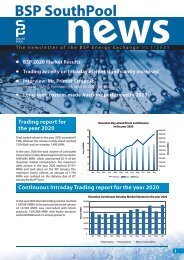
Trading Report January 2020
Report on trading activity at BSP SouthPool Energy Exchange
Report on trading activity at BSP SouthPool Energy Exchange

Create successful ePaper yourself
Turn your PDF publications into a flip-book with our unique Google optimized e-Paper software.
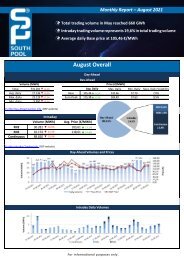
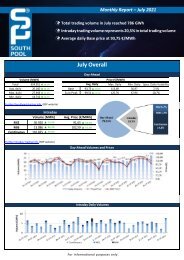
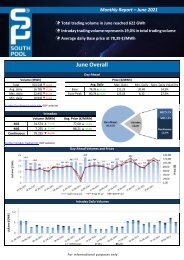
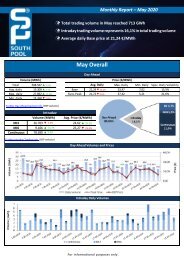
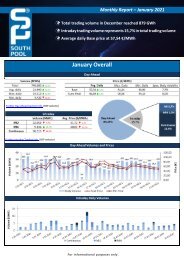
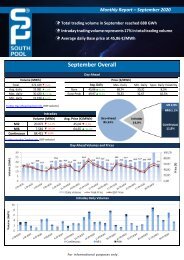
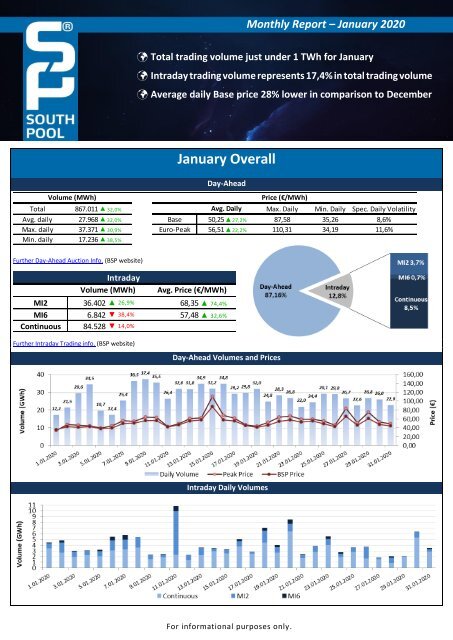
Monthly <strong>Report</strong> – <strong>January</strong> <strong>2020</strong><br />
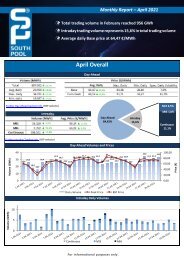
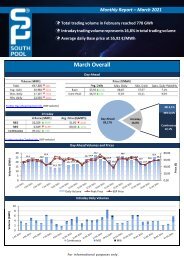
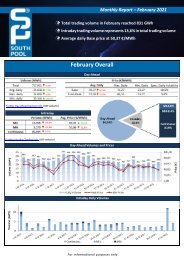
Total trading volume just under 1 TWh for <strong>January</strong><br />
Intraday trading volume represents 17,4% in total trading volume<br />
Average daily Base price 28% lower in comparison to December<br />
Volume (MWh)<br />
<strong>January</strong> Overall<br />
Day-Ahead<br />
Price (€/MWh)<br />
Total 867.011 ▲ 32,0% Avg. Daily Max. Daily Min. Daily Spec. Daily Volatility<br />
Avg. daily 27.968 ▲ 32,0% Base 50,25▲27,2% 87,58 35,26 8,6%<br />
Max. daily 37.371 ▲ 30,9% Euro-Peak 56,51▲22,2% 110,31 34,19 11,6%<br />
Min. daily 17.236 ▲ 38,5%<br />
Further Day-Ahead Auction Info. (BSP website)<br />
Intraday<br />
Volume (MWh)<br />
Avg. Price (€/MWh)<br />
MI2 36.402 ▲ 26,9% 68,35 ▲ 74,4%<br />
MI6 6.842 ▼ 38,4% 57,48 ▲ 32,6%<br />
Continuous 84.528 ▼ 14,0%<br />
Further Intraday <strong>Trading</strong> info. (BSP website)<br />
Day-Ahead Volumes and Prices<br />
Intraday Daily Volumes<br />
For informational purposes only.
Day-Ahead further Auction info.<br />
Average Hourly Volumes and Prices<br />
Hour (AM) 1 2 3 4 5 6 7 8 9 10 11 12<br />
Volume (MWh) 1106 1018 953 952 960 1110 1151 1185 1204 1206 1214 1265<br />
Base price (€/MWh) 41,77 39,00 37,16 36,03 36,50 40,60 48,48 53,74 59,31 57,60 55,18 56,95<br />
Hour (PM) 13 14 15 16 17 18 19 20 21 22 23 24<br />
Volume (MWh) 1271 1251 1212 1172 1235 1227 1161 1227 1243 1245 1227 1174<br />
Daily volatility of base price<br />
Base price (€/MWh) 57,30 53,66 52,90 52,65 55,08 59,82 59,82 57,80 53,52 51,00 47,71 42,38<br />
Cross-Zonal Capacities<br />
SI→IT IT→SI SI→AT AT→SI SI→HR<br />
Offered (MWh) 464.332 497.920 804.156 536.244 765.533 1.466.467 4.534.652<br />
Allocated (MWh) 27.517 307.350 2.607 496.820 393.189 16.850 1.244.334<br />
% Allocated 5,93% 61,73% 0,32% 92,65% 51,36% 1,15%<br />
Daily Volatility of Base Price<br />
HR→SI<br />
Total<br />
Methodology used for calculation of volatility.<br />
MI2 & MI6 Implicit Auctions<br />
Allocated CZC Values on Slovenian-Italian Border<br />
Cross-Zonal-Capacities<br />
SI-IT IT-SI Total<br />
Offered (MWh) 731.312 145.152 876.464<br />
Allocated (MWh) 12.138 19.558 31.696<br />
% Allocated 1,66% 13,47% /<br />
Read more about European Pilot Project<br />
Implicit Intraday Auctions (MI2 & MI6)<br />
Intraday Continuous <strong>Trading</strong><br />
Volumes by Products<br />
For informational purposes only.
Past 12 Months Trade Information<br />
Day-Ahead Auction<br />
Avg. Monthly Volume (MWh) 703.951<br />
Avg. Daily Volume (MWh) 23.144<br />
Avg. Base Price (€/MWh) 48,84<br />
Avg. Euro-Peak Price (€/MWh) 54,31<br />
Avg. SI-IT offered (MWh)/Avg. % Allocated 384.538 / 50,3%<br />
Avg. IT-SI offered (MWh)/Avg.% Allocated 465.239 / 23,5%<br />
Avg. SI-AT offered (MWh)/Avg. % Allocated 811.070 / 2,6%<br />
Avg. AT-SI offered (MWh)/Avg. % Allocated 495.614 / 72,8%<br />
Avg. SI-HR offered (MWh)/Avg. % Allocated 810.630 / 24,1%<br />
Avg. HR-SI offered (MWh)/Avg. % Allocated 1.327.409 / 6,8%<br />
Day-Ahead Market Volumes and Prices<br />
Intraday Continuous <strong>Trading</strong><br />
Avg. Monthly Volume (MWh) 25.449<br />
Number of trades 13.975<br />
MI2 & MI6 Implicit Auctions<br />
Avg. Monthly volume MI2 (MWh) 29.046<br />
Avg. Monthly volume MI6 (MWh) 7.872<br />
Avg. SI-IT offered (MWh)/Avg. % Allocated 292.019 / 3,5%<br />
Avg. IT-SI offered (MWh)/Avg.% Allocated 285.731 / 4,2%<br />
Intraday Volumes (MWh)<br />
Total Volume in the past 12 months Continuous ■ MI2 ■ MI6 ■<br />
Feb. 19 18.696 15.475 4.217<br />
Mar. 19 9.737 10.862 2.265<br />
Apr. 19 9.983 23.972 5.738<br />
May. 19 10.299 16.901 4.707<br />
Jun. 19 9.999 23.118 11.256<br />
Jul. 19 9.834 34.572 11.544<br />
313.873 303.253<br />
Aug. 19 13.075 26.922 5.042<br />
Sep. 19 12.887 27.784 5.345<br />
Oct. 19 7.756 32.170 9.045<br />
Nov. 19 28.771 26.380 5.879<br />
82.990 Dec. 19 98.311 28.693 11.110<br />
Jan. 20 84.528 36.402 6.842<br />
Absolute Difference Between MI and Day-Ahead Prices & MI Offered Cross-Zonal Capacities<br />
*Cross-Zonal Capacities not allocated on Day-Ahead Auction are later offered for MI2 and MI6 Auctions.<br />
For informational purposes only.
BSP Energy Exchange LL C<br />
Dunajska 156<br />
SI-1000 Ljubljana<br />
Slovenija<br />
+386 1 620 76 76<br />
+386 1 620 76 77<br />
www.bsp-southpool.com<br />
info@bsp-southpool.com<br />
For informational purposes only.