(a) 100 µm - Helmholtz-Zentrum Berlin
(a) 100 µm - Helmholtz-Zentrum Berlin
(a) 100 µm - Helmholtz-Zentrum Berlin

Create successful ePaper yourself
Turn your PDF publications into a flip-book with our unique Google optimized e-Paper software.
Nucleation and growth<br />
during the formation of<br />
polycrystalline silicon thin films<br />
Jens Schneider<br />
Nucleation and growth<br />
during the formation of<br />
polycrystalline silicon thin films<br />
(b)<br />
<strong>100</strong> <strong>µm</strong>
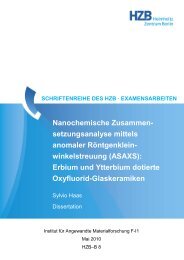
Nucleation and growth during the formation of<br />
polycrystalline silicon thin films<br />
vorgelegt von<br />
Diplom-Ingenieur<br />
Jens Michael Schneider<br />
aus Calw<br />
von der Fakultät IV - Elektrotechnik und Informatik<br />
der Technischen Universität <strong>Berlin</strong><br />
zur Erlangung des akademischen Grades<br />
Doktor der Ingenieurwissenschaften<br />
- Dr. ing. -<br />
vorgelegte Dissertation<br />
<strong>Berlin</strong> 2005<br />
D 83
"Our ignorance is not so vast as our failure to use what we know."<br />
Marion King Hubbert
Abstract<br />
Polycrystalline Silicon (poly-Si) thin films on foreign substrates are interesting<br />
for large area electronic devices like displays, sensors and solar cells. Such films<br />
can be formed by the aluminum-induced layer exchange (ALILE) process. In the<br />
ALILE process aluminum, amorphous silicon (a-Si) bi-layers exchange their posi-<br />
tions with a concurrent crystallization of the silicon during a simple annealing step<br />
below the eutectic temperature of the Al/Si system (Teu = 577 °C). The resulting<br />
poly-Si layer is large grained which promises high carrier mobilities and exhibits a<br />
preferential, crystallographic (<strong>100</strong>) orientation which facilitates low-temperature,<br />
epitaxial thickening.<br />
Within this thesis glass/Al/a-Si layer stacks are investigated in-situ during the<br />
ALILE process with an optical microscope. The role of a thin interlayer between<br />
the Al and a-Si is studied. While nucleation in isothermal annealing experiments is<br />
caused by supersaturation of silicon in the aluminum layer additional nucleation<br />
can be enforced by supercooling the sample during annealing. The use of temper-<br />
ature profiles during annealing reveals the mechanism of the ALILE process.<br />
The process is discussed on the basis of thermodynamic consideration and eluci-<br />
dated within the Al/Si phase diagram. The definition of Si concentration limits in<br />
the Al demonstrates that the large grains in the resulting poly-Si film are caused by<br />
a characteristic self-limiting suppression of nucleation during the layer exchange<br />
process. When the Si concentration is above the saturation concentration but<br />
below a critical concentration existing grains grow but additional nucleation is<br />
suppressed. From the thermodynamic considerations on nucleation and growth a<br />
model is derived explaining the origin of the preferential orientation.<br />
Both experimental and theoretical results obtained in this thesis allow to develop<br />
recipes for an optimized polycrystalline silicon layer formation. Poly-crystalline<br />
silicon thin-film solar cells based on the seed layer concept have the potential to<br />
achieve high efficiencies at very low costs which make them suitable candidates<br />
for the medium-term future solar cell technology.<br />
i
Zusammenfassung<br />
Dünne Schichten aus polykristalline Silizium auf Fremdsubstraten sind für groß-<br />
flächige, elektronische Anwendungen wie Displays, Sensoren und Solarmodulen<br />
von starkem Interesse. Im aluminium-induzierten Schichtaustauschprozess wird<br />
ein Glas/ Aluminium/ amorphes-Silizium Schichtstapel durch einen einfachen Tem-<br />
perschritt in einen Glas/ polykristallines Silizium/ Aluminum(+Silizium) Schicht-<br />
stapel überführt. Damit können polykristalline Siliziumschichten mit kristallinen<br />
Wachstumsbereichen von bis zu <strong>100</strong> <strong>µm</strong> Durchmesser hergestellt werden. Die<br />
großen Wachstumsbereiche werden durch eine selbstlimitierende Nukleation er-<br />
reicht. Die Schichten zeichnen sich durch eine (<strong>100</strong>) Vorzugsorientierung aus.<br />
Diese Vorzugsorientierung macht die poly-Si Schichten besonders interessant für<br />
epitaktische Verdickung bei niedrigen Temperaturen.<br />
Mittels optischer Mikroskopie wurde der aluminium-induzierte Schichtaustausch-<br />
prozess in-situ untersucht. Dabei wurden neben dem Einfluss der Tempertemper-<br />
atur auch der Einflusss einer dünnen Schicht zwischen der ursprünglichen Alu-<br />
minium- und amorphen Silizium-Schicht untersucht. Die Proben wurden durch<br />
DC Magnetron Sputtern hergestellt. Als Zwischenschicht wurde Aluminiumoxid<br />
verwendet. Die Oxidschicht wurde durch natürliche und thermische Oxidation<br />
hergestellt. Alternativ wurde per Sputterdeposition auch eine Molybdenschicht<br />
als Zwischenschicht untersucht. Zur Strukturuntersuchung der resultierenden<br />
Schichten wurden Transmission Electron Microscopy (TEM) und Electron Backscat-<br />
ter Diffraction (EBSD) eingestzt.<br />
Im aluminium-induzierten Schichtaustauschprozess haben die verschiedenen Pro-<br />
zessparameter meist sowohl positive als auch negative Einflüsse. Hohe Tempertem-<br />
peraturen reduzieren die Prozesszeit. Wohingegen niedrige Temperaturen die Ko-<br />
rngröße erhöhen und der Anteil der (<strong>100</strong>)-Vorzugsorientierung vergrößern. Dicke<br />
Oxidzwischenschichten führen zu großen Körner. Dünne Oxidschichten hingegen<br />
bewirken kurze Prozesszeiten und erhöhen den Anteil der (<strong>100</strong>)-Vorzugsorient-<br />
ierung. Um möglichst viele positive Eigenschaften in dem Prozess zu vereinen,<br />
iii
iv<br />
wurde die Temperatur während des Prozesses geändert. Die Tempertemperatur<br />
kann erhöht werden wenn die Nukleations unterdrückt ist ohne das neue Körner<br />
entstehen. Dadurch kann die Prozesszeit verkürzt werden, ohne die Korngröße zu<br />
verringern.<br />
Die Nukleation im aluminium-induzierten Schichtaustauschprozess wird bei iso-<br />
thermischer Temperung durch Übersättigung des Aluminiums mit Silizium her-<br />
vorgerufen. Durch Abkühlen während der Temperung kann zusätzlich Nukleation<br />
durch Unterkühlung erzwungen werden, auch wenn die Nukleation bereits un-<br />
terdrückt ist. Gebiete ohne neue Nukleation um die bestehenden Körner werden<br />
dabei sichtbar. Dies ist ein direkter Nachweis des Modells bei dem die Nukleation-<br />
sunterdrückung durch Silizium-Verarmungszonen im Aluminium hervorgerufen<br />
wird.<br />
Im Aluminium-Silizium-Phasendiagramm werden die Ergebnisse vor einem Ther-<br />
modynamischen Hintergrund diskutiert. Die Definition dreier wichtiger Si Konzen-<br />
trationen im Aluminium gestattet es, den Mechanismus der selbstlimitierten Nu-<br />
kleationsunterdrückung zu verstehen. Sowohl die Nukleations- als auch die Wach-<br />
stumsrate werden von der Si Konzentration bestimmt. Unterhalb eines kritischen<br />
Werts ist die Nukleation unterdrückt, aber die bestehenden Körner wachsen weiter.<br />
Thermodynamische Überlegungen zeigen, dass die (<strong>100</strong>)-Vorzugsorientierung bere-<br />
its durch bevorzugte Nukleation hervorgerufen wird. Detailierte Berechnung zur<br />
bevorzugten Nukleation von Clustern an der Aluminium-Zwischenschicht-Grenz-<br />
fläche können sowohl die Temperatur- als auch die Zwischenschichtabhängigkeit<br />
der (<strong>100</strong>)-Vorzugsorientierung erklären.<br />
Um optimierte polykristalline Siliziumschichten herzustellen, sollten:<br />
• dünne, natürliche Oxidschichten verwendet werden, die den Anteil der (<strong>100</strong>)-<br />
Vorzugsorientierung erhöhen.<br />
• niedrige Anfangstemperaturen gewählt werden, die große Körner erzeugen<br />
und ebenfalls den Anteil der (<strong>100</strong>)-Vorzugsorientierung vergrössern.
• Temperatureprofile mit hoher Endtemperatur gewählt werden, die die Pro-<br />
zesszeit minimieren, ohne dabei die Orientierung zu ändern oder neue Keime<br />
zu erzeugen.<br />
Mit diesem Verfahren können optimale polykristallinen Silizium Schichten mit<br />
dem aluminium-induzierten Schichtaustauschprozess hergestellt werden, die gut<br />
für nachfolgende epitaktische Verdickung geeignet sind. Polykristalline Silizium-<br />
dünnschichtsolarzellen, die mit diesem Konzept hergestellt werden versprechen<br />
hohe Wirkungsgrade bei niedrigen Kosten und sind somit Kandidaten für eine<br />
neue Solarzellengeneration der mittelfristigen Zukunft.<br />
v
Contents<br />
Abstract i<br />
Zusammenfassung iii<br />
1 Introduction 1<br />
2 State of the art 7<br />
2.1 Kinetics of phase change . . . . . . . . . . . . . . . . . . . . . . . . 7<br />
2.2 Solid Phase Crystallization (SPC) . . . . . . . . . . . . . . . . . . . 13<br />
2.3 Metal-Induced Crystallization (MIC) . . . . . . . . . . . . . . . . . 17<br />
2.4 Aluminum-Induced Layer Exchange (ALILE) . . . . . . . . . . . . . 22<br />
2.5 Current research involving ALILE layers . . . . . . . . . . . . . . . 29<br />
3 Experimental 37<br />
3.1 Sample preparation . . . . . . . . . . . . . . . . . . . . . . . . . . . 37<br />
3.1.1 Substrates . . . . . . . . . . . . . . . . . . . . . . . . . . . . 38<br />
3.1.2 Layer deposition . . . . . . . . . . . . . . . . . . . . . . . . 38<br />
3.1.3 Oxidation . . . . . . . . . . . . . . . . . . . . . . . . . . . . 38<br />
3.1.4 Annealing . . . . . . . . . . . . . . . . . . . . . . . . . . . . 39<br />
3.1.5 Chemical Mechanical Polishing . . . . . . . . . . . . . . . . 41
3.2 In-situ optical microscopy . . . . . . . . . . . . . . . . . . . . . . . 43<br />
3.3 Electron Back Scatter Diffraction . . . . . . . . . . . . . . . . . . . 46<br />
4 Results 49<br />
4.1 Interlayer . . . . . . . . . . . . . . . . . . . . . . . . . . . . . . . . 50<br />
4.1.1 Oxide interlayer . . . . . . . . . . . . . . . . . . . . . . . . 52<br />
4.1.2 Molybdenum interface . . . . . . . . . . . . . . . . . . . . . 69<br />
4.2 Temperature profiles . . . . . . . . . . . . . . . . . . . . . . . . . . 75<br />
4.2.1 Heating step . . . . . . . . . . . . . . . . . . . . . . . . . . 76<br />
4.2.2 Cooling step . . . . . . . . . . . . . . . . . . . . . . . . . . . 83<br />
5 Discussion 97<br />
5.1 Definition of three crucial Si concentrations in Al . . . . . . . . . . 99<br />
5.1.1 The saturation concentration . . . . . . . . . . . . . . . . . 99<br />
5.1.2 The maximum concentration . . . . . . . . . . . . . . . . . 102<br />
5.1.3 The critical concentration . . . . . . . . . . . . . . . . . . . 103<br />
5.2 The ALILE process in the phase diagram . . . . . . . . . . . . . . . 109<br />
5.3 Depletion regions in the ALILE process . . . . . . . . . . . . . . . . 113<br />
5.4 Comparison of the qualitative model with experimental results . . . 114<br />
5.5 Preferential orientation model . . . . . . . . . . . . . . . . . . . . . 120<br />
6 Conclusions 129<br />
A Preferential orientation calculated as pyramid cluster rotation 131<br />
B Abbreviations, symbols and units 135<br />
Literature 139
List of publications 151<br />
Acknowledgement 157<br />
Curriculum vitae 159
1 Introduction<br />
’Solar power is hot’, is the conclusion of equity investment analysts from Credit<br />
Lyonnais Securities Asia (CLSA) in July 2004 [1]. In this report CLSA advises its<br />
clients to ’become familiar with’ and ’keep a watch for’ an upcoming market with<br />
total revenues predicted to rise from 7 bn US$ in 2004 to 30 bn US$ in 2010. A<br />
growth rate of above 30 % is expected up to and beyond this point. The key chal-<br />
lenge in photovoltaic (PV) is the reduction of the price per kWh solar generated<br />
energy. Price reduction can be achieved by either introducing new technologies<br />
or increasing production. Learning curves indicate that doubling the cumulative<br />
production of PV modules leads to a price reduction by 20 %. Following this learn-<br />
ing curve together with the assumption of a continuous growth rate of 30 % in<br />
the upcoming years (the growth rate in 2004 has been 67 % [2]) and a price of<br />
7 US$/ Wp in 2004, the psychologically important margin of 1 US$/ Wp will be<br />
reached before 2030 at a cumulative production of about 400 GWp with total rev-<br />
enues of 400 bn US$. While the electricity production cost for current PV systems<br />
in Germany is about 50 Ct./kWh, decreasing the module cost to 1 US$/ Wp will<br />
get PV within the margin of economical competitiveness with conventional energy<br />
sources. At this point PV will contribute a large share to world’s energy supply.<br />
Reaching this goal depends highly on the possibility to adhere to the learning<br />
curve without reaching cost limits which restrict further cost reduction. Therefore<br />
solar power is one of the most interesting technologies for the 21st century for<br />
both investors and researchers.<br />
Today’s PV market is dominated by solar cells based on mono- and polycrystalline<br />
silicon wafers. The corresponding process technologies have been developed to-<br />
gether with the microelectronics industry. However an essential difference be-<br />
tween solar cells and microelectronics lies in scalability. While transistors get<br />
cheaper and faster when getting smaller, solar cells cannot decrease in size be-<br />
cause large areas are required in order to harvest the sunlight. Increasing the
2 Introduction<br />
number of devices per area has no positive effect in photovoltaics. Instead the ef-<br />
ficiency of the device has to be increased which is naturally attempted in all solar<br />
cell concepts but is limited to 30 % for an energy gap of 1.1 eV as pointed out by<br />
W. Shockley and H.J. Queisser [3]. M. Green summarized ideas on how to over-<br />
come this theoretical limit with so called third generation solar cells [4]. The more<br />
promising approach on a short to medium term for solar cells to reduce material<br />
consumption is the reduction of the thickness of the cells. Thin film concepts are<br />
considered second generation photovoltaics [5]. The thickness of the wafer based<br />
cells is limited by the mechanical stability during wafer handling. Transferring the<br />
mechanical stability issue to inexpensive substrates like glass enables the use of<br />
much thinner films. Besides PV applications thin films are also attractive for large-<br />
area electronic devices like displays and sensors. The homogeneous deposition<br />
of thin films on glass substrates on very large scale has already been developed<br />
by the glass industry for various applications like mirrors, toned glass etc. Thin<br />
film deposition using these technologies permits to save material cost. Addition-<br />
ally, in wafer based modules the solar cells have to be interconnected with extra<br />
connection strips. Assembly of connection strips is labor-intensive and sensitive<br />
to failure. The advantage of large-area devices on foreign substrates like glass is<br />
that interconnections can be realized by monolithic integration of solar cells. This<br />
leads to totally new concepts for solar module design offering a high potential to<br />
reduce cost limits in PV.<br />
One main challenge when using inexpensive substrates like glass is the limitation<br />
in process temperatures. Typical glasses have strain points at about 600 °C. That<br />
means all process steps must be below this margin. Si wafers can be handled<br />
at much higher temperatures because of the high melting point of Si at 1414 °C.<br />
In order to realize thin film technologies at low temperatures different material<br />
systems have been investigated. Compound semiconductors like copper indium<br />
diselenide (CIS) and cadmium telluride (CdTe) are promising candidates. Sili-<br />
con is particularly attractive due to its abundance and non-toxicity. Hydrogenated<br />
amorphous silicon (a-Si:H) thin films deposited by plasma enhanced chemical va-
por deposition (PECVD) achieved partial success. At present it is the only thin<br />
film technology which has overcome the barrier to mass production. But it has<br />
not been able to replace wafer based technologies so far and has market share be-<br />
low 10 %. For low-power applications (e.g. watches and calculators) amorphous<br />
silicon solar cells are established as dominant technology. They suffer from lower<br />
efficiencies due to their poorer electronic properties compared to crystalline wafer<br />
material and degradation know as Staebler-Wronski-effect [6]. Consequently the<br />
fabrication of silicon thin-films with improved electronic properties has attracted<br />
researchers interest. Microcrystalline silicon (µc-Si-H) can be deposited at tem-<br />
peratures below 200 °C. Solar cell efficiencies of above 10 % are obtained [7]. On<br />
µc-Si:H/a-Si:H tandem solar cell modules of sizes up to 450 × 910 mm −2 remark-<br />
able initial efficiencies of 13.5 % were obtained recently [7]. Even though these<br />
results are quite impressive it is believed that fine-crystalline silicon structures are<br />
limited in their perspertive compared to poly-crystalline Si wafer material. In or-<br />
der to minimize recombination at grain boundaries a large grain size is desirable.<br />
Ideally a large grained silicon thin film should be formed on a foreign inexpen-<br />
sive substrate, like glass. Large grained can be defined as laterally larger than the<br />
layer thickness. In this case the efficiency is limited by the recombination at the<br />
front and back contacts. This is hoped to yield efficiencies comparable with silicon<br />
wafers at much lower cost. Due to the softening point of glasses at around 600 °C<br />
the silicon thin films have to be formed at low temperatures.<br />
Due to the high melting point of silicon, crystallization of amorphous silicon at<br />
temperatures below the glass softening point is a solid phase reaction. Solid phase<br />
crystallization (SPC) has been extensively studied [8] and is addressed in detail in<br />
the chapter ’State of the art’. It was found that metals in contact with amorphous<br />
silicon reduce crystallization time and temperature. Also, the resulting Si grain<br />
size can be increased. Unfortunately metal impurities in the resulting crystalline<br />
silicon can lead to very high doping levels (e.g. in case of Al). Due to the result-<br />
ing high recombination rates crystalline silicon from metal induced crystallization<br />
(MIC) is not suitable for absorber layers. But due to the large grain sizes such<br />
3
4 Introduction<br />
Figure 1.1: Schematic ALILE process. The layer stack before (left) and after (right) the<br />
layer exchange are shown. The oxide interface layer remains in position during the pro-<br />
cess.<br />
layers can be used as templates for subsequent epitaxial thickening at low temper-<br />
atures. To do so a continuous smooth layer of crystallized silicon is needed.<br />
In 1998 O. Nast et al. [9] reported on a process which is now known as aluminum-<br />
induced layer exchange process (ALILE). In this process an aluminum and amor-<br />
phous silicon bi-layer on a glass substrate exchange their position with a con-<br />
current crystallization of the silicon. The resulting polycrystalline silicon layer is<br />
smooth, continuous and features large grains (> 10 <strong>µm</strong>) with a preferential (<strong>100</strong>)<br />
orientation. Thus ALILE layers are eligible as a template (seed layer) for subse-<br />
quent low temperature epitaxy.<br />
The aluminum-induced layer exchange process (ALILE) is shown schematically in<br />
Fig. 1.1. The initial glass/Al/oxide/a-Si layer stack (left side) is transformed into<br />
a glass/poly-Si/oxide/Al(+Si) layer stack (right side). The initial a-Si needs to be<br />
slightly thicker than the initial Al layer in order to form a continuous poly-Si layer.<br />
The Si excess remains in the final Al layer and forms c-Si islands. The interlayer<br />
between the initial Al and a-Si layer plays a crucial role in the process. Usually a<br />
native Al oxide layer is formed on top of the Al prior to a-Si deposition. This oxide<br />
layer remains in position and separates top and bottom layer throughout the layer<br />
exchange process.<br />
The ALILE process is the topic of this work. In order to optimize the poly-Si seed<br />
layers formed in the ALILE process a profound understanding of the driving forces<br />
and mechanisms in the process is required. The role of the initial aluminum amor-
phous silicon interface layer is examined and compared to the influence of the<br />
annealing temperature. Limits of the resulting nucleation density and grain size<br />
are investigated and the origin of a self-limited nucleation suppression within the<br />
ALILE process is elucidated. The influence of the interlayer and the annealing<br />
temperature on the resulting orientation of the film is studied. The possibilities of<br />
non-isothermal annealing to optimize the process results are tested. The obtained<br />
results are discussed against the background of thermodynamics and existing mod-<br />
els. A possible explanation for the self-limited suppression of nucleation and the<br />
formation of the preferential (<strong>100</strong>) orientation is suggested. And a route to an<br />
optimized poly-Si film made by the ALILE process is proposed.<br />
The thesis is divided into following chapters:<br />
Chapter 2: ’State of the art’ links this thesis within the context of existing re-<br />
search. An overview is given introducing the history of research on crystallization<br />
in general and the background of solid phase crystallization, metal-induced crys-<br />
tallization and the aluminum-induced layer exchange process in particular.<br />
Chapter 3: ’Experimental’ lists the sample preparation parameters. Oxidation<br />
and annealing processes are depicted. The characterization methods are explained<br />
including important evaluation methods.<br />
Chapter 4: ’Results’ shows the influence of the two main parameters under inves-<br />
tigation within this thesis. A thin membrane between aluminum and silicon is cru-<br />
cial for the layer exchange process. Here the influence of altering this membrane<br />
is investigated. Naturally, the annealing temperature determines the process char-<br />
acteristics strongly. Non isothermal annealing is investigated for improving the<br />
process and revealing the mechanism behind the layer exchange.<br />
Chapter 5: ’Discussion’ elucidates the findings of chapter 4. The parameters in-<br />
fluence on nucleation and growth of the Si grains is discussed. A model is sug-<br />
gested which explains the origin of the self-limited nucleation suppression and the<br />
preferential (<strong>100</strong>) orientation.<br />
Chapter 6: ’Conclusion’ summarizes the most important results and closes with<br />
5
6 Introduction<br />
an outlook on future perspectives of the ALILE process.
2 State of the art<br />
This chapter gives a general overview on the theoretical and technological back-<br />
ground of metal-induced crystallization and aluminum-induced layer exchange<br />
process in particular. Based on the kinetics of phase formation, related processes<br />
are investigated for more than 200 years. Already in 1724 G. Fahrenheit per-<br />
formed experiments with undercooling water at low temperatures. A summary<br />
of the basics of phase formation and transformation was published by M. Volmer<br />
in 1939 [10]. In the early 1970s amorphous semiconductors and their recrystal-<br />
lization behavior became of interest in microelectronics due to the amorphization<br />
caused by ion implantation in crystalline silicon for doping purposes and silicon<br />
on insulator devices. The driving force of a crystallization process is the reduc-<br />
tion of the Gibbs energy when the amorphous silicon transforms into crystalline<br />
silicon. The theory of the kinetics of phase change is briefly introduced in section<br />
2.1. Experimental and theoretical results from solid phase crystallization (SPC)<br />
applicable to the topic of this work are summarized in section 2.2. A descriptions<br />
of metal-induced crystallization (MIC) follows in section 2.3. Finally, an overview<br />
of research activities on the aluminum-induced layer exchange (ALILE) process in<br />
other groups is given in section 2.4. Currently existing models of the ALILE pro-<br />
cess from other authors are presented, which allow the classification of the models<br />
developed within this thesis (chapter 5). An overview of activities involving ALILE<br />
seed layers is given in section 2.5.<br />
2.1 Kinetics of phase change<br />
In general, the term ’phase change’ includes different transformations: firstly the<br />
transition between the states of aggregation, e.g. condensation (gas-liquid) or so-<br />
lidification (liquid-solid), secondly changes of composition in multi-component
8 State of the art<br />
p, c<br />
p, c<br />
1 1<br />
II<br />
1 2<br />
Figure 2.1: Phase diagram redrawn from [10]. The line in the p-T diagram (pressure,<br />
temperature) gives the coexistence line for phases I and II. In multi-component systems<br />
the concentration c is plotted instead of the pressure p. Point ’1’ can be reached by crossing<br />
the coexistence line at point ’2’ by decreasing the temperature at constant pressure p1 (or<br />
concentration c1) which is referred to as ’supercooling’. Or by crossing the coexistence line<br />
at point ’3’ by increasing the pressure or concentration at constant temperature T1 which<br />
is referred to as ’supersaturation’.<br />
systems, e.g. formation of alloys and thirdly transition between different crystal-<br />
lographic orderings.<br />
Fig. 2.1 illustrates the general principle of phase transformation. Here, the ex-<br />
istence of two phases (I and II) in a pressure-temperature diagram (p-T). The<br />
straight line denotes the coexistence of the two phases. Along this line both phases<br />
are in thermodynamic equilibrium and coexist, e.g. ice floats on water without fur-<br />
ther freezing or melting. In multi-component systems the concentration c instead<br />
of the pressure can be plotted. Upon passing the coexistence line the phase change<br />
does not take place immediately but at a certain rate. This rate is determined by<br />
the kinetics of phase change. Reaching ’1’ via ’2’ , i.e. by decreasing the tempera-<br />
ture at constant pressure p1, the process is called supercooling; reaching ’1’ via ’3’,<br />
i.e. by increasing pressure or concentration at constant temperature T1, the pro-<br />
3<br />
T 1<br />
I<br />
T
2.1 Kinetics of phase change 9<br />
Figure 2.2: Gibbs energy G along a reaction path from a metastable, initial state G1 into<br />
a stable, final state G2 via an activated state. ∆G a is the activation energy and ∆G is the<br />
driving force [11].<br />
cess is called supersaturation. The kinetics at point ’1’ are not affected by the path<br />
of reaching ’1’, i.e. the rate of the phase change will be the same in point ’1’ wether<br />
it was reached by supercooling or supersaturation. Increasing supersaturation or<br />
supercooling increases the rate of the phase change.<br />
In general, the thermodynamic driving force for a process is the minimization of<br />
the Gibbs energy G of the entire system. Many processes are inhibited by an acti-<br />
vation barrier. Such systems need to be supersaturated (or supercooled) in order<br />
to overcome the activation energy. In case of the amorphous to crystalline phase<br />
transition, the activation barrier is associated with the breaking and rearranging<br />
of the covalent bonds of the atoms. In Fig. 2.2 the Gibbs energy G is shown versus<br />
a reaction coordinate. The initial state with the Gibbs energy G1 has to pass an<br />
activated state with an activation energy ∆G a before the final state at the lowest<br />
Gibbs energy G2 = G1 − ∆G can be reached. ∆G is the driving force of the entire<br />
process. The process is thermally activated and the rate of transition j(T ) from
10 State of the art<br />
the metastable, initial state to the stable, final state is given by:<br />
�<br />
j(T ) ∝ exp − ∆Ga<br />
�<br />
, (2.1)<br />
kT<br />
where k is the Boltzmann constant and T the temperature. The activation energy<br />
is a barrier for the process which has to be overcome prior to the onset of the<br />
phase change.<br />
For the description of the kinetics of phase changes a detailed look on the interface<br />
between the participating phases is essential. Forming a new thermodynamically<br />
favorable, e.g. a crystalline phase, the Gibbs energy is reduced per atom trans-<br />
ferred from phase I (amorphous) to phase II (crystalline). But at the same time<br />
an interface between both phases has to be formed. The formation of this inter-<br />
face requires energy and thus increases the Gibbs energy of the system. While<br />
the Gibbs energy reduction per atom due to the phase transition is proportional<br />
to the number of atoms in the new phase, i.e. the volume, the interface energy is<br />
proportional to the surface area of the new phase. The volume is can be expressed<br />
as the number of atoms i in the cluster. The number of atoms at the surface must<br />
be calculated depending on the shape of the cluster. Spinella et al. used a simple<br />
approach with a spherical cluster [12]. The Gibbs energy ∆Gi for a cluster of size<br />
i is the sum of the negative volume term (Gibbs energy reduction) and the positive<br />
surface term (Gibbs energy increase) and can be written as:<br />
∆Gi = −∆gvi + σOi. (2.2)<br />
Here, ∆gv is the Gibbs energy reduction per atom and σ is the specific surface<br />
energy. In Fig. 2.3 the Gibbs energy as a function of the number of atoms in the<br />
cluster is shown. The resulting Gibbs energy of the new phase is shown as solid<br />
line. In case of very small clusters the Gibbs energy increases when the radius<br />
is increased. The formation of the surface requires more energy than obtained
2.1 Kinetics of phase change 11<br />
[e V ]<br />
ΔG i<br />
2<br />
1<br />
0<br />
-1<br />
-2<br />
i*<br />
ΔG *<br />
0 5 0 1 0 0<br />
i [a to m s ]<br />
1 5 0 2 0 0<br />
Figure 2.3: Gibbs energy ∆Gi versus number of atoms in the cluster i. The Gibbs energy<br />
decreases due to formation of a new volume but needs to build a new surface (increase of<br />
∆Gi). The resulting Gibbs energy exhibits a maximum at a critical cluster size i ∗ associated<br />
to the activation energy ∆G ∗ [12].<br />
by forming the stable volume. When the critical cluster size i ∗ is exceeded the<br />
volume term dominates and the cluster is stabilized. The activation energy ∆G ∗<br />
of the process can be associated with the critical cluster size i ∗ . For a spherical<br />
cluster Spinella et al. obtained:<br />
i ∗ = 32 σ3<br />
π<br />
3 ∆g3 ,<br />
V<br />
(2.3)<br />
∆G ∗ = 16 σ3<br />
π<br />
3 ∆g2 ,<br />
V<br />
(2.4)<br />
thus, both, critical cluster size i ∗ and activation energy ∆G ∗ depend on the ratio<br />
of the specific surface energy σ and the Gibbs energy reduction ∆gV by transition<br />
of an atom.<br />
Around 1940 the so-called KJMA-model (Kolmogorov, Johnson, Mehl, Avrami)<br />
was formulated which is used to describe theoretically the kinetics of phase change.
12 State of the art<br />
The model assumes the existence of germ nuclei which become growth nuclei at<br />
a certain nucleation rate. The phase transition takes place at a certain growth<br />
rate. Additionally, the model considers the geometrical limitations for the growing<br />
grains by either surfaces of the system or neighboring grains. From the KJMA-<br />
model a characteristic functional equation is derived. This functional equation<br />
became known later as the Kolmogorov-Johnson-Mehl-Avrami equation, because<br />
of the contributions of all four authors (A.E. Kolmogorov [13], W.A. Johnson and<br />
R.F. Mehl [14] and M. Avrami [15, 16, 17]). In general the time dependent frac-<br />
tion of the new phase RC(t) within the volume under investigation can be written<br />
as:<br />
RC (t) = 1 − exp (−At m ) . (2.5)<br />
A is a nucleation- and growth rate-dependent constant and m characterizes the<br />
experimental conditions and dimension of the growing nuclei. Besides the fact that<br />
nucleation rate and radius growth rate of the nuclei are assumed to be constant,<br />
the most important assumption made in the KJMA equation is the existence of<br />
germ nuclei. In terms of minimization of the Gibbs energy germ nuclei can be<br />
understood as follows. The formation energy of a surface can be strongly reduced<br />
by already existing surfaces. A reduction of this surface energy is accompanied<br />
by a reduction of both, critical radius and activation energy to form a nucleus.<br />
This effect can be very strong. Thus homogenous and heterogeneous nucleation<br />
are distinguished, without and with already existing surfaces, respectively. The<br />
most probable heterogeneous nucleation sites correspond to the germ nuclei of the<br />
KJMA-model.<br />
In Fig. 2.4 RC is plotted versus time t. Here, RC = 0 corresponds to the initial<br />
phase before the process starts and RC = 1 denotes the transformation of the<br />
entire volume. After the first nucleation the new phase fraction RC increases su-<br />
perlinearly because new growth nuclei are formed and the transformed volume<br />
increases with larger grains due to the constant radius growth velocity. The slope
2.2 Solid Phase Crystallization (SPC) 13<br />
R C<br />
1<br />
0<br />
0<br />
Figure 2.4: Diagram of the Kolmogorov-Johnson-Mehl-Avrami equation. The fraction RC<br />
of the new phase is plotted as a function of time t.<br />
of RC decreases when nucleation ends, and neighboring growth nuclei collide and<br />
thus limit further growth. The KJMA model [18] and the theory of nucleation<br />
and growth during phase separation are still under discussion [19]. New simula-<br />
tion methods allow the modeling of more and more complex systems and enable<br />
comparison with results obtained by the analytic formula.<br />
2.2 Solid Phase Crystallization (SPC)<br />
Solid phase crystallization has been investigated since the early 1970s. Doping by<br />
ion implantation (introduced in 1966 [20]) caused damage to the crystal lattice in<br />
semiconductors. Therefore recrystallization processes were required which took<br />
place at low temperature in order to prevent diffusion of the implanted species. In<br />
order to investigate the recrystallization process crystalline silicon wafers were im-<br />
planted with silicon atoms such that a surface layer of the wafer was amorphized.<br />
This was also referred to as solid phase epitaxy (SPE) because the reordering was<br />
found to start from the still crystalline phase of the wafer with the same orienta-<br />
tion 1 . Of particular interest was the dependence of the crystallization behavior on<br />
1 Note: Solid phase crystallization (SPC) where the crystalline phase grows epitaxially on a Si<br />
wafer substrate is referred to as Solid phase epitaxy (SPE). Crystallization of layers previously<br />
t
14 State of the art<br />
the substrate orientation [21]. In this study a series of wafers cut with a 5° angular<br />
increment were amorphized in the way described above. The regrowth rate dur-<br />
ing annealing was determined by backscatter measurements. The regrowth rate<br />
was found to depend strongly on the substrate orientation. The regrowth rate as<br />
a function of the tilt angle of the surface normal to 〈<strong>100</strong>〉 orientation is shown in<br />
Fig. 2.5. The experimental data is fitted by a solid line. The regrowth rate on 〈<strong>100</strong>〉<br />
orientated substrates was found to be 25 times higher than on 〈111〉 orientated<br />
substrates. For the model calculation the regrowth was assumed to be in 〈<strong>100</strong>〉<br />
direction only. By tilting the 〈<strong>100</strong>〉 direction the growth is slower and is propor-<br />
tional to sin (54.17 ◦ − α) where α is the tilt angle from 〈<strong>100</strong>〉 to 〈111〉 direction.<br />
This function is plotted as fit in Fig. 2.5 (dashed line).<br />
The influence of dopants (P, B, As) [22] and impurities (C, N, O and noble gases)<br />
[23] (up to 0.5 at.%) on the recrystallization process was investigated by the same<br />
group. The regrowth rate was found to increase with the concentration of dopants<br />
and decrease with the concentration of impurities by up to one order of magni-<br />
tude. In 1985 Pai et al. [24] used B and Ge to independently dope and stress<br />
amorphized layers prior to recrystallization. While B does both dope and stress<br />
the silicon, Ge only stresses the amorphized film. It was found that doping has a<br />
stronger effect on the recrystallization rate than stress. This led to the conclusion<br />
that an enhancement of the regrowth rate is an electronic effect of the participat-<br />
ing dopants rather than stress effects caused by the implanted ions.<br />
In 1979 Köster published a review on ’crystallization and decomposition of amor-<br />
phous semiconductors’ [25] stressing the importance of nucleation and growth<br />
rate. Both depend on the silicon transport from the amorphous to the crystalline<br />
phase and the change in Gibbs energy per atom during crystallization. While<br />
the crystallization of various semiconductors has been investigated the overview<br />
within this thesis focusses on SPC of amorphous silicon (a-Si).<br />
In 1987 Iverson and Reif [26] pointed out that the thermal recrystallization of<br />
amorphized by ion-implantation is referred to as recrystallization as opposed to crystallization<br />
of deposited amorphous Si layers.
2.2 Solid Phase Crystallization (SPC) 15<br />
Figure 2.5: Orientation dependent solid phase epitaxy results from [21]. The regrowth<br />
rate is shown as a function of the tilt angle of the substrate to the (<strong>100</strong>) direction. The<br />
experimental results fit reasonably with simple calculations made. The regrowth rate is<br />
25× faster for 〈<strong>100</strong>〉 than for 〈111〉.<br />
amorphous silicon is inhibited by several activation barriers. Annealing of amor-<br />
phized films on SiO2 covered substrates at various temperatures and determina-<br />
tion of the crystalline fraction and number of grains from TEM analysis allowed to<br />
determine different activation energies for solid phase crystallization (SPC). The<br />
most important ones are the activation energy for Si self-diffusion in amorphous<br />
silicon (2.8eV ) and for the nucleation (5.1eV ). The driving force for nucleation<br />
∆G = 0.124eV/atom was determined by Donovan et al. by calorimetric studies<br />
[27]. This is in good agreement with other literature values and was verified by<br />
Spinella et al. [12] in 1998. Spinella stressed the role of atom jump rates to and<br />
from the clusters. At the critical radius, equivalent to the critical cluster size, both<br />
jump rates are equal. On this basis calculations were performed on the formation<br />
of critical clusters during solid phase crystallization of amorphous silicon. The
16 State of the art<br />
Figure 2.6: Sketch showing the octahedron/double pyramid formation in silicon crystal-<br />
lization. Spinella et al. [12] suggest that the critical clusters in solid phase crystallization<br />
Si crystallites embedded in the a-Si matrix assume the shape of a double pyramid with<br />
111 faces, ledges and tips.<br />
critical cluster size was estimated to about 45 atoms during the crystallization of<br />
spherical clusters. In order to reduce the total surface energy the surfaces of low-<br />
est energy are formed. Fig. 2.6 illustrates the case for silicon. As can be seen Si<br />
forms an octahedron (double pyramid) with (111) surfaces. The (111) surfaces are<br />
stabilized and growth takes place along the (110) ledges of the pyramid covering<br />
the (111) surfaces layer by layer. This consideration is used for modeling later<br />
(chapter 5).<br />
In the early 1980s, research on silicon on insulator (SOI) technology for MOSFETS<br />
led to an increased interest in solid phase crystallization. At the end of this decade<br />
the application of thin film transistors (TFT) in displays and sensors led to the first<br />
solid phase crystallization experiments on foreign substrates, like glass. In the<br />
early 1990, Sanyo investigated the possible use of SPC for solar cells. Even though<br />
promising results where obtained with a laboratory cell efficiency of η = 9.2 %<br />
on an area of 1 cm 2 [8] further efforts were quitted for reasons unknown. In
2.3 Metal-Induced Crystallization (MIC) 17<br />
Figure 2.7: Crystalline silicon thin film module made by SPC (source:<br />
http://www.pacificsolar.com.au)<br />
January 2004 CSG Solar AG (formerly Pacific Solar Ltd.) set the cornerstone for a<br />
new factory in Thalheim, Saxony-Anhalt. CSG is the abbreviation for crystalline<br />
silicon on glass. It is the first company attempting to produce solar cells made by<br />
solid phase crystallization (SPC) on an industrial scale. Prototypes produced by<br />
Pacific Solar (Fig. 2.7) have reached a module efficiency of above 8 % on an area of<br />
96 cm 2 [28]. It is believed that a module efficiency of about 10 % can be reached at<br />
very low cost. These efficiencies are still below the tandem solar cells efficiencies<br />
described above [7]. Besides the efficiency and the fabrication cost of a module<br />
the yield is a very crucial parameter which determines success or failure of the<br />
thin film technologies because of the large areas processed at a time.<br />
2.3 Metal-Induced Crystallization (MIC)<br />
At about the same time SPC was investigated for the first time, contact metalliza-<br />
tion in integrated circuits was found to dissolve silicon. This process was found to<br />
be enhanced in case of heated metal-silicon contacts [29].
18 State of the art<br />
Combining this effect of metals on semiconductors and the idea of solid phase<br />
crystallization it was found that metals in contact with amorphous silicon strongly<br />
reduce the crystallization time and temperature. Two microscopic models were<br />
suggested explaining the observed effect. Hiraki [30, 31] deposited monolayers<br />
of gold on amorphous silicon. He found that only upon depositing four monolay-<br />
ers or more crystallization was enhanced. He concluded that some type of bulk<br />
metal must be formed. The bulk is needed because a free electron gas needs to be<br />
formed. The wave function of the free electron gas extends into the amorphous sil-<br />
icon screening the covalent Si bonds. The screened bonds are weakened and thus<br />
crystallization is faster. Tu [32] suggested an interstitial model for near-noble tran-<br />
sition metals. Such metals lack one electron to achieve noble gas configuration. If<br />
such a metal atom would be inserted in an interstitial position of the Si lattice an<br />
electron from the covalent bonds surrounding this atom would be transferred to<br />
the metal. This weakens the bonds around it, enhancing crystallization.<br />
In 1972 S.R. Herd [33] compared the influence of different metals on the crystal-<br />
lization temperature of amorphous silicon and germanium. Metals forming sili-<br />
cides (Ni, Pd, Cu) are distinguished from eutectic metal-silicon systems (Al, Au,<br />
Ag).<br />
Ni in contact with Si forms a NiSi2 phase. The chemical potential for Ni is lower at<br />
the NiSi2/a-Si interface than at the NiSi2/c-Si, thus Ni diffuses to the a-Si side. At<br />
the same time Si diffuses in the opposite direction. This makes the silicide phase<br />
move through the a-Si silicon and leaves crystalline silicon behind. Depending on<br />
the growth parameters the silicide phase either moves anisotropically leading to<br />
needle-like crystallites or isotropically leading to disk-like grains [34]. MIC allows<br />
to grow large and disk-like grains. Fig. 2.8(a) shows a micrograph of disk-like Si<br />
grains from a Pt-induced crystallization process with annual ring-like structures<br />
[35]. The Si grains exhibit a grain size of up to 500 <strong>µm</strong>. The ring structures corre-<br />
spond to interruptions in the annealing process. Fib. 2.8(b) shows a micrographs<br />
in the case for Ni-induced crystallization of a-Si [36]. The grain size is about<br />
50 <strong>µm</strong>. Again rings were found due to interruptions during the annealing, but this
2.3 Metal-Induced Crystallization (MIC) 19<br />
(a) (b)<br />
Figure 2.8: Scanning electron micrographs of annual ring like growth in Pt-induced crys-<br />
tallization of a-Si (a) [35] and in Ni-induced crystallization (b) [36]. The ring structures<br />
appear due to an interruption of the annealing process.<br />
time additional rings also appeared which could not be explained.<br />
Sohn et al. [37] investigated the crystallography of disk-like grains grown in a Ni-<br />
induced crystallization process enhanced by an electric field applied by two metal<br />
bars on the sample. This is called field-enhanced silicide-mediated crystallization<br />
(FE-SMC) and was first introduced by Jang et al. [38]. Sohn et al. showed by Elec-<br />
tron Back Scatter Diffraction (EBSD) and selective area diffraction (SAD) that the<br />
obtained grains were monocrystalline. The grains each have a single orientation,<br />
but their orientation is not the same as that of neighboring grains.<br />
The orientation dependence of the surface energy can lead to preferential growth<br />
of the silicide within the a-Si layer. Hayzelden et al. [39] suggested the formation<br />
of NiSi2 double pyramids (Fig. 2.9) with (111) crystal faces as the lowest energy<br />
configuration, which corresponds to the suggestion made by Spinella et al. in SPC<br />
of a-Si (Fig. 2.6). Fig. 2.9 shows a sketch of the a-Si film with three possible align-<br />
ments of a double pyramid. Depending on the alignment of the double pyramids<br />
in the a-Si layer different preferential orientations are obtained. The alignments<br />
correspond to different crystal orientations of the double pyramid normal to the<br />
surface of the a-Si film. From left to right: (<strong>100</strong>), (110) and (111) orientation. If
20 State of the art<br />
Figure 2.9: Hayzelden’s double pyramid alignment within a-Si thin films for Ni-induced<br />
crystallization [39]. Depending on the alignment the double pyramid is confined differ-<br />
ently within the a-Si film. In case of the pyramid orientated in (110) direction relative to<br />
the surface normal (middle) four (111) planes grow parallel to the substrate leading to the<br />
fastest growth.<br />
the double pyramid is aligned with the (110) orientation normal to the layer, four<br />
(111) planes lie in the main lateral growth direction. Because the growth direction<br />
is in the (111) direction, this leads to the (110) orientation as the fastest growth<br />
and preferential orientation.<br />
The metal-induced crystallization of amorphous silicon in eutectic forming metal-<br />
silicon systems differs from the silicide forming metals. Both phases in the eutectic<br />
system remain separated throughout the process. They can only dissolve a certain<br />
concentration of the other species. The Al/Si phase diagram is shown in Fig. 2.10.<br />
The horizontal line at 850 K (577 °C) together with the intersecting liquidus lines<br />
at a Si content of 12.2 % are characteristics of an eutectic system. The intersection<br />
point is the eutectic point with the corresponding eutectic temperature. The eu-<br />
tectic forming MIC process was separated into three major steps by Ottaviani et<br />
al. [40]: (i) the dissociation of Si atoms from the amorphous phase into the metal,<br />
(ii) the diffusion of silicon atoms through the metal, and (iii) the crystallization of<br />
the dissolved Si by either nucleation of new cluster or agglomeration on existing<br />
crystallites. These authors suggested that energetically, the driving force of the<br />
process is the higher Gibbs energy of the amorphous phase compared with that<br />
of the crystalline phase. Furthermore, it was suggested that the metal induced<br />
crystallization is faster due to the kinetically fast reaction path where the metal
2.3 Metal-Induced Crystallization (MIC) 21<br />
Figure 2.10: Al/Si phase diagram. The temperature versus the Si content in the Al is<br />
shown. The Al and Si attempt to reach the equilibrium state by mixing corresponding<br />
to the lines indicated in the phase diagram at the each temperature. The equilibrium<br />
lines separate the different phases. The Al/Si system is a eutectic system. The eutectic<br />
temperature is at 577 °C and the eutectic point is at a silicon concentration of 12.2 %.<br />
serves as a solvent medium for the amorphous material.<br />
Konno and Sinclair have conducted ex and in-situ cross-sectional transmission<br />
electron microscopy studies on Al/a-Si multilayers [41, 42]. They found that sil-<br />
icon nuclei are formed within the Al layer. This supports the three step model of<br />
dissociation, diffusion and nucleation.<br />
The differences in crystallization mechanism also lead to a difference in applica-<br />
tions. Silicide forming metals (Ni) are mostly used in so-called metal-induced lat-<br />
eral crystallization (MILC) processes. The metal crystallizes the amorphous silicon<br />
laterally in the region of interest (ROI), e.g. the channel of a TFT. Thus, the silicide<br />
next to the ROI can be ignored and remains there. Non-silicide forming metals like<br />
Al function merely as catalysts. The metal and silicon are dissolved up to the solu-<br />
bility limit. The metal phase can easily be removed. Additionally, Ni creates deep
22 State of the art<br />
level acceptor levels at 230meV above the valence band and at 350meV below the<br />
conduction band in crystalline silicon, while Al is a shallow acceptor only 67meV<br />
above the valence band [43]. Thus Ni enhances carrier recombination and thus<br />
strongly decreases the minority carrier lifetime. In photovoltaic applications the<br />
photogenerated minorities make minority carrier life time crucial for good solar<br />
cells. Thus Al is favored over Ni in PV applications.<br />
2.4 Aluminum-Induced Layer Exchange (ALILE)<br />
In order to obtain a continuous poly-Si layer on large area substrates without<br />
any metal remainders a special case of aluminum-induced crystallization (AIC)<br />
has been developed. This specific process is referred to as aluminum-induced<br />
layer exchange process (ALILE). In 1976 aluminum-induced crystallization was<br />
used in a type of layer exchange process by R.L. Boatright and J.O. McCaldin [44].<br />
Fig. 2.11 shows their experiment schematically. In Fig. 2.11(a) an initial stage of<br />
the experiment is shown which was published by J.O. Best and J.O. McCaldin one<br />
year earlier [45]. A hole was made by photolithographic means in a Si oxide layer<br />
covering a silicon wafer. After deposition of Al on top of the oxide covered wafer<br />
and annealing at 550 °C for 5..25 min, the Al dissolved the Si beneath the hole.<br />
Boatright et al. evaporated amorphous silicon onto the Al layer (Fig. 2.11(b)) and<br />
annealed the specimen again at 475..525 °C for another 10..20 min. It was found<br />
that the hole is refilled with silicon (Fig. 2.11(c)). Thus an amorphous layer on<br />
top of the Al fills a hole at the bottom of the Al.<br />
Majni and Ottaviani investigated the growth kinetics in solid phase epitaxy (SPE)<br />
by deposition of Al/a-Si double layers on differently orientated Si wafers [46, 47,<br />
48] and actually mentioned for the first time: ’the Si and Al exchange position’<br />
[49]. Tsaur et al. [50] used a-Si SPE through an Al layer to form highly p-doped<br />
emitters on n-doped c-Si wafers. The separated Al layer was removed and the<br />
resulting solar cells reached an efficiency of 10.4 %.
2.4 Aluminum-Induced Layer Exchange (ALILE) 23<br />
(a)<br />
(b)<br />
(c)<br />
Figure 2.11: First observation of a layer exchange type phenomenon: (a) Al evaporated<br />
on a thermal Si oxide with hole on top of a Si wafer [45]. Upon annealing at 550 °C<br />
for 5..25 min Al dissolves the Si beneath the hole. (b) Evaporating amorphous Si on this<br />
structure and (c) heating the sample again at 475..525 °C for another 10..20 min lead to<br />
refilling of the hole with Si [44].
24 State of the art<br />
Many years later in 1998 L. Koschier et al. suggested the use of such a layer ex-<br />
change as back surface field formation in solar cells [51]. O. Nast et al. transferred<br />
the idea of a layer exchange on wafers to form a polycrystalline silicon (poly-Si)<br />
layer on glass [9].<br />
O. Nast et al. found that a glass/Al/a-Si stack can be transformed in a glass/poly-<br />
Si/Al(+Si) stack in an annealing step below the eutectic temperature of the Al/Si-<br />
system. In Fig. 2.12 Focused Ion Beam (FIB) images are shown of the cross section<br />
of this layer stack [52]. Micrograph (a) shows the initial Al/Si layer stack and (b)<br />
after 5 min annealing at 500 °C. A small crystalline silicon cluster was formed in<br />
the Al layer. This cluster grows until it is vertically confined within the Al layer.<br />
(c) shows the specimen after 10 min annealing. The grain continues its growth<br />
in lateral direction only. The last micrograph (d) shows the sample after 60 min<br />
annealing. Now, the entire layer is exchanged and a continuous poly-Si layer is<br />
formed on the glass substrate. O. Nast called this process aluminum-induced layer<br />
exchange process (ALILE) [53]. The interface between the initial Al and a-Si layer<br />
is essential for the layer exchange. An oxide layer is needed on top of the Al<br />
layer for the process. The oxide can be formed by simple exposure of the Al to<br />
ambient air. This oxide layer functions as a permeable membrane separating the<br />
top and bottom layer throughout the process [54]. Additionally the oxide layer is<br />
a diffusion barrier controlling the diffusion of silicon into the aluminum and vice<br />
versa. A silicon excess is found to be needed in order to replace the complete Al<br />
layer by poly-Si.<br />
O. Nast developed a model for the ALILE process dividing the overall process into<br />
four steps as sketched in Fig. 2.13. Step 1 involves the interaction of amorphous<br />
silicon with the Al and the dissociation of the amorphous phase across the oxidized<br />
Al/Si interface. Once Si is dissolved in the metal, the Si atoms diffuse within the<br />
Al layer (step 2). The Si nucleates within the Al layer (step 3). The nuclei become<br />
grains and grains grow by incorporation of further Si atoms until the entire Al is<br />
replaced (step 4).
2.4 Aluminum-Induced Layer Exchange (ALILE) 25<br />
Figure 2.12: FIB images of the ALILE process. (a) Initial stack; (b) Annealing at 500 °C for<br />
5 min: nucleus formation; (c) 10 min annealing: confinement of the growing grain within<br />
the Al layer, (d) 60 min annealing: continuous layer formation [52].
26 State of the art<br />
Figure 2.13: ALILE growth model suggested by O. Nast [53]. Step 1: Si dissolution and<br />
transport into the Al layer. Step 2: Si diffusion in the Al layer. Step 3: Si nucleation.<br />
Step 4: growth of Si grain.<br />
This model was extended by P. Widenborg et al. [55]. They considered also the<br />
process in the top layer (Fig. 2.14). While process steps 1, 2 and 3 correspond to<br />
the steps suggested by O. Nast, here step 4 describes the diffusion of Al into the<br />
top layer. Al is displaced by Si grains and forced to diffuse into the a-Si top layer<br />
(step 4a). The a-Si crystallizes in presence of the Al and small Si crystallites form<br />
in the Al top layer. The Al in this mixed phase dissolves further a-Si and grows<br />
(step 4b) competing with the Si growth in the bottom layer in this model. While<br />
the poly-Si in the bottom layer grows supplied by step 5, silicon is also crystallized<br />
in the top layer. Small nanocrystalline Si (nc-Si) crystallites will agglomerate at the<br />
more compact central Si islands, even when the actual layer exchange is completed<br />
(step 6)<br />
The formation of a stable c-Si phase within the Al in the top layer can be thought<br />
of as formation of idealized ’double cylinder’ shaped Al/c-Si-clusters in top view.<br />
A sketch of such a ’double cylinder’ embedded in the a-Si matrix is shown in<br />
Fig. 2.15(a). Fig. 2.15(b) shows several of these ’double cylinders’ corresponding<br />
to the optical micrograph in Fig. 2.15(c) [56] obtained at the top layer.<br />
The driving force of the entire process was assumed by O. Nast to be the chemical<br />
potential difference between the amorphous and crystalline phase (Fig. 2.16). It<br />
is proposed that the Al layer is in equilibrium with both the amorphous and the<br />
crystalline silicon phase at the interfaces. Then the difference of the chemical<br />
potentials leads to silicon diffusion within the aluminum from the a-Si/Al interface<br />
to the Al/c-Si interface.
2.4 Aluminum-Induced Layer Exchange (ALILE) 27<br />
Figure 2.14: ALILE growth model by P. Widenborg et al. [55]. The process in the top<br />
layer is also taken into account. Formation of Si islands in top layer was found to compete<br />
with the crystallization process in the bottom layer. For details see text.
28 State of the art<br />
c-Si<br />
Al<br />
a-Si<br />
(a) (b)<br />
(c)<br />
Figure 2.15: ’Double cylinder’-shaped Al/c-Si clusters in the top layer in top view. (a)<br />
Single ’double cylinder’. (b) Multiple ’double cylinders’. (c) Optical micrograph of ’double<br />
cylinders’ [56].
2.5 Current research involving ALILE layers 29<br />
Figure 2.16: Chemical potential µSi versus distance x. On the left is the a-Si phase, on<br />
the right is the c-Si phase. Both are assumed to be in equilibrium with the Al. Thus the<br />
difference ∆µ of the chemical potential of the a-Si µa−Si and the c-Si µc−Si drives the<br />
diffusion of Si within the Al layer. The overall driving force of the ALILE process is the<br />
Gibbs energy reduction from amorphous to crystalline silicon [53].<br />
A key feature of the ALILE process is the suppression of nucleation by existing<br />
grains and the resulting large grain size of above 10 <strong>µm</strong>. Silicon diffusion to-<br />
wards growing grains leads to the formation of concentration gradients [52].<br />
Fig. 2.17 shows in a schematic diagram the silicon concentration profiles between<br />
two neighboring grains. The silicon concentration within the grains, the density<br />
of silicon, is cg. The growing silicon grain decreases the silicon concentration just<br />
in front of the grain to ci. Far away from the grain the Si concentration is cn, the<br />
concentration at which nucleation is likely to occur. Around the grains is a region<br />
with a lowered concentration, referred to as depletion regions. The width of the<br />
depletion region is d. While new nucleation is possible in the supersaturated re-<br />
gion between the depletion regions, it is suppressed once the depletion regions<br />
overlap. At a distance of 2d no further nucleation is possible.<br />
2.5 Current research involving ALILE layers<br />
A possible solar cell concept involving ALILE seed layers is shown schematically<br />
in Fig. 2.18 [57]: (a) After deposition of the initial Al and a-Si layer (b) the poly-
30 State of the art<br />
Figure 2.17: Si concentration profile around growing grains. The Si concentration within<br />
the grains is cg. Right in front of the grain it is ci. Far away from the grains is the<br />
nucleation concentration cn. Si is depleted in the concentration profiles on a distance d.<br />
(a) If neighboring grains are further then 2 d apart nucleation is still possible. (b) Once<br />
the grains are closer than 2 d nucleation is suppressed. [52].<br />
Si layer is formed by the ALILE process. (c) On the top of the poly-Si film an Al<br />
layer with silicon inclusion is formed which has to be removed. (d) The poly-<br />
Si layer is subsequently thickened by low-temperature epitaxy forming a p-doped<br />
absorber. Finally, a low temperature, n + -emitter is deposited. This can either be<br />
done epitaxially by changing the dopant or by deposition of an amorphous silicon<br />
emitter. In the latter case a transparent conducting oxide (TCO) layer is needed to<br />
enhance the lateral conductivity of the emitter. A mesa structure has to be etched<br />
in order to define the solar cell area and contact the absorber layer.<br />
Historically, the University of New South Wales (UNSW) in Sydney and the Hahn-<br />
Meitner-Institut <strong>Berlin</strong> (HMI) were both involved in ALILE research due to O. Nast<br />
preparing his dissertation in both facilities. In order to produce a smooth, epi-<br />
ready surface on the ALILE layer a wet chemical lift-off process for the Si islands
2.5 Current research involving ALILE layers 31<br />
a-Si<br />
Al<br />
glass substrate<br />
(a)<br />
Al (+Si)<br />
Poly-Si<br />
glass substrate<br />
(b)<br />
Poly-Si<br />
glass substrate<br />
(c)<br />
metal contact<br />
TCO<br />
a-Si (n+)<br />
Epi-Si (p)<br />
Poly-Si (p+)<br />
glass substrate<br />
Figure 2.18: Schematic illustration of the formation of a Si thin film solar cell on glass.<br />
(a) The layers of the initial stack; (b) exchange position by annealing at about 500 °C;<br />
(c) the top layer has to be removed in order to uncover the poly-Si layer; (d) After p-<br />
absorber formation by low-temperature epitaxy a low temperature n + -emitter, e.g. a thin<br />
a-Si layer, forms the p-n-junction. The cell is cover by a transparent conductive oxide<br />
layer (TCO) which enhances the lateral conductivity. The cell is finished by forming a<br />
mesa structure and front and back contacts.<br />
within the Al layer has been developed at the UNSW. Thereafter ALILE seed layers<br />
were successfully thickened epitaxially for the first time by ion assisted deposition<br />
(IAD) [58]. In the last two years different cell concepts have been developed<br />
involving IAD and SPE from a-Si layers deposited on the seed layer [59].<br />
The Hahn-Meitner-Institute is coordinating a EU-Project called ’METEOR’ (ENK5-<br />
CT-2001-00543) dealing with the above described solar cell concept [60]. The<br />
members of this project are the Interuniversity Microelectronics Center (IMEC) in<br />
Leuven, Belgium, the Vienna University of Technology (TUW) and the Catholic<br />
University Leuven (KUL). The project includes a high and a low temperature ap-<br />
proach.<br />
At IMEC the high temperature route is followed which offers a faster path to suc-<br />
cessful solar cell fabrication than the low temperature approach. ALILE seed lay-<br />
ers on ceramics substrates are studied. It was found that smoothening the ceramic<br />
substrates by applying a flowable oxide (FOx) is beneficial. Epitaxially thickened<br />
with high temperature atmospheric pressure chemical vapor deposition (APCVD),<br />
(d)
32 State of the art<br />
IMEC has achieved solar cell efficiencies of up to 4.5 % [61]. The influence of rapid<br />
thermal annealing (RTA) and hydrogen passivation of defects in the absorber lay-<br />
ers is examined at IMEC in order to improve the solar cell parameters [62].<br />
HMI focusses on the low temperature route which promises an even higher poten-<br />
tial in cost reduction than the high temperature approach. The ALILE seed layers<br />
are prepared on glass substrates limiting all process temperature to below 600 °C.<br />
It was shown that small amounts of oxygen present during Al deposition decrease<br />
the layer exchange process time, but upon further increasing the oxygen amount<br />
has the opposite effect occurs [63]. Samples are thickened epitaxially using elec-<br />
tron cyclotron resonance chemical vapor deposition (ECRCVD) [64]. Characteri-<br />
zation of defects in low temperature epitaxy is very important and done at HMI by<br />
defect etching, electron spin resonance (ESR) and photoluminescence (PL) [65].<br />
Both approaches are supported by electron microscopic characterization methods<br />
like transmission eleoctron microscopy (TEM), high resolution TEM (HRTEM) and<br />
electron energy loss spectroscopy (EELS) at TUW [66]. At KUL the use of other<br />
metals, e.g. Sb, for alternative crystallization concepts are studied in order to ob-<br />
tain n-doped poly-Si.<br />
Besides the activities at the UNSW and within the METEOR project, many other<br />
institutions started research in ALILE related research during the last couple of<br />
years. At Samsung in South Korea, it was found that the formation of the preferen-<br />
tial orientation depends upon the annealing temperature; the lower the annealing<br />
temperature, the higher the preferential (<strong>100</strong>) orientation [67].<br />
Toyota explored the use of SPC of a-Si on ALILE seed layers for solar cell appli-<br />
cations [68]. Some simulations were done to extrapolated the future goals for<br />
solar cells involving ALILE seed layers which claimed that efficiencies of about<br />
13 % could be achieved when various solar cell parameters are improved [69].<br />
Unfortunately, no time frame for these considerations is given.<br />
Slaoui et al. [70] in Strasbourg, France have investigated the influence of the<br />
structure of the silicon precursor on the layer exchange process. They found that
2.5 Current research involving ALILE layers 33<br />
nanocrystalline Si (nc-Si) yields the smoothed surface of the resulting film. Using<br />
high temperature CVD they achieved epi-layers on top of ALILE seed layers with<br />
grain sizes up to 60 <strong>µm</strong>. The grain sizes were determined by defect etching of the<br />
grain boundaries [71].<br />
At the London South Bank University, low temperature epitaxy using ECRCVD on<br />
an inverse ALILE seed layer structures is studied [72, 73]. The structural quality<br />
of the films is analyzed using electron back scatter diffraction (EBSD) and X-ray<br />
diffraction (XRD) analysis.<br />
The Academy of Science in Sofia, Bulgaria conducts experiments with different<br />
Al, Si layer sequences are conducted [74]. Also, the influence of different an-<br />
nealing atmospheres on the layer exchange process has been explored indicating<br />
that the use of hydrogen in the annealing atmosphere leads to improved strutural<br />
properties of the resulting poly-Si film [75].<br />
At the Technical University München the use of the ALILE process for crystalliza-<br />
tion of amorphous SiGe is investigated. Here, it was found that ALILE is suitable<br />
for crystallizing binary amorphous material without segregating different phases<br />
[76]. The optical and electrical properties of the resulting poly-crystalline films<br />
were found to be comparable with high quality crystalline SiGe films [77].<br />
In the USA many groups (NREL [78, 79], Caltech [80], University of Berkeley,<br />
University of Arkansas and University of Arizona) have recently started working<br />
on thin film c-Si devices either making direct use of the poly-Si layer formed by<br />
ALILE or using similar thin film seed layer concepts.<br />
At the Hahn-Meitner-Institut (HMI), where this work has been done, a group of<br />
researchers is dealing with solar cell concepts based on the ALILE process. As men-<br />
tioned before the poly-Si layers exhibits not only large grains but also a preferen-<br />
tial (<strong>100</strong>) orientation [81]. Due to the high hole density (2 × 10 18 cm −3 [82]) ALILE<br />
poly-Si layers are not suitable as absorber layers. But both the large grain size and<br />
the preferential (<strong>100</strong>) orientation make ALILE layers eligible as templates (seed<br />
layers) for low temperature (< 600 °C) epitaxial growth of an absorber layer. At
34 State of the art<br />
Figure 2.19: TEM cross section (left) and diffraction patterns (right) of a film deposited<br />
on a ALILE seed layer on glass. The circles mark the positions for the selected area aperture<br />
for electron diffraction. The diffraction images are aligned with respect to the neighboring<br />
TEM image. Position A is aligned in (<strong>100</strong>) direction normal to the substrate and position<br />
C is tilted by 7.8°. Epitaxy was successful on A but not on C.<br />
the Hahn-Meitner-Institut the main method used for low-temperature epitaxy has<br />
been electron cyclotron resonance chemical vapor deposition (ECRCVD) [83]. Rau<br />
et al. showed that the ALILE seed layer could be thickened by ECRCVD to above<br />
2 <strong>µm</strong> on grains with an orientation close to (<strong>100</strong>) [64]. In Fig. 2.19 a TEM cross<br />
section and the corresponding diffraction patterns of the glass/seed layer/epitaxial<br />
layer stack are shown. The grain on the right side is epitaxially thickened, whereas<br />
the one on the left caused finecrystalline growth. It was found by diffraction anal-<br />
ysis that the right grain is (<strong>100</strong>) orientated, but the left grain’s (<strong>100</strong>) direction is<br />
tilted by 7.8° with respect to the surface normal. This demonstrates the signifi-<br />
cance of the preferential (<strong>100</strong>)-orientation for low temperature epitaxy.<br />
Another low-temperature epitaxial technology used at HMI is the pulsed sputter<br />
deposition system [84]. Fig. 2.20 shows a transmission optical micrograph of an<br />
epitaxial film (1700 nm) grown on top of an ALILE layer by pulsed sputter deposi-<br />
tion. Clearly different areas can be distinguished. The bright areas were verified<br />
to correspond to epitaxial growth. The dark areas are expected to correspond to
2.5 Current research involving ALILE layers 35<br />
Figure 2.20: Transmission optical micrograph of an ALILE layer thickened by pulsed sput-<br />
ter epitaxy by about 1700 nm.<br />
fine crystalline growth 2 . Thus the growth still has to be improved a lot, but first<br />
results are promising.<br />
First solar cells were processed during the course of this thesis at HMI. The re-<br />
sulting current-voltage (IU) curve (Fig. 2.21(a)). An open circuit voltage of VOC =<br />
254 mV, a short circuit current of JSC = 6.7 mA/cm −2 and a fill factor of F F = 0.35<br />
result in an efficiency of η = 0.55 %. The internal quantum efficiency curve<br />
(Fig. 2.21(b)) of the best cell so far is shown. The best quantum efficiency is<br />
about 26 % at 450 nm. It is evident, that there is still a lot of work to do. All cell<br />
parameters offer chances of improvement. The diode itself does not show a good<br />
rectifying characteristic. Series and parallel resistances have to be improved. The<br />
cell layout needs to be modified. Finally, light trapping has to be incorporated in<br />
order to absorb more photons in the layer.<br />
This thesis is embedded in the activities at HMI. The main focus is to understand<br />
the mechanism of nucleation and growth in the aluminum-induced layer exchange<br />
process. This should lead to an understanding and thus improvement of the self-<br />
2 This fast, non-destructive method of analyzing Si thin film using an transmission optical mi-<br />
croscope was suggested by Straub et al. [85].
36 State of the art<br />
����������<br />
8<br />
6<br />
4<br />
2<br />
0<br />
0 1 0 0 2 0 0<br />
U [m V ]<br />
3 0 0<br />
(a)<br />
[% ]<br />
Q in t<br />
3 0<br />
2 0<br />
1 0<br />
0<br />
.2 0 .4 0 .6 0 .8 1 .0 1 .2<br />
����<br />
Figure 2.21: Current-voltage curve (a) and internal quantum efficiency for one of the first<br />
solar cells processed at HMI.<br />
limited nucleation suppression. The goal is to achieve large grained layer with<br />
grain sizes much larger than the final film thickness of about 2 <strong>µm</strong>. In order to im-<br />
prove the results of the subsequent low-temperature epitaxy the fraction of (<strong>100</strong>)<br />
orientated grains is to be increased.<br />
Within this chapter the history of the aluminum-induced layer exchange process<br />
and its origins is extensively summarized. And an overview on the current work<br />
of several research groups is given. The embedding of this thesis within HMI is<br />
elucidated.<br />
(b)
3 Experimental<br />
This thesis is focussed on the investigation of the influence of the Al/a-Si interface<br />
and the annealing temperature on the layer exchange process. Therefore, it was<br />
part of this work to optimize the setup of an optical microscope with a heating<br />
stage in order to do in-situ investigations on the nucleation and growth in the<br />
ALILE process. In the first part of this chapter the sample preparation is described<br />
in detail. The second part of this chapter describes the setup of the in-situ op-<br />
tical microscopy, the evaluation methods of the obtained images, and additional<br />
characterization methods.<br />
3.1 Sample preparation<br />
The substrates and their cleaning procedure is described in section 3.1.1. All sam-<br />
ples investigated within this thesis were deposited by DC magnetron sputtering.<br />
Both Al and a-Si for the ALILE process (as well as an additional Mo layer) were<br />
deposited in a four target sputtering tool (see section 3.1.2). The role of the Mo<br />
layer is described in section 4.1.2. The oxide interface layer was formed by differ-<br />
ent oxidation methods as described in section 3.1.3. The layer stacks have been<br />
annealed either within a furnace or the heating stage of an optical microscope<br />
(section 3.1.4). After the layer exchange the Al(+Si) top layer has to be removed<br />
in order to uncover the poly-Si layer. Chemical mechanical polishing was used to<br />
produce a smooth, epi-ready surface as described in section 3.1.5 [56]. The last<br />
step is of importance because the poly-Si layer is used as template for epitaxial<br />
thickening in order to form the absorber layer of the thin film solar cell.
38 Experimental<br />
3.1.1 Substrates<br />
Corning glass 1737F substrates were used, which are Na free. The strain point<br />
of this glass lies at 666 °C. The glass substrates were cleaned by a reduced RCA<br />
cleaning, which is usually used for Si wafers. The glasses were initially cleaned in<br />
a P iranha etch (H2SO4 : H2O2 = 3 : 1) at T = 120 °C for 20 min to remove organic<br />
contaminations. After rinsing in deionized (DI) water the samples were cleaned<br />
by a Kern1 etchant (NH4OH : H2O2 : H2O = 1 : 4 : 20) at T = 70 °C for 10 min<br />
to remove complex forming particles. Finally the samples were rinsed in DI-water<br />
again and dried.<br />
Square 1 ′′ × 1 ′′ samples with a thickness of 0.7 mm and round 3 ′′ substrates with a<br />
thickness of 1.1 mm were used. The thin samples can be cut in small pieces easily<br />
and were mainly used for annealing in the optical microscope. However, only the<br />
large samples can be processed in the polisher. Thus, large samples were used for<br />
further epitaxy and cell processing.<br />
3.1.2 Layer deposition<br />
If not otherwise stated samples were deposited with following standard process<br />
parameters. The base pressure in the sputter chamber was 7.0 · 10 −7 mbar. Before<br />
igniting the plasma an argon working pressure of 6.5 · 10 −3 mbar was adjusted. The<br />
sputter power was 500 W. The deposition rates were 160 nm/min and 66 nm/min<br />
with layer thicknesses of 300 nm and 375 nm for Al and a-Si, respectively. All sam-<br />
ples were deposited at room temperature.<br />
3.1.3 Oxidation<br />
The general difference between aluminum-induced crystallization (AIC) and the<br />
aluminum-induced layer exchange (ALILE) is the insertion of a permeable mem-<br />
brane between the initial Al and a-Si layers for the ALILE process. This membrane
3.1 Sample preparation 39<br />
does not participate in the layer exchange process and therefore remains in posi-<br />
tion throughout the annealing process separating top and bottom layer. A suitable<br />
membrane is aluminum oxide. Thus the initial aluminum layer needs to be ox-<br />
idized prior to a-Si deposition in order to obtain continuous poly-Si films [54].<br />
Al oxide layers are formed rapidly upon exposure to an oxygen containing atmo-<br />
sphere such as ambient air. Like in the case of silicon the oxidation of aluminum<br />
is self-limited meaning that the oxide layer prevents further oxidation. Thus upon<br />
reaching a certain oxide thickness, no further oxidation takes place. Whereas na-<br />
tive silicon oxides reach thicknesses of 2 − 3 nm [86, 87], native aluminum oxides<br />
are in the range of 1 − 2 nm.<br />
Within this thesis very thin and very thick oxide layers have been used to test the<br />
limits of the interlayer influence. The investigation of the extreme cases allows to<br />
elucidate the role of the oxide layer. Usually the samples are oxidized by expo-<br />
sure to ambient air for 2 h. Within this thesis additional oxidation methods were<br />
used: An argon/oxygen gas mixture (40sccm/9sccm) in the deposition chamber<br />
was used at low pressure (6.5 · 10 −3 mbar) for 1 min to 120 min to form an ultra<br />
thin oxide layer. Thick oxide layers were formed by thermal oxidation in oxygen<br />
atmosphere in a furnace at 400 °C to 560 °C for 1.5 h. Typically the transfer from<br />
deposition chamber to the oxidation furnace and back took a total of 30 min. This<br />
lead to overall exposure time to oxygen atmosphere of 2 h. The resulting oxide<br />
layer thicknesses are describe in section 4.1.<br />
3.1.4 Annealing<br />
Two different annealing methods were used, a furnace with N2 atmosphere and a<br />
heating stage (Instec, Inc., HCS 601) installed at an optical microscope. The setup<br />
of this heating stage is schematically shown in Fig. 3.1. The samples are placed<br />
face down onto a heating block. The chamber is kept under a constant nitrogen<br />
flow of 20sccm in order to obtain an inert atmosphere to avoid atmospheric in-<br />
fluence on the layer exchange process. The housing of the heating stage is water
40 Experimental<br />
cooled.<br />
A large temperature gradient exists within the heating stage. The housing is at<br />
room temperature whereas the inside of the heating block reaches temperatures<br />
close to 600 °C. In order to determine the sample temperature a Pt<strong>100</strong> thermal<br />
resistor was glued between two glass substrates with a two component ceramics<br />
glue. This stack was placed on the heater and the measurements of the internal<br />
platinum resistance temperature detector (RTD) Tset was compared to the values<br />
obtained by the Pt<strong>100</strong> Treal. The result for the temperature calibration is shown in<br />
Fig. 3.2. The linear fit is:<br />
Treal = 0.854 · Tset + 24.36 °C. (3.1)<br />
It is expected that the temperature in the ALILE layer stack is not above the set<br />
HO<br />
2<br />
N 2<br />
window<br />
heater<br />
window<br />
microscope<br />
objective<br />
sample<br />
PS, TS, N 2<br />
Figure 3.1: Scheme of the heating stage HCS 601 installed in the optical microscope.<br />
The housing is water-cooled and a constant nitrogen flow is supplied to the chamber in<br />
order to obtain a defined atmosphere. Usually the sample is placed face down on the<br />
heater. The heater is a silver block with a heating element, a thermo couple and nitrogen<br />
cooling tube inside. These are connected via an isolated tube to the power supply (PS),<br />
the temperature sensor (TS) and liquid or gaseous nitrogen supply. The sample can be<br />
observed in the optical microscope through a glass window. A window at the backside of<br />
the heating stage in combination with a central hole in the heater allows also to use the<br />
transmission mode of the microscope.<br />
N 2
3.1 Sample preparation 41<br />
� ���� �����<br />
6 0 0<br />
5 5 0<br />
5 0 0<br />
4 5 0<br />
���<br />
4 0 0<br />
��������<br />
3 5 0<br />
����������<br />
3 0 0<br />
3 0 0 3 5 0 4 0 0 4 5 0 5 0 0 5 5 0 6 0 0<br />
� ����� ���<br />
Figure 3.2: Temperature calibration: real temperature Treal as a function of the set value<br />
Tset. (linear fit: Treal = 0.854 · Tset + 24.36 °C). As guide to the eye the Treal : Tset = 1 : 1<br />
line is shown as well.<br />
value Tset and not below the real temperature Treal. The temperature values given<br />
within this thesis are the set values Tset.<br />
The task of the temperature controller is to adjust the annealing temperature as<br />
fast as possible to the desired value without any overshooting. In Fig. 3.3 the re-<br />
sulting temperature profile is shown for heating from RT to 450 °C. Within 3 min<br />
the temperature difference is below 5 °C and within 5 min the temperature differ-<br />
ence is below 1 °C. The temperature stays stable within ±0.5 K of the set temper-<br />
ature.<br />
3.1.5 Chemical Mechanical Polishing<br />
The top Al(+Si) layer has to be removed for certain characterization methods and<br />
the subsequent epitaxial thickening. As suggested earlier [56] this can be done by<br />
chemical mechanical polishing (CMP). In the CMP process the wafer is put into a
42 Experimental<br />
������<br />
4 5 0<br />
4 4 5<br />
4 4 0<br />
0 5 1 0 1 5 2 0<br />
t [m in ] A<br />
Figure 3.3: Temperature Tset versus annealing time tA when the temperature is at RT and<br />
set to 450 °C at 0 min. Within 3 min and 5 min the temperature is within 5 K and 1 K of the<br />
desired temperature, respectively.<br />
carrier head which is pressed onto a pad covering the main plate. Both carrier and<br />
main plate rotate while a defined amount of slurry is poured onto the pad. The<br />
slurry is a liquid including colloidal particles. Between sample and pad a small<br />
film of slurry is formed. While the chemical component modifies the surface at a<br />
homogeneous depth the combined mechanical polishing effect of colloids and pad<br />
take of the most protruding parts. This combined effect results in a very smooth<br />
surface.<br />
A Logitech CDP machine and a silicic acid based slurry (Syton) were used for<br />
polishing the samples. The standard parameters for the main plate and carrier<br />
rotation velocities, the download pressure on the sample and the flow of slurry are<br />
shown in table 3.1. Even though standard parameters are provided the polishing<br />
process has to be adjusted for every polished sample individually by checking the<br />
result during polishing. The polishing process takes about 2 min and has been<br />
optimized within our group.
3.2 In-situ optical microscopy 43<br />
main plate carrier download pressure slurry<br />
60rpm 40rpm 0.5 .. 0.7mbar 50 mL/ min<br />
Table 3.1: Main CMP parameters<br />
3.2 In-situ optical microscopy<br />
For in-situ characterization the samples were annealed in the optical microscope.<br />
The evaluation of the obtained results is described in detail in the following.<br />
For in-situ investigation of the layer exchange process a Leitz DMRX optical mi-<br />
croscope was used. The microscope has been equipped with a heating stage (see<br />
Fig. 3.1) and a digital camera (Sony DXC-151P CCD/RGB). The entire setup of the<br />
in-situ optical microscope is shown in Fig. 3.4. The camera image can be observed<br />
live at a monitor. The heating stage is powered by a power supply and operated<br />
by a PID temperature controller (see section 3.1.4). The controller is set via a<br />
Labview programm on the computer. Images were recorded using the program<br />
’supervision cam’ within typical time intervals of 10 s to 5 min depending on the<br />
process parameters. The spatial resolution limit of the setup is about 0.5 <strong>µm</strong>.<br />
The samples were put upside down onto the heating block. Thus the initial<br />
glass/Al interface is observed during the annealing through the glass substrate.<br />
Due to the high reflectivity of the Al the micrographs appear bright at the begin-<br />
ning of the process. As soon as the size of the Si grains exceeds the resolution<br />
limit of the microscope the crystallized Si becomes visible as small dark spots at<br />
the glass/Al interface due to the lower reflectivity of Si compared with Al. These<br />
dots grow further and finally form a continuous poly-Si film. Then the image ap-<br />
pears completely dark. Fig. 3.5(a) shows an optical micrograph of a samples after<br />
21.5 min annealing. The silicon covers 50 % of the micrograph area. Dark silicon<br />
grains have appeared. Fig. 3.5(b) shows the corresponding crystallized fraction<br />
RC curve. The definition and determination of the RC value is described in the<br />
next paragraph. The dot marks the image in (a).
44 Experimental<br />
camera<br />
OM<br />
HS<br />
live<br />
monitor<br />
power supply<br />
temperature<br />
controller<br />
computer<br />
Figure 3.4: Setup for in-situ microscopy. The sample in the heating stage (HS) (see<br />
Fig. 3.1) is observed in the optical microscope (OM). A CCD camera on the microscope is<br />
connected to a live monitor and a PC. The temperature controller operates a power supply<br />
to adjust the annealing temperature. The computer uses a Labview program to set the<br />
temperature profiles in the controller.<br />
(a)<br />
R C [% ]<br />
1 0 0<br />
8 0<br />
6 0<br />
4 0<br />
2 0<br />
0<br />
� ��� ���������<br />
�<br />
0 1 0 2 0 3 0 4 0<br />
� ������ �<br />
Figure 3.5: (a) Optical micrograph of a sample after 21.5 min annealing at Tset = 450 °C.<br />
The growing silicon grains are dark within the bright Al matrix. (b) Corresponding crys-<br />
tallized fraction curve RC. RC starts at 0 % when no silicon is present in the aluminum<br />
and reaches <strong>100</strong> % when the layer exchange is completed. The spot represents the case of<br />
the micrograph in (a).<br />
(b)
3.2 In-situ optical microscopy 45<br />
Before the annealing a ’blanc’ image is acquired of the glass/Al interface as a ref-<br />
erence for the CCD camera. The images are evaluated using image processing<br />
techniques of the program ’Image Tool’. ’Image Tool’ scripts were used to auto-<br />
mate image analysis. First, the color micrographs are converted to 8bit greyscale.<br />
Second, the ’blanc’ image is subtracted from each image in order to remove ef-<br />
fects from illumination non-uniformity and difference in brightness of images of<br />
different series. Thus the compatibility of the images of different series can be<br />
guaranteed. The threshold can be set to 170 out of 256 greyscale tones for all<br />
series. All pixels brighter than this margin are evaluated to be white (Al) and all<br />
darker pixels to be black (Si). The black fraction of the images is determined and<br />
used as crystallized fraction RC. The crystallized fraction curves are evaluated as<br />
function of the annealing time tA. RC is 0 % at the beginning of the process and<br />
corresponds to all Al at the interface. The first time spots area detect is defined<br />
as the nucleation time tN. As soon as RC reaches <strong>100</strong> % the entire glass surface is<br />
covered with poly-Si. The process time tP is defined as the time required to reach<br />
RC = 95 %.<br />
Counting the number of black objects n in the black and white image of area A0<br />
determines the nucleation density NG in each image (NG = n ). In Fig. 3.6 the nu-<br />
A0<br />
cleation density NG is shown as a function of the annealing time tA for a specimen<br />
with a thermal oxide interface formed at 500 °C for 1.5 h annealed at TA = 450 °C.<br />
Nucleation starts after tA = 15 min and increases rapidly until after about 30 min<br />
nucleation is strongly slowed down. The maximum nucleation density is reached<br />
after tA = 65 min. The nucleation density detected in the images decreases again,<br />
because neighboring grains coalesce and are not distinguished anymore. The max-<br />
imum of the nucleation density was used to evaluate the final estimated grain size<br />
dG of grains assumed to be squared (dG =<br />
� 1<br />
NG<br />
). The estimated grain size in-<br />
cludes several assumptions: (i) the maximum number of grains is detected when<br />
no new grains are formed, (ii) at this point no grains have collided, i.e. all grains<br />
are separate and counted, (iii) all grains are averaged in size, (iv) a square shape<br />
of the grains is assumed, (v) the areas grown from one nucleus are a grain, i.e.
46 Experimental<br />
-2 ]<br />
N G [1 0 0 0 m m<br />
1 .0<br />
0 .8<br />
0 .6<br />
0 .4<br />
0 .2<br />
N G ,m a x<br />
0 .0<br />
0 6 0 1 2 0<br />
t [m in ] A<br />
1 8 0<br />
Figure 3.6: Nucleation density NG versus annealing time tA for a specimen with a thermal<br />
oxide formed at 500 °C for 1.5 h annealed at TA = 450 °C.<br />
monocrystalline.<br />
3.3 Electron Back Scatter Diffraction<br />
Crystallographic analysis was done by Electron Back Scatter Diffraction (EBSD). A<br />
nice overview on EBSD is given in [88].<br />
EBSD uses the elctron beam from a scanning electron microscope and detects the<br />
back scattered electrons with a phosphor screen or CCD camera. The incident<br />
angle of the electron beam is low, about 20° with respect to the sample surface.<br />
Thus the penetration depth of the electrons is decreased and the fraction of back<br />
scattered electrons from the sample is increased. The elastic scattering of the elec-<br />
trons is either (i) a coulomb interaction with a nucleus or (ii) an interaction with<br />
the electron gas. As a result electrons are scatter in all direction almost homo-<br />
geneously. Due to the elastic scattering the electrons do not lose energy. Thus<br />
the electron propagate in all direction of the sample with the same energy. Elec-<br />
tron diffraction in the excited volume increases the number of electrons fulfilling<br />
Bragg’s condition:
3.3 Electron Back Scatter Diffraction 47<br />
nλ = 2 d sin Θ (3.2)<br />
where n is an integer (order of diffraction), λ is the wave length of the electron<br />
beam, d the lattice spacing and Θ is the diffraction angle. The incident electrons<br />
interact with a small volume of some cubic nanometers. With the detection screen<br />
being some centimeters away the detection volume can be assumed to be one<br />
point. Due to the homogeneous distribution of all electron propagation direc-<br />
tions in the sample the diffracted electrons exhibit a rotational symmetry around<br />
the normal to the respective lattice planes fulfilling Bragg’s condition. Thus the<br />
diffracted electrons show a maximum in two cones symmetric to the lattice planes<br />
in forward and backward direction. When these two cones intersect with the plane<br />
detection screen a double line is formed. These lines are referred to as Kikuchi<br />
lines. Their distance is inversely proportional to the lattice spacing d. The sum of<br />
all Kikuchi lines is called Kikuchi pattern. It is characteristic for the lattice type<br />
and spacing and thus allows the identification of both the investigated material<br />
and the crystal orientation. Since the samples investigated here are all Si, EBSD is<br />
used to determine the samples’ crystal orientation.
48 Experimental
4 Results<br />
In order to understand and optimize the aluminum-induced layer exchange pro-<br />
cess (ALILE) two main process parameters were modified. The role of an interlayer<br />
between aluminum and silicon was intensely studied (sec. 4.1). Therefor different<br />
types of oxidation conditions were tested. The thickness of the oxide layer was<br />
varied in a wide range from just about 1 nm to several 10 nm. On the one hand<br />
thick oxide layers and high annealing temperatures leads to large grain sizes in<br />
short process times. On the other hand thin oxide layers and low annealing tem-<br />
peratures enhances the formation of (<strong>100</strong>) orientated grains. Molybdenum as an<br />
alternative interlayer was investigated. It is shown that molybdenum interlayers<br />
enable the layer exchange process as well. They even facilitate the lift-off process<br />
of the silicon islands.<br />
In a thermal annealing process the process temperature is a crucial parameter. So<br />
far only isothermal annealing experiments have been reported in the ALILE pro-<br />
cess. Here the influence of different temperature profiles was studied (sec. 4.2).<br />
Experiments on increasing and decreasing the temperature during annealing were<br />
performed. The heating step experiments show that after a certain point in the<br />
annealing process the temperature can be increased without causing additional<br />
nucleation but resulting in shorter process time. This reinforces the existence of<br />
depletion regions around the growing grains. Once the depletion regions over-<br />
lap the temperature can be increased. The depletion regions become apparent in<br />
cooling step experiments where additional nucleation is caused by supercooling.<br />
Zones without additional nucleation around existing grains are direct experimen-<br />
tal proof of the existence of concentration profiles, namely the depletion regions.
50 Results<br />
4.1 Interlayer<br />
It was shown that an aluminum oxide interlayer between the initial Al and a-Si<br />
is needed in the aluminum-induced layer exchange process [54]. The interlayer<br />
controls the velocity of the crystallization process and the nucleation density. Both,<br />
oxidation of the aluminum layer as well as the oxidation of the amorphous silicon<br />
layer in an inverse layer structure were shown to lead to a layer exchange. Still<br />
many questions concerning the interlayer need to be answered.<br />
Two fundamental questions arise regarding the role of the interface layer. ’What<br />
happens without an interface layer?’ and ’Why is an oxide layer needed?’. In<br />
order to answer the first question a sample was prepared without an interlayer,<br />
i.e. the a-Si was deposited directly onto the Al. Additionally a sample with oxide<br />
interface was prepared. The samples were annealed at 480 °C for 45 min and the<br />
Al was etched off wet chemically. SEM images without (a) and with (b) oxide<br />
layer are shown in Fig. 4.1. The samples were tilted by 30°. At the bottom of the<br />
micrographs is the glass substrate covered with silicon. In both cases the glass is<br />
covered with large compact Si islands. The sample without oxide layer shows a<br />
porous silicon structure. Through holes in the porous structure the glass substrate<br />
is visible. No continuous film is obtained. With oxide layer a continuous Si film<br />
covers the glass beneath the islands. Thus, the use of an oxide layer leads to the<br />
formation of a continuous layer. This continuous Si layer is used as substrate for<br />
the subsequent epitaxy.<br />
TEM investigations were made in order to determine the influence of the anneal-<br />
ing process on the oxide layer. In Fig. 4.2 a TEM cross section of a sample after<br />
annealing is shown. The glass is covered by a continuous silicon layer. The top<br />
layer consist of Al with silicon islands. The presented section shows mostly sili-<br />
con islands. However, top and bottom layers are clearly separated. In the inset<br />
the color-coded superposition of three electron energy loss spectroscopy (EELS)<br />
elemental maps is shown. Here, red corresponds to Al, blue to O and green to<br />
Si. Even after the layer exchange process the oxide layer is still at the interface
4.1 Interlayer 51<br />
(a)<br />
(b)<br />
Figure 4.1: SEM micrographs of the crystallized Silicon after annealing and wet chemical<br />
removal of the Al without (a) and with (b) oxide interlayer [89]. In (a) a porous crystalline<br />
Si structure is formed. In (b) the glass substrate is covered with a continuous poly-Si film.<br />
On top of the film are Si islands which are crystalline as well.
52 Results<br />
between the c-Si seed layer (bottom) and the Al matrix with Si islands (top). In<br />
the inset almost no Al can be seen. But clearly the oxide interface between the si<br />
grain in the bottom layer and the Si island in the top layer is continuous even after<br />
the layer exchange. These results imply several conclusions. In order to remain at<br />
the same position without relocation the oxide layer must be permeable for both<br />
Al and Si. The silicon grains formed within the Al layer cannot grow across the<br />
oxide interface, they remain confined within the Al layer between oxide layer and<br />
glass. This leads to lateral growth and resulting continuous, smooth poly-Si layers.<br />
The thicknesses of the resulting c-Si and Al(+Si) layer are thus determined by the<br />
thicknesses of the initial Al and a-Si layers, respectively. Separation of top and<br />
bottom layer throughout the process is one of the task of the interlayer.<br />
In order to answer the second question, why an oxide layer is needed and to get a<br />
more detailed insight into the role of the interlayer, the oxide layer was varied by<br />
changing the thickness and preparation method (sec. 4.1.1). Alternatively a thin<br />
molybdenum layer was used as interface layer. This is described in sec. 4.1.2.<br />
4.1.1 Oxide interlayer<br />
Three different types of oxide interlayer were prepared by varying the oxidation<br />
conditions of the Al surface:<br />
• Type A: Thin oxide formed by oxidizing the Al surface in the deposition<br />
chamber by exposure to a gas mixture of [Ar] / [O2] = 40sccm/10sccm at<br />
6.5 · 10 −3 mbar for 60 min at room temperature.<br />
• Type B: Standard oxide formed by exposure to air for 20 h at room temper-<br />
ature.<br />
• Type C: Thick oxide formed by thermal oxidation of the Al surface in a<br />
furnace at 560 °C in oxygen atmosphere for 2 h.
4.1 Interlayer 53<br />
Figure 4.2: TEM cross section of a layer stack after annealing. On the glass substrate are<br />
the poly-crystalline Si seed layer and on top of it is the Al(+Si) layer. In this portion of<br />
the Al(+Si) layer mostly crystalline Si islands are found. In the inset a color coded EELS<br />
elemental map is shown. The oxide layer (blue) remains in position throughout the layer<br />
exchange process.
54 Results<br />
To investigate the influence on the incorporated amount of oxygen the different<br />
sample types were analyzed by Auger electron spectroscopy (AES) depth profil-<br />
ing. Fig. 4.3 shows AES counts for oxygen as a function of the sputter cycles for<br />
samples of type A, B and C 1 . The a-Si layer is on the left side, the Al layer on<br />
the right side and the oxide layer in between as indicated at the top of the graph.<br />
Whereas samples of type A and B show a narrow oxygen peak at the interface<br />
indicating that the oxide layer is quite thin, sample C exhibits a broad oxygen sig-<br />
nal indicating that the aluminium oxide layer stretches over several AES sputter<br />
cycles significantly into the Al-layer. Additionally the maximum number of oxygen<br />
counts increases for sample C. Note that the sputter cones obtained during the<br />
AES depth profiling lead to a broadening of the signal. The AES measurement is<br />
surface sensitive. If the surface is bend the analysis is integrated over a certain<br />
thickness of the film. Only the oxide in specimen type C is thicker than the curva-<br />
ture of the sputter cone. Thus the number of counts is higher and the maximum<br />
extends across several cycles. TEM investigations showed that the oxide layer<br />
thickness for the samples was increased from 4 nm to above 30 nm for samples of<br />
type A and C, respectively. While no TEM investigations were made on sample<br />
type B it is estimated from TEM results of other interlayers and the AES results<br />
in Fig.4.3 that it should be about double the thickness of the interlayer of sample<br />
type A. Thus the amount of oxygen at the interface was successfully altered by<br />
varying the oxidation conditions.<br />
The influence of the different oxide layers on the layer exchange process was stud-<br />
ied using the in-situ microscope setup. The samples were placed face down in the<br />
heating stage to enable the observation of the glass/Al-interface through the glass<br />
substrate. Two micrographs are shown in Fig. 4.4 recorded for samples of type A<br />
(Fig. 4.4b) and C (Fig. 4.4a) at a crystallized fraction RC = 40 % (defined in sec-<br />
tion 3.2) after 35 min and 29.5 h annealing at 450 °C, respectively. The silicon areas<br />
appear as dark round shapes in the bright aluminum matrix. For sample type A<br />
the nucleation density is much higher (NG,A = 3460 mm −2 ) than for sample type<br />
1 The zero sputter cycles were set at the onset of the oxide layer
4.1 Interlayer 55<br />
c o u n ts [a .u .]<br />
1 0 0<br />
8 0<br />
6 0<br />
4 0<br />
2 0<br />
0<br />
a -S i o x id e la y e r<br />
A l<br />
C<br />
B<br />
A<br />
0 1 0 2 0 3 0<br />
c y c le<br />
Figure 4.3: Auger depth profile of oxygen at the a-Si/Al-interface after deposition. The<br />
number of counts vs. the sputter cycles is shown. The corresponding layers are shown<br />
at the top of the graph. Samples of type A, B and C were measured. An increase in the<br />
oxygen content at the interface could be confirmed.<br />
C (NG,C = 44 mm −2 2 ). For sample type C the grains grow dendritic and some Al<br />
inclusions are visible in the growing grains. These inclusions should be avoided,<br />
because continuous poly-Si layer are desired for epitaxial thickening. Still the<br />
large difference in nucleation density demonstrates one of the most striking obser-<br />
vations in the ALILE process. In Fig. 4.4b large areas > <strong>100</strong> × <strong>100</strong> <strong>µm</strong> −2 ) without<br />
any nuclei are visible. In these areas no new grains appear throughout the entire<br />
process. The nucleation of the first grain suppressed nucleation of further grains<br />
in a self-limiting process. The phenomenon of self-limited nucleation suppression<br />
can stretch over several <strong>100</strong> <strong>µm</strong>. The oxide layer controls the flux of silicon from<br />
the amorphous Si phase into the Al. If this flux is inhibited by a thick interlayer<br />
less silicon is available in the Al layer and the nucleation rate is lower. Addition-<br />
ally this increases the process time strongly. Sample type C in Fig. 4.4b had to be<br />
annealed for 29.5 h. The origin of the nucleation suppression is discussed in detail<br />
in the chapter 5.<br />
2 This number is derived from a larger image not shown here
56 Results<br />
(a)<br />
(b)<br />
<strong>100</strong> <strong>µm</strong><br />
<strong>100</strong> <strong>µm</strong><br />
Figure 4.4: Optical micrograph of sample type (a) A (thin oxide) and (b) C (thick oxide)<br />
annealed at 450 °C at a crystallized fraction RC = 40 % after 35 min and 29.5 h, respectively.<br />
The images are taken looking through the glass at the initial glass/Al-interface. The dark<br />
circles correspond to the silicon growth areas while the bright area is the aluminium. The<br />
nucleation density in (b) is much lower than in (a). In (b) several Al inclusions in the<br />
growing grains can be observed. These have to be avoided.
4.1 Interlayer 57<br />
R C [% ]<br />
1 0 0<br />
8 0<br />
6 0<br />
4 0<br />
2 0<br />
1 0 1<br />
0<br />
A B C<br />
1 0 2<br />
1 0 3<br />
t [m in ] A<br />
Figure 4.5: Crystallized fraction RC versus annealing time tA for samples of type A, B and<br />
C annealed at 450 °C. While the layer exchange for sample A was completed in less than<br />
2 h it took about 2d for sample type C.<br />
Fig. 4.5 shows the crystallized fraction RC as a function of the annealing time for<br />
samples A, B and C at 450 °C. Annealing of sample A took less than two hours<br />
while the layer exchange for sample C took several days. The RC reaches <strong>100</strong> %<br />
for all types of oxide, i.e. all samples formed a continuous silicon layer 3 . Even for<br />
the very thick oxide (sample C) the layer exchange took place. Thus, the thicker<br />
the oxide, the lower the nucleation rate and the higher the process time tP needed<br />
to complete the process.<br />
The process time tP is defined as the annealing time needed to reach a crystallized<br />
fraction RC of 95 %, tP = tA (RC = 95 %). The process time tp (solid circles) and<br />
estimated grain size dG (open circles) for the three samples annealed at 450 °C are<br />
shown in Fig. 4.6. Thicker oxides lead to higher process times and larger estimated<br />
grain sizes. Note the enormously large estimated grain size of above <strong>100</strong> <strong>µm</strong> of the<br />
thermally oxidized sample (as already visible in Fig. 4.4b). This is the largest,<br />
published estimated grain size achieved with the ALILE process so far. However,<br />
3 the Al inclusion in Fig. 4.4b are to small at the end in order to contribute to a significant<br />
reduction of RC for sample type C<br />
1 0 4
58 Results<br />
� � ������<br />
1 0 4<br />
1 0 3<br />
1 0 2<br />
1 0 1<br />
A B<br />
S a m p le T y p e<br />
C<br />
1 0 3<br />
1 0 2<br />
1 0 1<br />
1 0 0<br />
� � �����<br />
Figure 4.6: Process time tp (solid circles) and estimated grain size dG (open circles) for<br />
samples A, B and C annealed at 450 °C. Sample A: thin oxide. Sample B: standard oxide.<br />
Sample C: thick oxide. The lines in the graph are guides to the eye.<br />
the process times to reach these large estimated grain sizes are very high, up to<br />
several days. For technological applications a compromise between grain size and<br />
process time in short process times has to be made.<br />
Both parameters - process time and estimated grain size - are a function of the<br />
annealing temperature as well. Fig. 4.7 shows process time tp and estimated grain<br />
size dG as a function of the annealing temperature tA for a sample of type B.<br />
The sample was annealed at 450 °C, 480 °C and 500 °C. While the process time<br />
varies strongly by about an order of magnitude (from 43 min at 500 °C to 605 min<br />
at 450 °C), the estimated grain size is only doubled (from 15 <strong>µm</strong> to 37 <strong>µm</strong>).<br />
In order to compare the influence of annealing temperature and type of oxide<br />
layer, samples of type B and C were annealed at higher temperatures to reduce<br />
the process times. The annealing temperatures were increased until the process<br />
time for all samples was below < 2 h. Sample A was annealed at 450 °C as in<br />
Fig. 4.8. Sample type B was annealed at 480 °C. Raising the annealing temperature<br />
by 30 °C reduced the process time by almost an order of magnitude. Sample C had<br />
to be annealed at 540 °C - i.e. 90 °C higher than sample A - to reduce the process
4.1 Interlayer 59<br />
� � ������<br />
1 0 4<br />
1 0 3<br />
1 0 2<br />
�������������<br />
1 0 3<br />
1 0 2<br />
1 0 1<br />
1 0 0<br />
1 0<br />
4 4 0 4 6 0 4 8 0 5 0 0 5 2 0<br />
1<br />
� ����� �<br />
Figure 4.7: Process time tp (solid circles) and estimated grain size dG (open circles) vs.<br />
annealing temperature TA for sample type B (standard oxide).<br />
time to about 2 h. The estimated grain sizes dG were smaller for samples B and<br />
C compared to the case of annealing at 450 °C (Fig. 4.6). Still a strong increase<br />
in the estimated grain size dG for the sample of type C was found compared to<br />
sample type A and B even at higher annealing temperature. The difference in dG<br />
from sample A and C is about one order of magnitude at similar process time, the<br />
estimated grain size for sample C is 150 <strong>µm</strong>, for sample of type A it is just about<br />
17 <strong>µm</strong>.<br />
Thus, it is concluded that the process time tp is dominated by the annealing tem-<br />
perature TA whereas the oxide layer thickness dox determines mainly the estimated<br />
grain size dG. Thus a second task of the interlayer is the control of the nucleation<br />
density NG and as a consequence the estimated grain size dG. For a detailed dis-<br />
cussion of these result see chapter 5.4.<br />
After demonstrating the influence of the interlayer on the nucleation density, the<br />
influence on the grain growth is investigated. Analyzing the growth of a single<br />
grain the radius growth velocity was studied. This quantity may be taken as a mea-<br />
sure of the grain growth. In Fig. 4.9 shows the development of the radius of a sin-<br />
gle grain rG (t) analyzed during annealing of a specimen of type C at TA = 400 °C.<br />
� � �����
60 Results<br />
� � ������<br />
1 0 4<br />
1 0 3<br />
1 0 2<br />
1 0 1<br />
� � ���<br />
�������������������������<br />
A B<br />
�����������<br />
C<br />
1 0 3<br />
1 0 2<br />
1 0 1<br />
1 0 0<br />
� � �����<br />
Figure 4.8: Adjustment of the process time tp (solid circles) to below 2 h for the three dif-<br />
ferently oxidized samples by raising the annealing temperature TA from 450 °C to 480 °C<br />
for sample B and to 540 °C for sample C. The estimated grain size dG (open circles) is still<br />
increasing strongly from sample B to C with increasing oxide thickness. The lines in the<br />
graph are guides to the eye.<br />
Here the nucleation time tN is defined by the time when the grain becomes visible<br />
in the optical microscope. The radius growth velocity vG = drG/dtA increases at<br />
the beginning until a final, constant grain growth velocity vG,0 is obtained. The<br />
slowest annealing process (thick oxide and low annealing temperature) was cho-<br />
sen to define tN and vG,0 because here the steady increase in the grain growth<br />
velocity before reaching a constant vG,0 can most easily be demonstrated. 4 The<br />
linear growth of the radius means that the area of the grain grows as tA 2 . This<br />
finding is quite striking because it means that during the process more and more<br />
Si is incorporated into the growing surface.<br />
The grain radius rG versus annealing time tA for the different sample types is<br />
shown in Fig. 4.10. Several grains for each specimen were evaluated and the fi-<br />
nal grain growth velocity vG,0 was determined by a linear fit to the rG curves and<br />
4 The noise in the curve is caused by small movements of the image and variations in image<br />
brightness during the annealing.
4.1 Interlayer 61<br />
� � �����<br />
1 0 0<br />
8 0<br />
6 0<br />
4 0<br />
2 0<br />
��������<br />
� � ��������<br />
� � ����<br />
0<br />
0 2 4 4 8 7 2 9 6 1 2 0 1 4 4 1 6 8<br />
t [h ] A<br />
Figure 4.9: The radius of a single grain rG as a function of the annealing time tA for<br />
a specimen type C annealed at TA = 400 °C. The grain becomes visible at the nucleation<br />
time tN. The grain growth velocity increases until the final, constant grain growth velocity<br />
vG,0 is obtained.<br />
by calculating the average value. The grain growth velocity for specimen A is<br />
0.227 ± 0.028 <strong>µm</strong>/min. For both the other specimens the grain growth velocity was<br />
found to be approximately equal at 0.077 ± 0.006 <strong>µm</strong>/min and 0.076 ± 0.001 <strong>µm</strong>/min<br />
for samples type B and C, respectively. The grain growth velocity is similar for all<br />
grains in the same experiment. All grains in the same experiment nucleate at<br />
approximately the same time.<br />
In Fig. 4.11 the density of grains NG is shown as a function of the annealing time<br />
for a specimen of type C annealed at 450 °C. The density of grains is very low<br />
at the end of the process indicating the very large grain size. Three different<br />
phases of the process are marked. In phase (I) no grains are visible. In phase<br />
(II) nucleation takes place and these grains grow, thus this phase is referred to as<br />
nucleation phase. After a certain time the nucleation comes to an end. The existing<br />
grains continue to grow until the layer exchange is completed. This phase (III) is<br />
referred to as growth phase. The process time in case of the sample in Fig. 4.11<br />
is about 43 h (Fig. 4.6). Depending on the process parameters the phases have
62 Results<br />
� � �����<br />
� � �����<br />
� � �����<br />
1 5<br />
1 0<br />
5<br />
0<br />
0 2 0 4 0 6 0 8 0<br />
3 0<br />
� ���������������<br />
���<br />
2 0<br />
1 0<br />
0<br />
1 5 0 2 4 0 3 3 0 4 2 0 5 1 0 6 0 0<br />
1 5 0<br />
� ���������������<br />
���<br />
1 0 0<br />
5 0<br />
� ��� ���������������<br />
�������������<br />
�������������<br />
�������������<br />
0<br />
6 0 0 1 0 0 0 1 4 0 0 1 8 0 0 2 2 0 0 2 6 0 0<br />
t [m in ] A<br />
Figure 4.10: Radius rG of several grains in the same experiments as a function of the<br />
annealing time tA for specimen A, B and C annealed at 450 °C. For sample type A the<br />
average final grain growth velocity vG,0 is faster than for the two other specimen.
4.1 Interlayer 63<br />
-2 ]<br />
N G [m m<br />
8<br />
6<br />
4<br />
2<br />
I I I I I I<br />
0<br />
0 3 6<br />
t [h ] A<br />
9 1 2<br />
Figure 4.11: Density of grains NG as a function of the annealing time tA for a specimen<br />
type C annealed at 450 °C. Three characteristic phases of the process are marked. In<br />
phase (I) no nuclei are formed. In the nucleation phase (II) more and more silicon grains<br />
become visible. In the growth phase (III) nucleation is suppressed and the layer exchange<br />
is continued by growth of the existing grains only. The process time is tP = 43 h<br />
different durations. Sometimes all grains appear basically at the same moment,<br />
i.e. within one or two micrographs in a time period short as compared to the<br />
process time. This is the case when thick oxide interfaces (type C) are used. In<br />
Fig. 4.11 the nucleation phase last about 4 h which is short compared to a process<br />
time tP = 43 h. However there are also other cases were the new grains are formed<br />
almost throughout the entire process and the growth phase (III) is short.<br />
The self limited nucleation suppression is one of the characteristic features of the<br />
ALILE process. Due to the low nucleation density large grain sizes are obtained<br />
in the ALILE process. The mechanism responsible for the self-limitation of the<br />
nucleation is discussed in detail in chapter 5.<br />
Besides large grain size the orientation of the resulting grains and the structural<br />
quality of the grains is of crucial importance for the subsequent epitaxial thick-<br />
ening. It was demonstrated that the resulting poly-Si layers exhibit a preferen-
64 Results<br />
tial (<strong>100</strong>) orientation [81]. This crystal (<strong>100</strong>) orientation is desirable for low-<br />
temperature epitaxy [90, 91, 64]. Kim et al. [67] showed that the preferential<br />
Si grain orientation of the resulting seed layers depends on the annealing temper-<br />
ature. Low annealing temperature leads to a higher degree of preferential (<strong>100</strong>)<br />
orientation. Here not only the annealing temperature but also the influence of the<br />
interface was investigated. In Fig. 4.12 EBSD maps for samples of type B and C<br />
annealed at three different temperatures namely at 450 °C, 500 °C and 550 °C are<br />
shown. The different colors in the maps correspond to different crystal orienta-<br />
tions: red is (<strong>100</strong>), green is (110) and blue is (111) orientation. No orientation<br />
could be assigned to the black spots either due to inhomogeneities in the crys-<br />
tallite or at the sample surface. In general the maps for the sample with native<br />
oxide interface (type B) are more red, i.e. more grains are close to (<strong>100</strong>) orienta-<br />
tion, than in case of samples with thermal oxide (type C) which are more blue,<br />
i.e. more grains are close to (111) orientation. Thus, the ALILE process allows the<br />
fabrication of both, layers with a preferential (<strong>100</strong>) orientation and layers with a<br />
(111) orientation. Remarkably almost none of the maps exhibits clear green color<br />
indicating that almost no grains of (110) orientation are formed. When looking<br />
at the temperature dependence the finding of Kim et al. [67] is confirmed. The<br />
lower the annealing temperature the more (<strong>100</strong>) orientated grains are found for<br />
both oxide interlayers.<br />
The EBSD maps in Fig. 4.12 have different scale because also the nucleation den-<br />
sities differ strongly. For the sample type C (thermal oxide) the estimated grain<br />
sizes are above <strong>100</strong> <strong>µm</strong> for all annealing temperatures. In the maps it is evident<br />
that areas of homogenous crystal orientation are much smaller than the estimated<br />
grain size. Thus it is concluded, that each region grown from nucleus must in-<br />
clude several orientations in case of sample type C. Furthermore many black spots<br />
are found which might be due to a microcrystalline structure. For the sample<br />
type B (native oxide) larger connected areas with similar orientation can be dis-<br />
tinguished. From optical micrographs the grain size was estimated to be 12 <strong>µm</strong> in<br />
case of the sample annealed at TA = 550 °C increasing up to 36 <strong>µm</strong> for the sample
4.1 Interlayer 65<br />
TA = 450 °C<br />
TA = 500 °C<br />
TA = 550 °C<br />
sample type B sample type C<br />
25 <strong>µm</strong> 50 <strong>µm</strong><br />
10 <strong>µm</strong> 50 <strong>µm</strong><br />
10 <strong>µm</strong> 50 <strong>µm</strong><br />
Figure 4.12: EBSD maps for samples type B (native oxide) and C (thermal oxide) an-<br />
nealed at 450 °C, 500 °C and 550 °C. Native oxide and low annealing temperature enhance<br />
the degree of preferential (<strong>100</strong>) orientation.
66 Results<br />
annealed at TA = 450 °C. This leads to the conclusion that the nucleation density<br />
does not correspond directly to a crystallographic grain size. Further investiga-<br />
tions concerning the structure within the areas growing from one nucleus in the<br />
seed layers have to be performed.<br />
The inverse pole figures for the two most distinct case for (a) the sample type B<br />
(native oxide) annealed at low temperature (TA = 450 °C) and (b) sample type<br />
C (thermal oxide) annealed at high temperature (TA = 550 °C) are shown in<br />
Fig. 4.13. The inverse pole figure is the superposition of all equivalent orienta-<br />
tions. The three corners correspond to the the three low index orientations (<strong>100</strong>),<br />
(110) and (111) like the color code from the EBSD maps. The detection spots<br />
agglomerate close to the (<strong>100</strong>) orientation in Fig. 4.13(a) and close to the (111)<br />
orientation in Fig. 4.13(b).<br />
In order to quantify the result obtained for the different samples the red fraction<br />
of the maps has been analyzed. The red fraction is changed with the tilting angle<br />
α with respect to the (<strong>100</strong>) orientation (α = 0° = (<strong>100</strong>)). All angles larger than 45°<br />
have no red fraction. The ratio of orientation within α ≤ 20° to the overall area<br />
under investigation is referred to as preferential (<strong>100</strong>) orientation R(<strong>100</strong>). Fig. 4.14<br />
shows R(<strong>100</strong>) for the six EBSD maps. The solid circles correspond to the native<br />
oxide results (sample type B) and the open circles to the thermal oxide (sample<br />
type C). The above described trend can be confirmed for the preferential (<strong>100</strong>)<br />
orientation R(<strong>100</strong>). The native oxide and lower annealing temperature TA enhance<br />
the degree of preferential (<strong>100</strong>) orientation. For the sample of type B annealed at<br />
450 °C R(<strong>100</strong>) is close to 70 %. For sample of type C and an annealing temperature<br />
of 550 °C R(<strong>100</strong>) decreased below 10 % 5 .<br />
Usually preferential orientations are determined by the fastest growth of a partic-<br />
ular orientation. Depending on the velocity of a process or subprocess preferential<br />
orientations are formed. In the presented case the thermal oxide (sample type C)<br />
5 The preferential (<strong>100</strong>) orientation R(<strong>100</strong>) is quantitative but limited number for the orientations<br />
in the films. It allows for a quantitative evaluation but comparison of the EBSD maps in Fig. 4.12<br />
with the result shown in Fig. 4.14 shows strong differences even for similar R (<strong>100</strong>).
4.1 Interlayer 67<br />
(111)<br />
(<strong>100</strong>) (110)<br />
(a)<br />
(111)<br />
(<strong>100</strong>) (110)<br />
(b)<br />
Figure 4.13: Inverse pole figures corresponding to the EBSD maps shown in Fig. 4.12 for<br />
(a) the sample type B (native oxide) and low annealing temperature (TA = 450 °C) and<br />
(b) the sample type C (thermal oxide) and high annealing temperature (TA = 550 °C). In<br />
(a) a preferential (<strong>100</strong>) orientation in (b) a preferential (111) orientation is detected. In<br />
neither case (110) orientated grains are found.
68 Results<br />
R (1 0 0 ) [% ]<br />
1 0 0<br />
8 0<br />
6 0<br />
4 0<br />
2 0<br />
0<br />
B<br />
C<br />
4 5 0 5 0 0<br />
� ����� �<br />
5 5 0<br />
Figure 4.14: Preferential (<strong>100</strong>) orientation R (<strong>100</strong>) as a function of the annealing tempera-<br />
ture TA for sample type B (solid circles) and sample type C (open circles). The preferential<br />
(<strong>100</strong>) orientation R (<strong>100</strong>) is defined as the ratio of orientations tilted by ≤ 20° with respect to<br />
the (<strong>100</strong>) orientation. The results are obtained from analyzing the EBSD maps in Fig. 4.12.<br />
Lower annealing temperature TA and thinner oxide interlayer leads to a higher preferen-<br />
tial (<strong>100</strong>) orientation.<br />
annealed at low temperature (450 °C) is the slowest and the native oxide (sample<br />
type B) annealed at high temperature (550 °C) is the fastest process. But these two<br />
cases exhibit no strong preferential orientation (R(<strong>100</strong>) ≈ 30..40 %).<br />
Besides the large grains the second important attribute of the ALILE seed layers<br />
is the preferential (<strong>100</strong>) orientation. By altering the annealing temperature and<br />
the type of oxide interlayer the degree of preferential (<strong>100</strong>) orientation has been<br />
modified succesfully. With a native oxide and low annealing temperature a prefer-<br />
ential (<strong>100</strong>) orientation of up to R(<strong>100</strong>) = 70 % was obtained. The use of a thermal<br />
oxide and high annealing temperature decreased the preferential (<strong>100</strong>) orientation<br />
below 10 %. In section 5.5 a possible explanation for this behavior is suggested.<br />
It will be shown that the annealing temperature and interlayer influence can be<br />
explained by preferential nucleation of silicon at the interface.
4.1 Interlayer 69<br />
4.1.2 Molybdenum interface<br />
An attractive alternative to the oxidation of the aluminum layer is the direct depo-<br />
sition of an interlayer. This would allow to deposit the layer stack without breaking<br />
the vacuum which allows much faster sample preparation. On the one hand direct<br />
or reactive deposition of an oxide is an option. However, also very different ap-<br />
proaches can be followed. Here, thin molybdenum layers deposited between the<br />
initial Al and a-Si layers were studied as an alternative to the oxide interlayer. In<br />
Al metallization Mo, W and Ta based Si nitrides and other compounds are used<br />
as diffusion barrier [92, 93]. A Mo target within the DC magnetron sputtering<br />
chamber for Al and a-Si deposition allowed the alternative use of a Mo interlayer<br />
without any vacuum break and resulting oxidation of the Al layer. Since Mo is<br />
used in Al/Si diffusion barriers investigations it was explored wether the diffusion<br />
barrier could be deposited thin enough to allow controlled diffusion between the<br />
two layers.<br />
The controlled deposition of very thin layers is quite challenging especially with<br />
DC magnetron sputtering. To verify the success of the deposition Auger electron<br />
spectroscopy (AES) depth profiles were measured. In Fig. 4.15 the AES results for<br />
specimens with a nominal Mo thickness of dMo = 12 nm, 24 nm and 48 nm between<br />
the initial Al and a-Si layers are shown. It is clearly demonstrated that the amount<br />
of Mo at the interface increased. Thus different thicknesses of the Mo interlayer<br />
were successfully deposited.<br />
In Fig. 4.16 the crystallized fraction RC curves for samples with nominal 12 nm,<br />
24 nm and 48 nm Mo thicknesses are shown. The annealing temperature was<br />
550 °C. With increasing Mo interface thickness the processes is slowed down.<br />
While the layer exchange for the 12 nm Mo sample is finished in 6 − 7 min, the<br />
layer exchange of the sample with 48 nm Mo starts after about 20 min only.<br />
The saturation value of the crystallized fraction decreases gradually with increas-<br />
ing interlayer thickness. While for 12 nm Mo a complete layer exchange can be<br />
observed (RC = <strong>100</strong> %), only about RC = 80 % are reached for 48 nm Mo. In
70 Results<br />
c o u n ts [a .u .]<br />
1 .0 0<br />
0 .7 5<br />
0 .5 0<br />
0 .2 5<br />
0 .0 0<br />
d M O<br />
-5 0 5 1 0<br />
c y c le<br />
Figure 4.15: Counts versus sputtering cycles from Auger electron spectroscopy Mo depth<br />
analysis of samples with three different Mo interfaces. The cycles have been normalized<br />
such that the Mo maximum counts are in cycle 0 for all samples. The nominal thickness<br />
of the Mo film is dMo = 12 nm, 24 nm and 48 nm.<br />
R C [% ]<br />
1 0 0<br />
8 0<br />
6 0<br />
4 0<br />
2 0<br />
� ��<br />
� � ���<br />
0<br />
�����<br />
1 1 0<br />
� ������<br />
�<br />
1 0 0<br />
Figure 4.16: Crystallized fraction RC versus annealing time tA for samples with different<br />
nominal thicknesses of the Mo interlayer (dMo = 12 nm, 24 nm and 48 nm). The samples<br />
were annealed at TA = 450 °C.
4.1 Interlayer 71<br />
Fig. 4.17 optical micrographs of a sample with 48 nm Mo interlayer thickness are<br />
shown after annealing for 25 min, 35 min and 45 min at 550 °C. For this samples<br />
the growth of a single, dendritic crystallite can be observed. The dendritic growth<br />
is strongly reduced in case of thinner Mo layers (not shown here). The reason<br />
why the crystallized fraction does not reach <strong>100</strong> % is due to Al inclusion caused<br />
by the dendritic growth. It has to be pointed out that the crystallized fraction<br />
curve in case of a single crystallite within the image area is not correct. The actual<br />
crystallized fraction develops slower. In RC just the fraction of the image area<br />
transformed is evaluated. In case of the sample shown in Fig. 4.17 the grain is<br />
much larger than the image. Thus, the grain growth continues outside the image<br />
area while RC already reached it’s maximum. As a matter of fact the crystal in<br />
Fig. 4.17 grew to about 700 <strong>µm</strong> final diameter which could only be detected in a<br />
larger micrograph (not shown here).<br />
Crystallized fraction curves RC (tA) for samples with 12 nm Mo interlayer thickness<br />
annealed at different temperatures are shown in Fig. 4.18. The curves are similar<br />
to the ones from the oxide interfaces. Higher annealing temperature decreases<br />
the process time. However different from the case of the oxide layer [94] the<br />
nucleation time does not strongly denpend on the annealing temperature. The<br />
reason for this remains unclear. Probably the nucleation starts right away due to<br />
the direct contact of metal (Mo) to a-Si instead of having an intermediate dielectric<br />
oxide layer. This could support the screening effect suggested by Hiraki [30].<br />
However, it remains unclear why this would only influence the nucleation time<br />
but not the process time.<br />
In Fig. 4.19 the nucleation density NG and estimated grain size dG as a function<br />
of the annealing temperature TA for the specimen with 12 nm Mo interface are<br />
shown. Quite large estimated grain sizes dG of up to 40 <strong>µm</strong> were obtained.<br />
The Mo interlayer was found to have an advantageous side effect. The surface<br />
topography of a sample grown with an 12 nm Mo interlayer after etching off the<br />
Al is shown in Fig. 4.20. According to the SEM micrograph a smooth seed layer
72 Results<br />
(a)<br />
(b)<br />
(c)<br />
<strong>100</strong> <strong>µm</strong><br />
<strong>100</strong> <strong>µm</strong><br />
<strong>100</strong> <strong>µm</strong><br />
Figure 4.17: Series of optical micrographs of the initial glass/Al interface showing a large<br />
dendritic grain growing during annealing of a specimen with 48 nm Mo interlayer at 550 °C<br />
after (a) 25 min, (b) 35 min and (c) 45 min.
4.1 Interlayer 73<br />
R C [% ]<br />
1 0 0<br />
8 0<br />
6 0<br />
� �<br />
�<br />
4 0<br />
2 0<br />
T<br />
A<br />
�����<br />
�����<br />
�����<br />
0<br />
�����<br />
0 3 0 6 0 9 0 1 2 0 1 5 0 1 8 0<br />
� ������<br />
�<br />
Figure 4.18: Results for 12 nm molybdenum interface. Crystallized fraction RC vs. an-<br />
nealing time tA at different annealing temperatures TA.<br />
� � ��������� �� �<br />
6<br />
4<br />
2<br />
0<br />
�<br />
4 6 0 4 8 0 5 0 0 5 2 0<br />
� �����<br />
�<br />
�<br />
6 0<br />
4 0<br />
2 0<br />
0<br />
� � �����<br />
Figure 4.19: Results for 12 nm molybdenum interface. Nucleation density NG (solid cir-<br />
cles) and estimated grain size dG (open circles) versus annealing temperature TA.
74 Results<br />
Figure 4.20: SEM image of a sample with 12 nm Mo interlayer after complete layer ex-<br />
change and standard Al etching. As for samples with oxide interface layer silicon islands<br />
are formed in the top layer. Due to the removal of the Mo interlayer by the Al etchant<br />
some of these islands are lifted off.<br />
has formed and the crystalline Si islands in the top layer have partially been lifted<br />
off without any mechanical force. The removal of the Si islands has to be assured<br />
prior to epitaxial thickening. A lift off process would probably be the most elegant<br />
way to achieve the removal of the islands. A similar lift off process was suggested<br />
by special adjustment of the oxide layer and the etching technique [95]. Here the<br />
Al oxide layer is etched at high temperature (130 °C) in a phosphoric acid based<br />
etchant. The use of alternative (non Al oxide) interface layers might offer an easier<br />
path towards a Si islands lift off process than the use of a chemically very resistant<br />
Al oxide interlayer.<br />
Within this section it was shown that not only oxide layers can serve as suitable<br />
interlayers which allow a complete layer exchange and the formation of a contin-<br />
uous poly-Si layer. This indicates that there is probably a large variety of suitable<br />
interlayer materials. In microelectronics many different alloys are used as diffu-<br />
sion barriers in metallization. Among those there could be reasonable candidates<br />
for the ALILE process. In conclusion of these results it is suggested that the inter-
4.2 Temperature profiles 75<br />
face layer has to fulfill two main requirements.<br />
1. Thermal stability: The interlayer should be thermally stable, i.e. the melting<br />
point should be much higher than the annealing temperature.<br />
2. Chemical stability: The interlayer should not form alloys with either Al or Si<br />
at the annealing temperature.<br />
Unfortunately, the second point made Mo not the ideal choice. It was found that<br />
in some experiments both Al and Si react with Mo. Better materials need to be<br />
found. So far native Al oxide as interlayer material still yields the best result due<br />
to homogeneously connected crystallites and preferential (<strong>100</strong>) orientation.<br />
4.2 Temperature profiles<br />
Besides the interlayer the annealing temperature is the most important parame-<br />
ter in the ALILE process. So far only isothermal experiments were made. In the<br />
following experiments are described which use temperature profiles in order to<br />
improve the process by increasing the grain size to process time ratio in heating<br />
step experiments (4.2.1) and to improve the understanding of the process by en-<br />
forcing additional nucleation in cooling step experiments (4.2.2).<br />
The experience obtained from the interlayer experiments described in the previous<br />
chapter were used in the selection of the proper specimens for the two types of<br />
temperature profile experiments. The heating step experiments which aim at opti-<br />
mizing the process were performed with samples which are regularly used (similar<br />
to sample type B). These samples were oxidized by exposure to air for 2 h. In the<br />
cooling experiments samples with a low nucleation density were needed. But the<br />
layer exchange should not take too long. Thus samples were thermally oxidized<br />
at 525 °C for 1.5 h (similar to sample type C) and annealed at temperatures up to<br />
550 °C in order to obtain a fast layer exchange.
76 Results<br />
4.2.1 Heating step<br />
In isothermal annealing experiments the ALILE process could be divided in three<br />
phases (see Fig. 4.11). In the growth phase III no additional grains are formed<br />
and the layer exchange process is continued merely by growth of existing grains.<br />
The idea of the heating step experiments is to increase the annealing tempera-<br />
ture during the growth phase in order to increase the grain growth velocity and<br />
thus decrease the process time without causing additional nucleation. In all ex-<br />
periments samples of a specific specimen were used in order to maintain the best<br />
comparability of the obtained results. For reference purposes samples have been<br />
annealed at a constant temperature nominally 460 °C and 500 °C. For the heating<br />
step experiments the annealing was started at nominally 460 °C and increased to<br />
an annealing temperature of maximal 500 °C. Two different kinds of procedures<br />
were applied. In experiment HS1 the nominal annealing temperature TA was in-<br />
creased from 460 °C to 500 °C while varying the step time tS from 40 min, 60 min to<br />
80 min (Fig. 4.21(a)). For the reference curves (dashed lines) the annealing took<br />
place isothermally at 460 °C and 500 °C. In experiment HS2 the nominal annealing<br />
temperature was increased from 460 °C in steps of TS = 10 °C, 20 °C, 30 °C and 40 °C<br />
at tS = 60 min (Fig. 4.21(b)). Again the reference profiles are indicated as dashed<br />
lines.<br />
Figure 4.22 shows the crystallized fraction RC curves for experiment HS1. The<br />
very left and very right curve (dashed lines) represent the reference curves an-<br />
nealed isothermally at 500 °C and 460 °C, respectively. The other curves show the<br />
results of the heating step experiments. The three RC (tA) curves show the same<br />
behavior before the temperature change. This is an indicator for the reproducibil-<br />
ity of the experiment. At the annealing steps tS = 40 min, 60 min and 80 min RC<br />
has reached 1.5 %, 12.6 % and 45.1 %, respectively. As a result of the temperature<br />
change the slope of the RC curves increases strongly for t > tS. Due to the higher<br />
temperature the grain growth velocity is increased and additional nucleation takes<br />
place. Thus the slope of the RC curves has a similar slope as the reference curve
4.2 Temperature profiles 77<br />
� � �����<br />
� � �����<br />
5 0 0<br />
4 8 0<br />
4 6 0<br />
5 0 0<br />
4 8 0<br />
4 6 0<br />
H S 1<br />
t S<br />
0 3 0 6 0 9 0 1 2 0 1 5 0<br />
t [m in ]<br />
A<br />
H S 2<br />
(a)<br />
T S<br />
0 3 0 6 0 9 0 1 2 0 1 5 0<br />
t [m in ]<br />
A<br />
(b)<br />
Figure 4.21: Annealing temperature TA versus annealing time tA for the temperature<br />
profiles used in non-isothermal annealing experiments. (a) HS1: variation of the heating<br />
step time tS. (b) HS2: variation of the heating step temperature TS. Dashed lines are the<br />
reference profiles annealed isothermally.
78 Results<br />
R C [% ]<br />
1 0 0<br />
8 0<br />
6 0<br />
4 0<br />
� �<br />
2 0<br />
0<br />
����� �����<br />
H S 1<br />
0 3 0 6 0 9 0 1 2 0 1 5 0<br />
� ������<br />
�<br />
Figure 4.22: Crystallized fraction RC vs. annealing time tA for experiment HS1. The left<br />
and the right curves (dashed lines) are isothermal anneals at 500 °C and 460 °C, respec-<br />
tively. The other samples where annealed at 460 °C until tS = 40 min, 60 min and 80 min<br />
and then heated to 500 °C.<br />
annealed at 500 °C. This leads to a strong reduction in process time compared to<br />
the reference curve annealed at 460 °C.<br />
In Fig. 4.23 the RC (tA) curves for experiment HS2 are shown. Again the same<br />
reference curves are included as dashed lines. Up to tA = 60 min the three RC<br />
curves follow the same dependence. At tA = 60 min RC varies only between 8.9 %<br />
and 12.9 % for the three samples. The slope of the RC curves clearly increases<br />
with increasing TS. The process time tP (RC = 95 %) is reduced by up to 45 min<br />
for the sample with the highest TS as compared to the reference sample annealed<br />
at 460 °C.<br />
The main objective of these experiments is the modification of the temperature<br />
profile in order to get large grains in short process times. In order to distinguish<br />
between the nucleation density at the heating step and the final nucleation density<br />
the indices S and F are introduced, respectively. The values have to be calculated<br />
differently because the layer exchange is not complete at the step time. Thus, not<br />
the entire image area is covered by Si but only the crystallized fraction. This has
4.2 Temperature profiles 79<br />
R C [% ]<br />
1 0 0<br />
8 0<br />
6 0<br />
4 0<br />
� �<br />
2 0<br />
0<br />
����� �����<br />
H S 2<br />
0 3 0 6 0 9 0 1 2 0 1 5 0<br />
� ������<br />
�<br />
Figure 4.23: Crystallized fraction RC vs. annealing time tA for experiment HS2. The left<br />
and the right curves (dashed lines) are isothermal anneals at 500 °C and 460 °C, respec-<br />
tively. (b) The step temperature TS has been varied from 10 °C, 20 °C, 30 °C to 40 °C at<br />
tS = 60 min.<br />
to be taken into account when calculating the grain size. To determine the nu-<br />
cleation density the number of objects in the micrographs is counted. The largest<br />
number of objects N0 within an image during the entire annealing together with<br />
the image area A0 determines the average final nucleation density NG,F = N0/A0.<br />
The average final grain area AG,F is inversely proportional to the final grain den-<br />
sity NG,F , AG,F = 1/NG,F . The average final estimated grain size dG,F is the square<br />
root of the average final grain area AG,F (dG,F = AG,F 1/2 ). Hence, lower NG,F<br />
is desirable to increase the grain size. The nucleation density NG,S at the step<br />
time tS is calculated similar to NG,F , but using the number of objects N0,S at tS<br />
(NG,S = N0,S/A0). Calculating the average grain area AG,S at the step time tS it<br />
has to be taken into account that not the entire area is covered with silicon but<br />
only the crystallized fraction RC. Thus AG,S is inversely proportional to the nucle-<br />
ation density NG,S multiplied by the crystallized fraction RC,S at the step time tS<br />
(AG,S = RC,S · 1/NG,S). The average estimated grain size dG,S is the square root of<br />
the average grain area AG,S (dG,s = AG,S 1/2 ).
80 Results<br />
-2 ]<br />
N G ,F [1 0 3 m m<br />
8<br />
6<br />
4<br />
2<br />
�����<br />
� � ��������<br />
� �<br />
������<br />
H S 1<br />
������<br />
�����<br />
������ �������<br />
0<br />
0 3 0 6 0 9 0 1 2 0 1 5 0<br />
� ������<br />
�<br />
Figure 4.24: Average final grain density NG,F vs. process time tP for experiment HS1.<br />
The corresponding step times are indicated. The reference curves have been interpreted<br />
as tS = 0 min (500 °C) and tS = 150 min (460 °C). NG,F decreases strongly for tS between<br />
40 min and 80 min.<br />
In Fig. 4.24 NG,F is shown versus the process time tP (time at RC = 95 %) for<br />
experiment HS1 together with the corresponding step times tS. The final nucle-<br />
ation density NG,F is strongly modified by tS. Increasing the temperature from<br />
460 °C to 500 °C after 40 min does not lead to a major change in NG,F compared<br />
with the isothermal anneal at 500 °C (tS = 0 min). Between tS = 40 min and<br />
tS = 80 min increasing tS results in a strong reduction of NG,F . Whereas for times<br />
above 80 min no further change can be observed. This means that upon reaching a<br />
certain annealing time tA the annealing temperature can be increased without any<br />
new nucleation. Thus the grain size remains the same but the process time is re-<br />
duced. The initial goal of the heating step approach has been reached successfully<br />
even with a single temperature step. It is believed that an annealing tempera-<br />
ture limit exists to which the sample can be heated at any time without additional<br />
nucleation. The time evolution of this annealing temperature limit is unclear.<br />
In order to investigate the behavior more closely a further specimen prepared with<br />
the same deposition parameters as the specimen before has been annealed with
4.2 Temperature profiles 81<br />
a smaller increment in step time and step temperature. It was found that for this<br />
specimen the decrease in NG,F took place already at a shorter step time of 30 min<br />
to 50 min instead of 40 min to 80 min as for the specimen examined above. In the<br />
experiments both step temperature TS and step time tS were varied in order to de-<br />
termine the course of the annealing temperature limit. Thus, various step time and<br />
step temperature couples from tS = [30, 35, 40, 50 min] and TS = [5, 10, 15, 20, 25 °C]<br />
were chosen. In Fig. 4.25 the difference between NG,F and NG,S, i.e. the additional<br />
average nucleation density, is shown versus the average grain size dG,S at the step<br />
time tS. It can clearly be seen in the figure that upon reaching an average grain<br />
size at tS of about dG,S = 5.5 <strong>µm</strong> no further nucleation occurs. This behavior is<br />
independent of the step temperature (not shown here). However, when the av-<br />
erage grain size dG,S at tS is below 5.5 <strong>µm</strong> new nucleation takes place depending<br />
on the step temperature TS. Higher TS are accompanied by an increase of the<br />
nucleation (not shown in Fig. 4.25). The average final grain density does not ex-<br />
ceed NG,F = 3.7 · 10 3 mm −2 in case of dG,S > 5.5 <strong>µm</strong>. Thus the maximum final<br />
grain size that can be reached is about dG,F = 16.5 <strong>µm</strong> (dG,F = (1/NG,F ) 1/2 with<br />
NG,F = 3.7 · 10 3 mm −2 ).<br />
This observation can be interpreted as follows. At the step time tS there exists<br />
a zone of dZ = 5.5 <strong>µm</strong> (at dG,S = 5.5 <strong>µm</strong>) on each side of the grain where no<br />
new nucleation (dG,F = dG,S + 2dZ) takes place (Fig. 4.26). Once these zones<br />
overlap the temperature can be increased to higher values and still now new grains<br />
nucleate. This is a first experimental proof for the depletion regions responsible<br />
for the suppression of nucleation suggested by Nast et al. [52].<br />
The goal of the heating step experiments was to reduce the process time without<br />
increasing the nucleation density. This goal was achieved. An estimated grain size<br />
limit was found at which the annealing temperature could be increased without<br />
new nucleation. This is a first proof for the depletion regions being responsible for<br />
the nucleation suppression. With increasing the annealing temperature after the<br />
critical grain size is reached the grain growth velocity can be increased strongly<br />
and thus the process time is decreased without further nucleation.
82 Results<br />
Figure 4.25: Additional nucleation, i.e. difference between average final grain density<br />
NG,F and average grain density at the step time NG,S vs. average grain size at the step<br />
time dG,S for various step time and step temperature couples, tS = [30, 35, 40, 50 min] and<br />
TS = [5, 10, 15, 20, 25 °C]. As soon as dG,S is larger than 5.5 <strong>µm</strong>, no new nucleation can be<br />
observed.<br />
d Z<br />
dG,F dG,S Figure 4.26: Sketch of a grain at the step time tS. The final grain size dG,F is the grain<br />
size at the step time dG,S plus twice a zone depleted of silicon around the growing grain<br />
dZ (dG,F = dG,S + 2dZ).<br />
d Z
4.2 Temperature profiles 83<br />
� � �����<br />
5 0 0<br />
4 5 0<br />
4 0 0<br />
C S<br />
0 3 0 6 0 9 0 1 2 0<br />
t [m in ]<br />
A<br />
Figure 4.27: Annealing temperature TA versus annealing time tA for the temperature<br />
profile for the cooling step experiment CS. A specimen from the heating step experiments<br />
A and B was cooled down to 330 °C within 1 min before being heated to 500 °C.<br />
4.2.2 Cooling step<br />
Increasing the annealing temperature before the critical grain size is reached leads<br />
to an increase in nucleation density. In chapter 2 it has been pointed out that in<br />
multi component systems supercooling and supersaturation lead to nucleation.<br />
In the regular isothermal annealing procedure used in the ALILE process nucle-<br />
ation is obviously not caused by supercooling but by supersaturation. Decreasing<br />
the annealing temperature causes an even stronger increase in nucleation density.<br />
Such experiments give further direct evidence for the formation of depletion re-<br />
gions which control and stop nucleation. First the heating step and the cooling<br />
step influence are compared. A sample with a thermal oxide interlayer formed at<br />
500 °C for 1.5 h was prepared in order to obtain larger grain sizes. In Fig. 4.27 the<br />
temperature profile for the first cooling step experiment CS is shown. After 60 min<br />
annealing at 450 °C the sample is cooled to 330 °C within 1 min prior to a heating<br />
step to 500 °C. This was compared to a direct heating step to 500 °C after 60 min<br />
annealing at 450 °C.<br />
The comparison of micrographs with and without cooling step prior to the heat-
84 Results<br />
ing step are shown in Fig. 4.28. Again, the bright areas correspond to aluminum<br />
whereas the dark spots represent silicon crystallites. Fig. 4.28a was taken after<br />
60 min annealing at 450 °C prior to the heating or cooling step. RC is very small (be-<br />
low 1 %) and the formed nuclei are about 50 <strong>µm</strong> apart from each other. Fig. 4.28b<br />
shows the same sample at the same position after additional annealing for 22 min<br />
at 500 °C. RC has increased to 25 %. In Fig. 4.28b the same specimen at the same<br />
position is shown as in Fig. 4.28a. Comparison of Fig. 4.28a and 4.28b reveals that<br />
due to the additional annealing the grains grew significantly and that only very<br />
few additional grains have formed. Those are smaller than the already existing<br />
grains. Fig. 4.28c shows a sample which had gone through a 1 min cooling period<br />
(see temperature profile Fig. 4.27) before it was heated at 500 °C for 20 min. The<br />
number of nuclei has increased strongly. The sample has not reached 500 °C as fast<br />
as the sample without cooling period. In consequence the grains did not grow to<br />
the same, large sizes within comparable time. However, due to the additional nu-<br />
cleation RC reached 25 % after about the same time, too. These experiments show<br />
that both heating and cooling of a specimen can lead to additional nucleation.<br />
Cooling the sample leads to a higher nucleation density than heating.<br />
In another experiment a specimen of type B was annealed at 460 °C for 240 min<br />
and then cooled down to 220 °C within 7 min. After cool down the sample was<br />
reheated to 520 °C for 60 min. In Fig. 4.29 optical micrographs of the specimen are<br />
shown. Fig. 4.29a shows the sample after 237 min annealing just before cool down.<br />
The different grains are round shaped and can be clearly distinguished. They<br />
have approximately the same size (about 30 <strong>µm</strong>). This means that the grains have<br />
nucleated at approximately the same time assuming similar grain growth rates .<br />
No new grains are formed in case of continued annealing at constant temperature.<br />
Fig. 4.29b shows the same specimen at the same position after cool down and<br />
reheating (after 253 min). Again, many new silicon grains appeared in the Al<br />
layer. The nucleation density before cool down was about 7 · 10 2 mm −2 . After cool<br />
down and reheating the Si nucleation density of newly formed grains within the<br />
initial Al layer was above 5 · 10 4 mm −2 . The new Si nuclei are homogeneously
4.2 Temperature profiles 85<br />
(a)<br />
(b)<br />
(c)<br />
<strong>100</strong> <strong>µm</strong><br />
<strong>100</strong> <strong>µm</strong><br />
<strong>100</strong> <strong>µm</strong><br />
Figure 4.28: Optical micrographs from experiment CS. Sample after 60 min annealing at<br />
450 °C (a), and subsequent heating to 500 °C for 22 min (b). A samples that includes a<br />
cooling step down to 330 °C for 1 min and was then heated to 500 °C is shown after a total<br />
of 81 min in (c).
86 Results<br />
distributed. It is important to notice that there are regions without new nuclei<br />
around the preexisting grains. Those are the above introduced depletion regions.<br />
The width of the depletion regions is about 9 <strong>µm</strong> in this case. This is the first direct<br />
evidence for the depletion regions. They are made visible directly.<br />
As shown above (Fig. 4.28) samples heated up without cool down did not show<br />
this behavior. Thus the cool down (not the reheating) leads to a very high nucle-<br />
ation density far away from the preexisting grains. In the vicinity of the preex-<br />
isting grains nucleation is suppressed. When reheating the newly formed nuclei<br />
grow and become visible in the micrographs. The growth of both the preexisting<br />
and the newly formed grains finally leads to the formation of a continuous layer.<br />
In the two cooling step experiments described above two important observations<br />
have been made: (i) when cooling the sample during the layer exchange process<br />
for a short time many new nuclei are formed. (ii) Under certain conditions of<br />
such cooling steps direct evidence of a region without nucleation around existing<br />
grains can be found. In order to study these observations more closely a special<br />
experiment was designed. Samples with large grain size were chosen in order to<br />
obtain a low nucleation density. This allows to investigate both the new nucleation<br />
density ρN and the depletion regions width L. Single cooling step experiment<br />
were chosen. The different parameters under investigation are elucidated in the<br />
measured annealing temperature TA (tA) profile as a function of the annealing<br />
time tA in Fig. 4.30. In phase P1 the samples are heated and annealed at a starting<br />
temperature T1 until after t1 the annealing temperature is decreased. The cooling<br />
period (phase P2) is characterized by three parameters. These are the cooling<br />
velocity v2, the cooling temperature T2 and the cooling duration t2 − t1. After<br />
the cooling the samples are reheated to the temperature T3 and annealed until<br />
the layer exchange is completed (phase P3). If not stated otherwise the samples<br />
were first annealed at T1 = 550 °C for t1 = 24 min and then cooled close to room<br />
temperature (T2 = 36 °C) for t2 − t1 = 15 min at v2 = 180 Kmin −1 before being<br />
reheated to T3 = 550 °C until the layer exchange was completed. The cooling<br />
velocity v2 was determined by a linear fit in the initial cooling and altered by
4.2 Temperature profiles 87<br />
(a)<br />
(b)<br />
<strong>100</strong> <strong>µm</strong><br />
<strong>100</strong> <strong>µm</strong><br />
Figure 4.29: Optical micrographs taken during annealing of a specimen of type B at<br />
TA = 460 °C for about tA = 4 h (a). In a cooling step the annealing temperature TA<br />
was decreased to 220 °C and before the sample was reheated to TA = 520 °C. In (b)<br />
after 4 h13 min many new grains have appeared. Around the existing, large grains regions<br />
without new nuclei were formed (depletion regions).
88 Results<br />
T A<br />
T 1<br />
T 2<br />
P 1 P 2 P 3<br />
v 2<br />
t 1<br />
Figure 4.30: Measured annealing temperature TA versus annealing time tA for the cooling<br />
experiments. The important parameters are the temperatures T1, T2 and T3 and the times<br />
t1 and t2. The cooling velocity v2 was found to play a crucial role. In this exemplary case<br />
the parameters have been T1 = 550 °C until t1 = 28 min, a cooling step T2 = 36 °C until<br />
t2 = 43 min with v2 = 180 K min −1 before being reheated to T3 = 550 °C.<br />
introducing small intermediated temperature steps, e.g. several steps decreasing<br />
the annealing temperature TA by 10 K lasting 10 s each. The resulting measured<br />
decrease in the annealing temperature TA is approximately linear at about v2 =<br />
60 Kmin −1 .<br />
In Fig. 4.31a the micrograph of a sample at the time t1 before cooling is shown.<br />
Large grains can be seen here. Between the large grains no new nuclei have been<br />
formed, i.e. the process is in the growth phase III as defined in section 4.1.1.<br />
the distance between the grains is significantly larger than <strong>100</strong> <strong>µm</strong>. In Fig. 4.31b<br />
the micrograph of the same sample at t2 after the cooling period (phase P2) is<br />
shown. The large grains can still be observed. In the areas without nuclei prior<br />
to the cooling step a large number of new nuclei have appeared. Around the<br />
large grains regions without additional nuclei, the depletion regions, are visible<br />
as shown above (see Fig. 4.31b). The results obtained here are used in the model<br />
t 2<br />
t A<br />
T 3
4.2 Temperature profiles 89<br />
(a)<br />
(b)<br />
<strong>100</strong> <strong>µm</strong><br />
<strong>100</strong> <strong>µm</strong><br />
Figure 4.31: (a) Optical micrograph of a sample after t1 (just before cooling). Large<br />
grains grow with a distance of more than <strong>100</strong> <strong>µm</strong>. (b) The same position at t2. A large<br />
number of new nuclei have formed. Around the existing grains depletion regions without<br />
nuclei are visible.<br />
presented in chapter 5.<br />
The method to determine the depletion region width L is illustrated in Fig. 4.32.<br />
Concentric circles are placed around both the grain and the grain with the cor-<br />
responding depletion region. The difference in circle radii is interpreted as the<br />
depletion region width L. The mean value for all grains in a micrograph was used<br />
as depletion region width L. In a series of experiments the dependence of the
90 Results<br />
Figure 4.32: Evaluation method of the depletion width L and the new nucleation density<br />
ρN illustrated for the specimen shown in Fig. 4.31. L is the difference in radius of the two<br />
concentric circles. The inner circle describes the grain size, while the outer circle describes<br />
the grain size plus the depletion region. The additional nucleation density ρN has been<br />
determined in rectangles outside the depletion regions.<br />
depletion region width and the density of the newly formed grains ρN - in the area<br />
without grains prior to the cooling step- on the process parameters of the cooling<br />
experiments was investigated.<br />
The depletion region width L as well as the density of the newly formed grains<br />
was found to be independent of the crystallized fraction RC which correspond to<br />
the point in time when cooling starts t1 (Fig. 4.33). With the results from section<br />
4.1.1 this means that neither the grain size nor the crystallized fraction strongly<br />
influence the shape of the depletion regions. Smaller depletion region widths are<br />
only obtained when the samples are cooled right after the appearance of the first<br />
grains.<br />
The dependencies of the density of newly formed grains ρN on both, the tempera-<br />
ture before cooling T1 (Fig. 4.34(a)) and the temperature at the end of the cooling<br />
period T2 (Fig. 4.34(b)) show a decreasing density of newly formed grains with<br />
increasing temperature. In chapter 5 these results will be explained in terms of a
4.2 Temperature profiles 91<br />
������<br />
2 0<br />
1 5<br />
1 0<br />
5<br />
0<br />
0 1 0 2 0 3 0 4 0 5 0 6 0<br />
R [% ] C<br />
Figure 4.33: Depletion region width L as a function of the crystallized fraction RC at<br />
the end of phase I before the cooling step. The depletion region width is constant about<br />
10 <strong>µm</strong>. Only for very low crystallized fractions RC the depletion region width decreases<br />
slightly.<br />
model for nucleation and growth. Here only some handwaving ideas are given to<br />
show the direction.<br />
For the experiments shown in Fig. 4.34(a) the samples were annealed at various<br />
temperatures T1 until the crystallized fraction RC reached a value of 10..20 %.<br />
Then the samples were cooled to room temperature (RT) for 15 min. The standard<br />
parameter is T1 = 550 °C indicated by a dotted line. The fact that the nucleation<br />
density is decreasing with increasing temperature T1 is striking, because the higher<br />
the temperature the more silicon is dissolved in the Al. The higher silicon concen-<br />
tration does not lead to a larger nucleation density. In order to incorporate more<br />
silicon the silicon nuclei formed during cooling must be larger in case of higher<br />
temperature T1. The velocity of the silicon atoms is higher at higher temperatures.<br />
The effective distance the silicon atoms diffuse before they are frozen in during the<br />
cooling step is the integral of the velocity over time. Starting at higher annealing<br />
temperature increases both the velocity and the time until the atoms are frozen
92 Results<br />
-2 ]<br />
ρ N [1 0 3 m m<br />
-2 ]<br />
ρ N [1 0 3 m m<br />
3 0<br />
2 0<br />
1 0<br />
0<br />
4 8 0 5 0 0 5 2 0 5 4 0 5 6 0 5 8 0<br />
� ����� �<br />
1 5<br />
1 0<br />
5<br />
0<br />
(a)<br />
3 5 4 5 0 5 0 0 5 5 0<br />
� ����� �<br />
(b)<br />
Figure 4.34: Density of newly formed nuclei ρN as a function of (a) the temperature T1<br />
before cooling and (b) the temperature T2 at the end of the cooling period. The common,<br />
standard parameters are indicated as dotted lines. All samples in (a) were cooled close to<br />
RT (36 °C) within t2 − t1 = 15 min. Before cooling samples were annealed at T1 = 550 °C.
4.2 Temperature profiles 93<br />
in. Thus the effective distance is larger and thus each formed nucleus can agglom-<br />
erate more silicon atoms and thus becomes larger. The decrease in nucleation<br />
density ρN as function of the temperature T1 can be approximated linearly.<br />
The results in Fig. 4.34(b) have been obtained while cooling the sample to differ-<br />
ent temperatures T2. In all cases the initial temperature T1 was 550 °C. The spec-<br />
imens were cooled to the corresponding temperature T2. Once T2 was reached<br />
the sample was kept at this temperature for t2 − t1 = 15 min. T2 was varied from<br />
450 °C to 540 °C. Additionally the result for the standard sample cooled to 36 °C<br />
is included (dotted line). At small differences T1 − T2 the course of the new nu-<br />
cleation density ρN can be approximated linearly with an intersection with the<br />
temperature scale at 550 °C, i.e. no cooling step, which makes sense. At larger<br />
differences the new nucleation density ρN saturates. The obtained results can<br />
be understood considering the silicon concentration in the Al layer, again. The<br />
Si saturation concentration CS in Al decreases as a function of the temperature.<br />
The larger the temperature change the higher the supersaturation S = CSi/CS of<br />
the Al and the higher the nucleation rate. The saturation of the new nucleation<br />
density ρN indicates that all nuclei are already formed when the temperature has<br />
decreased by about <strong>100</strong> K.<br />
The parameter which has the strongest impact in the cooling experiments is the<br />
cooling rate v2. To investigate this parameter the samples were cooled for 15 min<br />
from 550 °C to 450 °C. When 450 °C were reached the temperature was kept con-<br />
stant until t2 − t1 reached 15 min. The cooling rate v2 was change by introducing<br />
small temperature steps, e.g. changing the temperature for 10 K every 10 s leads<br />
to a cooling velocity of 60 Kmin −1 . The faster the samples are cooled the smaller<br />
the depletion region width (Fig. 4.35(a)). At cooling rates above <strong>100</strong> K min −1 the<br />
depletion region width is approximately constant at about 10 <strong>µm</strong>. This is almost<br />
twice as large as the result obtained for the heating step experiments (L = 5.5 <strong>µm</strong>)<br />
described in the previous chapter. This could be attributed to the differences in the<br />
studied samples but also to the different dynamics of the process during the heat-<br />
ing or cooling step. For slower cooling rates the depletion region width increases
94 Results<br />
to about 30 <strong>µm</strong>. The dependence of the density of newly formed grains on the<br />
cooling rate is shown in Fig. 4.35(b). The faster the cooling rate v2 the larger the<br />
newly formed nucleation density ρN. The dependence can be approximated by a<br />
line through origin with a slope of about 75 min/ ( K mm 2 ). If the cooling velocity<br />
v2 is zero, i.e. the sample is not cooled, there is no additional nucleation. Both<br />
dependences of the depletion region width L and the nucleation density ρN can<br />
be understood considering that the integration time is increased and thus the ef-<br />
fective diffusion length is increased. The higher the cooling rate, i.e. the faster the<br />
sample is cooled, the shorter the distance the silicon atoms can diffuse. Thus the<br />
depletion region is smaller because the atoms do not have enough time to diffuse<br />
to the existing growing grains. And due to the same reason the nucleation density<br />
is larger. These considerations are used in the discussion chapter to elucidate the<br />
mechanism responsible for the layer exchange process.<br />
Different interlayers between the initial Al and a-Si layers are investigated. Several<br />
Al oxide interlayers as well as an alternative Mo layer are compared. The function<br />
of the interlayer is to control the diffusion of silicon into the Al layer. The interlayer<br />
separates top and bottom layer throughout the process. Furthermore the interlayer<br />
confines the growing silicon grains within the Al layer. It is derived that several<br />
interlayers not only oxide layers are suitable. The interlayer has to meet two<br />
requirements. It must not be thermally or chemically affected throughout the<br />
process but still allow interdiffusion of Al and Si.<br />
The preferential orientation of the resulting poly-Si films has been found to depend<br />
both on the annealing temperature and the interlayer. Enhancing the preferential<br />
(<strong>100</strong>) orientation of the layers is mandatory for optimizing the low temperature<br />
epitaxy and thus the resulting solar cells.<br />
The use of a heating steps allows to reduce the process time without causing fur-<br />
ther nucleation. This result reinforces a model with depletion regions causing the<br />
nucleation suppression. A cooling step prior to the heating step leads to a very<br />
strong increase of nucleation which is expected to originate from supercooling
4.2 Temperature profiles 95<br />
������<br />
-2 ]<br />
ρ N [1 0 3 m m<br />
4 0<br />
3 0<br />
2 0<br />
1 0<br />
0<br />
0 5 0 1 0 0 1 5 0 2 0 0<br />
v [K m in<br />
2 -1 ]<br />
1 5<br />
1 0<br />
5<br />
(a)<br />
0<br />
0 5 0 1 0 0 1 5 0 2 0 0<br />
v [K m in 2 -1 ]<br />
(b)<br />
Figure 4.35: (a) Depletion region width L and (b) density of newly formed nuclei ρN as<br />
a function of the cooling velocity v2.
96 Results<br />
of the specimen. Zones apparent around the existing grains without additional<br />
nucleation are direct proof of the depletion region model.<br />
In the following chapter these findings will be considered and a model will be<br />
derived explaining the results.
5 Discussion<br />
Two of the most important experimental findings in the aluminum-induced layer<br />
exchange process are (i) the suppression of nucleation leading to the formation of<br />
large grained poly-Si layers and (ii) the formation of a preferential orientation in<br />
these layers. Within this chapter both these findings are discussed.<br />
The model adapted by O. Nast [53] from Ottaviani et al. [40] was extended by<br />
Widenborg et al. [55]. The considerations made within this chapter aim at adding<br />
further details to this model.<br />
At the beginning of this chapter the very basic, existing model is recalled in<br />
Fig. 5.1. On top of the glass substrate the Al (light) and the a-Si (dark) layers<br />
are separated by the interface layer (black). The steps of the ALILE process are:<br />
(1) Si diffuses across the interface layer into the Al layer. (2) Si diffuses within the<br />
Al layer. (3) Si nucleates within the Al layer. (4) Si grains grow. (5) Al diffuses<br />
across the interface layer into the initial a-Si layer.<br />
In this chapter it will be shown that the process steps (1) - (4) depend on the<br />
silicon concentration within the Al layer. Thus this parameter is very important.<br />
Figure 5.1: Scheme of the existing ALILE model separated into 5 major steps: (1) Diffu-<br />
sion of Si across the interlayer; (2) diffusion of Si within the Al layer; (3) nucleation; (4)<br />
grain growth; (5) diffusion of Al across the interlayer.
98 Discussion<br />
In section 5.1 three crucial Si concentrations will be defined. These are the sat-<br />
uration, maximum and nucleation concentration. These concentrations are used<br />
to modify the Al/Si phase diagram and to elucidate the ALILE process within this<br />
modified Al/Si phase diagram explaining the origin of the self-limited nucleation<br />
suppression (section 5.2). If the silicon concentration is above the saturation con-<br />
centration but below the critical nucleation no additional nucleation takes place,<br />
but existing grains grow.<br />
The considerations made are compared in a very simple qualitative approach with<br />
the experimental results from section 4.1 obtained using different interlayers and<br />
annealing temperatures (section 5.3). The interaction of the silicon fluxes across<br />
the interlayer and within the Al is shown to determine the nucleation time, grain<br />
growth velocity and nucleation density.<br />
Finally a model is presented which suggests a possible origin for the preferential<br />
orientation in the ALILE process and its dependency on the annealing temperature<br />
and the interlayer (section 5.5). This model is based on the idea that the preferen-<br />
tial orientation is a result of the preferential formation of certain critical clusters<br />
during nucleation.
5.1 Definition of three crucial Si concentrations in Al 99<br />
5.1 Definition of three crucial Si concentrations in<br />
Al<br />
The concentration of Si within the Al layer is very important to most of the process<br />
parameters. The transport of Si atoms from the amorphous silicon layer depends<br />
on this parameter as well as the nucleation and growth rate. For the subsequent<br />
considerations three crucial Si concentrations are defined using the phase dia-<br />
gram, thermodynamic considerations as well as calculations concerning the nu-<br />
cleation and growth rate.<br />
5.1.1 The saturation concentration<br />
In order to understand the thermodynamics of the Al/Si system, a closer look at<br />
the Al/Si phase diagram is necessary (Fig. 5.2). The Al/Si system is a eutectic<br />
system. The eutectic temperature is Teu = 850 K. The phase diagram shows the<br />
equilibrium lines as a function of the Si content in the Al and the temperature.<br />
Even though the phase diagram is only valid in the equilibrium case, it can also<br />
be used in the non-equilibrium case in order to understand which state the system<br />
tries to reach. In the phase diagram different parts of the system try to form<br />
sub-phases which have the mixing ratio of the equilibrium lines at the respective<br />
temperature. In Fig. 5.2(b) the Al rich part of the phase diagram is magnified. At<br />
the eutectic temperature of Teu = 850 K the solid Al dissolves 1.5 at.% Si when<br />
in contact with a Si system. In the Al rich part of the phase diagram the ALILE<br />
process takes place. It is referred to later in this chapter again.<br />
In order to understand phase diagrams it is important to realize that in a binary<br />
system there are two degrees of freedom: the volume and the mixing ratio of<br />
different subsystems. In thermodynamic equilibrium the subsystems’ mixing ratios<br />
are defined by the coexistence lines in the phase diagram. This means that any<br />
global mixture of material A and material B can be obtained, but the subsystems
<strong>100</strong> Discussion<br />
characteristic eutectic point. (b) Magnification of the Al rich part of the phase diagram. At the eutectic temperature (Teu = 850 K) solid<br />
Al can dissolve up to 1.5 at.% Si.<br />
Figure 5.2: Phase diagram of the Al/Si system [96]. (a) Entire phase diagram. At 12.2 % Si in the Al at a temperature of 850 K is the<br />
(a) (b)
5.1 Definition of three crucial Si concentrations in Al 101<br />
adjust their mixing ratio according to the phase diagram and their volume fraction<br />
according to the overall concentrations.<br />
For example when cooling a liquid, eutectic mixture of Al (87.8 at.%) and Si<br />
(12.2 at.%) an Al and Si phase will solidify at the eutectic temperature. The solid<br />
Al parts contain about 1.5 at.% silicon. The solid Si parts include below 0.01 at.%<br />
of Al. In order to achieve this in a eutectic alloy the volume fractions of solid Si<br />
and solid Al adjust accordingly.<br />
The coexistence lines in the phase diagram correspond to the thermodynamically<br />
most stable, crystalline phases of Al and Si. The coexistence line between the Al<br />
and the Al+Si phases in Fig. 5.2(b) is the coexistence line of Al and Si. Two phases<br />
are in an equilibrium when the chemical potentials are the same. The chemical<br />
potential µj is defined as:<br />
µj =<br />
� �<br />
dG<br />
dNj<br />
T,V,Ni�=j<br />
, (5.1)<br />
where G is the Gibbs energy and Nj is the number of particles. The chemical<br />
potential is the energy needed to add one particle to a system without a change in<br />
temperature T , volume V or the number of any other particle Ni�=j. In a solution<br />
the chemical potential of each species is a function of the concentration. In the<br />
case of Si dissolved in Al:<br />
µSi (CSi) = µSi,0 + kT ln CSi<br />
, (5.2)<br />
where CSi is the silicon concentration, µSi,0 is the chemical potential of Si at the<br />
saturation concentration CS and k is Boltzmann’s constant.<br />
As mentioned above the coexistence line from the phase diagram (Fig. 5.2(b)) cor-<br />
responds to the equilibrium of Si dissolved in Al with the crystalline Si phase. The<br />
corresponding concentration is referred to as the solubility limit or the saturation<br />
concentration CS. If the concentration of Si CSi within Al in contact with Si is<br />
CS
102 Discussion<br />
below the saturation concentration Si atoms diffuse from the Si into the Al, and<br />
the silicon is dissolved. If the concentration of Si within Al is above the satura-<br />
tion concentration Si, atoms diffuse to the crystalline Si surface, and the silicon<br />
crystal grows. At CS the Si crystal neither grows nor is dissolved, the system is in<br />
equilibrium.<br />
5.1.2 The maximum concentration<br />
The driving force for the entire process is the transition of the amorphous to<br />
the crystalline silicon phase. From calorimetric studies the macroscopic enthalpy<br />
of the crystallization was determined in kJ/mole [27]. From this value an av-<br />
erage change in Gibbs energy per atom can be derived in eV/atom. The en-<br />
ergy is temperature dependent. At 750 K it is 8..10 kJ/mol which correspond to<br />
0.083..0.104 eV/atom [12]. Thus about 0.1 eV/atom is available to drive the entire<br />
process.<br />
The amorphous phase has a higher Gibbs energy than the crystalline phase, thus<br />
the energy per atom and the chemical potential per atom are higher in amorphous<br />
Si than in crystalline Si. This chemical potential difference drives the transition of<br />
atoms from an amorphous to a crystalline Si phase. If two phases at an interface<br />
are in equilibrium the chemical potentials in both phases must be equal. Thus the<br />
silicon in aluminum in equilibrium with the amorphous silicon must have a higher<br />
chemical potential than in equilibrium with crystalline Si. The chemical potential<br />
of Si in Al depends on the concentration of Si and thus the Si concentration in<br />
the Al in equilibrium with the amorphous Si phase must be higher as well. As-<br />
suming the Gibbs energy gain per atom at 750 K to be 0.1 eV/atom, the resulting<br />
Si concentration within the Al in equilibrium with the amorphous Si phase can be<br />
determined from the change in chemical potential ∆µ during the phase transition:
5.1 Definition of three crucial Si concentrations in Al 103<br />
∆µ<br />
⇒ Ca−Si<br />
=<br />
=<br />
=<br />
µa−Si − µc−Si = 0.1 eV/atom<br />
� �<br />
Ca−Si<br />
kT ln<br />
CS<br />
� �<br />
∆µ<br />
CS exp<br />
kT<br />
(5.3)<br />
(5.4)<br />
(5.5)<br />
= 3.8 %. (5.6)<br />
This means that the silicon concentration in Al in equilibrium with the a-Si phase is<br />
3.8 %, which is about 4× as high as the saturation concentration (CS (T = 750 K) =<br />
0.8 % - from the phase diagram). Ca−Si is the maximum Si concentration in the<br />
Al which can be achieved by diffusion from the a-Si into the Al. Thus, it will be<br />
referred to as Cmax. Cmax is temperature dependent. A similar calculation was<br />
made by O. Nast [53].<br />
5.1.3 The critical concentration<br />
Si atoms diffusing into the Al layer either form a new nucleus or contribute to<br />
the growth of an existing grain (Fig. 5.1). Both processes, nucleation and growth,<br />
depend on the Si concentration within the Al layer.<br />
In general two different growth mechanism are distinguished depending on the<br />
slowest, velocity-limiting process step. The two process steps are the incorporation<br />
of particles into the growing phase (reaction) and the transport of particles to the<br />
growing phase (diffusion). Thus, reaction- or surface-limited and diffusion-limited<br />
growth are the two borderline cases. When the growing phase is very small, its<br />
surface is small as well and only few particles are incorporated. Thus only a few<br />
particles need to be transported to the growing phase for the phase to expand.<br />
Usually growth starts to be reaction/surface-limited. While increasing its size,<br />
the diffusion of particles to the growing phase gains importance and the growth<br />
becomes diffusion-limited. In diffusion-limited growth it is assumed that all atoms<br />
supersaturating the Al right in front of the growth front are instantly incorporated
104 Discussion<br />
in the grain. As a result the Si concentration at the growth front of the grain is the<br />
saturation concentration. In the case of the ALILE process observed with the in-situ<br />
optical microscope the grains are already quite large and diffusion limited growth<br />
is assumed. In Fig. 5.3 the Si concentration profile in front of a growing crystalline<br />
Si grain is shown in case of diffusion-limited growth. The concentration within the<br />
grain is the density of Si. As mentioned above, the concentration in the Al cannot<br />
be below the saturation concentration CS because otherwise the Si crystal would<br />
dissolve rather than grow. Far away from the grain, the silicon concentration C is<br />
higher than CS and thus a concentration gradient is formed. Silicon atoms diffuse<br />
following this concentration gradient. Since all atoms are diffusing to the growing<br />
grain the growth rate of the grain is equal to the Si flux density jG towards the<br />
grain. jG corresponds to the slope of the concentration profile right in front of the<br />
grain. Thus the growth rate is determined by Fick’s first law:<br />
jG = −D ∂CSi<br />
�<br />
�<br />
�<br />
∂x �<br />
x=0<br />
(5.7)<br />
≈<br />
C − CS<br />
−D<br />
xG<br />
(5.8)<br />
= − D<br />
CS (S − 1) , S = C<br />
, (5.9)<br />
xG<br />
where D is the temperature dependent diffusion coefficient, CSi is the silicon con-<br />
centration, the growth length xG depends on the geometry of the crystal growth<br />
according to Zener’s approximation [97] and S = C<br />
CS<br />
Hence, the growth rate jG is proportional to the supersaturation.<br />
CS<br />
is the supersaturation.<br />
The nucleation rate jN is a function of the supersaturation as well. In chapter 2<br />
the activation energy for nucleation depending on the volume and the surface<br />
term was introduced. According to D.A. Porter and K.E. Easterling [11] an ad-<br />
ditional strain term has to be taken into account. This strain term is related to<br />
the stress induced by the formation of the cluster in its surrounding matrix. It<br />
is proportional to the volume of the cluster and can thus be subtracted from the<br />
energy gain due to the crystallization of the cluster. In the calculations made here
5.1 Definition of three crucial Si concentrations in Al 105<br />
Figure 5.3: Si concentration in front of a growing Si grain in diffusion-limited growth. At<br />
the grain the CSi is the saturation concentration CS. A concentration gradient is formed<br />
which reaches a maximum concentration C far away from the grain. Si diffuses along this<br />
gradient towards the growing grain. The slope at the grain is determined by the growth<br />
length xG.<br />
homogeneous nucleation is assumed and the stress effect is neglected. For the<br />
presented, qualitative discussion this assumption is not of crucial importance.<br />
The density of critical cluster C ∗∗ is given by:<br />
C ∗∗ �<br />
∝ C exp − ∆G∗<br />
�<br />
, (5.10)<br />
kT<br />
where C is the concentration of the nucleating species and ∆G ∗ is the activation<br />
energy for the nucleation. The rate f at which the nuclei stabilize, i.e. reach<br />
the supercritical size, depends on how frequently a critical nucleus can receive<br />
an atom. This depends on the surface area of the nucleus and the rate at which<br />
diffusion can occur. If the activation energy for atomic migration is ∆Gm per atom,<br />
f can be written as:<br />
�<br />
f = ω exp − ∆Gm<br />
�<br />
, (5.11)<br />
kT
106 Discussion<br />
where ω is a factor that includes the vibration frequency of the atoms and the area<br />
of the critical nucleus. The nucleation rate is the product of f and C ∗∗ , therefore<br />
�<br />
jN ∝ ωC exp − ∆Gm<br />
� �<br />
exp −<br />
kT<br />
∆G∗<br />
�<br />
. (5.12)<br />
kT<br />
The Gibbs energy ∆G ∗ needed to form a critical cluster, i.e. the activation energy,<br />
is known to depend on the crystallization heat and the surface energy as shown in<br />
equation 2.4 [12]:<br />
∆G ∗ = 16 σ3<br />
π<br />
3 ∆g2 , (5.13)<br />
V<br />
for spherical cluster, σ is the specific surface energy and ∆gV is the Gibbs energy<br />
reduction by transition of an atom. In the Al layer the Gibbs energy reduction by<br />
transition of an atom corresponds to the difference of the chemical potential of the<br />
atom in the Al to the chemical potential in the cluster. Thus ∆gV can be substituted<br />
by ∆µSi in case of the ALILE process. In eq. 5.2 the concentration dependence of<br />
the chemical potential of Si µSi in Al is shown. The chemical potential of the<br />
silicon in the cluster is µSi,0. Thus the chemical potential difference ∆µSi is:<br />
∆µSi =<br />
� �<br />
C<br />
kT ln<br />
CS<br />
(5.14)<br />
= kT ln S. (5.15)<br />
Combining equations 5.12, 2.4 and 5.15 and substituting C = CSS leads to a<br />
concentration dependent formula for the nucleation rate<br />
�<br />
jN ∝ ωCSS exp − ∆Gm<br />
� �<br />
exp −<br />
kT<br />
16πσ3<br />
3(kT ) 3 ln 2 �<br />
S<br />
(5.16)<br />
In Fig. 5.4 both nucleation and growth rate are plotted as a function of the super-<br />
saturation S. All values other than S were set to 1 in order to plot the functions.
5.1 Definition of three crucial Si concentrations in Al 107<br />
j G , j N [a .u .]<br />
1<br />
j G<br />
0<br />
1 S * 2 3 4<br />
S<br />
Figure 5.4: Nucleation rate jN and growth rate jG as a function of the supersaturation S.<br />
Up to the nucleation concentration C ∗ the nucleation rate is about zero.<br />
In contrast to the growth rate, the nucleation rate remains close to zero up to a su-<br />
persaturation of about S ∗ = C ∗ /CS = 1.5 (This value varies when the nucleation<br />
rate is calculated with real values in equation 5.16, but the tendency remains).<br />
This means that there is a regime where growth is possible, but no nucleation is<br />
observed indicated by a dashed line in Fig. 5.4. The Si concentration correspond-<br />
ing to this supersaturation is referred to as critical or nucleation concentration C ∗ .<br />
Upon exceeding S ∗ the nucleation rate jN is dominated by the linear coefficient.<br />
Now, three important Si concentrations have been defined. No growth or nucle-<br />
ation takes place at concentrations below the saturation concentration CS. When<br />
CS is exceeded a regime without nucleation but crystal growth has been defined.<br />
Upon reaching the critical concentration C ∗ the nucleation rate increases. The<br />
maximum concentration Cmax can not be exceeded in the process.<br />
I: 0 ≤ C < CS: no nucleation, no grain growth.<br />
II: CS ≤ C < C ∗ : no nucleation, but grain growth.<br />
j N
108 Discussion<br />
III: C ∗ ≤ C < Cmax: both, nucleation and grain growth.<br />
The three regimes and the the corresponding Si concentrations are very important<br />
for understanding the ALILE process and are used in the following sections.
5.2 The ALILE process in the phase diagram 109<br />
T<br />
9 0 0<br />
�<br />
8 0 0<br />
7 0 0<br />
6 0 0<br />
����<br />
� �<br />
a b<br />
� �<br />
� ���<br />
���������<br />
5 0 0<br />
A l 0 .5 1 .0<br />
��<br />
1 .5<br />
���<br />
6 0 0<br />
��<br />
Figure 5.5: Al rich part of the modified Al/Si phase diagram including the three concen-<br />
trations: saturation concentration CS (solid line), critical concentration C ∗ (dashed line)<br />
and maximum concentration Cmax (dotted line).<br />
g<br />
5 0 0<br />
4 0 0<br />
3 0 0<br />
5.2 The ALILE process in the phase diagram<br />
The ALILE process takes place in the Al rich part of the Al/Si phase diagram. Using<br />
the above defined Si concentrations the phase diagram is modified.<br />
In the ’normal’ Al/Si phase diagram the saturation concentration is shown. The<br />
critical concentration and the maximum concentration are higher than the satura-<br />
tion concentration. Corresponding lines are added in the phase diagram (Fig. 5.5).<br />
The critical concentration C ∗ (dashed line) was estimated to be around 1.5×<br />
(Fig. 5.4) the saturation concentration CS (solid line) and the maximum concen-<br />
tration Cmax (dotted line) is about 4× as high (eqn. 5.6). Consequently the three<br />
concentration regimes (I-III) explained above can be distinguished. The regime<br />
(II) without nucleation but grain growth is shaded in grey, because it is of special<br />
importance to the nucleation suppression.<br />
Fig. 5.5 enables a discussion of the time evolution of the silicon concentration<br />
CSi in the Al layer far away of the growing grains. The importance of the Si
110 Discussion<br />
concentration close to the grain is discussed later. In Fig. 5.6(a) the modified<br />
phase diagram and in Fig. 5.6(b) the Si concentration CSi versus the annealing<br />
time tA are shown. At the beginning of the process there is no silicon within the<br />
aluminum layer. Provided that the heating is fast compared to the Si diffusion the<br />
Si concentration remains zero until the sample reaches the annealing temperature<br />
(1). The system tries to reach the thermodynamic equilibrium, i.e. the equilibrium<br />
line. Therefore silicon diffuses from the a-Si phase into the Al, increasing the<br />
Si concentration CSi from zero to the saturation concentration CS (2). Due to<br />
the higher chemical potential of the silicon within the a-Si phase the Al will be<br />
supersaturated, still no new nucleation is observed. Upon exceeding the critical<br />
concentration C ∗ (3), nucleation starts and the grains begin to grow supplied<br />
by lateral diffusion of silicon atoms from the Al layer. The increasing number of<br />
silicon nuclei and their growth reduces the increase in silicon concentration within<br />
the Al layer and the silicon concentration reaches a maximum (4). When the Si<br />
concentration reaches a maximum the nucleation rate reaches a maximum, too.<br />
When the growth of the silicon grains and the formation of new nuclei consumes<br />
more silicon than the supply of silicon from the a-Si phase, CSi decreases until it<br />
drops below the critical concentration again and nucleation comes to an end (5).<br />
The growth rate of the silicon grains is proportional to the difference between CSi<br />
and CS. Thus the growing grains are not able to decrease the Si concentration<br />
below the saturation concentration and thus CSi finally reaches a value between<br />
C ∗ and CS (6).<br />
The Si concentration CSi evolution in Fig. 5.6(b) shows that the process can be<br />
divided in three periods:<br />
I: saturation period: No nucleation takes place until the critical concentration<br />
C ∗ is reached at t1.<br />
II: nucleation period: Si nucleates and the nuclei grow.<br />
III: growth period: When the Si concentration drops below the critical concen-<br />
tration again and nucleation comes to and end.
5.2 The ALILE process in the phase diagram 111<br />
T<br />
9 0 0<br />
�<br />
8 0 0<br />
7 0 0<br />
6 0 0<br />
����<br />
� � �<br />
� �<br />
�<br />
���������<br />
5 0 0<br />
A l 0 .5 1 .0<br />
��<br />
1 .5<br />
(a)<br />
(b)<br />
�<br />
���<br />
6 0 0<br />
��<br />
Figure 5.6: Model for the ALILE process. (a) Modified Al/Si phase diagram with process<br />
steps and correspondingly (b) the time evolution of the Si concentration during the ALILE<br />
process. The three concentrations: maximum concentration Cmax, critical concentration<br />
C ∗ and saturation concentration CS play a crucial role in the process and divide it in<br />
three regimes: I: no nucleation, II: nucleation and growth of the grains, III: grain growth<br />
without further nucleation.<br />
5 0 0<br />
4 0 0<br />
3 0 0
112 Discussion<br />
These three periods correspond to the experimental results described in chapter 4<br />
shown in Fig. 4.11. Thus the mechanism responsible for the suppression of nucle-<br />
ation can be understood.<br />
With this model the cooling results discussed in chapter 4.2.2 can be explained<br />
as well. When the temperature is lowered the saturation concentration decreases<br />
and thus the supersaturation is increased strongly (7) (Fig. 5.6(a)). This leads to<br />
a strong increase in the nucleation rate. Upon reheating the sample the formed<br />
nuclei grow and become visible in the optical micrographs. The existence of the<br />
depletion regions will be addressed in the following section.
5.3 Depletion regions in the ALILE process 113<br />
5.3 Depletion regions in the ALILE process<br />
The nucleation suppression can be explained by the thermodynamic considera-<br />
tions and the phase diagram. The considerations were made involving the time<br />
evolution of the Si concentration somewhere in the Al or to be more precise some-<br />
where far away of the grain in the bulk of the Al. The origin of the depletion<br />
regions found in the cooling step experiments (section 4.2.2) is elucidated in this<br />
section.<br />
In Fig. 5.7 the Si concentration around an existing grain is shown schematically<br />
before (a) and after (b) cool down (compare to Fig. 5.7(a) and 5.7(b)) assum-<br />
ing ideal diffusion limited growth as mentioned above. Critical concentrations C ∗<br />
and saturation concentrations CS are marked with corresponding indices a (be-<br />
fore cool down) and b (after cool down). In the shown cases the sample reached<br />
the growth period prior to cool down. Thus the silicon concentration CSi is above<br />
the saturation concentration CS,a and below the critical concentration C ∗ a within<br />
the entire Al layer allowing for growth of existing grains but suppressing new nu-<br />
cleation (regime I) (Fig. 5.7(a)). Assuming the cool down to be very fast in com-<br />
parison to diffusion, the concentration profile does not change from Fig. 5.7(a) to<br />
Fig. 5.7(b). But upon cool down the saturation concentration is decreased from<br />
CS,a to CS,b according to the Al-Si phase diagram [98]. At the same time the<br />
critical concentration is decreased from C ∗ a to C ∗ b<br />
because the critical supersatura-<br />
tion remains the same (S ∗ = C ∗ a/CS,a = C ∗ b /CS,b). For comparison the saturation<br />
concentration CS,a and the critical concentration C ∗ a before the cool down are in-<br />
cluded in Fig. 5.7(b) (indicated by dotted lines). Due to the decrease of the critical<br />
concentration upon cool down the Si concentration within the Al layer far away<br />
from existing grains exceeds the critical concentration C ∗ b<br />
(regime II). Thus many<br />
new grains are formed as observed in the experiment (Fig. 5.7(b)). In the vicinity<br />
of existing grains CSi is still below C ∗ b<br />
and therefore no new nucleation occurs in<br />
these regions (regime I). These regions are the depletion regions. The width of<br />
the depletion region L is indicated in Fig. 5.7(b) (compare regions without new
114 Discussion<br />
nuclei around preexisting grains in section. 4.2.2). Due to the steep increase in nu-<br />
cleation rate at the critical concentration C ∗ b<br />
the nucleation density rises abruptly<br />
from zero inside the depletion regions to a high value outside the depletion re-<br />
gions.<br />
This model is compared with the experimental data obtained in chapter 4 in the<br />
next section in order to verify it.<br />
5.4 Comparison of the qualitative model with exper-<br />
imental results<br />
The results obtained in section 4.1.1 are elucidated in the context of the model de-<br />
scribed in the previous section in order to verify the model. The results presented<br />
in section 4.1.1 are normalized as described below to analyze them in context of<br />
the model presented above.<br />
Fig. 5.8 shows the normalized grain growth velocity vG,0 (open circles), nucleation<br />
density NG (crosses) and nucleation time tN (solid squares) for sample type C<br />
annealed at various temperatures. The values have been normalized to the results<br />
at the lowest annealing temperature. With increasing annealing temperature the<br />
grain growth velocity vG,0 increases whereas nucleation time tN decreases and the<br />
nucleation density NG is only little affected.<br />
Fig. 5.9 shows the result for the different samples annealed at 450 °C. Again the<br />
values have been normalized. This time to the corresponding values of sample<br />
type A. The nucleation time tN increases, the nucleation density NG decreases and<br />
the change in vG,0 is relatively small when the oxide layer thickness is increased<br />
from sample A to C.<br />
These results are interpreted using the basic model shown in Fig. 5.1 and the ther-<br />
modynamic consideration made thereafter. The two main Si fluxes correspond to<br />
the process step (1) total Si diffusion from the a-Si across the interface into the Al
5.4 Comparison of the qualitative model with experimental results 115<br />
(a)<br />
(b)<br />
Figure 5.7: Schematic illustration of the silicon concentration CSi in front of a growing<br />
grain vs distance x from the grain before (a) and after (b) cool down. Critical concentra-<br />
tion C ∗ and saturation concentration CS are shown with the corresponding indices. The<br />
transition from subcritical (β) to supercritical (γ) phase at the depletion region width L is<br />
indicated in (b).
116 Discussion<br />
n o rm a liz e d v a lu e<br />
1 0 2<br />
1 0 1<br />
1 0 0<br />
1 0 -1<br />
1 0 -2<br />
��������<br />
v G ,0<br />
N G<br />
4 0 0 4 5 0 5 0 0 5 5 0<br />
�� ����� �<br />
Figure 5.8: Values normalized to the value at 400 °C: average grain growth velocity vG,0<br />
(open circles), nucleation density NG (crosses) and nucleation time tN (solid squares) vs.<br />
annealing temperature TA for sample type C.<br />
n o rm a liz e d v a lu e<br />
1 0 2<br />
1 0 1<br />
1 0 0<br />
1 0 -1<br />
1 0 -2<br />
� � ������<br />
A B<br />
�������<br />
C<br />
t N<br />
t N<br />
v G ,0<br />
Figure 5.9: Values normalized to the value for sample type A: nucleation time tN (solid<br />
squares), average grain growth velocity vG,0 (open circles) and number of grains NG<br />
(crosses) for all three sample types A, B and C annealed at 450 °C.<br />
N G
5.4 Comparison of the qualitative model with experimental results 117<br />
layer J1 and (2) Si diffusion within the Al layer towards a single growing grains<br />
J2.<br />
The total flux J1 across the interface determines the time needed to reach the<br />
critical concentration C ∗ in the Al layer. The higher J1 the lower the nucleation<br />
time tN:<br />
tN ∼ 1<br />
. (5.17)<br />
The ALILE process is a diffusion limited process. This means that the amount of<br />
silicon aggregated at the grain and thus vG,0 is mostly determined by the diffusion<br />
velocity, i.e. the flux J2 of silicon within the aluminum layer towards a single grain<br />
(2). The higher the silicon diffusion velocity within the aluminum the faster the<br />
crystalline silicon grains grow:<br />
J1<br />
vG ∼ J2. (5.18)<br />
After the nucleation started the silicon diffuses across the interface and within<br />
the aluminum layer towards the grains. As long as the silicon flux across the<br />
interface is larger than the sum of silicon fluxes towards the growing grains the<br />
silicon concentration within the aluminum will rise. And thus new silicon nuclei<br />
are formed in the aluminum. In first approximation the nucleation stops when<br />
both diffusion processes are equal and the final nucleation density NG is reached 1 .<br />
J1 = NGJ2 (5.19)<br />
⇒ NG = J1<br />
J2<br />
(5.20)<br />
1 Actually the Si concentration only starts to decrease once the NGJ2 is larger than J1, but the<br />
nucleation stops only when the Si concentration CSi decreases below the critical concentration C ∗ .<br />
Still for the simple evaluations made here, the result is not affected.
118 Discussion<br />
This means that the number of grains is determined by the ratio of the two fluxes.<br />
At the beginning of the process the flux across the interface J1 is larger than the<br />
flux to the growing grains J2 (J1 > NGJ2) and the silicon concentration within<br />
the aluminum layer still increases. After reaching the point were both fluxes<br />
are equal the diffusion towards the grains is larger than the flux across the in-<br />
terface J1 < NGJ2 which leads to a lower concentration of silicon in the alu-<br />
minum layer. Applying these considerations to the experiments described above<br />
the influence of the different parameters on the different process steps has to be<br />
taken into account. With increasing annealing temperature TA both J1 and J2 in-<br />
crease (eq. 5.21). An increase of J1 leads to a decrease of the nucleation time tN<br />
(eq. 5.17). An increase of J2 leads to an increase of the grain growth velocity vG,0<br />
(eq. 5.18). The nucleation density NG remains approximately constant (eq. 5.20).:<br />
J1<br />
J2<br />
TA ↑: (5.21)<br />
J1 ↑ ⇒ tN ↓<br />
J2 ↑ ⇒ vG,0 ↑<br />
≈ const. ⇒ NG ≈ const.<br />
Both fluxes J1 and J2 are thermally activated processes. This means that the nu-<br />
cleation density NG is only affected by the difference in thermal activation energy<br />
of both processes (Fig. 5.8).<br />
The oxide layer thickness will change the diffusion across the interface but will<br />
have little effect on the diffusion within the aluminum layer. This means that tN<br />
will increase with increasing oxide thickness (eq. 5.17) and vG,0 will be little af-<br />
fected (eq. 5.18). The ratio of both processes is strongly changed by the oxide<br />
layer thickness. This means that the nucleation density NG decreases with in-<br />
creasing oxide layer thickness (eq. 5.20). This has been experimentally observed<br />
in Fig. 5.9:
5.4 Comparison of the qualitative model with experimental results 119<br />
dOx ↑: (5.22)<br />
J1 ↓ ⇒ tN ↑<br />
J2 ≈ const. ⇒ vG ≈ const.<br />
J1<br />
J2<br />
↓ ⇒ N ↓<br />
This basic model is very restricted, because all parameters influence each other. All<br />
process steps are linked by the silicon concentration within the aluminum layer.<br />
With increasing silicon concentration within the aluminum layer the silicon diffu-<br />
sion into the aluminum will decrease and the grain growth velocity and nucleation<br />
rate will increase . However, the simple picture presented here allows a qualitative<br />
interpretation of the role of the various parameters in the ALILE process.
120 Discussion<br />
5.5 Preferential orientation model<br />
The temperature dependence of the preferential orientation was reported first by<br />
Kim et al. [67]. In section 4.1.1 this temperature dependence is confirmed and an<br />
additional dependence on the interface layer is shown. The present section offers<br />
a possible explanation in particular of the following experimental observations:<br />
• there are more grains close to {<strong>100</strong>} than to {111} and {110}-orientation,<br />
• the orientation depends on the annealing temperature, lower annealing tem-<br />
perature increases the fraction of {<strong>100</strong>} orientated grains.<br />
• the orientation depends on the interlayer, native oxide increases the fraction<br />
of {<strong>100</strong>} orientated grains compared to thermal oxide<br />
Some general assumptions have to be made. No relation between grain size and<br />
orientation has been detected so far. In the experiments observed in the optical<br />
microscope the grain growth velocity for all grains in the same experiment were<br />
similar (see section 4.1). Thus it is concluded that the formation of the preferen-<br />
tial orientation is not due to the faster growth of grains with a certain orientation.<br />
Instead it is assumed that the formation of the critical cluster determines the pref-<br />
erential orientation of the film.<br />
In order to lead to a preferential orientation the critical cluster needs two proper-<br />
ties:<br />
1: the cluster itself must have a preferential orientation.<br />
2: the cluster must be aligned to a feature with reference to the surface normal.<br />
Recalling the section on critical cluster formation in chapter 2, the Gibbs energy<br />
change in the formation of a critical cluster is:<br />
∆Gi = −∆gV i + σOi, (5.23)
5.5 Preferential orientation model 121<br />
the sum of a negative volume (−∆gV i), product of the crystallization heat gV per<br />
atom and the number of atoms i in the cluster, and a positive surface (σOi) depen-<br />
dent energy, product of the specific surface energy σ per atom and the number of<br />
atoms at the surface Oi. The surface dependent term which acts against the for-<br />
mation of the critical cluster can be reduced by either heterogeneous nucleation or<br />
formation of preferential surfaces. In the diamond structure of crystalline silicon<br />
{111} faces have the lowest specific surface energy σ and thus are preferentially<br />
formed [99]. The result is an octahedral or double-pyramid structure of the criti-<br />
cal clusters as shown in Fig. 2.6. The double pyramid has {111} faces, 〈110〉 ledges<br />
and 〈<strong>100</strong>〉 tips. Thus the clusters are preferentially orientated and fulfill the first<br />
requirement for the preferential orientation formed through nucleation. From this<br />
point all clusters are assumed to form {111} faces only.<br />
The specific surface energy σ can also be reduced by nucleation at a preferential<br />
site. If the nucleation takes place at a pre-existing interface, σ is strongly reduced.<br />
This is referred to as heterogeneous nucleation. In the Al layer the grain bound-<br />
aries and the interfaces to the glass and the oxide layer are suitable structures<br />
for heterogeneous nucleation. All of these are aligned to the surface normal. It<br />
seems reasonable that the most likely nucleation sites are the points where three<br />
Al grains meet the interlayer. Here the density of interfaces is the highest. These<br />
sites are aligned and thus fulfill the second requirement. With both requirements<br />
achieved the preferentially orientated clusters have to be stuck to the interface at<br />
preferential sites in a defined and favorable manner in order to result in a prefer-<br />
ential orientation.<br />
In Fig. 5.10 two TEM cross sections are shown of a specimen which has been an-<br />
nealed very briefly and then cooled down rapidly. In Fig. 5.10(a) the TEM image<br />
shows the glass at the bottom with the bright Al layer and the a-Si layer on top.<br />
In the Al layer a quadrangle can be anticipated. A schematic drawing is placed<br />
on top to illustrate the double pyramid cluster shape. In Fig. 5.10(b) a diffrac-<br />
tion contrast of the cluster is shown. The corresponding diffraction analysis of<br />
this quadrangle reveals that it is a silicon crystallite aligned with its [211] direction
122 Discussion<br />
(a) (b)<br />
Figure 5.10: TEM cross section of a glass/Al/a-Si layer stack after a very short annealing<br />
step. (a) Preferentially shaped cluster at interface. The schematic structure is placed on<br />
top of the actual grain which can be seen in (b) the corresponding z-contrast micrograph<br />
with a diffraction pattern identifying silicon grain with � 211 � orientation normal to layer<br />
surface.<br />
normal to the oxide layer. A double pyramid cluster is inserted in the Fig. 5.10(a)<br />
to elucidate the idea of ’sticking’ an orientated cluster to the interface. The [211]<br />
direction is in between the [111] face and the [<strong>100</strong>] tip of the pyramid. The cluster<br />
is not perfectly aligned but tilted with respect to the [<strong>100</strong>] orientation and already<br />
much larger than the critical cluster size, which is expected to be of the size of<br />
about 45 atoms as determined by Spinella et al. in the case of solid phase crystal-<br />
lization of amorphous silicon [12]. Still the formation of a double pyramid can be<br />
anticipated.<br />
The shape of the critical cluster is assumed to only exhibit {111} orientated sur-<br />
faces and to be intersected by the oxide layer. These requirements can not only be<br />
fulfilled by a double pyramid, but much rather by a single pyramid. The tip of this
5.5 Preferential orientation model 123<br />
E<br />
[<strong>100</strong>]<br />
a b c<br />
(a)<br />
d<br />
E<br />
[<strong>100</strong>]<br />
a b c<br />
(b)<br />
n<br />
d<br />
[111]<br />
E<br />
[<strong>100</strong>]<br />
a b c<br />
(c)<br />
n<br />
d<br />
[110]<br />
Figure 5.11: Sketch of a tilted single pyramid. The normal vector n of the intersecting<br />
plane E as well as the four edge vectors of the pyramid a, b, c, d used in the calculations<br />
below are indicated. (a) Initial position with (<strong>100</strong>) tip normal to the interface. (b) Tilted<br />
towards (111) direction by α111. (c) Tilted towards (110) direction by α110.<br />
single pyramid can be tilted relative to the interface. If the pyramid is pointing<br />
straight down, the resulting grain is {<strong>100</strong>} orientated. If the tip is tilted one way<br />
or the other the resulting grain orientation changes accordingly.<br />
With these assumptions an analytic solution for the angular and size dependant<br />
Gibbs energy is derived in the following. A coordinate system is introduced with<br />
the pyramid shape being unchange and only the interlayer plane being altered in<br />
its distance from the origin and its tilting angle with respect to the [<strong>100</strong>] axis/o-<br />
rientation. The tip of the pyramid is the origin of the coordinated system. The<br />
tip of the single pyramid [<strong>100</strong>] direction always points in the [<strong>100</strong>] direction of the<br />
coordinate system. And the ledges of the pyramid are vectors from the origin in<br />
the four directions [110], [101], � 110 � and � 101 � (see Fig. 5.11(a)). The interface<br />
plane intersects the pyramid at a height h, i.e. at (h00) and its normal vector is<br />
tilted relative to the [<strong>100</strong>] direction by the angle α111 towards [111] direction (see<br />
Fig. 5.11(b)), or by the angle α110 towards the [110] direction (see Fig. 5.11(c)).<br />
The intersections of the four ledges vectors with the interface plane together with<br />
the origin are the five corners of the tilted pyramid.<br />
As a result the volume of the cluster, the surface area formed with the surrounding<br />
Al and the base area formed with the interlayer are calculated (for detailed calcu-
124 Discussion<br />
lations see Appendix A). The resulting size i in atoms and angular α110 and α111<br />
dependent Gibbs energy for the two tilt angles are:<br />
and<br />
respectively.<br />
∆G (i, α110) = −∆gV i<br />
�<br />
+<br />
∆G (i, α111) = −∆gV i<br />
�<br />
σAl,Si 2 1<br />
3 3 7<br />
6<br />
+ σAlOX,Si 2 1<br />
3 3 2<br />
3<br />
+<br />
σAl,Si 2 5<br />
3 3 7<br />
6<br />
+ σAlOX,Si 2 5<br />
3 3 2<br />
3<br />
(cos α110) 2<br />
3<br />
cos 1<br />
3 (2 α110)<br />
1<br />
cos α110 cos (2 α110)<br />
cos 4<br />
3 α111<br />
(1 + 3 cos (2 α111)) 2<br />
3<br />
cos 1<br />
3 α111<br />
(1 + 3 cos (2 α111)) 2<br />
3<br />
�<br />
i 2<br />
3 (5.24)<br />
�<br />
i 2<br />
3 , (5.25)<br />
The critical cluster size i ∗ and the activation energy ∆G ∗ can be calculated as<br />
shown in chapter 2. It is clear that both critical cluster size i ∗ and the activation<br />
energy ∆G ∗ not only depend on the tilt angles but also on the Gibbs energy per nu-<br />
cleated cluster ∆gV and the surface energies between Al and Si σAl,Si and between<br />
Si and AlOX aluminum oxide σAlOX,Si. From Spinella et al. [12] the correspond-<br />
ing energies in solid phase crystallization are known. The crystallization energy<br />
∆gV and the a-Si/c-Si interface energy σca are in the order of 0.1 eV/ atom. Even<br />
though the values for the aluminum-induced crystallization of amorphous silicon<br />
are expected to be different from these values, they are used as first approxima-<br />
tion. At the oxide/cluster interface one half of the interface- namely the oxide-<br />
already exists. Thus the σAlOX,Si is assumed to be only half of σAl,Si. The resulting<br />
Gibbs energy ∆G is plotted as a function of the tilt angles α and the cluster size i<br />
in Fig. 5.12. Clearly a saddle point is formed at α = 0°. Especially tilt angles far<br />
away from the (<strong>100</strong>) direction have much higher activation energies compared to<br />
(<strong>100</strong>).
5.5 Preferential orientation model 125<br />
Δ G [e V ]<br />
1 0<br />
8<br />
6<br />
4<br />
2<br />
0<br />
-4 5<br />
α ��� ����<br />
0<br />
4 5<br />
����� α ��� ����<br />
2 0 0<br />
1 5 0<br />
1 0 0<br />
5 0<br />
0<br />
Figure 5.12: Gibbs energy ∆G for different tilt angles α from (<strong>100</strong>) to (110) and (111) as<br />
a function of the cluster size.<br />
The resulting, angular dependent, nucleation activation energy ∆G ∗ is the maxi-<br />
mum for the different angles at the critical cluster size i ∗ and can be easily calcu-<br />
lated by setting the derivative with respect to the cluster size i to zero. Substituting<br />
the parenthesis in equations 5.24 and 5.25 by X (α) the results for both tilt angles<br />
are:<br />
∂∆G<br />
= −∆gV +<br />
∂i<br />
2<br />
3<br />
⇒ i ∗ � �3 2 X (α)<br />
=<br />
3 ∆gV<br />
⇒ ∆G ∗ �<br />
2 X (α)<br />
= −∆gV<br />
3 ∆gV<br />
= 4 X (α)<br />
27<br />
3<br />
∆g2 V<br />
s iz e [a to m s ]<br />
X (α) i− 1<br />
3 = 0 (5.26)<br />
� 3<br />
+ X (α)<br />
� 2<br />
3<br />
X (α)<br />
∆gV<br />
� 2<br />
(5.27)<br />
(5.28)<br />
(5.29)<br />
The result is shown in Fig. 5.13. Not only the activation energy ∆G ∗ increases for<br />
larger tilt angles α but also the critical cluster size i ∗ . This leads to an even lower<br />
nucleation rate, because more atoms have to jump onto the cluster before a critical<br />
cluster can be formed.
126 Discussion<br />
Δ G * [e V ]<br />
2 0<br />
1 5<br />
1 0<br />
5<br />
2 0 0<br />
1 5 0<br />
1 0 0<br />
5 0<br />
0<br />
-4 5 0 4 5<br />
0<br />
�����<br />
��� �����<br />
i* [a to m s ]<br />
Figure 5.13: Calculated nucleation Gibbs energy ∆G ∗ (open circle) and critical cluster<br />
size i ∗ (solid circle) as a function of the tilt angle α from (<strong>100</strong>) towards (110) and (111)<br />
orientation.<br />
With this model the temperature dependence of the preferential orientation can<br />
be understood. The rates of thermally activated processes are higher for lower<br />
than for higher activation energies at lower temperatures. Thus at low annealing<br />
temperatures mainly (<strong>100</strong>) oriented clusters are formed. At higher annealing tem-<br />
peratures the nucleation rates for clusters with tilted orientations increases and<br />
cluster with other orientations stabilize as well.<br />
An alternative way to visualize this is referred to as nucleation attempt model.<br />
The critical clusters are formed from statistical agglomerations of atoms. When<br />
the initial, subcritical cluster is formed the tilt angle is already determined. Thus<br />
in Fig. 5.12 the position at the angle dependant axis is already determined and<br />
will not change throughout the attempt of the cluster to reach the critical size.<br />
The subcritical cluster agglomerates atoms and attempts to overcome the energy<br />
barrier at the maximum of ∆G. Especially if the (thermal) energy of the system is<br />
low it is much more likely for the subcritical cluster to overcome the energy barrier<br />
close to the (<strong>100</strong>) orientation.<br />
Using this model an idea for the interlayer dependance of the orientation of the<br />
resulting layer can be given with a little more information on aluminum oxide.
5.5 Preferential orientation model 127<br />
Native oxide is amorphous but at temperatures above 450 °C a so called γ − Al2O3<br />
phase is formed which is crystalline [<strong>100</strong>]. This structural change of the oxide<br />
layer much rather than the change in thickness is suggested to be the origin of the<br />
shift in preferential orientation with thermal oxide interlayers. Keeping the nucle-<br />
ation attempt model in mind, the amorphous oxide does probably not influence<br />
the number of attempts of any tilt angle. But the crystalline interface can offer<br />
defined bonds for the initial, subcritical cluster. And even though it is still a sta-<br />
tistical process the number of nucleation attempts of a certain cluster orientation<br />
can be increased. The temperature dependance is not changed, but especially at<br />
high temperatures when the clusters of all types of orientations reach the critical<br />
cluster size the number of attempts can determine the final orientation of the film.<br />
This suggests that the thermal oxide (γAl2O3) increases the number of nucleation<br />
attempts close to the (111) orientation.<br />
In this chapter the layer exchange process is discussed. It is shown that the Si con-<br />
centration within the Al is crucial for nucleation and growth. Below the saturation<br />
concentration CS neither nucleation nor growth of existing grains is possible. At<br />
concentrations larger than CS but below the critical concentration C ∗ grains grow<br />
but no new nuclei are formed. Only when C ∗ is exceeded nucleation is observed.<br />
The higher the concentration the higher the growth and nucleation rate. But the<br />
concentration is shown to be limited to a maximum concentration Cmax. The self-<br />
limited suppression of nucleation is elucidated for the ALILE process by showing<br />
the time dependence of the Si concentration within an Al/Si phase diagram in-<br />
cluding the above defined concentrations. Evaluation of the experimental results<br />
against the background of the model demonstrates the validity of the presented<br />
considerations in very simple qualitative terms. Furthermore a model for the ori-<br />
gin of the preferential orientation elucidating both the temperature and interlayer<br />
dependence of the resulting poly-Si film is suggested. The formation of preferen-<br />
tially shaped clusters aligned at preferential nucleation sites is suggested to result<br />
in the observed preferential orientation.
128 Discussion
6 Conclusions<br />
In the aluminum-induced layer exchange process a glass/Al/a-Si layer stack is<br />
transformed into a glass/poly-Si/Al(+Si) layer stack in a simple thermal annealing<br />
step. The poly-Si layer is characterized by<br />
• large grains, promising good electronic properties and<br />
• preferential (<strong>100</strong>) orientation, desirable for subsequent low-temperature epi-<br />
taxy.<br />
Both attributes were known prior to this work, but their origin was not fully un-<br />
derstood. A model was suggested for the origin of the large grains earlier. Within<br />
this thesis its validity is proofed experimentally. The origin of the preferential ori-<br />
entation was not discussed before and a possible explanation is given within this<br />
thesis for the first time.<br />
By designing special experiments it is possible to elucidate the origin of both phe-<br />
nomena. The results are discussed on a thermodynamic basis using the Al/Si phase<br />
diagram. Nucleation and growth rates depend on the supersaturation of Si in the<br />
Al. Through supercooling additional nucleation is enforced proofing the suggested<br />
model. Self-limiting suppression of nucleation leads to very large grain sizes.<br />
The selective formation of critical clusters leads to a preferential nucleation of<br />
Si. The initial preferential nucleation causes a final preferential orientation of the<br />
films. This model is consistent with experimental findings.<br />
The discussion of the results makes the aluminum-induced layer exchange process<br />
very enlightening, revealing the physics of phase transformation. The comparison<br />
of nucleation caused by supersaturation and supercooling is of interest for the<br />
growing community of researchers working in the field of thin film crystalline<br />
silicon devices but is also very impressive and memorable for everybody dealing<br />
with nucleation processes in general.
130 Conclusions<br />
The results presented in this thesis provide a strategy to form optimized poly-Si<br />
layers. The best seed layers are obtained by:<br />
• using thin, native oxide interlayers which enhances the preferential (<strong>100</strong>)<br />
orientation.<br />
• starting at low annealing temperature, which increases the grain size and<br />
enhances the preferential (<strong>100</strong>) orientation.<br />
• increasing the annealing temperature after nucleation suppression to de-<br />
crease the process time without additional nucleation and perpetuation of<br />
the preferential (<strong>100</strong>) orientation.<br />
With this strategy templates made by the aluminum-induced layer exchange pro-<br />
cess are optimized as seed layers for low-temperature epitaxy. Poly-crystalline<br />
silicon thin-film solar cells based on the seed layer concept have the potential to<br />
achieve high efficiencies at very low costs which makes them promising candidates<br />
for the medium-term future solar cell technology.
A Preferential orientation calculated<br />
as pyramid cluster rotation<br />
The tip of the pyramid is located in the origin of the coordinate system and the<br />
edges of the pyramid stay fixed in direction. The edge vectors and the height of<br />
the pyramid are defined as<br />
⎛ ⎞<br />
�a :<br />
1<br />
⎜ ⎟<br />
⎜ ⎟<br />
�x − a ⎜ 1 ⎟<br />
⎝ ⎠<br />
0<br />
⎛ ⎞<br />
�b :<br />
1<br />
⎜ ⎟<br />
⎜ ⎟<br />
�x − b ⎜ 0 ⎟<br />
⎝ ⎠<br />
1<br />
⎛ ⎞<br />
�c :<br />
1<br />
⎜ ⎟<br />
⎜ ⎟<br />
�x − c ⎜ −1 ⎟<br />
⎝ ⎠<br />
0<br />
⎛ ⎞<br />
�d :<br />
⎜<br />
�x − d ⎜<br />
⎝<br />
1<br />
⎟<br />
0 ⎟<br />
⎠<br />
−1<br />
⎛ ⎞<br />
�h :<br />
1<br />
⎜ ⎟<br />
⎜ ⎟<br />
�x − h ⎜ 0 ⎟<br />
⎝ ⎠<br />
0<br />
= 0, (A.1)<br />
= 0, (A.2)<br />
= 0, (A.3)<br />
= 0, (A.4)<br />
= 0. (A.5)<br />
The base of the pyramid is allowed to turn by the two angles θ and φ as in spherical<br />
coordinates notation. The base is defined along the height in distance h. Rotating<br />
the base normal by θ and φ leads to the base definition in Hessian normal plane<br />
form
132 Preferential orientation calculated as pyramid cluster rotation<br />
⎛ ⎛ ⎞⎞<br />
E :<br />
1<br />
⎜ ⎜ ⎟⎟<br />
⎜ ⎜ ⎟⎟<br />
⎜�x<br />
− h ⎜ 0 ⎟⎟<br />
⎝ ⎝ ⎠⎠<br />
0<br />
·<br />
⎛ ⎞<br />
cos θ<br />
⎜ ⎟<br />
⎜ ⎟<br />
⎜ sin θ cos φ ⎟<br />
⎝ ⎠<br />
sin θ sin φ<br />
= 0. (A.6)<br />
To find the corners of the pyramid the intersections of the edges with the plane<br />
have to be determined. This is done exemplarily for the intersection of the plane<br />
E with the vector �a (E � �a):<br />
⎛<br />
⎜<br />
⎝ a<br />
⎛ ⎞ ⎛ ⎞⎞<br />
1 1<br />
⎜ ⎟ ⎜ ⎟⎟<br />
⎜ ⎟ ⎜ ⎟⎟<br />
⎜ 1 ⎟ − h ⎜ 0 ⎟⎟<br />
⎝ ⎠ ⎝ ⎠⎠<br />
0 0<br />
·<br />
⎛ ⎞<br />
cos θ<br />
⎜ ⎟<br />
⎜ ⎟<br />
⎜ sin θ cos φ ⎟<br />
⎝ ⎠<br />
⎛ ⎞<br />
sin θ sin φ<br />
a − h<br />
⎜ ⎟<br />
⎜ ⎟<br />
⎜ a ⎟<br />
⎝ ⎠<br />
0<br />
·<br />
⎛ ⎞<br />
cos θ<br />
⎜ ⎟<br />
⎜ ⎟<br />
⎜ sin θ cos φ ⎟<br />
⎝ ⎠<br />
sin θ sin φ<br />
= 0, (A.7)<br />
= 0, (A.8)<br />
(a − h) cos θ + a sin θ cos φ = 0, (A.9)<br />
a =<br />
h cos θ<br />
.<br />
cos θ + sin θ cos φ<br />
(A.10)<br />
The other intersection results are calculated correspondingly:<br />
b =<br />
c =<br />
d =<br />
h cos θ<br />
,<br />
cos θ + sin θ sin φ<br />
(A.11)<br />
h cos θ<br />
,<br />
cos θ − sin θ cos φ<br />
(A.12)<br />
h cos θ<br />
.<br />
cos θ − sin θ sin φ<br />
(A.13)<br />
The volume of the pyramid can be determined by using the triple product. The<br />
pyramid consists of the four edge vectors. A parallelepiped consist of three vectors.<br />
This means that the pyramid is calculated in two parts. One set of vectors consists<br />
of the edge vector �a, � b and �c, the other of �c, � d and �a. The volume of the half<br />
pyramids is a sixth of the parallelepiped mounted by the three edge vectors:<br />
V = 1<br />
� �<br />
�a · �b × �c +<br />
6 1<br />
� �<br />
�c · �d × �a .<br />
6<br />
(A.14)<br />
The four triangular faces of the pyramid have a total area of:<br />
S = 1<br />
�<br />
�<br />
��a ×<br />
2<br />
� �<br />
�<br />
b�<br />
+ 1<br />
�<br />
�<br />
�<br />
2<br />
� �<br />
�<br />
b × �c � + 1<br />
�<br />
�<br />
��c ×<br />
2<br />
� �<br />
�<br />
d�<br />
+ 1<br />
�<br />
�<br />
�<br />
2<br />
� �<br />
�<br />
d × �a � . (A.15)
The area of the base of the pyramid is:<br />
B = 1<br />
2<br />
��<br />
�<br />
�<br />
� �b − �a ×<br />
� ��<br />
�d �� 1<br />
− �a +<br />
2<br />
��<br />
�<br />
�<br />
� �d − �c ×<br />
133<br />
� ��<br />
�b ��<br />
− �c . (A.16)<br />
The volume of the pyramid- as for any pointed three dimensional shape- is also<br />
the third of the normal height times the base area:<br />
V =<br />
This is used to control the obtained results.<br />
h cos θ<br />
B. (A.17)<br />
3<br />
For all angles θ and φ the following calculations lead to very extensive terms. In<br />
order to simplify the calculations the two cases for tilting the pyramid in [110] and<br />
[111] direction are regarded only. Turning in [110] direction corresponds to φ = 0°,<br />
whereas φ = 45° corresponds to tilting the pyramid into [111] direction. In order<br />
to distinguish the general angle θ from these two special cases they are renamed<br />
to α110 and α111, respectively. The tilting of the base area is shown in Fig 5.11.<br />
The resulting volume, surface and base for the tilt by α110 are:<br />
and by α111:<br />
V110 = 2<br />
3 h3 cos2 α110<br />
, (A.18)<br />
cos (2α110)<br />
S110 = 2 √ 3h 2 cos2 α110<br />
, (A.19)<br />
cos (2α110)<br />
B110 = 2h 2 cos2 α110<br />
, (A.20)<br />
cos (2α110)<br />
V111 =<br />
32h 3 cos 4 α111<br />
2 , (A.21)<br />
3 (1 + 3 cos (2α111))<br />
S111 = 32√ 3h 2 cos 4 α111<br />
B111 =<br />
2 , (A.22)<br />
(1 + 3 cos (2α111))<br />
32h 2 cos 3 α111<br />
2 . (A.23)<br />
(1 + 3 cos (2α111))<br />
Comparison with equation A.17 confirms the result. The volume V is also related<br />
to the surface S in an angular independent way:<br />
V =<br />
h<br />
3 √ S. (A.24)<br />
3
134 Preferential orientation calculated as pyramid cluster rotation<br />
In order to be able to interpret the results in terms of Gibbs energy the volume<br />
and the areas have to be transformed into units of atoms. Thus the volume is set<br />
to be i atoms, the corresponding height is calculated and substituted into the area<br />
terms. The height in units of atoms for tilting in (110) direction is:<br />
h110 =<br />
� � 1<br />
3<br />
3<br />
i cos (2α110)<br />
2<br />
(cos α110) 2 , (A.25)<br />
3<br />
and correspondingly for tilting the pyramid into (111) direction:<br />
h111 =<br />
(3i) 1<br />
3 (1 + 3 cos (2α111)) 2<br />
3<br />
(2 cos α111) 4<br />
3<br />
. (A.26)<br />
The resulting size and angular dependent Gibbs energy for the two tilt angles are:<br />
and<br />
.<br />
∆G (i, α110) = −∆gV i<br />
�<br />
+<br />
∆G (i, α111) = −∆gV i<br />
�<br />
σAl,Si2 1<br />
3 3 7<br />
6<br />
+ σAlOX,Si2 1<br />
3 3 2<br />
3<br />
+<br />
σAl,Si2 5<br />
3 3 7<br />
6<br />
+ σAlOX,Si2 5<br />
3 3 2<br />
3<br />
(cos α110) 2<br />
3<br />
cos 1<br />
3 (2α110)<br />
1<br />
cos α110 cos (2α110)<br />
cos 4<br />
3 α111<br />
(1 + 3 cos (2α111)) 2<br />
3<br />
cos 1<br />
3 α111<br />
(1 + 3 cos (2α111)) 2<br />
3<br />
�<br />
i 2<br />
3 , (A.27)<br />
�<br />
i 2<br />
3 (A.28)
B Abbreviations, symbols and units<br />
abbreviation meaning<br />
ALILE aluminum-induced layer exchange process<br />
APCVD atmospheric pressure chemical vapor deposition<br />
a-Si:H hydrogenated amorphous silicon<br />
CIS Copper-Indium (Gallium)-Selenide (Sulfite)<br />
CSG Crystalline Silicon on Glass<br />
EELS electron energy loss spectrospocy<br />
EBSD electron back scatter diffraction<br />
ECRCVD electron cyclotron resonance chemical vapor deposition<br />
FESMC field enhanced silicide mediated crystallization<br />
FIB focussed ion beam<br />
FOx flowable oxide<br />
HMI Hahn-Meitner-Institut <strong>Berlin</strong><br />
HR-TEM high resolution transmission electron microscope<br />
IAD ion assisted deposition<br />
IMEC interuniversity microelectronics center<br />
KUL Catholic University Leuven<br />
METEOR European-project ’Metal-induced Crystallisation and Epitax-<br />
ial Deposition for Thin, Efficient and Low-cost Crystalline Si<br />
Solar Cells’<br />
MIC metal-induced crystallization<br />
MILC metal-induced lateral crystallization<br />
PECVD plasma enhanced chemical vapor deposition<br />
PV photovoltaic<br />
ROI region of interest<br />
RTA rapid thermal annealing<br />
SAD selective area diffraction
136 Abbreviations, symbols and units<br />
abbreviation meaning<br />
SPE solid phase epitaxy<br />
SPC solid phase crystallization<br />
TEM transmission electron microscope<br />
TUW Technical University Wien<br />
TCO transparent conductive oxide<br />
TFT thin-film transistor<br />
UNSW University of New South Wales<br />
µc-Si:H hydorgenated microcrystalline silicon<br />
Wp<br />
Watt peak<br />
symbol unit meaning<br />
A nucleation and growth dependent constant in KJMA<br />
equation<br />
α110 ° tilt angle from (<strong>100</strong>) to (110) direction<br />
α111 ° tilt angle from (<strong>100</strong>) to (111) direction<br />
C cm −3 concentration<br />
C ∗ cm −3 critical concentration<br />
C ∗∗ cm −3 concentration of critical clusters<br />
Ca−Si cm −3 Si concentration in Al in equilibrium with amor-<br />
phous Si<br />
Cmax cm −3 maximum Si concentration in Al<br />
CS cm −3 saturation concentration, solubility limit<br />
CSi cm −3 Si concentration (in Al)<br />
D cm 2 s −1 diffusion coefficient<br />
d <strong>µm</strong> depletion region width<br />
dOx nm thickness of the Al oxide interlayer<br />
f s −1 stabilization rate of a critical cluster<br />
G eV Gibbs energy<br />
∆G eV driving force
symbol unit meaning<br />
∆G a eV activation energy<br />
∆Gm eV activation energy for atomic migration<br />
∆GV eV Gibbs energy reduction by phase transition of a unit<br />
volume<br />
∆gV eV/ atom Gibbs energy reduction by phase transition of one<br />
atom<br />
∆G ∗ eV Gibbs energy needed to form a critical cluster<br />
i atom number of atoms<br />
j s −1 rate<br />
J1 atom s −1 Si flux from a-Si to c-Si across the interlayer<br />
J2 atom s −1 Si flux within the Al layer<br />
jG s −1 growth rate<br />
jN s −1 nucleation rate<br />
k eV/K Boltzmann constant (8.6215 · 10 −5 eV/K)<br />
L <strong>µm</strong> depletion region width<br />
m constant in KJMA equation determined by experi-<br />
mental conditions and dimensions<br />
NG 10 3 mm −2 nucleation density<br />
N atoms number of particles<br />
p Pa pressure<br />
R ratio<br />
RC % crystallized fraction<br />
r <strong>µm</strong> radius<br />
r ∗ nm critical radius<br />
S supersaturation<br />
σ eV/ atom specific surface energy<br />
σAl,Si eV/ atom specific surface energy at the Al-Si interface<br />
σAlOX,Si eV/ atom specific surface energy at the AlOX-Si interface<br />
T °C temperature<br />
137
138 Abbreviations, symbols and units<br />
symbol unit meaning<br />
T1 °C temperature before cooling step<br />
T2 °C temperature during cooling step<br />
T3 °C temperature after cooliung step<br />
TA °C annealing temperature<br />
t min time<br />
t1 min time until cooling step<br />
t2 min time at the end of the cooling step<br />
tN min nucleation time<br />
tP min process time<br />
TS K heating step temperature change<br />
tS min heating step time<br />
V nm 3 volume<br />
v2 Kmin −1 cooling rate<br />
vG <strong>µm</strong>/ min grain growth velocity<br />
vG,0 <strong>µm</strong>/ min final constant, grain growth velocity<br />
µ eV/atom chemical potential<br />
∆µ eV/atom chemical potential difference<br />
µa−Si eV/atom chemical potential of amorphous Si<br />
µc−Si eV/atom chemical potential of crystalline Si<br />
µj eV/atom chemical potential of particle j<br />
µSi eV/atom chemical potential of silicon<br />
µSi,0 eV/atom chemical potential of silicon at the saturation con-<br />
centration<br />
X eV/ atom angular dependant coefficient in preferential orien-<br />
tation model<br />
x m distance variable<br />
ω s −1 coefficient of the stabilization rate of a critical clus-<br />
ter f
Bibliography<br />
[1] M. Rogol, S. Doi, and A. Wilkinson. Sun screen - investment opportunities<br />
in solar power, 2004.<br />
[2] M. Schmela and Siemer. J. Wachstum um die wette. Photon, 0405:28,<br />
2005.<br />
[3] W. Shockley and H.J. Queisser. Detailed balance limit of efficiency of p-n<br />
junction solar cells. J. Appl. Phys., 32(3):510–519, 1961.<br />
[4] M. A. Green. Third generation photovoltaics: solar cells for 2020 and be-<br />
yond. Physica E, 14:65–70, 2002.<br />
[5] M. A. Green. Photovoltaics: technology overview. Energy Policy, 28:989–<br />
998, 2000.<br />
[6] D.L. Staebler and C.R. Wronski. Reversible conductivity changes in<br />
discharge-produced amorphous si. Appl. Phys. Lett., 31(4):292–294, 1977.<br />
[7] K. Yamamoto, A. Nakajima, M. Yoshimi, T. Sawada, S. Fukuda, T. Suezaki,<br />
M. Ichikawa, Y. Koi, M. Goto, T. Meguro, T. Matsuda, M. Kondo, T. Sasaki,<br />
and Y. Tawada. A high efficiency thin film silicon solar cell and module.<br />
Solar Energy, 77:939–949, 2004.<br />
[8] T. Matsuyama, N. Terada, T. Baba, T. Sawada, S. Tsuge, K. Wakisaka, and<br />
S. Tsuda. High-quality polycrystalline silicon thin film prepared by a solid<br />
phase crystallization method. J. Non-Cryst. Solids, 198-200(2):940–944,<br />
1996.
[9] O. Nast, T. Puzzer, L. M. Koschier, A. B. Sproul, and S. R. Wenham.<br />
Aluminum-induced crystallization of amorphous silicon on glass substrates<br />
above and below the eutectic temperature. Appl. Phys. Lett., 73(22):3214–<br />
3216, 1998.<br />
[10] M. Volmer. Kinetik der Phasenbildung, volume 4 of Die Chemische Reaktion.<br />
Verlag von Theodor Steinkopff, Leipzig, 1939.<br />
[11] D.A. Porter and K.E. Easterling. Phase Transformations in Metals and Alloys.<br />
Chapman & Hall, London, UK, 2nd edition, 1992.<br />
[12] C. Spinella, S. Lombardo, and F. Priolo. Crystal grain nucleation in amor-<br />
phous silicon. J. Appl. Phys., 84(10):5383–5414, 1998.<br />
[13] A.E. Kolmogorov. On statistic theory of crystallization of metals. Izv. Akad.<br />
Nauk SSR Ser. Fiz. Mat. Nauk, 1:355, 1937. original title translated from<br />
russian.<br />
[14] W.A. Johnson and R.F. Mehl. Reaction kinetics in processes of nucleation<br />
and growth. Trans. Am. Inst. Min. Metall. Pet. Eng., 135:416–442, 1939.<br />
[15] M. Avrami. Kinetics of phase change. i. J. Chem. Phys., 7:1103–1112, 1939.<br />
[16] M. Avrami. Kinetics of phase change. ii. J. Chem. Phys., 8:212–224, 1940.<br />
[17] M. Avrami. Granulation, phase change, and microstructure. J. Chem. Phys.,<br />
9:177–184, 1941.<br />
[18] M. Castro, F. Dominguer-Adame, A. Sanchez, and T. Rodriguez. Model for<br />
crystallization kinetics: Deviations from kolmogorov-johnson-mehl-avrami<br />
kinetics. Appl. Phys. Lett., 75(15):2205–2207, 1999.<br />
[19] C. Sagui and M. Grant. Theory of nucleation and growth during phase<br />
separation. Phys. Rev. E., 59(4):4175–4187, 1999.
[20] R.W. Bower, R. Baron, J.W. Mayer, and O.J. Marsh. Deep (1-10 µ) pene-<br />
tration of ion-implanted donors in silicon. Appl. Phys. Lett., 9(5):203–205,<br />
1966.<br />
[21] L. Csepregi, E.F. Kennedy, and J.W. Mayer. Substrate-orientation depen-<br />
dence of the epitacial regrowth rate from si-implanted amorphous si. J.<br />
Appl. Phys., 49(7):3906–3911, 1978.<br />
[22] L. Csepregi, E.F. Kennedy, T.J. Gallagher, and J.W. Mayer. Reordering of<br />
amorphous layers of si implated with 31p, 75as, and 11b ions. J. Appl.<br />
Phys., 48(10):4234–4240, 1977.<br />
[23] E.F. Kennedy, L. Csepregi, and J.W. Mayer. Influence of 16o, 12o, 14n, and<br />
noble gases on the crystallization of amorphous si layers. J. Appl. Phys.,<br />
48(10):4241–4246, 1977.<br />
[24] C.S. Pai and S.S. Lau. Comparison of electronic effects and stress effects in<br />
enhancing regrowth rate of ion-implanted amorphous si. Appl. Phys. Lett.,<br />
47(11):1214–1216, 1985.<br />
[25] U. Köster. Crystallization and decompostion of amorphous semiconductors.<br />
Adv. Colloid Interface Sci., 10:129–172, 1979.<br />
[26] R.B. Iverson and R. Reif. Recrystallization of amorphized polycrystalline<br />
silicon films of sio2: Temperature dependence of crystallization parameters.<br />
J. Appl. Phys., 62(5):1675–1681, 1987.<br />
[27] E.P. Donovan, F. Spaepen, D. Turnbull, J.M. Poate, and D.C. Jacobson.<br />
Calorimetric studies of crystallization relaxation of amorphous si and ge<br />
prepared by ion implantation. J. Appl. Phys., 57(6):1795–1784, 1985.<br />
[28] M. A. Green, P. A. Basore, N. Chang, D. Clugston, R. Egan, R. Evans,<br />
D. Hogg, S. Jarnason, M. Keevers, P. Lasswell, J. O’Sullivan, U. Schubert,<br />
A. Turner, S. R. Wenham, and T. Young. Crystalline silicon on glass (csg)<br />
thin-film solar cell modules. Solar Energy, 77:857–863, 2004.
[29] J.O. McCaldin and H. Sankur. Diffusivity and solubility of si in the al met-<br />
allization of intergrated circuits. Appl. Phys. Lett., 19(12):524–527, 1971.<br />
[30] A. Hiraki. A model on the mechanism of room temperature interface inter-<br />
mixing reaction in various metal-semiconductor coupels: What triggers the<br />
reaction? J. Electrochem. Soc., 127:2662, 1980.<br />
[31] A. Hiraki. Recent developments on metal-silicon interfaces. Appl. Surf. Sci.,<br />
56-58:370–381, 1992.<br />
[32] K.N. Tu. Selective growth of metal-rich silicide of near-noble metals. Appl.<br />
Phys. Lett., 27(4):221–224, 1975.<br />
[33] S. R. Herd, P. Chaudhari, and M. H. Brodsky. Metal contact induced crystal-<br />
lization in films of amorphous silicon and germanium. J. Non-Cryst. Solids,<br />
7:309–327, 1972.<br />
[34] K.H. Kim, J.H. Oh, E.H. Kim, and J. Jang. Formation and analysis of disk-<br />
shaped grains by ni-mediated crystallization of amorphous silicon. J. Vac.<br />
Sci. Technol. A, 22(6):2469–2472, 2004.<br />
[35] P. Joubert, L. Henry, and D. Riviere. Solid phase growth of disk-shaped<br />
ptsi clusters on lightly nitridized si substrates. J. Appl. Phys., 56(10):2734–<br />
2739, 1984.<br />
[36] Jong-Hyun Choi, Seung-Soo Kim, Jun-Hyuk Cheon, Seong-Jin Park, Yong-<br />
Duck Son, and Jin Jang. Kinetics of ni-mediated crystallization of a-si<br />
through a sinx cap layer. J. Electrochem. Soc., 151(7):G448–G451, 2004.<br />
[37] W.S. Sohn, J.H. Choi, K.H. Kim, J.H. Oh, and S.S Kim. Crystalline orien-<br />
tation of polycrystalline silicon with disklike grains produced by silicide-<br />
mediated crystallization of amorphous silicon. J. Appl. Phys., 94(7):4326–<br />
4331, 2003.
[38] J. Jang, J.Y. Oh, S.K. Kim, Y.J. Choi, S.Y. Yoon, and C.O. Kim. Electric-<br />
field-enhanced crystallization of amorphous silicon. nature, 395:481–483,<br />
1998.<br />
[39] C. Hayzelden, J. L. Batstone, and R. C. Cammarata. In situ transmission<br />
electron microscopy studies of silicide-mediated crystallization of amor-<br />
phous silicon. Appl. Phys. Lett., 60(2):225–227, 1992.<br />
[40] G. Ottaviani, D. Sigurd, V. Marrello, J.W. Mayer, and J.O. McCaldin. Crys-<br />
tallization of ge and si in metal films. J. Appl. Phys., 45(4):1730–1739,<br />
1974.<br />
[41] T.J. Konno and R. Sinclair. Crystallization of silicon in<br />
aluminum/amorphous-silicon multilayers. Philosophical Magazine B,<br />
66(6):749–765, 1992.<br />
[42] T.J. Konno and R. Sinclair. Metal-contact-induced crystallization of semi-<br />
conductors. Mat. Sci. Eng. A, 179-180(1):426–432, 1994.<br />
[43] S.M. Sze. Physics of Semiconductor Devices. Wiley, Singapore, 2nd edition,<br />
1981.<br />
[44] R.L. Boatright and J.O. McCaldin. Solid-state growth of si to produce planar<br />
surfaces. J. Appl. Phys., 47(6):2260–2262, 1976.<br />
[45] J.S. Best and J.O. McCaldin. Interfacial impurities and the reaction between<br />
si and evaporated al. J. Appl. Phys., 46(9):4071–4072, 1975.<br />
[46] G. Majni and G. Ottaviani. Large-area unifomr growth of si through<br />
al film by solid phase epitaxy. Appl. Phys. Lett., 31(2):125–126, 1977.<br />
[47] G. Majni and G. Ottaviani. Substrate effects in si-al solid phase epitaxial<br />
growth. Thin Solid Films, 55:235–242, 1978.<br />
[48] G. Majni and G. Ottaviani. Growth kinetics of si through an al layer<br />
by solid phase epitaxy. J. Cryst. Growth, 46:119–124, 1979.
[49] G. Majni and G. Ottaviani. Solid phase epitaxial growth of si through al<br />
film. J. Cryst. Growth, 45:132–137, 1978.<br />
[50] B-Y. Tsaur, G.W. Turner, and J.C.C Fan. Efficient si solar cell by low-<br />
temperature solid-phase epitaxy. Appl. Phys. Lett., 39(9):749–751, 1981.<br />
[51] L. M. Koschier, S. R. Wenham, M. Gross, T. Puzzer, and A. B. Sproul. Low<br />
temperature junction and back surface field formation for photovoltaic de-<br />
vices. In Proc. of the 2nd World Conference and Exhibition on Photovoltaic<br />
Energy Conversion, pages 1539–1542, Vienna, Austria, 1998.<br />
[52] O. Nast and S. R. Wenham. Elucidation of the layer exchange mechanism<br />
in the formation of polycrystalline silicon by aluminum-induced crystalliza-<br />
tion. J. Appl. Phys., 88(1):124–132, 2000.<br />
[53] O. Nast. The aluminium-induced layer exchange forming polycrystalline sil-<br />
icon on glass for thin-film solar cells. PhD thesis, Philipps-Universität Mar-<br />
burg, 2000.<br />
[54] O. Nast and A. J. Hartmann. Influence of interface and al structure on layer<br />
exchange during aluminum-induced crystallization of amorphous silicon. J.<br />
Appl. Phys., 88(2):716–724, 2000.<br />
[55] P. Widenborg and A. G. Aberle. Surface morphology of poly-si films made<br />
by aluminium-induced crystallisation on glass substrates. J. Cryst. Growth,<br />
242:270–282, 2002.<br />
[56] J. Schneider. Oberflächenpräparation von ALILE-Saatschichten für<br />
polykristalline Silizium-Dünnschichtsolarzellen. Diplomarbeit, Technische<br />
Universität <strong>Berlin</strong>, 2002.<br />
[57] W. Fuhs, S. Gall, B. Rau, M. Schmidt, and J. Schneider. A novel route to a<br />
polycrystalline silicon thin-film solar cell. Solar Energy, 77:961–968, 2004.<br />
in press.
[58] N.-P. Harder, T. Puzzer, P. Widenborg, S. Oelting, and A. G. Aberle. Ion-<br />
assisted low-temperature silicon epitaxy on randomly textured seed layers<br />
on glass. Cryst. Growth Des., 3(5):767–771, 2003.<br />
[59] A.G. Aberle, P.I. Widenborg, D. Song, A. Straub, M.L. Terry, T. Walhs,<br />
A. Sproul, P. Campbell, D. Inns, and B. Beilby. Recent advances in poly-<br />
crystalline silicon thin-film solar cells on glass at unsw. In Proc. of the 31st<br />
IEEE PV Conference, Orlando, USE, 2005. in press.<br />
[60] S. Gall, J. Schneider, J. Klein, M. Muske, B. Rau, E. Conrad, I. Sieber,<br />
W. Fuhs, C. Ornaghi, D. Van Gestel, I. Gordon, K. Van Nieuwenhuysen,<br />
G. Beaucarne, J. Poortmans, M. Stöger-Pollach, J. Bernardi, P. Schattschnei-<br />
der, Y. Wang, and O. Van der Biest. Crystalline silicon thin-film solar cells<br />
on foreign substrates: The european project meteor. In Proc. of the 19th Eu-<br />
ropean Photovoltaic Solar Energy Conference, pages 475–478, Paris, France,<br />
2004.<br />
[61] I. Gordon, D. Van Gestel, K. Van Nieuwenhuysen, L. Carnel, G. Beaucarne,<br />
and J. Poortmans. Thin-film polycrystalline silicon solar cells on ceramic<br />
substrates by aluminium-induced crystallization. Thin Solid Films, 2005. in<br />
press.<br />
[62] L. Carnel, I. Gordon, K. Van Nieuwenhuysen, D. Van Gestel, G. Beaucarne,<br />
and J. Poortmans. Defect passivation in chemical vapour deposited fine<br />
grained polycrystalline silicon by plasma hydrogenation. Thin Solid Films,<br />
2005. in press.<br />
[63] J. Klein, J. Schneider, M. Muske, R. Heimburger, S. Gall, and W. Fuhs.<br />
Aluminium-induced crystallisation of amorphous silicon: parameter varia-<br />
tion for optimisation of the process. In Proc. of the 31st Photovoltaic Spe-<br />
cialits Conference, Orlando, USA, 2005. in press.<br />
[64] B. Rau, I. Sieber, J. Schneider, M. Muske, M. Stöger-Pollach, P. Schattschnei-<br />
der, S. Gall, and W. Fuhs. Low-temperature si epitaxy on large-grained
polycrystalline seed layers by electron-cyclotron resonance chemical vapor<br />
deposition. J. Cryst. Growth, 270(3-4):396–401, 2004.<br />
[65] K. Petter, I. Sieber, B. Rau, S. Brehme, K. Lips, and W. Fuhs. Structural de-<br />
fect and photoluminescence of epitaxial si films grown at low temperatures.<br />
Thin Solid Films, 2005. in press.<br />
[66] M. Stöger-Pollach. Advanced methods in electron enery loss spectrometry and<br />
energy filtered transmission electron microscopy: Application to the Aluminum<br />
Induced Layer Exchange in Si thin film solar cells. PhD thesis, Technische<br />
Universität Wien, 2004.<br />
[67] H. Kim, D. Kim, G. Lee, D. Kim, and S. H. Lee. Polycrystalline si films<br />
formed by al-induced crystallization (aic) with and without al oxides at<br />
al/a-si interface. Sol. Energy Mater. Sol. Cells, 74:323–329, 2002.<br />
[68] T. Ito, H. Fukushima, and M. Yamaguchi. Fabrication of thin-film poly-<br />
crystalline silicon solar cells by silane-gas-free process using aluminium-<br />
induced crystallization. Jpn. J. Appl. Phys., 42(Part 1, No. 4A):1526–1532,<br />
2003.<br />
[69] T. Ito, H. Fukushima, and M. Yamaguchi. Efficiency potential of thin film<br />
polycrystalline silicon solar cells by silane-gas-free process using aluminium<br />
indced crystallization. Sol. Energy Mater. Sol. Cells, 83:91–99, 2004.<br />
[70] E. Pihan, A. Slaoui, P. Roca i Carbarrocas, and A. Focsa. Polycrystalline<br />
silicon films by aluminium-induced crystallisation: growth proces vs. silicon<br />
deposition method. Thin Solid Films, 451-452:328–333, 2004.<br />
[71] A. Slaoui, A. Focsa, E. Pihan, G. Beaucarne, and J. Poortmans. Formation<br />
of thin film polycrystalline silicon on ceramic substrates for photovoltaics.<br />
In Proc. of the 31st Photovoltaic Specialists Conference, Orlando, USA, 2005.<br />
in press.
[72] G. Ekanayake, S. Summers, and H. S. Reehal. Influence of argon on crys-<br />
talline silicon film growth by ecr plasma cvd for solar cells. In Kosuke<br />
Kurokawa, editor, Proc. of the 3rd WCPEC, volume B, pages 1867–1870,<br />
Osaka, Japan, 2003. WCPEC-3 Organising Commitee. latest news paper<br />
5LN-C-02.<br />
[73] G. Ekanayake, Z. Lu, and H. S. Reehal. Polycrystalline si film formation<br />
by aluminium-induced crystallisation. In Proc. of the EPVSEC 19th, Paris,<br />
2004. JS.<br />
[74] D. Dimova-Malinovska, O. Angelov, M. Sendova-Vassileva, M. Kamenova,<br />
and J.-C. Pivin. Polycrystalline silicon thin films on glass substrate. Thin<br />
Solid Films, 451-452:303–307, 2004.<br />
[75] D. Dimova-Malinovska, O. Angelov, M. Sendova-Vassileva, V. Grigorov, and<br />
M. Kamenova. Structural properties of poly-si films obtained by aluminium<br />
induced crystallisation in different atmospheres. In Proc. of the 19th Eu-<br />
ropean Photovoltaic Solar Energy Conference, pages 371–373, Paris, France,<br />
2004.<br />
[76] M. Gjukic, M. Buschbeck, R. Lechner, and M. Stutzmann. Aluminum-<br />
induced crystallization of amorphous silicon-germanium thin films. Appl.<br />
Phys. Lett., 85(11):2134–2136, 2004.<br />
[77] M. Gjukic, R. Lechner, M. Buschbeck, and M. Stutzmann. Optical and elec-<br />
trical properties of polycrystalline silicon-germanium thin films prepared by<br />
aluminum-induced layer exchange. Appl. Phys. Lett., 86(062115):3 pages,<br />
2005.<br />
[78] D.L. Young, P. Stradins, E. Iwaniczko, B. To, R. Reedy, Y. Yan, H. M. Branz,<br />
J. Lohr, M. Alvarez, J. Booske, A. Marconnet, and Q. Wang. Solid phase<br />
crystallization of hot-wire cvd amorphous silicon films. In Proc. of the MRS<br />
Spring meeting, San Francisco, USA, 2005. in press.
[79] P. Stradins, D.L. Young, H. M. Branz, M. Page, and Q. Wang. Real time<br />
monitoring of the crystallization of hydrogenated amorphous silicon. In<br />
Proc. of the MRS Spring Meeting, San Francisco, USA, 2005. in press.<br />
[80] C.E. Richardson, B.M. Kayes, M.J. Dicken, and H. A. Atwater. A phase dia-<br />
gram of low temperature epitaxial silicon grown by hot-wire chemical vapor<br />
deposition for photovoltaic devices. In Proc. of the MRS Spring Meeting, San<br />
Francisco, USA, 2005. in press.<br />
[81] O. Nast, T. Puzzer, C. T. Chou, and M. Birkholz. Grain size and structure<br />
analysis of polycrystalline silicon on glass formed by aluminum-induced<br />
crystallization for thin-film solar cells. In Proc. of the 16th European Photo-<br />
voltaic Solar Energy Conference, pages 292–297, Glasgow, UK, 2000.<br />
[82] O. Nast, S. Brehme, S. Pritchard, A. G. Aberle, and S. R. Wenham.<br />
Aluminium-induced crystallisation of silicon on glass for thin-film solar<br />
cells. Sol. Energy Mater. Sol. Cells, 65:385–392, 2001.<br />
[83] J. Schwarzkopf, B. Selle, W. Bohne, J. Röhrich, I. Sieber, and W. Fuhs.<br />
Disorder in silicon films grown epitaxially at low temperature. J. Appl.<br />
Phys., 93(9):5215, 2003.<br />
[84] P. Reinig, F. Fenske, W. Fuhs, and B. Selle. Crystalline silicon films grown<br />
by pulsed dc magnetron sputtering. J. Non-Cryst. Solids, 299-302:128–132,<br />
2002.<br />
[85] A. Straub, P. Widenborg, A. B. Sproul, Y. Huang, N.-P. Harder, and A. G.<br />
Aberle. Fast and non-destructive assessement of epitaxial quality of poly-<br />
crystalline silicon films on glass by optical measurements. J. Cryst. Growth,<br />
265:168–173, 2004.<br />
[86] S.I. Raider, R. Flitsch, and M.J. Palmer. Oxide growth on etched silicon in<br />
air at room temperature. J. Electrochem. Soc., 122(3):413–418, 1975.
[87] H.R. Philipp and E.A. Taft. An optical characterization of native oxides and<br />
thin thermal oxides on silicon. J. Appl. Phys., 53(7):5224–5229, 1982.<br />
[88] D.J. Prior, A.P. Boyle, F. Brenker, M.C. Cheadle, A. Day, G. Lopez, L. Pe-<br />
ruzo, G.J. Potts, S. Reddy, R. Spiess, N.E. Timms, P. Trimby, J. Wheeler,<br />
and L. Zetterström. The application of electron backscatter diffraction and<br />
orientation contrast imaging in the sem to textural problems in rocks. Amer-<br />
ican Mineralogist, 84:1741–1759, 1999.<br />
[89] S. Gall, J. Schneider, M. Muske, I. Sieber, O. Nast, and W. Fuhs. Poly-si<br />
seeding layers by aluminium-induced crystallisation. In Proc. of the PV in<br />
Europe, pages 87–90, Rome, Italy, 2002.<br />
[90] R. B. Bergmann, C. Zaczek, N. Jensen, S. Oelting, and J. H. Werner. Low-<br />
temperature si epitaxy with high deposition rate using ion-assisted deposi-<br />
tion. Appl. Phys. Lett., 72(23):2996–2998, 1998.<br />
[91] J. Platen, B. Selle, S. Brehme, U. Zeimer, and W. Fuhs. Low-temperature<br />
epitaxial growth of si by electron cyclotron resonance chemical vapor de-<br />
position. Thin Solid Films, 381:22–30, 2001.<br />
[92] J.M.E. Harper, S.E. Hörnström, O. Thomas, A. Charai, and L. Krusin-<br />
Elbaum. Mechanism for success or failure of diffusion barriers between<br />
aluminum and silicon. J. Vac. Sci. Technol. A, 7(3):875–881, 1989.<br />
[93] J.S. Reid, E. Kolawa, C.M. Garland, M.-A. Nicolet, F. Cardone, D. Gupta,<br />
and R.P. Ruiz. Amorphous (mo, ta, or w)-si-n diffusion barriers for al met-<br />
allizations. J. Appl. Phys., 79(2):1109–1115, 1996.<br />
[94] S. Gall, M. Muske, I. Sieber, O. Nast, and W. Fuhs. Aluminum-induced crys-<br />
tallization of amorphous silicon. J. Non-Cryst. Solids, 299-302:741, 2002.<br />
[95] A. Aberle, P. Widenborg, A. Straub, D.-H. Neuhaus, O. Hartley, and N.-P.<br />
Harder. Fabrication method for crystalline semiconductor films on foreign<br />
substrates. patent application published in WO 2004/033769 A1.
[96] Al-si (aluminium - silicon). In B. Predel, editor, Group IV Physical Chemistry,<br />
volume 5. Landoldt-Börnstein, 1991.<br />
[97] C. Zener. Theory of growth of spherical precipitates from solid solution. J.<br />
Appl. Phys., 40:950–953, 1949.<br />
[98] G. J. van Gurp. Diffusion-limited si precipitation in evaporated al/si films.<br />
J. Appl. Phys., 44(5):2040–2050, 1973.<br />
[99] D.J. Eaglesham, A.E. White, L.C. Feldman, N. Mriya, and D.C. Jacobson.<br />
Equlibrium shape of si. Phys. Rev. Lett., 70(11):1643–1646, 1993.<br />
[<strong>100</strong>] L.P.H. Jeurgens, W.G. Sloof, F.D. Tichelar, and E.J. Mittemeijer. Structure<br />
and morphology of aluminium-oxide films formed by thermal oxidation of<br />
aluminium. Thin solid films, 418:89–101, 2002.
list of publications<br />
journal papers<br />
J. Schneider, J. Klein, M. Muske, S. Gall, and W. Fuhs, ’Depletion regions in the<br />
aluminum-induced layer exchange process crystallizing amorphous Si’, Applied Physics<br />
Letters, accepted.<br />
J. Schneider, R. Heimburger, J. Klein, M. Muske, S. Gall, and W. Fuhs, ’Aluminum-<br />
induced crystallization of amorphous silicon: influence of temperature profiles’, Thin<br />
Solid Films, article in press.<br />
J. Schneider, J. Klein, M. Muske, S. Gall, and W. Fuhs, ’Aluminum-induced crystal-<br />
lization of amorphous silicon: Preparation effect on growth kinetics’, J. Non-Cryst.<br />
Solids 338-340, (2004), 127.<br />
B. Rau, I. Sieber, J. Schneider, M. Muske, M. Stöger-Pollach, P. Schattschneider, S.<br />
Gall, and W. Fuhs, ’Low-temperature Si epitaxy on large-grained polycrystalline seed<br />
layers by electron-cyclotron resonance chemical vapor deposition’, J. Cryst. Growth<br />
270, (2004), 396.<br />
J. Klein, J. Schneider, M. Muske, S. Gall, and W. Fuhs, ’Aluminium-induced crys-<br />
tallisation of amorphous silicon: influence of the aluminium layer on the process’,<br />
Thin Solid Films 451-452, (2004), 481.<br />
W. Fuhs, S. Gall, B. Rau, M. Schmidt, and J. Schneider, ’A novel route to a polycrys-<br />
talline silicon thin-film solar cell’, Solar Energy 77, (2004), 961.
F. Brunner, A. Braun, P. Kurpas, J. Schneider, J. Würfl, and M. Weyers, ’Investi-<br />
gation of short-term current gain stability of GaInP/GaAs-HBTs grown by MOVPE’,<br />
Microelectronics Reliability 43, (2003), 839.<br />
conference contributions<br />
J. Schneider, A. Schneider, A. Sarikov, J. Klein, M. Muske, S. Gall, W. Fuhs, ’Alu-<br />
minium-induced crystallisation: nucleation and growth process’, ICANS 21, Lisbon,<br />
Portugal, (2005), to be published in Journal of Non-Crystalline Solids.<br />
J. Schneider, I. Sieber, A. Sarikov, J. Klein, M. Muske, S. Gall, W. Fuhs, ’Crystal<br />
orientation of silicon thin films made by aluminum-induced layer exchange’, ACCGE<br />
16th, Big Sky, Montana, USA, (2005), Abstract #145, to be published in Journal<br />
of Crystal Growth.<br />
Andrey Sarikov, Jens Schneider, Juliane Klein, Martin Muske, Stefan Gall, ’Theoret-<br />
ical study of initial stages of the aluminium-induced layer-exchange process’, ACCGE<br />
16th, Big Sky, Montana, USA, (2005), Abstract #201, to be published in Journal<br />
of Crystal Growth.<br />
S. Gall, J. Schneider, J. Klein, M. Muske, B. Rau, E. Conrad, I. Sieber, W. Fuhs,<br />
D. Van Gestel, I. Gordon, K. Van Nieuwenhuysen, L. Carnel, J. Irigoyen, G. Beau-<br />
carne, J. Poortmans, M. Stöger-Pollach, P. Schattschneider, Y. Wang, O. Van Der<br />
Biest, ’Development of polycrystalline silicon thin-film solar cells within the european<br />
project METEOR’, 20th European Photovoltaic Solar Energy Conference, Barcelona,<br />
Spain, (2005), 2CV.3.18.
B. Rau, J. Klein, J. Schneider, E. Conrad, I. Sieber, S. Gall, W. Fuhs, M. Stöger-<br />
Pollach, P. Schattschneider, ’Polycrystalline Si Thin-Film Solar Cells on Glass by Epi-<br />
taxial Thickening of Seed Layers Using ECRCVD’, 20th European Photovoltaic Solar<br />
Energy Conference, Barcelona, Spain, (2005), 2CV.4.36.<br />
S. Gall, J. Schneider, J. Klein, K. Hübener, M. Muske, B. Rau, E. Conrad, I. Sieber,<br />
K. Petter, K. Lips, M. Stöger-Pollach, P. Schattschneider, W. Fuhs, ’Large-grained<br />
polycrystalline silicon on glass for thin-film solar cells’, EMRS, Strassbourg, France,<br />
(2005), F-II.01, invited talk, to be published in Thin Solid Films. conference con-<br />
tributions.<br />
J. Schneider, J. Klein, A. Sarikov, M. Muske, S. Gall, and W. Fuhs, ’Suppression of<br />
nucleation during the aluminum-induced layer exchange process’, Proc. of the 2005<br />
MRS Spring Meeting, San Francisco, USA, (2005), in press.<br />
S. Gall, J. Schneider, J. Klein, M. Muske, B. Rau, E. Conrad, I. Sieber, W. Fuhs, D.<br />
Van Gestel, I. Gordon, G. Beaucarne, J. Poortmans, M. Stöger-Pollach, P. Schatt-<br />
schneider, ’Large-grained polycrystalline silicon thin-film solar cells using AIC seed<br />
layers’, Proc. of the 31st IEEE Photovoltaic Specialists Conference, Orlando, USA,<br />
(2005), in press.<br />
J. Klein, J. Schneider, M. Muske, R. Heimburger, S. Gall, W. Fuhs, ’Aluminium-<br />
induced crystallisation of amorphous silicon: parameter variation for optimisation of<br />
the process’, Proc. of the 31st IEEE Photovoltaic Specialists Conference, Orlando,<br />
USA, (2005), in press.<br />
J. Schneider, J. Klein, M. Muske, K. Hübener, S. Gall, and W. Fuhs, ’Aluminium-
induced crystallisation of amorphous silicon: interface influence on grain growth’,<br />
Proc. of the 19th European Photovoltaic Solar Energy Conference, Paris, France,<br />
(2004), 1145.<br />
B. Rau, J. Schneider, M. Muske, I. Sieber, S. Gall, M. Stöger-Pollach, P. Schattschnei-<br />
der, and W. Fuhs, ’Epitaxial Si growth on polycrystalline Si seed layers at low tem-<br />
perature’, Proc. of the 19th European Photovoltaic Solar Energy Conference, Paris,<br />
France, (2004), 1131.<br />
J. Klein, J. Schneider, M. Muske, S. Gall, and W. Fuhs, ’Aluminium-Induced Crys-<br />
tallisation of amorphous Silicon: The influence of the aluminium layer on the pro-<br />
cess’, Proc. of the 19th European Photovoltaic Solar Energy Conference, Paris,<br />
France, (2004), 1135.<br />
S. Gall, J. Schneider, J. Klein, M. Muske, B. Rau, E. Conrad, I. Sieber, W. Fuhs, C.<br />
Ornaghi, D. Van Gestel, I. Gordon, K. Van Nieuwenhuysen, G. Beaucarne, J. Poort-<br />
mans, M. Stöger-Pollach, J. Bernardi, P. Schattschneider, Y. Wang, and O. Van der<br />
Biest, ’Crystalline Silicon thin-film solar cells on foreign substrates: The european<br />
project METEOR’, Proc. of the 19th European Photovoltaic Solar Energy Confer-<br />
ence, Paris, France, (2004), 475.<br />
J. Schneider, J. Klein, M. Muske, A. Schöpke, S. Gall, and W. Fuhs, ’Aluminium-<br />
induced crystallisation of amorphous silicon: Influence of oxidation conditions’, Proc.<br />
of the 3rd World Conference on Photovoltaic Energy Conversion, Osaka, Japan,<br />
(2003), 106.<br />
S. Gall, J. Schneider, M. Muske, I. Sieber, O. Nast, and W. Fuhs, ’Poly-Si seeding lay-<br />
ers by aluminium-induced crystallisation’, Proc. of the PV in Europe, Rome, Italy,
(2002), 87.<br />
S. Gall, M. Muske, I. Sieber, J. Schneider, O. Nast, and W. Fuhs, ’Polycrystalline<br />
silicon on glass by aluminium-induced crystallization’, Proc. of the 29th IEEE Pho-<br />
tovoltaic Specialists Conference, New Orleans, USA, (2002), 1202.
Acknowledgement<br />
I want to thank Prof. Dr. Christian Boit for accepting my proposal as Ph.D. stu-<br />
dent on an almost blind date; furthermore for being friendly, critical, supportive,<br />
constructive and at al times interested in the progress of my work.<br />
I want to thank Prof. Dr. Walther Fuhs for all the scientific, political and personal<br />
discussions; for all the support throughout my four years at SE1; for many times<br />
proof reading this initially exhausting thesis and for many rides home.<br />
Most and for all I thank Dr. Stefan Gall for supervising my work and for being<br />
a friend; for being honest and true all times; for being both severe and fun; for<br />
being supportive and giving me all these opportunities to present my results to the<br />
scientific community; for all I was able to learn on science and the scientific world;<br />
and of course for the cool time together in Japan.<br />
I want to thank my colleagues and room mates Dr. Juliane Klein and Martin Muske<br />
for all the hilarious times, especially on Friday afternoons. I want to thank Juliane<br />
especially for all the on and off topic discussions. I want to thank Martin especially<br />
for being the best aluminum-induced layer exchange processer in the world.<br />
I want to thank all students who directly contributed results to my work: Desmond<br />
Low for programming the heating stage controller; Michela DeVincentis for doing<br />
Hall measurements; Robert Heimburger for the heating step experiments; Andreas<br />
Schneider for the cooling step experiments.<br />
I want to thank Dr. Björn Rau for doing all the work. No really, it seems to me<br />
that Björn did all the work on making and measuring solar cells, helping in report<br />
writing, proof reading of papers, revising posters and talks... I want to thank Björn<br />
for remaining calm, friendly and in a good mood during all this stress.<br />
I want to thank Dr. Andrey Sarikov for theoretical discussions of the ALILE process.<br />
I want to thank Kati Hübener for caring and the interesting discussions on the<br />
ALILE process.<br />
I want to thank all members of the METEOR project for the interesting coopera-
tion. Special thank’s go to Dr. Michael Stöger-Pollach for many TEM images and<br />
discussions on diffusion paths.<br />
I want to thank Prof. Dr. Hari Reehal and Thomas Quinn for EBSD measurements<br />
and discussions.<br />
I want to thank Ina Sieber for the SEM and EBSD measurements.<br />
I want to thank Gisela Keiler, Kerstin Jacob and Sabrina Kreutzmann for tons of<br />
sample and substrate treatments.<br />
I want to thank Dr. Eveline Rudigier for being the first proof reader of this thesis.<br />
I admire your calm tenacity on working your way through this horrible mess (I<br />
hope the figure captions are satisfactory, now).<br />
I want to thank the staff of SE1 for the nice and friendly atmosphere at HMI in<br />
Adlershof. Special thanks to the other Ph.D. students at SE1 for regularly attending<br />
the ’Doktorandentreffen’. You know that without you, this would not have been<br />
possible.<br />
Particularly, I want to thank my family and friends for supporting and encouraging<br />
me and also for reminding me, that there are more important things in life than<br />
work, science and solar power. I am a very lucky person knowing all of you.
curriculum vitae: Jens Schneider, born in Calw 09/06/1975<br />
since 09/02 PhD student,<br />
09/02 participant,<br />
01/02-08/02 Diplom,<br />
Technische Universität <strong>Berlin</strong>, Hahn-Meitner-Insitut <strong>Berlin</strong>,<br />
’Aluminum-induced crystallization of amorphous silicon for<br />
seed layers in polycrystalline silicon thin film solar cells’<br />
Dresdner Sommerschule Mikroelektronik<br />
Technische Universität <strong>Berlin</strong>, Hahn-Meitner-Institut <strong>Berlin</strong>,<br />
’Surface preparation of ALILE seed layers for polycrystalline<br />
silicon thin film solar cells’<br />
10/01-12/01 student assistant,<br />
05/01-09/01 internship,<br />
Hahn-Meitner-Institut <strong>Berlin</strong><br />
02/99-03/01 student assistant,<br />
’Preparation for setup of spectral response measurement’<br />
Ferdinand-Braun-Institut für Höchstfrequenztechnik <strong>Berlin</strong>,<br />
’Device stability measurements on hetero bipolar transistors’<br />
Hahn-Meitner-Institut <strong>Berlin</strong>,<br />
’Scanning probe microscopy induced structuring of silicon’<br />
10/98-08/02 student electrical engineering,<br />
10/97-12/97 internship,<br />
Technische Universität <strong>Berlin</strong><br />
Ecosolar, Ratingen,<br />
’Preparation and installation of photovoltaic home systems’
10/95-09/98 student electrical engineering, (Vordiplom)<br />
06/95 Abitur,<br />
08/92-06/93 exchange student,<br />
Gerhard Mercator Universität Duisburg<br />
Albertus-Magnus-Gymnasium Ettlingen<br />
Meadowdale Highschool, Lynnwood, WA, USA