Trading Report June 2020
Report on trading activity at BSP SouthPool Energy Exchange
Report on trading activity at BSP SouthPool Energy Exchange

You also want an ePaper? Increase the reach of your titles
YUMPU automatically turns print PDFs into web optimized ePapers that Google loves.
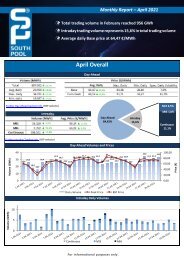
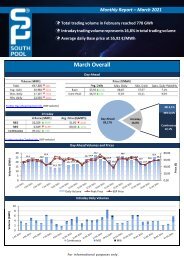
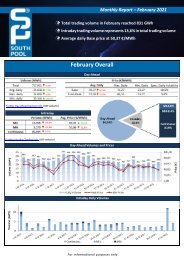
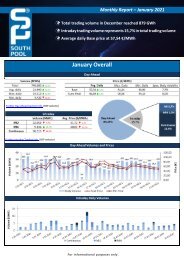
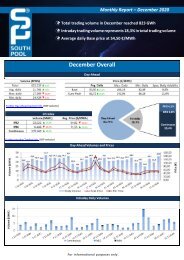
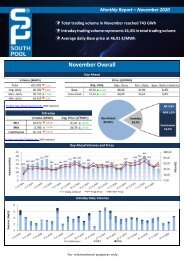
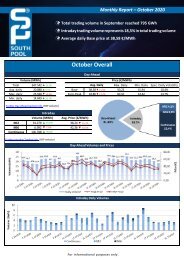
Monthly <strong>Report</strong> – <strong>June</strong> <strong>2020</strong><br />
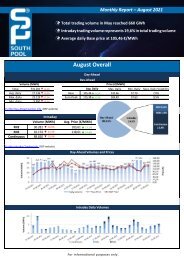
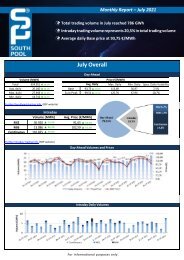
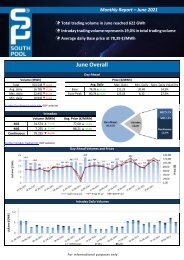
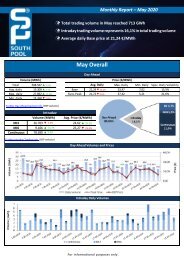
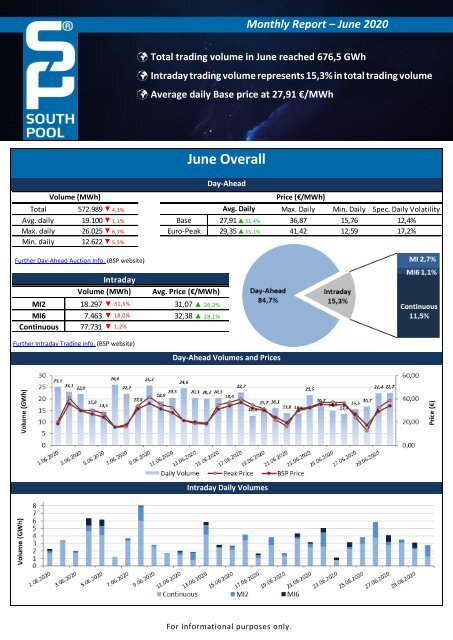
Total trading volume in <strong>June</strong> reached 676,5 GWh<br />
Intraday trading volume represents 15,3% in total trading volume<br />
Average daily Base price at 27,91 €/MWh<br />
Volume (MWh)<br />
Further Day-Ahead Auction Info. (BSP website)<br />
<strong>June</strong> Overall<br />
Day-Ahead<br />
Total 572.989 ▼ 4,3% Avg. Daily Max. Daily Min. Daily Spec. Daily Volatility<br />
Avg. daily 19.100 ▼ 1,1% Base 27,91▲31,4% 36,87 15,76 12,4%<br />
Max. daily 26.025 ▼ 6,7% Euro-Peak 29,35▲35,1% 41,42 12,59 17,2%<br />
Min. daily 12.622 ▼ 5,5%<br />
Intraday<br />
Volume (MWh)<br />
Avg. Price (€/MWh)<br />
MI2 18.297 ▼ 31,5% 31,07 ▲ 26,2%<br />
MI6 7.463 ▼ 18,0% 32,38 ▲ 28,1%<br />
Continuous 77.731 ▼ 1,2%<br />
Price (€/MWh)<br />
Further Intraday <strong>Trading</strong> info. (BSP website)<br />
Day-Ahead Volumes and Prices<br />
Intraday Daily Volumes<br />
For informational purposes only.
Day-Ahead further Auction info.<br />
Average Hourly Volumes and Prices<br />
Hour (AM) 1 2 3 4 5 6 7 8 9 10 11 12<br />
Volume (MWh) 695 645 637 646 675 684 840 848 812 836 832 844<br />
Base price (€/MWh) 26,08 22,87 21,38 19,86 19,76 20,49 26,79 31,07 33,21 31,37 30,07 29,75<br />
Hour (PM) 13 14 15 16 17 18 19 20 21 22 23 24<br />
Volume (MWh) 885 878 830 793 784 803 765 841 890 923 881 834<br />
Base price (€/MWh) 29,42 27,23 25,58 24,52 25,23 28,37 32,00 35,41 34,87 33,18 32,68 28,60<br />
Daily volatility of base price<br />
Cross-Zonal Capacities<br />
SI→IT IT→SI SI→AT AT→SI SI→HR<br />
Offered (MWh) 272.784 454.400 772.936 406.614 632.368 1.527.632 4.066.734<br />
Allocated (MWh) 40.769 194.984 77.054 155.340 241.885 41.922 751.953<br />
% Allocated 14,95% 42,91% 9,97% 38,20% 38,25% 2,74%<br />
Daily Volatility of Base Price<br />
HR→SI<br />
Total<br />
Methodology used for calculation of volatility.<br />
MI2 & MI6 Implicit Auctions<br />
Allocated CZC Values on Slovenian-Italian Border<br />
Cross-Zonal-Capacities<br />
SI-IT IT-SI Total<br />
Offered (MWh) Allocated (MWh) % Allocated 355.197 4.620 1,30% 235.797 11.577 4,91% 590.994<br />
16.197<br />
/<br />
Read more about European Pilot Project<br />
Implicit Intraday Auctions (MI2 & MI6)<br />
Intraday Continuous <strong>Trading</strong><br />
Volumes by Products<br />
For informational purposes only.
Past 12 Months Trade Information<br />
Day-Ahead Auction<br />
Avg. Monthly Volume (MWh) 683.421<br />
Avg. Daily Volume (MWh) 22.407<br />
Avg. Base Price (€/MWh) 40,89<br />
Avg. Euro-Peak Price (€/MWh) 45,21<br />
Avg. SI-IT offered (MWh)/Avg. % Allocated 362.065 / 31,4%<br />
Avg. IT-SI offered (MWh)/Avg.% Allocated 463.375 / 33,8%<br />
Avg. SI-AT offered (MWh)/Avg. % Allocated 814.764 / 3,5%<br />
Avg. AT-SI offered (MWh)/Avg. % Allocated 464.771 / 71,2%<br />
Avg. SI-HR offered (MWh)/Avg. % Allocated 771.826 / 31,6%<br />
Avg. HR-SI offered (MWh)/Avg. % Allocated 1.415.866 / 4,8%<br />
Day-Ahead Market Volumes and Prices<br />
Intraday Continuous <strong>Trading</strong><br />
Avg. Monthly Volume (MWh) 49.651<br />
Number of trades 13.975<br />
MI2 & MI6 Implicit Auctions<br />
Avg. Monthly volume MI2 (MWh) 31.172<br />
Avg. Monthly volume MI6 (MWh) 9.206<br />
Avg. SI-IT offered (MWh)/Avg. % Allocated 382.700 / 3,4%<br />
Avg. IT-SI offered (MWh)/Avg.% Allocated 248.787 / 4,6%<br />
Intraday Volumes (MWh)<br />
Total Volume in the past 12 months Continuous ■ MI2 ■ MI6 ■<br />
Jul. 19 9.834 34.572 11.544<br />
Aug. 19 13.075 26.922 5.042<br />
Sep. 19 12.887 27.784 5.345<br />
Oct. 19 7.756 32.170 9.045<br />
Nov. 19 28.771 26.380 5.879<br />
Dec. 19 98.311 28.693 11.110<br />
635.458<br />
Jan. 20 84.528 36.402 6.842<br />
Feb. 20 73.982 34.742 11.831<br />
350.946<br />
Mar. 20 77.947 30.378 7.996<br />
Apr. 20 71.949 27.901 8.008<br />
May. 20 78.690 26.703 9.106<br />
99.212<br />
Jun. 20 77.731 18.297 7.463<br />
Absolute Difference Between MI and Day-Ahead Prices & MI Offered Cross-Zonal Capacities<br />
*Cross-Zonal Capacities not allocated on Day-Ahead Auction are later offered for MI2 and MI6 Auctions.<br />
For informational purposes only.
BSP Energy Exchange LL C<br />
Dunajska 156<br />
SI-1000 Ljubljana<br />
Slovenija<br />
+386 1 620 76 76<br />
+386 1 620 76 77<br />
www.bsp-southpool.com<br />
info@bsp-southpool.com<br />
For informational purposes only.