Trading Report July 2020
Report on trading activity at BSP SouthPool Energy Exchange
Report on trading activity at BSP SouthPool Energy Exchange

Create successful ePaper yourself
Turn your PDF publications into a flip-book with our unique Google optimized e-Paper software.
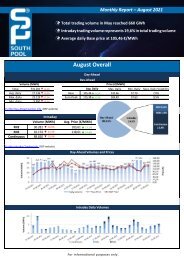
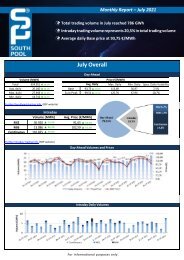
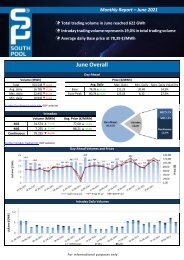
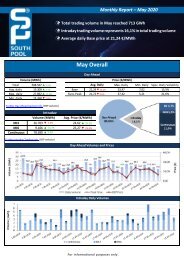
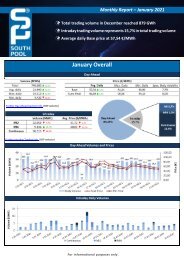
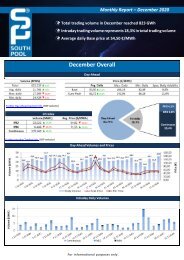
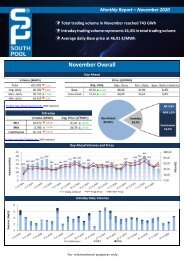
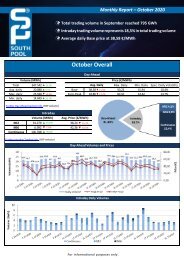
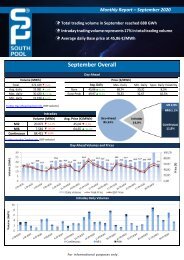
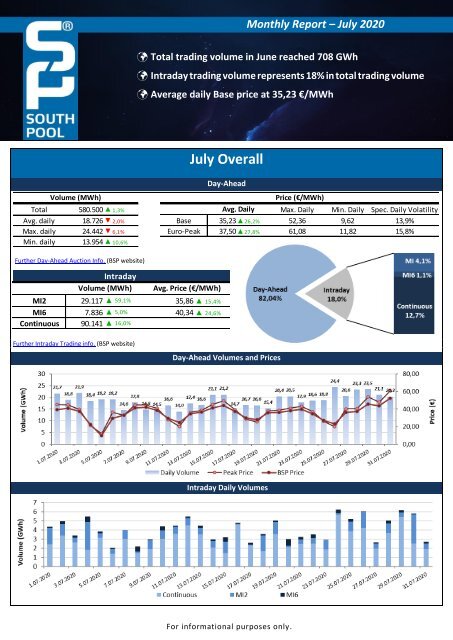
Monthly <strong>Report</strong> – <strong>July</strong> <strong>2020</strong><br />
Total trading volume in June reached 708 GWh<br />
Intraday trading volume represents 18% in total trading volume<br />
Average daily Base price at 35,23 €/MWh<br />
Volume (MWh)<br />
Further Day-Ahead Auction Info. (BSP website)<br />
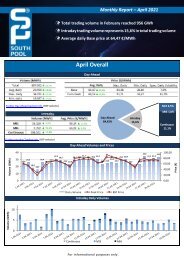
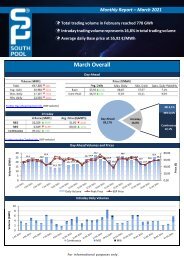
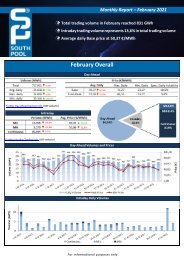
<strong>July</strong> Overall<br />
Day-Ahead<br />
Total 580.500 ▲ 1,3% Avg. Daily Max. Daily Min. Daily Spec. Daily Volatility<br />
Avg. daily 18.726 ▼ 2,0% Base 35,23▲26,2% 52,36 9,62 13,9%<br />
Max. daily 24.442 ▼ 6,1% Euro-Peak 37,50▲27,8% 61,08 11,82 15,8%<br />
Min. daily 13.954 ▲ 10,6%<br />
Intraday<br />
Volume (MWh)<br />
Avg. Price (€/MWh)<br />
MI2 29.117 ▲ 59,1% 35,86 ▲ 15,4%<br />
MI6 7.836 ▲ 5,0% 40,34 ▲ 24,6%<br />
Continuous 90.141 ▲ 16,0%<br />
Price (€/MWh)<br />
Further Intraday <strong>Trading</strong> info. (BSP website)<br />
Day-Ahead Volumes and Prices<br />
Intraday Daily Volumes<br />
For informational purposes only.
Day-Ahead further Auction info.<br />
Average Hourly Volumes and Prices<br />
Hour (AM) 1 2 3 4 5 6 7 8 9 10 11 12<br />
Volume (MWh) 701 679 696 744 741 689 761 777 758 816 822 836<br />
Base price (€/MWh) 33,59 28,72 26,92 25,90 25,64 26,50 32,46 37,13 38,43 37,88 37,17 37,76<br />
Hour (PM) 13 14 15 16 17 18 19 20 21 22 23 24<br />
Volume (MWh) 865 826 837 837 853 854 795 737 788 822 744 749<br />
Base price (€/MWh) 37,07 36,02 34,79 34,98 35,94 37,84 39,65 42,45 41,93 40,43 40,06 36,19<br />
Daily volatility of base price<br />
Cross-Zonal Capacities<br />
SI→IT IT→SI SI→AT AT→SI SI→HR<br />
Offered (MWh) 344.838 469.080 821.159 529.891 571.056 1.660.944 4.396.968<br />
Allocated (MWh) 140.080 62.884 29.845 344.650 195.324 38.610 811.393<br />
% Allocated 40,62% 13,41% 3,63% 65,04% 34,20% 2,32%<br />
Daily Volatility of Base Price<br />
HR→SI<br />
Total<br />
Methodology used for calculation of volatility.<br />
MI2 & MI6 Implicit Auctions<br />
Allocated CZC Values on Slovenian-Italian Border<br />
Cross-Zonal-Capacities<br />
SI-IT IT-SI Total<br />
Offered (MWh) Allocated (MWh) % Allocated 265.387 7.595 2,86% 264.426 18.229 6,89% 529.813<br />
25.824<br />
/<br />
Read more about European Pilot Project<br />
Implicit Intraday Auctions (MI2 & MI6)<br />
Intraday Continuous <strong>Trading</strong><br />
Volumes by Products<br />
For informational purposes only.
Past 12 Months Trade Information<br />
Day-Ahead Auction<br />
Avg. Monthly Volume (MWh) 676.522<br />
Avg. Daily Volume (MWh) 22.181<br />
Avg. Base Price (€/MWh) 40,52<br />
Avg. Euro-Peak Price (€/MWh) 44,76<br />
Avg. SI-IT offered (MWh)/Avg. % Allocated 362.307 / 29,4%<br />
Avg. IT-SI offered (MWh)/Avg.% Allocated 464.505 / 34,2%<br />
Avg. SI-AT offered (MWh)/Avg. % Allocated 819.519 / 3,5%<br />
Avg. AT-SI offered (MWh)/Avg. % Allocated 462.665 / 71,2%<br />
Avg. SI-HR offered (MWh)/Avg. % Allocated 754.385 / 32,3%<br />
Avg. HR-SI offered (MWh)/Avg. % Allocated 1.444.384 / 4,6%<br />
Day-Ahead Market Volumes and Prices<br />
Intraday Continuous <strong>Trading</strong><br />
Avg. Monthly Volume (MWh) 55.815<br />
Number of trades 13.975<br />
MI2 & MI6 Implicit Auctions<br />
Avg. Monthly volume MI2 (MWh) 31.672<br />
Avg. Monthly volume MI6 (MWh) 8.921<br />
Avg. SI-IT offered (MWh)/Avg. % Allocated 391.873 / 3,3%<br />
Avg. IT-SI offered (MWh)/Avg.% Allocated 243.816 / 4,9%<br />
Intraday Volumes (MWh)<br />
Total Volume in the past 12 months Continuous ■ MI2 ■ MI6 ■<br />
Aug. 19 13.075 26.922 5.042<br />
Sep. 19 12.887 27.784 5.345<br />
Oct. 19 7.756 32.170 9.045<br />
Nov. 19 28.771 26.380 5.879<br />
Dec. 19 98.311 28.693 11.110<br />
Jan. 20 84.528 36.402 6.842<br />
715.765<br />
Feb. 20 73.982 34.742 11.831<br />
Mar. 20 77.947 30.378 7.996<br />
Apr. 20 71.949 27.901 8.008<br />
345.490<br />
May. 20 78.690 26.703 9.106<br />
Jun. 20 77.731 18.297 7.463<br />
95.504 Jul. 20 90.141 29.117 7.836<br />
Absolute Difference Between MI and Day-Ahead Prices & MI Offered Cross-Zonal Capacities<br />
*Cross-Zonal Capacities not allocated on Day-Ahead Auction are later offered for MI2 and MI6 Auctions.<br />
For informational purposes only.
BSP Energy Exchange LL C<br />
Dunajska 156<br />
SI-1000 Ljubljana<br />
Slovenija<br />
+386 1 620 76 76<br />
+386 1 620 76 77<br />
www.bsp-southpool.com<br />
info@bsp-southpool.com<br />
For informational purposes only.