Trading Report September 2020
Report on trading activity at BSP SouthPool Energy Exchange
Report on trading activity at BSP SouthPool Energy Exchange

Create successful ePaper yourself
Turn your PDF publications into a flip-book with our unique Google optimized e-Paper software.
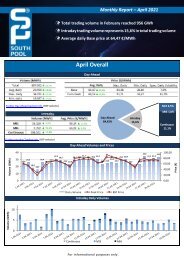
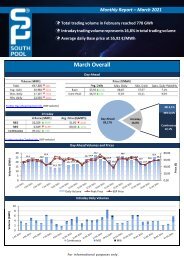
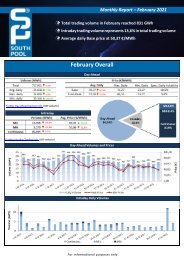
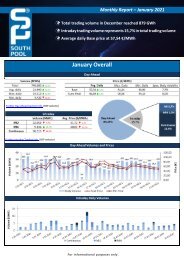
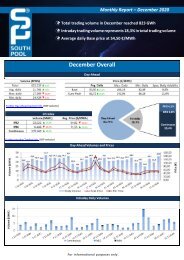
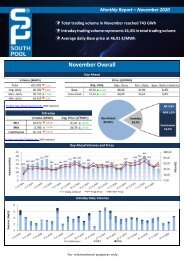
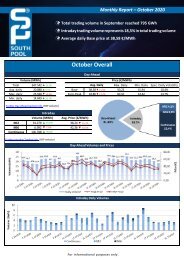
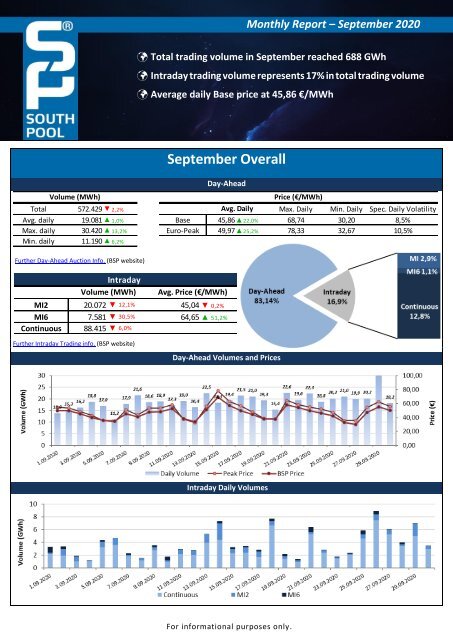
Monthly <strong>Report</strong> – <strong>September</strong> <strong>2020</strong><br />
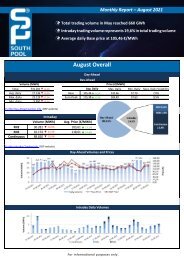
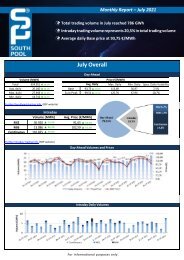
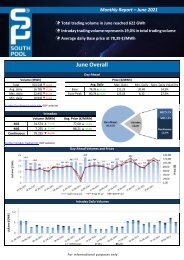
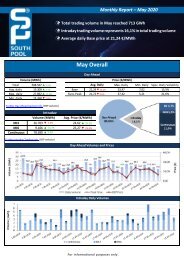
Total trading volume in <strong>September</strong> reached 688 GWh<br />
Intraday trading volume represents 17% in total trading volume<br />
Average daily Base price at 45,86 €/MWh<br />
Volume (MWh)<br />
Further Day-Ahead Auction Info. (BSP website)<br />
<strong>September</strong> Overall<br />
Day-Ahead<br />
Total 572.429 ▼ 2,2% Avg. Daily Max. Daily Min. Daily Spec. Daily Volatility<br />
Avg. daily 19.081 ▲ 1,0% Base 45,86▲22,0% 68,74 30,20 8,5%<br />
Max. daily 30.420 ▲ 13,2% Euro-Peak 49,97▲25,2% 78,33 32,67 10,5%<br />
Min. daily 11.190 ▲ 6,2%<br />
Intraday<br />
Volume (MWh)<br />
Avg. Price (€/MWh)<br />
MI2 20.072 ▼ 12,1% 45,04 ▼ 0,2%<br />
MI6 7.581 ▼ 30,5% 64,65 ▲ 51,2%<br />
Continuous 88.415 ▼ 6,0%<br />
Price (€/MWh)<br />
Further Intraday <strong>Trading</strong> info. (BSP website)<br />
Day-Ahead Volumes and Prices<br />
Intraday Daily Volumes<br />
For informational purposes only.
Day-Ahead further Auction info.<br />
Average Hourly Volumes and Prices<br />
Hour (AM) 1 2 3 4 5 6 7 8 9 10 11 12<br />
Volume (MWh) 794 819 807 830 812 789 743 853 852 783 759 788<br />
Base price (€/MWh) 36,98 35,30 33,85 32,44 32,61 35,04 44,08 51,91 56,41 52,74 47,71 46,51<br />
Hour (PM) 13 14 15 16 17 18 19 20 21 22 23 24<br />
Volume (MWh) 796 749 716 691 739 782 855 800 823 845 803 854<br />
Base price (€/MWh) 45,11 43,58 42,79 42,97 45,63 50,23 57,53 68,38 62,97 51,26 45,35 39,23<br />
Daily volatility of base price<br />
Cross-Zonal Capacities<br />
SI→IT IT→SI SI→AT AT→SI SI→HR<br />
Offered (MWh) 317.527 454.000 727.550 464.300 702.915 1.457.085 4.123.377<br />
Allocated (MWh) 203.045 41.964 113.914 129.230 44.516 184.486 717.155<br />
% Allocated 63,95% 9,24% 15,66% 27,83% 6,33% 12,66%<br />
Daily Volatility of Base Price<br />
HR→SI<br />
Total<br />
Methodology used for calculation of volatility.<br />
MI2 & MI6 Implicit Auctions<br />
Allocated CZC Values on Slovenian-Italian Border<br />
Cross-Zonal-Capacities<br />
SI-IT IT-SI Total<br />
Offered (MWh) Allocated (MWh) % Allocated 156.420 10.284 6,57% 212.326 5.428 2,56% 368.746<br />
15.712<br />
/<br />
Read more about European Pilot Project<br />
Implicit Intraday Auctions (MI2 & MI6)<br />
Intraday Continuous <strong>Trading</strong><br />
Volumes by Products<br />
For informational purposes only.
Past 12 Months Trade Information<br />
Day-Ahead Auction<br />
Avg. Monthly Volume (MWh) 657.369<br />
Avg. Daily Volume (MWh) 21.553<br />
Avg. Base Price (€/MWh) 38,80<br />
Avg. Euro-Peak Price (€/MWh) 42,63<br />
Avg. SI-IT offered (MWh)/Avg. % Allocated 362.789 / 33,6%<br />
Avg. IT-SI offered (MWh)/Avg.% Allocated 468.295 / 30,7%<br />
Avg. SI-AT offered (MWh)/Avg. % Allocated 811.786 / 5,0%<br />
Avg. AT-SI offered (MWh)/Avg. % Allocated 469.841 / 62,4%<br />
Avg. SI-HR offered (MWh)/Avg. % Allocated 746.039 / 28,6%<br />
Avg. HR-SI offered (MWh)/Avg. % Allocated 1.447.192 / 5,7%<br />
Day-Ahead Market Volumes and Prices<br />
Intraday Continuous <strong>Trading</strong><br />
Avg. Monthly Volume (MWh) 68.092<br />
Number of trades 13.975<br />
MI2 & MI6 Implicit Auctions<br />
Avg. Monthly volume MI2 (MWh) 30.122<br />
Avg. Monthly volume MI6 (MWh) 9.079<br />
Avg. SI-IT offered (MWh)/Avg. % Allocated 362.226 / 3,3%<br />
Avg. IT-SI offered (MWh)/Avg.% Allocated 251.656 / 4,5%<br />
Intraday Volumes (MWh)<br />
Total Volume in the past 12 months Continuous ■ MI2 ■ MI6 ■<br />
Oct. 19 7.756 32.170 9.045<br />
Nov. 19 28.771 26.380 5.879<br />
Dec. 19 98.311 28.693 11.110<br />
Jan. 20 84.528 36.402 6.842<br />
Feb. 20 73.982 34.742 11.831<br />
Mar. 20 77.947 30.378 7.996<br />
872.310<br />
Apr. 20 71.949 27.901 8.008<br />
May. 20 78.690 26.703 9.106<br />
Jun. 20 77.731 18.297 7.463<br />
333.680<br />
Jul. 20 90.141 29.117 7.836<br />
Aug. 20 94.091 22.824 10.903<br />
103.601 Sep. 20 88.415 20.072 7.581<br />
Absolute Difference Between MI and Day-Ahead Prices & MI Offered Cross-Zonal Capacities<br />
*Cross-Zonal Capacities not allocated on Day-Ahead Auction are later offered for MI2 and MI6 Auctions.<br />
For informational purposes only.
BSP Energy Exchange LL C<br />
Dunajska 156<br />
SI-1000 Ljubljana<br />
Slovenija<br />
+386 1 620 76 76<br />
+386 1 620 76 77<br />
www.bsp-southpool.com<br />
info@bsp-southpool.com<br />
For informational purposes only.