Asian Sky Quarterly 2020Q4

You also want an ePaper? Increase the reach of your titles
YUMPU automatically turns print PDFs into web optimized ePapers that Google loves.
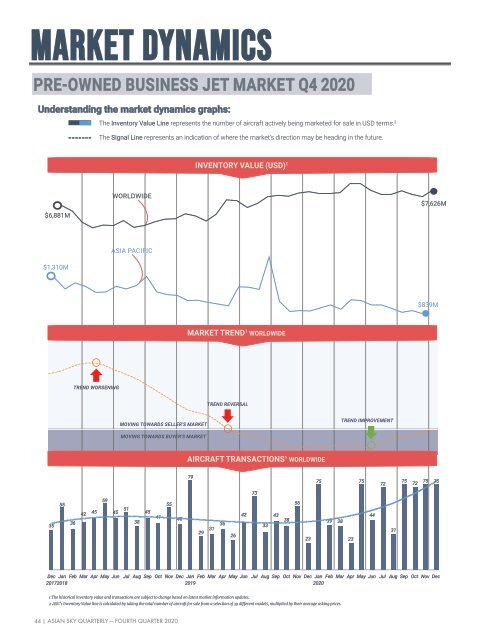
MARKET DYNAMICS<br />
PRE-OWNED BUSINESS JET MARKET Q4 2020<br />
Understanding the market dynamics graphs:<br />
The Inventory Value Line represents the number of aircraft actively being marketed for sale in USD terms. 2<br />
The Signal Line represents an indication of where the market’s direction may be heading in the future.<br />
INVENTORY VALUE (USD) 1<br />
$6,881M<br />
WORLDWIDE<br />
$7,626M<br />
ASIA PACIFIC<br />
$1,310M<br />
$839M<br />
MARKET TREND 1 WORLDWIDE<br />
TREND WORSENING<br />
TREND REVERSAL<br />
MOVING TOWARDS SELLER’S MARKET<br />
TREND IMPROVEMENT<br />
MOVING TOWARDS BUYER’S MARKET<br />
AIRCRAFT TRANSACTIONS 1 WORLDWIDE<br />
79<br />
75<br />
75<br />
72<br />
75<br />
72<br />
75<br />
75<br />
35<br />
55<br />
36<br />
59<br />
42 45 51 55<br />
45<br />
45<br />
41<br />
38<br />
40<br />
73<br />
42<br />
36<br />
29 31 33<br />
26<br />
43<br />
38<br />
56<br />
39 38<br />
23 23<br />
44<br />
31<br />
Dec Jan Feb Mar Apr May Jun Jul Aug Sep Oct Nov Dec Jan Feb Mar Apr May Jun Jul Aug Sep Oct Nov Dec Jan Feb Mar Apr May Jun Jul Aug Sep Oct Nov Dec<br />
20172018<br />
2019<br />
2020<br />
1 The historical inventory value and transactions are subject to change based on latest market information updates.<br />
2 ASG’s Inventory Value line is calculated by taking the total number of aircraft for sale from a selection of 39 different models, multiplied by their average asking prices.<br />
44 | ASIAN SKY QUARTERLY — FOURTH QUARTER 2020