XPS and laser Raman analysis of hydrogenated amorphous carbon ...
XPS and laser Raman analysis of hydrogenated amorphous carbon ...
XPS and laser Raman analysis of hydrogenated amorphous carbon ...

You also want an ePaper? Increase the reach of your titles
YUMPU automatically turns print PDFs into web optimized ePapers that Google loves.
Diamond <strong>and</strong> Related Materials 12 (2003) 974–978<br />
<strong>XPS</strong><strong>and</strong> <strong>laser</strong> <strong>Raman</strong> <strong>analysis</strong> <strong>of</strong> <strong>hydrogenated</strong> <strong>amorphous</strong> <strong>carbon</strong> films<br />
Abstract<br />
a a, a b b<br />
J. Filik , P.W. May *, S.R.J. Pearce , R.K. Wild , K.R. Hallam<br />
aSchool<br />
<strong>of</strong> Chemistry, University <strong>of</strong> Bristol, Cantock’s Close, Bristol BS8 1TS, UK<br />
bInterface<br />
Analysis Centre, University <strong>of</strong> Bristol, Oldbury House, 121 St Michael’s Hill, Bristol BS2 8BS, UK<br />
Hydrogenated <strong>amorphous</strong> <strong>carbon</strong> films were deposited in an RF parallel plate plasma reactor using various values <strong>of</strong> process<br />
pressure (10–50 mTorr) <strong>and</strong> DC self-bias (0–300 V). The films were then analysed by <strong>laser</strong> <strong>Raman</strong> spectroscopy (LRS) at 514.5<br />
2 3<br />
nm <strong>and</strong> X-ray photoelectron spectroscopy (<strong>XPS</strong>). Values for the ratio <strong>of</strong> sp :sp bonded <strong>carbon</strong> in the various films were obtained<br />
by suitable fitting <strong>of</strong> the <strong>XPS</strong><strong>carbon</strong> 1s energy peaks, using a three-curve fitting procedure, which recognises a portion <strong>of</strong> the<br />
3<br />
peak attributable to CO surface bonding. The sp content was found to depend upon the DC self bias (<strong>and</strong> hence the ion impact<br />
energy) during deposition, peaking at a value <strong>of</strong> 81% at approximately 150 V. The s<strong>of</strong>ter films grown at lower DC bias values<br />
3<br />
still had an sp content <strong>of</strong> approximately 70%. Microcombustion <strong>analysis</strong> showed that films deposited with low DC bias contained<br />
3<br />
7 at.% H compared to less than 2 at.% for films deposited at biases greater than 100 V. This high sp content can be explained<br />
3<br />
by H-termination <strong>of</strong> dangling bonds, suggesting that sp content alone is not a reliable indication <strong>of</strong> film properties. Curve-fittings<br />
<strong>of</strong> LRSspectra <strong>of</strong> the films showed that the Breit–Wigner–Fano lineshape is inappropriate for use with hydrogen containing<br />
films. Fitting using a Gaussian pr<strong>of</strong>ile gave precise values for the FWHM, intensity, <strong>and</strong> Stokes’ shift <strong>of</strong> the G <strong>and</strong> D-peaks. A<br />
linear relationship between the intensity ratio <strong>of</strong> the D to G peaks <strong>and</strong> the width <strong>of</strong> the G peak was found for films deposited at<br />
high DC bias (with low H content), but not for films deposited at low DC bias. This is consistent with the increased H content<br />
<strong>of</strong> the films causing a change in the elastic constants <strong>and</strong>yor affecting the stress levels within the films.<br />
� 2003 Elsevier Science B.V. All rights reserved.<br />
Keywords: Diamond-like <strong>carbon</strong>; Laser <strong>Raman</strong> <strong>analysis</strong>; <strong>XPS</strong>; Film composition<br />
1. Introduction<br />
Diamond-like <strong>carbon</strong> (DLC) thin films are becoming<br />
increasingly important in many forms <strong>of</strong> industrial applications,<br />
including wear-resistant coatings for hard-disk<br />
drives <strong>and</strong> optical components, as well as in semiconductor<br />
devices w1–3x. However, the term DLC covers<br />
a range <strong>of</strong> materials with properties that can vary from<br />
those similar to graphite to those approaching those <strong>of</strong><br />
natural diamond. Hydrogen-free DLC films (also known<br />
as <strong>amorphous</strong> <strong>carbon</strong> films, a-C w4x, are believed to<br />
2<br />
consist <strong>of</strong> a mainly graphitic sp <strong>carbon</strong> matrix contain-<br />
3<br />
ing nm-sized clusters <strong>of</strong> sp diamond-like <strong>carbon</strong>.<br />
Hydrogenated DLC films (also known as <strong>hydrogenated</strong><br />
<strong>amorphous</strong> <strong>carbon</strong> films, a-C:H) add yet more degrees<br />
<strong>of</strong> complexity to the possible structure <strong>of</strong> the films w5x.<br />
One <strong>of</strong> the most crucial factors determining the film<br />
2 3<br />
properties is the ratio <strong>of</strong> sp :sp bonded <strong>carbon</strong>. In a-C<br />
*Corresponding author. Tel.: q44-0117-9289927; fax: q44-0117-<br />
9251295.<br />
E-mail address: paul.may@bris.ac.uk (P.W. May).<br />
0925-9635/03/$ - see front matter � 2003 Elsevier Science B.V. All rights reserved.<br />
PII: S0925-9635Ž 02. 00374-6<br />
films, <strong>laser</strong> <strong>Raman</strong> spectroscopy (LRS) can be used to<br />
determine this ratio w6x, but in a-C:H films more sophisticated<br />
techniques such as electron energy loss spectroscopy<br />
(EELS) or X-ray photoelectron spectroscopy<br />
(<strong>XPS</strong>) <strong>of</strong>ten need to be used. In this paper we use <strong>XPS</strong><br />
2 3<br />
in conjunction with LRSto study the sp :sp ratio in a-<br />
C:H films grown with a variety <strong>of</strong> ion impact energies<br />
<strong>and</strong> deposition conditions, <strong>and</strong> to gain an insight into<br />
the structure <strong>and</strong> bonding within these films.<br />
2. Experimental<br />
a-C:H films were deposited onto single crystal Si<br />
(100) substrates using a capacitively-coupled radio frequency<br />
(RF) parallel-plate plasma reactor. The process<br />
gas was methane (CH 4)<br />
at a flow rate <strong>of</strong> 30 sccm <strong>and</strong><br />
a pressure ranging from 10–50 mTorr. RF power was<br />
used to strike a plasma <strong>and</strong> the ions were then accelerated<br />
onto the lower electrode by the DC self-bias. The<br />
substrate sat on the lower electrode, <strong>and</strong> the value <strong>of</strong><br />
the DC bias in this system thus gives an approximate
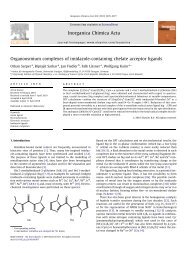
Fig. 1. An example <strong>of</strong> a wide <strong>XPS</strong>spectrum from an a-C:H film<br />
grown at 10 mTorr <strong>and</strong> with a DC bias <strong>of</strong> y100 V.<br />
measure <strong>of</strong> the average impact energy <strong>of</strong> the <strong>carbon</strong>containing<br />
ions upon the Si surface w7,8x. The a-C:H<br />
films were deposited for 30 min, yielding an approximate<br />
thickness <strong>of</strong> 0.5 mm, as measured by crosssectional<br />
SEM. The films were smooth, <strong>and</strong> varied in<br />
hardness depending upon the DC bias used. Films<br />
deposited at DC bias values less than 100 V were s<strong>of</strong>t<br />
<strong>and</strong> easily scratched, whereas those deposited at higher<br />
biases could not be scratched with tweezers.<br />
<strong>XPS</strong>was performed using the Mg K-a-line, which<br />
analysed approximately the top 40 A˚ <strong>of</strong> the film. The<br />
spectra were dominated by the C 1s peak at approximately<br />
285 eV (see Fig. 1). Calibration experiments<br />
using CVD diamond <strong>and</strong> graphite powder showed that<br />
the C 1s peak from diamond was located at 287 eV<br />
with a full-width half-maximum (FWHM) value <strong>of</strong> 1.1<br />
eV, <strong>and</strong> that the C 1s peak from graphite was located at<br />
284 eV (FWHMs0.98 eV). The 3 eV separation<br />
between these two peaks is largely due to charging<br />
effects on the insulating diamond film, but is also partly<br />
due to the different chemical environment <strong>of</strong> the C 1s<br />
electron with respect to the hybridisation <strong>of</strong> the orbital.<br />
Also present was the O 1s peak at 531 eV, due to<br />
surface chemisorbed oxygen species. If it is assumed<br />
that all the oxygen atoms in these films are <strong>of</strong> the same<br />
hybridisation, then the difference in the energies <strong>of</strong> the<br />
O 1s peak in the diamond <strong>and</strong> graphite spectra should<br />
be equal to the shift <strong>of</strong> the diamond C 1s, due to<br />
charging effects. This difference was used to give an<br />
estimate <strong>of</strong> the <strong>of</strong>fset due to charging, <strong>and</strong> was used to<br />
correct subsequent spectra. We note that this correction<br />
assumes that the surface charging is spatially homogeneous,<br />
which we believe is valid given the uniformity<br />
<strong>of</strong> the film deposition.<br />
The lineshapes <strong>of</strong> the O 1s <strong>and</strong> C 1s peaks give<br />
information about the chemical bonding environment,<br />
<strong>and</strong> fitting these peaks to suitable functions allows this<br />
bonding information to be extracted. Previous workers<br />
w9x have fitted two Voigt curves, one corresponding to<br />
J. Filik et al. / Diamond <strong>and</strong> Related Materials 12 (2003) 974–978<br />
975<br />
2 sp hybridisation with a FWHM the same as that for<br />
3<br />
graphite, <strong>and</strong> the other corresponding to sp hybridisa-<br />
tion with a FWHM the same as that measured for<br />
diamond. The ratio <strong>of</strong> Gaussian to Lorentzian functions<br />
comprising the Voigt pr<strong>of</strong>ile should be the same as the<br />
ratio needed to get the best fit in the calibration spectra<br />
<strong>of</strong> diamond <strong>and</strong> graphite (after compensation for the<br />
charging effects). However, this method does not<br />
account for any C bonded to O (which might arise as a<br />
result <strong>of</strong> hydro<strong>carbon</strong>s, water, oxygen <strong>and</strong> other adsorbates<br />
picked up when the film was transported through<br />
air), <strong>and</strong> when applied to our spectra gave inconsistent<br />
2 3<br />
values for the sp :sp proportion. Merel et al. w10x<br />
attributed a peak at 285.6 eV which was 1.3 eV higher<br />
3<br />
in energy than that <strong>of</strong> their sp peak (E ) to C bonded<br />
to O. We have therefore included this third curve to the<br />
fitting procedure, centred at an energy <strong>of</strong> (E q1.3)<br />
sp3<br />
eV.<br />
The curve fitting was done using <strong>XPS</strong>peak 4.0 s<strong>of</strong>tware,<br />
with Newton’s iteration method <strong>and</strong> 300 iterations.<br />
The three-curve fitting procedure resulted in a much<br />
better fit to our data than the previous two-curve<br />
procedure. Fig. 2 shows an example <strong>of</strong> an <strong>XPS</strong>curve<br />
fitted using the (a) two-curve <strong>and</strong> (b) three-curve<br />
Fig. 2. Example <strong>of</strong> the fits <strong>of</strong> the C 1s peak from an <strong>XPS</strong>spectrum<br />
from Fig. 1, fitted using (a) the two-curve method <strong>and</strong> (b) the threecurve<br />
method.<br />
sp3
976 J. Filik et al. / Diamond <strong>and</strong> Related Materials 12 (2003) 974–978<br />
methods. For our data, all curves were defined as 20%<br />
Lorentzian, 80% Gaussian (as used by Leung et al. w9x).<br />
3 The sp peak was fitted allowing both the FWHM <strong>and</strong><br />
2<br />
the binding energy to vary, whilst the sp peak had a<br />
variable FWHM but a position fixed at (Esp3y0.5) eV<br />
w9x. The C–O adsorbate peak was also fitted with a<br />
variable FWHM, but its energy was fixed at (Esp3q1.3) 3<br />
eV. It was found that the FWHM <strong>of</strong> both the sp peak<br />
2 <strong>and</strong> the sp peak tended to be wider than those from<br />
diamond <strong>and</strong> graphite. This has been attributed to<br />
2<br />
environments within the DLC films with mixed sp <strong>and</strong><br />
3 sp bonding. The FWHM <strong>of</strong> these peaks tended towards<br />
the values found by Leung et al., which were 1.4 eV<br />
3 2<br />
for sp <strong>carbon</strong> <strong>and</strong> 1.3 eV for sp <strong>carbon</strong>. One feature<br />
<strong>of</strong> <strong>XPS</strong><strong>analysis</strong>, which should be highlighted is that it<br />
is only the top few surface layers which are analysed.<br />
2 3<br />
Therefore, any sp :sp ratios calculated using <strong>XPS</strong>data<br />
will represent the surface values, <strong>and</strong> not necessarily<br />
those in the bulk. It is known that for ta-C films the<br />
2<br />
surface layers are <strong>of</strong>ten slightly richer in sp <strong>carbon</strong><br />
than the bulk, <strong>and</strong> this may be true for a-C:H films also.<br />
Microcombustion <strong>analysis</strong> was performed on three<br />
films grown with low, medium <strong>and</strong> high DC bias values<br />
to determine the H content <strong>of</strong> the film. For these<br />
experiments, the films were grown onto glass slides<br />
covered in Al foil. The Al foil was then dissolved in<br />
concentrated HCl (11.56 M) leaving inert DLC flakes<br />
floating on the surface. The mixture was filtered, washed<br />
with water <strong>and</strong> the flakes were left to dry overnight.<br />
Sufficient deposition runs were performed to obtain a<br />
few mg <strong>of</strong> solid DLC. Microcombustion then gave the<br />
ratio <strong>of</strong> C:H within the film to within 1%.<br />
LRSwas performed using a Renishaw 2000 spectrometer<br />
operating at a wavelength <strong>of</strong> 514.5 nm. The spectra<br />
were fitted using both Gaussian <strong>and</strong> Breit–Wigner–<br />
Fano (BWF) w11x lineshapes for both the G <strong>and</strong> D<br />
b<strong>and</strong>s. The BWF lineshape is commonly used to provide<br />
2 3<br />
an estimate <strong>of</strong> the sp :sp ratio in hydrogen-free a-C<br />
films (from the asymmetry <strong>of</strong> the G peak in the absence<br />
<strong>of</strong> a D peak). Curve fitting with the BWF line shape<br />
has been used to measure this asymmetry, <strong>and</strong> to<br />
quantify it using a variable called the skewness factor,<br />
Q (where 1yQ;0 corresponds to a pure Lorentzian line<br />
shape). Gilkes et al. w12x have shown that films high in<br />
3 sp content display much more symmetrical peaks,<br />
characterised by large (negative) values <strong>of</strong> Q. However,<br />
use <strong>of</strong> the BWF lineshape to fit G-peaks in LRSspectra<br />
<strong>of</strong> a-C:H films has yet to be reported.<br />
3. Results <strong>and</strong> discussion<br />
3<br />
The percentage <strong>of</strong> sp hybridised C in films grown at<br />
10 mTorr as a function <strong>of</strong> deposition DC bias is shown<br />
3<br />
in Fig. 3. The sp content has a constant high value <strong>of</strong><br />
approximately 70% for low biases, <strong>and</strong> then rises to a<br />
maximum at approximately 150–200 V, before rapidly<br />
3<br />
Fig. 3. The percentage <strong>of</strong> sp hybridised C in films grown at 10 mTorr<br />
as a function <strong>of</strong> (negative) deposition DC bias as measured by <strong>XPS</strong>.<br />
The diamond-shaped markers show the values derived using the threecurve<br />
fitting method, <strong>and</strong> for comparison, the square-markers show<br />
the values obtained using the two-curve method <strong>of</strong> Leung et al. w9x.<br />
decreasing at yet higher bias values. This can be<br />
explained, since at low DC bias values the ion impact<br />
energy is too small to disrupt the <strong>carbon</strong> network, <strong>and</strong><br />
also too small to remove H from the film by sputtering.<br />
Thus, the films probably consist <strong>of</strong> a relatively s<strong>of</strong>t<br />
3<br />
hydro<strong>carbon</strong> polymer. The surprisingly high sp content<br />
3<br />
could be explicable if many <strong>of</strong> the sp <strong>carbon</strong> bonds are<br />
terminated by hydrogen atoms, rather than bonded to<br />
other C atoms. As the DC bias is increased, the ions<br />
now have sufficient energy to sputter H, <strong>and</strong> also to<br />
sub-plant. The C network close to the surface then<br />
3<br />
rearranges itself to form C–C sp bonds, producing a<br />
hard diamond-like film. At even higher ion impact<br />
energies, the C network is sufficiently damaged throughout<br />
the bulk that subsequent long-range reconstruction<br />
2<br />
results in predominantly large graphitic sp structures.<br />
These results are consistent with the findings <strong>of</strong> Fallon<br />
et al. w13x 3<br />
who found the highest sp ratio in their<br />
hydrogen-free a-C films occurred at an ion impact<br />
energy <strong>of</strong> ;100 eV. However, Fallon et al. found that<br />
3 the sp content dropped sharply at ion impact energies<br />
<strong>of</strong> less than 100 eV. The results are also consistent with<br />
the models <strong>of</strong> Angus <strong>and</strong> Hayman w14x <strong>and</strong> Robertson<br />
w15x, who showed that the kinetic energy <strong>of</strong> ions<br />
impacting the substrate at approximately 100 eV is<br />
dissipated into a very small near-surface volume, leading<br />
3<br />
to preferential sp structuring. Studies <strong>of</strong> a-C films<br />
grown by pulsed <strong>laser</strong> ablation <strong>of</strong> graphite also found<br />
that optimal conditions for growth <strong>of</strong> high quality DLC<br />
3<br />
films with )90% sp -bonded C atoms involved impact<br />
energies ;100 eV w16x.<br />
Microcombustion results provide extra evidence for<br />
this mechanism. Films deposited at a bias <strong>of</strong> y25 V<br />
contained considerably more H (7%) than those deposited<br />
at y150 V (3%) <strong>and</strong> y300 V (2%). This is<br />
consistent with the findings <strong>of</strong> Tamor et al. w17x, who<br />
also found an increase in H content with decreasing DC<br />
bias in a-C:H films. Thus, for a-C:H films the conclusion
Fig. 4. A typical <strong>laser</strong> <strong>Raman</strong> spectrum (514.5 nm excitation) from<br />
y1<br />
an a-C:H film showing the prominent G peak (1580 cm ) <strong>and</strong> small-<br />
y1<br />
er shoulder (1350 cm ) due to the D b<strong>and</strong>. The fitted curves are<br />
also shown.<br />
2 3<br />
is that the sp :sp C ratio alone is not a reliable estimate<br />
3<br />
<strong>of</strong> the film structure or properties, since the sp C could<br />
be bonded to either C or H.<br />
3<br />
Fig. 3 also shows a comparison <strong>of</strong> the sp values that<br />
are obtained using the two-curve fitting method <strong>of</strong> Leung<br />
et al. w9x. 3<br />
By comparison with sp values derived from<br />
the three-curve fitting method, these values are less<br />
precise, had greater day-to-day variability, <strong>and</strong> are not<br />
consistent with other experimental findings, such as the<br />
trends with hardness <strong>and</strong> H content. Also, the two-curve<br />
data cannot be rationalised using the theoretical models<br />
<strong>of</strong> film growth mentioned above. This suggests that the<br />
three-curve fitting method is a more precise way <strong>of</strong><br />
2 3<br />
obtaining sp :sp ratios than previous methods.<br />
A typical <strong>laser</strong> <strong>Raman</strong> spectrum from an a-C:H film<br />
is given in Fig. 4, showing the prominent G b<strong>and</strong><br />
y1<br />
(centred approximately 1580 cm ) <strong>and</strong> a smaller<br />
underlying D b<strong>and</strong> shoulder (centred approximately<br />
y1 1350 cm ). The presence <strong>of</strong> the D peak in most <strong>of</strong> the<br />
spectra from these a-C:H films prohibited the use <strong>of</strong> a<br />
2 3<br />
single BWF lineshape to quantify the sp :sp ratio.<br />
However, some <strong>of</strong> the films that were grown at the<br />
lowest bias values gave spectra with only one G peak.<br />
These could be fitted to a BWF lineshape, but gave Q<br />
18<br />
values <strong>of</strong> y1=10 , so that 1yQ;0. This suggests that<br />
the BWF fitting method is not appropriate for hydrogen<br />
containing a-C:H films due to their highly symmetrical<br />
G peak shape. A possible reason for this is that the<br />
presence <strong>of</strong> H within the films stabilises graphitic<br />
clusters by terminating dangling bonds on the aromatic<br />
rings.<br />
Tamor et al. w17x state that for their spectra two<br />
Gaussians functions faithfully reproduced the peak structure,<br />
<strong>and</strong> therefore more elaborate line shapes were not<br />
needed. Following this procedure, the individual G <strong>and</strong><br />
D peaks from our spectra were fitted with Gaussian line<br />
shapes to quantify their respective FWHM <strong>and</strong> peak<br />
heights. A plot <strong>of</strong> the ratio <strong>of</strong> the intensities <strong>of</strong> the D<br />
J. Filik et al. / Diamond <strong>and</strong> Related Materials 12 (2003) 974–978<br />
977<br />
Fig. 5. The ratio <strong>of</strong> the intensities <strong>of</strong> the D peak, I D, <strong>and</strong> G peak, I G,<br />
plotted against the fitted G peak FWHM, for a number <strong>of</strong> different<br />
DC bias values. Different values for IDyIG <strong>and</strong> G peak FWHM were<br />
obtained for each DC bias value by changing the process pressure<br />
from 10–50 mTorr, which affected the ion impact energy <strong>and</strong> therefore<br />
the structure <strong>and</strong> composition <strong>of</strong> the films.<br />
peak, I , <strong>and</strong> G peak, I , to the fitted G peak width is<br />
D G<br />
shown in Fig. 5, for a number <strong>of</strong> different DC bias<br />
values. Schwan et al. w18x have proposed that the G<br />
peak width is partially determined by the graphitic<br />
cluster size, <strong>and</strong> so a plot <strong>of</strong> I yI vs. G peak width<br />
D G<br />
should give a straight line. It can be seen in Fig. 5 that<br />
for films deposited at DC bias values greater than<br />
approximately y150 V, a linear relationship between G<br />
peak width <strong>and</strong> the I yI ratio is indeed observed. This<br />
D G<br />
suggests that at high ion impact energies the width <strong>of</strong><br />
the G peak is strongly affected by the presence <strong>of</strong><br />
aromatic clusters. However, for films deposited at DC<br />
bias values lower than y150 V, the data points are<br />
more clustered <strong>and</strong> show less <strong>of</strong> an obvious trend. This<br />
suggests that at these lower ion impact energies the<br />
graphitic clusters have much less influence upon the G<br />
peak width. One reason for this might be that the<br />
graphitic clusters now have H-terminated aromatic<br />
groups, rather than extended networks <strong>of</strong> graphene<br />
sheets. Another reason could be that the increased H<br />
content is affecting the elastic constants <strong>of</strong> the film <strong>and</strong><br />
altering the stress levels. Schwan et al. also proposed<br />
that a-C:H films with G peak linewidths broader than<br />
y1 45 cm have small aromatic clusters with size less<br />
than 10 A. ˚ In our films, the very broad G peak width<br />
<strong>and</strong> IDyIG ratio <strong>of</strong> less than one, suggest that any<br />
aromatic clusters are less than 10 A˚ in size, <strong>and</strong> are<br />
thus probably composed <strong>of</strong> localised benzene-like or<br />
naphthalene-like structures.<br />
4. Conclusions<br />
We have shown that <strong>XPS</strong><strong>and</strong> <strong>laser</strong> <strong>Raman</strong> spectroscopy<br />
can be used to derive structural information about<br />
the localised bonding with a-C:H films. The fact that<br />
3<br />
films with apparently high sp contents can have poor
978 J. Filik et al. / Diamond <strong>and</strong> Related Materials 12 (2003) 974–978<br />
mechanical properties has been found to be due to the<br />
high H content <strong>of</strong> these films. This highlights the fact<br />
3 that sp content alone is not a reliable measure <strong>of</strong> the<br />
properties <strong>of</strong> hydrogen containing DLC films. This<br />
might also hold true for DLC films containing other<br />
elements, such as those doped with N or P. We have<br />
also demonstrated use <strong>of</strong> the three-curve fitting method<br />
2 3<br />
for <strong>XPS</strong>data gives precise values for sp :sp ratios<br />
within the films, <strong>and</strong> gave values consistent with results<br />
from microcombustion <strong>and</strong> apparent hardness. Thus, we<br />
feel that compared to previous fitting methods, the threecurve<br />
method is a much more reliable <strong>and</strong> accurate<br />
method to reliably obtain such data from a-C:H films.<br />
Acknowledgments<br />
The authors wish to thank Mike Ashfold <strong>and</strong> other<br />
members <strong>of</strong> the diamond group at Bristol for advice <strong>and</strong><br />
helpful comments.<br />
References<br />
w1x S.R.P. Silva, J. Robertson, W.I. Milne, G.A.J. Amaratunga,<br />
Amorphous <strong>carbon</strong>: State <strong>of</strong> the Art, World Scientific, Singapore,<br />
1998.<br />
w2x Y. Lifshitz, Diamond Relat. Mater. 8 (1999) 1659.<br />
w3x B. Bushan, Diamond Relat. Mater. 8 (1999) 1985.<br />
w4x M.A. Tamor, W.C. Vassell, J. Appl. Phys. 76 (1994) 3823.<br />
w5x M.-L. Theye, V. Paret, Carbon 40 (2002) 1153.<br />
w6x M. Chhowalla, A.C. Ferrari, J. Robertson, G.A.J. Amaratunga,<br />
Appl. Phys. Letts. 76 (2000) 1419.<br />
w7x P.W. May, PhD thesis, University <strong>of</strong> Bristol, 1991.<br />
w8x P.W. May, D. Field, D.F. Klemperer, J. Appl. Phys. 71 (1992)<br />
3721.<br />
w9x T.Y. Leung, W.F. Man, P.K. Lim, W.C. Chan, F. Gaspari, S.<br />
Zukotynski, J. Non-Cryst. Solids. 254 (1999) 156.<br />
w10x P. Merel, ´ M. Tabbal, M. Chaker, S. Moisa, J. Margot, Appl.<br />
Surf. Sci. 136 (1998) 105.<br />
w11x S. Prawer, K.W. Nugent, Y. Lifshitz, G.D. Lampert, E. Grossman,<br />
J. Kulik, et al., Diamond Relat. Mater. 5 (1996) 433.<br />
w12x K.W.R. Gilkes, S. Prawer, K.W. Nugent, J. Robertson, H.S.<br />
S<strong>and</strong>s, Y. Lifshitz, et al., J. Appl. Phys. 87 (2000) 7283.<br />
w13x P.J. Fallon, V.S. Veersamy, C.A. Davis, J. Robertson, G.A.J.<br />
Amaratunga, W.I. Milne, et al., Phys. Rev. B48 (1993) 4777.<br />
w14x J.C. Angus, C.C. Hayman, Science 241 (1988) 913.<br />
w15x J. Robertson, Diamond Relat. Mater. 3 (1994) 361.<br />
w16x D.B. Geohegan, A. Puretzky, Mat. Res. Soc. Symp. Proc. 397<br />
(1996) 55, references therein.<br />
w17x M.A. Tamor, W.C. Vassell, J. Appl. Phys. 76 (1994) 3823.<br />
w18x J. Schwan, S. Ulrich, V. Batori, H. Errhardt, J. Appl. Phys. 80<br />
(1996) 440.