2021-03 -- Real Estate of Northern Virginia Market Report - March 2021 Real Estate Trends - Michele Hudnall
2021 - Dare I Say Bidding Wars - Highly Competitive Market and a Unique Sellers Market! The Real Estate of Northern Virginia Report is a comprehensive residential real estate update for the Northern Virginia (NVA) region. The report is a unique report for the region that is both wide and deep, focused locally with actionable advice. The data is drawn from the local listing service, Bright MLS, compiled and presented with my opinion and advice as the author, knowledge as a Realtor and lifetime resident of this region.
2021 - Dare I Say Bidding Wars - Highly Competitive Market and a Unique Sellers Market!
The Real Estate of Northern Virginia Report is a comprehensive residential real estate update for the Northern Virginia (NVA) region. The report is a unique report for the region that is both wide and deep, focused locally with actionable advice.
The data is drawn from the local listing service, Bright MLS, compiled and presented with my opinion and advice as the author, knowledge as a Realtor and lifetime resident of this region.
- TAGS
- fauquier-county-real-estate
- prince-william-real-estate
- loudoun-county-real-estate
- fairfax-county-real-estate
- arlington-real-estate
- alexandria-real-estate
- fairfax-real-estate
- falls-church-real-estate
- manassas-real-estate
- best-northern-virginia-realtor
- you-northern-virginia-realto
- northern-virginia-home-trends
- norther-virginia-home-prices
- real-estate-of-nva
- nva-real-estate-trends
- nova-real-estate-trends
- northern-virginia-real-estate
- michele-hudnall
- realestatofnva

Create successful ePaper yourself
Turn your PDF publications into a flip-book with our unique Google optimized e-Paper software.
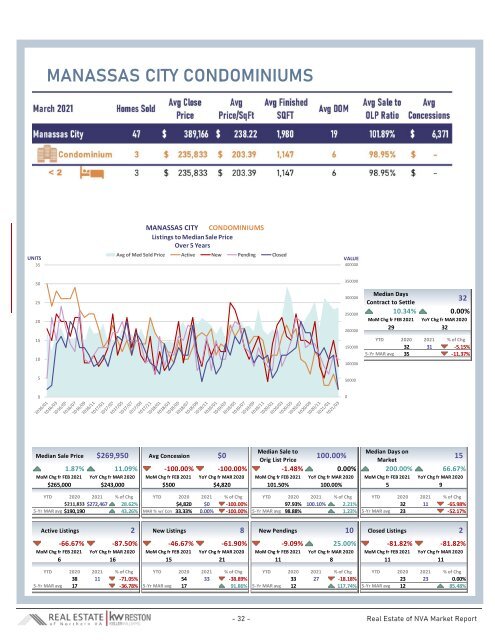
MANASSAS CITY CONDOMINIUMS<br />
UNITS<br />
35<br />
MANASSAS CITY CONDOMINIUMS<br />
Listings to Median Sale Price<br />
Over 5 Years<br />
Avg <strong>of</strong> Med Sold Price Active New Pending Closed<br />
VALUE<br />
400000<br />
30<br />
25<br />
20<br />
15<br />
10<br />
350000<br />
300000<br />
250000<br />
200000<br />
150000<br />
100000<br />
Median Days<br />
32<br />
Contract to Settle<br />
10.34%<br />
0.00%<br />
MoM Chg fr FEB <strong>2021</strong> YoY Chg fr MAR 2020<br />
29 32<br />
YTD 2020 <strong>2021</strong> % <strong>of</strong> Chg<br />
32 31 -5.15%<br />
5-Yr MAR avg 35 -11.37%<br />
5<br />
50000<br />
0<br />
0<br />
Median Sale to<br />
Median Days on<br />
Median Sale Price $269,950 Avg Concession $0<br />
100.00%<br />
Orig List Price<br />
<strong>Market</strong><br />
15<br />
1.87% 11.09% -100.00% -100.00%<br />
-1.48% 0.00% 200.00% 66.67%<br />
MoM Chg fr FEB <strong>2021</strong> YoY Chg fr MAR 2020 MoM Chg fr FEB <strong>2021</strong> YoY Chg fr MAR 2020 MoM Chg fr FEB <strong>2021</strong> YoY Chg fr MAR 2020 MoM Chg fr FEB <strong>2021</strong> YoY Chg fr MAR 2020<br />
$265,000 $243,000 $500 $4,820 101.50% 100.00%<br />
5 9<br />
YTD 2020 <strong>2021</strong> % <strong>of</strong> Chg YTD 2020 <strong>2021</strong> % <strong>of</strong> Chg YTD 2020 <strong>2021</strong> % <strong>of</strong> Chg YTD 2020 <strong>2021</strong> % <strong>of</strong> Chg<br />
$211,833 $272,467 28.62% $4,820 $0 -100.00% 97.93% 100.10% 2.21% 32 11 -65.98%<br />
5-Yr MAR avg $190,190 43.26% MAR % w/ Con 33.33% 0.00% -100.00% 5-Yr MAR avg 98.88% 1.23% 5-Yr MAR avg 23 -52.17%<br />
Active Listings 2<br />
New Listings 8 New Pendings 10 Closed Listings<br />
-66.67% -87.50% -46.67% -61.90%<br />
-9.09% 25.00% -81.82% -81.82%<br />
MoM Chg fr FEB <strong>2021</strong> YoY Chg fr MAR 2020 MoM Chg fr FEB <strong>2021</strong> YoY Chg fr MAR 2020 MoM Chg fr FEB <strong>2021</strong> YoY Chg fr MAR 2020 MoM Chg fr FEB <strong>2021</strong> YoY Chg fr MAR 2020<br />
6 16 15 21 11 8 11 11<br />
YTD 2020 <strong>2021</strong> % <strong>of</strong> Chg YTD 2020 <strong>2021</strong> % <strong>of</strong> Chg YTD 2020 <strong>2021</strong> % <strong>of</strong> Chg YTD 2020 <strong>2021</strong> % <strong>of</strong> Chg<br />
38 11 -71.05% 54 33 -38.89% 33 27 -18.18% 23 23 0.00%<br />
5-Yr MAR avg 17 -36.78% 5-Yr MAR avg 17 91.86% 5-Yr MAR avg 12 117.74% 5-Yr MAR avg 12 85.48%<br />
2<br />
- 32 - <strong>Real</strong> <strong>Estate</strong> <strong>of</strong> NVA <strong>Market</strong> <strong>Report</strong>