
Create successful ePaper yourself
Turn your PDF publications into a flip-book with our unique Google optimized e-Paper software.
NATIONAL BEACH &<br />
COASTAL SAFETY REPORT<br />
<strong>10</strong>-YEAR OVERVIEW | <strong>2011</strong>-<strong>21</strong> & 1-YEAR OVERVIEW | <strong>2020</strong>-<strong>21</strong>
KEY FINDINGS<br />
KEY FINDINGS<br />
<strong>10</strong>-YEAR OVERVIEW | <strong>2011</strong>-<strong>21</strong><br />
<strong>10</strong> YEAR OVERVIEW | <strong>2011</strong>-<strong>21</strong><br />
1<br />
Our Ten <strong>Year</strong> Average Fatal<br />
Drowning Rate is 44% Higher<br />
Than Australia’s<br />
2<br />
Other Ethnicities* Had the<br />
Greatest Fatal Drowning Rate<br />
Over the Last Ten <strong>Year</strong>s<br />
2.5<br />
44%<br />
New Zealand has a 44% higher ten-year average<br />
beach and coastal fatal drowning rate per capita<br />
(per <strong>10</strong>0,000 pop.) than Australia.<br />
2.0<br />
1.5<br />
1.0<br />
Maori Pasifika Other<br />
Ethnicities*<br />
*Other Ethnicities represent all other ethnicities that<br />
are not NZ European, Pasifika, Asian nor Maori.<br />
Over the last ten years, Other Ethnicities* had the<br />
highest fatal drowning rate per capita (2.49 per<br />
<strong>10</strong>0,000 pop.), followed by Pasifika (1.28 per<br />
<strong>10</strong>0,000 pop.) and Maori (1.15 per <strong>10</strong>0,000 pop).<br />
3<br />
Pasifika Had the Second-Highest<br />
Drowning Rate Over<br />
the Last <strong>10</strong> <strong>Year</strong>s.<br />
4<br />
Māori Had the Third-Highest<br />
Drowning Rate Over<br />
the Last <strong>10</strong> <strong>Year</strong>s<br />
1.28 1.15<br />
per <strong>10</strong>0,000 pop. per <strong>10</strong>0,000 pop.<br />
Over the last ten years, Pasifika people had the<br />
second-highest fatal drowning rate per capita<br />
(1.28 per <strong>10</strong>0,000 pop.)<br />
Over the last ten years, Maori people had the<br />
third-highest fatal drowning rate per capita (1.15<br />
per <strong>10</strong>0,000 pop).<br />
5<br />
46% Of Fatal Drownings<br />
Occurred in the Summer Months.<br />
Over the last ten years, there were 167 beach and<br />
coastal drowning fatalities during the three summer<br />
months of December, January and February. This<br />
figure represents nearly half of the total annual<br />
beach and coastal drowning fatalities recorded,<br />
highlighting the increased risk associated with the<br />
busy summer season.
We, Surf Life Saving New Zealand, are saying “enough is<br />
enough” and are calling for greater investment in a long term,<br />
evidence-based beach and coastal safety education strategy.<br />
6<br />
Males are Fatally Drowning<br />
More Than Females<br />
87%<br />
MALE<br />
13%<br />
FEMALE<br />
Of those who died from drowning over the last ten<br />
years, males represent 87% and females only 13%.<br />
Men are fatally drowning more on our beaches and<br />
coastlines than females.<br />
7<br />
Many New Zealand Adults<br />
Cannot Swim or Float Unaided.<br />
Nearly three in ten New Zealanders cannot swim or<br />
float in the ocean for more than a few minutes.<br />
Only 9% of New Zealand adults swam further than<br />
50m in the ocean in 20<strong>21</strong> while over one quarter<br />
have never swum this distance in the ocean.<br />
Adults are Fatally Drowning<br />
More Than Children and Young<br />
8 9<br />
Adolescents.<br />
Surf <strong>Beach</strong>es Pose the Greatest<br />
Risk for <strong>Beach</strong> and <strong>Coastal</strong> Fatal<br />
Drowning in New Zealand.<br />
38%<br />
Adults over the age of 15 account for 95% of all<br />
drowning fatalities in the beach and coastal<br />
environment. The 35-54 and 65+ age groups have<br />
the greatest number of fatal drownings.<br />
Over the last ten years, 38% of beach and<br />
coastal fatal drownings occurred at a surf beach<br />
in New Zealand.<br />
<strong>10</strong><br />
Over the Last <strong>10</strong> <strong>Year</strong>s, the<br />
Greatest Risk Activities on a<br />
<strong>Beach</strong> and <strong>Coastal</strong> Environment<br />
Have Been:<br />
However… Last <strong>Year</strong>, the Greatest<br />
Risk Activities Were:<br />
Swimming/Wading<br />
Boating<br />
Falls (trips/slips)<br />
Swimming/Wading<br />
Snorkelling<br />
Boating
DROWNING SNAPSHOT<br />
<strong>10</strong>-YEAR OVERVIEW | <strong>2011</strong>-<strong>21</strong><br />
357 87%<br />
MALE<br />
BEACH &<br />
COASTAL FATAL<br />
DROWNINGS<br />
13%<br />
FEMALE<br />
LOCATION<br />
38%<br />
SURF BEACH<br />
13%<br />
HARBOUR<br />
17%<br />
0-1KM<br />
OFFSHORE<br />
ACTIVITY<br />
22%<br />
SWIMMING/WADING<br />
18%<br />
BOATING<br />
16%<br />
FALLS
CONTENTS<br />
Synopsis 04<br />
Key Findings 06<br />
SECTION ONE:<br />
COMMUNITY 09<br />
New Zealand Population <strong>10</strong><br />
<strong>Coastal</strong> Visitation 12<br />
Covid-19 Impacts 13<br />
Activity Participation 14<br />
Swimming Ability 18<br />
<strong>Coastal</strong> <strong>Safety</strong> 19<br />
Feature: Rip Currents and the 3Rs 22<br />
SECTION TWO:<br />
CAPABILITY 25<br />
Capability 26<br />
Surf Life Saving Patrol<br />
Locations 28<br />
Surf Lifeguard Capability 29<br />
Rescues Per Region 30<br />
Assists Per Region 31<br />
Major First Aid Incidents 32<br />
Minor First Aid Incidents 33<br />
Searches Per Region 34<br />
Preventative Actions 35<br />
SECTION THREE:<br />
INCIDENT ANALYSIS 37<br />
<strong>10</strong> <strong>Year</strong> <strong>National</strong> <strong>Overview</strong> 38<br />
Rescues and Assists 40<br />
First Aid Treatments 41<br />
Searches 42<br />
45<br />
SECTION FOUR:<br />
SEARCH & RESCUE<br />
ANALYSIS<br />
<strong>10</strong> <strong>Year</strong> <strong>National</strong> <strong>Overview</strong> 46<br />
SECTION FIVE:<br />
FATAL DROWNING 49<br />
ANALYSIS - <strong>2011</strong>/<strong>21</strong><br />
<strong>10</strong> <strong>Year</strong> <strong>National</strong> <strong>Overview</strong> 50<br />
57<br />
SECTION SIX:<br />
FATAL DROWNING<br />
ANALYSIS - <strong>2020</strong>/<strong>21</strong><br />
1 <strong>Year</strong> <strong>National</strong> <strong>Overview</strong> 58<br />
SECTION SEVEN:<br />
REGIONAL OVERVIEWS<br />
Northland<br />
Auckland<br />
Waikato<br />
Bay of Plenty<br />
Gisborne<br />
Hawke's Bay<br />
Taranaki<br />
Manawatu-Wanganui<br />
Wellington<br />
Tasman<br />
Nelson<br />
Marlborough<br />
West Coast<br />
Canterbury<br />
Otago<br />
Southland<br />
61<br />
62<br />
64<br />
66<br />
68<br />
70<br />
72<br />
74<br />
76<br />
78<br />
80<br />
82<br />
84<br />
86<br />
88<br />
90<br />
92<br />
95<br />
SECTION EIGTH:<br />
<strong>10</strong> YEAR ACTIVITY<br />
OVERVIEW <strong>2011</strong>/<strong>21</strong><br />
Snapshot: Swimming/Wading 96<br />
Snapshot: Boating 97<br />
Snapshot: Falls 98<br />
Snapshot: Snorkelling 99<br />
Snapshot: Watercraft <strong>10</strong>0<br />
Snapshot: Land-Based Fishing <strong>10</strong>1<br />
SECTION NINE:<br />
<strong>10</strong> YEAR ETHNICITY <strong>10</strong>3<br />
OVERVIEW <strong>2011</strong>/<strong>21</strong><br />
Snapshot: NZ European <strong>10</strong>4<br />
Snapshot: Maori <strong>10</strong>5<br />
Snapshot: Asian <strong>10</strong>6<br />
Snapshot: Pasifika <strong>10</strong>7<br />
Snapshot: Other <strong>10</strong>8<br />
Key Terms 1<strong>10</strong><br />
References 112
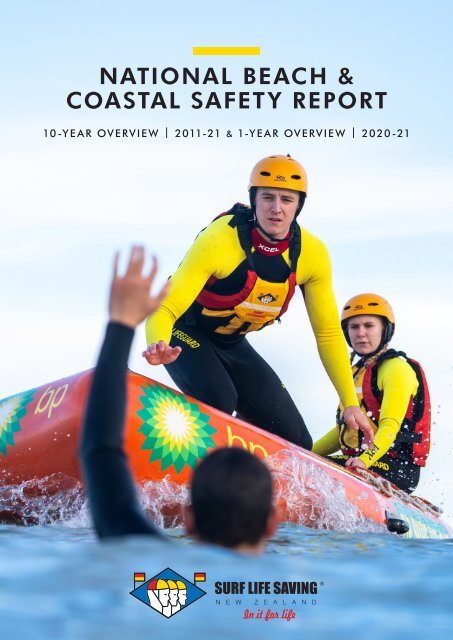
SYNOPSIS<br />
New Zealander’s love the coast. Sadly, in the last ten years,<br />
there have been 357 beach and coastal fatal drownings in<br />
New Zealand. Each one leaves families and communities<br />
devastated. Our drowning toll is something every New<br />
Zealander should see as a national tragedy and one we all<br />
have a responsibility to address.<br />
The <strong>2020</strong>-<strong>21</strong> <strong>Beach</strong> & <strong>Coastal</strong> <strong>Safety</strong> <strong>Report</strong> is being<br />
released while we are in the midst of an appalling summer<br />
for fatal drownings. Data from the <strong>2020</strong>-<strong>21</strong> <strong>Report</strong> shows<br />
that New Zealand has a 44% higher ten-year average beach<br />
and coastal fatal drowning rate per capita (per <strong>10</strong>0,000<br />
pop.) than Australia. This is a hugely concerning statistic and<br />
as a coastal nation, we need to do far better. We, Surf Life<br />
Saving New Zealand, are saying “enough is enough” and<br />
support water safety and public sector collaboration, to<br />
manage the risks our coastline presents and improve our<br />
drowning rate. We are also calling for greater investment<br />
in a long term, evidence-based beach and coastal safety<br />
education strategy.<br />
In order to help understand the problem in more detail,<br />
Surf Life Saving New Zealand (<strong>SLSNZ</strong>) produces this report<br />
on an annual basis, documenting incidents that have<br />
occurred within the coastal zone, while also analysing<br />
coastal participation, behaviours and perceptions. The<br />
report in itself does not provide answers, but provides the<br />
data in such a way that highlights the problem and will aid<br />
further analysis to help provide potential solutions.<br />
Between May <strong>2020</strong> and April 20<strong>21</strong>, 3.1 million New<br />
Zealand adults (16 years and above) visited the coast on<br />
average 3.8 times each month. This suggests there were<br />
over 12 million individual visits to the coast. Swimming/<br />
wading was the most popular activity, followed by kai<br />
gathering and boating.<br />
From <strong>2011</strong>-20<strong>21</strong> there were 167 beach and coastal<br />
drowning fatalities during the three summer months of<br />
December, January and February. This figure represents<br />
nearly half of the total annual beach and coastal drowning<br />
fatalities recorded, highlighting the increased risk associated<br />
with the busy summer season, as has tragically been seen<br />
with the high drowning numbers this year.<br />
Over the past ten years, nearly 40% of beach and coastal<br />
fatal drownings occurred at a surf beach, with almost onequarter<br />
of these deaths occurring while swimming or wading.<br />
Astoundingly almost a third of New Zealanders cannot swim<br />
or float in the ocean for more than a few minutes, and many<br />
cannot swim 50m in the ocean without touching the bottom.<br />
For those whose swimming and floating ability in the ocean<br />
is limited, it highlights the importance of choosing to swim<br />
at a lifeguarded beach.<br />
“Rip currents are the greatest<br />
hazard at a surf beach.”<br />
There is a strong correlation between rip currents, beaches,<br />
and swimming and wading incidents. As predicted, research<br />
shows nearly 60% of New Zealanders cannot identify a<br />
rip. Because of this inability to identify rip currents, <strong>SLSNZ</strong><br />
introduced the 3Rs Rip Survival Plan to increase awareness<br />
and knowledge on what to do if caught in a rip. The 3Rs<br />
message comprises three simple and easy-to-remember<br />
steps:<br />
R – Relax and float to conserve energy.<br />
R – Raise your hand to signal for help.<br />
R – Ride the rip until it stops and you<br />
can swim back to shore or help arrives.<br />
Research suggests the 3Rs campaign is clear and resonates<br />
with the New Zealand public. While we have an effective<br />
behaviour change tool, campaign exposure needs to be<br />
greater, more consistent and communicated in an authentic<br />
manner to a wider range of communities.<br />
Across all coastal activities, males continue to believe they<br />
are experienced enough to take more risks compared to<br />
females. Males are more likely to take risks and less likely to<br />
follow safety practices, while the opposite is true for female<br />
participants. Not surprisingly, males continue to fatally<br />
drown more than females on our beaches and coastline,<br />
accounting for 87% of drowning deaths.<br />
Interestingly, from a total of <strong>21</strong>,575 incidents addressed by<br />
Surf Lifeguards over the past ten years, 60% involved males<br />
and 40% females. Although males represent the majority<br />
of all beach and coastal incidents (fatal and non-fatal), the<br />
disparity in the male-female proportion is even higher when<br />
accounting for only the fatal incidents.<br />
During the last ten years, there has been an average of<br />
36 beach and coastal fatal drownings each year and in<br />
comparison to our antipodean neighbours, the ten-year<br />
average beach and coastal fatal drowning rate is 44%<br />
greater than the Australian ten-year average.<br />
SURF LIFE SAVING NEW ZEALAND<br />
04<br />
NATIONAL BEACH & COASTAL SAFETY REPORT
The Auckland region has the highest number of fatal<br />
drownings, followed by Northland and Waikato. However,<br />
when looking at per-capita figures, Northland had<br />
New Zealand’s greatest fatal drowning rate (3.30<br />
per <strong>10</strong>0,000 pop.) and Auckland, with a far greater<br />
population size, has a fatal drowning rate of only 0.59.<br />
Therefore, the risk of fatally drowning on the beach and<br />
coastal environments of Northland is over five times<br />
greater than in Auckland.<br />
Surf beaches remain the most dangerous environment,<br />
followed by locations 0-1 km from shore and within<br />
harbours. Most beach and coastal fatal drownings occurred<br />
while swimming or wading, followed by boating and falls.<br />
Over the last ten years, the highest fatal drowning rate<br />
per capita (2.49 per <strong>10</strong>0,000 pop.) has been seen amongst<br />
those communities that are less familiar with our beaches<br />
and essential water safety information, followed by Pasifika<br />
(1.28 per <strong>10</strong>0,000 pop.) and Maori (1.15 per <strong>10</strong>0,000 pop).<br />
<strong>SLSNZ</strong>’s vision is “No one drowns at our beaches”, the<br />
volunteer membership has provided a Surf Lifeguard<br />
Service to the New Zealand public for 111 years. This<br />
national Lifeguard service now consists of 74 volunteer<br />
Surf Life Saving Clubs who patrol at weekends from Labour<br />
Weekend to Easter and a council funded Lifeguard Service<br />
delivered by <strong>SLSNZ</strong> to provide patrols during the week in the<br />
peak summer holiday season in the most popular locations.<br />
When combined, these services patrol a total of over 80<br />
locations countrywide. During <strong>2020</strong>-<strong>21</strong> there were 4,6<strong>21</strong><br />
qualified Surf Lifeguards, with 925 of them gaining their<br />
Surf Lifeguard Award during the season.<br />
The interventions performed while Surf Lifeguards have<br />
been protecting our beaches in the last decade have saved<br />
countless people. Through these actions <strong>SLSNZ</strong> Volunteer<br />
Surf Lifeguards have likely saved more than 11,364 lives.<br />
Over the last ten years, Surf Lifeguards have carried<br />
out 1,136,315 preventative actions involving 4,472,325<br />
members of the public. That is a huge number of drownings<br />
that have been potentially averted because of the vital role<br />
that <strong>SLSNZ</strong> performs.<br />
<strong>SLSNZ</strong> also saves lives on the land as well as in the sea.<br />
All Surf Lifeguards are first aid trained, and many as First<br />
Responders. Over the last ten years, Surf Lifeguards have<br />
treated 24,163 people who have required minor or major<br />
first aid treatments and searched for 3,397 people.<br />
“Over the past ten years, Surf Lifeguards<br />
have recovered <strong>10</strong>1 deceased people,<br />
almost one-third of all beach and coastal<br />
drowning deaths across New Zealand.”<br />
As part of the ‘<strong>National</strong> Search and Rescue (SAR)<br />
Framework’, Volunteer <strong>SLSNZ</strong> Clubs are regularly called<br />
upon by the Police to respond to incidents out of hours.<br />
These call-outs have significantly increased in recent years<br />
as more and more people need our services. More lives<br />
are being saved, and more people are being rescued than<br />
ever before. Unfortunately, SAR Squads have also been<br />
busy searching for and recovering people who have died,<br />
returning them to their whanau and loved ones.<br />
The <strong>2020</strong>-<strong>21</strong> <strong>Beach</strong> & <strong>Coastal</strong> <strong>Safety</strong> <strong>Report</strong> shows that<br />
beach and coastal fatal drownings had plateaued, and<br />
there was a slight 1.3% decrease in the number of beach<br />
and coastal fatal drownings over the last five years when<br />
compared to the previous five years. Data for <strong>2020</strong>-20<strong>21</strong><br />
also shows there were 25 beach and coastal fatal drownings,<br />
the lowest fatality count since 2013-14, which sees the New<br />
Zealand drowning rate (0.49 per <strong>10</strong>0,000 pop.) drop to less<br />
than the Australian (0.53 per <strong>10</strong>0,000 pop.) for the first<br />
time in ten years.<br />
However, it seems this is not an indication of a positive<br />
trend. It is likely the statistics reflect last summer’s poor<br />
weather and Covid-19 restrictions keeping people away<br />
from the beach. Tragically, record numbers of rescues<br />
and dire drowning figures already taking place in the<br />
20<strong>21</strong>-22 summer period.<br />
We must ask the question why the New Zealand ten-year<br />
drowning rate is so high in comparison to Australia and<br />
ensure we do not repeat this disastrous year for drowning<br />
deaths. We cannot become complacent about the need for<br />
significant and sustained investment in public education<br />
strategies and campaigns for beach and coastal safety.<br />
This is essential to ensure that future figures no longer tell<br />
the tragic tale of hundreds of lives lost from preventable<br />
drownings in our oceans.<br />
Anyone can drown,<br />
but no one should.<br />
SURF LIFE SAVING NEW ZEALAND<br />
05<br />
SYNOPSIS
KEY FINDINGS<br />
• New Zealand adults (16 years and above) visited the coast on average 3.8 times each month. This<br />
suggests there were over 12 million individual visitations to the coast with 2.2 million coastal activity<br />
participants.<br />
• In the last 12 months, males and females visited the coast equally, but females spent fewer hours per<br />
visit. Swimming and wading was the most popular activity (49%), followed by kai gathering for food<br />
(23%) and boating (16%).<br />
• Nearly three in ten New Zealanders cannot swim or float in the ocean for more than a few minutes.<br />
• Only 9% of New Zealand adults swam further than 50m in the ocean in 20<strong>21</strong>, while over one quarter<br />
have never swum this distance in the ocean.<br />
• New Zealand has a 44% higher ten-year average beach and coastal fatal drowning rate per capita<br />
(per <strong>10</strong>0,000 pop.) than Australia.<br />
• Males are fatally drowning more than females on our beaches and coastline. Of those who died from<br />
drowning over the last ten years, males represent 87% and females 13%.<br />
• Over the last ten years, Other Ethnicities had the highest fatal drowning rate per capita (2.49 per<br />
<strong>10</strong>0,000 pop.) of any ethnicity, followed by Pasifika (1.28 per <strong>10</strong>0,000 pop.) and Māori (1.15 per<br />
<strong>10</strong>0,000 pop.).<br />
• Over the last ten years, there were 167 beach and coastal drowning fatalities during the three<br />
summer months of December, January and February. This figure represents nearly half of the total<br />
annual beach and coastal drowning fatalities recorded, highlighting the increased risk associated<br />
with the busy summer season.<br />
• Over the last ten years, adults over the age of 15 accounted for 95% of all drowning fatalities in the<br />
beach and coastal environment. The 35-54 and 65+ age groups have the greatest number of fatal<br />
drownings.<br />
• Over the last ten years, 38% of beach and coastal fatal drownings occurred at a surf beach in New<br />
Zealand. Rip currents are the greatest hazard at a surf beach.<br />
• Over the last ten years, swimming/wading, boating, and falls (trips/slips) have been the highest risk<br />
activities on the coast. Last year swimming/wading, snorkelling and boating were the highest risk<br />
activities.<br />
New Zealander’s love the coast. Sadly, in the last ten years, there<br />
have been 357 beach and coastal fatal drownings in New Zealand.<br />
Each one leaves families and communities devastated. Our drowning<br />
toll is something every New Zealander should see as a national<br />
tragedy and one we all have a responsibility to address.<br />
SURF LIFE SAVING NEW ZEALAND NATIONAL BEACH AND COASTAL SAFETY REPORT<br />
06
COMMUNITY<br />
SECTION ONE<br />
3.1M<br />
2.2M<br />
12M<br />
NEW ZEALAND<br />
ADULTS VISITED<br />
THE COAST<br />
COASTAL<br />
ACTIVITY<br />
PARTICIPANTS<br />
INDIVIDUAL<br />
COASTAL<br />
VISITATIONS<br />
49%<br />
SWIMMING/<br />
WADING<br />
23%<br />
KAI<br />
GATHERING<br />
16%<br />
BOATING
NEW ZEALAND POPULATION<br />
VISITATION & PARTICIPATION BY REGION<br />
Figure 1.1<br />
New Zealand (NZ) Population Density per Statistical<br />
Area (SA)<br />
This heat map shows the estimated NZ population density<br />
per SA area at June 2018 (Census 2018 – Stats NZ). The<br />
majority of areas with a population density greater than 2.9<br />
persons per square kilometre are located on NZ's extensive<br />
coastline.<br />
The <strong>National</strong> <strong>Coastal</strong> <strong>Safety</strong> Survey 20<strong>21</strong> (NCSS20<strong>21</strong>)<br />
collected data on coastal visitation, frequency and activity<br />
participation for the regions presented in the map below.<br />
SOUTH ISLAND<br />
REST OF THE<br />
SOUTH ISLAND<br />
0.4M - VISITORS<br />
5.4 - VISITS PER MONTH<br />
2 - HOURS PER VISIT<br />
0.3M - COASTAL ACTIVITY<br />
PARTICIPANTS<br />
CANTERBURY<br />
0.4M - VISITORS<br />
2.3 - VISITS PER MONTH<br />
1.8 - HOURS PER VISIT<br />
0.3M - COASTAL ACTIVITY<br />
PARTICIPANTS<br />
SURF LIFE SAVING NEW ZEALAND NATIONAL BEACH & COASTAL SAFETY REPORT 20<strong>21</strong><br />
<strong>10</strong>
NORTH ISLAND<br />
AUCKLAND<br />
1M - VISITORS<br />
4.6 - VISITS PER MONTH<br />
2 - HOURS PER VISIT<br />
0.8M - COASTAL ACTIVITY<br />
PARTICIPANTS<br />
REST OF THE<br />
NORTH ISLAND<br />
1M - VISITORS<br />
2.8 - VISITS PER MONTH<br />
2.2 - HOURS PER VISIT<br />
0.7M - COASTAL ACTIVITY<br />
PARTICIPANTS<br />
WELLINGTON<br />
0.4M - VISITORS<br />
4.6 - VISITS PER MONTH<br />
1.7 - HOURS PER VISIT<br />
0.2M - COASTAL ACTIVITY<br />
PARTICIPANTS<br />
Population density by Statistical Area<br />
(Census 2018)<br />
< 0.0<strong>21</strong> persons per km²<br />
0.0<strong>21</strong> - 0.544 persons per km²<br />
0.544 - 1.762 persons per km²<br />
1.762 - 2.941 persons per km²<br />
> 2.941 persons per km²<br />
SECTION ONE<br />
11<br />
COMMUNITY
COASTAL VISITATION<br />
NATIONAL VISITATION & PARTICIPATION<br />
3.1M 3.8 2.0<br />
HOURS/ 2.2M<br />
NZ ADULTS VISITED<br />
THE COAST<br />
VISITS/MONTH<br />
VISIT<br />
COASTAL ACTIVITY<br />
PARTICIPANTS<br />
COASTAL PARTICIPATION SUMMARY<br />
New Zealanders love the coast. To better understand how<br />
the coast is used, the annual <strong>National</strong> <strong>Coastal</strong> <strong>Safety</strong> Survey<br />
(NCSS) explores coastal participation, behaviours and<br />
perceptions. Between May <strong>2020</strong> and April 20<strong>21</strong>, 3.1 million<br />
New Zealand adults (16 years and above) visited the coast<br />
on average 3.8 times each month. This suggests that there<br />
were over 12 million individual visitations to the coast with<br />
2.2 million coastal activity participants (Figure 1.2).<br />
The OmniPoll <strong>National</strong> <strong>Coastal</strong> and Water <strong>Safety</strong> Survey in<br />
New Zealand is conducted online among a national sample<br />
of <strong>10</strong>00 people aged 16 and over. In the OmniPoll annual<br />
research, participation is asked for several coastal activities<br />
and refers to the past 12 months. The OmniPoll research<br />
has predominately a beach and coastal focus. For boating/<br />
watercraft/ jet ski, this also include activities in bay, harbour,<br />
estuary, off shore …but not in lake or river.<br />
Figure 1.2<br />
<strong>Coastal</strong> Participation By Activity And Gender<br />
In the last 12 months, males and females visited the coast equally, but females spend less hours per visit. Swimming and<br />
wading was the most popular activity (49%), followed by kai gathering for food (23%) and boating (16%).<br />
SCUBA<br />
1% DIVING<br />
55%<br />
SWIMMING/<br />
WADING 49%<br />
45%<br />
JET SKI/<br />
3% PWC<br />
35%<br />
25%<br />
KAI<br />
GATHERING 23%<br />
15%<br />
SURFIING<br />
6%<br />
5%<br />
BOATING<br />
16%<br />
ROCK<br />
6% FISHING<br />
LAND-BASED<br />
FISHING <strong>10</strong>%<br />
6% SNORKELLING<br />
WATERCRAFT 7%<br />
Net Occasional<br />
Net Frequent<br />
Net Occasional: people who occasionally participate in coastal activities (11 times per year to less than once a year.<br />
Net Frequent: people who often participate in coastal activities (everyday to 3 times per month).<br />
SURF LIFE SAVING NEW ZEALAND NATIONAL BEACH & COASTAL SAFETY REPORT 20<strong>21</strong><br />
12
COVID-19 IMPACTS<br />
CHANGES TO COASTAL VISITATION & PARTICIPATION<br />
Figure 1.3<br />
Did New Zealanders Visit The Coast More Or Less In The Last <strong>Year</strong> - Why & By Activity<br />
Recent unprecedented challenges have anecdotally affected coastal participation trends. When asked if, how and why<br />
coastal visitations had changed in the last year, 34% New Zealand adults have visited the coast less and 19% more often<br />
than in previous years. For those who visited less, 38% attributed this change due to COVID-19 restrictions, while 16% of<br />
those who visited more couldn’t travel overseas. <strong>Coastal</strong> activities also observed changes. For example, 35% of surfers<br />
and 34% of PWC users went more often this summer, while 40% of water craft users went less than in previous years.<br />
Understanding these changes is important to ensure coastal safety services remain relevant and able to support the<br />
community.<br />
No overseas travel,<br />
can only travel in Australia<br />
Place to relax or to exercise<br />
Moved closer to<br />
the coast/ relocated<br />
Weather,hotter,<br />
more sunny days<br />
Because of lockdown,<br />
to go out<br />
Other<br />
For the kids<br />
16%<br />
14%<br />
13%<br />
12%<br />
<strong>10</strong>%<br />
9%<br />
7%<br />
19%<br />
5%<br />
42%<br />
About the same<br />
as in previous<br />
years<br />
42%<br />
38%<br />
17%<br />
9%<br />
8%<br />
8%<br />
Covid/restrictions<br />
Busy, lack of time,<br />
less time than before<br />
Other<br />
Change in personal<br />
circumstances<br />
Bad weather/<br />
cold weather<br />
More free time<br />
Because of Covid /<br />
Covid restrictions (NFI)<br />
New habit<br />
7%<br />
5%<br />
4%<br />
34%<br />
8%<br />
7%<br />
Too crowded, to stay<br />
away from people<br />
Illness, health issues<br />
Can't say<br />
The only place to go these<br />
days,no covid, no mask<br />
For food gathering<br />
3%<br />
3%<br />
2%<br />
About the same as in<br />
previous years<br />
Less often than in<br />
previous years<br />
More often than in<br />
previous years<br />
Can’t say<br />
6%<br />
4%<br />
Can't say<br />
Cost, price<br />
Working from home<br />
0 5 <strong>10</strong> 15 20<br />
2%<br />
40 35 30 25 20 15 <strong>10</strong> 5 0<br />
No one to go with<br />
1%<br />
2%<br />
3%<br />
27%<br />
35%<br />
30%<br />
35%<br />
33%<br />
32%<br />
Swimming/<br />
Wading<br />
Surfing<br />
Boating<br />
36%<br />
32%<br />
33%<br />
3%<br />
25%<br />
33%<br />
30% 30%<br />
39%<br />
29%<br />
PWC<br />
Other<br />
Watercraft<br />
Rock<br />
Fishing<br />
39%<br />
40%<br />
32%<br />
1%<br />
3%<br />
5%<br />
23%<br />
31%<br />
29%<br />
34%<br />
30%<br />
52%<br />
Land-Based<br />
Fishing<br />
24%<br />
Snorkelling<br />
Kai<br />
Gathering<br />
32%<br />
37%<br />
More often than in previous years Less often than in previous years Or about the same as in previous years Can’t say<br />
SECTION ONE<br />
13<br />
COMMUNITY
ACTIVITY PARTICIPATION<br />
PARTICIPATION BY GENDER, FREQUENCY & REGION<br />
48%<br />
MALE<br />
52%<br />
FEMALE<br />
TOTAL 1.8M<br />
59%<br />
MALE<br />
41%<br />
FEMALE<br />
TOTAL 0.23M<br />
60%<br />
MALE<br />
40%<br />
FEMALE<br />
TOTAL 0.59M<br />
0.6M<br />
FREQUENT<br />
SWIMMERS<br />
1.2M<br />
OCCASIONAL<br />
SWIMMERS<br />
0.12M<br />
FREQUENT<br />
SURFERS<br />
0.11M<br />
OCCASIONAL<br />
SURFERS<br />
0.16M<br />
FREQUENT<br />
BOATERS<br />
0.42M<br />
OCCASIONAL<br />
BOATERS<br />
66<br />
HOURS/<br />
YEAR<br />
4<br />
HOURS/<br />
YEAR<br />
157<br />
HOURS/<br />
YEAR<br />
7<br />
HOURS/<br />
YEAR<br />
159<br />
HOURS/<br />
YEAR<br />
<strong>10</strong><br />
HOURS/<br />
YEAR<br />
54%<br />
48%<br />
8%<br />
5%<br />
19%<br />
15%<br />
51%<br />
8%<br />
18%<br />
39%<br />
6%<br />
13%<br />
49%<br />
3%<br />
<strong>10</strong>%<br />
49%<br />
Swimmers/Waders always<br />
choose to swim between flags<br />
when on a lifeguarded beach.<br />
64%<br />
Surfers avoid surfing under the<br />
influence of alcohol/drugs.<br />
61%<br />
Boaters always, or most of the<br />
time, fish while boating.<br />
SURF LIFE SAVING NEW ZEALAND NATIONAL BEACH AND COASTAL SAFETY REPORT 20<strong>21</strong><br />
14
<strong>Coastal</strong> participation differs by activity, gender, frequency and region. These pages show the proportion of male and<br />
female participants, the number of total, frequent and occasional participants, how many hours annually frequent vs.<br />
occasional participants spend on an activity, and the percentage of the region population who participate in each activity.<br />
Scuba diving not included due to small sample or no data<br />
66%<br />
MALE<br />
34%<br />
FEMALE<br />
TOTAL 0.22M<br />
66%<br />
MALE<br />
34%<br />
FEMALE<br />
TOTAL 0.37M<br />
59%<br />
MALE<br />
41%<br />
FEMALE<br />
TOTAL 0.85M<br />
0.11M<br />
FREQUENT<br />
ROCK FISHERS<br />
0.11M<br />
OCCASIONAL<br />
ROCK FISHERS<br />
0.17M<br />
FREQUENT<br />
LAND-BASED<br />
FISHERS<br />
0.<strong>21</strong>M<br />
OCCASIONAL<br />
LAND-BASED<br />
FISHERS<br />
0.30M<br />
FREQUENT<br />
SURFERS<br />
0.55M<br />
OCCASIONAL<br />
SURFERS<br />
127<br />
HOURS/<br />
YEAR<br />
9<br />
HOURS/<br />
YEAR<br />
<strong>10</strong>0<br />
HOURS/<br />
YEAR<br />
8<br />
HOURS/<br />
YEAR<br />
N/A<br />
HOURS/<br />
YEAR<br />
N/A<br />
HOURS/<br />
YEAR<br />
8%<br />
5%<br />
8%<br />
9%<br />
1%<br />
1%<br />
4%<br />
17%<br />
2%<br />
7%<br />
7%<br />
2%<br />
5%<br />
13%<br />
1%<br />
23%<br />
Rock fishers never wear a<br />
lifejacket or buoyancy aid.<br />
55%<br />
Land-based fishers consider<br />
land-based fishing not very<br />
hazardous or not at all hazardous.<br />
24%<br />
Kai gatherers consider the<br />
activity not very hazardous.<br />
SECTION ONE<br />
15<br />
COMMUNITY
ACTIVITY PARTICIPATION<br />
PARTICIPATION BY GENDER, FREQUENCY & REGION<br />
61%<br />
MALE<br />
39%<br />
FEMALE<br />
TOTAL 0.24M<br />
56%<br />
MALE<br />
44%<br />
FEMALE<br />
TOTAL 0.13M<br />
56%<br />
MALE<br />
44%<br />
FEMALE<br />
TOTAL 0.22M<br />
0.<strong>10</strong>M<br />
FREQUENT<br />
WATERCRAFT<br />
USERS<br />
0.14M<br />
OCCASIONAL<br />
WATERCRAFT<br />
USERS<br />
0.05M<br />
FREQUENT<br />
PWC USERS<br />
0.08M<br />
OCCASIONAL<br />
PWC USERS<br />
0.<strong>10</strong>M<br />
FREQUENT<br />
SNORKELLERS<br />
0.13M<br />
OCCASIONAL<br />
SNORKELLERS<br />
<strong>10</strong>4<br />
HOURS/<br />
YEAR<br />
6<br />
HOURS/<br />
YEAR<br />
44<br />
HOURS/<br />
YEAR<br />
6<br />
HOURS/<br />
YEAR<br />
<strong>10</strong>8<br />
HOURS/<br />
YEAR<br />
4<br />
HOURS/<br />
YEAR<br />
<strong>10</strong>%<br />
4%<br />
6%<br />
2%<br />
7%<br />
7%<br />
4%<br />
2%<br />
3%<br />
8%<br />
3%<br />
9%<br />
4%<br />
3%<br />
2%<br />
88%<br />
Watercraft users carry or use a<br />
lifejacket or a buoyancy aid.<br />
65%<br />
Users never had any<br />
Jet Ski training.<br />
37%<br />
Snorkellers have a dive plan<br />
and an emergency plan.<br />
SURF LIFE SAVING NEW ZEALAND NATIONAL BEACH AND COASTAL SAFETY REPORT 20<strong>21</strong><br />
16
ACTIVITY PARTICIPATION<br />
PROFILES & PRACTICES<br />
SWIMMERS/<br />
WADERS<br />
SURFERS<br />
BOATERS<br />
52%<br />
35-69 years old<br />
66%<br />
16-34 years old<br />
56%<br />
35-70 years old<br />
35%<br />
Swim at unpatrolled locations<br />
22%<br />
Are beginners<br />
85%<br />
Use power boat<br />
43%<br />
Always look for rip currents<br />
33%<br />
Always surf with others<br />
16%<br />
Boat further than 2<br />
nautical miles offshore<br />
49%<br />
Always swim between the flags<br />
32%<br />
Always check surf conditions<br />
with a lifeguard or other<br />
authoritative source<br />
70%<br />
Always wear a lifejacket<br />
48%<br />
Feel experienced enough<br />
to take some risks<br />
64%<br />
Always avoid alcohol/drugs<br />
when surfing<br />
78%<br />
Always carry safety equipment<br />
ROCK<br />
FISHERS<br />
LAND-BASED<br />
FISHERS<br />
KAI<br />
GATHERERS<br />
65%<br />
25-49 years old<br />
55%<br />
35-69 years old<br />
71%<br />
25-69 years old<br />
23%<br />
Never wear a lifejacket<br />
or buoyancy aid<br />
38%<br />
Never wear a lifejacket or<br />
buoyancy aid<br />
39%<br />
Gather from the beach<br />
46%<br />
Always avoid alcohol/drug<br />
33%<br />
Never carry EPIRB/phone<br />
23%<br />
Go at least once a year<br />
26%<br />
Consider rock fishing<br />
not very hazardous<br />
48%<br />
Always wear appropriate<br />
clothing/footwear<br />
44%<br />
Go to a beach<br />
42%<br />
Rock fishers feel experienced<br />
enough to take some risk<br />
53%<br />
Consider it reasonable to<br />
consume alcohol while fishing<br />
24%<br />
Consider activity not very<br />
hazardous<br />
WATERCRAFT<br />
USERS<br />
PWC<br />
USERS<br />
SNORKELLERS<br />
64%<br />
16-34 years old<br />
69%<br />
16-34 years old<br />
52%<br />
35-69 years old<br />
29%<br />
Always carry safety equipment<br />
65%<br />
Never had any jet ski training<br />
56%<br />
Choose location because it is<br />
safe<br />
67%<br />
Use kayaks<br />
67%<br />
Always wear a lifejacket<br />
44%<br />
Always use safety equipment<br />
63%<br />
Choose locations they<br />
consider safe<br />
47%<br />
Always carry safety equipment<br />
47%<br />
Feel experienced enough<br />
to take some risks<br />
60%<br />
Always wear a lifejacket<br />
46%<br />
Are beginners<br />
70%<br />
Can swim 50m in ocean<br />
without stopping<br />
SECTION ONE<br />
17<br />
COMMUNITY
SWIMMING ABILITY<br />
CONFIDENCE & ABILITY IN COASTAL WATERS<br />
Figure 1.4<br />
Unaided Swimming Ability In <strong>Coastal</strong> Waters<br />
Nearly three in ten New Zealanders cannot swim or float in the ocean for more<br />
than a few minutes.<br />
Figure 1.5<br />
The Last Time Participants Swam More<br />
Than 50m In The Ocean<br />
Only 9% of New Zealand adults swam<br />
further than 50m in the ocean in 20<strong>21</strong><br />
while over one quarter have never swum<br />
this distance in the ocean.<br />
In 20<strong>21</strong> 9%<br />
9%<br />
7%<br />
4%<br />
26%<br />
I can comfortably float and gently<br />
swim for about 15 minutes<br />
I can comfortably float for over 1<br />
minute and swim a little distance<br />
I can comfortably float and gently<br />
swim for up to 30 minutes<br />
Last year<br />
2 to 5<br />
years ago<br />
11%<br />
16%<br />
<strong>10</strong>%<br />
I cannot float or swim<br />
I can comfortably float and gently<br />
swim for up to 60 minutes<br />
More than<br />
5 years ago<br />
30%<br />
18%<br />
24%<br />
I can swim constantly for over one<br />
hour and float as long as I wish<br />
Can't say<br />
Never<br />
26%<br />
Can't say<br />
8%<br />
0 5 <strong>10</strong> 15 20 25 30 35<br />
Figure 1.6<br />
Ability To Swim 50m In The Ocean Without Touching The Bottom<br />
Swimming ability is not always very high amongst New Zealand adults. Snorkellers (70%), followed by watercraft users (68%)<br />
have the highest percentage of participants able to swim 50m in the ocean without touching the bottom.<br />
70%<br />
68%<br />
59% 59% 59%<br />
57% 57%<br />
54%<br />
51%<br />
SNORKELLING<br />
WATERCRAFT SURFING PWC ROCK<br />
FISHING<br />
BOATING<br />
KAI<br />
GATHERING<br />
SWIMMING/<br />
WADING<br />
LAND-BASED<br />
FISHING<br />
SURF LIFE SAVING NEW ZEALAND NATIONAL BEACH AND COASTAL SAFETY REPORT 20<strong>21</strong><br />
18
COASTAL SAFETY<br />
HAZARD PERCEPTION<br />
Figure 1.7<br />
Hazard Perception Of The Coast Vs.The <strong>Beach</strong><br />
Almost half (46%) of New Zealand adults believe the<br />
beach (ocean, surf zone and adjacent sandy beach) is not<br />
hazardous.<br />
Figure 1.8<br />
Proportion Who Consider The Coast To Be Very Or<br />
Extremely Hazardous By Region<br />
One in five (<strong>21</strong>%) of New Zealanders consider the coast to<br />
be extremely or very hazardous, but this differs by region.<br />
One in four participants from the rest of the South Island<br />
consider the coast to be hazardous compared to one in five<br />
in Auckland.<br />
60<br />
50<br />
Coast<br />
<strong>Beach</strong><br />
<strong>21</strong>%<br />
22%<br />
Percentage (%)<br />
40<br />
30<br />
20<br />
24%<br />
<strong>10</strong><br />
0<br />
Extremely<br />
hazardous<br />
Very<br />
hazardous<br />
Somewhat<br />
hazardous<br />
Not very<br />
hazardous<br />
Not at all<br />
hazardous<br />
Can’t<br />
Say<br />
18%<br />
22%<br />
Figure 1.9<br />
<strong>Coastal</strong> Hazards & Activities Rated Extremely Or Very Hazardous<br />
One in five (<strong>21</strong>%) New Zealanders consider the coast to be extremely or very hazardous. Rip currents remain the highest<br />
rated coastal hazard by New Zealanders, while rock fishing is regarded the most hazardous coastal activity.<br />
80<br />
70<br />
60<br />
Hazard<br />
Activity<br />
Percentage (%)<br />
50<br />
40<br />
30<br />
20<br />
<strong>10</strong><br />
0<br />
Land-Based<br />
Fishing<br />
Wading<br />
The <strong>Beach</strong><br />
Swimming<br />
Snorkelling<br />
Boating<br />
Watercraft<br />
The Rivers<br />
Surfing<br />
The Coast<br />
Scuba<br />
Diving<br />
PWC<br />
Marine<br />
Stinger<br />
Waves<br />
Rock<br />
Fishing<br />
Sharkss<br />
Rocks/<br />
Rocky Platform<br />
Sun<br />
Exposure<br />
Rip<br />
Currents<br />
SECTION ONE<br />
19<br />
COMMUNITY
COASTAL SAFETY<br />
RISK TAKING<br />
Figure 1.<strong>10</strong><br />
Participants Who Believe They Are Experienced Enough To Take Some Risks In Their <strong>Coastal</strong> Activity By Gender<br />
Across all coastal activities, males continue to believe they are experienced enough to take some risks compared to females.<br />
This is highlighted with a 20% difference in land-based fishing and 30% difference in other watercraft riders.<br />
80<br />
70<br />
60<br />
Male<br />
Female<br />
Percentage (%)<br />
50<br />
40<br />
30<br />
20<br />
<strong>10</strong><br />
0<br />
Swimming/<br />
Wading<br />
Surfing<br />
Watercraft<br />
Rock Fishing<br />
Land-Based<br />
Fishing<br />
Boating<br />
Snorkelling<br />
PWC<br />
Figure 1.11<br />
Play Safe Index Vs. Risk Taking By Gender<br />
The Play Safe Index has been developed to show how often activity participants follow safety practices. Here we compare<br />
this against self-reported belief in whether they are experienced enough to take risk. This revealed a clear separation<br />
between genders. Males were more likely to take risks and less likely to follow safety practices, while the opposite was true<br />
for female participants.<br />
60<br />
Male<br />
Female<br />
65<br />
70<br />
PlaySafe Index (%)<br />
75<br />
80<br />
85<br />
90<br />
95<br />
20 25 30 35 40 45 50 55 60 65<br />
Participants experienced enough to take risks (%)<br />
SURF LIFE SAVING NEW ZEALAND NATIONAL BEACH AND COASTAL SAFETY REPORT 20<strong>21</strong><br />
20
COASTAL SAFETY<br />
COASTAL RESCUES<br />
The role that bystander rescuers play in preventing<br />
drowning incidents cannot be underestimated, often they<br />
are the only form of assistance outside patrolled areas<br />
or times. Exploring perceptions helps to understand<br />
behaviours surrounding rescue incidents. A clear disparity<br />
exists between the numbers of rescues from the perspective<br />
of the rescuer or the rescuee, with fewer New Zealanders<br />
considering themselves as rescuees.<br />
9%<br />
NZ ADULTS<br />
HAVE RESCUED<br />
SOMEONE<br />
7%<br />
NZ ADULTS<br />
HAVE BEEN<br />
RESCUED<br />
Most rescuers were rescuing a stranger (52%), at a beach<br />
(54%), in the afternoon (45%), and away from Surf Life<br />
Saving services (70%). Bystander rescue events are often<br />
highly emotive events and can also be fatal when the rescuer<br />
gets in trouble themselves. Previous research has revealed a<br />
major factor in these tragic situations is the lack of flotation<br />
devices used or taken when enacting a rescue, here nearly<br />
half reported not using any rescue or flotation equipment<br />
(46%). These results support the call for further water safety<br />
and rescue training to be made readily available, to build<br />
our community of 'everyday' surf lifesavers.<br />
70%<br />
OCCURRED AWAY FROM<br />
SLS/LIFEGUARDS<br />
52%<br />
WERE RESCUING<br />
A STRANGER<br />
54%<br />
RESCUES OCCURRED<br />
AT A BEACH<br />
45%<br />
OCCURRED<br />
BETWEEN 12-4PM<br />
Figure 1.12<br />
Participants Who Have Been Rescued Or Rescued<br />
Someone Else By Gender & Activity<br />
Half (50%) of scuba divers have reported rescuing others<br />
while diving, but only 8% report having been rescued<br />
themselves.<br />
Figure 1.13<br />
Equipment Used By Rescuers<br />
Nearly half of all rescues were conducted without the use of<br />
any rescue or flotation equipment (46%).<br />
Percentage (%)<br />
50<br />
40<br />
30<br />
20<br />
<strong>10</strong><br />
0<br />
Swimming/<br />
Wading<br />
Rescued<br />
Rescuer<br />
Surfing<br />
Other<br />
Watercraft<br />
Rock<br />
Fishing<br />
Land-Based<br />
Fishing<br />
Activity<br />
Boating<br />
Snorkelling<br />
Scuba<br />
Diving*<br />
PWC<br />
*Small sample size<br />
<strong>10</strong>%<br />
11%<br />
9%<br />
6%<br />
16%<br />
3%<br />
46%<br />
Did Not Use<br />
Flotation<br />
Device<br />
46%<br />
None<br />
Lifejacket<br />
Rescue Tube<br />
Board<br />
Life Buoy<br />
Other or Watercraft<br />
Unknown<br />
SECTION ONE<br />
<strong>21</strong><br />
COMMUNITY
FEATURE: RIP CURRENTS AND THE 3R’S<br />
A SAFETY AWARENESS CAMPAIGN<br />
RRip currents are known to have<br />
contributed to 11% of drowning<br />
deaths at beaches between <strong>2011</strong><br />
and <strong>2020</strong> (provisional results). The<br />
data suggested a strong relationship<br />
between rip currents, beaches, and<br />
swimming/wading incidents.<br />
PEOPLE’S PERCEPTION OF THE RIP CURRENT HAZARD<br />
Figure 1.14<br />
Percentage Of People That Consider The Hazard Extremely Or Very<br />
Hazardous<br />
80<br />
70<br />
AWARENESS: RIPS ARE THE NUMBER<br />
ONE COASTAL HAZARD<br />
Three out of four NZ adults (76%)<br />
consider rip currents to be extremely<br />
or very dangerous. When asked what<br />
the biggest concern was when visiting<br />
the coast, 44% was extremely or<br />
very concerned about being caught<br />
unintentionally in a rip (Figure 1.15).<br />
Percentage (%)<br />
60<br />
50<br />
40<br />
30<br />
20<br />
<strong>10</strong><br />
0<br />
Rip<br />
Currents<br />
Sun<br />
Exposure<br />
Rocks/<br />
Rocky Platform<br />
Sharks<br />
Waves<br />
Figure 1.15<br />
Percentage Of People That Are Extremely Or Very Concerned<br />
50<br />
Research<br />
suggests the 3Rs<br />
campaign is clear<br />
and resonates with<br />
the New Zealand<br />
public. While we<br />
have an effective<br />
behaviour change<br />
tool, campaign<br />
exposure needs to<br />
be greater, more<br />
consistent and<br />
communicated<br />
in an authentic<br />
manner to a<br />
wider range of<br />
communities.<br />
Percentage (%)<br />
40<br />
30<br />
20<br />
<strong>10</strong><br />
0<br />
The Water Quality<br />
Being hit in the<br />
water by a board<br />
or watercraft<br />
Being stung<br />
by a jellyfish<br />
Figure 1.16<br />
People That Are Confident Identifying a Rip Current<br />
43%<br />
4%<br />
53%<br />
Not Confident<br />
53%<br />
Not Confident<br />
Confident<br />
Can’t Say<br />
Being caught<br />
unintentionally<br />
in a rip<br />
SURF LIFE SAVING NEW ZEALAND NATIONAL BEACH AND COASTAL SAFETY REPORT 20<strong>21</strong><br />
22
FEATURE: RIP CURRENTS AND THE 3R’S<br />
A SAFETY AWARENESS CAMPAIGN<br />
However, only 39% could identify a rip correctly. From<br />
those that were very confident they could identify a rip, only<br />
half identified them correctly (50%). New Zealanders who<br />
think they can spot rips, highly competent ocean swimmers<br />
and those who have previously been caught in a rip are<br />
most aware of this danger.<br />
THE 3 R’S SAFETY MESSAGE<br />
In February 2019, Surf Life Saving New Zealand introduced<br />
the 3R’s Rip Survival Plan poster (Figure 1.16) to increase<br />
awareness and knowledge on what to do if caught in<br />
a rip. Rip currents are not always easy to identify, so the<br />
message focused on what to do if the situation arises. The<br />
3R’s message was composed of three simple and easy-toremember<br />
steps that stated:<br />
R – Relax & float to conserve energy<br />
R – Raise your hand to signal for help<br />
R – Ride the rip until it stops & you can swim back to shore<br />
or help arrives<br />
This year the <strong>National</strong> <strong>Coastal</strong> <strong>Safety</strong> Survey (NCSS)<br />
evaluated the impact and exposure of the poster as reported<br />
by the NZ public for the first time.<br />
Only 15% have recognised the 3R’s poster and 18% said<br />
they have heard of the 3R’s message (Relax, Raise and Ride)<br />
before. Interestingly, 27% of the 16-24 years old recognised<br />
the poster, indicating that the younger people have been<br />
more exposed to the poster compared to the average<br />
percentage.<br />
When asked whether the 3R’s poster conveys a clear and<br />
informative message, 92% said the messages on the poster<br />
are clear and easy to understand, and 90% feel better<br />
informed on what to do if caught in a rip current. However,<br />
when asked which options they would use if caught in a rip<br />
current, 1 in 4 would not apply the 3R’s in full.<br />
Nevertheless, the responses above demonstrate the<br />
potential for the campaign to change behaviour with<br />
adequate campaign exposure.<br />
SUMMARY<br />
The 3R’s campaign is clear and resonates with the NZ<br />
population. The campaign has intrinsic value with clear<br />
messaging that communicates it is possible to escape<br />
rip currents and has the potential to change behaviour<br />
(campaign below). However, the overall messaging over the<br />
past few years was not visible enough and therefore did not<br />
cut through or was diluted due to its lack of exposure. These<br />
results show that we have an effective behaviour change tool<br />
with potential to be expanded but suggest that campaign<br />
exposure needs to be greater and more consistent to see<br />
these changes reflected within the NZ community.<br />
Figure 1.17<br />
20<strong>21</strong> <strong>National</strong> <strong>Coastal</strong> <strong>Safety</strong> Survey (NCSS) Question:<br />
Thinking now about these different options to get out<br />
of a rip. Which options would you personally use if you<br />
were caught in a rip?<br />
Rip Survival Plan<br />
Percentage (%)<br />
80<br />
70<br />
60<br />
50<br />
40<br />
30<br />
20<br />
to conserve your energy<br />
your Hand<br />
to signal for help<br />
<strong>10</strong><br />
0<br />
Relax, stay calm and float<br />
Raise your hand to<br />
signal for help<br />
Ride the rip until it stops<br />
and you can swim back<br />
to shore or help arrives<br />
the Rip<br />
until it stops & you can<br />
swim back to shore or<br />
help arrives<br />
3Rs Messages<br />
SECTION ONE<br />
23<br />
COMMUNITY
CAPABILITY<br />
SECTION TWO<br />
<strong>10</strong>-YEAR OVERVIEW | <strong>2011</strong>-<strong>21</strong><br />
&<br />
1-YEAR OVERVIEW | <strong>2020</strong>-<strong>21</strong><br />
STATISTICS | <strong>2011</strong>-<strong>21</strong><br />
1,136,315<br />
PREVENTATIVE<br />
ACTIONS<br />
11,364<br />
RESCUES<br />
7,866<br />
ASSISTS<br />
3,397<br />
SEARCHES<br />
INVOLVING<br />
4,472,325<br />
MEMBERS OF THE PUBLIC<br />
45<br />
SEARCH & RESCUE<br />
SQUADS<br />
24,163<br />
FIRST AID<br />
TREATMENTS
CAPABILITY<br />
Surf Life Saving New Zealand has provided a Surf<br />
Lifeguard Service to the New Zealand public for 111 years.<br />
The service consists of 74 volunteer Surf Life Saving Clubs<br />
and Paid Surf Lifeguard Service. When combined, these<br />
services patrol a total 80+ locations country-wide. During<br />
<strong>2020</strong>-<strong>21</strong> there were 4,6<strong>21</strong> qualified Surf Lifeguards, with<br />
925 gaining their Surf Lifeguard Award during the season.<br />
Beyond the red and yellow flags, Surf Life Saving New<br />
Zealand provides surveillance at many remote beaches and<br />
coastlines through a fleet of Inflatable Rescue Boats, Rescue<br />
Water Craft, All-Terrain Vehicles and 4x4’s, and delivers an<br />
invaluable Search and Rescue service, through a network of<br />
Volunteer Search & Rescue Squads.<br />
VOLUNTEER SURF LIFEGUARDS<br />
Seasonal patrols are provided by 74 volunteer Surf Life<br />
Saving Clubs, with patrols typically occurring between<br />
Labour Weekend (October) and Easter (April). Over the past<br />
few years, Surf Life Saving Clubs have been reviewing and<br />
adapting season lengths and daily patrol timings to meet<br />
the ever-changing demands of the communities they serve.<br />
The recommended Surf Lifeguard service requirements are<br />
evidence-based and derived from coastal risk assessments,<br />
which have been tailored towards existing patrol locations<br />
nationally. The coastal risk assessment also recommend<br />
new patrol locations, based upon risk-adjusted water use<br />
values for each site. Surf Life Saving New Zealand works<br />
with Surf Life Saving Clubs, communities and stakeholders<br />
to deliver services to areas with the greatest need.<br />
Volunteer clubs use standardised equipment that includes<br />
Rescue Tubes, Rescue Boards, Inflatable Rescue Boats and<br />
Rescue Water Craft to perform rescues and preventative<br />
actions that stop the public getting into dangerous situations.<br />
The organisation also provides a number of surveillance<br />
patrols to increase service coverage. All-Terrain Vehicles and<br />
4x4 vehicles equipped with first aid and rescue equipment,<br />
ensure coverage is extended across larger stretches of the<br />
coastline and remote beaches. A number of Rescue Water<br />
Craft provide rapid response to remote areas and rock<br />
foreshores and participate in both surveillance and Search<br />
and Rescue activities.<br />
PAID SURF LIFEGUARD SERVICE<br />
The Paid Surf Lifeguard Service is funded by Regional<br />
Councils and Local Territorial Authorities. Patrols primarily<br />
run on weekdays (Monday-Friday) through the summer<br />
school holidays (December-February). An evidence-based<br />
delivery model for the Paid Surf Lifeguard Service is also<br />
being used to expand the service to meet community need.<br />
In some areas, surveillance-based patrolling methods have<br />
been used to extend patrolling hours into the evening.<br />
An approach that has been effective for preventing Surf<br />
Lifeguard fatigue. On-call based services have also been<br />
successfully trialled in the Bay of Plenty, to extend patrols<br />
in response to periods of prolonged settled weather and<br />
dangerous swimming conditions, as well as providing<br />
additional safety services to the public.<br />
SEARCH AND RESCUE<br />
SAR Squads are used to assist Search & Rescue agencies<br />
or sometimes Maritime New Zealand, in NZ Police tasked<br />
incidents. There are currently 45 active SAR Squads<br />
nationally. In <strong>2020</strong>-<strong>21</strong> SAR Squads were involved in 91<br />
Category One and 1 Category Two SAR Operations. As a<br />
result of the operations, 78 people were rescued, of which<br />
60 people's lives were saved, with a further 35 people<br />
assisted to safety.<br />
SAR Squads were also involved in retrieving 15 persons<br />
who died returning them back to their whanau and loved<br />
ones. Surf Lifeguards provided over 1,091 hours of volunteer<br />
service as part of official SAR Operations.<br />
SURF LIFEGUARD INTERVENTIONS <strong>2011</strong>-<strong>21</strong><br />
The interventions performed whilst Surf Lifeguards have<br />
been protecting our beaches in the last decade have saved<br />
countless lives. The exact figure at present cannot be<br />
quantified, however through these actions Surf Life Saving<br />
New Zealand Volunteer Surf Lifeguards have likely saved<br />
more than 11,364 lives.<br />
Table 1<br />
Surf Lifeguard Interventions <strong>2011</strong>-<strong>21</strong> (last <strong>10</strong>yrs)<br />
SURF LIFEGUARD<br />
INTERVENTION<br />
TOTALS<br />
(<strong>2011</strong>-<strong>21</strong>)<br />
Rescues / Lives Saved 11,364<br />
Assists (new category since 2016/17) 7,866<br />
Preventative Actions<br />
People in Preventatives: 3,775,982<br />
1,136,315<br />
Searches 3,397<br />
First Aid Treatments 24,163<br />
TOTAL INTERVENTIONS 1,183,203<br />
SURF LIFE SAVING NEW ZEALAND NATIONAL BEACH & COASTAL SAFETY REPORT 20<strong>21</strong><br />
26
CAPABILITY<br />
1-YEAR OVERVIEW | <strong>2020</strong>-<strong>21</strong><br />
Figure 2.1<br />
<strong>2020</strong>-<strong>21</strong>: Qualifications held by Surf Lifeguards.<br />
There were a total of 4,6<strong>21</strong> proficient Surf Lifeguards in <strong>2020</strong>-<strong>21</strong>, of which 925 were new recipients of the Surf Lifeguard<br />
Award. <strong>SLSNZ</strong> Surf Lifeguards currently hold a total of 9,938 awards, with 2,796 first aid awards and 1,509 craft<br />
qualifications (IRB and RWC).<br />
PATROL<br />
SUPPORT<br />
171<br />
ADVANCED<br />
LIFEGUARD<br />
AWARD<br />
18<br />
SENIOR<br />
LIFEGUARD<br />
AWARD<br />
PATROL<br />
CAPTAIN<br />
81<br />
FIRST AID<br />
2,796<br />
IRB<br />
CREWSPERSONS<br />
MODULE<br />
501<br />
SURF LIFEGUARD<br />
AWARD<br />
4,6<strong>21</strong><br />
RADIO<br />
OPERATOR<br />
CERTIFICATE<br />
309<br />
ROCK<br />
TRAINING &<br />
RESCUE<br />
MODULE<br />
433<br />
SENIOR<br />
LIFEGUARD<br />
AWARD<br />
IRB DRIVER<br />
932<br />
RESCUE<br />
WATER<br />
CRAFT<br />
OPERATORS<br />
AWARD<br />
76<br />
Figure 2.2<br />
<strong>2020</strong>-<strong>21</strong>: Patrolling Surf Lifeguards per Region<br />
800<br />
700<br />
Male Lifeguards<br />
Female Lifeguards<br />
Lifeguards (n)<br />
600<br />
500<br />
400<br />
300<br />
200<br />
<strong>10</strong>0<br />
0<br />
NTL AUK WKO BOP GIS TKI MWT HKB WGN NSN MBH WTC CAN OTA STL<br />
Region<br />
SECTION TWO<br />
27<br />
CAPABILITY
SURF LIFE SAVING PATROL LOCATIONS<br />
1-YEAR OVERVIEW | <strong>2020</strong>-<strong>21</strong><br />
Figure 2.3<br />
<strong>2020</strong>-<strong>21</strong>: Surf Life Saving Patrol Locations per Region<br />
There are a total of 74 Surf Life Saving Clubs in New Zealand who provide voluntary patrols during varying season lengths<br />
between Labour and Easter weekends.<br />
46<br />
Northland<br />
6<br />
13<br />
Auckland<br />
Bay of Plenty<br />
<strong>10</strong><br />
288<br />
8<br />
Waikato<br />
Gisborne<br />
5<br />
4<br />
Taranaki<br />
ND<br />
Tasman<br />
1<br />
Nelson<br />
Hawke’s Bay<br />
5<br />
Manawatu-Wanganui<br />
5<br />
Wellington<br />
8<br />
2<br />
West Coast<br />
Marlborough<br />
1<br />
Canterbury<br />
<strong>10</strong><br />
1<br />
Southland<br />
Otago<br />
5<br />
SURF LIFE SAVING NEW ZEALAND NATIONAL BEACH & COASTAL SAFETY REPORT 20<strong>21</strong><br />
28
SURF LIFEGUARD CAPABILITY<br />
1-YEAR OVERVIEW | <strong>2020</strong>-<strong>21</strong><br />
Figure 2.4<br />
<strong>2020</strong>-<strong>21</strong>: Total Volunteer Surf Life Saving Patrols and Paid Surf Lifeguard Services per Region<br />
There are a total of 74 Surf Life Saving Clubs in New Zealand which provide voluntary patrols, up to a maximum season<br />
length between Labour and Easter weekends. The Paid Surf Lifeguard Service (Monday-Friday) provides 80 Surf Lifeguard<br />
Patrols nationally.<br />
15<br />
12<br />
Volunteer Surf Life Saving Patrols<br />
Contract Surf Lifeguard Service<br />
Patrols (n)<br />
9<br />
6<br />
3<br />
0<br />
NTL AUK WKO BOP GIS TKI MWT HKB WGN NSN MBH WTC CAN OTA STL<br />
Region<br />
Figure 2.5<br />
<strong>2020</strong>-<strong>21</strong>: Equipment Used in a Rescue<br />
Figure 2.6<br />
<strong>2020</strong>-<strong>21</strong>: Patrolling Surf Lifeguards<br />
1%<br />
5%<br />
19%<br />
33%<br />
42%<br />
IRB<br />
42%<br />
IRB<br />
Rescue Tube<br />
Rescue Board<br />
RWC<br />
No Gear<br />
55%<br />
MALE<br />
45%<br />
FEMALE<br />
SECTION TWO<br />
29<br />
CAPABILITY
RESCUES PER REGION<br />
1-YEAR OVERVIEW | <strong>2020</strong>-<strong>21</strong><br />
“Rescue - Where a person requires immediate help to return to shore (or place of safety)<br />
and who without intervention would have suffered distress, injury or drowning.”<br />
Figure 2.7<br />
<strong>2020</strong>-<strong>21</strong>: Rescues per Region<br />
Northland 28<br />
<strong>2020</strong>-<strong>21</strong><br />
513<br />
RESCUES<br />
1<strong>10</strong> Auckland<br />
142 Waikato<br />
Bay of Plenty<br />
38<br />
Gisborne<br />
8<br />
14<br />
Taranaki<br />
Hawke’s Bay<br />
15<br />
Tasman<br />
ND 5<br />
Nelson<br />
Manawatu-Wanganui<br />
14<br />
Wellington<br />
8<br />
0<br />
West Coast<br />
Marlborough<br />
3<br />
Key to Rescues per Region<br />
1 - 43 Rescues<br />
Canterbury 88<br />
43 - 86 Rescues<br />
86 - 130 Rescues<br />
130 - 173 Rescues<br />
0<br />
Southland<br />
Otago 40<br />
ND<br />
173 - <strong>21</strong>6 Rescues<br />
No Data<br />
SURF LIFE SAVING NEW ZEALAND NATIONAL BEACH & COASTAL SAFETY REPORT 20<strong>21</strong><br />
30
ASSISTS PER REGION<br />
1-YEAR OVERVIEW | <strong>2020</strong>-<strong>21</strong><br />
“Assist - Where a person requires assistance to return to shore but would most likely be<br />
able to get themselves out of danger if unaided.”<br />
Figure 2.8<br />
<strong>2020</strong>-<strong>21</strong>: People Assisted to <strong>Safety</strong> per Region<br />
Northland 70<br />
<strong>2020</strong>-<strong>21</strong><br />
1,142<br />
ASSISTS<br />
<strong>21</strong>1 Auckland<br />
252 Waikato<br />
Bay of Plenty 151<br />
Gisborne 37<br />
59<br />
Taranaki<br />
Hawke’s Bay<br />
42<br />
Tasman<br />
ND 25<br />
Nelson<br />
Manawatu-Wanganui<br />
39<br />
Wellington 23<br />
11<br />
West Coast<br />
Marlborough<br />
1<br />
Key to Assists per Region<br />
1 - 34 Assists<br />
Canterbury<br />
173<br />
34 - 69 Assists<br />
69 - <strong>10</strong>3 Assists<br />
<strong>10</strong>3 - 138 Assists<br />
4<br />
Southland<br />
Otago 44<br />
ND<br />
138 - 172 Assists<br />
No Data<br />
SECTION TWO<br />
31<br />
CAPABILITY
MAJOR FIRST AID INCIDENTS PER REGION<br />
1-YEAR OVERVIEW | <strong>2020</strong>-<strong>21</strong><br />
“Major First Aid - Any incident where a patient is administered some form of advanced<br />
medical treatment, or requires hospitalization.”<br />
Figure 2.9<br />
<strong>2020</strong>-<strong>21</strong>: Major First Aid Incidents per Region<br />
Northland 31<br />
89<br />
Auckland<br />
Bay of Plenty<br />
49<br />
<strong>2020</strong>-<strong>21</strong><br />
313<br />
MAJOR<br />
FIRST AID<br />
INCIDENTS<br />
Tasman<br />
77 Waikato<br />
5 Taranaki<br />
ND 1<br />
Nelson<br />
Gisborne<br />
Hawke’s Bay 5<br />
Manawatu-Wanganui <strong>10</strong><br />
Wellington 14<br />
6<br />
0<br />
West Coast<br />
Marlborough<br />
0<br />
Key to Major First Aid Treatments<br />
per Region<br />
1 - <strong>10</strong> Treatments<br />
Canterbury<br />
16<br />
<strong>10</strong> - <strong>21</strong> Treatments<br />
<strong>21</strong> - 31 Treatments<br />
31 - 42 Treatments<br />
0<br />
Southland<br />
Otago <strong>10</strong><br />
ND<br />
42 - 52 Treatments<br />
No Data<br />
SURF LIFE SAVING NEW ZEALAND NATIONAL BEACH & COASTAL SAFETY REPORT 20<strong>21</strong><br />
32
MINOR FIRST AID INCIDENTS PER REGION<br />
1-YEAR OVERVIEW | <strong>2020</strong>-<strong>21</strong><br />
“Minor First Aid - Where a patient is administered some form of<br />
minor medical treatment.”<br />
Figure 2.<strong>10</strong><br />
<strong>2020</strong>-<strong>21</strong>: Minor First Aid Incidents per Region<br />
Northland<br />
<strong>10</strong>8<br />
457<br />
Auckland<br />
Bay of Plenty<br />
345<br />
<strong>2020</strong>-<strong>21</strong><br />
1,873<br />
MINOR<br />
FIRST AID<br />
INCIDENTS<br />
Tasman<br />
480 Waikato<br />
39 Taranaki<br />
ND 7<br />
Nelson<br />
Gisborne 46<br />
Hawke’s Bay 36<br />
Manawatu-Wanganui 27<br />
Wellington 85<br />
5<br />
West Coast<br />
Marlborough<br />
17<br />
Key to Minor First Aid Treatments<br />
per Region<br />
0 - 69 Treatments<br />
Canterbury<br />
180<br />
69 - 138 Treatments<br />
138 - 207 Treatments<br />
207 - 276 Treatments<br />
0<br />
Southland<br />
Otago<br />
41<br />
ND<br />
276 - 345 Treatments<br />
No Data<br />
SECTION TWO<br />
33<br />
CAPABILITY
SEARCHES PER REGION<br />
1-YEAR OVERVIEW | <strong>2020</strong>-<strong>21</strong><br />
“Search - Any organised search for a missing person or group either at sea or on land.<br />
Searches include body recoveries.”<br />
Figure 2.11<br />
<strong>2020</strong>-<strong>21</strong>: Patrol Searches per Region<br />
Northland 25<br />
<strong>2020</strong>-<strong>21</strong><br />
355<br />
SEARCHES<br />
99 Auckland<br />
78 Waikato<br />
7 Taranaki<br />
Bay of Plenty<br />
54<br />
Gisborne 12<br />
Hawke’s Bay<br />
<strong>10</strong><br />
Tasman<br />
ND 5<br />
Nelson<br />
Manawatu-Wanganui<br />
7<br />
Wellington<br />
2<br />
4<br />
West Coast<br />
Marlborough<br />
2<br />
Canterbury<br />
33<br />
Key to Searches per Region<br />
1 - 12 Searches<br />
12 - 24 Searches<br />
24 - 37 Searches<br />
37 - 49 Searches<br />
1<br />
Southland<br />
Otago 16<br />
ND<br />
49 - 61 Searches<br />
No Data<br />
SURF LIFE SAVING NEW ZEALAND NATIONAL BEACH & COASTAL SAFETY REPORT 20<strong>21</strong><br />
34
PREVENTATIVE ACTIONS PER REGION<br />
1-YEAR OVERVIEW | <strong>2020</strong>-<strong>21</strong><br />
“Preventative Action - Direct action taken to reduce or eliminate the probability of a<br />
specific rescue, first aid or other reportable incident occuring.”<br />
Figure 2.12<br />
<strong>2020</strong>-<strong>21</strong>: Preventative Actions per Region<br />
Northland<br />
3,991<br />
17,704<br />
Auckland<br />
Bay of Plenty<br />
17,833<br />
<strong>2020</strong>-<strong>21</strong><br />
111,861<br />
PREVENTATIVE<br />
ACTIONS<br />
14,893 Waikato<br />
11,861 Taranaki<br />
11 Nelson<br />
ND Tasman<br />
Gisborne 1,478<br />
Hawke’s Bay 4,912<br />
Manawatu-Wanganui 9,478<br />
Wellington<br />
6,076<br />
27<br />
West Coast<br />
Marlborough<br />
329<br />
Key to Preventative Actions per Region<br />
1 - 3,522 Actions<br />
Canterbury<br />
18,573<br />
3,522 - 7,038 Actions<br />
7,038 - <strong>10</strong>,553 Actions<br />
<strong>10</strong>,553 - 14,069 Actions<br />
33<br />
Southland<br />
Otago 4,562<br />
ND<br />
14,069 - 17,585 Actions<br />
No Data<br />
SECTION TWO<br />
35<br />
CAPABILITY
INCIDENT ANALYSIS<br />
SECTION THREE<br />
<strong>10</strong>-YEAR OVERVIEW | <strong>2011</strong>-<strong>21</strong><br />
KEY DEMOGRAPHICS | <strong>2011</strong>-<strong>21</strong><br />
<strong>21</strong>,575<br />
6-15<br />
<strong>21</strong>-30<br />
INCIDENTS<br />
DURING<br />
<strong>2011</strong>-<strong>21</strong><br />
YEAR-OLDS<br />
BOTH<br />
GENDERS<br />
YEAR-OLD<br />
MALES<br />
31%<br />
SWIMMING/<br />
WADING<br />
59%<br />
MALE<br />
41%<br />
FEMALE
INCIDENT ANALYSIS<br />
<strong>10</strong>-YEAR OVERVIEW | <strong>2011</strong>-<strong>21</strong><br />
“Incident - Any unplanned event requiring lifesaving services intervention.”<br />
TOTAL INCIDENTS<br />
<strong>21</strong>,575<br />
IN <strong>10</strong> YEARS<br />
AVERAGE INCIDENTS<br />
2,157<br />
PER YEAR<br />
KEY DEMOGRAPHIC<br />
6-15 <strong>21</strong>-30<br />
YEAR-OLD SWIMMERS YEAR-OLD MALE SWIMMERS<br />
59%<br />
MALE<br />
41%<br />
FEMALE<br />
Figure 3.1<br />
<strong>2011</strong>-<strong>21</strong>: Incidents By Activity<br />
Total number of incidents reported<br />
n=<strong>21</strong>,575; total number of activities<br />
reported in incidents n=9,864.<br />
2% 1%<br />
Figure 3.2<br />
<strong>2011</strong>-<strong>21</strong>: Actions Performed by<br />
Lifeguards at Time of Incident<br />
More than one type of response is usually<br />
necessary at time of incident.<br />
Figure 3.3<br />
<strong>2011</strong>-<strong>21</strong>: Incidents by Status<br />
Total number of incidents reported<br />
n=<strong>21</strong>,575; total number of status level<br />
allocated to incidents n=7,009.<br />
2% 1%<br />
17%<br />
7%<br />
5%<br />
20%<br />
20%<br />
31%<br />
Swimming/<br />
Wading<br />
26%<br />
31%<br />
17%<br />
24%<br />
28%<br />
Major<br />
First Aid<br />
24%<br />
28%<br />
19%<br />
73%<br />
S4 - Stable<br />
(Unlikely to Change)<br />
73%<br />
Swimming/Wading<br />
Surfing<br />
Walking<br />
Other<br />
Boating<br />
Watercraft<br />
Land-Based Fishing<br />
Major First Aid<br />
Minor First Aid<br />
Rescues<br />
Assists<br />
Searches<br />
S4 - Stable (Unlikely to change)<br />
S3 - Stable (Possibility of worsening)<br />
S2 - Unstable<br />
S0 - Patient Deceased<br />
S1 - Life Threatening<br />
Figure 3.4<br />
Comparison Between the <strong>2011</strong>-<strong>21</strong> <strong>10</strong>-year Average and <strong>2020</strong>-<strong>21</strong> Count for Actions Performed During Incident.<br />
RESCUES<br />
<strong>2011</strong>-<strong>21</strong><br />
(average)<br />
<strong>2020</strong>-<strong>21</strong><br />
(count)<br />
MAJOR FIRST AID REATMENTS<br />
<strong>2011</strong>-<strong>21</strong><br />
(average)<br />
<strong>2020</strong>-<strong>21</strong><br />
(count)<br />
SEARCHES<br />
<strong>2011</strong>-<strong>21</strong><br />
(average)<br />
<strong>2020</strong>-<strong>21</strong><br />
(count)<br />
1,136<br />
513<br />
1,312 313<br />
350 355<br />
ASSISTS<br />
<strong>2011</strong>-<strong>21</strong><br />
(average)<br />
<strong>2020</strong>-<strong>21</strong><br />
(count)<br />
MINOR FIRST AID TREATMENTS<br />
<strong>2011</strong>-<strong>21</strong><br />
(average)<br />
<strong>2020</strong>-<strong>21</strong><br />
(count)<br />
PREVENTATIVE ACTIONS<br />
<strong>2011</strong>-<strong>21</strong><br />
(average)<br />
<strong>2020</strong>-<strong>21</strong><br />
(count)<br />
1,311 1,142<br />
1,841 1,873<br />
1113,632 111,861<br />
SURF LIFE SAVING NEW ZEALAND NATIONAL BEACH AND COASTAL SAFETY REPORT<br />
38
Figure 3.5<br />
<strong>2011</strong>-<strong>21</strong>: Incidents by Age and Gender<br />
Total number of patients recorded n=<strong>21</strong>,779.<br />
Figure 3.6<br />
<strong>2011</strong>-<strong>21</strong>: Incidents by Ethnicity and Gender<br />
Total number of patients recorded n=<strong>21</strong>,779.<br />
Number of People<br />
5000<br />
4000<br />
3000<br />
2000<br />
<strong>10</strong>00<br />
Unknown Gender<br />
Female<br />
Male<br />
Number of Incidents<br />
8000<br />
7000<br />
6000<br />
5000<br />
4000<br />
3000<br />
2000<br />
<strong>10</strong>00<br />
Unknown Gender<br />
Female<br />
Male<br />
0<br />
Unknown<br />
RESCUES AND ASSISTS<br />
<strong>10</strong>-YEAR OVERVIEW | <strong>2011</strong>-<strong>21</strong><br />
TOTAL INCIDENTS<br />
19,230<br />
IN <strong>10</strong> YEARS<br />
KEY DEMOGRAPHIC<br />
<strong>21</strong>-30<br />
YEAR OLD MALES<br />
AVERAGE INCIDENTS<br />
1,923<br />
PER YEAR<br />
SWIMMING/WADING<br />
62%<br />
MALE<br />
38%<br />
FEMALE<br />
Figure 3.11<br />
<strong>2011</strong>-<strong>21</strong>: Equipment Used at Time of Rescue/Assist<br />
More than one type of equipment may be necessary at time<br />
of rescue/assist.<br />
Figure 3.12<br />
<strong>2011</strong>-<strong>21</strong>: Activity at Time of Rescue/Assist<br />
Total number of rescues/assists reported n=19,230; total number of<br />
activities reported in rescues/assists n=4,949.<br />
Category ‘other’ includes beach activities other than walking/running,<br />
activities not done at the beach, SLS training/competition and other water<br />
activities such as diving and jet-ski.<br />
2% 1%<br />
5% 3% IRB<br />
5%<br />
5%<br />
12%<br />
37%<br />
43%<br />
IRB<br />
43%<br />
Rescue Tube<br />
Rescue Board<br />
No Equipment<br />
RWC<br />
8%<br />
24%<br />
55%<br />
Swimming/<br />
Wading<br />
55%<br />
Swimming/Wading<br />
Surfing<br />
Boating<br />
Watercraft<br />
Other<br />
Land-Based Fishing<br />
Walking<br />
Figure 3.13<br />
<strong>2011</strong>-<strong>21</strong>: Rescues/Assists by Age and Gender (n=9,950)<br />
Figure 3.14<br />
<strong>2011</strong>-<strong>21</strong>: Rescues/Assists by Ethnicity and Gender (n=9,950)<br />
Number of People<br />
5000<br />
4000<br />
3000<br />
2000<br />
<strong>10</strong>00<br />
Unknown Gender<br />
Female<br />
Male<br />
Number of People<br />
3500<br />
3000<br />
2500<br />
2000<br />
1500<br />
<strong>10</strong>00<br />
500<br />
Unknown Gender<br />
Female<br />
Male<br />
0<br />
Unknown<br />
FIRST AID TREATMENTS<br />
<strong>10</strong>-YEAR OVERVIEW | <strong>2011</strong>-<strong>21</strong><br />
TOTAL INCIDENTS<br />
24,163<br />
IN <strong>10</strong> YEARS<br />
KEY DEMOGRAPHIC<br />
6-15<br />
YEAR OLDS<br />
AVERAGE INCIDENTS<br />
2,416<br />
PER YEAR<br />
SWIMMING/WADING<br />
54%<br />
MALE<br />
46%<br />
FEMALE<br />
Figure 3.15<br />
<strong>2011</strong>-<strong>21</strong>: First Aid Treatments by Major and Minor<br />
(n=24,163)<br />
Figure 3.16<br />
<strong>2011</strong>-<strong>21</strong>: Activity at Time of Injury (n=2,478).<br />
Total number of major first aid reported n=13,120; total number of<br />
activities reported in major first aid n=2,478.<br />
Activities are only reported for major first aid. Category ‘other’ includes<br />
beach activities, on-land activities not done at the beach and other water<br />
activities such as water craft, diving and jet-ski.<br />
2%<br />
6%<br />
11%<br />
46%<br />
54%<br />
Major<br />
First Aid<br />
54%<br />
Major First Aid<br />
Minor First Aid<br />
18%<br />
37%<br />
Swimming/<br />
Wading<br />
37%<br />
Swimming/Wading<br />
Surfing<br />
Other<br />
SLS Training/<br />
Competing/Patrol<br />
Boating<br />
Land-Based Fishing<br />
26%<br />
Figure 3.17<br />
<strong>2011</strong>-<strong>21</strong>: Major First Aid by Age and Gender (n=<strong>10</strong>,534).<br />
Figure 3.18<br />
<strong>2011</strong>-<strong>21</strong>: Major First Aid by Ethnicity and Gender (n=<strong>10</strong>,534).<br />
Number of Patients<br />
2500<br />
2000<br />
1500<br />
<strong>10</strong>00<br />
500<br />
Unknown Gender<br />
Female<br />
Male<br />
Number of Patients<br />
4000<br />
3500<br />
3000<br />
2500<br />
2000<br />
1500<br />
<strong>10</strong>00<br />
500<br />
Unknown Gender<br />
Female<br />
Male<br />
0<br />
Unknown<br />
SEARCHES<br />
<strong>10</strong>-YEAR OVERVIEW | <strong>2011</strong>-<strong>21</strong><br />
TOTAL INCIDENTS<br />
3,397<br />
IN <strong>10</strong> YEARS<br />
AVERAGE INCIDENTS<br />
340<br />
PER YEAR<br />
74%<br />
MALE<br />
KEY DEMOGRAPHIC<br />
6-<strong>10</strong> <strong>21</strong>-30<br />
YEAR OLD MALES YEAR OLD MALES<br />
WALKING AND SWIMMING/WADING<br />
26%<br />
FEMALE<br />
Figure 3.19<br />
<strong>2011</strong>-<strong>21</strong>: Category-1 Police Tasked vs. <strong>SLSNZ</strong> Callout<br />
Operations<br />
In the last ten years, only 17% of SAR callouts involving<br />
<strong>SLSNZ</strong> were tasked by the Police (Category-1).<br />
Figure 3.20<br />
<strong>2011</strong>-<strong>21</strong>: Searches by Activity (n=1,132)<br />
Total number of searches reported n=3,397; total number<br />
of activities reported in searches n=1,132.<br />
Category ‘other’ includes beach activities other than walking/running,<br />
activities not done at the beach, SLS training/competition and other water<br />
activities such as diving and jet-ski.<br />
17%<br />
9%<br />
12%<br />
27%<br />
83%<br />
<strong>SLSNZ</strong><br />
Tasked<br />
83%<br />
<strong>SLSNZ</strong> Tasked<br />
Police Tasked Cat1<br />
13%<br />
16%<br />
27%<br />
Walking<br />
23%<br />
Walking<br />
Swimming/Wading<br />
Other<br />
Surfing<br />
Boating<br />
Land-Based Fishing<br />
Figure 3.<strong>21</strong><br />
<strong>2011</strong>-<strong>21</strong>: Searches by Age and Gender (n=3,397)<br />
Figure 3.22<br />
<strong>2011</strong>-<strong>21</strong>: Searches by Ethnicity and Gender (n=3,397)<br />
Number of People<br />
400<br />
350<br />
300<br />
250<br />
200<br />
150<br />
<strong>10</strong>0<br />
50<br />
Unknown Gender<br />
Female<br />
Male<br />
Number of People<br />
800<br />
700<br />
600<br />
500<br />
400<br />
300<br />
200<br />
<strong>10</strong>0<br />
Unknown Gender<br />
Female<br />
Male<br />
0<br />
Unknown<br />
Countless lives have been<br />
saved by the vast numbers<br />
of rescues, assists, searches,<br />
preventative actions conducted by<br />
our Surf Lifesaving Service every<br />
year, not to mention the thousands<br />
of first aid treatments administered<br />
to those in need. Without these<br />
actions, we would see many<br />
more lives lost from preventable<br />
drownings in our oceans.<br />
SECTION THREE<br />
43<br />
INCIDENT ANALYSIS
SEARCH AND RESCUE<br />
ANALYSIS<br />
SECTION FOUR<br />
<strong>10</strong>-YEAR OVERVIEW | <strong>2011</strong>-<strong>21</strong><br />
The Search and Rescue (SAR) analysis presented here refers to operations involving<br />
<strong>SLSNZ</strong> SAR squads, including those tasked by the Police (Category-1 SAR).<br />
587<br />
CAT 1 SAR<br />
OPERATIONS<br />
28<strong>10</strong><br />
<strong>SLSNZ</strong> SAR<br />
CALLOUTS<br />
405<br />
PEOPLE<br />
RESCUED<br />
344<br />
PEOPLE ASSISTED<br />
TO SAFETY<br />
346<br />
LIVES<br />
SAVED<br />
<strong>10</strong>1<br />
BODIES<br />
RETRIEVED
SEARCH AND RESCUE ANALYSIS<br />
<strong>10</strong>-YEAR OVERVIEW | <strong>2011</strong>-<strong>21</strong><br />
<strong>SLSNZ</strong> data shows that COVID-19 has had an impact<br />
on the outdoor activities across New Zealand’s coastal<br />
environment, where a decrease in aquatic activity over the<br />
last two seasons has been observed. However, the overall<br />
SAR operations is trending upwards (Figure 4.1). More lives<br />
are being saved and more people rescued than ever before.<br />
The past <strong>10</strong> years have also seen an increase in lives<br />
lost in the coastal environment. More people are finding<br />
themselves in life-threatening situations and losing their<br />
lives. SAR squads have been busier than ever searching and<br />
retrieving bodies, returning them to their whanau and loved<br />
ones.<br />
Figure 4.1<br />
<strong>2011</strong>-<strong>21</strong>: <strong>SLSNZ</strong> SAR Operations<br />
SAR Responses (n)<br />
<strong>10</strong>0<br />
80<br />
60<br />
40<br />
20<br />
Lives Saved<br />
People Rescued<br />
People Assisted<br />
Tasking Numbers Captured<br />
0<br />
<strong>2011</strong>-12<br />
2012-13<br />
2013-14<br />
2014-15<br />
2015-16<br />
2016-17<br />
2017-18<br />
2018-19<br />
2019-20<br />
<strong>2020</strong>-<strong>21</strong><br />
<strong>Year</strong><br />
Figure 4.2<br />
<strong>2011</strong>-<strong>21</strong>: Number of Bodies Recovered During <strong>SLSNZ</strong> SAR Operations<br />
25<br />
Number of Bodies (n)<br />
20<br />
15<br />
<strong>10</strong><br />
5<br />
0<br />
<strong>2011</strong>-12<br />
2012-13<br />
2013-14<br />
2014-15<br />
2015-16<br />
2016-17<br />
2017-18<br />
2018-19<br />
2019-20<br />
<strong>2020</strong>-<strong>21</strong><br />
<strong>Year</strong><br />
SURF LIFE SAVING NEW ZEALAND NATIONAL BEACH AND COASTAL SAFETY REPORT 20<strong>21</strong><br />
46
Outside the Category-1 taskings generated by NZ Police,<br />
<strong>SLSNZ</strong> assets often respond to emergencies along their<br />
coastline within reach of their asset base or club.<br />
With the nature of a marine emergency and the importance<br />
of responding within a tiny time window, <strong>SLSNZ</strong> SAR squads<br />
will activate a response to ready personnel and equipment,<br />
often without all the operational intelligence. The response<br />
is often successfully executed before all the operational<br />
information and formal police activation through a 111 call<br />
is made.<br />
These types of activations would otherwise lead to an<br />
escalating situation if an immediate response were not<br />
activated, potentially leading to fatalities if the <strong>SLSNZ</strong> SAR<br />
response were paused until all specific information gathered<br />
was complete.<br />
Since 2014 <strong>SLSNZ</strong> has actively encouraged its rescue<br />
squads to phone the Police to log a rescue that is underway<br />
(outside normal patrolling operations) and record a tasking<br />
number. Although this practice has increased the tasking's<br />
captured (Figure 4.3), the number of <strong>SLSNZ</strong> instigated<br />
emergency search and rescue responses continues to grow<br />
faster than the police Category-1 tasking numbers.<br />
<strong>SLSNZ</strong> Callouts are therefore not being formally recognised<br />
in the sector reports, resulting in critical underreporting. The<br />
disparity may result in an inequitable allocation of resource<br />
development, training requirements, maintenance costings<br />
and effect long term planning considerations from local<br />
and central government.<br />
Figure 4.3<br />
<strong>2011</strong>-<strong>21</strong>: Cat-1 Police Tasked Vs. <strong>SLSNZ</strong> Callout Operations<br />
500<br />
Number of SAR Callouts<br />
450<br />
400<br />
350<br />
300<br />
250<br />
200<br />
150<br />
<strong>10</strong>0<br />
50<br />
<strong>SLSNZ</strong> Tasked Response<br />
Cat 1 Police Tasked Response<br />
0<br />
<strong>2011</strong>-12<br />
2012-13<br />
2013-14<br />
2014-15<br />
2015-16<br />
2016-17<br />
2017-18<br />
2018-19<br />
2019-20<br />
<strong>2020</strong>-<strong>21</strong><br />
<strong>Year</strong><br />
SECTION FOUR<br />
47<br />
SEARCH AND RESCUE ANALYSIS
FATA L D R O W N I N G<br />
ANALYSIS<br />
SECTION FIVE<br />
<strong>10</strong>-YEAR OVERVIEW | <strong>2011</strong>-<strong>21</strong><br />
357 87%<br />
MALE<br />
BEACH &<br />
COASTAL FATAL<br />
DROWNINGS<br />
13%<br />
FEMALE<br />
LOCATION<br />
38%<br />
SURF BEACH<br />
17%<br />
0-1KM<br />
OFFSHORE<br />
13%<br />
HARBOUR<br />
ACTIVITY<br />
22%<br />
SWIMMING/WADING<br />
18%<br />
BOATING<br />
16%<br />
FALLS
NATIONAL OVERVIEW<br />
<strong>10</strong>-YEAR OVERVIEW | <strong>2011</strong>-<strong>21</strong><br />
Each fatal drowning is a tragedy in its own right; it affects<br />
not only the close family and friends but the wider community.<br />
The research presented here aims to report and categorise<br />
fatal drownings, to better inform strategic decision making<br />
for preventative educational programmes and community<br />
engagement initiatives. The following section focuses on<br />
fatal drownings that have occurred in beach and coastal<br />
environments from <strong>2011</strong>-<strong>21</strong>.<br />
There were 357 fatal drownings from <strong>2011</strong>-<strong>21</strong>. Auckland<br />
region has the highest number of fatal drownings (n=93),<br />
followed by Northland (n=58) and Waikato (n=41). Surf<br />
beaches were the most dangerous environment with 134<br />
drowning fatalities, followed by 0-1 km from shore (n=59)<br />
and within harbours (n=48). The majority of beach and<br />
coastal fatal drownings occurred while swimming/wading<br />
(n=77) followed by boating (n=64) and falls (n=56).<br />
Figure 5.1<br />
<strong>2011</strong>-<strong>21</strong>: Total Number of New Zealand <strong>Beach</strong> and <strong>Coastal</strong> Fatal Drownings per <strong>Year</strong> from <strong>2011</strong>-<strong>21</strong> (n=357); and<br />
Comparison of New Zealand vs Australian <strong>Beach</strong> and <strong>Coastal</strong> Fatal Drowning Rates per <strong>10</strong>0,000 pop.<br />
Fatal Drownings (n)<br />
60<br />
50<br />
40<br />
30<br />
20<br />
<strong>10</strong><br />
Fatal Drownings<br />
NZ Fatal Drowning Rate<br />
AUS Fatal Drowning Rate<br />
1.2<br />
1.0<br />
0.8<br />
0.6<br />
0.4<br />
0.2<br />
Fatal Drowning Rate<br />
(per <strong>10</strong>0,000 pop.)<br />
0<br />
<strong>2011</strong>-12<br />
2012-13 2013-14 2014-15 2015-16 2016-17 2017-18 2018-19 2019-20 <strong>2020</strong>-<strong>21</strong><br />
<strong>Year</strong><br />
0.0<br />
The New Zealand <strong>2020</strong>-<strong>21</strong> fatal drowning rate (0.49 per<br />
<strong>10</strong>0,000 pop.) is less than the Australian <strong>2020</strong>-<strong>21</strong> fatal<br />
drowning rate (0.53 per <strong>10</strong>0,000 pop.). However, the New<br />
Zealand ten-year average fatal drowning rate (0.76 per<br />
<strong>10</strong>0,000 pop.) is 43% greater than the Australian ten-year<br />
average (0.49 per <strong>10</strong>0,000 pop.).<br />
The New Zealand <strong>10</strong>-year<br />
average beach and coastal fatal<br />
drowning rate is 43% higher than<br />
the Australian <strong>10</strong>-year average,<br />
and is on the increase.<br />
Figure 5.2<br />
<strong>2011</strong>-16 and 2016-<strong>21</strong> Five-year Average <strong>Beach</strong> and<br />
<strong>Coastal</strong> Fatal Drownings and Average Fatal Drowning<br />
Rate per <strong>10</strong>0,000 pop.<br />
<strong>2011</strong>-16<br />
AVERAGE<br />
DROWNING RATE<br />
0.77<br />
PER <strong>10</strong>0,000 POPULATION<br />
2016-<strong>21</strong><br />
AVERAGE<br />
DROWNING RATE<br />
0.76<br />
PER <strong>10</strong>0,000 POPULATION<br />
When comparing the first half of the decade (<strong>2011</strong>-2016)<br />
to the later (2016-20<strong>21</strong>), there has been an increase from<br />
35 (<strong>2011</strong>-<strong>21</strong>16) fatal drownings on average per year to 37<br />
per year (2016-<strong>21</strong>). The five-year average fatal drowning<br />
rate has decreased from 0.77 in the first half of the decade<br />
to 0.76 per <strong>10</strong>0,000 pop. in the later half.<br />
AVERAGE FATAL<br />
DROWNINGS<br />
33<br />
PER YEAR<br />
AVERAGE FATAL<br />
DROWNINGS<br />
37<br />
PER YEAR<br />
SURF LIFE SAVING NEW ZEALAND NATIONAL BEACH & COASTAL SAFETY REPORT 20<strong>21</strong><br />
50
NATIONAL OVERVIEW<br />
<strong>10</strong>-YEAR OVERVIEW | <strong>2011</strong>-<strong>21</strong><br />
Figure 5.3<br />
<strong>2011</strong>-<strong>21</strong>: Regional Comparison of Total <strong>Beach</strong> and <strong>Coastal</strong> Fatal Drownings and Fatal Drowning Rate per <strong>10</strong>0,000<br />
pop. (n=357)<br />
During <strong>2011</strong>-<strong>21</strong> there were 357 fatal drownings in the beach and coastal environments. Auckland (n=93) experienced the<br />
highest fatal drowning number per region, followed by Northland (n=58) and Waikato (n=41). Northland has the highest<br />
average fatal drowning rate per region (3.30 per <strong>10</strong>0,000 pop.), followed by the West Coast (2.13 per <strong>10</strong>0,000 pop.), and<br />
then Gisborne (2.06 per <strong>10</strong>0,000 pop.).<br />
Fatal Drownings (n)<br />
<strong>10</strong>0<br />
80<br />
65<br />
40<br />
20<br />
Fatal Drownings<br />
Average Fatal Drowning Rate<br />
3.5<br />
3.0<br />
2.5<br />
2.0<br />
1.5<br />
1.0<br />
0.5<br />
Fatal Drowning Rate<br />
(per <strong>10</strong>0,000 pop.)<br />
0<br />
AUK<br />
NTL<br />
WKO<br />
BOP<br />
WGT<br />
HKB<br />
CAN<br />
OTA<br />
STL<br />
Region<br />
GIS<br />
TKI<br />
WTC<br />
MWT<br />
TAS<br />
MBH<br />
NSN<br />
0.0<br />
Figure 5.4<br />
<strong>2011</strong>-<strong>21</strong>: Age Groups and Gender Represented in<br />
<strong>Beach</strong> and <strong>Coastal</strong> Fatal Drownings (n=357).<br />
Age groups 15 years and above account for 95% (n=339)<br />
of all beach and coastal fatal drownings during <strong>2011</strong>-<strong>21</strong>.<br />
Males account for 87% (n=312) of all drowning fatalities,<br />
whereas females account for 13% (n=45). The fatal<br />
drowning rate for males is greater than females across all<br />
age groups.<br />
Fatal Drownings (n)<br />
70<br />
60<br />
50<br />
40<br />
30<br />
20<br />
<strong>10</strong><br />
Male<br />
Female<br />
87%<br />
More males are fatally<br />
drowning than females<br />
87%<br />
MALE<br />
MALE<br />
13%<br />
87%<br />
FEMALE<br />
FEMALE<br />
0<br />
0-4 5-14 15-24 25-34 35-44 45-54 55-64 MALE 65+<br />
Age<br />
More adults are fatally 13%<br />
13%<br />
drowning than children FEMALE<br />
SECTION FIVE<br />
51<br />
FATAL DROWNING ANALYSIS / <strong>10</strong> YEAR OVERVIEW
NATIONAL OVERVIEW<br />
<strong>10</strong>-YEAR OVERVIEW | <strong>2011</strong>-<strong>21</strong><br />
Figure 5.5<br />
<strong>2011</strong>-<strong>21</strong> (ten-year average) and <strong>2020</strong>-<strong>21</strong>: Total <strong>Beach</strong> and <strong>Coastal</strong> Fatal Drownings by Ethnicity.<br />
From <strong>2011</strong>-<strong>21</strong>, NZ Europeans (n=12) had the greatest average number of total fatal drownings per year, followed by Maori<br />
(n=9), Asian (n=5) and Pasifika (n=5). In <strong>2020</strong>-<strong>21</strong>, the annual fatal drowning toll for all ethnicities was less than the ten-year<br />
average.<br />
15<br />
Average Fatal Drownings per <strong>Year</strong> (<strong>2011</strong>-<strong>21</strong>)<br />
Total Fatal Drownings (<strong>2020</strong>-<strong>21</strong>)<br />
Fatal Drownings (n)<br />
12<br />
9<br />
6<br />
3<br />
0<br />
NZ EUROPEAN MAORI<br />
ASIAN PASIFIKA OTHER* UNKNOWN<br />
Ethnicity<br />
(*represents all other ethnicities)<br />
Figure 5.6<br />
<strong>2011</strong>-<strong>21</strong> (ten-year average) and <strong>2020</strong>-<strong>21</strong>: <strong>Beach</strong> and <strong>Coastal</strong> Fatal Drowning Rates (per <strong>10</strong>0,000 pop.) by<br />
Ethnicity (n=357).<br />
From <strong>2011</strong>-<strong>21</strong>, Other Ethnicities recorded the highest average fatal drowning rate (2.49 per <strong>10</strong>0,000 pop.), followed by<br />
Pasifika (1.28 per <strong>10</strong>0,000 pop.) and Maori (1.15 per <strong>10</strong>0,000 pop.).<br />
During <strong>2020</strong>-<strong>21</strong> Other Ethnicities represented the highest fatal drowning rate (2.34 per <strong>10</strong>0,000 pop.), followed by Maori<br />
(1.03 per <strong>10</strong>0,000 pop.) and Asian (0.57 per <strong>10</strong>0,000 pop.).<br />
The <strong>2020</strong>-<strong>21</strong> fatal drowning rates for each ethnicity was less than their respective ten-year average.<br />
Rate (per <strong>10</strong>0,000 pop.)<br />
2.5<br />
2.0<br />
1.5<br />
1.0<br />
0.5<br />
Fatal Drowning Rate (<strong>2011</strong>-<strong>21</strong>)<br />
Fatal Drowning Rate (<strong>2020</strong>-<strong>21</strong>)<br />
0<br />
NZ EUROPEAN MAORI ASIAN PASIFIKA OTHER*<br />
Ethnicity<br />
(*represents all other ethnicities)<br />
From <strong>2011</strong>-<strong>21</strong>, Other Ethnicities recorded the highest fatal drowning<br />
rate (2.49 per <strong>10</strong>0,000 pop.) across all ethnicities<br />
52<br />
SURF LIFE SAVING NEW ZEALAND NATIONAL BEACH & COASTAL SAFETY REPORT 20<strong>21</strong>
NATIONAL OVERVIEW<br />
<strong>10</strong>-YEAR OVERVIEW | <strong>2011</strong>-<strong>21</strong><br />
Figure 5.7<br />
<strong>2011</strong>-<strong>21</strong>: <strong>Beach</strong> and <strong>Coastal</strong> Fatal Drownings by Month (n=357).<br />
The highest number of beach and coastal fatal drownings occurred in January (n=63), followed by February (n=53) and<br />
December (n=51). From <strong>2011</strong>-<strong>21</strong>, 45% of all fatal drownings occurred during the summer months (Dec – Feb).<br />
80<br />
70<br />
Fatal Drownings<br />
Summer Season<br />
Fatal Drownings (n)<br />
60<br />
50<br />
40<br />
30<br />
20<br />
<strong>10</strong><br />
0<br />
JUL AUG SEPT OCT NOV DEC JAN FEB MAR APR MAY JUN<br />
<strong>Year</strong><br />
Figure 5.8<br />
Comparison Between the <strong>2011</strong>-<strong>21</strong> Ten <strong>Year</strong> Average (n=357) and <strong>2020</strong>-<strong>21</strong> Count (n=25) for <strong>Beach</strong> and <strong>Coastal</strong><br />
Fatal Drownings by Activity.<br />
The activities listed below represent the top eight causes of fatal drowning within the beach and coastal environment between<br />
<strong>2011</strong>-<strong>21</strong>. In <strong>2020</strong>-<strong>21</strong>, snorkelling was the only activity where the number of drowning fatalities was above the ten–year<br />
average. Swimming / wading, boating, falls, watercraft, land-based fishing, net/shell fishing and attempting a rescue activities<br />
were below the ten-year average.<br />
SWIMMING / WADING<br />
FALL<br />
BOATING<br />
WATERCRAFT<br />
<strong>2011</strong>-<strong>21</strong><br />
8<br />
<strong>2011</strong>-<strong>21</strong><br />
6<br />
<strong>2011</strong>-<strong>21</strong><br />
6<br />
<strong>2011</strong>-<strong>21</strong><br />
3<br />
<strong>2020</strong>-<strong>21</strong><br />
7<br />
<strong>2020</strong>-<strong>21</strong><br />
1<br />
<strong>2020</strong>-<strong>21</strong><br />
4<br />
<strong>2020</strong>-<strong>21</strong><br />
2<br />
SNORKELLING<br />
<strong>2011</strong>-<strong>21</strong><br />
4<br />
LAND-BASED FISHING<br />
<strong>2011</strong>-<strong>21</strong><br />
3<br />
NET / SHELL FISHING<br />
<strong>2011</strong>-<strong>21</strong><br />
2<br />
ATTEMPTING A RESCUE<br />
<strong>2011</strong>-<strong>21</strong><br />
2<br />
<strong>2020</strong>-<strong>21</strong><br />
5<br />
<strong>2020</strong>-<strong>21</strong><br />
2<br />
<strong>2020</strong>-<strong>21</strong><br />
1<br />
<strong>2020</strong>-<strong>21</strong><br />
1<br />
SECTION FIVE<br />
53<br />
FATAL DROWNING ANALYSIS / <strong>10</strong> YEAR OVERVIEW
Figure 5.9<br />
<strong>10</strong> YEAR OVERVIEW | <strong>2011</strong>-<strong>21</strong><br />
Fatal Drownings Per Region<br />
South Island<br />
5<br />
Tasman<br />
0<br />
Nelson<br />
7<br />
West Coast<br />
Marlborough<br />
4<br />
Canterbury<br />
14<br />
12<br />
Southland<br />
Otago<br />
13<br />
54<br />
SURF LIFE SAVING NEW ZEALAND NATIONAL BEACH & COASTAL SAFETY REPORT 20<strong>21</strong>
Northland<br />
58<br />
North Island<br />
93<br />
288<br />
Auckland<br />
Bay of Plenty<br />
34<br />
41<br />
Waikato<br />
Gisborne<br />
<strong>10</strong><br />
7<br />
Taranaki<br />
Hawke’s Bay<br />
20<br />
Manawatu-Wanganui<br />
5<br />
Wellington<br />
34<br />
4<br />
A TOTAL OF<br />
357<br />
BEACH AND<br />
COASTAL FATAL<br />
DROWNINGS<br />
SECTION FIVE<br />
55<br />
FATAL DROWNING ANALYSIS / <strong>10</strong> YEAR OVERVIEW
FATA L D R O W N I N G<br />
ANALYSIS<br />
SECTION SIX<br />
1-YEAR OVERVIEW | <strong>2020</strong>-<strong>21</strong><br />
25<br />
80%<br />
MALE<br />
BEACH &<br />
COASTAL FATAL<br />
DROWNINGS<br />
20%<br />
FEMALE<br />
LOCATION<br />
36%<br />
SURF BEACH<br />
17%<br />
HARBOUR<br />
12%<br />
ROCKY<br />
FORESHORE<br />
ACTIVITY<br />
28%<br />
SWIMMING/WADING<br />
20%<br />
SNORKELLING<br />
16%<br />
BOATING
NATIONAL OVERVIEW<br />
1-YEAR OVERVIEW | <strong>2020</strong>-<strong>21</strong><br />
In <strong>2020</strong>-<strong>21</strong> there were 25 fatal drownings at beach and coastal environments. Auckland had the highest<br />
fatalities per region (n=6), followed by Northland (n=4) and Bay of Plenty (n=4).<br />
The majority of drowning fatalities occurred while swimming/wading (n=7), followed by snorkelling (n=5)<br />
and boating (n=4).<br />
Surf beaches proved to be the most dangerous environment for drowning fatalities (n=9), followed by<br />
harbour (n=4), rocky foreshore (n=3), 0-1 km offshore (n=3) and river / harbour bar (n=3).<br />
Figure 6.1<br />
<strong>2020</strong>-<strong>21</strong>: <strong>Beach</strong> and <strong>Coastal</strong> Fatal Drownings per Region (n=25).<br />
25<br />
80%<br />
MALE<br />
20%<br />
BEACH &<br />
COASTAL FATAL<br />
DROWNINGS<br />
6FEMALE<br />
Auckland<br />
Northland<br />
4<br />
Bay of Plenty<br />
4<br />
LOCATION<br />
36%<br />
SURF BEACH<br />
17%<br />
HARBOUR<br />
0<br />
Waikato<br />
ROCKY 0<br />
FORESHORE Taranaki<br />
Tasman<br />
288<br />
2<br />
12%<br />
0 Nelson<br />
Gisborne 2<br />
Hawke’s Bay 1<br />
ACTIVITY<br />
Manawatu-Wanganui<br />
0<br />
Wellington<br />
3<br />
0<br />
West Coast<br />
Marlborough<br />
0<br />
28%<br />
SWIMMING/WADING<br />
20%<br />
SNORKELLING<br />
16%<br />
BOATING<br />
Canterbury<br />
1<br />
0<br />
Southland<br />
Otago<br />
2<br />
SURF LIFE SAVING NEW ZEALAND NATIONAL BEACH & COASTAL SAFETY REPORT 20<strong>21</strong><br />
58
NATIONAL OVERVIEW<br />
1-YEAR OVERVIEW | 2019-20<br />
Figure 6.2<br />
<strong>2020</strong>-<strong>21</strong>: <strong>Beach</strong> and <strong>Coastal</strong> Fatal Drownings by Age<br />
and Gender (n=25).<br />
The highest number of fatal drownings occurred in the<br />
65+ year age group (28%, n=7), followed by 45-54 (20%,<br />
n=5), 55-64 (16%, n=4) and 15-24 (16%, n=4) age groups.<br />
Across all age groups males accounted for 80% (n=20) of<br />
fatal drownings, whereas females accounted for 20% (n=5).<br />
Figure 6.4<br />
<strong>2020</strong>-<strong>21</strong>: <strong>Beach</strong> and <strong>Coastal</strong> Fatal Drownings by Month<br />
(n=25).<br />
The greatest number of fatal drownings occurred in<br />
November (24%, n=6), followed by December (16%, n=4)<br />
and February (16%, n=4). The summer months (Dec –<br />
Feb) accounted for the majority (40%, n=<strong>10</strong>) of all fatal<br />
drownings. With the exception of October, November and<br />
April, the number of fatal drownings per month during<br />
<strong>2020</strong>-<strong>21</strong> were below the <strong>10</strong> year average.<br />
Fatal Drownings (n)<br />
12<br />
<strong>10</strong><br />
8<br />
6<br />
4<br />
2<br />
Male<br />
Female<br />
Fatal Drownings (n)<br />
8<br />
7<br />
6<br />
5<br />
4<br />
3<br />
2<br />
1<br />
Fatal Drownings (<strong>2020</strong>-<strong>21</strong>)<br />
Average Fatal Drownings (<strong>2011</strong>-<strong>21</strong>)<br />
0<br />
0-4 5-14 15-24 25-34 35-44 45-54 55-64 65+<br />
Age Groups<br />
0<br />
JUL AUG SEPT OCT NOV DEC JAN FEB MAR APR MAY JUN<br />
Month<br />
Figure 6.3<br />
<strong>2020</strong>-<strong>21</strong>: <strong>Beach</strong> and <strong>Coastal</strong> Fatal Drownings by<br />
Activity (n=25).<br />
The majority of fatal drownings occurred while swimming/<br />
wading (n=7), followed by snorkelling (n=5) and boating<br />
(n=4).<br />
Figure 6.5<br />
<strong>2020</strong>-<strong>21</strong>: <strong>Beach</strong> and <strong>Coastal</strong> Fatal Drownings by<br />
Location (n=25).<br />
The majority of fatal drownings occurred at surf beaches<br />
(n=9), in harbours (n=4), adjacent to rocky foreshores (n=3),<br />
0-1 km offshore (n=3) and river / harbour bars (n=3).<br />
4%<br />
8%<br />
4%<br />
8%<br />
28%<br />
8%<br />
8%<br />
28%<br />
Swimming/<br />
Wading<br />
20%<br />
12%<br />
12%<br />
36%<br />
Surf<br />
<strong>Beach</strong><br />
36%<br />
16%<br />
12%<br />
16%<br />
Swimming/Wading<br />
Snorkelling<br />
Boating<br />
Attempting a Rescue<br />
4% 4% Surf <strong>Beach</strong><br />
Land-Based Fishing<br />
Watercraft<br />
Fall<br />
Net/Shell Fishing<br />
Scuba Diving<br />
Harbour<br />
Rocky Foreshore<br />
0-1km off Shore<br />
River/Harbour Bar<br />
Estuary<br />
Calm Water <strong>Beach</strong><br />
SECTION SIX<br />
59<br />
FATAL DROWNING ANALYSIS / 1 YEAR OVERVIEW
REGIONAL OVERVIEWS<br />
SECTION SEVEN<br />
NZ Regions<br />
Northland<br />
Auckland<br />
Bay of Plenty<br />
Waikato<br />
Gisborne<br />
Taranaki<br />
Hawke’s Bay<br />
Tasman<br />
Nelson<br />
Manawatu-Wanganui<br />
Wellington<br />
Marlborough<br />
West Coast<br />
Canterbury<br />
Southland<br />
Otago<br />
Please note: latitude and longitude coordinates were not available for all fatalities.
NORTHLAND / TE TAI TOKERAU<br />
Figure 7.1<br />
<strong>2011</strong>-<strong>21</strong>: Northland Region <strong>Beach</strong> and <strong>Coastal</strong> Fatal<br />
Drownings and Fatal Drowning Rate per <strong>10</strong>0,000<br />
population (n=58).<br />
During <strong>2020</strong>-<strong>21</strong>, there were four beach and coastal<br />
drowning fatalities within the Northland Region, which is less<br />
than the ten-year average of six per year. The <strong>2020</strong>-<strong>21</strong> fatal<br />
drowning rate (2.06 per <strong>10</strong>0,000 pop.) was less than the<br />
ten-year average (3.30 per <strong>10</strong>0,000 pop.).<br />
Figure 7.2<br />
<strong>2011</strong>-<strong>21</strong>: Northland Region <strong>Beach</strong> and <strong>Coastal</strong><br />
Drownings by Activity (n=58).<br />
Within the Northland Region during <strong>2011</strong>-<strong>21</strong>, the majority<br />
of beach and coastal drowning fatalities occurred while<br />
swimming/wading (n=13), followed by using watercraft<br />
(n=11) and net/shell fishing (n=<strong>10</strong>).<br />
Fatal Drownings (n)<br />
<strong>10</strong><br />
9<br />
8<br />
7<br />
6<br />
5<br />
4<br />
3<br />
2<br />
1<br />
0<br />
<strong>2011</strong>-12<br />
Fatal Drownings<br />
2012-13<br />
2013-14<br />
2014-15<br />
Fatal Drowning Rate<br />
2015-16<br />
2016-17<br />
<strong>Year</strong><br />
2017-18<br />
2018-19<br />
2019-20<br />
<strong>2020</strong>-<strong>21</strong><br />
4.5<br />
4.0<br />
3.5<br />
3.0<br />
2.5<br />
2.0<br />
1.5<br />
1.0<br />
0.5<br />
0.0<br />
Fatal Drowning Rate<br />
(per <strong>10</strong>0,000 pop.)<br />
5%<br />
7%<br />
9%<br />
12%<br />
5% 3% 17%<br />
24%<br />
Swimming/<br />
Wading<br />
24%<br />
17%<br />
Swimming/Wading<br />
Watercraft<br />
Net/Shell Fishing<br />
Boating<br />
Snorkelling<br />
Falls<br />
Attempting a Rescue<br />
Scuba Diving<br />
Land-Based Fishing<br />
Figure 7.3<br />
Comparison of <strong>Beach</strong> and <strong>Coastal</strong> Fatal Drowning Rates (per <strong>10</strong>0,000 pop.) by Activity in the Northland Region:<br />
<strong>2011</strong>-<strong>21</strong> (ten-year average) and <strong>2020</strong>-<strong>21</strong>.<br />
Within the Northland Region the <strong>2020</strong>-<strong>21</strong> fatal drowning rates (per <strong>10</strong>0,000 pop.) for all activities was less than their<br />
respective ten-year averages.<br />
SWIMMING / WADING<br />
SNORKELLING<br />
FALL<br />
<strong>2011</strong>-<strong>21</strong><br />
0.81<br />
<strong>2020</strong>-<strong>21</strong><br />
0.51<br />
<strong>2011</strong>-<strong>21</strong><br />
0.28<br />
LAND-BASED FISHING<br />
<strong>2020</strong>-<strong>21</strong><br />
0.51<br />
BOATING<br />
<strong>2011</strong>-<strong>21</strong><br />
0.22<br />
<strong>2020</strong>-<strong>21</strong><br />
0.00<br />
<strong>2011</strong>-<strong>21</strong><br />
0.12<br />
NET / SHELL FISHING<br />
<strong>2020</strong>-<strong>21</strong><br />
0.00<br />
WATERCRAFT<br />
<strong>2011</strong>-<strong>21</strong><br />
0.38<br />
<strong>2020</strong>-<strong>21</strong><br />
0.00<br />
<strong>2011</strong>-<strong>21</strong><br />
0.66<br />
ATTEMPTING A RESCUE<br />
<strong>2020</strong>-<strong>21</strong><br />
0.00<br />
<strong>2011</strong>-<strong>21</strong><br />
0.56<br />
<strong>2020</strong>-<strong>21</strong><br />
0.51<br />
<strong>2011</strong>-<strong>21</strong><br />
0.17<br />
<strong>2020</strong>-<strong>21</strong><br />
0.00<br />
62<br />
SURF LIFE SAVING NEW ZEALAND NATIONAL BEACH AND COASTAL SAFETY REPORT 20<strong>21</strong>
FATAL DROWNING SNAPSHOT<br />
<strong>10</strong>-YEAR OVERVIEW | <strong>2011</strong>-<strong>21</strong> 1-YEAR OVERVIEW | <strong>2020</strong>-<strong>21</strong><br />
FATAL DROWNINGS<br />
AVERAGE FATALITY<br />
4 2.06<br />
FATAL DROWNINGS BY LOCATION<br />
PER <strong>10</strong>0,000 POPULATION<br />
25%<br />
25%<br />
58<br />
25<br />
River/<br />
Harbour Bar<br />
25%<br />
0-1 km<br />
from shore<br />
Attempting a Rescue<br />
Boating<br />
Diving / Jumping<br />
Fall<br />
Net / Shell Fishing<br />
Land-Based Fishing<br />
Scuba Diving<br />
Snorkeling<br />
Swimming / Wading<br />
Watercraft<br />
25%<br />
25%<br />
Surf <strong>Beach</strong><br />
25%<br />
Harbour<br />
25%<br />
TOTAL FATAL DROWNINGS: 58<br />
AVERAGE FATAL DROWNINGS<br />
6<br />
PER YEAR<br />
AVERAGE FATALITY<br />
3.30<br />
PER <strong>10</strong>0,000 POPULATION<br />
0-1 Km from Shore<br />
Harbour<br />
FATAL DROWNINGS BY ACTIVITY<br />
Surf <strong>Beach</strong><br />
River/Harbour Bar<br />
KEY DEMOGRAPHIC<br />
YEAR OLD MALES<br />
SWIMMERS/WADERS<br />
81%<br />
MALE<br />
19%<br />
FEMALE<br />
15+ 15+<br />
YEAR OLD MALES<br />
NET/SHELL FISHING<br />
25%<br />
25%<br />
25<br />
Watercraft<br />
25%<br />
Swimming/<br />
Wading<br />
Scuba Diving<br />
Snorkelling<br />
25%<br />
Scuba Diving<br />
25%<br />
Snorkelling<br />
25%<br />
25%<br />
Swimming/Wading<br />
Watercraft
AUCKLAND / TAMAKI-MAKAU-RAU<br />
Figure 7.4<br />
<strong>2011</strong>-<strong>21</strong>: Auckland Region <strong>Beach</strong> and <strong>Coastal</strong> Fatal<br />
Drownings and Fatal Drowning Rate per <strong>10</strong>0,000<br />
population (n=93).<br />
During <strong>2020</strong>-<strong>21</strong>, there were six beach and coastal drowning<br />
fatalities within the Auckland Region, which is less than<br />
the ten-year average of ten per year. The <strong>2020</strong>-<strong>21</strong> fatal<br />
drowning rate (0.35 per <strong>10</strong>0,000 pop.) was less than the<br />
ten-year average (0.59 per <strong>10</strong>0,000 pop.).<br />
Figure 7.5<br />
<strong>2011</strong>-<strong>21</strong>: Auckland Region <strong>Beach</strong> and <strong>Coastal</strong><br />
Drownings by Activity (n=93).<br />
Within the Auckland Region during <strong>2011</strong>-<strong>21</strong>, the majority<br />
of beach and coastal drowning fatalities occurred while<br />
boating (n=26), followed by swimming/wading (n=23) and<br />
falls (n=17).<br />
2%<br />
1%<br />
Fatal Drownings (n)<br />
18<br />
16<br />
14<br />
12<br />
<strong>10</strong><br />
8<br />
6<br />
4<br />
2<br />
0<br />
<strong>2011</strong>-12<br />
Fatal Drownings<br />
Fatal Drowning Rate<br />
2012-13<br />
2013-14<br />
2014-15<br />
2015-16<br />
2016-17<br />
<strong>Year</strong><br />
2017-18<br />
2018-19<br />
2019-20<br />
<strong>2020</strong>-<strong>21</strong><br />
1.2<br />
1.0<br />
0.8<br />
0.6<br />
0.4<br />
0.2<br />
0.0<br />
Fatal Drowning Rate<br />
(per <strong>10</strong>0,000 pop.)<br />
9%<br />
9%<br />
18%<br />
3%<br />
3%<br />
28%<br />
Boating<br />
25%<br />
28%<br />
Boating<br />
Swimming/Wading<br />
Falls<br />
Land-Based Fishing<br />
Watercraft<br />
Attempting a Rescue<br />
Snorkelling<br />
Scuba Diving<br />
Diving/Jumping<br />
Net/Shell Fishing<br />
Unknown<br />
Figure 7.6<br />
CComparison of <strong>Beach</strong> and <strong>Coastal</strong> Fatal Drowning Rates (per <strong>10</strong>0,000 pop.) by Activity in the Auckland Region:<br />
<strong>2011</strong>-<strong>21</strong> (ten-year average) and <strong>2020</strong>-<strong>21</strong>.<br />
Within the Auckland Region the <strong>2020</strong>-<strong>21</strong> fatal drowning rates (per <strong>10</strong>0,000 pop.) for swimming/wading, falls, boating,<br />
snorkelling, net/shell fishing and attempting a rescue activities were less than their respective ten-year averages. However,<br />
the <strong>2020</strong>-<strong>21</strong> fatal drowning rates for watercraft, snorkelling and land-based fishing activities were higher.<br />
SWIMMING / WADING<br />
SNORKELLING<br />
FALL<br />
<strong>2011</strong>-<strong>21</strong><br />
0.15<br />
<strong>2020</strong>-<strong>21</strong><br />
0.12<br />
<strong>2011</strong>-<strong>21</strong><br />
0.02<br />
LAND-BASED FISHING<br />
<strong>2020</strong>-<strong>21</strong><br />
0.06<br />
BOATING<br />
<strong>2011</strong>-<strong>21</strong><br />
0.11<br />
<strong>2020</strong>-<strong>21</strong><br />
0.06<br />
<strong>2011</strong>-<strong>21</strong><br />
0.05<br />
NET / SHELL FISHING<br />
<strong>2020</strong>-<strong>21</strong><br />
0.06<br />
WATERCRAFT<br />
<strong>2011</strong>-<strong>21</strong><br />
0.17<br />
<strong>2020</strong>-<strong>21</strong><br />
0.00<br />
<strong>2011</strong>-<strong>21</strong><br />
0.01<br />
ATTEMPTING A RESCUE<br />
<strong>2020</strong>-<strong>21</strong><br />
0.00<br />
<strong>2011</strong>-<strong>21</strong><br />
0.05<br />
<strong>2020</strong>-<strong>21</strong><br />
0.06<br />
<strong>2011</strong>-<strong>21</strong><br />
0.02<br />
<strong>2020</strong>-<strong>21</strong><br />
0.00<br />
64<br />
SURF LIFE SAVING NEW ZEALAND NATIONAL BEACH AND COASTAL SAFETY REPORT 20<strong>21</strong>
FATAL DROWNING SNAPSHOT<br />
<strong>10</strong>-YEAR OVERVIEW | <strong>2011</strong>-<strong>21</strong> 1-YEAR OVERVIEW | <strong>2020</strong>-<strong>21</strong><br />
FATAL DROWNINGS<br />
AVERAGE FATALITY<br />
13 0.77<br />
FATAL DROWNINGS BY LOCATION<br />
PER <strong>10</strong>0,000 POPULATION<br />
17%<br />
33%<br />
93<br />
Attempting a Rescue<br />
Boating<br />
Diving / Jumping<br />
Fall<br />
Net / Shell Fishing<br />
Land-Based Fishing<br />
Scuba Diving<br />
Snorkeling<br />
Swimming / Wading<br />
Watercraft<br />
TOTAL FATAL DROWNINGS: 93<br />
17%<br />
17%<br />
33%<br />
Rocky<br />
Foreshore<br />
17%<br />
AVERAGE FATAL DROWNINGS<br />
<strong>10</strong><br />
PER YEAR<br />
AVERAGE FATALITY<br />
0.59<br />
PER <strong>10</strong>0,000 POPULATION<br />
Rocky Foreshore Calm Water Beaach Surf <strong>Beach</strong><br />
0-1km from shore Harbour<br />
FATAL DROWNINGS BY ACTIVITY<br />
90%<br />
MALE<br />
<strong>10</strong>%<br />
FEMALE<br />
17%<br />
17%<br />
33%<br />
Swimming/<br />
Wading<br />
33%<br />
KEY DEMOGRAPHIC<br />
15+ 25+<br />
YEAR OLD MALES<br />
SWIMMING/WADING<br />
YEAR OLD MALES<br />
BOATING<br />
17%<br />
Swimming/Wading<br />
Falls<br />
Land-Based Fishing<br />
17%<br />
Snorkelling<br />
Watercraft
WAIKATO<br />
Figure 7.7<br />
<strong>2011</strong>-<strong>21</strong>: Waikato Region <strong>Beach</strong> and <strong>Coastal</strong> Fatal<br />
Drownings and Fatal Drowning Rate per <strong>10</strong>0,000<br />
Population (n=41).<br />
During <strong>2020</strong>-<strong>21</strong>, there were two beach and coastal<br />
drowning fatalities within the Waikato Region, which equals<br />
the ten-year average of four per year. The <strong>2020</strong>-<strong>21</strong> fatal<br />
drowning rate (0.40 per <strong>10</strong>0,000 pop.) was less than the<br />
ten-year average (0.91 per <strong>10</strong>0,000 pop.).<br />
Figure 7.8<br />
<strong>2011</strong>-<strong>21</strong>: Waikato Region <strong>Beach</strong> and <strong>Coastal</strong><br />
Drownings by Activity (n=41).<br />
Within the Waikato Region during <strong>2011</strong>-<strong>21</strong>, the majority<br />
of beach and coastal drowning fatalities occurred while<br />
swimming/wading (n=<strong>10</strong>), followed by land-based fishing<br />
(n=9) and falls (n=5).<br />
2%<br />
Fatal Drownings (n)<br />
<strong>10</strong><br />
9<br />
8<br />
7<br />
6<br />
5<br />
4<br />
3<br />
2<br />
1<br />
0<br />
<strong>2011</strong>-12<br />
Fatal Drownings<br />
Fatal Drowning Rate<br />
2012-13<br />
2013-14<br />
2014-15<br />
2015-16<br />
2016-17<br />
<strong>Year</strong><br />
2017-18<br />
2018-19<br />
2019-20<br />
<strong>2020</strong>-<strong>21</strong><br />
2.0<br />
1.8<br />
1.6<br />
1.4<br />
1.2<br />
1.0<br />
0.8<br />
0.6<br />
0.4<br />
0.2<br />
0.0<br />
Fatal Drowning Rate<br />
(per <strong>10</strong>0,000 pop.)<br />
5%<br />
5%<br />
<strong>10</strong>%<br />
<strong>10</strong>%<br />
5%<br />
24%<br />
Swimming/<br />
Wading<br />
12%<br />
24%<br />
22%<br />
Swimming/Wading<br />
Land-Based Fishing<br />
Falls<br />
Boating<br />
Net/Shell Fishing<br />
Attempting a Rescue<br />
Scuba Diving<br />
Snorkelling<br />
Diving/Jumping<br />
Watercraft<br />
Unknown<br />
Figure 7.9<br />
Comparison of <strong>Beach</strong> and <strong>Coastal</strong> Fatal Drowning Rates (per <strong>10</strong>0,000 pop.) by Activity in the Waikato Region:<br />
<strong>2011</strong>-<strong>21</strong> (ten-year average) and <strong>2020</strong>-<strong>21</strong>.<br />
Within the Waikato Region the <strong>2020</strong>-<strong>21</strong> fatal drowning rates (per <strong>10</strong>0,000 pop.) for swimming/wading, falls, boating,<br />
watercraft, snorkelling and net/shell fishing and were less than their respective ten-year averages. However, the <strong>2020</strong>-<strong>21</strong><br />
fatal drowning rate for attempting a rescue was greater than the ten-year average.<br />
SWIMMING / WADING<br />
SNORKELLING<br />
FALL<br />
<strong>2011</strong>-<strong>21</strong><br />
0.22<br />
<strong>2020</strong>-<strong>21</strong><br />
0.00<br />
<strong>2011</strong>-<strong>21</strong><br />
0.05<br />
LAND-BASED FISHING<br />
<strong>2020</strong>-<strong>21</strong><br />
0.00<br />
BOATING<br />
<strong>2011</strong>-<strong>21</strong><br />
0.11<br />
<strong>2020</strong>-<strong>21</strong><br />
0.00<br />
<strong>2011</strong>-<strong>21</strong><br />
0.20<br />
NET / SHELL FISHING<br />
<strong>2020</strong>-<strong>21</strong><br />
0.20<br />
WATERCRAFT<br />
<strong>2011</strong>-<strong>21</strong><br />
0.09<br />
<strong>2020</strong>-<strong>21</strong><br />
0.00<br />
<strong>2011</strong>-<strong>21</strong><br />
0.12<br />
ATTEMPTING A RESCUE<br />
<strong>2020</strong>-<strong>21</strong><br />
0.00<br />
<strong>2011</strong>-<strong>21</strong><br />
0.02<br />
<strong>2020</strong>-<strong>21</strong><br />
0.00<br />
<strong>2011</strong>-<strong>21</strong><br />
0.04<br />
<strong>2020</strong>-<strong>21</strong><br />
0.20<br />
66<br />
SURF LIFE SAVING NEW ZEALAND NATIONAL BEACH AND COASTAL SAFETY REPORT 20<strong>21</strong>
FATAL DROWNING SNAPSHOT<br />
<strong>10</strong>-YEAR OVERVIEW | <strong>2011</strong>-<strong>21</strong> 1-YEAR OVERVIEW | <strong>2020</strong>-<strong>21</strong><br />
FATAL DROWNINGS<br />
AVERAGE FATALITY<br />
41<br />
2 0.40<br />
PER <strong>10</strong>0,000 POPULATION<br />
FATAL DROWNINGS BY LOCATION<br />
Attempting a Rescue<br />
Boating<br />
Diving / Jumping<br />
Fall<br />
Net / Shell Fishing<br />
Land-Based Fishing<br />
Scuba Diving<br />
Snorkeling<br />
Swimming / Wading<br />
Watercraft<br />
50% 50% 50%<br />
Rocky Surf <strong>Beach</strong><br />
Foreshore<br />
50%<br />
TOTAL FATAL DROWNINGS: 41<br />
AVERAGE FATAL DROWNINGS<br />
4<br />
PER YEAR<br />
90%<br />
MALE<br />
<strong>10</strong>%<br />
FEMALE<br />
AVERAGE FATALITY<br />
0.91<br />
PER <strong>10</strong>0,000 POPULATION<br />
KEY DEMOGRAPHIC<br />
15-44 35-44<br />
YEAR OLD MALES YEAR OLD MALES<br />
SWIMMING/WADING LAND BASED FISHING<br />
FATAL DROWNINGS BY ACTIVITY<br />
50%<br />
Surf <strong>Beach</strong><br />
50%<br />
Land-Based<br />
Fishing<br />
Attempting a Rescue<br />
Rocky Foreshore<br />
50%<br />
Attempting a<br />
Rescue<br />
50%<br />
Land-Based Fishing
BAY OF PLENTY / TE MOANA-A-TOI<br />
Figure 7.<strong>10</strong><br />
<strong>2011</strong>-<strong>21</strong>: Bay of Plenty Region <strong>Beach</strong> and <strong>Coastal</strong> Fatal<br />
Drownings and Fatal Drowning Rate per <strong>10</strong>0,000<br />
Population (n=34).<br />
During <strong>2020</strong>-<strong>21</strong>, there were four beach and coastal<br />
drowning fatalities within the Bay of Plenty Region, which<br />
is greater than the ten-year average of three per year. The<br />
<strong>2020</strong>-<strong>21</strong> fatal drowning rate (1.19 per <strong>10</strong>0,000 pop.) was<br />
greater than the ten-year average (1.14 per <strong>10</strong>0,000 pop.).<br />
Figure 7.11<br />
<strong>2011</strong>-<strong>21</strong>: Bay of Plenty Region <strong>Beach</strong> and <strong>Coastal</strong><br />
Drownings by Activity (n=34).<br />
Within the Bay of Plenty Region during <strong>2011</strong>-<strong>21</strong>, the majority<br />
of beach and coastal drowning fatalities were swimming/<br />
wading (n=7), followed by boating (n=6) and falls (n=6).<br />
Fatal Drownings (n)<br />
7<br />
6<br />
5<br />
4<br />
3<br />
2<br />
1<br />
0<br />
<strong>2011</strong>-12<br />
Fatal Drownings<br />
Fatal Drowning Rate<br />
2012-13<br />
2013-14<br />
2014-15<br />
2015-16<br />
2016-17<br />
<strong>Year</strong><br />
2017-18<br />
2018-19<br />
2019-20<br />
<strong>2020</strong>-<strong>21</strong><br />
2.5<br />
2.0<br />
1.5<br />
1.0<br />
0.5<br />
0.0<br />
Fatal Drowning Rate<br />
(per <strong>10</strong>0,000 pop.)<br />
9%<br />
9%<br />
9%<br />
12%<br />
6%<br />
<strong>21</strong>%<br />
Swimming/<br />
Wading<br />
18%<br />
<strong>21</strong>%<br />
18%<br />
Swimming/Wading<br />
Boating<br />
Falls<br />
Land-Based Fishing<br />
Snorkelling<br />
Watercraft<br />
Attempting a Rescue<br />
Net/Shell Fishing<br />
Figure 7.12<br />
Comparison of <strong>Beach</strong> and <strong>Coastal</strong> Fatal Drowning Rates (per <strong>10</strong>0,000 pop.) by Activity in the Bay of Plenty<br />
Region: <strong>2011</strong>-<strong>21</strong> (ten-year average) and <strong>2020</strong>-<strong>21</strong>.<br />
Within the Bay of Plenty Region the <strong>2020</strong>-<strong>21</strong> fatal drowning rates (per <strong>10</strong>0,000 pop.) for falls, watercraft, snorkelling, landbased<br />
fishing and attempting a rescue activities were less than their respective ten-year averages. However, the <strong>2020</strong>-<strong>21</strong><br />
fatal drowning rates for swimming/wading, boating and net/shell fishing were greater than the ten-year average.<br />
SWIMMING / WADING<br />
SNORKELLING<br />
FALL<br />
<strong>2011</strong>-<strong>21</strong><br />
0.22<br />
<strong>2020</strong>-<strong>21</strong><br />
0.59<br />
<strong>2011</strong>-<strong>21</strong><br />
0.<strong>10</strong><br />
LAND-BASED FISHING<br />
<strong>2020</strong>-<strong>21</strong><br />
0.00<br />
BOATING<br />
<strong>2011</strong>-<strong>21</strong><br />
0.20<br />
<strong>2020</strong>-<strong>21</strong><br />
0.00<br />
<strong>2011</strong>-<strong>21</strong><br />
0.<strong>10</strong><br />
NET / SHELL FISHING<br />
<strong>2020</strong>-<strong>21</strong><br />
0.00<br />
WATERCRAFT<br />
<strong>2011</strong>-<strong>21</strong><br />
0.<strong>21</strong><br />
<strong>2020</strong>-<strong>21</strong><br />
0.30<br />
<strong>2011</strong>-<strong>21</strong><br />
0.09<br />
ATTEMPTING A RESCUE<br />
<strong>2020</strong>-<strong>21</strong><br />
0.30<br />
<strong>2011</strong>-<strong>21</strong><br />
0.07<br />
<strong>2020</strong>-<strong>21</strong><br />
0.00<br />
<strong>2011</strong>-<strong>21</strong><br />
0.11<br />
<strong>2020</strong>-<strong>21</strong><br />
0.00<br />
68<br />
SURF LIFE SAVING NEW ZEALAND NATIONAL BEACH AND COASTAL SAFETY REPORT 20<strong>21</strong>
FATAL DROWNING SNAPSHOT<br />
<strong>10</strong>-YEAR OVERVIEW | <strong>2011</strong>-<strong>21</strong> 1-YEAR OVERVIEW | <strong>2020</strong>-<strong>21</strong><br />
FATAL DROWNINGS<br />
AVERAGE FATALITY<br />
34<br />
4 1.19<br />
PER <strong>10</strong>0,000 POPULATION<br />
FATAL DROWNINGS BY LOCATION<br />
25%<br />
Attempting a Rescue<br />
Boating<br />
Diving / Jumping<br />
Fall<br />
Net / Shell Fishing<br />
Land-Based Fishing<br />
Scuba Diving<br />
Snorkeling<br />
Swimming / Wading<br />
Watercraft<br />
TOTAL FATAL DROWNINGS: 34<br />
25%<br />
50%<br />
Surf <strong>Beach</strong><br />
50%<br />
AVERAGE FATAL DROWNINGS<br />
3<br />
PER YEAR<br />
KEY DEMOGRAPHIC<br />
85%<br />
MALE<br />
15%<br />
FEMALE<br />
AVERAGE FATALITY<br />
1.14<br />
PER <strong>10</strong>0,000 POPULATION<br />
15+ 15+<br />
YEAR OLD MALES<br />
SWIMMING/WADING<br />
YEAR OLD MALES<br />
BOATING<br />
Surf <strong>Beach</strong> Eastuary Rocky Foreshore<br />
FATAL DROWNINGS BY ACTIVITY<br />
25%<br />
25%<br />
50%<br />
Swimming/<br />
Wading<br />
50%<br />
Swimming/Wading Boating Net/Shell Fishing
GISBORNE / TE TAI RAWHITI<br />
Figure 7.13<br />
<strong>2011</strong>-<strong>21</strong>: Gisborne Region <strong>Beach</strong> and <strong>Coastal</strong> Fatal<br />
Drownings and Fatal Drowning Rate per <strong>10</strong>0,000<br />
Population (n=<strong>10</strong>).<br />
During <strong>2020</strong>-<strong>21</strong>, there were two beach and coastal<br />
drowning fatality within the Gisborne Region, which is the<br />
greater than the ten-year average of one per year. The<br />
<strong>2020</strong>-<strong>21</strong> fatal drowning rate (3.94 per <strong>10</strong>0,000 pop.) was<br />
greater than the ten-year average (2.06 per <strong>10</strong>0,000 pop.).<br />
Figure 7.14<br />
<strong>2011</strong>-<strong>21</strong>: Gisborne Region <strong>Beach</strong> and <strong>Coastal</strong><br />
Drownings by Activity (n=<strong>10</strong>).<br />
Within the Gisborne Region during <strong>2011</strong>-<strong>21</strong>, beach and<br />
coastal drowning fatalities were attributed to snorkelling<br />
(n=5), attempting a rescue (n=1), boating (n=1), diving/<br />
jumping (n=1), swimming / wading (n=1) and watercraft<br />
(n=1) activities.<br />
Fatal Drownings (n)<br />
4<br />
3<br />
2<br />
1<br />
0<br />
<strong>2011</strong>-12<br />
Fatal Drownings<br />
Fatal Drowning Rate<br />
2012-13<br />
2013-14<br />
2014-15<br />
2015-16<br />
2016-17<br />
<strong>Year</strong><br />
2017-18<br />
2018-19<br />
2019-20<br />
<strong>2020</strong>-<strong>21</strong><br />
7<br />
6<br />
5<br />
4<br />
3<br />
2<br />
1<br />
0<br />
Fatal Drowning Rate<br />
(per <strong>10</strong>0,000 pop.)<br />
<strong>10</strong>%<br />
<strong>10</strong>%<br />
<strong>10</strong>%<br />
<strong>10</strong>%<br />
50%<br />
Snorkelling<br />
<strong>10</strong>%<br />
50%<br />
Snorkelling<br />
Attempting a Rescue<br />
Boating<br />
Diving/Jumping<br />
Swimming/Wading<br />
Watercraft<br />
Figure 7.15<br />
Comparison of <strong>Beach</strong> and <strong>Coastal</strong> Fatal Drowning Rates (per <strong>10</strong>0,000 pop.) by Activity in the Gisborne Region:<br />
<strong>2011</strong>-<strong>21</strong> (ten-year average) and <strong>2020</strong>-<strong>21</strong>.<br />
Within the Gisborne Region the <strong>2020</strong>-<strong>21</strong> fatal drowning rate (per <strong>10</strong>0,000 pop.) for swimming / wading, watercraft and<br />
attempting a rescue activities was less than their respective ten-year average. However, the <strong>2020</strong>-<strong>21</strong> fatal drowning rate for<br />
boating and snorkelling activities were greater than the ten-year average.<br />
SWIMMING / WADING<br />
SNORKELLING<br />
FALL<br />
<strong>2011</strong>-<strong>21</strong><br />
0.<strong>21</strong><br />
<strong>2020</strong>-<strong>21</strong><br />
0.00<br />
<strong>2011</strong>-<strong>21</strong><br />
1.02<br />
LAND-BASED FISHING<br />
<strong>2020</strong>-<strong>21</strong><br />
1.97<br />
BOATING<br />
<strong>2011</strong>-<strong>21</strong><br />
0.00<br />
<strong>2020</strong>-<strong>21</strong><br />
0.00<br />
<strong>2011</strong>-<strong>21</strong><br />
0.00<br />
NET / SHELL FISHING<br />
<strong>2020</strong>-<strong>21</strong><br />
0.00<br />
WATERCRAFT<br />
<strong>2011</strong>-<strong>21</strong><br />
0.20<br />
<strong>2020</strong>-<strong>21</strong><br />
1.97<br />
<strong>2011</strong>-<strong>21</strong><br />
0.00<br />
ATTEMPTING A RESCUE<br />
<strong>2020</strong>-<strong>21</strong><br />
0.00<br />
<strong>2011</strong>-<strong>21</strong><br />
0.<strong>21</strong><br />
<strong>2020</strong>-<strong>21</strong><br />
0.00<br />
<strong>2011</strong>-<strong>21</strong><br />
0.<strong>21</strong><br />
<strong>2020</strong>-<strong>21</strong><br />
0.00<br />
70<br />
SURF LIFE SAVING NEW ZEALAND NATIONAL BEACH AND COASTAL SAFETY REPORT 20<strong>21</strong>
FATAL DROWNING SNAPSHOT<br />
<strong>10</strong>-YEAR OVERVIEW | <strong>2011</strong>-20 1-YEAR OVERVIEW | <strong>2020</strong>-<strong>21</strong><br />
FATAL DROWNINGS<br />
AVERAGE FATALITY<br />
2 3.94<br />
PER <strong>10</strong>0,000 POPULATION<br />
FATAL DROWNINGS BY LOCATION<br />
<strong>10</strong><br />
Attempting a Rescue<br />
Boating<br />
Diving / Jumping<br />
Fall<br />
Net / Shell Fishing<br />
Land-Based Fishing<br />
Scuba Diving<br />
Snorkeling<br />
Swimming / Wading<br />
Watercraft<br />
<strong>10</strong>0%<br />
Surf <strong>Beach</strong><br />
TOTAL FATAL DROWNINGS: <strong>10</strong><br />
AVERAGE FATAL DROWNINGS<br />
1<br />
PER YEAR<br />
<strong>10</strong>0%<br />
MALE<br />
AVERAGE FATALITY<br />
2.06<br />
PER <strong>10</strong>0,000 POPULATION<br />
Surf <strong>Beach</strong><br />
FATAL DROWNINGS BY ACTIVITY<br />
0%<br />
FEMALE<br />
50%<br />
50%<br />
Boating<br />
50%<br />
Snorkelling<br />
50%<br />
KEY DEMOGRAPHIC<br />
24-44<br />
YEAR OLD MALES<br />
SNORKELLING<br />
Attempting a Rescue<br />
Land Based Fishing
HAWKE’S BAY / TE MATAU-A-MAUI<br />
Figure 7.16<br />
<strong>2011</strong>-<strong>21</strong>: Hawke’s Bay Region <strong>Beach</strong> and <strong>Coastal</strong> Fatal<br />
Drownings and Fatal Drowning Rate per <strong>10</strong>0,000<br />
Population (n=20).<br />
During <strong>2020</strong>-<strong>21</strong>, there was one beach and coastal<br />
drowning fatality within the Hawke’s Bay Region, which is<br />
less than the ten-year average of two per year. The <strong>2020</strong>-<strong>21</strong><br />
fatal drowning rate (0.56 per <strong>10</strong>0,000 pop.) is less than the<br />
ten-year average (1.22 per <strong>10</strong>0,000 pop.).<br />
Figure 7.17<br />
<strong>2011</strong>-<strong>21</strong>: Hawke’s Bay Region <strong>Beach</strong> and <strong>Coastal</strong><br />
Drownings by Activity (n=20).<br />
Within the Hawke’s Bay Region during <strong>2011</strong>-<strong>21</strong>, the majority<br />
of beach and coastal drowning fatalities occurred as a fall<br />
(n=6) attempting a rescue (n=5), followed by swimming/<br />
wading (n=4).<br />
Fatal Drownings (n)<br />
6<br />
5<br />
4<br />
3<br />
2<br />
1<br />
0<br />
<strong>2011</strong>-12<br />
Fatal Drownings<br />
Fatal Drowning Rate<br />
2012-13<br />
2013-14<br />
2014-15<br />
2015-16<br />
2016-17<br />
<strong>Year</strong><br />
2017-18<br />
2018-19<br />
2019-20<br />
<strong>2020</strong>-<strong>21</strong><br />
3.5<br />
3.0<br />
2.5<br />
2.0<br />
1.5<br />
1.0<br />
0.5<br />
0.0<br />
Fatal Drowning Rate<br />
(per <strong>10</strong>0,000 pop.)<br />
<strong>10</strong>%<br />
20%<br />
<strong>10</strong>%<br />
5%<br />
30%<br />
Falls<br />
25%<br />
30%<br />
Falls<br />
Attempting a Rescue<br />
Swimming/Wading<br />
Boating<br />
Scuba Diving<br />
Snorkelling<br />
Figure 7.18<br />
Comparison of <strong>Beach</strong> and <strong>Coastal</strong> Fatal Drowning Rates (per <strong>10</strong>0,000 pop.) by Activity in the Hawke’s Bay<br />
Region: <strong>2011</strong>-<strong>21</strong> (ten-year average) and <strong>2020</strong>-<strong>21</strong>.<br />
Within the Hawke’s Bay Region the <strong>2020</strong>-<strong>21</strong> fatal drowning rates (per <strong>10</strong>0,000 pop.) for swimming/wading, falls, boating<br />
and attempting rescue activities were less than their respective ten-year averages. However, the <strong>2020</strong>-<strong>21</strong> fatal drowning rate<br />
for snorkelling was greater than the ten-year average.<br />
SWIMMING / WADING<br />
SNORKELLING<br />
FALL<br />
<strong>2011</strong>-<strong>21</strong><br />
0.24<br />
<strong>2020</strong>-<strong>21</strong><br />
0.00<br />
<strong>2011</strong>-<strong>21</strong><br />
0.06<br />
LAND-BASED FISHING<br />
<strong>2020</strong>-<strong>21</strong><br />
0.56<br />
BOATING<br />
<strong>2011</strong>-<strong>21</strong><br />
0.37<br />
<strong>2020</strong>-<strong>21</strong><br />
0.00<br />
<strong>2011</strong>-<strong>21</strong><br />
0.00<br />
NET / SHELL FISHING<br />
<strong>2020</strong>-<strong>21</strong><br />
0.00<br />
WATERCRAFT<br />
<strong>2011</strong>-<strong>21</strong><br />
0.12<br />
<strong>2020</strong>-<strong>21</strong><br />
0.00<br />
<strong>2011</strong>-<strong>21</strong><br />
0.00<br />
ATTEMPTING A RESCUE<br />
<strong>2020</strong>-<strong>21</strong><br />
0.00<br />
<strong>2011</strong>-<strong>21</strong><br />
0.00<br />
<strong>2020</strong>-<strong>21</strong><br />
0.00<br />
<strong>2011</strong>-<strong>21</strong><br />
0.31<br />
<strong>2020</strong>-<strong>21</strong><br />
0.00<br />
72<br />
SURF LIFE SAVING NEW ZEALAND NATIONAL BEACH AND COASTAL SAFETY REPORT 20<strong>21</strong>
FATAL DROWNING SNAPSHOT<br />
<strong>10</strong>-YEAR OVERVIEW | <strong>2011</strong>-<strong>21</strong> 1-YEAR OVERVIEW | <strong>2020</strong>-<strong>21</strong><br />
FATAL DROWNINGS<br />
AVERAGE FATALITY<br />
1 0.57<br />
PER <strong>10</strong>0,000 POPULATION<br />
FATAL DROWNINGS BY LOCATION<br />
Attempting a Rescue<br />
Boating<br />
Diving / Jumping<br />
Fall<br />
TOTAL FATAL DROWNINGS: 20<br />
AVERAGE FATAL DROWNINGS<br />
2<br />
PER YEAR<br />
KEY DEMOGRAPHIC<br />
YEAR OLD MALES<br />
FALLS<br />
Net / Shell Fishing<br />
Land-Based Fishing<br />
Scuba Diving<br />
Snorkeling<br />
80%<br />
MALE<br />
20%<br />
FEMALE<br />
20<br />
Swimming / Wading<br />
Watercraft<br />
AVERAGE FATALITY<br />
1.22<br />
PER <strong>10</strong>0,000 POPULATION<br />
0-24 5-54<br />
YEAR OLD MALES & FEMALES<br />
ATTEMPTING A RESCUE<br />
<strong>10</strong>0%<br />
Surf <strong>Beach</strong><br />
Surf <strong>Beach</strong><br />
FATAL DROWNINGS BY ACTIVITY<br />
<strong>10</strong>0%<br />
Snorkelling<br />
Snorkelling
TARANAKI<br />
Figure 7.19<br />
<strong>2011</strong>-<strong>21</strong>: Taranaki Region <strong>Beach</strong> and <strong>Coastal</strong> Fatal<br />
Drownings and Fatal Drowning Rate per <strong>10</strong>0,000<br />
Population (n=7).<br />
During <strong>2020</strong>-<strong>21</strong>, there were no beach and coastal drowning<br />
fatality within the Taranaki Region, which is less than the<br />
ten-year average of one per year. The <strong>2020</strong>-<strong>21</strong> fatal<br />
drowning rate (0.00 per <strong>10</strong>0,000 pop.) was less than the<br />
ten-year average (0.60 per <strong>10</strong>0,000 pop.).<br />
Figure 7.20<br />
<strong>2011</strong>-<strong>21</strong>: Taranaki Region <strong>Beach</strong> and <strong>Coastal</strong><br />
Drownings by Activity (n=7).<br />
Within the Taranaki Region during <strong>2011</strong>-<strong>21</strong>, the majority<br />
of beach and coastal drowning fatalities resulted from falls<br />
(n=2) and boating (n=2), followed attempting a rescue<br />
(n=1), swimming/wading (n=1) and watercraft activities<br />
(n=1).<br />
Fatal Drownings (n)<br />
4<br />
3<br />
2<br />
1<br />
0<br />
<strong>2011</strong>-12<br />
Fatal Drownings<br />
Fatal Drowning Rate<br />
2012-13<br />
2013-14<br />
2014-15<br />
2015-16<br />
2016-17<br />
2017-18<br />
2018-19<br />
2019-20<br />
<strong>2020</strong>-<strong>21</strong><br />
3.0<br />
2.5<br />
2.0<br />
1.5<br />
1.0<br />
0.5<br />
0.0<br />
Fatal Drowning Rate<br />
(per <strong>10</strong>0,000 pop.)<br />
14%<br />
14%<br />
14%<br />
29%<br />
Boating<br />
29%<br />
29%<br />
Boating<br />
Falls<br />
Attempting a Rescue<br />
Swimming/Wading<br />
Watercraft<br />
<strong>Year</strong><br />
Figure 7.<strong>21</strong><br />
Comparison of <strong>Beach</strong> and <strong>Coastal</strong> Fatal Drowning Rates (per <strong>10</strong>0,000 pop.) by Activity in the Taranaki Region:<br />
<strong>2011</strong>-<strong>21</strong> (ten-year average) and <strong>2020</strong>-<strong>21</strong>.<br />
Within the Taranaki Region the <strong>2020</strong>-<strong>21</strong> fatal drowning rates (per <strong>10</strong>0,000 pop.) for falls, boating, watercraft and<br />
attempting rescue activities were less than their respective ten-year averages.<br />
SWIMMING / WADING<br />
SNORKELLING<br />
FALL<br />
<strong>2011</strong>-<strong>21</strong><br />
0.08<br />
<strong>2020</strong>-<strong>21</strong><br />
0.00<br />
<strong>2011</strong>-<strong>21</strong><br />
0.00<br />
LAND-BASED FISHING<br />
<strong>2020</strong>-<strong>21</strong><br />
0.00<br />
BOATING<br />
<strong>2011</strong>-<strong>21</strong><br />
0.18<br />
<strong>2020</strong>-<strong>21</strong><br />
0.00<br />
<strong>2011</strong>-<strong>21</strong><br />
0.00<br />
NET / SHELL FISHING<br />
<strong>2020</strong>-<strong>21</strong><br />
0.00<br />
WATERCRAFT<br />
<strong>2011</strong>-<strong>21</strong><br />
0.17<br />
<strong>2020</strong>-<strong>21</strong><br />
0.00<br />
<strong>2011</strong>-<strong>21</strong><br />
0.00<br />
ATTEMPTING A RESCUE<br />
<strong>2020</strong>-<strong>21</strong><br />
0.00<br />
<strong>2011</strong>-<strong>21</strong><br />
0.08<br />
<strong>2020</strong>-<strong>21</strong><br />
0.00<br />
<strong>2011</strong>-<strong>21</strong><br />
0.09<br />
<strong>2020</strong>-<strong>21</strong><br />
0.00<br />
74<br />
SURF LIFE SAVING NEW ZEALAND NATIONAL BEACH AND COASTAL SAFETY REPORT 20<strong>21</strong>
FATAL DROWNING SNAPSHOT<br />
<strong>10</strong>-YEAR OVERVIEW | <strong>2011</strong>-<strong>21</strong> 1-YEAR OVERVIEW | <strong>2020</strong>-<strong>21</strong><br />
FATAL DROWNINGS<br />
AVERAGE FATALITY<br />
0 0.00<br />
PER <strong>10</strong>0,000 POPULATION<br />
FATAL DROWNINGS BY LOCATION<br />
7<br />
Attempting a Rescue<br />
Boating<br />
Diving / Jumping<br />
Fall<br />
Net / Shell Fishing<br />
Land-Based Fishing<br />
Scuba Diving<br />
Snorkeling<br />
Swimming / Wading<br />
Watercraft<br />
ZERO<br />
Fatal<br />
Drownings<br />
TOTAL FATAL DROWNINGS: 7<br />
AVERAGE FATAL DROWNINGS<br />
MANAWATU-WANGANUI<br />
Figure 7.22<br />
<strong>2011</strong>-<strong>21</strong>: Manawatū-Wanganui Region <strong>Beach</strong> and<br />
<strong>Coastal</strong> Fatal Drownings and Fatal Drowning Rate per<br />
<strong>10</strong>0,000 Population (n=5).<br />
During <strong>2020</strong>-<strong>21</strong>, there were no beach and coastal drowning<br />
fatalities within the Manawatu-Wanganui Region, which is<br />
less than the ten-year average of less than one per year. The<br />
<strong>2020</strong>-<strong>21</strong> fatal drowning rate (0.00 per <strong>10</strong>0,000 pop.) was<br />
less than the ten-year average (0.<strong>21</strong> per <strong>10</strong>0,000 pop.).<br />
Figure 7.23<br />
<strong>2011</strong>-<strong>21</strong>: Manawatū-Wanganui Region <strong>Beach</strong> and<br />
<strong>Coastal</strong> Drownings by Activity (n=5).<br />
Within the Manawatu-Wanganui Region during 20<strong>10</strong>-<br />
20, the majority of beach and coastal drowning fatalities<br />
occurred while swimming/wading (n=3), followed by<br />
snorkelling activities (n=1).<br />
3<br />
Fatal Drownings<br />
Fatal Drowning Rate<br />
1.0<br />
20%<br />
Fatal Drownings (n)<br />
2<br />
1<br />
0.8<br />
0.6<br />
0.4<br />
0.2<br />
Fatal Drowning Rate<br />
(per <strong>10</strong>0,000 pop.)<br />
80%<br />
Swimming/Wading<br />
Snorkelling<br />
0<br />
<strong>2011</strong>-12<br />
2012-13<br />
2013-14<br />
2014-15<br />
2015-16<br />
2016-17<br />
<strong>Year</strong><br />
2017-18<br />
2018-19<br />
2019-20<br />
<strong>2020</strong>-<strong>21</strong><br />
0.0<br />
80%<br />
Figure 7.24<br />
Comparison of <strong>Beach</strong> and <strong>Coastal</strong> Fatal Drowning Rates (per <strong>10</strong>0,000 pop.) by Activity in the Manawatū-<br />
Wanganui Region: <strong>2011</strong>-<strong>21</strong> (ten-year average) and <strong>2020</strong>-<strong>21</strong>.<br />
Within the Manawatu-Wanganui Region the <strong>2020</strong>-<strong>21</strong> fatal drowning rate (per <strong>10</strong>0,000 pop.) for swimming/wading and<br />
snorkelling activities were less than their respective ten-year average.<br />
SWIMMING / WADING<br />
SNORKELLING<br />
FALL<br />
<strong>2011</strong>-<strong>21</strong><br />
0.17<br />
<strong>2020</strong>-<strong>21</strong><br />
0.00<br />
<strong>2011</strong>-<strong>21</strong><br />
0.04<br />
LAND-BASED FISHING<br />
<strong>2020</strong>-<strong>21</strong><br />
0.00<br />
BOATING<br />
<strong>2011</strong>-<strong>21</strong><br />
0.00<br />
<strong>2020</strong>-<strong>21</strong><br />
0.00<br />
<strong>2011</strong>-<strong>21</strong><br />
0.00<br />
NET / SHELL FISHING<br />
<strong>2020</strong>-<strong>21</strong><br />
0.00<br />
WATERCRAFT<br />
<strong>2011</strong>-<strong>21</strong><br />
0.00<br />
<strong>2020</strong>-<strong>21</strong><br />
0.00<br />
<strong>2011</strong>-<strong>21</strong><br />
0.00<br />
ATTEMPTING A RESCUE<br />
<strong>2020</strong>-<strong>21</strong><br />
0.00<br />
<strong>2011</strong>-<strong>21</strong><br />
0.00<br />
<strong>2020</strong>-<strong>21</strong><br />
0.00<br />
<strong>2011</strong>-<strong>21</strong><br />
0.00<br />
<strong>2020</strong>-<strong>21</strong><br />
0.00<br />
76<br />
SURF LIFE SAVING NEW ZEALAND NATIONAL BEACH AND COASTAL SAFETY REPORT 20<strong>21</strong>
FATAL DROWNING SNAPSHOT<br />
<strong>10</strong>-YEAR OVERVIEW | <strong>2011</strong>-<strong>21</strong> 1-YEAR OVERVIEW | <strong>2020</strong>-<strong>21</strong><br />
FATAL DROWNINGS<br />
AVERAGE FATALITY<br />
5<br />
0 0.00<br />
PER <strong>10</strong>0,000 POPULATION<br />
FATAL DROWNINGS BY LOCATION<br />
Attempting a Rescue<br />
Boating<br />
Diving / Jumping<br />
Fall<br />
Net / Shell Fishing<br />
Land-Based Fishing<br />
Scuba Diving<br />
Snorkeling<br />
Swimming / Wading<br />
Watercraft<br />
ZERO<br />
Fatal<br />
Drownings<br />
TOTAL FATAL DROWNINGS: 5<br />
AVERAGE FATAL DROWNINGS AVERAGE FATALITY<br />
WELLINGTON / TE WHANGA-NUI-A-TARA<br />
Figure 7.25<br />
<strong>2011</strong>-<strong>21</strong>: Wellington Region <strong>Beach</strong> and <strong>Coastal</strong> Fatal<br />
Drownings and Fatal Drowning Rate per <strong>10</strong>0,000<br />
Population (n=34).<br />
During <strong>2020</strong>-<strong>21</strong>, there were three beach and coastal<br />
drowning fatalities within the Wellington Region, which<br />
equals the ten-year average of three per year. The <strong>2020</strong>-<strong>21</strong><br />
fatal drowning rate (0.55 per <strong>10</strong>0,000 pop.) was less than<br />
the ten-year average (0.67 per <strong>10</strong>0,000 pop.).<br />
Figure 7.26<br />
<strong>2011</strong>-<strong>21</strong>: Wellington Region <strong>Beach</strong> and <strong>Coastal</strong><br />
Drownings by Activity (n=34).<br />
Within the Wellington Region during <strong>2011</strong>-<strong>21</strong>, the majority<br />
of beach and coastal drowning fatalities occurred while<br />
swimming/wading (n=8), followed by boating (n=5), falls<br />
(n=5), snorkelling (n=5) and watercraft activities (n=5).<br />
Fatal Drownings (n)<br />
6<br />
5<br />
4<br />
3<br />
2<br />
1<br />
0<br />
<strong>2011</strong>-12<br />
Fatal Drownings<br />
Fatal Drowning Rate<br />
2012-13<br />
2013-14<br />
2014-15<br />
2015-16<br />
2016-17<br />
2017-18<br />
2018-19<br />
2019-20<br />
<strong>2020</strong>-<strong>21</strong><br />
1.2<br />
1.0<br />
0.8<br />
0.6<br />
0.4<br />
0.2<br />
0.0<br />
Fatal Drowning Rate<br />
(per <strong>10</strong>0,000 pop.)<br />
15%<br />
6%<br />
3% 3% 3%<br />
3%<br />
15%<br />
15%<br />
24%<br />
Swimming/<br />
Wading<br />
24%<br />
15%<br />
Swimming/Wading<br />
Boating<br />
Falls<br />
Snorkelling<br />
Watercraft<br />
Scuba Diving<br />
Attempting a Rescue<br />
Diving/Jumping<br />
Net/Shell Fishing<br />
Land-Based Fishing<br />
<strong>Year</strong><br />
Figure 7.27<br />
Comparison of <strong>Beach</strong> and <strong>Coastal</strong> Fatal Drowning Rates (per <strong>10</strong>0,000 pop.) by Activity in the Wellington Region:<br />
<strong>2011</strong>-<strong>21</strong> (ten-year average) and <strong>2020</strong>-<strong>21</strong>.<br />
Within the Wellington Region the <strong>2020</strong>-<strong>21</strong> fatal drowning rates (per <strong>10</strong>0,000 pop.) for falls, watercraft, snorkelling, landbased<br />
fishing, net/shell fishing and attempting a rescue activities were less than their respective ten-year averages. However,<br />
the <strong>2020</strong>-<strong>21</strong> fatal drowning rates for swimming/wading and boating activities were greater than the ten-year average.<br />
SWIMMING / WADING<br />
SNORKELLING<br />
FALL<br />
<strong>2011</strong>-<strong>21</strong><br />
0.16<br />
<strong>2020</strong>-<strong>21</strong><br />
0.37<br />
<strong>2011</strong>-<strong>21</strong><br />
0.<strong>10</strong><br />
LAND-BASED FISHING<br />
<strong>2020</strong>-<strong>21</strong><br />
0.00<br />
BOATING<br />
<strong>2011</strong>-<strong>21</strong><br />
0.<strong>10</strong><br />
<strong>2020</strong>-<strong>21</strong><br />
0.00<br />
<strong>2011</strong>-<strong>21</strong><br />
0.02<br />
NET / SHELL FISHING<br />
<strong>2020</strong>-<strong>21</strong><br />
0.00<br />
WATERCRAFT<br />
<strong>2011</strong>-<strong>21</strong><br />
0.<strong>10</strong><br />
<strong>2020</strong>-<strong>21</strong><br />
0.18<br />
<strong>2011</strong>-<strong>21</strong><br />
0.02<br />
ATTEMPTING A RESCUE<br />
<strong>2020</strong>-<strong>21</strong><br />
0.00<br />
<strong>2011</strong>-<strong>21</strong><br />
0.<strong>10</strong><br />
<strong>2020</strong>-<strong>21</strong><br />
0.00<br />
<strong>2011</strong>-<strong>21</strong><br />
0.02<br />
<strong>2020</strong>-<strong>21</strong><br />
0.00<br />
78<br />
SURF LIFE SAVING NEW ZEALAND NATIONAL BEACH AND COASTAL SAFETY REPORT 20<strong>21</strong>
FATAL DROWNING SNAPSHOT<br />
<strong>10</strong>-YEAR OVERVIEW | <strong>2011</strong>-<strong>21</strong> 1-YEAR OVERVIEW | <strong>2020</strong>-<strong>21</strong><br />
FATAL DROWNINGS<br />
AVERAGE FATALITY<br />
3 0.55<br />
PER <strong>10</strong>0,000 POPULATION<br />
FATAL DROWNINGS BY LOCATION<br />
34<br />
33%<br />
Attempting a Rescue<br />
Boating<br />
Diving / Jumping<br />
Fall<br />
Net / Shell Fishing<br />
Land-Based Fishing<br />
Scuba Diving<br />
Snorkeling<br />
Swimming / Wading<br />
Watercraft<br />
67%<br />
Harbour<br />
67%<br />
TOTAL FATAL DROWNINGS: 34<br />
AVERAGE FATAL DROWNINGS<br />
3<br />
PER YEAR<br />
KEY DEMOGRAPHIC<br />
25+<br />
91%<br />
MALE<br />
9%<br />
FEMALE<br />
AVERAGE FATALITY<br />
0.67<br />
PER <strong>10</strong>0,000 POPULATION<br />
FATAL DROWNINGS BY ACTIVITY<br />
33%<br />
Harbour<br />
0-1Km from shore<br />
67%<br />
Swimming/<br />
Wading<br />
67%<br />
YEAR OLD MALES<br />
SWIMMING/WADING<br />
Swimming/Wading<br />
Boating
TASMAN / TE TAI-O-AORERE<br />
Figure 7.28<br />
<strong>2011</strong>-<strong>21</strong>: Tasman Region <strong>Beach</strong> and <strong>Coastal</strong> Fatal<br />
Drownings and Fatal Drowning Rate per <strong>10</strong>0,000<br />
Population (n=5).<br />
During <strong>2020</strong>-<strong>21</strong>, there were beach and coastal drowning<br />
fatality within the Tasman Region, which is less than the tenyear<br />
average of less than one per year. The <strong>2020</strong>-<strong>21</strong> fatal<br />
drowning rate (0.00 per <strong>10</strong>0,000 pop.) was less than the<br />
ten-year average (0.96 per <strong>10</strong>0,000 pop.).<br />
Figure 7.29<br />
<strong>2011</strong>-<strong>21</strong>: Tasman Region <strong>Beach</strong> and <strong>Coastal</strong> Drownings<br />
by Activity (n=5).<br />
Within the Tasman Region during <strong>2011</strong>-<strong>21</strong>, the beach and<br />
coastal drowning fatalities occurred while swimming/wading<br />
(n=2), net / shell fishing (n=1) land based fishing (n=1) and<br />
watercraft activities (n=1).<br />
Fatal Drownings (n)<br />
2<br />
1<br />
0<br />
<strong>2011</strong>-12<br />
Fatal Drownings<br />
Fatal Drowning Rate<br />
2012-13<br />
2013-14<br />
2014-15<br />
2015-16<br />
2016-17<br />
2017-18<br />
2018-19<br />
2019-20<br />
<strong>2020</strong>-<strong>21</strong><br />
4.0<br />
3.5<br />
3.0<br />
2.5<br />
2.0<br />
1.5<br />
1.0<br />
0.5<br />
0.0<br />
Fatal Drowning Rate<br />
(per <strong>10</strong>0,000 pop.)<br />
20%<br />
20%<br />
40%<br />
Swimming/<br />
Wading<br />
40%<br />
Swimming/Wading<br />
Land-Based Fishing<br />
Net/Shell Fishing<br />
Watercraft<br />
<strong>Year</strong><br />
20%<br />
Figure 7.30<br />
Comparison of <strong>Beach</strong> and <strong>Coastal</strong> Fatal Drowning Rates (per <strong>10</strong>0,000 pop.) by Activity in the Tasman Region:<br />
<strong>2011</strong>-<strong>21</strong> (ten-year average) and <strong>2020</strong>-<strong>21</strong>.<br />
Within the Tasman Region the <strong>2020</strong>-<strong>21</strong> fatal drowning rates (per <strong>10</strong>0,000 pop.) for swimming/wading, watercraft, landbased<br />
fishing and net/shell fishing activities were less than their respective ten-year averages.<br />
SWIMMING / WADING<br />
SNORKELLING<br />
FALL<br />
<strong>2011</strong>-<strong>21</strong><br />
0.39<br />
<strong>2020</strong>-<strong>21</strong><br />
0.00<br />
<strong>2011</strong>-<strong>21</strong><br />
0.00<br />
LAND-BASED FISHING<br />
<strong>2020</strong>-<strong>21</strong><br />
0.00<br />
BOATING<br />
<strong>2011</strong>-<strong>21</strong><br />
0.00<br />
<strong>2020</strong>-<strong>21</strong><br />
0.00<br />
<strong>2011</strong>-<strong>21</strong><br />
0.19<br />
NET / SHELL FISHING<br />
<strong>2020</strong>-<strong>21</strong><br />
0.00<br />
WATERCRAFT<br />
<strong>2011</strong>-<strong>21</strong><br />
0.00<br />
<strong>2020</strong>-<strong>21</strong><br />
0.00<br />
<strong>2011</strong>-<strong>21</strong><br />
0.25<br />
ATTEMPTING A RESCUE<br />
<strong>2020</strong>-<strong>21</strong><br />
0.00<br />
<strong>2011</strong>-<strong>21</strong><br />
0.18<br />
<strong>2020</strong>-<strong>21</strong><br />
0.00<br />
<strong>2011</strong>-<strong>21</strong><br />
0.00<br />
<strong>2020</strong>-<strong>21</strong><br />
0.00<br />
80<br />
SURF LIFE SAVING NEW ZEALAND NATIONAL BEACH AND COASTAL SAFETY REPORT 20<strong>21</strong>
FATAL DROWNING SNAPSHOT<br />
<strong>10</strong>-YEAR OVERVIEW | <strong>2011</strong>-<strong>21</strong> 1-YEAR OVERVIEW | <strong>2020</strong>-<strong>21</strong><br />
FATAL DROWNINGS<br />
AVERAGE FATALITY<br />
0 0.00<br />
PER <strong>10</strong>0,000 POPULATION<br />
FATAL DROWNINGS BY LOCATION<br />
Attempting a Rescue<br />
Boating<br />
Diving / Jumping<br />
Fall<br />
Net / Shell Fishing<br />
Land-Based Fishing<br />
Scuba Diving<br />
Snorkeling<br />
5<br />
Swimming / Wading<br />
Watercraft<br />
ZERO<br />
Fatal<br />
Drownings<br />
TOTAL FATAL DROWNINGS: 5<br />
AVERAGE FATAL DROWNINGS AVERAGE FATALITY<br />
NELSON / WHAKATU<br />
Figure 7.31<br />
<strong>2011</strong>-<strong>21</strong>: Nelson Region <strong>Beach</strong> and <strong>Coastal</strong> Fatal<br />
Drownings and Fatal Drowning Rate per <strong>10</strong>0,000<br />
Population (n=0).<br />
During <strong>2020</strong>-<strong>21</strong>, there were no beach and coastal drowning<br />
fatality within the Nelson Region, which equals the ten-year<br />
average of zero per year. The <strong>2020</strong>-<strong>21</strong> fatal drowning rate<br />
(0.00 per <strong>10</strong>0,000 pop.) was equals the ten-year average<br />
(0.00 per <strong>10</strong>0,000 pop.).<br />
Figure 7.32<br />
<strong>2011</strong>-<strong>21</strong>: Nelson Region <strong>Beach</strong> and <strong>Coastal</strong> Drownings<br />
by Activity (n=0).<br />
Within the Nelson Region during <strong>2011</strong>-<strong>21</strong>, there were no<br />
beach and coastal drowning fatalities.<br />
1 Fatal Drownings<br />
1.0<br />
Fatal Drowning Rate<br />
Fatal Drownings (n)<br />
Fatal Drowning Rate<br />
(per <strong>10</strong>0,000 pop.)<br />
ZERO<br />
Fatal<br />
Drownings<br />
0<br />
<strong>2011</strong>-12<br />
2012-13<br />
2013-14<br />
2014-15<br />
2015-16<br />
2016-17<br />
2017-18<br />
2018-19<br />
2019-20<br />
<strong>2020</strong>-<strong>21</strong><br />
0.0<br />
<strong>Year</strong><br />
Figure 7.33<br />
Comparison of <strong>Beach</strong> and <strong>Coastal</strong> Fatal Drowning Rates (per <strong>10</strong>0,000 pop.) by Activity in the Nelson Region:<br />
<strong>2011</strong>-<strong>21</strong> (ten-year average) and <strong>2020</strong>-<strong>21</strong>.<br />
Within the Tasman Region the <strong>2020</strong>-<strong>21</strong> fatal drowning rates (per <strong>10</strong>0,000 pop.) for swimming/wading, watercraft, landbased<br />
fishing and net/shell fishing activities were less than their respective ten-year averages.<br />
SWIMMING / WADING<br />
SNORKELLING<br />
FALL<br />
<strong>2011</strong>-<strong>21</strong><br />
0.00<br />
<strong>2020</strong>-<strong>21</strong><br />
0.00<br />
<strong>2011</strong>-<strong>21</strong><br />
0.00<br />
LAND-BASED FISHING<br />
<strong>2020</strong>-<strong>21</strong><br />
0.00<br />
BOATING<br />
<strong>2011</strong>-<strong>21</strong><br />
0.00<br />
<strong>2020</strong>-<strong>21</strong><br />
0.00<br />
<strong>2011</strong>-<strong>21</strong><br />
0.00<br />
NET / SHELL FISHING<br />
<strong>2020</strong>-<strong>21</strong><br />
0.00<br />
WATERCRAFT<br />
<strong>2011</strong>-<strong>21</strong><br />
0.00<br />
<strong>2020</strong>-<strong>21</strong><br />
0.00<br />
<strong>2011</strong>-<strong>21</strong><br />
0.00<br />
ATTEMPTING A RESCUE<br />
<strong>2020</strong>-<strong>21</strong><br />
0.00<br />
<strong>2011</strong>-<strong>21</strong><br />
0.00<br />
<strong>2020</strong>-<strong>21</strong><br />
0.00<br />
<strong>2011</strong>-<strong>21</strong><br />
0.00<br />
<strong>2020</strong>-<strong>21</strong><br />
0.00<br />
82<br />
SURF LIFE SAVING NEW ZEALAND NATIONAL BEACH AND COASTAL SAFETY REPORT 20<strong>21</strong>
FATAL DROWNING SNAPSHOT<br />
<strong>10</strong>-YEAR OVERVIEW | <strong>2011</strong>-<strong>21</strong> 1-YEAR OVERVIEW | <strong>2020</strong>-<strong>21</strong><br />
FATAL DROWNINGS<br />
AVERAGE FATALITY<br />
0 0.00<br />
PER <strong>10</strong>0,000 POPULATION<br />
FATAL DROWNINGS BY LOCATION<br />
Attempting a Rescue<br />
Boating<br />
Diving / Jumping<br />
Fall<br />
Net / Shell Fishing<br />
Land-Based Fishing<br />
Scuba Diving<br />
Snorkeling<br />
0<br />
Swimming / Wading<br />
Watercraft<br />
ZERO<br />
Fatal<br />
Drownings<br />
TOTAL FATAL DROWNINGS: 0<br />
AVERAGE FATAL DROWNINGS<br />
0<br />
PER YEAR<br />
AVERAGE FATALITY<br />
0.00<br />
PER <strong>10</strong>0,000 POPULATION<br />
FATAL DROWNINGS BY ACTIVITY<br />
0%<br />
MALE<br />
0%<br />
FEMALE<br />
ZERO<br />
Fatal<br />
Drownings
MARLBOROUGH / TE TAUIHU-O-TE-WAKA<br />
Figure 7.34<br />
<strong>2011</strong>-<strong>21</strong>: Marlborough Region <strong>Beach</strong> and <strong>Coastal</strong><br />
Fatal Drownings and Fatal Drowning Rate per <strong>10</strong>0,000<br />
Population (n=4).<br />
During <strong>2020</strong>-<strong>21</strong>, there were no beach and coastal drowning<br />
fatality within the Marlborough Region, which is less than<br />
the ten-year average of less than one per year. The <strong>2020</strong>-<strong>21</strong><br />
fatal drowning rate (0.00 per <strong>10</strong>0,000 pop.) was less than<br />
the ten-year average (0.84 per <strong>10</strong>0,000 pop.).<br />
Figure 7.35<br />
<strong>2011</strong>-<strong>21</strong>: Marlborough Region <strong>Beach</strong> and <strong>Coastal</strong><br />
Drownings by Activity (n=4).<br />
Within the Marlborough Region during <strong>2011</strong>-<strong>21</strong>, the majority<br />
of beach and coastal drowning fatalities were classified as<br />
falls (n=3), followed by scuba diving activities (n=1).<br />
2<br />
Fatal Drownings<br />
Fatal Drowning Rate<br />
2.5<br />
Fatal Drownings (n)<br />
1<br />
0<br />
<strong>2011</strong>-12<br />
2012-13<br />
2013-14<br />
2014-15<br />
2015-16<br />
2016-17<br />
<strong>Year</strong><br />
2017-18<br />
2018-19<br />
2019-20<br />
<strong>2020</strong>-<strong>21</strong><br />
2.0<br />
1.5<br />
1.0<br />
0.5<br />
0.0<br />
Fatal Drowning Rate<br />
(per <strong>10</strong>0,000 pop.)<br />
25%<br />
75%<br />
Fall<br />
75%<br />
Falls<br />
Scuba Diving<br />
Figure 7.36<br />
Comparison of <strong>Beach</strong> and <strong>Coastal</strong> Fatal Drowning Rates (per <strong>10</strong>0,000 pop.) by Activity in the Marlborough<br />
Region: <strong>2011</strong>-<strong>21</strong> (ten-year average) and <strong>2020</strong>-<strong>21</strong>.<br />
Within the Marlborough Region the <strong>2020</strong>-<strong>21</strong> fatal drowning rates (per <strong>10</strong>0,000 pop.) for falls was less than the ten-year<br />
average.<br />
SWIMMING / WADING<br />
SNORKELLING<br />
FALL<br />
<strong>2011</strong>-<strong>21</strong><br />
0.00<br />
<strong>2020</strong>-<strong>21</strong><br />
0.00<br />
<strong>2011</strong>-<strong>21</strong><br />
0.00<br />
LAND-BASED FISHING<br />
<strong>2020</strong>-<strong>21</strong><br />
0.00<br />
BOATING<br />
<strong>2011</strong>-<strong>21</strong><br />
0.62<br />
<strong>2020</strong>-<strong>21</strong><br />
0.00<br />
<strong>2011</strong>-<strong>21</strong><br />
0.00<br />
NET / SHELL FISHING<br />
<strong>2020</strong>-<strong>21</strong><br />
0.00<br />
WATERCRAFT<br />
<strong>2011</strong>-<strong>21</strong><br />
0.00<br />
<strong>2020</strong>-<strong>21</strong><br />
0.00<br />
<strong>2011</strong>-<strong>21</strong><br />
0.00<br />
ATTEMPTING A RESCUE<br />
<strong>2020</strong>-<strong>21</strong><br />
0.00<br />
<strong>2011</strong>-<strong>21</strong><br />
0.00<br />
<strong>2020</strong>-<strong>21</strong><br />
0.00<br />
<strong>2011</strong>-<strong>21</strong><br />
0.00<br />
<strong>2020</strong>-<strong>21</strong><br />
0.00<br />
84<br />
SURF LIFE SAVING NEW ZEALAND NATIONAL BEACH AND COASTAL SAFETY REPORT 20<strong>21</strong>
FATAL DROWNING SNAPSHOT<br />
<strong>10</strong>-YEAR OVERVIEW | <strong>2011</strong>-<strong>21</strong> 1-YEAR OVERVIEW | <strong>2020</strong>-<strong>21</strong><br />
FATAL DROWNINGS<br />
AVERAGE FATALITY<br />
0 0.00<br />
PER <strong>10</strong>0,000 POPULATION<br />
FATAL DROWNINGS BY LOCATION<br />
Attempting a Rescue<br />
Boating<br />
Diving / Jumping<br />
Fall<br />
Net / Shell Fishing<br />
Land-Based Fishing<br />
Scuba Diving<br />
Snorkeling<br />
4<br />
Swimming / Wading<br />
Watercraft<br />
ZERO<br />
Fatal<br />
Drownings<br />
TOTAL FATAL DROWNINGS: 4<br />
AVERAGE FATAL DROWNINGS AVERAGE FATALITY<br />
WEST COAST / TE TAI POUTINI<br />
Figure 7.37<br />
<strong>2011</strong>-<strong>21</strong>: West Coast Region <strong>Beach</strong> and <strong>Coastal</strong> Fatal<br />
Drownings and Fatal Drowning Rate per <strong>10</strong>0,000<br />
Population (n=7).<br />
During <strong>2020</strong>-<strong>21</strong>, there were no beach and coastal drowning<br />
fatality within the West Coast Region, which is less the tenyear<br />
average of one per year. The <strong>2020</strong>-<strong>21</strong> fatal drowning<br />
rate (0.00 per <strong>10</strong>0,000 pop.) was less than the ten-year<br />
average (2.13 per <strong>10</strong>0,000 pop.).<br />
Figure 7.38<br />
<strong>2011</strong>-<strong>21</strong>: West Coast Region <strong>Beach</strong> and <strong>Coastal</strong><br />
Drownings by Activity (n=7).<br />
Within the West Coast Region during <strong>2011</strong>-<strong>21</strong>, the majority<br />
of beach and coastal drowning fatalities were classified<br />
as boating (n=3) and falls (n=3), followed by swimming/<br />
wading (n=1).<br />
3<br />
Fatal Drownings<br />
Fatal Drowning Rate<br />
7.0<br />
6.0<br />
14%<br />
Fatal Drownings (n)<br />
2<br />
1<br />
5.0<br />
4.0<br />
3.0<br />
2.0<br />
1.0<br />
Fatal Drowning Rate<br />
(per <strong>10</strong>0,000 pop.)<br />
43%<br />
Boating<br />
43%<br />
Falls<br />
43%<br />
0<br />
<strong>2011</strong>-12<br />
2012-13<br />
2013-14<br />
2014-15<br />
2015-16<br />
2016-17<br />
<strong>Year</strong><br />
2017-18<br />
2018-19<br />
2019-20<br />
<strong>2020</strong>-<strong>21</strong><br />
0.0<br />
43%<br />
Falls<br />
Boating<br />
Swimming/Wading<br />
Figure 7.39<br />
Comparison of <strong>Beach</strong> and <strong>Coastal</strong> Fatal Drowning Rates (per <strong>10</strong>0,000 pop.) by Activity in the West Coast Region:<br />
<strong>2011</strong>-<strong>21</strong> (ten-year average) and <strong>2020</strong>-<strong>21</strong>.<br />
Within the West Coast Region the <strong>2020</strong>-<strong>21</strong> fatal drowning rates (per <strong>10</strong>0,000 pop.) for swimming/wading, falls and boating<br />
activities were less than their respective ten-year averages.<br />
SWIMMING / WADING<br />
SNORKELLING<br />
FALL<br />
<strong>2011</strong>-<strong>21</strong><br />
0.30<br />
<strong>2020</strong>-<strong>21</strong><br />
0.00<br />
<strong>2011</strong>-<strong>21</strong><br />
0.00<br />
LAND-BASED FISHING<br />
<strong>2020</strong>-<strong>21</strong><br />
0.00<br />
BOATING<br />
<strong>2011</strong>-<strong>21</strong><br />
0.91<br />
<strong>2020</strong>-<strong>21</strong><br />
0.00<br />
<strong>2011</strong>-<strong>21</strong><br />
0.00<br />
NET / SHELL FISHING<br />
<strong>2020</strong>-<strong>21</strong><br />
0.00<br />
WATERCRAFT<br />
<strong>2011</strong>-<strong>21</strong><br />
0.92<br />
<strong>2020</strong>-<strong>21</strong><br />
0.00<br />
<strong>2011</strong>-<strong>21</strong><br />
0.00<br />
ATTEMPTING A RESCUE<br />
<strong>2020</strong>-<strong>21</strong><br />
0.00<br />
<strong>2011</strong>-<strong>21</strong><br />
0.00<br />
<strong>2020</strong>-<strong>21</strong><br />
0.00<br />
<strong>2011</strong>-<strong>21</strong><br />
0.00<br />
<strong>2020</strong>-<strong>21</strong><br />
0.00<br />
86<br />
SURF LIFE SAVING NEW ZEALAND NATIONAL BEACH AND COASTAL SAFETY REPORT 20<strong>21</strong>
FATAL DROWNING SNAPSHOT<br />
<strong>10</strong>-YEAR OVERVIEW | <strong>2011</strong>-<strong>21</strong> 1-YEAR OVERVIEW | <strong>2020</strong>-<strong>21</strong><br />
FATAL DROWNINGS<br />
AVERAGE FATALITY<br />
0 0.00<br />
PER <strong>10</strong>0,000 POPULATION<br />
FATAL DROWNINGS BY LOCATION<br />
Attempting a Rescue<br />
Boating<br />
Diving / Jumping<br />
Fall<br />
Net / Shell Fishing<br />
Land-Based Fishing<br />
Scuba Diving<br />
Snorkeling<br />
7<br />
Swimming / Wading<br />
Watercraft<br />
ZERO<br />
Fatal<br />
Drownings<br />
TOTAL FATAL DROWNINGS: 7<br />
AVERAGE FATAL DROWNINGS<br />
CANTERBURY / WAITAHA<br />
Figure 7.40<br />
<strong>2011</strong>-<strong>21</strong>: Canterbury Region <strong>Beach</strong> and <strong>Coastal</strong> Fatal<br />
Drownings and Fatal Drowning Rate per <strong>10</strong>0,000<br />
Population (n=14).<br />
During <strong>2020</strong>-<strong>21</strong>, there was one beach and coastal drowning<br />
fatalities within the Canterbury Region, which equals the tenyear<br />
average of one per year. The <strong>2020</strong>-<strong>21</strong> fatal drowning<br />
rate (0.15 per <strong>10</strong>0,000 pop.) was less than the ten-year<br />
average (0.24 per <strong>10</strong>0,000 pop.).<br />
Figure 7.41<br />
<strong>2011</strong>-<strong>21</strong>: Canterbury Region <strong>Beach</strong> and <strong>Coastal</strong><br />
Drownings by Activity (n=14).<br />
Within the Canterbury Region during <strong>2011</strong>-<strong>21</strong>, the majority<br />
of beach and coastal drowning fatalities occurred while<br />
snorkelling (n=4), followed by boating (n=2), falls (n=2),<br />
land based fishing (n=2) and scuba diving (n=2).<br />
Fatal Drownings (n)<br />
5<br />
4<br />
3<br />
2<br />
1<br />
0<br />
<strong>2011</strong>-12<br />
Fatal Drownings<br />
Fatal Drowning Rate<br />
2012-13<br />
2013-14<br />
2014-15<br />
2015-16<br />
2016-17<br />
<strong>Year</strong><br />
2017-18<br />
2018-19<br />
2019-20<br />
<strong>2020</strong>-<strong>21</strong><br />
0.7<br />
0.6<br />
0.5<br />
0.4<br />
0.3<br />
0.2<br />
0.1<br />
0.0<br />
Fatal Drowning Rate<br />
(per <strong>10</strong>0,000 pop.)<br />
14%<br />
14%<br />
7%<br />
7%<br />
29%<br />
Snorkelling<br />
14%<br />
14%<br />
29%<br />
Snorkelling<br />
Boating<br />
Falls<br />
Land-Based Fishing<br />
Scuba Diving<br />
Attempting a Rescue<br />
Swimming/Wading<br />
Figure 7.42<br />
Comparison of <strong>Beach</strong> and <strong>Coastal</strong> Fatal Drowning Rates (per <strong>10</strong>0,000 pop.) by Activity in the Canterbury Region:<br />
<strong>2011</strong>-<strong>21</strong> (ten-year average) and <strong>2020</strong>-<strong>21</strong>.<br />
Within the Canterbury Region the <strong>2020</strong>-<strong>21</strong> fatal drowning rates (per <strong>10</strong>0,000 pop.) for swimming/wading, falls, boating,<br />
snorkelling and land based fishing were less than their respective ten-year averages. However, the <strong>2020</strong>-<strong>21</strong> fatal drowning<br />
rates for attempting a rescue was greater than the ten-year average.<br />
SWIMMING / WADING<br />
SNORKELLING<br />
FALL<br />
<strong>2011</strong>-<strong>21</strong><br />
0.02<br />
<strong>2020</strong>-<strong>21</strong><br />
0.00<br />
<strong>2011</strong>-<strong>21</strong><br />
0.07<br />
LAND-BASED FISHING<br />
<strong>2020</strong>-<strong>21</strong><br />
0.00<br />
BOATING<br />
<strong>2011</strong>-<strong>21</strong><br />
0.03<br />
<strong>2020</strong>-<strong>21</strong><br />
0.00<br />
<strong>2011</strong>-<strong>21</strong><br />
0.03<br />
NET / SHELL FISHING<br />
<strong>2020</strong>-<strong>21</strong><br />
0.00<br />
WATERCRAFT<br />
<strong>2011</strong>-<strong>21</strong><br />
0.03<br />
<strong>2020</strong>-<strong>21</strong><br />
0.00<br />
<strong>2011</strong>-<strong>21</strong><br />
0.00<br />
ATTEMPTING A RESCUE<br />
<strong>2020</strong>-<strong>21</strong><br />
0.00<br />
<strong>2011</strong>-<strong>21</strong><br />
0.00<br />
<strong>2020</strong>-<strong>21</strong><br />
0.00<br />
<strong>2011</strong>-<strong>21</strong><br />
0.02<br />
<strong>2020</strong>-<strong>21</strong><br />
0.15<br />
88<br />
SURF LIFE SAVING NEW ZEALAND NATIONAL BEACH AND COASTAL SAFETY REPORT 20<strong>21</strong>
FATAL DROWNING SNAPSHOT<br />
<strong>10</strong>-YEAR OVERVIEW | <strong>2011</strong>-<strong>21</strong> 1-YEAR OVERVIEW | <strong>2020</strong>-<strong>21</strong><br />
FATAL DROWNINGS<br />
AVERAGE FATALITY<br />
1 0.15<br />
PER <strong>10</strong>0,000 POPULATION<br />
FATAL DROWNINGS BY LOCATION<br />
Attempting a Rescue<br />
Boating<br />
Diving / Jumping<br />
Fall<br />
AVERAGE FATAL DROWNINGS<br />
1<br />
PER YEAR<br />
KEY DEMOGRAPHIC<br />
25-64<br />
YEAR OLD MALES<br />
Net / Shell Fishing<br />
Land-Based Fishing<br />
Scuba Diving<br />
Snorkeling<br />
TOTAL FATAL DROWNINGS: 14<br />
93%<br />
MALE<br />
7%<br />
FEMALE<br />
14<br />
Swimming / Wading<br />
Watercraft<br />
AVERAGE FATALITY<br />
0.24<br />
PER <strong>10</strong>0,000 POPULATION<br />
SNORKELLING<br />
<strong>10</strong>0%<br />
Surf <strong>Beach</strong><br />
Surf <strong>Beach</strong><br />
FATAL DROWNINGS BY ACTIVITY<br />
<strong>10</strong>0%<br />
Attempting<br />
a Rescue<br />
Attempting a Rescue
OTAGO / OTAKOU<br />
Figure 7.43<br />
<strong>2011</strong>-<strong>21</strong>: Otago Region <strong>Beach</strong> and <strong>Coastal</strong> Fatal<br />
Drownings and Fatal Drowning Rate per <strong>10</strong>0,000<br />
Population (n=13).<br />
During <strong>2020</strong>-<strong>21</strong>, there were two beach and coastal<br />
drowning fatalities within the Otago Region, which is greater<br />
than the ten-year average of one per year. The <strong>2020</strong>-<strong>21</strong><br />
fatal drowning rate (0.82 per <strong>10</strong>0,000 pop.) was greater<br />
than the ten-year average (0.57 per <strong>10</strong>0,000 pop.).<br />
Figure 7.44<br />
<strong>2011</strong>-<strong>21</strong>: Otago Region <strong>Beach</strong> and <strong>Coastal</strong> Drownings<br />
by Activity (n=13).<br />
Within the Otago Region during <strong>2011</strong>-<strong>21</strong>, the majority<br />
of beach and coastal drowning fatalities occurred while<br />
snorkelling (n=7), followed by boating (n=3) and falls (n=2).<br />
Fatal Drownings (n)<br />
5<br />
4<br />
3<br />
2<br />
1<br />
0<br />
<strong>2011</strong>-12<br />
Fatal Drownings<br />
Fatal Drowning Rate<br />
2012-13<br />
2013-14<br />
2014-15<br />
2015-16<br />
2016-17<br />
<strong>Year</strong><br />
2017-18<br />
2018-19<br />
2019-20<br />
<strong>2020</strong>-<strong>21</strong><br />
1.8<br />
1.6<br />
1.4<br />
1.2<br />
1.0<br />
0.8<br />
0.6<br />
0.4<br />
0.2<br />
0.0<br />
Fatal Drowning Rate<br />
(per <strong>10</strong>0,000 pop.)<br />
15%<br />
23%<br />
8%<br />
54%<br />
Snorkelling<br />
54%<br />
Snorkelling<br />
Boating<br />
Falls<br />
Land-Based Fishing<br />
Figure 7.45<br />
Comparison of <strong>Beach</strong> and <strong>Coastal</strong> Fatal Drowning Rates (per <strong>10</strong>0,000 pop.) by Activity in the Otago Region:<br />
<strong>2011</strong>-<strong>21</strong> (ten-year average) and <strong>2020</strong>-<strong>21</strong>.<br />
Within the Otago Region the <strong>2020</strong>-<strong>21</strong> fatal drowning rates (per <strong>10</strong>0,000 pop.) for falls, land-based fishing and net /<br />
shell fishing were less than their respective ten-year averages. However, the <strong>2020</strong>-<strong>21</strong> fatal drowning rates for boating and<br />
snorkelling was greater than the ten-year average.<br />
SWIMMING / WADING<br />
SNORKELLING<br />
FALL<br />
<strong>2011</strong>-<strong>21</strong><br />
0.00<br />
<strong>2020</strong>-<strong>21</strong><br />
0.00<br />
<strong>2011</strong>-<strong>21</strong><br />
0.30<br />
LAND-BASED FISHING<br />
<strong>2020</strong>-<strong>21</strong><br />
0.41<br />
BOATING<br />
<strong>2011</strong>-<strong>21</strong><br />
0.09<br />
<strong>2020</strong>-<strong>21</strong><br />
0.00<br />
<strong>2011</strong>-<strong>21</strong><br />
0.04<br />
NET / SHELL FISHING<br />
<strong>2020</strong>-<strong>21</strong><br />
0.00<br />
WATERCRAFT<br />
<strong>2011</strong>-<strong>21</strong><br />
0.14<br />
<strong>2020</strong>-<strong>21</strong><br />
0.41<br />
<strong>2011</strong>-<strong>21</strong><br />
0.00<br />
ATTEMPTING A RESCUE<br />
<strong>2020</strong>-<strong>21</strong><br />
0.00<br />
<strong>2011</strong>-<strong>21</strong><br />
0.00<br />
<strong>2020</strong>-<strong>21</strong><br />
0.00<br />
<strong>2011</strong>-<strong>21</strong><br />
0.00<br />
<strong>2020</strong>-<strong>21</strong><br />
0.00<br />
90<br />
SURF LIFE SAVING NEW ZEALAND NATIONAL BEACH AND COASTAL SAFETY REPORT 20<strong>21</strong>
FATAL DROWNING SNAPSHOT<br />
<strong>10</strong>-YEAR OVERVIEW | <strong>2011</strong>-<strong>21</strong> 1-YEAR OVERVIEW | <strong>2020</strong>-<strong>21</strong><br />
FATAL DROWNINGS<br />
AVERAGE FATALITY<br />
2 0.82<br />
PER <strong>10</strong>0,000 POPULATION<br />
FATAL DROWNINGS BY LOCATION<br />
13<br />
Attempting a Rescue<br />
Boating<br />
Diving / Jumping<br />
Fall<br />
Net / Shell Fishing<br />
Land-Based Fishing<br />
Scuba Diving<br />
Snorkeling<br />
Swimming / Wading<br />
Watercraft<br />
50%<br />
50%<br />
34% 50%<br />
50% 50%<br />
River/ Estuary<br />
Harbour Bar<br />
TOTAL FATAL DROWNINGS: 13<br />
AVERAGE FATAL DROWNINGS<br />
1<br />
PER YEAR<br />
69%<br />
MALE<br />
31%<br />
FEMALE<br />
AVERAGE FATALITY<br />
0.57<br />
PER <strong>10</strong>0,000 POPULATION<br />
Estuary<br />
FATAL DROWNINGS BY ACTIVITY<br />
50%<br />
Snorkelling<br />
River/Harbour Bar<br />
50%<br />
Boating<br />
50% 34% 50%<br />
KEY DEMOGRAPHIC<br />
15-54<br />
YEAR OLD MALES<br />
SNORKELLERS<br />
Boating<br />
Snorkelling
SOUTHLAND / MURIHIKU<br />
Figure 7.46<br />
<strong>2011</strong>-<strong>21</strong>: Southland Region <strong>Beach</strong> and <strong>Coastal</strong> Fatal<br />
Drownings and Fatal Drowning Rate per <strong>10</strong>0,000<br />
Population (n=12).<br />
During <strong>2020</strong>-<strong>21</strong>, there were no beach and coastal drowning<br />
fatalities within the Southland Region, which is less than<br />
the ten-year average of one per year. The <strong>2020</strong>-<strong>21</strong> fatal<br />
drowning rate (0.00 per <strong>10</strong>0,000 pop.) was less than the<br />
ten-year average (1.<strong>21</strong> per <strong>10</strong>0,000 pop.).<br />
Figure 7.47<br />
<strong>2011</strong>-<strong>21</strong>: Southland Region <strong>Beach</strong> and <strong>Coastal</strong><br />
Drownings by Activity (n=12).<br />
Within the Southland Region during <strong>2011</strong>-<strong>21</strong>, the majority<br />
of beach and coastal drowning fatalities occurred while<br />
boating (n=3) and land-based fishing (n=3), followed by<br />
snorkelling (n=2).<br />
Fatal Drownings (n)<br />
4<br />
3<br />
2<br />
1<br />
Fatal Drownings<br />
Fatal Drowning Rate<br />
3.5<br />
3.0<br />
2.5<br />
2.0<br />
1.5<br />
1.0<br />
0.5<br />
Fatal Drowning Rate<br />
(per <strong>10</strong>0,000 pop.)<br />
8%<br />
8%<br />
8%<br />
8%<br />
25%<br />
Land-Based<br />
Fishing<br />
25%<br />
Boating<br />
25%<br />
Boating<br />
Land-Based Fishing<br />
Snorkelling<br />
Falls<br />
Scuba Diving<br />
Swimming/Wading<br />
Watercraft<br />
0<br />
<strong>2011</strong>-12<br />
2012-13<br />
2013-14<br />
2014-15<br />
2015-16<br />
2016-17<br />
<strong>Year</strong><br />
2017-18<br />
2018-19<br />
2019-20<br />
<strong>2020</strong>-<strong>21</strong><br />
0.0<br />
17%<br />
25%<br />
Figure 7.48<br />
Comparison of <strong>Beach</strong> and <strong>Coastal</strong> Fatal Drowning Rates (per <strong>10</strong>0,000 pop.) by Activity in the Southland Region:<br />
<strong>2011</strong>-<strong>21</strong> (ten-year average) and <strong>2020</strong>-<strong>21</strong>.<br />
Within the Southland Region the <strong>2020</strong>-<strong>21</strong> fatal drowning rates (per <strong>10</strong>0,000 pop.) for swimming/wading, falls, boating,<br />
watercraft, snorkelling and land-based fishing activities were less than their respective ten-year averages.<br />
SWIMMING / WADING<br />
SNORKELLING<br />
FALL<br />
<strong>2011</strong>-<strong>21</strong><br />
0.<strong>10</strong><br />
<strong>2020</strong>-<strong>21</strong><br />
0.00<br />
<strong>2011</strong>-<strong>21</strong><br />
0.20<br />
LAND-BASED FISHING<br />
<strong>2020</strong>-<strong>21</strong><br />
0.00<br />
BOATING<br />
<strong>2011</strong>-<strong>21</strong><br />
0.<strong>10</strong><br />
<strong>2020</strong>-<strong>21</strong><br />
0.00<br />
<strong>2011</strong>-<strong>21</strong><br />
0.30<br />
NET / SHELL FISHING<br />
<strong>2020</strong>-<strong>21</strong><br />
0.00<br />
WATERCRAFT<br />
<strong>2011</strong>-<strong>21</strong><br />
0.30<br />
<strong>2020</strong>-<strong>21</strong><br />
0.00<br />
<strong>2011</strong>-<strong>21</strong><br />
0.00<br />
ATTEMPTING A RESCUE<br />
<strong>2020</strong>-<strong>21</strong><br />
0.00<br />
<strong>2011</strong>-<strong>21</strong><br />
0.<strong>10</strong><br />
<strong>2020</strong>-<strong>21</strong><br />
0.00<br />
<strong>2011</strong>-<strong>21</strong><br />
0.00<br />
<strong>2020</strong>-<strong>21</strong><br />
0.00<br />
92<br />
SURF LIFE SAVING NEW ZEALAND NATIONAL BEACH AND COASTAL SAFETY REPORT 20<strong>21</strong>
FATAL DROWNING SNAPSHOT<br />
<strong>10</strong>-YEAR OVERVIEW | <strong>2011</strong>-<strong>21</strong> 1-YEAR OVERVIEW | <strong>2020</strong>-<strong>21</strong><br />
FATAL DROWNINGS<br />
AVERAGE FATALITY<br />
0 0.00<br />
PER <strong>10</strong>0,000 POPULATION<br />
FATAL DROWNINGS BY LOCATION<br />
12<br />
Attempting a Rescue<br />
Boating<br />
Diving / Jumping<br />
Fall<br />
AVERAGE FATAL DROWNINGS<br />
1<br />
PER YEAR<br />
Net / Shell Fishing<br />
Land-Based Fishing<br />
Scuba Diving<br />
Snorkeling<br />
TOTAL FATAL DROWNINGS: 12<br />
<strong>10</strong>0%<br />
MALE<br />
0%<br />
FEMALE<br />
Swimming / Wading<br />
Watercraft<br />
AVERAGE FATALITY<br />
1.<strong>21</strong><br />
PER <strong>10</strong>0,000 POPULATION<br />
KEY DEMOGRAPHIC<br />
15-34 25+<br />
YEAR OLD MALES YEAR OLD MALES<br />
LAND BASED FISHING BOATING<br />
ZERO<br />
Fatal<br />
Drownings<br />
FATAL DROWNINGS BY ACTIVITY<br />
ZERO<br />
Fatal<br />
Drownings
<strong>10</strong> YEAR ACTIVITY<br />
OVERVIEW <strong>2011</strong>-<strong>21</strong><br />
SECTION EIGHT<br />
TOTAL FATAL DROWNINGS BY ACTIVITY | <strong>2011</strong>-<strong>21</strong><br />
77<br />
64<br />
56<br />
SWIMMING/<br />
WADING<br />
BOATING<br />
FALLS<br />
(TRIPS/SLIPS)<br />
38<br />
30<br />
30<br />
SNORKELLING<br />
WATERCRAFT<br />
LAND-BASED<br />
FISHING
SNAPSHOT: SWIMMING/WADING<br />
<strong>10</strong> YEAR OVERVIEW | <strong>2011</strong>-<strong>21</strong><br />
<strong>2011</strong>-<strong>21</strong><br />
FATAL DROWNINGS<br />
77<br />
SWIMMING/WADING<br />
FATAL DROWNINGS LOCATION<br />
AVERAGE FATAL<br />
DROWNINGS PER YEAR<br />
8<br />
AVERAGE FATALITY RATE<br />
PER <strong>10</strong>0,000 POPULATION<br />
0.17<br />
KEY DEMOGRAPHIC<br />
15-65+<br />
ALL ETHNICITIES<br />
SWIMMING & WADING FATAL DROWNINGS <strong>2011</strong>-<strong>21</strong><br />
Fatal Drownings (n)<br />
12<br />
<strong>10</strong><br />
8<br />
6<br />
4<br />
2<br />
84%<br />
MALE<br />
16%<br />
FEMALE<br />
Fatal Drownings<br />
Fatal Drowning Rate<br />
0.30<br />
0.25<br />
0.20<br />
0.15<br />
0.<strong>10</strong><br />
0.05<br />
Fatal Drowning Rate<br />
(per <strong>10</strong>0,000 pop.)<br />
0<br />
<strong>2011</strong>-12<br />
2012-13 2013-14 2014-15 2015-16 2016-17 2017-18 2018-19 2019-20<br />
<strong>Year</strong><br />
<strong>2020</strong>-<strong>21</strong><br />
0.00<br />
SURF LIFE SAVING NEW ZEALAND NATIONAL BEACH AND COASTAL SAFETY REPORT 20<strong>21</strong><br />
96
SNAPSHOT: BOATING<br />
<strong>10</strong> YEAR OVERVIEW | <strong>2011</strong>-<strong>21</strong><br />
<strong>2011</strong>-<strong>21</strong><br />
FATAL DROWNINGS<br />
64<br />
BOATING<br />
FATAL DROWNINGS LOCATION<br />
AVERAGE FATAL<br />
DROWNINGS PER YEAR<br />
6<br />
AVERAGE FATALITY RATE<br />
PER <strong>10</strong>0,000 POPULATION<br />
0.14<br />
KEY DEMOGRAPHIC<br />
25+<br />
YEAR OLD MALES (PASIFIKA & NZ EUROPEAN)<br />
94%<br />
MALE<br />
6%<br />
FEMALE<br />
BOATING FATAL DROWNINGS <strong>2011</strong>-<strong>21</strong><br />
14<br />
12<br />
Fatal Drownings<br />
Fatal Drowning Rate<br />
0.30<br />
0.25<br />
Fatal Drownings (n)<br />
<strong>10</strong><br />
8<br />
6<br />
4<br />
0.20<br />
0.15<br />
0.<strong>10</strong><br />
Fatal Drowning Rate<br />
(per <strong>10</strong>0,000 pop.)<br />
2<br />
0.05<br />
0<br />
<strong>2011</strong>-12<br />
2012-13 2013-14 2014-15 2015-16 2016-17 2017-18 2018-19 2019-20 <strong>2020</strong>-<strong>21</strong><br />
<strong>Year</strong><br />
0.00<br />
SECTION EIGHT<br />
97<br />
<strong>10</strong> YEAR ACTIVITY OVERVIEW
SNAPSHOT: FALLS<br />
<strong>10</strong> YEAR OVERVIEW | <strong>2011</strong>-<strong>21</strong><br />
<strong>2011</strong>-<strong>21</strong><br />
FATAL DROWNINGS<br />
56<br />
FALLS<br />
FATAL DROWNINGS LOCATION<br />
AVERAGE FATAL<br />
DROWNINGS PER YEAR<br />
6<br />
AVERAGE FATALITY RATE<br />
PER <strong>10</strong>0,000 POPULATION<br />
0.12<br />
KEY DEMOGRAPHIC<br />
15+<br />
YEAR OLD MALES (NZ EUROPEAN)<br />
79%<br />
MALE<br />
<strong>21</strong>%<br />
FEMALE<br />
FALLS FATAL DROWNINGS <strong>2011</strong>-<strong>21</strong><br />
Fatal Drownings (n)<br />
12<br />
<strong>10</strong><br />
8<br />
6<br />
4<br />
2<br />
Fatal Drownings<br />
Fatal Drowning Rate<br />
0.25<br />
0.20<br />
0.15<br />
0.<strong>10</strong><br />
0.05<br />
Fatal Drowning Rate<br />
(per <strong>10</strong>0,000 pop.)<br />
0<br />
<strong>2011</strong>-12<br />
2012-13 2013-14 2014-15 2015-16 2016-17 2017-18 2018-19 2019-20 <strong>2020</strong>-<strong>21</strong><br />
<strong>Year</strong><br />
0.00<br />
SURF LIFE SAVING NEW ZEALAND NATIONAL BEACH AND COASTAL SAFETY REPORT 20<strong>21</strong><br />
98
SNAPSHOT: SNORKELLING<br />
<strong>10</strong> YEAR OVERVIEW | <strong>2011</strong>-<strong>21</strong><br />
<strong>2011</strong>-<strong>21</strong><br />
FATAL DROWNINGS<br />
38<br />
SNORKELLING<br />
FATAL DROWNINGS LOCATION<br />
AVERAGE FATAL<br />
DROWNINGS PER YEAR<br />
4<br />
AVERAGE FATALITY RATE<br />
PER <strong>10</strong>0,000 POPULATION<br />
0.08<br />
KEY DEMOGRAPHIC<br />
25-54<br />
YEAR OLD MALES (MAORI)<br />
95%<br />
MALE<br />
5%<br />
FEMALE<br />
SNORKELLING FATAL DROWNINGS <strong>2011</strong>-<strong>21</strong><br />
Fatal Drownings (n)<br />
<strong>10</strong><br />
9<br />
8<br />
7<br />
6<br />
5<br />
4<br />
3<br />
2<br />
1<br />
0<br />
Fatal Drownings<br />
Fatal Drownings<br />
Fatal Drowning Rate<br />
Fatal Drowning Rate<br />
<strong>2011</strong>-12 2012-13 2013-14 2014-15 2015-16 2016-17 2017-18 2018-19 2019-20 <strong>2020</strong>-<strong>21</strong><br />
<strong>Year</strong><br />
0.16<br />
0.14<br />
0.12<br />
0.<strong>10</strong><br />
0.08<br />
0.06<br />
0.04<br />
0.02<br />
0.00<br />
Fatal Drowning Rate<br />
(per <strong>10</strong>0,000 pop.)<br />
SECTION EIGHT<br />
99<br />
<strong>10</strong> YEAR ACTIVITY OVERVIEW
SNAPSHOT: WATERCRAFT<br />
<strong>10</strong> YEAR OVERVIEW | <strong>2011</strong>-<strong>21</strong><br />
<strong>2011</strong>-<strong>21</strong><br />
FATAL DROWNINGS<br />
30<br />
WATERCRAFT<br />
FATAL DROWNINGS LOCATION<br />
AVERAGE FATAL<br />
DROWNINGS PER YEAR<br />
3<br />
AVERAGE FATALITY RATE<br />
PER <strong>10</strong>0,000 POPULATION<br />
0.06<br />
KEY DEMOGRAPHIC<br />
45+<br />
YEAR OLD MALES (NZ EUROPEAN)<br />
83%<br />
MALE<br />
17%<br />
FEMALE<br />
WATERCRAFT FATAL DROWNINGS <strong>2011</strong>-<strong>21</strong><br />
6<br />
5<br />
Fatal Drownings<br />
Fatal Drowning Rate<br />
0.14<br />
0.12<br />
Fatal Drownings (n)<br />
4<br />
3<br />
2<br />
0.<strong>10</strong><br />
0.08<br />
0.06<br />
0.04<br />
Fatal Drowning Rate<br />
(per <strong>10</strong>0,000 pop.)<br />
1<br />
0.02<br />
0<br />
<strong>2011</strong>-12<br />
2012-13 2013-14 2014-15 2015-16 2016-17 2017-18 2018-19 2019-20 <strong>2020</strong>-<strong>21</strong><br />
<strong>Year</strong><br />
0.00<br />
SURF LIFE SAVING NEW ZEALAND NATIONAL BEACH AND COASTAL SAFETY REPORT 20<strong>21</strong><br />
<strong>10</strong>0
SNAPSHOT: LAND-BASED FISHING<br />
SNAPSHOT: LAND-BASED FISHING<br />
<strong>10</strong> YEAR OVERVIEW | <strong>2011</strong>-<strong>21</strong><br />
<strong>2011</strong>-<strong>21</strong><br />
FATAL DROWNINGS<br />
30<br />
LAND-BASED FISHING<br />
FATAL DROWNINGS LOCATION<br />
AVERAGE FATAL<br />
DROWNINGS PER YEAR<br />
3<br />
AVERAGE FATALITY RATE<br />
PER <strong>10</strong>0,000 POPULATION<br />
0.06<br />
KEY DEMOGRAPHIC<br />
25-64<br />
YEAR OLD MALES (ASIAN)<br />
93%<br />
MALE<br />
7%<br />
FEMALE<br />
LAND-BASED FISHING FATAL DROWNINGS <strong>2011</strong>-<strong>21</strong><br />
Fatal Drownings (n)<br />
<strong>10</strong><br />
9<br />
8<br />
7<br />
6<br />
5<br />
4<br />
3<br />
2<br />
1<br />
0<br />
Fatal Drownings<br />
Fatal Drowning Rate<br />
<strong>2011</strong>-12 2012-13 2013-14 2014-15 2015-16 2016-17 2017-18 2018-19 2019-20 <strong>2020</strong>-<strong>21</strong><br />
<strong>Year</strong><br />
0.16<br />
0.14<br />
0.12<br />
0.<strong>10</strong><br />
0.08<br />
0.06<br />
0.04<br />
0.02<br />
0.00<br />
Fatal Drowning Rate<br />
(per <strong>10</strong>0,000 pop.)<br />
SECTION EIGHT<br />
<strong>10</strong>1<br />
<strong>10</strong> YEAR ACTIVITY OVERVIEW
<strong>10</strong> YEAR ETHNICITY<br />
OVERVIEW <strong>2011</strong>-<strong>21</strong><br />
SECTION NINE<br />
TOTAL FATAL DROWNINGS BY ETHNICITY | <strong>2011</strong>-<strong>21</strong><br />
124<br />
NZ EUROPEAN<br />
89 MAORI<br />
51<br />
ASIAN<br />
49 PASIFIKA<br />
32 OTHER
SNAPSHOT: NZ EUROPEAN<br />
SNAPSHOT: NZ EUROPEAN<br />
<strong>10</strong> YEAR OVERVIEW | <strong>2011</strong>-<strong>21</strong><br />
<strong>10</strong> YEAR OVERVIEW: <strong>2011</strong>-<strong>21</strong><br />
FATAL DROWNINGS<br />
124<br />
FATAL DROWNING LOCATIONS<br />
AVERAGE FATAL<br />
DROWNINGS PER YEAR<br />
12<br />
AVERAGE FATALITY RATE<br />
PER <strong>10</strong>0,000 POPULATION<br />
0.38<br />
Fatal Drownings (n)<br />
40<br />
35<br />
30<br />
25<br />
20<br />
15<br />
<strong>10</strong><br />
5<br />
0<br />
Female<br />
Male<br />
0-4 5-14 15-24 25-34 35-44 45-54 55-64 65+<br />
Age<br />
80%<br />
MALE<br />
20%<br />
FEMALE<br />
FATAL DROWNINGS BY ACTIVITY<br />
2%<br />
1%<br />
FATAL DROWNINGS BY LOCATION<br />
6%<br />
5%<br />
27%<br />
6%<br />
8%<br />
8%<br />
39%<br />
12%<br />
27%<br />
Falls<br />
<strong>21</strong>%<br />
9%<br />
12%<br />
4% 4% 18%<br />
39%<br />
Surf <strong>Beach</strong><br />
18%<br />
Falls<br />
Swimming/Wading<br />
Boating<br />
Watercraft<br />
Attempting a Rescue<br />
Land-Based Fishing<br />
Snorkelling<br />
Scuba Diving<br />
Diving/Jumping<br />
Unknown<br />
Surf <strong>Beach</strong><br />
Harbour<br />
River/Harbour Bar<br />
0-1Km off Shore<br />
Marina<br />
Rocky Foreshore<br />
Estuary<br />
Calm Water <strong>Beach</strong><br />
SURF LIFE SAVING NEW ZEALAND NATIONAL BEACH AND COASTAL SAFETY REPORT 20<strong>21</strong><br />
<strong>10</strong>4
SNAPSHOT: MAORI<br />
SNAPSHOT: MAORI<br />
<strong>10</strong> YEAR OVERVIEW | <strong>2011</strong>-<strong>21</strong><br />
<strong>10</strong> YEAR OVERVIEW: <strong>2011</strong>-<strong>21</strong><br />
FATAL DROWNINGS<br />
89<br />
FATAL DROWNING LOCATIONS<br />
AVERAGE FATAL<br />
DROWNINGS PER YEAR<br />
9<br />
AVERAGE FATALITY RATE<br />
PER <strong>10</strong>0,000 POPULATION<br />
1.15<br />
Fatal Drownings (n)<br />
25<br />
20<br />
15<br />
<strong>10</strong><br />
5<br />
0<br />
Female<br />
Male<br />
0-4 5-14 15-24 25-34 35-44 45-54 55-64 65+<br />
Age<br />
93%<br />
MALE<br />
7%<br />
FEMALE<br />
FATAL DROWNINGS BY ACTIVITY<br />
1%<br />
6%<br />
7%<br />
28%<br />
7%<br />
FATAL DROWNINGS BY LOCATION<br />
8%<br />
6% 3% 1%<br />
8%<br />
8%<br />
28%<br />
Snorkelling<br />
15%<br />
12%<br />
39%<br />
Surf <strong>Beach</strong><br />
39%<br />
9%<br />
12%<br />
30%<br />
Snorkelling<br />
Swimming/Wading<br />
Boating<br />
Falls<br />
Watercraft<br />
Net/Shell Fishing<br />
Land-Based Fishing<br />
Scuba Diving<br />
Attempting a Rescue<br />
Diving/Jumping<br />
Surf <strong>Beach</strong><br />
0-1km off Shore<br />
Rocky Foreshore<br />
Harbour<br />
Estuary<br />
River/Harbour Bar<br />
Calm Water <strong>Beach</strong><br />
SECTION NINE<br />
<strong>10</strong>5<br />
<strong>10</strong> YEAR ETHNICITY OVERVIEW
SNAPSHOT: ASIAN<br />
SNAPSHOT: ASIAN<br />
<strong>10</strong> YEAR OVERVIEW | <strong>2011</strong>-<strong>21</strong><br />
<strong>10</strong> YEAR OVERVIEW: <strong>2011</strong>-<strong>21</strong><br />
FATAL DROWNINGS<br />
51<br />
FATAL DROWNING LOCATIONS<br />
AVERAGE FATAL<br />
DROWNINGS PER YEAR<br />
5<br />
AVERAGE FATALITY RATE<br />
PER <strong>10</strong>0,000 POPULATION<br />
0.72<br />
Fatal Drownings (n)<br />
15<br />
12<br />
9<br />
6<br />
3<br />
0<br />
Female<br />
Male<br />
0-4 5-14 15-24 25-34 35-44 45-54 55-64 65+<br />
Age<br />
84%<br />
MALE<br />
16%<br />
FEMALE<br />
FATAL DROWNINGS BY ACTIVITY<br />
2%<br />
FATAL DROWNINGS BY LOCATION<br />
2%<br />
4%<br />
4%<br />
24%<br />
6%<br />
4%<br />
6%<br />
12%<br />
<strong>10</strong>%<br />
<strong>10</strong>%<br />
24%<br />
Swimming/<br />
Wading<br />
22%<br />
12%<br />
47%<br />
Surf <strong>Beach</strong><br />
47%<br />
16%<br />
18%<br />
Swimming/Wading<br />
Land-Based Fishing<br />
Net/Shell Fishing<br />
Falls<br />
Snorkelling<br />
Scuba Diving<br />
Diving/Jumping<br />
Attempting a Rescue<br />
Boating<br />
Watercraft<br />
Unknown<br />
Surf <strong>Beach</strong><br />
Rocky Foreshore<br />
0-1km off Shore<br />
River/Harbour Bar<br />
Harbour<br />
Calm Water <strong>Beach</strong><br />
Estuary<br />
SURF LIFE SAVING NEW ZEALAND NATIONAL BEACH AND COASTAL SAFETY REPORT 20<strong>21</strong><br />
<strong>10</strong>6
SNAPSHOT: PASIFIKA<br />
SNAPSHOT: PACIFIC PEOPLES<br />
<strong>10</strong> YEAR OVERVIEW | <strong>2011</strong>-<strong>21</strong><br />
<strong>10</strong> YEAR OVERVIEW: <strong>2011</strong>-<strong>21</strong><br />
FATAL DROWNINGS<br />
49<br />
FATAL DROWNING LOCATIONS<br />
AVERAGE FATAL<br />
DROWNINGS PER YEAR<br />
5<br />
AVERAGE FATALITY RATE<br />
PER <strong>10</strong>0,000 POPULATION<br />
1.28<br />
Fatal Drownings (n)<br />
12<br />
<strong>10</strong><br />
8<br />
6<br />
4<br />
2<br />
0<br />
Male<br />
0-4 5-14 15-24 25-34 35-44 45-54 55-64 65+<br />
Age<br />
<strong>10</strong>0%<br />
MALE<br />
0%<br />
FEMALE<br />
FATAL DROWNINGS BY ACTIVITY<br />
2%<br />
4%<br />
6%<br />
8%<br />
FATAL DROWNINGS BY LOCATION<br />
<strong>10</strong>%<br />
29%<br />
12%<br />
45%<br />
Boating<br />
45%<br />
12%<br />
29%<br />
Surf <strong>Beach</strong><br />
22%<br />
18%<br />
4% 4% 22%<br />
Boating<br />
Swimming/Wading<br />
Net/Shell Fishing<br />
Falls<br />
Attempting a Rescue<br />
Land-Based Fishing<br />
Scuba Diving<br />
Surf <strong>Beach</strong><br />
River/Harbour Bar<br />
Harbour<br />
0-1Km off Shore<br />
Calm Water <strong>Beach</strong><br />
Estuary<br />
Rocky Foreshore<br />
SECTION NINE<br />
<strong>10</strong>7<br />
<strong>10</strong> YEAR ETHNICITY OVERVIEW
SNAPSHOT: OTHER<br />
SNAPSHOT: OTHER<br />
<strong>10</strong> YEAR OVERVIEW | <strong>2011</strong>-<strong>21</strong><br />
<strong>10</strong> YEAR OVERVIEW: <strong>2011</strong>-<strong>21</strong><br />
FATAL DROWNINGS<br />
32<br />
FATAL DROWNING LOCATIONS<br />
AVERAGE FATAL<br />
DROWNINGS PER YEAR<br />
3<br />
AVERAGE FATALITY RATE<br />
PER <strong>10</strong>0,000 POPULATION<br />
2.49<br />
Fatal Drownings (n)<br />
<strong>10</strong><br />
8<br />
6<br />
4<br />
2<br />
0<br />
Female<br />
Male<br />
0-4 5-14 15-24 25-34 35-44 45-54 55-64 65+<br />
Age<br />
91%<br />
MALE<br />
9%<br />
FEMALE<br />
FATAL DROWNINGS BY ACTIVITY<br />
3%<br />
FATAL DROWNINGS BY LOCATION<br />
3%<br />
6%<br />
13%<br />
9%<br />
34%<br />
16%<br />
44%<br />
Swimming/<br />
Wading<br />
22%<br />
44%<br />
113%<br />
16%<br />
34%<br />
Surf <strong>Beach</strong><br />
19%<br />
Swimming/Wading<br />
Falls<br />
Watercraft<br />
Boating<br />
Snorkelling<br />
Land-Based Fishing<br />
Surf <strong>Beach</strong><br />
0-1Km off Shore<br />
Harbour<br />
Rocky Foreshore<br />
Estuary<br />
Calm Water <strong>Beach</strong><br />
Marinas<br />
SURF LIFE SAVING NEW ZEALAND NATIONAL BEACH AND COASTAL SAFETY REPORT 20<strong>21</strong><br />
<strong>10</strong>8
We must address the high<br />
drowning rates in Pasifika and<br />
Maori communities, along with<br />
those who are newer to New<br />
Zealand and have less knowledge<br />
of the beach environment.<br />
Exposure to <strong>Beach</strong> and <strong>Coastal</strong><br />
<strong>Safety</strong> education needs to be<br />
greater, more consistent and<br />
communicated in an authentic<br />
manner to a wider range of<br />
communities.<br />
SECTION NINE<br />
<strong>10</strong>9<br />
<strong>10</strong> YEAR ETHNICITY OVERVIEW
KEY TERMS<br />
Adult – For this report, adults refer to a person 15 years<br />
of age and over, which aligns with the Stats NZ Tatauranga<br />
Aotearoa classification.<br />
Assist – Where a person requires assistance to return to<br />
shore but would most likely be able to get themselves out of<br />
danger if unaided.<br />
Attempting a Rescue – Trying to retrieve a person in distress<br />
and deliver them to a place of safety.<br />
<strong>Beach</strong> – A wave-deposited accumulation of sediment –<br />
usually sand, but ranging in size up to boulders – deposited<br />
between the upper tidal limit and the offshore area where<br />
waves first start breaking.<br />
<strong>Beach</strong> Fatal Drowning – Where the location of the fatality<br />
occurs on a surf beach, calm water beach or rocky foreshore<br />
and the cause of death involves drowning or immersion.<br />
Boating – Using either a powered vessel or sailing boat for<br />
pleasure and/or fishing.<br />
Bystander – A person who is present at an incident but not<br />
part of it initially.<br />
Calm Water <strong>Beach</strong> – An area of estuarine coastline with<br />
sand, gravel or pebbles that contains a sheltered foreshore,<br />
with no surf zone – e.g. harbour beach.<br />
<strong>Coastal</strong> – Tidal waters (estuary, harbour, marina and river/<br />
harbour bar); ocean up to 1km offshore; or inland up to five<br />
times the width of the inlet/river.<br />
Category 1 Search and Rescue Operations – Search and<br />
Rescue coordinated at a local level by the New Zealand Police;<br />
including land operations, river, lake and inland waterway<br />
operations and close-to-shore marine operations.<br />
<strong>Coastal</strong> Fatal Drowning – Where the location of the<br />
fatality is in tidal waters (estuary, harbour, marina and river/<br />
harbour bar), in the ocean up to 1km offshore or inland<br />
up to five times the width of the inlet/river and the cause of<br />
death includes drowning or immersion.<br />
<strong>Coastal</strong> Risk Assessment - A report that recommends levels<br />
of service provision at a location.<br />
Paid Lifeguard Service – Surf Lifeguard services that are<br />
funded by regional councils and local territorial authorities,<br />
and managed by Surf Life Saving New Zealand or Surf Life<br />
Saving Northern Region<br />
Drowning – The process of experiencing respiratory<br />
impairment from submersion/immersion in liquid; outcomes<br />
are classified as death, morbidity and no morbidity.<br />
DrownBaseTM – Database run by Water <strong>Safety</strong> New<br />
Zealand that collates all of the deaths from drowning in<br />
New Zealand. The dataset also includes information on<br />
non-fatal drownings.<br />
Search and Rescue Squads (SAR) – These are made up<br />
of several combined clubs and volunteer surf lifeguards<br />
attached to external local rescue/emergency services.<br />
Squad members are qualified and equipped to respond to<br />
any incident within the beach and coastal environment.<br />
Emergency Response – An action taken by an SLS entity<br />
in response to a call for assistance from an emergency<br />
management organisation.<br />
Estuary - A partially enclosed coastal body of water that is<br />
either permanently or periodically open to the sea<br />
Falls (trips/slips) – An event that results in a person tripping/<br />
slipping so they end up accidentally immersed in water.<br />
Fatal Drowning Rate – A comparative rate of drowning (as<br />
the cause of death) to the size of the population in a given<br />
area.<br />
First Aid – First aid is the first and immediate assistance<br />
given to any person suffering from either a minor or serious<br />
illness or injury, with care provided to preserve life, prevent<br />
the condition from worsening, or to promote recovery.<br />
Harbour – Large inner body of water surrounded on<br />
several sides by prominences of land<br />
Hazard – A source of potential harm.<br />
Incident – Any unplanned event requiring lifesaving<br />
services intervention.<br />
Intervention – An action performed by a Surf Lifeguard to<br />
prevent a situation from deteriorating, which includes injury<br />
or drowning. Interventions include preventative actions,<br />
assists, rescues, searches, major first aids and minor first<br />
aids.<br />
IRB – Inflatable rescue boat.<br />
Land Based Fishing – Attempting to catch fish from the<br />
shoreline. The locations for such activities are generally<br />
rock platforms, though wharfs, jetties and beaches are also<br />
common.<br />
Major First Aid – Any incident where a victim is administered<br />
some form of advanced medical treatment or requires<br />
hospitalization.<br />
Marina – A boat basin offering dockage and other service<br />
for small craft.<br />
Minor First Aid - Where a victim is administered some form<br />
of minor medical treatment – minor cut, bluebottle sting,<br />
sand in the eye, minor strain or sprains.<br />
Morbidity – Any physical or psychological state considered<br />
to be outside the realm of normal well-being. The term<br />
morbidity is often used to describe illness, impairment, or<br />
degradation of health.<br />
Net Fishing – Using a net to trawl the shallows of a beach/<br />
estuary for fish.<br />
Non-fatal Drowning – A subset of drowning, the process<br />
of experiencing respiratory impairment from submersion/<br />
immersion in liquid, where the outcome is classified as<br />
SURF LIFE SAVING NEW ZEALAND NATIONAL BEACH & COASTAL SAFETY REPORT 20<strong>21</strong><br />
1<strong>10</strong>
morbidity and no morbidity.<br />
Patrol – Surf Lifeguard service to monitor activities in/<br />
around an aquatic environment and respond accordingly<br />
through either preventative actions or rescue operations. A<br />
patrol will use the red and yellow patrol flags to assign a<br />
safer swimming area.<br />
Patrol Flags – Red/yellow horizontally divided flags which<br />
are set after performing a risk assessment to determine the<br />
most suitable area for swimming. The flags identify a zone<br />
for swimming and bodyboarding within a patrolled location.<br />
Patrolled Location – A location supervised by a Surf<br />
Lifeguard service.<br />
Preventative Action – Direct action taken to reduce or<br />
eliminate the probability of a specific rescue, first aid or<br />
other reportable incident from occuring.<br />
Rescue – Where a person requires immediate help to return<br />
to shore (or place of safety) and who without intervention<br />
would have suffered distress, injury or drowning.<br />
Risk-Adjusted Water Use Values – Dictates how many<br />
lifeguards are required at patrol location at any given time.<br />
Rock/Cliff – A rock platform that may or may not have a<br />
high steep face.<br />
Rocky Foreshore - The area of coastline with shoreline<br />
rocks, including steep rocky cliffs that is exposed by low<br />
tides and submerged by high tides.<br />
RWC – Rescue water craft or JetSki.<br />
Scuba Diving – Swimming underwater with the aid of<br />
scuba equipment for recreational or commercial purposes.<br />
Searches - Any organised search for a missing person<br />
or group either at sea or on land. Searches include body<br />
recoveries.<br />
Search and Rescue – The search for and provision of aid to<br />
people who are in distress or imminent danger.<br />
Season – For the context of this report, the 2018/19 season<br />
is for the period of July 2018 to June 2019.<br />
Shell Fishing – Collecting shellfish while onshore or<br />
wading/swimming in water.<br />
Snorkelling – Swimming with a snorkel and face mask.<br />
Surf <strong>Beach</strong> – An area of land with sand, gravel or pebbles<br />
that contains a foreshore and surf zone. Surf beaches<br />
include low energy and exposed coasts.<br />
Surf Lifeguard – An individual who undertakes patrols at a<br />
beach. As a minimum requirement they are qualified in surf<br />
rescue and basic lifeguard support.<br />
Surf Lifeguard Service – A coordinated group that exists to<br />
provide aquatic safety services to the public. This includes<br />
Volunteer Surf Life Saving Clubs, Contract Surf Lifeguards,<br />
RWCs, IRB’s, ATV’s and 4WD units.<br />
Surf Life Saving Club – An affiliated not-for-profit<br />
organisation that has volunteer members who provide<br />
patrols and coastal safety services to the community.<br />
Surf Life Saving New Zealand – The leading beach and<br />
coastal safety, drowning prevention and rescue authority in<br />
New Zealand. The purpose of the organisation is to reduce<br />
injury and drowning on our beaches with a vision of zero<br />
preventable drownings.<br />
Surveillance Patrols – Surf Lifeguard services that monitor<br />
beach and water users without designating a red and yellow<br />
flagged area. This approach is effective for extending<br />
patrolling hours or season length, where resources are<br />
limited.<br />
Swimming – Moving through water by moving the body or<br />
parts of the body.<br />
Wading – Walking through water while partially immersed.<br />
Water <strong>Safety</strong> New Zealand – Water <strong>Safety</strong> New Zealand<br />
works with water safety sector organisations, individuals<br />
and the public to reduce the incidence of drowning and<br />
injury in New Zealand. The purpose is to lead a step change<br />
in New Zealand so people don’t drown with a vision that by<br />
2025 more people in New Zealand respect the water and<br />
have the skills, knowledge and awareness to enjoy it safely.<br />
Watercraft – A piece of non-powered recreational<br />
equipment used in water. Examples include surfboards,<br />
stand-up paddleboards, body boards, windsurfers or<br />
kayaks.<br />
SYMBOL KEY<br />
Male and<br />
Female<br />
Rescue<br />
First Aid<br />
Swimming /<br />
Wading<br />
Net/Shell<br />
Fishing<br />
Marina<br />
Calm Water<br />
<strong>Beach</strong><br />
Fatal<br />
Drownings<br />
Search &<br />
Rescue<br />
Squad<br />
Major First<br />
Aid<br />
Fall<br />
Watercraft<br />
River/<br />
Harbour Bar<br />
Surf <strong>Beach</strong><br />
Rescue<br />
Tube<br />
IRB<br />
Minor First<br />
Aid<br />
Land-Based<br />
Fishing<br />
Boating<br />
Harbour<br />
Cat 1 SAR<br />
Operations<br />
Preventative<br />
Action<br />
Searches<br />
SLS Club Snorkelling Attempting<br />
a Rescue<br />
Rock<br />
Fishing<br />
Jet Ski/<br />
PWC<br />
Estuary<br />
<strong>SLSNZ</strong> SAR<br />
Callouts<br />
Assist<br />
Patrol Hours<br />
Dive<br />
Kai<br />
Gathering<br />
Rocky<br />
Foreshore<br />
Female<br />
and Male<br />
Lifeguards<br />
Patrol Sites<br />
Surfing<br />
Scuba<br />
Diving<br />
0-1Km<br />
Off Shore<br />
SURF LIFE SAVING NEW ZEALAND<br />
111<br />
KEY TERMS
REFERENCES<br />
METHODOLOGY<br />
The <strong>National</strong> <strong>Beach</strong> and <strong>Coastal</strong> <strong>Safety</strong> <strong>Report</strong> 20<strong>21</strong><br />
contains information on SLS capability and membership<br />
capacity; rescues and emergency response; and fatal and<br />
non-fatal drownings for the period of 1 July <strong>2011</strong> to 30 June<br />
20<strong>21</strong>. This information is correct as of 1 November 20<strong>21</strong>.<br />
All care has been taken to ensure the statistical information<br />
included within this report is correct. However, pending the<br />
outcome of ongoing coronial investigations, this data may<br />
be amended. Data in figures may not always add up to<br />
<strong>10</strong>0% due to rounding.<br />
The <strong>National</strong> <strong>Beach</strong> and <strong>Coastal</strong> <strong>Safety</strong> <strong>Report</strong> only<br />
documents incidents that have occurred within the coastal<br />
zone. The coastal zone is defined as “Tidal waters (estuary,<br />
harbour, marina and river/harbour bar); ocean up to 1km<br />
offshore; or inland up to five times the width of the inlet/<br />
river”.<br />
LIMITATIONS AND RECOMMENDATIONS FOR FUTURE<br />
RESEARCH<br />
The regional fatal drowning rates per <strong>10</strong>0,000 population<br />
use regional population estimates obtained from Stats NZ.<br />
However, these regional estimates do not include visitors<br />
from elsewhere in New Zealand or visitors from overseas.<br />
Further research is recommended to adjust these figures to<br />
account for the seasonal influx of visitors to each respective<br />
region.<br />
Further research is required to enable Surf Life Saving New<br />
Zealand and water safety stakeholders to gain a greater<br />
understanding of how and why people are recreating on our<br />
coastlines. Additional research is also required to understand<br />
how residents and international tourists use beach and<br />
coastal areas for recreation. Whilst applied psychological<br />
research is also recommended to assess public behaviour<br />
and perception of risk on our beaches. These findings will<br />
be used to inform community engagement and education<br />
strategies nationally.<br />
CAPABILITY ANALYSIS<br />
The Patrols and Memberships (PAM) database is a central<br />
repository for all Surf Life Saving clubs in New Zealand. It<br />
is used to log details of members (contact details, awards,<br />
memberships), patrols and incidents. PAM holds this<br />
information securely, and the data gives us an understanding<br />
of trends across the whole organisation. The database<br />
includes the Customer Relationship Management System<br />
(CRM) which includes operational data such as rescues, first<br />
aids, membership statistics and awards. Information was<br />
extracted from the CRM to identify how many interventions<br />
were performed by volunteers, lifeguards and lifesaving<br />
services during <strong>2020</strong>-<strong>21</strong>; and how many active Surf<br />
Lifeguards and award holders there were during this period.<br />
FATAL DROWNING DATA ANALYSIS<br />
Fatal drownings statistics was recorded in DrownBase TM<br />
and shared for this report by Water <strong>Safety</strong> New Zealand<br />
(20<strong>21</strong>). Water <strong>Safety</strong> New Zealand gives no warranty as to<br />
the correctness of the information or the data provided as it<br />
is supplied to WSNZ by third parties, not under its control.<br />
While WSNZ is satisfied as to its accuracy for the purposes<br />
for which it is supplied to it, WSNZ shall not be liable for any<br />
loss or damage arising directly or indirectly from the use of<br />
any data supplied. All reported statistics are provisional.<br />
The non-fatal drowning data used in this report is based<br />
on hospital stays of at least 24 hours and has been provided<br />
by WSNZ’s as recorded in DrownBaseTM. The data is sorted<br />
by the ICD-<strong>10</strong>-AM/ACHI/ACS international coding system.<br />
SUGGESTED CITATION: Surf Life Saving New Zealand.<br />
(20<strong>21</strong>). <strong>National</strong> <strong>Beach</strong> and <strong>Coastal</strong> <strong>Safety</strong> <strong>Report</strong> 20<strong>21</strong>.<br />
Wellington: Surf Life Saving New Zealand.<br />
ACKNOWLEDGEMENTS<br />
Surf Life Saving New Zealand would like to thank the<br />
following organisations for their assistance in the production<br />
of the <strong>National</strong> <strong>Beach</strong> & <strong>Coastal</strong> <strong>Safety</strong> <strong>Report</strong>. Water <strong>Safety</strong><br />
New Zealand; Surf Life Saving Australia; Omnipoll; Statistics<br />
New Zealand; <strong>SLSNZ</strong> regions and Volunteer Surf Life Saving<br />
clubs; <strong>SLSNZ</strong> would also like to thank our sponsors for their<br />
continued support and regional councils and local territorial<br />
authorities for their funding towards the cost of providing<br />
the Paid Lifeguard Service.<br />
The report was compiled by Dr Mick Kearney (<strong>National</strong><br />
<strong>Coastal</strong> <strong>Safety</strong> Manager), Dr Juliana Albertoni de Miranda<br />
(<strong>Coastal</strong> <strong>Safety</strong> Officer), Adam Wooler (Chief Operations<br />
Officer) and Rajal Middleton (Head of Commercial and<br />
Marketing).<br />
PHOTOGRAPHIC MATERIAL<br />
Cody Keepa: Pages 01, 07-09, 24-25, 36-37, 44-45, <strong>10</strong>9, 113.<br />
Canvas/Weekend Herald: Pages 60-61<br />
Liam Productions: Pages <strong>10</strong>2-<strong>10</strong><br />
Unsplashed: Pages 46-48<br />
Pixabay: Pages 56-57<br />
SURF LIFE SAVING NEW ZEALAND NATIONAL BEACH AND COASTAL SAFETY REPORT 20<strong>21</strong><br />
112
Road, fire and boating<br />
safety have had significant<br />
investment in public<br />
education strategies and<br />
campaigns, which has not only<br />
dramatically reduced deaths<br />
and injuries but also raised<br />
awareness of the issues. It's<br />
now time to do the same for<br />
beach and coastal safety.<br />
© 20<strong>21</strong> SURF LIFE SAVING NEW ZEALAND<br />
This publication is copyright. Except as expressly provided<br />
in the Copyright Act 1968 and the Copyright Amendment Act<br />
2006, no part of this publication may be reproduced, stored in<br />
any retrieval systems or transmitted by any means (including<br />
electronic, mechanical, microcopying, photocopying,<br />
recording or otherwise) without prior permission from Surf<br />
Life Saving New Zealand. Every attempt has been made to<br />
trace and acknowledge copyright, but in some cases, this<br />
may not have been possible. Surf Life Saving New Zealand<br />
apologises for any accidental infringements and would<br />
welcome any information to redress the situation.<br />
REFERENCES<br />
Omnipoll. (20<strong>21</strong>). <strong>National</strong> <strong>Coastal</strong> and Water Survey in<br />
New Zealand. Unpublished survey.<br />
Statistics New Zealand. (20<strong>21</strong>, October <strong>10</strong>). Population<br />
Estimates-DPE. http://infoshare.stats.govt.nz/<br />
Water <strong>Safety</strong> New Zealand. (2015). New Zealand Water<br />
<strong>Safety</strong> Sector Strategy <strong>2020</strong>. https://cdnflightdec.userfirst.<br />
co.nz/uploads/sites/watersafety/files/PDFs/Official_<br />
Documents/Sector-Strategy-Published-Version-Aug-2015.<br />
pdf<br />
Water <strong>Safety</strong> New Zealand. (20<strong>21</strong>). <strong>Coastal</strong> drowning<br />
deaths <strong>2011</strong>-20<strong>21</strong>. Retrieved from DrownBaseTM database.<br />
Water <strong>Safety</strong> New Zealand. (<strong>2020</strong>). Water <strong>Safety</strong> New<br />
Zealand Annual <strong>Report</strong> <strong>2020</strong>. https://cdn-flightdec.userfirst.<br />
co.nz/uploads/sites/watersafety/files/Annual_<strong>Report</strong>s/<br />
WSNZ_20<br />
20-Annual<strong>Report</strong>-FINAL_W.pdf
CONTACT INFORMATION<br />
Surf Life Saving New Zealand<br />
Phone: +64 4 560 0383<br />
E-Mail: communications@surflifesaving.org.nz