Cool Farming: Climate impacts of agriculture and mitigation potential
Cool Farming: Climate impacts of agriculture and mitigation potential
Cool Farming: Climate impacts of agriculture and mitigation potential

You also want an ePaper? Increase the reach of your titles
YUMPU automatically turns print PDFs into web optimized ePapers that Google loves.
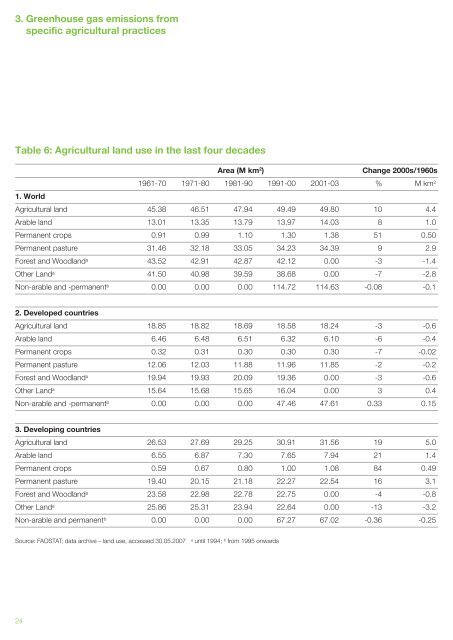
3. Greenhouse gas emissions from<br />
specific agricultural practices<br />
Table 6: Agricultural l<strong>and</strong> use in the last four decades<br />
1. World<br />
24<br />
Area (M km 2 ) Change 2000s/1960s<br />
1961-70 1971-80 1981-90 1991-00 2001-03 % M km 2<br />
Agricultural l<strong>and</strong> 45.38 46.51 47.94 49.49 49.80 10 4.4<br />
Arable l<strong>and</strong> 13.01 13.35 13.79 13.97 14.03 8 1.0<br />
Permanent crops 0.91 0.99 1.10 1.30 1.38 51 0.50<br />
Permanent pasture 31.46 32.18 33.05 34.23 34.39 9 2.9<br />
Forest <strong>and</strong> Woodl<strong>and</strong> a 43.52 42.91 42.87 42.12 0.00 -3 -1.4<br />
Other L<strong>and</strong> a 41.50 40.98 39.59 38.68 0.00 -7 -2.8<br />
Non-arable <strong>and</strong> -permanent b 0.00 0.00 0.00 114.72 114.63 -0.08 -0.1<br />
2. Developed countries<br />
Agricultural l<strong>and</strong> 18.85 18.82 18.69 18.58 18.24 -3 -0.6<br />
Arable l<strong>and</strong> 6.46 6.48 6.51 6.32 6.10 -6 -0.4<br />
Permanent crops 0.32 0.31 0.30 0.30 0.30 -7 -0.02<br />
Permanent pasture 12.06 12.03 11.88 11.96 11.85 -2 -0.2<br />
Forest <strong>and</strong> Woodl<strong>and</strong> a 19.94 19.93 20.09 19.36 0.00 -3 -0.6<br />
Other L<strong>and</strong> a 15.64 15.68 15.65 16.04 0.00 3 0.4<br />
Non-arable <strong>and</strong> -permanent b 0.00 0.00 0.00 47.46 47.61 0.33 0.15<br />
3. Developing countries<br />
Agricultural l<strong>and</strong> 26.53 27.69 29.25 30.91 31.56 19 5.0<br />
Arable l<strong>and</strong> 6.55 6.87 7.30 7.65 7.94 21 1.4<br />
Permanent crops 0.59 0.67 0.80 1.00 1.08 84 0.49<br />
Permanent pasture 19.40 20.15 21.18 22.27 22.54 16 3.1<br />
Forest <strong>and</strong> Woodl<strong>and</strong> a 23.58 22.98 22.78 22.75 0.00 -4 -0.8<br />
Other L<strong>and</strong> a 25.86 25.31 23.94 22.64 0.00 -13 -3.2<br />
Non-arable <strong>and</strong> permanent b 0.00 0.00 0.00 67.27 67.02 -0.36 -0.25<br />
Source: FAOSTAT; data archive – l<strong>and</strong> use, accessed 30.05.2007 a until 1994; b from 1995 onwards