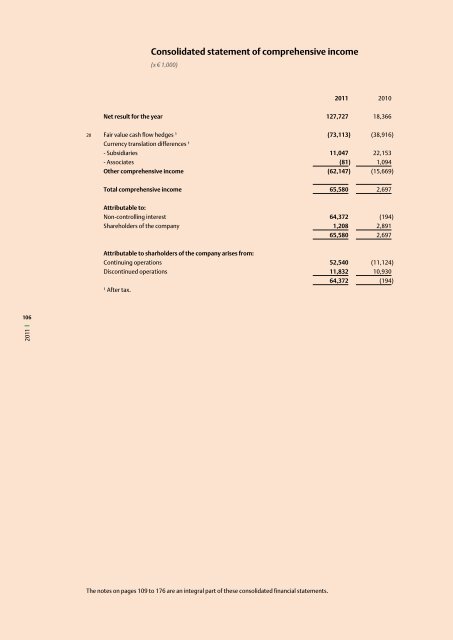
106 <strong>2011</strong> Consolidated statement <strong>of</strong> comprehensive <strong>in</strong>come (x € 1,000) The notes on pages 109 to 176 are an <strong>in</strong>tegral part <strong>of</strong> <strong>the</strong>se consolidated f<strong>in</strong>ancial statements. <strong>2011</strong> 2010 Net result for <strong>the</strong> year 127,727 18,366 20 Fair value cash flow hedges ¹ (73,113) (38,916) Currency translation differences ¹ - Subsidiaries 11,047 22,153 - Associates (81) 1,094 O<strong>the</strong>r comprehensive <strong>in</strong>come (62,147) (15,669) Total comprehensive <strong>in</strong>come 65,580 2,697 Attributable to: Non-controll<strong>in</strong>g <strong>in</strong>terest 64,372 (194) Shareholders <strong>of</strong> <strong>the</strong> company 1,208 2,891 65,580 2,697 Attributable to sharholders <strong>of</strong> <strong>the</strong> company arises from: Cont<strong>in</strong>u<strong>in</strong>g operations 52,540 (11,124) Discont<strong>in</strong>ued operations 11,832 10,930 ¹ After tax. 64,372 (194)
Consolidated statement <strong>of</strong> equity (x € 1,000) Share capital Reserves Equity attributable to <strong>the</strong> Company’s shareholders Reta<strong>in</strong>ed earn<strong>in</strong>gs Total The notes on pages 109 to 176 are an <strong>in</strong>tegral part <strong>of</strong> <strong>the</strong>se consolidated f<strong>in</strong>ancial statements. Non-controll<strong>in</strong>g <strong>in</strong>terest At 1 January 2010 469,379 (181,396) 587,059 875,042 6,172 881,214 20 Fair value cash flow hedges - (38,758) - (38,758) (158) (38,916) Currency translation differences - Subsidiaries - 22,144 - 22,144 9 22,153 11 - Associates Net result recognised directly - 1, 094 - 1,094 - 1,094 <strong>in</strong> equity - (15,520) - (15,520) (149) (15,669) Net result for <strong>the</strong> year - - 15,326 15,326 3,040 18,366 Total comprehensive <strong>in</strong>come - (15,520) 15,326 (194) 2,891 2,697 16 Issue <strong>of</strong> shares 240,087 - - 240,087 - 240,087 31 Dividend paid - - (13,520) (13,520) (344) (13,864) Acquisition <strong>of</strong> non controll<strong>in</strong>g <strong>in</strong>terest - - (1,474) (1,474) (4,541) (6,015) O<strong>the</strong>r movements - - - - (2,486) (2,486) 240,087 - (14,994) 225,093 (7,371) 217,722 At 31 December 2010 709,466 (196,916) 587,391 1,099,941 1,692 1,101,633 20 Fair value cash flow hedges Currency translation differences - (72,691) - (72,691) (422) (73,113) - Subsidiaries - 11,149 - 11,149 (102) 11,047 11 - Associates Net result recognised directly - (81) - (81) - (81) <strong>in</strong> equity - (61,623) - (61,623) (524) (62,147) Net result for <strong>the</strong> year - - 125,995 125,995 1,732 127,727 Total comprehensive <strong>in</strong>come - (61,623) 125,995 64,372 1,208 65,580 16 Preference shares conversion 1,407 - - 1,407 - 1,407 31 Dividend paid 3,821 - (7,133) (3,312) (2,015) (5,327) O<strong>the</strong>r movements - - - - (150) (150) 5,228 - (7,133) (1,905) (2,165) (4,070) At 31 December <strong>2011</strong> 714,694 (258,539) 706,253 1,162,408 735 1,163,143 Group equity 107 <strong>2011</strong>