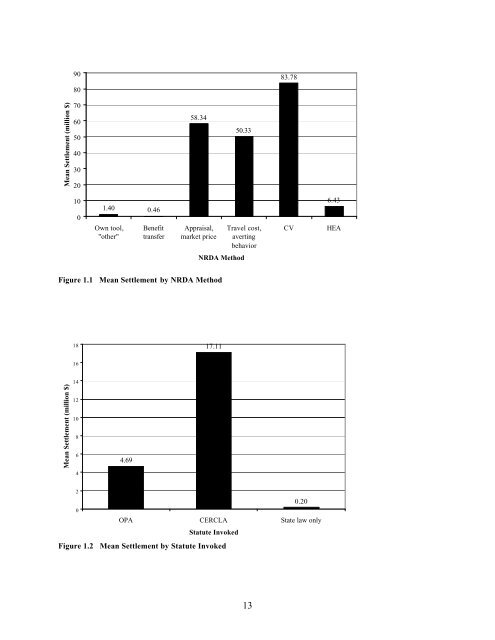
Sophisticated assessment methods such as contingent valuation or the indirect valuation methods (averting behavior <strong>and</strong> travel cost analyses) are not strictly tools of consultants. Table 1.16 shows that while most such tools were wielded by consultants, trustees report having performed some such studies themselves. Similarly, trustees are not the only analysts using simplified methods; they report their consultants having used such methods as well. A breakdown of methods by injured resource, Table 1.17, also shows a lack of specialization across resources; varied NRDA methods are used to assess damages from injuries of all sorts. Of the cases in the data, 61 have been settled completely, six have been the subject of a partial settlement, 20 remain unsettled, <strong>and</strong> one was reported without information on settlement status. Among the 41 cases for which information was provided about both the date of injury <strong>and</strong> the date of settlement, some settlements were reached less than a year after the event that led to the NRDs, while others took decades to reach. When two Superfund outliers are dropped from the calculation (contamination at those sites began in the 1870s), the average length of time between event <strong>and</strong> settlement is about 11 years, <strong>and</strong> the median is four. A few cases settled for less than $10,000. However, the median settlement is close to $300,000 <strong>and</strong> the mean settlement is over eight million dollars. Five cases settled for more than ten million dollars (see Table 1.18). Figure 1.1 indicates that settlements have been higher for cases that were assessed using relatively sophisticated NRDA tools. While this probably reflects the fact that trustees do not choose to use expensive assessment methods when the damages are likely to be small, it is possible that it is easier for trustees to l<strong>and</strong> larger settlements when they can back up their estimates with highly credible analyses. Figure 1.2 indicates that the largest recent settlements have been for NRDs associated with big Superfund sites, <strong>and</strong> that only small cases have been pursued under the auspices of state law. This is consistent with the data shown in Figure 1.3. The largest mean settlements are associated with the sort of uncommonly-claimed resource injuries (such as injuries to cultural resources) that tend to be associated with CERCLA cases. Finally, Figure 1.4 shows that there has not been a great gap between NRD estimates made by trustees <strong>and</strong> the settlements that are finally achieved. The points in the scatter-plot are visibly clustered around the 45-degree line, <strong>and</strong> the correlation coefficient between NRD estimates <strong>and</strong> settlements is .9956. Table 1.18 Amount of Settlement a Total settlement ($) Number of cases 0 – 10,000 5 10,001 - 100,000 12 100,001 – 1,000,000 12 1,000,001 - 10,000,000 10 10,000,001 + 5 Any settlement reported 44 a This value includes cost estimates of compensatory restoration or acquisition done by the PRP under the settlement. 12
Mean Settlement (million $) 90 80 70 60 50 40 30 20 10 0 1.40 0.46 Own tool, "other" Benefit transfer 58.34 Appraisal, market price 50.33 Travel cost, averting behavior NRDA Method Figure 1.1 Mean Settlement by NRDA Method Mean Settlement (million $) 18 16 14 12 10 8 6 4 2 0 4.69 17.11 13 83.78 6.43 CV HEA 0.20 OPA CERCLA State law only Statute Invoked Figure 1.2 Mean Settlement by Statute Invoked