slides
slides
slides

Create successful ePaper yourself
Turn your PDF publications into a flip-book with our unique Google optimized e-Paper software.
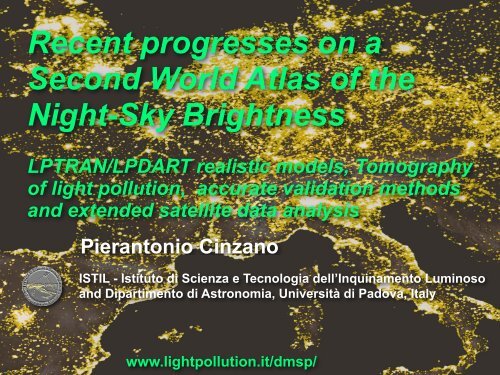
Recent progresses on a<br />
Second World Atlas of the<br />
Night-Sky Brightness<br />
LPTRAN/LPDART realistic models, Tomography<br />
of light pollution, accurate validation methods<br />
and extended satellite data analysis<br />
Pierantonio Cinzano<br />
ISTIL - Istituto di Scienza e Tecnologia dell’Inquinamento Luminoso<br />
and Dipartimento di Astronomia, Università di Padova, Italy<br />
www.lightpollution.it/dmsp/
1 Istituto di Scienza e Tecnologia dell’Inquinamento Luminoso (ISTIL)<br />
in collaboration with<br />
2 Università di Padova, Dip. Astronomia (until March 2006)<br />
3 NOAA National Geophysical Data Center, Boulder<br />
authors P. Cinzano 1,2 , F. Falchi 1,2 , C.D. Elvidge 3<br />
with the support of<br />
Italian Space Agency<br />
(Contract 2001: Global monitoring of<br />
light pollution and night sky brightness<br />
from satellite measurements)<br />
Università di Padova<br />
(Young Researcher’s Project 2003:<br />
Light pollution and the protection of<br />
astronomical sites)<br />
International Dark-Sky Association<br />
Astronomical Observatories<br />
(NOAA/CTIO, VAT, Lowell, IAC/OTPC)<br />
Other organizations (CfDS, AFAM)<br />
National and regional agencies for<br />
environmental protection
Funding for this project and related projects<br />
(excluded salary granted by UniPD to Cinzano until maj 2006 and<br />
support by NGDC for Falchi’s visits in Boulder and GIS software)<br />
ASI IDA UniPD<br />
CfDS AFAM Pierantonio Cinzano<br />
2001 2002<br />
2003<br />
2004<br />
2005<br />
Euro<br />
35.000<br />
30.000<br />
25.000<br />
20.000<br />
15.000<br />
10.000<br />
5.000<br />
0
LPLAB: Laboratory of Photometry<br />
and Radiometry of Light Pollution<br />
www.lplab.it<br />
Cinzano 2003, Mem. Soc. Astron. It. Suppl., 3, 312-315
Main steps<br />
OLS-DMSP<br />
Reduction of radiance data<br />
Data analysis<br />
Geographical and spatial distribution of upward light emission<br />
Atmosphere<br />
Earth-based<br />
measurements<br />
Modelling of light pollution propagation<br />
Map computation<br />
Validation of results<br />
Night sky brightness Stellar visibility<br />
Changes<br />
with time<br />
Correlation with the geographical distribution of population
New Computational techniques<br />
Cinzano<br />
New output products and indicators<br />
Cinzano<br />
New methods for validation of results<br />
and new observational campaigns<br />
Cinzano<br />
Falchi<br />
Falchi & Cinzano<br />
New methods in satellite data analysis<br />
Elvidge<br />
Cinzano<br />
Cinzano, Falchi & Elvidge<br />
Falchi, Cinzano & Elvidge
New Computational techniques<br />
Cinzano<br />
New output products and indicators<br />
New methods for validation of results<br />
and new observational campaigns<br />
New methods in satellite data analysis
Recent methods to map artificial night sky brightness and stellar<br />
visibility across large territories or their distribution over the entire sky at<br />
any site, are based on the computation of the propagation of light<br />
pollution with Garstang models, a simplified solution of the radiative<br />
transfer problem in atmosphere which allows a fast computation by<br />
reducing it to a ray-tracing approach. They are accurate with clear<br />
atmosphere, when a two-scattering approximation is acceptable, which<br />
is the most common situation.<br />
I present here up-to-date Extended Garstang Models (EGM) which<br />
provides a more general numerical solution for the radiative transfer<br />
problem applied to the propagation of light pollution in atmosphere.<br />
(Cinzano, in prep.)<br />
I also present the LPTRAN software package, an application of EGM<br />
to DMSP-OLS radiance measurements and to GTOPO30 digital<br />
elevation data, which provides an up-to-date method to predict the<br />
artificial brightness distribution of the night sky at any site in the World<br />
at any visible wavelength for a broad range of atmospheric situations<br />
and the artificial radiation density in atmosphere across the territory.
EGM account for:<br />
multiple scattering<br />
wavelength from 250 nm to infrared<br />
earth curvature and its screening effects<br />
sites and sources elevation<br />
many kinds of atmosphere or custom setup (e.g. thermal inversion layers)<br />
mix of different boundary layer aerosols and tropospheric aerosols or custom<br />
up to 5 aerosol layers in upper atmosphere including fresh and aged volcanic<br />
dust and meteoric dust<br />
variations of the scattering phase function with elevation<br />
continuum and line gas absorption from many species, ozone included<br />
up to 5 cloud layers<br />
wavelength dependant bidirectional reflectance of the ground surface from<br />
NASA/MODIS satellites, main models or custom data (snow included)<br />
geographically variable upward emission function given as a three-parameter<br />
function or a Lagrange polynomial series<br />
atmospheric scattering properties or libraries of light pollution propagation<br />
functions from other sources<br />
A more general solution, too heavy at present time, allows to account for:<br />
mountain screening<br />
geographical gradients of atmospheric conditions, including localized clouds<br />
geographic distribution of ground surfaces and asymmetric sources
Approach<br />
atmosphere divided in 3D grid<br />
surface in a corresponding 2D grid<br />
atmospheric situation and scattering functions of each volume from<br />
up-to-date models of atmospheric physics<br />
the source has a given upward intensity function<br />
Garstang-like ray-tracing approach<br />
irradiance from the source on each atmospheric volume is<br />
calculated (accounting for extinction, absorption, etc.)<br />
intensity of the light scattered in each direction by each volume<br />
(numerical approximation) based on detailed scattering properties<br />
irradiance on each surface area from each atmospheric volume<br />
and intensity of the light scattered in each direction<br />
start iterations: irradiance on each atmospheric volume and on<br />
each surface area is calculated, due to light coming from other<br />
volumes, other surface areas and the source. The intensity of the<br />
light scattered in each direction is added. Then another iteration.<br />
at the end, the intensity of light scattered by each volume in each<br />
direction is known, and also the radiation density, etc.<br />
brightness obtained from simple integration along the line-of-sight
The software package LPTRAN (Light Pollution radiative TRANsfer), written<br />
in Fortran-77, applies the method for the case of axial symmetry of sources.<br />
It is composed by a number of programs (Cinzano, in prep.):<br />
the main program LPTRAN (the same name of the package) computes the<br />
radiative transfer and light pollution propagation based on an input<br />
atmospheric and surface model for the given wavelength<br />
LPDART evaluates light pollution and night sky brightness on the grid and<br />
writes a library of light pollution propagation functions (brightness vs. distance)<br />
lpskymap_lptran computes night sky brightness in a site based on DMSP-<br />
OLS radiance data, a Digital Elevation Map and the lptran library.<br />
lpskyalt, lpskydens and lpskyfrzh compute across a territory the artificial<br />
night sky brightness at any chosen azimuth and elevation, the radiation and<br />
scattered flux densities in atmosphere and their fractionary contribution to the<br />
zenith night sky brightness at sea level.<br />
lpskymap package (Cinzano & Elvidge 2004) allow to obtain polar plots and<br />
other indicators for individual sites.<br />
lpmap package (Cinzano, Falchi & Elvidge 2001) allows to obtain the maps<br />
of limiting magnitudes across the territory.
Comparisons between predictions of classic Garstang<br />
models and LPTRAN predictions show close agreement<br />
for US62 standard clear atmosphere and typical upward<br />
emission function. (Cinzano, in prep.)
New Computational techniques<br />
New output products and indicators<br />
Cinzano<br />
New methods for validation of results<br />
and new observational campaigns<br />
New methods in satellite data analysis
upward flux<br />
statistical indexes<br />
(e.g fraction of population<br />
or surface under a sky<br />
of given luminosity)<br />
Cinzano, Falchi, Elvidge 2001b,<br />
MNRAS, 328, 689-707<br />
Our classic products and indicators<br />
sea level artificial<br />
night sky brightness<br />
Cinzano, Falchi, Elvidge, Baugh<br />
2000, MNRAS, 318, 641-657<br />
total night<br />
sky brightness<br />
stellar visibility<br />
(limiting magnitude)<br />
Cinzano, Falchi, Elvidge 2001a,<br />
MNRAS, 323, 34-46<br />
loss of stellar<br />
visibility<br />
night sky brightness and stellar visibility at individual sites<br />
polar maps cartesian maps hypermaps<br />
Cinzano, Elvidge 2004, MNRAS, 353, 1107-1116<br />
Cinzano, Falchi, Elvidge<br />
2003, IAUWG, Sidney
New indicators of light pollution:<br />
(i) the sky irradiance (or the illuminance) on the earth surface, which has effects on<br />
the luminosity of the ground surface and on the luminosity of the night environment as<br />
perceived by animals, plants and the man (where direct irradiance by nearby lighting<br />
installations is not overwhelming);<br />
(ii) the radiation density in the atmosphere, which is the energy (or the light or the<br />
number of photons) per unit volume of atmosphere in course of transit, in an unit time, in<br />
the neighborhood of the point (x, y, z ). UNITS: photon density in ph m -3 , luminous<br />
density in Tb m -3 , where Talbot (lm * s) is the unit of luminous energy.<br />
It can be split in upward and downward radiation densities, which quantify<br />
approximately the light coming back toward the soil and going toward the outer Space.<br />
The radiation density due to direct illumination by the sources, gives the direct light<br />
travelling through a unit volume of atmosphere.<br />
(iii) the upward and downward scattered flux densities, which are the flux density of<br />
the scattered radiation; the downward one, in particular, quantifies the ”strength” of the<br />
unit volume of atmosphere at position (x, y, z ) as secondary source of light pollution<br />
when subjected to the considered light polluting action. UNITS: density of flux in ph s -1<br />
m -3 or lm m -3 .<br />
These integrated quantities are useful only as generic indictors of the alteration of the<br />
atmosphere. The effects of the atmosphere as secondary source of light pollution must<br />
be evaluated based on the intensity of light at each position .
Downward radiation<br />
density in the<br />
atmosphere above a<br />
line at constant latitude<br />
in function of the<br />
volume index number<br />
and the position.<br />
Light flux scattered<br />
downward by an unit<br />
volume of atmosphere<br />
in function of the<br />
volume index number<br />
and the distance from<br />
an unit source.<br />
Tomography of light pollution<br />
LPTRAN/LPDART Preliminary Data © Cinzano/ISTIL 2004<br />
volume<br />
30<br />
20<br />
10<br />
Lat. N46 ◦ 26’, Veneto, Italy<br />
20 40 60 80 100 120<br />
distance (km)<br />
-1200 -1000 -800 -600 -400<br />
log(s)*100<br />
Tb/km 3<br />
The natural<br />
luminous density<br />
is approximately<br />
of the order of<br />
3·10 −3 Tb/km 3
Illuminance/irradiance at soil from scattered light<br />
LPTRAN/LPDART Preliminary Data © Cinzano/ISTIL 2004<br />
Verona<br />
Regione Veneto (Italy)<br />
Vicenza<br />
Padova<br />
Mestre-Venezia<br />
Moon 3.5 d<br />
(lat. 45°)<br />
natural<br />
night sky<br />
µlx
Cinzano 2002, Research note, in prep.
No biunivocal relation between the number of visible stars and the<br />
zenith limiting magnitude:<br />
V mag vs. star number is not exactly exponential and not well<br />
defined in catalogues<br />
sky brightness changes with the direction of observation: required<br />
integration over the visible emisphere or modelling<br />
extinction and star apparent magnitude change with elevation<br />
Cinzano 2002, Research note, in prep.
New Computational techniques<br />
New output products and indicators<br />
New methods for validation of results<br />
and new observational campaigns<br />
Cinzano<br />
Falchi<br />
Falchi & Cinzano<br />
New methods in satellite data analysis
We want improve the validation with Earth-based observations of<br />
the night sky brightness computed from OLS-DMSP data<br />
Cinzano, Elvidge 2004, MNRAS, 353, 1107–1116
the goal is the situation of the light pollution in the territory, then a lot of measurements in<br />
many different sites, each clean night, are needed. Main requirements:<br />
fast movements of the observer across the territory, possibly returning at the same<br />
site at different times in the same night, so the number of measured sites in a night<br />
should depend almost exclusively on the transfer times from one site to the following one<br />
measurements should be taken each night resulting clean over the entire territory for<br />
long times (because they are not many). This interact with private life of the observer so<br />
the measurement process should be not awkward or the observer will give up<br />
Needed fast "point-and-shot" mobile instrument with short setup times, easy to<br />
manage, portable, accurate, not requiring awkward data reduction<br />
Choices:<br />
1) search for better instruments and procedures<br />
automatized portable CCD imagers: accurate measurements of both brightness and<br />
aerosol content (extinction) but not so quick setup, professional data reduction required<br />
(e.g. WASBAM and WASBAM-SSH with spectrographic capabilities, Cinzano, Falchi 2003,<br />
Mem. Soc. Astron. It., 74, 458-459; Cinzano 2004, Mem. Soc. Astron. It. Suppl., 5, 395-398)<br />
mobile fish-eye CCD cameras pointed at zenith: fast setup, professional data<br />
reduction required, geometric corrections, some limitations (e.g. Duriscoe 2004, IDA Meeting,<br />
Tucson; see also CONCAM webcam network, Nemiroff & Schwarz 2003, AAS; Hollan, this meeting)<br />
portable research radiometers: point-and-shoot, very accurate, continuous<br />
sampling, but no measure of the atmospheric situation so external data are needed<br />
(e.g. LPLAB radiometer, Cinzano 2003, Mem. Soc. Astron. It. Suppl., 3, 312-315)<br />
sky quality meters: super-quick but not best accuracy, atmospheric data needed;<br />
they require accurate characterization and that the user “understand” the instrument<br />
(Cinzano 2005, Night sky photometry with Sky Quality Meter, ISTIL Internal Report, 9 )
Response<br />
Sky Quality Meter<br />
Characterization:<br />
Cinzano 2005, Night sky photometry with Sky<br />
Quality Meter, ISTIL Internal Report, 9<br />
http://www.lightpollution.it/download/sqmreport.pdf
2) improvements of method of measure<br />
(Cinzano, Falchi, various papers in prep.)<br />
Measurements needs to be:<br />
accurate (high accuracy and stable instrument with accurate calibration)<br />
taken in an accurately shaped passband (wide-field instruments are<br />
calibrated over a laboratory source rather than over stars so proper filters need to be fitted<br />
to the detector response or passband mismatch correction)<br />
independent from the time of the night (they should be taken all at the<br />
same time of the night - first or second part of the night - frequent sampling allow<br />
minimizing atmospheric fluctuations by averaging e.g. over 1 hour)<br />
independent from atmospheric conditions (to obtain an atmospheric<br />
independent measurement requires a large sample of data from the same site taken in<br />
many clean nights along one or more years with contemporary measurements of<br />
atmospheric aerosol optical depth (stellar extinction or lidar measurements taken inside<br />
the polluting area)
Night Sky Brightness (mag/arcsec^2)<br />
Night Sky Brightness (mag/arcsec^2)<br />
19,2<br />
19,3<br />
19,4<br />
19,5<br />
19,6<br />
0,35<br />
0,30<br />
0,25<br />
0,20<br />
0,15<br />
0,10<br />
0,05<br />
0,00<br />
23 24 25 26 27 28 29<br />
Time<br />
low elevation clouds<br />
21aug2004<br />
14aug2004<br />
-0,05<br />
20 21 22 23 24 25 26 27 28 29<br />
Time<br />
Urban Site A, Veneto, Italy<br />
Sampling: 30 sec<br />
16 mar 2004<br />
Night Sky Brightness (mag/arcsec^2)<br />
18,8<br />
19,0<br />
19,2<br />
19,4<br />
19,6<br />
Cinzano 2005, paper 6, in prep.<br />
29nov2003<br />
15dec2003<br />
16dec2003<br />
22dec2003<br />
23dec2003<br />
01feb2006<br />
18 20 22 24 26 28 30<br />
Time<br />
average brightness after h 02<br />
cleanest nights 2003–2005
Quantification of the atmospheric<br />
aerosol content is mandatory<br />
here another example<br />
Falchi, Cinzano 2006, in prep.<br />
45 deg elevation<br />
local<br />
45 deg elevation<br />
local<br />
45 deg elevation, data after h24<br />
cleanest nights 2003-2005,<br />
zenith<br />
snow
3) solution of primary issues of photometry and radiometry<br />
of light pollution at LPLAB (Cinzano, various papers in prep.)<br />
Procedures for characterization and testing of instruments<br />
Procedures for calibration of instruments<br />
Calibration of a TTL luminance-meter over the Moon<br />
Laboratory calibration of large-field radiometers in V band<br />
Conversion between CIE photopic and astronomical V band<br />
Effects and correction of passband mismatch<br />
Procedures for photometrical and spectral data reduction<br />
Development of software for instruments management (LABVIEW)
4) New observational campaigns<br />
Campaign for photometric measurements of night<br />
sky brightness and atmospheric extinction<br />
Dip. Astronomia, Università Padova (5/2003-11/2005)<br />
ISTIL, Thiene (after 11/2005)<br />
observer: Fabio Falchi<br />
wide field automatic CCD camera (like WASBAM)<br />
B,V night sky brightness and stellar extinction<br />
aim: map validation and brightness-aerosol relationship<br />
1600 frames, more than 1000 brightness measurements<br />
on a 37 points grid in 22 clean nights from 8 Italian sites<br />
contemporaneity with low gain DMSP measurements<br />
Light pollution measurements in urban areas<br />
ISTIL, Thiene (2003-2006)<br />
observer: Pierantonio Cinzano<br />
portable research radiometer<br />
V night sky brightness at zenith from an urban site<br />
aim: measurement in urban areas and relationship<br />
brightness-atmospheric content<br />
39 nights with 30 s sampling or random sampling<br />
aerosol optical depth measurements in the same day
New Computational techniques<br />
New output products and indicators<br />
New methods for validation of results<br />
and new observational campaigns<br />
New methods in satellite data analysis<br />
Elvidge<br />
Cinzano<br />
Cinzano, Falchi & Elvidge<br />
Falchi, Cinzano & Elvidge
maps of light emission<br />
near zenith<br />
OLS-DMSP<br />
upward emission function<br />
(normalized intensity)<br />
New extended data sets (Falchi, Elvidge) and improved reduction (Elvidge)<br />
visible band geolocated images in 30 arc second grids with both low<br />
gain and high gain, extended to large view angles (∼80° from nadir)<br />
scan angles from the OLS toward the Earth<br />
times of observation of each scan line<br />
thermal band images<br />
thermal band brightness temperature difference from NCEP surface<br />
temperature model<br />
flags (data quality labels, clouds, snow, etc.)<br />
lunar illuminance
We want improve our knowledge of<br />
the upward emission function of cities<br />
Cinzano, Falchi, Elvidge, Baugh, 2000, MNRAS, 318, 641–657<br />
Three methods, in progress:<br />
satellite measurements (analysis software under testing, required OLS angular<br />
response i.e. “standard sources” on Earth surface, Moon illuminance software done)<br />
(Cinzano, Falchi, Elvidge, in prep.)<br />
earth-based measurements with inversion of models (software<br />
under testing, some revision planned) (Cinzano, in prep.)<br />
modelling of cities by summing the functions of a sample of<br />
lighting installations randomly oriented<br />
(extension of Roadpollution software, models required for<br />
the city lighting and its environment) (Cinzano, to be done)
OLS-DMSP satellite measurements<br />
no extinction<br />
Lambertian<br />
Lambertian<br />
Falchi, Cinzano 2004, in prep.<br />
OLS-DMSP satellite measurements<br />
accounting for extinction along light paths<br />
Surface reflection<br />
Fixture<br />
Roadpollution
study of growth of light pollution<br />
requires accurate calibration of DMSP-OLS<br />
(Falchi, 2005)<br />
OLS-DMSP<br />
satellite
Convegno Rotary, Sant'Agata Feltria, 6 Dic 2003
Convegno Rotary, Sant'Agata Feltria, 6 Dic 2003
Conclusions<br />
we authors have a lot of works to complete<br />
Planned deadline: one year to complete papers<br />
and another year to compute the world atlas<br />
Realistic deadline: two years to complete draft<br />
papers, one year to complete further details<br />
and one/two years to compute the atlas<br />
This talk on the web:<br />
www.lightpollution.it/download/iau06cinzano.pdf<br />
www.lightpollution.it/download/iau06<strong>slides</strong>.pdf<br />
Photo G. Barcheri
Lights in Cekia<br />
Pizen<br />
Dresda<br />
Usti<br />
Prague<br />
Liberec<br />
Mlada<br />
Ceske Budejovice<br />
Hradec<br />
Kralové<br />
Jihlava<br />
Brno<br />
Olomuc<br />
Ostrava<br />
©2004 Cinzano/ISTIL based on OLS-DMSP data 2000
V mag<br />
>6.0<br />
5.75-6.0<br />
5.5-5.75<br />
5.25-5.5<br />
5.0-5.25<br />
4.75-5.0<br />
4.5-4.75<br />
4.25-4.5<br />
4.0-4.25<br />
3.75-4.0<br />
Magnitude loss in Cekia<br />
Cinzano/ISTIL 2003<br />
Magnitude loss<br />
Each level is 0.2 mag<br />
red = 1.6 – 1.8 mag<br />
green = 0.8-1.0 mag<br />
orchid = 0.2-0.4 mag
Cinzano 2005, Research note, in prep.
Roadpollution v. beta 1.5<br />
a free software for the analysis of road lighting installations and<br />
the evaluation of the environmental impact due to light pollution<br />
Downloadable from www.lightpollution.it/roadpollution/<br />
Users MUST read the user manual<br />
Roadpollution<br />
User Manual Manuale d’uso<br />
Pierantonio Cinzano 26 September 2005 • v1.6.1<br />
software for the analysis of road lighting installations and<br />
the evaluation of the environmental impact due to light<br />
software per<br />
pollution<br />
l'analisi degli impianti di illuminazione stradale e per la valu-<br />
tazione dell'impatto ambientale da inquinamento luminoso<br />
Pierantonio Cinzano • Roadpollution User Manual• www.lightpollution.it/roadpollution/!<br />
1
EasyLight free optimization software<br />
ing. Diego Bonata www.savethesky.eu