Core Strategy Baseline Analysis Study - Bradford Metropolitan ...
Core Strategy Baseline Analysis Study - Bradford Metropolitan ...
Core Strategy Baseline Analysis Study - Bradford Metropolitan ...

You also want an ePaper? Increase the reach of your titles
YUMPU automatically turns print PDFs into web optimized ePapers that Google loves.
Local Development Framework for <strong>Bradford</strong><br />
Evidence Base<br />
<strong>Core</strong> <strong>Strategy</strong> DPD:<br />
Base <strong>Analysis</strong> Report<br />
Working Draft<br />
October 2011
This page is intentionally left blank<br />
1
<strong>Core</strong> <strong>Strategy</strong>: <strong>Baseline</strong> <strong>Analysis</strong> Report<br />
Table of Contents<br />
1.0 Introduction 07<br />
1.1 Local Development Framework (LDF) for <strong>Bradford</strong> 08<br />
1.2 <strong>Bradford</strong> District-setting the context 08<br />
1.3 A Spatial Picture of the District 10<br />
1.4 The Big Plan- our place 12<br />
1.5 Scope and Purpose of the <strong>Baseline</strong> <strong>Analysis</strong> Report 15<br />
1.6 Structure of the Report 17<br />
2.0 Planning Policy Context 19<br />
2.1 National Planning Policy Context 19<br />
2.2 Regional Context 29<br />
2.3 Sub-Regional Context 34<br />
2.4 Local Planning Context 36<br />
3.0 Regeneration Context 43<br />
3.1 <strong>Bradford</strong> Vision – Local Strategic Partnership 43<br />
3.2 The Big Plan – Sustainable Community <strong>Strategy</strong> 2008 – 201 44<br />
3.3 <strong>Bradford</strong> City Centre Masterplan 45<br />
3.4 The Neighbourhood Development Frameworks 47<br />
3.5 Canal Road Masterplan 48<br />
3.6 Manningham Masterplan 49<br />
3.7 Airedale Corridor Masterplan 50<br />
3.8 Leeds <strong>Bradford</strong> Corridor <strong>Study</strong> 51<br />
3.9 <strong>Bradford</strong> Trident Masterplan 52<br />
3.10 <strong>Bradford</strong> Learning Quarter Design and Delivery Framework 53<br />
3.11 Neighbourhood Development Plan for South <strong>Bradford</strong> 54<br />
3.12<br />
Neighbourhood Development Plan for Holmewood, Tong and<br />
Manningham<br />
4.0 Socio-Economic Context 57<br />
4.1 Demographic Characteristics 57<br />
4.1.1 Population Structure<br />
4.1.2 Population Trend<br />
4.1.3 Ethnicity and Religion<br />
4.1.4 International Migration<br />
4.2 Deprivation Indices 62<br />
4.3 Education and Skills 64<br />
4.3.1 Qualifications<br />
4.3.2 GCSE Attainment<br />
4.3.3 Further and Higher Education<br />
4.4 Economic Activity 67<br />
4.4.1 Economic Trends<br />
4.4.2 Location of Employment Activities<br />
4.4.3 <strong>Bradford</strong> Employment Land Review and Forecast<br />
4.4.4 Protecting Existing Employment Land and Buildings<br />
4.4.5 Rural Diversification<br />
55<br />
2
4.5 Employment and Earnings 73<br />
4.5.1 Economic Activity Rates<br />
4.5.2 Employment Rates<br />
4.5.3 Occupation Profile<br />
4.5.4 Self-employment<br />
4.5.5 Earnings and Income<br />
4.5.6 Unemployment and Worklessness<br />
4.6 Car Ownership and Commuting 84<br />
4.6.1 Car Ownership Levels<br />
4.6.2 Commuting to Works<br />
4.7 Health 86<br />
4.8 Crime 90<br />
4.9 Road Casualties 94<br />
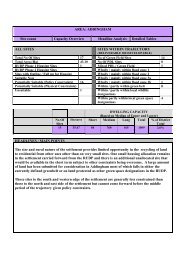
4.10 Emergency Services-Capacity and Performances 95<br />
4.11 Key Facts 101<br />
5.0 Housing 104<br />
5.1 National, Regional and Sub-regional Policies and Strategies 104<br />
5.2 Housing Profile of the District 110<br />
5.2.1 Current Housing Stock<br />
5.2.2 Building Activity<br />
5.2.3 Future Housing Stock<br />
5.2.4 Property type<br />
5.2.5 Tenure<br />
5.2.6 Stock Condition<br />
5.2.7 Vacancy<br />
5.2.8 Overcrowding<br />
5.3 Household Characteristics 119<br />
5.3.1 Household Composition<br />
5.3.2 Household Structure and Formation<br />
5.3.3 Gypsies and Travellers<br />
5.3.4 Household Formation Typology<br />
5.3.5 Future Changes in Household Numbers<br />
5.4 Housing Market 124<br />
5.4.1 <strong>Bradford</strong> Housing Market Area<br />
5.4.2 Housing Markets in <strong>Bradford</strong><br />
5.4.3 Property Values – Levels and Trends<br />
5.4.4 Affordability<br />
5.4.5 Housing Need<br />
5.5 Latest Housing Data 132<br />
5.6.1 Progress in Leeds City Region<br />
5.6.2 Implications of the Recession on LCR Housing Delivery<br />
5.6 Key Facts 135<br />
6.0 Social and Community Facilities 139<br />
6.1 Education 140<br />
6.1.1 Schools in <strong>Bradford</strong><br />
6.1.2 School Performances<br />
6.1.3 Other Achievements<br />
6.1.4 Management of Schools<br />
6.1.5 Building Schools for Future Programme<br />
6.1.6 School Capacity<br />
6.1.7 Further and Higher Education<br />
3
6.2 Health 151<br />
6.2.1 Primary Care<br />
6.2.2 Secondary Care<br />
6.2.3 Hospitals<br />
6.2.4 Health Centres/GP Surgeries<br />
6.3 Children’s Services 159<br />
6.4 Neighbourhood Management and Community <strong>Strategy</strong> 164<br />
6.5 Community Services 168<br />
6.5.1 Markets and Shopping Facilities<br />
6.5.2 Community Centres<br />
6.5.3 Post Offices<br />
6.5.4 Job Centre Plus<br />
6.5.5 Local Benefit/Tax Offices<br />
6.5.6 Cemeteries and Crematoria<br />
6.5.7 Courts and Prison<br />
6.5.8 Places of Worship<br />
6.6 Emergency Services 180<br />
6.6.1 Police<br />
6.6.2 Fire Services<br />
6.6.3 Ambulance<br />
6.7 Social Services/Over50s Support 186<br />
6.8 Gypsy and Travellers Facilities 188<br />
6.9 Culture and Leisure 191<br />
6.9.1 Museums/Galleries<br />
6.9.2 Theatres/Concert Halls<br />
6.9.3 Cinemas<br />
6.9.4 Ten-Pin Bowling Alleys, Casino/Bingo Halls<br />
6.9.5 Libraries<br />
6.9.6 Children’s Play Areas<br />
6.9.7 Sports Pitches and Courts<br />
6.9.8 Sports Centre and Recreation Facilities<br />
6.9.9 Festivals and Town Centre Programmes<br />
6.9.10 Parks and Openspaces<br />
6.10 Key Facts 218<br />
7.0 Landscape Character and Historic Environment 220<br />
7.1 General overview of Natural Landscape Elements 220<br />
7.1.1 Landform<br />
7.1.2 Geology<br />
7.1.3 Soils and Agricultural Land Classification<br />
7.1.4 Climate<br />
7.1.5 Biodiversity<br />
7.2 Landscape Types 228<br />
7.3 Landscape Character Areas 233<br />
7.4 Policy Context-Landscape 236<br />
7.5 Built Heritage and Historic Environment 236<br />
7.5.1 Policy Context- Historic environment<br />
7.5.2 Listed Buildings<br />
7.5.3 Conservation Areas<br />
7.5.4 World Heritage Site<br />
7.5.5 Parks and Gardens<br />
7.5.6 Scheduled Ancient Monuments<br />
7.5.7 Historical Battlefields<br />
4
7.5.8 Heritage at Risk<br />
7.5.9 Archaeology<br />
7.6 Key Facts 247<br />
8.0 Commercial Appraisal 249<br />
8.1 Regional Context 249<br />
8.2 Local Context 251<br />
8.3 Office Market Profile 252<br />
8.4 Industrial Market Profile 255<br />
8.5 Retail Profile 259<br />
8.6 Leisure and Tourism Market Profile 265<br />
8.7 Visitor Economy Profile 271<br />
8.8 Residential Market Profile 281<br />
8.9 Key Facts 284<br />
9.0 Transport and Accessibility 286<br />
9.1 Policy Context 286<br />
9.2 Travel and Transport in <strong>Bradford</strong> District 291<br />
9.2.1 General Traffic Trend<br />
9.2.2 Commuting Pattern<br />
9.2.3 Car Ownership<br />
9.2.4 Congestion<br />
9.2.5 Environmental Issues<br />
9.3 Accessibility and Connectivity 298<br />
9.4 Public Transport 299<br />
9.4.1 Train services<br />
9.4.2 Bus and Coach services<br />
9.4.3 Taxis<br />
9.5 Air Travel 307<br />
9.6 Cycling and Walking 309<br />
9.7 Car Parking Provision 310<br />
9.8 Road Injuries 313<br />
9.9 Key Facts 313<br />
10.0 Environment 316<br />
10.1 Air Quality 316<br />
10.2 River and Water Quality 321<br />
10.3 Renewable Energy 322<br />
10.4 Land Contamination 325<br />
10.5 Hazardous Installations 325<br />
10.6 Litter and Dereliction 327<br />
10.7 Flood Risk 329<br />
10.8 Biodiversity and Wildlife 333<br />
10.8.1 Biodiversity Habitat Summery<br />
10.8.2 Wildlife Species Summery<br />
10.8.3 Biodiversity Assets<br />
10.9 Agricultural Land 340<br />
10.10 Climate Change and energy Efficiency 341<br />
10.11 Key Facts 345<br />
11.0 Minerals and Waste Management 360<br />
11.1 Minerals 360<br />
11.1.1 Aggregates<br />
5
11.1.2 Sand and Gravel<br />
11.1.3 Building, Roofing and Flag Stone<br />
11.1.4 Coal and Fireclay<br />
11.2 Current Minerals Supply Situation in <strong>Bradford</strong> 365<br />
11.3 Waste Production in <strong>Bradford</strong> 366<br />
11.4 Municipal Waste 368<br />
11.5 Waste Collection, Treatment and Disposal Services 369<br />
11.6 Waste Composition 370<br />
11.7 Recycling and Composting 376<br />
11.8 Future waste Position in <strong>Bradford</strong> to 2021 377<br />
11.9 Key Facts 378<br />
12.0 Sustainability 384<br />
13.0 Conclusion 387<br />
6
1.0 INTRODUCTION<br />
It is important that the polices and proposals of the <strong>Core</strong> <strong>Strategy</strong> DPD are based on an upto-date,<br />
robust and reliable evidence base to ensure a thorough understanding of the needs,<br />
opportunities and any constraints of the area.<br />
The Council has drawn on a range of information about the important aspects of the District<br />
including housing, the local economy, environment, transportation and community facilities<br />
including schools, shopping and sporting facilities to form the evidence base for the <strong>Core</strong><br />
<strong>Strategy</strong>. These pieces of work provide a picture of the District in terms of key issues and<br />
also their spatial relevance. The Council is encouraging comments and reviews on all of its<br />
evidence base technical studies and research papers. The full list of evidence base studies<br />
and research which have informed the <strong>Core</strong> <strong>Strategy</strong> to date can be found in Bibliography<br />
section of the Report. These are also made available on the Council’s website under<br />
‘Evidence Base’. Some of the key pieces of Evidence are listed as follows:-<br />
• The Big Plan Sustainable Community <strong>Strategy</strong> and Background Papers<br />
• <strong>Bradford</strong> District Retail & Leisure <strong>Study</strong><br />
• <strong>Bradford</strong> District Employment Lands Review Assessment<br />
• <strong>Bradford</strong> District Strategic Housing Market Assessment<br />
• <strong>Bradford</strong> District Strategic Housing Land Availability Assessment<br />
• <strong>Bradford</strong> District Transport <strong>Study</strong><br />
• <strong>Bradford</strong> District Local Infrastructure <strong>Study</strong><br />
• <strong>Bradford</strong> District Strategic Flood Risk Assessment Level 1 and Level 2<br />
• <strong>Bradford</strong> District Open Space, Sports and Recreation <strong>Study</strong><br />
• <strong>Bradford</strong> District Conservation Area Assessments (for 57 Conservation Areas)<br />
• <strong>Bradford</strong> District Landscape Character Assessment<br />
• <strong>Bradford</strong> District Biodiversity Action Plan<br />
• <strong>Bradford</strong> District Tourism <strong>Strategy</strong><br />
In accordance with good practice advice by the Planning Advisory Service (PAS), including<br />
the online Plan Making Manual, the Council considers the gathering of evidence as an<br />
iterative process which must be continued throughout the plan preparation process. The<br />
reason for this is because the evidence is key to other aspects of plan production including<br />
Sustainability Appraisal, Infrastructure Planning and Delivery, Options Generation and<br />
Community Engagement.<br />
The Council has therefore published this ‘Draft <strong>Baseline</strong> <strong>Analysis</strong> Report’ which provides a<br />
comprehensive analysis of the core baseline conditions and context of the district. The Draft<br />
<strong>Baseline</strong> <strong>Analysis</strong> Report has been published as part of the Preferred Options consultation.<br />
The report has been deliberately left in ‘Draft’ form and will be supplemented with additional<br />
information during the course of the preparation of the <strong>Core</strong> <strong>Strategy</strong> DPD. As part of the<br />
ongoing consultation process, the Draft <strong>Baseline</strong> <strong>Analysis</strong> Report has been made publicly<br />
available for consultees for comment and review.<br />
7
1.1 Local Development Framework (LDF) for <strong>Bradford</strong><br />
Development in the District is currently managed by the Replacement Unitary Development<br />
Plan (RUDP), adopted in 2005. New planning legislation requires that local authorities<br />
replace their current development plans with a new type of plan called a Local Development<br />
Framework (LDF). The Local Development Scheme (LDS) provides a starting point for<br />
the local community and the stakeholders to find out what planning policies and<br />
proposals (Local Development Documents) the Council intends to produce as part of the<br />
Local Development Framework.<br />
The Local Development Framework will be a portfolio of documents which will replace the<br />
Council’s current Replacement Unitary Development Plan. For further information on the<br />
Local Development Framework, please see <strong>Bradford</strong> Councils Leaflet Number 1 ‘The Guide<br />
to the Local Development Framework’.<br />
The <strong>Core</strong> <strong>Strategy</strong> will set the long term spatial vision for the District and strategic policies<br />
to deliver the vision. The <strong>Core</strong> <strong>Strategy</strong> Issues and Options Report was published for public<br />
consultation in February 2007 with the Further Issues and Options Report published for<br />
consultation in January 2008. For further information on the <strong>Core</strong> <strong>Strategy</strong>, please see<br />
<strong>Bradford</strong> Councils Leaflet Number 2 ‘The Guide to The <strong>Core</strong> <strong>Strategy</strong>’<br />
1.2 <strong>Bradford</strong> – setting the context<br />
<strong>Bradford</strong> is a City in West Yorkshire, England. It lies amongst the Pennines, 8.6miles<br />
(13.8km) west of Leeds city centre. <strong>Bradford</strong> is surrounded by several smaller settlements<br />
which together form the City of <strong>Bradford</strong> <strong>Metropolitan</strong> District.<br />
<strong>Bradford</strong> is the sixth largest city in the UK, by population size, and the fourth largest<br />
<strong>Metropolitan</strong> District in England. Population projections for the District show annual growth in<br />
the population of 4,000 per year to 2028 - making <strong>Bradford</strong> the fastest growing <strong>Metropolitan</strong><br />
District outside London. <strong>Bradford</strong> also has a relatively young population, in 2004, <strong>Bradford</strong><br />
had the lowest average age population of all major urban areas in the North of England at<br />
34.8 years.<br />
<strong>Bradford</strong>’s economic performance has been growing in terms of output (GVA) and number of<br />
jobs, although the rate of improvement has not matched regional or national growth. Future<br />
developments in the District including £2bn of construction work will boost economic<br />
performance, and the District is currently predicted (Source: Experian Regional Econometric<br />
Model) to have the fastest growing economy in the region over the next 10 years.<br />
<strong>Bradford</strong> retains a significant manufacturing sector (the third largest in the UK) but recent job<br />
losses in the face of global competition and economic slump have strengthened the need to<br />
diversify the economic base in <strong>Bradford</strong>.<br />
8
Fig 01: <strong>Bradford</strong> in Regional Context<br />
Today's fastest growing employment sectors are the professional, commercial and service<br />
industries - including tourism. <strong>Bradford</strong>'s reputation as a base for high technology, scientific<br />
and computer based industries is growing, building on long traditions of innovation, skills and<br />
quality products.<br />
Several major companies have head offices based in the District including Wm Morrison plc,<br />
Otto UK (Freemans and Grattan), Hallmark Cards UK, Redcats UK (Empire Direct, La<br />
Redcoute, Vertbaudet and Daxon) and three of the UK’s largest financial institutions -<br />
Yorkshire Building Society, <strong>Bradford</strong> & Bingley Building Society and Provident Financial.<br />
The University of <strong>Bradford</strong> has leading national research departments in management,<br />
peace studies and archaeology, health and medical sectors and has strong links to industry<br />
9
and the community. The University’s School of Management is ranked 8 th<br />
in Europe. In 2006,<br />
the University was ranked 2 nd in the UK for graduate employment.<br />
<strong>Bradford</strong> has a strong cultural offer. Saltaire model village is one of only two World Heritage<br />
Sites in Yorkshire and includes the world’s largest collection of works by the artist David<br />
Hockney. Haworth and Bronte Country attracts visitors from all over the world while the<br />
National Media Museum in the city centre is the most visited museum outside London.<br />
<strong>Bradford</strong> District covers 143 square miles of which around 60% is classified as rural,<br />
stretching over parts of the Airedale and Wharfedale Valleys and the Pennine Hills and<br />
Moors. Despite the districts areas of open countryside, <strong>Bradford</strong>, along with Leeds, has the<br />
highest population density of the West Yorkshire districts at 1290 people/km 2 .<br />
Due to the heterogeneous nature of the geography and population of the district, many<br />
challenges will be posed to both service providers and commissioners of services to ensure<br />
that the needs of residents are both identified and met.<br />
1.3 A Spatial Picture of the District<br />
<strong>Bradford</strong> is a diverse District with sharp contrasts and challenges. This section sets out<br />
under several themes the spatial picture of the District together with key facts as an<br />
indication of where the District is at present.<br />
Structure and Growth<br />
Key facts<br />
Area: 370 km 2<br />
Total Population : 501,700 (ONS 2008 mid year estimate)<br />
Population Growth (ONS 2006 based population projections):<br />
2015 – 555,000 people<br />
2020 – 589,000 people<br />
2030 – 649,000 people<br />
Age group (ONS 2008 based population projections):<br />
Children (0-15): 22.5%<br />
Working age (16-64M/59F) : 61.5%<br />
Older people (65M/60F and over): 16%<br />
Age and Gender (2001 Census):<br />
Male 48.1%<br />
10
Female 51.9%<br />
26% up to age 18<br />
15% aged 65 or over<br />
Ethnic mix (2001 Census):<br />
White 78.3%<br />
Asian or Asian British 18.9%<br />
Mixed 1.5%<br />
Chinese or Other 1.0%<br />
Black or Black British 0.9%<br />
<strong>Bradford</strong> is a major metropolitan authority located within the West Yorkshire conurbation. It is<br />
in a key location within the Leeds City Region and also has good links to the North West and<br />
the Manchester City Region. The District covers an area of approximately 370 km 2 .<br />
However, unlike many other metropolitan areas, it is not one of unrelieved development, but<br />
a mixture of urban and country areas with distinctive and attractive landscapes. The<br />
administrative boundaries and major settlements of the district are shown in the figure below.<br />
Figure: Administrative boundaries and major settlements within West Yorkshire<br />
Around one third of the District is built up and the population is approaching half a million<br />
people. The main urban area of the District is comprised of the City of <strong>Bradford</strong>. Along the<br />
Aire Valley (Airedale) to the north of <strong>Bradford</strong> City are Shipley and several freestanding<br />
towns of Keighley, Bingley and Silsden and the smaller settlement of Steeton with Eastburn.<br />
To the north of Airedale within Wharfedale are the freestanding town of Ilkley and the smaller<br />
settlements of Menston, and Burley In Wharfedale, as well as the village of Addingham. The<br />
11
ural areas include many villages including large ones such as Wilsden, and Oakworth as<br />
well as smaller ones such as Harden, all of which have very limited remains of their original<br />
agricultural or textile functions but predominantly now serve as commuter settlements of the<br />
main employment centres in the District and beyond.<br />
Local Character<br />
Key facts<br />
Built heritage:<br />
1 World Heritage site (Saltaire)<br />
202 Scheduled Ancient Monuments<br />
1 Historic battlefield (Adwalton Moor)<br />
56 Historic parks and gardens<br />
59 Conservation areas<br />
5800 Listed Buildings<br />
The District has a long history with traces of stone age (Rombalds moor), Roman (Ilkley),<br />
Saxon, medieval, Tudor, Georgian and Victorian (Saltaire) heritage. The District possesses a<br />
rich architectural and archaeological heritage, which is highly valued. The District’s industrial<br />
heritage of mills and associated commercial development from the late 18 th and 19 th<br />
Centuries is particularly important and reflects the area’s dominance in the textile trade. This<br />
contributes to the distinctiveness of the District and quality of place. It is also important to the<br />
economy in terms of tourism in particularly in ‘Bronte’ country.<br />
The District’s topography is equally rich and diverse, characterised by dramatic contrasts<br />
from the fringes of the South Pennines in the west to the Wharfe Valley in the north. These<br />
provide a high quality setting for the settlements in the District but also constrain their<br />
development and growth.<br />
The quality of the District’s built and natural heritage is also of major importance to the<br />
economy in attracting and retaining high quality and high value investment.<br />
The District comprises a series of escarpments of plateaux with elevations up to 455m O.D.,<br />
and a general decrease in the height of plateau in the east. The escarpments are dissected<br />
by the Rivers Aire and Wharfe and a number of smaller rivers, including <strong>Bradford</strong> Beck and<br />
the River Worth. The valley sides are commonly very steep, in contrast to the flat nature of<br />
the valley bottoms. The main urban areas and transport routes occur within the valley floor<br />
of the District.<br />
1.4 The Big Plan – our place<br />
The district stretches from the outskirts of Leeds in the east, through <strong>Bradford</strong> city and<br />
onwards through the towns of Shipley, Bingley, Keighley and Ilkley, and close to the<br />
boundaries of the Yorkshire Dales National Park. This results in a diverse mix of<br />
12
environments ranging from inner-city areas, through towns and villages and onto high<br />
Pennine moorland.<br />
We are proud of our built heritage, including the World Heritage site of Saltaire. The<br />
redevelopment of Lister’s Mill has been a catalyst for ambitious regeneration in Manningham.<br />
Four of the district’s parks have coveted green flag status, including the award-winning Lister<br />
Park. Our desire to build on this heritage is reflected in the ambitious plans for ‘Park at the<br />
Heart’ in the city centre, and in our regeneration master-plans.<br />
The district’s range of landscapes is extraordinary - from wide valleys rising steeply through<br />
craggy escarpments up to open moorland; and from vibrant urban centres through densely<br />
populated residential areas, to idyllic rural villages, each with their own character.<br />
Unlike many metropolitan districts, only about a third of our 370 square kilometres is built up.<br />
Much of our moorland and woodland is relatively undisturbed, and provides important<br />
conservation habitats, as well as drawing visitors who want to enjoy our countryside.<br />
Farming is still part of our rural economy, but the average size of farmholdings is only 10-15<br />
hectares, so much farming activity is marginal, often part-time and supported by other<br />
income.<br />
This means that while some of our villages have maintained their original agricultural<br />
functions, such as Oxenhope and Stanbury, many are now largely commuter settlements for<br />
the main employment centres in the district and beyond.<br />
Our geography has also resulted in most of the industrial, economic and residential<br />
development taking place along the valleys and floodplains formed by rivers such as the Aire<br />
and Wharfe. 77% of our population live within the urban areas of <strong>Bradford</strong>, Keighley and<br />
along the Aire valley.<br />
These urban areas are both the district’s best attributes and biggest challenges. The city of<br />
<strong>Bradford</strong> is rich in culture, architecture and attractions –including the National Media<br />
Museum, the Alhambra Theatre and some of the best Asian cuisine in the UK. It is<br />
recognised nationally as a significant cultural economy. But it is also the most densely<br />
populated area of the district: in the inner city, the proportion of households living in terraced<br />
houses is 59%, and there are some 3,000 back-to-back houses.<br />
Sharp contrasts are also clear in neighbourhoods like Manningham. Magnificent buildings<br />
and public spaces such as Cartwright Hall and Lister Park, and elegant crescents and<br />
squares tell of Manningham’s affluent past as a textile centre. However, for many, a vibrant<br />
community can be marred by crime, traffic and congestion, sub-standard housing, and ill<br />
health.<br />
13
Such contrasts are an expression of the fact that, of the 354 local authority areas in England,<br />
the district ranks as the 32nd most deprived, according to the latest measures 1 .<br />
Two-fifths of our population live in some of the most deprived neighbourhoods in the country.<br />
And some of these neighbourhoods are adjacent to much more affluent areas.<br />
Another stark contrast is in the more rural areas, where, unlike most of the district, we score<br />
badly in terms of access to housing and services. People living in parts of Wharfedale, the<br />
Worth Valley, Wyke and Tong face geographical and wider barriers to GP surgeries,<br />
supermarkets, primary schools and post offices, as well as housing.<br />
The map below illustrates the pattern of deprivation (2007) across the district. It clearly<br />
shows that many of the urban areas on the edge of the city centre, which grew when our<br />
manufacturing industries were flourishing, have suffered in the shift to the service and<br />
knowledge based economy.<br />
Figure: <strong>Bradford</strong>’s least and most deprived areas (LSOAs) 2007<br />
The focus of economic activity now is the city of <strong>Bradford</strong>, and the well served corridor<br />
centred on Keighley, Bingley and Shipley. The historic concentrations of employment along<br />
Canal Road, Thornton Road and Bowling Back Lane have been joined by more recent<br />
concentrations close to the M606 and M62 motorways.<br />
We have good transport links with Leeds <strong>Bradford</strong> Airport, and three rail routes provide key<br />
connections across the district, and to neighbouring Leeds, as well as providing a trans-<br />
Pennine link to Manchester via Halifax. Good connections across all types of public transport<br />
will be increasingly important. Trends show that the district is unlikely to create enough jobs<br />
1 Office of National Statistics’ indices of multiple deprivation, 2007. These make an assessment across<br />
income; employment; heath and disability; education; skills and training; access to housing and<br />
services; environment and crime<br />
14
on its own to meet the demands of a growing workforce. Links with neighbouring districts will<br />
be increasingly important to connect people with training and employment. For some, the<br />
urban centres of Leeds will provide these opportunities, but for many of our rural<br />
communities, Craven is more important.<br />
Population trends also mean that we need to be planning for new homes and housing<br />
developments. The Local Development Framework (LDF) is a new system for making sure<br />
our land, buildings, transport links and green spaces are planned to provide us with<br />
maximum wellbeing and to meet people’s needs. The LDF will complement our priorities in<br />
The Big Plan, so that the council takes account of all of the economic development,<br />
transport, and housing activities that will shape our places across the district in the coming<br />
years.<br />
The LDF will help the Council work with its partners to plan for our growing population: to<br />
plan for homes, jobs, healthcare, education, shops and recreation spaces. It will ensure that<br />
planning and land-use strategies make the district a focus in West Yorkshire for sustainable<br />
economic growth, with high quality employment and housing.<br />
1.5 Scope and Purpose of the <strong>Baseline</strong> <strong>Analysis</strong> Report<br />
This report sets out the baseline position for the <strong>Bradford</strong> District, including the key issues<br />
and parameters which will inform the preparation of the <strong>Core</strong> <strong>Strategy</strong> and where appropriate<br />
the other Development Plan Documents of the Local Development Framework (LDF).<br />
Essentially this document comprises a concise and comprehensive analysis of a wide range<br />
of topics relevant to the district’s social, economic and environmental characteristics. The<br />
intention is that all policies and proposals in the <strong>Core</strong> <strong>Strategy</strong> be justified by the relevant<br />
evidence, and so this report includes data which have highlighted the district’s current<br />
position and conclusively identified the issues to be faced in the future.<br />
In accordance with good practice advice by the Planning Advisory Service, including the<br />
online Plan Making Manual, <strong>Bradford</strong> Council considers the gathering of evidence as an<br />
iterative process which must be continued throughout the plan preparation process. The<br />
reason for this is because the evidence base is key to other aspects of plan production<br />
including, Sustainability Appraisal, Options Generation and Community Engagement. The<br />
figure below explains the linkages between these different areas (Source PAS March 2008).<br />
15
Fig 03: Relationship between different elements of plan production<br />
This <strong>Baseline</strong> <strong>Analysis</strong> Report therefore has been deliberately left in ‘Draft’ and will be<br />
supplemented with additional information during the course of the preparation of the <strong>Core</strong><br />
<strong>Strategy</strong>. As part of the ongoing consultation process it would be made publicly available for<br />
statutory consultees and other consultees for comment and review.<br />
The report is arranged by thematic topics (e.g. Housing, Biodiversity, Transport, etc) and<br />
includes data showing performance at national, regional and local levels, illustrated through<br />
tables, charts, maps and diagrams. A significant part of the information contained within the<br />
report derives from the evidence which has informed District’s Sustainable Community<br />
<strong>Strategy</strong> (SCS) document prepared by the <strong>Bradford</strong> Council. It contains information about<br />
general socio-economic and sustainability topics, relevant targets, comparative analysis and<br />
data sources.<br />
Relevant information, specific to the District, has also been collated and analysed from a<br />
variety of sources, including commissioned studies and surveys, District, Regional and<br />
National data and monitoring reports.<br />
In preparing this report, we have not sought to replicate all published and unpublished<br />
documents and data, but to identify and describe key issues and findings that are raised. In<br />
considering the overall ‘Evidence Base’ that informs the emerging CS reference should be<br />
made to the individual documents, strategies and data sources that are identified in each<br />
chapter.<br />
This report will also focus on setting the current infrastructure context in the district, by<br />
achieving a basic knowledge and understanding of the issues relating to the provision of<br />
infrastructure. This will provide the foundation for the strategy, which will set out how the<br />
Council and key partners intend to implement the LDF and deliver the associated<br />
infrastructure requirements.<br />
16
The Local Infrastructure Plan covers physical, social and green infrastructure in <strong>Bradford</strong>, in<br />
order to ensure that it embraces all matters necessary for the achievement of LDF policies,<br />
proposals and aspirations.<br />
1.6 Structure of Report<br />
This report seeks to consider key elements of the ‘Evidence Base’ in a clear and structured<br />
manner, as follows:<br />
• Planning Policy and Regeneration Context – the first two sections contain an<br />
appraisal of the National, Regional, Sub-Regional and Local planning policies which<br />
provide the context within which the CS will be set. The second part of the section<br />
identifies and assesses a range of current and proposed regeneration initiatives<br />
affecting the future development of the district.<br />
• Socio-Economic Appraisal – An appraisal of the social and economic context of<br />
<strong>Bradford</strong> district.<br />
• Housing Assessment – An overview of existing housing tenure and types, summary<br />
of the relevant housing policy documents, urban potential study, housing land<br />
availability assessments and an overview of the housing market.<br />
• Social and Community Facility Audit – An assessment of the key public, private and<br />
community facilities that are currently provided in <strong>Bradford</strong>.<br />
• Landscape Character & Historic Environment – An assessment of the landscape and<br />
the physical form and structure of the district including an Urban Design analysis of<br />
the cityscape and assessment of the historic buildings, streets and spaces.<br />
• Commercial Appraisal – A sectoral overview of the development potential and an<br />
assessment of the delivery issues that this raises.<br />
• Transport and Accessibility– A review of the transportation infrastructure including<br />
highways, parking, facilities for pedestrians and cyclists, public transport as well as<br />
private vehicles.<br />
• Environment– An assessment of the District’s environmental quality and extent of the<br />
issues affecting the delivery of sustainable development.<br />
• Minerals and Waste Management- a review of <strong>Bradford</strong>’s waste and minerals<br />
situation ranging from current capacity and management issues to future requirement<br />
and planning matters .<br />
17
• Sustainability – An Outline of the key sustainability issues that need to be addressed<br />
throughout the development of the CS.<br />
Each section of this report summarises the key issues which are raised from the discussion<br />
of individual topic areas and which will be tested and explored during the next stage of the<br />
<strong>Core</strong> <strong>Strategy</strong>.<br />
18
2.0 PLANNING POLICY CONTEXT<br />
This section summarises the national, regional and local policies that are relevant to <strong>Bradford</strong><br />
district and those that should be considered during the development of the <strong>Core</strong> <strong>Strategy</strong>.<br />
The key planning policy documents at the national, regional, sub regional and district and city<br />
centre level are reviewed below. These comprise Planning Policy Guidance Notes and<br />
Planning Policy Statements at the national level; Regional Spatial <strong>Strategy</strong> at regional level;<br />
Leeds City Regional Development Programme at the sub regional level; and Replacement<br />
Unitary Development and LDF documents at the district level. The key policy implications<br />
arising from these documents for the future of <strong>Bradford</strong> district are considered below.<br />
2.1 National Planning Policy Context<br />
At the top of the planning policy hierarchy are Planning Policy Statements (PPS) which are<br />
published by the Department of Communities and Local Government (DCLG). Planning<br />
Policy Statements will eventually replace Planning Policy Guidance Notes (PPGs). Planning<br />
Policy Statements/Guidance Notes present the government’s views on general issues<br />
relating to planning policy and how Regional government and local planning authorities<br />
should interpret this strategic policy at local level. PPGs and PPSs form material planning<br />
considerations in the decision making process with respect to development plan making and<br />
development management.<br />
The Government’s overall aims for towns and cities are set out in the Urban White Paper and<br />
the Sustainable Communities Plan. These aims are taken forward into the planning system<br />
through a series of Planning Policy Statements and Guidance Notes.<br />
The Urban White Paper and the Sustainable Communities Plan<br />
The Urban White Paper – ‘Our Towns and Cities: The Future – Delivering an Urban<br />
Renaissance’, was published in 2000. It sets out the Government’s vision for urban areas.<br />
The Sustainable Communities Plan – ‘Sustainable Communities: Building for the Future’,<br />
was published in 2003. It builds on the urban white paper and sets out the Government’s<br />
long-term programme of action for urban areas.<br />
In summary, the Government’s vision is for towns and cities to become attractive, successful<br />
places with a good quality environment and a high quality of life. They will be the focus for<br />
housing and economic growth, and new development will be sustainable.<br />
To achieve this each town and city needs to develop a vision for its future and plan how to<br />
achieve it.<br />
19
The Planning Act 2008<br />
The Planning Act 2008 was granted Royal Assent on 26 November 2008. The Act builds on<br />
the proposals set out in the ‘Planning White Paper - Planning for a Sustainable Future’ and<br />
introduces a new system for nationally significant infrastructure planning, alongside further<br />
reforms to the town and country planning system and the introduction of a Community<br />
Infrastructure Levy.<br />
An Infrastructure Planning Commission (IPC) will be established under the Act as the new<br />
authority granting development consent for nationally significant infrastructure projects. The<br />
Act also provides for the Government to produce national policy statements (NPSs) to be<br />
used as the policy framework for the Commission's decisions. It imposes a requirement on<br />
project promoters to consult affected parties and local communities prior to submitting an<br />
application, and sets out a new process for examining applications. The three departments<br />
responsible for drafting the NPSs are: Department for Transport, Department for Energy and<br />
Climate Change and Department for Environment, Food and Rural Affairs.<br />
The Act also makes further reforms to the town and country planning system, including<br />
improving the Local Development Plan system by removing some minor procedures; adding<br />
a duty on councils to take action on climate change in their development plans; and to have<br />
regard to the desirability of achieving good design; streamlining development control<br />
procedures; making changes to the appeals process; and adding transitional powers allowing<br />
regional assemblies to delegate some planning functions to regional planning bodies.<br />
The Act also contains enabling powers to empower local councils to apply a Community<br />
Infrastructure Levy (CIL) on new developments in their areas to support infrastructure<br />
delivery. The CIL will establish a better way to increase investment in the vital infrastructure<br />
that growing communities need. Draft regulations setting out the detail of the CIL regime will<br />
be issued for public consultation in spring 2009. The regulations will not enter into force<br />
before October 2009.<br />
The Housing Green Paper<br />
The Housing Green Paper Homes for the future: more affordable, more sustainable<br />
published in July 2007 sets out proposals for more homes to meet growing demand, to make<br />
housing more affordable, and to create places and homes that people want to live in. The<br />
Green Paper includes proposals for further reforms to the planning system to aid the delivery<br />
of this ambition, including local planning incentives and improving the regional planning<br />
process.<br />
Planning Policy Statements and Guidance Notes<br />
National Planning Policy Guidance promotes high quality and sustainable development.<br />
Sustainable communities require sufficient quality housing to meet the needs of the<br />
community, a flourishing local economy supported by adequate infrastructure, a high quality<br />
20
safe and healthy environment and the amenities and sense of space and place to support a<br />
diverse and vibrant local community.<br />
PPS1: Creating Sustainable Communities (31 st January 2005) sets out Government’s<br />
commitment to the creation of sustainable communities and the delivery of sustainable<br />
development which focuses on:<br />
• The need for planning authorities to take an approach based on integrating the four<br />
aims of sustainable development: economic development; social inclusion;<br />
environmental protection and prudent use of resources;<br />
• The need for positive planning to achieve sustainable development objectives and<br />
proactive management of development;<br />
• The need for plans to set clear visions for communities and to help to integrate the<br />
wide range of activities relating to development and regeneration; and<br />
• The need for the planning system to actively promote participation and involvement.<br />
PPS1 states that planning should facilitate and promote sustainable patterns of development<br />
by:<br />
• Making suitable land available in line with objectives to improve the quality of life;<br />
• Contributing to sustainable economic growth;<br />
• Protecting and where possible enhancing the natural and historic environment and<br />
existing successful communities;<br />
• Ensuring high quality development through good design; and<br />
• Ensuring that development supports existing communities and contributes to the<br />
creation of safe, sustainable and liveable communities with good access to key<br />
services.<br />
PPS1 promotes development that builds socially inclusive communities and the need to<br />
address accessibility to jobs, health, housing, education, shops, leisure and community<br />
facilities.<br />
Planning Policy Statement: Planning & Climate Change – Supplement to PPS1 (17 th<br />
December 2007)<br />
PPS on climate change supplements PPS1 by setting out how planning should contribute to<br />
reducing emissions and stabilising climate change and take into account the unavoidable<br />
consequences. It does not seek to assemble all national planning policy relevant or<br />
applicable to climate change and should be read alongside the national PPS/G series.<br />
Where there is any difference in emphasis on climate change between the policies in this<br />
PPS and others in the national series this is intentional and the PPS on planning 7 climate<br />
change takes precedence.<br />
Tackling climate change is a key Government priority for the planning system. The ambition<br />
and policies in this PPS should therefore be fully reflected by planning authorities in the<br />
preparation of Local Development Documents. All planning authorities should apply the<br />
following principles in making decisions about their spatial strategies:<br />
21
• the proposed provision for new development, its spatial distribution, location and<br />
design should be planned to limit carbon dioxide emissions;<br />
• new development should be planned to make good use of opportunities for<br />
decentralised and renewable or low carbon energy;<br />
• new development should be planned to minimise future vulnerability in a changing<br />
climate;<br />
• climate change considerations should be integrated into all spatial planning concerns;<br />
• mitigation and adaptation should not be considered independently of each other, and<br />
• new development should be planned with both in mind; sustainability appraisal<br />
(incorporating strategic environmental assessment) should be applied to shape<br />
planning strategies and policies that support the Key Planning Objectives; and<br />
• appropriate indicators should be selected for monitoring and reporting on in regional<br />
planning bodies’ and planning authorities’ annual monitoring reports. Such monitoring<br />
should be the basis on which regional planning bodies and planning authorities<br />
periodically review and roll forward their planning strategies.<br />
Paragraph 18 states that planning authorities should consider the opportunities for the <strong>Core</strong><br />
<strong>Strategy</strong> to add to the policies and proposals in the RSS, such as where local circumstances<br />
would allow further progress to be made to achieving the Key Planning Objectives set out in<br />
this PPS. In doing so, the core strategy should be informed by, and in turn inform, local<br />
strategies on climate change including the sustainable community strategy<br />
PPG2: Green Belts (24 th January 1995) outlines the history and extent of Green Belts and<br />
explains their purposes. It describes how Green Belts are designated and their land<br />
safeguarded. Green Belt land-use objectives are outlined and the presumption against<br />
inappropriate development is set out.<br />
Paragraph 1.4 states that the fundamental aim of Green Belt policy is to prevent urban<br />
sprawl by keeping land permanently open; the most important attribute of Green Belts is their<br />
openness. Green Belts can shape patterns of urban development at sub-regional and<br />
regional scale, and help to ensure that development occurs in locations allocated in<br />
development plans. They help to protect the countryside, be it in agricultural, forestry or other<br />
use. They can assist in moving towards more sustainable patterns of urban development<br />
PPS3: Housing (29 th November 2006) sets out the national planning policy framework for<br />
delivering the governments housing objectives. Priorities include high quality; well-designed<br />
housing offering a mix of affordable and market units and mix of tenures for all communities<br />
including rural areas. Housing should be located in suitable locations and on previously<br />
developed land<br />
22
Paragraph 9 provides the strategic housing objectives and states that the Government’s key<br />
housing policy goal is to ensure that everyone has the opportunity of living in a decent home,<br />
which they can afford, in a community where they want to live. To achieve this, the<br />
Government is seeking:<br />
• To achieve a wide choice of high quality homes, both affordable and market housing,<br />
to address the requirements of the community.<br />
• To widen opportunities for home ownership and ensure high quality housing for those<br />
who cannot afford market housing, in particular those who are vulnerable or in need.<br />
• To improve affordability across the housing market, including by increasing the supply<br />
of housing.<br />
• To create sustainable, inclusive, mixed communities in all areas, both urban and<br />
rural.<br />
These housing policy objectives provide the context for planning for housing through<br />
development plans and planning decisions. The specific outcomes that the planning system<br />
should deliver are:<br />
• High quality housing that is well-designed and built to a high standard.<br />
• A mix of housing, both market and affordable, particularly in terms of tenure and<br />
price, to support a wide variety of households in all areas, both urban and rural.<br />
• A sufficient quantity of housing taking into account need and demand and seeking to<br />
improve choice.<br />
• Housing developments in suitable locations, which offer a good range of community<br />
facilities and with good access to jobs, key services and infrastructure.<br />
• A flexible, responsive supply of land – managed in a way that makes efficient and<br />
effective use of land, including re-use of previously-developed land, where<br />
appropriate.<br />
PPS 4: Planning for Sustainable Economic Growth (29 December 2009) provides the<br />
national planning framework for economic development and sets out how planning bodies<br />
should, in the wider context of delivering sustainable development, positively plan for<br />
sustainable economic growth and respond to the challenges of the global economy, in their<br />
plan policies and planning decisions.<br />
The PPS4 combines town centre and economic development policy into a single streamlined<br />
statement that supports sustainable economic growth, protects local markets and small<br />
23
shops and will help councils make the decisions to help speed up economic recovery in their<br />
towns and rural communities.<br />
It replaces Planning Policy Guidance 4: Industrial, Commercial Development and Small<br />
Firms (PPG4) and Planning Policy Guidance 5: Simplified Planning Zones (PPG5) both<br />
published on 10 November 1992; Planning Policy Statement 6: Planning for Town Centres<br />
(PPS6) published on 21 March 2005; and the economic development sections of Planning<br />
Policy Statement 7: Sustainable Development in Rural Areas (PPS7) published on 3 August<br />
2004.<br />
The government recognises that the UK planning system is a key lever which can contribute<br />
towards greater productivity and economic performance. This PPS sets out how the<br />
government expects planning bodies to develop a robust evidence base to underpin their<br />
decisions and to ensure that they have a flexible and responsive approach to providing for<br />
the needs of business not simply by identifying a supply of land, but by making better use of<br />
market information to inform their plans and decision-making.<br />
The Government’s overarching objective to achieve prosperous economies is sustainable<br />
economic growth. To help achieve sustainable economic growth, the Government’s<br />
objectives for planning are to:<br />
1. build prosperous communities by improving the economic performance of cities,<br />
towns, regions, sub-regions and local areas, both urban and rural<br />
2. reduce the gap in economic growth rates between regions, promoting regeneration<br />
and tackling deprivation<br />
3. deliver more sustainable patterns of development, reduce the need to travel,<br />
especially by car and respond to climate change<br />
4. promote the vitality and viability of town and other centres as important places for<br />
communities. To do this, the Government wants:<br />
• new economic growth and development of main town centre uses to be<br />
focused in existing centres, with the aim of offering a wide range of services to<br />
communities in an attractive and safe environment and remedying deficiencies<br />
in provision in areas with poor access to facilities<br />
• competition between retailers and enhanced consumer choice through the<br />
provision of innovative and efficient shopping, leisure, tourism and local<br />
services in town centres, which allow genuine choice to meet the needs of the<br />
entire community (particularly socially excluded groups)<br />
• the historic, archaeological and architectural heritage of centres to be<br />
conserved and, where appropriate, enhanced to provide a sense of place and<br />
a focus for the community and for civic activity<br />
5. raise the quality of life and the environment in rural areas by promoting thriving,<br />
inclusive and locally distinctive rural communities whilst continuing to protect the<br />
open countryside for the benefit of all<br />
24
The PPS mainly applies to development within the B Use Classes, public and community<br />
uses and main town centre uses. The policies also apply to other development which<br />
achieves at least one of the following objectives:<br />
• provides employment opportunities<br />
• generates wealth or<br />
• produces or generates an economic output or product<br />
The main uses to which the town centre policies in this PPS apply are:<br />
• retail development (including warehouse clubs and factory outlet centres)<br />
• leisure, entertainment facilities, and the more intensive sport and recreation<br />
uses (including cinemas, restaurants, drive-through restaurants, bars and<br />
pubs, night-clubs, casinos, health and fitness centres, indoor bowling centres,<br />
and bingo halls)<br />
• offices, and<br />
• arts, culture and tourism development (including theatres, museums, galleries<br />
and concert halls, hotels and conference facilities)<br />
Housing is not identified as a main town centre use however, is identified as an important<br />
element in most mixed-use, multi-storey developments.<br />
PPS7: Sustainable Development in Rural Areas (3 rd August 2004) sets out the<br />
Government's planning policies for rural areas, including country towns and villages and the<br />
wider, largely undeveloped countryside up to the fringes of larger urban areas.<br />
The principles of sustainable development are at the heart of this PPS7 and it ensures that<br />
decisions on development proposals are based on an integrated approach that considers-<br />
– social inclusion, recognising the needs of everyone;<br />
– effective protection and enhancement of the environment;<br />
– prudent use of natural resources; and<br />
– maintaining high and stable levels of economic growth and employment.<br />
It puts particular emphasis on ensuring good-quality design and enhancing the character of<br />
rural settlements. Protection of countryside, Nationally Designated Areas and Local<br />
Landscape Designations is also given greater priority to ensure that they are not affected by<br />
any potentially damaging developments and the vitality of the rural areas therefore is not<br />
compromised.<br />
Development of agricultural land and firm diversifications are the other key issues covered by<br />
the PPS7.<br />
The economic development sections of PPS7 have been replaced by PPS4: Planning for<br />
Sustainable Economic Growth published on 29 December 2009.<br />
25
PPG8: Telecommunications (23 rd August 2001) gives guidance on planning for<br />
telecommunications development - including radio masts and towers, antennas of all kinds,<br />
radio equipment housing, public call boxes, cabinets, poles and overhead wires.<br />
PPS9: Biodiversity and Geological Conservation (16 th August 2005) sets out national<br />
planning policies on the protection of biodiversity and geological conservation.<br />
Paragraphs 4 and 5 states that local authorities should take an integrated approach to<br />
planning for biodiversity and geodiversity when preparing local development documents.<br />
They should ensure that policies in local development documents reflect, and are consistent<br />
with, national, regional and local biodiversity priorities and objectives (including those agreed<br />
by local biodiversity partnerships).<br />
Local development frameworks should:<br />
• indicate the location of designated sites of importance for biodiversity and<br />
geodiversity, making clear distinctions between the hierarchy of international,<br />
national, regional and locally designated sites; and<br />
• identify any areas or sites for the restoration or creation of new priority habitats which<br />
contribute to regional targets, and support this restoration or creation through<br />
appropriate policies.<br />
PPS10: Planning for Sustainable Waste Management (21 st July 2005) sets out the<br />
Government's policy to be taken into account by waste planning authorities and forms part of<br />
the national waste management plan for the UK.<br />
Paragraph 3 states that all planning authorities must help deliver sustainable development<br />
through driving waste management up the waste hierarchy, addressing waste as a resource<br />
and looking to disposal as the last option, but one which must be adequately catered for;<br />
• provide a framework in which communities take more responsibility for their own<br />
waste, and enable sufficient and timely provision of waste management facilities to<br />
meet the needs of their communities;<br />
• help implement the national waste strategy, and supporting targets, are consistent<br />
with obligations required under European legislation and support and complement<br />
other guidance and legal controls such as those set out in the Waste Management<br />
Licensing Regulations 1994;<br />
• help secure the recovery or disposal of waste without endangering human health and<br />
without harming the environment, and enable waste to be disposed of in one of the<br />
nearest appropriate installations;<br />
• reflect the concerns and interests of communities, the needs of waste collection<br />
authorities, waste disposal authorities and business, and encourage competitiveness;<br />
26
• protect green belts but recognise the particular locational needs of some types of<br />
waste management facilities when defining detailed green belt boundaries and, in<br />
determining planning applications, that these locational needs, together with the wider<br />
environmental and economic benefits of sustainable waste management, are material<br />
considerations that should be given significant weight in determining whether<br />
proposals should be given planning permission;<br />
• ensure the design and layout of new development supports sustainable waste<br />
management.<br />
PPS12: Local Spatial Planning (4 th June 2008) sets out the government’s policies on<br />
different aspects of spatial planning, including the policy for the preparation and content of<br />
Area Action Plans. It reflects the lessons learned from the first three years of operation of the<br />
new planning system in England brought in by the Planning and Compulsory Purchase Act<br />
2004.<br />
PPS 12 explains what local spatial planning is, and how it benefits communities. It also sets<br />
out what the key ingredients of local spatial plans are and the key government policies on<br />
how they should be prepared. It should be taken into account by local planning authorities in<br />
preparing development plan documents and other local development documents.<br />
PPG13: Transport (20 th April 2001) outlines the government’s aim of achieving reduced car<br />
dependency via transport and planning policies that are integrated at the national, strategic<br />
and local level. The Guidance places an emphasis on putting people before traffic, indicating<br />
that new development “should help to create places that connect with each other sustainably,<br />
providing the right conditions to encourage walking, cycling and the use of public transport.”<br />
When assessing planning applications, PPG 13 requires local authorities to intensify housing<br />
and other uses at locations which are highly accessible by public transport, walking and<br />
cycling. The Guidance goes on to say that: “Local planning authorities in assessing the<br />
suitability of sites for housing development should, amongst other things, consider their<br />
location and accessibility to jobs, shops and services by modes other than the car, and the<br />
potential for improving such accessibility” (paragraph 14).<br />
PPG15: Planning and the Historic Environment (14 th September 1994) provides a full<br />
statement of Government policies for the identification and protection of historic buildings,<br />
conservation areas and other elements of the historic environment. It explains the role played<br />
by the planning system in their protection. PPG15 emphasises the need for effective<br />
protection of the historic environment whose presence adds to quality of life themes by<br />
sustaining the sense of local distinctiveness which is an important aspect of our towns.<br />
PPG16: Archaeology and Planning (21 st November 1990) sets out the Secretary of State's<br />
policy on archaeological remains on land, and how they should be preserved or recorded<br />
both in an urban setting and in the countryside.<br />
27
Draft PPS15: Planning for the Historic Environment (Consultation draft- 24July 2009)<br />
will update planning policy affecting archaeology, historic areas, buildings and landscapes.<br />
Once finalised, it will replace the current Planning Policy Guidance notes PPG 15 and 16.<br />
PPS 15 is much briefer and less discursive than PPGs 15 and 16 but all policy covered by<br />
those documents is either covered in the PPS or falls within Government's plans for new<br />
policy documents. The key principle at the heart of the PPS is no different from PPGs15 and<br />
16. It maintains the same level of protection to the historic environment as the current PPGs<br />
15 and 16 but expresses the policy much more succinctly.<br />
PPS 15 ensures there is a focus on understanding what is significant about a building, site<br />
or landscape and from that it becomes easier to determine the impact of the proposed<br />
change. It uses the 'values' approach of English Heritage's adopted Conservation Principles<br />
as an underlying philosophy to inform decision-making. It also puts more emphasis on the<br />
benefits of pre-application discussion as a way of collaboratively resolving consent issues at<br />
the earliest stage of the planning process.<br />
The PPS 15 provides greater clarity on key topics e.g. archaeological interest, conservation<br />
areas and their preservation and enhancement, World Heritage Sites, conflicts with other<br />
planning priorities and recording, and also encourages best practice within local authorities.<br />
For example, local authorities will be urged to create publicly-accessible Historic<br />
Environment Records.<br />
PPG17: Planning for Open Space, Sport and Recreation (24 th July 2002) seeks to protect<br />
and where possible enhance open space and recreation facilities and promotes the creation<br />
of high quality open spaces which are accessible and well-suited to the needs of the<br />
communities they serve.<br />
PPS22: Renewable Energy (10 th August 2004) states that local planning authorities should<br />
recognise the full range of renewable energy sources, their differing characteristics,<br />
locational requirements and the potential for exploiting them subject to appropriate<br />
environmental safeguards. Consideration should be given to the opportunity for incorporating<br />
renewable energy projects in all new developments.<br />
PPS23: Planning and Pollution Control (3 rd November 2004) advises that any<br />
consideration of the quality of land, air or water and potential impacts arising from<br />
development possibly leading to impacts on health is capable of being a material planning<br />
consideration in so far as it arises or may arise form or may affect any land use. The<br />
planning system plays a key role in determining the location of development which may give<br />
rise to pollution either directly or indirectly and in ensuring that other uses and developments<br />
are not affected by potential sources of pollution. The statement reiterates that the<br />
Government believes that planning should become a more strategic, proactive force for<br />
economic, social and environmental well-being and attaches great importance to controlling<br />
and minimising pollution.<br />
28
PPS25: Development and Flood Risk (7 th December 2006) sets out Government policy on<br />
development and flood risk. It's aims are to ensure that flood risk is taken into account at all<br />
stages in the planning process to avoid inappropriate development in areas at risk of<br />
flooding, and to direct development away from areas of highest risk. Where new<br />
development is, exceptionally, necessary in such areas, policy aims to make it safe, without<br />
increasing flood risk elsewhere, and, where possible, reducing flood risk overall.<br />
Good Practice Guide on Planning for Tourism (16 th May 2006), which should be read<br />
alongside national planning policies, is designed to ensure that planners understand the<br />
importance of tourism and take this fully into account when preparing development plans and<br />
taking planning decisions and ensure that planners and the tourism industry work together<br />
effectively to facilitate, promote and deliver new tourism development in a sustainable way.<br />
By Design: Urban Design in the Planning System - Towards Better Practice (15 th May<br />
2000) is intended as a companion to Planning Policy Guidance (PPGs) [and subsequent<br />
Planning Policy Statements (PPSs)] and aims to encourage better design and to stimulate<br />
thinking about urban design. The guide is relevant to all aspects of the built environment,<br />
from the design of buildings and spaces, landscapes, to transport systems; and for planning<br />
and development at every scale, from streets and their neighbourhoods, villages and cities,<br />
to regional planning strategies.<br />
2.2 Regional Context<br />
The regional and sub-regional policy context is set out in –<br />
• The Northern Way <strong>Strategy</strong> for the North of England<br />
• The Yorkshire & Humber Plan - Regional Spatial <strong>Strategy</strong> for Yorkshire and the Humber<br />
• The Regional Economic <strong>Strategy</strong> for Yorkshire and the Humber<br />
• The Regional Housing strategy for Yorkshire and the Humber<br />
• The West Yorkshire Local Transport Plan<br />
• Leeds City Region Development Programme<br />
Moving Forward: Northern Way Growth <strong>Strategy</strong> (September 2004)<br />
In order to promote economic growth in the regions the Government has set up Regional<br />
Development Agencies (RDAs). The RDA for this region is Yorkshire Forward.<br />
Yorkshire Forward, together with the RDAs for the North-West and the North-East, have<br />
published ‘Moving Forward: The Northern Way’, in September 2004.<br />
The Northern Way is a unique initiative, bringing together the cities and regions of the North<br />
of England to work together to improve the sustainable economic development of the North<br />
towards the level of more prosperous regions.<br />
29
Formed as a partnership between the three northern Regional Development Agencies<br />
(Yorkshire Forward, Northwest Regional Development Agency and One NorthEast), we also<br />
work with local authorities, universities, the private sector and other partners to secure a<br />
strong coalition in support of this goal. The Northern Way Initiative aims to influence policy<br />
and delivery at a local, city region, regional and national level, to join up thinking and<br />
encourage collaboration.<br />
The Northern Way sets out a strategy for how the North of England can bridge the economic<br />
gap with the rest of the UK. It identifies 8 city regions on which to concentrate economic<br />
growth. <strong>Bradford</strong> is identified within the Leeds City Region.<br />
The Leeds and Manchester city regions are highlighted as the most significant in terms of<br />
driving growth in the north.<br />
Figure : <strong>Bradford</strong> and the Northern way<br />
30
The Yorkshire and Humber Plan – Regional Spatial <strong>Strategy</strong> (RSS), May 2008<br />
This document provides the spatial strategy to guide the preparation of local authority<br />
development plans and local transport plans so that they can deliver a coherent framework<br />
for regional development.<br />
The RSS aims to guide development over the next 15 to 20 years. It influences the future<br />
direction of the economy, housing, transport, the built and natural environment. It provides a<br />
long term strategy for the region to help it become more competitive and sustainable patterns<br />
and forms of development, investment, and activity.<br />
The RSS recognises that main city, town and village centres throughout the region are<br />
critical in providing business services and performing a role as centres for social, cultural and<br />
political life. <strong>Bradford</strong> sits within the Leeds City Region sub area. The RSS identifies <strong>Bradford</strong><br />
as a Regional City within the regional settlement network with Keighley and Ilkley as principal<br />
towns.<br />
Regional cities are to be the prime focus for housing, employment, shoping, leisure,<br />
education, health and cultural activities in the region. These regional cities will be<br />
transformed into attractive places where people want to live, work, invest and spend time in.<br />
Whereas Principal Towns should be the focus of housing, employment, shopping, leisure,<br />
education and health and cultural activities.<br />
Policy YH1 deals with the location of new development, the policy seeks that first priority<br />
should be for the re-uses of previously developed land and buildings within developed areas<br />
within city and towns. The second priority is towards other suitable infill opportunities within<br />
city and towns. The third priority relates to extensions to city and towns.<br />
Policy LCR1 deals the Leeds City Region. It aims to transform <strong>Bradford</strong> as a regional city<br />
through significant growth in economic development, jobs and homes through the<br />
renaissance of the city and the development and regeneration elsewhere. <strong>Bradford</strong> is<br />
identified by the RSS as a major engine to the economic development of the regional<br />
economy. The policy also seeks to prmote strategic development in the Airedale areas<br />
increasing development in Keighley (and Skipton).<br />
Policy LCR2 deals with significant investment in the Leeds City Regional and seeks to<br />
support the renaissance of <strong>Bradford</strong> City Centre.<br />
Chapter 11 of the RSS deals with creating a success and competitive regional economy. The<br />
RSS recognises the regional cites as a key driver of productivity to securing competitive<br />
advantage. Policy E1 (i) recognises retail and leisure development as key economic and<br />
employment generators. Policy E2 deals with town centres. The policy seeks to strengthen<br />
the role and performance of existing city and town centre through strategies and investment<br />
decisions. <strong>Bradford</strong> as a regional city should be the focus for office, retail, leisure,<br />
entertainment, arts, culture, and tourism. Policy E2B seeks that other measures including<br />
environmental enhancement, accessibility improvement and town centre management and<br />
31
promotion can also improve the vibrance of existing centres. Policy E2C restricts new, or<br />
large scale expansion of existing, out-of-centre regional or sub-regional shopping centres.<br />
Fig 05: <strong>Bradford</strong> and the RSS<br />
Policy E3 of the RSS deals with land and premises for economic development. The RSS<br />
seeks to ensure that previously development land should be available to provide sufficient<br />
land and premises in sustainable location to meet the modern economies requirements. The<br />
32
need for additional office, retail and leisure floorspace is to be focused in existing city and<br />
town centres.<br />
Policy E5B deals with promoting tourism in City Centres such as <strong>Bradford</strong>, the RSS seeks to<br />
realise the potential of heritage, leisure and cultural assets by promoting their roles as<br />
modern, varied and destinations.<br />
The adopted Yorkshire and Humber Plan can be viewed in full at:-<br />
http://www.gos.gov.uk/goyh/plan/regplan/<br />
The Regional Economic <strong>Strategy</strong> (RES) 2006-2015<br />
The Regional Economic <strong>Strategy</strong> (RES) 2006-2015 provides the 10 year blueprint for<br />
economic development in Yorkshire and the Humber.<br />
It provides a framework of common priorities around which businesses, public agencies,<br />
voluntary groups and communities can focus their investment and effort. The strategy is<br />
owned, and can only be delivered, by the whole region.<br />
The <strong>Strategy</strong>'s six objectives are:<br />
1. More Businesses that last – because higher levels of enterprise are so important<br />
2. Competitive Businesses – making indigenous businesses more productive because they<br />
innovate and invest<br />
3. Skilled People benefiting business – with talents that employers value and which offer due<br />
reward<br />
4. Connecting People to good jobs – because levels of employment make a big difference to<br />
people and the economy, and we need more people in jobs in deprived areas.<br />
5. Transport, Infrastructure and Environment – a strong economy needs good sustainable<br />
transport connections and to make the best of the environment and infrastructure<br />
6. Stronger Cities, Towns and Rural Communities – to ensure they are attractive places to<br />
live, work and invest<br />
Further information can be found on the Yorkshire Forward website<br />
http://www.yorkshire-forward.com/www/view.asp?content_id=106&parent_id=17<br />
Regional Housing <strong>Strategy</strong> 2005- 2021<br />
The Regional Housing Board is responsible for producing a Regional Housing <strong>Strategy</strong> as<br />
the basis of advice to ministers on strategic housing priorities in the region. The Regional<br />
Housing <strong>Strategy</strong> sits within the context of the region's strategic framework, Advancing<br />
33
Together, and is consistent with other key strategies, such as the Regional Economic<br />
<strong>Strategy</strong>, the Regional Spatial <strong>Strategy</strong> and the Northern Way Growth <strong>Strategy</strong>. Regional<br />
Housing Strategies must also align with national priorities and strategies and Ministerial<br />
requirements.<br />
The Regional Housing <strong>Strategy</strong> has 3 main purposes:-<br />
• To influence regional, sub-regional and local strategies across a range of housing<br />
priorities such as delivery of affordable housing, energy efficiency, fuel poverty,<br />
sustainable design and construction, and fair access to housing policies.<br />
• To set out regional housing priorities to steer the use of the accompanying regional<br />
investment strategy and its single housing pot<br />
• To steer wider investment towards integrated housing, economic and social activity<br />
Further information can be found on the Yorkshire and Humber Assembly website<br />
http://www.yhassembly.gov.uk/index.cfm<br />
2.3 Sub-Regional Context<br />
Leeds City Region<br />
Leeds City Region comprises the 10 local authority districts of Barnsley, <strong>Bradford</strong>,<br />
Calderdale, Craven, Harrogate, Kirklees, Leeds, Selby, Wakefield, and York, which reflects<br />
the true area of how the economy of Leeds and the other cities, towns and rural areas in the<br />
city region functions; for example, 95% of people who live in the city region also work in the<br />
city region.<br />
A City Region Partnership comprising the councils of each of the 10 districts, plus North<br />
Yorkshire County Council (which has strategic responsibilities in three of the districts), was<br />
set up in 2004, and since then have been working together to look at how policy and delivery<br />
at this broad area level can be changed to improve economic growth and competitiveness.<br />
On the 1st April 2007 the Partnership became the City Region Leaders' Board, which is<br />
constituted as a Joint Committee. The Board comprises of the Leaders of each of the eleven<br />
constituent authorities, and has the remit of 'Promoting the economic wellbeing of the Leeds<br />
City Region.' The Board will provide the political accountability and 'voice' of the City Region.<br />
The City Region Development Programme (CRDP) November 2006 has been prepared and<br />
agreed by the 11 councils and is essentially the economic plan for the city region, focussed<br />
on areas where we can add value and deliver our Vision for the city region which is to<br />
'Develop an internationally recognised city region; to raise our economic performance; to<br />
spread prosperity across the whole of our city region, and to promote a better quality of life<br />
for all of those who live and work here.' This second iteration of the CRDP builds on a 2005<br />
34
document, but provides a more robust and evidence-based programme for prioritising policy<br />
and programmes that will accelerate economic growth in the Leeds City Region.<br />
Figure: <strong>Bradford</strong> in the Leeds City Region<br />
The CRDP puts forward a growth scenario to achieve 4% per annum growth in GVA per<br />
capita across the city region over the coming ten years. This growth rate would be sufficient<br />
to close the productivity gap with the England average over the same time period and<br />
contribute to the Northern Way's aim to close the £30 billion gap in the North. This would<br />
create around 150,000 net new jobs and result in a £21.5 billion increase in GVA across the<br />
city region over the ten year period.<br />
The financial and business services sector is identified as the key industry that will drive the<br />
city region's economic growth and competitiveness over the next 10 years. Future economic<br />
growth will not be driven solely by the City of Leeds and therefore a key element of the<br />
CRDP is to ensure that the city region has a 21st Century transport infrastructure that<br />
supports stronger links around the city region, particularly between growth locations and to<br />
rural hinterlands.<br />
Realising a stronger and more competitive economy that will benefit all areas within the city<br />
region will require co-ordinated and complementary action from all partners and stakeholders<br />
within the city region as well as the support of Government in helping address barriers to<br />
growth. Only then can the full economic potential of the Leeds City Region be realised and<br />
the benefits felt throughout.<br />
Priorities and Objectives of the Leeds City Region are to:-<br />
• Improve city regional, inter-region and international connectivity<br />
35
• Encourage a culture of innovation in both individuals and businesses in enterprise,<br />
science and greater knowledge transfer<br />
• Encourage and support the development of higher and more relevant skills in the<br />
workforce<br />
• Accelerate the development of a world-class infrastructure within which all<br />
businesses innovate and can thrive<br />
• Enhance and promote the City Region as a place to live and work<br />
Local Transport Plan (LTP)<br />
The West Yorkshire Local Transport Plan 2, (LTP2), was published in 2006. It covers the<br />
period 2006-2011 and is prepared jointly by the five West Yorkshire metropolitan authorities.<br />
It sets out the funding priorities for local transport schemes in the county. Priorities include<br />
the <strong>Bradford</strong> City Centre and West <strong>Bradford</strong> Integrated Transport Scheme, the Airedale<br />
Integrates Transport Scheme and <strong>Bradford</strong> Minitram. Improvements to the bus and rail<br />
connections within the Interchange are also a possibility.<br />
Further details can be found at http://www.wyltp.com<br />
2.4 Local Planning Context<br />
<strong>Bradford</strong> Replacement Unitary Development Plan<br />
The Replacement Unitary Development Plan adopted in October 2005 is the statutory<br />
development plan for <strong>Bradford</strong> District. On 30 th September 2008, the Council received the<br />
Secretary of States Direction (under paragraph 1(3) of schedule 8 to the Planning &<br />
Compulsory Purchase Act 2004) and Schedule of Saved policies.<br />
The RUDP is composed of the Policy Framework which includes includes Part One of the<br />
Plan, which consists of a written statement of the Council’s principal policies for the<br />
development and other use of land in the District. This strategy looks forward to 2020 and<br />
provides the context for the detailed policies and proposals in Part Two.<br />
Part Two, is in general conformity with Part One, and contains detailed policies and<br />
proposals for the development and other use of land, including the policies which will form<br />
the basis for deciding planning applications. These policies and proposals have been<br />
formulated to address the District’s needs in the period up to 2014 a period of some ten<br />
years from the anticipated adoption stage as advised in PPG12. It also contains reasoned<br />
justification for the policies and proposals in the Plan, indicating how national and regional<br />
policy, and social, economic, environmental, financial and other relevant considerations have<br />
been taken into account.<br />
36
In addition there are five Proposals Reports and Maps showing the location of site specific<br />
proposals contained in the Plan and identifying where area specific policies apply. Each<br />
Proposals Report and Map relates to one of the five Parliamentary Constituencies in the<br />
District. (<strong>Bradford</strong> North, West and South, Shipley and Keighley). There are also detailed<br />
inset plans for the <strong>Bradford</strong> City Centre and the town centres of Keighley, Shipley, Bingley<br />
and Ilkley and 2 District wide maps one illustrating the development strategy and a second<br />
providing information relating to Flood Risk, Landscape Character and Wildlife Corridors<br />
The aim of the Plan is to:<br />
Devise a Plan which will promote a more sustainable district<br />
The objectives are as follows.<br />
• To maximise the potential for the built up areas to meet the development needs of the<br />
District.<br />
• To promote the conservation and improvement of the built and natural environment.<br />
• Improve the quality of the built environment through a high standard of design in<br />
buildings, streets, public spaces and neighbourhoods, which respects local<br />
distinctiveness.<br />
• To ensure the provision of adequate housing and community facilities to meet the<br />
districts needs.<br />
• To help promote economic success. To provide a location strategy for<br />
accommodating development and ensuring environmental protection in a way which<br />
promotes access to services and minimises dependence on the private car.<br />
• To manage the use of the District’s natural and renewable resources including energy<br />
efficiently and with care.<br />
• To help ensure pollution and waste are minimised and managed efficiently.<br />
The RUDP promotes the following settlement hierarchy:-<br />
• First priority to locating development within the Main Urban Area of <strong>Bradford</strong> / Shipley<br />
/ Baildon;<br />
• Second priority is to meet development needs through the reuse of suitable<br />
previously developed land and buildings within the urban areas of Keighley, Ilkley,<br />
Bingley and Queensbury;<br />
37
• Next is extensions to the above urban areas which provide integration of uses such<br />
as transport, housing and industry, starting with the Main Urban Area;<br />
• Then locating development at Menston, Burley, Steeton and Thornton which are<br />
considered to be nodes in good quality public transport corridors<br />
• Finally development to meet local needs in the less well located smaller settlements,<br />
which are predominantly in the rural parts of the District.<br />
For local housing provision the rUDP describes a sequential approach to identifying sites that<br />
is in line with the relevant policies of the RSS. In the context of <strong>Bradford</strong> this sequence is set<br />
out in the table below:<br />
Source: <strong>Bradford</strong> rUDP (2005)<br />
With regard to the Hierarchy of Retail Centres, <strong>Bradford</strong> City Centre is at the top of the<br />
hierarchy as a city centre followed by Keighley, Ilkley, Shipley and Bingley as Town Centres,<br />
and then by District and Local Centres.<br />
38
The Replacement UDP can be viewed in full on the Council’s website at:<br />
http://www.bradford.gov.uk/planning<br />
Emerging Local Development Framework<br />
The Planning and Compulsory Purchase Act reformed the English planning system in<br />
September 2004. Unitary Development Plans (UDPs) and Supplementary Planning<br />
Guidance (SPGs) will be replaced by a range of documents that will form the <strong>Bradford</strong><br />
District Local Development Framework (LDF).<br />
The current Replacement Unitary Development Plan adopted in October 2005 is the<br />
statutory development plan for <strong>Bradford</strong> District. On 30 th September 2008, the Council<br />
received the Secretary of States Direction (under paragraph 1(3) of schedule 8 to the<br />
Planning & Compulsory Purchase Act 2004) and Schedule of Saved policies.<br />
The LDF is made up of different types of planning document known as Local Development<br />
Documents (LDDs) which include:- Development Plan Documents (DPDs) and<br />
Supplementary Planning Documents (SPDs), and will set out the guidelines for spatial<br />
development in the <strong>Bradford</strong> District in conformity with the Regional Spatial <strong>Strategy</strong>. The<br />
LDF must also seek to implement the spatial aspects of the Community <strong>Strategy</strong> prepared by<br />
<strong>Bradford</strong> Vision.<br />
The timetable for producing the documents is<br />
set out in the Local Development Scheme<br />
(LDS), which sets out the details for producing,<br />
monitoring and reviewing Local Development<br />
Documents.<br />
The Statement of Community Involvement<br />
(SCI) sets out how the Council will involve the<br />
local community and stakeholders in the<br />
preparation and review of Local Development<br />
Documents.<br />
All of the documents mentioned in the diagram<br />
must take into account a number of important<br />
and overarching issues. These include the<br />
environment, sustainability, equality and the<br />
needs and aspirations of the local community.<br />
An integral part of preparing the Local<br />
Development Framework is the Sustainability<br />
Appraisal (SA) process. The aim of the process<br />
is to assess the overall environmental,<br />
Figure: Structure of the LDF<br />
39
economic and social impact of the objectives and policies of the plans produced. The<br />
Appraisal should ensure that the <strong>Core</strong> <strong>Strategy</strong>, and in time other parts of the Local<br />
Development Framework, contribute towards achieving sustainable development.<br />
The Council also produces an Annual Monitoring Report (AMR) to monitor the progress<br />
made on preparing the LDDs.<br />
The following illustrates relationship between the different DPDs and SPDs that are in the<br />
process of being produced by the Council.<br />
Figure: Key LDDs in the <strong>Bradford</strong> LDF<br />
The <strong>Core</strong> <strong>Strategy</strong> is one of the key documents that forms part of the emerging Local<br />
Development Framework for <strong>Bradford</strong>. It will:<br />
• Set out the broad aims and objectives for sustainable development in the District for<br />
the next 15-20 years until 2026;<br />
• Set out broad policies for steering and shaping development within the district;<br />
• Set out the broad locations for new housing, employment and infrastructure<br />
investment; and<br />
• Take account of national and regional policy and the Council’s aims as set out in the<br />
Sustainable Community <strong>Strategy</strong> - ‘The Big Plan’.<br />
• The <strong>Core</strong> <strong>Strategy</strong> will not allocate specific sites for new housing and employment<br />
development.<br />
The final <strong>Core</strong> <strong>Strategy</strong> will set out what is to be done, where and by whom to achieve the<br />
over arching vision and objectives of the plan. There are a number of stages within the Plan<br />
production which seek to identify the broad issues faced by the district and the options to<br />
address these.<br />
40
The first stage in the preparation of the <strong>Core</strong> <strong>Strategy</strong> was to consult and discuss with the<br />
public and stakeholders the issues which the core strategy must address and the options for<br />
responding to them. To kick off these discussions the Council produced a series of 8 topic<br />
papers, which provided the background to the key issues and proposed a number of options<br />
for tackling the issues, and consulted on these documents between February and July 2007.<br />
The Council has recently consulted on a revised Spatial Vision and Objectives document<br />
which looked at four possible options of where to locate housing and jobs over the next 15<br />
years. Extensive public engagement took place between January and May 2008.<br />
Currently the council is taking stock of all the information gathered during the Issues and<br />
Options and Further Issues and Options Stages of the <strong>Core</strong> <strong>Strategy</strong> to produce the<br />
Preferred Option for the <strong>Bradford</strong> District. Consultation on the Preferred Options stage of the<br />
<strong>Core</strong> <strong>Strategy</strong> is planned for early 2009.<br />
The Local Development Framework (LDF) process requires planning policies to be based on<br />
a thorough understanding of the needs, opportunities and constraints within that area.<br />
Therefore, the Council has assembled a range of information and commissioned strategic<br />
studies to justify the "soundness" of the policy approach set out in Local Development<br />
Documents, including physical, economic, and social characteristics of the area. These<br />
reports and documents are known as the ‘Evidence Base’ for the LDF process.<br />
The following documents form part of the Evidence Base for the <strong>Bradford</strong> LDF:-<br />
• The Big Plan Sustainable Community <strong>Strategy</strong> and Background Papers<br />
• <strong>Bradford</strong> District Retail & Leisure <strong>Study</strong><br />
• <strong>Bradford</strong> District Employment Lands Review Assessment<br />
• <strong>Bradford</strong> District Strategic Housing Market Assessment<br />
• <strong>Bradford</strong> District Strategic Housing Land Availability Assessment<br />
• <strong>Bradford</strong> District Transport <strong>Study</strong><br />
• <strong>Bradford</strong> District Local Infrastructure <strong>Study</strong><br />
• <strong>Bradford</strong> District Strategic Flood Risk Assessment Level 1 and Level 2<br />
• <strong>Bradford</strong> District Open Space, Sports and Recreation <strong>Study</strong><br />
• <strong>Bradford</strong> District Built Recreational Facilities Assessment<br />
• <strong>Bradford</strong> District Conservation Area Assessments<br />
• <strong>Bradford</strong> District Landscape Character Assessment<br />
• <strong>Bradford</strong> District Biodiversity Action Plan<br />
• <strong>Bradford</strong> District Tourism <strong>Strategy</strong><br />
• Gypsy & Traveller Accommodation Assessment<br />
The Supplementary Planning Documents (SPDs) may cover a range of issues, both<br />
theme based and site specific, which provide further detail to policies within a DPD. The<br />
following SPDs are to be produced by the City of <strong>Bradford</strong> MDC:<br />
• <strong>Bradford</strong> City Centre Affordable Housing – adopted in October 2008<br />
• <strong>Bradford</strong> District Affordable Housing– scoping report out in October 2008<br />
41
• <strong>Bradford</strong> City Centre Design Guide– adopted in March 2006<br />
• Householder SPD – scoping report out in October 2008<br />
• Landscape Character – adopted in October 2008<br />
• Menston Housing Sites – adopted in October 2007<br />
• Planning for Crime Prevention – adopted in June 2007<br />
• Planning Obligations – adopted in October 2007<br />
• Shop Front Design – adopted in December 2007<br />
• Sustainable Design Guide – adopted in February 2006<br />
• Tree Protection- not commenced<br />
• Open Space and Built Facilities SPD- not commenced<br />
42
3.0 REGENERATION CONTEXT<br />
This section identifies and assesses a range of current and proposed regeneration initiatives<br />
affecting the future of the district.<br />
3.1 <strong>Bradford</strong> Vision – Local Strategic Partnership<br />
Created in 2008 the <strong>Bradford</strong> District Partnership (BDP) is the districts Local Strategic<br />
Partnership (LSP). The Government requires districts to have an LSP to assist in the<br />
planning and delivery of more effective services for local people. The BDP will ensure that<br />
the district’s Big Plan and Local Area Agreement (LAA) are delivered in the best way<br />
possible - and that all the partners work closely together to make things happen.<br />
In doing so the BDP will champion the well being and prosperity of all of the districts<br />
residents and ensure that they have the opportunity to realise their true potential.<br />
The aim is to achieve the vision for the future of <strong>Bradford</strong> District as set out in the 2020<br />
Vision - Community <strong>Strategy</strong> 2006 - 2009– a plan that includes the five key ambitions local<br />
communities have for their future. The Community <strong>Strategy</strong> has been prepared by the<br />
Partnership with City of <strong>Bradford</strong> <strong>Metropolitan</strong> District Council (CMBDC) as part of the<br />
partnership.<br />
The Vision set out the 5 main objectives for the future of the district:<br />
• Creating a vibrant economy and prosperous District<br />
• Improving the District for children and young people<br />
• Building safer and stronger communities<br />
• Making healthier communities and improving the quality of life of older people<br />
• Creating foundations for long term prosperity<br />
The BDP Board has 15 senior people from some of the key partner agencies – the Council,<br />
The Primary Care Trust, The Police, The Chamber of Commerce, <strong>Bradford</strong> Community<br />
Housing Trust, The University, The Child and Young Peoples partnership, the Environment<br />
Partnership and the Business and Voluntary/Community Sectors.<br />
This means that when the BDP makes decisions the partners will be committed to making<br />
them happen.<br />
The Board is supported by 5 Strategic Delivery Partnerships covering the following themes:<br />
• Children and Young People<br />
• Economy, Skills, Housing and Transport<br />
• Environment<br />
• Safer Communities<br />
• Health and Well Being<br />
43
These partnerships have the responsibility for ensuring that an area of the Big Plan and LAA<br />
is developed and delivered, raising any key issues with the Board where necessary.<br />
To support the BDP Board and its partnerships, the council co-ordinates a multi-agency<br />
officer team known as the Partnership Delivery Team (PDT). PDT is lead by the council’s<br />
Deputy Chief Executive, and it helps the deliver and performance manage the Big Plan and<br />
the Local Area Agreement.<br />
The Strategic Delivery Partnerships and the Board are supported by a range of cross cutting<br />
partnerships that work with them to ensure that a range of issues are reflected in all aspects<br />
of the LSPs work. They include the following:<br />
• The Cultural Consortium<br />
• The Strategic Disability Partnership<br />
• The Older Peoples Partnership<br />
• The Neighbourhood Improvement Strategic Partnership (NISP)<br />
• The Building Communities Partnership<br />
• The Community Network (Cnet)<br />
3.2 The Big Plan – Sustainable Community <strong>Strategy</strong> 2008 – 2011<br />
The Big Plan is an update on the existing Community <strong>Strategy</strong>, which will cover 2008 – 2011.<br />
The strategy has 6 main objectives:<br />
1. Prosperity, including the transformational priorities of regenerating the city and major<br />
towns, and improving skills, but also covering other economic aims including aspects<br />
of housing and transport.<br />
2. Children and Young People, including the transformational priority of improving<br />
education outcomes so that people are prepared for an adult life of skilled, creative<br />
productivity, personal, social and environmental responsibility, and engagement.<br />
3. Safer Communities – building public confidence, trust and satisfaction in reducing<br />
crime and anti-social behaviour, tackling its causes and increasing people’s feeling of<br />
safety and security in their homes and neighbourhoods<br />
4. Health and Wellbeing for All - dealing with the causes of major public health and lifestyle<br />
problems and working across partners to prevent illness and extend productive<br />
life<br />
5. Environment – clean, attractive neighbourhoods; reducing and managing waste<br />
sustainably and reducing our impact on climate change<br />
6. Strong Communities and Thriving Neighbourhoods – working with citizens to develop<br />
active engagement, self-confidence and local resources to invest in neighbourhood<br />
improvement.<br />
The objectives are similar to that of the existing community strategy, with the addition of an<br />
objective on the environment. The priorities for achieving the objectives have been updated<br />
and are as follows:<br />
44
• Regenerating the city and our major towns to create opportunities and impetus for<br />
sustained economic growth<br />
• Improving education outcomes to prepare people for an active and prosperous life<br />
• Improving skills at all levels to meet the needs of business and build a knowledge<br />
economy.<br />
The community strategy is still in the draft stage of production and expected to be adopted in<br />
late summer 2008.<br />
3.3 <strong>Bradford</strong> City Centre Masterplan<br />
This Section provides a commentary on the masterplanning work that has been undertaken<br />
for <strong>Bradford</strong> City Centre since the formation of <strong>Bradford</strong> Centre Regeneration (BCR) in 2003.<br />
It starts by looking at the BCR Masterplan and the response to it, before looking at the<br />
<strong>Bradford</strong> City Centre Design Guide Supplementary Planning Document (SPD) and the<br />
Neighbourhood Development Frameworks (NDF) – which have been produced to take<br />
forward the aims of the Masterplan.<br />
<strong>Bradford</strong> Centre Regeneration (BCR):<br />
In September 2002, the Government granted approval for the establishment of an Urban<br />
Regeneration Company for <strong>Bradford</strong> City Centre. This company was established in February<br />
2003 under the name <strong>Bradford</strong> Centre Regeneration (BCR). It is jointly funded by City of<br />
<strong>Bradford</strong> <strong>Metropolitan</strong> District Council, Yorkshire Forward (the Regional Development<br />
Agency) and English Partnerships (the national regeneration agency).<br />
The key role of BCR is to engage the public and private sectors in order to transform the city<br />
centre.<br />
The BCR Masterplan:<br />
In February 2003, Alsop Architects were appointed to prepare a Masterplan for the <strong>Bradford</strong><br />
City Centre. This was published in September 2003 and set out a new vision for the future of<br />
the city centre.<br />
The big idea of the Masterplan is to create a new city centre park that will change people’s<br />
perceptions of <strong>Bradford</strong> and differentiate it from other cities.<br />
The idea is based on exploiting <strong>Bradford</strong>’s topography – the city lies in a bowl formed by the<br />
valley of <strong>Bradford</strong> Beck. The Masterplan proposes rediscovering the ‘<strong>Bradford</strong>Bowl’ by<br />
getting rid of poor quality buildings which we do not need and forming a new city centre park.<br />
This would be a series of linked spaces, landscapes and water features, which breathes new<br />
life into the city’s historic fabric.<br />
The Masterplan identifies four separate neighbourhoods or ‘fingers of intervention’:<br />
45
The Bowl – proposes a large pool of water outside City Hall at the centre of the new park.<br />
Radiating out from the Pool are, a Pier attached to the National Museum, a new Business<br />
Forest, and the other three neighbourhoods.<br />
The Channel – proposes reintroducing the <strong>Bradford</strong> Canal to the city centre alongside which<br />
is a new canalside community.<br />
The Market – proposes an alternative multi-cultural retail offer with new public spaces.<br />
The Valley – proposes bringing <strong>Bradford</strong> Beck back to the surface, with a green corridor<br />
along Thornton Road including Wetlands and an Orchard.<br />
The aim of this approach is to promote a step change in the economy, inspire better quality<br />
development, and create a city centre that is used and cared for by all of the city’s different<br />
cultures.<br />
The Masterplan can be viewed in full on the BCR website -http://www.bradfordurc.com<br />
The Response to the Masterplan:<br />
The Public<br />
A public exhibition of the Masterplan was held between 15th October 2003 and 19th<br />
December 2003 at the former Dillons Bookstore on Market Street, <strong>Bradford</strong>. A total of 2,497<br />
comment forms were returned.<br />
Overall,<br />
• 65% of the respondents rated the Masterplan as either ‘Wow’ or ‘Exciting’,<br />
• 12% thought it was ‘OK’,<br />
• 13% hated it, and<br />
• 10% were undecided.<br />
The Council<br />
On 14th October 2003, City of <strong>Bradford</strong> <strong>Metropolitan</strong> District Council’s Executive welcomed<br />
the Masterplan for the city centre. Subsequently at the meeting of the<br />
Executive on 9th March 2004 it was resolved that the Council would:<br />
• Prepare a replacement planning document for the <strong>Bradford</strong> Centre<br />
Regeneration area as a high priority.<br />
• Co-operate with BCR in the commissioning of studies and project plans.<br />
At the meeting of the City of <strong>Bradford</strong> <strong>Metropolitan</strong> District Council Regulatory and Appeals<br />
Committee on 8th March 2005 it was resolved that: The Masterplan for <strong>Bradford</strong> City Centre<br />
be treated as a material consideration in the determination of planning applications.<br />
The Council and BCR in 2005 and 2006 commissioned consultants to produce the following:<br />
• City Centre Design Guide<br />
• City Centre Streetscape Manual<br />
• Neighbourhood Development Framework for each of the four neighbourhoods<br />
identified in the Masterplan.<br />
46
The purpose of these documents is to take forward the vision of the Masterplan and<br />
demonstrate how it can be delivered.<br />
<strong>Bradford</strong> City Centre Design Guide:<br />
In 2005 a consultancy team led by Urbed was commissioned to produce a Design Guide for<br />
the city centre for City of <strong>Bradford</strong> <strong>Metropolitan</strong> District Council.<br />
The purpose of the Guide is to articulate the Masterplan vision for the city centre into a set of<br />
design rules. This includes guidance on tall buildings, the character of streets, enclosure of<br />
space and public realm.<br />
The Guide is used to assess the design of new development proposals in the city centre. It<br />
was adopted by the Council in March 2006 as a Supplementary Planning Document (SPD)<br />
following public consultation. As an SPD, the guide is a material consideration when<br />
determining any planning applications within the city centre.<br />
The <strong>Bradford</strong> City Centre Design Guide can be viewed at –<br />
http://www.bradford.gov.uk/bccdg or alternatively viewed at any of the Council’s Planning<br />
Offices.<br />
BCR in 2006 commissioned consultants Landscape Projects to take the public realm<br />
guidance within the City Centre Design Guide further and produce a Streetscape Design<br />
Manual for the city centre. This will provide a set of rules and specify a palette of materials<br />
for new public realm works.<br />
3.4 The Neighbourhood Development Frameworks (NDFs)<br />
The Masterplan identifies four separate neighbourhoods in <strong>Bradford</strong> City Centre – The Bowl,<br />
The Channel, The Market, and The Valley.<br />
In late 2004/early 2005 consultants were commissioned by City of <strong>Bradford</strong> <strong>Metropolitan</strong><br />
District Council and BCR to produce a framework for each of the four neighbourhoods.<br />
These have been called Neighbourhood Development Frameworks (NDFs). The purpose of<br />
the NDFs is to build on the aims of the Masterplan andproduce a deliverable strategy and a<br />
set of projects for each neighbourhood.<br />
The NDF’s set out development proposals for each of the four separate parts of the city<br />
centre and take into a account a number of issues that have been identified in each area.<br />
The NDF’s carry out a baseline assessment of each area and a SWOT analysis, which they<br />
have used to compile the regeneration proposals put forward in the frameworks.<br />
The NDFs have been prepared by:<br />
The Channel – Arup<br />
The Market – Arup<br />
The Valley – Urbed<br />
The Bowl – Alsop<br />
47
The Draft Neighbourhood Development Frameworks can be viewed in full at<br />
http://www.bradford.gov.uk/environment/land_and_premises/planning/city<br />
_centre_neighbourhood_developmen t_framework.htm<br />
or alternatively by visiting any of the Councils Planning Offices<br />
Response to the NDFs:<br />
The Draft NDFs were published separately for public comment between March and<br />
December 2006. The comments received have been used to inform the <strong>Bradford</strong> City<br />
Centre Area Action Plan - Issues and Options Report (this document).<br />
On 16th January 2007, the City of <strong>Bradford</strong> <strong>Metropolitan</strong> District Council considered<br />
consultation responses to the NDFs and resolved that comments would be accepted as<br />
evidence for inclusion in the preparation of the City Centre Area Action Plan.<br />
On 7th February 2007, the City of <strong>Bradford</strong> <strong>Metropolitan</strong> District Council’s Regulatory &<br />
Appeals Committee resolved that: the four Draft Neighbourhood Development Frameworks<br />
for the City Centre be treated as material considerations in the determination of planning<br />
applications pending the adoption of the <strong>Bradford</strong> City Centre Action Area Plan.<br />
In addition to the above, a number of background and feasibility studies have been<br />
completed as part of the masterplanning process. These are detailed in Section 1.4 ‘The<br />
Evidence Base’ of the BCCAAP Issues and Options report.<br />
3.5 Canal Road Masterplan<br />
This sets out the plans for Canal Road and the land adjacent to the corridor. Similar to the<br />
NDF’s, a baseline assessment was carried out to extract the issues the area faces and a<br />
SWOT analysis was undertaken to establish the Strengths, Weaknesses, Opportunities and<br />
Threats of the area. The plan centres round the reopening of the <strong>Bradford</strong> Canal as its major<br />
regeneration project and the benefits that can bring. It also covers regeneration that could<br />
develop prior, subsequent and during the reopening of the canal.<br />
Its strategic objectives are to:<br />
• To recognise the importance of the ‘Canal as a catalyst’ for regeneration;<br />
• To ensure a ‘balance of functions’ within the Corridor;<br />
• To ‘create a sustainable place’ to live, work and spend leisure time;<br />
• To promote a positive and viable ‘mix of uses’ within the Corridor; and,<br />
• To ‘enhance movement and connection’ within the Corridor.<br />
Key Principles for development:<br />
• Establish a mix of uses that support the role and function of the Corridor as a major<br />
transportation corridor and series of sustainable neighbourhoods;<br />
48
• Reduce the severance effect of Canal Road and improve cross corridor routes<br />
through targeted access and environmental improvements;<br />
• Optimise the alignment of the proposed canal to reduce conflict between new traffic<br />
generating uses and Canal Road;<br />
• Reduce the potential conflict between uses through the location of sensitive uses<br />
such as residential properties away from the main road frontage;<br />
• Encourage higher density uses close to public transport corridors and main road<br />
frontages;<br />
• Discourage large traffic generating uses; and<br />
• Maximise the potential of the canal as a movement corridor to reduce the impact on<br />
Canal Road<br />
Other significant principles are the need to create sustainable communities, a mix of uses<br />
and enhance movement and connection.<br />
Character Areas and Principal Uses:<br />
• Shipley Waterside - Town centre residential and office with some ground floor retail;<br />
• Shipley Fields - Waterside open space, Bolton Woods Football Club and Shipley<br />
College’s Horticulture and Sports Campus;<br />
• Frizinghall Waterfront - Residential;<br />
• Oswin Marina - Residential with some ground floor commercial uses and a sports<br />
pitch;<br />
• Bolton Hillside - Residential within extensive areas of high quality open space;<br />
• Oliver’s Locks - A new residential community with a mix of retail, leisure, office and<br />
employment uses; and<br />
• Manningham Cross - Residential, large-scale retail and some commercial/leisure<br />
opportunities.<br />
Summary:<br />
Although the Canal Road Masterplan is not an officially adopted document and not<br />
specifically focused on the city centre, but it does raise some very valid issues and gives a<br />
detailed description of areas around the city centre.<br />
The main issues pointed out in the Masterplan are mainly physical, relating to the car<br />
domination of Canal Road, resulting in an unattractive and unfriendly pedestrian atmosphere,<br />
acting as a barrier to east-west movement across the Valley and poor quality built<br />
environment along the road.<br />
3.6 Manningham Masterplan<br />
This masterplan envisages improving the link between Manningham and the City Centre. It<br />
identifies that Drewton Street and Hamm Strasse form a large physical barrier between<br />
Manningham and the city centre. The road is large, busy road corridor, which has no active<br />
49
frontage and is surrounded on both sides by high retaining walls and planting. The entrance<br />
to Manningham Lane is dominated by traffic and road infrastructure, with lighting columns,<br />
signals and signs everywhere. This entrance to Manningham Lane currently creates a<br />
negative impression, reinforced by the characterless frontages of the shops on the corner of<br />
Manningham Lane and Drewton Street.<br />
The Masterplan proposes a mixed used development to replace the existing shops on this<br />
corner to satisfy the following objectives:<br />
• Be of a scale large enough to sit comfortably next to the vast road junction<br />
• Relate to the city centre buildings adjacent<br />
• Have a high quality design to raise the prominence of this gateway location into<br />
Manningham<br />
• Suit the distinctive character that Manningham possesses<br />
It is also proposed to encourage positive development on derelict and disused sites on the<br />
road frontage and improve the appearance of the existing shop and business facades.<br />
Summary:<br />
The Manningham Masterplan picks up on the car domination of road on the periphery of the<br />
city centre and how this effectives not only the city centre but also the surrounding areas, like<br />
Manningham. This domination results in an unattractive/unwelcoming pedestrian<br />
environment, which is further reinforced by the characterless shop fronts and the derelict<br />
sites on the road. The Masterplan suggests possible improvements, which are in line and<br />
combined with those in the City Centre Masterplan.<br />
3.7 Airedale Corridor Masterplan<br />
The Airedale Partnership was established in February 2003 to provide strategic leadership<br />
for the regeneration of Airedale. This grouping of leaders from business, education and the<br />
community, in conjunction with <strong>Bradford</strong> Council and Yorkshire Forward, saw the need for a<br />
strategic masterplan to deliver the aspirations of the <strong>Bradford</strong> 2020 Vision for Airedale.<br />
The aim of the masterplan and strategy is to establish a framework that will deliver a stepchange<br />
in the local economy that benefits local people and protects and enhances the<br />
environment. It will advise future planning frameworks and investment plans for the <strong>Bradford</strong><br />
District and the wider region.<br />
The key aspects of the brief were to establish how to deliver the <strong>Bradford</strong> 2020 Vision in<br />
Airedale and:<br />
• Stimulate economic growth;<br />
• Support the development of key employment sites;<br />
• Encourage the renaissance of the town centres;<br />
• Promote e-business technologies;<br />
50
• Support skill development;<br />
• Connect local people to economic opportunity;<br />
• Support the rural economy;<br />
• Develop cross boundary initiatives.<br />
Airedale masterplan has a particular role in supporting the city centre initiatives, including<br />
transport connectivity and developments along the line of the proposed <strong>Bradford</strong> Canal that<br />
forms a green link between Airedale, Manningham and the city centre. Integration of the<br />
thinking behind the Airedale, Manningham and <strong>Bradford</strong> city centre masterplans will deliver<br />
major benefits to <strong>Bradford</strong> District, and together they will help to provide the evidence base<br />
that will shape the future Local Development Framework.<br />
3.8 Leeds <strong>Bradford</strong> Corridor <strong>Study</strong><br />
The Leeds <strong>Bradford</strong> Corridor covers a nine-mile area joining <strong>Bradford</strong> and Leeds city<br />
centres. The project aims to revitalise the neighbourhoods, employment opportunities,<br />
environment and transport links in the corridor, connecting people living there to the growing<br />
economies in the two cities.<br />
The Corridor represents a key transformational project which will build on the growing<br />
linkages between the two cities and the objectives of the Northern Way strategy to boost the<br />
economies in the north of England. The joint working between <strong>Bradford</strong> and Leeds within the<br />
corridor area is one part of a wider project of collaboration between the two districts.<br />
Based on a feasibility study (Leeds-<strong>Bradford</strong> Corridor <strong>Study</strong> by WYG) completed in summer<br />
2007, work has been underway to develop and deliver activity under the following thematic<br />
strands:<br />
• Employment sites and economic development<br />
• Local connectivity and transport<br />
• Future housing growth and affordability<br />
• Skills and employment<br />
Fig 10: Leeds-<strong>Bradford</strong> Corridor<br />
An officer steering group and thematic task groups have been established, overseen by the<br />
two portfolio holders for <strong>Bradford</strong> and Leeds. Delivery to date has included:<br />
51
Aims:<br />
• Business engagement event<br />
• Business needs survey<br />
• Employment land mapping<br />
• Cycle network mapping<br />
• Regional Housing Board tour<br />
• Logistics academy bid<br />
• Job brokerage / housing services project development<br />
• To enhance economic development and employment opportunities that would<br />
support existing businesses and encourage new employers to the area.<br />
• To enhance and improve transport quality and connectivity in order to improve the<br />
quality of transport between the two city centres and enable better connectivity to<br />
employment and business opportunities.<br />
• To improve housing quality and choice that is available for local people, that will<br />
attract new households, respond to changing demand for housing and that will<br />
support any future economic growth.<br />
• To improve the image and appearance of the Leeds-<strong>Bradford</strong> Corridor.<br />
West Yorkshire Metro has also commissioned Arup to undertake an in-depth consideration of<br />
transport issues between the city centres, and this work is continuing.<br />
Due to the early stages this partnership is in, little is known on the possible future outcomes<br />
that may result. However, while these studies were being developed, Leeds and <strong>Bradford</strong><br />
councils arranged a series of practice forums (Leeds-<strong>Bradford</strong> Masterclasses) between April<br />
and July 2008 in order to facilitate effective networking between prominent officers and<br />
elected members in both cities and to highlight that this potential could not be realised<br />
without deeper and wider cooperation between the two authorities.<br />
The presentations at the seven practice forums, combined with the reflections of discussion<br />
groups at each event, provided a significant body of evidence of thinking and practice from<br />
around the UK. Staff from both cities had the opportunity to enhance their knowledge of key<br />
policy areas affecting them, and draw on the experience of practitioners who had grappled<br />
with comparable issues. <strong>Bradford</strong> and Leeds are already taking forward key learning points<br />
from the events, both at a strategic level and in operational terms.<br />
3.9 <strong>Bradford</strong> Trident Masterplan<br />
Building Design Partnership and Urban <strong>Strategy</strong> Associates were commissioned by Health,<br />
Housing and Environment Working Group of <strong>Bradford</strong> Trident to produce a masterplan to<br />
outline a strategy for the <strong>Bradford</strong> Trident area. The Masterplan concentrates on areas<br />
outside of the Phase 1 Masterplan area. It does not propose radical physical change but<br />
rather it seeks to focus on key sites where change is possible and on complementary<br />
strategies for open space, lighting and movement. Importantly the Masterplan seeks to<br />
develop on key design principles established in the Phase 1 Masterplan and notably the<br />
52
'Living Street' idea to promote a comprehensive approach to physical neighbourhood<br />
renewal and inclusion throughout the <strong>Bradford</strong> Trident area.<br />
The report sets out a number of issues the <strong>Bradford</strong> Trident area faces:<br />
� Poor Housing Conditions<br />
� Poor environment and lack of quality spaces<br />
� Crime and fear of crime<br />
� Community exclusion and a lack of confidence<br />
These issues are important for the City Centre because the <strong>Bradford</strong> Trident area borders<br />
the City Centre and is one of the gateways into it.<br />
The report also undertakes an appraisal of specific areas within <strong>Bradford</strong> Trident and<br />
produces some useful information about how areas around <strong>Bradford</strong> relate to the City<br />
Centre.<br />
3.10 <strong>Bradford</strong> Learning Quarter Design and Delivery Framework<br />
Farrell and Clark Architects were commissioned by the University of <strong>Bradford</strong> to produce a<br />
masterplan for the University campus area. The study aimed to bring together a number of<br />
development ideas in a format that demonstrates to others the intent of the University. It<br />
seeks to illustrate the possibility for improvements to the public realm by improving and<br />
clarifying the spaces around buildings, improving physical links and routes and allowing the<br />
development of landscaping where appropriate.<br />
The study undertakes an analysis of the area, covering 11 key themes:<br />
1. Green Spaces<br />
2. Car Parking<br />
3. Vehicular Circulation<br />
4. Pedestrian Routes<br />
5. Key Buildings/Pedestrian Space<br />
6. Bus Routes<br />
7. Space Use <strong>Analysis</strong><br />
8. Building Heights and Topography<br />
9. Street Patterns<br />
10. Links to College and Coty<br />
11. Cycle Provision<br />
The study recognises a number of issues in these key themes:<br />
• Mixed quality green space<br />
• Car dominance<br />
• Inconsistent poor quality pedestrian routes<br />
• Mixed quality public realm<br />
53
• No direct link between bus stops and circulation routes<br />
• Poor land use planning<br />
• Weak links to the City Centre<br />
The University has also produced an Estate <strong>Strategy</strong>, 2004-2014. This sets out the<br />
University’s vision for what the campus should look like in the next 10 years (from 2004). The<br />
strategy covers key themes of Security, Landscaping, student facilities, conference facilities<br />
and student accommodation.<br />
3.11 Neighbourhood Development Plan (NDP) for Barkerend, Beech Grove, <strong>Bradford</strong><br />
Moor, Thornbury, Woodhall and Laisterdyke.<br />
A Neighbourhood Development Plan (NDP) was jointly commissioned with Inspired<br />
Neighbourhoods in 2008 in order to identify how committed and future funding could be used<br />
to best effect in East <strong>Bradford</strong> to achieve the Council’s aims of:<br />
• Regenerating the private sector housing stock<br />
• Rejuvenating the failing housing market<br />
• Transforming the public realm on this key route between <strong>Bradford</strong> and Leeds<br />
The NDP area lies within the wider Leeds <strong>Bradford</strong> Corridor; this Corridor is identified in the<br />
Housing <strong>Strategy</strong> as having the potential for growth.<br />
The NDP looks to address priorities for prosperity and regeneration, safer communities,<br />
improving the environment, and strong and cohesive communities as set out in the Big Plan<br />
2008 – 2011. The NDP also addresses objectives relating to housing quality and growth,<br />
affordability and sustainability identified in <strong>Bradford</strong> Council’s Joint Housing <strong>Strategy</strong> 2008 -<br />
2020<br />
The plan identifies six key themes for action, these are:<br />
1. Existing Housing – how to improved standards<br />
2. New Houses – how to provide greater choice<br />
3. Local High Streets – how to make them more successful and attractive<br />
4. Public Space – how to support a sense of community ownership<br />
5. Green Space – how to improve access<br />
6. Movement – how to make it safer<br />
A total of 28 projects are identified that sit within the six themes, these projects are designed<br />
to deliver the key regeneration outcomes. Projects range in terms of scale; a number of<br />
projects require significant capital investment, others relate to the provision of advice and<br />
support to residents and householders and require no capital investment.<br />
The scope of the NDP which includes major regeneration initiatives suggests a delivery<br />
timescale of 10 – 15 years.<br />
54
Delivery of the interventions and projects identified in the NDP will achieve the following key<br />
outputs:<br />
• Improvement to 212 homes<br />
• Construction of 1,408 new homes<br />
• Improvement of 3,350 linear meters of backstreets<br />
• Creation of 1.2 ha of public open space<br />
• Improvement to 6,000 m2 of public high streets<br />
• Improvement to 4km walking and cycling routes<br />
The projects and interventions identified in the NDP, should they be implemented in full,<br />
would achieve a total inward capital investment of £191 million. In order to deliver<br />
interventions identified as short term priorities, (up to three years) total inward capital<br />
investment £18 million will be required.<br />
The NDP is available online from the following website:<br />
http://www.inspiredneighbourhoods.co.uk/index.php<br />
A detailed description of each Project Proposal can be found in Chapter Four of the NDP.<br />
Chapter Five provides a quantative breakdown of the Project Proposals and a costing<br />
breakdown that identifies short term, medium term, and long term indicative costs.<br />
3.12 Neighbourhood Development Plans for Holme Wood & Tong and Manningham<br />
The council has commissioned two other Neighbourhood Development Plans to provide a<br />
vision and delivery framework for regeneration and housing quality and growth in two priority<br />
neighbourhoods-<br />
• Holme Wood & Tong<br />
• Manningham<br />
The Holme Wood & Tong area sits within the Leeds <strong>Bradford</strong> Corridor which holds strategic<br />
importance at the Leeds City Region level as well as the District level. Linking a stronger<br />
future for the neighbourhood to the emerging Local Development Framework which<br />
recognises Holme Wood as an area of housing and economic growth will be one of the key<br />
aspects of the Neighbourhood Development Plan (NDP). The NDP will identify short<br />
medium and long term intervention able to achieve the vision. The plan will also contribute<br />
toward the local development framework’s evidence base and therefore a sustainability<br />
assessment of the options for investment.<br />
The Manningham areas has benefited over recent years from significant economic<br />
intervention underpinned by the 2005 Manningham master plan and investment from the<br />
public sector led by Yorkshire forward and CBMDC and private sector partnerships. The<br />
Manningham Neighbourhood Development Plan will build on the Manningham’s ambition,<br />
vibrant community and rich heritage landscape and buildings expressed in the master plan.<br />
The Neighbourhood Development Plan will identify short, medium and long term<br />
interventions able to support the Manningham master plan in particularly in areas of housing<br />
55
and environment. The plan will recognise the importance of the existing housing offer in the<br />
neighbourhood but place it in the context of existing housing offer to the West and emerging<br />
new housing market opportunities to the East and South. The plan will establish how and<br />
when interventions primarily in Manningham will take place building on the areas unique offer<br />
whilst complementing opportunities that exist and will arise in neighbouring areas.<br />
The two Neighbourhood Development Plans are expected to be completed by November<br />
2010.<br />
3.13 Key Facts<br />
• The Community <strong>Strategy</strong> is a key document for <strong>Bradford</strong> District, allowing a district<br />
level focus through a tiered partnership approach, whilst outlining 5 key ambitions<br />
that are of note for the <strong>Bradford</strong> City Centre Area Action Plan.<br />
• The City Centre Masterplan and Neighbourhood Development Frameworks provide<br />
good analysis of the entire city centre and comprehensive information on specific<br />
areas of the centre. The masterplan and NDF’s are a good launch pad for the City<br />
Centre AAP.<br />
• The Canal Road Master Plan identifies some keys issues surrounding one of the<br />
main corridors into the City Centre and set out details of a major regeneration<br />
scheme, the reopening of the <strong>Bradford</strong> Canal that could have a significant impact on<br />
the City Centre.<br />
• The Airedale Corridor Masterplan sets out the future regeneration of Airedale, with<br />
the City Centre Masterplan identifying the area as a major employment corridor. The<br />
future development of this corridor will have a major influence on the City Centre and<br />
the masterplan identifies key transport and developments along the <strong>Bradford</strong> Canal.<br />
• The Learning Quarter Design and Delivery Framework will play an important role to<br />
coordinate the development and environmental investment activities happening<br />
around the university and college area. The spatial themes identified in the framework<br />
would also help integrate the learning quarter with the city centre and achieve the<br />
visions of the City Centre AAP by shaping the future role and function of the land<br />
uses in this area.<br />
56
4.0 SOCIO-ECONOMIC APPRAISALS<br />
This appraisal is based on the analysis of a range of data on the socio-economic<br />
characteristics of the <strong>Bradford</strong> District. Data and statistics at the district level have been<br />
discussed along with that of the region to make it comprehensive in relation to a wider<br />
setting. Where appropriate/relevant information on the district or region was not available<br />
data for the UK as a whole has been considered.<br />
The baseline assessment of the socio-economic characteristics of the <strong>Bradford</strong> District has<br />
largely been a desk-base exercise using published data from a range of sources including-<br />
• A Picture of the District (Annual report on the state of the District produced by<br />
CBMDC Research and Consultation Service in March 2007)<br />
• The Big Plan- Sustainable Community <strong>Strategy</strong> for <strong>Bradford</strong> 2008-11(CBMDC, 2008)<br />
• <strong>Bradford</strong> and Airedale Joint Strategic Needs Assessment (CBMDC and <strong>Bradford</strong> and<br />
Airedale PCT, 2008)<br />
• Economic <strong>Strategy</strong> for <strong>Bradford</strong> District 2007-2020 (CBMDC, 2007)<br />
• Leeds <strong>Bradford</strong> Corridor <strong>Study</strong> (Genecon, King Sturge, Gillespies 2007)<br />
• Northern Way-Leeds City Region Diagnostic<br />
• <strong>Bradford</strong> Positioning Statement (Regeneris, 2005)<br />
• BCR Performance Framework ( Genecon, 04/05-05/06)<br />
4.1 Demographic Characteristics<br />
4.1.1 Population Structure<br />
The latest population estimate (2007) is 497,000. The<br />
ethnic minority population in the District accounts for<br />
22% of the total population (86% of this total is of Asian<br />
origin). Although the age structure of the UK is getting<br />
older, this is not the case in <strong>Bradford</strong>. A higher<br />
proportion of the population is made up of younger age<br />
groups than the national population. This youthful<br />
population is responsible for a high number of births in<br />
the District and most of the population growth the<br />
District is experiencing.<br />
The percentage of people under 16 years of age in the<br />
UK fell from 25% in mid 1971 to 19% in mid 2004. In<br />
<strong>Bradford</strong>, children accounted for 14% of the total<br />
population in 1971. According to the latest population<br />
estimate for the <strong>Bradford</strong> District, there are 110,000<br />
under 16-year olds, who make up 23% of the total<br />
population.<br />
57
As the population pyramid below shows, there are also more people under the age of 25<br />
than the national average. In 2004, people under the age of 25 accounted for 31.1% of the<br />
UK’s total population. In <strong>Bradford</strong>, this figure is higher. There are 172,100 under 25-year olds<br />
in the District - accounting for 35.8% of the total population.<br />
Figure 1: Age and sex breakdown - <strong>Bradford</strong> District (2001 Census)<br />
4.1.2 Population Trend<br />
<strong>Bradford</strong> has experienced rapid population growth over recent years, generated by both<br />
natural increases (i.e. more births than deaths in the District) and by international<br />
immigration. Based on the 2003 ONS mid year population estimates, the Districts population<br />
as a whole is projected to increase by approximately 4000 people per annum up to 2018 with<br />
an estimated 15% growth among the working age group by 2017. The population projections<br />
are based on the population growth the District appears to have experienced since 2000, and<br />
envisage that the population of the District will grow at a similar rate over the next 25 years.<br />
Forecasts have also shown that <strong>Bradford</strong>’s population will contain larger proportions of<br />
younger people, and also those from BME groups. In addition the highest growth is likely to<br />
continue in the existing deprived parts of the District.<br />
4.1.3 Ethnicity and Religion<br />
The ethnic structure of the <strong>Bradford</strong> population is diverse with a relatively high proportion<br />
from South-Asian background. The City has by far the largest Asian population in the region<br />
58
which is only second to London in England as a whole. According to the 2001 Census,<br />
78.3% of the population living in the District have a White British heritage and 14.5% have a<br />
Pakistani ethnic background. Approximately 3% people in the district have an Indian heritage<br />
and 1% a Bangladeshi one. By way of contrast, the black population is very small at less<br />
than 1% of the population. The following map highlights the strong Black Minority Ethnic<br />
(BME) concentrations in the centre of <strong>Bradford</strong> and in Keighley.<br />
Figure 2: <strong>Bradford</strong> District Ethnicity by Wards<br />
Source: <strong>Bradford</strong> City Centre Pool Feasibility <strong>Study</strong> (Driver Jonas, May 2009)<br />
34,000 children, over ¼ of all children in the District, were either born outside the UK, or live<br />
in households whose head of household was born outside the UK, the Irish Republic or the<br />
Old Commonwealth. The under 25-year-old population has a similar ethnic group<br />
breakdown. 2<br />
In terms of religious profile, <strong>Bradford</strong> has the fourth largest proportion of people (16%)<br />
identifying themselves as Muslim after Tower Hamlets, Newham and Blackburn.<br />
60% of the population of <strong>Bradford</strong> District identified themselves as Christian while 13% of<br />
people across the District indicated that they did not have a religion.<br />
1% of the people in <strong>Bradford</strong> indicated that they were Hindu. This is similar to the rates<br />
shown in Solihull, Peterborogh and Reading. 1% of the population identified them as Sikh.<br />
This is closest to the levels reported in Leeds, Harrow and Barking and Dagenham.<br />
Overall the religious – and to a lesser extent ethnic group - profile of <strong>Bradford</strong> is most similar<br />
to that in Luton.<br />
2 BMDC Research and Consultation Service (2006). A Picture of the District. Report Dated October<br />
2006. Research and Consultation Service, Jacobs Well. <strong>Bradford</strong>.<br />
59
4.1.4 International Migration<br />
There is a lack of accurate and complete data relating to the number of people moving into<br />
<strong>Bradford</strong> from abroad. Recent analysis of migration data from a number of official sources<br />
suggest <strong>Bradford</strong> gained approximately 5,000-7,000 international migrants during the<br />
2005/06 period. Informal sources of information suggest the number could be between 9,000<br />
and 15,000, a significant contribution to population growth. According to National Insurance<br />
Number Registrations (NINo) data from the DWP, the majority of migrants come from<br />
Pakistan (26%) and Poland (20%). The other A8 countries combined make up another 27%<br />
of the registrations. 3<br />
Figure 3: Number of NINo Registrations from Overseas – West Yorkshire, 2005/06<br />
Source: West Yorkshire B&ME Housing Market <strong>Study</strong> (Ecotec, 2007)<br />
From the regional pint of view, the majority of economic migrants arriving in West Yorkshire<br />
register for National Insurance numbers in Leeds and <strong>Bradford</strong> and 'A8' migrants now tend to<br />
be the largest group. However, as Figure 3 indicates there is a considerable degree of<br />
variation across the sub-region: In 2005/06 'A8' migrants accounted for around 64% of all<br />
migrants in Wakefield; 60% in Calderdale; 48% in <strong>Bradford</strong>; 39% in Leeds; and 34% in<br />
Kirklees. It is not possible to track precisely where these migrants are living but anecdotal<br />
evidence suggests that the highest concentrations tend to be in lower value areas, almost<br />
exclusively in private rented accommodation. 4<br />
A recent study 5 conducted by a local working group has highlighted that the newly arrived<br />
central and eastern European migrant in <strong>Bradford</strong> have been settling largely in five main<br />
areas of the district, namely in Leeds Road, Great Horton Road, Girlington, Manningham and<br />
West Bowling. Typically these are areas of cheap housing and have a history of migrant<br />
populations. In Girlington alone there are unofficial estimates suggesting that an influx of<br />
3 <strong>Bradford</strong> Economic Partnership and <strong>Bradford</strong> Council (2007). Economic <strong>Strategy</strong> for <strong>Bradford</strong> District<br />
2007-2020. <strong>Bradford</strong> Economic Partnership and <strong>Bradford</strong> Council.<br />
4 Ecotec (2007). West Yorkshire B&ME Housing Market <strong>Study</strong>. Report published in April 2007.<br />
5 <strong>Bradford</strong> Central and Eastern European Working Group (2006). A8 Migration in <strong>Bradford</strong>: A<br />
Template for Action. Report published in January 2006.<br />
60
approximately 200 families have moved into the area (the core of Girlington has around 3500<br />
households).<br />
However, the impact of international migration on the total population of the district is<br />
dampened by rates of migration from the district to other parts of the UK. The level of out<br />
migration to other parts of the UK reduces the impact of international migration on the total<br />
population figure for the district. Between 2008 and 2009 <strong>Bradford</strong> experienced a loss of<br />
2,700 people through migration to locations in this country. Similar levels have been<br />
experienced in the past and are expected to continue, which nearly cancels out the whole<br />
population gain through international migration. Between July 2008 and 2009, <strong>Bradford</strong>’s<br />
total net migration gain was 1,300. However, despite this minimal effect on total population<br />
numbers, international migration has, and will continue to have, a dramatic effect on the<br />
composition of the district’s population. 6<br />
Most of the A8 migrants are in <strong>Bradford</strong> to work and create a new life for themselves and<br />
their families. Migrants from Poland are often single men or women, although the number of<br />
polish families is increasing and include polish people of Roma origin. Czech and Slovak<br />
migrants (many of Gypsy/Roma origin) are often larger family groups usually with extended<br />
families of parents, young teenagers, small children and babies.<br />
The report also gives an indication of some of the acute issues faced by the migrants once<br />
they arrive in the district-<br />
• Health- access to GPs and hospital services.<br />
• Housings- overcrowding, poor standard of accommodations, high rents.<br />
• Education- lack of English, communication barriers, getting children into school.<br />
• Employment- language barriers, exploitative labour.<br />
• Knowledge of rights and entitlements.<br />
Asylum seekers and refugees<br />
Figure 4 below maps numbers of asylum seekers across the sub-region by parliamentary<br />
constituency, clearly illustrating the high number of asylum seekers concentrated in those<br />
areas of the sub-region with large established B&ME populations. The highest<br />
concentrations are in inner urban areas of Leeds, <strong>Bradford</strong> and Huddersfield, and there are<br />
also small but locally significant asylum seeker populations in Halifax and Wakefield.<br />
However, and despite there being sizeable established B&ME communities in these areas,<br />
Dewsbury (in Kirklees) and Keighley (in <strong>Bradford</strong>) are notable for not having high numbers of<br />
asylum seekers, possibly a conscious decision given community cohesion issues. There is<br />
an arc of neighbourhoods running from Hemsworth (in Wakefield); through Elmet; across<br />
northern areas of Leeds and <strong>Bradford</strong>; and ending in the Calder Valley, where asylum<br />
seekers are not represented.<br />
6 <strong>Bradford</strong> Joint Strategic Needs Assessment 2010-11<br />
61
Figure 4: NASS, Asylum Seekers by WY Local Authority and Parliamentary Constituency, June 2006<br />
Source: West Yorkshire B&ME Housing Market <strong>Study</strong> (Ecotec, 2007)<br />
The number of asylum seekers in West Yorkshire in June 2006 was around 3,830. West<br />
Yorkshire accounts for well over half of Yorkshire and the Humber's asylum seeker<br />
population, and nearly one tenth of the UK total. Overall, Leeds (1,800) has the highest<br />
number of asylum seekers, followed by <strong>Bradford</strong> (755), Kirklees (710), Wakefield (335) and<br />
Calderdale (230). The Constituencies of Leeds Central (745), Leeds East (535), <strong>Bradford</strong><br />
West (495) and Huddersfield (490) have the highest numbers of resident asylum seekers.<br />
There are also likely to be a relatively small number of unaccompanied asylum seeking<br />
children in the sub-region, not recorded by this data.<br />
4.2 Deprivation Indices<br />
A key characteristic of <strong>Bradford</strong> District is a significant variation in the levels of deprivation,<br />
both between <strong>Bradford</strong> and other areas and between different neighbourhoods and<br />
communities within the district. There is a clear link between deprivation and differing<br />
experiences of health and wellbeing which presents <strong>Bradford</strong> District with the challenge of<br />
narrowing this gap in experience.<br />
In 2007, Communities and Local Government published the “Indices of Multiple Deprivation<br />
2007” (IMD 2007), which are a means of measuring levels of deprivation in areas of England.<br />
The Index assesses deprivation by seven different ‘domains’ and provides an overall<br />
deprivation score for small geographical areas, known as ‘Lower Super Output Areas’.<br />
Summary measures of the IMD 2007 are also produced at Local Authority District Level.<br />
<strong>Bradford</strong> ranks 32nd (out of 354) in the Department for Communities and Local Government<br />
(DCLG, now CLG) Index of Multiple Deprivation (2007). This places it squarely in the most<br />
deprived 10% of local authorities nationally. Its position is worse than other West Yorkshire<br />
authorities:<br />
62
Table 1: Rank of Average IMD Scoreby LA (West Yorkshire)<br />
LA Name Rank of Average Score (ID 2007)<br />
<strong>Bradford</strong> 32<br />
Wakefield 66<br />
Kirkless 82<br />
Leeds 85<br />
Calderdale 107<br />
Source: Neighbourhood Statistics<br />
Some 42% of people in <strong>Bradford</strong> district live in the 20% most deprived areas of the country<br />
and 5% (over 20,000 people) in the 1% most deprived.<br />
The following map shows how the SOAs rank in a <strong>Bradford</strong> context. This enables a clearer<br />
picture of where deprivation is most deep seated as well as giving a better indication of the<br />
relatively less deprived areas in the District. It can be seen that a picture of a north/south<br />
divide emerges, with a relative lack of deprivation in the north with deprivation concentrated<br />
in the city of <strong>Bradford</strong> itself, notably in the inner city areas and the peripheral estates.<br />
Figure 5: IMD 2207- Rank of overall score of <strong>Bradford</strong> LSOAs<br />
Looking at individual aspects of deprivation, <strong>Bradford</strong> ranks 4th and 6th nationally for income<br />
and employment deprivation respectively (IMD data). More than 32,000 people<br />
experienced income deprivation in the <strong>Bradford</strong> District.<br />
Nearly 3 in 10 <strong>Bradford</strong> LSOAs fell into the 10% most income deprived in England. This<br />
amounts to 90 <strong>Bradford</strong> LSOAs, where typically at least 34% of the population were on very<br />
low incomes. This rose to 75% of people in the most deprived area of Undercliffe.<br />
63
Some 16% of <strong>Bradford</strong>’s LSOAs are in the 10% most employment deprived nationally. In<br />
these 49 LSOAs typically 1 in 5 (19%) of the population are claiming key benefits such as<br />
Job Seekers Allowance (JSA), Incapacity Benefit, (IB), Severe Disablement Allowance,<br />
(SDA) or are on New Deal programmes. An area of Little Horton ward (ranked 69th<br />
nationally) was the most employment deprived in the District, where 39% of its population are<br />
on benefits. 7<br />
The recent Regional Trends report 8 , published by the Office of National Statistics, also<br />
reflects the outcome of the IMD 2007. According to the Regional Trends report <strong>Bradford</strong> is<br />
one of the most deprived cities in the Yorkshire and Humber region with 41% of the areas<br />
across the district among the most deprived in the country. The only place with more pockets<br />
of deprivation in the Region is Hull. By contrast only 11% of the <strong>Bradford</strong> district is in the<br />
least-deprived bracket.<br />
Some of the places struggling most are in inner city areas including Bowling and Little Horton<br />
and areas of Shipley and Keighley.<br />
Deprivation is measured in the Regional Trends report by factors including low income,<br />
unemployment, lack of education, poor health and crime. There isn’t one factor which drags<br />
<strong>Bradford</strong> down overall, it has fairly high levels of deprivation for most of these factors.<br />
<strong>Bradford</strong> also seems quite polarised. Barnsley and Wakefield, for example, have fewer<br />
areas in the most deprived bracket than <strong>Bradford</strong>, but also fewer areas in the least deprived<br />
bracket, and more in the middle. Most of the actual city of <strong>Bradford</strong> has high levels of<br />
deprivation, and so does Keighley. Other areas to the north of the city centre, but still within<br />
the local authority, such as Baildon, Bingley and Ilkley, have less deprivation.<br />
4.3 Education and Skills<br />
The skills of the population are central to the economic success and the competitiveness of a<br />
locality. But in <strong>Bradford</strong>, skill levels in the workforce is relatively low which could act as a<br />
constraint on the economy and prevent <strong>Bradford</strong> from taking advantage of its comparative<br />
advantages with the neighbouring areas, especially low land values and office rental values.<br />
4.3.1 Qualifications<br />
Around 162,100 people of working age in <strong>Bradford</strong> are qualified to at least NVQ level 2.<br />
While this has increased significantly over the past 5 years, <strong>Bradford</strong> still lags behind<br />
regional and national averages. <strong>Bradford</strong> also has the highest proportion of people without<br />
any qualifications among all West Yorkshire Districts. 9 Further, <strong>Bradford</strong> has the lowest<br />
7 <strong>Bradford</strong> and Airedale Joint Strategic Needs Assessment (2009)<br />
8 Office of National Statistics (2009) Regional Trends No 41. London: ONS.<br />
9 Yorkshire Forward (2009) <strong>Bradford</strong> in Brief November 2006 [online]. Yorkshire Forward [accessed<br />
20 th April 2009] < http://www.yorkshirefutures.com/cb.aspx?page=CC6934FF-85FD-4341-B2C3-<br />
DB0804E8E103 ><br />
64
incidence of employers providing training to their workforce. This indicates that the district is<br />
likely to find it harder to increase productivity. 10<br />
Table 2: Proportion of working age population qualified to NVQ level at 2006<br />
Working age population: men aged 15 to 64 years & women aged 15 to 59 years<br />
The skill level of <strong>Bradford</strong> residents varies significantly across the district. In some wards, for<br />
example, a typical inner city ward like Little Horton, over half of all adults are without any<br />
qualifications (or have qualifications whose level is not known), whereas Rombalds as a<br />
typical affluent ward has far greater proportions (37%) of adults with higher level<br />
qualifications.<br />
4.3.2 GCSE Attainment<br />
According to the following figure, only 46% of 16 years old in <strong>Bradford</strong> achieved the threshold<br />
of 5 GCSEs grade A* - C, 10% below the England average of 56%. However, between 2005<br />
and 2006 the proportion of Year 11 pupils gaining five GCSE grades A*-C (the equivalent of<br />
NVQ level 2) in the District increased from 46.8% to 50.2% thus continuing to reduce the gap<br />
between the local and national average pass rates. 11<br />
Figure 6: GCSE and Equivalent - Percent of Pupils Gaining 5 A* - C 2004/05<br />
60%<br />
50%<br />
40%<br />
30%<br />
20%<br />
10%<br />
0%<br />
56% 55%<br />
Source: DfES, in Your Area.<br />
51%<br />
49%<br />
10 <strong>Bradford</strong> Economic Partnership and <strong>Bradford</strong> Council (2007). Economic <strong>Strategy</strong> for <strong>Bradford</strong><br />
District 2007-2020. <strong>Bradford</strong> Economic Partnership and <strong>Bradford</strong> Council.<br />
8 <strong>Bradford</strong> Economic Partnership and <strong>Bradford</strong> Council (2007). Economic <strong>Strategy</strong> for <strong>Bradford</strong> District<br />
2007-2020. <strong>Bradford</strong> Economic Partnership and <strong>Bradford</strong> Council.<br />
46%<br />
51%<br />
Wakefield Calderdale Kirkless Leeds <strong>Bradford</strong> Y&H England<br />
56%<br />
65
From 2006 the DfES’s preferred measure of attainment at GCSE level is five passes grade<br />
A*-C including English and Maths. On this measure, the gap between the District pass rate<br />
and the national rate is considerably wider at 34% (<strong>Bradford</strong>) compared with 45.8%<br />
(England) - although the gap has reduced since 2004.<br />
Figure 7: % of 15 year old students achieving 5 or more A*-C GCSEs including English and Maths<br />
4.3.3 Further & Higher Education<br />
The proportion of Year 11 pupils staying on in full-time education has increased in <strong>Bradford</strong><br />
from 64.7% in 2004 to 73.1% in 2006. This is higher than the average for West Yorkshire<br />
(72.9%) and similar to Yorkshire & Humber levels (73.4%), but still falls short of the national<br />
figure (77.9%). 12<br />
Nearly 52% of <strong>Bradford</strong>’s Year 13 pupils moved into higher education in 2006. In 2005/06<br />
there were over 13,000 students studying at <strong>Bradford</strong> University. The University has around<br />
140 degree courses at undergraduate level and around 80 at postgraduate level. These are<br />
spread across the 7 Academic Schools of Engineering, Design and Technology, Health<br />
Studies, Informatics, Life Sciences (including Archaeological, Geographical and<br />
Environmental Sciences), Management, Social and International Studies, and the School of<br />
Lifelong Education and Development, which also offers part-time courses.<br />
The University also has an excellent graduate employment record, and was rated 2nd out of<br />
99 UK Universities for employment in The Times Good University Guide 2006 and ranked<br />
number 1 for employment in the North of England.<br />
However, according to the Complete University Guide 2010 13 (based on data from the<br />
2007/08 academic year), <strong>Bradford</strong>’s graduate prospects score has fell from 73.9, the best in<br />
12 <strong>Bradford</strong> Economic Partnership and <strong>Bradford</strong> Council (2007). Economic <strong>Strategy</strong> for <strong>Bradford</strong><br />
District 2007-2020. <strong>Bradford</strong> Economic Partnership and <strong>Bradford</strong> Council.<br />
13 The complete University Guide (2009) University League Table 2010 [online].<br />
<br />
66
Yorkshire last year, to 70.4 – a trend only replicated in the region at York University and the<br />
University has slipped eight places to 57th in a national higher education league table.<br />
Students graduating with good degrees however rose by the third highest margin in<br />
Yorkshire and Humber and it keeps its place as fifth best out of the nine universities in the<br />
region, ahead of Sheffield Hallam but below Hull.<br />
Despite its lower research score, the guide recognised that <strong>Bradford</strong> has several areas of<br />
world-class research including in peace studies, polymers, mechanical engineering, medical<br />
biosciences and archaeological science.<br />
The guide reports that the university has more than 1,500 computer workstations across the<br />
campus, 500 more than last year, while the main library contains more than 600,000 books,<br />
up 20 per cent in 12 months.<br />
The University received four applications per place during the past academic year, down<br />
from seven last year. Its male/female student ratio is 49:51, state/private school ratio 96:4<br />
and home/international ratio 84:16.<br />
A study conducted by DTZ on the City Centre Housing Market has highlighted that <strong>Bradford</strong><br />
has relatively low level of graduate retention when compared to other cities although over<br />
half of the city centre residents they surveyed possess qualifications at or higher than a first<br />
degree/HND/GNVQ or equivalent. A separate report by the UoB Career Development<br />
Services (2006) also shows that only 38% of the students graduated from <strong>Bradford</strong><br />
University in 2004/05 retained within <strong>Bradford</strong>.<br />
4.4 Economic Activity<br />
4.4.1 Economic Trends<br />
<strong>Bradford</strong> has experienced economic growth in recent years but is underperforming generally<br />
when compared to the national picture and to other districts in the region. Large falls in<br />
traditional manufacturing employment have negated the impact of respectable service sector<br />
growth. Despite these falls in manufacturing employment, <strong>Bradford</strong> has still a larger<br />
proportion of people employed in these sectors (18.3%) than the Region (15.8%) and the UK<br />
as a whole (12.6%). 14<br />
In June 2009, the claimant unemployment count in <strong>Bradford</strong> district was 15,620, up by nearly<br />
6,300 since June 2008, when unemployment levels began rising significantly, and is now at<br />
its highest level for almost 12 years. The district’s claimant rate stands at 5.1% of the working<br />
age population, compared to the Yorkshire & Humber regional rate of 4.7%, and the national<br />
rate of 4.1%.<br />
Probably a more comprehensive measure of economic well being in the District is The Index<br />
of Multiple Deprivation 2007, which takes a measure of deprivation based on multiple<br />
14 CBMDC (2007) <strong>Core</strong> <strong>Strategy</strong> Issues and Options Topic Paper 4: Economy and Jobs. CBMDC.<br />
67
indicators. Overall <strong>Bradford</strong> is the 4th most deprived local authority on income deprivation<br />
and the 6th most deprived on employment deprivation. Over 190000 people, 42% of the<br />
District’s population live in wards that fall within 20% most deprived areas of the country and<br />
5% (over 20,000 people) in the 1% most deprived.<br />
It is not just the inner city areas which suffer from deprivation, the rural economies within the<br />
Leeds City Region, including <strong>Bradford</strong>, face particular challenges, predominately as a result<br />
of poor physical connectivity. Agriculture and farming have declined in recent years, there<br />
been pockets of severe deprivation and social exclusion with problems of housing<br />
affordability and poor access to services, and some places displaying significant disparities in<br />
wealth together with low business survival rates.<br />
Most of these general trends are not unique to <strong>Bradford</strong> and are characteristic of many<br />
northern cities, but the data does suggest many of these problems are more prevalent in<br />
<strong>Bradford</strong>. However the key points emerging from the analysis is that<br />
• <strong>Bradford</strong> has a larger than average proportion of workers employed in the declining<br />
traditional manufacturing sectors.<br />
• It has relatively high levels of unemployment.<br />
• Nationally in terms of key indicators it is one of the most deprived areas in the<br />
country with particularly high spatial concentrations of deprivation<br />
Tourism is an often overlooked contributor to the economy and the Good Practice Guide for<br />
Tourism (May 2006) stresses the vital importance of tourism both to national and local<br />
economies. For example tourism nationally contributes 74 billion to GDP therefore<br />
accounting for 6.4% of the UK’s total GDP. At the local level the guide says that Tourism can<br />
be the focus of regeneration of urban and rural areas and provide a catalyst for growth. It<br />
can also provide opportunities for re-training the resident workforce and diversify economies<br />
that are over reliant on a fairly narrow base of industries.<br />
4.4.2 Location of Employment Activities: Regional Context<br />
The growth sectors of the economy are changing and these new growth sectors have<br />
different locational requirements to the older manufacturing sectors. <strong>Bradford</strong> has a larger<br />
proportion of workers employed in the sectors that are expected to decline in the next 10 to<br />
15 years particularly in the traditional manufacturing sectors.<br />
The Leeds City Reion Development Programme (LCC, 2006) has highlighted that if the<br />
prosperity of the Region is to be increased there is a need to provide land that is locationally<br />
attractive for the new growth sectors so to try and increase the proportion of the district’s<br />
workers employed in these growth sectors. Forecasts by Arups and Experian show that the<br />
main growth areas in terms of employment are in the financial and business services, public<br />
admin, health and education, sectors that are mainly office based.<br />
The RSS states (Policy E3) that significant land should be provided in sustainable locations<br />
to meet the needs of the modern economy and they should be in locations well served by<br />
68
public transport links. However many sites that have been identified in the Replacement UDP<br />
have not been taken up for development and are not in locations suitable for the growing<br />
business sectors. Furthermore (Policy E2) that states that existing City and Town Centres<br />
should be the main location for office uses.<br />
4.4.3 <strong>Bradford</strong> Employment Land Review and Forecast<br />
The Council commissioned ARUPS to carry out the study in late summer 2007 and the report<br />
was delivered in December of that year. ARUPS were supplied with and assessed the<br />
employment land supply portfolio in the Council’s monitoring systems, mainly current RUDP<br />
allocations together with the sites previously considered in the draft RUDP and any windfall<br />
planning permissions which were granted between 2002 and 2007. All of these sites were<br />
assessed against a range of criteria to determine their suitability for inclusion in the future<br />
supply, focusing on site constraints, deliverability, market attractiveness and availability in the<br />
short medium or longer term. The study also assessed <strong>Bradford</strong>’s current market<br />
performance for both the office and industrial sectors and looked at future strategies for<br />
improving economic performance.<br />
Current situation<br />
In profiling <strong>Bradford</strong> District it regards the main asset as being the Districts role within the city<br />
region and its relationship with Leeds. It focuses on the growing working age population<br />
seeing this as positive opportunity to avail of employment opportunities in the Districts growth<br />
sectors. It describes <strong>Bradford</strong> as having a strong economic base in the M606 and canal road<br />
corridors with potential for growth along Airedale in the towns of Shipley, Bingley and<br />
Keighley. It only pays passing regard to Wharfedale. It recognises the potential links of the<br />
extended M606 corridor and to the north with Skipton, the potential for a growth in the small<br />
businesses in the Leeds <strong>Bradford</strong> corridor. The report describes the economic shortfalls<br />
within the District making general regional comparisons. The District has lower employment<br />
rates, higher rates of youth employment, has a low wage low skill economy and lower than<br />
average earnings. The existing large and small businesses come from a broad range of<br />
sectors and they continue to perform well. The largest are located within <strong>Bradford</strong>’s urban<br />
area but there is a noticeable absence within the central business district. There is strong<br />
growth in SME’s and business start-ups compared to the rest of the region and this bears<br />
well for future growth.<br />
The property market is analysed using PROMIS data in terms of availability or otherwise. It<br />
sees the office market in <strong>Bradford</strong> as underperforming with only a small offer of modern<br />
stock. It suggests that there is considerable scope for new grade ‘A’ accommodation and<br />
that this would be let. Shipley, Saltaire and Baildon perform weakly but proposed new<br />
developments in Shipley can transform this image. Bingley has the building society and a<br />
number of office premises in business parks. Development of Coolgardie and the auction<br />
market sites could increase demand. In Keighley the majority of existing office available<br />
accommodation is found in poor quality space above retail premises or converted mill<br />
buildings and Devonshire Street is regarded as the hub of the office market. Similarly, in<br />
69
Ilkley the offer is limited largely to local professional services in the town centre and future<br />
demand is likely to be low.<br />
The existing industrial market is described as being generally outdated with very little new<br />
build in recent years. There has been little change across the market. Current availability is<br />
256,000 sq m which is about 5% of total stock. This is below general averages. Demand for<br />
space is for units of 25000 to 50000 sq ft. Premises are generally cheaper than national<br />
averages. The M606 corridor is the key to new demand, sites on the western side of the city<br />
are not attractive and the Bowling Back Lane area is the centre for ‘dirty’ uses. Industrial<br />
accommodation in Shipley is focused around a select number of business parks and<br />
industrial estates as well as smaller older units in and around the town but the construction of<br />
the Shipley Eastern Bypass may unlock new development potential. Shipley is a clear<br />
candidate for the delivery of the Advance Digital Institute and market. In Bingley town centre<br />
industrial premises are largely confined to old mill building but there are a number of<br />
industrial parks dispersed around the periphery. The key locations for future development<br />
are at Coolgardie and the A650 corridor. Bingley and the proposed technology park will<br />
provide a degree of complimentary business to Shipley and if this is delivered demand will be<br />
good. Demand for industrial premises in Keighley is strong and the market comprises a<br />
multitude of accommodation from light industrial to high quality warehouse distribution<br />
premises and rents vary widely. However industrial land has developed sporadically and<br />
around individual requirements over a long time horizon. The result is a substantial amount<br />
of poor second hand stock part vacant and in disrepair. It appears there is too much old<br />
second hand and not enough modern accommodation. Ilkley has minimal accommodation,<br />
site having been developed for higher value uses. In general terms for the district 1, there is<br />
an over supply of poor quality stock, 2, the older spatial distribution does not meet modern<br />
markets or occupiers, 3, there is currently no central business district focus and 4, there is<br />
inadequate provision of large industrial sites in the right locations to meet emerging demand<br />
in both B2 and B8 requirements.<br />
The current estimated supply of allocated undeveloped employment land is 150.5 ha. This<br />
comprises 28 sites under 1ha, 24 sites between 1 and 5ha and 7 sites over 5ha. Of these, a<br />
total of 26.47ha have an extant consent for employment uses whilst planning applications are<br />
currently pending on a further 36.37ha. This would leave approximately 88ha of land<br />
available but without planning backing. Historically the main take up of employment land has<br />
been focused on constituencies <strong>Bradford</strong> North and <strong>Bradford</strong> South. Keighley has the 3 rd<br />
largest rate of take up. The average rate of take up across the district over the last 10 years<br />
has been 14.6ha although it has been characterised by peaks and troughs. The constraints<br />
associated with the employment land supply relate to the lack of variety of sites with a<br />
predominance of smaller sites under 5ha, poor quality sites with problems of contamination<br />
and poor access. The current supply can be characterised as infill or expansion sites with<br />
the exception of a few strategic sites. The nature of the supply therefore does not meet<br />
modern business demands.<br />
70
Future Change<br />
<strong>Bradford</strong> has aspirations for transformational change and strategic economic growth. The<br />
RSS and the Economic Strategies recognise significant opportunity to expand sectors of the<br />
knowledge industry. Under an unconstrained growth forecasting model, continued economic<br />
growth and job creation is envisaged in the business, professional and service sectors with<br />
the financial and business services sector to grow by over 11%. Economic policy also<br />
recognises the role of emerging sectors including design and technology, digital media,<br />
construction, education and health with links to <strong>Bradford</strong> University. There is also projected<br />
growth in retail, leisure and catering whilst forecasts show a decline in primary utilities and<br />
other public services sectors. Statistics show a strong business start-up economy and<br />
SME’s and <strong>Bradford</strong> needs to maintain the infrastructure to sustain this success. The result<br />
means that there will need to be a supply of high quality sites for high density office based<br />
uses. There will also be a need for sufficient land in particular locations which will enable the<br />
co location of businesses which is important to establish growth clusters, incubator units and<br />
innovation centres. <strong>Bradford</strong>’s traditional manufacturing base will still account for a<br />
significant proportion of the districts employment and therefore there will still be a need for a<br />
portfolio of low quality, low value sites to meet the demands of the manufacturing and<br />
industrial sector.<br />
The spatial focus for new development is in urban areas and main settlements. Any new<br />
employment strategy will need to consider how outlying settlements contribute to meeting<br />
need, with perhaps sustainable sites in Esholt, Silsden and Steeton. The Priority<br />
Regeneration areas such as Canal road corridor will need to evaluate the displacement of<br />
the older industrial fabric and the implications for maintaining supply of employment land to<br />
support regeneration principles.<br />
An analysis of future demand for employment land is based on various modelling techniques<br />
and growth scenarios. The Employment Land Monitoring Returns Model has limitations but<br />
is useful in that it shows trends on a financial yearly basis and informs understanding<br />
regarding geographic interest. It shows which areas business and industry has considered<br />
to be the right location for employment in the past. In this respect the winners were <strong>Bradford</strong><br />
North, <strong>Bradford</strong> South and Keighley. Commercial and Industrial Floorspace and Rateable<br />
Value Statistics (ODPM 2005) help to differentiate between Use Classes and data can be<br />
extrapolated to 2016. Historic trends show a reduction in demand of all employment land<br />
uses up to 2016. However this does not take account of economic growth modelling and the<br />
delivery of regeneration schemes. The Experian Regional Econometric Model is the data<br />
source used for the final quantitative employment projection and two economic scenarios<br />
have been applied to the data used for this study. These are 1, unrestrained growth which<br />
forecasts 25901 jobs and 2, constrained growth which forecasts a 32% reduction in output.<br />
Based on the two growth scenarios, the projected land requirement for the district between<br />
2016 and 2021 is between 214ha and 148 ha. This includes:<br />
B1a = 40ha to 30ha<br />
B1b and c/B2 = 100ha to 68ha<br />
B8 = 74ha to 50ha.<br />
71
Future <strong>Strategy</strong><br />
The Review seeks to match demand and supply as well as make recommendations on the<br />
strategic role of settlements to bring forward a flexible, varied and quality supply of<br />
employment land. Given that there has been some take up from the base figure in April<br />
2006, the residual projected demand is 129ha for constrained growth and 195ha for<br />
unconstrained growth. The review of the existing allocated sites recommends that 127ha are<br />
retained as allocated sites and 11ha are reconsidered while 13ha are de-allocated for other<br />
uses. When supply is measured against supply, in an unconstrained growth scenario there<br />
is need for a further 51.36ha of land. In a constrained growth scenario, there is an over<br />
supply of 14.64ha. The residual demand for the unconstrained growth scenario is likely to be<br />
for B2 uses.<br />
From a spatial viewpoint, <strong>Bradford</strong> City Centre will meet approximately half of the projected<br />
demand for B1a uses. <strong>Bradford</strong> South along the M606 should be the pipeline for future B2<br />
and B8 uses although the projected demand for B8 will be provided by West Bowling Golf<br />
Course. <strong>Bradford</strong> West can still supply smaller sites for local demand B2 and B8 uses.<br />
Bowling Back Lane and Canal road are the main drivers in <strong>Bradford</strong> North constituency.<br />
Shipley is dependant on major interventions through infrastructure schemes. Bingley can<br />
avail of the Technology Park and its associated clusters. Proactive intervention is needed in<br />
Keighley to enable strategic sites to come forward whilst Steeton and Silsden should provide<br />
for a local sustainable market. Similarly Ilkley and Burley can accommodate local demand<br />
and also provide for high quality new start up space.<br />
4.4.4 Protecting Existing Employment Land and Buildings<br />
The Replacement UDP has sought to protect existing employment buildings and sites from<br />
being redeveloped for other uses in order to minimise the allocations of new land in the<br />
District. It has also tried to ensure that existing employment land and buildings are reused<br />
for employment where they are still fit for purpose.<br />
Existing brownfield employment sites are coming under increasing pressure to be<br />
redeveloped for other uses than employment. The RSS considers that opportunities to<br />
redevelop older industrial areas for housing should be exploited and PPS3 states that<br />
additional housing schemes should be supported in industrial areas no longer suitable for<br />
continuing employment use. The LDF will therefore need to review both the extent, and<br />
where it protects existing industrial areas from being developed for uses other than<br />
employment.<br />
Employment Land Forecasts suggest that less land overall is needed for employment in the<br />
District and the land is needed in different locations. We may be therefore protecting land<br />
and buildings that are now not either required, or in suitable locations for employment uses.<br />
72
4.4.5 Rural Diversification<br />
The District being two thirds rural it has a significant rural economy. This has undergone<br />
major changes in recent years. Farmers are facing many challenges following BSE, foot &<br />
mouth disease and the reform of the European Agricultural Policy. In response many farmers<br />
are looking at new ways of generating income by diversifying into alternative enterprises<br />
outside of their mainstream agricultural activities. The landscape of the District is important<br />
to the quality of place for those living and working in the district therefore any change needs<br />
to be managed sensitively.<br />
4.5 Employment and Earnings<br />
4.5.1 Economic Activity rates<br />
Economic activity rates, together with rates of pay from employment, are critical factors in the<br />
wellbeing of the local population and are inextricably connected with the economic welfare of<br />
the district as a whole. They also underlie inequalities and relative deprivation across the<br />
district.<br />
<strong>Bradford</strong> has a lower proportion of economically active residents than Y+H and the country<br />
as a whole. In 2006/7 73.9% of all working age residents in the District were economically<br />
active. This compares to 78.5% nationally and 77.6% in Yorkshire and the Humber (Y+H).<br />
Table 4: Economically Active and Inactive (Oct 2006- Sept 2007)<br />
Source: Nomis web.co.uk<br />
There are some differences in the types of employment available in <strong>Bradford</strong> compared to<br />
Y+H and GB. For example, we have a lower proportion of professional occupations, a slightly<br />
higher proportion of personal service occupations and a higher proportion of plant and<br />
process machine operatives. (B+A Str Needs Assessment)<br />
73
4.5.2 Employment rates<br />
Latest data from the<br />
ONS Annual Population<br />
Survey shows that<br />
208,800 working age<br />
residents in <strong>Bradford</strong><br />
District were in<br />
employment over the<br />
period January to<br />
December 2007, giving<br />
an employment rate for<br />
the District of 68.5%.<br />
This rate is significantly<br />
below the regional<br />
(73.2%) and national<br />
(74.3%) averages.<br />
Although <strong>Bradford</strong>’s employment rate is relatively low, the number of <strong>Bradford</strong> residents in<br />
employment has increased significantly over recent years from 200,700 (January to<br />
December 2005) to 208,800 (January to December 2007), however, the District’s working<br />
age population grew at a faster rate over the same period resulting in a fall in the<br />
employment rate from 69.9% to 68.5%.<br />
The decline experienced in employment rates in <strong>Bradford</strong>, over the years 2005 to 2007,<br />
reflects similar downward trends in the Yorkshire and the Humber region, however, over the<br />
same period the employment rate for the UK has remained fairly static. 15<br />
4.5.3 Occupation Profile<br />
38% of <strong>Bradford</strong> residents are employed in higher level occupations - Managers & Senior<br />
Professional and Associate Professional & Technical occupations.<br />
Table 5: Employment By Occupation Group<br />
Figure 8: Working age employment rates 2007<br />
15 <strong>Bradford</strong> Economy (2008) Employment Rates [online]. CBMDC [accessed 20 th July 2009].<br />
.<br />
74
GB<br />
Y&H<br />
<strong>Bradford</strong><br />
Figure Chart 09: 7: Employment by occupation by occupation<br />
0% 10% 20% 30% 40% 50% 60% 70% 80% 90% 100%<br />
4.5.4 Self-Employment<br />
Self-employment can be<br />
used as a measure of<br />
entrepreneurial activity in<br />
an area. The latest<br />
Annual Population Survey<br />
shows the rate of selfemployment<br />
in <strong>Bradford</strong> is<br />
11%. This rate has<br />
fluctuated over the<br />
previous two years and<br />
has fallen just below the<br />
regional average. 16<br />
Managers & senior officials Professional occupations Associate professional & technical<br />
Administrative & secretarial occs. Skilled trades occupations Personal service occupations<br />
Sales & customer services occs. Process plant & machine operatives Elementary occupations<br />
<strong>Bradford</strong> has been highlighted as an entrepreneurial District. Acxiom Household Lifestyle<br />
Survey 2006 data revealed that 4.8% of households have an adult thinking of starting a<br />
business; this is higher than sub-regional and regional figures.<br />
4.5.5 Earnings & Income<br />
Figure 10 : Self-employment Percentage in Employment<br />
According to the Annual Survey for Hours & Earnings (ASHE) April 2007 data, <strong>Bradford</strong><br />
residents in full time employment earn on average £381.50 per week, compared to £425<br />
regionally and £459 nationally. Between 2004 and 2007, median earnings for <strong>Bradford</strong><br />
residents rose by 7.5%, but this was lower than the regional and national increase. Male full-<br />
16 <strong>Bradford</strong> Economic Partnership and <strong>Bradford</strong> Council (2007). Economic <strong>Strategy</strong> for <strong>Bradford</strong><br />
District 2007-2020. <strong>Bradford</strong> Economic Partnership and <strong>Bradford</strong> Council.<br />
75
time earnings, however, are increasing significantly and at a faster rate than regional and<br />
national average. 17<br />
Table 5: Earnings 2007<br />
Source: Nomis web.co.uk<br />
The average gross household income<br />
(including income from investments and<br />
benefits) in the District was estimated at<br />
£30,700 in 2007 (CACI Ltd). This is close to<br />
the average for the Yorkshire and Humber<br />
region, but lower than the national average<br />
of £33,700.<br />
The mean income figure masks the wide<br />
variation in household incomes across the<br />
District. According to statistics updated in<br />
2007, nearly 15% of households in <strong>Bradford</strong><br />
have an average income of £50,000 or<br />
17 <strong>Bradford</strong> Economy (2008) Average Earnings [online]. CBMDC [accessed 20 th July 2009].<br />
< http://bradfordeconomy.com/facts_and_figures/people/average_earnings >.<br />
76
more. Wharfedale and Ilkley Wards have<br />
the highest average household incomes at<br />
over £40,000. In these Wards, over 30% of<br />
the households respectively have an<br />
average household income in excess of<br />
£50,000.<br />
Conversely, inner city wards e.g. Little<br />
Horton ward has the lowest average<br />
household income at around £22,000 and<br />
only 4% of households in the ward has<br />
household incomes above £50,000. Such<br />
disparities in wealth across the District do not<br />
appear to be reducing.<br />
4.5.6 Unemployment and Worklessness<br />
The Strategic Engagement Team of the Council’s Economic Development Service produces<br />
monthly unemployment updates with figures from the Office of National Statistics, Jobcentre<br />
plus and other relevant sources. The following discussions highlight the latest unemployment<br />
situation in <strong>Bradford</strong> District as published in the July 2009 bulletin which could be accessed<br />
online at<br />
http://bradfordeconomy.com/facts_and_figures/people/monthly_unemployment_updateUnem<br />
ployment<br />
Unemployment Trend<br />
The unemployment rate in <strong>Bradford</strong> fell rapidly in previous years before the ongoing<br />
recession affected the economy, but the more recent figures published in July 2009 show<br />
that unemployment is increasing again in <strong>Bradford</strong>, despite a regional and national decline in<br />
claimants since May 2009.<br />
Table 6 : Monthly and annual change in claimant rates<br />
Area<br />
Claimants<br />
June 2009<br />
Monthly Change<br />
(Apr 09-May 09)<br />
Monthly Change<br />
(May 09 - Jun 09)<br />
Annual Change<br />
(Jun 08 - Jun 09)<br />
No Rate No % No % No %<br />
<strong>Bradford</strong> 15,620 5.1 180 1.2 104 0.7 6,266 67.0<br />
Leeds City Region 82,559 4.5 1,072 1.3 -305 -0.4 38,983 89.5<br />
Yorkshire & Humber 152,746 4.7 1,433 0.9 -836 -0.5 71,919 89.0<br />
United Kingdom 1,553,256 4.1 7,362 0.5 -11,722 -0.7 717,939 85.9<br />
Source: Monthly unemployment updates June 2009 and July 2009<br />
Figure 11: Income Distribution across the District (2005)<br />
Source: CACI Paycheck Data 2005<br />
In June 2009, the claimant unemployment count in <strong>Bradford</strong> district was 15,620, up by nearly<br />
6,300 since June 2008, when unemployment levels began rising significantly, and is now at<br />
its highest level for almost 12 years. The district’s claimant rate stands at 5.1% of the working<br />
77
age population, compared to the Yorkshire & Humber regional rate of 4.7%, and the national<br />
rate of 4.1%.<br />
Figure 11: Claimant rate Trends- May 2008 to May 2009<br />
Sources: Jobcentre Plus data, Nomis<br />
The number of claimants in<br />
<strong>Bradford</strong> increased by 104,<br />
or 0.7%, over the month.<br />
While this goes against a<br />
drop in claimant numbers<br />
regionally and nationally,<br />
this increase represents the<br />
smallest monthly rise than<br />
has been seen over the last<br />
year and <strong>Bradford</strong>’s overall<br />
growth in unemployment<br />
over the last 12 months has<br />
been slower than regionally<br />
and nationally.<br />
Youth unemployment (aged 18-24)<br />
There are currently 4,550 young claimants aged 18-24 (29.2% of all claimants) and this has<br />
dropped slightly since May 2009. The number of youth claimants has increased by 58.6%<br />
since June 2008, but they make up a lower proportion of the total claimants than last year.<br />
The biggest percentage increases in claimants have been in the older age groups.<br />
Youth unemployment is a growing concern nationally and locally. 8.5% of all 18-24 year olds<br />
are claiming, and this is a higher rate than for the other age band. However, <strong>Bradford</strong><br />
compares with the regional rate (8.5%) and is below the national rate (7.7%) for youth<br />
claimants. Further analysis is expected to be undertaken to better understand the issue of<br />
Youth Unemployment in <strong>Bradford</strong>, and this will be published shortly.<br />
Long-term claimants (over 12 months)<br />
People who have claimed for 12 months or more are classed as long term unemployed –<br />
there are 1,300 long term claimants in <strong>Bradford</strong>, which is 8.3% of all claimants. Due to high<br />
on-flows over recent months, the largest (and most quickly growing) are those who have<br />
claimed for less than a year. However, after a period of decline, the number of long term<br />
claimants has been rising steadily since September 2008 and may continue to rise through<br />
the recession.<br />
Usual occupation<br />
In June 2009 the majority of claimants (39.8%) stated their usual occupation as Elementary.<br />
However, since June 2008 the occupation profile of claimants has shifted slightly.<br />
78
Figure 12: Proportion of Claimants by Usual Occupation<br />
A greater proportion of<br />
claimants are from Skilled<br />
Trades (increased by<br />
133% since last year).<br />
The increasing number of<br />
construction workers<br />
signing on is a key<br />
indicator of local<br />
economic conditions.<br />
While numbers from<br />
higher-level occupations<br />
(managerial, professional<br />
and technical) are still<br />
Source: Jobcentre Plus data, Nomis<br />
relatively small, the<br />
proportion of claimants from these occupations has increased from 8.9% to 10.4% over the<br />
last 12 months.<br />
Constituencies and wards<br />
Geographical analysis of claimant rates at ward level shows that unemployment is most<br />
highly concentrated around the inner city areas within Bowling and Berkerend (8.1%), Tong<br />
(8.0%), Little Horton (7.9%) and Manningham (7.9%). Hot spots also occur in Keighley<br />
South, and Shipley East, which have unemployment rates above the district average. The<br />
lowest unemployment is found in Wharfdale (1.6%) and Ilkley (1.8%) to the north of the<br />
District.<br />
Table 7: Claimant rates by Parliamentary Constituency<br />
Parliamentary Constituency Claimants June 2009 Annual Change (June 08- June 09)<br />
Number Rate Number % Change % Point Change<br />
<strong>Bradford</strong> North 3,711 6.3 1,291 53.3 2.2<br />
<strong>Bradford</strong> South 3,507 5.7 1,638 87.6 2.7<br />
<strong>Bradford</strong> west 3,993 5.7 1,235 44.8 1.8<br />
Keighley 2,222 4.0 978 78.6 1.8<br />
Shipley 2,187 3.9 1,124 105.7 2.0<br />
Source: Jobcentre Plus data, Nomis<br />
In terms of electoral constituencies, <strong>Bradford</strong> North has the highest claimant rate (6.3%) and<br />
Shipley Constituency has the lowest (3.9%). <strong>Bradford</strong> South has experienced the greatest<br />
rise in the number of claimants over the year and the largest percentage point increase in its<br />
claimant rate.<br />
When looking at changes in unemployment rates in small areas it is advisable to calculate<br />
percentage point changes. Table below contains these percentage point changes and shows<br />
79
that the most significant increases in claimant rates over the last year have occurred in Tong<br />
and Royds wards. Bowling & Barkerend, Windhill & Wrose, Keighley Central and Wyke have<br />
also experienced a significant increase in claimant rates. Conversely, City, Heaton,<br />
Manningham and Toller wards have experienced a lower than average increase in claimant<br />
rate over the last year.<br />
Table 8 : Claimant rates by Ward<br />
Even at ward level, small pockets of unemployment can be hidden. The following map<br />
presents claimant rates at Super Output Area (SOA) level. The district is split into 306 SOAs,<br />
with between 9 and 12 in each ward. Rates have been estimated using ONS Mid-2007<br />
working age population estimates for lower SOAs.<br />
There are pockets of very high claimant rates (over 14%) in Holmewood, Barkerend, Little<br />
Horton and Aireworth in Keighley.<br />
80
Figure 13: <strong>Bradford</strong> JSA claimant rates by SOA<br />
Source: Monthly Unemployment Updates (July 2009)<br />
Vacancies<br />
There were 1,481 live unfilled vacancies<br />
registered at <strong>Bradford</strong>’s Jobcentre Plus<br />
offices in June 2009. While this<br />
number is significantly lower than at the<br />
same time last year, vacancy numbers<br />
have risen slightly since the beginning of<br />
the year.<br />
In June 2009 there was an average of<br />
10 claimants for every live vacancy,<br />
compared to 3 per vacancy 12 months<br />
ago.<br />
Figure 14: The Number of Unfilled Vacancies at<br />
<strong>Bradford</strong> Jobcentre Plus Offices<br />
Source: Jobcentre Plus data, Nomis<br />
Jobcentre Plus does not list all vacancies in the economy. National research suggested that<br />
between a third and half of all vacancies are listed by Jobcentre Plus, with a bias towards<br />
lower-level jobs (Source: Labour Market Trends - July 2003, pp 349 – 362), but this will vary<br />
over time, by area and by occupation and industry.<br />
81
Alternative measures of unemployment<br />
ILO unemployment<br />
The Labour Force Survey is the government’s preferred measure of unemployment, and is<br />
based on the International Labour Organisation (ILO) definition which includes all those who<br />
are out of work and actively se eking employment. This measure of unemployment is greater<br />
than the claimant-based measure due to its broader definition as it includes those who are not<br />
eligible to claim benefits or choose not to claim.<br />
National data released on 15 July 2009 showed that during the three months to May 2009,<br />
unemployment in the UK had risen to 2.38 million, increasing the national unemployment rate<br />
to 7 .6%.<br />
At local level, the data lags further behind. The latest quarterly data refers to Jan 2008-Dec<br />
2008, when there were 17,700 people unemployed in <strong>Bradford</strong>, a rate of 7.6% of the working<br />
age population, compared to 6.5% for the Yorkshire & Humber region and 5.9% for the UK.<br />
DWP benefit claimants<br />
The Department of Work and Pensions (DWP) publish quarterly figures on working age<br />
benefit claimants by client group. Working age benefits include JSA, Incapacity Benefit, Lone<br />
Parent benefits, Carer and Bereavement benefits. Looking at the number of people claiming<br />
one or more or these benefits gives us another picture of worklessness in the district.<br />
According to the latest DWP working age client group figures, as of August 2008 there were a<br />
total of 52,030 people claiming a workless benefit in <strong>Bradford</strong>, a rate of 17% of the working<br />
age population, higher than the regional and national figures.<br />
The largest group is Incapacity Benefit, with 24,160 people in this group.<br />
Table 9: Working age benefit claimants by statistical group- August 2008<br />
Individual benefits datasets have been updated to November 2008, but the next update of the<br />
Working Age Client Group data (as above) will be available in summer 2009.<br />
Worklessness & Benefit Dependency<br />
Worklessness is a term used to describe all people of working age who are not in<br />
employment. It includes those who are officially unemployed, and those who are<br />
82
economically inactive (that is those who are of working age not in work, not in full time<br />
education or training and are not actively seeking work). According to this definition, there<br />
are 90,400 working age people in <strong>Bradford</strong> who are workless. This is 31.3% of the working<br />
age population, a higher proportion than seen regionally and nationally.<br />
Table 9: Worklessness Numbers and Rates<br />
<strong>Bradford</strong> has a higher proportion of permanently sick / disabled than the rest of the sub<br />
region, with higher levels of incapacity benefit claiming than elsewhere (excluding<br />
Wakefield). In total over 24,000 (May 2007) people in <strong>Bradford</strong> are claiming Incapacity<br />
Benefit, indicating the scale of this issue relative to the level of unemployment. While<br />
Incapacity Benefit is generally a long term benefit, incidences of claiming for 2 years or more<br />
form a higher proportion of all claimants in <strong>Bradford</strong> than elsewhere. 18<br />
Table 10: <strong>Bradford</strong> Working Age Benefit Claimants<br />
Overall, Claimant rates for working age benefits (including JSA, incapacity benefit, lone<br />
parent benefits, etc) are high for <strong>Bradford</strong> when compared to regional and national levels. In<br />
May 2007 there were 51,300 individuals are claiming a workless benefit, 16.9% of the<br />
working age population in <strong>Bradford</strong>. This figure has fallen from 18.7% in May 2002. 19<br />
Table 11: Working age benefit claimant numbers & rates at February each year<br />
Note: Working age benefits are: Job Seekers Allowance, Incapacity Benefit/Severe Disablement Allowance, Income Support,<br />
Carers Allowance, Disability Living Allowance, Bereavement Benefit. Housing Benefit and Council Tax Benefit is not included.<br />
Source: WACG data set, DWP; Population estimates for SOAs, Neighbourhood Statistics; rates calculated by CBMDC,<br />
Regeneration Dept.<br />
18<br />
Ekos Consulting UK Ltd (2006) West Yorkshire Strategic Economic Assessment. WY Economic<br />
Partnership.<br />
19<br />
<strong>Bradford</strong> Economic Partnership and <strong>Bradford</strong> Council (2007) Economic <strong>Strategy</strong> for <strong>Bradford</strong> District<br />
2007-2020. <strong>Bradford</strong> Economic Partnership and <strong>Bradford</strong> Council.<br />
83
Total benefits claimants can be used as a proxy for worklessness and employment<br />
deprivation at a sub-district level. <strong>Analysis</strong> has shown that very high levels of worklessness<br />
exist within concentrated areas of <strong>Bradford</strong>. For example, in small parts of Keighley,<br />
Holmewood, Barkerend and Little Horton between 40% and 50% of the working age<br />
population are claiming a workless benefit.<br />
Initial results from the 2007 Index of Multiple Deprivation (IMD) show that <strong>Bradford</strong> is the 5th<br />
most employment deprived Local Authority in England, compared to its 6th place position in<br />
the 2004 IMD rankings.<br />
4.6 Car Ownership and Commuting<br />
4.6.1 Car Ownership Levels<br />
According to the 2001 census data, a higher proportion of households in <strong>Bradford</strong> (32.5%) do<br />
not have a car or van compared to the regional and national averages. Whilst the percentage<br />
of <strong>Bradford</strong> households owning 1 car or van in similar to the average for Yorkshire & Humber<br />
and England & Wales, fewer than average own 2 or more vehicles.<br />
Table 12: Car Ownership in <strong>Bradford</strong><br />
Source: 2001 Census, ONS<br />
However, the proportion of households owning at least one car has increased during 2005-<br />
2006. In 2006, on average, 66.9% of households across England have at least one car, (in<br />
comparison to 62.6% in 2005); in Yorkshire and Humber it is 64.4%, (up from 60% in 2005),<br />
and in <strong>Bradford</strong> local authority district it is 63.7%, (an increase from 60.4% in 2005). At<br />
constituency level, car ownership ranges from a low of 56.3% in <strong>Bradford</strong> West, (down from<br />
56.9% in 2005), to a high of 70% in Shipley, (up from 64.8% in 2005). Although levels of car<br />
ownership vary at local areas it is evident that the overall proportion of households owning a<br />
car is rising. 20<br />
20 Yorkshire Forward (2009) <strong>Bradford</strong> in Brief November 2006 [online]. Yorkshire Forward [accessed<br />
20 th April 2009] < http://www.yorkshirefutures.com/cb.aspx?page=CC6934FF-85FD-4341-B2C3-<br />
DB0804E8E103 ><br />
84
4.6.2 Commuting to Works<br />
There are significant movements of commuters between districts within West Yorkshire,<br />
although the highest two-way flow is between Leeds and <strong>Bradford</strong> Districts.<br />
According to the census 2001 figures,<br />
<strong>Bradford</strong> imported a net flow of<br />
workers from surrounding Districts,<br />
45,000 people commute into the<br />
District to work, the majority of these<br />
come from Leeds. A significant<br />
proportion of in-commuters are<br />
employed in higher level occupations<br />
mostly in the city centre offices and<br />
businesses.<br />
Recent forecasts have shown that,<br />
since the 2001 Census, the number of<br />
out-commuters is likely to have<br />
increased significantly, so that<br />
<strong>Bradford</strong> is now a net exporter of<br />
labour to Leeds and surrounding<br />
Districts. 21<br />
Commuting by mode of travel<br />
Car is the dominant mode of transport for people travelling to work, accounting for 63% of all<br />
trips to work made by <strong>Bradford</strong>’s employed residents – higher than the regional average. 80% of<br />
out-commuters and 86% of in-commuters travel by car. Car travel accounts for 59% of trips by<br />
people living and working within <strong>Bradford</strong>, where a higher proportion of trips to work are made<br />
by bus, and on foot.<br />
Travel by train is significant for commuting trips out of the District, with 9% of trips out being<br />
made by train. A lower proportion of trips into <strong>Bradford</strong> (3%) are by train.<br />
Commuting from <strong>Bradford</strong> Wards<br />
People living in wards along Wharfedale (Craven, Ilkley, Rombalds, Baildon and Idle), are<br />
most likely to commute outside the district to work. Nearly a third of the commuting trips out<br />
of <strong>Bradford</strong> are made by people living in these wards. Over 40% of employed people living in<br />
Rombalds commute outside <strong>Bradford</strong>.<br />
Wyke and Queensbury wards to the south also have a significant proportion of employed<br />
residents who commute out.<br />
21 <strong>Bradford</strong> Economic Partnership and <strong>Bradford</strong> Council (2007) Economic <strong>Strategy</strong> for <strong>Bradford</strong> District<br />
2007-2020. <strong>Bradford</strong> Economic Partnership and <strong>Bradford</strong> Council.<br />
85
Much lower levels of commuting are found in Keighley, Toller, Thornton, Clayton, Great<br />
Horton and Little Horton.<br />
Leeds is a significant destination for out-commuters from all wards, however the wards along<br />
Wharfedale, and those on the east side of <strong>Bradford</strong> have the highest proportion of residents<br />
commuting to Leeds. Over 70% of the trips from Rombalds and Ilkley to outside the District<br />
are to Leeds.<br />
There are also significant commuter movements between Craven ward and Craven District,<br />
and between Queensbury/Wyke wards and Calderdale.<br />
Figure 15 : % of Employed Residents in Each Ward Commuting outside the District<br />
Source: CBMDC statistical briefing, Feb. 2008<br />
4.7 Health<br />
The people in <strong>Bradford</strong> district have worse general health than the national average overall.<br />
There are health inequalities in the district between men and women, between different<br />
communities and between geographical areas.<br />
There is considerable evidence linking deprivation to ill health, and local people experience ill<br />
health in excess of the national averages. The following table shows the Standardised<br />
Mortality Ratio (SMR) for West Yorkshire. (The Standardised Mortality Rate shows how<br />
much more likely a resident in one area is to die relative to the national average [England].<br />
Values over 100 indicate an above average risk of death).<br />
86
Table 13: Mortality for all causes 2005<br />
As the table shows, <strong>Bradford</strong> and Wakefield had the highest SMR for men, and the second<br />
highest (after Wakefield) SMR for women in West Yorkshire in<br />
2005. Life expectancy in <strong>Bradford</strong> is also lower than the national averages, and lowest in<br />
West Yorkshire.<br />
Table 14: Life Expectancy at birth (2003 – 2005)<br />
The infant mortality rate is also relatively higher in <strong>Bradford</strong>. The infant mortality rate for<br />
<strong>Bradford</strong> District fell substantially between 1974 and 2003. However in the period 1999 to<br />
2003 the infant mortality rate had not significantly changed. In the years 2001 – 2003<br />
combined <strong>Bradford</strong> babies were 1.7 times more likely to die in their first year than babies in<br />
England and Wales as a whole. This gives an infant mortality rate of 9.0 infant deaths per<br />
1,000 live births in the <strong>Bradford</strong> District compared with 5.4 per 1,000 live births in England<br />
and Wales. (2001 – 2003 figures are used, as uncertainty exists about the infant mortality<br />
figures for 2004)<br />
There are wide variations in Infant Mortality across the district. The wards of <strong>Bradford</strong> Moor,<br />
Toller, Manningham, and City had the highest infant mortality rates; and Craven, Ilkley,<br />
Wharfedale, Baildon, Bingley and Worth Valley had the lowest. From 1993 – 2003 as a<br />
whole, a baby born in the most deprived fifth (quintile) in the District was almost five times as<br />
likely to die in their first year compared to the least deprived fifth (quintile). 22<br />
Obesity is a growing concern and by 2010 it is expected to overtake smoking as the leading<br />
cause of illness and death that is easily preventable. It has been estimated that just under<br />
90,000 adults in <strong>Bradford</strong> are overweight. 23<br />
22 BMDC Research and Consultation Service (2006). A Picture of the District.<br />
Report Dated October 2006. Research and Consultation Service, Jacobs Well. <strong>Bradford</strong>.<br />
23 BMDC (2007). <strong>Bradford</strong> District Sustainable Community strategy- Information pack and Fact<br />
Sheets. Policy Development Service, <strong>Bradford</strong> Council.<br />
87
Data provided by <strong>Bradford</strong> Health Informatics Service about obesity in children in 2006<br />
shows that children are more likely to be overweight or obese by the time they reach 11, and<br />
that boys are slightly more likely than girls to be overweight or obese.<br />
Table 15: Weight of young children in <strong>Bradford</strong><br />
Malnourishment is also a key factor in elderly people being vulnerable to infection. It has<br />
been estimated that 14,000 people over 65 are likely to be malnourished in <strong>Bradford</strong>. 24<br />
In <strong>Bradford</strong> District as in the rest of England, Teenage pregnancy is a major issue. It is more<br />
so in <strong>Bradford</strong> as it can be linked to deprivation. Girls from poorer backgrounds are ten times<br />
more likely to become teenage mothers than girls from professional backgrounds. In<br />
<strong>Bradford</strong> District there has been a 11% reduction in the rate of teenage pregnancy since<br />
1998. In 2005, the national rate of pregnancies to women under 18 was 41.1 per 1,000<br />
women aged 15-17. The rate for <strong>Bradford</strong> District was 50.1, higher than both the national and<br />
West Yorkshire rate.<br />
Across the district, there are still areas where teenage pregnancy is double the national<br />
average. Three quarters of teenage pregnancies occur in the most deprived 40% of the<br />
community and rates are generally higher in deprived wards with majority white populations.<br />
Seven wards Tong, Shipley East, Wyke, Eccleshill, Little Horton, Thornton and Keighley<br />
South have teenage pregnancy rates significantly above <strong>Bradford</strong> average. 25<br />
24<br />
BMDC (2007). <strong>Bradford</strong> District Sustainable Community strategy- Information pack and Fact Sheets.<br />
Policy Development Service, <strong>Bradford</strong> Council.<br />
25<br />
The Annual Report of the Joint Director of Public Health <strong>Bradford</strong> and Airedale 2007/08<br />
88
Figure16: Teenage pregnancy rate in <strong>Bradford</strong> 1998-2011 and by ward (2004-2006)<br />
Source: <strong>Bradford</strong> and Airedale NHS Pct JSNA 2008 and 2009<br />
The impact of HIV and sexually<br />
transmitted infections in UK society is<br />
increasing despite efforts to improve<br />
clinical services aimed at reducing<br />
them. HIV infection is associated with<br />
serious illness and high costs of<br />
treatment and care, as well as<br />
significant mortality. Each year, many<br />
thousands of individuals are<br />
diagnosed with HIV for the first time. During recent years the rate of new HIV / AIDS cases in<br />
<strong>Bradford</strong> district has remained between the England and the Yorkshire and Humber regional<br />
rate. 26<br />
Figure17 : Rate of new HIV/AIDS cases in <strong>Bradford</strong><br />
Source: Health Protection Agency<br />
Yorkshire and the Humber region had the second highest rate of tobacco use in 2002 - 2004.<br />
Following Leeds and Sheffield, <strong>Bradford</strong> District had the third highest number of smoking<br />
attributable deaths in 2002-4.<br />
Apart from smoking which is the single biggest preventable cause of illness and premature<br />
death in the UK, it is estimated that the number of heroin and crack users in the <strong>Bradford</strong><br />
district are between 4200-5200. Of these, 3554 accessed treatment in 2005/6, the great<br />
majority on methadone prescriptions. <strong>Bradford</strong> also has one of the worst records in Yorkshire<br />
and Humber for both months of life lost and hospital admissions due to alcohol. 27<br />
Cancer, cardiovascular disease and diabetes are still major causes of illness and death in<br />
the District; rates of these illnesses are higher in <strong>Bradford</strong> than the national rates.<br />
26 The Annual Report of the Joint Director of Public Health <strong>Bradford</strong> and Airedale 2007/08<br />
27 BMDC (2007). <strong>Bradford</strong> District Sustainable Community strategy- Information pack and Fact Sheets.<br />
Policy Development Service, <strong>Bradford</strong> Council.<br />
89
Black and Minority Ethnic groups have distinct mental health needs; discrimination faced by<br />
people from BME communities has a negative effect on mental health and general well<br />
being.<br />
There are more children in <strong>Bradford</strong> than elsewhere in the UK with deafness, cerebral palsy,<br />
neurodegenerative disorders, primary micro and inborn errors of metabolism.<br />
4.8 Crime<br />
Changes in crime levels<br />
Over the past four years, the total number of offences recorded has generally followed a<br />
downward trend. Although the figures show an increase in 2002/3 this reflects changes in<br />
recording practices. Had these changes not been introduced, there would have been a fall in<br />
crime in 2002/3. It appears that overall crime reduction reached a plateau in 2004/5 and has<br />
remained stable throughout the 2005/6 period. 28<br />
Table 16: Number of offences recorded in <strong>Bradford</strong> District 2001/2–2005/6<br />
The latest National Statistics (July 2009), released by the Home Office, show that the overall<br />
crime in <strong>Bradford</strong> is slightly below the West Yorkshire average. Offences against person,<br />
robbery, theft of and from motor vehicle all are down from the previous year. Robbery has<br />
decreased by 12%, the highest in West Yorkshire. The only crime categories in the district to<br />
show an increase is Burglary which is up by 16% from the previous year, the second highest<br />
in the region and above the West Yorkshire average.<br />
The tables below show the latest crime statistics both at the local authority level and breaking<br />
them down into division level within the district.<br />
28 BMDC Research and Consultation Service (2006). A Picture of the District.<br />
Report Dated October 2006. Research and Consultation Service, Jacobs Well. <strong>Bradford</strong>.<br />
90
Table 17: Recorded Crime Figures for 7 Key Offences in West Yorkshire (2008-09)<br />
LA<br />
Pop n<br />
(000)<br />
H’hold<br />
(000)<br />
Violence against<br />
person<br />
Per<br />
1000<br />
Pop n<br />
08/09<br />
%<br />
change<br />
07/08-<br />
08/09<br />
Per<br />
1000<br />
Pop n<br />
08/09<br />
Sexual<br />
Offences<br />
%<br />
change<br />
07/08-<br />
08/09<br />
Per<br />
1000<br />
Pop n<br />
08/09<br />
Robbery Burglary<br />
%<br />
change<br />
07/08-<br />
08/09<br />
Per<br />
1000<br />
Pop n<br />
08/09<br />
Per<br />
1000<br />
H’hold<br />
08/09<br />
%<br />
change<br />
07/08-<br />
08/09<br />
Theft of motor<br />
vehicle<br />
Per<br />
1000<br />
Pop n<br />
08/09<br />
%<br />
change<br />
07/08-<br />
08/09<br />
Theft from motor<br />
vehicle<br />
Per<br />
1000<br />
Pop n<br />
08/09<br />
%<br />
change<br />
07/08-<br />
08/09<br />
Interfering with<br />
motor vehicle<br />
<strong>Bradford</strong> 497 196 15 -14 1 0 1 -12 11 27 16 4 -9 9 -8 1 -13<br />
Calderdale 200 88 15 -21 1 1 1 24 6 14 22 4 -9 7 -24 1 -40<br />
Kirklees 401 169 16 -11 1 7 2 17 8 20 14 4 11 10 7 1 1<br />
Leeds 761 335 16 -6 1 -13 2 -6 12 28 9 4 -5 10 4 1 -12<br />
Wakefield 322 141 17 -14 1 -16 0 -11 6 13 3 4 2 8 1 1 3<br />
WY 2181 929 16 -11 1 -6 1 2 10 22 12 4 -3 9 -1 1 -11<br />
Source: Crime in England and Wales (home office Statistical Bulletin, July 2009)<br />
Table 18: <strong>Bradford</strong> District Crime Statistics over the last 12 months (July’08- June’09)<br />
For Every 1000 Population<br />
<strong>Bradford</strong> North <strong>Bradford</strong> South Keighley<br />
In This District In West Yorkshire Total in the<br />
Division<br />
Division<br />
Division<br />
district<br />
Burglary Dwelling* 37.2 36.0 14.5 26.3 24.3 9835<br />
Vehicle Crime 14.6 17.2 6.9 12.1 12.5 10494<br />
Serious Violence 0.2 0.4 0.2 0.2 0.2 219<br />
Other Violence 7.8 14.8 5.6 8.7 9.0 7190<br />
Anti-social<br />
Behaviour<br />
57.4 83.1 40.3 57.0 53.3 36350<br />
Criminal damage 22.2 30.8 14.0 21.1 21.6 16188<br />
Source: West Yorkshire Police Authority Crime Statistics http://www.beatcrime.info/index.htm<br />
*For Every 1000 Households<br />
Per<br />
1000<br />
Pop n<br />
08/09<br />
%<br />
change<br />
07/08-<br />
08/09<br />
91
Locations of crimes<br />
The above table shows that crime rates in the District vary substantially between different<br />
areas. However, in general the south and east of the District experience higher levels of<br />
crime than the north and west. Anecdotal evidence also suggests that offenders committing<br />
crimes within <strong>Bradford</strong> District also tended to live in the District, most of them living on a<br />
housing estate with a high proportion of Community Housing Trust (formerly Council-owned)<br />
properties. 29<br />
The area with the highest level of recorded crime within <strong>Bradford</strong> District during 2005/06 was<br />
<strong>Bradford</strong> City Centre. Based on the statistics on crime reported to the West Yorkshire Police,<br />
there were a total of 7814 crime incidents recorded in the city centre during April 2005-March<br />
2006 which shows a reduction of about 11% since the same period in 2003-2004. The<br />
council has set a target of reducing further 23% of crimes in the city centre by 2007<br />
(Genecon, 2007). 30<br />
Table 19: Crime Statistics in <strong>Bradford</strong> City Centre (2003-2009)<br />
Offence Type<br />
Number of<br />
Crimes<br />
Apr 03-Mar 04<br />
Number of<br />
Crimes<br />
Apr 04-Mar 05<br />
Number of<br />
Crimes<br />
Apr 05-Mar 06<br />
Number of<br />
Crimes<br />
Apr 08-Mar 09<br />
Burglary Dwelling 261 214 224 200<br />
Burglary Elsewhere 596 453 398 284<br />
Criminal Damage 880 783 738 522<br />
Drugs Offences 306 358 363 212<br />
Fraud & Forgery 622 504 331 64<br />
Handling 30 22 14 11<br />
Other Crime 139 174 227 366<br />
Other Theft 2529 2500 2750 1759<br />
Robbery 172 97 102 74<br />
Sexual Offences 112 118 93 45<br />
Theft from Motor Vehicle 1033 614 723 459<br />
Theft of Motor Vehicle 345 319 178 108<br />
Violent Crime 1755 1946 1671 826<br />
Homicide 0 0 2 7<br />
Total 8780 8102 7814 4940<br />
Source: (Genecon, 2010)<br />
All crime recorded within the city and town centres relate both to crimes against businesses<br />
and crimes against individuals. The city and town centres cannot be compared with<br />
other areas of the District; since the crime rates are calculated on the number of<br />
29 http://www.bradfordinfo.com/District/StateOfTheDistrict2003/Crime.cfm<br />
30 Genecon (2007). BCR Performance Framework: Second Annual Update 2005/06-Final report.<br />
Report Dated August 2007. Genecon Consultancy Ltd.<br />
92
people living in the areas, and this does not reflect the number of people who travel to the<br />
city centre each day for work, shopping or leisure.<br />
Youth Offending<br />
The number of first time youth offenders in the District shows a rising trend, increasing from<br />
1,269 in 2004 to 1,480 in 2005. This increase is however heavily influenced by improvements<br />
in local crime detection rates and the impact of the Government’s recorded crime initiative<br />
‘Narrowing the Justice Gap’. 53% of the young people supervised by the <strong>Bradford</strong> Youth<br />
Offending Team, during 2005 were accessing full-time education, training and employment.<br />
There was a downward trend in re-offending rates for young offenders. 47.1% of the 2001<br />
cohort of youth offenders re-offended, compared to 33.4% of the 2004 cohort, however<br />
43.3% of the 2005 cohort re-offended within 12 months. 31<br />
Drugs and Drug Related Crime<br />
It is difficult to accurately estimate the total scale of drug use in the <strong>Bradford</strong> District but it is<br />
thought that there may be in the region of 5,000 “problematic” heroin users.<br />
In 2005/06, the number of drug users in treatment was 3,533; a 10% increase compared to<br />
the previous year (3,202). 1,966 of those were new presentations to treatment. 32<br />
<strong>Bradford</strong> police now test all offenders arrested for acquisitive crimes (e.g. shop lifting) for<br />
heroin and cocaine. On average around 50% test positive, and most of these do so for heroin<br />
and cocaine use. During 2005/06 the police recorded 325 arrests and disposals for dealing<br />
Class A. This figure is also well in excess of the target set in the Safer Communities <strong>Strategy</strong><br />
for 2005/6 of 197.<br />
Fear of drug users and drug dealers are still major factors in making people feel unsafe in<br />
their neighbourhoods.<br />
Anti-social Behaviour<br />
Anti-social behaviour is difficult to define and can include serious incidents of harassment to<br />
lower level incidents of littering, graffiti and illegal parking. The way in which the police<br />
records incidents of anti-social behaviour changed in April 2005 and it is therefore not<br />
possible to compare data since that date with previous years. Perceptions of and tolerance<br />
toward anti-social behaviour is also varied due to its subjective nature. In 2005/6, the police<br />
recorded 26,408 incidents of anti-social behaviour; the most common type was loutish<br />
behaviour (almost a third of all incidents). Other types recorded were hoax calls, general<br />
nuisance and vehicle related nuisance (e.g. illegal parking and motorcycle nuisance).<br />
31 BMDC Research and Consultation Service (2006). A Picture of the District.<br />
Report Dated October 2006. Research and Consultation Service, Jacobs Well. <strong>Bradford</strong>.<br />
32 BMDC Research and Consultation Service (2006). A Picture of the District.<br />
Report Dated October 2006. Research and Consultation Service, Jacobs Well. <strong>Bradford</strong>.<br />
93
The latest crime statistics, as shown in table, highlights that ASB is one of the major<br />
community safety issues faced by the district. the WY Police Authority has recorded 26,350<br />
ASB offences over the past 12 months between July 2008 and June 2009. this is higher<br />
than the WY average.<br />
Anti social behaviour is not evenly distributed across the District. The highest number of<br />
incidents was recorded in <strong>Bradford</strong> City Centre. ASB tends to be particularly problematic in<br />
some of the District’s outlying estates.<br />
4.9 Road Casualties<br />
<strong>Bradford</strong>’s rate of road injuries and deaths is lower than the England average, at 56.3 per<br />
100,000 compared with 59.6. Locally, there were 2,466 road casualties in 2007 - 255<br />
involved death or serious injury - a drop of 9% over the 2006 figure of 2,700 33 .<br />
Figure 18: Killed or Seriously Injured in <strong>Bradford</strong><br />
Source: Safer Communities Partnership (2009) Safer Together- <strong>Bradford</strong> District Road Safety Plan 2007 to 2009.<br />
However this is the second highest casualty figure within the West Yorkshire that includes<br />
the highest number of KSI incidents involving children and pedestrians.<br />
Table 20: Road casualties by road user type and severity in WY local authority: 2007<br />
1 Includes goods vehicles, buses, coaches and trams, horse riders and agricultural vehicle users.<br />
Source: Road Casualties Great Britain 2007: Annual Report (September 2008). London: The Stationery Office<br />
33 <strong>Bradford</strong> and Airedale PCT (2008) The Health and Wellbeing needs of the People of <strong>Bradford</strong> and<br />
Airedale: Joint Strategic Needs Assessment 2008. CBMDC and <strong>Bradford</strong> and Airedale NHS PCT.<br />
94
The ‘Safer Communities Partnership’ is working to reduce the road casualty figures within the<br />
district and has set reduction targets to be achieved from the baseline of 1994-98. The target<br />
is to reduce the numbers of people killed and seriously injured in road crashes in <strong>Bradford</strong> by<br />
at least 40% by 2010 and to reduce the numbers of children and pedestrians killed and<br />
seriously injured by at least 50% 34 .<br />
Current provisional figures for 2008, however, indicate deterioration in the achievements that<br />
were made previously in relation to reducing road casualties. The 2010 target reduction for<br />
children killed and seriously injured was met in 2005 with just 32, but has since increased.<br />
The provisional figure for 2008 is 50 with likelihood that a further small number will be added<br />
when final figures are known. The provisional figures for all killed and serious injuries are 264<br />
against a target reduction of 208.<br />
Road deaths have fallen in 2008 to 19 from 27 – a substantial reduction despite there being<br />
a number of crashes with multiple fatalities. 19 is the second lowest value on record for the<br />
<strong>Bradford</strong> District. Overall crashes and casualty numbers continue to fall to their lowest ever<br />
levels for the District 35 .<br />
4.10 Emergency Services- Capacity and Performances<br />
Fire and Rescue Service<br />
The West Yorkshire Fire and Rescue Authority have the legal duty to provide fire and rescue<br />
service that meets the needs of local communities. It is an independent body which bears the<br />
responsibilities regarding the enforcement of fire prevention, petroleum and explosives<br />
legislation.<br />
The Yorkshire Fire and Rescue Service serve a resident population of 2,125,000 and rovides<br />
an emergency response across 202,924 hectares. Our emergency response is currently<br />
provided from 34 whole-time fire stations and 14 retained (part-time) fire stations, based<br />
within the five Districts of the county. We employ 1,514 wholetime firefighters, 196 part-time<br />
firefighters, 60 mobilisation and communication staff members and 343 fire and rescue (nonuniformed)<br />
staff.<br />
West Yorkshire Fire & Rescue Service has the following resources:<br />
• 49 Fire Stations (10 located in <strong>Bradford</strong> District)<br />
• 63 Pumping / Rescue Appliances<br />
• 6 aerial appliances<br />
• 6 Demountable Unit carrying vehicles<br />
• 15 Demountable Units<br />
• 1 Command Support Unit<br />
34<br />
Safer Communities Partnership (2009) Safer Together- <strong>Bradford</strong> District Road Safety Plan 2007 to<br />
2009.<br />
35<br />
CBMDC (2009) <strong>Bradford</strong> District Transport Delivery Plan- Executive Committee Report published on<br />
31 st March 2009. CBMDC.<br />
95
The 10 Fire stations located in <strong>Bradford</strong> District are:-<br />
1. <strong>Bradford</strong><br />
2. Ilkley<br />
3. Keighley<br />
4. Bingley<br />
5. Shipley<br />
6. Silden<br />
7. Idle<br />
8. Fairweather Green<br />
9. Odsal<br />
10. Howarth<br />
The HQ of the Fire & Rescue Authority is based in Birkenshaw, <strong>Bradford</strong>.<br />
Figure 19: West Yorkshire Fire and Rescue Service Stations<br />
The Fire and Rescue Service is diversifying both within the organisation and within the<br />
service it provides in an effort to better reflect the community it serves in <strong>Bradford</strong>, and the<br />
services include: -<br />
• the fitting of approx 15,000 smoke detectors to homes across the district<br />
• providing valuable road safety information to the community<br />
• working with schools and young persons<br />
• assistance and advice with the clearance of waste materials in order to prevent<br />
deliberate, opportunist fires<br />
96
In addition, the Legislative Fire Safety Team continues to provide a valuable service to<br />
business in <strong>Bradford</strong>, making premises safer for employees and members of the public.<br />
The Fire Service states that the current operational capacity of the service is sufficient to<br />
cater for <strong>Bradford</strong> District and its potential growth. The following figure shows the number of<br />
total fire incidents (including false alarm and special service calls) that have been dealt by<br />
the WYFS stations across the district over the past 3 years.<br />
Figure 20: Fire incidents attended by WYFRS 2006-08<br />
Total Incidents<br />
3500<br />
3000<br />
2500<br />
2000<br />
1500<br />
1000<br />
500<br />
0<br />
<strong>Bradford</strong><br />
Source: WYFRS website<br />
Ilkley<br />
Keighley<br />
2006 2007 2008<br />
Bingley<br />
Shipley<br />
Silden<br />
Idle<br />
Fairweather<br />
Green<br />
Further details on the capacity and performances of the above fire stations are available by<br />
clicking on the link below:-<br />
http://www.westyorksfire.gov.uk/aboutUs/au_stations.htm<br />
However, according to the recently published WYFRS Integrated Risk Management Plan<br />
2009-2012 <strong>Bradford</strong> is at the top of the overall geographical risk levels associated with<br />
<strong>Metropolitan</strong> Fire Authority areas 36 . There are also a number of areas where the fire and<br />
rescue service are not currently able to meet their target response time. They aim to evaluate<br />
the risk within these areas and implement appropriate prevention, protection and response<br />
solutions where the risk is at an intolerable level.<br />
36 West Yorkshire Fire & Rescue Authority (2009) Integrated Risk Management Plan and Action Plan<br />
20009-12. WYFRA.<br />
Odsal<br />
Howarth<br />
97
Figure 21: Areas covered by the target response time<br />
Source: Integrated Risk Management Plan and Action Plan 20009-12 (WYFRA, 2009)<br />
The latest WYFRS <strong>Bradford</strong> District Action Plan 37 has also highlighted that it still need to<br />
continue responding when an ‘emergency’ has occurred. Being prepared and ready to deal<br />
with emergency incidents, whatever the type, is a core duty alongside the prevention work<br />
and all the firefighters within <strong>Bradford</strong> District will further be trained to deal with a wide variety<br />
of emergencies, including: -<br />
• fires<br />
• road traffic collisions<br />
• chemical spills<br />
• water rescues<br />
• rope rescues<br />
Currently, through local operational information gathering, the WYFS have developed a<br />
Performance Management System which sets both local responsibility and accountability<br />
through a series of action plans and helps them identify the key risks in the area in order to<br />
ensure that they are fully prepared for any eventuality.<br />
Ambulance<br />
Yorkshire Ambulance Service NHS Trust was formed on 1 July 2006 bringing together South<br />
Yorkshire Ambulance Service, West Yorkshire <strong>Metropolitan</strong> Ambulance Service and the<br />
North and East Yorkshire parts of Tees, East and North Yorkshire Ambulance Service.<br />
37 West Yorkshire Fire & Rescue Authority (2009) <strong>Bradford</strong> District Action Plan 2008/09. WYFRA.<br />
98
YAS operate out of 22 ambulance stations (3 stations based in <strong>Bradford</strong> District) and in<br />
addition use numerous locations as standby points.<br />
There are 3 ambulance stations within <strong>Bradford</strong> District, as follows:-<br />
1. <strong>Bradford</strong><br />
2. Keighley<br />
3. Menston<br />
Standby points have been confirmed to date on the following sites in West Yorkshire (3<br />
within <strong>Bradford</strong>)-<br />
• Canal Road, <strong>Bradford</strong><br />
• Leeds Road Hospital, <strong>Bradford</strong><br />
• Odsal Fire Station, <strong>Bradford</strong><br />
• Rutland Lodge Medical Centre, Potternewton, Leeds<br />
• Kirkstall Medical Centre, Leeds<br />
• Beeston Fire Station, Leeds<br />
• Pontefract Fire Station, Pontefract<br />
A total of 24 more stand-by points are planned throughout Yorkshire in 2008/2009 to further<br />
improve the speed of response to 999 calls. 38<br />
The Air Support Unit operates out of Leeds <strong>Bradford</strong> International Airport. This unit operates<br />
one aircraft, but further aircrafts could be made available through the Northern Air<br />
Ambulance Support Group if required.<br />
Ambulance provision across the District is provided by the above three stations and is<br />
supplemented by stations within Leeds, Craven, Calderdale and Kirklees, if the incidence<br />
requires additional assistance.<br />
The current stations and the network of standby points provide a sufficient level of resource<br />
for the District. If demand increased permanently, <strong>Bradford</strong> would seek to commission<br />
additional resources to meet this demand through the Lead Commissioning arrangements.<br />
The following map shows the area each ambulance station in Yorkshire covers within the<br />
national eight minute response time target. It shows the majority of the District is covered for<br />
a response time of 8 minutes by either a <strong>Bradford</strong> District or neighbouring Ambulance<br />
Station.<br />
38 See: http://www.yas.nhs.uk/Media/PressReleases/2008/standsbytogettopatie.html for more info.<br />
99
Figure 22: ambulance stations in west yorkshire<br />
Source: Yorkshire Ambulance Service NHS Trust Annual Report 2007/08.<br />
During 2008/09 the YAS has received approximately 372,000 urgent and emergency calls,<br />
an average of over 1,800 calls a day, and responded to a total of approximately 565,000<br />
incidents.<br />
Table 21: YAS operational performances 2007-08<br />
Category<br />
Category A calls<br />
Response within 8 minutes<br />
Category A calls<br />
Response within 19 minutes<br />
Category B calls<br />
Response within 19 minutes<br />
England<br />
Average<br />
Yorkshire Ambulance Service<br />
2008/09 2007/08 2008/09<br />
Target<br />
74.3% 73.5% 69.4% 75%<br />
96.9% 96.1% 96.1% 95%<br />
91% 92.4% 90.6% 95%<br />
Sources: YAS Annual Report and Summary Accounts 2007/08 and National Statistics: Ambulance Services England 2008/09<br />
The overall performance of the YAS in dealing with accident and emergency incidents is<br />
however below the national average and does not meet the nationally set performance<br />
targets. The Healthcare Commission continues to monitor YAS and envisages that significant<br />
progress would be made in near future towards achieving the standards with which YAS<br />
were not compliant in the previous years.<br />
100
4.11 Key Facts<br />
• The district’s population is projected to grow and change in the next 20 years. It is<br />
likely that it will have the fastest growing population of any area outside London.<br />
• The population will become more ethnically mixed with significant growth among<br />
younger age groups, BME groups and within the more deprived areas of the District.<br />
This shift towards groups that traditionally experience lower labour market<br />
attainment, poses a challenge for <strong>Bradford</strong>. The free flow of labour across Europe<br />
and the effects of globalisation also suggest that communities will become more<br />
culturally mixed.<br />
• <strong>Bradford</strong> has one of the lowest proportions of working age residents in employment<br />
of any local authority in the Yorkshire and Humber region and is lower than the<br />
national average. Correspondingly the district has one of the highest unemployment<br />
rates. However, recent data shows that employment rates continue to improve and<br />
the gap with regional and national rates is narrowing. Economic activity rates are<br />
also improving and the gap with national rates has reduced.<br />
• Worklessness and dependency on benefits such as JSA and Incapacity Benefit is a<br />
particular issue for <strong>Bradford</strong>, where significant pockets of worklessness within<br />
<strong>Bradford</strong> push up the average figures for the District. Unemployment and<br />
worklessness is higher among BME groups and the situation is not improving.<br />
• <strong>Bradford</strong> as a whole ranks 32nd (out of 354) in the CLG Index of Multiple<br />
Deprivation, placing it firmly in the bottom 10% nationally. Within the district there is<br />
inevitably disparity between Wards in terms of deprivation, 42% of residents living in<br />
areas that fall into the 20% most deprived nationally, and 5% living in areas that are<br />
among the 1% most deprived. Overall, two-fifths of people live in some of the most<br />
deprived areas in the country.<br />
• Mortality and life expectancy data across the PCT’s four GP-based Alliance areas<br />
demonstrate a link between deprivation and poor health outcomes exist within the<br />
district.<br />
• Economic activity rates in the district are lower than average (73.9%: 78.5%<br />
nationally) and there are a high proportion of people without qualifications (21.8%:<br />
13.8% nationally). Average weekly earnings are also below regional and national<br />
average but have increased at a faster rate between 2006-2008.<br />
• The district’s economy is worth around £7 billion, the third largest in the region.<br />
Around 15,000 businesses provide 195,500 jobs and local residents hold about 78%<br />
of these jobs. The district is forecast to have the fastest rate of economic growth in<br />
West Yorkshire over the next ten years with a projected 50,000 increase in the<br />
number of local jobs.<br />
101
Sources:<br />
• <strong>Bradford</strong> is an enterprising district where local residents are more likely to aspire to<br />
start a business than people elsewhere in the region. Business start-ups and<br />
survival rates are also improving faster than national and regional averages.<br />
• Travel to work by car is increasing, and the level of out-commuting to surrounding<br />
Districts is estimated to have risen significantly. This places increasing pressure on<br />
the District’s road infrastructure and levels of congestion.<br />
• People in the district have a lower risk of becoming a victim of crime. Youth<br />
offending including anti social behaviour and the issues underlying it are being<br />
tackled successfully.<br />
• Arup (2005) Socio-Economic <strong>Baseline</strong> Report (part of NDF Technical<br />
Appendices). Report dated July 2005. Arup Consultancy.<br />
• BMDC (2002) <strong>Bradford</strong> Tourism <strong>Strategy</strong>. Report dated May 2002. <strong>Bradford</strong><br />
Council.<br />
• BMDC (2004) Only Connect-Cultural <strong>Strategy</strong> for <strong>Bradford</strong>. Report dated March<br />
2004. <strong>Bradford</strong> Council.<br />
• BMDC (2007) <strong>Bradford</strong> District Sustainable Community strategy- Information pack<br />
and Fact Sheets. Policy Development Service, <strong>Bradford</strong> Council.<br />
• <strong>Bradford</strong> Economic Partnership and <strong>Bradford</strong> Council (2007) Economic <strong>Strategy</strong><br />
for <strong>Bradford</strong> District 2007-2020. <strong>Bradford</strong> Economic Partnership and <strong>Bradford</strong><br />
Council.<br />
• BMDC (2006) A Picture of the District. Report dated October 2006. Research and<br />
Consultation Service, Jacobs Well. <strong>Bradford</strong>.<br />
• BMDC (2007) A Picture of the District. Report dated October 2007. Research and<br />
Consultation Service, Jacobs Well. <strong>Bradford</strong>.<br />
• BMDC (2010) The State of the District. Department of Performance and<br />
Commissioning. Report dated September 2010. <strong>Bradford</strong>.<br />
• DTZ and Tescom (2005) Creating a Balanced City Centre Housing Market in<br />
<strong>Bradford</strong>: Final Report. Report dated November 2005. DTZ Pieda Consulting<br />
and Tescom Research and Consultancy Ltd.<br />
• Genecon (2006) BCR Performance Framework: Second Annual Update 2004/05-<br />
Final report. Report dated May 2006. Genecon Consultancy Ltd.<br />
102
• Genecon (2007) BCR Performance Framework: Second Annual Update 2005/06-<br />
Final report. Report dated August 2007. Genecon Consultancy Ltd.<br />
• Genecon (2010) BCR Performance Framework: Annual Update 2009/10-draft<br />
report. Report dated February 2010. Genecon Consultancy Ltd.<br />
• Genecon, King Sturge, Gillespies (2007) Leeds <strong>Bradford</strong> Corridor <strong>Study</strong>. Report<br />
dated July 2007. Leeds <strong>Bradford</strong> Corridor Group.<br />
• Regeneris (2005) <strong>Bradford</strong> Positioning Statement. Report dated May 2006.<br />
Regeneris Consulting.<br />
• The Northern Way (2005) Leeds City Region Diagnostic. Report dated 2005. The<br />
Northern Way.<br />
103
5.0 Housing<br />
The following section provides details of the types of residential properties in <strong>Bradford</strong> and<br />
details of the housing and household characteristics within the district. It also highlights<br />
details of the National, Regional, Sub-regional and Local policy framework with which any<br />
future housing developments must conform, and outlines a detail analysis of the current<br />
Housing Market in the district.<br />
5.1 National, Regional and Sub-regional Housing Policies and Strategies<br />
This section contains details on<br />
• PPS3<br />
• The Yorkshire and Humber Plan<br />
• Local Housing studies<br />
PPS3: Housing<br />
In November 2006, the Government published Planning Policy Statement 3: Housing<br />
(PPS3), which superseded PPG3. PPS3 underpins the delivery of the Government's<br />
strategic housing policy objectives with the goal of ensuring that everyone has the<br />
opportunity to live in a decent home, which they can afford in a community where<br />
they want to live 39 .<br />
PPS3 sets out the policy objectives for planning for housing. The specific outcomes<br />
that the planning system should deliver are:<br />
• High quality housing that is well-designed and built to a high standard.<br />
• A mix of housing, both market and affordable, particularly in terms of tenure and<br />
price, to support a wide variety of households in all areas, both urban and rural.<br />
• A sufficient quantity of housing taking into account need and demand and seeking<br />
to improve choice.<br />
• Housing developments in suitable locations, which offer a good range of<br />
community facilities and with good access to jobs, key services and infrastructure.<br />
• A flexible, responsive supply of land – managed in a way that makes efficient and<br />
effective use of land, including re-use of previously-developed land, where<br />
appropriate.<br />
Key policies in PPS3 are:<br />
• Local and regional planning bodies will need to take more account of<br />
affordability when determining how many new homes are needed in their area;<br />
39 Planning Policy Statement 3: Housing<br />
104
• Local authorities will need to identify more appropriate sites for housing.<br />
Councils need to plan 15 years ahead, to ensure they have a rolling 5-year supply<br />
of sustainable and deliverable sites;<br />
• Stronger emphasis on improving the quality of design of housing and<br />
neighbourhoods. PPS3 makes it clear that local authorities should turn down<br />
poor quality applications;<br />
• Stronger environmental standards. Developers and planning bodies will have<br />
to take account of the need to cut carbon emissions as well as wider<br />
environmental and sustainability considerations when siting and designing new<br />
homes;<br />
• A new emphasis on family homes, with consideration to be given to the housing<br />
needs of children, including gardens, play areas and green spaces;<br />
• A continuing focus on brownfield land, retaining the national target that at<br />
least 60% of new homes should be built on brownfield land. Local authorities will<br />
need to continue to prioritise brownfield land in their plans and will need to set<br />
their own local targets to reflect available sites and support the national target.<br />
They will also need to take stronger action to bring more brownfield land back into<br />
use;<br />
• More flexibility for local authorities to determine how and where new homes<br />
should be built in their area, alongside greater responsibility to ensure the<br />
homes are built. Local authorities will be able to set their own local standards for<br />
density (with a national indicative minimum of 30 dwellings per hectare) and for<br />
car parking. They will also be able to set separate targets for different kinds of<br />
brownfield land where appropriate;<br />
• Stronger policies on affordable housing, so that local authorities will be able to<br />
require developer contributions to affordable housing on smaller sites where it is<br />
viable; and,<br />
• A stronger emphasis on rural affordable housing, so that local authorities and<br />
regional planning bodies will have to take greater account of affordability<br />
pressures in rural areas, and the need to sustain village life by providing<br />
additional housing that is sensitive to the area and the environment.<br />
Regional Spatial <strong>Strategy</strong> (RSS): The Yorkshire and Humber Plan<br />
The Yorkshire and Humber Plan is the current Regional Spatial <strong>Strategy</strong> for the<br />
Yorkshire and Humber Region. It was issued in May 2008 and is a primary<br />
consideration for City of <strong>Bradford</strong> <strong>Metropolitan</strong> District Council (CBMDC) in<br />
developing LDF policies.<br />
The housing requirement in the RSS states that approximately 50,000 new homes<br />
will have to be built in the <strong>Bradford</strong> district between 2008 and 2026, to meet the need<br />
of the growing population and the increase in household formation. Predicted<br />
residential growth is based on the figures specified in the RSS 2006-2026. This states<br />
an anticipated provision for <strong>Bradford</strong> equating to 2,700 per year.<br />
105
POLICY H1: Provision and distribution housing<br />
A The region’s housing stock should be improved and increased to provide<br />
appropriate accommodation for all households wanting homes, taking account of<br />
strong economic growth in the Leeds City Region, regeneration and increasing<br />
economic growth in South Yorkshire and the Humber Estuary sub area, and the<br />
need to place a greater emphasis on meeting local needs in rural areas.<br />
B Plans, strategies, programmes and investment decisions should ensure the<br />
delivery of the average annual net additions to the dwelling stock set out in Table<br />
12.1 in locations that accord with the <strong>Core</strong> Approach and Sub Area policies, taking<br />
account of indicative timing set out in Table 12.2 .<br />
Table 1. RSS Net Additions to dwelling stock for local authorities 2004-2026<br />
S<br />
Source: Yorkshire and Humber Plan 2008, p.159<br />
The RSS aims to transform <strong>Bradford</strong>, and in this context there is potential for<br />
significant job growth and a need to increase housing growth to reflect this and<br />
demographic changes. In this context <strong>Bradford</strong> district needs to significantly increase<br />
its housing supply.<br />
106
Table 2. RSS Jobs and Homes Growth in the Leeds City Region<br />
Source: Yorkshire and Humber Plan 2008, p.163<br />
Under Policy LCR1: Leeds City Region sub area policy, the RSS states that the role<br />
and function of place for <strong>Bradford</strong> is to transform the Regional City of <strong>Bradford</strong> with<br />
significantly increased growth in economic development, jobs and homes through the<br />
renaissance of the city centre and development and regeneration elsewhere.<br />
In terms of strategic patterns of development for <strong>Bradford</strong>, LCR1 states the following:<br />
1. Encourage growth across the south of the city region (broadly south of <strong>Bradford</strong><br />
and Leeds city centres) particularly within the Regeneration Priority Areas, and<br />
manage growth across the north of the city region with a greater emphasis on<br />
delivering affordable housing<br />
2. Focus most development on the Regional Cities of <strong>Bradford</strong> and Leeds and the<br />
Sub Regional Cities and Towns<br />
3. Promote development at the Principal Towns to strengthen their service centre<br />
roles, and where necessary to aid regeneration and/or to provide more affordable<br />
housing<br />
4. Encourage regeneration and growth in the following broad locations (supported by<br />
the investment priorities set out in policy LCR2):<br />
• Airedale (<strong>Bradford</strong> city centre to Skipton) – increasing employment<br />
opportunities and focussing development in Keighley and Skipton<br />
• <strong>Bradford</strong>-Leeds Corridor – restructure and regenerate east <strong>Bradford</strong> and<br />
west Leeds to better support economic growth of both cities<br />
The RSS contains two policies, which are relevant to affordable housing provision in<br />
the region:<br />
• H4 The Provision of Affordable Housing<br />
• H5 Housing Mix<br />
Policy H4 sets out indicative estimates for the proportion of new housing that may<br />
need to be affordable across the region. As is recognised in the Regional Housing<br />
<strong>Strategy</strong>, there are differences across the region in terms of affordability. Provisional<br />
107
estimates of the proportion of new housing that may need to be affordable are as<br />
follows:<br />
• Over 40% in North Yorkshire districts and the East Riding of Yorkshire<br />
• 30-40% in Kirklees, Leeds, Wakefield and Sheffield<br />
• Up to 30% in other parts of South and West Yorkshire, Hull, North<br />
Lincolnshire and North East Lincolnshire.<br />
It is likely that there will be considerable variety in what is required within the districts.<br />
These figures will be reviewed in the light of the findings from emerging local<br />
Strategic Housing Market Assessments.<br />
Policy H5 states that plans should ensure the provision of homes for a mix of<br />
households that reflects the needs of the area.<br />
Local Housing Studies<br />
CBMDC has collected and produced substantial evidence on housing markets and<br />
housing need in the district. These include the following studies;<br />
• <strong>Bradford</strong> Strategic Housing Market Assessment 2009 (SHMA): The SHMA is<br />
a key element of the LDF's evidence base. It analyses the housing market in<br />
<strong>Bradford</strong> advising on the types of housing needed in different areas and the<br />
amount and pattern of need for affordable housing.<br />
• Local Housing Assessment 2008: The study comprehensively examined the<br />
local housing market, the key drivers of local housing demand and supply and the<br />
level of housing need within the district.<br />
• <strong>Bradford</strong> Housing Requirements <strong>Study</strong> 2007/08: The study seeks to<br />
supplement the LHA with an evidence base for assessing future housing need.<br />
The study draws on a range of primary and secondary data, including a random<br />
sample of 3253 households.<br />
• Future of Social Housing <strong>Study</strong> 2007/08: The study examines attitudes to<br />
affordable housing, specifically amongst different demographics.<br />
• Private Sector Stock Condition Survey 2008: Provides an updated picture on<br />
stock condition.<br />
• Housing Market Tracker: A set of 55 indicators that track the state of the<br />
housing market in <strong>Bradford</strong>.<br />
• Joint Housing <strong>Strategy</strong> for <strong>Bradford</strong> 2008-2018: The three key objectives in the<br />
strategy are more homes, quality and inclusion. The housing strategy outlines the<br />
future plans for growth including five growth areas The Canal Road Corridor,<br />
108
Manningham, The Leeds/<strong>Bradford</strong> Corridor, The Airedale Corridor and the City<br />
Centre.<br />
Housing Development Frameworks<br />
The joint Housing <strong>Strategy</strong> outlines plans for growth, and for improving the success of<br />
existing neighbourhoods, include a focus on our major area regeneration projects.<br />
Housing Development Frameworks are being developed to exploit housing<br />
opportunities within the Masterplan areas and to establish realistic plans and delivery<br />
frameworks to regenerate these areas and make a difference. These are the Canal<br />
Road Corridor, Manningham, Airedale, the Leeds/<strong>Bradford</strong> Corridor, and the City<br />
Centre. We will work with the Homes & Communities agency to deliver our ambitions<br />
for these areas.<br />
The Canal Road Corridor offers the opportunity for the creation of new successful<br />
mixed neighbourhoods with up to 6000 dwellings, alongside new employment<br />
opportunities, but also enables adjoining communities, such as Manningham, to<br />
benefit from the buoyancy created by the new area.<br />
In Manningham, existing successful regeneration plans can be extended to new<br />
opportunities for high quality housing to complement key employment sites. We will<br />
work with any employer within the area or developer to assist housing growth and to<br />
transform Manningham into a sustainable area where people would choose to live.<br />
Green spaces will be enhanced and sites such as the reservoir site- a <strong>Bradford</strong><br />
Wildlife Site- will be protected.<br />
The Leeds/<strong>Bradford</strong> Corridor involves joint working to make the most of the<br />
powerful links between the two cities to boost the success of the neighbourhoods<br />
along the corridor – including Holmewood, Ravenscliffe, and Laisterdyke – and to<br />
exploit opportunities in areas in between these neighbourhoods. Significant growth<br />
opportunities exist in the area between <strong>Bradford</strong> and Leeds and upwards of 6000 new<br />
homes could be provided in this area.<br />
109
The Airedale Corridor is strongly focussed on economic growth. It will include<br />
opportunities for new market-led housing development that will also create scope for<br />
new affordable housing close to work and transport.<br />
In the City Centre there is still substantial scope for the development of high-quality<br />
modern apartment-type housing aimed principally at younger people owning or<br />
renting – encouraging a vibrant city centre both during the day and at night. A further<br />
6000 homes can be provided in addition to the existing residential supply in the city<br />
centre<br />
5.2 Housing Profile of the District<br />
This section provides details on:<br />
• The current housing stock<br />
• Building Activity<br />
• Future Housing stock<br />
• Property type<br />
• Tenure<br />
• Stock Condition<br />
• Vacancy<br />
• Occupancy<br />
5.2.1 Current Housing Stock<br />
Total dwelling stock as at April 2009 was 208,473 residential dwellings across<br />
<strong>Bradford</strong> District. Over the past 10 years, total dwelling stock has increased 4.8%<br />
from a total of 198,958 in 1999 (<strong>Bradford</strong> SHMA, 2009).<br />
5.2.2 Building activity<br />
Table 4 shows new build housing supply between the years 2002/3 to 2006/7. Private<br />
sector new builds in the district have fluctuated at around 1,100 properties annually<br />
for the past few years, with a slight dip in 2003/04. A modest increase to around<br />
1,200 completed units occurred in 2005/06. In 2006/07, new build constructions fell<br />
slightly to 1,100 properties once again.<br />
Over the same period new builds in the social housing sector have been much more<br />
modest, averaging at just over 80 units per annum, according to CBMDC Planning<br />
and NHBC figures although, the real figure is thought to be more like an average of<br />
220 properties per annum (LHA).<br />
110
Table 4: New Build Activity<br />
Source: Local Housing Assessment 2008, p.46<br />
Table 5 (below) shows that recent social housing new build activity in the district has<br />
been relatively modest - averaging at around 200 new units per year but dropping to<br />
181 new properties in 2004/05 and 148 properties in 2005/06, before rising<br />
significantly during 2006/07.<br />
111
Table 5: Social Housing completed new builds<br />
Source: Local Housing Assessment 2008<br />
The reduction in number of social housing new builds in 2004/05 was because of a<br />
significantly reduced level of Housing Corporation Social Housing Grant in 2003/04<br />
through the National Affordable Housing Programme of £7.9m compared to £17.5m<br />
in 2002/03. The effect was also carried over into 2005/06. The reduction in funding<br />
has created an increased burden on PPS3 schemes to provide more affordable<br />
housing.<br />
5.2.3 Future Housing Stock<br />
Clearance in the private sector has been negligible in comparison to the size of the<br />
sector as a whole. With around 1,200 private sector properties being supplied<br />
annually the private sector will continue to grow.<br />
The housing requirement for <strong>Bradford</strong> from the RSS is high, with a requirement to<br />
deliver roughly 50,000 new homes across the district by 2026. This represents almost<br />
a doubling of the annual target from 1390 to 2700.<br />
The effect of a limited social sector supply and high RTB figures for the short term will<br />
probably mean a reduction in social sector stock in the next couple of years to a<br />
possible low of around 30,005 properties. After this, albeit with similar funding levels<br />
from the National Affordable Housing Programme and comparable levels of PPS3<br />
supply, it may be expected that in the medium term the social sector will reach more<br />
stability as RTB pressures ease and new supply creates a net effect.<br />
The overall effect on tenure will be an increase in the private sector as it continues to<br />
grow, not withstanding future planning restrictions and a reduction in social sector<br />
tenancies. The level of owner occupation within the private sector may reduce as<br />
affordability becomes an issue and renting increases.<br />
5.2.4 Property type<br />
Table 6 reviews the profile of occupied dwelling stock by size and type. Overall, the<br />
vast majority (78.8%) of properties are houses, 14.5% are flats/maisonettes and 6.5%<br />
are bungalows.<br />
112
Table 6: Property type and size<br />
No.<br />
Bedrooms<br />
Property Type (Table %)<br />
Detached Semidetached<br />
Terraced Bungalow Flat or<br />
Maisonette<br />
Caravan Total Base<br />
One 0.1 0.1 1.6 0.9 6.7 0.1 9.6 18234<br />
Two 0.5 3.6 13.8 3.9 6.4 0.0 28.3 53733<br />
Three 4.2 26.3 11.6 0.9 0.6 0.0 43.6 82652<br />
Four 6.1 1.5 5.4 0.8 0.1 0.0 14.0 26509<br />
Five 1.1 0.9 0.9 0.0 0.0 0.0 2.9 5518<br />
Six 0.4 0.2 0.2 0.0 0.0 0.0 0.8 1523<br />
Seven 0.0 0.0 0.1 0.0 0.0 0.0 0.1 228<br />
Eight 0.0 0.0 0.0 0.0 0.0 0.0 0.0 88<br />
Bedsit 0.0 0.0 0.0 0.0 0.6 0.0 0.6 1232<br />
Total 12.5 32.6 33.7 6.5 14.5 0.1 100.0 189717<br />
Base 23730 61935 63929 12392 27464 267 189717<br />
Source: 2007/8 household survey<br />
Figure 1: Property type by sub-area<br />
100%<br />
80%<br />
60%<br />
40%<br />
20%<br />
0%<br />
City Central City North<br />
East<br />
City South City West Bingley Wharfedale Keighley &<br />
Worth Valley<br />
Detached Semi-detached Terraced Bungalow Flat or Maisonette Caravan<br />
Source: 2007/8 household survey<br />
5.2.5 Tenure<br />
The last Census found that owner-occupation was a more dominant tenure in<br />
<strong>Bradford</strong> than across the region as a whole, making up 71% of the total housing stock<br />
of the district. Levels of social renting are well below regional averages (at 16.3%<br />
compared to 21% across Yorkshire and the Humber).<br />
Total<br />
113
Table 7: Tenure profile<br />
Tenure of<br />
household<br />
<strong>Bradford</strong><br />
(No.)<br />
<strong>Bradford</strong><br />
(%)<br />
Owned 129,288 71.7 67.6<br />
Social Rented 29,350 16.3 21.0<br />
Private rented 17,584 9.8 9.1<br />
Living rent free 4,024 2.2 2.3<br />
Total 180,246 100 100<br />
Source: 2001 Census, <strong>Bradford</strong> Regional SHMA, p.26<br />
Yorkshire &<br />
Humber %<br />
In March 2002 66% of <strong>Bradford</strong>'s Council tenants voted in favour of transferring the<br />
ownership and management of their homes by LSVT to <strong>Bradford</strong> Community Housing<br />
Trust Group (BCHT). The group is a Registered Social Landlord.<br />
The long-term trends of decline of the social rented sector and growth of owneroccupation<br />
and private renting have served to dramatically change the nature of the<br />
housing market over the last 25 years. Right-to-buy (RTB) and demolition of local<br />
authority housing reduced the stock of social housing markedly during the 1980’s and<br />
1990’s. Most recently, the growth of buy-to-let has sped up private rented sector<br />
growth, particularly in lower value, inner core neighbourhoods.<br />
The private rented sector has expanded over the last few years, this has occurred for<br />
a number of related reasons. Firstly, general factors influencing increased demand<br />
include greater household dissolution, a growth in single person households and an<br />
emphasis on job mobility; secondly, the rapid expansion of the buy-to-let investment<br />
market; thirdly, rising house prices across the district have made affordability for<br />
owner-occupation increasingly difficult for first time-buyers and fourthly, the increased<br />
provision of flats and apartments across the District being typically attractive to the<br />
investment market and young professionals.<br />
The latest tenure profile of <strong>Bradford</strong> District is summarised in Figure 2. Variations in<br />
broad tenure groups by sub-area is summarised in Figure 3. Overall, based on<br />
survey evidence, 70.1% of occupied dwellings are owner-occupied, 15.1% are social<br />
rented, 14.1% are private rented and 0.3% are intermediate tenure (e.g. shared<br />
ownership).<br />
114
100%<br />
80%<br />
60%<br />
40%<br />
20%<br />
Figure 2: <strong>Bradford</strong> District tenure profile<br />
Owned Outright<br />
Owned with mortgage<br />
<strong>Bradford</strong> CH Trust<br />
Rented from Housing<br />
Associations<br />
Private Rented<br />
Tied accommodation<br />
Shared ownership<br />
379<br />
569<br />
Source: 2007/8 household survey<br />
11,193<br />
18,023<br />
26,371<br />
- 20,000 40,000 60,000<br />
59,381<br />
73,800<br />
Tenure profile varies to some extent across the District (Figure 3). Proportions of<br />
social rented properties were highest in City Central (24.2%), City South (16.8%) and<br />
Keighley & Worth Valley (16.4%). The proportion of households renting privately was<br />
highest in City Central (22.1%), City South (17.5%) and Keighley & Worth Valley<br />
(15.2%). The proportion of households who were owner-occupiers exceeded 80% in<br />
Wharfedale (87.1%) and Bingley (81.6%), compared with a District average of 70.1%.<br />
0%<br />
Figure 3: <strong>Bradford</strong> District tenure profile by sub-area<br />
City Central City North<br />
East<br />
City South City West Bingley Wharfedale Keighley &<br />
Worth<br />
Valley<br />
Owner Occupied Social Rented Private Rented Intermediate<br />
Source: 2007/8 household survey<br />
Total<br />
115
5.2.6 Stock condition<br />
In the private sector <strong>Bradford</strong> is dominated by older terraced housing. 25% of the<br />
stock is small terraced housing (compared with an English average of 12%) and 24%<br />
is medium/large terraced housing (compared with 17%). Flats make up only 6%<br />
compared with a national average of 12%. 6% (9500 homes) are back-to-back, a<br />
fundamentally unsatisfactory house type that is now largely confined to <strong>Bradford</strong> and<br />
Leeds. This older terraced stock brings with it serious housing condition problems<br />
that continue to be a major challenge.<br />
Figure 4: Dwelling type profile The City of <strong>Bradford</strong> and England<br />
Source: Private Sector House Condition Survey 2008, p.21<br />
The age profile of the total private stock in the district differs from the average for<br />
England in that the stock profile contains a larger proportion of pre-1919 and interwar<br />
(1919-1945) stock compared to the national average. There is a consequent dip in<br />
the number of dwellings post 1944, particularly in the post 1964 dwellings, however<br />
this has been steadily increasing in recent years as the result of private sector new<br />
build.<br />
116
Figure 5: Dwelling age profile England and the City of <strong>Bradford</strong> District<br />
Source: Private Sector House Condition Survey 2008, p.20<br />
The following characteristics were identified in relation to private sector non-decency<br />
in <strong>Bradford</strong>, as seen in Table 8.<br />
Table 8: <strong>Bradford</strong> Private Sector Non-decency<br />
Source: Private Sector House Condition Survey 2008, p.6<br />
Over 65,000 homes fail the Decent Homes standard (40.5% of private sector stock,<br />
substantially higher than the English average of 27.1%). The problem is worse in both<br />
the private rented stock (58.8% compared with 40.6% nationally) and owner-occupied<br />
stock (37.6% compared with 24.9% nationally) 40 .<br />
<strong>Bradford</strong>’s private sector housing stock has a higher level of non decency than that<br />
found nationally, particularly with thermal comfort and category 1 hazard failures.<br />
Practical issues regarding improvement to older dwellings exist, and meeting national<br />
priorities especially for improving energy efficiency will be challenging in many<br />
cases 41 .<br />
48.6% (23,580) of private residents classified as vulnerable live in non-Decent homes<br />
(compared with an English average of 33.9%). Of the 23,580, 17,950 are owneroccupied<br />
(76%) and 5990 (24%) private rented. To reach the national target of 70%<br />
40 District Housing <strong>Strategy</strong> 2008-2020<br />
41 Private Sector House Condition Survey 2008<br />
117
of vulnerable households in the private sector to be in decent homes by 2010 will<br />
require 9025 homes to be improved to the Decent Homes Standard. The shortfall<br />
against the Decent Homes Standard is a major challenge in its own right, but the<br />
quality issues associated with older private housing, go well beyond the basic Decent<br />
Homes Standard. Poor environment and street-scene, and poor and cramped internal<br />
layouts are also common problems 42 .<br />
In the private sector 7% of all dwellings unfit. This is the highest proportion across the<br />
5 West Yorkshire local authorities. The MSOA areas with the overall poorest<br />
condition of housing stock are: Laisterdyke, Manningham Central, West Bowling,<br />
<strong>Bradford</strong> Central and Girlington. The MSOA with consistently the best condition is<br />
Eldwick/Crossflatts/Bingley Moor 43 .<br />
In the social sector all housing associations are on target to achieve the Decent<br />
Homes standard by 2010. By 2010, therefore the physical condition of social rented<br />
housing will be the best it has been for many years 44 .<br />
5.2.7 Vacancy<br />
The overall vacancy rate is around 7.0% which is much higher that the regional<br />
average of 4.1%. The vacancy rate is highest in the City Central sub-area (10%) and<br />
Keighley/Worth Valley (7.1%) and lowest in Wharfedale (5.2%) (Table 4.1)<br />
Table 9: Vacancy rates by sub-area<br />
Sub-areas Occupancy<br />
Empty<br />
New build<br />
and not<br />
occupied<br />
Occupied Total<br />
Vacancy<br />
Rate (%)<br />
Bingley 1772 374 28428 30574 5.8<br />
City Central 5480 388 48727 54595 10.0<br />
City North East 1549 166 26927 28642 5.4<br />
City South 1560 118 25386 27064 5.8<br />
City West 1227 161 19706 21094 5.8<br />
Keighley and Worth Valley 1921 103 25224 27248 7.1<br />
Wharfedale 1006 141 18109 19256 5.2<br />
Total 14515 1451 192507 208473 7.0<br />
Source: CBMDC Council Tax 2009<br />
5.2.8 Overcrowding<br />
The 2007/8 household survey identified a total of 9,181 households across <strong>Bradford</strong><br />
District living in overcrowded conditions Table 10 shows that the proportion of<br />
42 Private Sector House Condition Survey 2008<br />
43 Local housing Assessment 2008<br />
44 District Housing <strong>Strategy</strong> 2008-2016<br />
118
households who were overcrowded averaged 4.8% across <strong>Bradford</strong> District and was<br />
highest in the City Central sub-area (10.7%).<br />
Table 10: Overcrowding by sub-area<br />
Sub-areas<br />
No.<br />
Overcrowded<br />
Households<br />
Total<br />
Households<br />
City Central 4644 43467 10.7<br />
City North East 1047 29418 3.6<br />
City South 941 24791 3.8<br />
City West 705 22145 3.2<br />
Bingley 770 28072 2.7<br />
Wharfedale 436 18585 2.3<br />
Keighley & Worth Valley 638 23239 2.7<br />
<strong>Bradford</strong> 9181 189717 4.8<br />
Source: 2007/8 household survey<br />
5.3 Household characteristics<br />
This section contains information on:<br />
• Household composition<br />
• Household structure and formation<br />
• Future changes in household numbers<br />
5.3.1 Household composition<br />
% Over<br />
crowded<br />
There are approximately 191,900 households in <strong>Bradford</strong> (2006 figures), an increase<br />
of around 11,200 or 6.2%, since 2001 45 .<br />
The average household size in the <strong>Bradford</strong> district fell from 2.75 in 1981 to 2.59 in<br />
2004. This was not such a dramatic decrease as in many other areas due mainly to<br />
the sizeable local BME community.<br />
Compared with regional and national data (Table 11), the household type profile of<br />
<strong>Bradford</strong> District generally mirrors that of the Region and England, although the<br />
District does have considerably more multi-person households and lower proportions<br />
of couples with no children compared with the Region and England.<br />
45 <strong>Bradford</strong> Regional SHMA, 2008<br />
119
Table 11: Household structure<br />
Household Type<br />
<strong>Bradford</strong><br />
(%)<br />
Y & H<br />
(%)<br />
England<br />
(%)<br />
Single Person 28.5 30.6 28.4<br />
Couple (no children) 23.3 29.4 29<br />
Couple (with dependent children) 23.9 20.7 22.1<br />
Lone Parent (with dependent children) 6.9 6.6 7.2<br />
Other multi-person household 17.4 12.7 13.3<br />
Total 100 100 100<br />
Base 187,717 2.1m 20.7m<br />
Source: 2007/8 household survey; 2008 ONS Regional Trends<br />
5.3.2 Household structure and formation<br />
The age profile of <strong>Bradford</strong> District suggests that the population is generally younger<br />
than that of the region and England (Table 12). Overall, 57.2% of the population are<br />
aged under 40 in comparison with 51.6% for the Region and 51.5% for England.<br />
Table 12: Age profile<br />
Age Group<br />
<strong>Bradford</strong><br />
%<br />
Calderdale<br />
%<br />
Leeds<br />
%<br />
Y & H<br />
%<br />
England<br />
%<br />
0-19 28.2 25.2 23.4 24.4 24.2<br />
20-39 29.0 25.3 33.3 27.2 27.3<br />
40-59 24.6 28.5 24.0 26.7 26.9<br />
60-74 11.6 13.6 12.2 14.1 13.9<br />
75+ 6.6 7.4 7.1 7.6 7.8<br />
Total 100.0 100.0 100.0 100.0 100.0<br />
Base (000s) 497.4 200.1 761.2 5177.3 51092.0<br />
Source: ONS 2006 Mid-Year Population Estimates<br />
There is considerable ethnic diversity within <strong>Bradford</strong>. 18.4% of households are<br />
headed by someone who identifies with a Black and Asian Minority Ethnic group. The<br />
largest BAME group is Asian/Asian British – Pakistani (11.4%) of the population<br />
followed by White (other than British/Irish) (3.1%), Asian/Asian British – Indian (1.9%)<br />
and Black/Black British (1.4%).<br />
120
Map 1 Black and Asian Minority Ethnic Households in <strong>Bradford</strong> District<br />
Source: 2007/8 household survey<br />
In <strong>Bradford</strong> the proportion of all student households in 2001 was 0.3% (or 465<br />
households). While this was lower than the proportion for the region as a whole<br />
(0.6%) it was nonetheless the district with the 7 th highest student population in the<br />
region. The student housing market therefore represents an element of the <strong>Bradford</strong><br />
market that should be given due consideration within more detailed local studies 46 .<br />
5.3.3 Gypsies and Travellers<br />
Across the District there are two Local Authority sites. The first, of which, opened in<br />
1973 and is in Esholt – providing 19 plots. The second is the Mary Street site, which<br />
opened in 1976 and now has 28 plots. Overall there is a caravan capacity of 94 – with<br />
56 capacity at Mary Street and 38 at Esholt 47 .<br />
. Latest figures published by LGYH suggest an overall shortfall of 51 pitches over a ten<br />
year period 48 , comprising 37 residential pitches, 6 transient pitches and 8 sites for<br />
travelling showpeople across <strong>Bradford</strong> District.<br />
46 Local Housing Assessment 2008<br />
47 Local Housing Assessment 2008<br />
48 Brown, P and Niner, P Overview of Gypsy and Traveller Accommodation Assessments: Yorkshire<br />
and Humber Region, Final report for Yorkshire and the Humber Regional Assembly, University of<br />
Salford, March 2009<br />
121
5.3.4 Household Formation Typology<br />
A profile of household formation across all the MSOAs has been developed by the<br />
Housing <strong>Strategy</strong> section. This profile allows a typology of household formation in<br />
each area to be recognised (Map 2 below).<br />
Map 2: Household Formation Typology<br />
S<br />
Source: Local Housing Assessment, p.27.<br />
122
5.3.5 Future changes in household numbers<br />
Population projections for <strong>Bradford</strong> District suggest that the total population will<br />
increase from 505,900 in 2008 to 626,300 by 2026 and 655,000 by 2031. What is<br />
particularly noticeable about <strong>Bradford</strong>’s population projections is the expected<br />
increase in population across all age cohorts (Table 13), with the biggest absolute<br />
increase in the 25-39 age group (31,100 increase to 2008-2026) and the biggest<br />
proportionate increase will be amongst the 75+ age group (42.5% increase 2008-<br />
2026).<br />
Table 13: Population projections for <strong>Bradford</strong> 2008-2031<br />
Age<br />
Group<br />
No. households (000s)<br />
280<br />
260<br />
240<br />
220<br />
200<br />
180<br />
160<br />
140<br />
120<br />
100<br />
Year and population (000s<br />
2006 2011 2016 2021 2026 2031<br />
Year<br />
Change in<br />
total no.<br />
2008 2011 2016 2021 2026 2031 2008-<br />
2026<br />
2008-<br />
2031<br />
% Change<br />
2008-<br />
2026<br />
2008-<br />
2031<br />
0-14 107.1 113.2 125.7 134.9 138.5 140.2 31.4 33.1 29.3 30.9<br />
15-24 75.7 75.9 73 74.5 82.5 89.6 6.8 13.9 9.0 18.4<br />
25-39 107 114.4 129.1 138.6 138.1 136.6 31.1 29.6 29.1 27.7<br />
40-59 123.6 127 130.9 134.8 143.9 154.7 20.3 31.1 16.4 25.2<br />
60-74 59.3 61.9 66.1 72.3 76 81 16.7 21.7 28.2 36.6<br />
75+ 33.2 34.4 36.9 40.2 47.3 52.9 14.1 19.7 42.5 59.3<br />
Total 505.9 526.8 561.7 595.3 626.3 655 120.4 149.1 23.8 29.5<br />
Source: Sub-national population projections 2006-based<br />
The number of households in <strong>Bradford</strong> District is expected to increase from 191,000<br />
in 2006 to 253,000 by 2026 (a 32.5% increase) (Figure 6). By 2031, the number of<br />
households is projected to be 269,000 (a 40.8% increase on 2006 figures). For the<br />
period 2006-2026, this equates to an average annual increase of 3,100 households<br />
(which compares with an RSS build rate of 2,700 each year).<br />
Figure 6: Projected household change 2006-2031<br />
Source: Sub-national household projections 2006-based<br />
123
5.4 Housing Markets<br />
This section contains information on:<br />
• <strong>Bradford</strong> Housing Market Area<br />
• Property values<br />
• Affordability<br />
• Housing Need<br />
5.4.1 <strong>Bradford</strong> Housing Market Area<br />
Following official guidance, and taking into account travel to work and migration<br />
patterns, research for the regional SHMAs defined Housing Market Areas (HMAs) by<br />
aligning them with whole local authorities or groups of local authorities (Map 3). In<br />
West Yorkshire this led to the definition of five HMAs, made up as follows:<br />
• Leeds;<br />
• <strong>Bradford</strong>;<br />
• Calderdale;<br />
• Kirklees; and<br />
• Wakefield.<br />
Although the boundaries of the <strong>Bradford</strong> HMA coincide with the district boundary, it is<br />
recognised that there are important overlaps with adjacent areas 49 .<br />
Map 3: Yorkshire and the Humber: housing market area boundaries<br />
Source: <strong>Bradford</strong> Regional SHMA 2008, p.9.<br />
49 <strong>Bradford</strong> Regional SHMA 2008<br />
124
The <strong>Bradford</strong> HMA represents a self-contained housing market. According to the<br />
2001 Census, 65.0 per cent of individuals’ most recent moves in the year prior to the<br />
Census both originated and ended in the <strong>Bradford</strong> HMA. Despite this selfcontainment<br />
there are clearly links with other areas, particularly the adjacent HMAs 50 .<br />
The <strong>Bradford</strong> SHMA concluded that the <strong>Bradford</strong> District can be described as a selfcontained<br />
housing market area, with 76.8% of households moving within the District<br />
and 78.6% of employees working in the District. This corroborates the findings of<br />
Regional SHMA work prepared by ECOTEC 51 .<br />
5.4.2 Housing Markets in <strong>Bradford</strong><br />
The SHMA also considered a range of data to identify a number of distinctive subareas.<br />
The urban area of <strong>Bradford</strong> was split into four localities, with the remainder of<br />
the District divided into: Bingley, Baildon and Shipley; Keighley and Worth Valley; and<br />
Wharfedale.<br />
Map 4: <strong>Bradford</strong> sub-areas<br />
50 <strong>Bradford</strong> Regional SHMA, 2008<br />
51 Strategic Housing Market Assessments for Yorkshire and the Humber: Final Report <strong>Bradford</strong> Housing Market<br />
Area, Ecotech, June 2008<br />
125
Having carried out this analysis, the proposed sub-areas were considered by the<br />
project steering group and the Housing Partnership. There was general agreement<br />
that this sub-area breakdown was appropriate for <strong>Bradford</strong> District. However, it is not<br />
suggested that these are different housing market areas but rather distinctive subareas<br />
of a larger <strong>Bradford</strong> Housing Market Area.<br />
5.4.3 Property Values – Levels and Trends<br />
Figure 7 shows how house prices across <strong>Bradford</strong> District have increased a<br />
staggering 298% over the period 1996 to 2008, with average prices peaking at<br />
£129,950 during 2008. Figure 8 summarises the latest house price data for <strong>Bradford</strong><br />
District which suggests that average prices have been falling since reaching this peak<br />
and by May 2009, average prices had fallen by 23.5% to £103,293. In comparison,<br />
regional prices have fallen by 21% since February 2008.<br />
Within <strong>Bradford</strong> District there are considerable variations in house prices (Map 3.1).<br />
Map 5 summarises median house prices across <strong>Bradford</strong> District, clearly illustrating<br />
highest prices in Wharfedale (with prices in excess of £180,000); prices of between<br />
£150,000 and £180,000 in the Bingley/Shipley area, with lowest prices in City Central<br />
and City South areas with median prices of between £90,000 and £120,000. Within<br />
other suburban areas of <strong>Bradford</strong> City and Keighley/Worth Valley, prices are around<br />
£120,000 to £150,00<br />
Figure 7: House price trends 1996 to 2008: <strong>Bradford</strong>, Leeds and regional data<br />
Median House Prices (£)<br />
140,000<br />
120,000<br />
100,000<br />
80,000<br />
60,000<br />
40,000<br />
Q1<br />
1999<br />
Source: Land Registry<br />
Q4 Q3 Q2 Q1<br />
2002<br />
Q4 Q3 Q2 Q1<br />
2005<br />
Q4 Q3 Q2 Q1<br />
2008<br />
<strong>Bradford</strong> Leeds Yorkshire and Humber<br />
126
Figure 8: Recent price trends: <strong>Bradford</strong> and Y&H Jan 08 – May 2009<br />
Average Price (£)<br />
150,000<br />
140,000<br />
130,000<br />
120,000<br />
110,000<br />
100,000<br />
Jan-08<br />
Source: Land Registry<br />
Mar-08<br />
May-08<br />
Jul-08<br />
Map 5: Median house prices in 2008<br />
Source: Land Registry<br />
Sep-08<br />
Nov-08<br />
Jan-09<br />
<strong>Bradford</strong> Y&H<br />
Mar-09<br />
May-09<br />
127
5.4.4 Affordability<br />
The relative affordability of open market dwellings in <strong>Bradford</strong> District is compared<br />
with other 21 districts in Yorkshire and the Humber in Table 3.1. Table 3.1 presents<br />
lower quartile house prices, lower quartile gross income of full-time workers and a<br />
ratio of lower quartile incomes to house prices. Compared with other districts <strong>Bradford</strong><br />
ranks as the 8 th most affordable District, with an income to house price ratio of 6.1<br />
(which compares with a ratio of 6.0 for the Region).<br />
Table 14: Relative affordability of lower quartile prices by Local Authority<br />
District<br />
Lower<br />
Quartile<br />
House Price<br />
LQ Gross<br />
Income<br />
each week<br />
Annual<br />
Gross<br />
Income<br />
Kingston upon Hull £75,000 £301 £15,643 4.8<br />
North East Lincolnshire £79,000 £309 £16,043 4.9<br />
Doncaster £85,000 £330 £17,178 4.9<br />
Calderdale £90,000 £337 £17,521 5.1<br />
Barnsley £85,000 £309 £16,091 5.3<br />
Rotherham £93,500 £318 £16,520 5.7<br />
Kirklees £101,000 £332 £17,247 5.9<br />
<strong>Bradford</strong> £95,000 £301 £15,627 6.1<br />
North Lincolnshire £100,000 £314 £16,347 6.1<br />
Wakefield £100,000 £312 £16,202 6.2<br />
Sheffield £102,167 £316 £16,426 6.2<br />
Leeds £110,000 £336 £17,471 6.3<br />
East Riding of Yorkshire £119,500 £352 £18,290 6.5<br />
Craven £128,000 £371 £19,310 6.6<br />
Scarborough £119,000 £320 £16,618 7.2<br />
Selby £121,500 £312 £16,244 7.5<br />
Hambleton £145,000 £367 £19,100 7.6<br />
Richmondshire £138,000 £324 £16,848 8.2<br />
York £148,100 £342 £17,774 8.3<br />
Ryedale £142,000 £315 £16,400 8.7<br />
Harrogate £160,000 £352 £18,286 8.7<br />
Yorkshire & Humber £100,000 £323 £16,782 6.0<br />
Sources: CLG House Price Statistics; Annual Survey of Hours and Earnings 2008<br />
Income to<br />
House Price<br />
ratio<br />
Within <strong>Bradford</strong> District there are considerable variations in house price and relative<br />
affordability (see Map 3.1). Map 3.4 considers the relative affordability of properties by<br />
comparing lower quartile incomes with lower quartile property prices. This suggests a<br />
four-way split between highest ratios in Wharfedale (where lower quartile prices are<br />
9.8 times a lower quartile income); a ratio of 7.9 in the Bingley/Shipley area; ratios of<br />
6.1 in City West and City North East sub-areas; and ratios between 5.2 and 5.7 in<br />
remaining <strong>Bradford</strong> City areas and Keighley/Worth Valley.<br />
128
Map 6: Relative affordability of properties in <strong>Bradford</strong><br />
In order to inform the development of the affordable housing policy, extensive<br />
analytical work was carried out by the Housing <strong>Strategy</strong> Section using<br />
Geodemographics. The results were grouped into three broad HMAs which will form<br />
the basis of affordable housing policy:<br />
• Cluster 1 - High Provision<br />
Characterised by lower than average density, higher incomes, and high lower quartile<br />
house prices. Lower than average level of affordable stock (band A), low social sector<br />
provision. NB: Density is used in an inverse way - as in where there is low density<br />
there is little availability of land for building<br />
• Cluster 3 - Medium Provision<br />
High demand for social rented, above average lower quartile house prices, lower than<br />
average social sector and affordable stock provision.<br />
• Cluster 2 - Low Provision<br />
High social sector, high levels of affordable stock (band A) but high levels of<br />
overcrowding so still substantial need, and average demand for social rented.<br />
129
Map 7: Affordable Housing Requirement<br />
Source: Local Housing Assessment 2008, p.161<br />
5.4.5 Housing Need<br />
A robust and defensible assessment of housing need is essential for the development<br />
of affordable housing policies which need to be articulated in Local Development<br />
Frameworks. PPS3 defines housing need as:<br />
‘the quantity of housing required for households who are unable to access<br />
suitable housing without financial assistance’.<br />
Table 15: Housing need in <strong>Bradford</strong> District<br />
Category Factor<br />
Homeless<br />
households or<br />
with insecure<br />
tenure<br />
Mismatch of<br />
housing need<br />
and dwellings<br />
N1 Under notice, real threat of notice or lease coming to<br />
an end<br />
N2 Too expensive, and in receipt of housing benefit or in<br />
arrears due to expense<br />
No.<br />
Households<br />
599<br />
437<br />
N3 Overcrowded according to the 'bedroom standard'<br />
2538<br />
model<br />
N4 Too difficult to maintain 30<br />
N5 Couples, people with children and single adults over<br />
25 sharing a kitchen, bathroom or WC with another 415<br />
household<br />
130
Dwelling<br />
amenities and<br />
condition<br />
Social needs<br />
N6 Household containing people with mobility<br />
impairment or other special needs living in unsuitable<br />
accommodation<br />
N7 Lacks a bathroom, kitchen or inside WC and<br />
household does not have resource to make fit<br />
N8 Subject to major disrepair or unfitness and<br />
household does not have resource to make fit<br />
N9 Harassment or threats of harassment from<br />
neighbours or others living in the vicinity which cannot<br />
be resolved except through a move<br />
2109<br />
Total no. households with one or more housing needs 7425<br />
Total Households 189717<br />
% households in need 3.9<br />
Note: A household may have more than one housing need.<br />
Source: 2007/8 Household Survey<br />
In addition to establishing the overall affordable housing requirements SHMA analysis<br />
breaks this requirement down by sub-area grouping, property designation (i.e.<br />
general purpose and older person) and property size (number of bedrooms) as<br />
shown in Table 4.12.<br />
Table 16: Annual affordable housing requirement (gross) 2008/09-2012/13<br />
Designation<br />
No.<br />
Beds<br />
Bingley City<br />
NE<br />
City<br />
Central<br />
Sub-area<br />
City<br />
West<br />
City<br />
South<br />
Keighley<br />
and<br />
Worth<br />
Valley<br />
490<br />
842<br />
316<br />
Wharfedale Total<br />
General<br />
needs<br />
1 -38 -130 -134 -48 8 -25 -8 -375<br />
2 161 -140 219 36 17 -11 70 351<br />
3 -21 176 -35 230 286 -81 49 604<br />
4 27 -6 11 -6 52 28 1 108<br />
Older person 1 -33 50 59 -21 34 -19 10 81<br />
Total<br />
2 6 -3 -6 -6 -6 -4 -2 -21<br />
Net 103 -53 114 185 391 -111 120 749<br />
Gross 194 227 288 266 396 28 130 1530<br />
Source: 2007/8 Household Survey<br />
Conclusions<br />
Future housing development needs to be managed to address relevant markets in<br />
the district, including the BME and affordable markets and meet identified housing<br />
needs of specific groups. It will be vital that planning policy considers housing mix<br />
alongside future economic growth and re-structuring to enable access by all groups,<br />
whilst also addressing the current trend of out-migration, especially within higher<br />
income groups.<br />
131
The RSS requires the District of <strong>Bradford</strong> to increase its supply of housing target<br />
considerably from 1,390 units per year to 2,700 per annum. Recent research<br />
supports the need for 25-30% of these new homes to be affordable. The current rate<br />
of new housing development averages 1400 homes per year over the last decade, of<br />
which only a small fraction is affordable. These new targets will be a major challenge<br />
to achieve.<br />
5.5 Latest Housing Data<br />
Much of the housing baseline data has been collected from studies which have been<br />
completed over the previous few years. Housing markets are dynamic and therefore it<br />
is important to have the latest figures and data possible to inform policy. The following<br />
studies provide the most up to date analysis of the housing markets in <strong>Bradford</strong>.<br />
5.5.1 Progress in Leeds City Region (LCR)<br />
The Progress in Leeds City Region Report was published in March 2009, therefore<br />
provides relatively up to date statistics on key indicators.<br />
Table 17: Mean House Prices based on Land Registry Data (£) by LA, 1998-2007<br />
Source: Housing Market and Price Statistics, DCLG. Progress in LCR- Report, 2009<br />
Table 18: Number of Households on LA Waiting Lists, 1998-2008<br />
Source: Housing Statistics, DCLG. Progress in Leeds City Region Report 2009<br />
132
Table 19: Annual Net Housing Completions by LA, 2002/03 - 2007/08<br />
Source: Yorkshire and Humber Assembly. Progress in Leeds City Region Report 2009<br />
5.5.2 Implications of the Economic Recession on LCR Housing Delivery<br />
This report examined the potential impact of the current economic recession on the<br />
long term housing delivery, of the Leeds City Region. The report states that the<br />
housing targets set in the RSS were raised substantially in the early part of 2008, and<br />
within six months the UK entered the first economic recession since the early 1990s.<br />
It is likely that some of the assumptions underpinning at least the early years of<br />
regional housing plans need to be re-examined.<br />
The report states that there are a number of factors at work which will result in the<br />
City Region being unable to meet its RSS numbers in the foreseeable future –<br />
(i) the availability of investment finance for developers,<br />
(ii) the new restrictions on mortgages,<br />
(iii) the general uncertainty over house prices,<br />
(iv) an increasing nervousness about future employment prospects amongst<br />
prospective house buyers<br />
(v) fewer people in employment, reducing the numbers of first time buyers.<br />
Added to this, is the unknown loss of capacity within the development industry.<br />
A further factor with longer term implications is the collapse of the apartment market.<br />
This high density model has played a major role in the recent increase in housing<br />
completions, accounting for 70%-80% of completions in some areas. It now appears<br />
to be substantially and possibly permanently damaged. There is a need to consider<br />
whether a new urban model is required, possibly based on an adapted apartment<br />
model (lower density, higher quality) to provide the scale of new housing required by<br />
the City Region. It is not obvious that the development industry in its current state is<br />
able to develop this model.<br />
133
Figure 7: LCR Housing Completions Scenario based on 1990’s Recession<br />
Source: Implications of the Economic Recession on LCR Housing Delivery-A Report 2009<br />
Figure 8: LCR Housing Completions Scenario<br />
Source: Implications of the Economic Recession on Leeds City Region Housing Delivery, 2009<br />
The report concludes that the current economic and housing market conditions make<br />
the current RSS target un-achievable in the foreseeable future, unless there is<br />
substantial intervention to change conditions on both the supply and demand side.<br />
On the supply side, the availability of finance for investors is crucial, as is the<br />
availability of sites and supporting infrastructure to accelerate new development. Of<br />
134
equal importance is the development of a new model to replace the apartment model<br />
which has dominated development is recent years.<br />
Also there is now considerable uncertainty with regard to population growth and<br />
household formation rates. The economic recession is likely to reduce the number of<br />
economic migrants in the region as employment opportunities decline, and lower<br />
levels of employment and the effect of the credit crunch will reduce new household<br />
formation, particularly with regard to younger people. As important, the ability of the<br />
development industry and financial sector to deliver a high number of completions<br />
year on year is now open to question.<br />
5.6 Key Facts<br />
Stock Profile<br />
• Total dwelling stock as at April 2009 was 208,473 residential dwellings across<br />
<strong>Bradford</strong> District<br />
• The stock is dominated by private sector dwellings, with levels of social housing<br />
well below the regional average.<br />
• Levels of private renting have increased over the last few years.<br />
• The stock is dominated by terraced housing, which accounts for roughly half of<br />
the total stock, and semi-detached housing.<br />
• Reflective of limited local offer of higher value housing is the fact that detached<br />
homes make up a smaller proportion than the regional and national average.<br />
• Flats represent a smaller percentage of the stock than the national average.<br />
Stock condition<br />
• The stock contains a larger proportion of pre-1919 and interwar stock compared<br />
to the national average. Roughly 40% of <strong>Bradford</strong>’s total stock was built pre-1919<br />
compared to the national average of 25%.<br />
• <strong>Bradford</strong> has very high levels of private sector non-decency and a higher<br />
percentage of dwellings unfit than other West Yorkshire authorities.<br />
• 6% of homes are back-to-back, a fundamentally unsatisfactory house type that is<br />
now largely confined to <strong>Bradford</strong> and Leeds. This older terraced stock brings with<br />
it serious housing condition problems that continue to be a major challenge.<br />
135
Household characteristics<br />
• Compared with regional and national data the household type profile of <strong>Bradford</strong><br />
District generally mirrors that of the Region and England, although the District<br />
does have considerably more multi-person households and lower proportions of<br />
couples with no children compared with the Region and England.<br />
• The average household size in the <strong>Bradford</strong> district is 2.5. This is not as low in<br />
many other areas due mainly to the sizeable local BME community.<br />
• Roughly a quarter of <strong>Bradford</strong>’s population is under 15, this is higher than regional<br />
and national averages.<br />
• <strong>Bradford</strong> has a significantly higher proportion of minority ethnic households than<br />
the region as a whole.<br />
• The older population in <strong>Bradford</strong> is not as significant as in some other areas of the<br />
region<br />
Future Change in Households<br />
• The population of <strong>Bradford</strong> is growing and is forecast to grow very strongly in<br />
future years. Economic growth and restructuring across the sub-region; strong<br />
B&ME population growth; and changing and increasing patterns of international<br />
migration are major drivers which will continue to determine the direction of<br />
housing market change in <strong>Bradford</strong> over coming years.<br />
• The period 2008-2026 is expected to see substantial household growth in the<br />
<strong>Bradford</strong> district, with an additional 62,000 households estimated.<br />
• This predicted increase in households is reflected in the doubling of the RSS<br />
annual housing target for <strong>Bradford</strong> to 2700 per year.<br />
• The most significant increase is predicted in single person households, which are<br />
predicted to become the single most dominant household group in <strong>Bradford</strong> by<br />
2029.<br />
• Average household size is predicted to decrease, though not by as much as other<br />
regional local authorities, due to <strong>Bradford</strong>’s large BME population.<br />
• Although growth of the older population (aged 65+) is not expected to be as<br />
marked in <strong>Bradford</strong> as in some other areas of the region, the district will need to<br />
commence planning for increasing demand as nearly a third of the district’s<br />
population increase will be accounted for by a growing population of older people.<br />
136
• <strong>Bradford</strong> has a significantly higher proportion of BME households than the region<br />
as a whole. Independent forecasts predict very strong population and household<br />
growth in <strong>Bradford</strong> driven by strong natural growth amongst the indigenous South<br />
Asian population.<br />
Housing Markets<br />
• <strong>Bradford</strong> HMA is relatively self contained but there are links to Leeds, Kirklees,<br />
Craven and North Yorkshire.<br />
• <strong>Bradford</strong> consists of a range of complex and diverse housing markets, and<br />
although many areas have healthy housing markets others exhibit symptoms of<br />
fragility.<br />
• Despite house prices increases across the district over recent years, the highest<br />
priced markets remain concentrated in suburban and semi-rural locations such as<br />
Wharfedale, Bingley and Baildon.<br />
• The inner suburbs remain characterised by lower sales values, although the<br />
expanding city centre market is emerging as an area of higher value properties at<br />
the very centre of <strong>Bradford</strong>.<br />
• The shortage of affordable housing in rural areas is a key issue for the district.<br />
• Overcrowding and poor housing are issues in central <strong>Bradford</strong>. The inner suburbs<br />
of <strong>Bradford</strong> suffer from higher levels of overcrowding than other areas of the<br />
district due to a coalescence of small properties and large household sizes.<br />
• The District’s B&ME community is the major driver of population and household<br />
growth and as such, due to a mix of issues including lower incomes and strong<br />
ties to specific neighbourhoods, there is a high risk that established B&ME<br />
neighbourhoods at the urban core of the District will ‘overheat’.<br />
Affordability<br />
• House prices are below the regional average, but in the few years the district has<br />
experienced faster rising house prices than nationally and regionally.<br />
• Affordability ratios for <strong>Bradford</strong> are slowly increasing, though are still below those<br />
of West Yorkshire and the Region. However, the district-wide picture masks much<br />
larger localised affordability problems.<br />
• Affordability issues are most obvious in Wharfedale, Airedale, the Worth Valley<br />
and some outlying suburbs of <strong>Bradford</strong>.<br />
137
Sources:<br />
• Affordability is a major issue for both urban and rural areas due to a low income<br />
and high house prices respectively.<br />
• The annual shortfall of affordable housing supply is currently estimated to be in<br />
the region of 749 (net) units per year<br />
• BMDC (2008) <strong>Bradford</strong> District Local Housing Assessment 2008. <strong>Bradford</strong> Council.<br />
• BMDC (2008) <strong>Bradford</strong> Future of Social Housing <strong>Study</strong> 2007-08. Report Dated<br />
August 2008. <strong>Bradford</strong> Council.<br />
• BMDC (2008) <strong>Bradford</strong> Housing Requirements <strong>Study</strong> 2007-08. Report Dated July<br />
2008. <strong>Bradford</strong> Council.<br />
• BMDC (2008) Private Sector House Condition Survey 2007. Report Dated June<br />
2008. <strong>Bradford</strong> Council.<br />
• BMDC (2009) Joint Housing <strong>Strategy</strong> for <strong>Bradford</strong>. 2008-2020. Report Dated<br />
February 2009. Department of Regeneration, <strong>Bradford</strong> Council.<br />
• BMDC (2010) Joint Housing <strong>Strategy</strong> for <strong>Bradford</strong> Delivery Plan 2010-12. <strong>Bradford</strong><br />
Council.<br />
• BMDC (2010) <strong>Bradford</strong> District Strategic Housing Market Assessments 2010. Report<br />
Dated June 2010. <strong>Bradford</strong> Council.<br />
• ECOTEC (2007) West Yorkshire B&ME Housing Market <strong>Study</strong>. Report Dated April<br />
2007. West Yorkshire Housing Partnership.<br />
• EKOS Consulting (UK) Ltd (2009) Implications of the Economic Recession on Leeds<br />
City Region Housing Delivery. A Report to Leeds City Region. Report Dated February<br />
2009.<br />
• Yorkshire and Humber Assembly (2008) Strategic Housing Market Assessments for<br />
Yorkshire & the Humber Final report: <strong>Bradford</strong> Housing Market Area. Report dated<br />
June 2008. Y&H Assembly.<br />
138
6. SOCIAL AND COMMUNITY FACILITIES<br />
Planning Policy Statement 1 supports the promotion of health and well being and requires<br />
local planning authorities to recognize the link between social inequalities in the provision of<br />
social and community facilities including health services, access to open spaces in the<br />
natural and built environment and the location of schools, shops and other facilities to reduce<br />
the need to travel. In delivering such facilities it is important that the LDF ensures that<br />
suitable locations are found for these uses which address local needs, whilst continuing to<br />
protect and enhance the natural built environment with high quality and inclusive designs.<br />
Previous studies by the council have highlighted that there are a number and variety of social<br />
and community facilities located within <strong>Bradford</strong> district with various degree of service<br />
capacity and catchment area. Although there are evidence of overall lack in quantity and<br />
quality of such provisions, access to these facilities are generally very good across the<br />
district. For example 96.9% and 99.8% of all households in the districts are within 15 and 30<br />
minutes of a GP by public transport. 90.5% and 99.7% of all households are within 30 and<br />
60 minutes of a hospital by public transport. 92.2% and 99.7% of 12-17 years are within 20<br />
and 40 minutes of a secondary school by public transport. Figures are similar for access to<br />
primary schools. 97.5% and 99.8% of people of working age are within 20 and 40 minutes of<br />
an employment centre by public transport. Employment centres are defined as Super Output<br />
Areas with more than 499 jobs. 52<br />
This section of the baseline analysis report will look into the detail of these existing social and<br />
community facilities spread across the district and will highlight their performances and the<br />
major issues they are facing. Findings from a number of existing studies and reports have<br />
been used for this purpose including the following-<br />
• The Big Plan- Sustainable Community <strong>Strategy</strong> for <strong>Bradford</strong> 2008-11(CBMDC, 2008)<br />
• <strong>Bradford</strong> Positioning Statement (Regeneris, 2005)<br />
• Open Space and Built Recreational Facilities SPD (CBMDC, 2007)<br />
• <strong>Bradford</strong> Open Space, Sport and Recreation <strong>Study</strong> (July 2006)<br />
• Sport and Recreation Facilities Assessment (Strategic Leisure ltd., 2008)<br />
• <strong>Bradford</strong> District Children and Young People Needs <strong>Analysis</strong> (CBMDC, 2008)<br />
• Children and Young People’s Plan 2009-12 (CBMDC,2008)<br />
• Strategic Learning Plan 2006-09 (<strong>Bradford</strong> and District Learning Partnership, 2007)<br />
• West Yorkshire Fire and Rescue Service- <strong>Bradford</strong> District Action Plan 2007/8-2008/09<br />
• Yorkshire Ambulance Service Annual Report + Corporate Plan (YAS, 2007-09)<br />
• West Yorkshire Police Annual Report 2006/7-2008/09 (West Yorkshire Police, 2006-2008)<br />
• West Yorkshire Gypsy and Travellers Accommodation Assessment (Powell R. et al, 2008)<br />
52 CS SA baseline.<br />
139
6.1 Education<br />
Councils as Local Education Authorities have a statutory obligation to provide education<br />
according to the Department for Education and Skills (DfES) guidance.<br />
Following <strong>Bradford</strong> LEA's critical OfSTED inspection of 2000, <strong>Bradford</strong> Council decided to<br />
establish a strategic partnership for the provision of school-focused educational services.<br />
This involved the procurement of a direct service provider who would work in partnership with<br />
and under contract to the Council. The contract was awarded to Serco which took up its<br />
responsibilities in the contract under the name of Education <strong>Bradford</strong> in July 2001. It is a ten<br />
year contract and the largest of its type in Europe. The contract is coming towards an end in<br />
July 2011 and the council is currently working towards setting up programmes for delivering<br />
the future education and related services in the district.<br />
6.1.1 Schools in <strong>Bradford</strong><br />
There are over 230 schools across <strong>Bradford</strong> District. The majority of these schools are state<br />
schools managed by the Local Education Authority (LEA), others are independent.<br />
ADD GIS MAP SHOWING STATE RUN NURSERY SCHOOLS, PRIMARY, SECONDARY SCHOOLS<br />
Faith state schools<br />
• 19 Catholic voluntary aided primary schools and 3 secondary Catholic voluntary<br />
aided schools.<br />
• There are 14 Church of England voluntary controlled primary schools and 11 Church<br />
of England voluntary aided primary schools.<br />
• There is 1 Muslim girl’s secondary school.<br />
http://www.bradford.gov.uk/education_and_skills/schools/school_types/faith_state_schools/<br />
Foundation Schools<br />
There are 12 foundation schools in the district. 9 of these are primary schools and the others<br />
are secondary.<br />
http://www.bradford.gov.uk/education_and_skills/schools/school_types/foundation_schools/<br />
Dixon academy is currently the only selective school in the district.<br />
http://www.bradford.gov.uk/education_and_skills/schools/school_types/selective_schools/<br />
All Through schools<br />
There are 2 all through schools, age range 2 – 18, which are both Academies.<br />
Academies<br />
There are 3 other secondary Academies.<br />
140
Specialist schools<br />
All secondary schools now have a specialism.<br />
http://www.bradford.gov.uk/education_and_skills/schools/school_types/specialist_schools/<br />
Special schools<br />
• There are 3 co-located primary special schools.<br />
• There are 3 co-located secondary special schools<br />
• There is 1 Communication and Interaction special school.<br />
• There is 1 special school for deaf children.<br />
http://www.bradford.gov.uk/education_and_skills/schools/school_types/state_special_school<br />
s/<br />
Supplementary Schools<br />
The LEA has been providing support to Supplementary Schools for mother tongue teaching<br />
since 1983. There are over 80 Supplementary Schools registered with Education <strong>Bradford</strong><br />
providing a range of mother tongue teaching classes in Arabic, Bengali, Gujarati, Punjabi,<br />
Hindi, Polish, Italian and Urdu as the main languages. These schools cater for approximately<br />
8,000 minority ethnic pupils involving 300 community tutors. Full detail of the supplementary<br />
schools education services can be found from the following lnk-<br />
http://www.bradford.gov.uk/education_and_skills/schools/school_types/supplementary_scho<br />
ols/<br />
Voluntary Controlled and Aided Schools<br />
There are 39 voluntary Aided schools in the district. 31 of these are primary schools and<br />
others are secondary.<br />
http://www.bradford.gov.uk/education_and_skills/schools/school_types/voluntary_aided_sch<br />
ools/<br />
There are 15 Voluntary Controlled schools in the district. 14 of these are primary schools and<br />
1 is a secondary school.<br />
http://www.bradford.gov.uk/education_and_skills/schools/school_types/voluntary_controlled_<br />
schools/<br />
Nursery and pre-school<br />
There are 7 state nursery schools in <strong>Bradford</strong> district.<br />
http://www.bradford.gov.uk/education_and_skills/schools/school_types/state_nursery_school<br />
s/<br />
141
Primary<br />
There are 159 primary schools in <strong>Bradford</strong> district.<br />
http://www.bradford.gov.uk/education_and_skills/schools/school_types/state_primary_school<br />
s/<br />
Secondary<br />
There are 29 secondary schools in <strong>Bradford</strong> district.<br />
http://www.bradford.gov.uk/education_and_skills/schools/school_types/state_secondary_sch<br />
ools/<br />
6.1.2 School Performances<br />
<strong>Bradford</strong> has 7 Nursery Schools, 159 Primary Schools, 29 Secondary Schools, 11 Special<br />
Schools, 4 Secondary Pupil Referral Units (PRUs), 1 Primary PRU and 2 Hospital based<br />
PRUs. In addition, there are 4 Academies.<br />
In January 2008 the total pupil population was 87,335, of which 52,915 were in the Nursery<br />
and Primary Sector. The number of pupils in <strong>Bradford</strong> schools is increasing in the younger<br />
age groups.<br />
Nursery and Primary schools<br />
The 7 state nursery schools in <strong>Bradford</strong> district are:<br />
http://www.bradford.gov.uk/education_and_skills/schools/school_types/state_nursery_school<br />
s/<br />
The 159 primary schools in <strong>Bradford</strong> district are:<br />
http://www.bradford.gov.uk/education_and_skills/schools/school_types/state_primary_school<br />
s/<br />
The latest figures from DCSF statistics 53 show that although there is significant variation in<br />
achievement level over time for each school in <strong>Bradford</strong>, most Primary schools are showing<br />
an overall improvement in their KS2 results since 2003 and the local authority average has<br />
risen closer to the national average; It also highlights that pupils in most deprived areas of<br />
the district are attaining a lower level than other pupils in the comparatively affluent areas,<br />
impacting on the future skills and opportunities available to them. This will also impact on the<br />
desirability of schools for new families moving into the area.<br />
Table: <strong>Bradford</strong> Key Stage 2 results 2008<br />
English Mathematics Science<br />
both English<br />
and<br />
Mathematics<br />
Average<br />
point<br />
score<br />
L4+ L5 A/T L4+ L5 A/T L4+ L5 A/T L4+<br />
LA Average 77% 25% 75% 26% 83% 37% 69% 27.1<br />
England<br />
Average<br />
Source: DCSF<br />
81% 30% 79% 31% 88% 44% 73% 27.9<br />
53 http://www.dcsf.gov.uk/cgibin/performancetables/group_08.pl?Mode=Z&No=380&Base=p&Type=LA&Begin=s&Phase=p&Year=08<br />
142
Table: <strong>Bradford</strong> GCSE attainment rate<br />
% of 15 year old pupils achieving 5+A*-<br />
C (and equivalent) including English<br />
and maths GCSEs<br />
Data collected from the primary schools at the end of June 2009 showed a reduction in the<br />
number of schools below the government’s floor target as compared with 2008.<br />
Source: <strong>Bradford</strong> and Airedale NHS PCT JSNA 2009<br />
By 2010, the aim is that the number of primary schools below 65% in both English and<br />
mathematics will have been reduced to five and that by 2011, no schools will be below the<br />
floor target.<br />
Overall outcomes at this stage for 2008 remained low but there were signs of of improvement<br />
that contrasted with the previous declines. KS2 and KS4 attainment levels show steady<br />
improvement over time.<br />
Secondary schools<br />
% of 15 old pupils achieving 5+A*-C<br />
(and equivalent)<br />
2005 2006 2007 2008 2005 2006 2007 2008<br />
LA Average 32.3% 34.0% 36.2% 36.7% 46.5% 50.0% 51.9% 56.4%<br />
England Average 44.3% 45.3% 46.0% 47.3% 56.3% 58.5% 60.9% 64.8%<br />
Source: DCSF 54<br />
There are 29 secondary schools in <strong>Bradford</strong> district<br />
http://www.bradford.gov.uk/education_and_skills/schools/school_types/state_secondary_sch<br />
ools/<br />
The percentage of <strong>Bradford</strong> students gaining 5 or more A*-C GCSE grades is well below the<br />
national figure, reflecting the problems the LEA has faced in achieving strong results.<br />
However, secondary schools have shown a continuing rapid improvement in standards year<br />
on year, faster than the national rate of improvement. There has been an overall 17.1%<br />
attainment improvement for pupils achieving at least 5 GCSE’s (A-C grades) since 2003<br />
compared to the national average of 13.5% with some schools showing exceptional<br />
improvement levels of over 20%. 55 Schools like <strong>Bradford</strong> Grammar School, <strong>Bradford</strong> Girls’<br />
Grammar School and Dixons City Academy have achieved 99% -100% success rates which<br />
is well above the national achievement rate.<br />
54 http://www.dcsf.gov.uk/cgibin/performancetables/group_08.pl?Mode=Z&Type=LA&Begin=b&No=380&Base=c&Phase=1&F=1&L=50&<br />
Year=08<br />
55 <strong>Bradford</strong> Strategic Education partnership Annual Review 2008.<br />
143
In 2008 nine secondary schools were below floor targets. Of these six are predicting<br />
improved performance above their targets. Four schools are not expecting to meet floor<br />
targets in 2009. There are three further schools whose estimates are only just above floor<br />
targets.<br />
Source: <strong>Bradford</strong> and Airedale NHS PCT JSNA 2009<br />
However, on the positive side, Schools in bradford are becoming more self-evaluating, selfimproving<br />
and have the strategies in place to be able to bring about sustainable changes. 4<br />
of the district's secondary schools (Belle Vue Girls' School, Carlton Bolling College, Grange<br />
Technology College and Laisterdyke Business and Enterprise College) were among 56<br />
schools nationally which recorded a good Value Added score in a report by the Specialist<br />
Schools and Academies Trust.<br />
Buttershaw Business and Enterprise College, Greenhead High School, Queensbury School,<br />
Rhodesway School and Visual Arts College and Thornton Grammar were also among 359<br />
specialist schools and academies which were recognised by the Trust earlier this year for<br />
making outstanding improvements to their GCSE results.<br />
There are however, some schools which still rate significantly under the national average and<br />
consequently the Government are now supporting <strong>Bradford</strong> in a further re building and<br />
renewal programme at both primary and secondary level in <strong>Bradford</strong>.<br />
6.1.3 Other Achievements<br />
Outstanding performance<br />
More than one in ten <strong>Bradford</strong> schools have now been judged as Outstanding by Ofsted<br />
since the inspection framework changed in 2005. Out of 205 schools in the district, Ofsted<br />
has now rated 25 as Outstanding. Eight of these schools were specifically praised and<br />
named in Ofsted's recently published Annual Report. They are: Allerton Primary School,<br />
Burley Oaks Primary School, Burley and Woodhead C of E Primary School, Dixons City<br />
Academy, Feversham College, Grange Technology College. Shibden Head Primary School<br />
and St Joseph’s Catholic Primary School, Bingley.<br />
The others judged as Outstanding by Ofsted since 2005 are: All Saints' CE Primary (Ilkley),<br />
Canterbury Children's Centre and Nursery, Carlton Bolling College, Copthorne Primary,<br />
Eldwick Primary, Killinghall Primary, Lilycroft Nursery, Long Lee Primary, Midland Road<br />
Nursery and Children's Centre, Myrtle Park Primary, Netherlands Avenue School &<br />
Community Nursery, Newby Primary, Oakworth Primary, St Anthony's Catholic Primary,<br />
144
(Clayton), St John's C of E Primary, The Sacred Heart Catholic Primary and Woodlands C of<br />
E Primary School.<br />
Improved attendance<br />
The figures for unauthorised absence across the district have reduced over the years. This<br />
reflects the hard work of parents, schools and the LEA, and means that all those children<br />
whose attendance has improved can expect to see improved results at school. The<br />
Department for Children, Schools and Families (DCSF) reported that the number of half-days<br />
missed without permission by pupils between the beginning of the autumn term in 2007 and<br />
the end of the spring term in 2008 had gone down by nearly four per cent. It should however<br />
be noted that unauthorised absences in district’s primary and secondary schools are still a<br />
great challenge. Data released by the Department for Children, Schools and Families shows<br />
that between autumn 2008 and spring 2009 term, 1.28 per cent of all half days missed in<br />
<strong>Bradford</strong> primary schools were down to unauthorised absence – almost twice as bad as the<br />
national average, 0.65 per cent.<br />
The percentage of primary school pupils classed as persistent absentees is also the worst in<br />
the county, at 3.4 per cent, despite there being 214 fewer persistently-absent pupils<br />
compared with the same period the year before.<br />
By percentage of overall absence, the rate of unauthorised absence in <strong>Bradford</strong>’s secondary<br />
schools is only better than Hull out of all 15 local authorities in Yorkshire and the Humber.<br />
However, persistent absences have fallen by more than 20 per cent in secondary schools,<br />
with 509 fewer students persistently absent than during the same period the year before.<br />
Overall attendance in secondary schools has also risen by 0.4 per cent to 91.45 per cent. 56<br />
Madrassah* Literacy Project<br />
Education <strong>Bradford</strong> has been working in partnership with Quest for Economic Development<br />
(QED-UK), a <strong>Bradford</strong> based charity on the Madrassah Literacy Project to develop better<br />
links between mainstream and supplementary schools. The project has two major aims. The<br />
first is to raise levels of attainment. The second, which is equally important, is to promote<br />
community cohesion. Developing collaborative ways of working will create a better<br />
understanding of the role and importance of Madrassahs to the Muslim community and the<br />
positive benefits they can have on behaviour, attendance at school and ultimately attainment<br />
levels. Mainstream schools will get an opportunity to learn more about how Madrassahs<br />
operate and they, in turn, will get an opportunity to learn different approaches to teaching<br />
from mainstream schools.<br />
(*An after-school learning centre based in a more traditional mosque setting where Muslim<br />
children learn and discuss the practices of their religion.)<br />
New technology to combat bullying<br />
Pupils in some <strong>Bradford</strong> schools are now using a new online risk assessment tool which<br />
efficiently and effectively measures and identifies pupils who may be at risk of being bullied,<br />
56 http://www.thetelegraphandargus.co.uk/news/4693274.Truancy_rates_are_worst_in_Yorkshire/<br />
145
or have issues which have not previously been detected. The new technology “Assesswise<br />
to beat bullying” is an online survey which has been designed through a partnership between<br />
an educational software provider and the charity Beatbullying with support from Education<br />
<strong>Bradford</strong>’s Children and Young People’s Public Health Team. This tool highlights if any pupils<br />
are at risk, thereby allowing intervention from the relevant professionals. This ties in greatly<br />
with school improvement across schools as it allows any problem to be dealt with<br />
immediately giving students a greater chance of achieving their full potential. Pupils can<br />
complete the survey at any time from any location as it is web based.<br />
National Healthy Schools success<br />
<strong>Bradford</strong>'s National Healthy Schools Programme continues to improve. With a total of 76% of<br />
primary, secondary PRU and special schools now having achieved the award the district<br />
retains its green rated Government status. <strong>Bradford</strong>’s Secondary PRU was the first of such<br />
provision to achieve the status and highlighted as models of good practice determining the<br />
framework now being rolled out from Government Office.<br />
Hospital Teaching<br />
The two units which provide education for children whilst they are in hospital have been<br />
praised by Ofsted for providing "outstanding care, support and guidance". Both units, based<br />
at <strong>Bradford</strong> Royal Infirmary and Airedale Hospital, are run by Education <strong>Bradford</strong>, and have<br />
received Good overall judgements from the regulatory body.<br />
Parental Involvement<br />
<strong>Bradford</strong> Council’s Parental Involvement Programme, now in its sixth year, provides a broad<br />
framework of positive parental engagement. There are currently 80 school - based Parental<br />
Involvement Workers providing opportunities for parents to become involved in ways which<br />
will support learning and lead to significant improvements.<br />
This is achieved within a framework of three broad areas; parents’ involvement in the life of<br />
the school; involvement in supporting children at home and developing their own learning<br />
and skills, all of which have a profound impact on the well being of the family. This leads to a<br />
positive impact on a child’s behaviour, attendance and achievement.<br />
Since launching the Investors in Families quality mark in April 2008, six schools have<br />
successfully received the award, and now others are working towards the quality mark.<br />
Investors in Families promotes the importance of family-friendly approaches and enables<br />
schools to demonstrate a whole school commitment to working with families.<br />
6.1.4 Management of Schools<br />
The Learning and Skills Council (LSC) is responsible for post-16 education in the area and<br />
<strong>Bradford</strong> Council is the Local Education Authority (LEA), which is in charge of all primary and<br />
secondary education in the area. Higher education establishments are not the responsibility<br />
of either of these organisations. They are quasi-autonomous bodies.<br />
146
Across <strong>Bradford</strong> District education provision for under 18’s has been contracted out, with<br />
BMDC giving authority to Education <strong>Bradford</strong> (managed by Serco/QAA) to provide<br />
educational support services to all the schools in the district for 10 years. In 2000 <strong>Bradford</strong><br />
failed its OFSTED inspection, and it was not felt that the existing BNDC education<br />
department had the capacity to deliver improvements. The new organisation was therefore<br />
formed in 2001 to take responsibility for managing and providing school improvement<br />
services, special education needs, learning support, personnel, finance, policy and planning,<br />
data and research, admissions, exclusions, welfare transport, music, library and outdoor<br />
educational services. With a contract life value of £360 million, the key priority for Education<br />
<strong>Bradford</strong> is to raise levels of achievement for pupils across the district.<br />
So far perceptions of Education <strong>Bradford</strong> have been positive. The stakeholders questioned<br />
felt that schools had improved and that the organisation had been able to attract high quality<br />
effective management staff that would otherwise not have been accessible to the District.<br />
However, as the organisation is a private entity, it delivers only within the responsibilities of<br />
its contract, and this may have implications for any efforts to provide integrated Early Years<br />
and post-18 education which falls outside of their remit.<br />
The two-tier system<br />
A reorganisation of primary and secondary schools in the <strong>Bradford</strong> district following the failed<br />
OFSTED led to the merger of middle schools into a two-tier system. The changes came into<br />
force in 2000 with the closure of middle schools and secondary establishments beginning to<br />
accept Year 7 and Year 8 pupils. The rational behind these changes relates to the current<br />
testing regime, which sees Key Stage testing at ages 7, 11 and 16, whilst middle schools<br />
would host children aged 9-13, thus overlapping these boundaries. In addition, upper schools<br />
are better equipped than middle schools and therefore as secondary schools can give a<br />
wider range and better standard of facilities to younger pupils.<br />
There are arguments against the merger, including the mixing of Year 7 and 8 pupils with<br />
much older children at senior schools and the difficulties in adapting facilities and teaching<br />
staff to the new roles. The impacts of this restructuring are starting to filter through, but a<br />
period of settlement is required before the full impact will be felt within the city’s educational<br />
institutions. The changes to the system aim to improve the quality of the worst performing<br />
schools, particularly those in inner city locations such as those for whom the City Centre area<br />
falls into the catchment.<br />
Confederations<br />
The secondary schools in the area are organising themselves into Confederations. The<br />
Confederations co-ordinate post 16 (and sometimes post-14) education for each area of 5-6<br />
schools and colleges within <strong>Bradford</strong>, to provide an educational guarantee system for the<br />
district.<br />
The LSC have taken control of funding for post 16 education away from schools and it is now<br />
distributed through the confederations, ensuring that schools, colleges and work-based<br />
learning providers co-operate on provision. The idea is to rationalise post 16 provision to<br />
provide more choice, new courses, specialist provision etc. and to make the provision<br />
147
available more effective. The Confederations will equalise funding between schools and<br />
provide the more economical delivery of a wider range of courses. This approach forces<br />
organisations to take a strategic approach to delivery within the city and may change the<br />
current nature of provision outlined in this report.<br />
6.1.5 School Places<br />
The number of children in primary schools has been growing steadily over the last 5 years<br />
due to an increase in the birth rate and consequent increase in the number of 4 year olds<br />
being admitted into reception year. However, the total number of pupils in secondary schools<br />
has remained relatively stable over the same period, although the smaller number of<br />
students in the upper age range masks the rise in the number of students being admitted to<br />
Year 7.<br />
Based on birth data provided to the Local Authority by the Health Authority the number of<br />
reception places required is forecast to rise further. Secondary pupil numbers are also<br />
forecast to rise by at least 14% by 2018 and by 2015 an additional 3,500 new student places<br />
are needed, made up of increased statutory age pupil places (11-16) and post -16.<br />
However the increase in demand for places is not evenly distributed across the District but<br />
concentrated in specific geographical areas, particularly the inner-city, its immediate<br />
surrounding areas and Wharfe Valley which experience the greatest pressure where<br />
population density has increased significantly.<br />
In addition parental expectations together with their cultural and religious beliefs often steers<br />
parents towards making choices about specific schools. However, school performance and<br />
hence popularity of schools changes over time which makes it increasingly difficult to identify<br />
where changes in demand will occur. There is, therefore, a need to have the surplus allowed<br />
by the DfE (5%) to be able to accommodate parental choice.<br />
Moreover, the number of appeals against allocated school places in <strong>Bradford</strong> is already the<br />
highest in the country. Anticipated increases in the school-age population will have a<br />
negative impact on the schools’ ability to meet parental preferences and further increase the<br />
number of appeals lodged unless additional places are created.<br />
Responding to demand- Over the following 5 year period in order to remedy the shortfall in<br />
places the District needs to have increased permanent capacity by 800 in each year group<br />
from Year 2 to Year 6 to accommodate the children as they progress through the primary<br />
sector, a total of a further 4000 places across the Primary School estate, as a minimum.<br />
To accommodate this anticipated growth the Local Authority has embarked on a programme<br />
of creating additional school places within a number of existing primary schools across the<br />
District. This will be delivered through a gradual increase in the size of a number of schools<br />
over a seven year period as the increased cohorts move through the school. When fully<br />
implemented these increases will result in an overall surplus capacity, based on current<br />
figures, across the primary sector of approximately 5%.<br />
148
The building work to accommodate these increased numbers has been started with the first<br />
phase of a multi phased programme. Capital funding to cover the costs of these expansions<br />
is provided by the DfE. However, the Local Authority has only received notification of the<br />
level of capital funding for 2011/12 with further levels of funding yet to be announced.<br />
In the secondary sector to accommodate the total number of additional pupil places for 11-16<br />
and the additional post 16 provision would require providing the equivalent of two new<br />
schools. The growth areas are unpredictable but over time there is a pattern of pupil<br />
increases concentrated in the inner <strong>Bradford</strong> area, North and West of the inner area in the<br />
Wharfe Valley.<br />
Building Schools for the Future (BSF) Phase 3 had provided a plan for the delivery of the<br />
growing young population in the district. Population growth was not increasing when Phase I<br />
& II schools were planned. Under the BSF Phase 3 plans for 16 forms of entry increase (480<br />
per year group) were to be accommodated across 9 schools. It was proposed that two school<br />
buildings would be completely replaced. The remaining schools were to be remodelled and<br />
refurbished. The schools were:-<br />
Belle Vue Boys: +2 FEs<br />
Belle Vue Girls +2 FEs<br />
Carlton Bolling +2 FEs<br />
Challenge College +1 FE<br />
Ilkley Grammar +1 FE planned rebuild<br />
Laisterdyke BEC +2 FEs<br />
Nab Wood +3 FEs planned rebuild<br />
Queensbury +1 FE<br />
Thornton Grammar +2 FEs<br />
In addition, it was proposed that Bingley Grammar should be substantially rebuilt in order to<br />
address suitability and condition issues. 57<br />
However with the cessation of the BSF programme other sources of capital are now being<br />
actively pursued to address the situation. For admissions in September 2011, a number of<br />
secondary schools have voluntarily agreed to admit above their Published Admission<br />
Number (PAN) to cater for the additional places required.<br />
Two Free Schools have been approved in the District. The Kings Science Academy is for<br />
children aged 7 to 11 and has opened in September 2011 with 140 year 7 pupils. A further<br />
57 The Council completed 3 new secondary schools built on time under BSF Phase 1 at Titus Salt,<br />
Tong High School and Buttershaw BEC, and which were opened on schedule in August 2008. Under<br />
Phase 2 the LA has provided and funded three new primary special schools at Chellow, Delius and<br />
Phoenix, together with a new primary mainstream school, Merlin Top, all opened on time in April 2010.<br />
The LA has also provided four new, fit-for- purpose secondary mainstream schools co-located with<br />
three new secondary special schools and a hearing impaired unit. They were completed in 2011.<br />
149
free school, Rainbow Free School for children aged 4 to 11 has also been approved to preopening<br />
stage for September 2011.<br />
Further free school applications have been submitted to the Department for Education (DfE);<br />
however it has not been possible to anticipate which of these might be successful.<br />
Schools converting from maintained to Academy status have had little if any impact on<br />
admissions for September 2011. However, as these schools become their own admissions<br />
authority with the ability to set their own admission numbers and admissions policies this<br />
could have future implications. As yet this is difficult to anticipate but the LA will maintain<br />
close scrutiny of the situation as it develops.<br />
6.1.7 Further and Higher Education<br />
There are four further education sixth form colleges in <strong>Bradford</strong> district, they are:-<br />
• <strong>Bradford</strong> College- <strong>Bradford</strong> College offers more university level qualifications than<br />
any other college in England with approximately 170 full and part time HE courses to<br />
choose from. Most of the college's degrees are validated by Leeds <strong>Metropolitan</strong><br />
University; previously they were validated by the University of <strong>Bradford</strong> with the final<br />
cohort graduating in December 2007. <strong>Bradford</strong> College plans to apply for university<br />
status and award their own degrees, the application process due to formally start in<br />
May 2008.<br />
• Park Lane College, Keighley- this is the former Keighley College now merged with<br />
the Park Lane College Leeds to form the new Leeds City College.<br />
• Shipley College The college is mainly based in the village of Saltaire but there is a<br />
Bingley Connection building, which is a building based in the centre of Bingley.<br />
There are a wide range of courses offered at Shipley College, but they mainly offer<br />
BTEC's as full time courses. The BTECs on offer include BTEC National Diploma,<br />
First Diploma and Introductory Diplomas and Certificates.<br />
• Bowling Community College Bowling College offers full and part-time courses for<br />
students, from first steps back into education through to GCSEs, NVQs, NOCN<br />
Level 2 Progression Award and Access to Higher Education. Student can study at<br />
the main site in East Bowling or at various community venues in Barkerend,<br />
Undercliffe, Canterbury, West Bowling, Girlington and Woodside.<br />
ADD GIS MAP SHOWING LOCATION OF FE COLLEGES AND UNIVERISTY IN BRADFORD.<br />
The University of <strong>Bradford</strong> is the only establishment offering Higher Education in <strong>Bradford</strong><br />
District.<br />
150
The University has around 140 degree courses at undergraduate level and around 80 at<br />
postgraduate level. These are spread across the 7 Academic Schools of Engineering, Design<br />
and Technology, Health Studies, Informatics, Life Sciences (including Archaeological,<br />
Geographical and Environmental Sciences), Management, Social and International Studies,<br />
and the School of Lifelong Education and Development, which also offers part-time courses.<br />
The University also has an excellent graduate employment record, and was rated 2nd out of<br />
99 UK Universities for employment in The Times Good University Guide 2006 and ranked<br />
number 1 for employment in the North of England.<br />
However, according to the Complete University Guide 2010 58 (based on data from the<br />
2007/08 academic year), <strong>Bradford</strong>’s graduate prospects score has fell from 73.9, the best in<br />
Yorkshire last year, to 70.4 – a trend only replicated in the region at York University and the<br />
University has slipped eight places to 57th in a national higher education league table.<br />
Students graduating with good degrees however rose by the third highest margin in<br />
Yorkshire and Humber and it keeps its place as fifth best out of the nine universities in the<br />
region, ahead of Sheffield Hallam but below Hull.<br />
Despite its lower research score, the guide recognised that <strong>Bradford</strong> has several areas of<br />
world-class research including in peace studies, polymers, mechanical engineering, medical<br />
biosciences and archaeological science.<br />
The guide reports that the university has more than 1,500 computer workstations across the<br />
campus, 500 more than last year, while the main library contains more than 600,000 books,<br />
up 20 per cent in 12 months.<br />
The University received four applications per place during the past academic year, down<br />
from seven last year. Its male/female student ratio is 49:51, state/private school ratio 96:4<br />
and home/international ratio 84:16.<br />
Information on current admission levels, demand for college places and adult learning<br />
requirements and demand is not available at present. This data will be requested from the<br />
appropriate key partners and used to update and inform this report.<br />
6.2 Health<br />
Health care remains the responsibility of central government through the Department of<br />
Health (DoH). A number of organisations including <strong>Bradford</strong> and Airedale Primary Care Trust<br />
(PCT), <strong>Bradford</strong> Teaching Hospitals NHS Foundation Trust and Airedale NHS Trust<br />
implement the local provision of health care within <strong>Bradford</strong>. They direct financial resources<br />
to primary and secondary care providers and regulate the primary care activities of General<br />
Practitioners (GPs), Dentists, Optometrists and Pharmacists.<br />
Their primary objectives are to:<br />
58 The complete University Guide (2009) University League Table 2010 [online].<br />
<br />
151
6.2.1 Primary Care<br />
• Provide excellent primary and acute health care<br />
• To ensure patients receive a seamless “care pathway” through Primary<br />
Services to acute where relevant.<br />
• To reduce inequalities in health outcomes.<br />
<strong>Bradford</strong> and Airedale Teaching Primary Care Trust is reponsible to provide primary health<br />
care and community services or to commission them from other providers. The tPCT merged<br />
from four separate PCTs (Airedale, North <strong>Bradford</strong>, South and West, and City) in 2007.<br />
<strong>Bradford</strong> and Airedale tPCT is also a ‘Teaching Primary Care Trust’, which has specific<br />
hospitals where medical students can learn in a practical setting.<br />
The tPCT is managed by a Board of directors made up of eight directors and headed by a<br />
Chief Executive. The Chairman of the Trust is a non-executive director. The finances of the<br />
tPCT, like most PCTs and tPCTs, are largely determined by directives set by the Strategic<br />
Health Authority or the Department of Health.<br />
One of the challenges faced by Primary Health Care in the district is to replace or refurbish<br />
Health Care Premises that are no longer fit for purpose. The Department of Health policy<br />
paper, ‘Our Health, Our Care, Our Say’, promotes Primary Care Trusts to develop care<br />
facilities in local communities, in liaison with Social Services Departments. In the <strong>Bradford</strong><br />
District, a new provision is being achieved through:<br />
• Remodelling of existing G.P Surgeries<br />
• Re-siting of GP Surgeries into multi-purpose Community Health Centres<br />
• Re-siting of Health Care Services into Multi-Agency shared facilities<br />
<strong>Bradford</strong> and Airedale tPCT has achieved a very positive progress over the recent years<br />
against a number of key performance indicators, while many of their objectives still require<br />
consistent action over a number of years before the achievement can be confirmed. In<br />
particular, attention is drawn to the following positive performance areas:<br />
• addressing health inequalities –<br />
- successfully achieved the demanding target of supporting over 4,000<br />
people to quit smoking at four weeks. Not only has performance in terms of<br />
the number of successful quitters been exceptional but the quit rate has<br />
increased to over 50%compared to our 2006/07 figures<br />
- NHS dentistry in <strong>Bradford</strong> and Airedale received a £2.1m boost in 2007-<br />
2008, making way for over 26,000 additional patients to be treated locally.<br />
An extra £1.5m will be spent annually to establish and maintain three new<br />
NHS dental surgeries in Keighley, <strong>Bradford</strong> and Ilkley. The surgeries will<br />
provide on-going preventative NHS dental care up 15,000 patients living in<br />
the district.<br />
152
Currently there are 62 dental practices in the district providing some level<br />
of NHS dentistry. A further four provide only orthodontic care. Four<br />
practices operating in Ilkley and the Wharfe Valley have limited lists,<br />
meaning they will only see children and patients exempt from paying NHS<br />
charges.<br />
An additional £1.9 million is being invested in NHS dentistry in 2008-2009.<br />
• securing high quality healthcare –<br />
- the <strong>Bradford</strong> and Airedale health economy achieved the 18 week referral to<br />
treatment national milestone for March 2008. Performance in terms of<br />
admitted patients seen within 18 weeks was 86.4% and for non-admitted<br />
patients was 91.1%- above the milestone targets of 85%and 90%<br />
respectively.<br />
- up to 60 percent of patients were able to book direct into a first outpatient<br />
appointment of their choice, when referred by their GP, using the new<br />
Choose and Book system. From April 2008, ‘free choice’ will be introduced<br />
where the majority of patients can choose to go to any hospital or treatment<br />
centre across the country.<br />
- <strong>Bradford</strong> and Airedale tPCT is one of the first PCTs in the country to pilot a<br />
new weather forecasting system with help from the Met Office to alert<br />
people suffering from chronic obstructive pulmonary disease (COPD) with<br />
conditions such as emphysema or bronchitis about any spells of cold<br />
weather. <strong>Bradford</strong> has around 9,000 people with COPD, and some of the<br />
highest rates of people admitted to hospital with COPD in the country.<br />
Around 5,000 COPD patients across the district received a phone call last<br />
winter to let them know in advance about such changes in weather and<br />
helped them stay well and avoid being admitted to hospital.<br />
• system reform –<br />
- significant progress has been made by the four alliances concerning<br />
practice-based commissioning, demonstrated by the delivery of<br />
commissioning plans which reflect their health priorities. Additionally, they<br />
have commissioned an enhanced range of services from the voluntary and<br />
community sector to address health inequality priorities, including obesity,<br />
smoking, mental health, isolation and loneliness, and sexual health.<br />
- The tPCT is an ‘early adopter’ of the NHS Care Records Service which will<br />
allow authorised doctors and nurses to share patient information<br />
electronically - so helping patients to get quicker, better, safer care. The<br />
Ridge Medical Practice, <strong>Bradford</strong>, and three Keighley practices - Farfield,<br />
Ling House Medical Centre and Holycroft Surgery are the first to join the<br />
scheme, with more coming on board in the next financial year.<br />
153
• provider development –<br />
- good progress has been demonstrated in learning disability, mental health<br />
and end of life care services. One-sixth of the population in England<br />
suffers from a mental health problem every day, costing the nation £77<br />
billion a year 59 . With this in mind, an Early Intervention in Psychosis (EIP)<br />
team has been set up to provide immediate and intensive treatment for<br />
people with early signs of psychosis. Earlier this year, reviews of both<br />
adult and older people’s mental health services were undertaken in<br />
partnership with <strong>Bradford</strong> Council. Both reviews aim to transform services<br />
to meet the needs of the diverse populations, ensuring they are equitable,<br />
fair and culturally sensitive. Findings from the reviews will be used to<br />
develop commissioning plans for both services.<br />
- Both Manorlands Hospice, at Oxenhope, Keighley, and Marie Curie<br />
Hospice, <strong>Bradford</strong>, provide day therapy and outpatient services as well as<br />
inpatient services to people with life-limiting illnesses. The focus of all of<br />
these services is to enhance patients’ quality of life. Both hospices use art<br />
as a therapeutic tool to help palliative care patients.<br />
• capacity and capability –<br />
- continued to implement the organisation development strategy as part of<br />
the fit for purpose development plan. Furthermore, work on the current<br />
infrastructural development projects are also progressing well to provide<br />
improved and wider access to health services across the district. some of<br />
the ongoing developments are:<br />
Despite this progress there are a number of areas where the <strong>Bradford</strong> and Airedale tPCT<br />
faces challenges and need to improve their performance. In particular, improvements are<br />
essential in the following areas where performance was below target in 2007/08:<br />
• addressing health inequalities - percentage of 15-24 year olds screened for<br />
chlamydia need to be increased by implementing additional incentive schemes<br />
• securing high quality care – while there was a 20%reduction in reported MRSA<br />
cases in 2007/08 compared to 2006/07, this still represents underperformance<br />
against the national target.<br />
• system reform – there has been success by increased uptake of first consultant<br />
outpatient appointments through Choose and Book, achieving 61% in April 2008<br />
compared to national performance of 51%. However this still remains below the<br />
national target and as a result the tPCT have retained the existing incentive<br />
scheme for an additional six months<br />
59 Breaking Down Barriers, Department of Health report, Louise Appleby, 11 May 2007.<br />
154
• provider development – performance by Yorkshire Ambulance Services NHS<br />
Trust was below national targets for both category A and B response times.<br />
Details on this performance by ambulance services could be found later in the<br />
chapter.<br />
6.2.2 Secondary Care<br />
District wide, there are three main hospitals; St Lukes, <strong>Bradford</strong> Royal Infirmary are<br />
controlled by the <strong>Bradford</strong> Teaching Hospitals NHS Foundation Trust, and Airedale General<br />
Hospital is operated by the Airedale NHS Trust. £70 million 60 of funding has been announced<br />
in 2006 by the Trust for the modernisation and rationalisation of the 2 city hospitals which<br />
involves land disposal, new buildings and refurbishment. Airedale General Hospital at<br />
Steeton, is already undergoing significant expansion and refurbishment.<br />
<strong>Bradford</strong> Teaching Hospitals NHS Foundation Trust is responsible for providing acute<br />
hospital care services for the people of <strong>Bradford</strong> and neighbouring communities. It has<br />
around 1,200 beds serving a community of over a million people, has an annual budget of<br />
£230 million and employs over 5,000 staff. Continuous professional development for all<br />
staffing groups is encouraged and supported within the foundation trust, which has Investors<br />
in People accreditation.<br />
The organisation is managed and led by the Board of Directors, which comprises of a<br />
chairman, six non-executive directors, four executive directors and a chief executive. The<br />
Board is responsible for approving policy, ensuring financial viability of the organisation and<br />
monitoring performance.<br />
Clinical services are provided from twelve clinical directorates each being led by a clinical<br />
director and supported by a general manager.<br />
Foundation trusts are new flagship hospitals in England and awarded to high performing<br />
organisations. They were approved to be a foundation trust on April 1 2004 - one of the first<br />
in the country, due to excellent performance, which has continued with the foundation trust<br />
being rated as 'good' for use of resources and 'good' for quality of services, in the<br />
Healthcare Commission's Annual Health Check.<br />
In April 2007 The Foundation Trust were recognised as the third safest hospital in England<br />
and the safest outside London with the rates of MRSA Bacteraemia reducing by 40% over<br />
the last three years.<br />
Based on the latest rate for patients who died in hospital between July 2007 and June 2008,<br />
hospitals in <strong>Bradford</strong> and Airedale are among the safest in the country. Airedale General<br />
Hospital is the safest hospital in the region and in the top five nationally, while <strong>Bradford</strong>’s<br />
hospital appeared as the tenth safest in the country.<br />
60 T&A 27/11/06<br />
155
The Foundation Trust also has an excellent record of meeting the national targets such as<br />
treatment within 18 weeks from referral, being seen within 4 hours in A&E and treating<br />
cancer patients quickly.<br />
Some of the operational and infrastructural improvements achieved by The Foundation Trust<br />
over the recent years are highlighted below-<br />
• Two new wards were created in a new £10m block at BRI creating extra capacity to<br />
meet the increased demand on hospital services, especially during winter.<br />
• A new £3m Sovereign Lecture Theatre has been opened which acts as a focal point<br />
for staff skill development and facilitates healthcare innovation.<br />
• A new pain management centre has been opened at St Luke’s Hospital which<br />
includes a dedicated pain relief clinic and other supporting facilities.<br />
• A new macular centre has also been opened at St Luke’s Hospital in shared<br />
facilities with the pain management service.<br />
Despite all these achievements, there are a number of challenges remain for the Foundation<br />
Trust to tackle. As home to one of the NHS’s biggest, and busiest, maternity units, the trust<br />
need to reduce the prevalence of smoking during pregnancy, as well as increase the<br />
breastfeeding rate among new mums.<br />
Moreover, there are recognised areas of high deprivation within the geographical locations<br />
covered by the Foundation Trust and this is likely to generate increased pressure on health<br />
services as the full impact of the recession plays out and unemployment rises.<br />
Apart from the above two trusts, there is the <strong>Bradford</strong> District Care Trust who provides<br />
mental health and learning disability services to the diverse communities of <strong>Bradford</strong>,<br />
Airedale and Craven. Established in 2002, <strong>Bradford</strong> District Care Trust services are provided<br />
across six care groups:<br />
• Adult Mental Health<br />
• Older People’s Mental Health<br />
• Child and Adolescent Mental Health (CAMHS)<br />
• Learning Disabilities<br />
• Substance Misuse & Alcohol and Forensic.<br />
Details of their services and care groups across the district could be found on the<br />
website: http://www.bdct.nhs.uk/index.php<br />
6.2.3 Hospitals<br />
As mentioned before, there are two A&E Hospital departments in <strong>Bradford</strong> District:-<br />
• <strong>Bradford</strong> Royal Infirmary, <strong>Bradford</strong><br />
• Airedale Hospital, Steeton (ADD MAP)<br />
A list of all <strong>Bradford</strong> & Airedale hospitals is given below:<br />
156
• Airedale General Hospital<br />
• Bingley Hospital<br />
• <strong>Bradford</strong> Maternity Hospital<br />
• <strong>Bradford</strong> Royal Infirmary<br />
• Coronation Hospital, Ilkley<br />
• Eccleshill Community Hospital<br />
• Eccleshill NHS Treatment Centre<br />
• Leeds Road Community Hospital<br />
• Lynfield Mount Shipley Hospital<br />
• Skipton General Hospital<br />
• St Luke's Hospital<br />
• Westwood Park Diagnostic and Treatment Centre<br />
• Westwood Park Community Hospital<br />
• Yorkshire Eye Clinic<br />
<strong>Bradford</strong> Royal Infirmary and St. Luke’s Hospital<br />
The current BRI was built in the 1930s at Ducworth Lane. It replaced a Victorian edifice in the<br />
city centre. Today it is part of the <strong>Bradford</strong> Teaching Hospitals NHS Trust. The infirmary is<br />
affiliated with Leeds School of Medicine. As well as the BRI the trust also incorporates St.<br />
Luke's Hospital in Little Horton.<br />
<strong>Bradford</strong> Royal Infirmary has an Accident and Emergency department and the majority of<br />
inpatient services are based there. St Luke’s Hospital provides about a third of our services<br />
and is centred mainly around the recently built Horton Wing, delivering outpatient and<br />
rehabilitation services.<br />
• The foundation employ almost 5000 staff in the two hospitals and serve a population<br />
of around 500000.<br />
• A total of 77% of staff are female, and 23% are male. At December 2008, the<br />
gender breakdown of senior staff (those on band 8 and above, and all medical staff)<br />
was 50% female and 50% male.<br />
• <strong>Bradford</strong> Royal Infirmary has 971 beds and is also home to one of the busiest A&E<br />
departments in the country, with more than 100,000 attendances each year.<br />
• BRI’s maternity unit is also one of the NHS’s busiest, delivering more than 5,000<br />
babies every year.<br />
157
• St Luke’s Hospital has 119 beds and houses the renal dialysis unit.<br />
• Saint Luke's Sound is the hospital radio station serving the patients and staff.<br />
Airedale General Hospital<br />
Airedale Hospital was opened in 1970 by Prince Charles and is an award winning hospital<br />
providing acute, elective and specialist care. The Trust headquarters are at Airedale NHS<br />
Trust, Airedale General Hospital, Skipton Road, Steeton, Keighley, BD20 6TD.<br />
Airedale Trust provides high quality, personalised healthcare for a population of over 200,000<br />
people from a widespread area covering 500 square miles within Yorkshire and Lancashire -<br />
stretching as far as the Yorkshire Dales and the National Park in North Yorkshire, reaching<br />
areas of North <strong>Bradford</strong> and Guiseley in West Yorkshire and extending into Colne and<br />
Pendle in the East of Lancashire.<br />
• Airedale Hospital employ 2100 staff and have 350 committed volunteers<br />
• In a year Airedale Hospital treat 25,000 inpatients, 22,000 day cases and 104,000 out<br />
patient appointments.<br />
• Airedale Hospital Accident and Emergency Department sees and treats over 47,000<br />
patients every year<br />
• Around 2300 babies are born each year at the hospital<br />
There are currently a number of other small hospitals and treatment centres across the<br />
District, which may be replaced by other facilities in time.<br />
6.2.4 Health Centres/GP surgeries<br />
Primary care practitioners such as GPs are not directly employed by the PCT - they run as<br />
independent 'contractors' under the umbrella of the PCT.<br />
There are 89 GP practices (August 2007) in the <strong>Bradford</strong> and Airedale Primary Care Trust<br />
district 61 . Over 70% of GP practices in <strong>Bradford</strong> and Airedale open their doors earlier in the<br />
morning or later at night to offer more flexible appointment times.<br />
A comprehensive list of all GPs, dentists, pharmacists and opticians operating in <strong>Bradford</strong><br />
are included on the website:<br />
http://www.bradford.nhs.uk/wp-content/uploads/2010/07/HealthMatters2010.pdf<br />
ADD MAP SHOWING LOCATION OF GP, DENTISTS, PHARMACIES AND OPTICIANS<br />
61 http://www.bradford.nhs.uk/Pages/GPPractices.aspx<br />
158
6.3 Children’s Services<br />
The Councils - <strong>Bradford</strong> Early Years, Childcare and Play (BEYCP) promotes, develops, and<br />
supports the highest quality childcare, early education and play provision, offering equality of<br />
opportunity and access for all.<br />
Play, early education and childcare are essential elements of achieving the very best<br />
outcomes for children and young people as part of Every Child Matters.<br />
BEYCP are responsible for delivering the government’s 10 Year Childcare <strong>Strategy</strong> and its<br />
vision for a Sure Start for all children, as well as meeting duties under the Childcare Act,<br />
which came into force in 2008. Priorities include ensuring that sufficient childcare is available<br />
to meet demand and that free, part time nursery places are available for all 3 and 4 year<br />
olds.<br />
BEYCPs aim is to provide greater choice for parents so that they can balance work<br />
commitments and family life, and ensure that flexible childcare is available for all families with<br />
children. A major focus of the strategy is reducing social disadvantage by enabling parents to<br />
access training and work.<br />
Establishing Children’s Centres, offering integrated services for children aged 0-5 and their<br />
families, is a central feature of the national strategy. So far, the Council has established 33<br />
children’s centres in <strong>Bradford</strong>, bringing together early education, childcare, health and family<br />
support for the 0-5’s.<br />
Children’s Centres<br />
Sure Start is a Government initiative which aims to give every child the best possible start in<br />
life. Children’s Centres are places where children under five and their families can access<br />
services and information from a range of professionals. An example of some of the services<br />
offered include:<br />
• Chatterbox – helps children to develop early language and communication skills;<br />
• Baby massage – teaches parents techniques, which relax their baby and helps with<br />
their sleep;<br />
• Play and Stay – offers activities for children to learn through play;<br />
• Information – available on employment opportunities, childcare and training;<br />
• Incredible years – for parents to develop skills to deal with everyday behaviour; and<br />
• Family Support – offering individual support for families in their home or in the centre.<br />
The SureStart Children’s Centres in <strong>Bradford</strong> have been developed in accordance with<br />
Government guidance, building on existing developments including Local SureStart<br />
Programmes, Neighbourhood Nurseries and the Early Excellence Centre and then later<br />
Nursery and Primary School sites. This has created a very mixed economy.<br />
159
The 8 ex Local SureStart programmes in the District have completed their transition to<br />
Children’s Centre focus and now support 14 of the 33 Phase 1 and 2 Children’s Centres in<br />
<strong>Bradford</strong>.<br />
Four of the District’s five Family Centres operate as co-located Children’s Centre sites whilst<br />
investment in the fifth will support partnership working with all Children’s Centres within its<br />
locality.<br />
All seven of the Districts Nursery Schools are leading on delivery of the Children’s Centre<br />
offer on their sites. Fourteen Primary Schools operate as co-located sites for Children’s<br />
Centres. All Children’s Centres are linked with the Extended Schools clusters.<br />
Six of the Councils Children’s Centres are ‘Children’s Centre Plus’ sites, a model unique to<br />
<strong>Bradford</strong>. These are specifically designed and resourced to provide enhanced facilities for<br />
children with complex health needs. These Children’s Centre Plus sites are located at:<br />
• Canterbury Nursery School and Centre for Children and Families<br />
• Strong Close Nursery School and Children’s Centre<br />
• St Edmund’s Nursery School and Children’s Centre<br />
• Woodroyd Children’s Centre<br />
• Barkerend Children’s Centre<br />
• Hirstwood Nursery School<br />
City of <strong>Bradford</strong> <strong>Metropolitan</strong> District Council has one of the largest Children’s Centre<br />
programmes in the country having already established 33 Children’s Centres in the 30%<br />
most disadvantaged areas of the District through Phases 1 and 2 and by commissioning the<br />
development of 7 new Phase 3 Children’s Centres to cover the remaining 70% areas of the<br />
District between 2008 and 2010. Each Centre is expected to ‘reach’ between 800 to 1200<br />
children aged 0-5 years with an overall reach totalling 37,015 children by 2011.<br />
160
Phase 1 and 2 Children’s Centres in the <strong>Bradford</strong> district.<br />
161
162
<strong>Bradford</strong> has been allocated capital totalling £3.8 million to support the development of up to<br />
11 new Phase 3 Centres and maintenance of all Centres between 2008-2011. Revenue<br />
totalling £48.5 million will provide direct funding and funding for centrally managed services<br />
contributing to the core offer in Phases 1, 2 and 3 between 2008-2011.<br />
Children’s Centres and their locations are detailed below (ADD MAP), with many of the<br />
centres sharing space within existing facilities such as schools. The sharing of space within<br />
existing facilities ensures the centres are located in accessible and convenient locations for<br />
local residents to access.<br />
163
See link below for map of Children Centres in <strong>Bradford</strong> District:-<br />
http://www.bradford.gov.uk/NR/rdonlyres/E849B60B-BBEC-4EE4-895B-<br />
19DDD98D6492/0/ChildrensCentresMap.pdf<br />
See Draft <strong>Bradford</strong> District Children’s Centres <strong>Strategy</strong> (Feb, 2008) by clicking link below:-<br />
http://www.bradford.gov.uk/NR/rdonlyres/66AF3C80-167B-4B88-BCE7-<br />
F3BC53351A63/0/DraftChildrensCentres<strong>Strategy</strong>DocFeb08.pdf<br />
6.4 Neighbourhood Management and Community <strong>Strategy</strong><br />
Neighbourhood Management is one of the 'big ideas' in the Government's campaigns to<br />
tackle social exclusion and it forms a key part of the National <strong>Strategy</strong> for Neighbourhood<br />
Renewal. The Neighbourhood Management initiative aims to tackle quality of life (‘liveability’)<br />
issues in the community through better management of the local environment, particularly<br />
through:<br />
• Increasing community safety;<br />
• Improving housing stock;<br />
• Working with young people; and<br />
• Encouraging employment opportunities.<br />
Within <strong>Bradford</strong> District 80 ‘natural neighbourhoods’ have been defined by local communities<br />
and often determined by physical features such as roads, opens spaces and parks.<br />
Seventeen of the 80 take the same boundaries as local Town / Parish / Community Councils.<br />
The recognition of these neighbourhoods has stemmed from the district’s long-standing<br />
arrangements for area and locality based engagement and planning (e.g. through Area<br />
Committees, Area Coordination, and Neighbourhood Forums). The new delivery<br />
arrangements mean that structures and resources can be developed to better connect<br />
residents, service providers and elected Members, to work together to identify and implement<br />
plans for their areas.<br />
164
The diagram above shows how locality plans sit below the delivery plans within the district.<br />
The locality plans retain links to the Big Plan themes whilst neighbourhood partnerships, area<br />
committees and residents have an opportunity to influence priorities, as translated into the<br />
action plans for their locality.<br />
Index of Neighbourhoods:<br />
Area Committee Action Plans are based on wide consultation and neighbourhood plans as<br />
well as available data. Neighbourhood Forums and other public involvement and consultation<br />
events are held regularly in every neighbourhood throughout the Area in order to give local<br />
residents the chance to have their say on local issues. Neighbourhood Forums are organised<br />
and run by the five Area Co-ordinators and their teams one for each of the parliamentary<br />
constituencies.<br />
• <strong>Bradford</strong> North: Bolton & Undercliffe, Bowling & Barkerend,, <strong>Bradford</strong> Moor,<br />
Eccleshill, Idle & Thackley, Manningham<br />
• <strong>Bradford</strong> South: Great Horton, Tong, Queensbury, Royds, Wibsey, Wyke<br />
• <strong>Bradford</strong> West: Thorton & Allerton, City Ward, Clayton & Fairweather Green, Toller,<br />
Heaton, Little Horton<br />
165
• Keighley: Craven, Worth Valley, Ilkley, Keighley Central, Keighley East, Keighley<br />
West<br />
• Shipley: Baildon, Bingley, Bingley Rural, Shipley, Wharfedale, Windhill, Wrose<br />
The ‘Area Committee Action Plans’ set out a range of social, economic and environmental<br />
priorities for the area and thereby help decision making of the area committee in relation to<br />
funding allocation and encourage contributions, both practical and financial, from partners.<br />
The action plans are usually divided into themes, same as those within the ‘Big Plan’<br />
(District’s Sustainable Community <strong>Strategy</strong>), and the priorities are informed by consultations<br />
carried out through a range of activities including neighbourhood forums, neighbourhood<br />
action planning process, community consultations, urban village action planning etc. The<br />
Area Committee Action Plans also provide a framework against which progress can be<br />
measured in every two years and be reported to the area committee, partners and the public<br />
before setting/renewing targets for the next action plans.<br />
Map: <strong>Bradford</strong> Ward Map<br />
166
To know more about the Neighbourhood Services and the Area Committee Action Plans<br />
please visit the following webpage:<br />
http://www.bradford.gov.uk/bmdc/neighbourhoods/your_neighbourhood.htm<br />
In order to ensure effective community engagement a comprehensive community strategy is<br />
also needed at neighbourhood and district or city-wide level. <strong>Bradford</strong> District’s current<br />
‘Sustainable Community <strong>Strategy</strong>’ is known as The Big Plan and it has replaced the<br />
previous community strategy that existed in the form of 20:20 Vision, prepared by <strong>Bradford</strong><br />
Vision (the name of <strong>Bradford</strong>’s Local Strategic Partnership). The purpose of the Sustainable<br />
Community <strong>Strategy</strong> (SCS) is to aim to enhance the quality of life of local communities and<br />
contribute to the achievement of sustainable development through action that will improve<br />
the economic, social and environmental well-being of the area and its inhabitants.<br />
Evidences were gathered and critical issues identified around ten themes which later helped<br />
identify linkages and cross-cutting issues, as well as specific long-term ambitions and<br />
medium-term priorities in order to inform LAA outcomes and targets, and the specific<br />
strategic and operational plans of key partnerships and partners, such as the Council’s<br />
corporate plan.<br />
The Big Plan themes:<br />
1. Children and Young People<br />
2. Safer Communities<br />
3. Stronger Communities<br />
4. Healthier Communities<br />
5. Older People<br />
6. Economic Development and Enterprise<br />
7. Environment<br />
8. Housing<br />
9. Culture<br />
10. Transport<br />
The analysis of evidence, consultation and subsequent impact assessment of the<br />
Sustainable Community <strong>Strategy</strong> (SCS) has identified that the overarching challenge the<br />
district faces is to bring about long-term, sustainable prosperity which is shared across<br />
communities, including businesses and residents. At the heart of The Big Plan are three<br />
major tasks which are fundamental to transforming the district. These “transformational<br />
priorities” are:<br />
• Regenerating the city and our major towns to create the opportunities and impetus for<br />
sustained economic growth;<br />
• Improving education outcomes to prepare people for an active and prosperous life;<br />
and<br />
• Improving skills at all levels to meet the needs of business and build a knowledge<br />
economy.<br />
167
This community strategy and its priorities will provide a framework to guide the way the<br />
council and its partners plan and work together over the next three years and beyond. It will<br />
also inform the negotiation, consultation and implementation of the important plans, policies<br />
and agreements to be made by the authority.<br />
6.5 Community Services<br />
6.5.1 Market and shopping facilities<br />
Vibrant town and local shopping facilities, which successfully compete and provide local<br />
choice, make a valuable contribution to the local community, which they serve. There are a<br />
wide range of shopping and marketing facilities provided in the city, town, district and local<br />
centres of <strong>Bradford</strong>.<br />
Traditional Markets<br />
The following are the major traditional market and shopping facilities currently being<br />
managed by <strong>Bradford</strong> Council.<br />
Indoor<br />
Kirkgate Market, <strong>Bradford</strong>: Located in the Kirkgate Centre, this shopping hall sells a wide<br />
range of commodity from fancy goods to footwear and designer jeans to duvets all usually at<br />
lower prices than high street retailers.<br />
Oastler Shopping Centre: This venue is located off Westgate in the City's Northern Quarter.<br />
A newly created food hall offers quality fish, meat and fresh fruit and vegetables from all over<br />
the world. The centre has lift access from the adjacent car park, shop mobility facilities and<br />
nine cafes and food outlets.<br />
Keighley Market: Located in the centre of Keighley, the Market has long tradition of being a<br />
colourful and lively shopping destination with quality food retailers to the latest in fashion,<br />
jewellery, materials, homeware and more. It's easily accessible by public transport or via car.<br />
Wholesale<br />
St James Market: St. James Wholesale Market is located on a six-acre site off the A650<br />
Wakefield Road, <strong>Bradford</strong>. It is easily accessible from the city centre and only minutes away<br />
from the motorway links to the M62, M1, etc.<br />
Ample parking is provided for buyers in the main hall where the bulk of the selling takes<br />
place. A wide range of fresh fruit and vegetables, exotic produce and flowers are available. In<br />
response to demand, the product range has been extended in recent years to include prepacked<br />
supplies to cater for restaurant owners.<br />
168
Outdoor<br />
Shipley Market: Shipley Open Market provides a focal point to the town centre; the open<br />
market operates on a Monday selling a great selection of second-hand items and bric-a-brac.<br />
On a Friday and Saturday, a wide selection of miscellaneous goods and fresh food products<br />
are available on over 40 stalls.<br />
Bingley Market: Bingley Open Market now trades on the newly refurbished Town Square<br />
with 36 stalls featuring Fresh Bread, Fish, Meat and Game, Fresh Fruit & Vegetables,<br />
Flowers & Plants, Shoes and much more.<br />
These markets and the centres they are located in offer particular advantages namely:<br />
• the wide range of services and facilities that they offer, which encourages<br />
competition from which all consumers are able to benefit;<br />
• their high accessibility by public transport, which benefits public transport users,<br />
particularly those without access to a car, and provide for the most sustainable<br />
pattern of development in the future;<br />
• their attractive built environment and urban heritage.<br />
The centres do however exhibit inherent planning problems compared with out of centre<br />
locations namely:<br />
• sites for development are not always easy to obtain, assemble and develop;<br />
roads within the centres are more congested;<br />
• access to and use of car parking facilities is not always as convenient. There is a<br />
need to cater for those who wish to use cars since failure to do so will inevitably<br />
result in continuing pressure for out of centre development;<br />
• there is a legacy of buildings which are not easily adapted for current activities.<br />
These are often small, having upper floors, and no parking or loading facilities.<br />
Areas of neglect and dereliction are created where these buildings are underused<br />
or vacant.<br />
Shopping Malls<br />
In the wake of recent financial downturn there have been significant losses to the shopping<br />
range throughout the district. The city centre particularly has suffered as a result of the delay<br />
in the completion of the proposed Broadway development. Over the coming years this is<br />
expected to be resolved by the development of a brand new shopping centre which together<br />
with additional investment in the rest of the district will allow <strong>Bradford</strong> to compete with other<br />
centres in the region, by clawing back shoppers who currently go elsewhere.<br />
169
Westfield/ Broadway Shopping Centre: Westfield <strong>Bradford</strong> is a £275 million development<br />
project that will create a modern shopping experience to meet the needs of the thriving<br />
catchment. The retail component will be a mix of national and local fashion, food and lifestyle<br />
brands – a spectacular retail environment to address the current under provision in the city.<br />
Key Facts:<br />
• 51,466 sq m retail floorspace<br />
• 75 stores<br />
• 1,345 parking spaces<br />
A revised planning permission for the development was approved in October 2011 and the<br />
groundworks stage of the retail mall has been completed. The developer has already<br />
invested about £80m in the scheme and currently working on signing in the necessary<br />
number of pre-lets before proceeding with the final stages of the construction. Detail plan for<br />
the next phase of the development which includes offices and apartments is expected to be<br />
finalised within seven years.<br />
The Broadway development is expected to serve a catchment of more than 735,000 people,<br />
including large proportions of middle-income customers. It is also estimated that about 4,000<br />
jobs will be created between the construction phase and the completed centre.<br />
Airedale Shopping Centre, Keighley: The Airedale Shopping Centre is a 250,000 sq ft<br />
town centre development with an adjoining 460-space multi-storey car park.<br />
The single level Centre is readily accessible for all visitors and public transport links are<br />
particularly well catered for since the February 2002 opening of the award winning bus<br />
station which stands alongside the shopping malls.<br />
The Centre has a mall café, public telephones, public conveniences (including facilities for<br />
the disabled) and a parent & baby room<br />
5Rise Bingley: With 59,500 square feet of retail space and 18 individual shop units, 5Rise is<br />
a modern shopping centre development that has revitalised the town of Bingley. A major £5<br />
million regeneration project, the 5Rise scheme is built on the ground of former Myrtle<br />
Shopping Centre and once again has become the main shopping destination of Bingley's<br />
residents.<br />
The anchor tenant is a brand new 12,000 sq ft Co-operative food store and will be shortly<br />
joined by Home Bargains, Santander and Browns Café Bar as well as existing retailers such<br />
as Boots, Natwest, Greggs, Superdrug, Timpsons, Klick, and Betfred.<br />
The District's shopping centres are already protected for retail use from other development<br />
by polices in the rUDP and in the government's Planning Policy Statement 4. However there<br />
is a growing trend for existing food superstores and supermarkets in suburban locations to<br />
sell a wider range of comparison goods. This action competes with the roles of city and town<br />
centres to be the main destinations for comparison shopping. There is also growing<br />
170
pressure from superstore / supermarket operators to build new and larger stores across the<br />
District which can also pose a threat to established centres.<br />
Food stores<br />
According to the <strong>Bradford</strong> District Retail and Leisure <strong>Study</strong> (WYG, 2008) supermarkets within<br />
the district cater for almost two-third (72%) of the main food shopping done by the district’s<br />
residents. The district is well represented by a number of supermarkets ranging from the<br />
branches of all main national multiples to locally developed chain food stores.<br />
Tesco has traditionally dominated the grocery sector in the UK and so has in <strong>Bradford</strong> with<br />
by far the largest market share (49%) of all main food shopping trips. Asda, Morrisons and<br />
Sainsbury are also well represented throughout the district operating mainly from the town<br />
and district centres. Branches of Netto, Lidl and Aldi are also concentrated in and around the<br />
main urban areas of the district. On the other hand Co-op convenience stores have a much<br />
wider reach than any other supermarkets with their branches located in many rural areas of<br />
the district including local and village centres.<br />
Locations of all major supermarkets within <strong>Bradford</strong><br />
The table below provides a list of supermarkets located within the city, town and district<br />
centres of the district.<br />
171
Table: Supermarkets in City, Town and District Centres<br />
<strong>Bradford</strong> City Centre<br />
• Morrisons, Westgate<br />
• Marks and Spencer, Darley Street<br />
Bingley Town Centre<br />
• Co-op, 5Rise, Bingley<br />
Ilkley Town Centre<br />
• Tesco, Springs Lane, Ilkley<br />
• Booths, Ilkley<br />
• Co-op Late Shops, Brook Street, Ilkley<br />
• Marks and Spencer, Station Road, Ilkley<br />
Keighley Town Centre<br />
• Morrisons, Worth Way, Keighley<br />
• Sainsburys, Cavendish Street, Keighley<br />
• Asda, Bingley Street, Keighley<br />
• Aldi, Gresley Road, Keighley<br />
• Netto, Keighley<br />
• Marks and Spencer, Low Street, Keighley<br />
• Iceland, Gresley Road, Keighley<br />
• Farmfoods, Cooke Lane, Keighley<br />
Shipley Town Centre<br />
• ASDA, Manor Lane, Shipley<br />
• Aldi, Tony Miller Approach, Briggate, Shipley<br />
• Co-op Late Shops, Wrose Road, Shipley<br />
District Centres<br />
• Five Lane Ends- Morrissons, Enterprise 5, 275 <strong>Bradford</strong> Road, Idle.<br />
• Girlington- Morrissons, Victoria Shopping Centre, Young Street.<br />
• Great Horton- Tesco Extra (on the edge of the centre)<br />
• Greengates- Sainsbury, 760 Harrogate Road.<br />
• Mayo Avenue- Morrissons, 110 Mayo Avenue.<br />
• Thornbury- Morrissons, Rushton Avenue.<br />
• Tong Street- Netto, Oasby Croft, off Tong Street.<br />
Source: <strong>Bradford</strong> Retail and Leisure <strong>Study</strong> (WYG, 2008)<br />
All the district centres in <strong>Bradford</strong> has at least one supermarket serving the catchment. The<br />
only local centre to attract any significant proportion of main food shopping trips is<br />
Buttershaw, which contains a large-format Tesco. Apart from these, the other important freestanding<br />
stores include Asda at Rooley Lane and Tesco at the Peel Centre, Valley Road. In<br />
terms of foodstore outside the district, the Morrisons at Otley Road, Guiseley (Leeds<br />
authority area) appears to be the most popular to the resident of the district.<br />
6.5.2 Community Centres<br />
Community centres in <strong>Bradford</strong> offer facilities for a wide range of events including parties,<br />
corporate and social events, meetings, conferences and sporting activities. These centres<br />
play an important part in contributing towards community vibrancy. MAP below shows the<br />
location of all of the Community Centres in <strong>Bradford</strong>.<br />
ADD MAP SHOWING THE LOCATION OF COMMUNITY CENTRES<br />
172
The current provision of centres which provide wider community facilities are often located in<br />
the centre of a community whether that be in the town centre, local centre or in the middle of<br />
a housing estate, wherever the wider needs of local people can best be served.<br />
There are 96 Community Centres across the <strong>Bradford</strong> Sitrict according to the data held by<br />
DIVA – the voluntary organisations database for <strong>Bradford</strong> District.<br />
• Activity and Recreation Centre (ARC)<br />
• All Saints Landmark Centre<br />
• Anand Milan Centre<br />
• Baildon Community Link<br />
• Bangladeshi Community Association -<br />
<strong>Bradford</strong> (BCAB)<br />
• Bangladeshi Community Association -<br />
Keighley (BCA)<br />
• Bedale Centre<br />
• Bierley Community Centre<br />
• Bolton Villas HUB Project (The HUB)<br />
• Bolton Woods Community Centre<br />
• Bracken Bank and District Community<br />
Association<br />
• <strong>Bradford</strong> Moor Community Centre<br />
• <strong>Bradford</strong> Moor Youth Sports<br />
Association<br />
• Braithwaite and Guardhouse<br />
Community Association<br />
• Braithwaite People's Association<br />
(BPA)<br />
• Buttershaw Christian Family Centre<br />
(BCFC)<br />
• Cafe West<br />
• Canterbury Youth and Community<br />
Centre<br />
• Checkpoint / <strong>Bradford</strong> West Indian<br />
Community Centre Association<br />
• Claremont Community Trust<br />
• Clayton Village Hall Community<br />
Centre<br />
• Community Association of Great<br />
Horton<br />
• Communityworks<br />
• Communityworks in Buttershaw and<br />
Cooperville<br />
• Cottingley Cornerstone<br />
• Crosley Wood Tenants Action Group<br />
• Cullingworth Village Hall<br />
• Delius Arts and Cultural Centre<br />
• Eccleshill Youth And Community<br />
Association Ltd<br />
• Edward's Rainbow Family Community<br />
Centre<br />
• Kirkgate Community Centre<br />
• Kirkland Community Centre<br />
• Laisterdyke Trinity Community Centre<br />
• Light of The World Community Centre<br />
(LOTWCC)<br />
• Long Lee Village Hall<br />
• Manningham Mills Community<br />
Association (MMCA)<br />
• Marshfield Community Association<br />
(MCA)<br />
• Millan Centre<br />
• Newton Street Day Centre<br />
• North Community Centre<br />
• North East Windhill Community<br />
Association (NEWCA)<br />
• Pakistan Community Neighbourhood<br />
Association<br />
• Pan African Arts and Cultural Group<br />
(PAACG)<br />
• Park Lane Community Association Ltd<br />
• Parkside Community Centre<br />
• Parkwood Risers<br />
• Polish Community Centre - Friday<br />
Group<br />
• Princeville Community Association<br />
• Queensbury Community Centre<br />
• Queensbury Community Programme<br />
(QCP)<br />
• Ravenscliffe Community Association<br />
(RCA)<br />
• Ravenscliffe Youth Centre<br />
• Rockwell Centre<br />
• Royds Community Association (RCA)<br />
• Ryecroft Community Centre<br />
• Sangat Community Association<br />
(Sangat Centre)<br />
• Scholemoor Community Association<br />
• Shree Krishna Community Centre<br />
• South Square Centre<br />
• Springfield Youth And Community<br />
Centre<br />
• St Christopher's Youth Project<br />
• St John's Centre<br />
• St Mary's New Horizons Care in the<br />
173
• Equity Partnership - <strong>Bradford</strong> LGB<br />
Strategic Partnership<br />
• Fagley Youth and Community Centre<br />
• Friends of The Gateway<br />
• Frizinghall Community Centre<br />
• Frontline Initiative<br />
• Girlington Community Association<br />
(GCA)<br />
• Grange Interlink Community Centre<br />
• Greenwood Youth and Community<br />
Association<br />
• Gulberg Community Resource Centre<br />
• Hainworth Wood Community Centre<br />
• Haworth Community Centre<br />
• Heaton St Barnabas Village Hall<br />
• Highfield Community Centre<br />
• Holmewood Activity Centre<br />
• Hopes Centre (HCCC)<br />
• Idle Baptist Church and Community<br />
Centre<br />
• Karmand Community Centre<br />
• Keighley Association Women's and<br />
Children's Centre (KAWACC)<br />
Community (New Horizons)<br />
• St Oswald's West End Centre<br />
• Sutton Community Association (SCA)<br />
• The Diamond Community Cafe (DCC)<br />
• The Khidmat Centre<br />
• The Source<br />
• The Vine Trust<br />
• Thornbury Centre<br />
• Victor Road Community Project<br />
• Wilsden Village Hall<br />
• Woodside Action Group (WAG)<br />
• Wrose Community Centre<br />
• Wyke Christian Fellowship (WCF)<br />
• Wyke Community And Children's<br />
Centre Ltd<br />
• Wyke Manor Community Centre<br />
• YMCA - City of <strong>Bradford</strong><br />
The Council is currently undertaking a review of community centres in the District. Once the<br />
findings of this review are available, the information will be used to update and inform this<br />
Plan.<br />
6.5.3 Post offices<br />
Post Office Ltd is a wholly owned subsidiary of Royal Mail Group. With a nationwide network<br />
of Post Office branches across the country the Post Office network is the UK’s biggest<br />
retailer.<br />
Post Office branches were established originally for the acceptance of mail, but their use<br />
expanded to include the payment of pensions and other financial transactions. Post Office<br />
Ltd. now offer more than 170 different products and services, including telephony, financial<br />
services, bill payment, banking and travel related products. Post Office Ltd is the largest<br />
provider of foreign currency in the UK and the leading independent provider of travel<br />
insurance.<br />
Post Office services are provided online and by phone in addition to face to face. There are<br />
lots of different types of outlets in the network including Crown Office branches in city<br />
centres, outlets run by subpostmasters that combine a shop with the Post Office branch, as<br />
well as Outreaches Services including mobile Post Offices, and services that visit village<br />
halls or churches.<br />
Post Office Ltd serves over 22 million customers a week who make 34 million visits and<br />
174
approximately 63 million transactions. Approximately 93% of the UK adult population visit a<br />
Post Office branch each year.<br />
The Government has recognised that fewer people are using Post Office branches, partly<br />
because traditional service, including benefit payments are now available in other ways, such<br />
as online or directly through banks. It has concluded that the overall size and shape of the<br />
Post Office network of branches needs to change.<br />
Post Office Ltd has now in place a Network Change Programme to implement measures<br />
proposed by the Government. The programme will involve the compulsory compensated<br />
closure of up to 2,500 Post Office branches (out of a Network of 14,000 branches) with the<br />
introduction of about 500 service points known as Outreaches to mitigate the impact of the<br />
proposed closures.<br />
<strong>Bradford</strong> District is covered by two Post Office Network Change Programme Area Plan<br />
Proposals:-<br />
• Area Plan Proposal for West Yorkshire<br />
• Area Plan Proposal for North Yorkshire with Yorkshire East and Keighley Area<br />
Each of the above Area Plan Proposals has been subject to public consultation during<br />
2007/2008 to ensure that the views of the local people are taken into account before any final<br />
decisions are made by Post Office Ltd.<br />
Post Office Ltd. has confirmed that the following 16 Post Office branches within the <strong>Bradford</strong><br />
District are to close:-<br />
• Ashbourne Estate, Bolton Road, <strong>Bradford</strong><br />
• <strong>Bradford</strong> Road, Stocksbridge, Keighley<br />
• Chellow Dene, 1-3 Pearson Lane, <strong>Bradford</strong><br />
• City Road, <strong>Bradford</strong><br />
• Duckworth Lane, <strong>Bradford</strong><br />
• East Morton, 7-9 Main Road, East Morton, Keighley<br />
• East Bierley, 59-60 Southview Road, <strong>Bradford</strong><br />
• Highfield, 21 Belgrave Road, Keighley<br />
• Leaventhorpe (Temporaily closed), 1009 Thornton Road, <strong>Bradford</strong><br />
• Leeds Road, 812 Leeds Road, <strong>Bradford</strong><br />
• Leeds Road, 24 Dean Street, Ilkley<br />
• Manningham, 14-18 Green Lane, <strong>Bradford</strong><br />
• St Pauls Road, 51 <strong>Bradford</strong> Road, Shipley<br />
• Undercliffe, 10 Harrogate Road, <strong>Bradford</strong><br />
• Wibsey, 96 High Street, <strong>Bradford</strong><br />
• Woodhall Avenue, <strong>Bradford</strong><br />
175
Post Office Ltd has considered the relative convenience of alternative branches for those<br />
customers whose closest branch will close. Of the 10.2% of customers who use a branch<br />
that has closed, 10% do have access to Post Office services within one mile as measured by<br />
road distance (3% being within half a mile of their nearest alternative). According to Post<br />
Office Ltd, in total 99.8% of the population will either see no change, or will be within one<br />
mile of an alternative branch.<br />
The plan shows that the remaining 64 sub post offices are evenly dispersed throughout the<br />
District and that Post Office Ltd are confident that the remaining post office branches<br />
conform to the national accessibility criteria set by the Government.<br />
See link to the Network Change Programme here<br />
http://www.postoffice.co.uk/portal/po/content1?catId=57600693&mediaId=57600697<br />
6.5.4 Job centre plus<br />
Jobcentre Plus is a government agency supporting people of working age from welfare into<br />
work, and helping employers to fill their vacancies. Job Centre Plus is part of the<br />
Department of Works and Pensions (DWPS) and plays a major role in supporting the<br />
Department’s aim to ‘promote opportunity and independence for all through modern,<br />
customer-focused services’.<br />
There are 4 Job Centre Plus locations in <strong>Bradford</strong> District:-<br />
• Vicar Lane, <strong>Bradford</strong><br />
• Wainman Street, Shipley<br />
• Worth Way, Keighley<br />
• Manningham Lane, <strong>Bradford</strong><br />
Other Job Centre Plus locations adjacent to the district include:-<br />
• Newmarket Street, Skipton<br />
• Otley Road, Guiseley, Leeds<br />
• James Road, Halifax<br />
6.5.5 Local benefit/Tax Offices<br />
The Council Tax Payment Office is located at Britannia House, Hall Ings, <strong>Bradford</strong>.<br />
Council Tax Enquiry desks are located at:-<br />
• Bdirect, Centenary Court, <strong>Bradford</strong><br />
• Shipley Town Hall<br />
• Bingley Council Shop<br />
• Manningham One Stop Shop<br />
Her Majesty’s Revenue & Custom (HMRC) Tax Office (West Yorkshire & Craven Tax Office)<br />
is located at:-<br />
176
Centenary Court<br />
1 St Blaise Way<br />
<strong>Bradford</strong><br />
BD1 4YL<br />
6.5.6 Cemeteries and crematoria<br />
There are 67 sites classified under this typology of cemeteries, churchyards and burial<br />
grounds equating to 109 hectares of provision in <strong>Bradford</strong>.<br />
<strong>Bradford</strong> Council provides cemeteries at:-<br />
• Bingley<br />
• Bowling<br />
• Charlestown<br />
• Clayton<br />
• God’s Acre (Burley-in-Wharfedale)<br />
• Haworth<br />
• Ilkley<br />
• Menston<br />
• Morton<br />
• Nab Wood<br />
• North Bierley<br />
• Oakworth<br />
• Oxenhope<br />
• Queensbury<br />
• Scholemoor<br />
• Silsden<br />
• Stanbury<br />
• Steeton<br />
• Thornton<br />
• Tong<br />
• Utley<br />
• Wilsden<br />
• Windhill<br />
Crematoria facilities are also provided at:-<br />
• Scholemoor<br />
• Nab Wood<br />
• Oakworth<br />
177
Figure: Cemeteries sites mapped against settlement areas with catchment applied<br />
PENDLE<br />
CRAVEN<br />
KEIGHLEY<br />
KEIGHLEY<br />
CALDERDALE<br />
Steeton Steeton<br />
Steeton Steeton<br />
Haworth<br />
Haworth<br />
Oxenhope<br />
Oxenhope<br />
Silsden<br />
Silsden<br />
Addingham<br />
Addingham<br />
Keighley<br />
Keighley<br />
Cullingworth<br />
Cullingworth<br />
Cullingworth<br />
Cullingworth<br />
Denholme<br />
Denholme Denholme Denholme<br />
Harden<br />
Harden<br />
Queensbury<br />
Queensbury<br />
Wilsden Wilsden Wilsden<br />
Wilsden Wilsden Wilsden<br />
Bingley<br />
Bingley<br />
Ilkley<br />
Ilkley<br />
SHIPLEY<br />
SHIPLEY<br />
Shipley<br />
Shipley<br />
BRADFORD BRADFORD WEST WEST<br />
WEST WEST<br />
Baildon<br />
Baildon<br />
Bradf Bradf ord<br />
ord<br />
Burley Burley in in in in Wharf Wharf edale<br />
edale<br />
Menston<br />
Menston<br />
BRADFORD BRADFORD NORTH<br />
NORTH<br />
KIRKLEES<br />
Source: <strong>Bradford</strong> Open Space, Sports and Recreation <strong>Study</strong> (2006)<br />
HARROGATE<br />
BRADFORD BRADFORD SOUTH<br />
SOUTH<br />
ADD GIS MAP SHOWING ALL OF THE CEMETERIES AND CREMATORIA FACILITIES<br />
<strong>Bradford</strong> District Open Space Assessment Catchment mapping, based on all current<br />
provision, shows that there are only a small number of gaps across the settlements of<br />
<strong>Bradford</strong> in terms of cemeteries, churchyards and disused burial grounds. These are in the<br />
Shipley and Keighley analysis areas, especially in Keighley. However, it is not considered<br />
appropriate to consider covering these catchment gaps through extra provision of this<br />
typology because of its nature.<br />
The existing capacity within each of these cemeteries is detailed in BELOW. The data<br />
indicates that in the AREA X there is XX years supply, and in the AREA X an average of XX<br />
years supply, with Cemetery NAME X at capacity.<br />
DETERMINE SUPPLY AND CAPACITY, NEED FROM BRADFORD COUNCIL<br />
CEMETERIES AND CREMOTORIA<br />
6.5.7 Courts and prison<br />
<strong>Bradford</strong> Magistrates Court is located at The Tyrls, <strong>Bradford</strong> (Court number 2978). The<br />
Magistrates Court is working as part of the Governments Community Justice Programme and<br />
covers Criminal, Civil, Youth Court and Family Work.<br />
There are proposals to relocated the Magistrates Court next to the Law Courts at Exchange<br />
Square as part of the <strong>Bradford</strong> City Centre Regeneration proposals.<br />
LEEDS<br />
178
<strong>Bradford</strong> Law Courts (Combined Court Centre) is located at Exchange Square, Drake Street,<br />
<strong>Bradford</strong> (Court number 141 , County Court number 141). The Law Courts covers Criminal,<br />
Civil, Youth Court and Family Work, Divorce and Bankruptcy.<br />
There are no current prison facilities within the District, or any specific proposals or sites<br />
identified for new prison development in <strong>Bradford</strong> District at present.<br />
However, the National Offender Management Service (NOMS) which incorporates HM<br />
Prison Service have requested that the LDF include a criteria based policy to deal with a firm<br />
prison proposal should it arise during the Plan period. The demand for such facilities will be<br />
discussed with NOMS and used to update and inform this Plan.<br />
The nearest prison facility is HM Prison Leeds, located in West Leeds at 2 Gloucester<br />
Terrace, Stannngley Road, Armley, Leeds.<br />
HMP Leeds is a category B local prison. It accepts all adult male prisoners from West<br />
Yorkshire. It has an operational capacity of 1004 as of 1st January 2008<br />
HM Prision Leeds has a total 551 cells spread across six residential units, a segregation unit<br />
and in-patients Healthcare Facility.<br />
ADD DETAILS OF HMP REQUIREMENTS FOR WEST YORKSHIRE<br />
6.5.8 Places of worship<br />
<strong>Bradford</strong> District contains Places of Worship serving people from all the major religious<br />
background. There is no comprehensive record of all places of worship located within the<br />
district; however the following web links provide a general list of all major places of worship in<br />
the district.<br />
For a list of churches: http://www.eden.co.uk/churches/bradford/index.html<br />
For a list of mosques: http://councilformosques.org.uk/direct.pdf<br />
For Hindu temples: http://www.bradfordmandir.org/<br />
Alternatively a list of places of worship could be accessed from the online directory links<br />
below-<br />
BD POST CODE<br />
http://www.yell.com/ucs/UcsSearchAction.do;jsessionid=6512E362751A06976EE1421FCBF<br />
5C3BC?keywords=Places+of+Worship&companyName=&location=bd&scrambleSeed=3958<br />
0979&searchType=advance&M=&lastKeyword=Places+of+Worship&lastClarifyIndex=&lastCl<br />
arifyOptions=&lastSearchall=&lastSearchallTax=&lastbandedclarifyResults=&bandedclarifyR<br />
esults=&ssm=0<br />
LS29 POST CODE<br />
179
http://www.yell.com/ucs/UcsSearchAction.do?keywords=Places+of+Worship&companyName<br />
=&location=LS29&scrambleSeed=17907614&searchType=advance&M=&lastKeyword=Plac<br />
es+of+Worship&lastClarifyIndex=&lastClarifyOptions=&lastSearchall=&lastSearchallTax=&la<br />
stbandedclarifyResults=&bandedclarifyResults=&ssm=0<br />
The following plan shows the current location of Buddhist, Christian, Hindu, Jewish, Sikh and<br />
Muslim places of worship within the District. Once information on the level of use and other<br />
community services the places of worship provide is available, it will be used to update and<br />
inform this Plan.<br />
LIST THEM OR MAP THEM FROM THE LINK BELOW. BREAK THEM DOWN INTO<br />
CHRISTIAN, MUSLIM, JEWISH, SIKH, HINDU, BUDDIST, OTHER<br />
6.6 Emergency Services<br />
6.6.1 Police<br />
West Yorkshire Police is the Home Office Department Police Force responsible for policing<br />
West Yorkshire. It is the fourth largest force in England and Wales by number of officers, with<br />
5671 officers.<br />
West Yorkshire Police Authority contains 9 councillors, 3 magistrates and 5 independent<br />
members. The councillors are appointed by the five borough councils in the area - <strong>Bradford</strong>,<br />
Calderdale, Kirklees, Leeds and Wakefield.<br />
Proposals made by the Home Secretary on March 21, 2006 would see the force merge with<br />
North Yorkshire Police, South Yorkshire Police and Humberside Police to form a strategic<br />
police force for the entire region. These plans are currently under review and not expected to<br />
take place in the foreseeable future.<br />
For operational purposes, West Yorkshire Police is divided into 8 divisions. <strong>Bradford</strong> District<br />
is covered by two divisions:-<br />
Airedale & North <strong>Bradford</strong> Division covering the following neighbourhood policing areas<br />
with Police Stations at Keighley (Airedale & North <strong>Bradford</strong> Divisional HQ), Ilkley, Shipley<br />
and Eccleshill.<br />
• Bingley & Worth<br />
Bingley, Bingley Rural and Worth<br />
• Eccleshill<br />
Bolton, Undercliffe, Eccleshill and Idle, Thackley<br />
• Keighley<br />
Bogthorn, Exley Head, Fell Lane, Bracken Bank & Ingrow, Braithwaite, Guard House<br />
and Laycock, East Morton and Riddlesden, Hainworth & Woodhouse, Keighley<br />
Fields, Keighley Town Centre, Knowle Park, Utley & Beechcliffe and Worth Village<br />
180
• North <strong>Bradford</strong><br />
Allerton & Lower Grange, Clayton, Fairweather Green, Frizinghall, Heaton, Sandy<br />
Lane and Thornton<br />
• Shipley<br />
Baildon, Shipley and Windhill, Wrose<br />
• Wharfedale & Craven<br />
Addingham, Burley-in-Wharfedale, Ilkley, Menston, Silsden and Steeton-with-<br />
Eastburn<br />
<strong>Bradford</strong> South Division covering the following neighbourhood policing areas with Police<br />
Stations at Nelson Street <strong>Bradford</strong> (<strong>Bradford</strong> South Divisional HQ) and Lilycroft Road,<br />
Manningham<br />
• NP Area 1<br />
<strong>Bradford</strong> City Centre, <strong>Bradford</strong> University and College and Brown Royd and Horton<br />
Grange<br />
• NP Area 2<br />
<strong>Bradford</strong> Moor, East Bowling & Tyersal and Wapping, Undercliffe, Barkerend<br />
• NP Area 3<br />
Bierley and Euroway Trading Estate, Holmewood, Low Moor, Oakenshaw, Tong and<br />
Wyke<br />
• NP Area 4<br />
Buttershaw, Clayton Heights, Queensbury, Wibsey & Odsal and Woodside<br />
• NP Area 5<br />
Great Horton, Lidget Green and Scholemoor, Little Horton and West Bowling<br />
• NP Area 6<br />
Daisy Hill and Girlington and Manningham<br />
ADD DETAILS OF NUMBER OF PC AND POLICE COMMUNIT SUPPORT OFFICERS<br />
HERE+ ADD GIS MAP SHOWING POILCE STATIONS AND POLICE DIVISIONS<br />
The current Police provision is monitored on a daily basis across the District and the Police<br />
Stations operate on a fluid basis. Where by if demand requires Officers from one Station<br />
area to support another area, they are relocated.<br />
British Transport Police<br />
The role and responsibilities of the British Transport Police is similar to that of the Home<br />
Department police forces. The British Transport Police provide a police service on any land,<br />
premises or property of any person who has entered into a Police Service Agreement made<br />
181
under the relevant Act of Parliament. These premises etc. are mostly, but not entirely,<br />
Network Rail and Train Operating Companies.<br />
British Transport Police is a national police force which is divided into 8 Areas. The Area<br />
which covers West Yorkshire is the North East Area. There is a Police Station at Leeds City<br />
Station and a Police Station at <strong>Bradford</strong> Interchange Station.<br />
6.6.2 Fire Services<br />
The West Yorkshire Fire and Rescue Authority is an independent body with a legal duty to<br />
provide a fire and rescue service that meets the needs of local communities. It also has<br />
responsibilities regarding the enforcement of fire prevention, petroleum and explosives<br />
legislation.<br />
The authority is made up of 22 people who are appointed annually by the county’s five<br />
district councils: Leeds, <strong>Bradford</strong>, Kirklees, Wakefield and Calderdale.<br />
West Yorkshire Fire and Rescue Service serve a resident population of 2,125,000 and<br />
provides an emergency response across 202,924 hectares. The service’s emergency<br />
response is currently provided from 34 whole-time fire stations and 14 retained (part-time)<br />
fire stations, based within the five Districts of the county. It employs 1,514 wholetime<br />
firefighters, 196 part-time firefighters, 60 mobilisation and communication staff members and<br />
343 fire and rescue (non-uniformed) staff.<br />
All 999 calls are received by a central control room at HQ in Birkenshaw, <strong>Bradford</strong>.<br />
Appliances can then be mobilised from 48 fire stations. Each front-line fire engine is<br />
equipped with state-of-the-art rescue equipment -- some are also geared up for heavy<br />
rescue. There is also a fleet of specialist back-up appliances.<br />
West Yorkshire firefighters are trained to cope with a whole range of emergencies, not just<br />
fire. These include: road, rail or air crashes, floods, chemical spills and even terrorist attack.<br />
West Yorkshire Fire & Rescue Service has the following resources:<br />
• 48 Fire Stations (10 located in <strong>Bradford</strong> District)<br />
• 63 Pumping / Rescue Appliances<br />
• 6 aerial appliances<br />
• 6 Demountable Unit carrying vehicles<br />
• 15 Demountable Units<br />
• 1 Command Support Unit<br />
There are 10 Fire stations located in <strong>Bradford</strong> District at:-<br />
11. <strong>Bradford</strong><br />
12. Ilkley<br />
13. Keighley<br />
14. Bingley<br />
15. Shipley<br />
182
16. Silden<br />
17. Idle<br />
18. Fairweather Green<br />
19. Odsal<br />
20. Howarth<br />
West Yorkshire Fire & Rescue Authority HQ is based in Birkenshaw, <strong>Bradford</strong>.<br />
Further details on the above fire stations are available by clicking on the link below:-<br />
http://www.westyorksfire.gov.uk/aboutUs/au_stations.htm<br />
Map: Fire service stations across West Yorkshire<br />
The Fire Service states that the current operational capacity of the service is sufficient to<br />
cater for <strong>Bradford</strong> District and its potential growth.<br />
Fire Stations located in <strong>Bradford</strong> District are supported by neighbouring Fire Stations in<br />
Craven, Leeds, Calderdale and Kirklees during major incidences and high demand periods.<br />
The Fire and Rescue Service states that the scope to design out the risk of fire, with the use<br />
of modern materials and design standards, helps to reduce the risk of fire and the number of<br />
incidences the service responds to. To ensure incidences can be dealt with promptly, all new<br />
buildings (of 280m2 or more) are required to be located within 90m of a fire hydrant. The<br />
provision of fire hydrants is currently provided by the Fire and Rescue Service.<br />
183
6.6.3 Ambulance<br />
Yorkshire Ambulance Service NHS Trust was formed on 1 July 2006 bringing together South<br />
Yorkshire Ambulance Service, West Yorkshire <strong>Metropolitan</strong> Ambulance Service and the<br />
North and East Yorkshire parts of Tees, East and North Yorkshire Ambulance Service.<br />
YAS operate out of 22 ambulance stations (3 stations based in <strong>Bradford</strong> District) and in<br />
addition use numerous locations as standby points.<br />
There are 3 ambulance stations within <strong>Bradford</strong> District, as follows:-<br />
4. <strong>Bradford</strong><br />
5. Keighley<br />
6. Menston<br />
Standby points have been confirmed to date on the following sites in West Yorkshire ( 3<br />
within <strong>Bradford</strong>)-<br />
• Canal Road, <strong>Bradford</strong><br />
• Leeds Road Hospital, <strong>Bradford</strong><br />
• Odsal Fire Station, <strong>Bradford</strong><br />
• Rutland Lodge Medical Centre, Potternewton, Leeds<br />
• Kirkstall Medical Centre, Leeds<br />
• Beeston Fire Station, Leeds<br />
• Pontefract Fire Station, Pontefract<br />
A total of 24 more stand-by points are planned throughout Yorkshire in 2008/2009 to further<br />
improve the speed of response to 999 calls. 62<br />
The Air Support Unit operates out of Leeds <strong>Bradford</strong> International Airport. This unit operates<br />
one aircraft, but further aircrafts could be made available through the Northern Air<br />
Ambulance Support Group if required.<br />
Ambulance provision across the District is provided by the above three stations and is<br />
supplemented by stations within Leeds, Craven, Calderdale and Kirklees, if the incidence<br />
requires additional assistance.<br />
The current stations and the network of standby points provide a sufficient level of resource<br />
for the District. If demand increased permanently, <strong>Bradford</strong> would seek to commission<br />
additional resources to meet this demand through the Lead Commissioning arrangements.<br />
The following map shows the area each ambulance station in Yorkshire covers within the<br />
national eight minute response time target. It shows the majority of the District is covered for<br />
62 http://www.yas.nhs.uk/Media/PressReleases/2008/standsbytogettopatie.html<br />
184
a response time of 8 minutes by either a <strong>Bradford</strong> District or neighbouring Ambulance<br />
Station.<br />
Map: ambulance stations across Yorkshire<br />
During 2008/09 the YAS has received approximately 372,000 urgent and emergency calls,<br />
an average of over 1,800 calls a day, and responded to a total of approximately 565,000<br />
incidents.<br />
Table: Ambulance service emergency call response rate<br />
England<br />
Average<br />
Yorkshire Ambulance Service<br />
Target<br />
2008/09 2007/08 2008/09<br />
Category A calls<br />
Response within 8 minutes<br />
74.3% 73.5% 69.4% 75%<br />
Category A calls<br />
Response within 19 minutes<br />
96.9% 96.1% 96.1% 95%<br />
Category B calls<br />
Response within 19 minutes<br />
91% 92.4% 90.6% 95%<br />
Sources: YAS Annual Report and Summary Accounts 2007/08 and National Statistics: Ambulance Services<br />
England 2008/09<br />
The overall performance of the YAS in dealing with accident and emergency incidents is<br />
however below the national average and does not meet the nationally set performance<br />
targets. The Healthcare Commission continues to monitor YAS and envisages that significant<br />
progress would be made in near future towards achieving the standards with which YAS<br />
were not compliant in the previous years.<br />
185
6.7 Social services/over 50s support<br />
In line with national trends, <strong>Bradford</strong> has an aging population, with a projected increase by<br />
2025 from 68,600 to 90,800 in the over-65’s. A further demographic analysis has been<br />
presented in the Adult & Community Services 5-Year <strong>Strategy</strong> 2007-12 which in turn has<br />
informed the District’s statutory Joint Strategic Needs Assessment, and the development of a<br />
joint commissioning strategy for older people (‘joint’ refers principally to joint commissioning<br />
of health and social care with NHS <strong>Bradford</strong> & Airedale tPCT). The key points, as highlighted<br />
by the reports, in respect of delivering services to the elderly population of <strong>Bradford</strong> are that<br />
the rate of growth is higher amongst very elderly people than the 65+ population (the number<br />
of people aged 85 and over is already increasing, and is set to increase by 45% in the next<br />
15 years, from 9,200 to 13,400) and there will be increasing numbers from ethnic minority<br />
groups. There will also be increased numbers of older people and carers living with long-term<br />
conditions, affecting both physical and mental health; for example estimated numbers of<br />
people with dementia will increase in the same period from 5,400 to 7,100 (+31%).<br />
Table: <strong>Bradford</strong> District older people population projections<br />
Source: <strong>Bradford</strong> Adult Services 5-year <strong>Strategy</strong> 2007-2012<br />
Table: 5 year projected growth in <strong>Bradford</strong>’s older people population 2007-12<br />
Source: <strong>Bradford</strong> Adult Services 5-year <strong>Strategy</strong> 2007-2012<br />
<strong>Bradford</strong> Council’s Adult Services is responsible to support older people and other adults in<br />
the district including those with physical, sensory or learning disabilities, mental health<br />
problems, drug or alcohol dependence and those with HIV/Aids.<br />
186
In <strong>Bradford</strong> there are 91 care homes alongside 63 care homes with nursing facilities. A<br />
comprehensive list and details of each of the care homes could be found in <strong>Bradford</strong> District<br />
Care Services Directory 2008/09 downloadable from the following link-<br />
http://www.bradford.gov.uk/health_wellbeing_and_care/adult_care/bradford_care_services_directory.htm<br />
THE MAP below shows the location of adult social care facilities in <strong>Bradford</strong>. In terms of adult<br />
social care facilities, this includes day care centres, resource centres (which offer services<br />
and activities for adults who have physical or sensory disability, support people who wish to<br />
gain paid employment, enter voluntary work or take part in further/higher education and run<br />
courses in Business Administration, Computer Use, Music, Drama and Personal<br />
Development), and older people’s residential care homes.<br />
ADD MAP SHOWING ADULT SERVICES FACILITIES ACROSS THE DISTRICT (DAY<br />
CARE CENTRES, RESOURCE CENTRES, OLDER PEOPLE RESIDENTIAL CARE<br />
HOMES)<br />
Apart from responding to the challenges of meeting the continued need and demand for care<br />
and support from the district’s aging population, the adult services have to make a strategic<br />
move towards providing greater choice and control to service users. The emphasis in social<br />
care is on support for the individual rather than physical facilities. Care within the community,<br />
fostering and a national policy emphasis on care within the recipient’s own home are altering<br />
the traditional notions of residential institutions. Public and private sector partnership is also<br />
increasingly the main delivery mechanism for social care.<br />
The following points sets out some of the features that will define future care and support in<br />
<strong>Bradford</strong> district:<br />
• Predominately home-based support, including extra care and supported housing.<br />
• Increased use of a range of assistive technologies, e.g. telecare.<br />
• A high level of self-assessment and self-directed care underpinned by information,<br />
advice, advocacy and brokerage support.<br />
• An increased emphasis on prevention.<br />
• An ability to respond to outcomes as defined by users.<br />
• An ability to respond flexibly to users’ preferences and choices.<br />
• Promotion of social inclusion.<br />
• Specialist services, normally delivered jointly with health, where individual needs are<br />
very complex.<br />
From financial point of view, the future challenge to the adult service will depend on the<br />
impact of demographic change leading to increased needs alongside decisions about the<br />
care models required to meet these needs. At present, the department is unable to meet<br />
current levels of need with budget pressures of £5m. It is estimated that demographic<br />
pressures will increase this by an additional £5.4m over the next 5 years. Alongside this<br />
there are additional service pressures of £8.5m, which lead to a possible budget shortfall in 5<br />
years of approximately £18.9m. <strong>Analysis</strong> of spend in the comparator group of authorities<br />
187
indicates that the department is currently spending an average £14.75m less on Adult<br />
Services.<br />
The significant increase in overall costs is reflected in the Wanless Review63, which<br />
attempts to project the cost of social care for older people up to 2026. Using current service<br />
provision models, it projects an increase of 139% in the gross cost of provision. Local<br />
analysis of the demographic impact on older people’s funded care home placements<br />
indicates costs could increase by £5 - £7.5m over the next 15 years.<br />
Based on this emerging trend of future needs and aspiration of older people in <strong>Bradford</strong> and<br />
the financial challenges being faced by the service, the council recently has carried out an<br />
assessment of the care and support services it provides in the council owned 11 residential<br />
care homes and in the 7 extra-care housing schemes commissioned by the council. The<br />
Council’s eleven residential care homes are currently providing a very wide range of<br />
services, covering long-stay (permanent) care; short-stays (mainly to provide carer breaks);<br />
rehabilitation and assessment (intermediate care); and specialist care for people with<br />
primarily mental health needs. But unfortunately the current assessment has found that all<br />
these 11 residential care homes are unlikely, in their current condition, to meet future<br />
expectations for the quality of their environment and accommodation. (This is no reflection on<br />
the quality of care provided by the staff teams). None of them would meet all the statutory<br />
registration standards for room size and en-suite facilities if they were opening new or being<br />
reregistered; they all rely on lower standards applied to existing homes. There fore the<br />
council is currently working on finalising option for the future of these 11 care homes. The<br />
options include securing capital investment over the next 5-10 years to ensure that the care<br />
homes meet standards and expectations for high quality accommodation, focussing on<br />
specific care provisions, and/or closing all in-house provision over the next 10 years.<br />
Further information on Adult Services can be found here:-<br />
http://www.bradford.gov.uk/health_well-being_and_care/adult_care/<br />
The Councils Guide to Over 50s can be found by clicking on the link below:-<br />
http://www.bradford.gov.uk/NR/rdonlyres/B519825C-38A2-4FEB-ADC8-<br />
6CF134A3B7F5/0/W18685AZGUIDEOVER50SJune08final.pdf<br />
6.8 Gypsies and travellers facilities<br />
The distribution of the Gypsy and Traveller population across West Yorkshire is relatively<br />
uneven with heavier concentrations in the larger authorities of <strong>Bradford</strong>, Leeds and<br />
Wakefield. This pattern is mirrored in terms of the incidences of unauthorised Encampments.<br />
<strong>Bradford</strong>, Leeds and Wakefield currently provide a total of 126 pitches on their local authority<br />
sites. There are a further 17 pitches on private authorised sites in the sub-region<br />
concentrated in <strong>Bradford</strong> and Kirklees.<br />
63 The Wanless Review ‘Securing good care for older people’ (2006) used a model based on<br />
estimating the numbers of older people with different levels of functional impairment. See <strong>Bradford</strong><br />
District Adult Services Five Year <strong>Strategy</strong> 2007-12 for more detail.<br />
188
Council Gypsy and Traveller sites at October 2007<br />
Source: WY Gypsy and Travellers Accommodation Assessment (Powell R. et al, 2008)<br />
These sites are large by national standards and occupancy rates are relatively high across<br />
all sites. There has been no change in the number of pitches over the past 5 years at any of<br />
the sites. All these sites are currently managed by a site manager or warden employed by<br />
the local authority, however the post at Mary Street in <strong>Bradford</strong> is presently vacant. The<br />
previous site warden at Mary Street was a site resident but resigned in 2005 and has not<br />
been replaced. The intention is to find a replacement from the same source if possible.<br />
Facilities and Living Quality of Council Gypsy and Traveller Sites<br />
Site facilities<br />
Facilities in amenity units<br />
Quality of surroundings /environment<br />
Location and access to schools/shops<br />
- Amenity units for each pitch;<br />
- Site office;<br />
- Animal grazing (Esholt Lane only).<br />
- Bath and shower;<br />
- WC with access from lobby;<br />
- Space/provision for cooking and laundry;<br />
- Space for eating/ sitting;<br />
- Effective heating in bathroom.<br />
- Very good (Esholt Lane)<br />
- Very poor (Mary Street)<br />
- Very good (Mary Street)<br />
- Good (Esholt Lane)<br />
Site condition and maintenance - Very good (both sites)<br />
Any known disputes etc over last year?<br />
- Disputes between residents (Esholt Lane)<br />
- Vandalism (Mary Street).<br />
Source: Source: WY Gypsy and Travellers Accommodation Assessment (Powell R. et al, 2008)<br />
189
Amenity provision on the sites appears to be good, but there are environmental and access<br />
issues at Mary Street.<br />
There are also 5 authorised private sites identified in <strong>Bradford</strong>.<br />
Table: Authorised Private Sites in <strong>Bradford</strong><br />
Site Pitches/caravans Planning Status<br />
Raglan Terrace 1 pitch Approved<br />
Square Street 1 pitch Approved<br />
Mill Car Hill Road 2 pitches Application submitted<br />
Westgate Hill Street 2 pitches Approved<br />
Westgate Hill Street 1 pitch Approved<br />
Generally, these are very small encampments, usually only consisting of one or two<br />
caravans or trailers and in every case just one family/household. However, the WYGATAA<br />
<strong>Study</strong> has highlighted that given the sheer geographical scale of the sub-region and the<br />
infrequency of the caravan count it is possible that there are more 'hidden' private sites within<br />
West Yorkshire including <strong>Bradford</strong>.<br />
Incidents of unauthorised development of Gypsy and Travellers sites are not as common as<br />
they are in the wider region or in the national context. However, the above study has<br />
identified six cases of possible unauthorised development in West Yorkshire, 3 of them being<br />
within <strong>Bradford</strong>. Moreover, there have been 53 incidents of unauthorised encampments were<br />
recored in 2006 with an average duration of statying of 10.1 days. The majority of<br />
encampments on LA land are resolved by negotiation. Only four encampments out of 25<br />
involved a court order.<br />
There are also two sites within the district that accommodates 17 plots for the travelling<br />
showpeople.<br />
- Paley Road (1.97 hectares- 15 households) in Bowling, <strong>Bradford</strong> West<br />
Constituency. The site is owned by the BMDC and rented to the Guild-also used<br />
as parking space for vehicles.<br />
- Gain Lane (2 households)<br />
Future needs<br />
An Accommodation <strong>Study</strong> was produced in May last year by CRESR (commissioned by the<br />
West Yorkshire Housing Partnership) which assessed the future needs of G&T sites across<br />
the WY region. It has identified a need for 80 additional pitches in <strong>Bradford</strong> in the period to<br />
2026 but there is a shortfall now which needs pressing action. The study revealed that the<br />
majority of the new accommodation will need to be social provision. Although there are<br />
Government grants currently available for sites, so far most of the grant take up regionally<br />
has been for refurbishment of existing sites.<br />
190
Table: Summary of estimated G&T site need in <strong>Bradford</strong><br />
Need for 2008-12<br />
19 standard pitches +<br />
6 transit pitches<br />
Gypsy’s &<br />
Travellers<br />
Need for 2013-15<br />
(based on family growth)<br />
Total Requirement 2008-15<br />
6 standard pitches<br />
31 pitches<br />
Additional requirement 2016-26 31 pitches<br />
Total Requirement 2008-26 62 pitches<br />
Travelling<br />
Showpeople<br />
Need for 2008-12 6 pitches<br />
Need for 2013-15<br />
(based on family growth)<br />
2 pitches<br />
Total Requirement 2008-15 8 pitches<br />
Additional requirement 2016-26 10 pitches<br />
Total Requirement 2008-26 18 pitches<br />
Council’s Housing <strong>Strategy</strong> reflects the requirements for future pitches but there is no action<br />
plan in place as to how the needs will be met. Moreover, it is possible that the existing Mary<br />
Street site may be needed for a new Waste Management facility – therefore a consequent<br />
replacement for the site would be additional to the pitches needed specified above.<br />
The sorts of areas suitable for gypsy and traveller sites will be addressed in the LDF <strong>Core</strong><br />
<strong>Strategy</strong> and in particular allocations DPDs.<br />
6.9 Culture and Leisure<br />
6.9.1 Museums/galleries<br />
<strong>Bradford</strong> District is home to some of the most exciting museums and galleries in Yorkshire.<br />
From the Baroque splendour of Cartwright Hall Art Gallery to the intimacy of Ilkley's Manor<br />
House Museum and Art Gallery, there is always something new to do or see, and admission<br />
is free.<br />
Specialist museums like <strong>Bradford</strong> Industrial Museum and Keighley's Cliffe Castle Museum<br />
bring our District's history and heritage to life through ever-changing displays; while<br />
interactive exhibits and family events at the Brackenhall Countryside centre help young<br />
people learn to enjoy and respect the countryside.<br />
The Councils Education team run regular workshops and special events with schools and<br />
other groups, and will be delighted to help you make the most of your visit.<br />
Many of the museums, galleries and community halls have rooms for hire for meetings and<br />
special events - some are even licensed for marriages.<br />
There are 7 museums and galleries managed by the Council within <strong>Bradford</strong> District:-<br />
1. <strong>Bradford</strong> 1 Gallery<br />
2. Cartwright Hall<br />
3. <strong>Bradford</strong> Industrial Museum<br />
4. Cliffe Castle<br />
191
5. Manor House<br />
6. Bolling Hall<br />
7. Bracken Hall<br />
<strong>Bradford</strong> is also home to the National Media Museum as well as the following privately run<br />
museums and galleries-<br />
Name and Location Type of attraction<br />
• Saltaire Brewery & Visitor Centre, Saltaire Museum & Gallery<br />
• Salts Mill Gallery, Saltaire Museum & Gallery<br />
• Brontë Parsonage Museum, Haworth Museum & Gallery<br />
• Keighley Bus Museum, Keighley Museum & Gallery<br />
• Impressions Gallery, <strong>Bradford</strong> Museum & Gallery<br />
• Gallery II, <strong>Bradford</strong> Museum & Gallery<br />
• Colour Museum, <strong>Bradford</strong> Museum & Gallery<br />
• Peace Museum, <strong>Bradford</strong> Museum & Gallery<br />
• Museum of Reed Organs and Harmoniums, Shipley Museum & Gallery<br />
• Ilkley Toy Museum, Ilkely Museum & Gallery<br />
• Brontë Weaving Shed, Haworth Museum & Gallery<br />
• East Riddlesden Hall, Keighley Historic House<br />
• White Wells Spa Cottage, Ilkely Historic House<br />
Figure: Location of Attractions in and around <strong>Bradford</strong><br />
192
6.9.2 Theatres/Concert Halls<br />
<strong>Bradford</strong> District is home to 5 theatres/concert halls mainly located in <strong>Bradford</strong> City Centre<br />
close to public transport interchanges and the road network. The first three of the list below<br />
are run by the Council. <strong>Bradford</strong> Theatres attract 400,000 visitors yearly with over 90,000<br />
people in the eight weeks of Pantomime seasons.<br />
St. George's Hall<br />
St. George's Hall is renowned for exceptional acoustics<br />
and an intimate atmosphere. The venue seats over 1,500<br />
people and is a popular choice for bands at the cutting<br />
edge of British. The venue hosts one of the UKs longest<br />
running Orchestral Seasons, with the Hallé as resident<br />
orchestra. The hall also attracts big names in variety<br />
entertainment and receives regular children's shows and<br />
amateur productions.<br />
St. George's Hall offers a unique and unrivalled setting for meetings, events and corporate<br />
hospitality, and conferences (limited to certain times of year only).<br />
Alhambra Theatre<br />
The Alhambra Theatre is regarded as the North's premier<br />
touring venue and hosts the best in large scale<br />
entertainment from ballet and opera to variety and comedy,<br />
musicals, drama and Yorkshire's biggest panto.<br />
The venue seats 1,400 people and is a popular choice for major touring companies including<br />
Northern Ballet Theatre, Royal Shakespeare Company and Bill Kenwright (Joseph, Cabaret,<br />
Blood Brothers). It has staged major West End shows including Chitty Chitty Bang Bang and<br />
Starlight Express. It is a member of The Dance Consortium, a group of theatres who work<br />
together to bring the best in international dance to the UK.<br />
The Alhambra also offers a unique and unrivalled setting for meetings, events, corporate<br />
hospitality and conferences in <strong>Bradford</strong> (conferences at certain times of year only).<br />
The Studio<br />
The Studio offers a flexible space for theatre, exhibitions,<br />
meetings, conferences, wedding receptions, private parties<br />
and themed events.<br />
With a range of options from buffet dining for 140 to raked<br />
seating for 200, and even standing for 300 people, this<br />
<strong>Bradford</strong> venue has the potential for many types of event.<br />
193
It is also home to <strong>Bradford</strong>'s favourite comedy club, A Bag of Quips. Now in its 10th year, the<br />
monthly comedy club is famed for its intimate atmosphere and top class comedians - past<br />
headliners have included Russell Howard and Alan Carr.<br />
<strong>Bradford</strong> Playhouse<br />
<strong>Bradford</strong> Playhouse (formally known as The Priestley, The<br />
Priestley Centre for the Arts or <strong>Bradford</strong> Playhouse and Film<br />
Theatre - and originally <strong>Bradford</strong> Civic Playhouse) is a 290<br />
seat proscenium arch theatre with circle and stall seating<br />
based in Little Germany. The Priestley also has a studio<br />
space which has flexible lighting, sound, and seating<br />
arrangements.<br />
The King's Hall & Winter Garden<br />
The King's Hall and Winter Garden are located in the heart<br />
of Ilkley. The Hall comprises a traditional theatre and with<br />
the adjacent glass roofed spa Winter Garden.<br />
The King's Hall and Winter Garden currently host a wide<br />
range of events and community provision, from local<br />
amateur dramatic and performing arts companies, to lifestyle<br />
fairs and community events, as well being a key venue for<br />
the Summer Festival held in August.<br />
For details of each of the theatres/concert halls visit the website:<br />
http://www.bradford-theatres.co.uk/venues<br />
ADD MAP SHOWING LOCATION OF THE THEATRES<br />
6.9.3 Cinemas<br />
In terms of cinemas, the district contains -<br />
• 16 screen Cineworld at Leisure Exchange, Vicar Lane, <strong>Bradford</strong><br />
• 13 screen Odeon at Gallacher Leisure Park, Thornbury, <strong>Bradford</strong><br />
• IMAX at The National Media Museum, <strong>Bradford</strong><br />
• 2 screen cinema at The Picture House, North Street, Keighley<br />
The National Media Museum also houses two more cinemas, the Pictureville and Cubby<br />
Broccoli, which regularly screens the best contemporary and classic films, and frequently<br />
welcome guests from the cinema industry to talk about their work.<br />
194
6.9.4 Ten Pin Bowling alleys, Casinos/Bingo Halls<br />
10-pin bowling facilities in the District comprise Hollywood Bowl at Vicar Lane, <strong>Bradford</strong> (28<br />
lanes), AMF Bowling at Keighley (20 lanes) and Go-Bowling at Shipley Lanes (12 lanes). In<br />
addition to small and informal bingo clubs, large format bingo halls in the District include<br />
Buckingham Bingo, <strong>Bradford</strong> Interchange; Mecca Bingo, Little Horton, <strong>Bradford</strong>; Gala Bingo,<br />
Tong Street; Oxford Bingo, Dudley Hill Road, <strong>Bradford</strong>; and Gala Bingo, Alice Lane,<br />
Keighley.<br />
6.9.5 Libraries<br />
<strong>Bradford</strong> Council manages 31 libraries across <strong>Bradford</strong> District. These are listed below:-<br />
1. Addingham Library<br />
2. Allerton Library<br />
3. Baildon Library<br />
4. Bingley Library<br />
5. Burley Library<br />
6. Central Library<br />
7. Clayton Library<br />
8. Denholme Library<br />
9. East Bowling Library<br />
10. Eccleshill Library<br />
11. Girlington Library<br />
12. Great Horton Library<br />
13. Haworth Road Library<br />
14. Heaton Library<br />
15. Holme Wood Library<br />
16. Idle Library<br />
17. Ilkley Library<br />
18. Keighley Library<br />
19. Laisterdyke Library<br />
20. Manningham Library<br />
21. Menston Library<br />
22. Queensbury Library<br />
23. Shipley Library<br />
24. Silsden Library<br />
25. St. Augustine's Library<br />
26. Thornbury Library<br />
27. Thornton Library<br />
28. Wibsey Library<br />
29. Wilsden Library<br />
30. Wrose Library<br />
31. Wyke Library<br />
ADD GIS PLAN SHOWING THE LOCATION OF THE LIBRARIES<br />
There are also 3 mobile libraries that travel to different locations around the District. The<br />
Libraries provide a range of services including loaning of books, DVDs, CDs and audio<br />
books, 24/7 web access to the library catalogue and other information resources. All libraries<br />
offer free internet access, free requests for in stock items, storytimes and activities for<br />
children and families. Many libraries also offer reading groups and informal learning<br />
opportunities. Larger libraries also have meeting rooms, photocopying facilities, local and<br />
family history material and business information.<br />
195
The size of library members and the number of annual and average weekly visits, as shown<br />
in the following table, indicate that existing libraries in <strong>Bradford</strong> are well used by the<br />
communities across the district.<br />
Table: Library usage in <strong>Bradford</strong> District<br />
Library Name Annual Visit numbers Average visits per week Library Members<br />
Addingham 3335 64.1 543<br />
Allerton 19730 379.4 2046<br />
Baildon 65919 1267.7 4201<br />
Bingley 99253 1908.7 8861<br />
Burley 35340 679.6 2397<br />
Central 294421 5661.9 51043<br />
Clayton 22199 426.9 2271<br />
Denholme 4751 91.4 539<br />
East Bowling 11461 220.4 1054<br />
Eccleshill 116892 2247.9 12689<br />
Girlington 21318 410.0 2070<br />
Great Horton 34883 670.8 3870<br />
Haworth Road 15829 304.4 1470<br />
Heaton 3023 58.1 207<br />
Holme Wood 28266 543.6 2854<br />
Idle 10225 196.6 567<br />
Ilkley 131396 2526.8 11796<br />
Keighley 271603 5223.1 25412<br />
Laisterdyke 59692 1147.9 6297<br />
Manningham (estimate) 120000 2307.7 8361<br />
Menston 29291 563.3 2194<br />
Queensbury 9787 188.2 1179<br />
Shipley 309791 5957.5 24052<br />
Silsden 14659 281.9 2043<br />
St. Augustine's 7776 149.5 894<br />
Thornbury 21157 406.9 1784<br />
Thornton 12480 240.0 1113<br />
Wibsey 34154 656.8 5677<br />
Wilsden 4450 85.6 251<br />
Wrose 5554 106.8 546<br />
Wyke 47924 921.6 4216<br />
Mobile Library Service<br />
(incl Home<br />
delivery/delivery vans)<br />
29829 573.6 1957<br />
TOTAL 1896388 36469.0 194454<br />
Source: <strong>Bradford</strong> Libraries, Department of Culture, Tourism and sport, CBMDC.<br />
The role of the library within the community is changing resulting in libraries working in<br />
partnership with other community services and sharing resources and accommodation<br />
whenever possible.<br />
The recent review of library services in the District recommends further development of<br />
partnership working and commissioning of services, working closely with local communities<br />
to ensure local libraries meet local needs and moving towards a more flexible operation able<br />
to delivery library services in a variety of settings.<br />
196
6.9.6 Children’s play areas<br />
There are over 140 play areas the <strong>Bradford</strong> District, many of them within Parks or Recreation<br />
Grounds. (ADD GIS MAP SHOWING PLAY AREAS IN BRADFORD DISTRICT)<br />
In addition to conventional play areas the Council also provide Skateparks, BMX facilities<br />
and Multi-Use games courts for older children and young people.<br />
The Council works with local groups to create new play areas. This may include helping them<br />
apply for funding or with design and sourcing the best equipment. All play areas managed by<br />
the service are inspected by qualified staff, on a regular basis, to ensure they are maintained<br />
in a safe and good condition.<br />
In total, there are 215 play areas for children and young people in the District, totalling 20ha.<br />
The <strong>Bradford</strong> District Open Space Assessment (2006) has concluded that in areas of slight<br />
catchment gaps, the upgrading of certain play areas from Local Area for Play (LAPs) to Local<br />
Equipped Areas of Play (LEAPs) could be considered.<br />
However, in other areas of significant gaps, such as in north and south Shipley and west<br />
Keighley, the installation of new equipped play areas is required in some to reduce the<br />
significant catchment gaps.<br />
6.9.7 Sports pitches and courts<br />
<strong>Bradford</strong> District Open Space Assessment (2006) has been prepared by KKP on behalf of<br />
the Council.<br />
Football<br />
There are a total of XX senior football pitches and 19 mini football pitches which are spread<br />
throughout the <strong>Bradford</strong> district.<br />
The Open Space, Sports and Recreation <strong>Study</strong> (2006) highlighted that there is large<br />
deficiency of designated mini and junior soccer pitches across the District. Although a<br />
surplus of senior pitches (to meet peak demand) was identified it was established that this<br />
would not make up for the deficiencies in mini and junior provision even if it was redesignated.<br />
197
Figure: <strong>Bradford</strong> Football and Cricket pitches<br />
<strong>Bradford</strong> Football Pitches<br />
Assessed by Quality / Capacity<br />
Over Use<br />
At Guidance Level<br />
Under Use<br />
No specified usage<br />
PENDLE<br />
CRAVEN<br />
CALDERDALE<br />
Steeton<br />
Haworth<br />
Oxenhope<br />
Silsden<br />
Addingham<br />
Keighley<br />
Keighley<br />
Harden<br />
Cullingworth<br />
Denholme<br />
Queensbury<br />
Wilsden<br />
Bingley<br />
Ilkley<br />
<strong>Bradford</strong> West<br />
Shipley<br />
Burley in<br />
Wharf edale<br />
Menston<br />
Baildon<br />
Shipley<br />
Bradf ord<br />
HARROGATE<br />
<strong>Bradford</strong> North<br />
<strong>Bradford</strong> South<br />
KIRKLEES<br />
Source: <strong>Bradford</strong> Open Space, Sports and Recreation <strong>Study</strong> (2006)<br />
In terms of area based assessment, the study concludes that the current pitch stock in the<br />
<strong>Bradford</strong> North area has capacity to accommodate strategic reserve and future demand<br />
while those in <strong>Bradford</strong> South would not currently be able to meet the requirements.<br />
The current pitch stock in <strong>Bradford</strong> West could just cope with accommodating strategic<br />
reserve but the pitch stock in Ilkley and Keighley is not capable of accommodating strategic<br />
reserve and latent/future demand.<br />
The current pitch stock in Shipley has the capacity to accommodate strategic reserve, latent<br />
and future demand if improvements are made to existing sites.<br />
Cricket<br />
The Open Space Assessment has highlighted that there is a slight deficiency in pitch<br />
provision at peak times and that demand is increasing for cricket pitches on parks and<br />
recreation grounds in <strong>Bradford</strong> North, <strong>Bradford</strong> South and <strong>Bradford</strong> West.<br />
See location of cricket pitches across the district below:-<br />
LEEDS<br />
198
Figure: Cricket pitches in <strong>Bradford</strong><br />
PENDLE<br />
CRAVEN<br />
CALDERDALE<br />
Steeton<br />
Silsden<br />
148<br />
143<br />
Addingham<br />
185<br />
Keighley<br />
Keighley<br />
162<br />
159<br />
146<br />
Queensbury<br />
66<br />
161<br />
153<br />
Ilkley<br />
156<br />
Shipley<br />
205<br />
224<br />
150<br />
154<br />
Burley in<br />
Wharf edale<br />
Menston<br />
194<br />
70<br />
281<br />
230<br />
233<br />
<strong>Bradford</strong> South<br />
HARROGATE<br />
168<br />
170<br />
175<br />
169<br />
215 Bingley<br />
157<br />
Baildon<br />
229<br />
279<br />
32<br />
173<br />
Haworth<br />
174<br />
Oxenhope<br />
177<br />
Harden<br />
195<br />
197 228 199 29 36<br />
209<br />
232<br />
27<br />
Shipley<br />
Wilsden<br />
109<br />
20<br />
115<br />
Cullingworth<br />
236 172<br />
119<br />
218<br />
<strong>Bradford</strong> West 112<br />
38<br />
<strong>Bradford</strong> North<br />
Denholme 120<br />
126<br />
Bradf ord<br />
83<br />
22<br />
113<br />
37<br />
12<br />
62<br />
71 69<br />
2 5<br />
67<br />
88<br />
90<br />
94<br />
84<br />
55<br />
86<br />
KIRKLEES<br />
Source: <strong>Bradford</strong> Open Space, Sports and Recreation <strong>Study</strong> (2006)<br />
Rugby union<br />
The Yorkshire Rugby Football Union (RFU) administers rugby in <strong>Bradford</strong>. A full-time<br />
development officer is responsible for the West Yorkshire region and works closely with all<br />
the clubs to maximise their potential. This work involves developing club structures, including<br />
working towards the RFU Seal of Approval and the development of school-club structures.<br />
Figure : Rugby Union pitch sites in <strong>Bradford</strong> District<br />
<strong>Bradford</strong> Rugby union Pitches<br />
Assessed by Quality / Capacity<br />
Over Use<br />
At Guidance Level<br />
Under Use<br />
No specified usage<br />
PENDLE<br />
CRAVEN<br />
CALDERDALE<br />
Steeton<br />
Haworth<br />
Oxenhope<br />
Silsden<br />
Addingham<br />
282<br />
Keighley<br />
Keighley<br />
Denholme<br />
Queensbury<br />
Burley in<br />
Wharf edale<br />
Source: <strong>Bradford</strong> Open Space, Sports and Recreation <strong>Study</strong> (2006)<br />
Harden<br />
Cullingworth<br />
Wilsden<br />
239<br />
Bingley<br />
Ilkley<br />
<strong>Bradford</strong> West<br />
155<br />
Shipley<br />
197<br />
137<br />
154<br />
60<br />
Menston<br />
Shipley<br />
283<br />
Baildon<br />
Bradf ord<br />
284<br />
<strong>Bradford</strong> North<br />
<strong>Bradford</strong> South<br />
HARROGATE<br />
9<br />
5<br />
86<br />
KIRKLEES<br />
LEEDS<br />
LEEDS<br />
199
There are relatively few issues affecting rugby union compared to other sports in <strong>Bradford</strong>.<br />
The quality of pitches in <strong>Bradford</strong> is good and many private clubs own their own facilities and<br />
are able to maintain them to a high standard.<br />
There are catchment gaps of both clubs and facilities for certain areas of <strong>Bradford</strong> (<strong>Bradford</strong><br />
South and <strong>Bradford</strong> West) but these shortfalls are currently being met by surpluses in other<br />
areas. The usage of school facilities by rugby union clubs is very high. Often, these pitches<br />
are used on an ad-hoc basis if the main sites are unusable.<br />
There is no latent demand at senior level for rugby but demand for more junior pitches is<br />
growing which will become more acute if clubs individual development plans are realised.<br />
Table: Summary of rugby union pitches in <strong>Bradford</strong><br />
Site name Area<br />
Site Community Senior Junior Mini<br />
Owner Use G A P G A P G A P<br />
<strong>Bradford</strong> Cathedral<br />
Community College<br />
Hanson School<br />
Tong School<br />
Northfield Road Playing<br />
Fields<br />
Thornton Grammer School<br />
Braford Salem Rugby Club<br />
<strong>Bradford</strong><br />
North<br />
<strong>Bradford</strong><br />
North<br />
<strong>Bradford</strong><br />
South<br />
<strong>Bradford</strong><br />
South<br />
<strong>Bradford</strong><br />
West<br />
<strong>Bradford</strong><br />
West<br />
LA Yes 1<br />
LA Yes 1<br />
LA Yes 1<br />
0 Yes 1<br />
LA Yes 1<br />
0 Yes 2<br />
Ilkley Grammar School Keighley LA Yes 1<br />
Ilkley Rugby Union Club Keighley Private Yes 4 2<br />
Cougar Park Keighley 0 Yes 3<br />
<strong>Bradford</strong> & Bingley Sports &<br />
Social Club<br />
Shipley Private Yes 4<br />
Source: <strong>Bradford</strong> Open Space, Sports and Recreation <strong>Study</strong> (2006)<br />
School sites with rugby union pitches in <strong>Bradford</strong> are significantly underused by clubs. Ilkey<br />
Grammar School is used on a weekly basis by Ilkley Rugby Club to accommodate its junior<br />
development programme.<br />
Two of the main clubs in <strong>Bradford</strong>, Keighley Cougars and Ilkley Rugby Club, make use of<br />
other sites in <strong>Bradford</strong> to play matches. These are used on an ad-hoc basis and are not<br />
therefore shown as being played to capacity.<br />
Rugby league<br />
There is a considerable amount of rugby league activity in <strong>Bradford</strong>. The majority of this<br />
activity takes place within a small number of clubs, all of whom field several senior teams<br />
and a number of teams at junior level.<br />
200
Figure : Rugby league pitch sites in <strong>Bradford</strong> District<br />
<strong>Bradford</strong> Rugby league Pitches<br />
Assessed by Quality / Capacity<br />
Over Use<br />
At Guidance Level<br />
Under Use<br />
No specified usage<br />
PENDLE<br />
CRAVEN<br />
CALDERDALE<br />
Steeton<br />
Haworth<br />
Oxenhope<br />
Silsden<br />
165<br />
Queensbury<br />
Source: <strong>Bradford</strong> Open Space, Sports and Recreation <strong>Study</strong> (2006)<br />
<strong>Bradford</strong> has a stronger and larger grass roots base than other areas of West Yorkshire with<br />
all ten clubs either working towards, or having achieved Clubmark to date. The two<br />
professional clubs, <strong>Bradford</strong> Bulls and Keighley Cougars, have both achieved Clubmark and<br />
are used as flagship clubs to promote club accreditation to amateur clubs.<br />
The following table indicates club accreditation in <strong>Bradford</strong>.<br />
190<br />
Addingham<br />
149<br />
Keighley<br />
167<br />
160<br />
Keighley<br />
Harden<br />
Cullingworth<br />
Denholme<br />
Burley in<br />
Wharf edale<br />
Table: Rugby league clubs accredited in <strong>Bradford</strong><br />
Club Accreditation status<br />
Queensbury Accreditation achieved<br />
Victoria Rangers Accreditation achieved<br />
<strong>Bradford</strong> Dudley Hill Accreditation achieved<br />
West Bowling ARLFC Accreditation achieved<br />
Keighley Cougar Cubs Accreditation achieved<br />
Thonrton ARLFC Registered – working towards<br />
Wyke ARLFC Registered – working towards<br />
Wibsey Juniors Registered – working towards<br />
Clayton Registered – working towards<br />
Wilsden<br />
Bingley<br />
Ilkley<br />
Shipley<br />
<strong>Bradford</strong> West<br />
120<br />
7<br />
207<br />
107<br />
54<br />
152<br />
56<br />
The majority of rugby league clubs are located in the north of <strong>Bradford</strong> reflecting an uneven<br />
distribution of clubs across the District. The <strong>Bradford</strong> Open Space, Sports and Recreation<br />
<strong>Study</strong> (2006) however demonstrates that the current stock of rugby league pitches is not<br />
being played to capacity; particularly in <strong>Bradford</strong> South where there is a disproportionate<br />
number of teams compared the rest of the District.<br />
89<br />
Menston<br />
Shipley<br />
92<br />
Baildon<br />
91<br />
194<br />
HARROGATE<br />
17<br />
18<br />
<strong>Bradford</strong> North<br />
74 Bradf ord<br />
10<br />
76<br />
80<br />
<strong>Bradford</strong> South<br />
55<br />
KIRKLEES<br />
LEEDS<br />
201
Table: Rugby league pitches in <strong>Bradford</strong> district<br />
Site name Area<br />
Site<br />
Owner<br />
Community<br />
Use<br />
Senior<br />
G A P<br />
Junior<br />
G A P<br />
Emsley Memorial Recreation Ground <strong>Bradford</strong> North LA Yes 1<br />
Lowerfields Primary <strong>Bradford</strong> North LA Yes 1<br />
Victoria Rangers Ground <strong>Bradford</strong> North Private Yes 1<br />
Apperley Bridge Playing Fields <strong>Bradford</strong> North LA Yes 1<br />
ASA Briggs Park <strong>Bradford</strong> South LA Yes 1<br />
Bankfoot Cricket Ground <strong>Bradford</strong> South Private Yes 1<br />
Beldon Lane Recreation Ground <strong>Bradford</strong> South LA Yes 1<br />
Lidget Green Cricket and Athletic<br />
Club<br />
<strong>Bradford</strong> South LA Yes 2<br />
Neil Hunt Memorial Ground <strong>Bradford</strong> South LA Yes 1 1<br />
Odsal Recreation Ground <strong>Bradford</strong> South LA Yes 2<br />
Wibsey Park <strong>Bradford</strong> South LA Yes 2<br />
Wibsey Park Primary <strong>Bradford</strong> South LA Yes 1<br />
Woodside Primary <strong>Bradford</strong> South LA Yes 1<br />
Delph Recreation Ground <strong>Bradford</strong> West LA Yes 1<br />
Hill Top Rd <strong>Bradford</strong> West LA Yes 2<br />
Silsden Park Keighley LA Yes 1<br />
East Holmes Field Keighley LA Yes 2<br />
Highfield Recreation Ground Keighley LA Yes 2<br />
Oakbank Sports College Keighley LA Yes 1<br />
Utley Recreation Ground Keighley LA Yes 2<br />
The Holy Family Catholic School Keighley LA Yes 1<br />
Baildon Rugby and Cricket Ground Shipley Private Yes 2<br />
Crossflats Recreation Ground Shipley LA Yes 1<br />
Source: <strong>Bradford</strong> Open Space, Sports and Recreation <strong>Study</strong> (2006)<br />
Hockey<br />
On a County level, hockey is strong and junior development is well structured in <strong>Bradford</strong>.<br />
However, considering the demographic make up of the District there is a lack of true<br />
‘community’ work and more could be done to increase participation in the deprived areas for<br />
disadvantaged young people. Most participation/activity is based around the grammar<br />
schools, which risks bringing an ‘elitist’ label to the game in <strong>Bradford</strong>.<br />
There are six ATPs identified in use by the local teams.<br />
Table: ATPs in <strong>Bradford</strong> District<br />
Venue Area<br />
Thornton Sports College/Recreation Centre <strong>Bradford</strong> West<br />
Oakbank Sports College Keighley/Ilkley<br />
Beckfoot Technology College Shipley<br />
<strong>Bradford</strong> Girls Grammar School <strong>Bradford</strong> North<br />
Carlton Bolling College <strong>Bradford</strong> North<br />
Grange Technology College (under construction) <strong>Bradford</strong> West<br />
Ben Rhydding Sports Club Keighley/Ilkley<br />
202
All of the above facilities are full size sand based artificial turf pitches. In addition there are a<br />
number of smaller artificial turf surfaces, which are suitable for hockey training and some<br />
junior play.<br />
Table: Small ATPs in <strong>Bradford</strong><br />
Venue Area<br />
Parkside School Keighley<br />
Maningham Sports Centre <strong>Bradford</strong> North<br />
Scotchman Road Activity & Coaching Centre <strong>Bradford</strong> North<br />
Highfield Community Centre Keighley<br />
University of <strong>Bradford</strong> – Trinity Road <strong>Bradford</strong> West<br />
The ATP at Marley Playing Fields has been replaced with a 3 rd generation field turf pitch and<br />
as such is no longer a suitable surface for competitive hockey. It was the only pitch managed<br />
by CBMDC with ‘100% community use’. All the other pitches were within the education and<br />
private sector. Use of ATPs is considered to be at capacity.<br />
Figure : Artificial turf hockey pitches in <strong>Bradford</strong> District<br />
PENDLE<br />
CRAVEN<br />
CALDERDALE<br />
Steeton<br />
Oxenhope<br />
Silsden<br />
Haworth<br />
Addingham<br />
Keighley<br />
165<br />
Keighley<br />
Cullingworth<br />
Denholme<br />
Source: <strong>Bradford</strong> Open Space, Sports and Recreation <strong>Study</strong> (2006)<br />
Harden<br />
Queensbury<br />
Wilsden<br />
Burley in<br />
Wharf edale<br />
Hockey is not a priority sport for CBMDC sports development unit but support for clubs is<br />
available through the B Active networks set up in each area.<br />
Athletics<br />
There are two athletics tracks servicing competitive athletics in the <strong>Bradford</strong> District:<br />
Bingley<br />
Ilkley<br />
<strong>Bradford</strong> West<br />
137<br />
Shipley<br />
196<br />
105<br />
Greenhead High School, Keighley: Greenhead is an eight-lane synthetic, floodlit track on<br />
the grounds of Greenhead School in Keighley. It is managed by CBMDC, which employs a<br />
150<br />
Shipley<br />
Menston<br />
Bradf ord<br />
103<br />
Baildon<br />
116<br />
37<br />
<strong>Bradford</strong> South<br />
HARROGATE<br />
<strong>Bradford</strong> North<br />
50<br />
KIRKLEES<br />
LEEDS<br />
203
part-time track manager. The quality of the track is ‘adequate to poor’ evidenced by<br />
deteriorating track edging, poor drainage on surround grass areas and uneven surfaces on<br />
run up areas etc.<br />
Greenhead is the home of Keighley & Craven Athletics Club (KCAC) and is also used by a<br />
number of other local clubs and schools e.g. the Oakbank School Sport Partnership<br />
secondary schools, cluster primary schools as well as other schools from neighbouring Ilkely,<br />
Bingley and Skipton. It is considered by sportKeighley, the Three Valley’s SSP and the<br />
Airedale Masterplan and Airdale Primary Care Trust to be a key sports development facility<br />
for the area.<br />
Greenhead School is in phase two of CBMDC’s BSF programme. Whilst this will involve<br />
demolition of the School’s buildings and reconstruction adjacent to the track, the track will<br />
remain in its current position. Funding from the Community Athletics Refurbishment<br />
Programme (CARP) has recently been secured for basic renovation of the track. This is<br />
intended to support the existence and development of K&CAC and facilitate an athletics<br />
development centre as well as provide good quality facilities for sport and physical activity<br />
through curricular and extra curricular activities for all schools in the area.<br />
Horsfall Playing Fields, Low Moor (<strong>Bradford</strong> South): Horsfall track is located at Horsfall<br />
Playing Fields, off the A6036 Halifax Road heading southwest away from <strong>Bradford</strong>. The site<br />
is a multi-sport facility with grass pitches for cricket and football adjacent to the track. The<br />
athletics track also has a football pitch in the middle, which is used by <strong>Bradford</strong> Park Avenue<br />
FC.<br />
Horsfall track is a six lane track and, as such, is not certified for anything other than local<br />
level competitions. It is the home of <strong>Bradford</strong> Airedale Athletics Club (BAAC) and is<br />
occasionally used by other local clubs for training sessions. According to the Athletics<br />
Development Officer for West Yorkshire Sport the venue is not used by West Yorkshire<br />
Schools Athletics Association, <strong>Bradford</strong> Schools Athletics Association or West Yorkshire<br />
Athletics Association for meetings/competitions due to the poor quality changing rooms and<br />
the fact that it is only a six lane track.<br />
The track is currently being considered as part of proposals to develop ‘Odsal Sports Village’<br />
at the existing Odsal Stadium, home of <strong>Bradford</strong> Bulls. The scheme involves relocating and<br />
upgrading the track from Horsfall to an eight-lane track as part of a regional sports complex<br />
including leisure centre, swimming pool and artificial turf pitches.<br />
204
Figure: Athletics tracks in <strong>Bradford</strong> District with a 30-minute drive time catchment<br />
RIBBLE VALLEY<br />
HYNDBURN<br />
BLACKBURN<br />
WITH DARWEN<br />
BOLTON<br />
ROSSENDALE<br />
PENDLE<br />
BURNLEY<br />
CRAVEN<br />
Greenhead High School<br />
CALDERDALE<br />
BURY ROCHDALE<br />
DONCASTER<br />
Source: <strong>Bradford</strong> Open Space, Sports and Recreation <strong>Study</strong> (2006)<br />
A number of schools mark out tracks on grass or redraw areas in the summer in order to<br />
deliver curriculum activities. School competitions and sports days are carried out either at<br />
Horsfall, Greenhead or at tracks outside the District.<br />
All the local track and field clubs in <strong>Bradford</strong> has constituted <strong>Bradford</strong> Athletics Development<br />
Group (BADG) which is led by the athletics development officer from West Yorkshire Sport<br />
with input from the Keighley area sports development officer from CBMDC who also has a<br />
responsibility for athletics across the District. The group comes together to discuss the<br />
delivery of activities steered by West Yorkshire Sport and the <strong>Bradford</strong> school sports<br />
partnerships, local and area competitions and to share good practise and resources. The<br />
clubs are-<br />
• Keighley and Craven Athletics Club (K&CAC)<br />
• <strong>Bradford</strong> Airedale Athletics Club (BAAC)<br />
• Bingley Harriers & Athletics Club (BHAC)<br />
• Idle Athletics Club(IAC)<br />
• Wharfedale Harriers<br />
Horsfall Playing Fields<br />
KIRKLEES<br />
HARROGATE<br />
WAKEFIELD<br />
Public consultation with these clubs as a part of the Council’s Outdoor Sports Facilities<br />
Assessment has highlighted the urgent need of improving the quality of tracks and ancillary<br />
facilities at Greenhead School as well as development of a new track at Odsal. If a track is<br />
not developed at Odsal, with the loss of Horsfall, there would be a significant gap in provision<br />
covering the centre and south of the District. The study also identified demand for a training<br />
track (e.g. three lane straight and bend) in the Shipley/Bingley area.<br />
There are also a number of other road running clubs in the District including:<br />
• Baildon Runners – based at Baildon Cricket & Rugby Club.<br />
LEEDS<br />
SELBY<br />
YORK<br />
205
• Eccleshill Road Runners – based at Idle Cricket Club.<br />
• Ilkley Harriers – based at Ilkley Lawn Tennis & Squash Club.<br />
These clubs train on the roads, footpaths and canal towpaths around the District. Activities<br />
are essentially supported by being linked to another sports club which enables them to<br />
access changing and in most cases, social facilities.<br />
Bowls<br />
Bowls in West Yorkshire is predominantly played on crown greens.<br />
Figure: Bowling greens in <strong>Bradford</strong> District<br />
PENDLE<br />
CRAVEN<br />
CALDERDALE<br />
Steeton<br />
266<br />
Haworth<br />
Oxenhope<br />
Silsden<br />
259<br />
Addingham<br />
149<br />
Keighley<br />
Keighley<br />
260<br />
Queensbury<br />
Burley in<br />
Wharf edale<br />
262<br />
171<br />
Harden<br />
256<br />
Bingley<br />
263<br />
Wilsden<br />
229<br />
261<br />
Baildon<br />
258<br />
Shipley<br />
28<br />
26<br />
15<br />
Cullingworth 272<br />
212<br />
Denholme<br />
267 <strong>Bradford</strong> North<br />
<strong>Bradford</strong> West 275<br />
33<br />
129<br />
269<br />
<strong>Bradford</strong><br />
257<br />
Source: <strong>Bradford</strong> Open Space, Sports and Recreation <strong>Study</strong> (2006)<br />
276<br />
There are a total of 52 bowling greens in <strong>Bradford</strong> district located at the following parks and<br />
club sites.<br />
Table: Number and Location of bowling greens in <strong>Bradford</strong><br />
Site name Area No. greens<br />
Greengates Recreation Ground <strong>Bradford</strong> North 1<br />
Idle Recreation Ground <strong>Bradford</strong> North 1<br />
Institute Road Recreation Ground <strong>Bradford</strong> North 1<br />
Lister Park <strong>Bradford</strong> North 3<br />
Peel Park <strong>Bradford</strong> North 3<br />
Asa BriggsBowling Club <strong>Bradford</strong> South 1<br />
Brackenhill Park Bowling Club <strong>Bradford</strong> South 1<br />
<strong>Bradford</strong> Moor Bowling Club <strong>Bradford</strong> South 2<br />
Foxhill Park <strong>Bradford</strong> South 1<br />
Harold Park <strong>Bradford</strong> South 1<br />
274<br />
65<br />
268<br />
Ilkley<br />
Shipley<br />
277<br />
150<br />
270<br />
Menston<br />
89<br />
<strong>Bradford</strong> South<br />
68<br />
273<br />
264<br />
271<br />
78<br />
HARROGATE<br />
265<br />
72<br />
KIRKLEES<br />
LEEDS<br />
206
Table: Number and Location of bowling greens in <strong>Bradford</strong><br />
Site name Area No. greens<br />
Knowles Recreation Ground <strong>Bradford</strong> South 2<br />
Low Moor Harold Bowling Club <strong>Bradford</strong> South 2<br />
Oakenshaw Park <strong>Bradford</strong> South 2<br />
Wibsey Park <strong>Bradford</strong> South 2<br />
Clayton Victoria Park <strong>Bradford</strong> West 1<br />
Horton Park <strong>Bradford</strong> West 3<br />
Thornton Bowling Club <strong>Bradford</strong> West 1<br />
West <strong>Bradford</strong> Bowling Club <strong>Bradford</strong> West 1<br />
West Park <strong>Bradford</strong> West 2<br />
Ben Rhydding Sports Club Keighley 1<br />
Burley In Wharfedale Bowling Club Keighley 1<br />
Crossroads Park Keighley 1<br />
Haworth Bowling Club Keighley 1<br />
Ilkley Bowling Club Keighley 1<br />
Keighley Bowling Club Keighley 1<br />
Lund Park bowling green Keighley 2<br />
Silsden Park Keighley 1<br />
Steeton Bowling Club Keighley 1<br />
Whinswood Bowling Club Keighley 1<br />
Crowgill Park bowling green Shipley 1<br />
Cullingworth Bowling Club Shipley 1<br />
Foster Park Shipley 1<br />
Menston Bowling Club Shipley 1<br />
Myrtle Park Shipley 2<br />
Royd House Park Bowling Club Shipley 1<br />
Salts Playing Fields Shipley 2<br />
The Shipley Club Shipley 1<br />
Most of the clubs rent greens from the Council while a small number of clubs lease the<br />
greens from the Council. There are also few private bowling clubs in the district. Overall the<br />
existing bowling greens meet the current demand for such sports facilities in the district;<br />
however the Outdoor Sports Facilities Assessment has identified thee need for two additional<br />
bowling greens to meet future demand.<br />
Vandalism of bowling greens and pavilions is the biggest issue for bowls for the District as a<br />
whole. A large proportion of bowling greens also do not have appropriate access for players<br />
or spectators with disabilities.<br />
Tennis<br />
<strong>Bradford</strong> has the following tennis courts spread throughout the district.<br />
207
Table: Tennis clubs in <strong>Bradford</strong> district<br />
Site name Area No. courts<br />
Carlton Bolling College <strong>Bradford</strong> North 5<br />
Hanson School <strong>Bradford</strong> North 8<br />
Lister Park <strong>Bradford</strong> North 2<br />
Undercliffe Tennis Club <strong>Bradford</strong> South 3<br />
Thornton Grammer School <strong>Bradford</strong> West 4<br />
Heaton Tennis Club Shipley 9<br />
Eldwick Lawn Tennis Club Keighley 2<br />
Greenhead High School Keighley 5<br />
Ilkley Tennis Club Keighley 6<br />
Keighley Tennis Club Keighley 4<br />
The Holy Family Catholic School Keighley 7<br />
Beckfoot Technology College Shipley 4<br />
Beckfoot Tennis Club Shipley 4<br />
Saltaire Tennis Club Shipley 3<br />
Salts Playing Fields Shipley 3<br />
St. Peter's Tennis Club Shipley 2<br />
Figure: Tennis court provision across <strong>Bradford</strong> District<br />
PENDLE<br />
CRAVEN<br />
CALDERDALE<br />
Haworth<br />
Steeton<br />
Oxenhope<br />
Silsden<br />
190<br />
Addingham<br />
Keighley<br />
Keighley<br />
185<br />
288<br />
Cullingworth<br />
Denholme<br />
Source: <strong>Bradford</strong> Open Space, Sports and Recreation <strong>Study</strong> (2006)<br />
Harden<br />
Queensbury<br />
287<br />
292<br />
Wilsden<br />
Bingley<br />
Ilkley<br />
Shipley<br />
<strong>Bradford</strong> West<br />
137<br />
285<br />
Burley in<br />
Wharf edale<br />
Tennis in <strong>Bradford</strong> is administered by Yorkshire LTA which is responsible for the delivery of<br />
the LTA’s national plan at a local level, the main body of this being the Club Vision<br />
Programme. Club Vision is the LTA's strategy to provide progressive clubs with greater<br />
support and resources at both national and county level. It is an investment programme that<br />
supports not just tennis clubs but also public 'pay and play' indoor tennis centres (ITI<br />
centres), schools and local authority venues; it also helps the club and county tennis<br />
286<br />
Menston<br />
196 229<br />
289<br />
Shipley<br />
267<br />
Baildon<br />
Bradf ord<br />
<strong>Bradford</strong> South<br />
HARROGATE<br />
9<br />
<strong>Bradford</strong> North<br />
50<br />
KIRKLEES<br />
LEEDS<br />
208
development officer identify areas or projects for the club to work on and where funding or<br />
other resources may be required.<br />
The Council’s Outdoor Sports Facilities Assessment states that the existing tennis facilities<br />
are adequate to meet the demand for such facilities in the district. There is however a need<br />
for more courts at some clubs (Saltaire and Eldwick) to meet a league demand which is<br />
currently being met by hiring courts at other venues.<br />
Golf<br />
<strong>Bradford</strong> District has the following golf facilities:<br />
Table: Golf clubs in <strong>Bradford</strong><br />
Club<br />
Ownership/<br />
management Club<br />
Ownership/<br />
management<br />
Baildon Private The Manor Private<br />
Ben Rhydding Private Marriott Hollins Hall Hotel Private<br />
Bingley St. Ives Private Northcliffe Private<br />
Bracken Ghyll Private Phoenix Park Private<br />
<strong>Bradford</strong> Private Queensbury Private<br />
<strong>Bradford</strong> Moor Private Riddlesden Private<br />
Branshaw Private Shay Grange Golf Centre Local authority<br />
Clayton Private Shipley Private<br />
Fardew Private Silsden Private<br />
Headley Private South <strong>Bradford</strong> Private<br />
Ilkley Private West Bowling Private<br />
Keighley Private West <strong>Bradford</strong> Private<br />
Source: <strong>Bradford</strong> Open Space, Sports and Recreation <strong>Study</strong> (2006)<br />
According to the Outdoor Sports Facilities Assessment (2006) it appears that the existing golf<br />
facilities can accommodate the demand in the district. However, the ongoing golf<br />
development work (e.g. golf being introduced as an extra curricular activity in schools in<br />
<strong>Bradford</strong> through the school sport partnerships) may potentially increase demand in the short<br />
to longer term. Although only a few municipal courses provide affordable opportunities for<br />
young people/beginners to play regularly, there is potential for many of those clubs to<br />
develop junior activities and make courses/membership more accessible to young people.<br />
Most clubs also have good access for non-members.<br />
209
Figure : Golf courses and driving ranges in <strong>Bradford</strong><br />
PENDLE<br />
CRAVEN<br />
CALDERDALE<br />
Keighley<br />
Shipley<br />
<strong>Bradford</strong> West<br />
<strong>Bradford</strong><br />
South<br />
<strong>Bradford</strong><br />
North<br />
KIRKLEES<br />
Source: <strong>Bradford</strong> Open Space, Sports and Recreation <strong>Study</strong> (2006)<br />
7<br />
1319<br />
6.9.8 Sports Centres and recreation facilities<br />
22<br />
4<br />
10<br />
3<br />
11<br />
12<br />
21<br />
18<br />
8<br />
2<br />
16<br />
20<br />
1<br />
5<br />
15<br />
6<br />
17<br />
9<br />
HARROGATE<br />
The current community strategy of the district is economy-led but it realises that sustainable<br />
regeneration must go hand-in-hand with environmental improvements and real progress on<br />
other issues such as education, sports, health, citizenship and community safety. The council<br />
has recently commissioned a comprehensive and independent review of district wide Sports<br />
and Recreation Facilities 64 with an aim to produce a plan to establish strategies and policies<br />
to protect, enhance and provide facilities in response to shortfalls or over provision, both now<br />
and up to 2018. The report has identified the existing provision of sports and recreation<br />
facilities across the district and highlighted the key issues faced by this sector.<br />
In terms of existing provision the District contains a wide array of gyms, swimming pools and<br />
health clubs, both in private membership and publicly run facilities. The followings are the<br />
council-run Sports Centres and Swimming Pools in the <strong>Bradford</strong> District:<br />
• Baildon Recreation Centre, Green Lane, Baildon, BD17 5JH<br />
• Bingley Pool, Myrtle Place, Bingley, BD16 2LF<br />
• Bowling Pool, Flockton Road, <strong>Bradford</strong>, BD4 7RY<br />
• Doe Park Water Activities Centre, Foster Park View, Denholme, BD13 4LN<br />
• Eccleshill Pool, Harrogate Road, <strong>Bradford</strong>, BD10 0QE<br />
• Grange Sports Centre, Haycliffe Lane,<strong>Bradford</strong>, BD5 9ET<br />
• Greenhead Track, Greenhead Road, Utley, BD20 6ED<br />
64 BMDC (2008). Sports and Recreation Facilities Assessment. Draft Report dated February 2008.<br />
Strategic Leisure Limited.<br />
25<br />
23<br />
24<br />
14<br />
LEEDS<br />
210
• Horsfall Stadium, Cemetery Road, <strong>Bradford</strong>, BD6 1JQ<br />
• Ilkley Pool & Lido, Denton Road, Ilkley, LS29 0BZ<br />
• The Leisure Centre, Victoria Park, Keighley, BD21 3JN<br />
• Manningham Sports Centre & Pool, Carlisle Road, <strong>Bradford</strong>, BD8 8BA<br />
• Marley Activities & Coaching Centre, Aireworth Road, Keighley, BD21 4DB<br />
• Nab Wood Sports Centre, Cottingley New Road, Bingley, BD16 1TZ<br />
• Queensbury Pool, Station Road, Queensbury, BD13 1AB<br />
• Rhodesway Pool, Oaks Lane, <strong>Bradford</strong>, BD15 7RU<br />
• Richard Dunn Sports Centre, Rooley Avenue, <strong>Bradford</strong>, BD6 1EZ<br />
• Shipley Pool, Alexandra Road, Shipley, BD18 3ER<br />
• Thornton Recreation Centre, Leaventhorpe Lane, <strong>Bradford</strong>, BD13 3BH<br />
• Tong Sports Centre & Pool, Westgate Hill, <strong>Bradford</strong>, BD4 6NR<br />
Apart from the above swimming pools and sports centres there are also a number of other<br />
local facilities spread throughout the district. Some of the health and fitness centres<br />
frequently visited by the residents are listed below-<br />
• Fitness First (Westgate, <strong>Bradford</strong> / Horton Park Avenue, <strong>Bradford</strong> / Worth Way,<br />
Keighley / Victoria Road, Eccleshill)<br />
• Cannons Health Club, Cottingley New Road, Bingley<br />
• Esporta, Gallagher Leisure Park, Thornbury<br />
• Greens Health and Fitness, Fred Atkinson Way, Baildon<br />
• Workouts, Oakworth Road, Keighley<br />
• <strong>Bradford</strong> University Gym, <strong>Bradford</strong><br />
• Kents Leisure Centre, Undercliffe Road, <strong>Bradford</strong><br />
• Hi-Energy Dance, Health& Fitness Studio, Russell Street, Keighley<br />
• Streamline Fitness, Park View Mills, <strong>Bradford</strong><br />
• Planet Fitness, Buttershaw Mills, <strong>Bradford</strong><br />
• Heaton Tennis & Squash Club, Crofton Road, <strong>Bradford</strong><br />
• We are not a Gym, Unit E1, Enterprise Way, <strong>Bradford</strong><br />
• Fitness Fusion, The Grove Promenade, Ilkley<br />
• Bingley Grammar School Sports Centre, Keighley Road, Bingley<br />
Although these facilities are generally widespread across the district, there appears to be<br />
insufficient quality, fit for purpose facilities to meet the identified demand and provide<br />
opportunities to increase and improve participation in sport and physical activity. There is<br />
also an under provision of some fit for purpose facilities, particularly 25m pools across the<br />
district which is exacerbated when the issue of accessibility is taken into account. A number<br />
of facilities are located on school sites which provide for school use only and the policy for<br />
community access is limited.<br />
Sports Hall Provision is generally well provided for in quantitative terms, but there are issues<br />
with accessibility. There is a slight deficiency to meet future demand for provision. This could<br />
be met by the increased number of halls to be provided through BSF programme and by<br />
providing significant health and fitness facilities within the Amaechi Basketball Centre<br />
211
(ABC) under the Odsal Sports Village development, provided that these are available for<br />
community use and managed appropriately to maximise community accessibility.<br />
The 2 main athletics facilities in the district- Horsfall Athletics Stadium and Greenhead Track<br />
meet the current standard but there are issues with quality and size of the facilities to<br />
accommodate identified need. The new provision at Greenhead School through the BSF<br />
programme however is expected to address the quality issues.<br />
The Sports and Recreation Facilities assessment has also identified 15 synthetic turf pitches<br />
(STP) across the district (consisting of 14 full size pitches and 2 x half-size) of varying quality<br />
and access. These STPs are well distributed across the district in terms of accessibility, as<br />
indicated by the catchment areas (20 min drive). However, the majority of provision is located<br />
in <strong>Bradford</strong> West. Possible deficiency in parts of Shipley area and <strong>Bradford</strong> South for small<br />
sided games areas.<br />
6.9.9 Festivals and town centre programmes<br />
There are more than 200 festivals and events programmed to be celebrated across the<br />
district from January 2009 and December 2010. The <strong>Bradford</strong> events calendar, which could<br />
be accessed through the www.visitbradford.com website, shows a comprehensive list of all<br />
the current and future events planned for the district. This ranges from classical music<br />
concerts to film festivals celebrating bradford’s newly gained the World’s First UNESCO ‘City<br />
of Film’ status and art exhibitions to vintage car exhibitions.<br />
Most of the major events and festivals are organised throughout the summer months e.g.<br />
<strong>Bradford</strong> Mela, the Ilkley Literature Festival, the Bingley Show and <strong>Bradford</strong> city centre<br />
events. Events traditionally held in the winter months include a Victorian Fayre and a<br />
Christmas Carol Service.<br />
<strong>Bradford</strong> is also well-known for its three film festivals including the <strong>Bradford</strong> Film Festival<br />
(March), Bite the Mango (September) and the <strong>Bradford</strong> Animation Festival (November) which<br />
are organised by the National Media Museum.<br />
Other highlights include the Ilkley Summer Festival, the Saltaire Festival and Christmas<br />
events in Haworth.<br />
The events in <strong>Bradford</strong> with the highest profile include:<br />
• <strong>Bradford</strong> Mela: usually held over a weekend in July, the <strong>Bradford</strong> Mela has been running<br />
since 1989 and attracts up to 140,000 people annually. It provides an opportunity for the<br />
local community to come together to share and celebrate their culture. Events include<br />
markets, bazaars, international food stalls, art, crafts, educational ‘zones’ and traditional and<br />
contemporary music, dance and theatre.<br />
• <strong>Bradford</strong> International Film Festival: first festival was held in 1995. The event showcases<br />
classic films as well as works of new and up-coming European directors.<br />
212
• Bite the Mango: initially conceived as a showcase for Black and Asian filmmakers in Britain,<br />
it now attracts cinema from Africa, South Asia, Central America and the Far East. It<br />
showcases a mix of feature films, documentaries, shorts, masterclasses and seminars.<br />
• <strong>Bradford</strong> Animation Festival: UK’s longest running and biggest animation festival which<br />
includes talks, workshops and the annual BAF awards celebrating best in new animation<br />
from around the world.<br />
• <strong>Bradford</strong> International Market: Held in 2004 and 2006 in the city centre with stallholders<br />
from many countries and extensive entertainments. In 2006, the event is estimated to have<br />
attracted 700,000 visitors from across the region and generated revenue of over £9 million.<br />
• <strong>Bradford</strong> Classic: Vintage vehicles on display in the city centre. In 2006 it was held in<br />
Centenary Square, 120 cars were displayed and 6,000 people attended the show.<br />
• There is increasing use of the BBC Big Screen in Centenary Square to attract audiences<br />
and people downtown for example for televised concerts and opera. The Council owns the<br />
screen.<br />
6.9.10 Parks and open spaces<br />
Well designed open areas are hugely valuable in their ability to reduce social barriers,<br />
improve health and well being and generally enhance and define local areas. Poorly<br />
designed they can encourage anti social behavior, which discourages the use of the area by<br />
the wider community.<br />
There are a large number of protected informal and formal open spaces including, parks,<br />
playgrounds, recreation grounds, village greens and allotments across the District. The<br />
current replacement UDP also contains policies, which require the developers of new<br />
housing to make a contribution toward the improvement of existing spaces or the creation of<br />
new open spaces including sites for children’s play, which serve the development itself and<br />
the wider community.<br />
Some areas in the district are less well served by open space than other areas. The quantity,<br />
attractiveness and accessibility of open space, recreation and leisure facilities determine the<br />
success of the local area in terms of creating a prosperous community and in attracting new<br />
investment. There is presently little facility by the Council to secure new areas of open space<br />
unless the land is being re developed for residential use. A key issue for the emerging LDF<br />
would therefore to explore how best this issue can be resolved to ensure that a fair and<br />
equitable supply of green open areas is be delivered through the planning system.<br />
Parks<br />
The <strong>Bradford</strong> District has thirty six public parks, totalling an area of over two hundred and<br />
seventy hectares. Ten of the parks are on the English Heritage Register of Parks and<br />
213
Gardens of Special Historic Interest in England. (ADD GIS MAP SHOWING PUBLIC PARKS<br />
IN DISTRICT)<br />
Lister Park has undergone extensive refurbishment and was recently voted 'Britain's Best<br />
Park 2006' in a national competition. The park has also been awarded a Civic Trust, Green<br />
Flag award for a fifth year running, placing it among the top parks in the country.<br />
Central Park Haworth, Peel Park and Harold Park are also winners of the Prestigious Green<br />
Flag Award.<br />
Many of the parks have active 'Friends' groups, which work with the Parks and Landscape<br />
Service to care for, protect and improve their local parks.<br />
Click on park name for further details:<br />
• Bowling Park<br />
• Brackenhill Park<br />
• <strong>Bradford</strong> Moor Park<br />
• Central Park<br />
• Cliffe Castle Park<br />
• Cross Roads Park<br />
• Crowgill Park<br />
• Devonshire Park<br />
• Foster Park<br />
• Foxhill Park<br />
• Burley Grange Park<br />
• Greenwood Park<br />
• Harden Memorial Park<br />
• Harold Park<br />
• Horton Bank Country Park<br />
• Horton Park<br />
• Ladyhill Park<br />
• Lister Park<br />
• Littlemoor Park<br />
• Lund Park<br />
• Menston Park<br />
• Myrtle Park<br />
• Northcliffe Park<br />
• Oakworth (Holden) Park<br />
• Peel Park<br />
• Prince of Wales Park<br />
• Riverside Gardens Park<br />
• Roberts Park<br />
• Russell Hall Park<br />
• Shipley Central Park<br />
• Silsden Park<br />
• St. Ives Estate (Country Park)<br />
• Victoria Park, Clayton<br />
• Victoria Park, Keighley<br />
• Victoria Park, Oakenshaw<br />
214
• Wibsey Park<br />
• West Park, Girlington<br />
• West View Park (Darwin Gardens)<br />
The <strong>Bradford</strong> District Open Space Assessment Catchment mapping exercise 65 , based on all<br />
current provision, shows that the majority of the District is adequately provided for in terms of<br />
parks and gardens. However, there are significant catchment gaps in Addingham, Steeton,<br />
Baildon and Menston and minor catchment gaps in <strong>Bradford</strong> South and <strong>Bradford</strong> West.<br />
However, these areas may be covered by provision in neighbouring authoritiesof Craven and<br />
Leeds.<br />
Open space forests and woodlands<br />
Approximately five percent of the <strong>Bradford</strong> District is covered by woodland, some of it steep<br />
sided valleys and 'cloughs' which support remnants of the ancient Oak and Birch woodlands<br />
of the South Pennines.<br />
The Council owns and manages large areas of woodland. Some of these are listed in the<br />
Collins Guide to the most beautiful woodlands in Yorkshire and the North East including:<br />
Middleton Woods (Ilkley), Judy Woods (<strong>Bradford</strong>), St Ives Estate (Bingley)<br />
Buck Wood, Judy Woods, St Ives Estate and Northcliffe Woods have active 'Friends of'<br />
groups, who work with the service to care for and protect the woodlands.<br />
Other woodlands across the District include:<br />
Bierley Woods, Hebers Gill Wood, Black Carr Wood, Holden Park Woodland, Chellow Dene<br />
Woods, Horton Park Country Park, Crabtree Gill Woodland, Jer Wood, Crossley Wood, Low<br />
Wood (Keighley), The Dell Woodland, Midgley Wood, Elam Wood, Milner Wood, Esholt<br />
Woodland, Nailor Rough, Fairbank Wood, Northcliffe Woods, Gravel Pits Woodland,<br />
Panorama Wood, Griff Wood, Park Wood, Heaton Woods, Shipley Glen Woodland, Hirst<br />
Woods.<br />
<strong>Bradford</strong> District Open Space Assessment Catchment mapping shows mainly minor<br />
catchment gaps in the provision of natural and semi-natural greenspaces across the District.<br />
The major catchment in Burley in Wharfedale and Menston may be covered by neighbouring<br />
authority provision as they are close to the <strong>Bradford</strong> boundary with Leeds. It is interesting to<br />
note that much of the urban area of the District is adequately provided for in terms of natural<br />
and semi-natural provision.<br />
Green public realm<br />
Trees, grassed areas and verges on the public highway are mainatened by <strong>Bradford</strong> Council.<br />
65 CBMDC (2006) <strong>Bradford</strong> Open Space, Sports and Recreation <strong>Study</strong>.<br />
215
National parks<br />
A short stretch of the <strong>Bradford</strong> District Boundary near to Addingham abuts the Yorkshire<br />
Dales National Park to the north.<br />
Allotments<br />
Allotment gardening provides a wide range of benefits to communities and the<br />
environment.<br />
Apart from providing low cost food, they also provide valuable recreational opportunities<br />
involving healthy activity and social contacts. Allotments are significant to our green spaces<br />
and provide habitats for many forms of wildlife.<br />
The first legislative reforms date back to the Enclosures Act of 1845. Today, the Council has<br />
a statutory requirement to provide allotments for the public. The council manages a total of<br />
38 allotment sites across the district. There are 86 sites classified as allotments in <strong>Bradford</strong><br />
equating to 98 hectares.<br />
ADD GIS MAP SHOWING THE ALLOTMENTS IN BRADFORD DISTRICT<br />
There are 27 allotment gardens across the City of <strong>Bradford</strong>. See links below for more<br />
information:-<br />
• Abb Scott Lane Allotments<br />
• Avenue Road Allotments<br />
• Bowling Park Allotments<br />
• Bullroyd Allotments<br />
• Cecil Avenue Allotments<br />
• Chapel Lane Allotments<br />
• Common Road Allotments<br />
• Derby Road Allotments<br />
• Greengates Allotments<br />
• Harewood Street Allotments<br />
• Haycliffe Lane Allotments<br />
• Heaton Allotments<br />
• Highfield Terrace Allotments<br />
• Legrams Lane Allotments<br />
• New House Lane Allotments<br />
• Park Road Allotments<br />
• Queen's Road B Allotments<br />
• Scotchman Road Allotments<br />
• Speeton Road Allotments<br />
• Stanacre Allotments<br />
• Stanley Street Allotments<br />
• Sunny Bank Road Allotments<br />
• Top Royd Street Allotments<br />
• Undercliffe Allotments<br />
• Valley Allotments<br />
• Whetley Grove Allotments<br />
• Worthing Head Allotments<br />
The are 3 allotments across the Keighley area, listed as follows:-<br />
216
• Haworth Rec Allotments<br />
• West Lane Allotments<br />
• Woodside Road Allotments<br />
There are 8 allotments across the Shipley and Bingley area, listed as follows:-<br />
• Beck Lane Allotments<br />
• Carlton Avenue Allotments<br />
• Caroline Street Allotments<br />
• Commercial Inn Allotments<br />
• Esholt Lane Allotments<br />
• Northcliffe Allotments<br />
• Red Beck Allotments<br />
• Stanley Street Allotments<br />
The following are self administered allotments. The day to day management of these sites is<br />
the responsibility of the allotment society.<br />
• Moorside Road Allotments<br />
• Charlestown Allotments<br />
• Thompson Lane Allotments<br />
• Warren Lane Allotments<br />
Allotment sites across <strong>Bradford</strong> district are often oversubscribed. For the latest waiting lists,<br />
see link below:-<br />
http://www.bradford.gov.uk/government_politics_and_public_administration/public_administr<br />
ation/asset_management/allotments/sites_with_waiting_lists/<br />
The <strong>Bradford</strong> District Open Space Assessment has concluded that there are a number of<br />
catchment gaps in the provision of allotments across <strong>Bradford</strong>. However, neighbouring<br />
authority provision may cover some of the gaps close to the District boundary.<br />
Village greens<br />
Village greens form local additional site-based access provision within the District. Similar to<br />
common land, they provide some rights of access to the public, which may vary from place to<br />
place. There are 18 registered village greens within the District which total approximately 130<br />
acres (54 hectares).<br />
Consultation as part of the <strong>Bradford</strong> District Open Space Assessment identified that the<br />
perception is, that there is a lack of amenity greenspace in <strong>Bradford</strong>. Catchment mapping<br />
shows that there are a number of catchment gaps for this typology, particularly in the rural<br />
settlement areas. The mapping indicates that the urban area surrounding the City Centre is<br />
adequately provided for in terms of amenity open space<br />
ADD GIS AP SHOWING VILLAGE GREENS OPEN COUNTRY AND REGISTERED<br />
COMON LAND<br />
217
Open country<br />
In September 2004 a new statutory right of access to “open country” commenced in the<br />
<strong>Bradford</strong> District, introduced through Part 1 of the Countryside and Rights of Way Act 2000.<br />
This confers a right of access, on foot, to “mountain, moor, heath and downland” as defined<br />
by the Countryside Agency. In the <strong>Bradford</strong> District, some 20.8 square miles (33.5 sq.kms) of<br />
additional land was mapped as open country and subsequently opened up for walkers – over<br />
and above the existing urban commons.<br />
These new access areas include moorland areas west of the Worth Valley, such as Stanbury<br />
Moor and the moors above Airedale (Bradup, Morton, Bingley and Hawksworth Moors). They<br />
also includes smaller pockets of land such as Catstones Moor near Bingley.<br />
6.10 Key Facts<br />
• The District is generally well served with the essential community facilities e.g.<br />
schools, community centres, libraries, post offices, food stores, police stations etc,<br />
but this would need to be reviewed in the face of significant changes in demand<br />
caused by residential development.<br />
• In the more rural areas the district scores badly in terms of access to housing and<br />
services. People face geographical and wider barriers to GP surgeries,<br />
supermarkets, primary schools and post offices, as well as housing.<br />
• Educational attainments at all key stage levels remained relatively low but there<br />
were signs of improvement that contrasted with the previous declines. Unauthorised<br />
absence from district’s primary and secondary schools is still remains a big<br />
challenge for the district.<br />
• Although the district’s primary and secondary healthcare providers have achieved<br />
significant progress over the years in securing high quality health care and<br />
addressing health inequalities, there still remains some areas e.g. MRSA cases,<br />
teenage pregnancy, infant mortality which represents underperformances against<br />
national targets.<br />
• The district is adequately served by the current open space and outdoor sports<br />
facilities although certain catchment gaps still remain in some areas which are<br />
currently being met by surplus facilities located in other areas of the district.<br />
• There is an under provision of fit for purpose indoor sports/recreation facilities and<br />
they are generally of average quality with some requiring a significant level of<br />
investment to bring them up to a standard to meet the requirements of future use.<br />
• A number of sports facilities are located on school sites which provide for school use<br />
only and the policy for community access is limited.<br />
218
Sources:<br />
• The district is served by highly accessible leisure and cultural facilities which offer a<br />
wide range of services and facilities to the residents. However, the issue remains<br />
how to better integrate them to improve the viability, vitality and vibrancy of the<br />
centres they are located in particularly in the evening.<br />
• BCR (2005) Socio-Economic <strong>Baseline</strong> Report (part of NDF Technical Appendices).<br />
Report dated July 2005. Arup Consultancy.<br />
• BMDC (2004) ‘Only Connect’: A Cultural <strong>Strategy</strong> for <strong>Bradford</strong> District. Report dated<br />
March 2004. BMDC.<br />
• BMDC (2006) <strong>Bradford</strong> Open Space, Sport and Recreation <strong>Study</strong>. Report dated July<br />
2006. Knight, Kavanagh & Page (KKP).<br />
• BMDC (2007) <strong>Bradford</strong> District Sustainable Community strategy- Information pack<br />
and Fact Sheets. Policy Development Service, <strong>Bradford</strong> Council.<br />
• BMDC (2007) Open Space and Built Recreation Facilities SPD. Report dated March<br />
2007. BMDC.<br />
• BMDC (2008) <strong>Bradford</strong> District Children and Young People Needs <strong>Analysis</strong>. Report<br />
dated June 2008. BMDC.<br />
• BMDC (2008) Children and Young People’s Plan 2006 – 2009 (reviewed 2008).<br />
Report dated June 2008. BMDC.<br />
• BMDC (2008) Sports and Recreation Facilities Assessment. Draft Report dated<br />
February 2008. Strategic Leisure Limited.<br />
• Genecon (2007) BCR Performance Framework: Second Annual Update 2005/06-<br />
Final report. Report dated August 2007. Genecon Consultancy Ltd.<br />
• Regeneris (2005) <strong>Bradford</strong> Positioning Statement. Report dated May 2006.<br />
Regeneris Consulting.<br />
• West Yorkshire Fire & Rescue Service (2007) <strong>Bradford</strong> Station Action Plan 2007/08.<br />
Report dated 2007. <strong>Bradford</strong> Fire Station.<br />
• West Yorkshire Fire & Rescue Service (2009) <strong>Bradford</strong> District Action Plan 2008/11.<br />
Report dated 2009. WYFRS.<br />
219
7.0 LANDSCAPE CHARACTER AND HISTORIC ENVIRONMENT<br />
To understand <strong>Bradford</strong> District as a place it is useful to understand the physical form and<br />
the landscape character of the area and also the influence of the historic environment and<br />
the built heritage of the district. This section therefore undertakes an assessment of the<br />
existing landscape and historic environment of the district and the contribution these aspects<br />
have on the overall shaping of the area.<br />
The documents and reports that helped analyze these aspects of the District include-<br />
• Heritage at Risk register 2009 (English Heritage, 2009)<br />
• Landscape Character SPD (CBMDC, 2008)<br />
• Saltaire WHS Environmental Capacity <strong>Study</strong> (Atkins, 2006)<br />
• Conservation Area Assessments (CBMDC, 2003-2005 )<br />
• Listed Buildings at Risk Survey (CBMDC, 2001-2005)<br />
• <strong>Bradford</strong> City Centre Design Guide SPD (Urbed, 2007)<br />
• Good-Bad-Ugly: Notes on a Heritage Weekend Walk in <strong>Bradford</strong> City Centre (<strong>Bradford</strong><br />
Building Preservation Trust, 2004)<br />
• Land Ownership Schedule for <strong>Bradford</strong> City Centre (Land Aspects, 2006)<br />
• Archaeological Evaluation of the Broadway Centre Site (WYAS, 2002)<br />
• City Centre Streetscape Design Manual (BCR and CBMDC, 2006)<br />
7.1 General Overview of the District’s Natural Landscape Elements<br />
The City of <strong>Bradford</strong> <strong>Metropolitan</strong> District comprises about 370 km 2 . Only about one third of<br />
the District is built up but this area contains about 86% of the population (See Figure 1 –<br />
Settlement Map). The main population areas of <strong>Bradford</strong>, Keighley, Shipley, Bingley and<br />
Ilkley are separated by areas of agricultural land, isolated villages, areas of undeveloped<br />
moorland, woodland and parkland (See Figure1 - Landcover Map).<br />
One of the most striking features of the District is the quality of its landscape and in particular<br />
the proximity of the main urban areas to areas of high landscape value. The character of the<br />
District’s landscape is very varied, ranging from the rugged open moorland of the South<br />
Pennine uplands to rolling farmland, and open river valleys to wooded hillsides.<br />
The landscape elements of <strong>Bradford</strong> are the product of the interaction of both physical and<br />
human influences. This section of the report describes the main physical influences including<br />
topography, geology, soils, climate and biodiversity.<br />
220
Figure 1: Settlement and Landcover<br />
7.1.1 Landform<br />
The District comprises a series of escarpments of plateaux with elevations up to 455m O.D.,<br />
and a general decrease in the height of plateau in the east. The escarpments are dissected<br />
by the Rivers Aire and Wharfe and a number of smaller rivers, including <strong>Bradford</strong> Beck and<br />
the River Worth. The valley sides are commonly very steep, in contrast to the flat nature of<br />
the valley bottoms. The main urban areas and transport routes occur within the valley floor<br />
of the district. Within these urbanised areas the topography has often been altered<br />
artificially, with large areas of made ground, disturbed ground and excavation.<br />
Geographically, the area is considered to be part of the upland Pennine peneplain generally<br />
slopes eastward complicated by valley incisions, and a series of step like features marking<br />
breaks in slope.<br />
Rivers tend to flow eastwards following the actual slope of the land along major fault lines.<br />
See Figure 2 - Landform Map.<br />
221
7.1.2 Geology<br />
The bedrock is composed entirely of rocks deposited during the Upper Carboniferous period,<br />
about 315 to 310 million years ago.<br />
The south east of the District, including the main <strong>Bradford</strong> conurbation and the outlier of<br />
Baildon Moor is underlain by Coal Measures. The District is located at the northern margin<br />
of the exposed Yorkshire Coalfield.<br />
Figure 2: Landform and Geology<br />
The Coal Measures have been extensively exploited notably during the 19 th Century, not only<br />
for coal, but also for fireclay, brickclay and ironstone.<br />
Although mining of these resources in <strong>Bradford</strong> was not at the same scale as the further<br />
south in the coalfield, it has had great effect in shaping the landscape, notably in triggering<br />
adjacent industrial growth.<br />
The coal measures are underlain by the Millstone Grit, which outcrops over most of the north<br />
and west of the District and has been used extensively for building stone.<br />
222
The dominance of the Millstone Grit is not only limited to the underlying geology. Its use has<br />
shaped the whole of the landscape we see today. The rock has been mined for centuries<br />
and has provided the material for the network of dry stone walls enclosing the pasture land<br />
and for the distinctive architecture of villages, towns and cities in the district. See Figure 2 -<br />
Geology Map.<br />
The period of deposition of material to form the Millstone Grits and Coal Measurers was<br />
completed some 280 million years ago and was followed by folding of the earth’s crust. The<br />
asymmetric anticline created the upstanding mountain ridge, which, although considerably<br />
eroded, still dominates the District today.<br />
About 60% of the District is covered by drift (natural superficial) deposits, most of which are a<br />
product of glacial and post glacial activity. Boulder clay is the main glacial deposit in the<br />
District forming an extensive featureless spread, generally less than 5m in thickness. The<br />
exceptions are the Aire and Wharfe valley bottoms where thickness exceeding 50m are know<br />
to exist. Various alluvial deposits of sand and gravel are evident throughout the District, for<br />
example at Keighley in the Aire Valley where deposits are up to 17m thick. Silty sand<br />
pebbles and gravels can also been seen exposed on the riverbank of the Wharfe and have<br />
previously been exploited creating the Ben Rhydding gravel pits, now a Site of Ecological or<br />
Geological Interest (SEGI).<br />
7.1.3 Soils and Agricultural Land Classification<br />
Soils which form the final layer on the landform reflect the interaction of solid and drift<br />
geology, altitude, climate and past human land use. Generally local soils are poor and<br />
naturally acid, due to the high silica content of the parent material, lack of neutralising<br />
minerals such as lime, and due to the high rainfall. The often relatively low temperatures in<br />
the District result in slow rates of soil formation, whereas the high rainfall leaches out soluble<br />
minerals such as calcium from the soil.<br />
Thin soil tends to develop on steep slopes due to the progressive downslope creep of soils<br />
as they develop.<br />
Although areas of higher quality soils that could support arable farming are to be found in the<br />
Wharfe Valley, they are not extensive enough to be economically viable.<br />
As a result most rural land is either permanent grass for pasture, or rough pasture or<br />
moorland.<br />
Agricultural land<br />
Most of the agricultural land in <strong>Bradford</strong> consists of improved and semi-improved pastures on<br />
the upland fringes of the north-west of the District or the neutral (neither alkaline nor acidic)<br />
grasslands to the east and south of the City. Agriculture in <strong>Bradford</strong> is generally based<br />
around rearing stock, mainly sheep, although cattle rearing take place in areas along the<br />
river valleys and on the lowlands to the east of the District.<br />
223
Most of the farmland in <strong>Bradford</strong> District can be described as marginal, constrained by<br />
climate and physical topography. Nearly half of the farmland is classed as Grade 4 or 5 66 ;<br />
that is, land with severe limitations which significantly restricts the range of crops and is<br />
mainly suitable for pasture grazing. However, there are also some grade 3 lands made up of<br />
alluvial soils along the flood plains of the River Wharfe and River Aire which are more<br />
productive.<br />
Figure: <strong>Bradford</strong> agricultural land classification 67<br />
Grade 3<br />
Grade 4<br />
Grade 5<br />
An interactive map showing the agricultural land classifications within <strong>Bradford</strong> can be<br />
viewed online by clicking the link below.<br />
http://www.magic.gov.uk/website/magic/opener.htm?startTopic=maglandclass&xygridref=408<br />
406,438698&startScale=250000<br />
66 The ALC system classifies land into five grades, with Grade 3 subdivided into Subgrades 3a and<br />
3b. Grade one is best quality and Grade five is poorest quality. A number of consistent criteria used for<br />
assessment which include climate (temperature, rainfall, aspect, exposure, frost risk), site (gradient,<br />
micro-relief, flood risk) and soil (depth, structure, texture, chemicals, stoniness).<br />
67 http://www.self-willed-land.org.uk/rep_res/rur_vis_bfd.ppt<br />
224
Countryside recreation is increasingly important as a rural land use and people are visiting<br />
the countryside in increasing numbers. However, it is important to recognise the impact<br />
visitors have on the countryside and that the pressures which result need to be carefully<br />
managed in order to prevent the quality of the countryside from being diminished.<br />
7.1.4 Climate<br />
With a difference of 300m between the highest western part of the District and the low areas<br />
of the city centre, relief plays a major part in influencing local climate, affecting rainfall, the<br />
temperature and the number of hours of sunshine. <strong>Bradford</strong> has an annual rainfall of 34.15<br />
inches, an annual mean temperature of 8.8 C with 1242 hours of bright sunshine. These<br />
figures indicate a much less favourable climate especially for agriculture, than that to the east<br />
of the county in, for example, the Vale of York.<br />
The Pennines act as a climatic barrier, so that <strong>Bradford</strong> lies in the rain shadow of the upland<br />
mass and therefore benefits a lesser extent from the warming effects of the prevailing<br />
westerly winds. With a growing season defined as months over 6.1 C, <strong>Bradford</strong> has a<br />
growing season of about seven months in the lower lying areas and about six months over<br />
275m.<br />
The poor soils combined with this harsh climate restricted <strong>Bradford</strong> to small-scale, isolated<br />
agricultural settlements prior to the industrialisation of the 19 th Century.<br />
7.1.5 Biodiversity<br />
“…the diversity within habitats and ecosystems, the diversity of species and the interaction<br />
between species and their habitat…” 68<br />
The biodiversity of the <strong>Bradford</strong> District is not only varied but also contains good quality<br />
habitats and an interesting range of wildlife, including many internationally, nationally and<br />
regionally notable species of flora and funa.<br />
Of particular note are the internationally important South Pennine Moors, a Special<br />
Protection Area of nearly 21,000 hectares (of which 4489 hectares are located with in the<br />
<strong>Bradford</strong> District). This area is significant for the variety and rarity of its bird life, including the<br />
merlin and golden plover, which is supported by the diverse and extensive upland plant<br />
communities. The South Pennine Moors are also a Special Area of Conservation designated<br />
for the variety of the upland habitat mosaic.<br />
The main habitats through the <strong>Bradford</strong> District can be categorised as:-<br />
68 Source = UK Bio Diversity Action Plan: 1994<br />
225
Moorland<br />
The large areas of peat covered moorland give rise to a rich mosaic of habitats, including<br />
blanket bog, heather moors, wet heaths and ‘in-bye’ 69 land. These areas are remote and<br />
less likely to suffer from development pressure but they are fragile ecosystems and can<br />
easily be affected by pollution or changes in management brought about by declining<br />
agricultural activity.<br />
Woodland<br />
Only 4.6% of the <strong>Bradford</strong> District is covered<br />
by woodland, compared with the national<br />
average of 10%, although a large area is<br />
exposed moorland and upland, which would<br />
limit the growth of trees. Many of the<br />
woodlands are recently planted (within the<br />
last 150 years) but there are numerous<br />
examples of steep sided valleys and cloughs<br />
whose base-poor and acid soils support the<br />
remnants of ancient woodland,<br />
characterised by the oak/birch woodlands of<br />
South Pennines, many of which have an<br />
ecologically diverse ground flora.<br />
Grasslands<br />
Much of <strong>Bradford</strong>’s landscape is covered by<br />
grassland surrounded by the traditional<br />
gritstone walls. They are a mixture of<br />
improved, semi-improved and natural<br />
grasslands depending on the character of<br />
the underlying soils, the topography and<br />
management influences. Acidic grassland<br />
communities tend to be found on the exposed uplands and are generally species poor by<br />
nature. Although these are often classed as permanent pasture, many have been limed and<br />
fertilised to improve their grazing capacity; consequently, they have a greener, visually<br />
improved appearance but are ecologically poorer than the diverse meadows. The lower lying<br />
pastures in the valleys tend to be neutral short-growing grassland communities which have<br />
been improved and can be managed as short-term leys; some of these have a greater<br />
species diversity and were possibly former hay meadows. These have more interest for<br />
nature conservation and are increasingly rare. Surprisingly, <strong>Bradford</strong> has a larger proportion<br />
than Kirklees or Calderdale 70 . Wet grasslands are increasingly rare in <strong>Bradford</strong> District and<br />
69 Enclosed moorland of wet rush pasture which is also important as feeing and breeding areas for upland birds.<br />
70 <strong>Bradford</strong> Grassland Survey 1996<br />
Figure 3: Ecology and Heritage<br />
226
are often under pressure for land improvement and drainage schemes. However, they can<br />
contain a great variety of plant communities suited to damp conditions.<br />
Wetlands<br />
The characteristic landform of the <strong>Bradford</strong> District has been carved as a result of the Ice<br />
Age, with glacial overflow channels and cloughs (steep sided tributary valleys) forming the<br />
frameworks for the water collection from the uplands. Many of these overflow channels now<br />
form valuable wetlands. Numerous reservoirs also collect water from the uplands which are<br />
not only an important water catchments area but these water bodies and the surrounding<br />
wetlands also provide important wintering and breeding habitats for the wide variety of<br />
wildfowl and waders. Small streams, springs and wet flushes slow from the uplands into the<br />
Rivers Worth, Aire and Wharfe. The Leeds and Liverpool Canal also acts as a valuable<br />
wildlife corridor across the District and a network of neglected mill ponds – a legacy of<br />
<strong>Bradford</strong>’s industrial heritage – have been re-colonised by amphibians. In addition there are<br />
a few fragments of lowland raised mire, which are ecologically valuable but fragile and<br />
threatened habitats.<br />
Wildlife<br />
<strong>Bradford</strong> District contains a wide variety of wildlife, according to the range of habitats. In<br />
particular, have healthy populations of deer and badger. The deer numbers are increasing<br />
and are generally migrating from the north towards Calderdale in the south west and also<br />
east along the Leeds and Liverpool Canal 71 , badgers are also well presented throughout the<br />
District and successfully protected against persecution. A range of bird species can be found<br />
in all habitats throughout, especially on the moorlands, as stated above. Bats are found in<br />
roosting sites such as trees, buildings (old and new), old parkland and bridges, especially<br />
over rivers. Amphibians and reptiles, however, are limited to the common species; great<br />
crested newts are unknown in the <strong>Bradford</strong> area. West Yorkshire was the northern limit for<br />
some butterflies and insects, however with global warming some species have increased<br />
their range northwards and the loss of diverse grasslands generally will have a long-term<br />
effect on these populations, with subsequent consequences throughout the ecosystem as a<br />
whole.<br />
Biodiversity Assets<br />
There are 4 levels of designated nature conservation sites within <strong>Bradford</strong> District. In<br />
addition to the 4 SSSIs, there are 21 Sites of Ecological or Geological Importance and 16<br />
Regionally Important Geological / Geomorphological Sites (RIGS). One of these SSSIs, the<br />
South Pennine Moors, represented by Rombalds Moor and Haworth Moor has been<br />
designated a Special Protection Area (SPA) due to the importance of its breeding bird<br />
populations. It is also a Special Area of Conservation (SAC), under the European Habitats<br />
Directive because it contains habitats which are rare or threatened within a European<br />
71 <strong>Bradford</strong> Deer Survey 1996<br />
227
context. There are also 152 sites of local nature conservation value, designated for both<br />
biodiversity interest and community benefits.<br />
Table 1: Biodiversity Asset<br />
Designation No Area/Details<br />
Special Protection Area (SPA) SPA 1 No 4489 ha – South Pennine Moors<br />
Special Area of Conservation (SAC) SAC 1 No 4489 ha – South Pennine Moors<br />
South Pennine Moors, Bingley<br />
Sites of Special Scientific Interest (SSSI) SSSI 4 No South Bog, Trench Meadows.<br />
Yeadon Brick Works<br />
Sites of Ecological/ Geological Interest<br />
(SEGI)<br />
SEGI<br />
Ecological 21 No<br />
340ha – Leeds/Liverpool Canal<br />
and River Wharfe<br />
Geological 16 No<br />
Third Tier Sites<br />
Over<br />
100 No<br />
Yet to be verified<br />
A detail assessment of the habitats and wildlife species in <strong>Bradford</strong> district is also discussed<br />
in the ‘Environment’ chapter of this baseline report.<br />
7.2 Landscape Types<br />
The landscape character spd has identified the patterns of landscape within the <strong>Bradford</strong><br />
District on two levels. At one level, the district has been broken down into ten specific,<br />
distinct, and unique landscape character areas that are all very different from each other, e.g.<br />
Airedale, Wharfedale, and Tong Valley, etc. At another, more detailed, level, it has identified<br />
areas of land very similar to each other that recur throughout the District, (and in theory<br />
throughout the country), for example moorlands, wooded valleys, and settlements. These<br />
are the generic landscape types.<br />
There are 10 different landscape types identified within the district. These are summarised<br />
below:<br />
1. Gritstone Moorland: The moorland landscape is typified<br />
by its wild open character; its uninterrupted views; its<br />
apparent, if not actual, naturalness; and by its extent and<br />
uniformity; as well as its subtlety of colour and texture.<br />
228
2. Upland Pasture: A smooth, open treeless, landscape,<br />
dominated by bold linear patters of drystone walls<br />
3. Mixed Upland Pasture: An open landscape with<br />
rectangular pasture fields enclosed by drystone walls,<br />
and having some trees. Contains a wide variety of other<br />
landscape elements, giving the landscape a much more<br />
mixed character than the upland pasture, with more<br />
human influences.<br />
4. Wooded Valley: These are narrow, linear, incised,<br />
wooded valleys cut into the landscape by the branching<br />
patters of streams. This results in a very enclosed<br />
environment where the topography has strictly governed<br />
the landcover to produce a very strong and distinctive<br />
feature in the wider landscape.<br />
5. Wooded Incline: Visually prominent blocks of mainly<br />
native broad-leaved woodland stretching along the<br />
sloping sides of <strong>Bradford</strong>’s open valleys.<br />
6. Enclosed Pasture: Enclosed pasture has a strong sense<br />
of enclosure brought about by the framework of small<br />
woods and tree groups that cross the pasture farmland.<br />
It is generally found on lower lying concave slopes of<br />
<strong>Bradford</strong>’s open valleys.<br />
229
7. Parkland: Broad open grassland dominated landscape<br />
which lacks small scale field enclosure and contains<br />
woodland and mature fields trees.<br />
8. Floodplain Pasture: A very distinct, flat, open landscape<br />
with relatively large, rectilinear fields enclosed by hedges,<br />
occupying the low-lying floodplains of <strong>Bradford</strong>’s open<br />
valleys.<br />
9. Industrial Corridor: An enclosed, low lying landscape<br />
dominated by industrial development and the corridors of<br />
transport infrastructure necessary to support it.<br />
10. Settlement: It is a very enclosed landscape, which exists<br />
where there is an area of land dominated by large<br />
numbers of mainly residential buildings, such that views<br />
within it are restricted primarily to sequences of short<br />
views contained by building groups.<br />
Source: Landscape Character SPD (CBMDC, 2008)<br />
The identification and definition of <strong>Bradford</strong>’s ten landscape types was carried out through<br />
the completion of field study forms and photographic records on site; and their subsequent<br />
analysis through discussion and debate within the study team.<br />
The Issues<br />
Some landscape types have been easier to identify than others. The Gritstone Moorland is a<br />
particularly characteristic landscape with fairly distinct boundaries. Likewise the wooded<br />
230
valleys, wooded inclines, settlements, and floodplain pastures are relatively easy to identify<br />
in the landscape because the boundaries correspond to sudden, sharp, changes in<br />
topography or landcover.<br />
However, the rest of the landscape often has very gradual, subtle, changes in landscape<br />
character, for example the pasture landscapes. These landscapes do vary dramatically, for<br />
example the pastures above Steeton are very different to those in the Tong Valley, which are<br />
very different to those between Denholme and Thornton. But the boundaries between these<br />
areas of very different character are often difficult to map because there is not strong visible<br />
boundary on the ground. This is an inherent quality of some landscapes and should inform<br />
the way that the inevitably exact lines on maps are interpreted and used in the future.<br />
Summary Table of Distinguishing Landscape Elements<br />
Table 2 was drawn up in order to provide a summary of the most easily perceivable<br />
landscape characteristics and elements that distinguish the ten different landscape types<br />
from each other.<br />
It should be understood that the purpose of this table is to show how one landscape type can<br />
be distinguished from another, and not comprehensively describe each landscape type.<br />
Consequently the list of landscape elements down the left hand side is not a comprehensive<br />
list of all the landscape elements present in every landscape type, nor are the elements<br />
weighted in importance in any way. The elements listed have been chosen simply because<br />
they are those that most easily enable a person to distinguish between the ten landscape<br />
types.<br />
231
TABLE 2: LANDSCAPE TYPES IN THE BRADFORD DISTRICT<br />
Gritstone<br />
Moorland<br />
Upland<br />
Pasture<br />
Mixed<br />
Upland<br />
Pasture<br />
Wooded<br />
Valleys<br />
Characteristics<br />
differentiating<br />
between<br />
landscape<br />
types<br />
6.2 6.3 6.4 6.5<br />
6.6<br />
6.7<br />
6.8<br />
6.9 6.10<br />
PHYSICAL FEATURES<br />
Altitude HIGH HIGH LOW LOW<br />
Landform INCISED SLOPES SLOPES FLAT<br />
Context BELOW MOOR WATER ESTATE NEAR RIVER<br />
Enclosure OPEN OPEN OPEN ENCLOSED ENCLOSED ENCLOSED ENCLOSED<br />
FIELDS<br />
Fields ● ● ○<br />
Field pattern ●<br />
Walls ●<br />
◐<br />
◐<br />
Wooded<br />
Incline<br />
◐<br />
○<br />
○ ○<br />
Hedges ○ ○<br />
Enclosed<br />
pasture<br />
Parkland<br />
● ●<br />
Fences ○ ○ ○<br />
TREE COVER<br />
Woodland<br />
Blocks<br />
Tree Clumps<br />
Isolated Trees<br />
◐<br />
◐<br />
● ●<br />
○ ○<br />
◐<br />
◐<br />
◐<br />
◐<br />
○ ○ ○ ● ○<br />
BUILDINGS<br />
Farmsteads ○ ○ ○ ○<br />
Building Groups ○ ○<br />
Detached<br />
residential<br />
○<br />
◐<br />
Settlement ●<br />
Industrial ● ○<br />
OTHER ELEMENTS<br />
Quarries ○ ○<br />
Recreation ○ ○ ○ ○<br />
Telegraph Poles ○ ○ ○ ○<br />
Pylons ○ ○ ○ ○<br />
INFRASTRUCTURE<br />
Major Roads ●<br />
◐<br />
Roads ○ ○ ○<br />
Lanes ○ ○<br />
Tracks ○ ○ ○ ○ ○<br />
Car movement ○ ○ ○<br />
◐ ◐<br />
Car parks ○ ○<br />
Traffic signs ○ ○<br />
◐<br />
Street lights ○ ○<br />
Kerbs ○ ○ ○<br />
Street furniture ○<br />
Detail ● ● ● Dominant Dominant description features features of the elements and distribution ◐ ◐ Significant Significant of each features features features of the landscape types could ○ ○ Features Features be found that that in may may the be be SPD. present<br />
present<br />
The dominance or otherwise of certain elements in each landscape type is representative of the typical state of that<br />
Detail description of the elements and distribution of each of the landscape types could be found in the SPD.<br />
○<br />
●<br />
Floodplain<br />
pasture<br />
●<br />
◐<br />
◐<br />
◐<br />
Industrial<br />
Corridor<br />
○<br />
◐<br />
232<br />
Settlement<br />
6.11<br />
○<br />
●<br />
◐
7.3 Landscape Character Areas<br />
The landscape of the <strong>Bradford</strong> District has been broadly influenced by its physical<br />
characteristics such as geology, soils and climate (especially glaciation) and subsequent<br />
modification by man in terms of land use.<br />
The Joint Countryside Commission/English Nature ‘Character Map of England’ subdivides<br />
the District into three main character areas:<br />
36 South Pennines<br />
37 Yorkshire Southern Pennine Fringe<br />
38 Nottinghamshire, Derbyshire and Yorkshire Coalfield<br />
A small area in the north of the District lies within the YORKSHIRE DALES Character Area<br />
21, but has limited influence on the landscape character of the <strong>Bradford</strong> District.<br />
Southern Pennines<br />
This area lies between the Peak<br />
District National Park and the<br />
Yorkshire Dales National Park. A<br />
sweeping landscape of upland moor<br />
and pasture, over 7 million people<br />
live within 1 hours drive of the South<br />
Pennines and the demands for<br />
transport, mineral extraction, power<br />
transmission and generation, urban<br />
encroachment, recreation sport and<br />
tourism have shaped the character<br />
accordingly. The heavily populated<br />
valleys contrast with the marginal<br />
economic viability of the uplands<br />
where the dual economy of part-time<br />
FIGURE 4: CHARACTER AREAS<br />
farming subsidised by other<br />
occupations prevails. Sheep grazing<br />
and small dairy/beef herds are the<br />
main agricultural occupations;<br />
stonewalls and small fields reflect<br />
the fluctuating moorland/grassland<br />
fringe. The moorland plateau gives<br />
extensive views over the lower lying<br />
towns, which reduces the sense of<br />
isolation. Whilst the quarries and<br />
vertical elements such as wind<br />
turbines, transmitter masts and<br />
pylons are often prominent and detract from landscape quality, there are also a strong<br />
industrial heritage of buildings and other remnants of the wool and cotton industries.<br />
233
Yorkshire Southern Pennine Fringe<br />
This character area represents the transition of the Pennine Uplands to the lower undulating<br />
landscape of the Nottinghamshire, Derbyshire and Yorkshire Coalfield, characterised by<br />
gritstone industrial settlements in the valleys surrounded by pastoral agriculture in the<br />
foothills. The gritstone buildings and stone walls of the pastures give a visual unity to the<br />
landscape. Mills, factories and towns associated with the main transport routes lie in the<br />
valley bottoms. Tall mill chimneys and terraces are packed into the valley bottoms and rise<br />
up the hillside. Pylons and masts are prominent on the skylines. The industrial archaeology<br />
gives the area a strong historical character and visual identity.<br />
Nottinghamshire Derbyshire and Yorkshire Coalfield<br />
This is a large area of densely settled countryside embracing major industrial towns. It has<br />
a low lying, rolling landform with escarpments and broad valley resulting from sloping<br />
alternate bands of wet shales and dry sandstones. This area is dominated by extensive<br />
urban influences and rapid expansion of industry, settlement and transport networks.<br />
Likewise the rural areas suffer from urban fringe influences and the resulting landscape is<br />
downgraded – the soils are relatively poor and the graded pastures are bounded by a<br />
mixture of walls, occasional hedgerows and post and wire fencing. ‘Horticulture’ is a popular<br />
activity among the complex mosaic of land uses, ribbon development and transport route<br />
dominated landscape. Broad-leaved woodlands, often large and fragmented, are relatively<br />
common.<br />
The Countryside Commission’s character areas have been determined at a national level<br />
and are therefore broad-brush descriptions of large areas of countryside. The boundaries<br />
between theses are not distinct and often occur gradually over several kilometres.<br />
The Landscape Character SPD however, has defined the character of <strong>Bradford</strong> in more<br />
detail at a local scale by subdividing the district into 10 Character Areas on the basis of their<br />
overall characteristics and the recurring pattern of landscape elements contained within<br />
them. These are:<br />
1) Airedale<br />
2) Esholt<br />
3) Pennine Upland<br />
4) Rombalds Ridge<br />
5) South <strong>Bradford</strong><br />
6) Thornton/Queensbury<br />
7) Tong Valley<br />
8) Wharfedale<br />
9) Wilsden<br />
10) Worth and North Beck Valleys<br />
See Figure 4 - Character Areas Map<br />
234
These Landscape Character Areas are defined on a geographical basis and named<br />
according to local terminology for ease of identification and recognition by a wide range of<br />
people.<br />
Of the ten areas, two correspond to the major broad, deep, glacial river valleys of the AIRE<br />
and WHARFE, running parallel to each other approximately NW-SE, separated by a third<br />
character area of higher land in between forming the ROMBALD’S RIDGE and connecting<br />
Baildon Moor to Ilkley Moor and beyond towards Grassington and the Yorkshire Dales. The<br />
settled and industrialised wooded valleys contrast with the open empty windswept moorland<br />
and sparsely settled farmland of the Rombald’s Ridge. Airedale is extensively develop yet<br />
retains a strong though fragmented green character with its wooded slopes and remnants of<br />
pastoral agriculture on the valley sides. The settlements in Wharfedale have well defined<br />
edges with substantial woodlands and tree cover giving the valley a more enclosed and ‘lush’<br />
character.<br />
Three smaller character areas lie immediately next to <strong>Bradford</strong>’s urban core. These areas<br />
are ESHOLT, TONG VALLEY and SOUTH BRADFORD. They all show more common links<br />
to the Coal Measurers character area in the complexity of their elements and more urbanised<br />
influences, with low lying, rolling landform and fragmented woodland cover.<br />
The four remaining character areas are all pasture dominated landscapes with typical stone<br />
wall boundaries overlooked by bleak windswept moorland on higher exposed land, affording<br />
long views and intersected by small intimate wooded valleys or cloughs. THE WORTH and<br />
NORTH BECK VALLEYS character area has a stepped profile with valley bottoms crowded<br />
with settlement and a patchwork of pastures on the upper slopes. It is surrounded to the NW<br />
and SW by the PENNINE UPLAND character area of high unenclosed moorland, isolated<br />
farmsteads, a treeless landscape with high nature conservation value where resources<br />
exploitation such as mineral extraction wind and water power generation and recreation have<br />
left their mark on the landscape. The WILSDEN and THORNTON/QUEENSBURY character<br />
areas, although similar in that they contain small/medium villages within a farmed landscape<br />
sloping to the east, are dominated by urban/sub-urban influences. Differences in landform,<br />
altitude and layout however do occur to make them distinct. The Wilsden character area is<br />
more domesticated, with improved enclosed pastures, smaller villages and more woodland<br />
cover.<br />
The area covered excludes the urban core of <strong>Bradford</strong> City Centre, Shipley, Keighley and<br />
Ilkley. It also excludes all ‘inset’ areas defined as ‘urban’ or ‘village’ in the rUDP. It is<br />
intended that these areas will be the subjects of settlement studies at some future date.<br />
Detailed description and analysis of the landscape of each character area along with a<br />
succinct set of policy guidelines for each landscape type is to be found in the Landscape<br />
Character SPD.<br />
235
7.4 Policy Context- Landscape<br />
Planning Policy Statement 1: Delivering Sustainable Development seeks to protect and<br />
enhance the quality, character and amenity value of the countryside and urban areas as a<br />
whole. Protection should be given to those areas that have been recognised for their<br />
landscape value. Planning Policy Statement 7: Sustainable Development in Rural Areas<br />
encourages local authorities to maintain or extend local landscape designations to protect<br />
areas from unsustainable development and to also enhance local distinctiveness of the areas<br />
and preserve the intrinsic qualities of the countryside.<br />
The Regional Spatial <strong>Strategy</strong> (RSS) for the Yorkshire and the Humber region (adopted May<br />
2008) provides the Regional Planning Policy context. This Plan will be used as material<br />
consideration within the Planning process. The Plan maintains the need for Local Authorities<br />
to recognise and protect the distinctive landscape character of the region. Policies LCR1 (C,<br />
1, 5) and ENV 10 within the Plan should be referred too.<br />
Other Framework<br />
The Standing Conference of South Pennine Authorities (SCOSPA) published a regional<br />
based Landscape Assessment, Landscape Guidelines and Countryside Design Summary for<br />
the South Pennines, which include the majority of <strong>Bradford</strong>’s non-urban areas. In addition,<br />
SCOSPA has also prepared an Integrated Management <strong>Strategy</strong> and Conservation Action<br />
Plan for the South Pennine Moors SPA, which emphasises the conservation importance of<br />
the moorland landscape.<br />
The Forest of <strong>Bradford</strong> Initiative and the Woodland <strong>Strategy</strong> (1992) aim to undertake<br />
strategic measures to increase general tree cover with the District and guide appropriate<br />
areas for action.<br />
7.5 Built Heritage and Historic Environment<br />
<strong>Bradford</strong>’s District is a rich and diverse historic environment. It consists of the following<br />
elements which, when viewed as an entity, form the essential characteristics of local<br />
distinctiveness and environmental identity. These elements are highly valued today, for the<br />
positive contribution they make to the quality of the environment as well as for the benefits to<br />
the economy and tourism in particular.<br />
7.5.1 Policy Context- Historic Environment<br />
PPS1: Delivering Sustainable Development, PPG15: Planning and the Historic Environment<br />
and PPG16: Archaeology and Planning promote good design and the protection and<br />
enhancement of the historic environment. The RSS states that ‘the heritage resource makes<br />
a very important contribution to the Region’s distinctive character, identity and sense of<br />
place; it also greatly adds to the quality of life of residents, and in particular the local and<br />
regional economy’. Policy ENV9 states:-<br />
236
‘The region will safeguard and enhance the historic environment, and ensure that historical<br />
context informs future development and regeneration. All development strategies, plans,<br />
programmes and decisions in the Region will conserve distinctive elements of the historic<br />
environment and enhance local character and distinctiveness ……..’<br />
Relevant heritage priority areas identified are industrial landscapes, housing areas and civic<br />
buildings, especially in West and South Yorkshire.<br />
The RSS identifies as an issue the vulnerability of the heritage resource to decay and<br />
deterioration and the impact of poor design nearby. There is a need to recognise the<br />
benefits of the heritage resource to the local and regional economy and ensure new<br />
development adds to this, rather than detracts from it. This is especially important in terms of<br />
providing a sense of place in urban areas. The RUDP contains a range of policies seeking to<br />
protect <strong>Bradford</strong> District’s rich and diverse built heritage and historic environment.<br />
One of the key principles in PPS1: Delivering Sustainable Development is that planning<br />
policies should promote high quality inclusive design in the layout of new developments and<br />
individual buildings in terms of function and impact, not just for the short term but over the<br />
lifetime of the development. Design which fails to take the opportunities available for<br />
improving the character and quality of an area should not be accepted. It also states that<br />
‘good design should contribute positively to making places better for people’. An objective<br />
that is reinforced by the Commission for Architecture and the Built Environment (CABE) in its<br />
guide ‘By Design’. ‘Good design is essential if we are to produce attractive, high-quality,<br />
sustainable places in which people will want to live, work and relax.’<br />
7.5.2 Listed Buildings<br />
<strong>Bradford</strong> has over 5800 buildings, listed by the Secretary of State as being of special<br />
architectural or historic interest. These range from large industrial mill complexes to<br />
weaver’s cottages; and from agricultural farmsteads to stately halls and manor houses.<br />
These buildings of architectural and historic interest make a vital contribution to the heritage<br />
character and attractiveness of the District.<br />
Those buildings of the greatest historical or architectural value, listed grade I and II* form a<br />
fraction of the total. In <strong>Bradford</strong> district buildings of this status comprise less than a third of<br />
the national average, hence the need to ensure that the elements which contribute towards<br />
their special character are safeguarded. Examples include Upper Headley Hall, Thornton<br />
with its courtyard walling, entrance gateway and aisled barn and the church of All Saints,<br />
Bingley. (National percentage grade I 2.5% City of <strong>Bradford</strong> area 0.34% national percentage<br />
grade II* 5.2% City of <strong>Bradford</strong> 1.6%)<br />
The first listed building survey was carried out from 1993 to 1995; this systematically<br />
surveyed all listed buildings in the district using the standard procedure. Recently the Council<br />
have completed a re-survey (2001-2005) of all the buildings to highlight changes since the<br />
previous survey (1993-1995). Whilst many listed buildings are reviewed regularly, especially<br />
if in a critical condition, or a subject of ongoing discussions, the district wide survey indicates<br />
237
if the number of buildings at risk is decreasing, identifies any new buildings at risk and shows<br />
any patterns of problem buildings or areas, which may need different approaches.<br />
Current indications show that some 300 buildings and structures were identified as being ‘at<br />
risk’ or vulnerable. This information has since helped the Council identify priorities, targets<br />
efforts or resources and try to reduce the numbers.<br />
Description of all the Listed Buildings in <strong>Bradford</strong> could be found in the following weblink-<br />
http://www.bradford.gov.uk/the_environment/planning_service/heritage_and_conservation/lis<br />
ted_building_descriptions.htm<br />
There is also an online register of <strong>Bradford</strong>’s Listed Buildings at Risk which could be<br />
accessed from this link-<br />
http://www.bradford.gov.uk/the_environment/planning_service/heritage_and_conservation/on<br />
line_register.htm<br />
7.5.3 Conservation Areas<br />
The District currently has 57 designated Conservation Areas, which vary from Victorian<br />
suburbs such as Little Horton Lane representing the 19 th century growth of <strong>Bradford</strong>, to the<br />
historic linear upland villages such as Stanbury. The periodic re-assessment of boundaries<br />
and consideration of additional areas ensures the relevance of the designations remain valid.<br />
The process of character assessment and boundary review was carried out between 2001<br />
and 2005. This has resulted in there being a Conservation Area Assessment document for<br />
each of the 59 conservation areas in the district.<br />
The list of links below lead to the conservation area assessment document and the current<br />
boundary map for each conservation area.<br />
• Addingham<br />
• Apsley Crescent<br />
• Baildon<br />
• Baildon, Station Road<br />
• Ben Rhydding<br />
• Bingley<br />
• Braithwaite<br />
• Brunthwaite<br />
• Burley in Wharfedale<br />
• Cathedral Precinct<br />
• City Centre<br />
• Clayton<br />
• Cullingworth<br />
• Devonshire Park and Cliffe Castle<br />
• East Morton<br />
• Eldon Place<br />
• Little Germany<br />
• Little Horton Green<br />
• Little Horton Lane<br />
• Little London<br />
• Low Utley<br />
• Lower Wyke<br />
• Menston<br />
• Micklethwaite<br />
• Middleton<br />
• North Park Road<br />
• Oakworth<br />
• Oxenhope Lower Town<br />
• Oxenhope Station Road<br />
• Oxenhope Upper Town<br />
• Queensbury<br />
• Ryecroft<br />
238
• Esholt<br />
• Goitside<br />
• Goose Eye and Laycock<br />
• Great Horton<br />
• Hainworth<br />
• Haworth<br />
• Heaton Estates<br />
• Hodgson Fold<br />
• Idle and the Green<br />
• Ilkley<br />
• Keighley Town Centre<br />
• Leeds Liverpool Canal<br />
• Leeming<br />
Potential Conservation Areas<br />
• Saltaire<br />
• Silsden<br />
• Southfield Square<br />
• St Paul's<br />
• Stanbury<br />
• Steeton<br />
• Thornton<br />
• Tong<br />
• Undercliffe Cemetery<br />
• Whetley Grove<br />
• Wilsden<br />
• Wrose<br />
Residents, Councillors and organisations have contacted the Council and have suggested<br />
that, in their opinion, new conservation areas should be designated in certain localities. The<br />
Council’s Conservation Team has assessed these suggested areas in order to determine<br />
whether all or any of them would be recommended for conservation area designation.<br />
The areas which have been considered for potential conservation area designation are listed<br />
in the table below. After undertaking detail field surveys and following a period of public<br />
consultation in each area the Conservation Team has reported their findings to Area<br />
Planning Panels and Area Committees and recommended that only two of the areas, Baildon<br />
Green and Eldwick Beck, are appropriate characteristics to be designated as Conservation<br />
Areas.<br />
Table: Areas with Potential Conservation Area Reports Completed<br />
• Ambler Thorn<br />
• Apperley Bridge<br />
• Baildon Bank<br />
• Baildon Green<br />
• Beechcliffe<br />
• Burley Woodhead<br />
• Carr Syke<br />
• Charlestown, Baildon<br />
• Damems<br />
• Eldwick Beck<br />
• Greenholme<br />
• Hawksbridge<br />
• Heaton Village<br />
• Ingrow<br />
• Keighley Station<br />
• Marsh<br />
• Marsh Top<br />
• Moor Side<br />
• Mountain<br />
• Oakworth Station<br />
• Plevna Terrace, Bingley<br />
• Thackley<br />
• The Brow<br />
239
7.5.4 World Heritage Site<br />
The District has a World Heritage Site<br />
identified by UNESCO as having worldwide<br />
significance in association with the<br />
textile trade and the industrial revolution.<br />
UNESCO inscribed Saltaire as a World<br />
Heritage Site on 16 th December 2001. It is<br />
one of 27 in the United Kingdom.<br />
Developed from the 1850’s and still an<br />
almost complete model village, Saltaire<br />
illustrates the combination of industrial<br />
processes and transport systems, the use<br />
of power and the early concepts of Town<br />
Planning with provision of model housing<br />
and social amenities. All of these factors<br />
are unified by dignified architectural<br />
detailing, the use of local materials and<br />
technological advances which illustrate a<br />
significant stage in human history and<br />
contribute to make the site of outstanding<br />
universal value.<br />
Figure 5: Cultural Heritage<br />
Today, its textile mills, public buildings and<br />
workers' housing continue to operate as a living and working community. It is the duty of the<br />
international community as a whole, to co-operate in its protection. Saltaire has a<br />
Management Plan in place to direct this function. Recently an Environmental Capacity<br />
<strong>Study</strong> 72 has been carried out for the site in order to gain an appreciation of the level and type<br />
of change that can be accommodated within the World Heritage Site and its setting. The<br />
study also provides a mechanism to allow for positive change to take place, whilst putting<br />
management arrangements in place to monitor the impact of change and prevent change<br />
that exceeds the environmental capacity of the Site. This included addressing a range of<br />
pressures and demands facing the Site due its location in a strategic corridor e.g. traffic and<br />
transport issues, the need for economic and social regeneration and the maintenance of a<br />
high quality of life for residents.<br />
The ECS has identified 8 key capacity issues which could affect the Site’s Key Values now or<br />
in the future and employed a “monitor and manage” approach founded on a series of<br />
Capacity Indicators. The indicators measure changes in data through time and trigger action<br />
when thresholds are exceeded. This ranges from the need for further analysis and<br />
monitoring through to possible physical actions such as the provision of more car parking<br />
spaces in the area.<br />
72 Atkins (2008) Saltaire World Heritage Site Environmental Capacity <strong>Study</strong>. Atkins Heritage, Leeds.<br />
240
The ECS also includes a timetable for the ongoing monitoring of the Site. This has been<br />
established over a rolling 6-yearly programme to tie-in with the UNESCO periodic review<br />
process. This is not however a static document and will continue to be reviewed and<br />
developed over the coming years as new challenges and issues emerge at the Site.<br />
The ECS will play a significant role in the development of a revised WHS Management Plan<br />
for the Site. It will also inform a number of other emerging strategies including a tourism<br />
strategy and planning documentation within the Local Development Framework (LDF). The<br />
indicators identified by the ECS may be used as part of the annual monitoring report on the<br />
LDF and the accompanying Sustainability Appraisal.<br />
7.5.5 Parks and Gardens<br />
There are 13 sites within the District that are included in the Register of Parks and Gardens<br />
of Special Historic Interest in England designated by English Heritage. This is a reflection of<br />
the fact that the urban areas of <strong>Bradford</strong> are well provided with Victorian municipal parks.<br />
The historic layouts, planting and the structures generally survive to indicate the original form<br />
of the parks and gardens. Examples of notable significance include <strong>Bradford</strong>’s ‘city of the<br />
dead’ at Undercliffe Cemetery and the private grounds at Heathcote, Ilkley.<br />
Table: English Heritage Register of Parks and Gardens of Special Historic Interest in <strong>Bradford</strong><br />
Name Grade Date Registered<br />
1) Bowling Park, <strong>Bradford</strong> II 02 Apr 2001<br />
2) Central Park, Haworth II 13 Nov 2002<br />
3) Horton Park, <strong>Bradford</strong> II 02 Apr 2001<br />
4) Lister Park II 01 Dec 1984<br />
5) Lund Park, Keighley II 02 Apr 2001<br />
6) Peel Park, <strong>Bradford</strong> II 02 Apr 2001<br />
7) Prince Of Wales Park, Bingley II 14 Mar 2001<br />
8) Roberts Park, Shipley II 01 Dec 1984<br />
9) Heathcote, Ilkley II 12 Jan 1984<br />
10) Whinburn, Keighley II 02 Sep 2002<br />
11) St Ives Estate, Harden II 28 Apr 2009<br />
12) Scholemoor Cemetery II 09 Jan 2002<br />
13) Undercliffe Cemetery II 20 Jul 1998<br />
Source: English Heritage<br />
Further details about each of the above historic parks and gardens can be found on the<br />
Council’s Leisure and Culture website below-<br />
http://www.bradford.gov.uk/leisure_and_culture/parks_and_gardens/parks_and_gardens.htm<br />
The District also contains four recognised Local Historic Parks and Gardens. These sites are<br />
of local interest, (not included on the national register) which display evidence of designated<br />
landscapes that are of local interest and any proposals, which affect the site or setting,<br />
should demonstrate a clear understanding of the original design and layout.<br />
241
Table: Local Historic Parks and Gardens<br />
1) Bierley Hall Wood, <strong>Bradford</strong><br />
2) Heber’s Ghyll, Ilkley<br />
3) Cliffe Castle and Devonshire Park, Keighley<br />
4) Milnerfield, Gilstead<br />
Source: <strong>Bradford</strong> rUDP<br />
7.5.6 Scheduled Ancient Monuments<br />
<strong>Bradford</strong> <strong>Metropolitan</strong> District has 202 scheduled monuments that range from the site of the<br />
Roman Fort at Ilkley to prehistoric earthworks and the unique concentration of carved stones<br />
on Ilkley Moor. The vast majority of the monuments are located in the north of the district.<br />
7.5.7 Historical Battlefields<br />
The Register of Historic Battlefields in England is compiled and maintained by English<br />
Heritage. The inclusion of a site on this Register brings with it no additional statutory controls,<br />
but it is a material consideration when determining planning applications in the area.<br />
The historic interest of a battlefield is judged by the documentary evidence that is available to<br />
pin point the site and the surviving physical features, such as the topography and<br />
archaeological evidence. <strong>Bradford</strong> <strong>Metropolitan</strong> District has one historic battlefield included<br />
on the Register: Adwalton Moor 1643 which extends into the districts of Kirklees and Leeds.<br />
Adwalton Moor 1643 - gave the Royalists control of the North of England for the remainder of<br />
that year. It was second only in significance to Marston Moor in the history of the Civil Wars<br />
in the North. The battlefield landscape of 1643 was one of hedge-lined fields on the lower<br />
242
slopes and moorland with coal pits, some of which can still be identified today. The<br />
encroachment of development especially the railway, road and built developments over the<br />
last 150 years has dramatically altered the character of the battlefield by changes to the<br />
landscape. Nevertheless many elements of the landscape of the time of the battle remain<br />
such that it is still possible to trace the various phases of the conflict and to interpret the<br />
progress of the battle.<br />
Further detail about the historic battlefield can be found from the web links below-<br />
http://www.bradford.gov.uk/NR/rdonlyres/181CA68E-AA97-476E-B4C1-<br />
35172A5A759C/0/battle_of_adwalton_moor.pdf<br />
And http://www.english-heritage.org.uk/upload/pdf/Adwalton.pdf<br />
7.5.8 Heritage at risk<br />
The English Heritage publishes annual ‘Heritage at Risk Register’ which identifies historic<br />
assets that are in danger of losing their significance across the Yorkshire and Humber<br />
region. Recent reports (2009 to 2011) have summarised that while the condition of the<br />
region’s historic assets has improved over the years, generally they are facing slightly<br />
greater levels of risk than nationally, and highlighted the scale of the challenge and the<br />
resources needed for their enhancement and protection, both at a national and local level.<br />
Figure: Heritage at risk in Yorkshire and the Humber<br />
Source: Heritage at Risk Register (English Heritage, 2011)<br />
243
According to the latest 2011 ‘Heritage at Risk’ report a total of 41 heritage sites, monuments<br />
and buildings are currently deemed ‘at risk’ in the <strong>Bradford</strong> District. Nine new sites have<br />
been added since 2009 assessment- an extra three conservation areas and six places of<br />
worship.<br />
Table: ‘At Risk’ Heritage Assets in <strong>Bradford</strong><br />
Buildings 4<br />
Places of worship 6<br />
Scheduled monuments 19<br />
Registered parks and gardens 1<br />
Registered battlefield 1 (stretches into Leeds and Kirklees)<br />
Conservation areas 10<br />
Source: Heritage At Risk Register ( English Heritage, 2011)<br />
The number of ‘at risk’ conservation areas is particularly high in the District compared to any<br />
other Local Authority area in Yorkshire and Humber. The mills listed above are particularly<br />
vulnerable because they lack interests from developers and remain largely empty.<br />
The Battle of Adwalton Moor battlefield is also in the English Heritage’s register. It is judged<br />
to be of a generally satisfactory condition but is said to be declining.<br />
7.5.9 Archaeology<br />
<strong>Bradford</strong> District contains a large number of significant archaeological sites, some of which<br />
are of international interest and many of which are of national or high regional importance.<br />
<strong>Bradford</strong> District falls into three land-use zones: upland, lowland and townscape. The upland<br />
zone comprises unenclosed moorland and enclosed rough pasture. The lowland zone<br />
roughly follows the lines of the area’s watercourses and comprises improved enclosed<br />
pasture and other agricultural land, centred around scattered farmsteads. The townscape<br />
zone consists of all intensively settled land.<br />
The Upland Zone: The little-disturbed upland landscape retains a large number of<br />
Prehistoric (Middle Stone Age to Iron Age) features. Many of the upstanding remains are<br />
designated as Scheduled Ancient Monuments. Known features include hundreds of carved<br />
rocks on the moorland above Ilkley, Keighley and Baildon. Other Prehistoric funerary/ritual<br />
sites survive here and elsewhere in the District. Settlement sites are also represented by a<br />
number of well-preserved earthworks. There are probably similar sites which now lack<br />
above-ground remains. <strong>Bradford</strong> District was crossed by a network of Roman roads, the true<br />
routes of which are not yet known in most instances. Currently unknown Roman sites may<br />
survive along the road lines. Medieval settlement in the uplands was scattered in small,<br />
dispersed settlements or farmsteads rather than discreet nucleated villages. Upstanding farm<br />
buildings, apparently of 18th- or 19th-century date, may have Medieval origins. Redundant<br />
farm buildings have been little studied, and represent a finite and diminishing building stock<br />
of archaeological interest. From the Medieval period onward, mineral deposits in the uplands<br />
have been extensively exploited, and well-preserved associated remains survive.<br />
244
The Lowland Zone: The lowlands also appear to contain Prehistoric settlement remains.<br />
Large finds of worked flint along the Aire corridor suggest the presence of Middle and New<br />
Stone Age campsites, while a few known Prehistoric settlements, numerous spotfinds of<br />
Bronze Age metalwork, and scattered Roman finds indicate that occupation continued into<br />
later periods. Most Medieval settlement took the form found in the uplands. A small number<br />
of sites were administrative centres for the surrounding area, and here a number of fine Late<br />
Medieval and Post-Medieval houses survive which may have associated below-ground<br />
remains. The site of a Medieval convent survives at Esholt and a number of granges (small<br />
agricultural/industrial sites owned by the Medieval church) survive in the District. Wellpreserved<br />
industrial sites survive, including iron-working sites, pottery kilns and corn mills.<br />
Some Medieval settlement sites evolved over into prominent private estates after the mid-<br />
17th century. These were often furnished with significant landscaped grounds. Early waterpowered<br />
industrial sites were also redeveloped in the 18th century and later. Many of the<br />
District’s numerous textile mills retain late 18th/early 19th century features or contain<br />
evidence for the development of technology over the course of the 19th/20th centuries.<br />
Townscape Zone: Most of the evidence for Roman occupation in <strong>Bradford</strong> District roughly<br />
coincides with the areas of modern settlement, with occupation along the Wharfe valley (the<br />
Roman fort and associated civilian settlement at Ilkley), through Bingley and into central<br />
<strong>Bradford</strong>. Occupation continued into the Early Medieval phase, with Anglo-Saxon remains<br />
apparently surviving within Addingham, Ilkley, and central <strong>Bradford</strong>. With a few exceptions<br />
(Keighley; Addingham, where a number of small settlement foci merged to form a single<br />
settlement; Bingley, where the available evidence suggests the possible presence of a<br />
castle; Ilkley, where settlement formed around the area of the Roman fort; <strong>Bradford</strong>, where<br />
settlement formed at a crossing point of <strong>Bradford</strong> Beck), Medieval settlement consisted of<br />
small, dispersed building groups lying along a network of roads and access tracks.<br />
Industrialisation and population growth during the 19th century led to ribbon development on<br />
these road lines which enveloped pre-existing settlements. This type of development can be<br />
traced in areas where the Late Medieval and Post-Medieval building stock survives and<br />
forms a settlement ‘core’. In areas such as central <strong>Bradford</strong> where the ‘core’ of earlier<br />
buildings has not survived, the modern building stock may mask below-ground Medieval and<br />
Post-Medieval remains. Recent work in urban centres has made it clear that the effect of<br />
19th/20th century cellarage on the below-ground archaeology has not been as severe as<br />
formerly believed, and that appreciable pockets of early material may survive in situ.<br />
<strong>Bradford</strong>’s current replacement UDP aims to protect three categories of archaeological<br />
areas, identified by the West Yorkshire Archaeology Advisory Services (WYAAS), which are<br />
registered in the County Sites and Monuments Record. These are:<br />
Class I -Class I areas are sites and landscapes of national importance which are protected<br />
as Scheduled Ancient Monuments under the terms of the Ancient Monuments and<br />
Archaeological Areas Act 1979.<br />
Class II and Class III- Class II areas are sites and landscapes which are regionally important<br />
but unscheduled, and which merit preservation in situ. Class III areas are sites registered in<br />
the County Sites and Monuments Records as containing or likely to contain remains of<br />
245
archaeological importance. The locations and extent of all Archaeological Areas are shown<br />
on the County Sites and Monuments Record.<br />
Archaeological significance is not confined solely to below-ground remains but may be also<br />
assigned to any or all structures on a site. Where a Class II or Class III archaeological area is<br />
adversely affected by a development proposal, the current rUDP requires an archaeological<br />
evaluation is to be undertaken to assist in determining the importance of the archaeological<br />
remains and the appropriate course of action.<br />
Up until now most of the existing knowledge about <strong>Bradford</strong>’s past has come from written<br />
records and surviving maps. A historical map surviving from the 1720s, as well as<br />
descriptions from earlier records, was the only sources to provide an impression of <strong>Bradford</strong><br />
as it might have appeared at the end of the Middle Ages:<br />
Map 03 : <strong>Bradford</strong> City Centre c1720<br />
Although <strong>Bradford</strong> was a bustling place in medieval times its earlier layout was almost<br />
completely masked by the city's dramatic growth in the 19th century. Even its main<br />
watercourse, the <strong>Bradford</strong> Beck, together with the 'broad ford' which is widely regarded to<br />
have given the settlement its name, is hidden beneath today's streets and buildings.<br />
The demolition of the 1960s buildings and an archaeological evaluation undertaken by the<br />
WYAS in the Forster Square Area was the first of its kind in <strong>Bradford</strong> city Centre and it<br />
discovered historical evidences about the streets in 17th and 18th century <strong>Bradford</strong> and the<br />
industrial activities around the site. The archaeologists excavated an area between Forster<br />
Square and Cheapside near the site of the bridge which replaced the ford. Beneath the<br />
modern cables and piping, and even the remains of a 19th century pub, traces of what are<br />
probably 16 th century buildings were discovered. Smaller finds included coins, pottery, clay<br />
tobacco pipes, a bone spoon and a bone toothbrush. Remains of buildings with some hint of<br />
some industrial processes going on down by the beck, a good water source there for<br />
246
industrial activity, were also found. It was the earliest archaeological evidence found in<br />
<strong>Bradford</strong> 73 .<br />
Earlier, in 2000 a desk-based assessment of the same site was carried out by WYAS. 74<br />
Several artefacts (mostly coins) were found in the area date to the Romano-British period<br />
suggesting the possibility of an early settlement in the vicinity of the city centre. In addition, a<br />
possible late Roman/early Saxon empty stone coffin was found near Leeds road. The<br />
presence of early medieval settlement, suggested by documentary evidence, is supported by<br />
the presence of Anglo-Saxon masonry within the cathedral walls.<br />
By the 14 th century the town centre was flourishing with buildings erected surrounding the<br />
cathedral. Documentary evidence shows that the occupied area extended from Berkerend in<br />
the east towards Kirkgate and Westgate in the west. During the post-medieval period<br />
<strong>Bradford</strong> city centre was affected by a dramatic increase in wealth and population caused by<br />
the growth of the textile industry. This lead to the expansion of the town centre and also to<br />
the redevelopment of the medieval core. The current city centre therefore should contain<br />
significant medieval and post-medieval remains.<br />
The expansion and redevelopment of the town centre continued during the 19 th and 20 th<br />
centuries, possibly destroying the evidences of earlier activity. However, documentary<br />
evidence regarding the 20 th century development of the area (i.e. the extent of cellarage),<br />
combined with the results of a recent test-pitting investigation at the junction of Kirkgate and<br />
Queengate, confirm the existence of undisturbed archaeological deposits in the city centre.<br />
In summery, although the city centre has not been greatly disturbed in the past, the area is<br />
known to be of archaeological potentials that could be uncovered in the future through<br />
modern disturbances because of the huge amount of development in the city centre. The<br />
archaeological excavations in the Forster Square site were the first real field excavations in<br />
the city centre and indicate that medieval or earlier remains may still be well-preserved in<br />
small pockets in some areas within the city centre.<br />
7.6 Key Facts:<br />
• The character of the District’s landscape is very varied, ranging from the rugged<br />
open moorland of the South Pennine uplands to rolling farmland, and open river<br />
valleys to wooded hillsides. Much of our moorland and woodland provides important<br />
conservation habitats, and draws visitors who enjoy our countryside.<br />
• The landscape is, however, facing major pressures for change due, in particular, to<br />
agricultural change, diversification and increasing demand for leisure and recreation<br />
73 BBC (2008). Beneath <strong>Bradford</strong>’s Streets! [online]. BBC [cited 19 June 2008]. Accessed on:<br />
<br />
74 Keith, K. (2000). Broadway Centre, Hall Ings, <strong>Bradford</strong>, West Yorkshire: Desk-based Assesment.<br />
Unpublished WYAS report (R778, 2 vols).<br />
247
Sources:<br />
activities in the countryside. It is important that the distinctive character of the<br />
District’s landscape is conserved and enhanced and that development which occurs<br />
is sympathetic to its character.<br />
• The district enjoys a rich built heritage, including the World Heritage site of Saltaire,<br />
Little Germany, and the redeveloped Lister’s Mill site. Four of our parks have green<br />
flag status, including the award winning Lister Park.<br />
• <strong>Bradford</strong> District contains a rich and diverse historic environment which consists of<br />
elements that range from Victorian parks and buildings to historic battlefields and old<br />
cemeteries and form the essential characteristics of local distinctiveness and<br />
environmental identity. These elements are highly valued today for the positive<br />
contribution they make to the quality of the environment as well as for the benefits to<br />
the economy and tourism in particular.<br />
• Grade I and ii* listed buildings are of the greatest historical or architectural value but<br />
they form a fraction of the total heritage assets and comprise less than a third of the<br />
national average. Hence there is need to ensure that the elements which contribute<br />
towards their special character are safeguarded.<br />
• The nature of district’s conservation areas and scheduled ancient monuments varies<br />
significantly across the district and adds values to the historic landscape of the area.<br />
The number of such heritage assets at risk in <strong>Bradford</strong> is relatively low compared to<br />
other regional cities but they still need to be protected from disuse and decay as well<br />
as from pressure of new developments. Redevelopment of some of these assets<br />
e.g. residential conversion of Manningham Mills has been encouraged.<br />
• Heritage at Risk register 2009-2011 (English Heritage, 2009-2011)<br />
• Landscape Character SPD (CBMDC, 2008)<br />
• Saltaire WHS Environmental Capacity <strong>Study</strong> (Atkins, 2006)<br />
• Conservation Area Assessments (CBMDC, 2003-2005 )<br />
• Listed Buildings at Risk Survey (CBMDC, 2001-2005)<br />
• <strong>Bradford</strong> City Centre Design Guide SPD (Urbed, 2007)<br />
• Good-Bad-Ugly: Notes on a Heritage Weekend Walk in <strong>Bradford</strong> City Centre (<strong>Bradford</strong><br />
Building Preservation Trust, 2004)<br />
• Land Ownership Schedule for <strong>Bradford</strong> City Centre (Land Aspects, 2006)<br />
• Archaeological Evaluation of the Broadway Centre Site (WYAS, 2002)<br />
248
8.0 COMMERCIAL APPRAISAL<br />
The following section provides an overview of the <strong>Bradford</strong> district property market. The<br />
purpose of the overview is to provide a series an audit of <strong>Bradford</strong> districts property market<br />
and ensure future development proposals are supported by sound property market analysis<br />
and advice on retail, residential property, office, leisure and industrial (including<br />
warehousing) markets.<br />
<strong>Baseline</strong> information has been taken from a number of local and regional reports and studies<br />
including the following-<br />
• <strong>Bradford</strong> District Economic Assessment (BMDC, 2010)<br />
• Leeds City Region Development Programme (LCC, 2006)<br />
• <strong>Bradford</strong> District Retail and Leisure <strong>Study</strong> (WYG, 2008)<br />
• <strong>Bradford</strong> Strategic Housing Market Assessment (Arc4, 2009)<br />
• Yorkshire & Humber Strategic Housing Market Assessment (2008)<br />
• <strong>Bradford</strong> Employment Land Review (Arup, 2007)<br />
• <strong>Bradford</strong> Office Audit (Donaldsons, 2007)<br />
• <strong>Bradford</strong> City Centre Market Activity Report (Knight Frank, 2006-2008)<br />
• Destination <strong>Bradford</strong> Tourism Assessment & <strong>Strategy</strong> (Locum, 2008)<br />
8.1 Regional Context<br />
The current Yorkshire and Humber Regional Spatial <strong>Strategy</strong> (RSS) highlights that the main<br />
urban areas of <strong>Bradford</strong>, Dewsbury/Batley, Halifax, Huddersfield, Leeds and Wakefield would<br />
be the focus for economic and housing development in the Leeds City sub region during the<br />
plan period.<br />
The RSS has designated <strong>Bradford</strong> as a ‘Regional City’, due its scale, significance and growth<br />
potential. Policy LCR1A(3) of the RSS specifically states that: Plans strategies, investment<br />
decisions and programmes for the Leeds City Region should:<br />
“Transform the Regional City of <strong>Bradford</strong> with significantly increased growth in economic<br />
development, jobs, and homes through the renaissance of the city centre and regeneration<br />
elsewhere.”<br />
Policy LCR1 of the RSS has been designed to reflect <strong>Bradford</strong>’s status as a regional city,<br />
support <strong>Bradford</strong> as a major engine of the regional economy, improve public transport within<br />
and between regional and sub regional cities, and implement stronger demand management<br />
in relation to the strategic road network. It particularly encourages regeneration and growth in<br />
Airedale (<strong>Bradford</strong> City Centre to Skipton) and the <strong>Bradford</strong>-Leeds Corridor, to support the<br />
economic growth of both cities.<br />
Policy LCR2 promotes investment in order to support the renaissance of <strong>Bradford</strong> City<br />
Centre; provide infrastructure to support site assembly, manage flood risk and improve<br />
249
access to town centres and public transport interchanges in Airedale; and to take advantage<br />
of the close proximity of the regional cities, and deliver housing market renewal, training<br />
programmes and support site assembly in west Leeds and east <strong>Bradford</strong> and improve the<br />
quality and capacity of public transport links along the Leeds- <strong>Bradford</strong> Corridor.<br />
The RSS predicts that for the B1 office sector, <strong>Bradford</strong> would experience the highest annual<br />
employment growth followed by Leeds and Sheffield; Hull, York and Wakefield are forecast<br />
to also increase by over 2,000 jobs in the next 10 years.<br />
Manufacturing and industry is forecast to experience an overall decline in employment in<br />
Humber, but numbers employed will continue to increase in the rest of the region. The<br />
highest increases in jobs are forecast for Leeds, <strong>Bradford</strong> and Doncaster 75 .<br />
In terms of overall employment growth between 2006 and 2016 Leeds, <strong>Bradford</strong>, Sheffield<br />
and York are forecast to experience the greatest levels of growth, followed by Rotherham,<br />
Kirklees and Doncaster where employment growth for each district is forecast at over 15,000<br />
people over 10 years. Selby is forecast to experience an overall reduction in employment<br />
numbers; however growth is predicted in the retail and miscellaneous employment sectors 76 .<br />
Furthermore, employment in all Financial and Business Service (FBS) sub-sectors within the<br />
city-region grew by 75,000 from 1996, reinforcing its regional and national role. Future<br />
growth however is predicted to slow significantly in line with national trends, although<br />
<strong>Bradford</strong> is expected to raise its profile in the sector, adding 6600 jobs to Leeds 7200. The<br />
table below also indicates that five other centres each have around 18,000-22,000 jobs in the<br />
sector, with the city-region as a whole employing over 273,000. Moreover, FBS is continuing<br />
to increase its share of city-region jobs, expected to be almost 1 in 5 by 2016 77 .<br />
Employment in mainstream financial services are also expected to grow strongly in the next<br />
decade, especially in Leeds, <strong>Bradford</strong>, Calderdale and Craven 78 .<br />
It also appears that <strong>Bradford</strong> is set for the highest economic growth out of all districts within<br />
Leeds City Region, both in terms of output and employment growth.<br />
Through all economic growth projection scenarios for Leeds City Region, <strong>Bradford</strong> is forecast<br />
significant growth. The LCR Development Programme suggests that this growth will need to<br />
be accommodated through a number of changes in <strong>Bradford</strong>, mainly the addressing the lack<br />
of Grade A office accommodation and thus realising the potential of <strong>Bradford</strong> as an economic<br />
centre in Leeds City Region.<br />
75 Update of the job growth and employment land figures in Draft Regional Spatial <strong>Strategy</strong><br />
76 Update of the job growth and employment land figures in Draft Regional Spatial <strong>Strategy</strong><br />
77 Henderson. R (2006) Leeds City Region Development Programme- Appendix 2 (Financial and<br />
Business Services: Cluster and / or Catalyst). Report Dated August 2006. Leeds <strong>Metropolitan</strong><br />
University.<br />
78 Leeds City Region Development Programme – Appendix 2<br />
250
8.2 Local Context<br />
<strong>Bradford</strong> is the sixth largest city in the UK, by population size, and the fourth largest<br />
<strong>Metropolitan</strong> District in England. Population projections for the District show annual growth in<br />
the population of 4,000 per year to 2028 - making <strong>Bradford</strong> the fastest growing <strong>Metropolitan</strong><br />
District outside London.<br />
<strong>Bradford</strong> also has a relatively young population, in 2004, <strong>Bradford</strong> had the lowest average<br />
age population of all major urban areas in the North of England at 34.8 years.<br />
<strong>Bradford</strong>’s economic performance has been growing in terms of output (GVA) and number of<br />
jobs, although the rate of improvement has not matched regional or national growth. Future<br />
developments in the District including £2bn of construction work will boost economic<br />
performance, and the District is currently predicted (Source: Experian Regional Econometric<br />
Model) to have the fastest growing economy in the region over the next 10 years.<br />
<strong>Bradford</strong> retains a significant manufacturing sector (the third largest in the UK) but recent job<br />
losses in the face of global competition have strengthened the need to diversify the economic<br />
base in <strong>Bradford</strong>.<br />
Today's fastest growing employment sectors are the professional, commercial and service<br />
industries - including tourism. <strong>Bradford</strong>'s reputation as a base for high technology, scientific<br />
and computer based industries is growing, building on long traditions of innovation, skills and<br />
quality products.<br />
<strong>Bradford</strong> district has a diverse and varied employment base including retailers, major utilities,<br />
financial and business services and manufacturing. Several major companies are based in<br />
the District including Wm Morrison plc, Otto UK, Hallmark Cards UK and three of the UK’s<br />
largest financial institutions - Yorkshire Building Society, <strong>Bradford</strong> & Bingley Building Society<br />
and Provident Financial.<br />
The University of <strong>Bradford</strong> has leading national research departments in management,<br />
peace studies and archaeology, health and medical sectors and has strong links to industry<br />
and the community. The University’s School of Management is ranked 8th in Europe. In<br />
2006, the University was ranked 2nd in the UK for graduate employment.<br />
<strong>Bradford</strong> District covers 143 square miles of which around 60% is classified as rural,<br />
stretching over parts of the Airedale and Wharfedale Valleys and the Pennine Hills and<br />
Moors.<br />
<strong>Bradford</strong> has a strong cultural offer. Saltaire model village is one of only two World Heritage<br />
Sites in Yorkshire and includes the world’s largest collection of works by the artist David<br />
Hockney. Haworth and Bronte Country attracts visitors from all over the world while the<br />
National Media Museum in the city centre is the most visited museum outside London.<br />
251
<strong>Bradford</strong> does not feature as one of the current top 50 UK retail locations according to CACI<br />
2007 Retail Footprint. This demonstrates that <strong>Bradford</strong> does not have a sufficiently strong<br />
mix of the attractions to warrant a place in the top 50, which is surprising for one of the<br />
largest cities in the UK.<br />
Map: Location of Top 20 Employers in <strong>Bradford</strong> District<br />
8.3 Office Market Profile<br />
This section provides an overview of <strong>Bradford</strong>’s office market from the Employment Land<br />
Review Assessment by Arup & DTZ, focussing on the key locations and settlements.<br />
<strong>Bradford</strong> Urban Area<br />
<strong>Bradford</strong>’s office market is occupied by a variety of businesses with a wide range of needs.<br />
At present, office stock is largely secondary, in many cases refurbished, which does not meet<br />
the needs of the modern office occupier. What little high specification stock that is built, such<br />
as No.1 The Interchange, is usually occupied quickly. It is possible that local business will be<br />
more likely to occupy existing stock since they have little choice in the geographical area in<br />
which they must operate. However, if <strong>Bradford</strong> is to compete for office occupiers on a<br />
252
egional and national scale then it will need high quality office space with which to meet their<br />
needs.<br />
Achievable headline rents for high specification office units are in the region of £15 per<br />
square foot based on the two recent lettings at No.1 The Interchange. Current asking prices<br />
for the remaining space at No.1 The Interchange are £164 per m² (£15.25 per sq.ft.). This<br />
was achieved May 2005 when space was let to The Consulting Consortium and we see no<br />
reason why that figure could not be repeated in either this or another similar high quality<br />
development. Indeed we see the market going beyond this figure if a degree of critical mass<br />
is delivered. As new accommodation is delivered and the market begins to mature, the<br />
potential to re-base rentals to £172 per m² (£16 per sq.ft.) and above will be realistic. As can<br />
be seen from the recent office lettings, there is not a definitive quantity of office space that<br />
satisfies potential occupier’s desire. As such, flexible floor space which could meet a range of<br />
occupational needs would be desirable. It is the professional opinion of DTZ that grade A<br />
accommodation is delivered in the city centre, it will let. This is supported by Knight Frank’s<br />
market deliver report for <strong>Bradford</strong> City Centre. Developer interest is around large scale<br />
schemes such as those proposed at the Business Forest.<br />
Shipley, Saltaire and Baildon<br />
Occupational activity in the Shipley / Saltaire area is relatively weak, particularly for large<br />
office suites. Accommodation can remain on the market for some time, for example the<br />
Chandlers Wharf development has been on the market for approximately 4 years. The<br />
locality tends to take its market and value cues from <strong>Bradford</strong>, where rents have struggled to<br />
exceed £161.50 per sq.m (£15 per sq.ft) for grade ‘A’ space. However, the area forms one of<br />
the major regeneration successes in the region and Shipley has attracted occupiers such as<br />
Halliday Clark Architects, Robinson Design Group, Filtronc Plc and HMRC (formerly the<br />
Inland Revenue). The office market in Shipley has historically focused on converted mill<br />
properties and upper floor premises in the town centre, however new developments have<br />
been constructed which have focused on more high quality accommodation, especially on<br />
the edge of the town.<br />
The Airedale Masterplan identifies that several office schemes are proposed in the Shipley<br />
area. The Advanced Digital Institute (ADI) is a commercially-led design and development<br />
project supported by the major digital industries within the Shipley area and Yorkshire<br />
Forward. It is intended to be a national digital research resource. It is proposed that the ADI<br />
is situated on the canal front adjacent to the Shipley Interchange in order to be as accessible<br />
to the wider region as possible, however a decision on location remains to be concluded.<br />
Focussing the Shipley market at the Advanced Digital Institute will ensure a clear and<br />
definable role for the market going forward. A new college development for Shipley College<br />
will also provide new courses linking into the neighbouring creative arts, digital industries,<br />
horticulture and health care businesses. An accommodation strategy has been produced and<br />
the College are currently undertaking a site feasibility study. The proposed development of<br />
Shipley Eastern Link Road will potentially reduce traffic in the town centre and ensure that<br />
the transition between the existing employment offer and the town centre is greatly<br />
enhanced. Another factor here is that the Shipley town centre offer is very poor and<br />
253
outmoded. Redevelopment in the future will contribute to an overall improvement in image to<br />
potential occupiers making Shipley a more attractive office location.<br />
Bingley and Cross Flats<br />
Bingley is home to <strong>Bradford</strong> and Bingley Building Society HQ and as such attracts a number<br />
of spin-off businesses to the area. Much of Bingley’s supply of office premises is located on<br />
purpose built business parks and sites outside of the town centre. The rent at which this<br />
purpose built premises is let is highlighted in the table below.<br />
Table: Typical office rental values in Bingley and Cross Flatts<br />
Source: <strong>Bradford</strong> Employment Land Review (Arup, 2007)<br />
With a lack of large, deliverable sites identified within Bingley town centre itself, the<br />
Coolgardie and Bingley Auction Market sites essentially form one large development site<br />
(close to Crossflatts Railway station) which could ultimately deliver a significant quantity of<br />
office development strategically located along the A629 corridor with good rail access, and<br />
would align with the aspirations of the Airedale Masterplan.<br />
Keighley<br />
There is an extremely limited provision of office accommodation in Keighley which is perhaps<br />
surprising given that the town historically had a significant manufacturing and distribution<br />
base. Given the size of this market one would expect there to be a more significant provision<br />
of office accommodation for supporting financial and business service functions.<br />
Office accommodation is currently being marketed at Universal Mills, on the fringe of the<br />
town centre available to let on short flexible terms at competitive rents equating to £86 per<br />
sq.m (£8 psf). Self contained office accommodation is available to let on Devonshire Street<br />
on the edge of Keighley town centre close to the Airedale Shopping Centre, at a level which<br />
equates to circa £75 per sq.m (£7 psf). Surrounding occupiers are mainly professional<br />
services such as accountancy or insurance firms.<br />
Other accommodation in the town centre is on the market at rents in the region of £5 psf or<br />
on an all inclusive basis and would be suitable for professional occupiers or those seeking all<br />
inclusive rents.<br />
254
However, the majority of existing office accommodation available in the town consists of poor<br />
quality space located above retail premises or in converted, often obsolete, mill buildings. At<br />
present, we consider that developer demand is low for constructing offices in Keighley<br />
(particularly speculatively) as the likely low rental values achievable would render<br />
development unviable.<br />
Ilkley<br />
Although it is in an attractive setting and is a significant rural centre, there is limited<br />
accommodation currently available in the centre of Ilkley, especially a shortage of<br />
accommodation with large floorplates. This is in part due to competition for the provision of<br />
competing higher value uses. The majority of accommodation is available in converted<br />
terraced properties or at first floor level (space above retail shop units). Much of this<br />
accommodation is poor in quality and unlikely to be attractive to the wider market. Occupiers<br />
are mostly limited to professional services in the centre of the town with larger occupiers<br />
being historically attracted to nearby larger settlements of <strong>Bradford</strong>, Skipton, Keighley or<br />
Shipley. Local business start ups therefore have a relatively poor choice of space in the town<br />
and attracting small businesses from outside of the town is subsequently difficult.<br />
Because of the lack of maturity in the office market, prevailing rental values are considered to<br />
be low and currently would make development of new offices unviable. Developers are<br />
unlikely to build any quantum of offices speculatively (or otherwise) in the town without<br />
funding or without also providing other uses (ie. residential) to cross-subsidise the build costs<br />
as part of a mixed use scheme.<br />
8.4 Industrial Market Profile<br />
This section provides an overview of <strong>Bradford</strong>’s industrial and warehousing market from the<br />
Employment Land Review Assessment by Arup & DTZ, focussing on the key locations and<br />
settlements.<br />
<strong>Bradford</strong> Urban Area<br />
Very little of <strong>Bradford</strong>’s industrial and warehousing stock is considered to be new build (built<br />
in the past 5 years) and in addition in 2006 there was no reported new space completed.<br />
Current availability of premises was estimated to be 256,000 m² by the end of 2006 (<strong>Bradford</strong><br />
District Council), compared to a peak of 343,650 m² as at end of 1993. Availability is<br />
currently 5% of total stock compared to a North & Scotland average of 7.1%. The number of<br />
vacant premises has remained relatively constant over the last year whereas nationally the<br />
number of vacancies grew by around 3.7% on average.<br />
Around a quarter of all demand has been for units of 2,323 – 4,646 sq.m (25,000 to 50,000<br />
sq.ft).There is also a significant amount of industrial development in the pipeline (with<br />
planning permission or proposed).<br />
Top rents in <strong>Bradford</strong> for industrial space were reported to be £54 per m² (£5.00 per sq.ft.) at<br />
the end of 2006 and have remained relatively stable over the last year although rents in the<br />
North & Scotland have risen by approximately 1%. Historically industrial premises have been<br />
255
slightly cheaper on average than the rest of the North & Scotland and considerably cheaper<br />
than the national average. This is illustrated in the table below.<br />
Table: Prime Industrial Rents (£ per sq.ft.)<br />
Source: <strong>Bradford</strong> Employment Land Review (Arup, 2007)<br />
<strong>Bradford</strong> Urban Area needs to focus on delivering high quality industrial sites in the best<br />
locations. The M606 corridor provides the greatest opportunity to provide accommodation<br />
that will meet the needs of the modern industrial and logistics market. In addition, these<br />
areas should seek to capitalise on the proximity to the M62.<br />
On the western side of the city the existing allocations, save for those which allow for the<br />
expansion of existing occupiers, are largely redundant in terms of ability to deliver modern<br />
occupational accommodation.<br />
Bowling Back Lane offers an opportunity to contain heavy industrial and traditional<br />
manufacturing uses in one area, specifically the area bounded by Sticker Lane, Wakefield<br />
Road and the <strong>Bradford</strong>-Leeds Railway Line.<br />
Shipley<br />
Industrial accommodation in Shipley is focused around a select number of business parks<br />
and Industrial Estates as well as smaller older units in and around the town. Rental values<br />
range from around £45 per sq.m. (£4.25 per sq.ft) for newer premises to £43 per sq.m. (£4<br />
per sq.ft.) for more traditional industrial premises.<br />
The development of the Shipley Eastern Link Road may unlock development potential. The<br />
Dockfields Area currently contains a diverse mix of printing, plastics, engineering and digital<br />
firms. With this in mind, the intention is to build on these successful businesses by<br />
reintroducing research, development and business incubator facilities to Shipley. As part of<br />
the reopening of the waterfront of the Leeds <strong>Bradford</strong> Canal, the Dockfield Road area would<br />
be part of a mixed use waterfront development, creating a business park around Carnaud<br />
Metal Box. This would enable essential business relocations within Shipley and encourage<br />
inward investment.<br />
256
The ELR by Arup considers that current demand for industrial premises in Shipley is<br />
reasonably good, the level of future demand for industrial premises may be linked to the<br />
success of the Digital cluster (depending on the future success of the proposed Advanced<br />
Digital Institute) and the spin out requirements for light assembly and high value added<br />
manufacturing uses.<br />
It is difficult to see however, how such uses could be differentiated to the proposed use /<br />
occupier profile for Bingley Technology Park. Depending upon the success of the ADI. The<br />
ELR by Arup recommends that the Council is flexible in its approach to granting planning<br />
consents at the park so as not to preclude other types of uses, should such demand come<br />
forward.<br />
Should the Shipley Eastern Link Road proceed, it is recommended that a masterplan of the<br />
Dockfield Road area be drawn up to identify key development opportunities in this part of the<br />
town as a result of the road scheme.<br />
Bingley<br />
Industrial premises in the centre of Bingley town centre are mainly focused around converted<br />
mill buildings and small stone built workshop premises. In addition to this, a number of small<br />
business / industrial parks are dispersed around the fringe of the town, with newly developed<br />
estates situated slightly further a field such as Castlefields Industrial Estate. Single storey<br />
warehouse units are currently available within the estate and are being marketed at £43 per<br />
sq.m (£4 psf).<br />
Castlefields Industrial Estate is the only significant site at present, which has recently gone<br />
through a major overhall with the reprovision of a number of units to a modern specification.<br />
Once these new units have been taken up and the remaining land fully developed out the<br />
only location in Bingley capable of delivering any quantum of accommodation is the<br />
Coolgardie Farm site. Situated on the frontage of the old A650 and bounded by the railway to<br />
the north, this site located on the western edge of Bingley, we see this as the key location for<br />
future development.<br />
The aspiration to deliver a Technology Park is realistic however we would not want to see all<br />
of the available land here restricted to specific sector’s as this may impact the expansion of<br />
other indigenous companies in the town.<br />
Keighley<br />
Demand for industrial premises is strong with many high tech manufacturing and precision<br />
engineering businesses relocating to newly developed premises in the Keighley area. The<br />
area has a multitude of industrial accommodation from light industrial units to high quality<br />
warehouse / distribution premises. There are many other small clusters of industrial<br />
properties throughout the town centre and fringe as well as a number of light industrial<br />
estates offering single storey units.<br />
257
Demand for small-to-medium units is particularly strong (units from around to 232 to 929<br />
sq.m. or 2,500 to 10,000 sq.ft.) whilst there is also a good level of demand for slightly larger<br />
units (above 929 sq.m. or 10,000 sq.ft.). From our discussions with local agents it has been<br />
stated anecdotally that industrial take up in the town could be around 55,750 sq.m. (600,000<br />
sq.ft.) per annum.<br />
Rents vary widely according to location and specification of industrial premises (as<br />
demonstrated in table 4.3 below) and a wide variety of accommodation is currently available<br />
on the market. Many of the units available are suited to a wide variety of occupiers and there<br />
is much scope for the expansion of business, the introduction of new businesses or business<br />
relocations within the Keighley area.<br />
Table: Typical industrial rental values in Keighley<br />
Source: <strong>Bradford</strong> Employment Land Review (Arup, 2007)<br />
This said, demand in the town is predominantly for freehold premises – the Trafalgar Park<br />
scheme at Lawkholme Lane for instance currently has nine out of the ten of the units under<br />
offer on a freehold rather than a leasehold basis. Freehold values are approximately £1,000<br />
per sq.m. (£95 per sq.ft.) for units up to around 929 sq.m. (10,000 sq.ft.) and around £800<br />
per sq.m. (£75 per sq.ft.) for larger units sizes. Development land in Keighley is likely to<br />
achieve up to around £1.25M per hectare (£500,000 per acre).<br />
Industrial land in Keighley has developed sporadically and primarily around the bespoke<br />
requirements of specific occupiers over a substantial time horizon. There is evidence of<br />
some new build development in the town which has been relatively successful; however<br />
Keighley has a substantial amount of poor, second hand stock which is located throughout<br />
the town and which is now vacant and in disrepair and or struggling to let well having been<br />
refurbished to a low quality standard. It appears that there is simply too much second hand<br />
258
stock on the market and not enough modern accommodation. If new accommodation were to<br />
be delivered, it is likely to be successful, particularly if targeted towards the freehold market.<br />
Ilkley<br />
Ilkley has a limited market for industrial development with most existing provision catering for<br />
indigenous local demand. Whilst there will be a requirement for further land in the future, this<br />
should be restricted to the remaining allocations. The recycling of existing sites as they come<br />
to the end of their useful economic life will therefore, become increasingly important over<br />
time. This puts a greater emphasis on the need to defend such sites from pressure from<br />
developers to deliver higher values uses.<br />
8.5 Retail Profile<br />
This section provides an overview of the Retail Profile of <strong>Bradford</strong> district from the Retail &<br />
Leisure <strong>Study</strong> produced by White Young Green on behalf of the Council.<br />
<strong>Bradford</strong> Districts Catchment<br />
By analysing the survey results of the market share achieved by all convenience goods<br />
facilities in the district, approximately 74.5% of convenience goods expenditure was retained<br />
in 2007. Accordingly less than a quarter of convenience goods expenditure generated in the<br />
study area were lost to competing centres outside <strong>Bradford</strong> District.<br />
Table 1: Market Share of <strong>Bradford</strong> District (2007)<br />
Source: <strong>Bradford</strong> District Retail and Leisure <strong>Study</strong> (WYG, 2008)<br />
259
In terms of comparison goods, existing facilities within the district retain 59.6% of comparison<br />
goods expenditure generated by residents within the study area. Whilst the market share<br />
achieved for comparison goods shopping is less than that achieved by convenience goods<br />
shopping, this lower market share is understandable given the strength of the major centres<br />
of Leeds, Huddersfield and other out of centre developments.<br />
With forecast growth in convenience shopping predicted at +1.0% per annum after 2007, it is<br />
estimated that <strong>Bradford</strong> will experience an increase in convenience goods expenditure within<br />
the District of some £243.7m between 2007 and 2022 at current market share. In contrast,<br />
the significant increase identified in expenditure on comparison goods would suggest that<br />
<strong>Bradford</strong>’s market share would capture a further £1,573.4m between 2007 and 2022.<br />
<strong>Bradford</strong> City Centre<br />
<strong>Bradford</strong> City Centre was identified as being of regional significance. The defined shopping<br />
area contains 473 retail outlets which together occupy 98,730sq m of retail floorspace. The<br />
study found that a proportion of convenience provision within the City Centre was limited.<br />
Conversely, the study found that the comparison goods sector was the most significant in<br />
terms of floorspace, accounting for 53% of the total retail floorspace in the centre. In addition,<br />
the study found that the centre benefited from a significant range of civic and cultural<br />
services in and around the City Centre which added to the diversity of the city. It is important<br />
to note that the total amount of retail floorspace in the City Centre has actually dropped by<br />
approximately 100,000sq m between the 2001 and 2007 period. This can be attributed to the<br />
demolition of a number of retail outlets in the Broadway and Petergate area to help facilitate<br />
the new and proposed Broadway Shopping Centre redevelopment. The study found that<br />
given the historic nature of the City Centre, it was dominated by a number of small retail<br />
outlets, not necessarily conducive to modern retail practices. In addition, GOAD identified<br />
that <strong>Bradford</strong> contained an above average representation of vacant outlets, many of which<br />
were of poor quality. The high proportion of small vacant outlets indicates that these may be<br />
unsuitable to the demands of modern retailing. However, it is noted that vacancies in the City<br />
Centre have actually declined since 2001, which is a positive sign for the vitality of the<br />
centre.<br />
The study found that despite prime Zone A rents in the City Centre being relatively high, they<br />
have remained unchanged since 2000, whilst other competing centres in the sub-region have<br />
witnessed increases in their prime Zone A rents. Following discussions with local agents,<br />
WYG found that whilst there was strong demand for representation in the City Centre, there<br />
was a lack of suitable, high quality retail outlets to meet that demand. Local agents however,<br />
found that <strong>Bradford</strong> benefited from affordable rents, acceptable terms, a readily available<br />
workforce, and good public transport infrastructure. In addition, yields in <strong>Bradford</strong> have fallen<br />
in recent years, indicating improvements to investor confidence in the City Centre.<br />
<strong>Bradford</strong> contains some 65% of the top 20 national high street retailers (as identified by<br />
Focus 2007). In addition to this, there is a significant demand recorded by retailers seeking<br />
representation in the City Centre where some 72 retailers sought up to 138,236sq m (gross)<br />
of new retail floorspace. Accessibility to the City Centre is good and with the largest<br />
proportion of visitors interviewed on the In-Street Survey having arrived in the City centre by<br />
260
us, mini-bus or coach. However, those that drove in to the City Centre did not encounter<br />
any difficulty in obtaining a car parking space.<br />
In conclusion, whilst <strong>Bradford</strong> can be seen to provide a strong comparison goods offer which<br />
is also enhanced by its leisure destination, its future growth will be restricted unless new high<br />
quality large retail outlets can be brought in the City Centre. The Broadway shopping<br />
development should deliver these, although the inactivity on the site has led to a significant<br />
decline in retail floorspace that has not been replaced. Furthermore, as noted by agents,<br />
many retailers are currently refraining from investing in the centre until development is<br />
complete, which is actually stifling investment. Once the development is completed, careful<br />
management will be required to ensure that the whole of the centre benefits from the<br />
development and to ensure that the Kirkgate and Oastler Shopping Centres remain important<br />
retail destinations.<br />
Keighley Town Centre<br />
Keighley is the second largest town in the district after <strong>Bradford</strong> and contains 76,690sq m of<br />
retail floorspace. Due to its somewhat isolated location in the North West of the district, it is a<br />
self-contained centre with a dedicated catchment. The representation of both comparison<br />
and convenience goods floorspace is above the national average, whilst retail service,<br />
leisure service and financial and business service floorspace are all below the national<br />
average. In the convenience sector, the town is anchored by a Sainsburys foodstore on<br />
Cavendish Street and a Morrisons foodstore on Worth Way. Comparison retailers are<br />
focused on the purpose built Airedale Centre and Cavendish Retail Park. The Town Centre<br />
contains a mixture of national multiples and independent traders, and includes a permanent<br />
indoor market.<br />
In terms of outlet sizes in Keighley, the Town Centre is dominated by small outlets, whereby<br />
57% of total floorspace is dominated by units under 93sq m. This is compared to a national<br />
average of 39%. The proportion of vacant outlets represents 15% of the total amount, which<br />
is above the national average of 10%. However, the proportion of vacant floorspace (7%) is<br />
below the national average (9%). This demonstrates the high number of small outlets that<br />
are currently vacant which are not suitable for the requirements of modern retailers.<br />
The study found that only half of the top 20 national high street retailers (as defined by<br />
FOCUS) are in the Town Centre. At October 2007 FOCUS found that a total of 21<br />
requirements were recorded by retailers seeking representation in the Town Centre. In total,<br />
these collectively had a requirement for 20,026sq m of new retail floorspace.<br />
In June 2006 prime Zone A rents in Keighley were recorded at £861 per sq m. This was<br />
found to be lower than nearby centres of Halifax and Harrogate. However, rents have<br />
increased by some 45% since 1998. Yields in the centre are falling indicating improvements<br />
to investor confidence.<br />
Keighley is a somewhat unique centre in that it has a lower catchment base due to its<br />
distance from other competing centres. It is identified by agents that the threat of an<br />
improved retail offer in competing centres such as <strong>Bradford</strong> is likely to be minimal. The<br />
261
centre show signs of strong vitality and viability. However, there are a number of indicators to<br />
suggest that there are key issues which will need to be addressed in the forthcoming Local<br />
Development Framework (LDF). Consequently the key challenge for Keighley in the future<br />
will be to ensure that sufficient retail and leisure developments are brought forward which will<br />
help cater for the needs of shoppers who use the centre. Lastly, the issue of the high amount<br />
of small vacant outlets will need to be addressed.<br />
Ilkley Town Centre<br />
Ilkley contains 37,380sq m of retail floorspace, making it the third largest retail destination in<br />
the district. Convenience retail floorspace is above the national average and this sector is<br />
anchored by a Tesco foodstore and a Booths foodstore. Comparison retail floorspace is<br />
below the national average although the study found that the town centre had an adequate<br />
supply. The centre contains a variety of specialist comparison traders which is dominated by<br />
independent traders. The proportion of retail service and financial and business service<br />
floorspace is above the national average, with the proportion of leisure service floorspace<br />
being lower than the national average. The study found that the majority of retail outlets in<br />
Ilkley are small in nature (under 93 sq m), although these units will appeal to the independent<br />
retail sector. The study found that there are currently 18 retailers who are seeking<br />
representation in Ilkley Town Centre. This represents a combined floorspace of 11,823sq m<br />
gross. Ilkley is well provided for in terms of its train and bus services, with regular<br />
connections to <strong>Bradford</strong> and Leeds, amongst other destinations. The centre is also well<br />
positioned to take advantage of the A65 road.<br />
A major concern identified by local traders was the inadequacy of customer car parking,<br />
which was a barrier to trading performance. Ilkley benefits from a safe and pleasant shopping<br />
environment for pedestrians. Half of the shoppers felt that the accessibility to Ilkley was<br />
‘better’ or ‘much better’ than the accessibility to other shopping centres. The environmental<br />
quality of the Town Centre was good, with well maintained retail units and high quality public<br />
realm.<br />
The study found that Ilkley is clearly a healthy, vital and viable Town Centre. The high<br />
proportion of good quality independent retailers adds to the diversity and the unique range of<br />
goods and services on offer in the town. In terms of the future of the centre, the study found<br />
that it will be necessary to balance the delivery of new retail floorspace to ensure that it<br />
retains/improves its market share, whilst at the same time preserving the good quality<br />
environment and independent/specialist nature of the businesses that it currently contains.<br />
Shipley Town Centre<br />
Shipley was found to have 38,800 sq m of retail floorspace. The Town Centre is dominated<br />
by the large-format ASDA superstore off Manor Road which offers a range of comparison<br />
and convenience goods. The centre contains a permanent indoor market, as well as an<br />
outdoor market in the Market Square. This is held three times a week. The study found that<br />
the proportion of convenience, retail service and financial and business service floorspace is<br />
above the national average, whilst the proportion of comparison and leisure service<br />
floorspace is below the national average.<br />
262
Similar to other Town Centres in the district, Shipley is dominated by small outlets of less<br />
than 93 sq m. Vacancies in the Town Centre are above the national average with respect to<br />
both the proportion of floorspace and the proportion of outlets that they occupy. Many of<br />
these outlets are noted to be of poor quality, which detract from the overall quality of the<br />
environment. The study also found that vacancies in the Town Centre had actually increased<br />
between 2001 and 2006. The centre only contains five of the top twenty national high street<br />
retailers including Boots, Woolworths, Argos, Superdrug and Wilkinsons. Yields in the centre<br />
have remained largely static over the past ten years, although they have fallen marginally<br />
from 9.5% in October 1996 to 8.5% in January 2007.<br />
Shipley has a centrally located bus station that provides good services to the local area<br />
including Leeds, <strong>Bradford</strong>, Harrogate, and Keighley. A train station is located within close<br />
proximity of the Town Centre and provides direct services to Leeds and <strong>Bradford</strong> every thirty<br />
minutes. The Town Centre benefits from a number of car parks, although the largest of these<br />
(Ivar Way multi-storey and Manor Road), are both located adjacent to the ASDA foodstore.<br />
There is limited parking elsewhere in the town centre which is well linked to the other retailing<br />
core. Pedestrian movement around the centre is not impeded; however bus movements can<br />
create some conflict<br />
Shipley is predominantly a destination for convenience shopping, dominated by the ASDA<br />
and retail markets. The centre does show signs of vitality and viability, however there are a<br />
number of indicators which suggest that the centre is vulnerable. The future of the Town<br />
Centre will require diversification of Town Centre retail uses and make it a more attractive<br />
retail destination. This could be achieved by improving the quality of the indoor markets to<br />
provide a quality retail offer, and also environmental improvements would help to increase<br />
the attractiveness of the Town Centre.<br />
Bingley Town Centre<br />
Bingley is the smallest Town Centre with only 15,940 sq m of retail floorspace. The study<br />
found that Bingley has a limited shopping function and performs a role providing for the day<br />
to day needs of the local population. The study found that the proportion of both comparison<br />
and convenience floorspace is below the national average, whilst the proportion of leisure<br />
service, retail service and financial and business service floorspace are all above the national<br />
average.<br />
Bingley is dominated by small retail outlets of less than 93 sq m. These represent 62% of all<br />
outlets compared to a national average of 39%. The only large-format retail accommodation<br />
in Bingley is situated in the Myrtle Walk Shopping Centre. The centre has a high number of<br />
vacancies with both the proportion of vacant floorspace and vacant outlets being above the<br />
national average. However, the study found that vacancies in the Town Centre had declined<br />
since 2001. Many of these vacancies are found in the Myrtle Walk Shopping Centre which<br />
itself is poorly lit and of a poor environmental quality. However, this is earmarked for potential<br />
redevelopment.<br />
The centre benefits from good accessibility on foot with pedestrian movement around the<br />
centre being unproblematic. The Town Centre contains a centrally located train station with<br />
263
services to Skipton, Keighley, <strong>Bradford</strong> and Leeds. The centre benefits from a large amount<br />
of off-street car parking. The Town Centre is currently being redeveloped with a new Town<br />
Centre Square which will provide a number of environmental enhancements and<br />
improvements to Main Street.<br />
In conclusion, Bingley was found to be a healthy centre performing a role as a service centre.<br />
The major issue that the centre faces is the poor quality of the Myrtle Walk Shopping Centre<br />
which detracts form the town’s environmental quality and does not provide an attractive<br />
shopping environment. However, the ongoing redevelopment of Main Street and the Town<br />
Square are positive signs for the centre which will be beneficial for the future of Bingley.<br />
Retail Market Share<br />
Based on the current market shares for all existing facilities within the district (which includes<br />
town centres, district centres, local centres, freestanding stores etc.), WYG’s analysis<br />
indicates that existing facilities in the district have a convenience goods turnover of some<br />
£641.8m in 2007. In addition, £9.6m (or 1.5%) of convenience goods expenditure is also<br />
captured from outside the <strong>Study</strong> Area (otherwise classed as ‘inflow’). WYG has estimated the<br />
‘benchmark’ turnover of existing facilities in <strong>Bradford</strong> District based on published trading<br />
information. WYG estimate that all facilities have a benchmark convenience goods turnover<br />
of £548.9m.<br />
The study indicates that convenience goods facilities in <strong>Bradford</strong> appear to be overtrading by<br />
approximately £102.5m in 2007, primarily due to the overtrading of the WM Morrisons store<br />
in Keighley. This overtrading is set to increase to £157.7m by 2012 and to £307.3m by 2022.<br />
The results show that there is an immediate capacity within <strong>Bradford</strong> District as a whole for<br />
additional convenience goods floorspace of between 8,565 sq m (net) and 20,507 sq m (net).<br />
However, this is dependent upon the end operator and type of development. In respect of<br />
comparison goods capacity, our analysis identifies that in 2007 existing facilities within the<br />
district have a comparison goods turnover of approximately £1,046m. This equates to a<br />
market share of 59.6%. The district benefits from some £16.5m (or 2.5%) derived from<br />
inflow from outside the study area.<br />
Based on its current market share, <strong>Bradford</strong> District is identified to have a capacity for almost<br />
£288.8m of additional comparison goods expenditure that will be made available for new<br />
retail floorspace by 2012. By 2022, this surplus comparison goods expenditure will rise to<br />
more than £1.34bn.<br />
Set out below is a summary of the comparison and convenience goods capacity both within<br />
the main Town Centres in the district, including, <strong>Bradford</strong> City Centre; Ilkley Town Centre;<br />
Bingley Town Centre; Shipley Town Centre; and Keighley Town Centre.<br />
264
Table: Summary of the Main Centres (2007)<br />
Notes: 1 - Floorspace derived from Experian Goad for <strong>Bradford</strong>, Keighley, Bingley, Shipley, Ilkley and WYG for all<br />
District Centres. Floorspace figure for *<strong>Bradford</strong> excludes the Tesco store at Peel Centre.<br />
2 - Catchment and market share derived from Household Survey (2006) based on <strong>Study</strong> Area only<br />
3 - Assumes constant market share for each centre<br />
Source: <strong>Bradford</strong> District Retail and Leisure <strong>Study</strong> (WYG, 2008)<br />
Based on current performance of the main town and district centres, Keighley was identified<br />
to be the strongest convenience goods retail destination. <strong>Bradford</strong> City Centre is identified to<br />
provide the most important comparison goods destination, but has a weak convenience<br />
goods function. The results also show that some of the defined District Centres (Mayo<br />
Avenue, Girlington, Great Horton and Thornbury) perform important roles for convenience<br />
hopping compared to some of the Town Centres (Bingley, <strong>Bradford</strong>, and Ilkley).<br />
The study also illustrates that <strong>Bradford</strong> City Centre is the strongest bulky and non-bulky<br />
comparison goods shopping destination, followed by Keighley Town Centre. The results<br />
show that Bingley and Ilkley perform limited bulky goods roles, whilst Ilkley plays a more<br />
important on-bulky role to its local catchment. Similar to convenience shopping, the results<br />
found that some of the District Centres (Thornbury and Five Lane Ends) play an important<br />
bulky and non-bulky comparison role than other competing centres such as Ilkley and<br />
Bingley. The results also demonstrate the important role that the network of local centres<br />
provide in local main food, bulky and non-bulky shopping in the District. The rise of out-ofcentre<br />
provision also shows that collectively they have a significant influence on local<br />
shopping patterns.<br />
8.6 Leisure and Tourism Market Profile<br />
This section provides and overview of the Leisure market profile of <strong>Bradford</strong> district. The<br />
Retail & Leisure <strong>Study</strong> produced by White Young Green on behalf of the Council does<br />
enable analysis of leisure activities through analysis of the results of the Household Survey in<br />
regard to specific leisure activities. These include:<br />
265
• Cinemas;<br />
• Health and fitness;<br />
• Ten pin bowling;<br />
• Bingo; and<br />
• Pubs/Bars/Nightclubs<br />
In terms of existing provision, the study found that the district has a diverse range of leisure<br />
facilities within it. In terms of cinemas, the District contains a 13 screen Odeon Cinema at<br />
Gallagher Leisure Park, a 2 screen cinema at The Picture House, Keighley, and a 3 screen<br />
cinema at the National Media Museum which includes an IMAX screen. 10-pin bowling<br />
facilities in the District comprise Hollywood Bowl at Vicar Lane, <strong>Bradford</strong> (28 lanes), AMF<br />
Bowling at Keighley (20 lanes) and Go-Bowling at Shipley Lanes (12 lanes). In addition to<br />
small and informal bingo clubs, large format bingo halls in the District include Buckingham<br />
Bingo, <strong>Bradford</strong> Interchange; Mecca Bingo, Little Horton, <strong>Bradford</strong>; Gala Bingo, Tong Street;<br />
Oxford Bingo, Dudley Hill Road, <strong>Bradford</strong>; and Gala Bingo, Alice Lane, Keighley.<br />
The District contains a wide array of gyms, and health clubs, both private membership and<br />
publically run facilities. These include amongst other facilities: Manningham Sports Centre,<br />
Carlisle Road; Richard Dunn Sports Centre, Rooley Avenue; Esporta, Gallagher Leisure<br />
Park, Thornbury; Fitness First, Worth Way, Keighley; Soccer City, Leaverthrope Lane,<br />
Thornton; Virgin Active; and Ilkley’s Lido.<br />
With respect to the evening economy the Alhambra theatre and St George’s Concert Hall are<br />
both located in <strong>Bradford</strong> City Centre, and a large number of bars, public house and<br />
nightclubs are located across the District.. The District contains a high number of restaurants<br />
offering specialist cuisine from around the world, reflecting the multi-cultural diversity of the<br />
Districts residents. Such leisure facilities are concentrated in <strong>Bradford</strong> City Centre primarily<br />
together with the other defined town centres, although they can be found in varying quantities<br />
throughout <strong>Bradford</strong> District.<br />
Cinemas<br />
Within the study area, approximately 44% of respondents to the household survey visited the<br />
cinema, of which 65% of these visited cinemas within <strong>Bradford</strong> district. Within the district the<br />
most popular cinema was the Cineworld at the Leisure Exchange in <strong>Bradford</strong>. This was<br />
followed by the Odeon Cinema in Thornbury. WYG’s assessment has identified that there is<br />
potential support for up to ten cinema screens in <strong>Bradford</strong>.<br />
Health and Fitness<br />
The study found that a quarter of the respondents within the study area participate in health<br />
and fitness activities. Of those people that undertook health and fitness activities, some 66%<br />
of respondents stated that they visited facilities in the District. The most popular facility was<br />
the Dines First at Horton Park Avenue in <strong>Bradford</strong>, with a market share of 7%. Other<br />
important destinations were Fitness First in Keighley and the Richard Dunn Sports Centre in<br />
<strong>Bradford</strong>, closely followed by Cannons Health Club in Bingley.<br />
266
Ten Pin Bowling<br />
The study found that 26% of the population participated in ten-pin bowling activity. Of those,<br />
70% indicated that they visited ten-pin bowling facilities no more than once every two<br />
months. The study found that there are three ten-pin bowling facilities in <strong>Bradford</strong>, Keighley<br />
and Shipley. The study found that 72% of residents who partake in ten-pin bowling did so in<br />
facilities within the district. The most popular destinations were the Hollywood Bowl at Vicar<br />
Lane in <strong>Bradford</strong>, which attracted 47% of those residents, followed by the Hollywood Bowl in<br />
Kirstall, and the AMF Bowling in Keighley.<br />
Bingo<br />
The study found that 8% of the population use bingo facilities. Of those that stated that they<br />
participate in bingo, 82% stated that they visited facilities within the District. The most popular<br />
destinations were large-format clubs including Buckingham Bingo at <strong>Bradford</strong> Interchange,<br />
Mecca Bingo in <strong>Bradford</strong>, and the Gala Clubs in Tong Street and Keighley.<br />
Pubs/Bars/Nightclubs<br />
The study found that 56% of the resident population indicated that they visited pubs on a<br />
regular basis. This increased in age groups between 35 and 54. In terms of restaurants, the<br />
study found that 78% of respondents undertook this activity. In contrast, the study found that<br />
across the study area only 13% of respondents visited nightclubs.<br />
Potential Retail Development & Emerging <strong>Strategy</strong><br />
Given the identified need in the study, WYG recommend that the Council take a pro-active<br />
approach to enhance the role of all the key town centres through the plan period. WYG do<br />
not believe that any of the defined Town Centres can afford to stand still. In terms of<br />
convenience shopping there is a quantitative need to provide a new foodstore in <strong>Bradford</strong><br />
City Centre, through enhancing its current poor market share, which will also seek to address<br />
the qualitative deficiency in the City Centre. We also believe that there is quantitative and<br />
qualitative need to improve the convenience provision in Shipley Town Centre.<br />
In terms of Keighley, the study has found that the proposed new ASDA store will meet the<br />
identified quantitative need for the town. The study has also found that up to three new<br />
superstores/supermarkets can be implemented in three centres up to 2012. This would<br />
satisfy the district’s quantitative need in the short term. Subject to the delivery of this we<br />
would recommend that the Council review and monitor this over the next five years.<br />
In terms of comparison shopping, the study found that there is capacity to enhance the<br />
position of <strong>Bradford</strong> City Centre through the implementation of major retail development.<br />
WYG believe that delivery of the Broadway will be fundamental and will help transform<br />
<strong>Bradford</strong> as a shopping destination and will address the recent decline over the last 10 years.<br />
WYG also believe that there is scope to enhance the current positions of Shipley and<br />
Keighley as comparison goods shopping destinations through both the redevelopment and<br />
the expansion of the existing Town Centres. This expansion will need to be carefully<br />
monitored and delivered through appropriately scaled developments.<br />
267
In terms of Bingley, WYG recommend that the LDF should focus on the redevelopment of the<br />
Myrtle Walk Shopping Centre. The objective should be to secure a replacement convenience<br />
anchor in the Town Centre which will then help to encourage other comparison retailers to<br />
the centre. At the same time, the Council should seek to maintain the centres strong service<br />
role.<br />
In terms of leisure development, although the study has found limited capacity for new<br />
leisure provision in quantitative terms, there is a qualitative need to improve the leisure<br />
provision within Keighley and maybe Shipley. The current leisure provision in <strong>Bradford</strong> City<br />
Centre is good. There is scope to improve the evening economy through the promotion and<br />
enhancement of leisure and cultural facilities, which will complement the role and function of<br />
the City Centre as a retail destination. This should include improving the quality and range of<br />
restaurants, bars, public houses and evening entertainment uses.<br />
The study sets out a clear framework for enhancing and sustaining the role of the defined<br />
Town Centres within the district, and that appropriate and sensitive retail and leisure<br />
development should be accommodated where possible within the five Town Centres. In<br />
terms of the existing network of defined District Centres as set out in the <strong>Bradford</strong> UPD,<br />
WYG has reviewed the role and function of each of these and has concluded that the<br />
following centres are performing an adequate role as a District Centre, and require no further<br />
action by the Council apart from minor boundary changes where appropriate. These include:<br />
• Five Lane Ends;<br />
• Girlington;<br />
• Great Horton Road;<br />
• Greengates; and<br />
• Thornbury.<br />
The study has recommended that Tong Street becomes a priority for regeneration and<br />
investment in order to support and enhance its future role. This is required to help support<br />
the regeneration of this deprived area of <strong>Bradford</strong> and to become a focal point for community<br />
life. Given the lack of diversity of uses, WYG have advised that Mayo Avenue be de-listed as<br />
a District Centre and unallocated in future planning documents. As part of the study, WYG<br />
also examined 40 local centres throughout the district. The study assessed their current role<br />
and function against the definitions in PPS6 to understand whether they were satisfying their<br />
required role.<br />
In conclusion, WYG consider that the following local centres are performing their role well<br />
and require no Planning Policy intervention from the Council. These include:<br />
• Addingham Local Centre;<br />
• Baildon Local Centre;<br />
• Barkerend Road Local Centre;<br />
• Burnley-in-Wharfedale Local Centre;<br />
• Carlisle Road/Whetley Hill Local Centre;<br />
• Clayton Local Centre;<br />
268
• Denholme Local Centre;<br />
• Duckworth Lane Local Centre;<br />
• Frizinghall Local Centre;<br />
• Haworth (Main Street) Local Centre;<br />
• Haworth (Mill Hey) Local Centre;<br />
• Horton Grange Local Centre;<br />
• Idle Local Centre;<br />
• Laisterdyke Local Centre;<br />
• Leeds Road Local Centre<br />
• Lidget Green Local Centre;<br />
• Marshfields (Manchester Road) Local Centre;<br />
• Oak Lane, Manningham Local Centre;<br />
• Queensbury Local Centre;<br />
• Saltaire Local Centre;<br />
• Silsden Local Centre;<br />
• Thornton Local Centre;<br />
• Undercliffe Local Centre;<br />
• White Abbey Road Local Centre;<br />
• Wibsey Local Centre; and<br />
• Wyke Local Centre.<br />
Based on site visits and analysis of role and function, WYG recommend that the following<br />
centres should not be defined as local centres under the guidance of PPS6. These include:<br />
• Bolton Junction Local Centre;<br />
• Buttershaw Local Centre;<br />
• Eldwick Local Centre; and<br />
• Shearbridge/Listerhills (Woodhead Road) Local Centre.<br />
Future Retail Policy <strong>Strategy</strong><br />
WYG has reviewed the current retail and leisure strategy as set out in Chapter 7 of the<br />
Replacement UDP (Adopted 2005). WYG have examined this against the national Planning<br />
Policy set out in PPS6 to ensure that any emerging Local Development Framework will<br />
reflect national guidance and will try to emulate the aims and objectives of PPS6.<br />
WYG have set out a preferred retail hierarchy which provides a clear network of town, district<br />
and local centres.<br />
City Centre<br />
<strong>Bradford</strong><br />
Town Centre<br />
Bingley; Ilkley; Keighley; Shipley<br />
District Centre<br />
Five Lane Ends; Girlington; Great Horton Road; Greengates; Thornbury; Tong Street<br />
269
Local Centre<br />
Addingham; Idle; Silsden; Allerton; Saltaire; Baildon; Horton Grange; Thornton; Cross Road<br />
(Keighley); Crossflats; Barkerend Road; Haworth (Mill Hey); Undercliffe; Eccleshill; Fell<br />
Lane/Oakworth (Keighley); Denholme; Laisterdyke; Queensbury; Holme Wood; Princeville;<br />
Carlisle Road/Whetley Hill; Leeds Road; Wibsey; Duckworth Lane; Frizinghall Clayton; Lidget<br />
Green; Wyke; Sticker Lane; Wrose; Burley-in-Wharfedale; Marshfields (Manchester Road);<br />
Oak Lane, Manningham; Haworth (Main Street); White Abbey Road; Bankfoot (Manchester<br />
Road).<br />
The Council will need to consider other potential strategic locations for local centres to<br />
ensure that social inclusion and accessibility considerations are satisfied through the<br />
emerging LDF.<br />
Although the WYG study has not specially been asked to look at locations for new centres,<br />
PPS6 requires local planning authorities to consider the designation of new centres in areas<br />
of significant growth or in areas of clear deficiency, with priority given to areas of high<br />
deprivation, where access to local services is needed. From the accessibility review set out<br />
in Section 9 of the study, we highlighted the network of town, district and local centres as well<br />
as known foodstores. From this analysis we found that generally the district is well catered<br />
for with existing retail (convenience) facilities. However, from closer inspection we did find<br />
that there may be scope to designate some local centres to ensure that most of the district is<br />
covered. WYG has identified that the following settlements areas should be considered for<br />
designation of a local centre. We should note that some of these centres (*) do benefit from a<br />
foodstore/superstore. The settlements are:<br />
• Steeton with Eastburn;<br />
• Menston *;<br />
• Riddleston *;<br />
• Oakworth *;<br />
• Harden;<br />
• Cullingworth *<br />
• Wilsden *;<br />
• Cottingley *;<br />
• Heaton *;<br />
• Sandy Lane *;<br />
• Low Moor *.<br />
If any future retail strategy is to address social exclusion issues and deficiencies, then it will<br />
be essential that the above settlements with no identified supermarket/foodstore present<br />
should represent the priority for some form of daily provision to meet daily needs. The<br />
Council will need to consider allocating these strategic locations for local centres to ensure<br />
that social inclusion and accessibility considerations are satisfied through the emerging LDF.<br />
The study has reviewed and recommended appropriate changes where possible to many of<br />
the adopted retail and leisure policies set out in the UDP. Many of the changes identified by<br />
270
WYG are to ensure that the future policies are compliant with national planning guidance set<br />
out in PPS6, and that any future changes required are reflected in the emerging LDF.<br />
8.7 Visitor Economy Profile<br />
This section provides and overview of the visitor economy based upon the <strong>Bradford</strong><br />
Destination Assessment & <strong>Strategy</strong> (2008) produced by Locum Consulting on behalf of the<br />
Council.<br />
<strong>Bradford</strong>’s proximity to other large conurbations such as Leeds, Sheffield and Manchester<br />
means that it has a large catchment population: over one and a half million people live within<br />
a 30 minute drive time and nearly eleven million people in total live within a 90 minute drive<br />
time of <strong>Bradford</strong>.<br />
Overall and allowing for the deficiencies and uncertainties in the data, the main conclusion<br />
that can be drawn is to lend further weight to the view that <strong>Bradford</strong> is underachieving in<br />
terms of volume and value of day visitors.<br />
The Cambridge model estimates that about 760,000 visits involving at least a one night stay<br />
are made to the district each year, and estimates that the number has decreased by 5%<br />
since 2003, albeit that the amount they have spent has increased by 11%. Staying visitors<br />
are estimated to have accounted for 10% of all visits to <strong>Bradford</strong> in 2006, but to have<br />
accounted for nearly 30% of total tourism expenditure in <strong>Bradford</strong>.<br />
The two main reasons for staying visits to <strong>Bradford</strong> are for a holiday and to visit friends and<br />
relatives, although visiting <strong>Bradford</strong> for business reasons has become more popular since<br />
2003 and now accounts for nearly a quarter of all staying trips to the city and about a third of<br />
all spend. This is important because the hotel sector in city centres normally depends on<br />
business tourists to generate it bread and butter trade.<br />
Cambridge estimates that there is a more or less even split in expenditure between those<br />
staying with friends and relatives and those staying in serviced accommodation.<br />
271
City’s attraction to the wider international visitors are very promising and encouraging as<br />
well. According to figures released by the Office for National Statistics the length of time<br />
overseas visitors stay in <strong>Bradford</strong> has more than doubled in a year, averaging 19 days per<br />
visit in 2008 as opposed to eight days per visit in 2007.<br />
The Travel Trends survey also revealed that overseas visitors spent a combined total of 2.1<br />
million nights in <strong>Bradford</strong> in 2008, up from just 826,000 in 2007.<br />
Meanwhile, the number of overseas visitors who stayed more than a day in <strong>Bradford</strong><br />
increased from 105,000 in 2007 to 111,000 in 2008, with their spending going up from £26 to<br />
£29 million.<br />
In 2008, the district welcomed 5,000 overnight visitors from North America, many of whom<br />
were wooed by attractions such as the Bronte Parsonage Museum in Haworth, the World<br />
Heritage Site of Saltaire and <strong>Bradford</strong>’s National Media Museum. Meanwhile, 75,000 visitors<br />
from Europe had overnight stays in <strong>Bradford</strong> 79 .<br />
The key challenge for <strong>Bradford</strong> however is to lift the appeal of the city centre and to persuade<br />
people who live relatively locally, especially more affluent people living “outside the ring-road”<br />
to visit the city centre more often and to spend more money there. The population of the<br />
country is increasingly middle class and any place that wants to have a thriving economy can<br />
only do so by appealing to middle class taste. Upping the quality of the visitor offer in the city<br />
centre to make it a primary leisure resource for the metropolitan area and its surrounds<br />
should be top priority.<br />
Having improved the appeal of the city centre to people who live nearby, a second challenge<br />
is to persuade people that live further afield that the city is worthwhile visiting. This<br />
represents a huge potential market and there are good reasons for them to come to the city<br />
and the district, especially star attractions like the National Media Museum and Saltaire, but<br />
currently the image of the city and the poor quality of the general urban experience are major<br />
deterrents. The image is related to the reality of the appearance of the urban realm and will<br />
79 Telegraph and Argus (2008) Visitors increase stop-offs in <strong>Bradford</strong> [online]. Newsquest Media Group [cited 6 th<br />
May 2009]. < http://www.thetelegraphandargus.co.uk/news/4497966.Tourists_double_length_of_their_stay/ ><br />
272
e difficult to change without substantial progress in addressing that. Improvements to<br />
marketing could probably also help.<br />
Another key challenge in this respect is differentiating <strong>Bradford</strong> from the many other post<br />
Industrial towns in the Leeds-Manchester conurbation – places like Preston, Blackburn,<br />
Bolton, Oldham, Halifax and Huddersfield. Research that Locum has undertaken for the<br />
Northwest Regional Development Agency show that they all struggle to be seen as<br />
destinations. <strong>Bradford</strong> District has the advantage of a range and depth of major attractions<br />
that place <strong>Bradford</strong> apart from other locations in the North and Yorkshire in particular. The<br />
task of the strategy needs to be to place them in a much better context, and then to market<br />
them more effectively.<br />
A market of third priority (after locals and potential day visitors within about 90 minutes) is<br />
people who are potential staying visitors, especially those coming to the city to stay in paid<br />
for accommodation. The statistics – albeit they are crude – suggest that the city has been<br />
going backward in this respect, and it certainly has not been enjoying the investment in new<br />
hotel stock that has been seen by the larger regional cities. A major reason for this is the lack<br />
of professional and commercial business in the city to sustain the bread and butter. There<br />
are, however, hotels proposed as part of the new development schemes that should help to<br />
address the situation. The most optimal approach to promoting to potential staying visitors<br />
seems to be to collaborate more with Leeds.<br />
In terms of promoting to overseas markets, working with Leeds and other Yorkshire<br />
stakeholders to promote to markets served by Leeds-<strong>Bradford</strong> Airport seems to be the best<br />
approach.<br />
The 2004 Benchmark Report5 was based on visitor surveys carried out in various locations<br />
in <strong>Bradford</strong>, Ilkley and Haworth. It asked respondents about their experience of different<br />
aspects of the visitor experience. Respondents were asked to assess dimensions of the<br />
visitor experience on a scale of 1 – 5 with 1 being poor and 5 being very good. The<br />
researchers reported that the responses compared favourably6, where information was<br />
available, with national benchmarks. The dimension on which <strong>Bradford</strong> offered the least<br />
satisfaction was the range of shops within the city, which scored 3.97. On average Haworth<br />
and Ilkley received higher visitor satisfaction scores than the city centre.<br />
<strong>Bradford</strong> District Visitor Guide Conversion Research 2006 survey was sent to all those<br />
who requested a <strong>Bradford</strong> District Visitor Guide. In total there were nearly 2,000 enquiries for<br />
a guide and 550 responded to the questionnaire. The results are compared with data<br />
collected in 20057. Two thirds of the respondents were over the age of 55. The majority<br />
stayed between 2 -3 nights in the District. On average, respondents spend £89 per person<br />
on accommodation in <strong>Bradford</strong> in 2006 and £167 per person on the total holiday.<br />
Visitors were most likely to visit <strong>Bradford</strong> city centre, Haworth and Ilkley. The proportion<br />
visiting Saltaire is notably low.<br />
273
The top three places of interest to visit in 2006 were <strong>Bradford</strong> City Centre, Haworth and<br />
Brontë Country. The National Media Museum was ranked the 11th most interesting attraction<br />
by respondents in 2006. Salts Mill seems to generate a level of interest that is not matched<br />
by the proportion of visitors actually going there.<br />
There are 35 visitor attractions listed on the Visit <strong>Bradford</strong> website: 31 of which are heritage<br />
sites, with 15 being specifically museums and galleries. The table shows the range of<br />
attractions in <strong>Bradford</strong> whilst the map indicates their location.<br />
274
275
The National Media Museum is considerably the most visited attraction in the District. It is<br />
one of the most visited national museums outside of London and is, unquestionably, a major<br />
asset for the city that it should keep seeking to build upon. It reported 650,000 visits in 2006<br />
(although this was the lowest number since 2002).<br />
The other star attraction in the district is Saltaire, which was designated a World Heritage<br />
Site in 2001 because it is a complete and well-preserved industrial village dating to the<br />
second half of the nineteenth century. It was constructed by textile industrialist Sir Titus Salt<br />
over the period 1853 – 1876. The main attraction at Saltaire, however, is Salts Mill, which<br />
was converted into a mixed gallery-shopping-dining experience by the late Jonathan Silver. It<br />
is probably the best such mix in the country (there are only a few other examples, one being<br />
the successful Snape Maltings outside Aldeburgh in Suffolk). The offer at the Mill has<br />
progressively improved over the years and it now deserves to be seen and treated as one of<br />
the foremost attractions in the north of England. It should be on the itinerary of many foreign<br />
visitors. Almost certainly, its profile outside of the sub-region is lower than it deserves to be.<br />
The most popular paid attraction in the <strong>Bradford</strong> area is the Brontë Parsonage Museum,<br />
which reported nearly 79,000 visits in 2006. This was also lower than in preceding years and<br />
it is in danger of slipping into unsustainable territory. Generally, all visits to <strong>Bradford</strong><br />
276
attractions listed in the Visit Britain Attractions Monitor have decreased since 2002. This is<br />
not necessarily out of step with the rest of the country.<br />
It is common for admissions to specific attractions to be on a downward trend because, on<br />
the whole, the total number of visits to attractions has not been keeping pace with the<br />
increase in new attractions (many of them funded by the National Lottery and other public<br />
funds). In Yorkshire and Humber as a whole, there was a 1% increase in visits to all<br />
attractions in 2006. 41% of attractions reported an increase, 11% reported no change 39%<br />
reported a decrease. Smaller visitor attractions (20,000 visits or less) reported an 8% decline<br />
in total visitor numbers in 2006.<br />
Perhaps the single factor that gives <strong>Bradford</strong> a special sense of place is the mills. The truly<br />
special nature of Saltaire is discussed above. It is soon to be joined by other mills that have<br />
been beautifully restored to provide modern, contemporary uses.<br />
The <strong>Bradford</strong> events calendar currently has thirty three events programmed from January –<br />
June 2008. This includes eight classical music concerts at the cathedral, five festivals<br />
(including three prestigious film festivals) and three exhibitions. Events traditionally held in<br />
the winter months include a Victorian Fayre and a Christmas Carol Service.<br />
In the surrounding area, current events programmed for Ilkley are a range of walks in the<br />
locality whilst sixteen of the nineteen events programmed for Haworth will be taking place at<br />
277
the Keighley and Worth Valley Railway. This includes two steam gala weekends. There will<br />
also be a Festival of Transport held at the Keighley Bus Museum.<br />
The events in <strong>Bradford</strong> with the highest profile include:<br />
• <strong>Bradford</strong> Mela: usually held over a weekend in July, the <strong>Bradford</strong> Mela has been<br />
running since 1989 and attracts up to 140,000 people annually9. It provides an<br />
opportunity for the local community to come together to share and celebrate their<br />
culture. Events include markets, bazaars, international food stalls, art, crafts,<br />
educational ‘zones’ and traditional and contemporary music, dance and theatre.<br />
• <strong>Bradford</strong> International Film Festival: first festival was held in 1995. Showcases classic<br />
films as well as works of new and up-coming European directors.<br />
• Bite the Mango: initially conceived as a showcase for black and Asian filmmakers in<br />
Britain, it now attracts cinema from Africa, South Asia, Central America and the Far<br />
East. Showcases a mix of feature films, documentaries, shorts, masterclasses and<br />
seminars.<br />
• <strong>Bradford</strong> Animation Festival: UK’s longest running and biggest animation festival<br />
which includes talks, workshops and the annual BAF awards celebrating best in new<br />
animation from around the world.<br />
• <strong>Bradford</strong> International Market: Held in 2004 and 2006 in the city centre with<br />
stallholders from many countries and extensive entertainments. In 2006, the event is<br />
estimated to have attracted 700,000 visitors from across the region and generated<br />
revenue of over £9 million.<br />
• <strong>Bradford</strong> Classic: Vintage vehicles on display in the city centre. In 2006 it was held in<br />
Centenary Square, 120 cars were displayed and 6,000 people attended the show.<br />
• There is increasing use of the Big Screen in Centenary Square to attract audiences<br />
and people downtown for example for televised concerts and opera. The Council<br />
owns the screen.<br />
The Visit <strong>Bradford</strong> website, contains details of some forty four restaurants in and around<br />
<strong>Bradford</strong> City Centre as well over twenty eateries in the surrounding Haworth and Ilkley<br />
areas. The <strong>Bradford</strong> Curry Guide lists and reviews Asian restaurants from one to five stars<br />
and has more than 60 entries<br />
There are more restaurants serving Indian and Kashmiri food than any other style of cuisine.<br />
Italian and Chinese restaurants are the second most prolific cuisine styles. <strong>Bradford</strong> was<br />
crowned Curry Capital in 2004, a competition organised by Menu Magazine. In the most<br />
recent competition, <strong>Bradford</strong> missed out on the title of UK Curry Capital but was awarded the<br />
status of a Curry Super City along with six others in the UK.<br />
278
There is one Michelin star-rated restaurant in the <strong>Bradford</strong> area: the Box Tree Restaurant in<br />
Ilkley, which has one star.<br />
There are 28 hotels with more than 10 rooms registered on the Visit <strong>Bradford</strong> website. Five<br />
are 4*, thirteen are 3*, six are 2* and four are unclassified.<br />
279
Occupancy rates have consistently been lower than the Yorkshire average.<br />
The main prompt to further hotel investment in the city is likely to be growth of the<br />
office/commercial sector and for hotels to be built (as seems to be happening) as part of<br />
large development schemes.<br />
The following table shows the number of proposed/emerging hotel projects to be located in<br />
and around <strong>Bradford</strong> city centre. All these hotels are proposed as part of a series of<br />
ambitious mixed-use development.<br />
Table: proposed Hotel in and around <strong>Bradford</strong> city centre<br />
Site Proposal Current status<br />
National House<br />
Sunbridge Road<br />
Highpoint<br />
Westgate<br />
<strong>Bradford</strong> Channel<br />
Limited<br />
Citygate<br />
Manchester Road<br />
Yorkshire Water<br />
George Street<br />
Odeon Cinema<br />
Prince's Way<br />
Broadway<br />
Southgate Project-<br />
Jurys Inn<br />
Car Park at<br />
Salem Street<br />
Carnation<br />
Manchester Road<br />
Former gasworks site<br />
Thornton road<br />
New build 145 bed 7 storey hotel<br />
Mixed-use development including<br />
a 96 bed hotel.<br />
Mixed-use development- 5109<br />
sqm (gross) hotel.<br />
Hotel with conference facility.<br />
Mixed-use scheme that will<br />
include a 120 bed hotel with<br />
conference facility.<br />
Mixed-use scheme that will<br />
include a 120 bed hotel.<br />
Shopping centre with 220 bed<br />
hotel<br />
8-storey 200 bed hotel and<br />
offices<br />
120 bed hotel with office,<br />
restaurant and apartments<br />
Redevelopment of the site with a<br />
125 bed hotel and other facilities.<br />
Swimming pool with associated<br />
facilities including a hotel.<br />
Planning Permission Granted- Section<br />
106 agreement under negotiation<br />
Planning Permission Granted<br />
Outline Planning Permission granted<br />
Outline Planning Permission - Pending<br />
Decision<br />
Outline Planning Permission - Pending<br />
Decision<br />
Full Planning Application is expecting<br />
soon- Public exhibition on revised<br />
scheme design has been carried out.<br />
Planning Permission Granted<br />
Planning Permission Granted-<br />
Construction ongoing<br />
Pre-application Major Enquiry- pending<br />
consideration<br />
Pre-application major enquiries.<br />
Feasibility study has been carried out.<br />
280
A recent news report suggests that the number of hotel bedrooms in <strong>Bradford</strong> could increase<br />
from 1,079 to more than 2,000 if the redevelopment proposals all come to fruition 80 . It is also<br />
possible that there might be merit in trying to secure funding support towards a “landmark”<br />
hotel, perhaps a city-spa, preferably in the Medieval heart of the city centre.<br />
In addition to the hotels proposed in <strong>Bradford</strong> city centre, another is set to be built at Odsal<br />
Top after a recent decision to grant planning permission for a hotel and restaurant on the site<br />
of Wiltex House, at the junction of Halifax Road and Odsal Road.<br />
8.8 Residential Market Profile<br />
<strong>Bradford</strong> district consists of a range of settlements including the City of <strong>Bradford</strong> itself and<br />
the smaller settlements of Shipley and Keighley. The north of the district is generally more<br />
rural / semi-rural in character than the south. The estimated population in mid-2008 was<br />
501,700, having grown by some 30,900 (6.5%) since 2001. The district experienced periods<br />
of population decline during the mid 1980's and late 1990's, and was a net donor of<br />
population throughout the 1990's.<br />
However, strong natural population growth and considerable levels of in-migration to the<br />
district more recently have served to cause very strong population and household growth.<br />
Semi-detached housing, closely followed by terraced housing, forms the majority housing<br />
type in the district. Detached housing forms a small component of the local housing offer.<br />
Owner-occupation is a more dominant tenure than across the region as a whole – making up<br />
70% of the total housing stock in the district.<br />
Total dwelling stock as at April 2009 was 208,473 residential dwellings across <strong>Bradford</strong><br />
District. Over the past 10 years, total dwelling stock has increased 4.8% from a total of<br />
198,958 in 1999 (<strong>Bradford</strong> SHMA, 2009).<br />
The overall vacancy rate is around 7.0% which is much higher that the regional average of<br />
4.1%. The vacancy rate is highest in the City Central sub-area (10%) and Keighley/Worth<br />
Valley (7.1%) and lowest in Wharfedale (5.2%) (Table 4.1)<br />
80 th<br />
Telegraph and Argus (2008) Boom in hotel rooms welcomed [online]. Newsquest Media Group [cited 6 May<br />
2009].<br />
< http://www.thetelegraphandargus.co.uk/search/3641897.Boom_in_hotel_rooms_welcomed/><br />
281
Table: Vacancy rates by sub-area<br />
Sub-areas Occupancy<br />
Empty<br />
New build and<br />
not occupied<br />
Occupied Total<br />
Vacancy<br />
Rate (%)<br />
Bingley 1772 374 28428 30574 5.8<br />
City Central 5480 388 48727 54595 10.0<br />
City North East 1549 166 26927 28642 5.4<br />
City South 1560 118 25386 27064 5.8<br />
City West 1227 161 19706 21094 5.8<br />
Keighley and Worth Valley 1921 103 25224 27248 7.1<br />
Wharfedale 1006 141 18109 19256 5.2<br />
Total 14515 1451 192507 208473 7.0<br />
Source: CBMDC Council Tax 2009<br />
New housing completions have averaged 1,187 per year since 1998, with 90% of these<br />
being private sector completions.<br />
Average house prices have risen broadly in line with regional averages, rising sharply over<br />
the period 2001-2006, before falling slightly early in 2007. However, the gap between prices<br />
in <strong>Bradford</strong> and the region has grown since 2001. Figure X below shows how house prices<br />
across <strong>Bradford</strong> District have increased a staggering 298% over the period 1996 to 2008,<br />
with average prices peaking at £129,950 during 2008. Figure XX summarises the latest<br />
house price data for <strong>Bradford</strong> District which suggests that average prices have been falling<br />
since reaching this peak and by May 2009, average prices had fallen by 23.5% to £103,293.<br />
In comparison, regional prices have fallen by 21% since February 2008.<br />
Figure: House price trends 1996 to 2008: <strong>Bradford</strong>, Leeds and regional data<br />
Median House Prices (£)<br />
140,000<br />
120,000<br />
100,000<br />
80,000<br />
60,000<br />
40,000<br />
Q1<br />
1999<br />
Source: Land Registry<br />
Q4 Q3 Q2 Q1<br />
2002<br />
Q4 Q3 Q2 Q1<br />
2005<br />
Q4 Q3 Q2 Q1<br />
2008<br />
<strong>Bradford</strong> Leeds Yorkshire and Humber<br />
282
Figure : Recent price trends: <strong>Bradford</strong> and Y&H Jan 08 – May 2009<br />
Average Price (£)<br />
150,000<br />
140,000<br />
130,000<br />
120,000<br />
110,000<br />
100,000<br />
Jan-08<br />
Source: Land Registry<br />
Mar-08<br />
May-08<br />
Map: Median house prices in 2008<br />
Source: Land Registry<br />
Jul-08<br />
Sep-08<br />
Nov-08<br />
Jan-09<br />
<strong>Bradford</strong> Y&H<br />
Mar-09<br />
May-09<br />
283
Within <strong>Bradford</strong> District there are considerable variations in house prices. Map X summarises<br />
median house prices across <strong>Bradford</strong> District, clearly illustrating highest prices in Wharfedale<br />
(with prices in excess of £180,000); prices of between £150,000 and £180,000 in the<br />
Bingley/Shipley area, with lowest prices in City Central and City South areas with median<br />
prices of between £90,000 and £120,000. Within other suburban areas of <strong>Bradford</strong> City and<br />
Keighley/Worth Valley, prices are around £120,000 to £150,00.<br />
The increasing supply of flats (rising from 3% of all sales in 2001 to around 10% in 2006) is<br />
likely to have impacted positively on local affordability for those able to take up this housing<br />
offer. However, a shortage of affordable family accommodation is recognised as being a<br />
significant issue at a local level. This is the case for inner-urban and rural areas alike.<br />
There is a severe mismatch between supply (of smaller terraced homes) and demand (from<br />
larger households) in some areas of <strong>Bradford</strong> with well established BME communities.<br />
8.9 Key Facts<br />
• <strong>Bradford</strong> is forecast to experience highest annual job growth in office sector within<br />
Leeds City Region and significant growth in retail, leisure, manufacturing, industry<br />
and public services over the coming years.<br />
• <strong>Bradford</strong>’s office market is constrained by lack of both a defined central business<br />
district, and available, good quality product, which will meet modern occupiers’<br />
requirements. The market is however expected to be transformed in near future with<br />
the completion of major mixed use schemes currently in the pipeline.<br />
• The district’s major retail centres are poorly represented by national multiples with<br />
below average volume and quality of retail outlets. There is however strong demand<br />
for representation and it is clear that the Broadway will be a major catalyst for city<br />
centre retail.<br />
• Following several years of continued inward investment in retail property market, the<br />
later half of 2007 marked the beginning of a clear downturn reflecting the turbulent<br />
state of the current national/global economy. Despite this, the investor interest<br />
remains in the city as evidenced by several recent investments across the district.<br />
• Demand for residential property is strong. However, the market is currently<br />
experiencing a slow down following several years of continued investment in this<br />
sector. The developers are expected to take a more cautious approach to<br />
development, and this may be necessary to ensure a correct influx of residential<br />
accommodation in the market place.<br />
• Industrial and warehousing market is relatively stable in <strong>Bradford</strong> compared to the<br />
regional trend.<br />
284
Source:<br />
• Provision of leisure uses and services are considered to be adequate to serve the<br />
district’s residents and tourists. There is however strong demand for improvement of<br />
quality and expansion to the range of provisions.<br />
• Although the District has the advantage of a range and depth of major tourist<br />
attractions in Yorkshire, tourism industry is underachieving in terms of volume and<br />
value of both day and staying visitors. The key challenge is to lift the appeal and<br />
quality of some attractions and encourage people to make more visits locally. The<br />
district’s attraction to the wider international visitors however is very promising.<br />
• BMDC (2010) <strong>Bradford</strong> District Economic Assessment. Report Dated January 2010.<br />
<strong>Bradford</strong> Council.<br />
• Arup (2007) <strong>Bradford</strong> Employment Land Review. Report dated December 2007.<br />
ARUP.<br />
• Donaldsons (2007) <strong>Bradford</strong> Office Audit. Report dated January 2007. Donaldsons<br />
LLP.<br />
• Henderson. R (2006) Leeds City Region Development Programme- Appendix 2<br />
(Financial and Business Services: Cluster and / or Catalyst). Report Dated August<br />
2006. Leeds <strong>Metropolitan</strong> University.<br />
• LCRDP (2006) Leeds City Region Development Programme- Appendix 5 (City<br />
Region Economic Growth). Report Dated October 2006. Leeds City Council.<br />
• Locum (2008) <strong>Bradford</strong> Destination Assessment. Report dated April 2008. Locum<br />
Consulting.<br />
• Locum (2008) <strong>Bradford</strong> Destination <strong>Strategy</strong>. Report dated November 2008. Locum<br />
Consulting.<br />
• Regeneris (2005) <strong>Bradford</strong> Positioning Statement. Report dated May 2006.<br />
Regeneris Consulting.<br />
• The Northern Way (2005) Leeds City Region Diagnostic. Report dated 2005. The<br />
Northern Way.<br />
• WYG (2008) <strong>Bradford</strong> District Retail and Leisure <strong>Study</strong>. Report Dated June 2008.<br />
White Young Green.<br />
• Yorkshire & Humber Strategic Housing Market Assessment - <strong>Bradford</strong> Housing<br />
Market Area (2008)<br />
285
9.0 TRANSPORT AND ACCESSIBILITY<br />
This section assesses key aspects of transport in the <strong>Bradford</strong> district by discussing the key<br />
opportunities and issues faced by the various transportation methods and identifying gaps in<br />
the promotion of sustainable transport infrastructure. The section also outlines detail national,<br />
regional and local transport policies which will mould the way these transport systems<br />
develop in the years to come.<br />
A range of documents, studies and reports has provided valuable information for this section<br />
of the base line report. Some of the main documents are-<br />
• <strong>Bradford</strong> District Transport <strong>Strategy</strong> 2006-2021(CBMDC, 2007)<br />
• The West Yorkshire Local Transport Plan 2011-2026 (Wyltp, 2011)<br />
• The LTP <strong>Bradford</strong> Local Implementation Plan 2011-2014 (BMDC, 2011)<br />
• The West Yorkshire Urban Congestion Target Delivery Plan (DfT, 2009)<br />
• Leeds City Region Transport Vision (Appendix 4 of LCRDP, 2006)<br />
• <strong>Bradford</strong> Channel and Market NDFs Transport Report (Ove Arup & Partners Ltd, 2005)<br />
• <strong>Bradford</strong> Positioning Statement (Regeneris, 2005)<br />
9.1 Policy Context<br />
The following section briefly describes the key aspects of some regional and local policies<br />
and strategies in relation to their implication for the current and future transport development<br />
in the district and the city centre.<br />
Regional Transport <strong>Strategy</strong><br />
Transport affects business success, the quality of life and the environment. Transport allows<br />
people to make social trips, access leisure facilities and go on holiday. Without transport and<br />
movement, people social well being and quality of life would be dramatically affected.<br />
Addressing traffic growth and congestion is a major issue for the RSS. A key aim of<br />
integrated land use and transport planning policies is to reduce the need to travel and to<br />
reduce the length and number of journeys, particularly those made by private car. The Plan<br />
includes a number of complementary policies to attract more journeys by foot, bicycle and<br />
onto public transport, encourage developments in locations well-served by public transport<br />
and introduce measures aimed at achieving a shift away from increasing car dependency.<br />
Policy T1 covers the specific contribution which transport planning makes to effect modal<br />
shift, and Policy T2 (parking) also makes an important contribution. There are strong linkages<br />
with Policy T3 (public transport), as significant increases in the capacity of the public<br />
transport network will be needed if a step change in modal share is to be achieved.<br />
Greater use of walking and cycling as modes of transport, particularly over short distances,<br />
requires encouragement and support. The provision of well designed shared or where<br />
necessary segregated, spaces for pedestrian and cycling should be supported in appropriate<br />
286
circumstances, including the use of towpaths alongside inland waterways. These measures<br />
should be complemented by using the planning system to require employers’ travel plans<br />
and the provision of incentives to use public transport at new housing developments such as<br />
free or subsidised travel cards.<br />
Following the principles of PPG13, the Assembly has produced a set of parking standards to<br />
be applied across the region reflecting the situation in Yorkshire and Humber. These<br />
standards are based on the principle of specifying the upper limit of parking to be provided at<br />
developments.<br />
Park and Ride has the potential to complement local parking policies. There is scope for local<br />
and strategic Park and Ride sites which will require cross boundary cooperation on<br />
development, management and policy co-ordination. However the introduction of Park and<br />
Ride should not lead to an increase in private car use in order to reach Park and Ride sites,<br />
rather than making the complete journey by public transport. Neither should it alleviate urban<br />
congestion at the expense of suburban/rural areas.<br />
Strengthening public transport is essential for the delivery of the Plan and to address existing<br />
problems of congestion and accessibility. The Public Transport framework set out in Policy<br />
T3 is complemented by public transport accessibility criteria that define the levels of public<br />
transport accessibility needed to support development across the Region. The overall aim of<br />
the framework is to strengthen and clarify the integration of public transport and landuse.<br />
Developments should be planned to enhance the viability of existing public transport, which<br />
in some cases will mean making use of spare capacity and in others will mean increasing<br />
patronage such that additional services become viable.<br />
The Region will seek to improve access to all its main tourist destinations, particularly<br />
Regional Cities and Sub Regional Cities and Towns by more sustainable modes of transport.<br />
Tourism requires movement so the general presumption underlying the rest of the Plan and<br />
RTS about reducing the need to travel cannot apply to transport related to tourism. However,<br />
tourism still needs to become more sustainable and the policies on modal shift and public<br />
transport in the RTS also apply to those on a tourist trip.<br />
The West Yorkshire Local Transport Plan 2011-2026 and<br />
<strong>Bradford</strong> Local Implementation Plan 2011-2014<br />
The West Yorkshire Integrated Transport Authority (WYITA) is currently delivering on LTP2,<br />
which runs from 2006 to 2011. LTP3 has been completed in March 2011 which consists of a<br />
15 year strategy (2011-2026) and will be delivered through 3 year Local LTP Implementation<br />
Plans. The first <strong>Bradford</strong> Local LTP Implementation Plan (2011-2014) has been approved in<br />
June 2011 which, as well as setting out an overview of the transport issues in the District,<br />
can be used when engaging local stakeholders and communities on transport issues. LTP3<br />
thus provides greater flexibility for ITAs to determine the scope, nature and duration of its<br />
strategy and implementation plans.<br />
287
The third West Yorkshire Local Transport Plan <strong>Strategy</strong> 2011 – 2026 and its first<br />
Implementation Plan 2011 – 2014 have been developed by the WYITA with support from all<br />
five West Yorkshire Districts. Whilst the Department for Transport had previously been very<br />
prescriptive about the content and performance management of previous LTPs, this is<br />
relaxed for LTP3 giving more flexibility for the development of plans more suited to local<br />
circumstances. The current LTP has been developed to deliver three key objectives:<br />
• To make substantial progress towards a low carbon transport system for West<br />
Yorkshire.<br />
• To improve connectivity to support economic activity and growth across West<br />
Yorkshire and the Leeds City Region<br />
• To enhance the quality of life of people in West Yorkshire<br />
The objectives will be delivered through four strategic approaches:<br />
• Maintaining and managing Transport Assets<br />
• Providing information on, and encouraging use of sustainable Transport Choices<br />
• Improving Connectivity through the delivery of an integrated and reliable transport<br />
system<br />
• Making Enhancements to the transport system to provide greater capacity and better<br />
performance<br />
In <strong>Bradford</strong> the Council aim to achieve the vision and objectives through:<br />
• supporting the delivery of new housing and jobs and helping to regenerate existing<br />
local communities<br />
• making it easier to access places, services and amenities by sustainable means<br />
• creating high quality, distinctive, cohesive and safe environments<br />
• reducing congestion and supporting greener fuel technologies<br />
• serving the transport needs of the most vulnerable members of the community and<br />
reducing the harmful effects of road traffic within neighbourhoods.<br />
The <strong>Bradford</strong> Local Implementation Plan 2011-2014 lists all the schemes that are<br />
programmed under the above strategic elements. See appendix A of the <strong>Bradford</strong> Local LTP<br />
Implementation Plan 2011-2014 for detail.<br />
Over the last 3 years the Council has also been preparing annual Transport Delivery Plans<br />
setting out its priorities for delivery of transport related schemes which enabled the Council to<br />
deliver transport measures in partnership with WYITA. Some major achievements under the<br />
above plans include:<br />
• Enforcement of access to the <strong>Bradford</strong> City Centre Pedestrianised Area has been<br />
improved through the introduction of rise and fall bollards.<br />
• Work has commenced on site on junction improvement schemes for Little Horton<br />
Lane / Southfield Rd and Leeds Road/Laisterdyke.<br />
288
• Phase 1 of the Living Street, which extends from the City Centre to Manchester<br />
Road, is nearing completion.<br />
• Continued delivery of casualty reduction and local improvement schemes through<br />
partnership working with local communities and other stakeholders<br />
Despite good progress in many programme areas there has been some delay in<br />
implementing a number of schemes in the programme which has necessitated re-phasing.<br />
This re-phasing is incorporated in the Council’s Capital Investment Plan on an on-going<br />
basis.<br />
Other major integrated transport capital investment in <strong>Bradford</strong>, funded through the West<br />
Yorkshire Strategic Programme of Schemes, is progressing as follows:<br />
<strong>Bradford</strong> City Links – supporting highways measures for City Park<br />
This scheme is nearing completion - includes a bus only right turn at the junction of Little<br />
Horton Lane and Princes Way and a new pedestrian crossing on Princes Way.<br />
Saltaire Improvements – following the successful outcome of an innovative stakeholder<br />
involvement process a detailed design work has now commenced and work on the scheme<br />
is scheduled to be complete by the end of 2013.<br />
Low Moor Rail Station<br />
A rail engineering consultant for this scheme has now been appointed and the new station<br />
should be operational by 2013/2014. It is unlikely that this scheme could be accelerated due<br />
to the complexities involved in delivering rail related schemes and the rail industry's approval<br />
procedures.<br />
Traffic Light Priority for Buses<br />
This West Yorkshire wide scheme will include the introduction of equipment to provide bus<br />
detection for up to 60 sites in <strong>Bradford</strong>. This will give priority to late running buses at traffic<br />
signals. It is envisaged that 5 of these sites will be implemented by the end of the current<br />
financial year together with an upgrade to the Urban Traffic Control system to work with the<br />
new detection equipment.<br />
Other Considerations:<br />
Strategic Road Network- Highway Agency’s previous modelling work has identified a need<br />
for a number of improvements to junctions on the SRN in and close to <strong>Bradford</strong> District to<br />
cater for traffic growth generated by proposed developments emerging from the LDF process<br />
in all of the Districts of West Yorkshire. Issues relating to the existing peak period congestion<br />
on the M62 eastbound between Junctions 24 (Ainley Top) and 27 (Gildersome) and<br />
westbound between Junctions 28 (Tingley) and 26 (Chain Bar) have been addressed by the<br />
Managed Motorway and Hard Shoulder Running scheme that is expected to commence by<br />
2015. The objectives of this scheme are to increase capacity for strategic traffic and to<br />
relieve existing traffic delays. Although the M62 motorway does not enter <strong>Bradford</strong> District,<br />
the scheme will address congestion problems that have an adverse effect on traffic<br />
movement to and from <strong>Bradford</strong>.<br />
289
Apperley Bridge Rail Station- The provision of a new station at Apperley Bridge is included in<br />
a Leeds City Region Rail Growth Package which has been submitted to the Department for<br />
Transport for approval. As part of the Comprehensive Spending Review the Department<br />
resolved that this Package would be included in the pot of 22 schemes across the country<br />
where promoters would be asked to provide more information. A decision would then be<br />
made by the Department on which schemes would be supported. This decision is expected<br />
by the end of 2011.<br />
Caldervale Line- <strong>Bradford</strong> Council is working with officers from Leeds, Calderdale and<br />
Rochdale Councils, as well as Metro, the Greater Manchester Transport Executive, Network<br />
Rail and Northern Rail, to identify proposals that would improve the operation of, and journey<br />
times on, the Caldervale line. Any viable proposal could be subject of a future bid for funding<br />
in recognition of the importance of the line to the Districts through which it passes and it’s<br />
potential to improve the economy of the Leeds and Manchester City Regions<br />
Local Development Framework (LDF)<br />
The district’s Unitary Development Plan adopted in 2005 was drafted having particular regard<br />
to the transport implications of the district’s development requirements, especially in the<br />
hierarchy of settlements and the location and phasing of sites for housing. The emergence of<br />
regeneration master plans for Airedale, <strong>Bradford</strong> city centre, Manningham and the Canal<br />
Road corridor post date the UDP. They promote strategic development opportunities,<br />
intensification of development and make specific proposals for new elements in both the<br />
highway and public transport systems.<br />
The replacement of the UDP by new Development Plan Documents will address the<br />
comprehensiveness of the transport system and its integral relationship with district’s spatial<br />
development. A new <strong>Core</strong> <strong>Strategy</strong> is being prepared which will determine any changes to<br />
the role of settlements and whether any new strategic land allocations (as suggested in the<br />
master plans) are needed. Area Action Plans are being prepared for the city centre and the<br />
Shipley and Canal Road Corridor which will incorporate proposals for new transport<br />
infrastructure.<br />
City Centre Masterplan and the NDFs<br />
The implications of the <strong>Bradford</strong> Centre Regeneration Masterplan in terms of changes and<br />
intensification of land use for the overall transport network are considerable. The Masterplan,<br />
through its Neighbourhood Development Frameworks, promotes a package of public<br />
transport, parking and pedestrian projects. It identifies also a significant increase in the levels<br />
of residential, retail and commercial activity in the city centre. While individual elements of<br />
these proposals will be considered as they are brought forward, a viable and comprehensive<br />
transport system in the city centre needs to be maintained for all users including service and<br />
public transport access.<br />
This city centre’s role as the district’s meeting place demands improvement in the quantity<br />
and quality of public realm to create a more pedestrian friendly environment. This will be<br />
290
supportive of the greater activity through which the Masterplan promotes the transformation<br />
of the city centre.<br />
<strong>Bradford</strong> District Transport <strong>Strategy</strong> 2006-2021<br />
This District Transport <strong>Strategy</strong> outlines the key gaps that the district faces in both quantity<br />
and quality of its transport network and makes the case for a ‘step-change’ in investment in<br />
the district as part of a comprehensive approach to meeting the transport needs of business,<br />
residents and visitors.<br />
The report also highlights the importance of the urban areas to function for its growing<br />
businesses and residential population. Investment in the strategic road network is expected<br />
to address this in part but a particular issue is the quality of the Outer Ring Road and in<br />
particular its significant junctions with major radial routes in the city. The outer ring road is<br />
also seen as a barrier for public transport routes into the city centre. Schemes have been<br />
developed for some junctions to improve public transport, safety and congestion but the<br />
complexity of the orbital routes, particularly on the west and north of the city, requires<br />
resolution and funding.<br />
Whilst the pattern of employment areas is changing, many jobs will be provided within the<br />
district and it is important that the local transport system, in essence the bus, is capable of<br />
allowing workforce to access them. The anticipated growth in city centre employment will<br />
require that the bus network can make a substantial contribution to t commuting. Additionally,<br />
some of the larger employment sites and traditional employment areas will be redeveloped<br />
for mixed or other uses which may have transport impacts, such as on peak travel and on<br />
existing public transport networks.<br />
One of the other most challenging issues is reduction of through traffic on Godwin Street and<br />
Westgate which must be resolved to be able to implement the Masterplan transport<br />
aspirations in their entirety. This cannot be achieved without the creation of a replacement<br />
highway route. This would normally be a major scheme for Local Transport funding but<br />
current Department for Transport assessment methods are unlikely to be supportive. Other<br />
funding sources may be necessary.<br />
9.2 Travel and Transport in <strong>Bradford</strong> District<br />
The following part of the section will outline a general overview of the key dimensions of<br />
travel and transport in <strong>Bradford</strong> District.<br />
9.2.1 General traffic trend<br />
The use of the road system in <strong>Bradford</strong> District is dominated by private vehicles. These form<br />
some 80% of the vehicles on the road and carry around 70-75% of the travelling population.<br />
The journeys involved have a wide range of origins and destinations; they also have a wide<br />
range of journey purposes, from leisure to commuting. Other journeys occurring as part of<br />
291
the working process involving either travelling as part of the working procedure or the<br />
transfer of goods and equipment are an essential element of the district’s business activity. 81<br />
Between 1979 and 1993 all day traffic in <strong>Bradford</strong> District increased significantly (by 45%);<br />
since then growth has levelled off - with an increase of only 1.3% between 1993 and 2005.<br />
Peak traffic levels within <strong>Bradford</strong> have remained fairly static over the last twelve years, with<br />
flows in 2005 slightly lower than those recorded in 1993. Census data, however, indicates<br />
significantly increased journey lengths for commuters between 1991 and 2001, with <strong>Bradford</strong><br />
workers travelling an average 21% greater distances over that period. Government forecasts<br />
are for an increase in car journeys of 12% in <strong>Bradford</strong> District between 2005 and 2015. 82<br />
A more recent study has also highlighted that total vehicle traffic in <strong>Bradford</strong> has continued to<br />
increase, albeit at a much slower rate than the national and regional trend (8.7% compared<br />
to 13.5% and 11.4% respectively). Vehicle traffic is by far the highest in Leeds within the City<br />
Region with 6.4 billion km travelled per year and the greatest rise in traffic volume was in<br />
Barnsley with a 22.5% percentage increase between 1998 and 2007. 83<br />
Table: Total Vehicle Traffic (billion km per year) by Local Authority 1998-2007 (HL 22)<br />
Trend data on traffic volumes within the <strong>Bradford</strong> urban areas (measured from the <strong>Bradford</strong><br />
Monitoring Cordon) indicates that inbound peak period (0700-1000) traffic levels are less<br />
now than they were ten years ago. Traffic volumes fell between 2001 and 2007 (despite a<br />
rise between 2003 and 2005). The flows in 2007 were still some 5% lower than in 2001 and<br />
3% below the 1997 level. For the shorter peak period (0800-0900), inbound flows in 2007<br />
were some 8.0% below the 1997 level.<br />
Modal share data from the Monitoring Cordon indicates increased rail patronage (up 13%)<br />
and a slight increase in bus use (up 3%) since 2005 in the inbound morning peak.<br />
81 <strong>Bradford</strong> District Transport <strong>Strategy</strong> (CBMDC, 2007)<br />
82 A Picture of the District (Report on the State of the District produced by CBMDC Research and<br />
Consultation Service 2006 and 2007 updates)<br />
83 Progress in Leeds City Region (LCR Secretariat and Yorkshire Future, 2009)<br />
292
Forecast increases in employment for <strong>Bradford</strong> District, however, could potentially increase<br />
peak period traffic across the cordon by as much as 8% between 2005 and 2011. The LTP<br />
target to restrict this to 3% or less assumes that growth will be limited by a significant<br />
expansion in City Centre living, accompanied by the effects of increased rail use and car<br />
sharing (under the Liftshare scheme).<br />
The <strong>Bradford</strong> SATURN model shows that the person journey times on the three <strong>Bradford</strong><br />
congestion routes (A647 Leeds Road, A650 Aire Valley Road and Little Horton Lane) would<br />
rise by around 5% which is well within the overall West Yorkshire target of 7%. 84<br />
9.2.2 Commuting Patterns<br />
The 2001 Census revealed important information about how and where people travelled to<br />
work in the district. According to origin-destination data from the 2001 census:<br />
• Of <strong>Bradford</strong>’s 191,200 employed residents:<br />
- 78% also work in <strong>Bradford</strong><br />
- 22% commute outside the district to work<br />
• Of 194,700 people who work within <strong>Bradford</strong> District:<br />
- 77% are <strong>Bradford</strong> residents<br />
- 23% are in-commuters<br />
• 41,400 people who live in <strong>Bradford</strong> commute outside the district to work<br />
- Over half of these commuters work in Leeds<br />
- 80% of the trips made out of the District are by car<br />
- Over 9% are made by train<br />
• 44,900 people who live elsewhere commute into the District to work<br />
- Over a third of these people come from Leeds<br />
- A further 20% come from Kirklees, and 16% from Calderdale<br />
- Nearly 86% of the trips into the District are made by car<br />
- Only 3% of commuters into <strong>Bradford</strong> arrive by train<br />
• Around 3,500 more people commute into the District than commute out. 85<br />
84 West Yorkshire Congestion Target Delivery Plan (2009)<br />
85 Recent economic forecasting by WM Enterprise for Inputs into the <strong>Bradford</strong> Economic <strong>Strategy</strong><br />
(2007) showed that since the 2001 census there is likely to have been a shift from a net import of<br />
labour to a larger net export – with more people commuting out than commute in. This shift is driven<br />
by the growth in population in <strong>Bradford</strong> compared to the increase in job opportunities inside and<br />
outside the district.<br />
293
Table: Commuting Counts in and out of West Yorkshire Districts<br />
• <strong>Bradford</strong> and Leeds is the heaviest corridor between West Yorkshire districts and<br />
the most balanced.<br />
• 15% of people who work in <strong>Bradford</strong> district do so in the city centre (29,000 approx)<br />
– of these one third travels from outside the district.<br />
• Between 1991 and 2001 the average distance travelled to work by people working<br />
in the district increased by 21% to 8.5km, slightly below the West Yorkshire figure of<br />
25%<br />
• 23% of people who work in <strong>Bradford</strong> district travel less than 2km to work, of these<br />
half travel by car.<br />
• The proportion of <strong>Bradford</strong> residents travelling to work by car rose by 6% between<br />
1991 and 2001 compared with a West Yorkshire figure of 3%.<br />
Commuting within the LCR<br />
There are significant movements of commuters between districts within west Yorkshire, and<br />
other LCR districts, with the highest two-way flow between Leeds and <strong>Bradford</strong>.<br />
There is a net inward flow of commuter into <strong>Bradford</strong> from all surrounding districts except<br />
Leeds, which receives a net gain of 6,000 <strong>Bradford</strong> commuters.<br />
294
Figure: Largest Commuting Flows within Leeds City Region (counts over 400 shown)<br />
Commuting by mode of travel<br />
Car is the dominant mode of transport for people travelling to work, accounting for 63% of all<br />
trips to work made by <strong>Bradford</strong>’s employed residents – higher than the regional average. 80% of<br />
out-commuters and 86% of in-commuters travel by car. Car travel accounts for 59% of trips by<br />
people living and working within <strong>Bradford</strong>, where a higher proportion of trips to work are made<br />
by bus, and on foot.<br />
Travel by train is significant for commuting trips out of the District, with 9% of trips out being<br />
made by train. A lower proportion of trips into <strong>Bradford</strong> (3%) are by train.<br />
9.2.3 Car ownership<br />
Between 1991 and 2001, the total number of cars owned in <strong>Bradford</strong> rose by 28% (the<br />
national figure was 23%). The proportion of households with no car fell from 41% to 33%,<br />
over the same period. The 2001 figure for England and Wales is 27%. Forecasts for car<br />
ownership show that this trend is set to continue - between 2001 and 2015 car ownership is<br />
set to rise by 28% in <strong>Bradford</strong> compared with a national forecast of around 23%.<br />
Table : Car ownership in <strong>Bradford</strong> District-1<br />
H’hlds with no cars or<br />
vans<br />
H’hlds with one car<br />
or van<br />
<strong>Bradford</strong> District- no 58592 79003 42651<br />
<strong>Bradford</strong> District- % 32.3 43.9 23.8<br />
Source: Census 2001<br />
H’hlds with two or<br />
more cars or vans<br />
295
Table : Car ownership in <strong>Bradford</strong> District-2<br />
% of H’hlds with no<br />
cars or vans<br />
Cars or vans per<br />
H’hlds<br />
England and Wales 26.8 1.11<br />
West Yorkshire 32.2 0.98<br />
<strong>Bradford</strong> District 32.3 0.97 309<br />
Source: Census 2001<br />
9.2.4 Congestion<br />
Rank (out of 378<br />
LAs)<br />
Congestion in <strong>Bradford</strong> is not a district wide problem though there are hot spots, especially at<br />
peak times. Whilst there is little change recorded at particular periods it is clear that public<br />
perception believes there to be increasing congestion. This is most likely manifested in<br />
lengthening of peak periods as drivers seek to avoid congestion. Studies included in the LTP<br />
reveal that whilst many of the key junctions and the corridors leading to them are congested<br />
in the morning peak period, a substantial number are remaining so throughout the inter-peak<br />
period, especially on the outer ring road, in the city centre and Airedale. (Congestion is<br />
defined as traffic speeds less than 70% of speed limit.) This is a concern for those journeys<br />
involving either travelling as part of the working procedure or the transfer of goods and<br />
equipment.<br />
The <strong>Bradford</strong> District Transport <strong>Study</strong> 86 has identified eight major radial routes to and from<br />
central <strong>Bradford</strong> as being the most important transport corridors within the district. Of those<br />
eight radial routes, three were identified in the West Yorkshire Local Transport Plan as<br />
having regional significance and designated ‘Congestion Corridors’.<br />
The radial routes and congestion corridors within the <strong>Bradford</strong> district are:<br />
1: A647 Leeds Road (Congestion Corridor);<br />
2: A650 Wakefield Road;<br />
3: A641 Manchester Road (Congestion Corridor is Little Horton Lane);<br />
4: A647 Great Horton Road;<br />
5: B6145 Thornton Road;<br />
6: A650 Aire Valley Road (Congestion Corridor);<br />
7: A6037 Canal Road;<br />
8: A658 Harrogate Road.<br />
The recent update of the West Yorkshire Urban Congestion Target Delivery Plan (UCTDP)<br />
has highlighted the current levels of congestions on these 3 <strong>Bradford</strong> congestion corridors<br />
which are among the 13 specifically chosen routes across the region to tackle congestion.<br />
The average journey time for vehicles on A650 Mannigham Lane is 5 mins/mile, equating an<br />
average speed of just 12mph, although that speed falls to an even lower level during peak<br />
periods. The average journey time on A647 Leeds Road is 4min 30 seconds and 3min 45<br />
seconds on Little Horton Lane.<br />
86 The <strong>Bradford</strong> District Transport <strong>Study</strong> (Interim report by Steer Davies Gleave, 2009)<br />
296
The <strong>Bradford</strong> SATURN model shows that the person journey times on the three <strong>Bradford</strong><br />
congestion routes would rise by around 5% which is well within the overall West Yorkshire<br />
target of 7%. 87<br />
In the future, major regeneration projects, particularly in the city centre itself are likely to lead<br />
to increased traffic movements on inner and outer ring roads. Employment growth in the<br />
M606 corridor is likely to lead to increased congestion on the M606-A6177-A650 and the<br />
A650. Future growth in the numbers of jobs and housing in the Airedale Corridor will put<br />
increased pressure on road and rail capacity in the Aire Valley where the topography<br />
concentrates local movements and through movements to North Yorkshire.<br />
9.2.5 Environmental Issues<br />
Road traffic is the main source of air-borne pollution in <strong>Bradford</strong>. The Council has already<br />
established 4 Air Quality Management Areas in localities where levels of Nitrogen Oxide<br />
were found to be higher than acceptable. The location of all the AQMAs identified experience<br />
significant levels of traffic congestion. The large volume and varied types of vehicular traffics<br />
are the major sources of this pollutant at those sites. Measures to try and improve air quality<br />
in these locations are being considered. (See Environment chapter for further consideration<br />
of air quality matters.)<br />
It is possible to reduce the impact of transport on the environment, especially with regard to<br />
its effect on air quality and its contribution to climate change by reducing the length and<br />
number of car journeys and encouraging the use of alternative modes of transport.<br />
There are some locations where Travel Plans can have an impact on car usage, for example,<br />
major employers, schools and developments generating significant amounts of travel.<br />
<strong>Bradford</strong> Carshare scheme is now well established, with 600 members who have saved over<br />
50 tonnes of CO2. The <strong>Bradford</strong> Council Walking Bus scheme now runs at seven schools in<br />
the district - Aire View Infants in Silsden, Eldwick Primary in Bingley, All Saints School in<br />
Ilkley, Parkwood School in Keighley, Wibsey School in Wibsey, St Walburga's in Shipley and<br />
Keelham Primary in Den-holme, which has significantly reduced the number of car trips to<br />
and from schools and helped children learn about traffic and road safety issues. 88 Moreover,<br />
over 30 employers in <strong>Bradford</strong> have now signed up to the West Yorkshire Travel Plan<br />
network which demonstrates that they are committed to implementing travel plan measures<br />
in their organisations.<br />
Sustainability<br />
Over the past decade the environmental impacts of traffic and transport schemes have been<br />
presented as an issue for sustainability. These impacts, coupled with congestion, have lead<br />
to investigation and introduction of demand management measures. The concerns are now<br />
part of the wider ‘climate change’ concerns and carbon reduction. Whilst demand<br />
management will be important to tackle congestion, it is likely that alternative technology may<br />
87 West Yorkshire Congestion Target Delivery Plan (2009)<br />
88 http://www.thetelegraphandargus.co.uk/news/2260696.children_rank_high_in_walking_to_school/<br />
297
in due course offer alternatives to the carbon content of current vehicle fuels. However,<br />
maintenance of the transport network has its own carbon footprint through electricity usage,<br />
especially for street lighting and traffic signals. Investment in low energy use therefore will<br />
become increasingly significant for investment programmes.<br />
Greenways<br />
A system of greenways is also being developed to encourage biodiversity and enable people<br />
to become more active and get around the District without having to use a car. The initial<br />
strategic routes will be based around the following:<br />
- The Sustrans routes on the canal towpath connecting Shipley to Leeds and Shipley to<br />
Keighley with links to the town centres of Shipley, Bingley and Keighley.<br />
- The planned route along the side of the new canal spur from Shipley to Forster<br />
Square in <strong>Bradford</strong> and its extension through Bowling to link with the Spen Valley<br />
Greenway.<br />
- The planned Worth Way route linking Haworth to Keighley.<br />
- The Great Northern Trail linking Queensbury to Denholme.<br />
9.3 Accessibility and connectivity<br />
In past centuries <strong>Bradford</strong>'s location in <strong>Bradford</strong>ale made communications difficult, except<br />
from the north. Nonetheless, <strong>Bradford</strong> is now well-served by transport systems. <strong>Bradford</strong> was<br />
first connected to the developing turnpike network in 1734, when the first Yorkshire turnpike<br />
was built between Manchester and Leeds via Halifax and <strong>Bradford</strong>. In 1740, the Selby to<br />
Halifax road was constructed through Leeds and <strong>Bradford</strong>. Several more local and longdistance<br />
roads were built through the rest of the century.<br />
Today <strong>Bradford</strong> lies on several trunk roads:<br />
• The A647 to Leeds<br />
• The A650 between Wakefield and Keighley<br />
• The A658 to Harrogate<br />
• The A6036 to Halifax<br />
The M606, a spur off the M62 motorway, connects <strong>Bradford</strong> with the national motorway<br />
network. Although it was originally planned to go directly into the city centre, this has never<br />
been built and is unlikely now ever to be, as a hotel has been built across the proposed route<br />
298
<strong>Bradford</strong> also has a relatively<br />
competitive position in terms<br />
of its connectivity to wider<br />
destinations. Junction 26 of<br />
the major east-west M62<br />
artery lies only three miles<br />
from the city centre,<br />
connected directly by the<br />
M606. Rail access is good,<br />
with direct services taking<br />
around 20 minutes and<br />
departing about 7 times per<br />
hour. There are also good<br />
direct services down the Aire<br />
Valley to Leeds (and the<br />
centre of <strong>Bradford</strong>) and from<br />
Ilkley to Leeds. Frequent,<br />
direct rail links are also<br />
available to Manchester and<br />
Map: Highways and Motorways serving <strong>Bradford</strong><br />
York. Air links to the district are provided by Leeds <strong>Bradford</strong> Airport, which lies around six<br />
miles north-east of the city centre.<br />
A key planning objective of the current national and local planning policies is to ensure that<br />
jobs, shopping, leisure facilities and services are accessible by public transport, cycling and<br />
walking. This is also particularly important in terms of social inclusion for people without<br />
access to a car. However, one of the main transport issues for <strong>Bradford</strong> is the extent to which<br />
developments that attract large numbers of people should be allowed in areas of poor public<br />
transport accessibility. These are normally employment sites where redevelopment is<br />
proposed for either more intensive employment use or for mixed use; for example in the<br />
M606 corridor, which is accessible mainly by car. The impact may be mitigated to some<br />
extent through the effective use of ‘Travel Plan’ initiatives that offer people and businesses a<br />
choice of travel.<br />
There are key services, employment and areas in <strong>Bradford</strong>, which are poorly served by<br />
public transport, cycling and walking. These include employment sites such as East Bowling<br />
in the M606 corridor as mentioned above, some housing sites in Bingley and Thornton and<br />
areas on the Outer Ring Road. <strong>Bradford</strong> Royal Infirmary for instance though served by buses<br />
from <strong>Bradford</strong> City Centre, is poorly accessed by direct bus services from adjacent<br />
residential areas, and areas to the north of the district such as Shipley and Baildon.<br />
9.4 Public Transport<br />
Bus patronage in West Yorkshire has been declining for many years, however rail usage<br />
continues to rise. The number of rail journeys increased by 43% between 1999/2000 and<br />
2005/06 to more than 23 million per year.<br />
299
The number of bus passengers declined by 3% between 1999/2000and 2005/06 to 194.8<br />
million journeys per year through West Yorkshire, although the introduction of specific<br />
initiatives has led to an increase in passengers – the Manchester Road Quality Bus has seen<br />
an increase in 9% of passengers since it was introduced in 2001. 89<br />
Detail assessment of the major public transport services are discussed below-<br />
9.4.1 Train Services<br />
There are 67 MetroTrain stations in West Yorkshire and <strong>Bradford</strong> is connected to all of them<br />
through a mix of long-distance and local services operating on 12 different metro train lines.<br />
The city is centrally served by <strong>Bradford</strong> Interchange to the south of the city centre and by<br />
Forster Square to the north. There are 12 other trains stations located within the boundary of<br />
the district and served by a range of local and national services.<br />
MetroTrain stations in <strong>Bradford</strong> District are:<br />
1. Baildon<br />
2. Ben Rhydding<br />
3. Bingley<br />
4. <strong>Bradford</strong> Forster Square<br />
5. <strong>Bradford</strong> Interchange<br />
6. Burley-in-Wharfedale<br />
7. Crossflatts<br />
8. Frizinghall<br />
9. Ilkley<br />
10. Keighley<br />
11. Menston<br />
12. Saltaire<br />
13. Shipley<br />
14. Steeton and Silsden<br />
Table : Journey Times and Frequency to Metro Stations from <strong>Bradford</strong><br />
Location<br />
Journey Time (1-way)<br />
1<br />
Frequency (daytime)<br />
New Pudsey 8 minutes 4 tph<br />
Shipley 9 minutes 2 tph<br />
Baildon 14 minutes 2 tph<br />
Halifax 14 minutes 4 tph<br />
Bingley 16 minutes 2 tph<br />
Guiseley 19 minutes 2 tph<br />
Leeds<br />
20 minutes<br />
4 tph to Interchange<br />
(via Caldervale line)<br />
89 A Picture of the District (Report on the State of the District produced by CBMDC Research and<br />
Consultation Service 2006 and 2007 updates)<br />
300
Keighley 23 minutes<br />
4 tph to Forster Square<br />
(via Airedale & Wharfdale lines)<br />
2 tph<br />
Brighouse 26 minutes 1 tph<br />
Hebden Bridge 30 minutes 2 tph<br />
Ilkley 33 minutes 2 tph<br />
Morley<br />
1 change 47 minutes 1 tph Morley - Leeds<br />
4 tph Leeds - <strong>Bradford</strong><br />
Dewsbury<br />
1 change 48 minutes 1 tph Deswbury - Leeds<br />
4 tph Leeds - <strong>Bradford</strong><br />
Horsforth<br />
1 change 50 minutes 2 tph Horsforth - Leeds<br />
4 tph Leeds - <strong>Bradford</strong><br />
Wakefield<br />
(Westgate)<br />
1 change 50 minutes<br />
2 tph Wakefield Westgate –Leeds<br />
4 tph Leeds - <strong>Bradford</strong><br />
1 Journey times taken from National Rail enquiries journey planner to arrive 0900 with least changes<br />
possible.<br />
Description of some of the major train stations and their services are presented below:<br />
<strong>Bradford</strong> Interchange<br />
<strong>Bradford</strong> Interchange is on the Caldervale Line and is one of the two railway stations serving<br />
the city of <strong>Bradford</strong>. The other station is, as mentioned above, Forster Square, ten minutes'<br />
walk away.<br />
During Monday to Saturday daytimes, services run every 15 minutes between the<br />
Interchange and Leeds, and hourly onwards to York and Selby respectively. On evenings<br />
and Sundays there is a half-hourly service to Leeds and usually hourly to York.<br />
In the other direction there is a train every 15 minutes to Halifax with two trains an hour<br />
continuing to Manchester Victoria (one limited stop, the other serving all stations to<br />
Rochdale), one to Blackpool North and one to Wakefield Westgate via Huddersfield where<br />
customers can change for Sheffield and Manchester Airport.<br />
Sundays there is a half-hourly service to Halifax with an hourly service on to Manchester<br />
Victoria and one train an hour alternates between Blackpool North and Huddersfield.<br />
Due to the geography of <strong>Bradford</strong>, the station was built as a terminus. Trains have to reverse<br />
out of the station, and drivers have to change to the other end of the train.<br />
Recently it has been announced that direct rail services between <strong>Bradford</strong> Interchange and<br />
London are set to return for the first time in more than a decade. Grand Central Railway - an<br />
open-access company that operates services between London and Sunderland, had<br />
proposed to run services into <strong>Bradford</strong> Interchange using the East Coast Main Line from<br />
Kings Cross via Halifax, Brighouse, Wakefield Kirgate, Pontefract Monkhill and Doncaster<br />
301
under the name the ‘West Riding Service’. The Office of Rail Regulation (ORR) has granted<br />
them permission to run three return services a day between the Interchange and Kings Cross<br />
and it is scheduled to start from December 13, 2009 using 125mph streamlined trains.<br />
<strong>Bradford</strong> Forster Square<br />
Trains from <strong>Bradford</strong> Forster Square are operated by Northern Rail and National Express<br />
East Coast. Most trains are run by Northern Rail; these are towards Leeds (on the Leeds-<br />
<strong>Bradford</strong> Line), Skipton (on the Airedale Line) and Ilkley (on the Wharfedale Line). During<br />
Monday to Saturday daytimes, trains operate every 30 minutes on each route. During the<br />
evenings, there are trains every hour to each of Skipton and Ilkley; on Sundays these run<br />
every two hours. At these times there are no trains to Leeds; passengers have to change at<br />
Shipley.<br />
National Express East Coast operates around three services per day via Leeds and the East<br />
Coast Main Line to London Kings Cross.<br />
Shipley<br />
Train services are mostly commuter services between Leeds and <strong>Bradford</strong>, and from the<br />
Airedale Line and the Wharfedale Line into Leeds and <strong>Bradford</strong>.<br />
During Monday to Saturday daytimes, these operate every 30 minutes on each of the<br />
following routes:<br />
• Leeds-<strong>Bradford</strong> Forster Square;<br />
• Leeds-Skipton;<br />
• <strong>Bradford</strong> Forster Square-Skipton;<br />
• <strong>Bradford</strong> Forster Square-Ilkley.<br />
In Evenings a half hourly service is maintained between Leeds and Skipton. Ilkley and<br />
Skipton to <strong>Bradford</strong> are hourly. There is no direct service between Leeds and <strong>Bradford</strong> but a<br />
shuttle from Shipley to <strong>Bradford</strong> connects with Leeds departures. On Sundays, Ilkley/Skipton<br />
- <strong>Bradford</strong> is every 2 hours with Skipton and <strong>Bradford</strong> to Leeds every hour.<br />
There are also a number of trains each day from Leeds to Carlisle (six each way weekdays,<br />
seven on Saturdays and three on Sundays) and Morecambe (four on weekdays, two or four<br />
on Sundays; both routes operated by Northern Rail), and from <strong>Bradford</strong> Forster Square to<br />
London King's Cross (via Leeds), operated by NXEC.<br />
Keighley<br />
The station is located on the Airedale Line and managed by Northern Rail, who operate most<br />
of the passenger trains serving it. Electric trains operate frequently from Keighley towards<br />
<strong>Bradford</strong> Forster Square, Leeds and Skipton. Longer distance trains on the Leeds to<br />
Morecambe Line and Settle to Carlisle Line also call here.<br />
302
Keighley is also the northern terminus of the Keighley and Worth Valley Railway. This is a<br />
heritage branch-line railway run by volunteers that was originally built by the Midland Railway<br />
and opened in 1867. Closed to passenger traffic in 1962, it was reopened by the K&WVR<br />
Preservation Society six years later and is now a popular tourist attraction.<br />
There is a half-hourly service to both Leeds and <strong>Bradford</strong> Forster Square and four trains an<br />
hour on to Skipton during Monday to Saturday daytime. The evening frequency is hourly to<br />
<strong>Bradford</strong> and half hourly to Leeds, with three trains per hour to Skipton. On Sundays there is<br />
an hourly service to Leeds and a two-hourly service to <strong>Bradford</strong> with two or three trains per<br />
hour to Skipton. There is usually one longer distance train per hour to either Carlisle or<br />
Morecambe.<br />
In addition to the above, National Express East Coast operate one train daily to London<br />
King's Cross, via Leeds and the East Coast Main Line.<br />
The Keighley and Worth Valley service runs daily during the summer and at weekends in<br />
other seasons.<br />
Figure: Annual rail passenger usage of <strong>Bradford</strong> Stations*<br />
Millions<br />
3<br />
2.5<br />
2<br />
1.5<br />
1<br />
0.5<br />
0<br />
<strong>Bradford</strong><br />
Interchange<br />
Annual rail passenger usage<br />
<strong>Bradford</strong><br />
Forster<br />
Square<br />
Shipley Keighley Ilkley<br />
2004/05 2005/06 2006/07<br />
* Annual passenger usage based on sales of tickets in stated financial year(s) which end<br />
or originate at <strong>Bradford</strong> Interchange from Office of Rail Regulation statistics.<br />
Rail is expected to continue to be the dominant public transport mode in those corridors<br />
where it exists, notably Airedale. Airedale and Wharfedale services are the busiest in the<br />
West Yorkshire network as are Shipley and the two <strong>Bradford</strong> stations. However,<br />
overcrowding on some peak services into both <strong>Bradford</strong> city centre stations is still an issue<br />
and needs to be addressed. Whilst the high standard of the Forster Square service is<br />
recognised, services to the south of the city are of poor quality in terms of both rolling stock<br />
and infrastructure provision and considerable investment is needed.<br />
303
The immediate investment priorities for the local network are set out in Metro’s Rail Plan 6.<br />
This identifies two of the four proposed new stations as being in <strong>Bradford</strong> district with Low<br />
Moor the most ready to introduce. This does not include the Manningham station proposed in<br />
the Masterplan. The logic for this station is strong as part of a recasting of <strong>Bradford</strong> Forster<br />
Square – Leeds services which will also serve a new station in north <strong>Bradford</strong> at Apperley<br />
Bridge.<br />
9.4.2 Bus and Coach Services<br />
First Group presently run the majority of the local bus network around <strong>Bradford</strong>, including the<br />
high-frequency core ‘Overground’ network, and services to Leeds, Halifax and Huddersfield.<br />
Other services are run by:<br />
• Arriva – operate longer distance services to Dewsbury, Wakefield and Sheffield<br />
• Keighley and District Travel – operate the local Keighley network including a number<br />
of <strong>Bradford</strong> connections<br />
• Black Prince Buses – operate a number of services to Leeds.<br />
High frequency bus networks have been developed in <strong>Bradford</strong> and Keighley and there has<br />
been investment made by operators in high quality corridors such as the Keighley-<strong>Bradford</strong><br />
662 route. A ‘guided bus’ corridor has also been developed on Manchester Road (A640)<br />
which has retained patronage levels.<br />
Table: Major bus stations in <strong>Bradford</strong>.<br />
Description :<br />
List of Main<br />
Operators using<br />
this bus station :<br />
<strong>Bradford</strong><br />
Interchange<br />
29 Drive-In Reverse<br />
Out stands. 1 set<br />
down only stand.<br />
Upper and lower<br />
concourse. On same<br />
site as <strong>Bradford</strong><br />
Interchange railway<br />
station.<br />
Arriva, First, Halifax<br />
Joint Committee,<br />
TLC Travel,<br />
Transdev Keighley<br />
and District, National<br />
Express<br />
Keighley Bus<br />
Station<br />
17 stand Drive-In<br />
Reverse-Out bus<br />
station with central<br />
passenger<br />
concourse.<br />
Jacksons, Transdev<br />
Burnley and Pendle,<br />
Transdev Keighley<br />
and District, Tyrer<br />
Tours<br />
Ilkley Bus<br />
Station<br />
3 bus shelters<br />
surrounding a<br />
layover and car<br />
parking area.<br />
Next to Ilkley rail<br />
station.<br />
First, Transdev<br />
Keighley and<br />
District, Pride of<br />
the Dales.<br />
Daily Footfall : 25,803 17,324 2,288 5,518<br />
Recent major<br />
improvement<br />
2001 Rebuilt in 2002 Rebuilt in 1998<br />
Staffed: Yes Yes No No<br />
Shipley Market<br />
Place<br />
Drive through bus<br />
point on public<br />
highway (Market<br />
Square) - 9<br />
stands.<br />
First, Transdev<br />
Keighley and<br />
District, National<br />
Express<br />
Complete<br />
upgrading<br />
CCTV Coverage: Yes Yes Yes Yeas<br />
304
Facilities:<br />
Maintained by<br />
Metro:<br />
* Facility not provided by Metro<br />
Baby Changing<br />
Facilities, Cafe*,<br />
Disabled Persons<br />
Toilet, Escalators,<br />
Information Help<br />
Point, Lifts,<br />
Newsagent*, Photo<br />
Booths, Toilets,<br />
Travel Centre,<br />
Baby Changing<br />
Facilities, Cash<br />
Machines, Disabled<br />
Toilets, Newsagent,<br />
Photo Booths,<br />
Toilets, Travel<br />
Centre*, Telephones.<br />
Real Time<br />
Information,<br />
Information Help<br />
Point,<br />
Newsagent,<br />
Telephones,<br />
Travel Centre<br />
Yes Yes Yes Yes<br />
Cafe*, Disabled<br />
Toilet*,<br />
Newsagents*,<br />
Telephones,<br />
Toilets*<br />
The MetroConnect (737 and 747) services connect the city to Leeds <strong>Bradford</strong> International<br />
Airport and call at both the Interchange and Forster Square stations. MetroConnect MC3<br />
provides services in Little Horton area connecting Smiddles Lane - Great Horton - Little<br />
Horton - West Bowling.<br />
AccessBus, a dial-a-ride bus service operated by the Metro, provides door-to-door local<br />
transport to people who are unable to use conventional bus services. The service is free of<br />
charge to residents of <strong>Bradford</strong> and operates between:<br />
• 9am and 5.30pm Monday to Saturday<br />
• 9am - 5pm on Sunday.<br />
• A limited evening service is available to groups of 5 or more.<br />
Due to the very high demand for the service travel is restricted to local journeys only. Most<br />
trips are for shopping purposes, such as to the local supermarket or shopping centre, but<br />
also provides a limited number of journeys for social purposes, e.g. to the local community<br />
centres.<br />
Bus services in <strong>Bradford</strong> are very well used across the district and is rated one of the top<br />
services within West Yorkshire. The outcome of a recent public opinion surveys undertaken<br />
earlier in 2008 by independent researchers on behalf of Metro has highlighted that 73% of<br />
<strong>Bradford</strong> respondents who used local bus services were satisfied with those services (BVPI<br />
103). This was significantly higher than the West Yorkshire average of 67% and was the<br />
highest level of satisfaction of the five districts. Furthermore, 82% of <strong>Bradford</strong> respondents<br />
who used local bus services were satisfied with local provision of public transport information<br />
(BVPI 104). Again this was the highest level of satisfaction within West Yorkshire.<br />
Satisfaction levels relating to the safety, cleanliness and reliability were also found to be<br />
higher in <strong>Bradford</strong> than the West Yorkshire average and these have increased compared to<br />
previous years.<br />
Recently the council has adopted a ‘Bus Action Plan 2008-11’ in partnership with the Metro,<br />
West Yorkshire Police and bus operators First, Keighley & District Travel and Arriva which<br />
recognises the comparatively positive performances of the district’s bus services and<br />
identified a number of specific areas where further measures is needed to improve the<br />
305
services including congestion and punctuality, effective interchange and bus stop<br />
infrastructure and better accessibility.<br />
There is also a Freecitybus service funded by <strong>Bradford</strong> Council and Metro that run every ten<br />
minutes from 7am to 7pm Monday to Friday and 8am to 5:30pm on Saturdays covering the<br />
city centre, the university and the college campus.<br />
Figure: City Centre Free Bus Route<br />
The service was initially launched on 29 September 2008 with a six month trial ending on 28<br />
March 2009. At the end of the trial period a survey work was undertaken on the service<br />
which indicated that the service was exceeding all of its predetermined targets in terms of<br />
patronage, modal shift, trip generation, mobility and accessibility. Therefore long term<br />
funding for the service was secured from the council and its partners and it has become a<br />
permanent transport facility in the city centre.<br />
National Express operates long distance coach services from <strong>Bradford</strong> Interchange.<br />
Coaches run from their own bays in the travel interchange to many towns and cities within<br />
the UK and also providing linking services between Leeds-<strong>Bradford</strong> International and other<br />
major Airports. The Euroline, also operated by the National Express, connects to over 500<br />
European destinations. A network of 32 independent coach companies provides services to<br />
destinations covering the whole of Continental Europe, plus other destinations such as<br />
Morocco.<br />
The New Bharat Coaches, based in Southall, also runs a service to and from the <strong>Bradford</strong><br />
Interchange once everyday via Leicester and Derby.<br />
In March 2009, the Stagecoach group, in partnership with East Midland Trains, has also<br />
introduced a new budget integrated bus and rail services connecting <strong>Bradford</strong> with London St<br />
Pancras station. The Megabusplus services depart from the bus stop located on Mayo Ave<br />
outside the Morrisons superstore.<br />
9.4.3 Taxis<br />
'Hackney Carriage' is the licensed Taxi services in <strong>Bradford</strong>. The Council has the right to<br />
regulate the number of Hackney Carriage licences it issues, or may decide to deregulate.<br />
306
Currently there are 224 Hackney Carriage taxis in <strong>Bradford</strong> and the council will review the<br />
situation in 2009.<br />
Hackney Carriage fares are regulated by the Council. All Hackney Carriage vehicles are<br />
inspected at least once per annum to a standard determined by the Council.<br />
Private Hire Vehicles cannot ply for hire in the street or at taxi ranks. Journeys must be prebooked,<br />
normally by phone or in person at a booking office. Fares for private hire vehicles<br />
are not regulated by the Council - the cost of a journey will normally be based on a rate per<br />
mile or should be agreed with the company before the journey.<br />
Private Hire vehicles must be licensed by the Council.<br />
9.5 Air Travel<br />
The city is served by both Leeds <strong>Bradford</strong> International Airport (LBIA), 6 miles (9.7 km) to the<br />
north east of the city, and Manchester International Airport located 50 miles (80 km) away at<br />
Ringway in the City of Manchester.<br />
By the number of passengers handled, Leeds <strong>Bradford</strong> is the 16th busiest in the UK and<br />
Yorkshire's largest. There has been rapid expansion to the airport in recent years and direct<br />
flights are now available to over 70 business and leisure destinations (July 2009). Around<br />
3 million passengers used the airport in 2006. It is the home base of economy Airline<br />
Jet2.com, voted Best European Short Haul Airline 2006.<br />
Figure: Passenger Numbers at LBIA 1997-2008<br />
Source: UK Airport Statistics 2008-Annual<br />
Recently low cost airline Ryanair has announced that it is going to open a new base at LBIA<br />
investing more that £54 million and creating opportunities for around 1,000 new jobs. The<br />
307
Dublin-based company will offer 14 new routes and 63 weekly return flights from the base<br />
taking its total number of destinations from the airport to 17.<br />
The airport was in public ownership until May 2007, when it was sold for £145.5 million to<br />
Bridgepoint Capital. Bridgepoint announced that a further £70 million would be invested in<br />
airport improvements, to boost passenger figures to over 7 million by 2015. 90 The airport has<br />
recently started a new long-haul route to Islamabad three times a week using wide-bodied<br />
Airbus A310 aircraft. It is hoped this spurs on new routes from the airport.<br />
Below is the full list of direct flights and holiday destinations available.<br />
Africa<br />
Tunisia<br />
Austria<br />
Innsbruck<br />
Salzburg<br />
Balearics Islands<br />
Mahon – Menorca<br />
Palma – Majorca<br />
Ibiza<br />
Belgium<br />
Brussels<br />
Bulgaria<br />
Bourgas<br />
Canary Islands<br />
Fuerteventura<br />
Gran Canaria<br />
Lanzarote<br />
Tenerife<br />
Caribbean<br />
Barbados<br />
Channel Islands<br />
Jersey<br />
Croatia<br />
Dubrovnik<br />
Cyprus<br />
Larnaca<br />
Paphos<br />
Czech Republic<br />
Prague<br />
Egypt<br />
Sharm el Sheikh<br />
France<br />
Avignon<br />
Bergerac<br />
Chambery<br />
La Rochelle<br />
Nice<br />
Paris<br />
Toulouse<br />
Germany<br />
Düsseldorf<br />
Greece<br />
Corfu<br />
Crete<br />
Rhodes<br />
Zante<br />
Holland<br />
Amsterdam<br />
Iceland<br />
Italy<br />
Milan<br />
Pisa<br />
Rome<br />
Sardinia<br />
Venice Marco Polo<br />
Verona<br />
Lapland<br />
Malta<br />
Malta<br />
Pakistan<br />
Islamabad<br />
Portugal<br />
Faro – Algarve<br />
Poland<br />
Krakow<br />
Mainland Spain<br />
Alicante – Costa Blanca<br />
Almeria - Costa Almeria<br />
Barcelona - Costa Brava<br />
Girona - Costa Brava<br />
Malaga – Costa Del Sol<br />
Murcia<br />
Switzerland<br />
Geneva<br />
Turkey<br />
Bodrum<br />
Dalaman<br />
United Kingdom & Ireland<br />
Aberdeen<br />
Belfast City<br />
Belfast International<br />
Bristol<br />
Dublin<br />
Exeter<br />
Edinburgh<br />
Glasgow<br />
Isle Of Man<br />
London Gatwick<br />
Newquay<br />
Plymouth<br />
Southampton<br />
90 http://www.thetelegraphandargus.co.uk/news/1374024.airport_sold_for_145_million_to_bridgepoint/<br />
308
The LBIA plays an important part in building the City Region’s economy and its contribution to the<br />
region’s economy is set to grow as the passenger throughput is expected to reach from 2.6m in<br />
2005 to 5.1m in 2016.<br />
Over 89% of passengers originate in the Leeds City Region using business or leisure flights on<br />
short and medium haul services within the UK and to mainland Europe. Similarly, it acts as a<br />
significant ‘gateway’ to tourist and business visitors to the Region, as around 900,000 overseas<br />
visitors came to the Yorkshire and Humber Region in 2003, spending approximately £294 million.<br />
By 2030, the Airport is forecast to handle 8.2 million passengers and support around 4,100 FTE<br />
jobs and provide £154 million of income 91 .<br />
The Airport therefore has an increasingly important role to play in supporting this growing industry.<br />
It has developed a strategic masterplan 2005-2016 which shows how the airport might develop in<br />
the future in terms access, transport mode share and maximising the efficiency of its existing land<br />
and facilities.<br />
Recently Leeds City Council has approved a £28million expansion plan for LBIA that includes a<br />
new two storey building extension and internal improvements to the existing terminal. The<br />
extension will create a new check-in area and security facilities, and a new departure lounge and<br />
shops on the first floor. It follows a recent £2m re-development of the forecourt.<br />
Manchester airport provides much wider international destinations to the people of the district. This<br />
airport is the fourth busiest airport in the UK and the biggest outside of London, in terms of annual<br />
passenger throughput.<br />
The airport provides regular direct flights to over 190 destinations worldwide by 84 airlines and is<br />
the main international gateway to and from the North-West of England. It offers non-stop<br />
scheduled flights to destinations across Europe, North America, Africa, South Asia, the Caribbean,<br />
Middle East and Far East.<br />
Moreover, 65 tour operators utilise the airport’s facility and many of Manchester's overseas routes<br />
are served by charter flights to holiday destinations, some being seasonal.<br />
9.6 Cycling and Walking<br />
Cycling is not an intensively used form of transport in <strong>Bradford</strong> but provides a sustainable, healthy<br />
means of travel for a range of journeys that could otherwise be carried out by car, not only for<br />
leisure but also for some work and school journeys. Furthermore, encouragement of travel by cycle<br />
will assist in minimising the demand for road space from other road users. However, the numbers<br />
of accidents involving cycling casualties is high in relation to the levels of cycling that take place,<br />
highlighting the vulnerability of this group of road users. Allocation of road space for cyclists is a<br />
matter for local scheme design whereas the creation of long distance cycle routes including the<br />
National Routes 66 and 69 and the Great Northern Trail is of strategic importance to the district.<br />
91 Leeds <strong>Bradford</strong> International Airport (2004) LBIA Masterplan 2005-2016. Leeds: LBIA.<br />
309
The <strong>Bradford</strong> Living Street proposal which is pat of the Sustrans’ Connect2 project is expected to<br />
create a walking and cycling network linking East and West Bowling with Little Horton, and by<br />
extending <strong>Bradford</strong>'s traffic free ‘Living Street' over the busy A647 Manchester Road to a network<br />
of traffic-free paths and quiet roads reaching deep into the surrounding communities - benefiting<br />
more than 85,000 people living within a mile of the scheme.<br />
This urban greenway and a new bridge over Manchester Road will transform the community by<br />
providing a three mile continuous walking and cycling route from the city centre to Bowling Park<br />
with local links to schools, the university and the hospital and transport interchange - enabling<br />
easier everyday journeys to school, to work or the shops, without having to negotiate the busy dual<br />
carriageway which cuts the community in two.<br />
<strong>Bradford</strong> Council are working to make the bridge the best it can be and throughout 2009 and 2010<br />
will go through extensive public consultation, design development and planning phases before<br />
work to build the bridge can begin in 2011. Its opening in 2012 will mark the completion of the<br />
Connect2 scheme in <strong>Bradford</strong>. 92<br />
The <strong>Bradford</strong> City Cycling Map covers the whole <strong>Bradford</strong> District and shows a network of routes<br />
recommended by cyclists, consisting of a number of signed cycle routes, many quiet roads, traffic<br />
calmed areas and off highway links. The map was first produced in 2000 and now has been<br />
updated in 2009 taking account of the additional cycle provision across the district.<br />
The <strong>Bradford</strong> Cycle map is available as a free hard copy map from tourist information centres,<br />
council buildings, libraries, bike shops, travel centres and leisure centres and other outlets around<br />
the district. Alternatively it can be downloaded from the following link:<br />
http://www.bradford.gov.uk/transport_and_infrastructure/transport_planning/bradford_cycle_map.htm<br />
9.7 Car Parking Provision<br />
Car parking is a key consideration for people who travel by car in <strong>Bradford</strong> District. Two main types<br />
of car parking exist within the control of <strong>Bradford</strong> Council, on street public car parking and off street<br />
public car parking.<br />
Currently there are xxx on street public Council pay and display managed car parking spaces in<br />
<strong>Bradford</strong> District which provides access to town centre facilities including shopping, work, leisure<br />
and education. In addition to this, <strong>Bradford</strong> Council manages xx off street pay and display car<br />
parking within the District. The largest concentration is in <strong>Bradford</strong> City Centre.<br />
<strong>Bradford</strong> city centre has a large supply of off-street parking both in charged facilities and on vacant<br />
sites. The city centre Masterplan proposes the development of many of these sites for<br />
development as well as acknowledging the 1800 spaces being provided at Broadway and<br />
promoting three new and replacement car parks on the perimeter of the city centre. There is also a<br />
good deal of free unrestricted on-street parking throughout the City Centre. The Figure below<br />
presents a map of all principle car parks across the area.<br />
92 http://www.sustransconnect2.org.uk/schemes/project_detail.php?id=17<br />
310
Figure 0: <strong>Bradford</strong> City Centre Principal Public Car Parks (Off Street)<br />
Car Parks No<br />
Wigan Street 116<br />
Burnett Street 180<br />
Crown Court 140<br />
Eurocar 390<br />
Forster Square (N) 450<br />
Forster Square (S) 500<br />
Hall Ings NCP 198<br />
Jacobs Well (Sat only) 958<br />
Leisure Exchange 432<br />
New Southgate 404<br />
Oastler (long stay) 404<br />
Oastler (short stay) 60<br />
Pine Street 105<br />
Radwell Drive 33<br />
Rawson Road 98<br />
Sharpe Street 77<br />
Simes Street 102<br />
St Thomas A 30<br />
St Thomas B 110<br />
Tyson Street 43<br />
Other major car parks in other town centres and tourist destinations within the district are listed<br />
below:<br />
Shipley:<br />
• Market Place Car Park<br />
• Saville Car Park<br />
• Atkinson Car Park<br />
• Westcliffe Road Car Park<br />
• Wharfe Street Car Park<br />
• Swimming Pool Car Park<br />
• Oastler Road Car Park<br />
• Caroline Street Car Park, Saltaire<br />
• Exhibition Road Car Park, Saltaire<br />
Bingley:<br />
• Ferncliffe Road Car Park<br />
• Wellington Street Car Park<br />
• Waterloo Car Park<br />
• Queen Street v<br />
• Main Street Car Park<br />
• Victoria Street Car Park<br />
Keighley:<br />
• Scott Street Car Park<br />
• Church Green Car Park<br />
311
Haworth:<br />
• Museum Car Park<br />
• Bronte Village Car Park<br />
• Gas Street Car Park<br />
• Rawdon Road Car Park<br />
Ilkley:<br />
• South Hawksworth Street<br />
One of the key parking issues is to keep balance between long stay and short stay parking in<br />
the main city and town centres. As a general comparison, parking in <strong>Bradford</strong> is cheaper<br />
than in other West Yorkshire centres and may need to be addressed in the context of wide<br />
area congestion measures.<br />
Table : Comparison of Parking Charges in Leeds and <strong>Bradford</strong> (Aug 2005)<br />
Source: <strong>Bradford</strong> Channel and Market NDFs Transport Report (Ove Arup & Partners Ltd, 2005)<br />
Council parking charges however have been increased by 50p a day or 10p per hour from<br />
3rd August 2009. The move is part of a budget deal struck by <strong>Bradford</strong> Council in February<br />
to raise £170,000 over the year by increasing short-stay parking charges. It applies to the<br />
majority of car parks and on-street parking in <strong>Bradford</strong>, Shipley, Bingley, Keighley, Haworth<br />
and Ilkley.<br />
The charges at some car parks remain unchanged. These are: Shipley: Swimming Pool and<br />
Oastler Road; Baildon: Ian Clough Hall; Esholt: Car and Coach park; Silsden: Wesley Place<br />
and Bridge Street; Haworth: Gas Street and Rawdon Road.<br />
Although the Council has no current proposals to open any new car parks in the city centre,<br />
the Broadway retail development is expected to provide the largest parking facilities in the<br />
city centre. Other changes in car parking provision may occur to those sites on land<br />
earmarked for development, which include Crown Court car park, Alexandra car park and<br />
Burnett Street car park and this could result in a loss of significant number of parking spaces.<br />
In addition to the car parking spaces managed by <strong>Bradford</strong> Council, there are also a number<br />
of privately managed car parking spaces across the district. The following provides a list of<br />
the largest privately managed car parking spaces in <strong>Bradford</strong> District:-<br />
• NCP New Southgate Multi Storey Car Park off Thornton Road, <strong>Bradford</strong>, 432 spaces<br />
• NCP <strong>Bradford</strong> Hall Ings Multi Storey Car Park, <strong>Bradford</strong>, 526 spaces<br />
• Britannia Parking Ltd Leisure Exchange, Vicar Lane, <strong>Bradford</strong>, 432 spaces<br />
312
Location of primary Council owned car parking spaces across the district can be viewed via<br />
the Direct Gov website:-<br />
http://bluebadge.direct.gov.uk/index.php?br_wid=1024&br_hgt=768&stoneage<br />
9.8 Road Injuries<br />
Road injuries in the District are measured against target reductions to 2010 set in the<br />
National Road Safety <strong>Strategy</strong>; the West Yorkshire Local Transport Plan – Safer Roads; and<br />
the Local Public Service Agreement (LPSA1 and 2).<br />
These targets included 40% fewer people killed or seriously injured, 50% fewer children<br />
killed or seriously injured, and 50% fewer pedestrians killed or seriously injured. The LPSA 1<br />
target to reduce the number of people killed or seriously injured on the roads in <strong>Bradford</strong> by a<br />
further 20 people by 31 December 2005 was not met, but the 2010 target reduction in killed<br />
and serious injury to children was met in 2005.<br />
2006 was a year of consolidation after significant falls in road injuries in 2005. Final figures<br />
show that all injuries are slightly more in 2006 than in 2005, with a very small increase in the<br />
numbers of children injured. The figures are still well below those occurring in 2004. The total<br />
for the category ‘All killed and seriously injured’ is marginally above 2005 and more work<br />
needs doing to get back on track to meet the 2010 target reductions. Pedestrian injuries<br />
continue to fall.<br />
LPSA2 target reductions to achieve stretch targets in 2008 in the reduction of killed and<br />
serious injury to children and children overall as pedestrians, cyclists and car passengers,<br />
are still on track.<br />
Further initiatives being developed include pedestrian skills training, speed management and<br />
targeted police enforcement<br />
9.9 Key Facts<br />
• <strong>Bradford</strong>’s road system is dominated by private vehicles with journeys involving a<br />
wide range of origins, destinations and purposes. Car ownership in <strong>Bradford</strong> is also<br />
set to rise at a faster rate than nationally.<br />
• Commuters flow between <strong>Bradford</strong> and Leeds is the highest in Leeds City Region.<br />
There is a net inward flow of commuter into <strong>Bradford</strong> from all surrounding districts<br />
except Leeds, which receives a net gain <strong>Bradford</strong> commuters.<br />
• Congestion in <strong>Bradford</strong> is not a district wide problem though there are hot spots,<br />
especially at peak times at the major radial routes to and from the central part of the<br />
district. In the future, major regeneration projects, particularly in the city centre, and<br />
employment growth in the M606 corridor are likely to lead to increased traffic<br />
movements at inner and outer ring roads. Future growth in the numbers of jobs and<br />
313
housing in the Airedale Corridor will also put increased pressure on road and rail<br />
capacity in the Aire Valley.<br />
• Although <strong>Bradford</strong> District has a relatively competitive position in terms of its<br />
connectivity to wider destination, the city internally faces the challenge of planning<br />
for major infrastructure projects e.g. completion of city centre west ring road, and<br />
allowing large scale/intensive developments in areas of poor transport accessibility.<br />
There are also some key services, employment and housing areas in <strong>Bradford</strong> that<br />
are poorly served by public transport, cycling and walking.<br />
• Road traffic is the main source of air-borne pollution in <strong>Bradford</strong>. All the four Air<br />
Quality Management Areas in the district experience significant levels of traffic<br />
congestion which causes the level of Nitrogen Oxide in those localities being higher<br />
than acceptable. Travel initiatives that reduce the length and number of car journeys<br />
and encourage using alternative modes of transport are increasingly becoming<br />
popular and thus contributing towards reducing the impacts of traffics on the<br />
environment.<br />
• Bus services in <strong>Bradford</strong> are well used across the district and rated by public opinion<br />
survey as one of the top services within West Yorkshire. However, there are specific<br />
areas e.g. congestion, punctuality and better accessibility where further and<br />
effective measures are needed for improvement.<br />
• Rail patronage in the district has increased significantly over the years and is<br />
expected to continue to be the dominant public transport mode in those corridors<br />
where it exists, notably in Airedale. However, lack of adequate park and ride<br />
facilities at stations and overcrowding on some peak services still remain a major<br />
issue and needed to be addressed.<br />
• Air travelling to and from <strong>Bradford</strong> is set to increase as the city is now connected to<br />
more frequent and wider national and international destinations through the Leeds-<br />
<strong>Bradford</strong> International Airport and Manchester Airport. The LBIA is expected to play<br />
a much important regional role in the future and thereby directly contributing to the<br />
economy of the region.<br />
• In the long terms good connections between all public transport modes will be<br />
increasingly important. The district is unlikely to create enough jobs on its own to<br />
meet the demands of a growing workforce, and therefore links with neighbouring<br />
districts will be important to connect people with employment and housing.<br />
314
Sources:<br />
• WYITA (2011) West Yorkshire Local Transport Plan 2011-2026. Report Dated<br />
March 2011. WY Integrated Transport Authority.<br />
• BMDC (2011) <strong>Bradford</strong> LTP3 Local Implementation Plan 2011-2014. Report<br />
Dated June 2011. <strong>Bradford</strong> Council.<br />
• CBMDC (2007) <strong>Bradford</strong> District Transport <strong>Strategy</strong> 2006-2021. <strong>Bradford</strong> Council.<br />
• LCR Secretariat (2009) Progress in Leeds City Region. Leeds City Region<br />
Secretariat and Yorkshire Forward.<br />
• CBMDC (2007) <strong>Bradford</strong> District Sustainable Community strategy- Information<br />
pack and Fact Sheets. Policy Development Service, <strong>Bradford</strong> Council.<br />
• Genecon (2006) BCR Performance Framework: Second Annual Update 2004/05-<br />
2005/06 Final report. Report dated May 2006. Genecon Consultancy Ltd.<br />
• Genecon, King Sturge, Gillespies (2007) Leeds <strong>Bradford</strong> Corridor <strong>Study</strong>. Report<br />
dated July 2007. Leeds <strong>Bradford</strong> Corridor Group.<br />
• LCRDP (2006) Leeds City Region Development Programme- Appendix 4 (Leeds<br />
City Region Transport Vision). Report dated October 2006. Leeds City Council.<br />
• GOYH (2008) the Yorkshire and Humber Plan- Regional Spatial <strong>Strategy</strong> to 2026.<br />
Government office for Yorkshire and the Humber.<br />
• Ove Arup & Partners Ltd (2005) <strong>Bradford</strong> Channel and Market NDFs Transport<br />
Report. Report dated December 2006. BCR.<br />
• Regeneris (2005) <strong>Bradford</strong> Positioning Statement. Report dated May 2006.<br />
Regeneris Consulting.<br />
315
10. ENVIRONMENT<br />
This section of the report appraises the current environmental situation across the district<br />
and also reviews the existing and ongoing studies that deal with the issues.<br />
A wide range of research and study materials have been investigated to compile the facts on<br />
these subject areas. Some of the reports are-<br />
• The Big Plan: Sustainable Community <strong>Strategy</strong> for <strong>Bradford</strong> District (CBMDC, 2008)<br />
• <strong>Bradford</strong> District Environmental <strong>Strategy</strong> 2008-11 (BMDC, 2007)<br />
• <strong>Bradford</strong> District Air Quality Action Plan (BMDC, 2009)<br />
• Air Quality in CBMD: Progress Report (CBMDC, 2007)<br />
• <strong>Bradford</strong> District Carbon Management Programme 2007-12 (BMDC, 2007)<br />
• <strong>Bradford</strong> Strategic Flood Risk Assessment: Final Report ( BMDC, March 2003)<br />
• Review to Consider the Future of Water Management and the Associated problems<br />
of Flooding in the <strong>Bradford</strong> District ( BMDC, 2005)<br />
• Inspection <strong>Strategy</strong> for Contaminated Land in the <strong>Bradford</strong> District (BMDC, 2001)<br />
• <strong>Bradford</strong> Local Biodiversity Action Plan- Draft (CBMDC, 2003)<br />
• YH Regional Biodiversity <strong>Strategy</strong> (Y&H Biodiversity Forum, 2009)<br />
• YH Regional Environment Enhancement <strong>Strategy</strong> 2008-13 (YHREF, 2009)<br />
• Low Carbon and Renewable Energy Capacity in Y&H (AECOM, 2011)<br />
• Weathering the Storm: Yorkshire and Humber Regional Climate Change Adaptation<br />
<strong>Study</strong> (Y&H Assembly, 2009)<br />
• Climate Change Plan for Yorkshire and Humber 2009-2014 (LGYH, 2009)<br />
• West Yorkshire Adaptation Action Plan (AWAY, 2010 )<br />
• West Yorkshire Geodiversity Action Plan (WY Geology Trust, 2008)<br />
• Saltaire World Heritage Site Environmental Capacity <strong>Study</strong> (Atkins, 2006)<br />
• Conservation Area Review Programme (CBMDC, 2007/08)<br />
• Listed Building at Risk Survey (CBMDC, 2005)<br />
10.1 Air Quality<br />
The Government estimates that air pollution in the UK kills between 12,000 and 24,000<br />
people prematurely each year.<br />
Cars are the greatest source of air pollution and they are responsible for the majority of smog<br />
forming gases. The other main sources of air pollutants in <strong>Bradford</strong> are wood and coal<br />
smoke from wood and coal heaters and industry. 93<br />
The Environment Act 1995 introduced the National Air Quality <strong>Strategy</strong> and the requirement<br />
for local authorities to determine if statutory air quality objectives are likely to be exceeded.<br />
All local authorities now report to DEFRA on an annual basis, and have the obligation to<br />
93 A Picture of the District (Report on the State of the District produced by CBMDC Research and<br />
Consultation Service 2006 and 2007 updates)<br />
316
declare Air Quality Management Areas and develop action plans for improvement of air<br />
quality if objectives are likely to be exceeded.<br />
The council has carried out two rounds of review and assessment of air quality in the<br />
<strong>Bradford</strong> district since 2001. The first round was undertaken as a staged process in<br />
accordance with DETR technical guidance and submitted to DETR in December 2000. A<br />
second round of review and assessment was submitted to DEFRA in April 2003.<br />
A subsequent Detailed Assessment of Air Quality was produced in November 2004 updating<br />
the findings of the second round of air quality review. One of the major findings of the<br />
assessment was that it discounted the need for an air quality management declaration at 8 of<br />
the 12 sites it has investigated for nitrogen dioxide as it has been found very unlikely that the<br />
objective will be exceeded at those sites. However, due to identifying concentrations above<br />
the objectives for nitrogen dioxide the study suggested to declare the remaining 4 sites as air<br />
quality management areas (AQMAs). 94<br />
As a result of work done in the second round of review and assessment the council has now<br />
declared the following four AQMAs.<br />
i) Mayo Avenue, <strong>Bradford</strong> (Mayo Avenue Manchester Road junction)<br />
ii) Thornton Road, <strong>Bradford</strong> (Near the junction with Princes Way and Godwin Street<br />
within the City Centre area)<br />
iii) Manningham Lane, <strong>Bradford</strong> (Junction of Manningham Lane and Queens Road)<br />
iv) Shipley Airedale Road, <strong>Bradford</strong><br />
They were declared on the 1st of September 2006. The maps of the four AQMAs can be<br />
seen in Appendix 1 of this chapter.<br />
The AQMAs have been looked at in more detail in a Further Assessment report, which was<br />
submitted to DEFRA in October 2007. At the time of writing this report a Draft Action Plan<br />
has been written and further work is ongoing to complete an Action Plan for the four AQMAs.<br />
Based on the recent assessment it has been understood that the main pollutants of concern<br />
is fine particles and nitrogen dioxide. The particles arise from a wide range of sources, some<br />
of which are outside the District. Around 70% of nitrogen dioxide emissions arise from traffic<br />
pollution. The location of all the 4 AQMAs identified experience significant levels of traffic<br />
congestion. The large volume and varied types of vehicular traffics are the major sources of<br />
this pollutant at those sites.<br />
94 BMDC (2007) Air Quality in the City of <strong>Bradford</strong> <strong>Metropolitan</strong> District-Progress Report 2007. Report<br />
dated December 2007. Department of Environment and Neighbourhood, BMDC.<br />
317
Figure : Locations of the continuous monitoring in the <strong>Bradford</strong> District.<br />
Source: Air Quality in the City of <strong>Bradford</strong> <strong>Metropolitan</strong> District: Progress Report 2007<br />
Continuous monitoring for nitrogen dioxide has taken place at the 9 sites as shown on the<br />
Map 1 and in Table X. The table also shows the monitoring results for NO 2 up to the year<br />
2006. (For further information on the monitoring methods used by <strong>Bradford</strong> MDC such as<br />
quality control and methods etc please refer to the Updating and Screening Assessment<br />
produced in April 2006 which is freely available on the <strong>Bradford</strong> MDC website at the following<br />
web address:<br />
http://www.bradford.gov.uk/council/enviro_protect_and_waste_manage/air_quality_review.as<br />
p.)<br />
318
Table : Continuous monitoring results NO 2<br />
Figure X Below shows the trends in continuous monitoring data for NO 2 between the years<br />
1999 and 2006. The graph illustrates the unusually high number of days with poor pollution<br />
dispersion conditions in 2001 with higher than average annual means for NO 2 for 2001 at all<br />
three sites. The graph does not show any significant trend of either a reduction or increase in<br />
annual mean concentrations for NO 2 .<br />
Figure: Trends in NO 2 Annual Mean 1999 - 2006 95<br />
In addition some passive monitoring using nitrogen dioxide tubes was also undertaken in an<br />
attempt to ascertain the extent of the area of exceedance. The following map identifies the<br />
locations of the nitrogen dioxide tubes that are currently monitoring in <strong>Bradford</strong>. The<br />
corrected NO 2 annual mean for 2006 in µg/m3 is also displayed. The nitrogen dioxide tube<br />
95 Air Quality Progress Report 2007, CBMDC<br />
319
esults are corrected using the method described in Government guidance LAQM.TG (03)<br />
which utilises coexposure with a continuous monitor.<br />
There are no trends to be seen in the historical results as the nitrogen dioxide tubes are not<br />
often kept at the same location for longer than a year, they are generally used as a screening<br />
tool to identify sites that require continuous monitoring.<br />
Figure : Locations of the NO 2 tubes that are currently monitoring in <strong>Bradford</strong><br />
The District also currently has 187 industrial processes subject to local authority air pollution<br />
control (LAPC), requiring them to meet nationally set standards for emissions to air 96 . The<br />
review and assessment of air quality concluded that industrial sources were unlikely to cause<br />
a breach of national air quality objectives.<br />
Reporting of Monitoring Data<br />
The Government owned site in central <strong>Bradford</strong> has been discontinued (as of October 07)<br />
however, past Information about air pollution measured at the site can be seen on Ceefax,<br />
page 413, and on the Internet at http://www.aeat.co.uk/netcen/airqual.<br />
Data from the three automatic monitoring sites owned by the Council can be seen on the<br />
Council website at www.bradford.gov.uk and is also displayed 24 hours a day on computer<br />
screen in The Council Shop, Main Street, Bingley.<br />
96 BMDC (2006). <strong>Bradford</strong> District Environment Partnership <strong>Strategy</strong>. Report dated July 2006. BMDC.<br />
320
Air pollution measured at the Government owned station and all the others in the UK<br />
Automatic Urban Network is reported annually by the National Environmental Technology<br />
Centre.<br />
The National Environmental Technology Centre reports summary data for the 1 UK smoke<br />
monitoring site in <strong>Bradford</strong> centre and nitrogen dioxide levels measured at the four UK<br />
National Survey sites annually.<br />
Air Quality <strong>Strategy</strong><br />
Government guidance strongly recommends that all authorities, particularly those that have<br />
not had to designate AQMAs but who have areas close to the exceedance levels, should<br />
consider drawing up a local air quality strategy. Although <strong>Bradford</strong> MDC has designated<br />
AQMAs at four sites it has been decided that an Air Quality <strong>Strategy</strong> would still be of benefit<br />
to the Authority in addition to Action Plans as a result of the AQMAs.<br />
<strong>Bradford</strong> MDC is still at the preliminary stages of drawing up an air quality strategy. An air<br />
quality strategy steering group has been set up which includes representatives within the<br />
Council from planning, highways, policy and environmental health. The Steering group has<br />
been involved in work on the Action Planning that is taking place as a result of the four<br />
AQMAs. A draft Air Quality Action Plan has been produced in July 2009.<br />
It is anticipated that this group will be widened to include external agencies, other Council<br />
departments such as Leisure Services and other interested parties in the future. One of the<br />
aims of the group has been to ensure that information on air quality is distributed throughout<br />
relevant departments so that the information is available to all those that might need to use it.<br />
It also allows information on relevant air quality matters such as new road developments,<br />
EMAS policy or climate change to be distributed within the group.<br />
10.2 River and Water Quality<br />
The main river systems comprise:-<br />
• The Becks in the south of the district which drain to the south into the River Calder;<br />
• The streams around <strong>Bradford</strong> which drain into <strong>Bradford</strong> Beck and then into the River Aire;<br />
• The River Worth which meets the River Aire in Keighley and drains the catchment from<br />
the moors in the west of the district;<br />
• The River Aire which continues towards Leeds in the east;<br />
• And the River Wharfe which drains across the north of the district towards the east.<br />
The Environment Agency undertakes river water quality sampling across the district and the<br />
summary results are available on the web-site at www.environment-agency.gov.uk ‘What’s in<br />
your backyard?’ section. The information presented there, demonstrates that the water<br />
quality is more likely to be poor or bad (according to the EA’s General Quality Assessment<br />
(GQA) classification system) in the urban areas such as the centre of <strong>Bradford</strong>, and in the<br />
becks to the south of the district which drain toward the Calder catchment. The Aire<br />
catchment tends to have better water quality until it reaches the confluence with <strong>Bradford</strong><br />
Beck in Shipley. The Council is working with the Environment Agency to improve the quality<br />
321
of these watercourses. It is also running a trial involving two areas of reed beds – these are<br />
being used to evaluate their effectiveness in cleaning up diffuse pollution. The Wharfe water<br />
quality tends to be very good through the north of the district.<br />
It should be noted that the GQA classification scheme is only for chemical parameters and<br />
there are other water quality issues involved including pesticides, pathogens and other<br />
criteria related to the current and previous industrial and other effluent impacts on the<br />
watercourses.<br />
In recent years, increased investment in sewage treatment has also brought improvements in<br />
river water quality, but there is still concern about certain pollutants such as contamination<br />
from faulty combined sewer overflows, pesticides and industrial detergents. There are<br />
emerging issues relating to new pollutants such as synthetic human hormones used as<br />
contraceptives which have been detected in water samples. These chemicals are persistent<br />
in waterway ecosystems and may have a hormone disrupter effect on fish, invertebrates and<br />
other indicators of biological water quality. This highlights the need to monitor the<br />
connections between lifestyles and the potential consequences for human environmental<br />
impacts.<br />
Through a system of permits the Environment Agency also regulates anyone wishing to<br />
dispose of effluent to rivers. As well as these point sources it also considers pollution from<br />
diffuse sources such as run-off from contaminated land. In addition to the grading systems<br />
for both chemical and biological pollution, an agreed target or River Quality Objective (RQO)<br />
has been set for certain stretches of a watercourse. The monitoring of waterways in the<br />
District shows an overall improvement in biological and chemical water quality in recent<br />
years.<br />
The water for public supplies in the district comes from surface water. Most of it is from<br />
reservoirs, although there are also a number of licensed spring sources and significant<br />
quantities are abstracted from the River Wharfe. Water is ‘imported’ from higher up the<br />
Wharfe and from the Nidd Valley and pumped to the local reservoirs for distribution. Water is<br />
also abstracted under license for industrial cooling and processing purposes.<br />
10.3 Renewable Energy<br />
In order to meet the Government’s carbon-cutting ambitions, both higher levels of energy<br />
efficiency and much greater use of renewable energy is required. PPS1 ’Planning and<br />
Climate Change’ emphasises the important role of local planning authorities in encouraging<br />
much greater use of local renewable and low-carbon energy in new developments as part of<br />
their strategies for mitigating and adapting to climate change.<br />
The ambitious goal of the Energy White Paper (2007) is to put ourselves on a path to cut the<br />
UK’s carbon dioxide emissions (by some 60% by about 2050), with real progress by 2020,–<br />
by creating a low-carbon economy through improved energy efficiency and increased use of<br />
renewables. The White Paper also confirms the requirement for 10% of UK electricity to<br />
come from renewable energy by 2010 (with an aspiration to double this by 2020). PPS22<br />
322
elating to Renewable Energy aims to promote and encourage, rather than restrict, the<br />
development of renewable energy resources. Renewable energy developments should be<br />
capable of being accommodated in locations where the technology is viable and<br />
environmental, economic and social impacts can be addressed satisfactorily.<br />
Moreover, The Home Energy Conservation Act 1995 requires that local authorities report on<br />
progress towards meeting objectives to improve the energy efficiency of residential<br />
properties in the area. Government has set a target of a 30% reduction in domestic<br />
consumption by 2010 from a baseline figure from 1996. <strong>Bradford</strong>’s cumulative improvement<br />
in energy efficiency between 1996 and 2005 is 15.6%. Based on current rates of progress,<br />
the best estimate is that it will take a further two years to 2012 to meet the target. Carbon<br />
dioxide reduction per annum as a result of this improvement is 588,250 tonnes. 97<br />
<strong>Bradford</strong> is one of the smaller LA's in the region in terms of land size but has a population<br />
that is above the average. The town of <strong>Bradford</strong> has the density necessary to support district<br />
heating networks. The Energy Opportunities Plan 98 shows that there are many public<br />
buildings in the town that could provide anchor loads for such networks.<br />
The council itself runs an Eco-Management and Audit Scheme (EMAS) for its own buildings<br />
and properties. In support of the process it has an ongoing programme of works aiming to<br />
reduce energy consumption in council buildings and to increase use of renewable sources of<br />
energy where appropriate.<br />
Other renewable energy opportunities in the district include wind and hydro opportunities.<br />
There is currently one hydro generation plant operating in Esholt, and a potential site<br />
identified at Greenholme Mills on the border with Harrogate district. <strong>Bradford</strong>’s hydro<br />
potential is among the best in the region and their installation should be sought and<br />
supported wherever feasible.<br />
List of all commercial scale renewable energy generators in <strong>Bradford</strong> should be included.<br />
Because of <strong>Bradford</strong>’s hilly topography the main pressure has been for energy generation<br />
from the wind. The district is largely built-up to the east around <strong>Bradford</strong> but is more rural to<br />
west and north and incorporates areas of moorland. These extra-urban areas are mainly<br />
classified as having a high and very high sensitivity to wind development. For these reasons<br />
wind developments are most likely on a small scale in appropriate pockets of land within<br />
suburban and green belt land. However, the potential for small wind developments in such<br />
situations may be higher than that indicated by the targets in the RSS.<br />
97 BMDC (2007). <strong>Bradford</strong> City Centre Area Action Plan Sustainability Appraisal Final Scoping Report.<br />
Report dated September 2007. Planning Service, Department of Regeneration, BMDC.<br />
98 Low carbon and renewable energy capacity in Y&H- Draft Final Report (AECOM, 2011)<br />
323
Table: Renewable energy sources in <strong>Bradford</strong><br />
Source: Low carbon and renewable energy capacity in Y&H- Draft Final Report (AECOM, 2011)<br />
The Council is also in the process of carrying out an ‘Environmental Constraint Assessment’<br />
for the district which will look into the different level of environmental sensitiveness across<br />
the district (e.g. greenbelt, flood zone, low wind speed zone etc) and help identify potential<br />
locations for renewable energy sources e.g. wind farms, individual turbines etc. An initial<br />
overview of the study suggests that the most potential sites for wind turbines in the district<br />
lies in the south-west at Denholme-Queensbury area near the Ovenden Moor.<br />
In addition, the built-up areas in <strong>Bradford</strong> provide an opportunity for exploiting PV which<br />
should make a significant contribution to renewable energy generation and can stand above<br />
average for any LA's in the region. By 2021 biomass technologies can provide significant<br />
opportunities to further diversify <strong>Bradford</strong>’s power supply. There should also be potential for<br />
growing energy crops on brownfield sites and as an alternative to agricultural crops on<br />
established farmland.<br />
In terms of energy generation from waste, planning permission has been granted to BioGen<br />
Power in April 2010 to build the world’s largest waste gasification facility in <strong>Bradford</strong>, capable<br />
of processing 160,000 tonnes of residual waste.<br />
However, despite the good potential for various renewable opportunities, the overall potential<br />
for <strong>Bradford</strong> to generate renewable energy is lower than the average for LA's in the region<br />
due to the District’s lower potential for wind developments. (Source: AEA Planning for<br />
Renewable Energy Targets, Yorksire & Humber, 2004).<br />
(ADD PLAN SHOWING AREAS OF WIND ENERGY POTENTIAL IN BRADFORD DISTRICT – SEE<br />
JANE SCOTT)<br />
324
10.4 Land Contamination<br />
<strong>Bradford</strong> has a legacy of land used for industry resulting in land contamination. Certain past<br />
and present human activity will have potentially caused contamination of the ground.<br />
However, existing assessment and knowledge suggest that the potential contamination<br />
sources are limited to previous manufacturing and industrial activity, chemical or fuel storage<br />
and treatment or disposal of waste.<br />
Although the precise extent of the problem is still being investigated, the Council is<br />
developing various strategies which include assessing and prioritising the treatment of<br />
contaminated sites as part of the regeneration process across the District. Recently a guide<br />
to submitting planning application for development on contaminated land has been published<br />
which aims to help developers identify the best way of dealing with possible contaminated<br />
land and bring those lands back into use releasing pressure on other environmentally<br />
sensitive areas.<br />
The current 2020 Vision highlights the potential for using previously developed sites, also<br />
known as “brown field” sites, to aid urban regeneration, improve the environment of the inner<br />
urban areas, and minimise the pressures on “green field” land. Some sites could be used for<br />
woodland and quality green-space, whereas certain sites could be regenerated for more<br />
affluent uses. For example, the former Gaswork site on Thornton road has been through a<br />
Council Land Reclamation Scheme to get rid of the pollutants in order to make it fit to cater<br />
for major urban regeneration projects. However, decisions regarding the preferred uses of<br />
these sites will be made through consultation with local communities, specialist agencies,<br />
and the development assessment process.<br />
The current rUDP policies emphasise the need to ensure public health and safety and, in<br />
order to determine the level of suspicion in relation to contamination, suggest developer carry<br />
out phase I and later phase II site investigation (if it is considered from phase I study that the<br />
contamination would adversely affect the proposed development) to the satisfaction of the<br />
council before the status of the planning application is determined. The type and level of<br />
contaminants present on the site and the remedial measures proposed will be prime<br />
consideration to deal with such issues.<br />
The council also has a contaminated land inspection strategy which highlights the possible<br />
sources and receptors of land contamination across the district and outlined the aims,<br />
objectives and key action areas in order to deal with the issue. 99<br />
10.5 Hazardous Installations<br />
Within the District there are certain sites and pipelines for example High Pressure Gas<br />
pipelines designated by the Health and Safety Executive (HSE) as notifiable hazardous<br />
installations because of the quantities of hazardous substances stored, used or transmitted.<br />
99 contaminated land inspection strategy<br />
325
Hazardous substances and their specified quantities are set down in The Planning<br />
(Hazardous Substances) Regulations 1992 as amended by The Planning (Control of Major-<br />
Accident Hazards) Regulations 1999 (COMAH). These latter regulations implemented the<br />
land use planning requirements of the Seveso II Directive [Council Directive 96/82/EC of 9<br />
December 1996]. The notifiable installations under these regulations, as at April 2002, are<br />
listed below and shown on the rUDP proposals maps.<br />
Sites within <strong>Bradford</strong> Designated Under the Control of Major Accident Hazards (Planning)<br />
Regulations 1999 (Comah)*:<br />
<strong>Bradford</strong> North<br />
• British Gas Plc, Peace Street, <strong>Bradford</strong><br />
• British Gas Plc, Canal Road, <strong>Bradford</strong><br />
• Towler & Staines Ltd, Leeds Road, <strong>Bradford</strong><br />
<strong>Bradford</strong> North<br />
• A H Marks, Wyke Lane, Wyke<br />
• Ciba Speciality Chemicals, Cleckheaton Road, Low Moor<br />
• Coales & Son, 21 Commondale Way, Euroway Trading Estate, <strong>Bradford</strong><br />
• Ellis And Everard (Uk Ltd), Holme Lane, <strong>Bradford</strong><br />
<strong>Bradford</strong> North<br />
Keighley<br />
Shipley<br />
• Cytec Industries Uk Ltd, Bowling Park Drive, <strong>Bradford</strong><br />
• Yorkshire Water Services, Chellow Heights<br />
• Water Treatment Works, Haworth Road, <strong>Bradford</strong><br />
• Transco Plc, Marley Road, Thwaites, Keighley<br />
• Towler & Staines Ltd, <strong>Bradford</strong> Road, Keighley<br />
• Filtronic Comtek Uk Ltd,<br />
• Woolcombers Shed, Salts Mill, Saltaire<br />
*(Sites As At April 2002)<br />
<strong>Bradford</strong> also has a number of sites where significant quantities of potential hazardous<br />
chemicals are used and stored. These chemical plants are a major source of local<br />
employment but the storage and use of these chemicals can place significant restrictions on<br />
certain kinds of development in the vicinity. When considering development on land in the<br />
vicinity of COMAH sites the council aims to strike the proper balance taking account of the<br />
costs and benefits and the nature of the risk as well as the level of risk. Unacceptable risk is<br />
determined with regard to what is considered to be an acceptable level of safety in relation to<br />
the potential accident affects on people in the surrounding area, taking account of HSE<br />
advice and appropriate comparable acceptable levels of risk.<br />
326
10.6 Litter and Dereliction<br />
Litter and related problems are one of the big concerns for ensuring quality city living in<br />
<strong>Bradford</strong>. The districts emerging Sustainable Community <strong>Strategy</strong> has highlighted this fact<br />
and pointed out that poor quality of some parts of the urban environment, particularly due to<br />
fly-tipping, litter and dereliction, is an important factor behind the trend of the higher socioeconomic<br />
groups moving out of inner urban areas towards the suburbs and outskirts of the<br />
District. Research commissioned on behalf of the Environmental Task Force in July 2006 in<br />
the 10% most deprived wards of the District highlighted the following:<br />
• 59% of people surveyed felt that rubbish and litter was a very big or fairly big problem<br />
• Only 29% of people felt the quality of the environment in their neighbourhood was<br />
very good or fairly good<br />
• In some wards satisfaction with <strong>Bradford</strong> Council in keeping land clear of refuse and<br />
litter was just 32%<br />
This graph below shows <strong>Bradford</strong>’s performance against the England and Neighbourhood<br />
Renewal Local Authority average on unacceptable levels of litter and detritus as judged by<br />
Government. The trend shows positive progress particularly in comparison with other NR<br />
Local Authorities however considerable work is needed to bring <strong>Bradford</strong> in line with the<br />
England average.<br />
Figure : Percentage of Unacceptable Levels of Litter and Detritus<br />
Source: The <strong>Bradford</strong> District Environment <strong>Strategy</strong> 2008-11<br />
The most recent survey across the district however saw a 17% increase in satisfaction of<br />
cleanliness standards. The percentage of people satisfied with the cleanliness of the District<br />
has increased from 45% in 2003 to 63% in 2007, while the levels of cleanliness of our streets<br />
has risen from 60% to 88% (using the Tidy Britain/ENCAMS standard). 100<br />
100 BMDC (2007) <strong>Bradford</strong> District Sustainable Community strategy- Information pack and Fact<br />
Sheets. Policy Development Service, <strong>Bradford</strong> Council.<br />
327
Furthermore, a user satisfaction survey carried out in July 2007 with residents in <strong>Bradford</strong><br />
Environmental Task Force 101 areas demonstrates the improvements people are seeing in<br />
their neighbourhood as a result of Task Force activities. These results are compared to July<br />
2006 results, prior to the Task Force commencing work:<br />
- Percentage of people satisfied with the quality of the environment in their<br />
neighbourhood has increased from 29% to 40%<br />
- Percentage of people who agree that “overall my neighbourhood is a good place<br />
to live” has risen to 66% compared to 53%<br />
- The proportion of residents who felt that fly tipping and dumping is a problem in<br />
their area has fallen to 33% from 44%<br />
In April 2006, £5m Neighbourhood Renewal Funding was allocated to the Environmental<br />
Partnership over 2 years (NRF must be targeted within the 10% most deprived communities<br />
across the District, which also have a poor local visible environment). £4m has been<br />
allocated to the Environmental Task Force which aims to replicate and build upon the<br />
successes of the Go Girlington and Big Sweep initiatives. £1m will be used to support the<br />
local environmental initiatives across the District. 102<br />
The standard of cleanliness of adopted highways remains very high with 96% at a high or<br />
acceptable standard. However, other areas of land both in the public sector and private<br />
ownership continue to have a negative impact on the overall appearance of the District. 2020<br />
Vision highlights the need to clean up the environment of the inner city, as part of a wider<br />
package of actions aimed at reversing this trend and bringing earners and spending-power<br />
back into the inner areas. 103<br />
Derelict land and buildings refer to the amount of land identified in NLUD as ‘Previously<br />
Developed Land (PDL)’. These are lands or buildings so damaged by previous development,<br />
e.g. contamination, sub surface structures, that they are incapable of beneficial use without<br />
treatment. In 2007 the total amount of all previously developed land in <strong>Bradford</strong> district was<br />
182 hectares of which only 41% (75 hectares) was in use and/or have planning permission or<br />
redevelopment potential. The rest of the PDL was vacant (77 hectares) and derelict land and<br />
buildings (29 hectares) 104 .<br />
101 This is a partnership of public and voluntary sector projects working together to improve the quality<br />
of the neighbourhood environment, supported through the Neighbourhood Renewal Fund. The Task<br />
Force works closely with the community to organise cleanups and re-design and improvement of<br />
community spaces, including pathways and parks. Education and awareness-raising around<br />
maintaining a clean and safe local environment is integrated with these activities. The Environmental<br />
Task Force won the 2007 Improving Lives Award at the Yorkshire and Humber Making a Difference<br />
Awards led by the Local Government Yorkshire and Humber.<br />
102 A Picture of the District (Report on the State of the District produced by CBMDC Research and<br />
Consultation Service 2006 and 2007 updates)<br />
103 BMDC (2002) The <strong>Bradford</strong> District Multi-Agency Environmental <strong>Strategy</strong> 2002-2007 (Draft for Consultation).<br />
Reprt dated February 2002. BMDC.<br />
104 DCLG (2008) Previously-developed land that may be available for Development: England 2007. Report dated<br />
August 2008. London:DCLG.<br />
328
The breakdown by different category is:<br />
Land Type A – Previously developed land now vacant- 48 hectares<br />
Land Type B – Vacant Buildings- 29 hectares<br />
Land Type C – Derelict Land and Buildings- 29 hectares<br />
Land Type D – Land or buildings currently in use and allocated in the local plan and/or<br />
having planning permission- 72 hectares<br />
Land Type E – Land or buildings currently in use with redevelopment potential- 3 hectares.<br />
Figure: Distribution of PDL in Yorkshire and Humber by Land Type 2004<br />
Source: National Landuse Database of PDL- Y&H Summery, 2004<br />
The map above shows the extent of the PDL across <strong>Bradford</strong> district by various land types. It<br />
is clear from the map that PDL is mostly concentrated within the existing built-up areas both<br />
in urban and rural locations.<br />
10.7 Flood Risk<br />
Flood risk is a real and also a perceived issue throughout Yorkshire, not only in <strong>Bradford</strong><br />
where demand and potential for further development, particularly in new housing sectors, are<br />
increasing every year. Major flooding incidents have often resulted in the Council and others<br />
making policy and operational changes to water management in order to reduce the risk of<br />
further floods or to reduce the damage caused. The local authority together with the<br />
329
environment agency is therefore working towards improving the standard of protection of the<br />
existing communities and infrastructures. The government also has developed a strategy in<br />
the form of PPG 25 that aims to use the planning system to reduce the demand for further<br />
flood defences by protecting natural floodplains from development, and to steer investment<br />
away from areas of high flood risk.<br />
<strong>Bradford</strong> district encompasses a significant part of the catchment for the river Aire. The Aire<br />
enters the district from the Craven District to the north west, and has a number of major<br />
tributaries from the south. To the north, the <strong>Bradford</strong> district is bounded by the Wharfe<br />
corridor, although there is a part to the north of the river at Ilkley which lies within the<br />
CBMDC area. The Aire, Wharfe, Worth and Silsden Beck are classified as main rivers and<br />
are the responsibility of the Environment Agency, although parts of the Aire are managed by<br />
the Drainage Board. Flooding from the Aire is moderated by the extensive washlands<br />
upstream of the district. Flood risk in the district may be examined by accessing the EA’s online<br />
maps that have recently been updated. These show the likelihood of inland areas being<br />
affected by flooding for both a 1% (100 to 1) and 0.1% (1000 to 1) chance of occurrence in<br />
any one year. The ‘natural’ flood plains shown are illustrated as if there were no flood<br />
defences in place, although where these exist, they show higher levels of protection.<br />
The EA Flood Risk maps currently show some 3,476 properties as potentially at risk from<br />
flooding within the boundaries of <strong>Bradford</strong> Council. This figure is a “count” of the properties<br />
within the floodplain in the “urban” areas as defined by the areas shown grey on the 1:50,000<br />
Ordnance Survey maps.<br />
<strong>Bradford</strong> has a history of land and property being flooded through heavy downpours of rain<br />
and watercourses overflowing their banks. Flooding can be caused by main rivers bursting<br />
their banks or by localised incidents involving smaller becks or by surcharging drainage<br />
330
systems. Communities on the Rivers Aire and Wharfe were flooded during the November<br />
2000 event. As a result delineation of the natural floodplain is well understood.<br />
During the flooding of November 2000 significant numbers of properties were affected along<br />
the River Aire at Shipley, Bingley and Apperley Bridge and particularly at Stockbridge, where<br />
substantial flood damages were sustained as a result of structural failure of the river<br />
defences, which have subsequently been reinstated and improved. In general relatively few<br />
areas within the <strong>Bradford</strong> District are constituted as ‘defended areas’, flooding from the River<br />
Aire is modified by a substantial system of washlands upstream of <strong>Bradford</strong>. During periods<br />
of high flow, water spills into these vital washland areas, reducing maximum flood areas<br />
downstream (ie within residential communities).<br />
An increased programme of investment is currently underway to improve the standard of<br />
protection to existing communities. The Authority works in partnership with a variety of<br />
organisations to address water management in the district. European funding has been<br />
accessed for flood alleviation capital projects. Water management strategies and<br />
programmes aim to:<br />
• Reduce the risk of flooding<br />
• Mitigate the effect of flooding<br />
• Provide coordinated and effective emergency responses to flooding incidents<br />
A Strategic Flood Risk Assessment for <strong>Bradford</strong> District was carried out in 2003 in<br />
consultation with the Environment Agency and Yorkshire Water. Primarily this used existing<br />
data sources and provided information on the nature of flood risk in the district, and its<br />
potential consequences with respect to the allocation of proposed development sites. Only a<br />
handful of sites out of 400 allocations have been subsequently withdrawn or re-phased, a<br />
proportion of these until such time that further investigations have been undertaken. More<br />
recently PPS 25 clarifies the Sequential Test that matches types of development to degrees<br />
of flood risk and strengthens the requirement to include flood risk at all levels of the planning<br />
process.<br />
The Strategic Flood Risk Assessment (SFRA) identified the main river flooding issues as<br />
given in following Table.<br />
331
Table : Known Main River Flooding Issues – <strong>Bradford</strong> District<br />
Source: <strong>Bradford</strong> Strategic Flood Risk Assessment Final Report 2003<br />
The report also highlighted the known flooding issues related to the ‘Critical Ordinary<br />
Watercourses’ and also summarises Surface Water Drainage Related Issues across the<br />
district.<br />
In March 2005 the council also published a Review to consider the Future of Water<br />
Management and the Associated Problems of Flooding in the <strong>Bradford</strong> District 105 that<br />
analysed information from agencies involved in water management and the public affected<br />
by flooding in order to support future policy development and implementation. The report<br />
particularly highlighted how the nature and the scale of flood risk in <strong>Bradford</strong> district could be<br />
affected by future developments in regeneration, the landuse planning system, new<br />
legislation, and new working practices. In conclusion, it outlined a range of recommendations<br />
based on its inquiry on the following key issues-<br />
• The risk, nature and scale of flooding in the district<br />
• Key actions required for reducing the risk of flooding<br />
• Key actions required for mitigating the effects of flooding<br />
105 BMDC (2005) Review to consider the Future of Water Management and the Associated Problems<br />
of Flooding in the <strong>Bradford</strong> District. Report dated March 2005. Policy Development Service, CBMDC.<br />
332
The designation of the flood plains by the Environment Agency has seriously affected the<br />
availability of development sites where land and property are seen to be at risk. This not only<br />
restricts new development but also makes the redevelopment of existing buildings and<br />
brownfield sites potentially very difficult. The above report however envisaged that landuse<br />
plans (including the Airedale Master plan and the City Centre Master Plan) will recommend<br />
that new developments will include alternative methods of urban water management<br />
including rainwater harvesting, the use of reed beds, permeable hard surfaces, grey water<br />
recycling etc. The delivery of these innovative systems will require partnership working with<br />
the developers, the EA, YW and <strong>Bradford</strong> Council. There are of course other opportunities<br />
such as tree planting, and the creation of water storage and retention areas, which need to<br />
be considered.<br />
The council has recently agreed to review the current SFRA in order to update the flood risk<br />
issues across the district and investigate the scope of the phase 2 recommendations outlined<br />
in the SFRA. At the time of writing this report the council has commissioned JBA Consulting<br />
to carry out this assessment and the work is ongoing.<br />
This flood risk assessment will influence the strategic choices for development that are to be<br />
addressed in the <strong>Core</strong> <strong>Strategy</strong>. When considering development in certain areas, particularly<br />
<strong>Bradford</strong> City and locations along the valley floor within Airedale, this will also help achieve a<br />
balanced view of the competing objectives of reducing flood risk and achieving sustainable<br />
regeneration across the district.<br />
10.8 Biodiversity and Wildlife<br />
Biodiversity is the widespread term for biological diversity, which represents the richness and<br />
variety of plants, birds, animals and insects throughout the world. Biodiversity is not just<br />
about rare, or threatened species or habitats, but peoples day to day quality of life and<br />
experience of nature.<br />
Biodiversity conservation and caring for the district’s wildlife and their natural habitats is<br />
important from both global and local points of view, and this has direct implications for the<br />
health and quality of life of local people. <strong>Bradford</strong> has a wide range of ecosystems from<br />
Pennine uplands to lowland pasture, woodland, parkland, river floodplain and numerous<br />
reservoirs. While these environments have suffered degradation, such as habitat and<br />
species loss to development and agricultural practices, they still support a rich diversity of<br />
native plant and animal species.<br />
A wide range of legislative provisions exists at the international and national level that can<br />
impact on planning decisions affecting biodiversity and geological conservation issues.<br />
Working with the Grain of Nature: a Biodiversity <strong>Strategy</strong> for England sets out the<br />
Government’s vision for conserving and enhancing biological diversity, including the broad<br />
aim that planning should have a minimal impact on biodiversity and enhance it wherever<br />
possible. PPS1: Delivering Sustainable Development also supports biodiversity, stating<br />
that the reversal of biodiversity loss/decline is a national planning priority. While supporting<br />
the broad aim of the Biodiversity <strong>Strategy</strong> PPS9, which sets out planning policy on<br />
333
Biodiversity and Geological Conservation, puts greater emphasis on restoration and<br />
enhancement, based on the view that maintaining a wide range of species is vital to the<br />
future.<br />
Figure: RIGS in West Yorkshire<br />
Source: West Yorkshire Geodiversity Action Plan (WY Geology Trust, 2008)<br />
1. Addingham Edge Millstone<br />
Quarry<br />
2. Baildon Bank and Baildon<br />
Green Quarries<br />
3. Baildon Moor<br />
4. Cow and Calf Rocks, Ilkley<br />
5. Dimples Quarry, Haworth<br />
6. Doubler Stones, Addingham<br />
Moorside<br />
7. Eldwick Crag and Quarry<br />
8. Goitstock Waterfall,<br />
Cullingworth<br />
9. Horton Bank Country Park,<br />
<strong>Bradford</strong><br />
10. Lanshaw Delves, Ilkley<br />
11. Noon Nick, Shipley<br />
12. Ponden Clough, Haworth<br />
13. Royds Hall Beck, Wyke<br />
14. Shipley Glen<br />
15. Throstle Nest, Silsden<br />
16. Wrose Hill, Shipley<br />
The West Yorkshire Geodiversity Action Plan (WY Geology Trust, 2008) also provides a<br />
framework to safeguard, manage and promote the geodiversity of the county, especially the<br />
existing and potential Regionally Important Geological/Geomorphological Sites (RIGS).<br />
Objectives of the Action Plan includes identification and monitoring of the RIGS in west<br />
Yorkshire and ensuring that they are included on the LDF proposal map for each local<br />
authority.<br />
The Yorkshire & Humber Regional Biodiversity <strong>Strategy</strong> sets out a framework for the<br />
integration of biodiversity into regional and local policies, programmes and processes, and<br />
provides a means of promoting a coherent approach to biodiversity action in the region. It<br />
complements and implements the biodiversity elements of the Regional Spatial <strong>Strategy</strong> and<br />
identifies key mechanisms and actions required of different partners and sectors across the<br />
region.<br />
In addition to indicating the location of designated sites, the local development frameworks<br />
should identify any areas or sites suitable for the restoration or creation of new priority<br />
habitats that contribute to regional targets. Distinctive elements in the biodiversity resource<br />
of the region, that are relevant to <strong>Bradford</strong> are upland heath and floodplain habitats, where<br />
urban regeneration is seen as an opportunity to create and restore habitat corridors. The<br />
LDF should also protect ancient woodland, to the extent of refusing proposals that would<br />
harm it, whilst also protecting networks of connected corridors from development. <strong>Core</strong><br />
334
strategy policies especially need to reflect national, regional and local biodiversity priorities<br />
and objectives, including those agreed by local biodiversity partnerships.<br />
A Local Biodiversity Action Plan for the <strong>Bradford</strong> District (draft) was prepared in 2003.<br />
Action Plans have been prepared for local species and habitats that have been highlighted<br />
for their conservation concern. The LBAP gives in-depth descriptions of the different habitats<br />
and species that can be found within the District.<br />
Important objectives in the <strong>Bradford</strong> LBAP (draft) are- safeguarding locally and nationally<br />
valued species and habitats and raising public awareness of and commitment towards local<br />
biodiversity issues. Key habitats and species identified in the local BAP are set out in the<br />
later section, as are the four tiers of protected sites. Additional strategic documents relating<br />
to nature conservation are the Nature Conservation <strong>Strategy</strong> for <strong>Bradford</strong> and the more<br />
recent Woodland <strong>Strategy</strong>. The latter expresses the Council’s commitment to improving the<br />
amount of woodland cover and quality of woodlands in <strong>Bradford</strong>.<br />
Existing policies in the RUDP offer strong support for the four levels of designated sites and<br />
also wildlife corridors. Policy NE10 aims to ensure that development respects important<br />
landscape and geological features and Policies NE11 and 12 require ecological appraisals<br />
and landscape and wildlife enhancement schemes, where appropriate. Outside designated<br />
areas, where there are competing priorities for development gain, a lack of information about<br />
species and habitats and limited resources for evaluation can lead to the biodiversity asset<br />
being undervalued.<br />
10.8.1 <strong>Bradford</strong>’s Biodiversity: Habitat Summery<br />
The habitats of the <strong>Bradford</strong> District are largely influenced by their underlying geology. The<br />
Millstone Grits of the Southern Pennines to the west of the District give rise to substantial<br />
areas of upland heathland and blanket bog, whilst the softer shales of the Coal Measures<br />
have produced more woodlands, valley wetlands and unimproved grasslands. The demand<br />
for development on the lower-lying Coal Measures has fragmented these habitats, although<br />
unique habitats have also been created throughout the District as by-products of<br />
industrialisation, such as reservoirs, canals and quarries.<br />
The main habitats through the <strong>Bradford</strong> District can be categorised as:-<br />
Upland: A combination of geology, historic agricultural practice and high rainfall has<br />
produced the acidic infertile soils of the upland plateaux and this mosaic of expansive<br />
heather moorland, blanket bog and acid grassland forms a substantial part of the District and<br />
were the dramatic setting for Charlotte Bronte’s ‘Wuthering Heights’. However, much of it is<br />
considered to be of international nature conservation value – Rombald’s Moor (Ilkley Moor,<br />
Burley Moor and Bingley Moor) and the other South Pennine Moors in the <strong>Bradford</strong> District<br />
(Oxenhope Moor, Haworth Moor, Stanbury Moor, Oakworth Moor and Keighley Moor) have<br />
been designated as a Special Protection Area and Special Area of Conservation under<br />
European Directives for their moorland breeding birds and their upland habitats.<br />
335
Woodland: Only 4.6% of <strong>Bradford</strong> District is<br />
woodland, compared to a national average of 10%.<br />
Within the upland areas of the District, remnants of<br />
woodlands remain in steep sided ravines (cloughs).<br />
The trees here are a mixture of oak, birch, rowan,<br />
alder and ash, with a surprisingly varied ground flora.<br />
There are also a number of conifer plantations of<br />
more recent origin, with a limited biodiversity value.<br />
Much of the woodland in the lower lying valleys<br />
originated in the mid nineteenth century when the<br />
Victorians became aware of the value of planting<br />
trees to replace resources lost to the Industrial<br />
Revolution. Only fragments of ancient semi-natural<br />
woodlands remain in the <strong>Bradford</strong> District, totalling<br />
approximately 200 hectares. Middleton Woods at<br />
Ilkley, Hirst Wood and Shipley Glen are good<br />
examples.<br />
Figure : Ecology and Heritage<br />
Wetlands and watercourses: The characteristic<br />
landform of the <strong>Bradford</strong> District has been carved as<br />
a result of the Ice Age, with glacial overflow channels<br />
and cloughs (steep sided tributary valleys) forming the frameworks for the water collection<br />
from the uplands. Many of these overflow channels now form valuable wetlands. Numerous<br />
reservoirs also collect water from the uplands which are not only an important water<br />
catchments area but these water bodies and the surrounding wetlands also provide<br />
important wintering and breeding habitats for the wide variety of wildfowl and waders. Small<br />
streams, springs and wet flushes slow from the uplands into the Rivers Worth, Aire and<br />
Wharfe. The Leeds and Liverpool Canal also acts as a valuable wildlife corridor across the<br />
District and a network of neglected mill ponds – a legacy of <strong>Bradford</strong>’s industrial heritage –<br />
have been re-colonised by amphibians. In addition there are a few fragments of lowland<br />
raised mire, which are ecologically valuable but fragile and threatened habitats.<br />
Two main rivers flow through the district, the River Aire and the River Wharfe. Both the River<br />
Wharfe, which supports a variety of fish, including salmon, brown trout and grayling and the<br />
Leeds and Liverpool Canal are designated as SEGIs for their nature conservation value.<br />
The River Aire has been affected by years of pollution, although recent dramatic<br />
improvements to water quality have seen otters return to these waters. There are also<br />
numerous ponds and reservoirs of nature conservation importance, especially those which<br />
support notable bird populations such as Thornton Moor Reservoir.<br />
Grassland: <strong>Bradford</strong> District has a variety of grasslands, from the species-poor waterlogged,<br />
acid grasslands of the uplands to the more fertile, mesotrophic grasslands on the valley floor.<br />
In between, on the moorland fringes, occur the ‘in-bye grasslands’; traditionally enclosed for<br />
winter pasture and summer hay. The inbye supports a range of invertebrates which support<br />
a range of waders and birds such as twite, whose numbers are declining drastically.<br />
However, many of the grasslands in the District are classified as ‘improved’ fertilised or<br />
336
seeded as grass leys for more intensive stock-grazing, and therefore have limited wildlife<br />
value.<br />
The majority of the field boundaries of <strong>Bradford</strong> District consist of dry-stone walls, with few<br />
hedges concentrated around areas such as Silsden, Addingham and Menston. Stone walls,<br />
as wildlife habitats and linking other habitats as wildlife corridors, provide cover for mammals,<br />
such as stoats, weasels, mice and voles, and create a variety of microclimates and niches for<br />
the invertebrates which inhabit the wider environment.<br />
Boundaries: The majority of the field boundaries of the district consist of dry-stone walls,<br />
with a few hedges concentrated around areas such as Silsden, Addingham and Menston.<br />
Stone walls, as wildlife habitats and linking other habitats as wildlife corridors, provide cover<br />
for mammals and create a variety of microclimates and niches for the invertebrates which<br />
inhabit the wider environment. Hedgerows, although of limited extent throughout the district,<br />
also act as important wildlife corridors between other habitats as well as support their own<br />
range of flora and fauna. Hedges are an important habitat for a variety of birds as well as<br />
bats and small mammals. Many hedgerows in the district however have been neglected or<br />
poorly managed.<br />
Quarries: <strong>Bradford</strong> District has a legacy of abandoned mineral quarries, which have<br />
developed into good wildlife habitats, supporting birds such as peregrines which nest on the<br />
cliff faces, as well as bats in old mine shafts.<br />
10.8.2 Wildlife: Species Summery<br />
Flora: <strong>Bradford</strong> District’s climate and its predominantly acid, often water-logged, soils do not<br />
favour a particularly diverse range of flora. The habitats which are formed by the range of<br />
plant communities in composite are perhaps more valued than the individual species.<br />
Nevertheless, it does host an array of interesting species, with some notable rarities.<br />
Mammals: <strong>Bradford</strong> District contains a variety of mammala, according to the range of<br />
habitats. In particular, have healthy populations of deer and badger. The deer numbers are<br />
increasing and are generally migrating from the north towards Calderdale in the south west<br />
and also east along the Leeds and Liverpool Canal 106 . Badgers are also well presented<br />
throughout the District and successfully protected against persecution.<br />
Recent exciting news about the District’s mammals includes the return of the otter, with<br />
sightings on both the Rivers Wharfeand Aire, indicating cleaner water quality and the<br />
recovery of this, once seriously threatened, species. However, the news is not so good for<br />
the water voles whose number in the district have plummeted. The population of Brown hare<br />
has also been reduced by illegal poaching and habitat loss, although they are still present in<br />
the district in key strongholds. Unfortunately, red squirrel is no longer found in the <strong>Bradford</strong><br />
District.<br />
106 <strong>Bradford</strong> Deer Survey 1996<br />
337
The District has only 3 or 4 of the 16 species of mainland UK bats living in a variety of<br />
roosting sites such as trees, buildings (old and new), old parkland and bridges, especially<br />
over rivers.<br />
Birds: A range of bird species can be found in all habitats throughout, especially on the<br />
moorlands. A total of 241 bird species have been recorded within the <strong>Bradford</strong> Ornithological<br />
Group recording area, although there area covers places outside the district.<br />
Amphibians and Reptiles: Amphibians and reptiles, however, are limited to the common<br />
species; great crested newts are unrecorded in the <strong>Bradford</strong> area. Frogs and toads are<br />
widespread in the district, though their numbers are thought to be declining as wetlands are<br />
drained and ponds infilled.<br />
Invertebrates: Apart from bees, butterflies, moths and dragonflies many invertev=brates in<br />
<strong>Bradford</strong> District are under-recorded. However, the wide range of habitats supports a good<br />
range of known species.The heathland habitat of Harden Moor, in particular, is known to<br />
support an interesting range of bees, wasps as well as several ant species.<br />
West Yorkshire was the northern limit for some butterflies and insects, however with global<br />
warming some species have increased their range northwards and the loss of diverse<br />
grasslands generally will have a long-term effect on these populations, with subsequent<br />
consequences throughout the ecosystem as a whole.<br />
One of the locally important invertebrates, the white clawed or freshwater crayfish, generally<br />
found in clean rivers and canals, is unfortunately suffering from a variety of problems and its<br />
location is now limited to the River Wharfe.<br />
A detail description of these habitats and species are to be found in the <strong>Bradford</strong> Local<br />
Biodiversity Action Plan (draft) report.<br />
The <strong>Bradford</strong> Local Biodiversity Action Plan (draft), in common with many other LBAPs,<br />
includes a series of detailed action plans for priority habitat and species. These cover firstly<br />
the current status of the habitats/species, factors causing loss or decline in the local context<br />
and current action being undertaken, followed by more detailed recommendations for site<br />
safeguard, habitat management, habitat creation, policy requirements, data needs, research<br />
and advisory work.<br />
The following table depicts the priority habitat and species from the UK Biodiversity Action<br />
Plan which are found in the <strong>Bradford</strong> district and also local priority habitats and species<br />
which have been selected by the <strong>Bradford</strong> Biodiversity Partnership as being important and<br />
locally threatened.<br />
Habitats and species in bold indicate those which have been chosen for the first trenche of<br />
the Local Biodiversity Action Plan for <strong>Bradford</strong> District. Other habitats and species will<br />
hopefully have action plans written for them as part of the subsequent phases of the <strong>Bradford</strong><br />
Biodiversity Action Plan.<br />
338
Table: Habitats and Species Found in the <strong>Bradford</strong> District<br />
HABITATS FOUND IN THE BRADFORD DISTRICT<br />
National/Yorkshire and Humberside Key Habitats Local Key Habitats*<br />
Species Rich Hedgerows Upland Oakwood In-Bye Pasture<br />
Lowland Heathland Upland Mixed Ashwood River Corridors<br />
Upland Heathland Wet Woodlands<br />
Fens Lowland Hay Meadow<br />
Reedbeds Lowland Dry Acid Grassland<br />
Blanket Bog<br />
SPECIES FOUND IN THE BRADFORD DISTRICT<br />
National/Yorkshire and Humberside Key Species Local Key Species*<br />
Water Vole Linnet Lesser Twayblade<br />
Brown Hare Tree Sparrow Yellowhammer<br />
Otter Spotted Flycatcher Lapwing<br />
Pipistrelle Black Grouse Twite<br />
Skylark Song Thrush Green Hairstreak Butterfly<br />
Reed Bunting White Clawed Crayfish<br />
White Letter<br />
Butterfly<br />
Hairstreak<br />
Bullfinch<br />
Grey Partridge<br />
Killarney Fern Blue Butterflies<br />
* Selected by the <strong>Bradford</strong> Biodiversity Partnership as being locally significant in the <strong>Bradford</strong> District<br />
The LBAP acknowledges the Council’s role in the protection of these species and habitats,<br />
and states that ‘site and species protection policies, negotiations as part of the development<br />
control process and the using of planning conditions and Section 106 Agreements all provide<br />
mechanisms to protect, manage and enhance the existing areas of wildlife importance and<br />
establish new areas for wildlife’.<br />
10.8.3 Biodiversity Assets<br />
The wildlife interest of the <strong>Bradford</strong> District is influenced by its climate, topography and<br />
latitude, with many species at the limit of their range. On a national scale the climate of the<br />
<strong>Bradford</strong> District lies on the transition zone between the warmer drier lowlands of Britain and<br />
the cool, wet, uplands. The microcimate is influenced by topography, whereby the sheltered<br />
and more humid valleys and cloughs cut into the Pennines following glaciation, contrast with<br />
the open, exposed moorland plateaux. The soils closely reflect the pattern of bedrock and<br />
superficial deposits, varying from acidic peat and thin, nutrient-poor brown earth soils and<br />
badly drained boulder clay deposits from the last Ice Age along the Wharfe and Aire valleys<br />
to the east.<br />
There are 4 levels of designated nature conservation sites within <strong>Bradford</strong> District. In<br />
addition to the 4 SSSIs, there are 21 Sites of Ecological or Geological Importance and 16<br />
Regionally Important Geological / Geomorphological Sites (RIGS). One of these SSSIs, the<br />
South Pennine Moors, represented by Rombalds Moor and Haworth Moor has been<br />
339
designated a Special Protection Area (SPA) due to the importance of its breeding bird<br />
populations. It is also a Special Area of Conservation (SAC), under the European Habitats<br />
Directive because it contains habitats which are rare or threatened within a European<br />
context. In addition, there are also 152 sites of local nature conservation value and <strong>Bradford</strong><br />
Wildlife Areas (BWAs),, designated not only for their biodiversity interest, but also for their<br />
community benefits in respect of their accessibility for the quiet enjoyment of nature, their<br />
educational value or their heritage associations (such as mill ponds).<br />
Table : Biodiversity Asset<br />
Designation No Area/Details<br />
Special Protection Area (SPA) SPA 1 No 4489 ha – South Pennine Moors<br />
Special Area of Conservation (SAC) SAC 1 No 4489 ha – South Pennine Moors<br />
South Pennine Moors, Bingley<br />
Sites of Special Scientific Interest (SSSI) SSSI 4 No South Bog, Trench Meadows.<br />
Yeadon Brick Works<br />
Sites of Ecological/ Geological Interest (SEGI) SEGI<br />
Ecological 21 No<br />
340ha – Leeds/Liverpool Canal<br />
and River Wharfe<br />
Geological 16 No<br />
Third Tier Sites Over 100 Yet to be verified<br />
For detail description of the 4 SSSIs, including maps and most up to date condition<br />
summery, are to be found on natural England website by clicking the link below-<br />
http://www.sssi.naturalengland.org.uk/Special/sssi/search.cfm<br />
10.9 Agricultural Land<br />
Most of the agricultural land in <strong>Bradford</strong> consists of improved and semi-improved pastures on<br />
the upland fringes of the north-west of the District or the neutral (neither alkaline nor acidic)<br />
grasslands to the east and south of the City. Agriculture in <strong>Bradford</strong> is generally based<br />
around rearing stock, mainly sheep, although cattle rearing take place in areas along the<br />
river valleys and on the lowlands to the east of the District.<br />
Most of the farmland in <strong>Bradford</strong> District can be described as marginal, constrained by<br />
climate and physical topography. Nearly half of the farmland is classed as Grade 4 or 5 107 ;<br />
that is, land with severe limitations which significantly restricts the range of crops and is<br />
mainly suitable for pasture grazing. However, there are also some grade 3 lands made up of<br />
alluvial soils along the flood plains of the River Wharfe and River Aire which are more<br />
productive.<br />
107 The ALC system classifies land into five grades, with Grade 3 subdivided into Subgrades 3a and<br />
3b. Grade one is best quality and Grade five is poorest quality. A number of consistent criteria used for<br />
assessment which include climate (temperature, rainfall, aspect, exposure, frost risk), site (gradient,<br />
micro-relief, flood risk) and soil (depth, structure, texture, chemicals, stoniness).<br />
340
Figure: <strong>Bradford</strong> agricultural land classification 108<br />
An interactive map showing the agricultural land classifications within <strong>Bradford</strong> can be<br />
viewed online by clicking the link below.<br />
http://www.magic.gov.uk/website/magic/opener.htm?startTopic=maglandclass&xygridref=408<br />
406,438698&startScale=250000<br />
Countryside recreation is increasingly important as a rural land use and people are visiting<br />
the countryside in increasing numbers. However, it is important to recognise the impact<br />
visitors have on the countryside and that the pressures which result need to be carefully<br />
managed in order to prevent the quality of the countryside from being diminished.<br />
10.10 Climate Change and Energy Efficiency<br />
On average, each person in <strong>Bradford</strong> produces a total greenhouse gas emissions equivalent<br />
to 6.5 tonnes of CO2 per year just from energy and transport use. With over 485,000 people<br />
108 http://www.self-willed-land.org.uk/rep_res/rur_vis_bfd.ppt<br />
Grade 3<br />
Grade 4<br />
Grade 5<br />
341
living in <strong>Bradford</strong>, that equates to roughly 3 million* tonnes of CO2 in total. 109 So, cutting<br />
carbon emissions and promoting sustainable living as part of the fight against climate change<br />
are one of the top corporate agendas for <strong>Bradford</strong> council.<br />
The draft Corporate Plan 2009-2012, submitted to the Council in March 2009 for approval,<br />
makes a firm commitment to working towards a sustainable environment. One of its Strategic<br />
Delivery Priorities (SDP) is ‘contributing to a more sustainable environment’ throughout the<br />
district.<br />
The government has set targets to reduce CO2 emissions by 34% by 2020 and 50% by 2080,<br />
from a baseline taken in 1990. A more locally adopted target (NI186) is to reduce district’s<br />
CO2 emissions by 11.4% by 2010 from the 2005 baseline.<br />
Figure: <strong>Bradford</strong> District’s CO2 emission 2006<br />
Source: CBMDC<br />
42% of CO2 emissions in the district are from business and industry and 17% from road<br />
transport. Between 2005 and 2006, CO2 emissions in the district fell from 2,957 kt CO2 to<br />
2,945 kt CO2, a reduction of 0.4%. 110<br />
In order to meet targets by 2010, emissions must reduce from 6.1 tonnes CO2 per capita to<br />
5.4 tonnes per capita.<br />
The District has also developed its Sustainable Community <strong>Strategy</strong>. One of its stated<br />
priorities is improving the environment of the District. The key issues have been identified as:<br />
1. Improving the Neighbourhood Environment so that the <strong>Bradford</strong> District is a clean<br />
and attractive place to live and work.<br />
2. Resource Efficiency so that people and organisations across the District protect the<br />
natural environment and reduce waste<br />
109<br />
BMDC (2008) Climate Change and <strong>Bradford</strong> District [online]. CBMDC [cited 20 June 2008].<br />
Accessed on :<br />
<br />
*Statistics taken from DEFRA End User Local and Regional Estimates of Carbon Emissions, 2004 findings<br />
110 <strong>Bradford</strong> and Airedale NHS Pct (2009) Joint Strategic Needs Assessment 2009.<br />
342
3. Climate Change so that the <strong>Bradford</strong> District is a place which takes action to use<br />
energy efficiently and to tackle the impact of climate change<br />
<strong>Bradford</strong> Council is undertaking a range of actions to improve its own performance and to act<br />
as a community leader for the District in addressing climate change:<br />
• In partnership with the Carbon Trust, the Council has undertaken a Carbon<br />
Management Plan, through which it aims to reduce the levels of carbon dioxide<br />
emissions it is responsible for by 20% compared to the ‘business as usual’ scenario<br />
by the end of the financial year 2011/12.111 The Council is seeking to achieve Ecomanagement<br />
and Audit Scheme (EMAS) accreditation by 2011-2012;<br />
• Sustainability appraisal guidance is being developed in partnership with <strong>Bradford</strong><br />
Centre Regeneration, the University of <strong>Bradford</strong> and <strong>Bradford</strong> College;<br />
• The Council is working with other local authorities in West Yorkshire to develop the<br />
DEFRA sponsored warm zone initiative to promote and financially support energy<br />
improvements for fuel-poor households;<br />
• The Council is working with the Ove Arup Consultancy to look at the relationship<br />
between economic growth and carbon emissions and assess how sustainable<br />
production and consumption can co-exist in the District;<br />
• In partnership with Future Energy Yorkshire, it is looking at setting up an Energy<br />
Service Company. Based on the Woking Council model, such a structure would<br />
enable initiatives such as district heating schemes to be connected into an energy<br />
efficient local energy network, making the District less reliant on the national grid;<br />
• The Climate Change Plan proposes an eight- year timescale to achieve<br />
transformational change in the key work areas, ensuring that clear connections can<br />
be made between current and planned activity with particular regard to climate<br />
proofing and carbon dioxide emissions<br />
• <strong>Bradford</strong> is one of over 200 Councils which have signed the Nottingham<br />
Declaration on Climate Change which commits them to actively tackle climate<br />
change in their area and work with others to reduce emissions country-wide.<br />
Currently only 3% of the total energy used across the council is obtained from renewable<br />
sources. So in order to reduce its own carbon emission the council is taking a leading role to<br />
switch their energy consumption into renewable sources in council buildings, fleet services,<br />
passenger transport, car business travel and street lighting, and also to encourage the<br />
private sector and individual residents to respond similarly.<br />
111 BMDC (2007) Carbon Management Programme 2007- 2012 Strategic and Implementation Plan.<br />
Report dated October 2007.<strong>Bradford</strong> Council.<br />
343
The Council has direct management control of 400 of the 600+ operational Buildings. Most of<br />
the higher energy using sites consists of large civic buildings such as City Hall, office blocks<br />
and leisure centres and are located in the city and town centres. The ongoing Ecomanagement<br />
and Audit Scheme (EMAS) has already established baselines for 68 high<br />
energy using buildings and taken steps to reduce energy are being built up through individual<br />
building action plans.<br />
Through 2006, the Council has been gathering data of the highest energy using buildings as<br />
part of the European Display Initiative which supports the Energy Performance of Buildings<br />
Directive. The buildings are given an A-G rating for three areas- energy use, carbon dioxide<br />
emissions and water management, and certificates are publicly displayed to help staff and<br />
public using those buildings to consider the impact of their actions on energy consumption.<br />
Although the cost of energy for all <strong>Bradford</strong> schools accounts for 57% of the Council’s total<br />
energy bill, it has not been included in this programme. As energy budgets are devolved to<br />
schools, the emissions and spend cannot be fully controlled. For this reason, schools are<br />
excluded from the Carbon Management Programme. Schools are supported by the council in<br />
reducing their carbon emissions through awareness training and technical support.<br />
Climate change is already impacting on the delivery of some of the council services-<br />
• Growing season is 40 days longer- impacting on grass cutting and maintenance of<br />
parks and open spaces<br />
• Mild winter- less gritting. In 2006 winter the council gritted 27 times compared to<br />
annual average of 95 times (in severe winter it could be 140 times).<br />
• Flooding in Stockbridge area in 2000.<br />
• Rise in the number of uncontrolled fires on Ilkley Moor.<br />
The cost of tackling these will be increasing if decisions are not made ‘future-proofed’.<br />
Regeneration across the district, particularly in the city centre, is important but growth needs<br />
to be within environmental limits. The council, with its partners, is therefore working towards<br />
achieving environmental sustainability through ‘future-proof’ regeneration and by tackling the<br />
factors affecting climate change. A report to the Council’s Environment & Waste<br />
Management Improvement Committee in March 2009 has identified the major areas of<br />
concern around these issues and highlighted the strategic recommendations and key actions<br />
taken and/or ongoing to make progress in this aspect. Details of this are included in appendix<br />
2 of this chapter.<br />
The Council has agreed the development of its own Climate Change Action Plan, which will<br />
be an 8-year programme with targets and resources for carbon savings and adaptation<br />
measures. As an initial step the council’s Environment and Waste Management Improvement<br />
Committee has launched the first report on climate change in June 2008 which focussed on<br />
the impact of regeneration in the district.<br />
Housing accounts for around 30% of the UK’s total energy use and 27% of carbon dioxide<br />
emissions. The council views that retrofitting of some of the existing housing stock is<br />
344
important as they will constitute a large part of the houses in 2030. DEFRA has already<br />
granted £300k for the Warm Zone scheme, covering two inner city wards, offering advice and<br />
subsidies on loft insulation, cavity wall insulation and draft proofing.<br />
Although <strong>Bradford</strong> has been named the “Greenest City in the UK” in the recent Forum for the<br />
Future survey112, there are still major issues that need to be addressed effectively. The city<br />
scored well on air and water quality, waste per head and ecological footprint but less well for<br />
‘Quality of Life’ and ‘Future Proofing’. One of the many ways to achieve this should be to<br />
concentrate on underused resources in the district. For example, <strong>Bradford</strong> Woodlands could<br />
be better employed for woodchip biomass heating. It is used in City Hall & Ilkley Town Hall<br />
but could be more widely used e.g. in schools. The city has the most cost effective UK wind<br />
firm at Ovenden Moor, so more use of such wind technology could be better promoted.<br />
10.11 Key Facts:<br />
• Fine particles and nitrogen dioxide are the two pollutants likely to have the most<br />
impact on the District’s air quality. Heavy traffic movement is identified as one of the<br />
major sources of these pollutants. The District also has a number of industrial<br />
processes subject to local authority air pollution control but they are unlikely to<br />
cause a breach of national air quality objectives.<br />
• Water quality within <strong>Bradford</strong> district tends to be ‘poor or bad’ in urban areas and<br />
‘better’ in the Aire and Wharfe catchment. Increased investments in sewage<br />
treatment and improved monitoring of trade effluents have brought overall biological<br />
and chemical improvements in district’s waterways. However issues related to<br />
pesticides, pathogens, industrial detergents are still to be explored further; but<br />
currently they are unlikely to cause any detrimental effect to the river ecosystem or<br />
public health.<br />
• Poor quality of some parts of the inner city/town urban environment, particularly due<br />
to fly-tipping, litter and dereliction, is a major problem and studies suggest that it<br />
causes the affluent residents of those areas to move out towards the suburbs and<br />
outskirts of the District. Most up to date studies and opinion surveys however show<br />
that public satisfaction about the cleanliness of the district’s streets and<br />
neighbourhoods have increased in recent years.<br />
• Land contamination is not expected to be a major problem although the precise<br />
extent of the contamination is still being investigated. Existing assessment and<br />
knowledge however suggest that the potential contamination sources are limited to<br />
previous manufacturing and industrial activity and treatment or disposal of waste.<br />
112 BBC (2007). <strong>Bradford</strong> tops green cities league [online]. BBC [cited 18 June 2008]. Accessed on:<br />
<br />
345
Sources:<br />
• The delineation of <strong>Bradford</strong>’s natural floodplains is well understood as experienced<br />
from the recent flood events. The main flood risk areas lies along the course of river<br />
Wharfe, River Aire and Silsden beck covering their catchment areas mainly in Ilkely,<br />
Burley, Stockbridge, Shipley, Bingley, Apperley Bridge and Silsden. Developments<br />
in those floodplains are strictly controlled by dedicated planning policies and through<br />
extensive consultation process with related partners including the the Environment<br />
Agency.<br />
• The wildlife and habitat interest in <strong>Bradford</strong> District is influenced by its climate,<br />
topography and latitude, with many species at the limit of their range. There is a<br />
range of designated nature conservation sites within <strong>Bradford</strong> some of which are<br />
specially protected because of their nationally and internationally recognised<br />
species and habitats. There are also a number of Wildlife Areas and sites with<br />
Local Nature Conservation value which, apart from their biodiversity interest, provide<br />
community benefits in terms of quiet enjoyment of nature and educational value.<br />
• Climate change is a major concern worldwide and it has already impacted on some<br />
of the council’s services. There are ongoing schemes and strategies that are<br />
coordinated to tackle this issue in the district primarily by focussing on energy<br />
efficiency through better design and by exploring potentials for alternative<br />
technologies.<br />
• The overall potential for <strong>Bradford</strong> to meet the regional and national renewable<br />
energy target is lower than the average for LA's in the region. Although there is good<br />
potential to make alternative technologies, such as biomass and photovoltaic, more<br />
commercially viable, there is a lower potential for wind turbine developments across<br />
the district.<br />
• There has been no comprehensive assessment of the archaeological history of the<br />
district. However, desktop analysis and field investigation of certain development<br />
sites have indicated the presence of early medieval settlements in <strong>Bradford</strong> which<br />
flourished in later centuries most prominently surrounding the cathedral.<br />
• BBC (2008). Beneath <strong>Bradford</strong>’s Streets! [online]. BBC [cited 19 June 2008].<br />
Available:<br />
<br />
• BCR (2005) Masterplan Framework for the Public Realm of <strong>Bradford</strong>- Feasibility<br />
<strong>Study</strong>. Report dated August 2005. Arup.<br />
• BCR (2005) Utilities and Drainage <strong>Study</strong>. Report dated October 2005. Arup.<br />
346
• CBMDC (2001) Inspection <strong>Strategy</strong> for Contaminated Land in the <strong>Bradford</strong> District.<br />
Report dated December 2001. <strong>Bradford</strong> Council.<br />
• CBMDC (2002) The <strong>Bradford</strong> District Multi-Agency Environmental <strong>Strategy</strong> 2002-<br />
2007 (Draft for Consultation). Reprt dated February 2002. CBMDC.<br />
• CBMDC (2003) <strong>Bradford</strong> Strategic flood Risk Assessment. Report dated March 2003.<br />
JBA Consulting.<br />
• CBMDC (2005) City Centre Conservation Area Assessment. Report dated October<br />
2005. CBMDC.<br />
• CBMDC (2005) Municipal Waste Management <strong>Strategy</strong>. Report dated October 2005.<br />
CBMDC.<br />
• CBMDC (2005) Review to consider the Future of Water Management and the<br />
Associated Problems of Flooding in the <strong>Bradford</strong> District. Report dated March 2005.<br />
Policy Development Service, CBMDC.<br />
• CBMDC (2006). <strong>Bradford</strong> District Environment Partnership <strong>Strategy</strong>. Report dated<br />
July 2006. CBMDC.<br />
• CBMDC (2007) Air Quality in the City of <strong>Bradford</strong> <strong>Metropolitan</strong> District-Progress<br />
Report 2007. Report dated December 2007. Department of Environment and<br />
Neighbourhood, CBMDC.<br />
• CBMDC (2007) <strong>Bradford</strong> City Centre Area Action Plan Sustainability Appraisal Final<br />
Scoping Report. Report dated September 2007. Planning Service, Department of<br />
Regeneration, CBMDC.<br />
• CBMDC (2007) <strong>Bradford</strong> District Environmental <strong>Strategy</strong> 2008-11. Report dated<br />
2007. CBMDC.<br />
• CBMDC (2007) <strong>Bradford</strong> District Sustainable Community strategy- Information pack<br />
and Fact Sheets. Policy Development Service, <strong>Bradford</strong> Council.<br />
• CBMDC (2007) Carbon Management Programme 2007- 2012 Strategic and<br />
Implementation Plan. Report dated October 2007.<strong>Bradford</strong> Council.<br />
• CBMDC (2007) Sustainability Appraisal Scoping report for the Open Space and<br />
Recreational Built Facilities SPD. Report dated March 2007. CBMDC.<br />
• CBMDC (2008) Climate Change and <strong>Bradford</strong> District [online]. CBMDC [cited 20 June<br />
2008]. Accessed on :<br />
347
• AWAY (2010) West Yorkshire Adaptation Action Plan. Association of West Report<br />
Dated September 2010. Yorkshire Authorities.<br />
• CBMDC (2009) Air Quality Action Plan for <strong>Bradford</strong> District –Draft. Report dated June<br />
2009. CBMDC.<br />
• Genecon (2010) BCR Performance Framework: Annual Update 2010/11-Draft Final<br />
report. Report dated February 2010. Genecon Consultancy Ltd.<br />
• Keith, K. (2000). Broadway Centre, Hall Ings, <strong>Bradford</strong>, West Yorkshire: Desk-based<br />
Assessment. Unpublished WYAS report (R778, 2 vols).<br />
• Waterman Burrow Crocker (2003) Flood Risk Assessment-Foster Square, <strong>Bradford</strong>.<br />
Report dated March 2003. Waterman Burrow Crocker.<br />
• Y & H Assembly (2003) Yorkshire and Humber Regional Waste <strong>Strategy</strong>. Report<br />
dated July 2003. Y & H Assembly.<br />
• YHREF (2009) YH Regional Environment Enhancement <strong>Strategy</strong> 2008-13. Yorkshire<br />
and Humber Regional Environment Forum.<br />
• AECOM (2011) Low Carbon and Renewable Energy Capacity in Y&H-Final Draft.<br />
Report Dated February 2011. Local Govt Yorkshire and Humber.<br />
348
Appendix 1:<br />
Maps of <strong>Bradford</strong> AQMAs<br />
The City of <strong>Bradford</strong> <strong>Metropolitan</strong> District Council Air Quality Management Order<br />
(No.1), 2006.<br />
The Area surrounded by the red line has been designated as an Air Quality Management<br />
Area<br />
349
The City of <strong>Bradford</strong> <strong>Metropolitan</strong> District Council Air Quality Management Order<br />
(No.1), 2006.<br />
The Area surrounded by the red line has been designated as an Air Quality Management<br />
Area<br />
350
The City of <strong>Bradford</strong> <strong>Metropolitan</strong> District Council Air Quality Management Order<br />
(No.1), 2006.<br />
The Area surrounded by the red line has been designated as an Air Quality Management<br />
Area<br />
351
The City of <strong>Bradford</strong> <strong>Metropolitan</strong> District Council Air Quality Management Order<br />
(No.1), 2006.<br />
The Area surrounded by the red line has been designated as an Air Quality Management<br />
Area<br />
352
Appendix 2:<br />
CLIMATE CHANGE ISSUES AND STRATEGIC RECOMMENDATIONS AND KEY ACTIONS TO BE TAKEN BY THE COUNCIL<br />
Recommendations Current Issues and Actions Taken/Ongoing<br />
1. The Council, working with its partners, should<br />
take a lead on action to adapt to, and mitigate<br />
climate change in <strong>Bradford</strong> District.<br />
2. The Council and the Local Strategic<br />
Partnership should undertake regular and<br />
transparent monitoring of the environmental<br />
sustainability of regeneration and development<br />
taking place in the district.<br />
• Climate Change features within the Big Plan (Sustainable Community <strong>Strategy</strong>). Aligned delivery<br />
planning to follow.<br />
• Partnership project to recruit a District Carbon Reduction Officer to conduct research and feasibility<br />
studies into how best the district can reduce CO2 emissions. Research to include renewable<br />
technology, Planning guidance (linked to LDF) and Building Schools for the Future<br />
• A Climate Change <strong>Strategy</strong> for the Council is in development.<br />
• National Local Indicator 186 has been adopted as part of the Local Area Agreement with the<br />
Government Office. This relates to district wide reduction of Carbon Dioxide emissions. A target of<br />
11.4% reduction has been agreed to be achieved by 2011.<br />
• Eco-city campaign in existence and under development. 20 organisations have signed up, enabling<br />
the sharing of practice on the pledges on CO2 reduction and adaptation.<br />
• Working Neighbourhood Fund, £160,000 has been allocated to the Partnership for District carbon<br />
reduction work. £30k match funding will be provided by each: <strong>Bradford</strong> University, <strong>Bradford</strong> and<br />
Airedale tPCT and Incommunities, totalling an additional £90k for 2009-11.<br />
• Regeneration projects incorporate environmental sustainability into the project development,<br />
appraisal and management processes.<br />
• Such an approach is prioritised because environmental sustainability is understood to be an integral<br />
part of regeneration in <strong>Bradford</strong> district.<br />
(see below – recommendation 7 - for information on sustainability at strategy and specific project level)<br />
353
3. The Council should ensure that it is robustly<br />
employing all its existing planning powers and<br />
fully exploits the opportunities presented by the<br />
development of the Local Development<br />
Framework in order to ensure that the<br />
regeneration of the district is environmentally<br />
sustainable.<br />
• Existing policies in RUDP and approved Regional Spatial <strong>Strategy</strong> (RSS) aim to deal with<br />
environmental sustainability and were subject to Sustainability Appraisals (SA) as part of preparation<br />
process in 2002-03.<br />
• Supplementary Planning Document on Sustainable Design Guide adopted by the Council in 2007,<br />
supports existing policies in RUDP.<br />
• Policy ENV5 in the RSS sets out an interim target requiring new developments to secure at least<br />
10% of their energy from decentralised and renewable or low-carbon sources, where feasible and<br />
viable, until local targets emerge. Work is ongoing with the Regional Assembly to establish the best<br />
methods of achieving targets.<br />
• The Council needs to consider how <strong>Bradford</strong> implements this provision in advance of Local<br />
Development Framework (LDF). (There is an opportunity in the LDF to set local requirements for<br />
sustainable buildings in advance of the progressive increases in national standards that are<br />
anticipated to lead to housing with zero carbon emissions. However any local requirement set for<br />
sustainable buildings and/or a target percentage of the energy to be used in new development from<br />
decentralised and renewable or lowcarbon energy sources, will have to take account of local<br />
circumstances, the viability of projects and the need to deliver housing targets).<br />
• Emerging LDF work has established a SA framework in line with national guidance and EU<br />
Sustainable Environment Appraisal Directive that will assess LDF proposals against common<br />
sustainability criteria and will inform decisions on strategy and approach. The SA framework includes<br />
economic and social considerations as well as environmental.<br />
• National requirements will ensure new housing is carbon neutral by 2018.<br />
• With its partner, <strong>Bradford</strong> City Regeneration (BCR) planning legislation is used to ensure new<br />
developments take account of flooding risks. Plans are scrutinised by both the Council’s Drainage<br />
service and the Environment Agency.<br />
• BCR seek to encourage developers to exceed minimum planning law requirements.<br />
354
4. All proposals for new developments in the<br />
district should be required to take account of the<br />
environmental and quality of life impacts of<br />
transport.<br />
• All BCR sponsored development meets BREEAM requirements for sustainable disposal of site<br />
waste.<br />
A safe, efficient and integrated transport system is the key to quality of life for those living, working and visiting<br />
<strong>Bradford</strong>. It is also important to the economic prospects of the District. Our aim is to produce a safe and<br />
effective modern transport system which caters for the need of all users, enhanced by regeneration, with an<br />
attractive public transport network, reduced reliance on the car and much improved air quality.<br />
The West Yorkshire Local Transport Plan (LTP) provides the framework for implementing transport schemes<br />
and tackles environmental and quality of life issues by:<br />
• Increasing opportunities for walking and cycling by connecting housing, employment and leisure<br />
sites with green pathways, such as the Shipley to Spen Valley Cycle Route, the Great Northern Trail<br />
and Airedale Greenway<br />
• Introducing new bus services where accessibility is poor e.g. between BRI and local communities in<br />
north <strong>Bradford</strong> and introduction of FreeCityBus in City Centre<br />
• Investigating ways to reduce congestion such as High Occupancy Vehicle (HOV) lanes e.g. M606,<br />
and encouraging people to car share e.g. <strong>Bradford</strong> Carshare scheme is now well established, with<br />
600 members who have saved over 50 tonnes of CO2<br />
• Promoting active travel which contributes to delivering the health agenda through both infrastructure<br />
(e.g. implementation of the Rights of Way Improvement Plan and development of cycle ways) and<br />
other measures (e.g. promotional events such as Bike Week and cycle proficiency training in<br />
schools)<br />
• LTP partners working with LDF teams to promote sustainable land use planning by reducing the<br />
need to travel, encouraging walking, cycling and use of public transport and having denser<br />
development in more accessible locations.<br />
• WY Planning Authorities and Metro are including planning obligations for developers to provide free<br />
MetroCards to residents of new developments to encourage public transport use.<br />
• It is possible to reduce the impact of transport on the environment, especially with regard to its effect<br />
on air quality and its contribution to climate change by reducing the length and number of car<br />
journeys and encouraging the use of alternative modes of transport.<br />
• Non motorised forms of transport are being encouraged through promotion of Travel Plans for<br />
355
5. The Council and its partners must urgently<br />
seek ways in which to address the energy<br />
efficiency of existing privately owned and<br />
privately rented housing<br />
schools and businesses.<br />
• Work with schools in <strong>Bradford</strong> to promote walking and cycling includes initiatives such as the<br />
provision of pedestrian and cycling training, assistance in establishing walking buses, the<br />
organisation of events as part of Bike Week, and support for campaigns such as ‘Walk to School<br />
Week’. 144 schools in <strong>Bradford</strong> have an approved school travel plan which qualifies them for capital<br />
grant funding from central Government to support various measures such as installation of cycle<br />
parking, facilities for pedestrians and safety improvements<br />
• The LDF core strategy will ensure that all new developments in the district promote sustainable<br />
methods of transport. Travel plans for new developments facilitated through the planning process<br />
are starting to be delivered as the developments come on stream. All types of development affected:<br />
retail, residential and commercial.<br />
• All development proposals likely to have significant travel implications are required to undertake a<br />
Transport Assessment to identify the impact of the development on the transport network and put<br />
forward measures for addressing any adverse impact.<br />
• Over 30 employers in <strong>Bradford</strong> have now signed up to the West Yorkshire Travel Plan network which<br />
demonstrates that they are committed to implementing travel plan measures in their organisations<br />
• <strong>Bradford</strong> Carshare scheme is now well established, with 600 members who have saved over 50<br />
tonnes of CO2.<br />
• The Council, with its partners, is investing £1.5 million in <strong>Bradford</strong>’s Community Warmth Scheme,<br />
targeted at 170,000 homes in private ownership or private renting.<br />
• Three wards have been completed, with residents self referring. 2,600 energy efficient measures<br />
have been installed and 2,750 referrals made to partner organisations for further action.<br />
• The programme now makes it possible to offer free cavity wall insulation across the district and free<br />
loft insulation for over the 60’s and to people on benefits.<br />
• At completion, the programme will have treated 37,000 cavity walls and 48,000 lofts.<br />
Three city centre developments, facilitated by <strong>Bradford</strong> City Regeneration will achieve high energy efficiency<br />
standards:-<br />
356
6. Accessible and practical advice and support<br />
on environmental sustainability should be made<br />
available and promoted to local businesses.<br />
i) Exchange Court – CBMDC/YF/BCR and HMCS, designing the new Magistrates Court to<br />
BREEAM 2008 Excellent Standards.<br />
ii) The New Victoria Place development, designed to BREEAM Excellent Standard<br />
iii) Listerhills Student village, designed to BREEAM Outstanding and has full planning permission<br />
NRF supported project: Environment Made Easy<br />
A variety of business support organisations exist to encourage businesses to address their environmental<br />
impacts. Many offer free support in a specialised area. Some have a national remit, others are regional.<br />
However, many business are unaware of this support and some find it confusing.<br />
In response, the BBEF (Better Business Environment Forum) developed the ‘Green Pages’ directory funded<br />
by <strong>Bradford</strong> District Economic Development Partnership. The booklet signposts businesses to over twenty<br />
environmental support programmes open to businesses in <strong>Bradford</strong> including:<br />
• Free waste audits from Envirowise;<br />
• Free energy audits provided by the Carbon Trust;<br />
• A free online degree course in Sustainable Waste Management from Leeds University;<br />
• Assistance turning waste into a valuable resource with Why Waste;<br />
• Grants for environmental projects from Manufacturing Advisory Service;<br />
• Grants for Capital Investment from Yorkshire Fund Managers.<br />
LEGI and Kickstart advisors help to disseminate the booklet to a wide audience.<br />
To ensure the booklet reached its appropriate target audience it was distributed to all businesses in the<br />
<strong>Bradford</strong> postal area with over ten employees. The booklet was not mailed to the services sector as that is<br />
considered to have a lower environmental impact.<br />
The project has created awareness of contemporary environmental issues facing <strong>Bradford</strong> businesses. This in<br />
turn has effected the following:<br />
• Amount of waste sent to Landfill<br />
357
7. The Council, when carrying out its economic<br />
development function, should actively<br />
encourage, and also promote the opportunities<br />
presented by ‘green’ enterprise and the ‘green’<br />
economy.<br />
• Amount of non-renewable resources consumed by businesses<br />
• Amount of climate change gases emitted by businesses<br />
• Demand for environmental services.<br />
Enterprise Europe Yorkshire<br />
The Enterprise Europe Network provides a local gateway to a wealth of information on doing business, finding<br />
collaborative partners and increasing competitiveness in Europe. It is delivered out of the Economic<br />
Development Service within <strong>Bradford</strong> Council.<br />
EEY sit on the Steering Group for the Chamber co-ordinated Better Business Environment Forum – see above<br />
– which provides a local green business club for <strong>Bradford</strong> businesses.<br />
Working with BBEF, Enterprise Europe Yorkshire provides seminars on a range of issues, including assisting<br />
businesses to meet the sustainability goals of local authorities articulated through their procurement<br />
processes.<br />
EEY provides information direct to local businesses on European environmental legislation, and regularly<br />
posts news on their website (www.ee-yorkshire.com) – for example a recent post focused on a new retail<br />
forum established to promote sustainable consumption.<br />
The economic strategy for <strong>Bradford</strong> identifies the development of environmental industries as a major growth<br />
opportunity for the district and commits to supporting the development of this sector.<br />
• Shipley sustainable resource park Phase 1: A reclaimed and refurbished industrial unit now houses<br />
two social enterprises – one of which is in the green business sector – Aire Valley recycling.<br />
Phase 2 is being considered for implementation – would reclaim 5ha of heavily contaminated land,<br />
to create a green business park.<br />
<strong>Bradford</strong> Together sets out in a single document opportunities for partners and suppliers to help the Council<br />
meet its sustainability objectives and has been adopted as part of the procurement methodology.<br />
358
8. The Council and its partners should<br />
proactively campaign and lobby for the powers<br />
needed to enable the district to adapt to and<br />
mitigate climate change.<br />
The opportunities for business partners and suppliers to help the Council meet its sustainability objectives lie<br />
in the tender process. Organisations wishing to tender for supplies of goods or services to the Council, or for<br />
development of Council-owned land or property in the District, will be asked to make clear their contributions<br />
to sustainability objectives as laid out in <strong>Bradford</strong> Together. For example, when Procurement Unit considers<br />
tenders for a development in the district, regard will be given to provision for employment of local labour, use<br />
of energy from sustainable sources, commitment to spend percentage of contract value with the local supply<br />
chain. It is anticipated that this practice will become increasingly commonplace among developers and lead to<br />
increased competition in the sustainability content of tenders.<br />
<strong>Bradford</strong> Together forms part of the Council’s contribution to implementation of the Big Plan in relation to the<br />
shared outcomes of sustainability.<br />
• The Council and University , set up an Eco city pledge in March 2007.<br />
• All Council Directorates have been asked to describe their contributions to the Prince of Wales’ May<br />
Day Pledge.<br />
• A full Council resolution to contact Government for support in relation to climate change and oil<br />
dependency was made in xxxx<br />
• The District Environment <strong>Strategy</strong> will be presented to Executive in April 2009. That will promote for<br />
the Council and its partners in the Local strategic Partnership a range of actions and criteria that will<br />
positively support environmental sustainability.<br />
• The Council is a member of the regional climate change forum and uses the forum to represent the<br />
district’s priorities.<br />
• During 2009, the district’s Environment Partnership will be working with the UK Climate Improvement<br />
Programme, to model “good practice “to reduce carbon emissions, in business operations with<br />
partners- including the Council.<br />
359
11. MINERALS AND WASTE MANAGEMENT<br />
This section of the report provides details about the existing Minerals resources within the<br />
district and highlights the issues being faced by the industry. The section also reviews the<br />
district’s Waste Management issues- the types of wastes produced in <strong>Bradford</strong>, how this is<br />
currently being managed and the challenges faced by the Local Authority to meet the<br />
regional and national waste management targets.<br />
The information used in this section were mostly derived from:<br />
• Waste DPD Issues and Options (CBMDC, 2009)<br />
• <strong>Core</strong> <strong>Strategy</strong> Further Issues and Options: Topic Paper 7 and 8 (CBMDC, 2008)<br />
• Municipal Waste Management <strong>Strategy</strong> (CBMDC, 2005)<br />
• Yorkshire & Humber Regional Waste <strong>Strategy</strong> (2003)<br />
• Identifying mineral resources in the <strong>Bradford</strong> District – local distinctiveness and<br />
protection of heritage (Jon Ackroyd, 2008)<br />
• British Geological Survey, 2009. Mineral Resource Data for City of <strong>Bradford</strong> MDC<br />
• Yorkshire and Humber Region Aggregates Working Party Annual Report 2008.<br />
• Yorkshire and Humber Regional Aggregates Working Party: Sand and Gravel <strong>Study</strong><br />
(British Geological Survey, 2004).<br />
11.1 Minerals<br />
National minerals planning policy is set out in Minerals Planning Guidance Notes (MPGs)<br />
and the new replacement Minerals Policy Statements (MPSs). The key national policy<br />
document relevant to the forward planning of minerals in the <strong>Bradford</strong> District is Minerals<br />
Policy Statement 1: Planning and Minerals (MPS1). MPS1 sets out the Government’s key<br />
overarching policies and principles which apply to all minerals, applying the principles of<br />
sustainable development.<br />
The key policy messages in MPS1 are:<br />
- the need to maintain sufficient supply to meet the anticipated need for minerals<br />
consistent with environmental acceptability;<br />
- the need to protect designated areas of national and international importance;<br />
- the need to encourage efficient use of extracted materials and the use of<br />
substitute or recycled materials in place of primary minerals wherever practicable;<br />
and<br />
- the need to ensure that where extraction does take place, restoration and<br />
aftercare of sites are of high quality.<br />
The Yorkshire and Humber Plan Regional Spatial <strong>Strategy</strong> to 2026 (RSS) follows the<br />
overarching key polices set out in MPS1, but gives a regional context. However the RSS<br />
focuses on aggregate production and does not specifically refer to building stone, roofing<br />
stone or flagstone production in the region.<br />
360
The RSS states that development plans should seek to safeguard mineral deposits in the<br />
region from sterilisation by other types of development and provide for an adequate and<br />
steady supply of minerals by maintaining a landbank for all nationally and regionally<br />
significant minerals. The RSS also commits the region to maximising the use of secondary<br />
and recycled aggregates to reduce the need for primary extraction by encouraging facilities<br />
involved in the production of such material, especially in West Yorkshire. The intended<br />
outcome of regional minerals policy is that:<br />
- Mineral deposits in the Region will have been safeguarded from sterilisation, and<br />
conserved through maximising the use of secondary and recycled aggregates<br />
wherever possible.<br />
11.1.1 Aggregates<br />
The Regional Aggregates Working Party (RAWP) is a Yorkshire and Humber regional<br />
technical working group with the purpose of monitoring aggregate and sand and gravel<br />
landbanks within the region. An annual monitoring report is published providing information<br />
on the length of sub-regional landbanks<br />
The tables below illustrate the position in West Yorkshire in terms of sand & gravel and<br />
crushed rock. The Region intends to monitor the situation to ensure that sub-regional<br />
apportionments are met and that the use of substitute/secondary aggregates is maximised.<br />
Table: Sub-Regional Apportionment of the National and Regional Guidelines for Aggregates<br />
Provision, 2001 to 2016 (Million Tonnes)<br />
Land-won sand and gravel<br />
Land-won crushed rock<br />
West Yorkshire 5.5 17.8<br />
(Source: Yorkshire and Humber Region Aggregates Working Party Annual Report 2007 Aggregates<br />
Monitoring 2007)<br />
Table: Crushed Rock Reserves and Landbanks<br />
Reserves at<br />
31.12.07<br />
(million tonnes)<br />
Sub-regional Apportionment<br />
(million tonnes per annum)<br />
Landbank<br />
at 31.12.07<br />
(years)<br />
West Yorkshire 40.8 1.11 36.6<br />
(Source: Yorkshire and Humber Region Aggregates Working Party Annual Report 2007 Aggregates<br />
Monitoring 2007)<br />
The figures for the sub-region (shown in table 2) indicate that in West Yorkshire there are<br />
significant permitted reserves of crushed rock aggregate (40.8 million tonnes), with a<br />
landbank of over 36 years. The apportionment for West Yorkshire between 2001 and 2016<br />
is 17.8 million tonnes, which is actually less than the current permitted reserves. However<br />
West Yorkshire currently makes a minimal contribution to sand and gravel supply within the<br />
region.<br />
361
Figure: Mineral extraction sites and potential Resource areas within <strong>Bradford</strong> district<br />
Source: BMDC Minerals and waste Planning<br />
11.1.2 Sand and Gravel<br />
Due to the low number of sites within the West Yorkshire sub-region (only 1 site was<br />
recorded as active during 2007 with another site inactive but possessing permitted reserves)<br />
data on landbank length cannot be published due to commercial confidentiality. However the<br />
report acknowledges that there is a ‘low’ level of permitted reserves within the sub-region.<br />
The Yorkshire and Humber Assembly (YHA) has estimated that there is a 32 million tonne<br />
shortfall in the permitted reserves of sand and gravel in the Yorkshire and Humber Region to<br />
meet the apportionments likely to be set by the government up to 2021.<br />
There are currently 13 operational minerals extraction sites in the <strong>Bradford</strong> district, mainly<br />
extracting sandstone in a block form, with aggregate production a secondary activity. The<br />
sites vary in size, from the relatively small, extracting an average of 10,000 tonnes per<br />
annum to some larger scale sites, extracting of up to 80,000 tonnes per annum.<br />
Most of the sites are established historical sites, run by local companies. They are mostly<br />
situated in green belt (including the moors) to the north west of the City Centre and to the<br />
south of Keighley.<br />
362
Many of the sites are approaching the exhaustion of their permitted reserves.<br />
During a meeting of the Regional Aggregates Working Party the sand and gravel industry<br />
expressed doubts about the viability of exploiting sand and gravel resources within <strong>Bradford</strong><br />
in terms of finding sites with sufficient accessible resources to make them commercially<br />
viable. The British Geological Society (BGS) has been commissioned by the Yorkshire and<br />
Humber Assembly (YHA) to undertake a reality checking exercise which will involve the sand<br />
and gravel industry in identifying constraints to commercial sand and gravel extraction within<br />
West Yorkshire, including <strong>Bradford</strong>.<br />
11.1.3 Building, Roofing and Flag Stone<br />
The government commissioned a report on the planning issues related to the supply of<br />
natural stone building materials which was published in March 2004, Planning for the<br />
Supply of Natural Building and Roofing Stone in England and Wales. Research was<br />
carried out on building and roofing stone supply through survey work, analysis of published<br />
statistics and case studies. Demand was discussed but not quantified, due to the variable<br />
and unpredictability of building stone markets.<br />
The supply data analysed indicated that there was a generally slowly rising trend in building<br />
and roofing stone production in England and Wales between the period from 1992 to 2001.<br />
However the proportion of building and roofing stone demand being met by imports<br />
increased dramatically over this period, with imports being 14% greater than domestic<br />
production in 1992 but 200% greater by 2001.<br />
The survey found that the majority of quarries are relatively small scale (under 3ha) with<br />
relatively low output (up to 2,000m 3 ) per annum and are often only worked intermittently.<br />
However the majority of production is concentrated within a small number of relatively large<br />
operations.<br />
The report highlights the significance of carboniferous sandstones in terms of building and<br />
roofing stone production, which account for both the largest number of individual quarries<br />
and the greatest level of output. The importance of Yorkshire, in terms of the supply of<br />
carboniferous sandstones, commonly known as York Stone, is particularly noted.<br />
Imports are stated to be the perceived biggest threat to the UK building stone industry. In<br />
particular sandstone from India and China is noted to be competing directly with materials<br />
such as York Stone paving at less than half the price (ODPM/ Symonds group, 2004).<br />
The need for natural stone building materials within the district is integrally linked to housing,<br />
built heritage and design policy objectives. The most significant element of building, roofing<br />
and flag stone demand is for new build projects, including new housing developments and<br />
public realm projects. The RSS sets out benchmark figures for housing provision within the<br />
<strong>Bradford</strong> District. Depending upon the location of the housing and the design policies<br />
adopted by the Council, a certain proportion of the building materials required to construct<br />
these new houses will comprise natural sandstone products such as sandstone walling<br />
363
masonry. Likewise design objectives are likely to require natural Elland Flag paving and<br />
decorative/ monumental stone for a certain proportion of public realm projects.<br />
Locally produced building stone, and in particular flagstone, is also sold throughout the UK<br />
for both new paving and building projects and the restoration of historic buildings. Stone<br />
produced in the district has been recently been used in projects at nationally significant sites<br />
such as Saltaire World Heritage Site, York Minster and Buckingham Palace.<br />
The need for materials for the repair, alteration or extension of historic and culturally<br />
important buildings within the district, such as listed buildings and many buildings within<br />
Conservation Areas, is less significant in terms of sales but of significant importance in terms<br />
of the maintenance of the traditional character of <strong>Bradford</strong>’s built environment.<br />
To inform the development of minerals policies the Council’s Design and Conservation team<br />
have produced a report (Jon Ackroyd, 2008) discussing the relationship of the built heritage<br />
of the district with minerals resources. The report notes that the character of the settlements<br />
within <strong>Bradford</strong> and the ‘sense of place’ of the inhabitants is primarily derived from the local<br />
building stone materials and that the use of artificial stone, brick or contrasting materials can<br />
dilute local character and result in the loss of a sense of place.<br />
The report goes on to note that there are only a limited number of operational quarries<br />
supplying building stone with appropriate aesthetic characteristics for use within the district.<br />
The scarcity of supply of coarse grained ‘gritstone’ walling, suitable for use in settlements to<br />
the north of the district, and stone slate roofing are particularly highlighted. Concerns are<br />
raised that the natural stone materials currently imported from outside the district can have<br />
subtly different aesthetic characteristics to local stone, in terms of colour, texture and course<br />
thickness. The report concludes that there is a clear need for greater availability of local<br />
stone for local use, and that particular emphasis should be placed on increasing supplies of<br />
roofing stone.<br />
Enquiries have been made with both English Heritage and the West Yorkshire<br />
Archaeological Advisory Service (WYAS) to establish if any records exist of specific quarries<br />
within the District which may be important in supplying materials for the repair and<br />
maintenance of historic sites and monuments. English Heritage indicated that they intend to<br />
undertake a survey of building stone quarrying within West Yorkshire, but that, pending the<br />
outcome of the survey, they cannot provide any assistance in identifying such sites. WYAS<br />
likewise indicated that they do not hold any records of sites within <strong>Bradford</strong> which could<br />
provide material for the repair of historic sites or monuments.<br />
In December 2008 discussions were held between English Heritage and the Yorkshire and<br />
Humber Assembly regarding the potential for a jointly funded regional building stone study.<br />
However these discussions have been postponed pending the reorganisation of the Regional<br />
Planning Body, with the intention of recommencing in April 2009.<br />
364
11.1.4 Coal and Fireclay<br />
Fireclays are sedimentary mudstones mainly found underlying coal seams. Fireclay was<br />
traditionally valued as a raw material for manufacturing refractories for lining furnaces,<br />
however demand from refractory manufacturers has diminished and fireclay is now more<br />
commonly used for manufacturing high quality buff coloured facing bricks (BGS, 2006). In the<br />
past fireclay workings were widespread to the south of the district around the settlements of<br />
Denholme, Queensbury, Thornton, Tong and South of <strong>Bradford</strong> City Centre. These workings<br />
supplied several brickworks and refractory manufacturers within the district. In recent years<br />
fireclay has been extracted at a site to the south of Oxenhope to supply a refractory business<br />
located in Queensbury.<br />
There are currently no active mineral workings within the district supplying fireclay, all<br />
brickworks located within the district have closed and the MPA are not aware of any<br />
proposals for future fireclay extraction within the district to supply markets for either brick or<br />
refractory production. One site in the Denholme area has recently obtained permission for<br />
the extraction clay for engineering purposes; however this is for a surface deposit of glacial<br />
till rather than deeper fireclay resources.<br />
There has been widespread historic deep mining of coal within the district; however no large<br />
scale opencast coal mining has taken place. There are currently no active deep or opencast<br />
coal mines within the district and the MPA are not aware of any proposals for future deep or<br />
surface coal extraction.<br />
Fireclay resources are largely coincident with shallow coal resources, and the viability of<br />
fireclay extraction is usually dependant upon the recovery of other minerals, principally coal;<br />
therefore potential fireclay resources identified within the district correspond with potential<br />
shallow coal resources (BGS, 2006). Resource maps obtained from the coal authority<br />
indicate that a wide area surrounding the City of <strong>Bradford</strong> contains shallow coal resources<br />
potentially suitable for surface extraction. Much of this area is heavily urbanised, however the<br />
potential resource includes areas of countryside to the east and west of the City including<br />
areas around Tong, Thornton, Queensbury and Denholme.<br />
11.2 Current Minerals Supply Situation within <strong>Bradford</strong><br />
The predominant mineral extracted within the <strong>Bradford</strong> District is sandstone used to produce<br />
building, roofing or flag stone. Crushed sandstone aggregate production also takes place<br />
utilising material unsuitable for producing natural stone building materials, but no large scale<br />
primary aggregate quarries operate in the District. Although resources exist, there are no<br />
active fireclay, coal or sand and gravel extraction sites located within the District. One site<br />
has recently obtained permission for the extraction of a surface deposit of boulder clay to be<br />
used for landfill engineering applications.<br />
There are currently 10 active building or flagstone quarries within the District; however<br />
several of these sites are only intermittently worked. The majority of sites are located west of<br />
the City of <strong>Bradford</strong> around the settlements of Bingley, Cullingworth, Wilsden, Thornton,<br />
365
Denholme and Oxenhope. However several ‘urban quarries’ are located within the City of<br />
<strong>Bradford</strong>. The sites vary in size, from the relatively small scale, operations with low or<br />
intermittent output, producing up to 10,000 tonnes per annum, to several relatively large<br />
scale operations producing up to 80,000 tonnes of building stone, flag stone and aggregates<br />
per annum. It is understood that there is a small amount of stone slate roofing produced<br />
within the district however this is restricted to a small number of sites.<br />
Most of the active quarries are long established sites that have provided stone for the<br />
construction of buildings within the <strong>Bradford</strong> District for over 100 years, where the quarries<br />
themselves form part of the character of the landscape. The landscapes in which the<br />
quarries within the district tend to be situated are predominantly either mixed upland<br />
agricultural areas or gritstone moorland. The exploitation of certain sandstone resource<br />
areas, such as resources to the north of the district, and the production of certain types of<br />
natural stone materials, such as riven flags and stone slate roofing has declined<br />
substantially.<br />
Many of the active building stone quarries are thought to be approaching the exhaustion of<br />
their permitted reserves and several have closed within recent years. However further survey<br />
work is to be undertaken to gather data on currently permitted reserves and output within the<br />
district. Several quarry operators have suggested areas of land which they would wish to<br />
extend their operations into in order to extend the operational life of their sites. These and<br />
other sites will be considered for inclusion in the Allocations Development Plan Document at<br />
a later stage of the LDF process.<br />
There are 10 dormant minerals permissions within the district, equally split between fireclay<br />
and sandstone extraction sites. Under the Review of Minerals Permissions legislation these<br />
sites can be re-activated through an application to the Planning Authority for the<br />
determination of a modern set of planning conditions. The dormant sites are concentrated<br />
around the settlements of Haworth, Denholme and Queensbury.<br />
As a consequence of the historic widespread working of building, roofing and flag stone<br />
within the <strong>Bradford</strong> district, there are known to be a number of disused quarry workings. The<br />
viability of re-opening disused workings would depend upon the circumstances of each site in<br />
terms of the extent and quality of the remaining resource, surrounding highways<br />
infrastructure, neighbouring land uses and ecological, geological or cultural designations. In<br />
order to determine whether any of these sites are likely to be suitable for minerals extraction<br />
within the plan period, further survey work will be necessary.<br />
11.3 Waste Production in <strong>Bradford</strong><br />
In 2007 (the latest data available) the total amount of waste produced (known as waste<br />
arisings) in the District is estimated to have been at least 852,489 tonnes excluding<br />
Construction Demolition and Excavation Waste 113 . This rises to a best estimate of 1,424,003<br />
tonnes when all waste types are included:<br />
113 Data taken from Waste Data Interrogator 2007 produced by the Environment Agency<br />
366
• Agricultural waste: waste arising from a farm or market garden, including organic<br />
matter such as manure, slurry, silage effluent and crop residues, but also packaging<br />
and films, and animal treatment dips;<br />
• Commercial waste: waste arising from wholesalers, catering establishments, shops<br />
and offices (in both the public and private sector). This also includes municipal<br />
waste collected by commercial waste agencies;<br />
• Construction and demolition waste: waste arising from the construction, repair,<br />
maintenance and demolition of buildings and structures. For this waste type it is<br />
important to note that the original figures from the RSS have been used as they are<br />
likely to portray a more accurate reflection of waste arising of this type due to certain<br />
exclusions within the waste data interrogator figures for C&D waste;<br />
• Hazardous waste: defined in European Law as those wastes included within the<br />
European Waste Catalogue because they possess one or more of the hazardous<br />
properties set out in the Hazardous Waste Directive. Waste data figures for<br />
hazardous waste type is taken from the Hazardous Waste Interrogator 2007;<br />
• Industrial waste: waste arising from factories and industrial plants; and<br />
• Municipal waste: includes household waste and other waste collected by waste<br />
collection authorities.<br />
The figures below outline the waste arisings within the District in 2007. They illustrate large<br />
contributions to the total waste arisings across the District from Municipal Solid Waste and<br />
Commercial and Industrial, together accounting for over 56% of total estimated waste<br />
arisings. Construction, Demolition & Excavation waste is also likely to produce large<br />
contributions to total waste arisings although these figures are only estimates from regional<br />
data.<br />
Figure: Summary of Waste Arisings in <strong>Bradford</strong> (2007)<br />
Type of Waste Arising Arisings (tonnes)<br />
Municipal Solid Waste (BMDC only) 261,065<br />
Commercial and Industrial Waste 547,131<br />
Construction, Demolition and Excavation Waste 114 571,514<br />
Hazardous Waste 21,821<br />
Agricultural Waste 115 22,472<br />
TOTAL 1,424,003<br />
Source: Waste and Hazardous Waste Data Interrogator, 2007, Environment Agency<br />
114 NB: Robust data is not available at the time of writing specific to <strong>Bradford</strong>. In order to generate a figure for Construction,<br />
Demolition and Excavation Waste arisings for <strong>Bradford</strong> the Yorkshire and Humber total has been divided by 21 (the number of<br />
UA / District areas within the region) as an average. It is noted that in the context of <strong>Bradford</strong> relative to the other administrative<br />
areas across the region that this figure is likely to be a low estimate.<br />
115 NB: Data on Agricultural Waste arisings across <strong>Bradford</strong> is believed to be a low estimate based on some data being<br />
excluded or counted as commercial and industrial waste due to licensing of premises additionally the Environment Agency does<br />
not count most of this type of waste. Agricultural waste arisings excludes manure or straw. Manure and slurry when spread at<br />
the place of production, for the benefit of agriculture, is not considered waste.<br />
367
Figure: Breakdown of Waste Arisings in <strong>Bradford</strong> (2007)<br />
40%<br />
2% 2%<br />
18%<br />
Municipal Solid Waste<br />
Commercial and Industrial Waste<br />
Construction, Demolition and Excavation Waste<br />
Hazardous Waste<br />
Agricultural Waste<br />
Source: Waste and Hazardous Waste Data Interrogator set, 2007, Environment Agency<br />
11.4 Municipal Waste<br />
<strong>Bradford</strong> MDC covers an area of 141 square miles (36,536 hectares), and contains some<br />
200,000 domestic properties. The vast majority of municipal waste is delivered directly to the<br />
2 transfer stations (in <strong>Bradford</strong> to the south of the District, and Keighley to the north). The<br />
waste is bulk loaded and transported by road to landfill sites in Wakefield and Skipton<br />
(outside the district). The volume of waste produced is currently growing at approximately 2-<br />
3% per annum.<br />
The types of municipal waste produced in <strong>Bradford</strong> (for 2005/06) are identified in the table<br />
below. The information was derived from the Waste Treatment Project Outline Business<br />
Case January 2008.<br />
38%<br />
368
Table: Wastes produced in 2005/06 116<br />
Source: Environ (2008)<br />
11.5 Waste Collection, Treatment and Disposal Services<br />
The Council operates 4 very different and discrete waste collection services. Operating from<br />
two bases, Harris Street at <strong>Bradford</strong> and Stockbridge at Keighley, 185 operational staff,<br />
utilising 60 frontline vehicles, collect approximately 210,000 tonnes of waste per annum.<br />
Table: Waste Collection Services<br />
Domestic Refuse Collection<br />
The domestic collection service is delivered with 31 operational rounds, of these 28 service<br />
the urban areas utilising 26 tonne vehicles with a driver and 2 loaders. The rural areas<br />
represent 60% of the district are serviced with 3 rounds operating on 11 tonne vehicles with<br />
a driver and loader. The Authority began the introduction of wheeled bins in 1998 and<br />
completed the process in December 2000. The weekly service collects 162,000 tonnes<br />
annually of domestic waste from 200,000 households.<br />
116 Source: <strong>Bradford</strong> Waste DPD Sustainability Appraisal Scoping Report Revision (Environ, 2008)<br />
369
Recycling<br />
The division collects paper and glass via separate 240 litre wheeled bins from 120,000<br />
households across the District. The monthly service uses 26 tonnes compaction vehicles to<br />
collect over 10,000 tonnes of recyclates per annum.<br />
Bulky Household Collection<br />
Three dedicated bulk collection crews of a driver and one operative collect 3,000 tonnes of<br />
bulky waste from around of 30,000 requests per annum.<br />
Trade Waste Service<br />
The trade portfolio has 5,500 customers and a turnover of £3.7m. There are 22 operational<br />
staff operating 10 frontline vehicles. The service collects 43,000 tonnes of trade waste from<br />
a variety of commercial and industrial premises.<br />
To handle all the waste collected by the above, the Council operates a number of facilities<br />
and functions. Within the District there are a number of waste management facilities,<br />
including:<br />
• Landfill sites;<br />
• Civic amenity / household waste recycling centres;<br />
• Waste transfer sites;<br />
• Metal recycling sites;<br />
• Storage sites; and<br />
• Treatment sites.<br />
In total there were 61 such facilities across the District in 2007. These are broken down by<br />
site category in the table below.<br />
Table: Number of Operational Waste Management Facilities in <strong>Bradford</strong> (2007)<br />
Type of Waste Management Facility Number of Facilities<br />
Landfill 2<br />
MRS 21<br />
Treatment 4<br />
Transfer 34<br />
TOTAL 61 facilities<br />
Source: Waste Date Interrogator, 2007, Environment Agency<br />
TableX provides an outline capacity for each of the facility types across the District in tonnes.<br />
This data is taken from the previous RATS Data set (2005), prepared by the Environment<br />
Agency, which represents the best available data currently in record and will be subject to<br />
further update and analysis during the net review of the baseline analysis report.<br />
Table : Capacity of Operational Waste Management Facilities in <strong>Bradford</strong> (2005)<br />
Capacity of Facilities<br />
Type of Waste Management Facility<br />
(tonnes)<br />
Landfill<br />
Inert 944,260<br />
Non Hazardous 1,089,356<br />
370
Restricted 165,000<br />
Transfer<br />
Civic Amenity/Household Waste Recycling Sites 81,997<br />
Waste Transfer 1,005,678<br />
Metal Recycling Sites<br />
Car Breaker 102,149<br />
Metal Recycling 1,161,800<br />
Storage<br />
In-House Storage 2,500<br />
Pet Crematorium 75<br />
Treatment<br />
Chemical Treatment 250<br />
Physical-Chemical Treatment 80,914<br />
TOTAL (including Waste Transfer) 4,633,979<br />
TOTAL (excluding Waste Transfer) 1,347,688<br />
Source: RATS Data set, 2005, Environment Agency<br />
To deal with MSW specifically the following treatment and disposal services are currently<br />
being used in the district.<br />
Table: Municipal Waste Treatment and Disposal Services in the District<br />
Transfer Stations<br />
There are 2 transfer stations:<br />
• Royd Way, Keighley - handles approximately 70,000 t/pa<br />
• Bowling Back Lane, <strong>Bradford</strong> - handles approximately 180,000 t/pa These sites are<br />
purpose built facilities, providing weighing in and out of all loads, and categorising waste<br />
into type, source and destination. The sites utilise large items of plant and 44 tonne road<br />
going haulage and are open 362 days per year.<br />
Currently <strong>Bradford</strong> transfer station hauls to Welbeck landfill near Wakefield, operated by<br />
WRG (contracted minimum of 160,000 t/pa): Keighley transfer station hauls to Skibedon<br />
Landfill near Skipton, operated by Yorwaste (contracted minimum of 60,000 t/pa). Landfill<br />
contracts end in 2010 but it is likely that BMDC will need to procure further landfill contracts<br />
to 2015. There are no suitable landfills in the <strong>Bradford</strong> area.<br />
The transfer sites also receive waste directly from traders and commercial waste collections<br />
for which a charge is levied. They also offer a public weighbridge facility for which a charge is<br />
levied. A household waste recycling centre is also provided at each transfer station.<br />
Materials Reclamation Facility (MRF)<br />
A small MRF is located at Bowling Back Lane and processes waste for recycling. Dry<br />
recyclables are received from Household Waste Recycling Centres, bring sites and wheeled<br />
bin recycling schemes. The facility incorporates a sorting and picking station, magnetic<br />
separations, and metal, aluminium, card, paper, textile and plastic baling equipment. Once<br />
371
ecycling waste is received, the waste is cleaned up and sorted into various types and<br />
grades and put into a suitable form for onward transportation to specialist recycling<br />
merchants. Any reject or non suitable materials are deposited as a waste into the adjoining<br />
transfer station.<br />
Household Waste Recycling Centres<br />
There are 7 sites located throughout the District, (formerly known as Civic Amenity Sites).<br />
The sites are open for the public to use to dispose of bulky or excess waste and to deposit<br />
materials for recycling (these sites are not available for traders to use).<br />
These sites are open 7 days per week, 362 days per year, and are serviced by a fleet of 4 x<br />
32 tonne container handling vehicles. The quality of the site infrastructures varies from well<br />
planned sites such as Sugden End, to ones with little space or facilities (e.g. Golden Butts,<br />
Ilkley). Significant infrastructure improvements have taken place recently, with further action<br />
planned for 2006.<br />
Chemical Advisory Service (CAS)<br />
A chemical advisory service is offered to inspect, investigate, consign, transport and correctly<br />
dispose of small quantities or unwanted chemicals.<br />
• Lab chemicals e.g., from schools, colleges etc.<br />
• Pharmaceuticals.<br />
• Herbicides.<br />
• Poisons.<br />
• Chemical reagents.<br />
• Unidentified powders and liquids.<br />
The service is offered at no charge to <strong>Bradford</strong> householders. An inspection, collection and<br />
disposal charge is made to outside companies and organisations.<br />
Contract Management<br />
Disposal contracts for deposit of waste to landfill are managed including:<br />
- two major contracts for landfill (described below);<br />
- the disposal of difficult or special wastes to landfill e.g., tyres, asbestos;<br />
- incineration of various chemicals from CAS or analysis of chemicals;<br />
- incineration of clinical wastes;<br />
- recycling contracts for various types of products with recycling/reclamation<br />
- merchants;<br />
- composting of green wastes;<br />
- other minor contracts associated with operations.<br />
Landfill Aftercare<br />
The service is also responsible for looking after the legacy of previous landfilling of municipal<br />
wastes within the District, including site restoration and maintenance, and environmental<br />
control measures for areas such as landfill gas and leachates. This aftercare will continue<br />
for many years into the future and includes environmental monitoring, which involves the<br />
372
collection of field data via monitoring equipment, its subsequent collation and interpretation,<br />
culminating in a quarterly report to the Environment Agency. This service is also provided to<br />
some outside agencies for which a fee is levied.<br />
Currently a landfill gas flaring system is operating at the Sugden End landfill, along with<br />
leachate pumping. Progressive capping and restoration continues at this site, other sites are<br />
now restored but still require monitoring and land management.<br />
Maps showing all the Transfer and Landfill Facilities Location are attached in appendix 3.<br />
Management of non-municipal waste sources is listed below-<br />
Commercial and Industrial<br />
There are approximately 10 sites in the District managing general commercial and industrial<br />
(C & I) waste. 8 of the sites are located to the south of the district, in or around the City<br />
Centre area (particularly the Bowling area), with 2 sites to the north of the District (in the<br />
Keighley/Eldwick area). Most of the 10 sites are waste transfer stations, which sort the<br />
waste, recycle what is possible and dispose of that material which cannot be recycled to<br />
landfill<br />
There are 4 specialist sites which specialise in managing animal wastes, 2 of the specialist<br />
sites are located in the city centre area and 2 to the east of the district in the<br />
Thorton/Harecroft area. These sites undertake processes such as rendering and incineration.<br />
Construction and Demolition Waste<br />
Currently there are approximately 8 sites managing construction and demolition (C&D)<br />
waste. 7 of the sites are located to the south of the district (near or within the city centre) and<br />
1 site is to the north (in the Keighley area). Most of the sites are waste transfer stations<br />
which recycle the material to produce a secondary aggregate and divert the unrecyclable C &<br />
D to landfill. 3 of the sites also manage the C & I waste detailed above.<br />
Hazardous Waste<br />
There is currently one major facility managing hazardous waste which is situated in the south<br />
of the district (in the Bowling Back Lane area).<br />
Agricultural Waste<br />
There is no facility managing this type of waste in the <strong>Bradford</strong> District. The farmers<br />
currently manage this waste individually on their agricultural holding.<br />
373
11.6 Waste Composition<br />
In 2002 MEL Research (MEL) was commissioned to undertake an analysis of kerbside<br />
collected domestic wastes in <strong>Bradford</strong>. MEL found that the average Asian household size<br />
was 4.58 people, while average for non-Asian was 2.40 people, and also the Asian<br />
households had a younger age profile.<br />
In terms of overall weight of waste put out for disposal, Asian households produced 18.36kg /<br />
week, while non-Asian households 14.52kg / week. When household size is taken into<br />
account, residual weight per capita for Asian household was 4.01kg / week, as against<br />
6.05kg / week for non-Asian households.<br />
Observation as to difference in waste composition showed there to be more kitchen waste<br />
and disposable nappies in Asian households, and conversely more glass in non-Asian<br />
households.<br />
The survey found surprisingly similar levels of awareness of recycling facilities at household<br />
waste sites and drop-off recycling sites, but interestingly Asian households tended to donate<br />
higher levels of clothing and textiles to charitable/fund raising collections. Despite higher<br />
levels of kitchen waste, Asian households tended not to compost their waste, even where<br />
they had a garden.<br />
The survey showed 37% of Asians and 48% of non-Asian households putting garden waste<br />
directly into the residual waste stream. The report found that enthusiasm for recycling is<br />
probably determined more by levels of deprivation than by ethnicity.<br />
The overall waste composition for waste collected at the kerbside for <strong>Bradford</strong> is detailed in<br />
the table below.<br />
Table : Summary MEL Kerbside Waste Composition <strong>Analysis</strong> (<strong>Bradford</strong>)<br />
Waste Stream Kg per household/week<br />
Putrescibles 57.0 38.6<br />
Paper and card 33.9 23.5<br />
Misc. combustible 10.6 7.4<br />
Glass 9.8 6.9<br />
Dense plastic 9.3 6.5<br />
Plastic film 7.2 5.0<br />
Textiles 5.0 3.5<br />
Ferrous metal 4.6 3.2<br />
Misc. non-combustible 2.8 2.0<br />
Non-ferrous metal 2.3 1.6<br />
WEEE 0.7 1.5<br />
Fines 0.4 0.3<br />
TOTAL 143.6 100<br />
% by weight<br />
374
Household Waste Recycling Centres<br />
Some 51,000 tonnes of waste (23% of the District’s domestic waste) arises from <strong>Bradford</strong>’s 7<br />
Household Waste Recycling Centres (HWRC). MEL undertook a survey of HWRC waste use<br />
and waste types in July 2002.<br />
Survey data, plus data held by the department indicates that:<br />
• 50% of all HWRC inputs by weight arises on weekends.<br />
• around 60% of all inputs are delivered in summer months (April to September).<br />
• the heaviest fractions from the sample representing 75% of total weight are:<br />
- electrical and electronic equipment 15.6%<br />
- green waste 14.8%<br />
- mixed household (bin waste) 14.3%<br />
- hardcore/rubble 11.3%<br />
- textiles 10.3%<br />
- wood 9.1%<br />
The biodegradable content of the HWRC waste surveyed is reproduced in the table below.<br />
Table: Biodegradable material, HWRC July 2002<br />
Primary Category Sub Category<br />
Friday<br />
%<br />
Saturday<br />
%<br />
Recyclable paper 1.4 0.9<br />
Paper and card<br />
Recyclable card<br />
Cardboard<br />
0.0<br />
4.5<br />
0.0<br />
2.7<br />
Non-recyclable paper 2.8 0.9<br />
Textiles<br />
Man made and natural<br />
fibres<br />
4.1 6.6<br />
Shoes 0.1 0.0<br />
Misc. combustible Wood 8.9 9.2<br />
Other combustible 1.4 0.3<br />
Misc. non-<br />
Soil 0.0 0.0<br />
combustible Other non-combustible 0.8 0.1<br />
Putrescible<br />
Soft compostable<br />
garden waste<br />
9.1 22.6<br />
Other putrescibles 1.6 0.0<br />
Fines Particles >10mm 0.4 0.0<br />
Mixed Household<br />
Normally material for<br />
the wheeled bin<br />
7.8 10.6<br />
TOTAL 42.9 53.9<br />
375
11.7 Recycling and Composting in <strong>Bradford</strong><br />
<strong>Bradford</strong> MDC achieved a recycling / composting rate for domestic waste of 23.8% for<br />
2007/8 against a local service agreement target of 24%. Recently published research<br />
suggests 30% is the maximum recycling level likely to be achieve in large metropolitan areas<br />
such as <strong>Bradford</strong>.<br />
Approximately 55% of waste in 2004/05 was sourced from refuse collection, approximately<br />
17.5% of waste was collected from household waste and recycling centres and a further 7%<br />
was collected in trade waste containers including commercial and industrial waste handled<br />
by the Council.<br />
The Government has set (and will continue to revise and review) performance standards<br />
relating to such areas as recycling and composting, along with specific guidance as to how<br />
definitions these indicators are to be calculated e.g., what materials count and how<br />
measured. The current statutory recycling target (2005/06) BV82 (a) + (b) for <strong>Bradford</strong> is<br />
24%. Clearly the achievement of BVPI targets will be a very important feature of any long<br />
term strategy for <strong>Bradford</strong>’s waste.<br />
Table: Recycling and composing trend data based on BVPIs<br />
Source: <strong>Bradford</strong> Waste DPD Sustainability Appraisal Scoping Report Revision (Environ, 2008)<br />
To achieve the 16.7% recycling target in 2004/5, the Council employed a number of<br />
initiatives:<br />
• a diversion rate of nearly 50% is achieved at HWRC;<br />
• a kerbside recycling scheme based on paper is provided to 60% of all<br />
• domestic properties on an opt out basis;<br />
• a kerbside recycling scheme based on glass/cans is provided to 10% of all<br />
• domestic properties on an opt in basis;<br />
• drop off banks are provided across the District; and<br />
• green waste kerbside collection.<br />
376
11.8 The Future Waste Position in <strong>Bradford</strong> to 2021<br />
<strong>Bradford</strong> is subject to a number of waste targets derived from the national, regional and local<br />
levels.<br />
At the national level, the following targets apply:<br />
• Landfill: By 2010 reduce the amount of biodegradable municipal waste sent to<br />
landfill to 75% of the total generated in 1995; 50% by 2013 an 35% by 2020 (Landfill<br />
Directive).<br />
• Recycling and composting of household waste: At least 40% by 2010; 45% by 2015<br />
and 50% by 2020 (Waste <strong>Strategy</strong> 2007).<br />
• Recovery of municipal waste: 53% by 2010; 67% by 2015 and 75% by 2020 (Waste<br />
<strong>Strategy</strong> 2007).<br />
• Commercial and industrial waste: Reduce amount going to landfill by 20% in 2010<br />
compared to 2004 (Waste <strong>Strategy</strong> 2007).<br />
At the regional level the following targets apply:<br />
• Waste production: Reduce the annual increase in waste growth to 2% (from 3%) by<br />
2008/09 (Yorkshire and Humber Regional Waste <strong>Strategy</strong>).<br />
• 100% of waste developments should be in compliance with the Regional Plan’s<br />
locational criteria in Policy ENV14. 100% of local authorities have allocated sufficient<br />
sites in line with Policy ENV14.<br />
Local targets are shown in the BVPI table above.<br />
Predictions have been made at Regional level through the RSS on the likely waste to be<br />
managed up to 2021. Predictions have also been made on the landfill capacity, treatment<br />
and recycling required for municipal waste and commercial and Industrial waste (in order to<br />
meet targets) and these are illustrated below.<br />
Table : Municipal solid waste forecasts for <strong>Bradford</strong><br />
377
Table : Commercial and industrial waste forecasts for <strong>Bradford</strong><br />
Source: Regional Spatial <strong>Strategy</strong> (2008)<br />
Recycling and composting trend data based on BVPIs indicate that by 2008/2009, the target<br />
rate should be 26% of all wastes are recycled or composted. Performance targets and<br />
predictions for household waste for 2020 estimate 33% of waste will be recycled or<br />
composted.<br />
<strong>Bradford</strong>’s Municipal Waste Management <strong>Strategy</strong> outlines the current management of the<br />
waste stream and details the challenging targets set by Government through policy and other<br />
legislative drivers such as the Landfill Allowance Trading Scheme. The <strong>Strategy</strong> analyses<br />
how these drivers seek to divert municipal waste from landfill, increase recycling and move<br />
the management of waste up the waste hierarchy. The strategy acknowledges the need for a<br />
step change to the management of municipal waste, up the waste hierarchy and away from<br />
landfilling.<br />
11.9 Key Facts<br />
• The predominant mineral extracted within the <strong>Bradford</strong> District is sandstone.<br />
Crushed sandstone aggregate production also takes place but no large scale<br />
primary aggregate quarries operate in the District. Although resources exist, there<br />
are no active fireclay, coal or sand and gravel extraction sites located within the<br />
District.<br />
• A large proportion of building stone and flag produced in <strong>Bradford</strong> is exported to<br />
other regions, London and oversees markets. York Stone is a widely marketable<br />
product and sales are not limited to specific areas. This product however is now<br />
facing increasing challenges from cheaper sandstones imported from overseas.<br />
• The exploitation of certain sandstone resource areas, such as resources to the north<br />
of the district, and the production of certain types of natural stone materials, such as<br />
riven flags and stone slate roofing has declined substantially.<br />
• Many of the active building stone quarries are thought to be approaching the<br />
exhaustion of their permitted reserves and several have closed within recent years.<br />
However further survey work is to be undertaken to gather data on currently<br />
permitted reserves and output within the district.<br />
378
• Exporting waste arisings to landfill outside of the District remains the primary waste<br />
management method utilised by BMDC for Municipal Solid Waste, a situation which<br />
needs to be reversed. The main destinations of exported municipal solid waste at<br />
the current time is Wakefield and Skipton.<br />
• There has been a continued improvement in the amount of municipal waste that is<br />
being recycled across <strong>Bradford</strong> District in recent years. However this amount<br />
constitutes a small fraction of the waste arisings and is below the council’s current<br />
local service agreement target for recycling.<br />
• There are currently eight Household Waste Recycling Centres (HWRC) across<br />
<strong>Bradford</strong> District, which handle just under a quarter of municipal waste arising.<br />
Better accessibility to these centres is still an issue in encouraging more local<br />
participation and this is being considered through a review of the current waste<br />
infrastructure.<br />
• Given the current trend within <strong>Bradford</strong> to export the majority of waste arisings<br />
outside of the District, coupled with new challenges for recycling, composting, and<br />
recovery of energy from waste there is currently a need for new waste infrastructure<br />
within <strong>Bradford</strong>.<br />
• There is a shortage of waste management facilities in the District at the current time.<br />
Both extant planning permissions for new waste facilities, future applications, and<br />
the PFI programme will result in improvements to this waste management<br />
infrastructure across the District.<br />
379
380
381
382
383
12. SUSTAINABILITY<br />
The LDF <strong>Core</strong> <strong>Strategy</strong> must undergo Sustainability Appraisal, as described under Section<br />
19(5) of the Planning and Compulsory Purchase Act 2004, in recognition of its role within<br />
Local Development Frameworks. This ensures that any significant environmental, social and<br />
economic effects have been considered during the preparation of planning policy documents<br />
consistent with European Directive 2001/42/EC relating to Strategic Environmental<br />
Assessments (SEA).<br />
This report has presented all the policy context and baseline information that will inform the<br />
Sustainability Appraisal relevant to the <strong>Core</strong> <strong>Strategy</strong>. At this stage, it is appropriate to outline<br />
the broad sustainability objectives that the forthcoming options for the <strong>Core</strong> <strong>Strategy</strong> will seek<br />
to achieve. This will also help draft a list of decision making criteria that could act as<br />
sustainability indicators for the <strong>Core</strong> <strong>Strategy</strong> and would be refined and agreed upon at the<br />
next stage of the plan making process.<br />
384
385
The sustainability objectives have been identified from the review of national, regional and<br />
local policies, aspirations and targets, and have been adapted to reflect the character and<br />
needs of the <strong>Bradford</strong> District as a whole.<br />
The objectives will be further revised and refined at later stages of the sustainability appraisal<br />
process through consultations of the various options designed to meet the plan objectives.<br />
Each option will meet the range of objectives in different ways. Some of the objectives may<br />
conflict, and so each option will meet each objective to a differing extent. This provides an<br />
opportunity to test and measure each option against each objective, providing an outline<br />
Sustainability Appraisal of the options. The outline appraisal report will suggest mitigation<br />
and monitoring methodologies and identify the preferred option. This will be carried out and<br />
reported upon as part of the community consultation process. Therefore the Sustainability<br />
Appraisal will be integrated into the process. The final report on the <strong>Core</strong> <strong>Strategy</strong> will be<br />
integrated with the Sustainability Appraisal of the entire LDF.<br />
386
13. CONCLUSIONS<br />
The key issues identified within this report will be addressed through the approach being<br />
undertaken to prepare the <strong>Core</strong> <strong>Strategy</strong> for <strong>Bradford</strong> District. This combines a collaborative<br />
consultation process and evaluation to prepare the emerging development options. The<br />
baseline analysis and the evaluation of key will help determine development priorities for the<br />
district and influence spatial distribution of the planned growth proposed by the <strong>Core</strong><br />
<strong>Strategy</strong>.<br />
As part of the ongoing consultation which is being undertaken, this report will be made<br />
publicly available for comment and review. Any additional information, factual corrections or<br />
further thoughts will be welcomed by the <strong>Bradford</strong> <strong>Metropolitan</strong> District Council. Any<br />
comments should be forwarded to:<br />
Local Development Framework Group<br />
FREEPOST NEA 11445<br />
PO BOX 1068<br />
BRADFORD<br />
BD1 1BR<br />
Or by hand at any planning office at <strong>Bradford</strong>, Keighley or Ilkley.<br />
Or by Fax to: 01274 433767<br />
At the present time, this report has been deliberately left in ‘Draft’ and will be supplemented<br />
with additional information during the course of the preparation of the <strong>Core</strong> <strong>Strategy</strong><br />
submission report. This report and its findings will be the subject of further extensive public<br />
consultation and engagement.<br />
Further details on the practical arrangements for the preparation of <strong>Core</strong> <strong>Strategy</strong> are<br />
provided in ‘Creating Local Development Frameworks - A Companion guide to PPS12’<br />
published by the Department of Communities and Local Government and can be viewed at:<br />
http://www.communities.gov.uk/archived/publications/planningandbuilding/pps12companiong<br />
uide<br />
387
Produced by the<br />
City of <strong>Bradford</strong> <strong>Metropolitan</strong> District<br />
Council<br />
Local Development<br />
Framework Group