
Create successful ePaper yourself
Turn your PDF publications into a flip-book with our unique Google optimized e-Paper software.
Lesson 12<br />
Main Idea<br />
Find and interpret<br />
the mean absolute<br />
deviation for a set<br />
of data.<br />
New Vocabulary<br />
mean absolute<br />
deviation<br />
Math Online<br />
glencoe.com<br />
6.SP.5c<br />
<strong>Mean</strong> <strong>Absolute</strong> <strong>Deviation</strong><br />
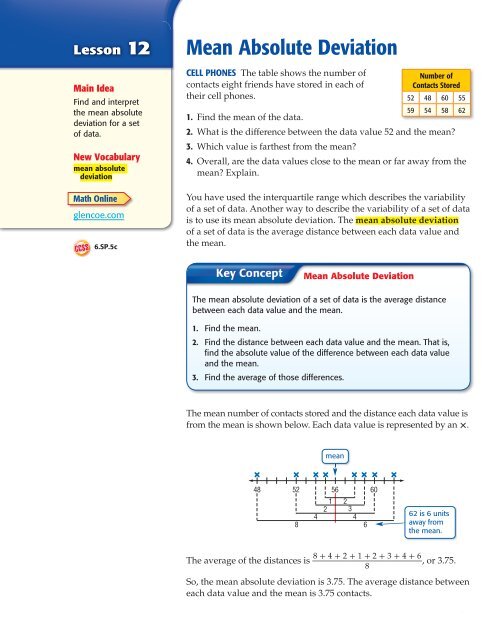
CELL PHONES The table shows the number of<br />
contacts eight friends have stored in each of<br />
Number of<br />
Contacts Stored<br />
their cell phones.<br />
52 48 60 55<br />
1. Find the mean of the data.<br />
59 54 58 62<br />
2. What is the difference between the data value 52 and the mean?<br />
3. Which value is farthest from the mean?<br />
4. Overall, are the data values close to the mean or far away from the<br />
mean? Explain.<br />
You have used the interquartile range which describes the variability<br />
of a set of data. Another way to describe the variability of a set of data<br />
is to use its mean absolute deviation. The mean absolute deviation<br />
of a set of data is the average distance between each data value and<br />
the mean.<br />
The mean number of contacts stored and the distance each data value is<br />
from the mean is shown below. Each data value is represented by an ×.<br />
× × × × × × × ×<br />
48 52 56<br />
<strong>Mean</strong> <strong>Absolute</strong> <strong>Deviation</strong><br />
The mean absolute deviation of a set of data is the average distance<br />
between each data value and the mean.<br />
1. Find the mean.<br />
2. Find the distance between each data value and the mean. That is,<br />
find the absolute value of the difference between each data value<br />
and the mean.<br />
3. Find the average of those differences.<br />
mean<br />
1<br />
2<br />
2<br />
3<br />
4<br />
4<br />
8 6<br />
8 + 4 + 2 + 1 + 2 + 3 + 4 + 6<br />
The average of the distances is ___ , or 3.75.<br />
8<br />
So, the mean absolute deviation is 3.75. The average distance between<br />
each data value and the mean is 3.75 contacts.<br />
60<br />
62 is 6 units<br />
away from<br />
the mean.<br />
Lesson 12 <strong>Mean</strong> <strong>Absolute</strong> <strong>Deviation</strong> 51
ROLLER COASTERS The table shows the<br />
maximum speeds of eight roller coasters<br />
at an amusement park. Find the mean<br />
absolute deviation of the set of data.<br />
Describe what the mean absolute<br />
deviation represents.<br />
Step 1 Find the mean.<br />
Find <strong>Mean</strong> <strong>Absolute</strong><br />
<strong>Deviation</strong><br />
____<br />
58 + 88 + 40 + 60 + 72 + 66 + 80 + 48<br />
= 64<br />
8<br />
The mean is 64 miles per hour.<br />
Step 2 Find the absolute value of the differences between each<br />
value in the data set and the mean.<br />
mean<br />
× × × × × × × ×<br />
40 50 60 70 80 90<br />
4 2<br />
6 8<br />
16<br />
16<br />
24 24<br />
Step 3 Find the average of the absolute values of the differences<br />
between each value in the data set and the mean.<br />
___<br />
24 + 16 + 6 + 4 + 2 + 8 + 16 + 24<br />
= 12.5<br />
8<br />
The mean absolute deviation is 12.5. This means that the average<br />
distance each data value is from the mean is 12.5 miles per hour.<br />
a. BIRDS The table shows the maximum<br />
flying speeds of the ten fastest birds<br />
worldwide. Find the mean absolute<br />
deviation of the set of data. Round to<br />
the nearest hundredth. Describe what<br />
the mean absolute deviation represents.<br />
Maximum Speeds<br />
of Roller Coasters (mph)<br />
58 88 40 60<br />
72 66 80 48<br />
Speeds of Top Ten<br />
Fastest Birds (mph)<br />
88 77 65 70 65<br />
72 95 80 106 68<br />
You can compare the mean absolute deviations for two data sets.<br />
A data set with a smaller mean absolute deviation has data values<br />
that are closer to the mean than a data set with a greater mean<br />
absolute deviation.
<strong>Mean</strong> <strong>Absolute</strong> <strong>Deviation</strong><br />
<strong>Mean</strong> <strong>Absolute</strong> <strong>Deviation</strong><br />
The absolute values of the<br />
differences between each<br />
data value and the mean<br />
for the top five salaries<br />
are calculated below.<br />
⎪33.00 - 23.40⎥ = 9.60<br />
⎪24.29 - 23.40⎥ = 0.89<br />
⎪22.60 - 23.40⎥ = 0.80<br />
⎪20.63 - 23.40⎥ = 2.77<br />
⎪16.50 - 23.40⎥ = 6.90<br />
Compare Variation<br />
BASEBALL The top five salaries and the bottom five salaries<br />
for the 2010 New York Yankees are shown in the table below.<br />
Salaries are in millions of dollars and are rounded to the nearest<br />
hundredth.<br />
2010 New York Yankees Salaries (millions of $)<br />
Top Five Salaries Bottom Five Salaries<br />
33.00 24.29 22.60 20.63 16.50 0.45 0.44 0.43 0.41 0.41<br />
a. Find the mean absolute deviation for each set of data. Round<br />
to the nearest hundredth.<br />
Top Five Salaries<br />
Find the mean.<br />
___<br />
33.00 + 24.29 + 22.60 + 20.63 + 16.50<br />
≈ 23.40<br />
5<br />
The mean is about $23.40 million.<br />
Find the mean absolute deviation by finding the absolute<br />
values of the differences between each data value and the<br />
mean. Then average the differences.<br />
___<br />
9.60 + 0.89 + 0.80 + 2.77 + 6.90<br />
≈ 4.19<br />
5<br />
The mean absolute deviation is about $4.19 million.<br />
Bottom Five Salaries<br />
Find the mean.<br />
___<br />
0.45 + 0.44 + 0.43 + 0.41 + 0.41<br />
≈ 0.43<br />
5<br />
The mean is about $0.43 million.<br />
Find the mean absolute deviation by finding the absolute<br />
values of the differences between each data value and the<br />
mean. Then average the differences.<br />
___<br />
0.02 + 0.01 + 0 + 0.02 + 0.02<br />
≈ 0.01<br />
5<br />
The mean absolute deviation is about $0.01 million.<br />
b. Write a few sentences comparing their variation.<br />
The mean absolute deviation for the bottom five salaries is<br />
much less than that for the top five salaries. The data for the<br />
bottom five salaries are closer together than the data for the<br />
top five salaries.
Example 1<br />
b. MOVIES The table shows the running time in minutes for two<br />
kinds of movies. Find the mean absolute deviation for each set<br />
of data. Round to the nearest hundredth. Then write a few<br />
sentences comparing their variation.<br />
Running Time for Movies (min)<br />
Comedy Drama<br />
90 95 88 100 98 115 120 150 135 144<br />
Find the mean absolute deviation for each set of data. Round to the nearest<br />
hundredth if necessary. Then describe what the mean absolute deviation<br />
represents.<br />
1. Number of Daily Visitors<br />
2. Zoo Admission Prices ($)<br />
to a Web Site<br />
9.50 9.00 8.25<br />
112 145 108 160 122<br />
9.25 8.00 8.50<br />
Example 2 3. WATER PARKS The table shows the height of waterslides at two different<br />
water parks. Find the mean absolute deviation for each set of data.<br />
Round to the nearest hundredth. Then write a few sentences comparing<br />
their variation.<br />
Example 1<br />
Height of Waterslides (ft)<br />
Splash Lagoon Wild Water Bay<br />
75 95 80 110 88 120 108 94 135 126<br />
Find the mean absolute deviation for each set of data. Round to the<br />
nearest hundredth if necessary. Then describe what the mean absolute<br />
deviation represents.<br />
4. Known Moons of Planets<br />
5. Hard Drive (gigabytes)<br />
0 0 1 2<br />
640 250 500 640<br />
63 34 27 13<br />
720 640 250 720<br />
6. Digital Camera Prices ($)<br />
140 125 190 148 156<br />
212 178 188 196 224<br />
7. Grand Slam<br />
Singles Titles Won<br />
14 8 7 6 5<br />
10 11 8 8 6
Example 2<br />
Real-World R<br />
Link<br />
New York City is<br />
the largest city in<br />
the U.S., with<br />
a population of<br />
about 8.4 million<br />
within the city<br />
limits. If the<br />
surrounding<br />
metropolitan<br />
areas are<br />
included, it<br />
is closer to<br />
20 million.<br />
B<br />
8. FUNDRAISING The table shows the amount of money raised by the<br />
homerooms for two grade levels at a middle school. Find the mean<br />
absolute deviation for each set of data. Round to the nearest hundredth.<br />
Then write a few sentences comparing their variation.<br />
Money Raised ($)<br />
Sixth Grade Seventh Grade<br />
88 116 94 108 112 124 144 91 97 122 128 132<br />
9. BRIDGES The table shows the lengths of the longest bridges in the United<br />
States and in Europe. Find the mean absolute deviation for each set of<br />
data. Round to the nearest hundredth if necessary. Then write a few<br />
sentences comparing their variation.<br />
Longest Bridges (kilometers)<br />
United States Europe<br />
38.4 36.7 29.3 24.1 17.7 17.2 11.7 7.8 6.8 6.6<br />
12.9 11.3 10.9 8.9 8.9 6.1 5.1 5.0 4.3 3.9<br />
10. BASKETBALL The table shows the number of points scored each game for<br />
two different basketball teams. Find the mean absolute deviation for each<br />
set of data. Round to the nearest hundredth if necessary. Then write a<br />
few sentences comparing their variation.<br />
Number of Points Scored<br />
Lakeside Panthers Jefferson Eagles<br />
44 38 54 48 26 36 58 42 64 62 70 40<br />
POPULATION For Exercises 11–14, refer to the table<br />
that shows the recent population, in millions, of the<br />
ten largest U.S. cities.<br />
11. Find the mean absolute deviation. Round to the<br />
nearest hundredth.<br />
Population of Largest<br />
U.S. Cities (millions)<br />
1.5 3.8 1.3 1.6 2.9<br />
1.4 0.9 2.3 8.4 1.3<br />
12. How many data values are closer than one mean absolute deviation<br />
away from the mean?<br />
13. Which population is farthest from the mean? How far away from the<br />
mean is that population? Round to the nearest hundredth.<br />
14. Are there any populations that are more than twice the mean absolute<br />
deviation from the mean? Explain.<br />
VOCABULARY For Exercises 15 and 16, look up the word deviate in a<br />
dictionary or online.<br />
15. What does the word deviate mean? How can it help you remember what<br />
the mean absolute deviation refers to?<br />
16. How does the word absolute help you to remember how to calculate the<br />
mean absolute deviation?<br />
Lesson 12 <strong>Mean</strong> <strong>Absolute</strong> <strong>Deviation</strong> 55
C<br />
Test T Practice<br />
56 Domain: Statistics and Probability<br />
NUTRITION For Exercises 17 and 18, refer to the table that shows the number<br />
of Calories in several sandwiches at two restaurants.<br />
Number of Calories per Sandwich<br />
Susan’s Sub Shop The Picnic Basket<br />
490 380 270 430 510 410 550 320 470 430 610 290<br />
17. Find the mean absolute deviation for each set of data. Round to the<br />
nearest hundredth.<br />
18. For either data set, are there any data values that are more than twice the<br />
mean absolute deviation from the mean? Explain.<br />
19. OPEN ENDED Create two sets of data, each with five values, that satisfy<br />
the following conditions.<br />
The mean absolute deviation of Set A is less than the mean absolute<br />
deviation of Set B.<br />
The mean of Set A is greater than the mean of Set B.<br />
CHALLENGE For Exercises 20 and 21, refer to the<br />
Recorded Speeds (mph)<br />
table that shows the recorded speeds of several<br />
35 38 41 35 36 55<br />
cars on a busy street.<br />
20. Calculate the mean absolute deviation both with and without the data<br />
value of 55. Round to the nearest hundredth if necessary.<br />
21. Explain how including the value of 55 affects the mean absolute deviation.<br />
22. REASONING Explain why the mean absolute deviation is calculated using<br />
absolute value.<br />
23. WRITE MATH Write a letter to a classmate explaining how to find the mean<br />
absolute deviation and what it tells you about a set of data.<br />
24. The table shows the prices for parking at<br />
various beaches along the same<br />
coastline.<br />
Beach Parking ($)<br />
2.50 3.75 1.25 2.25 3.00<br />
Which of the following is the mean<br />
absolute deviation for the set of data?<br />
A. $0.25<br />
B. $0.66<br />
C. $2.50<br />
D. $2.55<br />
25. Which of the following is true<br />
concerning the mean absolute deviation<br />
of a set of data?<br />
F. It describes the variation of the data<br />
values around the median.<br />
G. It describes the absolute value of the<br />
mean.<br />
H. It describes the average distance<br />
between each data value and the<br />
mean.<br />
I. It describes the variation of the data<br />
values around the mode.