Aircraft Carrier Multipath Modeling for Sea-Based JPALS - AWE ...
Aircraft Carrier Multipath Modeling for Sea-Based JPALS - AWE ...
Aircraft Carrier Multipath Modeling for Sea-Based JPALS - AWE ...

You also want an ePaper? Increase the reach of your titles
YUMPU automatically turns print PDFs into web optimized ePapers that Google loves.
BIOGRAPHY<br />
<strong>Aircraft</strong> <strong>Carrier</strong> <strong>Multipath</strong> <strong>Modeling</strong> <strong>for</strong><br />
<strong>Sea</strong>-<strong>Based</strong> <strong>JPALS</strong><br />
Jan P. Weiss, Steve Anderson, Corey Fenwick, Lin S. Stowe, Penina Axelrad<br />
Colorado Center <strong>for</strong> Astrodynamics Research, University of Colorado, Boulder<br />
<strong>Sea</strong>n M. Calhoun, Richard P. Pennline<br />
ARINC Engineering Services, LLC<br />
Jan P. Weiss is a Ph.D. candidate in the Department of<br />
Aerospace Engineering Sciences at the University of<br />
Colorado, Boulder. His research focuses on ground and<br />
airborne plat<strong>for</strong>m GNSS multipath simulation and<br />
analysis as well as antenna and receiver based techniques<br />
<strong>for</strong> multipath detection/mitigation. He received his B.S.<br />
in Physics from Creighton University and M.S. in<br />
Aerospace Engineering Sciences from the University of<br />
Colorado.<br />
Steve Anderson is a Professional Research Assistant with<br />
the Colorado Center <strong>for</strong> Astrodynamics Research at the<br />
University of Colorado, Boulder. He received his M.S. in<br />
Electrical and Computer Engineering from the University<br />
of Colorado and B.S. in Electrical Engineering from the<br />
University of North Dakota. He has been involved in<br />
GPS research and programs since 1992.<br />
Corey Fenwick is a graduate student at the University of<br />
Colorado, Boulder seeking an M.S. degree in Aerospace<br />
Engineering Sciences. Currently, he is a research<br />
assistant at the Colorado Center <strong>for</strong> Astrodynamics<br />
Research. In 2004, he graduated from the University of<br />
Kansas with a B.S. in Aerospace Engineering.<br />
Lin S. Stowe is a graduate student in the Department of<br />
Aerospace Engineering Sciences at the University of<br />
Colorado, Boulder. Her research interests include GPS<br />
multipath studies and ambiguity resolution <strong>for</strong> carrier<br />
phase based navigation solutions. She completed her<br />
undergraduate studies in Physics and Computer Science at<br />
Rensselaer Polytechnic Institute.<br />
Penina Axelrad is a Professor of Aerospace Engineering<br />
Sciences at the University of Colorado, Boulder. Her<br />
research is focused on GPS technology and data analysis<br />
<strong>for</strong> aerospace applications. She has been involved in<br />
GPS-related research since 1985, previously at Stan<strong>for</strong>d<br />
University and Stan<strong>for</strong>d Telecommunications, Inc.<br />
<strong>Sea</strong>n M. Calhoun is a Senior Engineer with ARINC<br />
Engineering Services, LLC. Mr. Calhoun received his<br />
B.S. in Electrical Engineering, Physics, and Mathematics<br />
from Ohio University.<br />
Richard P. Pennline is a Principal Engineer with ARINC<br />
Engineering Services, LLC. He is currently responsible<br />
<strong>for</strong> the flight test demonstration system in support of<br />
research and development ef<strong>for</strong>ts <strong>for</strong> the Joint Precision<br />
Approach and Landing System (<strong>JPALS</strong>). He has twenty<br />
years experience in research, development, test, and<br />
evaluation of GPS, space, and communication systems.<br />
Mr. Pennline received his B.S. in Electrical Engineering<br />
from Carnegie Mellon University.<br />
ABSTRACT<br />
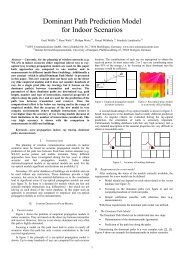
This paper provides an overview of multipath modeling<br />
<strong>for</strong> the <strong>Sea</strong>-<strong>Based</strong> Joint Precision and Landing System<br />
(<strong>JPALS</strong>). The model integrates a detailed structural<br />
model of the aircraft carrier USS Eisenhower, receiving<br />
antenna gain and phase patterns, receiver tracking loop<br />
models, and satellite motions to simulate both code and<br />
carrier phase tracking errors due to multipath. These<br />
ef<strong>for</strong>ts complement analysis of actual shipboard test data<br />
[2] and use one dockside data set <strong>for</strong> model validation.<br />
For this purpose, a top-level yardarm antenna/receiver<br />
system is simulated and the multipath results are<br />
compared to actual test data. Comparisons are given in<br />
the <strong>for</strong>m of code multipath time histories and elevation<br />
dependent error statistics. The statistical comparisons<br />
show that the model accurately captures elevationdependent<br />
elevation error magnitudes and trends.<br />
Simulated carrier phase multipath results show 1-σ<br />
magnitudes of under 0.5 cm and maximum errors of less<br />
than 1.5 cm.<br />
The Advanced GNSS <strong>Multipath</strong> Model is also used to<br />
evaluate expected per<strong>for</strong>mance of fixed and beamsteering<br />
controlled radiation pattern antennas located on<br />
both the top and middle levels of the yardarm structure.<br />
The results show higher levels of multipath at the middle<br />
Presented at the Institute of Navigation GNSS 2005, 13-16 September, Long Beach, CA 1
yardarm location, primarily due to additional multipath<br />
reflections/diffractions from the top yardarm. Improved<br />
multipath per<strong>for</strong>mance with beam-steering antenna is<br />
demonstrated on both yardarm levels.<br />
INTRODUCTION<br />
The <strong>Sea</strong>-<strong>Based</strong> (SB) Joint Precision Approach and<br />
Landing System (<strong>JPALS</strong>) is the next generation military<br />
GPS-based system <strong>for</strong> landing aircraft on ships. It is<br />
envisioned that SB <strong>JPALS</strong> will support autoland<br />
operations even under zero visibility conditions. This<br />
requires sub-meter accuracy position solutions and<br />
necessitates the use of carrier phase-based kinematic<br />
positioning [4, 7].<br />
The stringent SB <strong>JPALS</strong> accuracy requirements make it<br />
imperative to minimize and thoroughly understand all<br />
possible error sources. One of the significant error<br />
sources <strong>for</strong> the shipboard plat<strong>for</strong>m is multipath on both<br />
carrier phase and code measurements. Code multipath<br />
errors are important because pseudorange measurements<br />
are used to limit the carrier phase ambiguity search space.<br />
Large pseudorange errors lead to a correspondingly large<br />
range of possible integer ambiguities. Furthermore, if the<br />
pseudorange uncertainty is underestimated, it can lead to<br />
incorrect integer solutions. <strong>Carrier</strong> phase multipath errors<br />
are much smaller in magnitude (on the order of a few cm)<br />
than code multipath but can still preclude reliable<br />
ambiguity resolution in high multipath environments. If<br />
integers are correctly resolved, carrier phase multipath,<br />
along with other error sources such as tropospheric delay<br />
and ship structure flexure, still contributes to the overall<br />
positioning error budget.<br />
One way to characterize and understand multipath errors<br />
<strong>for</strong> the complex shipboard environment is by way of a<br />
model. Our ef<strong>for</strong>ts rely on a GNSS <strong>Multipath</strong> Model [10]<br />
which integrates reflector environment geometries,<br />
satellite almanac data, and antenna/receiver models to<br />
simulate multipath errors. The complete model is<br />
comprised of five modules. The satellite motion module<br />
uses almanac or ephemeris data to compute satellite<br />
locations with respect to the antenna location. The<br />
environment module defines the ship structure (i.e.,<br />
reflector environment) and the material properties of each<br />
object. The ray-tracing module determines signal paths<br />
from the GPS satellite to the receiving antenna, known as<br />
the prediction point, taking into account combinations of<br />
signal interactions (reflections, diffractions, and<br />
transmissions) with the reflector environment. The rayantenna<br />
module applies the receiving antenna pattern and<br />
determines the multipath delay, relative amplitude, and<br />
relative phase. Both fixed radiation pattern antennas<br />
(FRPA) and controlled radiation pattern antennas (CRPA)<br />
may be simulated. Finally, the tracking loop module<br />
simulates the receiver front-end and code and carrier<br />
phase tracking loop response to multipath.<br />
This paper provides an overview of several simulated<br />
multipath studies <strong>for</strong> the aircraft carrier USS Eisenhower<br />
(CVN 69). These complement concurrent experimental<br />
shipboard data analysis which is underway. First, we give<br />
an overview of the model in the context of the aircraft<br />
carrier simulations and the associated experimental data.<br />
Next, model validation results, comparing simulated<br />
multipath and 13 hours of live P(Y) code multipath data<br />
collected while the ship was in dock, are shown. Third,<br />
the ability of the model to predict multipath error levels<br />
<strong>for</strong> different antenna equipment is explored. Here we<br />
compare the multipath per<strong>for</strong>mance of a 7-element beamsteering<br />
antenna array and a choke ring antenna. Finally,<br />
some visualization tools that identify reflectors and<br />
multipath signal paths in the environment are described.<br />
AIRCRAFT CARRIER MULTIPATH MODEL<br />
This section describes the components of the Advanced<br />
GNSS <strong>Multipath</strong> Model as they pertain to the aircraft<br />
carrier simulations. More general descriptions, including<br />
details on the MATLAB® software implementation, were<br />
presented in [10]. The WinProp ray-tracing software and<br />
propagation models are developed by <strong>AWE</strong><br />
Communications.<br />
Satellite Motion<br />
The satellite motion module defines the satellite tracks <strong>for</strong><br />
each simulation. Here, the tracks are taken directly from<br />
the experimental data set described below.<br />
Reflector Environment<br />
The environment module defines the reflector<br />
environment. The aircraft carrier surface geometry was<br />
created using AutoCAD 2005® based on scale computer<br />
aided design (CAD) drawings provided by the Navy [3].<br />
The ship model is comprised of 744 surfaces, and 4<br />
surfaces were added to represent the dockside and<br />
surrounding sea surface. The ship CAD model is shown<br />
in Figure 1; Figure 2 shows the complete environment<br />
model including the dock and sea surface. For reference,<br />
a satellite picture of the actual ship dock location is given<br />
in Figure 3. Overall we note that the environment model<br />
is intended to capture dominant surfaces but certainly<br />
ignores smaller objects as well as vehicles, dockside<br />
buildings, and other ships.<br />
Presented at the Institute of Navigation GNSS 2005, 13-16 September, Long Beach, CA 2
Figure 1: CVN 69 CAD model.<br />
Figure 2: Ship and dock/sea surface model.<br />
Figure 3: Satellite picture of actual dock location.<br />
(Photo Google Earth/Digital Globe)<br />
Material properties are defined separately <strong>for</strong> the ship<br />
structures, dock, and ocean surface. These are chosen<br />
such that multipath magnitudes seen in the real and<br />
simulated data match reasonably well. The material<br />
properties which are used <strong>for</strong> these simulations are<br />
summarized in Table 1. We expect to refine these in the<br />
future by taking advantage of the fact that the modeled<br />
material properties can be adjusted without rerunning ray<br />
tracing computations. This is because the ray tracing<br />
results depend only on the satellite-reflector geometry and<br />
the prediction point. Thus, to adjust a given material<br />
property, one only needs to search <strong>for</strong> rays that interacted<br />
with this material. To adjust, <strong>for</strong> example, the reflection<br />
coefficient, one simply changes the power of the ray at<br />
the prediction point. Once the search and adjustments are<br />
done, multipath processing is simply started at the rayantenna<br />
module.<br />
Table 1: <strong>Aircraft</strong> carrier simulation material<br />
properties.<br />
Interaction<br />
Type<br />
<strong>Aircraft</strong><br />
<strong>Carrier</strong><br />
Coefficient<br />
Dock<br />
Coefficient<br />
Ocean<br />
Surface<br />
Coefficient<br />
Transmission Disabled Disabled Disabled<br />
Reflection 0.4 0.18 0.2<br />
Diffraction 0.12 (max) Disabled Disabled<br />
Ray Tracing<br />
The ray-tracing module per<strong>for</strong>ms the electromagnetic ray<br />
tracing computations. The transmitters that represent the<br />
GNSS satellites are defined automatically by a MATLAB<br />
function that converts satellite azimuths/elevations to the<br />
appropriate XYZ coordinates relative to the prediction<br />
point. For each satellite epoch, the ray tracing algorithm<br />
reports results in the <strong>for</strong>m of the impulse response (time<br />
of arrival, power), ray travel paths, ray interactions, and<br />
surface/material IDs at which each interaction occurred.<br />
This in<strong>for</strong>mation allows us to compute all multipath<br />
parameters and keep track of reflection from the ocean<br />
surface. We currently compute rays with up to 2<br />
interactions. These results are then passed to the rayantenna<br />
module.<br />
Ocean surface reflections may also be accounted <strong>for</strong><br />
separately by way of a rough surface model <strong>for</strong> GPS<br />
scattering from the ocean [11]. This model modifies the<br />
ranging code correlation function according to ocean<br />
surface wind speed. In our implementation, the user<br />
simply chooses an ocean reflection correlation function<br />
from a library that contains correlations <strong>for</strong> a set of<br />
common wind speeds. The tracking loop functions then<br />
use a delayed and scaled ocean surface correlation instead<br />
of a scaled/delayed replica of the direct signal correlation<br />
<strong>for</strong> signals which reflected from the ocean. In general, the<br />
ocean correlation function differs from the direct in that<br />
the trailing edge of the triangle is distorted due to diffuse<br />
scattering. This effect is, however, negligible in these<br />
simulations <strong>for</strong> two reasons. First, the distortion of the<br />
correlation peak is only very minor <strong>for</strong> the yardarm<br />
antenna height above the ocean (about 60 m). Second,<br />
almost all multipath signals result from interaction with<br />
the aircraft carrier so the effect of ocean surface is very<br />
minor.<br />
Presented at the Institute of Navigation GNSS 2005, 13-16 September, Long Beach, CA 3
Ray-Antenna Module<br />
The ray-antenna model reads the ray-tracing outputs and<br />
converts them to standard GNSS multipath parameters.<br />
These are delay relative to the direct signal, relative phase<br />
(includes geometric delay, polarization, and antenna<br />
phase pattern), and relative amplitude (includes<br />
interaction losses and antenna gain pattern).<br />
The FRPA model used <strong>for</strong> model validation is based on<br />
anechoic chamber measurements <strong>for</strong> the Sensor Systems<br />
S-96 series choke-ring antenna used during the ship<br />
test [8]. The pattern data include right-hand circular<br />
polarization (RCP) and left-hand circular polarization<br />
(LCP) gain and phase at the L1 frequency. These pattern<br />
data are accessed in the simulation by way of a gain/phase<br />
lookup <strong>for</strong> a given angle of arrival and polarization. A<br />
sample cut of antenna gain pattern is shown in Figure 4.<br />
Figure 4: Vertical cut of choke-ring antenna gain.<br />
Receiver Tracking Module<br />
The tracking loop model is a MATLAB implementation<br />
of standard uncoupled code and carrier phase tracking<br />
loops [6].<br />
EXPERIMENTAL DATA<br />
The experimental data were collected on the USS<br />
Eisenhower in the spring of 2005. For model validation<br />
we use one ~13 hour data set collected while the ship was<br />
docked. The GPS receiver tracked dual frequency P(Y)<br />
code and carrier phase and was connected to a Sensor<br />
Systems S-96 series L1/L2 choke-ring antenna. The<br />
antenna was mounted on the top yardarm marked with an<br />
arrow in Figure 5. Embedded GPS/Inertial navigation<br />
system data are used to trans<strong>for</strong>m satellite<br />
azimuth/elevation into the aircraft carrier body frame.<br />
This step is required to capture the satellite-reflector<br />
geometries correctly. The body frame satellite sky plot is<br />
given in Figure 6. For further details on the experimental<br />
data collection ef<strong>for</strong>t the reader is referred to Reference 2.<br />
Figure 5: <strong>Aircraft</strong> carrier island showing yardarm<br />
where antenna is mounted.<br />
Figure 6: Body frame satellite sky plot.<br />
Presented at the Institute of Navigation GNSS 2005, 13-16 September, Long Beach, CA 4
MODEL VALIDATION<br />
To validate the model we compare real and simulated<br />
code multipath data in the <strong>for</strong>m of time histories and<br />
overall error statistics. To make meaningful comparisons<br />
the simulated and real receiver parameters are matched as<br />
closely as possible as shown in the table below.<br />
Table 2: Receiver system summary.<br />
Receiver System Real Receiver Simulated<br />
Parameter<br />
Receiver<br />
Antenna S-96 choke- S-96 chokeringring<br />
Frequency L1 / L2 L1<br />
Code Type P(Y) P<br />
Correlator Spacing 1.0 chips 1.0 chips<br />
Front-end<br />
Bandwidth<br />
Unknown 20 MHz<br />
Data Recording Rate 1 Hz 1/10 Hz<br />
Code <strong>Multipath</strong> Results<br />
The figures below show several real and simulated code<br />
multipath time histories. At times the multipath errors<br />
track one another well in terms of both frequency and<br />
amplitude, and at other times there are mismatches. For<br />
example, the multipath frequencies in Figure 8 agree <strong>for</strong><br />
much of the satellite pass, but simulated magnitudes<br />
be<strong>for</strong>e 6.5 hours are smaller than those seen in the real<br />
data. Mismatches are not surprising since the simulation<br />
does not capture several factors which contribute to<br />
multipath. First, the ship CAD model does not capture<br />
small objects on ship. Also, the simulated environment<br />
does not include some static structures or moving<br />
equipment. This includes ships and buildings on the<br />
surrounding dockside, equipment on the deck of the<br />
aircraft carrier (aircraft, flight support and maintenance<br />
vehicles), as well the operation of elevators and blast<br />
deflectors on the deck. Furthermore, the simulations do<br />
not model low signal power tracking problems (such as<br />
cycle slips) which occur in the real data, especially at<br />
lower elevations where the choke-ring strongly attenuates<br />
incoming signals. Finally, the installed choke-ring<br />
antenna pattern will differ slightly from the anechoic<br />
chamber measurements.<br />
Figure 7: Comparison of real and simulated code<br />
multipath, PRN 8.<br />
Figure 8: Comparison of real and simulated code<br />
multipath, PRN 20.<br />
Figure 9: Comparison of real and simulated code<br />
multipath, PRN 11.<br />
Figure 10: Comparison of real and simulated code<br />
multipath, PRN 16.<br />
Figure 11: Comparison of real and simulated code<br />
multipath, PRN 19.<br />
Presented at the Institute of Navigation GNSS 2005, 13-16 September, Long Beach, CA 5
Figure 12: Comparison of real and simulated code<br />
multipath, PRN 23.<br />
Overall multipath statistics also assess how well the<br />
simulated multipath matches the live data. The overall<br />
multipath 1-σ statistics per 10 degree elevation by are<br />
shown in Figure 13, where the left and right set of bars<br />
show the real and simulated multipath statistics,<br />
respectively. This comparison shows that the model<br />
captures multipath quite well in the statistical sense.<br />
Overall, the model not only correctly predicts the trends<br />
across the elevation bins but also predicts the 1-σ<br />
magnitudes to within 90% across all bins.<br />
Figure 13: Real and simulated aircraft carrier code<br />
multipath 1-σ statistics.<br />
<strong>Carrier</strong> Phase <strong>Multipath</strong> Results<br />
The model also computes carrier phase error due to<br />
multipath directly <strong>for</strong> a given site. This is advantageous<br />
because carrier phase multipath cannot be isolated in live<br />
measurements. Double-difference or inter-frequency<br />
carrier phase multipath observables always contain a<br />
combination of multipath from two sites and two different<br />
satellites or frequencies [2]. The simulated carrier phase<br />
multipath 1-σ statistics corresponding to the validated<br />
code multipath are shown in Figure 14. It is promising<br />
that 1-σ magnitudes are well below 1 cm. The model<br />
predicts that maximum carrier phase errors <strong>for</strong> this<br />
satellite geometry are no larger than 1.5 cm, as shown in<br />
Figure 15.<br />
Figure 14: <strong>Carrier</strong> phase multipath 1-σ.<br />
Figure 15: <strong>Carrier</strong> phase multipath maximum.<br />
Computational Costs<br />
The computational cost of a given simulation depends<br />
upon a number of factors driven by the ray-tracing,<br />
antenna models, and tracking loops. For ray-tracing,<br />
these factors include the environment complexity and<br />
number of surfaces, the number of interactions to<br />
consider, the number of transmitters (i.e., number of<br />
epochs per satellite), and the number of prediction points<br />
(receiving antennas). After ray-tracing is completed, the<br />
antenna pattern is applied and the ray-tracing outputs are<br />
converted to multipath parameters. This step is fastest<br />
with an omni-directional antenna, but slows down when<br />
using a FRPA or CRPA due to the required gain/phase<br />
lookups and/or weighting matrix calculations. The code<br />
and carrier tracking loop models are mostly affected by<br />
the precision to which the multipath delays are computed.<br />
Presented at the Institute of Navigation GNSS 2005, 13-16 September, Long Beach, CA 6
This affects the simulation speed because the code<br />
correlation functions must be sampled to this precision, so<br />
an increase in precision from 1 cm to 1 mm will result in<br />
correlation function vectors which are ten times as long.<br />
We have found that 1 cm precision is a good tradeoff<br />
between computational speed and the ability to capture<br />
multipath errors with sufficient accuracy.<br />
The simulation tasks and associated computational time<br />
<strong>for</strong> the validation simulation are summarized in Table 3.<br />
The breakdown is given <strong>for</strong> both a single and double<br />
interaction simulation corresponding to the 13 hour live<br />
data set. Both simulations were run on the same<br />
Pentium 4 / 2.8 GHz PC. The double interaction results<br />
were of course used because they represent the live data<br />
much more accurately. The increased accuracy comes at<br />
a much higher computational expense, though, as the total<br />
simulation time increased by about a factor of 70. While<br />
the total simulation time is still acceptable in this case, we<br />
are currently exploring the use of additional processors as<br />
well as the distribution of tasks to multiple PCs via a local<br />
area network.<br />
Table<br />
3: Computational tasks <strong>for</strong> aircraft carrier<br />
validation simulation.<br />
Computational<br />
Task<br />
<strong>Aircraft</strong><br />
<strong>Carrier</strong> @ One<br />
Interaction<br />
<strong>Aircraft</strong><br />
<strong>Carrier</strong> @ Two<br />
Interactions<br />
MATLAB file I/O 10 min 150 min<br />
Ray Tracing 30 min 7700 min<br />
Apply<br />
Pattern<br />
Antenna 15 min 40 min<br />
Code/<strong>Carrier</strong><br />
Tracking Loops<br />
45 min 250 min<br />
Total: ~2 hours ~137<br />
hours<br />
COMPARATIVE MULTIPATH PERFORMANCE<br />
STUDIES<br />
One<br />
important application of this multipath model is the<br />
evaluation of expected multipath error <strong>for</strong> different<br />
antenna types and locations in a given environment. Such<br />
studies can be very helpful in identifying candidate<br />
antenna equipment and sites which reduce overall<br />
multipath error. In the context of the aircraft carrier, the<br />
expected per<strong>for</strong>mance of beam-steering CRPA equipment<br />
and the level of multipath on the middle yardarm are of<br />
interest.<br />
Sample<br />
results <strong>for</strong> a beam-steering antenna are shown<br />
next. This simulation uses a 7-element GPS Antenna<br />
System 1 (GAS 1) CRPA model provided by Rockwell<br />
Collins [1,5]. This antenna model utilizes spatial adaptive<br />
processing (SAP) only and the geometry of the array is<br />
shown in Figure 16. A weighted sum of the outputs of<br />
each of the antenna elements is computed to create a<br />
composite antenna pattern that can be controlled to<br />
enhance direct and attenuate multipath signals. In our<br />
implementation, the RCP and LCP antenna patterns <strong>for</strong><br />
each element are only loaded once while the weighting<br />
algorithms and gain/phase lookups are per<strong>for</strong>med at each<br />
epoch. To improve computational per<strong>for</strong>mance, the<br />
composite gain/phase pattern are computed only <strong>for</strong><br />
angles at which signal rays are present (rather than <strong>for</strong> the<br />
complete pattern).<br />
Figure 16: GAS-1 CRPA diagram. Courtesy of<br />
Rockwell Collins.<br />
The<br />
CRPA per<strong>for</strong>mance is evaluated <strong>for</strong> two sample<br />
satellites by comparing CRPA multipath to a non-choke<br />
ring FRPA at the top-level yardarm location. Since this is<br />
a comparison of simulated data only, receiver noise is not<br />
included in the multipath observables. Sample time<br />
histories are shown below. As one can see, the beamsteering<br />
CRPA is able to reduce multipath because the<br />
antenna array applies positive gain towards the direct<br />
signal while attenuating multipath signals arriving from<br />
other directions. It is notable that at certain times, such as<br />
between hours 5-6 in Figure 17 and hours 10.5-11 in<br />
Figure 18, the CRPA errors are comparable to those of the<br />
FRPA. This is not unexpected since the composite CRPA<br />
pattern sometimes exhibits “parasitic beams” where<br />
arriving signals are not significantly attenuated [5,9]. An<br />
example of a composite CRPA pattern with parasitic<br />
beams is given in Figure 19. Here the pattern is steering<br />
towards an azimuth of 90 deg but one can see that signals<br />
arriving from azimuths around 220 deg and 320 deg<br />
would not be significantly reduced by the antenna.<br />
Presented at the Institute of Navigation GNSS 2005, 13-16 September, Long Beach, CA 7
Figure 17: Comparison of simulated FRPA/CRPA<br />
multipath, PRN 19.<br />
Figure 18: Comparison of simulated FRPA/CRPA<br />
multipath, PRN 24.<br />
Figure 19: Modeled upper-hemisphere CRPA gain<br />
pattern <strong>for</strong> azimuth 90 o / elevation 15 o .<br />
The model is also a powerful tool <strong>for</strong> comparing relative<br />
multipath levels at various locations. This is useful<br />
because it is not practical to install and test equipment at<br />
all candidate locations <strong>for</strong> a specific installation. In the<br />
case of the aircraft carrier, space <strong>for</strong> antenna equipment<br />
was limited to the top yardarm <strong>for</strong> the spring 2005 tests<br />
described above. But what is the expected multipath if<br />
antennas could be placed on the middle yardarm? To<br />
answer this question, a simulation is run with identical<br />
conditions except that the receiving antenna is moved<br />
3.8 m lower to just above the middle yardarm. Results <strong>for</strong><br />
a sample of five identical satellite tracks are shown below.<br />
Figure 20 shows a multipath time history (no noise) and<br />
one can see that the middle yardarm tends to have larger<br />
errors. There is also a data outage <strong>for</strong> the middle yardarm<br />
due to direct signal blockage from the top yardarm. This<br />
makes sense because the middle yardarm will experience<br />
multipath not only from the ship below but also from the<br />
mast and equipment above. The statistics <strong>for</strong> all satellites<br />
in Figure 21 confirm this, with significantly larger 1-σ<br />
values above 50 deg.<br />
Figure 20: Sample multipath time history <strong>for</strong><br />
upper/middle yardarm, PRN 24.<br />
Figure 21: Comparison of upper/middle yardarm<br />
multipath statistics <strong>for</strong> five identical satellite tracks.<br />
VISUALIZATION TOOLS<br />
Several useful multipath visualization tools have also<br />
been developed. For instance, multipath error can be<br />
plotted alongside the impulse response and angle of<br />
arrival in<strong>for</strong>mation. This allows one to quickly assess<br />
how many multipath signals contribute to multipath error<br />
at a given epoch as well as the directions of reflectors.<br />
The figure below shows a sample multipath impulse<br />
response. Here the multipath error <strong>for</strong> one epoch is<br />
highlighted in the top plot while the impulse response and<br />
angles of arrival are shown in the bottom plots. The<br />
impulse response and angles of arrival are color coded<br />
according to whether the final multipath interaction was a<br />
diffraction (green) or a reflection (blue). Generally these<br />
visualizations are viewed in the <strong>for</strong>m of a movie in order<br />
to illustrate the changing interactions between multipath<br />
delay, relative amplitude, and total multipath error.<br />
Presented at the Institute of Navigation GNSS 2005, 13-16 September, Long Beach, CA 8
Figure 22: Sample multipath impulse response<br />
visualization.<br />
Finally, the multipath model includes a tool to visualize<br />
ray paths within the environment model. Figure 23 shows<br />
sample ray paths <strong>for</strong> one satellite epoch with the<br />
prediction point marked in blue. One can see the direct<br />
signal as well as a few diffractions from the yardarm.<br />
While this view does not provide in<strong>for</strong>mation about<br />
multipath delays or relative amplitudes, it often helps to<br />
quickly identify multipath geometries. Figure 24 shows<br />
the same satellite-reflector geometry and adds second<br />
order interactions. This clearly illustrates how each<br />
additional interaction and the corresponding geometric<br />
complexities contribute to a significantly higher<br />
computational burden.<br />
Satellite<br />
direction<br />
Figure 23: Middle yardarm ray-path example (single<br />
interactions).<br />
Figure 24: Middle yardarm ray-path example (single<br />
and double interactions).<br />
CONCLUSIONS AND FUTURE WORK<br />
A comprehensive GNSS multipath model has been<br />
developed and applied to the USS Eisenhower aircraft<br />
carrier. The model utilizes a CAD model of the ship<br />
structures in combination with 3D ray tracing and detailed<br />
antenna and receiver models to predict multipath errors.<br />
Model validation was per<strong>for</strong>med by comparing an<br />
13 hours of P(Y) code and carrier phase multipath data<br />
collected aboard the ship to simulation results. The<br />
receiving antenna location, antenna gain/phase pattern,<br />
receiver tracking model, and satellite constellation were<br />
set up to represent those of the open-air test as closely as<br />
possible. Results presented in the <strong>for</strong>m of multipath time<br />
histories and overall error statistic summaries show that<br />
the model captures multipath errors accurately. Some<br />
discrepancies will always exist, of course, since several<br />
simplifications were made in the environment model. In<br />
light of these simplifications, however, the multipath<br />
model nonetheless shows much promise <strong>for</strong> reliable and<br />
accurate multipath predictions in the shipboard<br />
environment. This will complement carrier phase<br />
multipath analysis of actual data especially well since the<br />
simulation provides unambiguous errors <strong>for</strong> the site of<br />
interest.<br />
Future modeling work to support <strong>Sea</strong>-<strong>Based</strong> <strong>JPALS</strong> is<br />
primarily focused on refining the environment models.<br />
More comparisons to real data will be made <strong>for</strong> other<br />
antenna locations <strong>for</strong> both at-sea and dockside data.<br />
These simulations will provide additional optimization of<br />
the material properties. Also, a highly detailed CAD<br />
model of the USS Eisenhower was recently made<br />
available. We eventually plan to transition to this model<br />
once it has been simplified such that acceptable<br />
computational times are realized. Finally, methods <strong>for</strong><br />
Presented at the Institute of Navigation GNSS 2005, 13-16 September, Long Beach, CA 9
including ship motions relative to the ocean surface will<br />
be investigated.<br />
ACKNOWLEDGEMENTS<br />
The work presented in this article was per<strong>for</strong>med under<br />
contract to ARINC Engineering Services, LLC, sponsored<br />
by the U.S. Navy Air Systems Command. Gary McGraw<br />
and Ryan Young of Rockwell Collins supplied the<br />
adaptive beam-steering algorithms used <strong>for</strong> the CRPA<br />
model.<br />
REFERENCES<br />
1. Anderson, Steve, J.P. Weiss, P. Axelrad, R.<br />
Pennline. A GPS <strong>Multipath</strong> Simulator with Beam-<br />
Steering Antenna <strong>Modeling</strong> <strong>for</strong> <strong>JPALS</strong> LDGPS.<br />
Proceedings of the Institute of Navigation’s ION<br />
GNSS 2004.<br />
2. Anderson, Steve. J.P. Weiss, C. Fenwick, L. Song,<br />
P. Axelrad, J. Stevens, R.L. Brinkley, S. Calhoun.<br />
Analysis of P(Y) Code and <strong>Carrier</strong> <strong>Multipath</strong> <strong>for</strong><br />
<strong>JPALS</strong> Ship and Airborne Receivers. Proceedings<br />
of the Institute of Navigation’s ION GNSS 2005.<br />
3. Department of the Navy / Naval <strong>Sea</strong> Systems<br />
Command. <strong>Aircraft</strong> <strong>Carrier</strong> CVN 69 RCOH<br />
Antenna Arrangement. Revision A, May 3, 2004.<br />
4. Department of the Navy / Naval <strong>Sea</strong> Systems<br />
Command. Systems Requirement Document <strong>for</strong><br />
Shipboard Relative Global Positioning System<br />
Technology Development. Release 1.0, October<br />
30, 2003.<br />
5. McGraw, Gary A., R. S.Y. Young, K.<br />
Reichenauer, J. Stevens, F. Ventrone. GPS<br />
<strong>Multipath</strong> Mitigation Assessment of Digital Beam<br />
Forming Antenna Technology in a <strong>JPALS</strong> Dual<br />
Frequency Smoothing Architecture. Proceedings<br />
of the Institute of Navigation’s ION NTM 2004.<br />
6. Misra, Pratap, P. Enge. Global Positioning<br />
System: Signals, Measurements, and Per<strong>for</strong>mance.<br />
Lincoln, MA: Ganga-Jamuna Press, 2001.<br />
7. Peterson, Bruce R., G. Johnson, J. Stevens.<br />
Feasible Architectures <strong>for</strong> Joint Precision<br />
Approach and Landing System (<strong>JPALS</strong>) <strong>for</strong> Land<br />
and <strong>Sea</strong>. Proceedings of the Institute of<br />
Navigation’s ION GNSS 2004.<br />
8. U.S. Navy Air Systems Command (NAVAIR) /<br />
Facilities <strong>for</strong> Antenna and Radar Cross Section<br />
Measurements. <strong>JPALS</strong> Choke Ring Antenna<br />
Measurements Final Report. June 2005.<br />
9. Weiss, Jan P., S. Anderson, P. Axelrad, R. L.<br />
Brinkley, R. P. Pennline. Analysis of P(Y) Code<br />
<strong>Multipath</strong> <strong>for</strong> <strong>JPALS</strong> LDGPS Ground Station and<br />
Airborne Receivers. Proceedings of the Institute of<br />
Navigation’s ION GNSS 2004.<br />
10. Weiss, Jan P., S. Anderson, C. Fenwick, L. Song,<br />
P. Axelrad, P. Belay, R. L. Brinkley. Development<br />
and Validation of an <strong>Aircraft</strong> <strong>Multipath</strong> Model <strong>for</strong><br />
Land-<strong>Based</strong> <strong>JPALS</strong>. Proceedings of the Institute<br />
of Navigation’s Annual Meeting 2005.<br />
11. Zavorotny, V.U., Voronovich, A.G. Scattering of<br />
GPS Signals from the Ocean with Wind Remote<br />
Sensing Application. IEEE Transactions on<br />
Geoscience and Remote Sensing, Vol. 38, No. 2,<br />
2000.<br />
Presented at the Institute of Navigation GNSS 2005, 13-16 September, Long Beach, CA 10