The ITER toroidal field model coil project
The ITER toroidal field model coil project
The ITER toroidal field model coil project

Create successful ePaper yourself
Turn your PDF publications into a flip-book with our unique Google optimized e-Paper software.
226 A. Ulbricht et al. / Fusion Engineering and Design 73 (2005) 189–327<br />
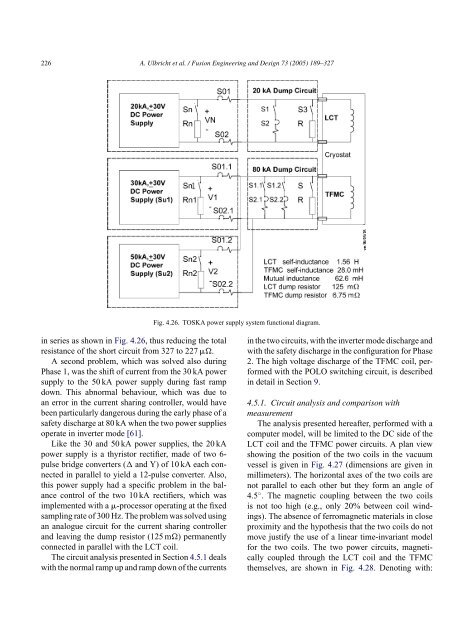
in series as shown in Fig. 4.26, thus reducing the total<br />
resistance of the short circuit from 327 to 227 ��.<br />
A second problem, which was solved also during<br />
Phase 1, was the shift of current from the 30 kA power<br />
supply to the 50 kA power supply during fast ramp<br />
down. This abnormal behaviour, which was due to<br />
an error in the current sharing controller, would have<br />
been particularly dangerous during the early phase of a<br />
safety discharge at 80 kA when the two power supplies<br />
operate in inverter mode [61].<br />
Like the 30 and 50 kA power supplies, the 20 kA<br />
power supply is a thyristor rectifier, made of two 6pulse<br />
bridge converters (� and Y) of 10 kA each connected<br />
in parallel to yield a 12-pulse converter. Also,<br />
this power supply had a specific problem in the balance<br />
control of the two 10 kA rectifiers, which was<br />
implemented with a �-processor operating at the fixed<br />
sampling rate of 300 Hz. <strong>The</strong> problem was solved using<br />
an analogue circuit for the current sharing controller<br />
and leaving the dump resistor (125 m�) permanently<br />
connected in parallel with the LCT <strong>coil</strong>.<br />
<strong>The</strong> circuit analysis presented in Section 4.5.1 deals<br />
with the normal ramp up and ramp down of the currents<br />
Fig. 4.26. TOSKA power supply system functional diagram.<br />
in the two circuits, with the inverter mode discharge and<br />
with the safety discharge in the configuration for Phase<br />
2. <strong>The</strong> high voltage discharge of the TFMC <strong>coil</strong>, performed<br />
with the POLO switching circuit, is described<br />
in detail in Section 9.<br />
4.5.1. Circuit analysis and comparison with<br />
measurement<br />
<strong>The</strong> analysis presented hereafter, performed with a<br />
computer <strong>model</strong>, will be limited to the DC side of the<br />
LCT <strong>coil</strong> and the TFMC power circuits. A plan view<br />
showing the position of the two <strong>coil</strong>s in the vacuum<br />
vessel is given in Fig. 4.27 (dimensions are given in<br />
millimeters). <strong>The</strong> horizontal axes of the two <strong>coil</strong>s are<br />
not parallel to each other but they form an angle of<br />
4.5 ◦ . <strong>The</strong> magnetic coupling between the two <strong>coil</strong>s<br />
is not too high (e.g., only 20% between <strong>coil</strong> windings).<br />
<strong>The</strong> absence of ferromagnetic materials in close<br />
proximity and the hypothesis that the two <strong>coil</strong>s do not<br />
move justify the use of a linear time-invariant <strong>model</strong><br />
for the two <strong>coil</strong>s. <strong>The</strong> two power circuits, magnetically<br />
coupled through the LCT <strong>coil</strong> and the TFMC<br />
themselves, are shown in Fig. 4.28. Denoting with: