BPZ Resources, Inc. - Shareholder.com
BPZ Resources, Inc. - Shareholder.com
BPZ Resources, Inc. - Shareholder.com

Create successful ePaper yourself
Turn your PDF publications into a flip-book with our unique Google optimized e-Paper software.
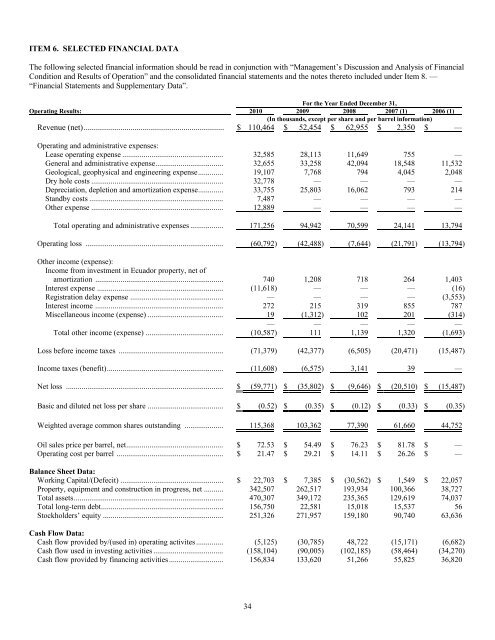
ITEM 6. SELECTED FINANCIAL DATA<br />
The following selected financial information should be read in conjunction with “Management’s Discussion and Analysis of Financial<br />
Condition and Results of Operation” and the consolidated financial statements and the notes thereto included under Item 8. —<br />
“Financial Statements and Supplementary Data”.<br />
For the Year Ended December 31,<br />
Operating Results: 2010 2009 2008 2007 (1) 2006 (1)<br />
(In thousands, except per share and per barrel information)<br />
Revenue (net)..................................................................... $ 110,464 $ 52,454 $ 62,955 $ 2,350 $ —<br />
Operating and administrative expenses:<br />
Lease operating expense .................................................... 32,585 28,113 11,649 755 —<br />
General and administrative expense................................... 32,655 33,258 42,094 18,548 11,532<br />
Geological, geophysical and engineering expense............. 19,107 7,768 794 4,045 2,048<br />
Dry hole costs .................................................................... 32,778 — — — —<br />
Depreciation, depletion and amortization expense............. 33,755 25,803 16,062 793 214<br />
Standby costs ..................................................................... 7,487 — — — —<br />
Other expense .................................................................... 12,889 — — — —<br />
Total operating and administrative expenses ................. 171,256 94,942 70,599 24,141 13,794<br />
Operating loss ....................................................................... (60,792) (42,488) (7,644) (21,791) (13,794)<br />
Other in<strong>com</strong>e (expense):<br />
<strong>Inc</strong>ome from investment in Ecuador property, net of<br />
amortization .................................................................. 740 1,208 718 264 1,403<br />
Interest expense ................................................................. (11,618) — — — (16)<br />
Registration delay expense ................................................ — — — — (3,553)<br />
Interest in<strong>com</strong>e .................................................................. 272 215 319 855 787<br />
Miscellaneous in<strong>com</strong>e (expense) ....................................... 19 (1,312) 102 201 (314)<br />
— — — — —<br />
Total other in<strong>com</strong>e (expense) ........................................ (10,587) 111 1,139 1,320 (1,693)<br />
Loss before in<strong>com</strong>e taxes ...................................................... (71,379) (42,377) (6,505) (20,471) (15,487)<br />
<strong>Inc</strong>ome taxes (benefit)............................................................ (11,608) (6,575) 3,141 39 —<br />
Net loss ................................................................................. $ (59,771) $ (35,802) $ (9,646) $ (20,510) $ (15,487)<br />
Basic and diluted net loss per share ....................................... $ (0.52) $ (0.35) $ (0.12) $ (0.33) $ (0.35)<br />
Weighted average <strong>com</strong>mon shares outstanding .................... 115,368 103,362 77,390 61,660 44,752<br />
Oil sales price per barrel, net.................................................. $ 72.53 $ 54.49 $ 76.23 $ 81.78 $ —<br />
Operating cost per barrel ....................................................... $ 21.47 $ 29.21 $ 14.11 $ 26.26 $ —<br />
Balance Sheet Data:<br />
Working Capital/(Defecit) ..................................................... $ 22,703 $ 7,385 $ (30,562) $ 1,549 $ 22,057<br />
Property, equipment and construction in progress, net .......... 342,507 262,517 193,934 100,366 38,727<br />
Total assets............................................................................. 470,307 349,172 235,365 129,619 74,037<br />
Total long-term debt............................................................... 156,750 22,581 15,018 15,537 56<br />
Stockholders’ equity .............................................................. 251,326 271,957 159,180 90,740 63,636<br />
Cash Flow Data:<br />
Cash flow provided by/(used in) operating activites .............. (5,125) (30,785) 48,722 (15,171) (6,682)<br />
Cash flow used in investing activities .................................... (158,104) (90,005) (102,185) (58,464) (34,270)<br />
Cash flow provided by financing activities............................ 156,834 133,620 51,266 55,825 36,820<br />
34