South-west Western Australia Sustainable Yields Project, Water
South-west Western Australia Sustainable Yields Project, Water
South-west Western Australia Sustainable Yields Project, Water

You also want an ePaper? Increase the reach of your titles
YUMPU automatically turns print PDFs into web optimized ePapers that Google loves.
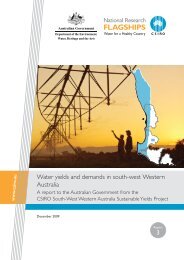
<strong>South</strong>-West <strong>Western</strong> <strong>Australia</strong> <strong>Sustainable</strong><br />
<strong>Yields</strong> <strong>Project</strong><br />
Don McFarlane<br />
<strong>Project</strong> Leader
Broad terms of reference<br />
• Estimate the current and 2030 yield of water in<br />
catchments and aquifers for the south-<strong>west</strong> of WA<br />
considering climate change and development<br />
(plantations, farm dams, groundwater abstraction)<br />
• Compare the estimated current and future water<br />
yields to those needed to meet the current levels of<br />
extractive use, future demands and environmental<br />
needs<br />
CSIRO SWWASY <strong>Project</strong> – <strong>Water</strong> Corporation
Publications<br />
Main reports Executive summaries<br />
Factsheets<br />
CSIRO SWWASY <strong>Project</strong> – <strong>Water</strong> Corporation<br />
Web:<br />
www.csiro.au/partnerships/SWSY.html
Location of the project area<br />
• All fresh, marginal and<br />
brackish surface water<br />
catchments between<br />
Gingin Brook and the<br />
Hay River<br />
• All aquifers within the<br />
Perth and Collie basins,<br />
plus the <strong>west</strong>ern Bremer<br />
Basin<br />
• Area = 62,500 km 2<br />
CSIRO SWWASY <strong>Project</strong> – <strong>Water</strong> Corporation
<strong>Project</strong> area topography<br />
• Short streams that arise in<br />
the Darling Ranges are fresh<br />
• Darling Fault separates Perth<br />
Basin from Darling Plateau<br />
• Coastal plains are flat and<br />
low lying – Swan Coastal<br />
Plain; Scott Costal Plain;<br />
<strong>South</strong> Coast<br />
• Perth Basin Plateaux are<br />
higher in elevation<br />
CSIRO SWWASY <strong>South</strong>-West <strong>Project</strong> <strong>Western</strong> – <strong>Water</strong> <strong>Australia</strong> Corporation <strong>Sustainable</strong> <strong>Yields</strong> <strong>Project</strong> – Overview
Scenarios<br />
• The ‘historical climate’ or Scenario A assumed that the climate of the<br />
last 33 years (1975 to 2007) would continue. This was used as a base<br />
case for comparison of other climate scenarios<br />
• The ‘recent climate’ or Scenario B assumed that the climate of the last<br />
11 years (1997 to 2007) would continue<br />
• The ‘future climate’ or Scenario C used 15 GCMs with 3 GHG<br />
emission levels which would result in 0.7, 1.0 and 1.3oC of warming by<br />
2030 = 45 possible climates. They are reported as<br />
• wet future climate (Cwet)<br />
• median future climate (Cmid) and<br />
• dry future climate (Cdry)<br />
• Current levels of abstraction and land use were assumed to continue<br />
for all scenarios above<br />
• The ‘future climate and development’ or Scenario D assumed a<br />
median future climate and full groundwater abstraction. New<br />
plantations and farm dams where not estimated to be important<br />
CSIRO SWWASY <strong>Project</strong> – <strong>Water</strong> Corporation
<strong>South</strong>-<strong>west</strong> WA has had reduced rainfall since<br />
1975<br />
Total rainfall (mm)<br />
600<br />
500<br />
400<br />
300<br />
200<br />
100<br />
0<br />
1900 1910 1920 1930 1940 1950 1960 1970 1980 1990 2000 2010<br />
CSIRO SWWASY <strong>South</strong>-West <strong>Project</strong> <strong>Western</strong> – <strong>Water</strong> <strong>Australia</strong> Corporation <strong>Sustainable</strong> <strong>Yields</strong> <strong>Project</strong> – Overview<br />
-18%<br />
-8%<br />
May – July<br />
August – October<br />
The 1975 to 2007 period is the baseline for all subsequent comparisons
Annual rainfalls have been even drier since 1997<br />
CSIRO SWWASY <strong>South</strong>-West <strong>Project</strong> <strong>Western</strong> – <strong>Water</strong> <strong>Australia</strong> Corporation <strong>Sustainable</strong> <strong>Yields</strong> <strong>Project</strong> – Overview<br />
1997 to 2007 rainfall<br />
compared with<br />
1975 to 1996 rainfall
14 of 15 GCMs project it will get drier<br />
CSIRO SWWASY <strong>Project</strong> – <strong>Water</strong> Corporation<br />
Change in annual rainfall<br />
• Median future climate -7%<br />
• Wet extreme future -1%<br />
climate (90 percentile)<br />
• Dry extreme future -14%<br />
climate (10 percentile)<br />
High warming<br />
Mid warming<br />
Low warming
Geographic scope<br />
• 13 surface water<br />
basins covering<br />
39,000 km 2<br />
CSIRO SWWASY <strong>Project</strong> – <strong>Water</strong> Corporation
Rainfall runoff modelling<br />
• Runoff simulated using five simple conceptual models<br />
• Sacramento<br />
• IHACRES<br />
• SIMHYD<br />
• AWBM<br />
• SMARG<br />
• One catchment model<br />
• LUCICAT (in about half the catchments)<br />
• The calibrated model output was compared with<br />
observed data and an average of runoff from<br />
Sacramento and IHACRES was the best<br />
CSIRO SWWASY <strong>Project</strong> – <strong>Water</strong> Corporation
Calibration results – examples<br />
Annual runoff (mm) .<br />
Annual runoff (mm) .<br />
500<br />
400<br />
300<br />
200<br />
100<br />
0<br />
400<br />
300<br />
200<br />
100<br />
0<br />
Harvey River - Dingo Road Observed<br />
Scott River - Brennan's Ford Observed<br />
1975 1985 1995 2005<br />
CSIRO SWWASY <strong>Project</strong> – <strong>Water</strong> Corporation<br />
Modelled<br />
Modelled<br />
Modelled annual runoff (mm)<br />
Modelled annual runoff (mm)<br />
500<br />
400<br />
300<br />
200<br />
100<br />
0<br />
400<br />
300<br />
200<br />
100<br />
0<br />
NSE = 0.82<br />
NSE = 0.87<br />
Average model efficiency = 0.84, >0.8 in 80% of catchments<br />
0 100 200 300 400<br />
Observed annual runoff (mm)
Global climate models<br />
Averaged across the surface water basins<br />
15 global climate models project less runoff<br />
inmcm<br />
ncar_pcm<br />
iap<br />
cccma_t63<br />
ipsl<br />
miroc<br />
cnrm<br />
cccma_t47<br />
ncar_ccsm<br />
mri<br />
mpi<br />
gfdl<br />
csiro<br />
giss_aom<br />
miub<br />
-50 -40 -30 -20 -10 0<br />
Change in runoff from historical (%)<br />
CSIRO SWWASY <strong>Project</strong> – <strong>Water</strong> Corporation<br />
Runoff change across all basins<br />
Wet future climate -10%<br />
Median future climate -25%<br />
Dry future climate -42%<br />
High warming<br />
Mid warming<br />
Low warming
<strong>Project</strong>ed change in mean annual runoff relative to<br />
the historical climate<br />
• Runoff declines by 25% under median future climate and 42% under dry climate<br />
• Proportion of area generating 110 mm runoff is: 37% under historical climate, 34% under<br />
recent and wet future, 22% under median future, and 16% under dry future climate<br />
CSIRO SWWASY <strong>Project</strong> – <strong>Water</strong> Corporation
Percent decline in runoff in all basins<br />
Change in mean annual runoff (%)<br />
0<br />
-10<br />
-20<br />
-30<br />
-40<br />
Northern region Central region <strong>South</strong>ern region<br />
Gingin<br />
Murray<br />
Swan Coastal<br />
• Decline under recent climate is greatest Gingin to Collie<br />
• Decline under median future climate more uniform across the area<br />
CSIRO SWWASY <strong>Project</strong> – <strong>Water</strong> Corporation<br />
Harvey<br />
Collie<br />
Preston<br />
Busselton Coast<br />
Recent climate<br />
Lower Blackwood<br />
Median future climate<br />
Donnelly<br />
Warren<br />
Shannon<br />
Kent<br />
Denmark
Groundwater results<br />
Geomorphic landforms<br />
affect groundwater<br />
response to climate<br />
change<br />
CSIRO SWWASY <strong>Project</strong> – <strong>Water</strong> Corporation
Groundwater models<br />
• The PRAMS model as used<br />
in the Gnangara<br />
Sustainability Strategy was<br />
used<br />
• A new model for the Peel<br />
Harvey area was developed<br />
• The SWAMS model was<br />
linked to a recharge model<br />
and recalibrated<br />
• The Collie model was linked<br />
to a recharge model and<br />
recalibrated<br />
CSIRO SWWASY <strong>Project</strong> – <strong>Water</strong> Corporation<br />
Perth Regional Aquifer<br />
Modeling System<br />
(PRAMS)<br />
Peel Harvey Regional<br />
Aquifer Modeling<br />
System (PHRAMS)<br />
<strong>South</strong> West Aquifer<br />
Modeling System<br />
(SWAMS)<br />
Collie model
Land cover likely to affect recharge / discharge<br />
Groundwater<br />
assessment areas<br />
• 56% dryland agriculture<br />
• 38% native vegetation<br />
• 6% plantations, urban,<br />
irrigated, open water<br />
CSIRO SWWASY <strong>Project</strong> – <strong>Water</strong> Corporation
Maximum depth of the watertable in the southern<br />
half of the Perth Basin in 2007<br />
• Coloured areas are potential<br />
GDEs if not cleared<br />
• Coastal plain soils have very<br />
shallow watertables except<br />
Gnangara and Spearwood<br />
Dunes<br />
• Plateaux areas mainly<br />
have deep watertables<br />
CSIRO SWWASY <strong>Project</strong> – <strong>Water</strong> Corporation<br />
22%<br />
14%<br />
10%<br />
46%
Change in groundwater levels between 2008 and<br />
2030 under climate and development scenarios<br />
CSIRO SWWASY <strong>Project</strong> – <strong>Water</strong> Corporation
Collie groundwater basin level changes between<br />
2008 and 2030<br />
Groundwater levels are less affected near rivers<br />
CSIRO SWWASY <strong>Project</strong> – <strong>Water</strong> Corporation
Level of confidence in the 2030 projections of<br />
groundwater levels<br />
• Central and <strong>South</strong>ern Perth<br />
Basin groundwater models<br />
are generally better than<br />
others<br />
• Northern Perth Basin and<br />
Albany Area require<br />
models<br />
• In some areas there is<br />
more confidence in specific<br />
aquifers.<br />
• Over a 22 year period the<br />
impact on deeper aquifers<br />
is present but muted<br />
CSIRO SWWASY <strong>Project</strong> – <strong>Water</strong> Corporation
Environment – key findings<br />
For surface water dependent ecosystems<br />
• Runoff during both the wet and dry seasons is expected to<br />
decrease by 20 to 30 percent under a median future climate<br />
• The impact of a drier climate is greater for low frequency-<br />
high flow events, but ecosystems are less sensitive to such<br />
conditions<br />
For groundwater dependent ecosystems<br />
• About 40% of potential GDEs may be affected to some<br />
degree under a median future climate<br />
• There are some localised high risk areas under the dry<br />
future climate and development scenarios<br />
CSIRO SWWASY <strong>Project</strong> – <strong>Water</strong> Corporation
Some terminology clarification<br />
• Runoff = amount of surface water flow expressed as a depth (mm)<br />
• Streamflow = amount of surface water flow expressed as a volume<br />
(runoff x area)<br />
• Surface water yield = streamflow that can be diverted for use.<br />
Takes account of water for the environment and the location of nature<br />
reserves, national parks, irrigable land, etc.<br />
• Use = water that is currently being used (metered, estimated)<br />
• Yield = the amount of surface water and groundwater that is available<br />
for use – either under license and as unlicensed ‘stock and domestic’<br />
• Demand – as estimate of the future requirement for water as a result<br />
of economic, demographic and industry growth. Unmet demand may<br />
result in higher water prices, reuse, water conservation, trading,<br />
desalination, etc. as well as the curtailment of growth<br />
CSIRO SWWASY <strong>Project</strong> – <strong>Water</strong> Corporation
<strong>Water</strong> use in the project area<br />
• Total use is about 1200 GL/y of which 71% is self supplied<br />
(on-site bores and farm dams) and three quarters is<br />
groundwater<br />
• About 35% is used for irrigated agriculture – elsewhere in<br />
<strong>Australia</strong> it is 66 to 75%<br />
• There is relatively little ‘low value’ agricultural water use<br />
compared with elsewhere in <strong>Australia</strong><br />
• Can be competition for water between water sectors –<br />
residential, industry, mining and agriculture<br />
• The fact that so little agricultural water is in schemes, most<br />
is groundwater and it is used on high value crops, makes<br />
transfers and trading less feasible<br />
CSIRO SWWASY <strong>Project</strong> – <strong>Water</strong> Corporation
Yield and demand areas<br />
• 21 surface water<br />
management areas<br />
• 23 groundwater areas<br />
• 8 demand regions<br />
CSIRO SWWASY <strong>Project</strong> – <strong>Water</strong> Corporation<br />
Perth Demand Region
Surface water use is highest in central catchments<br />
and these will grow in future<br />
Current use = 299 GL/y Growth in demand<br />
CSIRO SWWASY <strong>Project</strong> – <strong>Water</strong> Corporation
Current surface water yields<br />
Total yield = 425 GL/y<br />
Licensed allocations<br />
• Public <strong>Water</strong> Supply<br />
24%<br />
• Irrigation schemes<br />
27%<br />
• Self supply 49%<br />
• Harvey and Collie<br />
contribute 43% of<br />
total yield<br />
CSIRO SWWASY <strong>Project</strong> – <strong>Water</strong> Corporation
Surface water yields are projected to change by -24%<br />
under a median future climate. Range of -4 to -49%<br />
CSIRO SWWASY <strong>Project</strong> – <strong>Water</strong> Corporation<br />
IWSS yields reduced by 18% to 77 GL/y<br />
under a median future climate
Selected water yield areas<br />
Surface water<br />
management area<br />
More detailed data are available for runoff (mm) and streamflows (GL/y)<br />
CSIRO SWWASY <strong>Project</strong> – <strong>Water</strong> Corporation<br />
Current<br />
Median Future<br />
Climate<br />
Dry Extreme Future<br />
Climate<br />
GL/y GL/y % change GL/y % change<br />
Helena 9.6 7.9 -18 3.9 -59<br />
Canning River 25.4 21.1 -17 14.8 -42<br />
Serpentine River<br />
Catchment<br />
Dandalup River<br />
System<br />
20.7 15.6 -25 9.1 -56<br />
21.9 15.8 -28 9.6 -56<br />
Collie 93.6 72.9 -22 53.8 -43<br />
Total 171.2 133.3 -22 91.2 -47
Gaps in surface water yields and demands in<br />
areas where irrigation is important<br />
CSIRO SWWASY <strong>Project</strong> – <strong>Water</strong> Corporation<br />
Surplus<br />
Deficit
Current groundwater yields as estimated by<br />
adding the 2009 Allocation Limits<br />
Total yield = 1556 GL/y<br />
Main aquifers:<br />
• Superficial 58%<br />
• Leederville 12%<br />
• Yarragadee 26%<br />
CSIRO SWWASY <strong>Project</strong> – <strong>Water</strong> Corporation<br />
Total yield Yield per unit area
Groundwater use and future demand is highest<br />
near Perth and Bunbury<br />
Current use = 808 GL/y<br />
(2.2 x surface water)<br />
CSIRO SWWASY <strong>Project</strong> – <strong>Water</strong> Corporation<br />
Growth in demand<br />
Additional<br />
Perth – Peel<br />
area<br />
Bunbury
Groundwater yields are projected to change by -2%<br />
under a median future climate. Range = +2 to -7%<br />
Recent<br />
climate<br />
Yield reductions are low because<br />
1. Drain and ET losses reduce as watertables fall<br />
2. Areas under dryland agriculture (56% of Perth Basin) have rising levels<br />
3. Allocation Limits account for a future drier climate<br />
CSIRO SWWASY <strong>Project</strong> – <strong>Water</strong> Corporation<br />
Median future<br />
climate<br />
Dry<br />
future climate
CSIRO SWWASY <strong>Project</strong> – <strong>Water</strong> Corporation
IWSS yield and demands<br />
CSIRO SWWASY <strong>Project</strong> – <strong>Water</strong> Corporation
Available SW/GW yield (GL/y)<br />
300<br />
250<br />
200<br />
150<br />
100<br />
50<br />
Estimated yields and demands for the IWSS<br />
0<br />
Current<br />
yield<br />
A B Cwet Cmid Cdry<br />
Yarragadee Mirrabooka Leederville<br />
Superficial Fractured rock Other aquifer<br />
SW self-supply SW dams<br />
CSIRO SWWASY <strong>Project</strong> – <strong>Water</strong> Corporation<br />
Demand Historical Recent Wet extreme Median future Dry extreme<br />
GL/y<br />
Low demand -47 -73 -55 -86 -125<br />
Medium demand -77 -103 -85 -116 -155<br />
High demand -136 -162 -144 -175 -214<br />
Total demand v Total available yield (GL/y)<br />
500<br />
450<br />
400<br />
350<br />
300<br />
250<br />
200<br />
150<br />
100<br />
50<br />
116 GL/y<br />
0<br />
2005 2010 2015 2020 2025 2030 2035<br />
2030 Low demand 2030 Scenario B<br />
2030 Medium demand 2030 Scenario Cwet<br />
2030 High demand 2030 Scenario Cmid<br />
2030 Scenario A 2030 Scenario Cdry
Groundwater deficits may develop near Perth,<br />
Collie and Albany<br />
Recent climate<br />
2030 gap<br />
CSIRO SWWASY <strong>Project</strong> – <strong>Water</strong> Corporation<br />
Median future climate<br />
2030 gap<br />
Dry future climate<br />
2030 gap<br />
Surplus<br />
Deficit
The project area can meet all except high<br />
demands until 2030 under a median future climate<br />
Available SW/GW yield (GL/y)<br />
2500<br />
2000<br />
1500<br />
1000<br />
500<br />
0<br />
Current yield<br />
Historical<br />
Recent<br />
Wet extreme<br />
Median<br />
Yarragadee<br />
Mirrabooka<br />
Leederville<br />
Superficial<br />
Other aquifer<br />
Self-supply dams<br />
CSIRO SWWASY <strong>Project</strong> – <strong>Water</strong> Corporation<br />
Dry extreme<br />
Scheme dams<br />
Fractured rock<br />
Total demand v Total available yield (GL/y)<br />
2500<br />
2000<br />
1500<br />
1000<br />
500<br />
0<br />
2005 2010 2015 2020 2025 2030 2035<br />
2030 Low demand Recent<br />
2030 Medium demand Wet extreme<br />
2030 High demand Median<br />
Historical Dry extreme<br />
• A 250 GL/y deficit may develop under a dry extreme climate and<br />
high demand<br />
250 GL
Key Findings<br />
1. <strong>South</strong>-<strong>west</strong> <strong>Western</strong> <strong>Australia</strong> has experienced a<br />
significant shift since 1975 which probably contains<br />
a component of climate change. Climate models<br />
project that the region will get about 7% drier by<br />
2030 (could be up to 14%)<br />
2. Surface water yields have already decreased in<br />
northern catchments and may decrease further by<br />
2030. Central catchments are higher yielding and<br />
could decrease by less. <strong>South</strong>ern catchments are<br />
lower yielding and may decrease by most in<br />
volume. The overall decrease may be about 24%<br />
but it could be up to 49%<br />
CSIRO SWWASY <strong>Project</strong> – <strong>Water</strong> Corporation
Key Findings (cont.)<br />
3. Groundwater levels are projected to fall most under<br />
areas of perennial vegetation, e.g. Gnangara,<br />
Blackwood Plateau, Collie and Albany.<br />
Levels are least affected in areas with high watertables<br />
such as coastal areas under dryland agriculture, e.g.<br />
Swan and Scott Coastal Plains; Dandaragan Plateau<br />
As watertables fall, drainage and evaporation from<br />
GDEs fall and allows more recharge to enter<br />
4. <strong>Water</strong> dependent ecosystems have already been<br />
impacted and these impacts are projected to worsen,<br />
especially for high streamflows and GDEs with a<br />
watertable depth of 6 to 10m<br />
CSIRO SWWASY <strong>Project</strong> – <strong>Water</strong> Corporation
Key Findings (cont.)<br />
5. <strong>Water</strong> deficits between yields and demands are<br />
likely in:<br />
• Surface water irrigation catchments<br />
• Aquifers near Perth, Collie and Albany<br />
6. Overall there is enough water to meet all except<br />
high demands under a median future climate.<br />
However if there is a dry extreme climate and a<br />
high demand the deficit may be as much as<br />
250 GL/y<br />
CSIRO SWWASY <strong>Project</strong> – <strong>Water</strong> Corporation
Acknowledgements<br />
• DEWHA – funding and policy guidance<br />
• Department of <strong>Water</strong> – data, models, researchers, report review<br />
• <strong>Water</strong> Corporation – data, report review – Mike Canci, Charles Jeevaraj,<br />
Chengchao Xu<br />
• Department of Agriculture and Food WA – soils data<br />
• Bureau of Meteorology – climate data, surface water modelling<br />
• Queensland Department of Environment and Resource Management – SILO data<br />
• Contracts and consultancies<br />
• URS – Peel Harvey groundwater model<br />
• CyMod Systems Pty Ltd – groundwater model calibration<br />
• Resource Economics Unit – demand estimation<br />
• Geographic Information Analysis – model data preparation<br />
• Jim Davies and Associates – yield and demand analyses<br />
• External reviewers:<br />
Peter Davies (University of Tasmania); Andy Pitman (University of New <strong>South</strong> Wales);<br />
Tony Jakeman (<strong>Australia</strong>n National University): Don Armstrong (Lisdon Associates) and<br />
Murray Peel (University of Melbourne)<br />
CSIRO SWWASY <strong>Project</strong> – <strong>Water</strong> Corporation
Contributors<br />
<strong>Project</strong> Director Tom Hatton<br />
<strong>Sustainable</strong> <strong>Yields</strong> Coord. Mac Kirby<br />
<strong>Project</strong> Leader Don McFarlane<br />
<strong>Project</strong> Support Frances Parsons, Therese McGillion, Paul Jupp, Josie Grayson<br />
Data Management Geoff Hodgson, Jeannette Crute, Christina Gabrovsek, Mick Hartcher, Malcolm Hodgen<br />
DOW – Aidan Belouardi<br />
DAFWA – Damien Shepherd, Dennis van Gool, Noel Schoknecht<br />
Climate Stephen Charles, Francis Chiew, Randall Donohue, Guobin Fu, Ling Tao Li, Steve Marvanek,<br />
Tim McVicar, Ian Smith, Tom Van Niel<br />
NSW Dept of <strong>Water</strong> and Energy – Jin Teng<br />
Surface <strong>Water</strong> Richard Silberstein, Santosh Aryal, Neil Viney, Ang Yang<br />
DOW – Mark Pearcey, Jacqui Durrant, Michael Braccia, Kathryn Smith, Lidia Boniecka, Simone McCallum<br />
BOM – Mohammad Bari<br />
Geographic Information Analysis – Geoff Mauger<br />
Groundwater Riasat Ali, Warrick Dawes, Sunil Varma, Irina Emelyanova, Jeff Turner, Glen Walker, John Byrne,<br />
Phil Davies, Steve Gorelick, Mahtab Ali<br />
DOW – Chris O’Boy, Binh Anson, Phillip Commander, Cahit Yesertener, Jayath de Silva, Jasmine Rutherford<br />
<strong>Water</strong> Corporation – Mike Canci, Chengchao Xu<br />
Cymod Systems – Neil Milligan<br />
URS <strong>Australia</strong> – Wen Yu, Andrew Brooker, Amandine Bou, Andrew McTaggart<br />
<strong>Water</strong> <strong>Yields</strong> and Demands Olga Barron, Natalie Smart, Michael Donn<br />
DOW – Roy Stone, Phillip Kalaitzis, Rob Donohue, Fiona Lynn, Adrian Goodreid, Andrew Paton,<br />
Susan Worley, Kylie La Spina<br />
Resource Economics Unit – Jonathan Thomas<br />
Jim Davies and Associates – Sasha Martens, Kate Smith<br />
Reporting Viv Baker, Becky Schmidt, Susan Cuddy, Simon Gallant, Heinz Buettikofer, Elissa Churchward,<br />
Chris Maguire, Linda Merrin<br />
Communications Anne McKenzie, Helen Beringen, Mary Mulcahy<br />
CSIRO SWWASY <strong>Project</strong> – <strong>Water</strong> Corporation
Questions?<br />
CSIRO SWWASY <strong>Project</strong> – <strong>Water</strong> Corporation