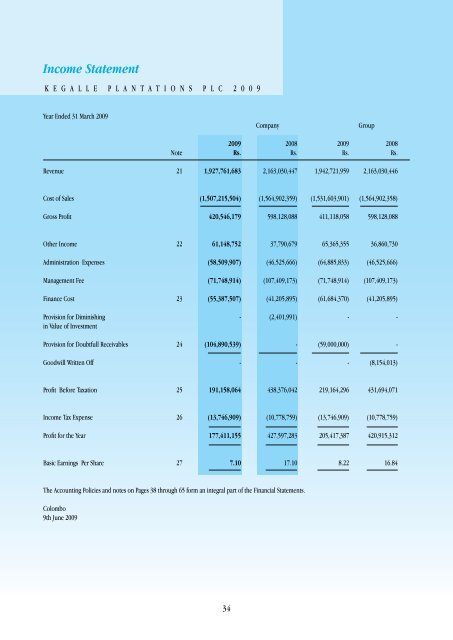
Income Statement K E G A L L E P L A N T A T I O N S P L C 2 0 0 9 Year Ended 31 March 2009 Company Group 2009 2008 2009 2008 Note Rs. Rs. Rs. Rs. Revenue 21 1,927,761,683 2,163,030,447 1,942,721,959 2,163,030,446 Cost of Sales (1,507,215,504) (1,564,902,359) (1,531,603,901) (1,564,902,358) Gross Profit 420,546,179 598,128,088 411,118,058 598,128,088 O<strong>the</strong>r Income 22 61,148,752 37,790,679 65,365,355 36,860,730 Administration Expenses (58,509,907) (46,525,666) (64,885,833) (46,525,666) Management Fee (71,748,914) (107,409,173) (71,748,914) (107,409,173) Finance Cost 23 (55,387,507) (41,205,895) (61,684,370) (41,205,895) Provision for Diminishing - (2,401,991) - - in Value of Investment Provision for Doubtfull Receivables 24 (104,890,539) - (59,000,000) - Goodwill Written Off - - - (8,154,013) Profit Before Taxation 25 191,158,064 438,376,042 219,164,296 431,694,071 Income Tax Expense 26 (13,746,909) (10,778,759) (13,746,909) (10,778,759) Profit for <strong>the</strong> Year 177,411,155 427,597,283 205,417,387 420,915,312 Basic Earnings Per Share 27 7.10 17.10 8.22 16.84 The Accounting Policies and notes on Pages 38 through 65 form an integral part of <strong>the</strong> <strong>Financial</strong> <strong>Statements</strong>. <strong>Colombo</strong> 9th June 2009 34
K E G A L L E P L A N T A T I O N S P L C 2 0 0 9 Year Ended 31 March 2009 Company Group 2009 2008 2009 2008 Note Rs. Rs. Rs. Rs. CASH FLOWS FROM OPERATING ACTIVITIES Net Profit/(Loss) before Taxation 191,158,064 438,376,042 219,164,296 431,694,071 ADJUSTMENTS FOR Goodwill Written Off - - - 8,154,013 Interest Income 22 (38,722,426) (9,243,057) (38,722,426) (9,243,057) Depreciation / Amortization 25 72,777,088 65,916,931 79,135,487 72,256,817 Provision for Defined Benefit Plan Costs 14 34,325,973 57,194,984 34,420,633 57,194,984 Defined Benefit Plan Costs paid 14 (37,052,335) (19,922,179) (37,052,335) (19,922,179) Amortization of Grants 22 (4,677,969) (3,870,733) (8,894,571) (8,357,464) Finance Costs 23 55,387,507 41,205,895 64,684,370 56,812,438 Provision for Diminishing in Value of Investment - 2,401,991 - (11,599,009) Provisin for Bad & Doubtful Debt 104,890,539 - 59,000,000 - Operating Profit before Working Capital Changes 378,086,441 572,059,874 371,735,454 576,990,614 (Increase)/Decrease in Trade & O<strong>the</strong>r Receivables 9 44,586,855 (179,803) 90,177,810 2,465,414 (Increase)/Decrease in Inven<strong>to</strong>ries 8 56,346,318 6,750,153 66,424,425 (700,233) (Increase)/Decrease in Amounts due from Related Companies 10 (58,014,547) 13,610,374 (58,014,547) 13,610,374 Increase/(Decrease) in Trade & O<strong>the</strong>r Payables 17 (23,561,818) 10,704,341 (20,517,322) 12,161,223 Increase/(Decrease) in Amounts due <strong>to</strong> Related Companies 20 226,750 (16,111,395) (506,397) (12,394,423) Cash Generated from Operations 397,669,999 586,833,544 449,299,423 592,132,969 ESC Paid (5,461,719) (5,492,031) (5,461,719) (5,492,031) Finance Cost Paid (38,286,882) (23,964,392) (44,583,745) (39,570,936) Income Tax Paid (357,526) (5,286,728) (357,526) (5,286,728) Net Cash from Operating Activities 353,563,872 552,090,393 398,896,433 541,783,274 CASH FLOWS FROM INVESTING ACTIVITIES Investments (5,297,498) (72,598,999) (5,297,498) (72,598,999) Interest Received 38,722,426 9,243,057 38,722,426 9,243,057 Grant Received 22 32,417,846 26,833,876 32,417,846 28,677,379 Field Development Expenditure Note A (89,992,790) (61,159,302) (89,992,790) (61,159,302) Purchase of Property, Plant & Equipment Note B (75,947,341) (58,050,267) (75,947,341) (59,809,953) Net Cash used in Investing Activities (100,097,357) (155,731,635) (100,097,357) (155,647,818) CASH FLOWS FROM FINANCING ACTIVITIES Dividend Paid (53,483,875) (146,350,228) (53,483,875) (146,350,228) Payment of Government lease rentals (17,100,625) (17,241,607) (17,100,625) (17,241,607) Payment of Lease Rentals (3,657,099) (3,657,099) (3,657,099) (3,657,099) Proceeds from Loans 99,128,000 92,614,047 99,128,000 92,614,047 Repayment of Loans (48,364,118) (95,633,786) (83,164,118) (96,833,786) Net Cash from Financing Activities (23,477,717) (170,268,673) (58,277,717) (171,468,673) Net Increase/(Decrease) in Cash & Cash Equivalents 229,988,798 226,090,085 240,521,359 214,666,783 Cash & Cash Equivalents at <strong>the</strong> beginning of <strong>the</strong> Year Note C 213,133,841 (12,956,244) 203,102,378 (11,564,405) Cash & Cash Equivalents at <strong>the</strong> end of <strong>the</strong> Year Note D 443,122,639 213,133,841 443,623,737 203,102,378 The Accounting Policies and notes on Pages 38 through 65 form an integral part of <strong>the</strong> <strong>Financial</strong> <strong>Statements</strong>. <strong>Colombo</strong> 9th June 2009 Cash Flow Statement 35