

Development and Globalization: - Unctad
Development and Globalization: - Unctad
Development and Globalization: - Unctad

Create successful ePaper yourself
Turn your PDF publications into a flip-book with our unique Google optimized e-Paper software.
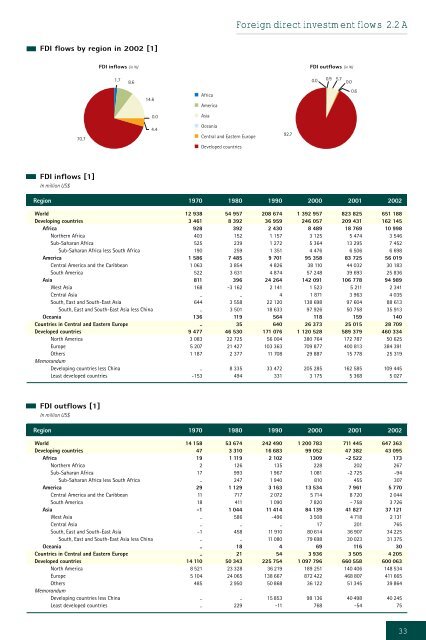
FDI flows by region in 2002 [1]<br />
70.7<br />
FDI inflows [1]<br />
In million US$<br />
1.7<br />
8.6<br />
14.6<br />
0.0<br />
4.4<br />
Africa<br />
America<br />
Asia<br />
Oceania<br />
Central <strong>and</strong> Eastern Europe<br />
Developed countries<br />
Foreign direct investment flows 2.2 A<br />
92.7<br />
0.0 0.9 5.7<br />
0.0<br />
Region 1970 1980 1990 2000 2001 2002<br />
World 12 938 54 957 208 674 1 392 957 823 825 651 188<br />
Developing countries 3 461 8 392 36 959 246 057 209 431 162 145<br />
Africa 928 392 2 430 8 489 18 769 10 998<br />
Northern Africa 403 152 1 157 3 125 5 474 3 546<br />
Sub-Saharan Africa 525 239 1 272 5 364 13 295 7 452<br />
Sub-Saharan Africa less South Africa 190 259 1 351 4 476 6 506 6 698<br />
America 1 586 7 485 9 701 95 358 83 725 56 019<br />
Central America <strong>and</strong> the Caribbean 1 063 3 854 4 826 38 110 44 032 30 183<br />
South America 522 3 631 4 874 57 248 39 693 25 836<br />
Asia 811 396 24 264 142 091 106 778 94 989<br />
West Asia 168 -3 162 2 141 1 523 5 211 2 341<br />
Central Asia .. .. 4 1 871 3 963 4 035<br />
South, East <strong>and</strong> South-East Asia 644 3 558 22 120 138 698 97 604 88 613<br />
South, East <strong>and</strong> South-East Asia less China .. 3 501 18 633 97 926 50 758 35 913<br />
Oceania 136 119 564 118 159 140<br />
Countries in Central <strong>and</strong> Eastern Europe .. 35 640 26 373 25 015 28 709<br />
Developed countries 9 477 46 530 171 076 1 120 528 589 379 460 334<br />
North America 3 083 22 725 56 004 380 764 172 787 50 625<br />
Europe 5 207 21 427 103 363 709 877 400 813 384 391<br />
Others 1 187 2 377 11 708 29 887 15 778 25 319<br />
Memor<strong>and</strong>um<br />
Developing countries less China .. 8 335 33 472 205 285 162 585 109 445<br />
Least developed countries -153 494 331 3 175 5 368 5 027<br />
FDI outflows [1]<br />
In million US$<br />
FDI inflows (in %) FDI outflows (in %)<br />
Region 1970 1980 1990 2000 2001 2002<br />
World 14 158 53 674 242 490 1 200 783 711 445 647 363<br />
Developing countries 47 3 310 16 683 99 052 47 382 43 095<br />
Africa 19 1 119 2 102 1309 -2 522 173<br />
Northern Africa 2 126 135 228 202 267<br />
Sub-Saharan Africa 17 993 1 967 1 081 -2 725 -94<br />
Sub-Saharan Africa less South Africa .. 247 1 940 810 455 307<br />
America 29 1 129 3 163 13 534 7 961 5 770<br />
Central America <strong>and</strong> the Caribbean 11 717 2 072 5 714 8 720 2 044<br />
South America 18 411 1 090 7 820 - 758 3 726<br />
Asia -1 1 044 11 414 84 139 41 827 37 121<br />
West Asia .. 586 -496 3 508 4 718 2 131<br />
Central Asia .. .. .. 17 201 765<br />
South, East <strong>and</strong> South-East Asia -1 458 11 910 80 614 36 907 34 225<br />
South, East <strong>and</strong> South-East Asia less China .. .. 11 080 79 698 30 023 31 375<br />
Oceania .. 18 4 69 116 30<br />
Countries in Central <strong>and</strong> Eastern Europe .. 21 54 3 936 3 505 4 205<br />
Developed countries 14 110 50 343 225 754 1 097 796 660 558 600 063<br />
North America 8 521 23 328 36 219 189 251 140 406 148 534<br />
Europe 5 104 24 065 138 667 872 422 468 807 411 665<br />
Others 485 2 950 50 868 36 122 51 345 39 864<br />
Memor<strong>and</strong>um<br />
Developing countries less China .. .. 15 853 98 136 40 498 40 245<br />
Least developed countries .. 229 -11 768 -54 75<br />
0.6<br />
33


