Tracking Progress on Child and Maternal Nutrition - Unicef
Tracking Progress on Child and Maternal Nutrition - Unicef
Tracking Progress on Child and Maternal Nutrition - Unicef

Create successful ePaper yourself
Turn your PDF publications into a flip-book with our unique Google optimized e-Paper software.
TRACKING<br />
PROGRESS<br />
ON CHILD<br />
AND<br />
MATERNAL<br />
NUTRITION<br />
A survival <strong>and</strong><br />
development priority
© United Nati<strong>on</strong>s <strong>Child</strong>ren’s Fund (UNICEF)<br />
November 2009<br />
Permissi<strong>on</strong> to reproduce any part of this publicati<strong>on</strong> is required.<br />
Please c<strong>on</strong>tact:<br />
Divisi<strong>on</strong> of Communicati<strong>on</strong>, UNICEF<br />
3 United Nati<strong>on</strong>s Plaza<br />
New York, NY 10017, USA<br />
Email: nyhqdoc.permit@unicef.org<br />
Permissi<strong>on</strong> will be freely granted to educati<strong>on</strong>al or<br />
n<strong>on</strong>-profit organizati<strong>on</strong>s. Others will be requested to<br />
pay a small fee.<br />
This report c<strong>on</strong>tains nutriti<strong>on</strong> profiles for 24 countries with<br />
the largest burden of stunting, beginning <strong>on</strong> page 43. Additi<strong>on</strong>al<br />
country nutriti<strong>on</strong> profiles will be available early 2010 at<br />
.<br />
For any corrigenda found subsequent to printing,<br />
please visit our website at www.unicef.org/publicati<strong>on</strong>s>.<br />
For any data updates subsequent to printing,<br />
please visit .<br />
ISBN: 978-92-806-4482-1<br />
Sales no.: E.09.XX.25<br />
United Nati<strong>on</strong>s <strong>Child</strong>ren’s Fund<br />
3 United Nati<strong>on</strong>s Plaza<br />
New York, NY 10017, USA<br />
Email: pubdoc@unicef.org<br />
Website: www.unicef.org
TRACKING<br />
PROGRESS<br />
ON CHILD<br />
AND<br />
MATERNAL<br />
NUTRITION<br />
A survival <strong>and</strong><br />
development priority
CONTENTS<br />
Foreword ...................................................................................................................................................................................................................3<br />
Glossary of terms used in this report ..........................................................................................................................................................4<br />
Introducti<strong>on</strong> .............................................................................................................................................................................................................5<br />
Key messages .........................................................................................................................................................................................................7<br />
Overview ...................................................................................................................................................................................................................9<br />
1. The challenge of undernutriti<strong>on</strong> ...........................................................................................................................................................10<br />
2. The importance of nutriti<strong>on</strong> ...................................................................................................................................................................12<br />
3. Current status of nutriti<strong>on</strong> ......................................................................................................................................................................15<br />
4. Coverage of interventi<strong>on</strong>s to improve nutriti<strong>on</strong> ..............................................................................................................................23<br />
5. Effective interventi<strong>on</strong>s to improve nutriti<strong>on</strong> .....................................................................................................................................31<br />
6. Underlying causes of undernutriti<strong>on</strong>: Poverty, disparities <strong>and</strong> other social factors ..............................................................35<br />
7. Factors for good nutriti<strong>on</strong> programming ..........................................................................................................................................37<br />
8. The way forward .......................................................................................................................................................................................40<br />
References .......................................................................................................................................................................................................41<br />
Notes <strong>on</strong> the maps ........................................................................................................................................................................................42<br />
Nutriti<strong>on</strong> profi les: 24 countries with the largest burden of stunting ........................................................................................ 43<br />
Acr<strong>on</strong>yms used in the country profi les ....................................................................................................................................................92<br />
Interpreting infant <strong>and</strong> young child feeding area graphs ...................................................................................................................92<br />
Data sources ....................................................................................................................................................................................................94<br />
Defi niti<strong>on</strong>s of key indicators .......................................................................................................................................................................97<br />
Defi niti<strong>on</strong>s of policy indicators ................................................................................................................................................................100<br />
Statistical tables ............................................................................................................................................................................................... 101<br />
Table 1: Country ranking, based <strong>on</strong> numbers of moderately <strong>and</strong> severely<br />
stunted children under 5 years old..........................................................................................................................................102<br />
Table 2: Demographic <strong>and</strong> nutriti<strong>on</strong>al status indicators ...................................................................................................................104<br />
Table 3: Infant feeding practices <strong>and</strong> micr<strong>on</strong>utrient indicators ......................................................................................................108<br />
Annexes ................................................................................................................................................................................................................ 113<br />
Summary indicators .................................................................................................................................................................................... 114<br />
General notes <strong>on</strong> the data ......................................................................................................................................................................... 116<br />
Acknowledgements ........................................................................................................................................................................................ 119<br />
2 <str<strong>on</strong>g>Tracking</str<strong>on</strong>g> <str<strong>on</strong>g>Progress</str<strong>on</strong>g> <strong>on</strong> <strong>Child</strong> <strong>and</strong> <strong>Maternal</strong> Nutriti<strong>on</strong>
FOREWORD<br />
Undernutriti<strong>on</strong> c<strong>on</strong>tributes to more than <strong>on</strong>e third of all<br />
deaths in children under the age of fi ve. It does this by<br />
stealing children’s strength <strong>and</strong> making illness more<br />
dangerous. An undernourished child struggles to withst<strong>and</strong><br />
an attack of pneum<strong>on</strong>ia, diarrhoea or other illness – <strong>and</strong><br />
illness often prevails.<br />
Undernutriti<strong>on</strong> is caused by poor feeding <strong>and</strong> care,<br />
aggravated by illness. The children who survive may<br />
become locked in a cycle of recurring illness <strong>and</strong> faltering<br />
growth – diminishing their physical health, irreversibly<br />
damaging their development <strong>and</strong> their cognitive abilities,<br />
<strong>and</strong> impairing their capacities as adults. If a child suffers<br />
from diarrhoea – due to a lack of clean water or adequate<br />
sanitati<strong>on</strong>, or because of poor hygiene practices – it will<br />
drain nutrients from his or her body.<br />
And so it goes, from bad to worse: <strong>Child</strong>ren who are<br />
weakened by nutriti<strong>on</strong>al defi ciencies cannot stave off<br />
illness for l<strong>on</strong>g, <strong>and</strong> the frequent <strong>and</strong> more severe bouts<br />
of illness they experience make them even weaker. More<br />
than a third of the children who died from pneum<strong>on</strong>ia,<br />
diarrhoea <strong>and</strong> other illnesses could have survived if they<br />
had not been undernourished.<br />
This report shows that an estimated 195 milli<strong>on</strong> children<br />
under age 5 in developing countries suffer from stunting,<br />
a c<strong>on</strong>sequence of chr<strong>on</strong>ic nutriti<strong>on</strong>al deprivati<strong>on</strong> that begins<br />
in the period before birth if the mother is undernourished.<br />
Of these, more than 90 per cent are in Asia <strong>and</strong> Africa.<br />
<strong>Maternal</strong> undernutriti<strong>on</strong> affects a woman’s chances of<br />
surviving pregnancy as well as her child’s health. Women<br />
who were stunted as girls, whose nutriti<strong>on</strong>al status was<br />
poor when they c<strong>on</strong>ceived or who didn’t gain enough<br />
weight during pregnancy may deliver babies with low<br />
birthweight. These infants in turn may never recoup from<br />
their early disadvantage. Like other undernourished<br />
children, they may be susceptible to infectious disease <strong>and</strong><br />
death, <strong>and</strong> as adults they may face a higher risk of chr<strong>on</strong>ic<br />
illness such as heart disease <strong>and</strong> diabetes. Thus the health<br />
of the child is inextricably linked to the health of the mother.<br />
In turn, the health of the mother is linked to the status<br />
a woman has in the society in which she lives. In many<br />
developing countries, the low status of women is c<strong>on</strong>sidered<br />
to be <strong>on</strong>e of the primary reas<strong>on</strong>s for undernutriti<strong>on</strong><br />
across the life cycle.<br />
Undernutriti<strong>on</strong> in children under age 2 diminishes the<br />
ability of children to learn <strong>and</strong> earn throughout their lives.<br />
Nutriti<strong>on</strong>al deprivati<strong>on</strong> leaves children tired <strong>and</strong> weak, <strong>and</strong><br />
lowers their IQs, so they perform poorly in school. As adults<br />
they are less productive <strong>and</strong> earn less than their healthy<br />
peers. The cycle of undernutriti<strong>on</strong> <strong>and</strong> poverty thereby<br />
repeats itself, generati<strong>on</strong> after generati<strong>on</strong>.<br />
Exclusive breastfeeding for the fi rst six m<strong>on</strong>ths <strong>and</strong><br />
c<strong>on</strong>tinued breastfeeding together with appropriate foods<br />
can have a major impact <strong>on</strong> children’s survival, growth<br />
<strong>and</strong> development. Adding vitamin A to the diet, to boost<br />
resistance to disease, <strong>and</strong> zinc, to treat diarrhoea, can<br />
further reduce child mortality. Fortifi cati<strong>on</strong> of staple foods,<br />
c<strong>on</strong>diments <strong>and</strong> complementary foods for young children<br />
can make life-saving vitamins <strong>and</strong> minerals available to<br />
large segments of the populati<strong>on</strong>. Ensuring against iodine<br />
<strong>and</strong> ir<strong>on</strong> defi ciencies improves lives <strong>and</strong> cognitive development.<br />
Studies show iodine defi ciency lowers IQ 13.5 points<br />
<strong>on</strong> average.<br />
For children who suffer from severe acute malnutriti<strong>on</strong>,<br />
often in the c<strong>on</strong>text of emergencies, ready-to-use foods<br />
can effectively reduce the malnutriti<strong>on</strong> <strong>and</strong> replenish many<br />
of the nutrients <strong>and</strong> energy lost.<br />
Lack of attenti<strong>on</strong> to child <strong>and</strong> maternal nutriti<strong>on</strong> today<br />
will result in c<strong>on</strong>siderably higher costs tomorrow. With<br />
more than 1 billi<strong>on</strong> people suffering from malnutriti<strong>on</strong> <strong>and</strong><br />
hunger, internati<strong>on</strong>al leadership <strong>and</strong> urgent acti<strong>on</strong> are<br />
needed. Global commitments <strong>on</strong> food security, nutriti<strong>on</strong><br />
<strong>and</strong> sustainable agriculture are part of a wider internati<strong>on</strong>al<br />
agenda that will help address the critical issues raised in<br />
this report.<br />
Ann M. Veneman<br />
Executive Director, UNICEF<br />
Foreword<br />
3
GLOSSARY OF TERMS USED IN THIS REPORT<br />
# Breastmilk substitute: any food being marketed or otherwise represented as a partial or total replacement for breastmilk,<br />
whether or not it is suitable for that purpose.<br />
# Complementary feeding: the process starting when breastmilk al<strong>on</strong>e or infant formula al<strong>on</strong>e is no l<strong>on</strong>ger suffi cient to<br />
meet the nutriti<strong>on</strong>al requirements of an infant, <strong>and</strong> therefore other foods <strong>and</strong> liquids are needed al<strong>on</strong>g with breastmilk<br />
or a breastmilk substitute. The target range for complementary feeding is generally c<strong>on</strong>sidered to be 6–23 m<strong>on</strong>ths.<br />
# Exclusive breastfeeding: infant receives <strong>on</strong>ly breastmilk (including breastmilk that has been expressed or from a wet nurse)<br />
<strong>and</strong> nothing else, even water or tea. Medicines, oral rehydrati<strong>on</strong> soluti<strong>on</strong>, vitamins <strong>and</strong> minerals, as recommended by health<br />
providers, are allowed during exclusive breastfeeding.<br />
# Low birthweight: an infant weighing less than 2,500 grams at birth.<br />
# Malnutriti<strong>on</strong>: a broad term comm<strong>on</strong>ly used as an alternative to undernutriti<strong>on</strong>, but technically it also refers to overnutriti<strong>on</strong>.<br />
People are malnourished if their diet does not provide adequate nutrients for growth <strong>and</strong> maintenance or they are unable to<br />
fully utilize the food they eat due to illness (undernutriti<strong>on</strong>). They are also malnourished if they c<strong>on</strong>sume too many calories<br />
(overnutriti<strong>on</strong>).<br />
# Micr<strong>on</strong>utrients: essential vitamins <strong>and</strong> minerals required by the body throughout the lifecycle in miniscule amounts.<br />
# Micr<strong>on</strong>utrient defi ciency: occurs when the body does not have suffi cient amounts of a vitamin or mineral due to insuffi cient<br />
dietary intake <strong>and</strong>/or insuffi cient absorpti<strong>on</strong> <strong>and</strong>/or suboptimal utilizati<strong>on</strong> of the vitamin or mineral.<br />
# Moderate acute malnutriti<strong>on</strong>: defi ned as weight for height between minus two <strong>and</strong> minus three st<strong>and</strong>ard deviati<strong>on</strong>s from<br />
the median weight for height of the st<strong>and</strong>ard reference populati<strong>on</strong>.<br />
# Overweight: defi ned as weight for height above two st<strong>and</strong>ard deviati<strong>on</strong>s from the median weight for height of the st<strong>and</strong>ard<br />
reference populati<strong>on</strong>.<br />
# Stunting: defi ned as height for age below minus two st<strong>and</strong>ard deviati<strong>on</strong>s from the median height for age of the st<strong>and</strong>ard<br />
reference populati<strong>on</strong>.<br />
# Severe acute malnutriti<strong>on</strong>: defi ned as weight for height below minus three st<strong>and</strong>ard deviati<strong>on</strong>s from the median weight for<br />
height of the st<strong>and</strong>ard reference populati<strong>on</strong>, mid-upper arm circumference (MUAC) less than 115 mm, visible severe thinness,<br />
or the presence of nutriti<strong>on</strong>al oedema.<br />
# Supplementary feeding: additi<strong>on</strong>al foods provided to vulnerable groups, including moderately malnourished children.<br />
# Undernutriti<strong>on</strong>: the outcome of insuffi cient food intake, inadequate care <strong>and</strong> infectious diseases. It includes being<br />
underweight for <strong>on</strong>e’s age, too short for <strong>on</strong>e’s age (stunting), dangerously thin for <strong>on</strong>e’s height (wasting) <strong>and</strong> defi cient<br />
in vitamins <strong>and</strong> minerals (micr<strong>on</strong>utrient defi ciencies).<br />
# Underweight: a composite form of undernutriti<strong>on</strong> that includes elements of stunting <strong>and</strong> wasting <strong>and</strong> is defi ned as weight<br />
for age below minus two st<strong>and</strong>ard deviati<strong>on</strong>s from the median weight for age of the st<strong>and</strong>ard reference populati<strong>on</strong>.<br />
# Wasting: defi ned as weight for height below minus two st<strong>and</strong>ard deviati<strong>on</strong>s from the median weight for height of the<br />
st<strong>and</strong>ard reference populati<strong>on</strong>. A child can be moderately wasted (between minus two <strong>and</strong> minus three st<strong>and</strong>ard deviati<strong>on</strong>s<br />
from the median weight for height) or severely wasted (below minus three st<strong>and</strong>ard deviati<strong>on</strong>s from the median<br />
weight for height).<br />
4 <str<strong>on</strong>g>Tracking</str<strong>on</strong>g> <str<strong>on</strong>g>Progress</str<strong>on</strong>g> <strong>on</strong> <strong>Child</strong> <strong>and</strong> <strong>Maternal</strong> Nutriti<strong>on</strong>
INTRODUCTION<br />
The fi rst Millennium Development Goal calls for the<br />
eradicati<strong>on</strong> of extreme poverty <strong>and</strong> hunger, <strong>and</strong> its achievement<br />
is crucial for nati<strong>on</strong>al progress <strong>and</strong> development.<br />
Failing to achieve this goal jeopardizes the achievement of<br />
other MDGs, including goals to achieve universal primary<br />
educati<strong>on</strong> (MDG 2), reduce child mortality (MDG 4) <strong>and</strong><br />
improve maternal health (MDG 5).<br />
One of the indicators used to assess progress towards<br />
MDG 1 is the prevalence of children under 5 years old who<br />
are underweight, or whose weight is less than it should be<br />
for their age. To have adequate <strong>and</strong> regular weight gain,<br />
children need enough good-quality food, they need to stay<br />
healthy <strong>and</strong> they need suffi cient care from their families<br />
<strong>and</strong> communities.<br />
To a great extent, achieving the MDG target <strong>on</strong> underweight<br />
depends <strong>on</strong> the effective implementati<strong>on</strong> of large-scale<br />
nutriti<strong>on</strong> <strong>and</strong> health programmes that will provide appropriate<br />
food, health <strong>and</strong> care for all children in a country.<br />
Since the MDGs were adopted in 2000, knowledge of<br />
the causes <strong>and</strong> c<strong>on</strong>sequences of undernutriti<strong>on</strong> has<br />
greatly improved.<br />
Recent evidence makes it clear that in children under 5 years<br />
of age, the period of greatest vulnerability to nutriti<strong>on</strong>al<br />
defi ciencies is very early in life: the period beginning with<br />
the woman’s pregnancy <strong>and</strong> c<strong>on</strong>tinuing until the child is<br />
2 years old. During this period, nutriti<strong>on</strong>al defi ciencies have<br />
a signifi cant adverse impact <strong>on</strong> child survival <strong>and</strong> growth.<br />
Chr<strong>on</strong>ic undernutriti<strong>on</strong> in early childhood also results in<br />
diminished cognitive <strong>and</strong> physical development, which puts<br />
children at a disadvantage for the rest of their lives. They<br />
may perform poorly in school, <strong>and</strong> as adults they may be<br />
less productive, earn less <strong>and</strong> face a higher risk of disease<br />
than adults who were not undernourished as children.<br />
For girls, chr<strong>on</strong>ic undernutriti<strong>on</strong> in early life, either before<br />
birth or during early childhood, can later lead to their<br />
babies being born with low birthweight, which can lead<br />
again to under nutriti<strong>on</strong> as these babies grow older. Thus<br />
a vicious cycle of undernutriti<strong>on</strong> repeats itself, generati<strong>on</strong><br />
after generati<strong>on</strong>.<br />
Where undernutriti<strong>on</strong> is widespread, these negative<br />
c<strong>on</strong>sequences for individuals translate into negative<br />
c<strong>on</strong>sequences for countries. Knowing whether children are at<br />
risk of nutriti<strong>on</strong>al defi ciencies, <strong>and</strong> taking appropriate acti<strong>on</strong>s<br />
to prevent <strong>and</strong> treat such defi ciencies, is therefore imperative.<br />
Whether a child has experienced chr<strong>on</strong>ic nutriti<strong>on</strong>al<br />
defi ciencies <strong>and</strong> frequent bouts of illness in early life is<br />
best indicated by the infant’s growth in length <strong>and</strong> the<br />
child’s growth in height. Day-to-day nutriti<strong>on</strong>al defi ciencies<br />
over a period of time lead to diminished, or stunted,<br />
growth. Once children are stunted, it is diffi cult for them<br />
to catch up in height later <strong>on</strong>, especially if they are living<br />
in c<strong>on</strong>diti<strong>on</strong>s that prevail in many developing countries.<br />
Whereas a defi cit in height (stunting) is diffi cult to correct, a<br />
defi cit in weight (underweight) can be recouped if nutriti<strong>on</strong><br />
<strong>and</strong> health improve later in childhood. The weight of a child<br />
at 4–5 years old, when it is adequate for the child’s age,<br />
can therefore mask defi ciencies that occurred during<br />
pregnancy or infancy, <strong>and</strong> growth <strong>and</strong> development that<br />
have been compromised.<br />
The global burden of stunting is far greater than the burden<br />
of underweight. This report, which is based <strong>on</strong> the latest<br />
available data, shows that in the developing world the<br />
number of children under 5 years old who are stunted is<br />
close to 200 milli<strong>on</strong>, while the number of children under 5<br />
who are underweight is about 130 milli<strong>on</strong>. Indeed, many<br />
countries have much higher rates of stunting prevalence<br />
am<strong>on</strong>g children compared with underweight prevalence.<br />
Governments, d<strong>on</strong>ors <strong>and</strong> partners that c<strong>on</strong>sider <strong>on</strong>ly<br />
underweight prevalence are overlooking a signifi cant<br />
porti<strong>on</strong> of the persistent problem of undernutriti<strong>on</strong>. The<br />
high stunting burden in many countries should be an<br />
issue of great c<strong>on</strong>cern, as pointed out in this report.<br />
Today, there is a much better underst<strong>and</strong>ing of the<br />
programme strategies <strong>and</strong> approaches to improve nutriti<strong>on</strong>,<br />
based <strong>on</strong> sound evidence <strong>and</strong> improved health <strong>and</strong> nutriti<strong>on</strong><br />
data. This report draws <strong>on</strong> these sources in order to<br />
identify key factors for the effective implementati<strong>on</strong> of<br />
programmes to improve maternal nutriti<strong>on</strong>, breastfeeding,<br />
complementary feeding, <strong>and</strong> vitamin <strong>and</strong> mineral intake<br />
for infants <strong>and</strong> young children. The report also provides<br />
informati<strong>on</strong> that dem<strong>on</strong>strates that improving child nutriti<strong>on</strong><br />
is entirely feasible.<br />
Introducti<strong>on</strong><br />
5
It describes, for example, how cost-effective nutriti<strong>on</strong><br />
interventi<strong>on</strong>s such as vitamin A supplementati<strong>on</strong> reach the<br />
vast majority of children even in the least developed countries;<br />
that great progress has been made to improve infant<br />
feeding in many African countries; <strong>and</strong> that the treatment of<br />
severe acute malnutriti<strong>on</strong> has exp<strong>and</strong>ed rapidly.<br />
The large burden of undernutriti<strong>on</strong>, <strong>and</strong> its infl uence <strong>on</strong><br />
poverty reducti<strong>on</strong> as well as the achievement of many of<br />
the MDGs, itself c<strong>on</strong>stitutes a call for acti<strong>on</strong>. The fact that<br />
even more children may become undernourished in some<br />
countries due to such recent events as the rapid increase<br />
in food prices <strong>and</strong> the fi nancial crisis brings acute focus to<br />
the issue.<br />
Given what is now known about the serious, l<strong>on</strong>g-lasting<br />
impact of undernutriti<strong>on</strong>, as well as about experiences of<br />
effective <strong>and</strong> innovative programme approaches to promoting<br />
good nutriti<strong>on</strong>, this report is particularly timely. Its<br />
value lies in that it argues for nutriti<strong>on</strong> as a core pillar of<br />
human development <strong>and</strong> in that it documents how c<strong>on</strong>crete,<br />
large-scale programming not <strong>on</strong>ly can reduce the<br />
burden of undernutriti<strong>on</strong> <strong>and</strong> deprivati<strong>on</strong> in countries but<br />
also can advance the progress of nati<strong>on</strong>s.<br />
6 <str<strong>on</strong>g>Tracking</str<strong>on</strong>g> <str<strong>on</strong>g>Progress</str<strong>on</strong>g> <strong>on</strong> <strong>Child</strong> <strong>and</strong> <strong>Maternal</strong> Nutriti<strong>on</strong>
KEY MESSAGES<br />
Overview<br />
Undernutriti<strong>on</strong> jeopardizes children’s survival, health, growth <strong>and</strong> development, <strong>and</strong> it slows nati<strong>on</strong>al<br />
progress towards development goals. Undernutriti<strong>on</strong> is often an invisible problem.<br />
A child’s future nutriti<strong>on</strong> status is affected before c<strong>on</strong>cepti<strong>on</strong> <strong>and</strong> is greatly dependent <strong>on</strong> the mother’s<br />
nutriti<strong>on</strong> status prior to <strong>and</strong> during pregnancy. A chr<strong>on</strong>ically undernourished woman will give birth to a<br />
baby who is likely to be undernourished as a child, causing the cycle of undernutriti<strong>on</strong> to be repeated<br />
over generati<strong>on</strong>s.<br />
<strong>Child</strong>ren with ir<strong>on</strong> <strong>and</strong> iodine defi ciencies do not perform as well in school as their well-nourished peers,<br />
<strong>and</strong> when they grow up they may be less productive than other adults.<br />
Stunting refl ects chr<strong>on</strong>ic nutriti<strong>on</strong>al defi ciency, aggravated by illness. Compared to other forms of<br />
undernutriti<strong>on</strong>, it is a problem of larger proporti<strong>on</strong>s:<br />
• Am<strong>on</strong>g children under 5 years old in the developing world, an estimated <strong>on</strong>e third – 195 milli<strong>on</strong> children –<br />
are stunted, whereas 129 milli<strong>on</strong> are underweight.<br />
• Twenty-four countries bear 80 per cent of the developing world burden of undernutriti<strong>on</strong> as measured<br />
by stunting.<br />
• In Africa <strong>and</strong> Asia, stunting rates are particularly high, at 40 per cent <strong>and</strong> 36 per cent respectively.<br />
More than 90 per cent of the developing world’s stunted children live in Africa <strong>and</strong> Asia.<br />
<str<strong>on</strong>g>Progress</str<strong>on</strong>g> for children lies at the heart of all Millennium Development Goals (MDGs). Al<strong>on</strong>g with cognitive<br />
<strong>and</strong> physical development, proper nutriti<strong>on</strong> c<strong>on</strong>tributes signifi cantly to declines in under-fi ve mortality<br />
rates, reducti<strong>on</strong>s of disease <strong>and</strong> poverty, improvements in maternal health <strong>and</strong> gender equality – thus,<br />
it is essential for achieving most of the MDGs.<br />
Programme evidence<br />
There is a critical window of opportunity to prevent undernutriti<strong>on</strong> – while a mother is pregnant <strong>and</strong> during a<br />
child’s fi rst two years of life – when proven nutriti<strong>on</strong> interventi<strong>on</strong>s offer children the best chance to survive <strong>and</strong><br />
reach optimal growth <strong>and</strong> development.<br />
Marked reducti<strong>on</strong>s in child undernutriti<strong>on</strong> can be achieved through improvements in women’s nutriti<strong>on</strong><br />
before <strong>and</strong> during pregnancy, early <strong>and</strong> exclusive breastfeeding, <strong>and</strong> good-quality complementary feeding<br />
for infants <strong>and</strong> young children, with appropriate micr<strong>on</strong>utrient interventi<strong>on</strong>s.<br />
Large-scale programmes – including the promoti<strong>on</strong>, protecti<strong>on</strong> <strong>and</strong> support of exclusive breastfeeding, providing<br />
vitamins <strong>and</strong> minerals through fortifi ed foods <strong>and</strong> supplements, <strong>and</strong> community-based treatment of severe<br />
acute malnutriti<strong>on</strong> – have been successful in many countries. Where such programming does not yet exist,<br />
this experience can guide implementati<strong>on</strong> at scale.<br />
Unsafe water, inadequate sanitati<strong>on</strong> <strong>and</strong> poor hygiene increase the risk of diarrhoea <strong>and</strong> other illnesses that<br />
deplete children of vital nutrients <strong>and</strong> can lead to chr<strong>on</strong>ic undernutriti<strong>on</strong> <strong>and</strong> increase the risk of death.<br />
Improving child <strong>and</strong> maternal nutriti<strong>on</strong> is not <strong>on</strong>ly entirely feasible but also affordable <strong>and</strong> cost-effective.<br />
Nutriti<strong>on</strong> interventi<strong>on</strong>s are am<strong>on</strong>g the best investments in development that countries can undertake.<br />
Key Messages<br />
7
8 <str<strong>on</strong>g>Tracking</str<strong>on</strong>g> <str<strong>on</strong>g>Progress</str<strong>on</strong>g> <strong>on</strong> <strong>Child</strong> <strong>and</strong> <strong>Maternal</strong> Nutriti<strong>on</strong>
OVERVIEW
1. THE CHALLENGE OF<br />
UNDERNUTRITION<br />
The level of child <strong>and</strong> maternal undernutriti<strong>on</strong> remains<br />
unacceptable throughout the world, with 90 per cent of the<br />
developing world’s chr<strong>on</strong>ically undernourished (stunted)<br />
children living in Asia <strong>and</strong> Africa. Detrimental <strong>and</strong> often<br />
undetected until severe, undernutriti<strong>on</strong> undermines the<br />
survival, growth <strong>and</strong> development of children <strong>and</strong> women,<br />
<strong>and</strong> it diminishes the strength <strong>and</strong> capacity of nati<strong>on</strong>s.<br />
Brought about by a combined lack of quality food, frequent<br />
attacks of infectious disease <strong>and</strong> defi cient care, undernutriti<strong>on</strong><br />
c<strong>on</strong>tinues to be widely prevalent in both developing<br />
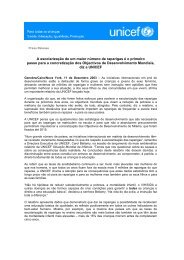
80 per cent of the developing world’s stunted children live in 24 countries<br />
Ranking Country<br />
Stunting<br />
prevalence<br />
(%)<br />
10 <str<strong>on</strong>g>Tracking</str<strong>on</strong>g> <str<strong>on</strong>g>Progress</str<strong>on</strong>g> <strong>on</strong> <strong>Child</strong> <strong>and</strong> <strong>Maternal</strong> Nutriti<strong>on</strong><br />
<strong>and</strong> industrialized countries, to different degrees <strong>and</strong> in<br />
different forms. Nutriti<strong>on</strong>al defi ciencies are particularly<br />
harmful while a woman is pregnant <strong>and</strong> during a child’s<br />
fi rst two years of life. During this period, they pose a<br />
signifi cant threat to mothers <strong>and</strong> to children’s survival,<br />
growth <strong>and</strong> development, which in turn negatively affects<br />
children’s ability to learn in school, <strong>and</strong> to work <strong>and</strong> prosper<br />
as adults.<br />
Undernutriti<strong>on</strong> greatly impedes countries’ socio-ec<strong>on</strong>omic<br />
development <strong>and</strong> potential to reduce poverty. Many of the<br />
Millennium Development Goals (MDGs) – particularly<br />
MDG 1 (eradicate extreme poverty <strong>and</strong> hunger), MDG 4<br />
(reduce child mortality) <strong>and</strong> MDG 5 (improve maternal<br />
health) – will not be reached unless the nutriti<strong>on</strong> of<br />
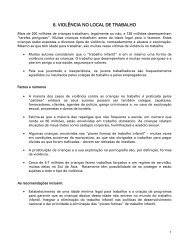
24 countries with the largest numbers of children under 5 years old who are moderately or severely stunted<br />
Number of children who are stunted<br />
(thous<strong>and</strong>s, 2008)<br />
Percentage<br />
of developing world total<br />
(195.1 milli<strong>on</strong>)<br />
1 India 48 60,788<br />
31.2%<br />
2 China 15 12,685<br />
6.5%<br />
3 Nigeria 41 10,158<br />
5.2%<br />
4 Pakistan 42 9,868<br />
5.1%<br />
5 Ind<strong>on</strong>esia 37 7,688<br />
3.9%<br />
6 Bangladesh 43 7,219<br />
3.7%<br />
7 Ethiopia 51 6,768<br />
3.5%<br />
8 Democratic Republic of the C<strong>on</strong>go 46 5,382<br />
2.8%<br />
9 Philippines 34 3,617<br />
1.9%<br />
10 United Republic of Tanzania 44 3,359<br />
1.7%<br />
11 Afghanistan 59 2,910<br />
1.5%<br />
12 Egypt 29 2,730<br />
1.4%<br />
13 Viet Nam 36 2,619<br />
1.3%<br />
14 Ug<strong>and</strong>a 38 2,355<br />
1.2%<br />
15 Sudan 40 2,305<br />
1.2%<br />
16 Kenya 35 2,269<br />
1.2%<br />
17 Yemen 58 2,154<br />
1.1%<br />
18 Myanmar 41 1,880<br />
1.0%<br />
19 Nepal 49 1,743<br />
About this report<br />
This report offers a rati<strong>on</strong>ale for urgently scaling up effective interventi<strong>on</strong>s to reduce the global burden of child <strong>and</strong> maternal<br />
undernutriti<strong>on</strong>. It provides informati<strong>on</strong> <strong>on</strong> nutriti<strong>on</strong> strategies <strong>and</strong> progress made by programmes, based <strong>on</strong> the most recent<br />
data available. The success stories <strong>and</strong> less<strong>on</strong>s learned that are described in these pages dem<strong>on</strong>strate that reducing undernutriti<strong>on</strong><br />
is entirely feasible. The report presents detailed, up-to-date informati<strong>on</strong> <strong>on</strong> nutriti<strong>on</strong>al status, programme implementati<strong>on</strong><br />
<strong>and</strong> related indicators for the 24 countries where 80 per cent of the world’s stunted children live (page 43). While this report is a<br />
call to acti<strong>on</strong> for these 24 high-burden countries, it also highlights the need for accelerated efforts to reduce undernutriti<strong>on</strong> in<br />
all countries.<br />
women <strong>and</strong> children is prioritized in nati<strong>on</strong>al development<br />
programmes <strong>and</strong> strategies. With persistently high levels<br />
of undernutriti<strong>on</strong> in the developing world, vital opportunities<br />
to save milli<strong>on</strong>s of lives are being lost, <strong>and</strong> many more<br />
children are not growing <strong>and</strong> thriving to their full potential.<br />
In terms of numbers, the bulk of the world’s undernutriti<strong>on</strong><br />
problem is localized. Twenty-four countries account for more<br />
than 80 per cent of the global burden of chr<strong>on</strong>ic undernutriti<strong>on</strong>,<br />
as measured by stunting (low height for age). Although<br />
India does not have the highest prevalence of stunted<br />
children, due to its large populati<strong>on</strong> it has the greatest<br />
number of stunted children.<br />
Stunting remains a problem of greater magnitude than<br />
underweight or wasting, <strong>and</strong> it more accurately refl ects<br />
nutriti<strong>on</strong>al defi ciencies <strong>and</strong> illness that occur during the<br />
most critical periods for growth <strong>and</strong> development in early<br />
life. Most countries have stunting rates that are much<br />
higher than their underweight rates, <strong>and</strong> in some countries,<br />
more than half of children under 5 years old are stunted.<br />
Nutriti<strong>on</strong> remains a low priority <strong>on</strong> the nati<strong>on</strong>al development<br />
agendas of many countries, despite clear evidence of the<br />
c<strong>on</strong>sequences of nutriti<strong>on</strong>al deprivati<strong>on</strong> in the short <strong>and</strong><br />
l<strong>on</strong>g term. The reas<strong>on</strong>s are multiple.<br />
Nutriti<strong>on</strong> problems are often unnoticed until they reach<br />
a severe level. But mild <strong>and</strong> moderate undernutriti<strong>on</strong> are<br />
highly prevalent <strong>and</strong> carry c<strong>on</strong>sequences of enormous<br />
magnitude: growth impediment, impaired learning ability<br />
<strong>and</strong>, later in life, low work productivity. N<strong>on</strong>e of these<br />
c<strong>on</strong>diti<strong>on</strong>s is as visible as the diseases from which the<br />
undernourished child dies. <strong>Child</strong>ren may appear to be<br />
healthy even when they face grave risks associated with<br />
undernutriti<strong>on</strong>. Not recognizing the urgency, policymakers<br />
may not underst<strong>and</strong> how improved nutriti<strong>on</strong> relates to<br />
nati<strong>on</strong>al ec<strong>on</strong>omic <strong>and</strong> social goals.<br />
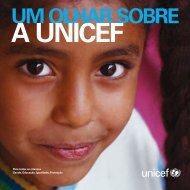
18 countries with the highest prevalence<br />
of stunting<br />
Prevalence of moderate <strong>and</strong> severe stunting am<strong>on</strong>g<br />
children under 5 years old, in 18 countries where the<br />
prevalence rate is 45 per cent or more<br />
Country<br />
Prevalence of stunting<br />
(moderate <strong>and</strong> severe)<br />
(%)<br />
Afghanistan 59<br />
Yemen 58<br />
Guatemala 54<br />
Timor-Leste 54<br />
Burundi 53<br />
Madagascar 53<br />
Malawi 53<br />
Ethiopia 51<br />
Rw<strong>and</strong>a 51<br />
Nepal 49<br />
Bhutan 48<br />
India 48<br />
Lao People’s Democratic Republic 48<br />
Guinea-Bissau 47<br />
Niger 47<br />
Democratic Republic of the C<strong>on</strong>go 46<br />
Democratic People’s Republic of Korea 45<br />
Zambia 45<br />
Note: Estimates are calculated according to the WHO <strong>Child</strong> Growth St<strong>and</strong>ards,<br />
except in cases where data are <strong>on</strong>ly available according to the previously used<br />
NCHS/WHO reference populati<strong>on</strong>; please refer to data notes <strong>on</strong> page 116 for more<br />
informati<strong>on</strong>. Estimates are based <strong>on</strong> data collecti<strong>on</strong> in 2003 or later, with the<br />
excepti<strong>on</strong> of Guatemala (2002) <strong>and</strong> Bhutan (1999).<br />
Source: MICS, DHS <strong>and</strong> other nati<strong>on</strong>al surveys, 2003–2008.<br />
Overview 11
In many countries, nutriti<strong>on</strong> has no clear instituti<strong>on</strong>al home;<br />
it is often addressed in part by various ministries or departments,<br />
an arrangement that can hinder effective planning<br />
<strong>and</strong> management of programmes.<br />
In some of the countries with the highest levels of<br />
undernutriti<strong>on</strong>, governments are faced with multiple<br />
challenges – poverty, ec<strong>on</strong>omic crisis, c<strong>on</strong>fl ict, disaster,<br />
inequity – all of them urgent, <strong>and</strong> all of them competing<br />
for attenti<strong>on</strong>. Undernutriti<strong>on</strong> often does not feature prominently<br />
am<strong>on</strong>g these problems, unless it becomes very<br />
severe <strong>and</strong> widespread.<br />
Some leaders may not c<strong>on</strong>sider nutriti<strong>on</strong> to be politically<br />
expedient because it requires investment over the l<strong>on</strong>g<br />
term <strong>and</strong> the results are not always immediately visible.<br />
Furthermore, the interests of d<strong>on</strong>or agencies – with<br />
limited budgetary allocati<strong>on</strong>s for aid in general – are<br />
often focused elsewhere.<br />
In the past, nutriti<strong>on</strong> strategies were not always effective<br />
<strong>and</strong> comprehensive, programmes were insuffi cient in scale<br />
<strong>and</strong> human resources were woefully inadequate, partly due<br />
to insuffi cient coordinati<strong>on</strong> <strong>and</strong> collaborati<strong>on</strong> between<br />
internati<strong>on</strong>al instituti<strong>on</strong>s <strong>and</strong> agencies working in nutriti<strong>on</strong>.<br />
But cost-effective programming strategies <strong>and</strong> interventi<strong>on</strong>s<br />
that can make a signifi cant difference in the health<br />
<strong>and</strong> lives of children <strong>and</strong> women are available today. These<br />
interventi<strong>on</strong>s urgently require scaling up, a task that will<br />
entail the collective planning <strong>and</strong> resources of developing<br />
country governments at all levels <strong>and</strong> of the internati<strong>on</strong>al<br />
development community as a whole.<br />
Undernutriti<strong>on</strong> can be greatly reduced through the delivery<br />
of simple interventi<strong>on</strong>s at key stages of the life cycle – for<br />
the mother, before she becomes pregnant, during pregnancy<br />
<strong>and</strong> while breastfeeding; for the child, in infancy <strong>and</strong><br />
early childhood. Effectively scaled up, these interventi<strong>on</strong>s<br />
will improve maternal nutriti<strong>on</strong>, increase the proporti<strong>on</strong><br />
of infants who are exclusively breastfed up to 6 m<strong>on</strong>ths<br />
of age, improve c<strong>on</strong>tinued breastfeeding rates, enhance<br />
complementary feeding <strong>and</strong> micr<strong>on</strong>utrient intake of<br />
children between 6 <strong>and</strong> 24 m<strong>on</strong>ths old, <strong>and</strong> reduce the<br />
severity of infectious diseases <strong>and</strong> child mortality.<br />
Undernutriti<strong>on</strong> is a violati<strong>on</strong> of child rights. The C<strong>on</strong>venti<strong>on</strong><br />
<strong>on</strong> the Rights of the <strong>Child</strong> emphasizes children’s right to the<br />
highest attainable st<strong>and</strong>ard of health <strong>and</strong> places<br />
12 <str<strong>on</strong>g>Tracking</str<strong>on</strong>g> <str<strong>on</strong>g>Progress</str<strong>on</strong>g> <strong>on</strong> <strong>Child</strong> <strong>and</strong> <strong>Maternal</strong> Nutriti<strong>on</strong><br />
resp<strong>on</strong>sibility <strong>on</strong> the State to combat malnutriti<strong>on</strong>. It also<br />
requires that nutritious food is provided to children <strong>and</strong> that<br />
all segments of society are supported in the use of basic<br />
knowledge of child nutriti<strong>on</strong> (article 24). Nutriti<strong>on</strong> must be<br />
placed high <strong>on</strong> nati<strong>on</strong>al <strong>and</strong> internati<strong>on</strong>al agendas if this<br />
right is to be fulfi lled.<br />
2. THE IMPORTANCE<br />
OF NUTRITION<br />
C<strong>on</strong>sequences of undernutriti<strong>on</strong> <strong>and</strong><br />
the impact of nutriti<strong>on</strong> interventi<strong>on</strong>s<br />
<strong>on</strong> child survival<br />
<strong>Child</strong>ren who are undernourished, not optimally breastfed<br />
or suffering from micr<strong>on</strong>utrient defi ciencies have substantially<br />
lower chances of survival than children who are well<br />
nourished. They are much more likely to suffer from a<br />
serious infecti<strong>on</strong> <strong>and</strong> to die from comm<strong>on</strong> childhood<br />
illnesses such as diarrhoea, measles, pneum<strong>on</strong>ia <strong>and</strong><br />
malaria, as well as HIV <strong>and</strong> AIDS. 1<br />
According to the most recent estimates, maternal <strong>and</strong><br />
child undernutriti<strong>on</strong> c<strong>on</strong>tributes to more than <strong>on</strong>e third of<br />
child deaths. 2 Undernourished children who survive may<br />
become locked in a cycle of recurring illness <strong>and</strong> faltering<br />
growth, with irreversible damage to their development <strong>and</strong><br />
cognitive abilities. 3<br />
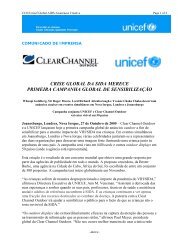
Causes of mortality in children<br />
under 5 years old (2004)<br />
Other<br />
13%<br />
HIV/AIDS<br />
2%<br />
Injuries<br />
4%<br />
Measles<br />
4%<br />
Malaria<br />
7%<br />
Diarrhoea<br />
16%<br />
Globally,<br />
undernutriti<strong>on</strong><br />
c<strong>on</strong>tributes to more<br />
than <strong>on</strong>e third of<br />
child deaths<br />
Source: World Health Organizati<strong>on</strong>, 2008.<br />
Ne<strong>on</strong>atal<br />
37%<br />
Acute respiratory<br />
infecti<strong>on</strong>s<br />
17%
Every level of undernutriti<strong>on</strong> increases the risk of a child’s<br />
dying. While children suffering from severe acute malnutriti<strong>on</strong><br />
are more than nine times more likely to die than children<br />
who are not undernourished, 4 a large number of deaths<br />
also occurs am<strong>on</strong>g moderately <strong>and</strong> mildly undernourished<br />
children who may otherwise appear healthy. Compared to<br />
children who are severely undernourished, children who<br />
are moderately or mildly undernourished have a lower risk<br />
of dying, but there are many more of the latter. 5<br />
Manifestati<strong>on</strong>s of<br />
inadequate nutriti<strong>on</strong><br />
Undernutriti<strong>on</strong> in children can manifest itself in several<br />
ways, <strong>and</strong> it is most comm<strong>on</strong>ly assessed through the<br />
measurement of weight <strong>and</strong> height. A child can be too<br />
short for his or her age (stunted), have low weight for<br />
his or her height (wasted), or have low weight for his or<br />
her age (underweight). A child who is underweight can<br />
also be stunted or wasted or both.<br />
Each of these indicators captures a certain aspect of<br />
the problem. Weight is known to be a sensitive indicator<br />
of acute defi ciencies, whereas height captures more<br />
chr<strong>on</strong>ic exposure to defi ciencies <strong>and</strong> infecti<strong>on</strong>s. Wasting<br />
is used as a way to identify severe acute malnutriti<strong>on</strong>.<br />
Inadequate nutriti<strong>on</strong> may also manifest itself in overweight<br />
<strong>and</strong> obesity, comm<strong>on</strong>ly assessed through the body<br />
mass index.<br />
Micr<strong>on</strong>utrient malnutriti<strong>on</strong>, caused by defi ciencies in<br />
vitamins <strong>and</strong> minerals, can manifest itself through such<br />
c<strong>on</strong>diti<strong>on</strong>s as fatigue, pallor associated with anaemia<br />
(ir<strong>on</strong> defi ciency), reduced learning ability (mainly ir<strong>on</strong><br />
<strong>and</strong> iodine defi ciency), goitre (iodine defi ciency),<br />
reduced immunity, <strong>and</strong> night blindness (severe<br />
vitamin A defi ciency).<br />
Low birthweight is related to maternal undernutriti<strong>on</strong>;<br />
it c<strong>on</strong>tributes to infecti<strong>on</strong>s <strong>and</strong> asphyxia, which together<br />
account for 60 per cent of ne<strong>on</strong>atal deaths. An infant born<br />
weighing between 1,500 <strong>and</strong> 2,000 grams is eight times<br />
more likely to die than an infant born with an adequate<br />
weight of at least 2,500 grams. Low birthweight causes<br />
an estimated 3.3 per cent of overall child deaths. 6<br />
Thus, the achievement of Millennium Development<br />
Goal 4 – to reduce the under-fi ve mortality rate by two<br />
thirds between 1990 <strong>and</strong> 2015 – will not be possible<br />
without urgent, accelerated <strong>and</strong> c<strong>on</strong>certed acti<strong>on</strong> to<br />
improve maternal <strong>and</strong> child nutriti<strong>on</strong>.<br />
Food <strong>and</strong> nutriti<strong>on</strong><br />
Undernutriti<strong>on</strong> is not just about the lack of food. An<br />
individual’s nutriti<strong>on</strong>al status is infl uenced by three<br />
broad categories of factors – food, care <strong>and</strong> health – <strong>and</strong><br />
adequate nutriti<strong>on</strong> requires the presence of all three.<br />
Poor infant <strong>and</strong> young child feeding <strong>and</strong> care, al<strong>on</strong>g with<br />
illnesses such as diarrhoea, pneum<strong>on</strong>ia, malaria, <strong>and</strong> HIV<br />
<strong>and</strong> AIDS, often exacerbated by intestinal parasites, are<br />
immediate causes of undernutriti<strong>on</strong>. Underlying <strong>and</strong><br />
more basic causes include poverty, illiteracy, social<br />
norms <strong>and</strong> behaviour.<br />
<strong>Maternal</strong> nutriti<strong>on</strong> <strong>and</strong> health greatly infl uence child<br />
nutriti<strong>on</strong>al status. A woman’s low weight for height or<br />
anaemia during pregnancy can lead to low birthweight<br />
<strong>and</strong> c<strong>on</strong>tinued undernutriti<strong>on</strong> in her children. At the same<br />
time, maternal undernutriti<strong>on</strong> increases the risk of<br />
maternal death during childbirth.<br />
Household food security, often infl uenced by such<br />
factors as poverty, drought <strong>and</strong> other emergencies, has<br />
an important role in determining the state of child <strong>and</strong><br />
maternal nutriti<strong>on</strong> in many countries.<br />
Optimal infant <strong>and</strong> young child feeding – initiati<strong>on</strong> of<br />
breastfeeding within <strong>on</strong>e hour of birth, exclusive breastfeeding<br />
for the fi rst six m<strong>on</strong>ths of the child’s life <strong>and</strong><br />
c<strong>on</strong>tinued breastfeeding until the child is at least 2 years<br />
old, together with age-appropriate, nutriti<strong>on</strong>ally adequate<br />
<strong>and</strong> safe complementary foods – can have a major impact<br />
<strong>on</strong> child survival, with the potential to prevent an estimated<br />
19 per cent of all under-5 deaths in the developing world,<br />
more than any other preventive interventi<strong>on</strong>. 7 In the<br />
c<strong>on</strong>diti<strong>on</strong>s that normally exist in developing countries,<br />
breastfed children are at least 6 times more likely to survive<br />
in the early m<strong>on</strong>ths than n<strong>on</strong>-breastfed children; in the fi rst<br />
six m<strong>on</strong>ths of life they are 6 times less likely to die from<br />
diarrhoea <strong>and</strong> 2.4 times less likely to die from acute<br />
respiratory infecti<strong>on</strong>. 8<br />
Vitamin A is critical for the body’s immune system; supplementati<strong>on</strong><br />
of this micr<strong>on</strong>utrient can reduce the risk of child<br />
mortality from all causes by about 23 per cent. The provisi<strong>on</strong><br />
of high-dose vitamin A supplements twice a year to<br />
all children 6–59 m<strong>on</strong>ths old in countries with high child<br />
mortality rates is <strong>on</strong>e of the most cost-effective interventi<strong>on</strong>s.<br />
9 Zinc supplementati<strong>on</strong> can reduce the prevalence of<br />
diarrhoea in children by 27 per cent because it shortens the<br />
durati<strong>on</strong> <strong>and</strong> reduces the severity of a diarrhoea episode. 10<br />
Overview 13
C<strong>on</strong>sequences of undernutriti<strong>on</strong> <strong>and</strong><br />
the impact of nutriti<strong>on</strong> interventi<strong>on</strong>s<br />
<strong>on</strong> development, school performance<br />
<strong>and</strong> income<br />
The period of children’s most rapid physical growth <strong>and</strong><br />
development is also the period of their greatest vulnerability.<br />
Signifi cant brain formati<strong>on</strong> <strong>and</strong> development takes<br />
place beginning from the time the child is in the womb.<br />
Adequate nutriti<strong>on</strong> – providing the right amount of carbohydrates,<br />
protein, fats, <strong>and</strong> vitamins <strong>and</strong> minerals – is<br />
essential during the antenatal <strong>and</strong> early childhood period.<br />
<strong>Maternal</strong> undernutriti<strong>on</strong>, particularly low body mass index,<br />
which can cause fetal growth retardati<strong>on</strong>, <strong>and</strong> n<strong>on</strong>-optimal<br />
infant <strong>and</strong> young child feeding are the main causes of<br />
faltering growth <strong>and</strong> undernutriti<strong>on</strong> in children under 2<br />
years old. 11 These c<strong>on</strong>diti<strong>on</strong>s can have a lifel<strong>on</strong>g negative<br />
impact <strong>on</strong> brain structure <strong>and</strong> functi<strong>on</strong>.<br />
Stunting is an important predictor of child development; it<br />
is associated with reduced school outcome. Compared to<br />
children who are not stunted, stunted children often enrol<br />
later, complete fewer grades <strong>and</strong> perform less well in<br />
school. In turn, this underperformance leads to reduced<br />
productivity <strong>and</strong> income-earning capacity in adult life. 12<br />
Iodine <strong>and</strong> ir<strong>on</strong> defi ciency can also undermine children’s<br />
school performance. Studies show that children from<br />
communities that are iodine defi cient can lose 13.5 IQ<br />
points <strong>on</strong> average compared with children from communities<br />
that are n<strong>on</strong>-defi cient, 13 <strong>and</strong> the intelligence quotients<br />
of children suffering ir<strong>on</strong> defi ciency in early infancy were<br />
lower than those of their peers who were not defi cient. 14<br />
Ir<strong>on</strong> defi ciency makes children tired, slow <strong>and</strong> listless, so<br />
they do not perform well in school.<br />
Ir<strong>on</strong>-defi ciency anaemia is highly prevalent am<strong>on</strong>g women<br />
in developing-country settings <strong>and</strong> increases the risk of<br />
maternal death. 15 It causes weakness <strong>and</strong> fatigue, <strong>and</strong><br />
reduces their physical ability to work. Adults suffering<br />
from anaemia are reported to be less productive than<br />
adults who are not anaemic. 16<br />
14 <str<strong>on</strong>g>Tracking</str<strong>on</strong>g> <str<strong>on</strong>g>Progress</str<strong>on</strong>g> <strong>on</strong> <strong>Child</strong> <strong>and</strong> <strong>Maternal</strong> Nutriti<strong>on</strong><br />
Early childhood is also a critical period for a child’s cognitive<br />
development. Particularly in settings where ill health <strong>and</strong><br />
undernutriti<strong>on</strong> are comm<strong>on</strong>, it is important to stimulate the<br />
child’s cognitive development during the fi rst two years<br />
through interacti<strong>on</strong> <strong>and</strong> play. Nutriti<strong>on</strong> <strong>and</strong> child development<br />
interventi<strong>on</strong>s have a synergistic effect <strong>on</strong> growth <strong>and</strong><br />
development outcomes.<br />
Nutriti<strong>on</strong> in early childhood has a lasting impact <strong>on</strong> health<br />
<strong>and</strong> well-being in adulthood. <strong>Child</strong>ren with defi cient growth<br />
before age 2 are at an increased risk of chr<strong>on</strong>ic disease<br />
as adults if they gain weight rapidly in later stages of<br />
childhood. 17 For chr<strong>on</strong>ic c<strong>on</strong>diti<strong>on</strong>s such as cardiovascular<br />
disease <strong>and</strong> diabetes, a worst-case scenario is a baby of<br />
low birthweight who is stunted <strong>and</strong> underweight in infancy<br />
<strong>and</strong> then gains weight rapidly in childhood <strong>and</strong> adult life. 18<br />
This scenario is not uncomm<strong>on</strong> in countries where underweight<br />
rates have been reduced but stunting remains<br />
relatively high.<br />
Undernutriti<strong>on</strong> has dominated discussi<strong>on</strong>s <strong>on</strong> nutriti<strong>on</strong>al<br />
status in developing countries, but overweight am<strong>on</strong>g both<br />
children <strong>and</strong> adults has emerged in many countries as a<br />
public health issue, especially in countries undergoing a<br />
so-called ‘nutriti<strong>on</strong> transiti<strong>on</strong>’. Overweight is caused in<br />
these countries mainly by poverty <strong>and</strong> by poor infant <strong>and</strong><br />
young child feeding practices; the ‘transiti<strong>on</strong>’ refers to<br />
changes in traditi<strong>on</strong>al diets, with increased c<strong>on</strong>sumpti<strong>on</strong><br />
of high-calorie, high-fat <strong>and</strong> processed foods.<br />
Height at 2 years of age is clearly associated with enhanced<br />
productivity <strong>and</strong> human capital in adulthood, 19 so early<br />
nutriti<strong>on</strong> is also an important c<strong>on</strong>tributor to ec<strong>on</strong>omic<br />
development. There is evidence that improving growth<br />
through adequate complementary feeding can have a<br />
signifi cant effect <strong>on</strong> adult wages. An evaluati<strong>on</strong> of <strong>on</strong>e<br />
programme in Latin America that provided good-quality<br />
complementary food to infant <strong>and</strong> young boys found their<br />
wages in adulthood increased by 46 per cent compared to<br />
peers who did not participate in the programme. 20
3. CURRENT STATUS<br />
OF NUTRITION<br />
Stunting<br />
Stunting affects approximately 195 milli<strong>on</strong> children under<br />
5 years old in the developing world, or about <strong>on</strong>e in three.<br />
Africa <strong>and</strong> Asia have high stunting rates – 40 per cent <strong>and</strong><br />
36 per cent, respectively – <strong>and</strong> more than 90 per cent of the<br />
world’s stunted children live <strong>on</strong> these two c<strong>on</strong>tinents.<br />
195 milli<strong>on</strong> children in the developing world are stunted<br />
Number of children under 5 years old who are moderately or severely stunted (2008)<br />
Number of children<br />
who are stunted<br />
Circle size is proporti<strong>on</strong>al<br />
to the number of children<br />
50 milli<strong>on</strong><br />
10 milli<strong>on</strong><br />
1 milli<strong>on</strong><br />
100,000<br />
Data not available<br />
Stunting prevalence worldwide<br />
Percentage of children under 5 years old who are moderately or severely stunted<br />
Less than 5 per cent<br />
5–19 per cent<br />
20–29 per cent<br />
30–39 per cent<br />
40 per cent or more<br />
Data not available<br />
Of the 10 countries that c<strong>on</strong>tribute most to the global<br />
burden of stunting am<strong>on</strong>g children, 6 are in Asia. These<br />
countries all have relatively large populati<strong>on</strong>s: Bangladesh,<br />
China, India, Ind<strong>on</strong>esia, Pakistan <strong>and</strong> the Philippines.<br />
Due to the high prevalence of stunting (48 per cent) in<br />
combinati<strong>on</strong> with a large populati<strong>on</strong>, India al<strong>on</strong>e has<br />
an estimated 61 milli<strong>on</strong> stunted children, accounting<br />
for more than 3 out of every 10 stunted children in the<br />
developing world.<br />
Notes for all maps in this publicati<strong>on</strong>: The maps in this publicati<strong>on</strong> are stylized <strong>and</strong> not to scale. They do not reflect a positi<strong>on</strong> by UNICEF <strong>on</strong> the legal status of any country or<br />
territory or the delimitati<strong>on</strong> of any fr<strong>on</strong>tiers. The dotted line represents approximately the Line of C<strong>on</strong>trol in Jammu <strong>and</strong> Kashmir agreed up<strong>on</strong> by India <strong>and</strong> Pakistan. The final status of<br />
Jammu <strong>and</strong> Kashmir has not yet been agreed up<strong>on</strong> by the parties. For detailed notes <strong>on</strong> the map data, see page 42.<br />
Sources for both maps <strong>on</strong> this page: MICS, DHS <strong>and</strong> other nati<strong>on</strong>al surveys, 2003–2008.<br />
Overview 15
Stunting prevalence in Africa <strong>and</strong> Asia <strong>and</strong> in countries<br />
where more than half of children are stunted<br />
Percentage of children under 5 years old who are moderately or severely stunted (based <strong>on</strong> WHO <strong>Child</strong> Growth St<strong>and</strong>ards)<br />
60%<br />
50%<br />
40%<br />
30%<br />
20%<br />
10%<br />
0%<br />
40<br />
36<br />
Note: Estimates are calculated according to the WHO <strong>Child</strong> Growth St<strong>and</strong>ards except for Burundi <strong>and</strong> Timor-Leste, where estimates are available <strong>on</strong>ly according to the NCHS/WHO<br />
reference populati<strong>on</strong>. Estimates are based <strong>on</strong> data collected in 2003 or later with the excepti<strong>on</strong> of Guatemala (2002).<br />
Source: MICS, DHS <strong>and</strong> other nati<strong>on</strong>al surveys, 2003–2008.<br />
More than half the children under 5 years old are stunted<br />
in nine countries, including Guatemala, whose stunting<br />
rate of 54 per cent rivals that of some of the highestprevalence<br />
countries in Africa <strong>and</strong> Asia. Of countries with<br />
available data, Afghanistan <strong>and</strong> Yemen have the highest<br />
stunting rates: 59 per cent <strong>and</strong> 58 per cent, respectively.<br />
Reducing stunting in Peru<br />
16 <str<strong>on</strong>g>Tracking</str<strong>on</strong>g> <str<strong>on</strong>g>Progress</str<strong>on</strong>g> <strong>on</strong> <strong>Child</strong> <strong>and</strong> <strong>Maternal</strong> Nutriti<strong>on</strong><br />
34<br />
Africa Asia Developing<br />
countries<br />
59<br />
58<br />
54 54 53 53<br />
Afghanistan Yemen Guatemala Timor-Leste Burundi Madagascar Malawi Ethiopia Rw<strong>and</strong>a<br />
A nati<strong>on</strong>’s average rate of stunting may mask disparities.<br />
For example, an analysis of disparities in H<strong>on</strong>duras indicates<br />
that children living in the poorest households or<br />
whose mothers are uneducated have almost a 50 per cent<br />
chance of being stunted, whereas <strong>on</strong> average, throughout<br />
the country 29 per cent of children are stunted. 21<br />
The stunting rate in Peru is high, particularly am<strong>on</strong>g those who are poor. One reas<strong>on</strong> for the c<strong>on</strong>tinued high prevalence of<br />
stunting is the percepti<strong>on</strong> that undernutriti<strong>on</strong> is primarily a food security issue. But in some regi<strong>on</strong>s of the country, more<br />
holistic, community-based efforts to improve basic health practices have led to an improvement in stunting levels am<strong>on</strong>g<br />
young children.<br />
In 1999, the programme ‘A Good Start in Life’ was initiated in fi ve regi<strong>on</strong>s – four in the Andean highl<strong>and</strong>s <strong>and</strong> <strong>on</strong>e in the Amaz<strong>on</strong><br />
regi<strong>on</strong> – as a collaborati<strong>on</strong> between the Ministry of Health, the United States Agency for Internati<strong>on</strong>al Development <strong>and</strong> UNICEF.<br />
Efforts focused <strong>on</strong> reaching pregnant <strong>and</strong> lactating women. Methods included such community-based interventi<strong>on</strong>s as antenatal<br />
care, promoti<strong>on</strong> of adequate food intake during pregnancy <strong>and</strong> lactati<strong>on</strong>, promoti<strong>on</strong> of exclusive breastfeeding of infants under<br />
6 m<strong>on</strong>ths of age <strong>and</strong> improved complementary feeding from six m<strong>on</strong>ths, growth promoti<strong>on</strong>, c<strong>on</strong>trol of ir<strong>on</strong> <strong>and</strong> vitamin A<br />
defi ciency, promoti<strong>on</strong> of iodized salt, <strong>and</strong> pers<strong>on</strong>al <strong>and</strong> family hygiene.<br />
Programme teams were led by local governments, which worked with communities, health facility staff <strong>and</strong> local n<strong>on</strong>-governmental<br />
organizati<strong>on</strong>s. The programme emphasized strengthening the capacity <strong>and</strong> skills of female counsellors <strong>and</strong> rural health promoters.<br />
By 2004, it covered the inhabitants of 223 poor, rural communities, including approximately 75,000 children under 3 years old,<br />
<strong>and</strong> 35,000 pregnant <strong>and</strong> lactating women.<br />
A comparis<strong>on</strong> between 2000 <strong>and</strong> 2004 shows that in the communities covered by the programme the stunting rate for children<br />
under 3 years old declined from 54 per cent to 37 per cent, while anaemia rates dropped from 76 per cent to 52 per cent. The<br />
total cost of the programme was estimated to be US$116.50 per child per year. ‘A Good Start in Life’ inspired the design <strong>and</strong><br />
implementati<strong>on</strong> of a nati<strong>on</strong>al programme, which has since been associated with reduced stunting rates.<br />
Source: Lechtig, Aar<strong>on</strong>, et al., ‘Decreasing Stunting, Anemia, <strong>and</strong> Vitamin A Defi ciency in Peru: Results of the Good Start in Life Program’, Food <strong>and</strong> Nutriti<strong>on</strong> Bulletin,<br />
vol. 30, no. 1, March 2009, pp. 37–48; <strong>and</strong> UNICEF Peru Country Offi ce, ‘Annual Report 2000’ (internal document).<br />
53<br />
51<br />
51
Decline in stunting prevalence in Africa <strong>and</strong> Asia <strong>and</strong> in countries<br />
where prevalence has decreased by more than 20 percentage points<br />
Percentage of children under 5 years old who are moderately or severely stunted (based <strong>on</strong> NCHS/WHO reference populati<strong>on</strong>)<br />
70%<br />
60%<br />
50%<br />
40%<br />
30%<br />
20%<br />
10%<br />
0%<br />
38<br />
34<br />
Note: The trend analysis is based <strong>on</strong> a subset of 80 countries with trend data, including 75 developing countries, covering 80 per cent of the under-fi ve populati<strong>on</strong> in the developing world.<br />
All trend estimates are calculated according to the NCHS/WHO reference populati<strong>on</strong>.<br />
Source: MICS, DHS <strong>and</strong> other nati<strong>on</strong>al surveys, around 1990 to around 2008.<br />
Since 1990, stunting prevalence in the developing world<br />
has declined from 40 per cent to 29 per cent, a relative<br />
reducti<strong>on</strong> of 28 per cent. <str<strong>on</strong>g>Progress</str<strong>on</strong>g> has been particularly<br />
notable in Asia, where prevalence dropped from 44 per cent<br />
around 1990 to 30 per cent around 2008. This reducti<strong>on</strong> is<br />
infl uenced by marked declines in China.<br />
The decline in Africa has been modest, from 38 per cent<br />
around 1990 to 34 per cent around 2008. Moreover, due to<br />
populati<strong>on</strong> growth, the overall number of African children<br />
under 5 years old who are stunted has increased, from an<br />
estimated 43 milli<strong>on</strong> in 1990 to 52 milli<strong>on</strong> in 2008.<br />
Stunting rates have declined signifi cantly in a number of<br />
countries – including Bangladesh, Eritrea, Mauritania <strong>and</strong><br />
Viet Nam – underscoring that marked improvements can be<br />
achieved. In countries where the burden of stunting is high,<br />
there is an urgent need to accelerate integrated programmes<br />
addressing nutriti<strong>on</strong> during the mother’s pregnancy <strong>and</strong><br />
before the child reaches 2 years of age.<br />
Underweight<br />
Around 1990<br />
Around 2008<br />
44<br />
30<br />
Africa Asia<br />
Developing<br />
countries<br />
Eritrea<br />
(1993, 2002)<br />
Today, an estimated 129 milli<strong>on</strong> children under 5 years old<br />
in the developing world are underweight – nearly <strong>on</strong>e in<br />
four. Ten per cent of children in the developing world are<br />
severely underweight. The prevalence of underweight<br />
am<strong>on</strong>g children is higher in Asia than in Africa, with rates<br />
of 27 per cent <strong>and</strong> 21 per cent, respectively.<br />
40<br />
29<br />
66<br />
38<br />
63<br />
36<br />
Bangladesh<br />
(1992, 2007)<br />
57<br />
36<br />
Viet Nam<br />
(1987, 2006)<br />
57<br />
27<br />
Mauritania<br />
(1990, 2008)<br />
42<br />
22<br />
Bolivia (Plurinati<strong>on</strong>al<br />
State of) (1989, 2008)<br />
33<br />
11<br />
China<br />
(1990, 2005)<br />
Underweight prevalence in Africa <strong>and</strong> Asia<br />
<strong>and</strong> in countries where more than <strong>on</strong>e third<br />
of children are underweight<br />
Percentage of children under 5 years old who are<br />
moderately or severely underweight (based <strong>on</strong> WHO<br />
<strong>Child</strong> Growth St<strong>and</strong>ards)<br />
Africa<br />
Asia<br />
Developing<br />
countries<br />
Timor-Leste<br />
India<br />
Yemen<br />
Bangladesh<br />
Nepal<br />
Chad<br />
Madagascar<br />
Niger<br />
Burundi<br />
Eritrea<br />
0%<br />
10%<br />
Note: Estimates are calculated according to the WHO <strong>Child</strong> Growth St<strong>and</strong>ards<br />
except for Chad <strong>and</strong> Timor-Leste, where estimates are available <strong>on</strong>ly according to<br />
the NCHS/WHO reference populati<strong>on</strong>. Estimates are based <strong>on</strong> data collected in<br />
2003 or later with the excepti<strong>on</strong> of Eritrea (2002).<br />
Source: MICS, DHS <strong>and</strong> other nati<strong>on</strong>al surveys, 2003–2008.<br />
21<br />
20%<br />
23<br />
27<br />
30%<br />
35<br />
35<br />
36<br />
36<br />
37<br />
39<br />
41<br />
40%<br />
43<br />
43<br />
49<br />
50%<br />
Overview 17
Underweight prevalence worldwide<br />
Percentage of children under 5 years old who are moderately or severely underweight<br />
Less than 5 per cent<br />
5–19 per cent<br />
20–29 per cent<br />
30–39 per cent<br />
40 per cent or more<br />
Data not available<br />
Source: MICS, DHS <strong>and</strong> other nati<strong>on</strong>al surveys, 2003–2008.<br />
In 17 countries, underweight prevalence am<strong>on</strong>g children<br />
under 5 years old is greater than 30 per cent. The rates are<br />
highest in Bangladesh, India, Timor-Leste <strong>and</strong> Yemen, with<br />
more than 40 per cent of children underweight.<br />
C<strong>on</strong>tributi<strong>on</strong> to the underweight burden<br />
Countries with the largest numbers of children under<br />
fi ve who are moderately or severely underweight,<br />
as a proporti<strong>on</strong> of the developing world total<br />
(129 milli<strong>on</strong> children)<br />
Other developing<br />
countries<br />
43%<br />
Nigeria<br />
5%<br />
India<br />
42%<br />
Pakistan<br />
5%<br />
Bangladesh<br />
5%<br />
Note: Estimates are calculated using underweight prevalence according to the<br />
WHO <strong>Child</strong> Growth St<strong>and</strong>ards <strong>and</strong> the number of children under 5 years old in<br />
2008. Underweight prevalence estimates are based <strong>on</strong> data collected in 2003 or<br />
later with the excepti<strong>on</strong> of Pakistan (2001–2002).<br />
Source: MICS, DHS <strong>and</strong> other nati<strong>on</strong>al surveys, 2003–2008.<br />
18 <str<strong>on</strong>g>Tracking</str<strong>on</strong>g> <str<strong>on</strong>g>Progress</str<strong>on</strong>g> <strong>on</strong> <strong>Child</strong> <strong>and</strong> <strong>Maternal</strong> Nutriti<strong>on</strong><br />
Some countries have low underweight prevalence but<br />
unacceptably high stunting rates. For example, in Albania,<br />
Egypt, Iraq, M<strong>on</strong>golia, Peru <strong>and</strong> Swazil<strong>and</strong>, stunting rates are<br />
more than 25 per cent although underweight prevalence is<br />
6 per cent or less. For nati<strong>on</strong>al development <strong>and</strong> public health,<br />
it is important to reduce both stunting <strong>and</strong> underweight.<br />
<str<strong>on</strong>g>Progress</str<strong>on</strong>g> towards the reducti<strong>on</strong> of underweight prevalence<br />
has been limited in Africa, with 28 per cent of children under<br />
5 years old being underweight around 1990, compared with<br />
25 per cent around 2008. <str<strong>on</strong>g>Progress</str<strong>on</strong>g> has been slightly better in<br />
Asia, with 37 per cent underweight prevalence around 1990<br />
<strong>and</strong> 31 per cent around 2008.<br />
Even in countries where underweight<br />
prevalence is low, stunting rates can be<br />
alarmingly high<br />
Countries with underweight prevalence of 6 per cent or<br />
less <strong>and</strong> stunting rates of more than 25 per cent<br />
Prevalence of Prevalence Ratio of<br />
underweight of stunting stunting to<br />
Country<br />
(%)<br />
(%) underweight<br />
Peru 6 30 5.4<br />
M<strong>on</strong>golia 5 27 5.4<br />
Swazil<strong>and</strong> 5 29 5.4<br />
Egypt 6 29 4.8<br />
Albania 6 26 4.3<br />
Iraq 6 26 4.3<br />
Note: Estimates are calculated according to WHO <strong>Child</strong> Growth St<strong>and</strong>ards.<br />
Source: MICS, DHS <strong>and</strong> other nati<strong>on</strong>al surveys, 2003–2008.
Decline in underweight prevalence in Africa <strong>and</strong> Asia <strong>and</strong> in the fi ve countries<br />
with the greatest reducti<strong>on</strong>s<br />
Percentage of children under 5 years old who are moderately or severely underweight (based <strong>on</strong> NCHS/WHO reference populati<strong>on</strong>)<br />
70%<br />
60%<br />
50%<br />
40%<br />
30%<br />
20%<br />
10%<br />
0%<br />
28<br />
25<br />
Note: The trend analysis is based <strong>on</strong> a subset of 86 countries with trend data, including 81 developing countries, covering 89 per cent of the under-fi ve populati<strong>on</strong> in the developing<br />
world. All trend estimates are based <strong>on</strong> the NCHS/WHO reference populati<strong>on</strong>.<br />
Source: MICS, DHS <strong>and</strong> other nati<strong>on</strong>al surveys, around 1990 to around 2008.<br />
Sixty-three countries (out of 117 with available data) are <strong>on</strong><br />
track to achieving the MDG 1 target of a 50 per cent reducti<strong>on</strong><br />
of underweight prevalence am<strong>on</strong>g children under 5 between<br />
1990 <strong>and</strong> 2015. This compares with 46 countries (out of 94<br />
with available data) <strong>on</strong> track just three years ago, based<br />
63 countries are <strong>on</strong> track to meet the MDG 1 target<br />
On track: Average annual<br />
rate of reducti<strong>on</strong> (AARR)<br />
in underweight prevalence<br />
is greater than or equal to<br />
2.6 per cent, or latest<br />
available estimate of<br />
underweight prevalence<br />
estimate is less than or<br />
equal to 5 per cent,<br />
regardless of AARR<br />
Insuffi cient progress:<br />
AARR is between 0.6 per cent<br />
<strong>and</strong> 2.5 per cent<br />
No progress: AARR is less<br />
than or equal to 0.5 per cent<br />
Data not available<br />
Around 1990<br />
Around 2008<br />
37<br />
<strong>on</strong> trend data from around 1990 to around 2004. Today, in<br />
34 countries, progress is insuffi cient, <strong>and</strong> 20 have made<br />
no progress towards achieving the MDG target. Most of<br />
these 20 countries are in Africa.<br />
<str<strong>on</strong>g>Progress</str<strong>on</strong>g> is insuffi cient to meet the MDG target in 34 countries, <strong>and</strong> 20 countries have made no progress<br />
Source: MICS, DHS <strong>and</strong> other nati<strong>on</strong>al surveys, around 1990 to around 2008.<br />
31<br />
31<br />
Africa Asia Developing<br />
world<br />
26<br />
67<br />
46<br />
Bangladesh<br />
(1992, 2007)<br />
48<br />
31<br />
Mauritania<br />
(1990, 2008)<br />
45<br />
20<br />
Viet Nam<br />
(1987, 2006)<br />
40<br />
28<br />
Ind<strong>on</strong>esia<br />
(1987, 2003)<br />
23<br />
8<br />
Malaysia<br />
(1990, 2005)<br />
Overview 19
Wasting<br />
<strong>Child</strong>ren who suffer from wasting face a markedly<br />
increased risk of death. According to the latest available<br />
data, 13 per cent of children under 5 years old in the<br />
developing world are wasted, <strong>and</strong> 5 per cent are severely<br />
wasted (an estimated 26 milli<strong>on</strong> children).<br />
A number of African <strong>and</strong> Asian countries have wasting rates<br />
that exceed 15 per cent, including Bangladesh (17 per cent),<br />
India (20 per cent) <strong>and</strong> the Sudan (16 per cent). The country<br />
with the highest prevalence of wasting in the world is<br />
Timor-Leste, where 25 per cent of children under 5 years<br />
old are wasted (8 per cent severely).<br />
Out of 134 countries with available data, 32 have wasting<br />
prevalence of 10 per cent or more am<strong>on</strong>g children under<br />
5 years old. At such elevated levels, wasting is c<strong>on</strong>sidered a<br />
public health emergency requiring immediate interventi<strong>on</strong>,<br />
in the form of emergency feeding programmes.<br />
Ten countries account for 60 per cent of children in the<br />
developing world who suffer from wasting. The top eight<br />
countries all have wasting prevalence of 10 per cent or<br />
higher. More than <strong>on</strong>e third of the developing world’s<br />
children who are wasted live in India.<br />
The burden of severe wasting is particularly high – 6 per cent<br />
or more – in countries with large populati<strong>on</strong>s; Ind<strong>on</strong>esia,<br />
Nigeria, Pakistan <strong>and</strong> the Sudan, in additi<strong>on</strong> to India, all<br />
have high rates of wasting.<br />
Wasting prevalence<br />
Percentage of children under 5 years old who are<br />
moderately or severely wasted<br />
Africa<br />
Asia<br />
Developing<br />
countries<br />
0%<br />
Note: Estimates are calculated according to the WHO <strong>Child</strong> Growth St<strong>and</strong>ards.<br />
Source: MICS, DHS <strong>and</strong> other nati<strong>on</strong>al surveys, 2003–2008.<br />
20 <str<strong>on</strong>g>Tracking</str<strong>on</strong>g> <str<strong>on</strong>g>Progress</str<strong>on</strong>g> <strong>on</strong> <strong>Child</strong> <strong>and</strong> <strong>Maternal</strong> Nutriti<strong>on</strong><br />
10<br />
10%<br />
13<br />
17<br />
20%<br />
10 countries account for 60 per cent<br />
of the global wasting burden<br />
10 countries with the largest numbers of children<br />
under 5 years old who are wasted<br />
Country<br />
Note: Estimates are calculated according to the WHO <strong>Child</strong> Growth St<strong>and</strong>ards, except<br />
in cases where data are <strong>on</strong>ly available according to the previously used NCHS/WHO<br />
reference populati<strong>on</strong>. For more informati<strong>on</strong>, please refer to data notes <strong>on</strong> page 116.<br />
China is not included due to lack of data.<br />
Source: MICS, DHS <strong>and</strong> other nati<strong>on</strong>al surveys, 2003–2008.<br />
Overweight<br />
Wasting<br />
Moderate <strong>and</strong> severe Severe<br />
Numbers Prevalence Numbers Prevalence<br />
(thous<strong>and</strong>s) (%) (thous<strong>and</strong>s) (%)<br />
India 25,075 20 8,105 6<br />
Nigeria 3,478 14 1,751 7<br />
Pakistan 3,376 14 1,403 6<br />
Bangladesh 2,908 17 485 3<br />
Ind<strong>on</strong>esia 2,841 14 1,295 6<br />
Ethiopia 1,625 12 573 4<br />
Democratic<br />
Republic of<br />
the C<strong>on</strong>go<br />
1,183 10 509 4<br />
Sudan 945 16 403 7<br />
Egypt 680 7 302 3<br />
Philippines 642 6 171 2<br />
Although being overweight is a problem most often<br />
associated with industrialized countries, some developing<br />
countries <strong>and</strong> countries in transiti<strong>on</strong> also have high prevalence<br />
of overweight children. In Georgia, Guinea-Bissau,<br />
Iraq, Kazakhstan, Sao Tome <strong>and</strong> Principe, <strong>and</strong> the Syrian Arab<br />
Republic, for example, 15 per cent or more of children under<br />
5 years old are overweight.<br />
Some countries are experiencing a ‘double burden’ of<br />
malnutriti<strong>on</strong>, having high rates of both stunting <strong>and</strong><br />
overweight. In Guinea-Bissau <strong>and</strong> Malawi, for example,<br />
more than 10 per cent of children are overweight, while<br />
around half are stunted.
Wasting prevalence<br />
Percentage of children under 5 years old who are moderately or severely wasted<br />
More than 10 per cent of children are overweight in 17 countries with available data<br />
Percentage of children under 5 years old who are overweight <strong>and</strong> percentage who are stunted<br />
60%<br />
50%<br />
40%<br />
30%<br />
20%<br />
10%<br />
0%<br />
21<br />
Less than 2.5 per cent<br />
2.5–4.9 per cent<br />
5.0–9.9 per cent<br />
10 per cent or more<br />
Data not available<br />
Source: MICS, DHS <strong>and</strong> other nati<strong>on</strong>al surveys, 2003–2008.<br />
13<br />
18<br />
28<br />
17 17<br />
Georgia Syrian Kazakhstan Sao<br />
Arab<br />
Tome <strong>and</strong><br />
Republic<br />
Principe<br />
Guinea-<br />
Bissau<br />
Note: Estimates are calculated according to the WHO <strong>Child</strong> Growth St<strong>and</strong>ards.<br />
Source: MICS, DHS <strong>and</strong> other nati<strong>on</strong>al surveys, 2003–2008.<br />
16<br />
29<br />
15<br />
26<br />
Iraq<br />
15<br />
47<br />
14<br />
27<br />
15<br />
13<br />
13<br />
22<br />
13<br />
23<br />
13<br />
25<br />
13<br />
Overweight<br />
Stunting<br />
M<strong>on</strong>golia Algeria Belize Morocco Azerbaijan Egypt Uzbekistan Armenia Swazil<strong>and</strong> Malawi Kyrgyzstan<br />
23<br />
12<br />
19<br />
11<br />
18<br />
11<br />
29<br />
11<br />
53<br />
10<br />
18<br />
Overview 21
Low birthweight<br />
In developing countries, 16 per cent of infants, or 1 in 6,<br />
weigh less than 2,500 grams at birth. Asia has the highest<br />
incidence of low birthweight by far, with 18 per cent of all<br />
infants weighing less than 2,500 grams at birth. Mauritania,<br />
Pakistan, the Sudan <strong>and</strong> Yemen all have an estimated low<br />
birthweight incidence of more than 30 per cent.<br />
A total of 19 milli<strong>on</strong> newborns per year in the developing<br />
world are born with low birthweight, <strong>and</strong> India has the<br />
highest number of low birthweight babies per year:<br />
7.4 milli<strong>on</strong>.<br />
The low proporti<strong>on</strong> of newborns who are weighed at<br />
birth indicates a lack of appropriate newborn care <strong>and</strong><br />
may lead to inaccurate estimates of low-birthweight<br />
incidence. Almost 60 per cent of newborns in developing<br />
countries are not weighed at birth. Some countries with<br />
very high incidence of low birthweight also have a very<br />
high rate of infants who are not weighed at birth. In<br />
Pakistan <strong>and</strong> Yemen, for example, where almost <strong>on</strong>e third<br />
of newborns are estimated to be of low birthweight,<br />
more than 90 per cent of infants are not weighed at birth.<br />
C<strong>on</strong>tributi<strong>on</strong> to the low birthweight burden<br />
Countries with the largest numbers of infants weighing<br />
less than 2,500 grams at birth, as a proporti<strong>on</strong> of the<br />
global total (19 milli<strong>on</strong> newborns per year)<br />
Other countries<br />
44%<br />
Bangladesh<br />
4%<br />
Nigeria<br />
4%<br />
Note: Estimates are calculated using incidence of low birthweight <strong>and</strong> the number<br />
of births in 2008.<br />
Source: MICS, DHS <strong>and</strong> other nati<strong>on</strong>al surveys, 2003–2008.<br />
22 <str<strong>on</strong>g>Tracking</str<strong>on</strong>g> <str<strong>on</strong>g>Progress</str<strong>on</strong>g> <strong>on</strong> <strong>Child</strong> <strong>and</strong> <strong>Maternal</strong> Nutriti<strong>on</strong><br />
India<br />
39%<br />
Pakistan<br />
9%<br />
Low birthweight incidence in Africa <strong>and</strong><br />
Asia <strong>and</strong> in countries with the highest rates<br />
Percentage of infants weighing less than 2,500 grams<br />
at birth<br />
Africa<br />
Asia<br />
Developing countries<br />
Mauritania<br />
Pakistan<br />
Yemen<br />
Sudan<br />
India<br />
Niger<br />
0%<br />
14<br />
10% 20%<br />
Note: Estimates are based <strong>on</strong> data collected in 2003 <strong>and</strong> later with the excepti<strong>on</strong><br />
of the Sudan (1999) <strong>and</strong> Yemen (1997).<br />
Source: MICS, DHS <strong>and</strong> other nati<strong>on</strong>al surveys, 2003–2008.<br />
Newborns not weighed in Africa <strong>and</strong> Asia<br />
<strong>and</strong> in countries with the highest rates<br />
Percentage of infants not weighed at birth<br />
Africa<br />
Asia*<br />
Developing countries*<br />
Ethiopia<br />
Yemen<br />
Pakistan<br />
Chad<br />
Maldives<br />
Timor-Leste<br />
Bangladesh<br />
0%<br />
* Excludes China.<br />
Note: Estimates are based <strong>on</strong> data collected 2003 <strong>and</strong> later with the excepti<strong>on</strong> of<br />
Maldives (2001) <strong>and</strong> Yemen (1997).<br />
Source: MICS, DHS <strong>and</strong> other nati<strong>on</strong>al surveys, 2003–2008.<br />
16<br />
18<br />
61<br />
60<br />
59<br />
27<br />
28<br />
31<br />
32<br />
32<br />
30%<br />
34<br />
40%<br />
20% 40% 60% 80% 100%<br />
87<br />
87<br />
87<br />
85<br />
92<br />
90<br />
97
Micr<strong>on</strong>utrient defi ciencies<br />
Vitamin <strong>and</strong> mineral defi ciencies are highly prevalent<br />
throughout the developing world. The status of vitamin A,<br />
ir<strong>on</strong> <strong>and</strong> iodine defi ciencies are highlighted below, but<br />
other defi ciencies such as zinc <strong>and</strong> folate are also comm<strong>on</strong>.<br />
Vitamin A defi ciency remains a signifi cant public health<br />
challenge across Africa <strong>and</strong> Asia <strong>and</strong> in some countries of<br />
South America. An estimated 33 per cent (190 milli<strong>on</strong>) of<br />
preschool-age children <strong>and</strong> 15 per cent (19 milli<strong>on</strong>) of<br />
pregnant women do not have enough vitamin A in their<br />
daily diet, <strong>and</strong> can be classifi ed as vitamin A defi cient.<br />
The highest prevalence <strong>and</strong> numbers are found in<br />
Africa <strong>and</strong> some parts of Asia, where more than<br />
40 per cent of preschool-age children are estimated<br />
to be vitamin A defi cient. 22<br />
Ir<strong>on</strong> defi ciency affects about 25 per cent of the world’s<br />
populati<strong>on</strong>, most of them children of preschool-age <strong>and</strong><br />
women. It causes anaemia, <strong>and</strong> the highest proporti<strong>on</strong>s of<br />
preschool-age children suffering from anaemia are in Africa<br />
(68 per cent). 23<br />
Iodine defi ciency, unlike many other nutriti<strong>on</strong> problems,<br />
affects both developed <strong>and</strong> developing countries. Although<br />
most people are now protected through the c<strong>on</strong>sumpti<strong>on</strong><br />
of iodized salt, the proporti<strong>on</strong> of the populati<strong>on</strong> affected<br />
by iodine defi ciency is highest in Europe (52 per cent).<br />
Africa is also affected, with 42 per cent of the populati<strong>on</strong><br />
assessed as defi cient. 24<br />
4. COVERAGE OF<br />
INTERVENTIONS TO<br />
IMPROVE NUTRITION<br />
Infant <strong>and</strong> young child feeding<br />
Optimal infant <strong>and</strong> young child feeding entails the initiati<strong>on</strong><br />
of breastfeeding within <strong>on</strong>e hour of birth; exclusive breastfeeding<br />
for the fi rst six m<strong>on</strong>ths of the child’s life; <strong>and</strong><br />
c<strong>on</strong>tinued breastfeeding for two years or more, together<br />
with safe, age-appropriate feeding of solid, semi-solid <strong>and</strong><br />
soft foods starting at 6 m<strong>on</strong>ths of age.<br />
While infant feeding practices need to be strengthened<br />
overall, increasing the rates of early initiati<strong>on</strong> of breastfeeding<br />
<strong>and</strong> of exclusive breastfeeding is critical to<br />
improving child survival <strong>and</strong> development. Less than<br />
40 per cent of all infants in the developing world receive<br />
the benefi ts of immediate initiati<strong>on</strong> of breastfeeding.<br />
Similarly, just 37 per cent of children under 6 m<strong>on</strong>ths of age<br />
are exclusively breastfed. Less than 60 per cent of children<br />
6–9 m<strong>on</strong>ths old receive solid, semi-solid or soft foods while<br />
being breastfed. In additi<strong>on</strong>, the quality of the food received<br />
is often inadequate, providing insuffi cient protein, fat or<br />
micr<strong>on</strong>utrients for optimal growth <strong>and</strong> development.<br />
C<strong>on</strong>tinuum of infant feeding practices<br />
Percentage of children in the developing world put to the<br />
breast within <strong>on</strong>e hour of delivery; exclusively breastfed;<br />
both breastfed <strong>and</strong> receiving complementary foods; <strong>and</strong><br />
c<strong>on</strong>tinuing to breastfeed at specifi ed ages<br />
Birth<br />
Early initiati<strong>on</strong> of breastfeeding<br />
(<strong>on</strong>e hour of birth)<br />
Exclusive breastfeeding<br />
(0–5 m<strong>on</strong>ths old)<br />
Complementary feeding<br />
(6–9 m<strong>on</strong>ths old)<br />
C<strong>on</strong>tinued breastfeeding<br />
(1 year old)<br />
C<strong>on</strong>tinued breastfeeding<br />
(2 years old)<br />
39*<br />
37*<br />
0% 20% 40% 60%<br />
* Excludes China due to lack of data.<br />
Source: MICS, DHS <strong>and</strong> other nati<strong>on</strong>al surveys, 2003–2008.<br />
50<br />
58<br />
75<br />
80%<br />
100%<br />
Overview 23
Data indicate that as children develop <strong>and</strong> complementary<br />
foods are introduced, levels of c<strong>on</strong>tinued breastfeeding<br />
are high (75 per cent) at around 1 year of age but decrease<br />
to 50 per cent by age 2.<br />
<str<strong>on</strong>g>Progress</str<strong>on</strong>g> in exclusive breastfeeding rates<br />
Trends in the percentage of infants under 6 m<strong>on</strong>ths old<br />
who are exclusively breastfed<br />
50%<br />
40%<br />
30%<br />
20%<br />
10%<br />
0%<br />
* Excludes China due to lack of data.<br />
Note: Analysis is based <strong>on</strong> a subset of 88 countries with trend data,<br />
including 83 developing countries, covering 73 per cent of births in the<br />
developing world.<br />
Source: MICS, DHS <strong>and</strong> other nati<strong>on</strong>al surveys, around 1995 to around 2008.<br />
Exclusive breastfeeding rates<br />
Percentage of infants under 6 m<strong>on</strong>ths old who are exclusively breastfed<br />
Less than 20 per cent<br />
20–49 per cent<br />
Around 1995<br />
Around 2008<br />
26<br />
32<br />
50 per cent or more<br />
Data not available<br />
Source: MICS, DHS <strong>and</strong> other nati<strong>on</strong>al surveys, 2003–2008.<br />
24 <str<strong>on</strong>g>Tracking</str<strong>on</strong>g> <str<strong>on</strong>g>Progress</str<strong>on</strong>g> <strong>on</strong> <strong>Child</strong> <strong>and</strong> <strong>Maternal</strong> Nutriti<strong>on</strong><br />
38<br />
42<br />
Africa Asia* Developing<br />
countries*<br />
33<br />
37<br />
Exclusive breastfeeding<br />
In the developing world, less than 40 per cent of infants<br />
under 6 m<strong>on</strong>ths old receive the benefi ts of exclusive<br />
breastfeeding. The rate is particularly low in Africa,<br />
where less than <strong>on</strong>e third of infants under 6 m<strong>on</strong>ths<br />
old are exclusively breastfed.<br />
Over the past 10–15 years exclusive breastfeeding rates<br />
have increased in many countries of Africa <strong>and</strong> Asia. In the<br />
developing world as a whole, however, progress has been<br />
modest, from 33 per cent around 1995 to 37 per cent<br />
around 2008.<br />
Evidence from a variety of countries indicates that marked<br />
improvements in exclusive breastfeeding are possible if<br />
supported by effective regulatory frameworks <strong>and</strong> guidelines,<br />
<strong>and</strong> when comprehensive programmatic approaches<br />
are at scale.<br />
Exclusive breastfeeding rates are very low <strong>and</strong> stunting<br />
prevalence is high in several countries that have experienced<br />
emergencies <strong>and</strong> l<strong>on</strong>ger-term challenges, such as<br />
Chad, Côte d’Ivoire, Djibouti <strong>and</strong> the Niger. In these countries,<br />
urgent acti<strong>on</strong>s are needed to promote <strong>and</strong> support<br />
exclusive breastfeeding in order to reduce the rate of<br />
infectious diseases <strong>and</strong> ensure optimal infant nutriti<strong>on</strong>.
Exclusive breastfeeding rates in Africa <strong>and</strong> Asia <strong>and</strong> in countries with both<br />
high stunting prevalence <strong>and</strong> very low exclusive breastfeeding rates<br />
Percentage of infants under 6 m<strong>on</strong>ths old who are exclusively breastfed<br />
100%<br />
80%<br />
60%<br />
40%<br />
20%<br />
0%<br />
32<br />
41<br />
37<br />
Africa Asia Developing Djibouti Chad Côte<br />
countries<br />
d’Ivoire<br />
1<br />
2<br />
4 4<br />
Niger Burkina<br />
Faso<br />
Somalia Sierra<br />
Le<strong>on</strong>e<br />
* See box below for recent developments in Kenya.<br />
Note: Countries in this chart have a stunting prevalence of 30% or higher <strong>and</strong> an exclusive breastfeeding rate of 15% or lower. Stunting prevalence is estimated according to the<br />
WHO <strong>Child</strong> Growth St<strong>and</strong>ards, except for Burkina Faso, Chad <strong>and</strong> Kenya, where it is estimated according to the NCHS/WHO reference populati<strong>on</strong>.<br />
Source: MICS, DHS <strong>and</strong> other nati<strong>on</strong>al surveys, 2003–2008.<br />
Integrated approaches to improving infant <strong>and</strong> young child feeding in Kenya<br />
The exclusive breastfeeding rate for children under 6 m<strong>on</strong>ths old in Kenya remained static at around 13 per cent from 1993<br />
to 2003. But after the Government, supported by UNICEF, established a comprehensive infant <strong>and</strong> young child feeding (IYCF)<br />
programme in 2007, a substantial increase in the rate of exclusive breastfeeding for this age group took place, according<br />
to preliminary data from 2008.<br />
The programme in Kenya is based <strong>on</strong> the comprehensive, multi-level approach to improving exclusive breastfeeding rates that<br />
had proved successful in a number of countries in sub-Saharan Africa <strong>and</strong> elsewhere. An assessment of people’s knowledge,<br />
attitudes <strong>and</strong> practices towards infant <strong>and</strong> young child feeding guided programme development <strong>and</strong> laid the foundati<strong>on</strong> for<br />
communicati<strong>on</strong> <strong>and</strong> advocacy addressing the challenges to infant feeding in the c<strong>on</strong>text of HIV.<br />
Government, n<strong>on</strong>-governmental organizati<strong>on</strong>s, <strong>and</strong> bilateral <strong>and</strong> multilateral stakeholders then developed a comprehensive<br />
IYCF strategy addressing acti<strong>on</strong> at the nati<strong>on</strong>al level, including policy <strong>and</strong> legislati<strong>on</strong>, at the health-services level <strong>and</strong> at the<br />
community level. Guidelines <strong>and</strong> training materials were created for use in nati<strong>on</strong>al capacity <strong>and</strong> service development, including<br />
in maternity facilities, during various maternal <strong>and</strong> child health c<strong>on</strong>tacts, <strong>and</strong> within communities.<br />
In 2008, the fi rst full year of the programme’s implementati<strong>on</strong>, 25 per cent of all health <strong>and</strong> nutriti<strong>on</strong> service providers <strong>and</strong><br />
community health workers in most provinces were trained in integrated IYCF counselling. Infant feeding practices in 60 per cent<br />
of the country’s public hospitals were assessed based <strong>on</strong> Baby-Friendly Hospital Initiative st<strong>and</strong>ards. Communicati<strong>on</strong> messages<br />
<strong>on</strong> the benefi ts of exclusive breastfeeding were broadcast nati<strong>on</strong>wide. The package of services delivered as part of the resp<strong>on</strong>se<br />
to emergency situati<strong>on</strong>s emphasized IYCF.<br />
Improved support for infant <strong>and</strong> young child feeding reached 73 per cent of women attending antenatal care or services to<br />
prevent mother-to-child transmissi<strong>on</strong> (PMTCT) of HIV in 2008, or an estimated 1.1 milli<strong>on</strong> out of the 1.5 milli<strong>on</strong> pregnant <strong>and</strong><br />
lactating women in Kenya. The approach has not <strong>on</strong>ly strengthened the crucial infant feeding aspect of PMTCT, it also extended<br />
IYCF counselling <strong>and</strong> communicati<strong>on</strong> to the general populati<strong>on</strong>.<br />
N<strong>on</strong>-governmental organizati<strong>on</strong>s <strong>and</strong> the United States President’s Emergency Plan for AIDS Relief (PEPFAR) partners<br />
implemented the initial phase of IYCF activities; the package of ICYF activities is now being exp<strong>and</strong>ed as part of the PEPFAR<br />
programme. Within the next two to three years, high coverage of the various activities is anticipated in all provinces.<br />
Sources: UNICEF Kenya Country Offi ce, ‘Annual Report 2008’ (internal document) <strong>and</strong> Demographic <strong>and</strong> Health Surveys, 1993, 1998 <strong>and</strong> 2003.<br />
7<br />
9<br />
11 12 13 13<br />
15<br />
Yemen Kenya* Nigeria Myanmar<br />
Overview 25
Early initiati<strong>on</strong> of breastfeeding<br />
Only 39 per cent of newborns in the developing world<br />
are put to the breast within <strong>on</strong>e hour of birth. The rate is<br />
especially low in Asia, at 31 per cent.<br />
There is growing evidence of the benefi ts to mother <strong>and</strong><br />
child of early initiati<strong>on</strong> of breastfeeding, preferably within<br />
the fi rst hour after birth. Early initiati<strong>on</strong> of breastfeeding<br />
c<strong>on</strong>tributes to reducing overall ne<strong>on</strong>atal mortality. 25 It<br />
ensures that skin-to-skin c<strong>on</strong>tact is made early <strong>on</strong>, an<br />
important factor in preventing hypothermia <strong>and</strong> establishing<br />
the b<strong>on</strong>d between mother <strong>and</strong> child. Early initiati<strong>on</strong><br />
of breastfeeding also reduces a mother’s risk of post-partum<br />
haemorrhage, <strong>on</strong>e of the leading causes of maternal<br />
mortality. Colostrum, the milk produced by the mother<br />
during the fi rst post-partum days, provides protective<br />
antibodies <strong>and</strong> essential nutrients, acting as a fi rst immunizati<strong>on</strong><br />
for newborns, strengthening their immune system<br />
<strong>and</strong> reducing the chances of death in the ne<strong>on</strong>atal period. 26<br />
In a subset of countries with available data, the low<br />
proporti<strong>on</strong>s of early initiati<strong>on</strong> of breastfeeding c<strong>on</strong>trast<br />
with substantially higher proporti<strong>on</strong>s of infants who are<br />
delivered by a skilled health professi<strong>on</strong>al <strong>and</strong> of infants<br />
whose mothers received antenatal care at least <strong>on</strong>ce from<br />
a skilled health professi<strong>on</strong>al. This gap c<strong>on</strong>stitutes a lost<br />
opportunity <strong>and</strong> highlights the critical need to improve the<br />
c<strong>on</strong>tent <strong>and</strong> quality of counselling by health-care providers.<br />
Early initiati<strong>on</strong> of breastfeeding<br />
Percentage of newborns put to the breast within<br />
<strong>on</strong>e hour of delivery<br />
Africa<br />
Asia*<br />
Developing countries*<br />
* Excludes China due to lack of data.<br />
Source: MICS, DHS <strong>and</strong> other nati<strong>on</strong>al surveys, 2003–2008.<br />
26 <str<strong>on</strong>g>Tracking</str<strong>on</strong>g> <str<strong>on</strong>g>Progress</str<strong>on</strong>g> <strong>on</strong> <strong>Child</strong> <strong>and</strong> <strong>Maternal</strong> Nutriti<strong>on</strong><br />
31<br />
39<br />
0% 10% 20% 30% 40% 50% 60%<br />
47<br />
Complementary feeding<br />
In the developing world, 58 per cent of infants aged<br />
6–9 m<strong>on</strong>ths old receive complementary foods while c<strong>on</strong>tinuing<br />
to be breastfed. These data do not refl ect the quality<br />
of the complementary foods received. Meeting minimum<br />
st<strong>and</strong>ards of dietary quality is a challenge in many developing-country<br />
settings, especially in areas where household<br />
food security is poor, <strong>and</strong> it has often not been given<br />
enough emphasis. <strong>Child</strong>ren may not receive complementary<br />
foods at the right age (often either too early or too late), are<br />
not fed frequently enough during the day, or the quality of<br />
the food may be inad equate. New programming opti<strong>on</strong>s are<br />
now available to meet this challenge.<br />
Complementary feeding is the most effective interventi<strong>on</strong><br />
that can signifi cantly reduce stunting during the fi rst two<br />
years of life. 27 A comprehensive programme approach to<br />
improving complementary feeding includes counselling for<br />
caregivers <strong>on</strong> feeding <strong>and</strong> care practices <strong>and</strong> <strong>on</strong> the optimal<br />
use of locally available foods, improving access to quality<br />
foods for poor families through social protecti<strong>on</strong> schemes<br />
<strong>and</strong> safety nets, <strong>and</strong> the provisi<strong>on</strong> of micr<strong>on</strong>utrients <strong>and</strong><br />
fortifi ed food supplements when needed.<br />
Health-system c<strong>on</strong>tacts are not resulting<br />
in early initiati<strong>on</strong> of breastfeeding<br />
Percentage of infants who were put to the breast within<br />
<strong>on</strong>e hour of birth; percentage of births attended by a<br />
skilled health professi<strong>on</strong>al; <strong>and</strong> percentage of pregnant<br />
mothers with at least <strong>on</strong>e antenatal care visit with a skilled<br />
health professi<strong>on</strong>al<br />
80%<br />
60%<br />
40%<br />
20%<br />
0%<br />
47<br />
50<br />
71<br />
Early initiati<strong>on</strong> of breastfeeding<br />
Skilled attendant at delivery<br />
Antenatal care with a skilled professi<strong>on</strong>al<br />
30<br />
Africa Asia Developing<br />
countries<br />
Note: Analysis based <strong>on</strong> a subset of 74 countries with data <strong>on</strong> all three indicators<br />
available from the same survey.<br />
Source: MICS, DHS <strong>and</strong> other nati<strong>on</strong>al surveys, 2003–2008.<br />
49<br />
73<br />
38<br />
54<br />
75
Recently adopted new indicators for infant <strong>and</strong> young<br />
child feeding (especially the ‘minimum acceptable diet’<br />
indicator refl ecting both frequency of feeding <strong>and</strong> dietary<br />
diversity) emphasize the importance of quality of food<br />
<strong>and</strong> allow for better assessment of complementary<br />
feeding practices.<br />
Vitamin A supplementati<strong>on</strong><br />
Vitamin A is essential for a well-functi<strong>on</strong>ing immune system;<br />
its defi ciency increases the risk of mortality signifi cantly. In<br />
2008, 71 per cent of all children 6–59 m<strong>on</strong>ths old in developing<br />
countries were fully protected against vitamin A defi ciency<br />
with two doses of vitamin A. Coverage of 85 per cent for<br />
the least developed countries highlights the success of<br />
programmes in reaching the most vulnerable populati<strong>on</strong>s.<br />
In 2008, 22 out of 34 least developed countries with data<br />
had surpassed the 80 per cent target of full coverage of<br />
vitamin A supplementati<strong>on</strong>. Service provided through<br />
integrated child health events has helped to ensure high<br />
coverage in a large number of these countries, where<br />
weak health systems would otherwise not have reached<br />
children. In 2008, integrated child health events were the<br />
most effective platform for delivery of vitamin A supplements,<br />
resulting in more than 80 per cent coverage <strong>on</strong><br />
average. 28 Nearly three quarters of the 20 countries with the<br />
highest number of deaths am<strong>on</strong>g children under 5 years<br />
old achieved more than 80 per cent full coverage of<br />
vitamin A supplementati<strong>on</strong>.<br />
Vitamin A supplementati<strong>on</strong> coverage<br />
Percentage of children 6–59 m<strong>on</strong>ths old reached with two<br />
doses of vitamin A in 2008, in 56 countries with nati<strong>on</strong>al<br />
programmes for which fi nal data were available in July 2009<br />
Africa<br />
Asia<br />
Least developed countries<br />
Developing countries<br />
Source: UNICEF, 2009.<br />
0% 20% 40% 60%<br />
70<br />
73<br />
71<br />
85<br />
80% 100%<br />
Reaching children with vitamin A<br />
in Bihar, India<br />
Vitamin A defi ciency is widespread throughout India,<br />
but particularly so in rural India, where up to 62 per cent<br />
of preschool-age children are defi cient, according to<br />
the latest estimates. Moreover, the high prevalence of<br />
wasting (20 per cent), stunting (48 per cent) <strong>and</strong> anaemia<br />
(70 per cent) in children under 5 years old indicates<br />
widespread nutriti<strong>on</strong>al deprivati<strong>on</strong>.<br />
India’s nati<strong>on</strong>al policy recommends that all children<br />
9–59 m<strong>on</strong>ths old be given preventive vitamin A supplementati<strong>on</strong><br />
twice yearly to reduce the risk of blindness,<br />
infecti<strong>on</strong>, undernutriti<strong>on</strong> <strong>and</strong> death associated with<br />
vitamin A defi ciency, particularly am<strong>on</strong>g the most<br />
vulnerable children. Many states in India have put the<br />
fi ght against vitamin A defi ciency <strong>on</strong> a ‘war footing’,<br />
<strong>and</strong> Bihar State – <strong>on</strong>e of the poorest in India – is at the<br />
forefr<strong>on</strong>t of this battle.<br />
The Government of Bihar, in partnership with UNICEF, the<br />
Micr<strong>on</strong>utrient Initiative <strong>and</strong> others, supports a strategy to<br />
increase coverage of vitamin A supplementati<strong>on</strong> bey<strong>on</strong>d<br />
the levels achieved through routine c<strong>on</strong>tact with the health<br />
system. The goal is to reach out to all children, beginning<br />
with children in socially excluded groups, scheduled castes<br />
<strong>and</strong> minority groups in which undernutriti<strong>on</strong> <strong>and</strong> mortality<br />
rates are signifi cantly higher than am<strong>on</strong>g children outside<br />
these groups.<br />
District planning has been a crucial tool. More than 11,000<br />
health centres <strong>and</strong> 80,000 anganwadis, or child development<br />
centres, that serve as core distributi<strong>on</strong> sites for<br />
vitamin A supplementati<strong>on</strong> in Bihar have been mapped<br />
out, <strong>and</strong> more than 3,400 temporary sites have been<br />
organized to deliver vitamin A supplements within small,<br />
isolated communities. Fr<strong>on</strong>t-line health <strong>and</strong> nutriti<strong>on</strong><br />
workers <strong>and</strong> community volunteers in the 38 districts of<br />
Bihar have been trained to administer preventive vitamin<br />
A syrup to children <strong>and</strong> to counsel mothers <strong>on</strong> how to<br />
improve the vitamin A c<strong>on</strong>tent of their children’s diet.<br />
The latest coverage data indicate that in the fi rst semester<br />
of 2009, Bihar’s vitamin A supplementati<strong>on</strong> programme<br />
reached 13.4 milli<strong>on</strong> children 9–59 m<strong>on</strong>ths old, protecting<br />
95 per cent of children in this age group against the<br />
devastating c<strong>on</strong>sequences of vitamin A defi ciency.<br />
The Government of Bihar is dem<strong>on</strong>strating that it is<br />
feasible to undertake inclusive programming for child<br />
nutriti<strong>on</strong> <strong>and</strong> to reach children who are traditi<strong>on</strong>ally<br />
excluded from services when efforts are made to<br />
underst<strong>and</strong> who these children are <strong>and</strong> where they live<br />
– <strong>and</strong> when political decisi<strong>on</strong>s are made to assign the<br />
human <strong>and</strong> programme resources needed to reach them.<br />
Sources: Offi cial statistics provided to UNICEF by the Government of Bihar,<br />
October 2009 (internal documents).<br />
Overview 27
Vitamin A supplementati<strong>on</strong> coverage rates show dramatic<br />
increases in a relatively short period of time. In Africa, full<br />
coverage of vitamin A supplementati<strong>on</strong> has increased fi vefold<br />
since 2000, due largely to the introducti<strong>on</strong> of biannual child<br />
health days, the main platform for vitamin A supplement<br />
distributi<strong>on</strong> in many African countries. Importantly, coverage<br />
more than doubled in the least developed countries, rising<br />
from 41 per cent in 2000 to 88 per cent in 2008, dem<strong>on</strong>strating<br />
that this life-saving interventi<strong>on</strong> is reaching<br />
children in countries where it is most needed.<br />
<str<strong>on</strong>g>Progress</str<strong>on</strong>g> in vitamin A<br />
supplementati<strong>on</strong> coverage<br />
Percentage of children 6–59 m<strong>on</strong>ths old reached<br />
with two doses of vitamin A, 2000–2008<br />
100%<br />
80%<br />
60%<br />
40%<br />
20%<br />
0%<br />
41<br />
14<br />
2000 2002<br />
2004<br />
2006<br />
2008<br />
Note: Vitamin A supplementati<strong>on</strong> two-dose (full coverage) trends are based <strong>on</strong> a<br />
subset of 16 African countries <strong>and</strong> 18 least developed countries with data in even<br />
years between 2000 <strong>and</strong> 2008 <strong>and</strong> <strong>on</strong> a subset of 11 Asian countries with data in<br />
even years between 2002 <strong>and</strong> 2008. The trend line for Asia begins in 2002 because<br />
of a lack of data for trend analysis prior to that.<br />
Source: UNICEF, 2009.<br />
Universal salt iodizati<strong>on</strong><br />
70<br />
51<br />
47<br />
Least developed countries<br />
Africa<br />
Asia<br />
Iodine defi ciency can be easily prevented by ensuring that<br />
salt c<strong>on</strong>sumed by households is adequately iodized. The<br />
most recent data indicate that 36 countries have reached<br />
the target of at least 90 per cent of households using<br />
adequately iodized salt. This represents an increase from<br />
21 countries in 2002, when the universal salt iodizati<strong>on</strong> goal<br />
was endorsed at the United Nati<strong>on</strong>s General Assembly<br />
Special Sessi<strong>on</strong> <strong>on</strong> <strong>Child</strong>ren. Despite this signifi cant<br />
progress, about 41 milli<strong>on</strong> newborns a year remain<br />
unprotected from the enduring c<strong>on</strong>sequences of brain<br />
damage associated with iodine defi ciency.<br />
28 <str<strong>on</strong>g>Tracking</str<strong>on</strong>g> <str<strong>on</strong>g>Progress</str<strong>on</strong>g> <strong>on</strong> <strong>Child</strong> <strong>and</strong> <strong>Maternal</strong> Nutriti<strong>on</strong><br />
78<br />
69<br />
87<br />
76<br />
66 64<br />
88<br />
74<br />
70<br />
Some 72 per cent of all households in developing countries<br />
now c<strong>on</strong>sume adequately iodized salt. About 73 per cent of<br />
households in Asia <strong>and</strong> 60 per cent in Africa c<strong>on</strong>sume<br />
adequately iodized salt. Africa’s relatively high rate is<br />
largely due to high coverage in two populous countries<br />
– Nigeria (with 97 per cent coverage) <strong>and</strong> the Democratic<br />
Republic of the C<strong>on</strong>go (79 per cent) – which masks the low<br />
coverage in many less populous countries of the regi<strong>on</strong>.<br />
125 countries are now implementing <strong>and</strong><br />
reporting <strong>on</strong> salt iodizati<strong>on</strong> programmes,<br />
an increase of 39 per cent in just seven years<br />
Number of countries implementing <strong>and</strong> reporting <strong>on</strong> salt<br />
iodizati<strong>on</strong> programmes, 2002–2009, by level of coverage<br />
Number of<br />
countries<br />
Reported in<br />
2002 2009<br />
Change<br />
2002–2009<br />
Number of<br />
countries Percentage<br />
Countries with more than 90% coverage 21 36 +15 +71%<br />
Countries with 70–89% coverage 17 27 +10 +59%<br />
Countries with 50–69% coverage 17 22 +5 +29%<br />
Countries with 20–49% coverage 22 28 +6 +27%<br />
Countries with less than 20% coverage 13 12 -1 -8%<br />
Total number of countries implementing<br />
<strong>and</strong> reporting <strong>on</strong> programmes<br />
90 125 +35 +39%<br />
Source: The ‘reported in 2002’ column represents UNICEF data published in<br />
<str<strong>on</strong>g>Progress</str<strong>on</strong>g> Since the World Summit for <strong>Child</strong>ren: A statistical review (2002). The<br />
‘reported in 2009’ column represents UNICEF data published in the statistical<br />
tables accompanying The State of the World’s <strong>Child</strong>ren Special Editi<strong>on</strong>:<br />
Celebrating 20 Years of the C<strong>on</strong>venti<strong>on</strong> <strong>on</strong> the Rights of the <strong>Child</strong> (2009).<br />
Iodized salt c<strong>on</strong>sumpti<strong>on</strong><br />
Percentage of households c<strong>on</strong>suming adequately<br />
iodized salt<br />
Africa<br />
Asia<br />
Developing countries<br />
0% 20% 40% 60%<br />
Source: MICS, DHS <strong>and</strong> other nati<strong>on</strong>al surveys, 2003–2008.<br />
60<br />
73<br />
72<br />
USI target<br />
90%<br />
80% 100%
Increases in excess of 30 percentage points over the past<br />
decade have occurred in 19 countries where the current<br />
levels of household c<strong>on</strong>sumpti<strong>on</strong> of adequately iodized<br />
salt exceed 70 per cent. These marked improvements are<br />
a product of a unique combinati<strong>on</strong> of innovative public<br />
policies, private-sector initiative <strong>and</strong> civic commitment.<br />
Thirteen of these countries have improved their coverage<br />
by more than 50 percentage points, indicating that the goal<br />
of universal salt iodizati<strong>on</strong> can be attained – even at the<br />
global level – if efforts are similarly strengthened am<strong>on</strong>g<br />
countries that are lagging.<br />
Government commitment<br />
helps eliminate iodine<br />
deficiency in Nigeria<br />
In the 1980s, iodine defi ciency was a signifi cant public<br />
health c<strong>on</strong>cern in Nigeria, with a total goitre rate of 67<br />
per cent in 1988. This left many children at risk of mental<br />
<strong>and</strong> cognitive impairment. To combat this public health<br />
problem, the Government, in collaborati<strong>on</strong> with UNICEF,<br />
launched the Universal Salt Iodizati<strong>on</strong> programme. This<br />
initiative is now managed by the Nati<strong>on</strong>al Agency for<br />
Food <strong>and</strong> Drug Administrati<strong>on</strong> <strong>and</strong> C<strong>on</strong>trol in collaborati<strong>on</strong><br />
with the St<strong>and</strong>ards Organizati<strong>on</strong> of Nigeria, the<br />
Nati<strong>on</strong>al Planning Commissi<strong>on</strong> <strong>and</strong> the Ministry of Health.<br />
At the time the Universal Salt Iodizati<strong>on</strong> programme<br />
started in 1993, <strong>on</strong>ly 40 per cent of households c<strong>on</strong>sumed<br />
adequately iodized salt. The programme has achieved<br />
tremendous success, with 97 per cent of households<br />
now c<strong>on</strong>suming adequately iodized salt <strong>and</strong> with<br />
factories producing 90–100 per cent iodized salt. The<br />
goitre rate has plummeted, to about 6 per cent in 2007.<br />
By 2007, Nigeria became the fi rst country in Africa to<br />
receive recogniti<strong>on</strong> by the Network for Sustained<br />
Eliminati<strong>on</strong> of Iodine Defi ciency. Nigeria’s success in<br />
eliminating iodine defi ciency disorder can be attributed<br />
to the commitment of the Government <strong>and</strong> the salt<br />
industry, effective legislati<strong>on</strong> <strong>and</strong> str<strong>on</strong>g enforcement.<br />
Sources: Universal Salt Iodizati<strong>on</strong> in Nigeria: Process, successes <strong>and</strong> less<strong>on</strong>s,<br />
Government of Nigeria, Ministry of Health, <strong>and</strong> UNICEF, Abuja, 2007.<br />
Outst<strong>and</strong>ing improvements in the use<br />
of iodized salt<br />
Trends in the percentage of households c<strong>on</strong>suming<br />
adequately iodized salt, selected countries <strong>and</strong> territories<br />
Benin<br />
(1995, 2001)<br />
Cambodia<br />
(1996, 2005)<br />
Madagascar<br />
(1995, 2003)<br />
Kyrgyzstan<br />
(1997, 2006)<br />
Mali<br />
(1996, 2006)<br />
Democratic Republic<br />
of the C<strong>on</strong>go<br />
(1995, 2007)<br />
Egypt<br />
(2000, 2008)<br />
Syrian Arab Republic<br />
(1996, 2005)<br />
M<strong>on</strong>golia<br />
(2000, 2005)<br />
Bangladesh<br />
(1993, 2006)<br />
Côte d’Ivoire<br />
(2000, 2004)<br />
Lao People’s<br />
Democratic Republic<br />
(1996, 2006)<br />
Occupied<br />
Palestinian Territory<br />
(2000, 2006)<br />
Georgia<br />
(1999, 2005)<br />
Mexico<br />
(1992, 2003)<br />
Kazakhstan<br />
(1999, 2006)<br />
Viet Nam<br />
(1995, 2006)<br />
Sri Lanka<br />
(1994, 2005)<br />
China<br />
(1995, 2008)<br />
0%<br />
1<br />
1<br />
7<br />
7<br />
20%<br />
27<br />
35<br />
Source: MICS, DHS <strong>and</strong> other nati<strong>on</strong>al surveys.<br />
8<br />
12<br />
19<br />
20<br />
28<br />
28<br />
31<br />
31<br />
33<br />
36<br />
37<br />
45<br />
51<br />
72<br />
73<br />
75<br />
76<br />
79<br />
79<br />
79<br />
79<br />
83<br />
84<br />
84<br />
84<br />
86<br />
87<br />
91<br />
92<br />
93<br />
94<br />
95<br />
40% 60% 80% 100%<br />
Overview 29
Fortifi cati<strong>on</strong> of staple foods <strong>and</strong> c<strong>on</strong>diments<br />
Al<strong>on</strong>g with the iodizati<strong>on</strong> of salt, adding such vitamins<br />
<strong>and</strong> minerals as ir<strong>on</strong>, zinc, vitamin A <strong>and</strong> folic acid to staple<br />
foods, complementary foods <strong>and</strong> c<strong>on</strong>diments is a costeffective<br />
way to improve the vitamin <strong>and</strong> mineral intake of<br />
the overall populati<strong>on</strong>, including women of reproductive<br />
age <strong>and</strong> children. As of March 2009, roughly 30 per cent of<br />
the world’s wheat fl our produced in large roller mills was<br />
fortifi ed, while 57 countries had legislati<strong>on</strong> or decrees<br />
m<strong>and</strong>ating fortifi cati<strong>on</strong> of <strong>on</strong>e or more types of fl our with<br />
either ir<strong>on</strong> or folic acid. 29 Although many foods, such as<br />
fats, oils <strong>and</strong> margarine, have been fortifi ed for years in<br />
some countries, this approach has not yet been scaled up in<br />
many lower-income countries. Through increased efforts by<br />
various partnerships <strong>and</strong> alliances, it is expected that food<br />
fortifi cati<strong>on</strong> will c<strong>on</strong>tinue to gain momentum.<br />
Multiple micr<strong>on</strong>utrient<br />
supplementati<strong>on</strong>/home fortifi cati<strong>on</strong><br />
Am<strong>on</strong>g products recently developed to provide ir<strong>on</strong> <strong>and</strong><br />
other vitamins <strong>and</strong> minerals to young children <strong>and</strong> women<br />
of reproductive age, multiple micr<strong>on</strong>utrient powders (MNPs)<br />
are c<strong>on</strong>sidered particularly promising; studies have found<br />
they may reduce anaemia in young children by as much<br />
as 45 per cent. 30 MNP sachets c<strong>on</strong>tain a blend of vitamins<br />
<strong>and</strong> minerals in powdered form that can be sprinkled <strong>on</strong>to<br />
home-prepared foods, enabling families without access to<br />
commercially fortifi ed foods to add micr<strong>on</strong>utrients directly<br />
to their diets. There is emerging evidence that MNPs can<br />
c<strong>on</strong>tribute to improving complementary feeding practices<br />
if programmes are designed with that goal in mind. 31<br />
30 <str<strong>on</strong>g>Tracking</str<strong>on</strong>g> <str<strong>on</strong>g>Progress</str<strong>on</strong>g> <strong>on</strong> <strong>Child</strong> <strong>and</strong> <strong>Maternal</strong> Nutriti<strong>on</strong><br />
Multi-micr<strong>on</strong>utrients for<br />
M<strong>on</strong>golian children<br />
In recent years, multiple micr<strong>on</strong>utrient powders that<br />
can improve vitamin <strong>and</strong> mineral intake am<strong>on</strong>g infants<br />
over 6 m<strong>on</strong>ths old <strong>and</strong> young children have become<br />
available globally to address what appeared to be an<br />
intractable, widespread public health problem of<br />
ir<strong>on</strong>-defi ciency anaemia. The powders can c<strong>on</strong>tain<br />
5–15 vitamins <strong>and</strong> minerals (such as ir<strong>on</strong>, <strong>and</strong> vitamins A<br />
<strong>and</strong> D), are relatively tasteless, <strong>and</strong> are safe, easy to use<br />
<strong>and</strong> acceptable to caregivers. They cost about US$0.03<br />
per sachet (<strong>on</strong>e child typically gets 60–90 sachets per<br />
year), <strong>and</strong> there is suffi cient commercial supply to meet<br />
programme needs.<br />
M<strong>on</strong>golia is am<strong>on</strong>g the many countries that are introducing<br />
<strong>and</strong> scaling up the use of MNPs as part of an integrated<br />
approach to improve young child feeding <strong>and</strong> reduce<br />
stunting <strong>and</strong> anaemia. The M<strong>on</strong>golian effort, part of a<br />
comprehensive nati<strong>on</strong>al nutriti<strong>on</strong> strategy to tackle<br />
chr<strong>on</strong>ic undernutriti<strong>on</strong>, is also a way to address the<br />
nutriti<strong>on</strong>al fallout from the ec<strong>on</strong>omic instability <strong>and</strong><br />
chr<strong>on</strong>ic food shortages that have plagued the country<br />
in the past few years.<br />
The country’s approach builds <strong>on</strong> an experience of<br />
distributing MNPs to children 6–36 m<strong>on</strong>ths old to reduce<br />
anaemia <strong>and</strong> vitamin D defi ciency. At the <strong>on</strong>set of that<br />
distributi<strong>on</strong>, in 2001, the baseline prevalence of anaemia<br />
was around 42 per cent. <strong>Child</strong>ren received MNPs via a<br />
community distributi<strong>on</strong> model <strong>and</strong> also had biweekly<br />
visits by community workers supported by the Ministry<br />
of Health.<br />
One year into the programme, 13,000 children, or more<br />
than 80 per cent of those targeted, had received multimicr<strong>on</strong>utrient<br />
powders, <strong>and</strong> anaemia was reduced to half<br />
of baseline levels. With technical <strong>and</strong> fi nancial support<br />
from the Asian Development Bank, M<strong>on</strong>golia plans to<br />
exp<strong>and</strong> the programme to reach some 15,000 children<br />
6–24 m<strong>on</strong>ths old (or 22 per cent of all children in this age<br />
range) by targeting provinces based <strong>on</strong> poverty levels,<br />
geographical access <strong>and</strong> health indicators.<br />
Sources: ‘Micr<strong>on</strong>utrient Sprinkles for Use in Infants <strong>and</strong> Young <strong>Child</strong>ren:<br />
Guidelines <strong>on</strong> recommendati<strong>on</strong>s for use <strong>and</strong> program m<strong>on</strong>itoring <strong>and</strong> evaluati<strong>on</strong>’,<br />
Sprinkles Global Health Initiative, Tor<strong>on</strong>to, December 2008; <strong>and</strong> Schauer, C., et al.,<br />
‘Process Evaluati<strong>on</strong> of the Distributi<strong>on</strong> of Micr<strong>on</strong>utrient Sprinkles in over 10,000<br />
M<strong>on</strong>golian Infants Using a N<strong>on</strong>-Governmental Organizati<strong>on</strong> (NGO) Program<br />
Model’, abstract presented at the Internati<strong>on</strong>al Nutriti<strong>on</strong>al Anemia C<strong>on</strong>sultative<br />
Group Symposium, Marrakech, February 2003, p.42.
5. EFFECTIVE<br />
INTERVENTIONS TO<br />
IMPROVE NUTRITION<br />
The period in the life cycle from the mother’s pregnancy<br />
to the child’s sec<strong>on</strong>d birthday provides a critical window<br />
of opportunity in which interventi<strong>on</strong>s to improve maternal<br />
<strong>and</strong> child undernutriti<strong>on</strong> can have a positive impact <strong>on</strong><br />
young children’s prospects for survival, growth <strong>and</strong><br />
development, especially in countries with a high burden<br />
of undernutriti<strong>on</strong>.<br />
A package of effective nutriti<strong>on</strong> interventi<strong>on</strong>s has widely<br />
been agreed up<strong>on</strong> by experts <strong>and</strong> programme partners.<br />
It includes interventi<strong>on</strong>s in three key areas:<br />
# <strong>Maternal</strong> nutriti<strong>on</strong> during pregnancy <strong>and</strong> lactati<strong>on</strong>.<br />
# Initiati<strong>on</strong> of breastfeeding within the fi rst hour after<br />
birth, exclusive breastfeeding for the fi rst 6 m<strong>on</strong>ths,<br />
<strong>and</strong> c<strong>on</strong>tinued breastfeeding up to at least<br />
24 m<strong>on</strong>ths of age.<br />
# Adequate complementary feeding from 6 m<strong>on</strong>ths<br />
<strong>on</strong>ward, <strong>and</strong> micr<strong>on</strong>utrient interventi<strong>on</strong>s as needed.<br />
Successful programming in these areas will lead to<br />
marked reducti<strong>on</strong>s in the levels of chr<strong>on</strong>ic undernutriti<strong>on</strong><br />
in young children.<br />
Effective interventi<strong>on</strong>s for the treatment of severe acute<br />
malnutriti<strong>on</strong> in both emergency <strong>and</strong> n<strong>on</strong>-emergency<br />
settings include the use of ready-to-use therapeutic foods<br />
<strong>and</strong> adequate treatment of complicati<strong>on</strong>s, <strong>and</strong>, for management<br />
of moderate acute malnutriti<strong>on</strong>, the use of various<br />
supplementary foods. These interventi<strong>on</strong>s need to be<br />
implemented at scale together with strategies to improve<br />
care <strong>and</strong> feeding practices.<br />
Given the close link between undernutriti<strong>on</strong> <strong>and</strong> infecti<strong>on</strong>s,<br />
the implementati<strong>on</strong> at scale of key interventi<strong>on</strong>s to prevent<br />
<strong>and</strong> treat infecti<strong>on</strong>s will c<strong>on</strong>tribute to better nutriti<strong>on</strong> as<br />
well as reduced mortality. Such interventi<strong>on</strong>s include<br />
immunizati<strong>on</strong>, improved hygiene <strong>and</strong> h<strong>and</strong> washing,<br />
sanitati<strong>on</strong> (including the eliminati<strong>on</strong> of open defecati<strong>on</strong>)<br />
<strong>and</strong> access to clean drinking water, use of improved oral<br />
rehydrati<strong>on</strong> salts <strong>and</strong> therapeutic zinc to treat diarrhoea,<br />
the preventi<strong>on</strong> <strong>and</strong> treatment of malaria, <strong>and</strong> the treatment<br />
of pneum<strong>on</strong>ia with antibiotics.<br />
Reducing acute malnutriti<strong>on</strong><br />
in the Niger<br />
Unacceptable levels of malnutriti<strong>on</strong> due to drought,<br />
recurring food crises, poor feeding practices <strong>and</strong><br />
inadequate access to health services have plagued the<br />
Niger for years. In 2005, nutriti<strong>on</strong> surveys documented<br />
the prevalence of global acute malnutriti<strong>on</strong> (severe<br />
<strong>and</strong> moderate acute malnutriti<strong>on</strong> combined) above<br />
emergency thresholds of 15 per cent in several<br />
regi<strong>on</strong>s, triggering a major emergency resp<strong>on</strong>se by<br />
the Government <strong>and</strong> the internati<strong>on</strong>al community.<br />
One result was a signifi cant drop in prevalence to<br />
10 per cent in 2006.<br />
A vital comp<strong>on</strong>ent of the successful effort was a shift to<br />
programming approaches that allowed for many more<br />
affected individuals to be treated. A decentralized,<br />
community-based approach to treating acute malnutriti<strong>on</strong><br />
was used for the fi rst time. <strong>Child</strong>ren with severe acute<br />
malnutriti<strong>on</strong> were treated in their homes using ready-to-use<br />
therapeutic food. Moderate acute malnutriti<strong>on</strong> was treated<br />
with a range of products, including the traditi<strong>on</strong>al fortifi ed<br />
blended fl our as well as an oil-based ready-to-use<br />
supplementary food. Some partners also exp<strong>and</strong>ed<br />
nutriti<strong>on</strong> treatment programmes to include preventi<strong>on</strong><br />
of acute malnutriti<strong>on</strong> through the large-scale distributi<strong>on</strong><br />
of supplementary food products.<br />
The number of facilities in the Niger where treatment for<br />
severe acute malnutriti<strong>on</strong> was provided jumped from 75<br />
in 2005 to 941 in 2007. The increased dem<strong>and</strong> for therapeutic<br />
<strong>and</strong> supplementary food products prompted<br />
creati<strong>on</strong> of a local producti<strong>on</strong> facility that is increasingly<br />
meeting the dem<strong>and</strong>.<br />
Although signifi cant progress has been made since 2005<br />
in the Niger’s ability to effectively treat severely acutely<br />
malnourished children through the community-based<br />
approach, the prevalence of acute malnutriti<strong>on</strong> remains<br />
high. The challenge is to scale up such preventive practices<br />
as breastfeeding <strong>and</strong> improving complementary feeding,<br />
which would signifi cantly improve child nutriti<strong>on</strong> <strong>and</strong><br />
c<strong>on</strong>tribute to lowering the numbers of children with<br />
moderate or severe acute malnutriti<strong>on</strong>.<br />
Sources: Community-based Management of Severe Acute Malnutriti<strong>on</strong>:<br />
A joint statement by the World Health Organizati<strong>on</strong>, the World Food Programme,<br />
the United Nati<strong>on</strong>s System St<strong>and</strong>ing Committee <strong>on</strong> Nutriti<strong>on</strong> <strong>and</strong> the United<br />
Nati<strong>on</strong>s <strong>Child</strong>ren’s Fund, WHO, WFP, SCN <strong>and</strong> UNICEF, Geneva, Rome <strong>and</strong> New<br />
York, May 2007; <strong>and</strong> ‘Humanitarian Acti<strong>on</strong> Niger’, UNICEF, New York, June 2006.<br />
Overview 31
Community-based management of<br />
severe acute malnutriti<strong>on</strong> in Malawi<br />
In Malawi each year, there are an estimated 59,000 children<br />
with severe acute malnutriti<strong>on</strong>. Around 59 per cent of<br />
these children are currently being treated, at a recovery<br />
rate of more than 75 per cent, which makes Malawi a<br />
leader globally in achieving results in the management of<br />
severe acute malnutriti<strong>on</strong>. A vital comp<strong>on</strong>ent of Malawi’s<br />
success has been the introducti<strong>on</strong> of community-based<br />
management of the c<strong>on</strong>diti<strong>on</strong>.<br />
Poor nutriti<strong>on</strong>al status has been a chr<strong>on</strong>ic problem in<br />
Malawi. In additi<strong>on</strong> to endemic diseases <strong>and</strong> the AIDS<br />
epidemic, from 2001–2006 Malawi experienced persistent<br />
episodes of food shortage <strong>and</strong> other humanitarian crises.<br />
The rate of global acute malnutriti<strong>on</strong> nati<strong>on</strong>ally was<br />
6.2 per cent in 2005; four districts had rates above<br />
10 per cent. Prior to 2006, management of severe acute<br />
malnutriti<strong>on</strong> took place <strong>on</strong> an inpatient basis in paediatric<br />
wards <strong>and</strong> in nutriti<strong>on</strong> rehabilitati<strong>on</strong> units using the<br />
milk-based therapeutic preparati<strong>on</strong>s.<br />
In 2002, however, the n<strong>on</strong>-governmental organizati<strong>on</strong>s<br />
C<strong>on</strong>cern Worldwide <strong>and</strong> Valid Internati<strong>on</strong>al introduced an<br />
innovative approach using ready-to-use therapeutic food<br />
to increase coverage of treatment for severe acute<br />
malnutriti<strong>on</strong>. The initiative, anchored at the district level,<br />
encourages communities to identify severely undernourished<br />
children before they require inpatient care. Effective<br />
treatment is then given <strong>on</strong> a weekly basis at local health<br />
structures or at distributi<strong>on</strong> sites within a day’s walk of<br />
people’s homes. Inpatient care is available for complicated<br />
cases.<br />
These efforts led to exp<strong>and</strong>ed coverage of effective<br />
treatment, reaching 74 per cent of those in need,<br />
compared to 25 per cent for the traditi<strong>on</strong>al approach.<br />
After extending the initiative to additi<strong>on</strong>al districts<br />
following a 2004 review, the model was adopted as a<br />
nati<strong>on</strong>al strategy in 2006, <strong>and</strong> its gradual scale-up <strong>and</strong><br />
integrati<strong>on</strong> into the primary-health-care system began. By<br />
March 2009, the programme had been scaled up to 330<br />
outpatient <strong>and</strong> 96 inpatient sites in all of the country’s 27<br />
districts, <strong>and</strong> it is expected to eventually reach all health<br />
facilities in the country.<br />
Sources: Community-based Management of Severe Acute Malnutriti<strong>on</strong>: A joint<br />
statement by the World Health Organizati<strong>on</strong>, the World Food Programme, the<br />
United Nati<strong>on</strong>s System St<strong>and</strong>ing Committee <strong>on</strong> Nutriti<strong>on</strong>, <strong>and</strong> the United Nati<strong>on</strong>s<br />
<strong>Child</strong>ren’s Fund, WHO, WFP, SCN <strong>and</strong> UNICEF, Geneva, Rome <strong>and</strong> New York,<br />
May 2007; <strong>and</strong> UNICEF Malawi Country Offi ce Annual Reports <strong>and</strong> other<br />
internal documents.<br />
32 <str<strong>on</strong>g>Tracking</str<strong>on</strong>g> <str<strong>on</strong>g>Progress</str<strong>on</strong>g> <strong>on</strong> <strong>Child</strong> <strong>and</strong> <strong>Maternal</strong> Nutriti<strong>on</strong><br />
In many countries <strong>and</strong> communities, households face<br />
periods of seas<strong>on</strong>al food shortage, or adequate nutritious<br />
food may be unavailable to families <strong>on</strong> a c<strong>on</strong>tinual basis.<br />
This situati<strong>on</strong> needs to be addressed in order to ensure<br />
adequate maternal nutriti<strong>on</strong> <strong>and</strong> complementary feeding<br />
for infants <strong>and</strong> young children, as well as to sustain reducti<strong>on</strong>s<br />
in undernutriti<strong>on</strong> over the l<strong>on</strong>g term. Interventi<strong>on</strong>s<br />
include measures to improve agricultural producti<strong>on</strong> <strong>and</strong> to<br />
increase food availability through social protecti<strong>on</strong> schemes<br />
<strong>and</strong> food distributi<strong>on</strong> programmes.<br />
The table <strong>on</strong> the following pages offers detailed informati<strong>on</strong><br />
<strong>on</strong> the priority interventi<strong>on</strong>s for the preventi<strong>on</strong> of undernutriti<strong>on</strong><br />
<strong>and</strong> the treatment of severe <strong>and</strong> moderate acute<br />
malnutriti<strong>on</strong> to be delivered at stages of the life cycle<br />
between the woman’s pregnancy <strong>and</strong> the child’s sec<strong>on</strong>d<br />
birthday. Some of these preventive acti<strong>on</strong>s should begin<br />
in adolescence, before the woman becomes pregnant, <strong>and</strong><br />
c<strong>on</strong>tinue after the child reaches 24 m<strong>on</strong>ths of age. Many of<br />
these interventi<strong>on</strong>s endeavour to change behaviour <strong>and</strong> will<br />
depend <strong>on</strong> the successful implementati<strong>on</strong> of large-scale<br />
communicati<strong>on</strong> strategies.<br />
Adequate nutriti<strong>on</strong> is also of key importance for children<br />
more than 2 years old, <strong>and</strong> interventi<strong>on</strong>s such as vitamin A<br />
supplementati<strong>on</strong>, zinc treatment for diarrhoea, management<br />
of acute malnutriti<strong>on</strong>, <strong>and</strong> communicati<strong>on</strong> <strong>and</strong> counselling<br />
<strong>on</strong> the preventi<strong>on</strong> of both undernutriti<strong>on</strong> <strong>and</strong> overweight<br />
are also crucial for these children.
Priority interventi<strong>on</strong>s for the preventi<strong>on</strong> of undernutriti<strong>on</strong> <strong>and</strong> the treatment<br />
of severe <strong>and</strong> moderate acute malnutriti<strong>on</strong><br />
Life cycle stage<br />
Adolescence/pre-pregnancy<br />
Interventi<strong>on</strong>s for the mother Justifi cati<strong>on</strong>/evidence<br />
Ir<strong>on</strong> <strong>and</strong> folic acid supplements or multiple micr<strong>on</strong>utrient<br />
supplementati<strong>on</strong>, <strong>and</strong> deworming<br />
Reduces ir<strong>on</strong> defi ciency <strong>and</strong> other micr<strong>on</strong>utrient defi ciencies, <strong>and</strong><br />
anaemia in pregnancy<br />
Food fortifi cati<strong>on</strong> with folic acid, ir<strong>on</strong>, vitamin A, zinc <strong>and</strong> iodine Reduces micr<strong>on</strong>utrient defi ciencies; prevents neural tube defects<br />
<strong>and</strong> negative effects associated with iodine defi ciency in early<br />
pregnancy<br />
Pregnancy<br />
Interventi<strong>on</strong>s for the mother Justifi cati<strong>on</strong>/evidence<br />
Ir<strong>on</strong> <strong>and</strong> folic acid supplements <strong>and</strong> deworming Reduces micr<strong>on</strong>utrient defi ciency, pregnancy complicati<strong>on</strong>s,<br />
maternal mortality <strong>and</strong> low birthweight<br />
Multi-micr<strong>on</strong>utrient supplementati<strong>on</strong> Reduces micr<strong>on</strong>utrient defi ciency; c<strong>on</strong>tributes to improving<br />
birthweight <strong>and</strong> child growth <strong>and</strong> development<br />
Iodized salt c<strong>on</strong>sumed as table salt <strong>and</strong>/or as food-grade salt<br />
(used in food processing)<br />
Improves fetal development, cogniti<strong>on</strong> <strong>and</strong> intelligence in infant;<br />
reduces risks of complicati<strong>on</strong>s during pregnancy <strong>and</strong> delivery;<br />
prevents goitre, miscarriages, stillbirth <strong>and</strong> cretinism<br />
Treatment of night blindness in pregnancy C<strong>on</strong>trols maternal vitamin A defi ciency <strong>and</strong> subsequent defi ciency<br />
in early infancy<br />
Fortifi ed food (with ir<strong>on</strong>, folate, zinc, vitamin A, iodine) Reduces micr<strong>on</strong>utrient defi ciency <strong>and</strong> birth defects<br />
Improved use of locally available foods to ensure increased intake<br />
of important nutrients<br />
Fortifi ed food supplements (e.g., corn-soya blends, lipid-based<br />
nutrient supplements) for undernourished women<br />
Birth<br />
Interventi<strong>on</strong>s for the infant Justifi cati<strong>on</strong>/evidence<br />
Initiati<strong>on</strong> of breastfeeding within 1 hour<br />
(including colostrum feeding)<br />
Less than 6 m<strong>on</strong>ths<br />
Reduces wasting <strong>and</strong> micr<strong>on</strong>utrient defi ciencies; c<strong>on</strong>tributes to<br />
reducing low birthweight<br />
Reduces wasting <strong>and</strong> micr<strong>on</strong>utrient defi ciencies; c<strong>on</strong>tributes to<br />
reducing low birthweight<br />
C<strong>on</strong>tributes to reducti<strong>on</strong> of ne<strong>on</strong>atal deaths<br />
Interventi<strong>on</strong>s for the mother Justifi cati<strong>on</strong>/evidence<br />
Vitamin A supplement in fi rst 8 weeks after delivery Repleti<strong>on</strong> of maternal vitamin A status improves vitamin A c<strong>on</strong>tent<br />
of breastmilk; c<strong>on</strong>tributes to reducing vitamin A defi ciency in<br />
infants <strong>and</strong> reduces infecti<strong>on</strong>s<br />
Multi-micr<strong>on</strong>utrient supplementati<strong>on</strong> Reduces ir<strong>on</strong> <strong>and</strong> other micr<strong>on</strong>utrient defi ciencies in mother;<br />
improves quality of breastmilk<br />
Improved use of locally available foods, fortifi ed foods, micr<strong>on</strong>utrient<br />
supplementati<strong>on</strong>/home fortifi cati<strong>on</strong> <strong>and</strong> food supplements for<br />
undernourished women<br />
Interventi<strong>on</strong>s for the infant Justifi cati<strong>on</strong>/evidence<br />
Prevents maternal undernutriti<strong>on</strong>; helps maintain ability to<br />
breastfeed <strong>and</strong> ensure high-quality breastmilk<br />
Exclusive breastfeeding Assures optimal nutrient intake <strong>and</strong> prevents childhood disease<br />
<strong>and</strong> death<br />
Appropriate feeding of HIV-exposed infants C<strong>on</strong>tributes to reducing mother-to-child transmissi<strong>on</strong> of HIV <strong>and</strong> to<br />
reducing infant mortality<br />
Overview 33
Priority interventi<strong>on</strong>s for the preventi<strong>on</strong> of undernutriti<strong>on</strong> <strong>and</strong> the treatment<br />
of severe <strong>and</strong> moderate acute malnutriti<strong>on</strong> (c<strong>on</strong>tinued)<br />
34 <str<strong>on</strong>g>Tracking</str<strong>on</strong>g> <str<strong>on</strong>g>Progress</str<strong>on</strong>g> <strong>on</strong> <strong>Child</strong> <strong>and</strong> <strong>Maternal</strong> Nutriti<strong>on</strong><br />
Life cycle stage<br />
6–23 m<strong>on</strong>ths<br />
Interventi<strong>on</strong>s for the mother Justifi cati<strong>on</strong>/evidence<br />
Improved use of locally available foods, fortifi ed foods <strong>and</strong><br />
food supplements for undernourished women<br />
Helps maintain breastfeeding <strong>and</strong> ensure high-quality breastmilk,<br />
as well as prevent maternal undernutriti<strong>on</strong><br />
H<strong>and</strong> washing with soap Helps reduce diarrhoea <strong>and</strong> associated undernutriti<strong>on</strong> in the child<br />
Interventi<strong>on</strong>s for the young child Justifi cati<strong>on</strong>/evidence<br />
Timely, adequate, safe <strong>and</strong> appropriate complementary feeding<br />
(including improved use of local foods, multi-micr<strong>on</strong>utrient<br />
supplementati<strong>on</strong>, lipid-based nutrient supplements <strong>and</strong> fortifi ed<br />
complementary foods)<br />
Prevents <strong>and</strong> decreases underweight, stunting, wasting <strong>and</strong><br />
micr<strong>on</strong>utrient defi ciency <strong>and</strong> c<strong>on</strong>tributes to survival <strong>and</strong><br />
development; also c<strong>on</strong>tributes to reducing childhood obesity<br />
C<strong>on</strong>tinued breastfeeding Provides signifi cant source of nutrients; protects from infecti<strong>on</strong>s<br />
Appropriate feeding of HIV-exposed infants C<strong>on</strong>tributes to reducing mother-to-child transmissi<strong>on</strong> of HIV <strong>and</strong><br />
reducing child mortality<br />
Zinc treatment for diarrhoea Reduces durati<strong>on</strong> <strong>and</strong> severity of diarrhoea <strong>and</strong> subsequent<br />
episodes; reduces mortality<br />
Iodized salt c<strong>on</strong>sumed as table salt <strong>and</strong>/or as food-grade salt<br />
(used in food processing)<br />
Improves brain development; prevents motor <strong>and</strong><br />
hearing defi cits<br />
Vitamin A supplementati<strong>on</strong> <strong>and</strong> deworming C<strong>on</strong>tributes to reducing anaemia, vitamin A defi ciency <strong>and</strong><br />
undernutriti<strong>on</strong>, <strong>and</strong> to reducing child mortality<br />
Management of severe acute malnutriti<strong>on</strong> C<strong>on</strong>tributes to reducing child mortality<br />
Management of moderate acute malnutriti<strong>on</strong> Prevents progressi<strong>on</strong> to severe acute malnutriti<strong>on</strong> <strong>and</strong> c<strong>on</strong>tributes<br />
to reducing child mortality<br />
H<strong>and</strong> washing with soap Helps reduce diarrhoea <strong>and</strong> associated undernutriti<strong>on</strong><br />
24–59 m<strong>on</strong>ths<br />
Interventi<strong>on</strong>s for the young child Justifi cati<strong>on</strong>/evidence<br />
Vitamin A supplementati<strong>on</strong> with deworming C<strong>on</strong>tributes to reducing anaemia, vitamin A defi ciency <strong>and</strong><br />
undernutriti<strong>on</strong> <strong>and</strong> to reducing child mortality<br />
Multi-micr<strong>on</strong>utrient powder or fortifi ed foods for young children Reduces ir<strong>on</strong> <strong>and</strong> zinc defi ciency<br />
Iodized salt c<strong>on</strong>sumed as table salt <strong>and</strong>/or as food-grade salt<br />
(used in food processing)<br />
Improves brain development; prevents motor <strong>and</strong><br />
hearing defi cits<br />
Management of severe acute malnutriti<strong>on</strong> C<strong>on</strong>tributes to reducing child mortality<br />
Management of moderate acute malnutriti<strong>on</strong> Prevents progressi<strong>on</strong> to severe acute malnutriti<strong>on</strong> <strong>and</strong> c<strong>on</strong>tributes<br />
to reducing child mortality<br />
H<strong>and</strong> washing with soap Helps reduce diarrhoea <strong>and</strong> associated undernutriti<strong>on</strong><br />
Sources: Policy <strong>and</strong> guideline recommendati<strong>on</strong>s based <strong>on</strong> WHO <strong>and</strong> other UN agencies; publicati<strong>on</strong>s in The Lancet; Edm<strong>on</strong>d, Karen M., et al., ‘Delayed Breastfeeding Initiati<strong>on</strong> Increases Risk of<br />
Ne<strong>on</strong>atal Mortality’, Pediatrics, vol. 117, no. 3, March 2006, pp. 3380−3386; Singh, Kiran, <strong>and</strong> Purnima Srivasta, ‘The Effect of Colostrum <strong>on</strong> Infant Mortality: Urban-rural differentials’, Health <strong>and</strong><br />
Populati<strong>on</strong>, vol. 15, no. 3−4, July–December 1992, pp. 94−100; Mullany, Luke C., et al., ‘Breastfeeding Patterns, Time to Initiati<strong>on</strong> <strong>and</strong> Mortality Risk Am<strong>on</strong>g Newborns in Southern Nepal’, The<br />
Journal of Nutriti<strong>on</strong>, vol. 138, March 2008, pp. 599−603; Ramakrishnan, Usha, et al., ‘Effects of Micr<strong>on</strong>utrients <strong>on</strong> Growth of <strong>Child</strong>ren Under 5 Years of Age: Meta-analyses of single <strong>and</strong> multiple<br />
nutrient interventi<strong>on</strong>s’, The American Journal of Clinical Nutriti<strong>on</strong>, vol. 89, no. 1, January 2009, pp. 191−203.
6. UNDERLYING CAUSES<br />
OF UNDERNUTRITION:<br />
POVERTY, DISPARITIES<br />
AND OTHER<br />
SOCIAL FACTORS<br />
Poverty, inequity, low maternal educati<strong>on</strong> <strong>and</strong> women’s<br />
social status are am<strong>on</strong>g the underlying factors that need<br />
to be taken into c<strong>on</strong>siderati<strong>on</strong> <strong>and</strong> addressed in order to<br />
reduce undernutriti<strong>on</strong> in a sustained manner.<br />
Poverty<br />
The relati<strong>on</strong>ship between poverty <strong>and</strong> nutriti<strong>on</strong> is two-sided:<br />
Ec<strong>on</strong>omic growth, when it c<strong>on</strong>tributes to lowering the<br />
prevalence of poverty <strong>and</strong> food insecurity, can also lead to<br />
reduced undernutriti<strong>on</strong>, albeit at a slow pace. 32 Nutriti<strong>on</strong><br />
is <strong>on</strong>e of the key elements for human capital formati<strong>on</strong>,<br />
which in turn represents <strong>on</strong>e of the fundamental drivers of<br />
ec<strong>on</strong>omic growth. 33<br />
But ec<strong>on</strong>omic growth does not necessarily translate<br />
to better <strong>and</strong> equitable outcomes for all individuals in<br />
society, <strong>and</strong> the nutriti<strong>on</strong>al status of a populati<strong>on</strong> does<br />
not always depend <strong>on</strong> nati<strong>on</strong>al development, prosperity<br />
or ec<strong>on</strong>omic growth.<br />
<strong>Maternal</strong> <strong>and</strong> child nutriti<strong>on</strong> is the result of a wide variety<br />
of factors, refl ecting the quality of public health systems,<br />
caring practices in households <strong>and</strong> communities, society’s<br />
ability to deal with poverty, food insecurity for disadvantaged<br />
groups, the capacities of social justice <strong>and</strong> welfare<br />
systems, <strong>and</strong> the effectiveness of broader ec<strong>on</strong>omic <strong>and</strong><br />
social policies. Nutriti<strong>on</strong> status can therefore be improved<br />
even when ec<strong>on</strong>omic growth remains limited. 34 In fact,<br />
addressing undernutriti<strong>on</strong> helps to halt the intergenerati<strong>on</strong>al<br />
transmissi<strong>on</strong> of poverty.<br />
Equity<br />
Equity issues are important when assessing progress <strong>on</strong><br />
nutriti<strong>on</strong> globally. Analysing disparities in equity can lead<br />
to a better underst<strong>and</strong>ing of the causes of undernutriti<strong>on</strong>,<br />
<strong>and</strong> it can help identify <strong>and</strong> target interventi<strong>on</strong>s for the<br />
most vulnerable populati<strong>on</strong>s within a country or regi<strong>on</strong><br />
as part of a multi-sectoral nutriti<strong>on</strong> strategy.<br />
Although a number of countries have made progress<br />
combating child undernutriti<strong>on</strong>, closer scrutiny using<br />
an ‘equity lens’ reveals large inequities. The Plurinati<strong>on</strong>al<br />
State of Bolivia, for example, halved stunting prevalence<br />
am<strong>on</strong>g children under 5 years old between 1989 <strong>and</strong> 2003,<br />
but children in the poorest households are nearly six times<br />
as likely to be stunted as children in the richest households.<br />
In Peru, children in the poorest households are 11 times<br />
more likely to be stunted than children in the richest<br />
households. 35<br />
Relati<strong>on</strong>ships vary between stunting <strong>and</strong> poverty<br />
Percentage of children under 5 years old who are moderately or severely stunted, by household wealth quintile<br />
70%<br />
60%<br />
50%<br />
40%<br />
30%<br />
20%<br />
10%<br />
0%<br />
60<br />
54<br />
49<br />
41<br />
25<br />
54 53<br />
India Nigeria Ethiopia<br />
Egypt<br />
Note: Estimates are calculated according to the WHO <strong>Child</strong> Growth St<strong>and</strong>ards.<br />
Source: India: Nati<strong>on</strong>al Family Health Survey (2005–2006), Nigeria: DHS (2003), Ethiopia: DHS (2005), Egypt: DHS (2008).<br />
49<br />
36<br />
21<br />
53<br />
55<br />
52 51<br />
40<br />
30<br />
31<br />
Poorest 20%<br />
Sec<strong>on</strong>d 20%<br />
Middle 20%<br />
Fourth 20%<br />
Richest 20%<br />
27<br />
30<br />
27<br />
Overview 35
The relati<strong>on</strong>ship between stunting <strong>and</strong> wealth varies<br />
signifi cantly across countries. In India <strong>and</strong> Nigeria,<br />
children in the richest households are at a distinct advantage<br />
compared to children in other households. This<br />
c<strong>on</strong>trasts with Ethiopia, where stunting is widespread<br />
– even am<strong>on</strong>g children living in the wealthiest households,<br />
the prevalence of stunting is high, at 40 per cent – <strong>and</strong> in<br />
Egypt, where stunting prevalence is remarkably similar<br />
in all wealth quintiles.<br />
<strong>Child</strong>ren in rural areas in the developing world are almost<br />
twice as likely to be underweight as children in urban areas.<br />
Gender <strong>and</strong> social norms<br />
An analysis of nutriti<strong>on</strong> indicators at the global level reveals<br />
negligible differences between boys <strong>and</strong> girls under 5 years<br />
old. Similarly, programme coverage <strong>and</strong> practice data that<br />
are disaggregated by sex reveal no signifi cant differences<br />
<strong>on</strong> the basis of gender. But further disaggregati<strong>on</strong> of data<br />
from some countries indicates there might be differences in<br />
the feeding <strong>and</strong> care of girls compared to boys, presumably<br />
stemming from power relati<strong>on</strong>s <strong>and</strong> social norms that<br />
perpetuate discriminatory attitudes <strong>and</strong> practices. Data in<br />
some countries point to the possible effects, such as<br />
Bangladeshi boys being signifi cantly taller relative to their<br />
age than girls. 36 In sub-Saharan Africa, <strong>on</strong> the other h<strong>and</strong>,<br />
boys are more likely to be stunted than girls. 37<br />
Underweight prevalence, by<br />
gender <strong>and</strong> area of residence<br />
Percentage of children under 5 years old in developing<br />
countries who are moderately or severely underweight,<br />
by gender <strong>and</strong> area of residence<br />
50%<br />
40%<br />
30%<br />
20%<br />
10%<br />
0%<br />
23<br />
Male Female Urban Rural<br />
Note: Estimates are calculated according to the WHO <strong>Child</strong> Growth St<strong>and</strong>ards.<br />
Source: MICS, DHS <strong>and</strong> other nati<strong>on</strong>al surveys, 2003–2008.<br />
36 <str<strong>on</strong>g>Tracking</str<strong>on</strong>g> <str<strong>on</strong>g>Progress</str<strong>on</strong>g> <strong>on</strong> <strong>Child</strong> <strong>and</strong> <strong>Maternal</strong> Nutriti<strong>on</strong><br />
25<br />
16<br />
Gender Residence<br />
29<br />
<strong>Maternal</strong> educati<strong>on</strong><br />
Signifi cant disparity in nutriti<strong>on</strong>al status also exists in terms<br />
of mothers’ educati<strong>on</strong> <strong>and</strong> literacy. A number of studies<br />
<strong>and</strong> analyses have found a signifi cant associati<strong>on</strong> between<br />
low maternal literacy <strong>and</strong> poor nutriti<strong>on</strong> status of young<br />
children. An analysis of survey data from 17 developing<br />
countries, for example, c<strong>on</strong>fi rms a positive associati<strong>on</strong><br />
between maternal educati<strong>on</strong> <strong>and</strong> nutriti<strong>on</strong>al status in<br />
children 3–23 m<strong>on</strong>ths old, although a large part of these<br />
associati<strong>on</strong>s is the result of educati<strong>on</strong>’s str<strong>on</strong>g link to<br />
household ec<strong>on</strong>omics. 38 A study in Pakistan revealed that<br />
the majority of infants with signs of undernutriti<strong>on</strong> had<br />
mothers with virtually no schooling. The study also observed<br />
that the introducti<strong>on</strong> of complementary foods for infants<br />
at an appropriate age (6 m<strong>on</strong>ths) improved when mothers<br />
were educated. 39<br />
Women’s social status<br />
In many developing countries, the low status of women<br />
is c<strong>on</strong>sidered to be <strong>on</strong>e of the primary determinants of<br />
undernutriti<strong>on</strong> across the life cycle. Women’s low status<br />
can result in their own health outcomes being compromised,<br />
which in turn can lead to lower infant birthweight <strong>and</strong> may<br />
affect the quality of infant care <strong>and</strong> nutriti<strong>on</strong>. A study in<br />
India showed that women with higher aut<strong>on</strong>omy (indicated<br />
by access to m<strong>on</strong>ey <strong>and</strong> freedom to choose to go to the<br />
market) were signifi cantly less likely to have a stunted child<br />
when compared with their peers who had less aut<strong>on</strong>omy. 40
7. FACTORS FOR<br />
GOOD NUTRITION<br />
PROGRAMMING<br />
The packages of interventi<strong>on</strong>s for the preventi<strong>on</strong> <strong>and</strong><br />
treatment of undernutriti<strong>on</strong> described in Secti<strong>on</strong> 5 of this<br />
Overview must be implemented at a large scale if they are<br />
to translate to real gains in reducing child undernutriti<strong>on</strong>.<br />
Effective programming – based <strong>on</strong> adequate policies <strong>and</strong><br />
regulatory frameworks, str<strong>on</strong>g management <strong>and</strong> functi<strong>on</strong>ing<br />
service delivery systems, <strong>and</strong> backed by suffi cient<br />
resources – is also imperative to achieve a high coverage<br />
of service delivery <strong>and</strong> to effect widespread change in<br />
community <strong>and</strong> household behaviours <strong>and</strong> practices.<br />
Experience shows that it is entirely feasible to scale up<br />
nutriti<strong>on</strong> programmes <strong>and</strong> achieve marked improvements<br />
in caring behaviour <strong>and</strong> practices, especially when there<br />
is str<strong>on</strong>g government leadership <strong>and</strong> broad supporting<br />
partnerships. Over the past 5–10 years, for example,<br />
16 countries have recorded gains of 20 percentage points<br />
or more in exclusive breastfeeding rates. Many of these<br />
countries face serious development challenges, as well as<br />
emergency situati<strong>on</strong>s. The implementati<strong>on</strong> of large-scale<br />
programmes in these countries was based <strong>on</strong> nati<strong>on</strong>al<br />
policies <strong>and</strong> often guided by the WHO-UNICEF Global<br />
Strategy for Infant <strong>and</strong> Young <strong>Child</strong> Feeding. Country<br />
programmes included the adopti<strong>on</strong> <strong>and</strong> implementati<strong>on</strong> of<br />
nati<strong>on</strong>al legislati<strong>on</strong> <strong>on</strong> the Internati<strong>on</strong>al Code of Marketing<br />
of Breastmilk Substitutes <strong>and</strong> subsequent World Health<br />
Assembly resoluti<strong>on</strong>s, as well as maternity protecti<strong>on</strong> for<br />
working women. Further acti<strong>on</strong>s included ensuring that<br />
breastfeeding was initiated in maternity facilities (<strong>and</strong> that<br />
no infant formula was given in the facilities), building health<br />
worker capacity to offer counselling <strong>on</strong> infant <strong>and</strong> young<br />
child feeding, <strong>and</strong> mother-to-mother support groups in the<br />
community. These acti<strong>on</strong>s were accompanied by communicati<strong>on</strong><br />
strategies to promote breastfeeding using multiple<br />
channels <strong>and</strong> messages tailored to the local c<strong>on</strong>text. 41<br />
16 developing countries increased exclusive breastfeeding rates by 20 percentage points or more<br />
Trends in the percentage of infants under 6 m<strong>on</strong>ths old who are exclusively breastfed<br />
80%<br />
60%<br />
40%<br />
20%<br />
0%<br />
3<br />
23<br />
Central<br />
African<br />
Republic<br />
(1994, 2006)<br />
3<br />
26<br />
Uzbekistan<br />
(1996,<br />
2006)<br />
Source: MICS, DHS <strong>and</strong> other nati<strong>on</strong>al surveys.<br />
6<br />
34<br />
Senegal<br />
(1993,<br />
2005)<br />
16<br />
36<br />
Lesotho<br />
(1996,<br />
2004)<br />
16<br />
37<br />
Pakistan<br />
(1995,<br />
2007)<br />
8<br />
38<br />
Mali<br />
(1996,<br />
2006)<br />
7<br />
40<br />
Turkey<br />
(1998,<br />
2008)<br />
10<br />
43<br />
Benin<br />
(1996,<br />
2006)<br />
12<br />
47<br />
Colombia<br />
(1995,<br />
2005)<br />
11<br />
48<br />
Guinea<br />
(1999,<br />
2008)<br />
10<br />
48<br />
Togo<br />
(1998,<br />
2008)<br />
12<br />
60<br />
Cambodia<br />
(2000,<br />
2005)<br />
19<br />
61<br />
Zambia<br />
(1996,<br />
2007)<br />
7<br />
63<br />
Ghana<br />
(1993,<br />
2008)<br />
38<br />
67<br />
Madagascar<br />
(1992, 2004)<br />
53<br />
76<br />
Sri Lanka<br />
(2000,<br />
2007)<br />
Overview 37
The recent global initiative <strong>on</strong> community-based treatment<br />
of severe acute malnutriti<strong>on</strong> is an excellent example of<br />
partnership am<strong>on</strong>g many organizati<strong>on</strong>s working together<br />
to reach children with life-saving services not available to<br />
them before. A total of 42 countries in Africa, Asia <strong>and</strong> the<br />
Middle East, including countries facing chr<strong>on</strong>ic or acute<br />
emergencies, have fi nalized or drafted integrated guidelines<br />
<strong>and</strong> acti<strong>on</strong> plans for scale-up <strong>and</strong> integrati<strong>on</strong> within the<br />
regular health system. 42 Guidance <strong>on</strong> planning <strong>and</strong> implementati<strong>on</strong><br />
has been provided by internati<strong>on</strong>al partners,<br />
<strong>and</strong> health-worker capacity has been strengthened. In<br />
parallel, the producti<strong>on</strong> <strong>and</strong> distributi<strong>on</strong> of therapeutic<br />
products has drastically increased, particularly for<br />
ready-to-use therapeutic food. 43<br />
While prioritizing the accelerati<strong>on</strong> of programmes<br />
to provide treatment for children with severe acute<br />
malnutriti<strong>on</strong>, it is also important to implement acti<strong>on</strong>s<br />
to prevent it – including measures to exp<strong>and</strong> infant <strong>and</strong><br />
young child feeding, improve health care <strong>and</strong> hygiene<br />
c<strong>on</strong>diti<strong>on</strong>s, <strong>and</strong> promote food security.<br />
In many countries, integrated child health events have<br />
proved effective in delivering vitamin A. This approach<br />
– which employs good planning, capacity strengthening<br />
<strong>and</strong> the pooling of resources – allows for wide coverage<br />
of a package of interventi<strong>on</strong>s in situati<strong>on</strong>s where delivery<br />
through routine health services is limited.<br />
38 <str<strong>on</strong>g>Tracking</str<strong>on</strong>g> <str<strong>on</strong>g>Progress</str<strong>on</strong>g> <strong>on</strong> <strong>Child</strong> <strong>and</strong> <strong>Maternal</strong> Nutriti<strong>on</strong><br />
Integrated child health<br />
events improve vitamin A<br />
supplementati<strong>on</strong> coverage<br />
in Mozambique <strong>and</strong> Zambia<br />
Many countries are using integrated child health events<br />
to signifi cantly increase coverage of selected health<br />
<strong>and</strong> nutriti<strong>on</strong> interventi<strong>on</strong>s <strong>and</strong> to improve equity of<br />
coverage. In 2008, Mozambique introduced integrated<br />
<strong>Child</strong> Health Weeks in order to achieve high coverage of<br />
this type of essential child survival interventi<strong>on</strong>, particularly<br />
in hard-to-reach populati<strong>on</strong>s. The <strong>Child</strong> Health Weeks<br />
offer vitamin A supplements, deworming, measles<br />
vaccinati<strong>on</strong>, nutriti<strong>on</strong> screening, nutriti<strong>on</strong> messages <strong>on</strong><br />
breastfeeding <strong>and</strong> distributi<strong>on</strong> of iodized oil supplements.<br />
A key feature of these events is that services are offered<br />
closer to people’s homes.<br />
For the fi rst round of <strong>Child</strong> Health Weeks in March–April<br />
2008, Mozambique achieved more than 80 per cent<br />
coverage of vitamin A supplementati<strong>on</strong>, made possible<br />
by integrated, district-level micro-planning, supportive<br />
supervisi<strong>on</strong> of community-level workers, <strong>and</strong> m<strong>on</strong>itoring.<br />
Integrati<strong>on</strong> of the planning of <strong>Child</strong> Health Weeks into<br />
comprehensive district-level planning processes is<br />
expected to enhance sustainability. After the fi rst<br />
child-health event, post-event coverage analysis identifi<br />
ed low-performing districts so that implementati<strong>on</strong><br />
could be improved for subsequent distributi<strong>on</strong> rounds.<br />
Zambia has supported integrated child health events<br />
for a decade now, <strong>and</strong> has achieved progressively high<br />
coverage of essential child health <strong>and</strong> nutriti<strong>on</strong> interventi<strong>on</strong>s.<br />
<strong>Child</strong> Health Weeks were initially introduced to<br />
increase coverage of interventi<strong>on</strong>s such as vitamin A<br />
supplementati<strong>on</strong>. Increased dem<strong>and</strong> for services eventually<br />
led to expansi<strong>on</strong> of <strong>Child</strong> Health Weeks to include<br />
additi<strong>on</strong>al high-impact interventi<strong>on</strong>s such as routine<br />
childhood vaccinati<strong>on</strong>s, health educati<strong>on</strong>, promoti<strong>on</strong><br />
of h<strong>and</strong> washing, nutriti<strong>on</strong>al screening, HIV testing,<br />
family planning <strong>and</strong> management of comm<strong>on</strong><br />
childhood illnesses.<br />
Given its success in increasing coverage of these<br />
interventi<strong>on</strong>s, particularly in hard-to-reach areas of the<br />
country, the Government has instituti<strong>on</strong>alized <strong>Child</strong><br />
Health Weeks. In 2008, all but two provinces reported<br />
vitamin A <strong>and</strong> deworming coverage of more than<br />
80 per cent. One recent innovati<strong>on</strong> has the country’s<br />
leading mobile ph<strong>on</strong>e service sending out free text<br />
messages urging parents <strong>and</strong> caregivers to participate.<br />
Sources: UNICEF Mozambique Country Offi ce, ‘Annual Report 2008’, <strong>and</strong> UNICEF<br />
Zambia Country Offi ce, ‘Annual Report 2008’ (internal documents).
PROGRAMME SUCCESS FACTORS<br />
1. Situati<strong>on</strong> analysis: The starting point in the design<br />
of programmes should always be the analysis of<br />
the local nutriti<strong>on</strong> situati<strong>on</strong> <strong>and</strong> its determinants,<br />
including household food security, poverty <strong>and</strong><br />
social issues. This analysis should form the basis for<br />
appropriate nati<strong>on</strong>al policies, adequate legislative<br />
frameworks <strong>and</strong> strategies that ensure the best use<br />
of local resources. Policy guidance <strong>and</strong> technical<br />
documentati<strong>on</strong> <strong>on</strong> internati<strong>on</strong>al norms already<br />
established can facilitate policy design <strong>and</strong> choice<br />
of implementati<strong>on</strong> strategy.<br />
2. Political commitment <strong>and</strong> partnership: Str<strong>on</strong>g<br />
<strong>and</strong> clear government ownership, leadership <strong>and</strong><br />
commitment are keys to the success of any nutriti<strong>on</strong><br />
programme. Nutriti<strong>on</strong> often falls within the m<strong>and</strong>ate<br />
of several departments, so programmes require clear<br />
roles <strong>and</strong> resp<strong>on</strong>sibilities; similar clarity <strong>and</strong> wellcoordinated<br />
support is required from the internati<strong>on</strong>al<br />
community. The Renewed Efforts Against <strong>Child</strong>hood<br />
Hunger <strong>and</strong> Undernutriti<strong>on</strong> (REACH) initiative<br />
provides a good example of inter-agency collaborati<strong>on</strong><br />
<strong>and</strong> partnerships to improve nutriti<strong>on</strong> (see box<br />
<strong>on</strong> the next page).<br />
3. Linkages with other sectors: The packages of nutriti<strong>on</strong><br />
interventi<strong>on</strong>s described in this report need to be<br />
implemented in c<strong>on</strong>juncti<strong>on</strong> with relevant health<br />
<strong>and</strong> water/sanitati<strong>on</strong> interventi<strong>on</strong>s – particularly<br />
those addressing treatment <strong>and</strong> preventi<strong>on</strong> of the<br />
major childhood illnesses closely associated with<br />
undernutriti<strong>on</strong> (diarrhoea, pneum<strong>on</strong>ia, malaria,<br />
measles, <strong>and</strong> HIV <strong>and</strong> AIDS). Better household food<br />
security, through strengthened agricultural <strong>and</strong><br />
social protecti<strong>on</strong> programmes, is essential to<br />
sustain efforts to improve nutriti<strong>on</strong>.<br />
4. Capacity-building: Early initiati<strong>on</strong> of breastfeeding<br />
<strong>and</strong> exclusive breastfeeding can be effectively<br />
promoted using various channels at all levels of the<br />
primary-health-care system, including antenatal<br />
care clinics <strong>and</strong> traditi<strong>on</strong>al birth attendants; home<br />
visits by community health workers; immunizati<strong>on</strong><br />
<strong>and</strong> weighing sessi<strong>on</strong>s, <strong>and</strong> sick child c<strong>on</strong>sultati<strong>on</strong>s;<br />
<strong>and</strong> services to prevent mother-to-child transmissi<strong>on</strong><br />
of HIV <strong>and</strong> provide paediatric AIDS treatment.<br />
For health workers to do this work effectively, the<br />
reach <strong>and</strong> coverage of the health system needs to<br />
be reviewed, opportunities identifi ed, <strong>and</strong> knowledge<br />
<strong>and</strong> skills updated <strong>and</strong> strengthened. Capacity<br />
building is therefore critical to the success of<br />
nutriti<strong>on</strong> programmes.<br />
5. Communicati<strong>on</strong> <strong>and</strong> community: Experience shows<br />
that effective large-scale communicati<strong>on</strong> campaigns<br />
<strong>and</strong> community involvement are key c<strong>on</strong>diti<strong>on</strong>s for<br />
programmes that seek to improve child care <strong>and</strong><br />
nutriti<strong>on</strong> <strong>and</strong> promote behavioural change. Regular<br />
support <strong>and</strong> counselling of caregivers at the<br />
community level in a comprehensive manner, with<br />
messaging <strong>on</strong> feeding, care, hygiene, <strong>and</strong> disease<br />
preventi<strong>on</strong> <strong>and</strong> treatment, can lead to positive<br />
outcomes. For this purpose, many countries<br />
successfully rely <strong>on</strong> community-based volunteers<br />
who work closely with offi cial service providers.<br />
Str<strong>on</strong>g emphasis <strong>on</strong> quality implementati<strong>on</strong> of<br />
planned activities at the community level includes<br />
supportive supervisi<strong>on</strong> <strong>and</strong> c<strong>on</strong>tinuous m<strong>on</strong>itoring<br />
<strong>and</strong> evaluati<strong>on</strong> with feedback mechanisms. The<br />
noti<strong>on</strong> of communities as passive recipients of<br />
services is no l<strong>on</strong>ger valid; they are active agents<br />
for identifying <strong>and</strong> addressing gaps, assuming<br />
resp<strong>on</strong>sibilities <strong>and</strong> ensuring that adequate nutriti<strong>on</strong><br />
is provided for all.<br />
6. Corporate social resp<strong>on</strong>sibility: The involvement of<br />
the private sector can ensure the availability of<br />
appropriate <strong>and</strong> affordable products, such as highquality<br />
foods for complementary feeding <strong>and</strong><br />
supplementary feeding, <strong>and</strong> micr<strong>on</strong>utrient-fortifi ed<br />
staple foods <strong>and</strong> supplements. This is an important<br />
strategy that can both improve access to quality<br />
foods <strong>and</strong> lead to increased local producti<strong>on</strong>. With its<br />
extensive access to populati<strong>on</strong>s, the private sector<br />
also has a role in encouraging behaviour change that<br />
promotes healthy lifestyles <strong>and</strong> good nutriti<strong>on</strong>. In this<br />
way, corporate social resp<strong>on</strong>sibility can help improve<br />
child <strong>and</strong> maternal nutriti<strong>on</strong>. It is critical that companies<br />
comply with the Internati<strong>on</strong>al Code of Marketing<br />
of Breastmilk Substitutes <strong>and</strong> all relevant st<strong>and</strong>ards.<br />
7. Resources: Nutriti<strong>on</strong> programmes are usually severely<br />
under-resourced – despite evidence of their effectiveness.<br />
The Copenhagen C<strong>on</strong>sensus 2008, for example,<br />
listed nutriti<strong>on</strong> interventi<strong>on</strong>s am<strong>on</strong>g the most costeffective<br />
acti<strong>on</strong>s to tackle some of the world’s most<br />
pressing challenges. According to the Copenhagen<br />
C<strong>on</strong>sensus, a global investment of US$60 milli<strong>on</strong><br />
per year for vitamin A <strong>and</strong> zinc supplementati<strong>on</strong><br />
would yield a return in benefi ts of US$1 billi<strong>on</strong>. 44 The<br />
programme ‘A Good Start in Life’ in Peru documented<br />
a signifi cant reducti<strong>on</strong> in stunting at an annual cost<br />
of about US$117 per child. 45 The REACH initiative is<br />
estimated to need about US$36 per child per year to<br />
implement an integrated programme with costeffective<br />
interventi<strong>on</strong>s. 46 Although the cost of<br />
programmes will vary widely between countries,<br />
depending <strong>on</strong> many local c<strong>on</strong>diti<strong>on</strong>s, these fi gures<br />
provide an indicati<strong>on</strong> of the resources required.<br />
Overview 39
Ending child hunger <strong>and</strong><br />
undernutriti<strong>on</strong> in Mauritania:<br />
The REACH partnership<br />
As part of the global REACH effort to end child hunger,<br />
Mauritania, al<strong>on</strong>g with the Lao People’s Democratic<br />
Republic, was the site of a pilot project launched in<br />
June 2008. REACH – Renewed Efforts Against <strong>Child</strong><br />
Hunger <strong>and</strong> Undernutriti<strong>on</strong> – is driven by a partnership<br />
between governments, n<strong>on</strong>-governmental <strong>and</strong> civil<br />
society organizati<strong>on</strong>s, <strong>and</strong> the United Nati<strong>on</strong>s, with the<br />
goal of improving effi ciency <strong>and</strong> coordinati<strong>on</strong> of the<br />
work to advance children’s nutriti<strong>on</strong>al status. It aims to<br />
accelerate progress towards MDG 1, target 3 (halve the<br />
underweight rate am<strong>on</strong>g children under 5 by 2015) <strong>and</strong><br />
dramatically reduce child hunger <strong>and</strong> undernutriti<strong>on</strong><br />
in a single generati<strong>on</strong>.<br />
In Mauritania, a working group of government, UN<br />
<strong>and</strong> internati<strong>on</strong>al n<strong>on</strong>-governmental organizati<strong>on</strong> staff,<br />
supported by a facilitator, developed a detailed nutriti<strong>on</strong><br />
acti<strong>on</strong> plan. The outcome has already been positive.<br />
Coordinated distributi<strong>on</strong> of vitamin A <strong>and</strong> mebendazole<br />
(a deworming drug) in the south, for example, has<br />
reduced resource waste <strong>and</strong> duplicati<strong>on</strong> of efforts.<br />
Another positive outcome has been the launch of<br />
an improved referral <strong>and</strong> m<strong>on</strong>itoring system for<br />
supplementary <strong>and</strong> therapeutic feeding.<br />
The direct impact <strong>on</strong> nutriti<strong>on</strong>al status is shown by<br />
improvements in specifi c indicators. Preliminary results<br />
of data collected in 2008 indicate substantial improvements<br />
in household c<strong>on</strong>sumpti<strong>on</strong> of adequately iodized<br />
salt <strong>and</strong> in rates of exclusive breastfeeding between 2007<br />
<strong>and</strong> 2008. There is optimism that the programmatic efforts<br />
made through REACH will ultimately lead to improved<br />
growth, survival <strong>and</strong> development for Mauritania’s children.<br />
The work in Mauritania has also led to the formati<strong>on</strong> of a<br />
West African regi<strong>on</strong>al nutriti<strong>on</strong> working group, developed<br />
to improve support to country teams <strong>and</strong> help mainstream<br />
the REACH approach. The working group assists in-country<br />
facilitators; provides tools, workshops <strong>and</strong> advice; <strong>and</strong><br />
fosters advocacy, research <strong>and</strong> capacity-building in<br />
collaborati<strong>on</strong> with such regi<strong>on</strong>al bodies as the Ec<strong>on</strong>omic<br />
Community of West African States.<br />
Sources: UNICEF, ‘Report <strong>on</strong> implementati<strong>on</strong> of the Ending <strong>Child</strong> Hunger <strong>and</strong><br />
Undernutriti<strong>on</strong> Initiative’, E/ICEF/2008/11, Executive Board Annual Sessi<strong>on</strong> 2008<br />
(19 May 2008); <strong>and</strong> Enquête rapide nati<strong>on</strong>ale sur la nutriti<strong>on</strong> et survie de l’enfant<br />
en Mauritanie, Government of Mauritania, Ministry of Health, <strong>and</strong> UNICEF,<br />
Nouakchott, December 2008.<br />
40 <str<strong>on</strong>g>Tracking</str<strong>on</strong>g> <str<strong>on</strong>g>Progress</str<strong>on</strong>g> <strong>on</strong> <strong>Child</strong> <strong>and</strong> <strong>Maternal</strong> Nutriti<strong>on</strong><br />
8. THE WAY FORWARD<br />
Clear <strong>and</strong> compelling evidence <strong>on</strong> the magnitude of<br />
undernutriti<strong>on</strong> as well as its c<strong>on</strong>sequences is well<br />
documented. Clear evidence also exists c<strong>on</strong>cerning<br />
effective interventi<strong>on</strong>s to prevent undernutriti<strong>on</strong> <strong>and</strong> the<br />
critical window of opportunity to deliver them – during a<br />
woman’s pregnancy <strong>and</strong> before a child reaches age 2.<br />
Without delay, these effective interventi<strong>on</strong>s need to be<br />
implemented at scale. Evidence of successful programmes<br />
in a number of countries – salt iodizati<strong>on</strong>, vitamin A supplementati<strong>on</strong>,<br />
exclusive breastfeeding <strong>and</strong> community-based<br />
treatment of severe acute malnutriti<strong>on</strong> – shows that this can<br />
be d<strong>on</strong>e rapidly <strong>and</strong> effectively, <strong>and</strong> the experiences gained<br />
in these programmes can be used as a guide. Effective<br />
health <strong>and</strong> water <strong>and</strong> sanitati<strong>on</strong> programmes to prevent<br />
<strong>and</strong> treat infectious diseases must go h<strong>and</strong> in h<strong>and</strong> with<br />
implementati<strong>on</strong> of the package of nutriti<strong>on</strong> interventi<strong>on</strong>s.<br />
To sustain improvement, underlying causes of undernutriti<strong>on</strong><br />
such as social norms, gender <strong>and</strong> equity issues must be<br />
addressed. An improvement in the status of women –<br />
including access to educati<strong>on</strong> <strong>and</strong> health care, a higher<br />
degree of decisi<strong>on</strong>-making power <strong>and</strong> gender equality – will<br />
c<strong>on</strong>tribute to marked <strong>and</strong> sustained improvements in child<br />
nutriti<strong>on</strong>. Poverty, chr<strong>on</strong>ic <strong>and</strong> acute emergencies, <strong>and</strong> lack<br />
of access to resources often lead to food <strong>and</strong> nutriti<strong>on</strong><br />
insecurity, <strong>and</strong> in these situati<strong>on</strong>s, social protecti<strong>on</strong> schemes<br />
as well as programmes to enhance food producti<strong>on</strong> <strong>and</strong><br />
household food <strong>and</strong> nutriti<strong>on</strong> security must be exp<strong>and</strong>ed.<br />
A global momentum is needed that will entail unifi ed <strong>and</strong><br />
compelling advocacy am<strong>on</strong>g governments, lead organizati<strong>on</strong>s<br />
<strong>and</strong> instituti<strong>on</strong>s. Enhanced advocacy <strong>and</strong> resources,<br />
in combinati<strong>on</strong> with strengthened collaborati<strong>on</strong> <strong>and</strong><br />
effective coordinati<strong>on</strong> at the internati<strong>on</strong>al level, should be<br />
refl ected at the country level, with clear nati<strong>on</strong>al ownership<br />
<strong>and</strong> leadership.<br />
For the sake of the survival, growth <strong>and</strong> development of<br />
milli<strong>on</strong>s of children <strong>and</strong> the overall development of many<br />
countries, we cannot afford to neglect this issue.
REFERENCES<br />
1 Pelletier, David L., et al., ‘Epidemiologic Evidence for a Potentiating Effect<br />
of Malnutriti<strong>on</strong> <strong>on</strong> <strong>Child</strong> Mortality’, American Journal of Public Health,<br />
vol. 83, no. 8, August 1993, pp. 1130–1133; <strong>and</strong> Habicht, Jean-Pierre,<br />
‘Malnutriti<strong>on</strong> Kills Directly, Not Indirectly’, The Lancet, vol. 371, no. 9626,<br />
24–30 May 2008, pp. 1749–1750.<br />
2 Black, Robert E., et al., ‘<strong>Maternal</strong> <strong>and</strong> <strong>Child</strong> Undernutriti<strong>on</strong>: Global <strong>and</strong><br />
regi<strong>on</strong>al exposures <strong>and</strong> health c<strong>on</strong>sequences’,The Lancet, vol. 371,<br />
no. 9608, 19 January 2008, pp. 243–260. Note that earlier estimates of<br />
more than 50 per cent of deaths being caused by undernutriti<strong>on</strong> relate to<br />
the age group 6–59 m<strong>on</strong>ths, whereas the latest estimate extends to all<br />
children under 5 years old.<br />
3 Black, Robert E., et al., ‘<strong>Maternal</strong> <strong>and</strong> <strong>Child</strong> Undernutriti<strong>on</strong>: Global <strong>and</strong><br />
regi<strong>on</strong>al exposures <strong>and</strong> health c<strong>on</strong>sequences’, The Lancet, vol. 371,<br />
no. 9608, 19 January 2008, pp. 243–260.<br />
4 Ibid.<br />
5 Pelletier, David L., et al., ‘Epidemiologic Evidence for a Potentiating Effect<br />
of Malnutriti<strong>on</strong> <strong>on</strong> <strong>Child</strong> Mortality’, American Journal of Public Health,<br />
vol. 83, no. 8, August 1993, pp. 1130–1133; <strong>and</strong> Habicht, Jean-Pierre,<br />
‘Malnutriti<strong>on</strong> Kills Directly, Not Indirectly’, The Lancet, vol. 371, no. 9626,<br />
24–30 May 2008, pp. 1749–1750.<br />
6 Black, Robert E., et al., ‘<strong>Maternal</strong> <strong>and</strong> <strong>Child</strong> Undernutriti<strong>on</strong>: Global <strong>and</strong><br />
regi<strong>on</strong>al exposures <strong>and</strong> health c<strong>on</strong>sequences’, The Lancet, vol. 371,<br />
no. 9608, 19 January 2008, pp. 243–260.<br />
7 J<strong>on</strong>es, Gareth, et al., ‘How many child deaths can we prevent this year?’<br />
The Lancet, vol. 362, no. 9377, 5 July 2003, pp. 65–71.<br />
8 WHO Collaborative Study Team <strong>on</strong> the Role of Breastfeeding <strong>on</strong> the<br />
Preventi<strong>on</strong> of Infant Mortality, ‘Effect of Breastfeeding <strong>on</strong> Infant <strong>and</strong> <strong>Child</strong><br />
Mortality Due to Infectious Diseases in Less Developed Countries: A<br />
pooled analysis’, The Lancet, vol. 355, no. 9202, 2000, pp. 451–455.<br />
9 Beat<strong>on</strong>. G. H., et al., ‘Effectiveness of Vitamin A Supplementati<strong>on</strong> in the<br />
C<strong>on</strong>trol of Young <strong>Child</strong> Morbidity <strong>and</strong> Mortality in Developing Countries’,<br />
Nutriti<strong>on</strong> Policy Discussi<strong>on</strong> Paper, no. 13, United Nati<strong>on</strong>s System St<strong>and</strong>ing<br />
Committee <strong>on</strong> Nutriti<strong>on</strong>, Geneva, 1993, pp. 4–6.<br />
10 Micr<strong>on</strong>utrient Initiative, ‘Investing in the Future: A united call to acti<strong>on</strong> <strong>on</strong><br />
vitamin <strong>and</strong> mineral defi ciencies – Global report 2009’, Micr<strong>on</strong>utrient<br />
Initiative, Ottawa, 2009, pp. 5–6.<br />
11 Shrimpt<strong>on</strong>, Roger, et al., ‘Worldwide Timing of Growth Faltering:<br />
Implicati<strong>on</strong>s for nutriti<strong>on</strong>al interventi<strong>on</strong>s,’ Pediatrics, vol. 107, no. 5,<br />
May 2001, pp. 5–6.<br />
12 Victora, Cesar G., et al., ‘<strong>Maternal</strong> <strong>and</strong> <strong>Child</strong> Undernutriti<strong>on</strong>: C<strong>on</strong>sequences<br />
for adult health <strong>and</strong> human capital’, The Lancet, vol. 371, no. 9609,<br />
26 January 2008, pp. 340–357.<br />
13 Bleichrodt, N., <strong>and</strong> M. Born, ‘A Meta-analysis of Research into Iodine <strong>and</strong><br />
Its Relati<strong>on</strong>ship to Cognitive Development’, in The Damaged Brain of<br />
Iodine Defi ciency, edited by John B. Stanbury, Cognizant Communicati<strong>on</strong><br />
Corporati<strong>on</strong>, New York, 1994, pp. 195–200.<br />
14 Lozoff, Betsy, Elias Jimenez <strong>and</strong> Julia B. Smith, ‘Double Burden of Ir<strong>on</strong><br />
Defi ciency <strong>and</strong> Low Socio-Ec<strong>on</strong>omic Status: A l<strong>on</strong>gitudinal analysis of<br />
cognitive test scores to 19 years’, Archives of Pediatric & Adolescent<br />
Medicine, vol. 160, no. 11, November 2006, pp. 1108–1113.<br />
15 Black, Robert E., et al., ‘<strong>Maternal</strong> <strong>and</strong> <strong>Child</strong> Undernutriti<strong>on</strong>: Global <strong>and</strong><br />
regi<strong>on</strong>al exposures <strong>and</strong> health c<strong>on</strong>sequences’, The Lancet, vol. 371,<br />
no. 9608, 19 January 2008, pp. 243–260.<br />
16 Hunt, Joseph, M., ‘Reversing Productivity Losses from Ir<strong>on</strong> Defi ciency:<br />
The ec<strong>on</strong>omic case’, Journal of Nutriti<strong>on</strong>, vol. 132, 4 suppl., April 2002,<br />
pp. 794S–801S.<br />
17 Victora, Cesar G., et al., ‘<strong>Maternal</strong> <strong>and</strong> <strong>Child</strong> Undernutriti<strong>on</strong>: C<strong>on</strong>sequences<br />
for adult health <strong>and</strong> human capital’, The Lancet, vol. 371, no. 9609,<br />
26 January 2008, pp. 340–357.<br />
18 Ibid.<br />
19 Ibid.<br />
20 Hoddinott, John, et al., ‘Effect of a Nutriti<strong>on</strong> Interventi<strong>on</strong> during Early<br />
<strong>Child</strong>hood <strong>on</strong> Ec<strong>on</strong>omic Productivity in Guatemalan Adults’, The Lancet,<br />
vol. 371, 2 February 2008, pp. 411–416.<br />
21 Republic of H<strong>on</strong>duras <strong>and</strong> ORC Macro, ‘Nati<strong>on</strong>al Demographic <strong>and</strong> Health<br />
Survey, 2005–06’, Macro Internati<strong>on</strong>al, Calvert<strong>on</strong>, MD, December 2006.<br />
22 World Health Organizati<strong>on</strong>, ‘Global Prevalence of Vitamin A Defi ciency in<br />
Populati<strong>on</strong>s at Risk 1995–2005: WHO global database <strong>on</strong> vitamin A<br />
defi ciency’, WHO, Geneva, 2009, pp. 10–11.<br />
23 Benoist, Bruno de, et al., editors, ‘Worldwide Prevalence of Anaemia<br />
1993–2005: WHO global database <strong>on</strong> anaemia’, World Health Organizati<strong>on</strong><br />
<strong>and</strong> Centers for Disease C<strong>on</strong>trol <strong>and</strong> Preventi<strong>on</strong>, Geneva <strong>and</strong> Atlanta, GA,<br />
2008, p. 8.<br />
24 Benoist, Bruno de, et al., ‘Iodine Defi ciency in 2007: Global progress since<br />
2003’, Food <strong>and</strong> Nutriti<strong>on</strong> Bulletin, vol. 29, no. 3, 2008, pp. 195–202.<br />
25 Edm<strong>on</strong>d, Karen, et al., ‘Delayed Breastfeeding Initiati<strong>on</strong> Increases Risk of<br />
Ne<strong>on</strong>atal Mortality’, Pediatrics, vol. 117, no. 3, 1 March 2006, pp. e380–e386;<br />
<strong>and</strong> Mullany, Luke C., et al., ‘Breastfeeding Patterns, Time to Initiati<strong>on</strong> <strong>and</strong><br />
Mortality Risk Am<strong>on</strong>g Newborns in Southern Nepal’, Journal of Nutriti<strong>on</strong>,<br />
vol. 138, March 2008, pp. 599–603.<br />
26 Huffman, S<strong>and</strong>ra L., et al., ‘Can Improvements in Breast-feeding Practices<br />
Reduce Ne<strong>on</strong>atal Mortality in Developing Countries?’, Midwifery, vol. 17,<br />
no. 2, June 2001, pp. 84–86.<br />
27 Ramakrishnan, Usha, et al., ‘Effects of Micr<strong>on</strong>utrients <strong>on</strong> Growth of<br />
<strong>Child</strong>ren under 5 Years of Age: Meta-analyses of single <strong>and</strong> multiple<br />
nutrient interventi<strong>on</strong>s’, American Journal of Clinical Nutriti<strong>on</strong>, vol. 89,<br />
no. 1, January 2009, pp. 191–203.<br />
28 UNICEF analysis of data from 109 rounds of vitamin A delivery in<br />
55 countries in 2008 (internal database, 2008).<br />
29 Flour Fortifi cati<strong>on</strong> Initiative, ‘Map of Global <str<strong>on</strong>g>Progress</str<strong>on</strong>g>: Fortifi cati<strong>on</strong><br />
status – March 2009’, FFI, Atlanta, GA, , accessed 25 September 2009.<br />
30 Dewey, Kathryn G., et al., ‘Systematic Review <strong>and</strong> Meta-Analysis of Home<br />
Fortifi cati<strong>on</strong> of Complementary Foods’, <strong>Maternal</strong> <strong>and</strong> <strong>Child</strong> Nutriti<strong>on</strong>, 2009,<br />
vol. 5, issue 4, pp. 283–321.<br />
31 United Nati<strong>on</strong>s <strong>Child</strong>ren’s Fund, ‘Workshop Report <strong>on</strong> Scaling Up<br />
the Use of Multiple Micr<strong>on</strong>utrient Powders to Improve the Quality of<br />
Complementary Foods for Young <strong>Child</strong>ren in Asia’, UNICEF, 2009, p. 2.<br />
32 Haddad, Lawrence, et al., ‘Reducing <strong>Child</strong> Undernutriti<strong>on</strong>: How far does<br />
income growth take us?’, FCND Discussi<strong>on</strong> Paper, no. 137, Internati<strong>on</strong>al<br />
Food Policy Research Institute, Washingt<strong>on</strong>, D.C., August 2002, p. 24.<br />
33 Hunt, Joseph M., ‘The Potential Impact of Reducing Global Malnutriti<strong>on</strong> <strong>on</strong><br />
Poverty Reducti<strong>on</strong> <strong>and</strong> Ec<strong>on</strong>omic Development’, Asia Pacifi c Journal of<br />
Clinical Nutriti<strong>on</strong>, vol.14, CD Supplement, pp. 10–38.<br />
34 Jolly, Richard, ‘Nutriti<strong>on</strong>’, Our Planet, United Nati<strong>on</strong>s Envir<strong>on</strong>ment<br />
Programme, 1996, ,<br />
accessed 25 September 2009.<br />
Overview 41
35 UNICEF analysis of Demographic <strong>and</strong> Health Survey data from the<br />
Plurinati<strong>on</strong>al State of Bolivia (2003) <strong>and</strong> Peru (2004–2006).<br />
36 Dancer, Diane, Anu Rammohan <strong>and</strong> Murray D. Smith, ‘Infant Mortality<br />
<strong>and</strong> <strong>Child</strong> Nutriti<strong>on</strong> in Bangladesh’, Health Ec<strong>on</strong>omics, vol. 17, no. 9,<br />
September 2008, pp. 1015–1035.<br />
37 Wamani, Henry, et al., ‘Boys Are More Stunted than Girls in Sub-Saharan<br />
Africa: A meta-analysis of 16 demographic <strong>and</strong> health surveys’, BMC<br />
Pediatrics, vol. 7, no. 17, 10 April 2007.<br />
38 Clel<strong>and</strong>, John G., <strong>and</strong> Jeroen K. van Ginneken, ‘<strong>Maternal</strong> Educati<strong>on</strong> <strong>and</strong><br />
<strong>Child</strong> Survival in Developing Countries: The search for pathways of<br />
infl uence’, Social Science <strong>and</strong> Medicine, vol. 27, no. 12, 1988,<br />
pp. 1357–1368.<br />
39 Liaqat, Perveen, et al., ‘Associati<strong>on</strong> between Complementary Feeding<br />
Practice <strong>and</strong> Mothers Educati<strong>on</strong> Status in Islamabad’, Journal of Human<br />
Nutriti<strong>on</strong> <strong>and</strong> Dietetics, vol. 20, no. 4, 17 July 2007, pp. 340–344.<br />
40 Shroff, M., et al., ‘<strong>Maternal</strong> Aut<strong>on</strong>omy is Inversely Related to <strong>Child</strong><br />
Stunting in Andhra Pradesh, India’, <strong>Maternal</strong> <strong>and</strong> <strong>Child</strong> Nutriti<strong>on</strong>, vol. 5,<br />
no. 1, 1 January 2009, pp. 64–74.<br />
41 World Health Organizati<strong>on</strong>, United Nati<strong>on</strong>s <strong>Child</strong>ren’s Fund, Academy for<br />
Educati<strong>on</strong>al Development <strong>and</strong> United States Agency for Development,<br />
‘Learning from Large-Scale Community Based Programmes to Improve<br />
Breastfeeding Practices: Report of ten-country case study’, WHO, Geneva,<br />
2008, pp. 7–8, 10–12, 21.<br />
42 United Nati<strong>on</strong>s <strong>Child</strong>ren’s Fund, ‘Annual report of the Executive Director:<br />
<str<strong>on</strong>g>Progress</str<strong>on</strong>g> <strong>and</strong> achievements against the medium-term strategic plan’,<br />
Executive Board, Annual sessi<strong>on</strong> 2009, 8–10 June 2009, E/ICEF/2009/9*, p. 6.<br />
43 UNICEF, ‘A Supply Chain Analysis of Ready-to-use Therapeutic Foods for<br />
the Horn of Africa: The Nutriti<strong>on</strong> Articulati<strong>on</strong> Project. A Study’, May 2009,<br />
pp. i <strong>and</strong> 12.<br />
44 Hort<strong>on</strong>, Sue, Harold Alderman <strong>and</strong> Juan A. Rivera, ‘Copenhagen<br />
C<strong>on</strong>sensus 2008 Challenge Paper: Hunger <strong>and</strong> malnutriti<strong>on</strong>’, Copenhagen<br />
C<strong>on</strong>sensus Center, Frederiksberg, Denmark, May 2008, p. 32.<br />
45 Lechtig, A., et al., ‘Decreasing stunting, anemia, <strong>and</strong> vitamin A defi ciency<br />
in Peru: Results of The Good Start in Life Program’, Food <strong>and</strong> Nutriti<strong>on</strong><br />
Bulletin, vol. 30, no. 1, March 2009, p. 37.<br />
46 Bost<strong>on</strong> C<strong>on</strong>sulting Group, ‘REACH: Successful practice compilati<strong>on</strong><br />
<strong>and</strong> country pilots, High-level cost estimates for REACH-promoted<br />
interventi<strong>on</strong>s’ (presentati<strong>on</strong>), August 2008.<br />
42 <str<strong>on</strong>g>Tracking</str<strong>on</strong>g> <str<strong>on</strong>g>Progress</str<strong>on</strong>g> <strong>on</strong> <strong>Child</strong> <strong>and</strong> <strong>Maternal</strong> Nutriti<strong>on</strong><br />
Notes <strong>on</strong> the maps<br />
For the maps <strong>on</strong> page 15 (‘195 milli<strong>on</strong> children in the<br />
developing world are stunted’ <strong>and</strong> ‘Stunting prevalence<br />
worldwide’), page 18 (‘Underweight prevalence worldwide‘)<br />
<strong>and</strong> page 21 (‘Wasting prevalence’), estimates are<br />
calculated according to the WHO <strong>Child</strong> Growth St<strong>and</strong>ards,<br />
except in cases where data are <strong>on</strong>ly available according<br />
to the previously used NCHS/WHO reference populati<strong>on</strong>.<br />
Estimates for 96 countries are from surveys c<strong>on</strong>ducted in<br />
2003 or later.<br />
For the map <strong>on</strong> page 19 (‘63 countries are <strong>on</strong> track to<br />
meet the MDG 1 target’), estimates are calculated<br />
according to the NCHS/WHO reference populati<strong>on</strong>.<br />
For the map <strong>on</strong> page 24 (‘Exclusive breastfeeding rates’),<br />
estimates for 108 countries are from surveys c<strong>on</strong>ducted<br />
in 2003 or later.<br />
For more informati<strong>on</strong> <strong>on</strong> countries with estimates<br />
calculated according to the NCHS/WHO reference<br />
populati<strong>on</strong> or countries with surveys before 2003,<br />
please refer to data notes <strong>on</strong> page 116.
NUTRITION<br />
PROFILES:<br />
24 countries<br />
with the largest<br />
burden of stunting
44<br />
DEMOGRAPHICS<br />
Total populati<strong>on</strong> (000) 27,208 (2008)<br />
Total under-fi ve populati<strong>on</strong> (000) 4,907 (2008)<br />
Total number of births (000) 1,269 (2008)<br />
Under-fi ve mortality rate (per 1,000 live births) 257 (2008)<br />
Total number of under-fi ve deaths (000) 311 (2008)<br />
Infant mortality rate (per 1,000 live births) 165 (2008)<br />
Ne<strong>on</strong>atal mortality rate (per 1,000 live births) 60 (2004)<br />
HIV prevalence rate (15–49 years, %) - -<br />
Populati<strong>on</strong> below internati<strong>on</strong>al<br />
poverty line of US$1.25 per day (%)<br />
NUTRITIONAL STATUS<br />
Burden of undernutriti<strong>on</strong> (2008)<br />
WHO <strong>Child</strong> Growth St<strong>and</strong>ards<br />
Current nutriti<strong>on</strong>al status<br />
Percentage of children < 5 years old suffering from:<br />
Underweight<br />
Source:<br />
Stunting<br />
Wasting<br />
7<br />
9<br />
33<br />
39<br />
AFGHANISTAN<br />
59<br />
54<br />
WHO <strong>Child</strong> Growth St<strong>and</strong>ards<br />
NCHS reference populati<strong>on</strong><br />
0 20 40 60 80 100%<br />
Other NS 2004<br />
INFANT AND YOUNG CHILD FEEDING<br />
<strong>Child</strong> feeding practices, by age<br />
Complementary feeding<br />
(6 - 9 mos.)<br />
C<strong>on</strong>tinued breastfeeding<br />
(12 - 15 mos.)<br />
C<strong>on</strong>tinued breastfeeding<br />
(20 - 23 mos.)<br />
Source: MICS 2003<br />
29<br />
- -<br />
Under-five mortality rate<br />
Deaths per 1,000 live births<br />
<str<strong>on</strong>g>Tracking</str<strong>on</strong>g> <str<strong>on</strong>g>Progress</str<strong>on</strong>g> <strong>on</strong> <strong>Child</strong> <strong>and</strong> <strong>Maternal</strong> Nutriti<strong>on</strong><br />
280<br />
240<br />
200<br />
160<br />
120<br />
80<br />
40<br />
0<br />
260<br />
257<br />
1990 1995 2000 2005 2010 2015<br />
Source: IGME 2009<br />
Stunting trends<br />
Percentage of children < 5 years old stunted<br />
NCHS reference populati<strong>on</strong><br />
100%<br />
80<br />
60<br />
40<br />
20<br />
0<br />
54<br />
57<br />
1997<br />
MICS<br />
50<br />
2000<br />
MICS<br />
92<br />
54<br />
87<br />
MDG<br />
Target<br />
2004<br />
Other NS<br />
0 10 20 30 40 50 60 70 80 90 100%<br />
Causes of under-fi ve deaths, 2004<br />
Others<br />
20%<br />
Pneum<strong>on</strong>ia<br />
33%<br />
Source: WHO 2008<br />
Underweight trends<br />
Percentage of children < 5 years old<br />
underweight NCHS reference populati<strong>on</strong><br />
On track towards MDG1<br />
100%<br />
80<br />
60<br />
40<br />
20<br />
0<br />
49<br />
1997<br />
MICS<br />
Globally,<br />
undernutriti<strong>on</strong><br />
c<strong>on</strong>tributes to more<br />
than <strong>on</strong>e third of<br />
child deaths<br />
47<br />
2000<br />
MICS<br />
Data not available to produce infant feeding practices<br />
area graph<br />
39<br />
2004<br />
Other NS<br />
Exclusive breastfeeding<br />
Percentage Percentage of of infants infants < 6 m<strong>on</strong>ths m<strong>on</strong>ths old old exclusively<br />
exclusively<br />
breastfed breastfed<br />
No data Data<br />
Ne<strong>on</strong>atal<br />
23%<br />
Diarrhoea<br />
23%<br />
Stunted (under-fi ves, 000): 2,910 Underweight (under-fi ves, 000): 1,614<br />
Share of developing world stunting burden (%): 1.5 Wasted (under-fi ves, 000): 422<br />
Stunting country rank: 11 Severely wasted (under-fi ves, 000): 172<br />
Injuries<br />
1%
100%<br />
80<br />
60<br />
40<br />
20<br />
0<br />
MICRONUTRIENTS<br />
Vitamin A supplementati<strong>on</strong><br />
Percentage of children 6-59 m<strong>on</strong>ths old receiving two doses<br />
of vitamin A during calendar year<br />
58<br />
76<br />
94<br />
ESSENTIAL NUTRITION INTERVENTIONS DURING THE LIFE CYCLE<br />
Pregnancy Birth 0-5 m<strong>on</strong>ths 6-23 m<strong>on</strong>ths 24-59 m<strong>on</strong>ths<br />
Use of ir<strong>on</strong>-folic acid supplements -<br />
Household c<strong>on</strong>sumpti<strong>on</strong> of<br />
adequately iodized salt<br />
85<br />
Early initiati<strong>on</strong> of breastfeeding<br />
(within 1 hour of birth)<br />
28% Infants not weighed at birth -<br />
MATERNAL NUTRITION/HEALTH WATER AND SANITATION<br />
DISPARITIES IN NUTRITION<br />
95<br />
2000 2002 2004 2006 2008<br />
Source: UNICEF<br />
<strong>Maternal</strong> mortality ratio, adjusted<br />
(per 100,000 live births)<br />
1,800 (2005)<br />
<strong>Maternal</strong> mortality ratio, reported<br />
(per 100,000 live births)<br />
1,600 (1999-2002)<br />
Total number of maternal deaths 26,000 (2005)<br />
Lifetime risk of maternal death (1 in : ) 8 (2005)<br />
Women with low BMI (
Underweight<br />
Source:<br />
46<br />
Stunting<br />
Wasting<br />
DEMOGRAPHICS<br />
Total populati<strong>on</strong> (000) 160,000 (2008)<br />
Total under-fi ve populati<strong>on</strong> (000) 16,710 (2008)<br />
Total number of births (000) 3,430 (2008)<br />
Under-fi ve mortality rate (per 1,000 live births) 54 (2008)<br />
Total number of under-fi ve deaths (000) 183 (2008)<br />
Infant mortality rate (per 1,000 live births) 43 (2008)<br />
Ne<strong>on</strong>atal mortality rate (per 1,000 live births) 36 (2004)<br />
HIV prevalence rate (15–49 years, %) - -<br />
Populati<strong>on</strong> below internati<strong>on</strong>al<br />
poverty line of US$1.25 per day (%)<br />
NUTRITIONAL STATUS<br />
Burden of undernutriti<strong>on</strong> (2008)<br />
WHO <strong>Child</strong> Growth St<strong>and</strong>ards<br />
Current nutriti<strong>on</strong>al status<br />
Percentage of children < 5 years old suffering from:<br />
17<br />
16<br />
43<br />
36<br />
41<br />
46<br />
BANGLADESH<br />
WHO <strong>Child</strong> Growth St<strong>and</strong>ards<br />
NCHS reference populati<strong>on</strong><br />
0 20 40 60 80 100%<br />
DHS 2007<br />
INFANT AND YOUNG CHILD FEEDING<br />
Infant feeding practices, by age<br />
100%<br />
90<br />
80<br />
70<br />
60<br />
50<br />
40<br />
30<br />
20<br />
10<br />
0<br />
50 (2005)<br />
Under-five mortality rate<br />
Deaths per 1,000 live births<br />
<str<strong>on</strong>g>Tracking</str<strong>on</strong>g> <str<strong>on</strong>g>Progress</str<strong>on</strong>g> <strong>on</strong> <strong>Child</strong> <strong>and</strong> <strong>Maternal</strong> Nutriti<strong>on</strong><br />
160<br />
120<br />
80<br />
40<br />
0<br />
149<br />
1990 1995 2000 2005 2010 2015<br />
Source: IGME 2009<br />
Stunting trends<br />
Percentage of children < 5 years old stunted<br />
NCHS reference populati<strong>on</strong><br />
100%<br />
80<br />
60<br />
40<br />
20<br />
0<br />
68 65 63<br />
1985 1989 1992<br />
Other NS Other NS Other NS<br />
0-1 2-3 4-5 6-7 8-9 10-11 12-13 14-15 16-17 18-19 20-21 22-23<br />
age (m<strong>on</strong>ths)<br />
Source: DHS 2007<br />
55<br />
1996-<br />
1997<br />
DHS<br />
45<br />
54<br />
1999-<br />
2000<br />
DHS<br />
43<br />
2004<br />
DHS<br />
50<br />
MDG<br />
Target<br />
36<br />
2007<br />
DHS<br />
Causes of under-fi ve deaths, 2004<br />
Pneum<strong>on</strong>ia<br />
15%<br />
Injuries<br />
3%<br />
Measles<br />
4%<br />
Diarrhoea<br />
20%<br />
Source: WHO 2008<br />
Underweight trends<br />
Percentage of children < 5 years old<br />
underweight NCHS reference populati<strong>on</strong><br />
Insufficient progress towards MDG1<br />
100%<br />
80<br />
60<br />
40<br />
20<br />
0<br />
100 100 % %<br />
80 80<br />
60 60<br />
40 40<br />
20 20<br />
71<br />
66 67<br />
1985 1989 1992<br />
Other NS Other NS Other NS<br />
Weaned (not breastfed)<br />
Breastfed <strong>and</strong> solid/<br />
semi-solid foods<br />
Breastfed <strong>and</strong> other<br />
milk/formula<br />
46 46<br />
Malaria<br />
1%<br />
Globally,<br />
undernutriti<strong>on</strong><br />
c<strong>on</strong>tributes to more<br />
than <strong>on</strong>e third of<br />
child deaths<br />
45 45<br />
46 46<br />
56<br />
1996-<br />
1997<br />
DHS<br />
48<br />
1999-<br />
2000<br />
DHS<br />
42 42<br />
0 0<br />
1993-1994 1993-19941996-1997<br />
1996-19971999-2000<br />
1999-2000 2004 2004<br />
DHS DHS DHS DHS DHS DHS DHS DHS<br />
48<br />
2004<br />
DHS<br />
Breastfed <strong>and</strong><br />
n<strong>on</strong>-milk liquids<br />
Breastfed <strong>and</strong> plain<br />
water <strong>on</strong>ly<br />
Exclusively breastfed<br />
37 37<br />
2006 2006<br />
MICS MICS<br />
Others<br />
9%<br />
Ne<strong>on</strong>atal<br />
48%<br />
Stunted (under-fi ves, 000): 7,219 Underweight (under-fi ves, 000): 6,851<br />
Share of developing world stunting burden (%): 3.7 Wasted (under-fi ves, 000): 2,908<br />
Stunting country rank: 6 Severely wasted (under-fi ves, 000): 485<br />
46<br />
2007<br />
DHS<br />
Exclusive breastfeeding<br />
Percentage of of infants infants < < 6 6 m<strong>on</strong>ths m<strong>on</strong>ths old old exclusively<br />
breastfed<br />
43 43<br />
2007 2007<br />
DHS DHS
100%<br />
80<br />
60<br />
40<br />
20<br />
0<br />
MICRONUTRIENTS<br />
Vitamin A supplementati<strong>on</strong><br />
Percentage of children 6-59 m<strong>on</strong>ths old receiving two doses<br />
of vitamin A during calendar year<br />
85<br />
90<br />
84<br />
ESSENTIAL NUTRITION INTERVENTIONS DURING THE LIFE CYCLE<br />
Pregnancy Birth 0-5 m<strong>on</strong>ths 6-23 m<strong>on</strong>ths 24-59 m<strong>on</strong>ths<br />
Use of ir<strong>on</strong>-folic acid supplements -<br />
Household c<strong>on</strong>sumpti<strong>on</strong> of<br />
adequately iodized salt<br />
87<br />
Early initiati<strong>on</strong> of breastfeeding<br />
(within 1 hour of birth)<br />
MATERNAL NUTRITION/HEALTH WATER AND SANITATION<br />
DISPARITIES IN NUTRITION<br />
83<br />
2000 2002 2004 2006 2008<br />
Source: UNICEF<br />
82<br />
89<br />
43%<br />
84% Infants not weighed at birth 85%<br />
<strong>Maternal</strong> mortality ratio, adjusted<br />
(per 100,000 live births)<br />
570 (2005)<br />
<strong>Maternal</strong> mortality ratio, reported<br />
(per 100,000 live births)<br />
350 (2007)<br />
Total number of maternal deaths 21,000 (2005)<br />
Lifetime risk of maternal death (1 in : ) 51 (2005)<br />
Women with low BMI (
Underweight<br />
Source:<br />
48<br />
Stunting<br />
Wasting<br />
DEMOGRAPHICS<br />
CHINA<br />
Total populati<strong>on</strong> (000) 1,337,411 (2008)<br />
Total under-fi ve populati<strong>on</strong> (000) 86,881 (2008)<br />
Total number of births (000) 18,134 (2008)<br />
Under-fi ve mortality rate (per 1,000 live births) 21 (2008)<br />
Total number of under-fi ve deaths (000) 365 (2008)<br />
Infant mortality rate (per 1,000 live births) 18 (2008)<br />
Ne<strong>on</strong>atal mortality rate (per 1,000 live births) 18 (2004)<br />
HIV prevalence rate (15–49 years, %) 0.1 (2007)<br />
Populati<strong>on</strong> below internati<strong>on</strong>al<br />
poverty line of US$1.25 per day (%)<br />
NUTRITIONAL STATUS<br />
Burden of undernutriti<strong>on</strong> (2008)<br />
WHO <strong>Child</strong> Growth St<strong>and</strong>ards<br />
Current nutriti<strong>on</strong>al status<br />
Percentage of children < 5 years old suffering from:<br />
15<br />
11<br />
6<br />
7<br />
WHO <strong>Child</strong> Growth St<strong>and</strong>ards<br />
NCHS reference populati<strong>on</strong><br />
0 20 40 60 80 100%<br />
Other NS 2005<br />
INFANT AND YOUNG CHILD FEEDING<br />
<strong>Child</strong> feeding practices, by age<br />
Complementary feeding<br />
(6 - 9 mos.)<br />
C<strong>on</strong>tinued breastfeeding<br />
(12 - 15 mos.)<br />
C<strong>on</strong>tinued breastfeeding<br />
(20 - 23 mos.)<br />
15<br />
16 (2005)<br />
Under-five mortality rate<br />
Deaths per 1,000 live births<br />
<str<strong>on</strong>g>Tracking</str<strong>on</strong>g> <str<strong>on</strong>g>Progress</str<strong>on</strong>g> <strong>on</strong> <strong>Child</strong> <strong>and</strong> <strong>Maternal</strong> Nutriti<strong>on</strong><br />
32<br />
43<br />
50<br />
40<br />
30<br />
20<br />
10<br />
0<br />
46<br />
1990 1995 2000 2005 2010 2015<br />
Source: IGME 2009<br />
Stunting trends<br />
Percentage of children < 5 years old stunted<br />
NCHS reference populati<strong>on</strong><br />
100%<br />
80<br />
60<br />
40<br />
20<br />
0<br />
33 32 34<br />
18<br />
16<br />
21<br />
14<br />
15<br />
MDG<br />
Target<br />
1990 1992 1995 1998 2000 2002 2005<br />
Other NS Other NS Other NS Other NS Other NS Other NS Other NS<br />
0<br />
Source: Other NS 2003<br />
10 20 30 40 50 60 70 80 90 100%<br />
11<br />
Causes of under-fi ve deaths, 2004<br />
Pneum<strong>on</strong>ia<br />
8%<br />
Injuries<br />
9%<br />
Measles<br />
1%<br />
Diarrhoea<br />
10%<br />
Source: WHO 2008<br />
Underweight trends<br />
Percentage of children < 5 years old<br />
underweight NCHS reference populati<strong>on</strong><br />
On track towards MDG1<br />
100%<br />
80<br />
60<br />
40<br />
20<br />
0<br />
19 16 16<br />
Globally,<br />
undernutriti<strong>on</strong><br />
c<strong>on</strong>tributes to more<br />
than <strong>on</strong>e third of<br />
child deaths<br />
10<br />
1990 1992 1995 1998 2000 2002 2005<br />
Other NS Other NS Other NS Other NS Other NS Other NS Other NS<br />
Data not available to produce infant feeding practices<br />
area graph<br />
Exclusive breastfeeding<br />
Percentage of of infants < < 6 6 m<strong>on</strong>ths old old exclusively<br />
breastfed<br />
No No data Data<br />
10<br />
8<br />
Others<br />
15%<br />
Ne<strong>on</strong>atal<br />
57%<br />
Stunted (under-fi ves, 000): 12,685 Underweight (under-fi ves, 000): 5,213<br />
Share of developing world stunting burden (%): 6.5 Wasted (under-fi ves, 000): -<br />
Stunting country rank: 2 Severely wasted (under-fi ves, 000): -<br />
7
MICRONUTRIENTS<br />
Vitamin A supplementati<strong>on</strong><br />
Percentage of children 6-59 m<strong>on</strong>ths old receiving two doses<br />
of vitamin A during calendar year<br />
ESSENTIAL NUTRITION INTERVENTIONS DURING THE LIFE CYCLE<br />
Pregnancy Birth 0-5 m<strong>on</strong>ths 6-23 m<strong>on</strong>ths 24-59 m<strong>on</strong>ths<br />
Use of ir<strong>on</strong>-folic acid supplements -<br />
Household c<strong>on</strong>sumpti<strong>on</strong> of<br />
adequately iodized salt<br />
Subnati<strong>on</strong>al Programme<br />
Early initiati<strong>on</strong> of breastfeeding<br />
(within 1 hour of birth)<br />
95% Infants not weighed at birth -<br />
MATERNAL NUTRITION/HEALTH WATER AND SANITATION<br />
<strong>Maternal</strong> mortality ratio, adjusted<br />
(per 100,000 live births)<br />
45 (2005)<br />
<strong>Maternal</strong> mortality ratio, reported<br />
(per 100,000 live births)<br />
37 (2007)<br />
Total number of maternal deaths 7,800 (2005)<br />
Lifetime risk of maternal death (1 in : ) 1,300 (2005)<br />
Women with low BMI (
Underweight<br />
Source:<br />
50<br />
Stunting<br />
Wasting<br />
DEMOGRAPHICS<br />
Total populati<strong>on</strong> (000) 64,257 (2008)<br />
Total under-fi ve populati<strong>on</strong> (000) 11,829 (2008)<br />
Total number of births (000) 2,886 (2008)<br />
Under-fi ve mortality rate (per 1,000 live births) 199 (2008)<br />
Total number of under-fi ve deaths (000) 554 (2008)<br />
Infant mortality rate (per 1,000 live births) 126 (2008)<br />
Ne<strong>on</strong>atal mortality rate (per 1,000 live births) 47 (2004)<br />
HIV prevalence rate (15–49 years, %) - -<br />
Populati<strong>on</strong> below internati<strong>on</strong>al<br />
poverty line of US$1.25 per day (%)<br />
NUTRITIONAL STATUS<br />
Burden of undernutriti<strong>on</strong> (2008)<br />
WHO <strong>Child</strong> Growth St<strong>and</strong>ards<br />
Current nutriti<strong>on</strong>al status<br />
Percentage of children < 5 years old suffering from:<br />
10<br />
9<br />
25<br />
31<br />
46<br />
40<br />
DEMOCRATIC REPUBLIC OF THE CONGO<br />
WHO <strong>Child</strong> Growth St<strong>and</strong>ards<br />
NCHS reference populati<strong>on</strong><br />
0 20 40 60 80 100%<br />
DHS 2007<br />
INFANT AND YOUNG CHILD FEEDING<br />
Infant feeding practices, by age<br />
100%<br />
90<br />
80<br />
70<br />
60<br />
50<br />
40<br />
30<br />
20<br />
10<br />
0<br />
59 (2005-2006)<br />
Under-five mortality rate<br />
Deaths per 1,000 live births<br />
<str<strong>on</strong>g>Tracking</str<strong>on</strong>g> <str<strong>on</strong>g>Progress</str<strong>on</strong>g> <strong>on</strong> <strong>Child</strong> <strong>and</strong> <strong>Maternal</strong> Nutriti<strong>on</strong><br />
240<br />
200<br />
160<br />
120<br />
80<br />
40<br />
0<br />
199<br />
199<br />
1990 1995 2000 2005 2010 2015<br />
Source: IGME 2009<br />
Stunting trends<br />
Percentage of children < 5 years old stunted<br />
NCHS reference populati<strong>on</strong><br />
0-1 2-3 4-5 6-7 8-9 10-11 12-13 14-15 16-17 18-19 20-21 22-23<br />
age (m<strong>on</strong>ths)<br />
Source: DHS 2007<br />
100%<br />
80<br />
60<br />
40<br />
20<br />
0<br />
45<br />
1995<br />
MICS<br />
38<br />
2001<br />
MICS<br />
40<br />
2007<br />
DHS<br />
66<br />
MDG<br />
Target<br />
Causes of under-fi ve deaths, 2004<br />
Others<br />
11%<br />
Malaria<br />
17%<br />
Pneum<strong>on</strong>ia<br />
23%<br />
Source: WHO 2008<br />
Underweight trends<br />
Percentage of children < 5 years old<br />
underweight NCHS reference populati<strong>on</strong><br />
Insufficient progress towards MDG1<br />
100%<br />
80<br />
60<br />
40<br />
20<br />
0<br />
100<br />
%<br />
80 80<br />
60 60<br />
40 40<br />
20 20<br />
00<br />
34 31<br />
31<br />
1995<br />
MICS<br />
Weaned (not breastfed)<br />
Breastfed <strong>and</strong> solid/<br />
semi-solid foods<br />
Breastfed <strong>and</strong> other<br />
milk/formula<br />
24 24<br />
1995<br />
MICS<br />
Globally,<br />
undernutriti<strong>on</strong><br />
c<strong>on</strong>tributes to more<br />
than <strong>on</strong>e third of<br />
child deaths<br />
Injuries<br />
3%<br />
2001<br />
MICS<br />
24 24<br />
2001<br />
Other NS NS<br />
2007<br />
DHS<br />
Breastfed <strong>and</strong><br />
n<strong>on</strong>-milk liquids<br />
Breastfed <strong>and</strong> plain<br />
water <strong>on</strong>ly<br />
Exclusively breastfed<br />
Exclusive breastfeeding<br />
Percentage of of infants < 6 m<strong>on</strong>ths old exclusively<br />
breastfed<br />
36 36<br />
2007<br />
DHS<br />
Ne<strong>on</strong>atal<br />
24%<br />
HIV/AIDS<br />
3%<br />
Diarrhoea<br />
17%<br />
Measles<br />
3%<br />
Stunted (under-fi ves, 000): 5,382 Underweight (under-fi ves, 000): 2,969<br />
Share of developing world stunting burden (%): 2.8 Wasted (under-fi ves, 000): 1,183<br />
Stunting country rank: 8 Severely wasted (under-fi ves, 000): 509
100%<br />
80<br />
60<br />
40<br />
20<br />
0<br />
MICRONUTRIENTS<br />
Vitamin A supplementati<strong>on</strong><br />
Percentage of children 6-59 m<strong>on</strong>ths old receiving two doses<br />
of vitamin A during calendar year<br />
0<br />
11<br />
62<br />
ESSENTIAL NUTRITION INTERVENTIONS DURING THE LIFE CYCLE<br />
Pregnancy Birth 0-5 m<strong>on</strong>ths 6-23 m<strong>on</strong>ths 24-59 m<strong>on</strong>ths<br />
Use of ir<strong>on</strong>-folic acid supplements 2%<br />
Household c<strong>on</strong>sumpti<strong>on</strong> of<br />
adequately iodized salt<br />
72<br />
Early initiati<strong>on</strong> of breastfeeding<br />
(within 1 hour of birth)<br />
MATERNAL NUTRITION/HEALTH WATER AND SANITATION<br />
DISPARITIES IN NUTRITION<br />
70<br />
2000 2002 2004 2006 2008<br />
Source: UNICEF<br />
DEMOCRATIC REPUBLIC OF THE CONGO<br />
87<br />
91<br />
48%<br />
79% Infants not weighed at birth 32%<br />
<strong>Maternal</strong> mortality ratio, adjusted<br />
(per 100,000 live births)<br />
1,100 (2005)<br />
<strong>Maternal</strong> mortality ratio, reported<br />
(per 100,000 live births)<br />
550 (2004-2007)<br />
Total number of maternal deaths 32,000 (2005)<br />
Lifetime risk of maternal death (1 in : ) 13 (2005)<br />
Women with low BMI (
Underweight<br />
Source:<br />
52<br />
Stunting<br />
Wasting<br />
DEMOGRAPHICS<br />
EGYPT<br />
Total populati<strong>on</strong> (000) 81,527 (2008)<br />
Total under-fi ve populati<strong>on</strong> (000) 9,447 (2008)<br />
Total number of births (000) 2,015 (2008)<br />
Under-fi ve mortality rate (per 1,000 live births) 23 (2008)<br />
Total number of under-fi ve deaths (000) 45 (2008)<br />
Infant mortality rate (per 1,000 live births) 20 (2008)<br />
Ne<strong>on</strong>atal mortality rate (per 1,000 live births) 17 (2004)<br />
HIV prevalence rate (15–49 years, %) - -<br />
Populati<strong>on</strong> below internati<strong>on</strong>al<br />
poverty line of US$1.25 per day (%)<br />
NUTRITIONAL STATUS<br />
Burden of undernutriti<strong>on</strong> (2008)<br />
WHO <strong>Child</strong> Growth St<strong>and</strong>ards<br />
Current nutriti<strong>on</strong>al status<br />
Percentage of children < 5 years old suffering from:<br />
6<br />
8<br />
7<br />
7<br />
29<br />
25<br />
WHO <strong>Child</strong> Growth St<strong>and</strong>ards<br />
NCHS reference populati<strong>on</strong><br />
0 20 40 60 80 100%<br />
DHS 2008<br />
INFANT AND YOUNG CHILD FEEDING<br />
Infant feeding practices, by age<br />
100%<br />
90<br />
80<br />
70<br />
60<br />
50<br />
40<br />
30<br />
20<br />
10<br />
0<br />
100%<br />
80<br />
60<br />
40<br />
20<br />
0<br />
MICRONUTRIENTS<br />
Vitamin A supplementati<strong>on</strong><br />
Percentage of children 6-59 m<strong>on</strong>ths old receiving two doses<br />
of vitamin A during calendar year<br />
ESSENTIAL NUTRITION INTERVENTIONS DURING THE LIFE CYCLE<br />
Pregnancy Birth 0-5 m<strong>on</strong>ths 6-23 m<strong>on</strong>ths 24-59 m<strong>on</strong>ths<br />
Use of ir<strong>on</strong>-folic acid supplements 14%<br />
Household c<strong>on</strong>sumpti<strong>on</strong> of<br />
adequately iodized salt<br />
93<br />
90 93<br />
Early initiati<strong>on</strong> of breastfeeding<br />
(within 1 hour of birth)<br />
MATERNAL NUTRITION/HEALTH WATER AND SANITATION<br />
DISPARITIES IN NUTRITION<br />
95<br />
2000 2002 2004 2006 2008<br />
Source: UNICEF<br />
56%<br />
79% Infants not weighed at birth 58%<br />
<strong>Maternal</strong> mortality ratio, adjusted<br />
(per 100,000 live births)<br />
130 (2005)<br />
<strong>Maternal</strong> mortality ratio, reported<br />
(per 100,000 live births)<br />
84 (2000)<br />
Total number of maternal deaths 2,400 (2005)<br />
Lifetime risk of maternal death (1 in : ) 230 (2005)<br />
Women with low BMI (
Underweight<br />
Source:<br />
54<br />
Stunting<br />
Wasting<br />
DEMOGRAPHICS<br />
NUTRITIONAL STATUS<br />
12<br />
11<br />
33<br />
38<br />
ETHIOPIA<br />
Total populati<strong>on</strong> (000) 80,713 (2008)<br />
Total under-fi ve populati<strong>on</strong> (000) 13,323 (2008)<br />
Total number of births (000) 3,093 (2008)<br />
Under-fi ve mortality rate (per 1,000 live births) 109 (2008)<br />
Total number of under-fi ve deaths (000) 321 (2008)<br />
Infant mortality rate (per 1,000 live births) 69 (2008)<br />
Ne<strong>on</strong>atal mortality rate (per 1,000 live births) 41 (2004)<br />
HIV prevalence rate (15–49 years, %) 2.1 (2007)<br />
Populati<strong>on</strong> below internati<strong>on</strong>al<br />
poverty line of US$1.25 per day (%)<br />
Burden of undernutriti<strong>on</strong> (2008)<br />
WHO <strong>Child</strong> Growth St<strong>and</strong>ards<br />
Current nutriti<strong>on</strong>al status<br />
Percentage of children < 5 years old suffering from:<br />
51<br />
47<br />
WHO <strong>Child</strong> Growth St<strong>and</strong>ards<br />
NCHS reference populati<strong>on</strong><br />
0 20 40 60 80 100%<br />
DHS 2005<br />
INFANT AND YOUNG CHILD FEEDING<br />
Infant feeding practices, by age<br />
100 %<br />
90<br />
80<br />
70<br />
60<br />
50<br />
40<br />
30<br />
20<br />
10<br />
0<br />
39 (2005)<br />
Under-five mortality rate<br />
Deaths per 1,000 live births<br />
<str<strong>on</strong>g>Tracking</str<strong>on</strong>g> <str<strong>on</strong>g>Progress</str<strong>on</strong>g> <strong>on</strong> <strong>Child</strong> <strong>and</strong> <strong>Maternal</strong> Nutriti<strong>on</strong><br />
240<br />
200<br />
160<br />
120<br />
80<br />
40<br />
0<br />
210<br />
1990 1995 2000 2005 2010 2015<br />
Source: IGME 2009<br />
100%<br />
80<br />
60<br />
40<br />
20<br />
0<br />
64<br />
1992<br />
Other NS<br />
52 52<br />
1998<br />
Other NS<br />
2000<br />
DHS<br />
109<br />
Stunting trends<br />
Percentage of children < 5 years old stunted<br />
NCHS reference populati<strong>on</strong><br />
0-1 2-3 4-5 6-7 8-9 10-11 12-13 14-15 16-17 18-19 20-21 22-23<br />
age (m<strong>on</strong>ths)<br />
Source: DHS 2005<br />
70<br />
MDG<br />
Target<br />
47<br />
2005<br />
DHS<br />
Causes of under-fi ve deaths, 2004<br />
Others<br />
20%<br />
Malaria<br />
7%<br />
Pneum<strong>on</strong>ia<br />
24%<br />
Source: WHO 2008<br />
Underweight trends<br />
Percentage of children < 5 years old<br />
underweight NCHS reference populati<strong>on</strong><br />
Insufficient progress towards MDG1<br />
100%<br />
80<br />
60<br />
40<br />
20<br />
0<br />
100%<br />
100%<br />
80<br />
80<br />
60<br />
60<br />
40<br />
40<br />
20<br />
20<br />
0<br />
0<br />
48<br />
44<br />
47<br />
1992<br />
Other NS<br />
Weaned (not breastfed)<br />
Breastfed <strong>and</strong> solid/<br />
semi-solid foods<br />
Breastfed <strong>and</strong> other<br />
milk/formula<br />
Globally,<br />
undernutriti<strong>on</strong><br />
c<strong>on</strong>tributes to more<br />
than <strong>on</strong>e third of<br />
child deaths<br />
54<br />
54<br />
2000<br />
2000<br />
DHS<br />
DHS<br />
Injuries<br />
2%<br />
1998<br />
Other NS<br />
Measles<br />
1%<br />
2000<br />
DHS<br />
Breastfed <strong>and</strong><br />
n<strong>on</strong>-milk liquids<br />
Breastfed <strong>and</strong> plain<br />
water <strong>on</strong>ly<br />
Exclusively breastfed<br />
49<br />
49<br />
2005<br />
2005<br />
DHS<br />
DHS<br />
Ne<strong>on</strong>atal<br />
25%<br />
HIV/AIDS<br />
3%<br />
Diarrhoea<br />
19%<br />
Stunted (under-fi ves, 000): 6,768 Underweight (under-fi ves, 000): 4,423<br />
Share of developing world stunting burden (%): 3.5 Wasted (under-fi ves, 000): 1,625<br />
Stunting country rank: 7 Severely wasted (under-fi ves, 000): 573<br />
38<br />
2005<br />
DHS<br />
Exclusive Exclusive breastfeeding<br />
breastfeeding<br />
Percentage<br />
Percentage<br />
of<br />
of<br />
infants<br />
infants<br />
< 6<br />
6<br />
m<strong>on</strong>ths<br />
m<strong>on</strong>ths<br />
old<br />
old<br />
exclusively<br />
exclusively<br />
breastfed<br />
breastfed
100%<br />
80<br />
60<br />
40<br />
20<br />
0<br />
MICRONUTRIENTS<br />
Vitamin A supplementati<strong>on</strong><br />
Percentage of children 6-59 m<strong>on</strong>ths old receiving two doses<br />
of vitamin A during calendar year<br />
0<br />
ESSENTIAL NUTRITION INTERVENTIONS DURING THE LIFE CYCLE<br />
Pregnancy Birth 0-5 m<strong>on</strong>ths 6-23 m<strong>on</strong>ths 24-59 m<strong>on</strong>ths<br />
Use of ir<strong>on</strong>-folic acid supplements 0%<br />
Household c<strong>on</strong>sumpti<strong>on</strong> of<br />
adequately iodized salt<br />
0<br />
22<br />
2000 2002 2004 2006 2008<br />
Source: UNICEF<br />
Early initiati<strong>on</strong> of breastfeeding<br />
(within 1 hour of birth)<br />
MATERNAL NUTRITION/HEALTH WATER AND SANITATION<br />
DISPARITIES IN NUTRITION<br />
59<br />
80<br />
69%<br />
20% Infants not weighed at birth 97%<br />
<strong>Maternal</strong> mortality ratio, adjusted<br />
(per 100,000 live births)<br />
720 (2005)<br />
<strong>Maternal</strong> mortality ratio, reported<br />
(per 100,000 live births)<br />
670 (1998-2004)<br />
Total number of maternal deaths 22,000 (2005)<br />
Lifetime risk of maternal death (1 in : ) 27 (2005)<br />
Women with low BMI (
Underweight<br />
56<br />
Stunting<br />
Wasting<br />
DEMOGRAPHICS<br />
INDIA<br />
Total populati<strong>on</strong> (000) 1,181,412 (2008)<br />
Total under-fi ve populati<strong>on</strong> (000) 126,642 (2008)<br />
Total number of births (000) 26,913 (2008)<br />
Under-fi ve mortality rate (per 1,000 live births) 69 (2008)<br />
Total number of under-fi ve deaths (000) 1,830 (2008)<br />
Infant mortality rate (per 1,000 live births) 52 (2008)<br />
Ne<strong>on</strong>atal mortality rate (per 1,000 live births) 39 (2004)<br />
HIV prevalence rate (15–49 years, %) 0.3 (2007)<br />
Populati<strong>on</strong> below internati<strong>on</strong>al<br />
poverty line of US$1.25 per day (%)<br />
NUTRITIONAL STATUS<br />
Burden of undernutriti<strong>on</strong> (2008)<br />
WHO <strong>Child</strong> Growth St<strong>and</strong>ards<br />
Current nutriti<strong>on</strong>al status<br />
Percentage of children < 5 years old suffering from:<br />
17<br />
20<br />
NFHS 2005-2006<br />
Source:<br />
48<br />
43<br />
43<br />
48<br />
WHO <strong>Child</strong> Growth St<strong>and</strong>ards<br />
NCHS reference populati<strong>on</strong><br />
0 20 40 60 80 100%<br />
NFHS 2005-2006<br />
INFANT AND YOUNG CHILD FEEDING<br />
Infant feeding practices, by age<br />
100%<br />
90<br />
80<br />
70<br />
60<br />
50<br />
40<br />
30<br />
20<br />
10<br />
0<br />
42 (2004-<br />
2005)<br />
Under-five mortality rate<br />
Deaths per 1,000 live births<br />
<str<strong>on</strong>g>Tracking</str<strong>on</strong>g> <str<strong>on</strong>g>Progress</str<strong>on</strong>g> <strong>on</strong> <strong>Child</strong> <strong>and</strong> <strong>Maternal</strong> Nutriti<strong>on</strong><br />
160<br />
120<br />
80<br />
40<br />
0<br />
116<br />
1990 1995 2000 2005 2010 2015<br />
Source: IGME 2009<br />
Stunting trends<br />
Percentage of children < 5 years old stunted<br />
NCHS reference populati<strong>on</strong><br />
100%<br />
80<br />
60<br />
40<br />
20<br />
0<br />
52 50<br />
1992-1993<br />
NFHS<br />
1998-1999<br />
NFHS<br />
69<br />
39<br />
MDG<br />
Target<br />
43<br />
2005-2006<br />
NFHS<br />
0-1 2-3 4-5 6-7 8-9 10-11 12-13 14-15 16-17 18-19 20-21 22-23<br />
age (m<strong>on</strong>ths)<br />
Source: NFHS 2005-2006<br />
Causes of under-fi ve deaths, 2004<br />
Pneum<strong>on</strong>ia<br />
14%<br />
Injuries<br />
3%<br />
Measles<br />
6%<br />
Diarrhoea<br />
19%<br />
HIV/AIDS<br />
1%<br />
Source: WHO 2008<br />
Underweight trends<br />
Percentage of children < 5 years old<br />
underweight NCHS reference populati<strong>on</strong><br />
Insufficient progress towards MDG1<br />
100%<br />
80<br />
60<br />
40<br />
20<br />
0<br />
100<br />
%<br />
80 80<br />
60 60<br />
40 40<br />
20 20<br />
00<br />
54<br />
1992-1993<br />
NFHS<br />
Weaned (not breastfed)<br />
Breastfed <strong>and</strong> solid/<br />
semi-solid foods<br />
Breastfed <strong>and</strong> other<br />
milk/formula<br />
44 44<br />
1992-1993<br />
NFHS<br />
Globally,<br />
undernutriti<strong>on</strong><br />
c<strong>on</strong>tributes to more<br />
than <strong>on</strong>e third of<br />
child deaths<br />
46 46<br />
1998-1999<br />
NFHS<br />
49<br />
1998-1999<br />
NFHS<br />
37 37<br />
2000<br />
MICS<br />
48<br />
2005-2006<br />
NFHS<br />
Breastfed <strong>and</strong><br />
n<strong>on</strong>-milk liquids<br />
Breastfed <strong>and</strong> plain<br />
water <strong>on</strong>ly<br />
Exclusively breastfed<br />
Others<br />
13%<br />
Ne<strong>on</strong>atal<br />
45%<br />
Stunted (under-fi ves, 000): 60,788 Underweight (under-fi ves, 000): 53,823<br />
Share of developing world stunting burden (%): 31.2 Wasted (under-fi ves, 000): 25,075<br />
Stunting country rank: 1 Severely wasted (under-fi ves, 000): 8,105<br />
Exclusive breastfeeding<br />
Percentage of of infants < 6 m<strong>on</strong>ths old exclusively<br />
breastfed<br />
46 46<br />
2005-2006<br />
NFHS
100%<br />
80<br />
60<br />
40<br />
20<br />
0<br />
MICRONUTRIENTS<br />
Vitamin A supplementati<strong>on</strong><br />
Percentage of children 6-59 m<strong>on</strong>ths old receiving two doses<br />
of vitamin A during calendar year<br />
27<br />
ESSENTIAL NUTRITION INTERVENTIONS DURING THE LIFE CYCLE<br />
Pregnancy Birth 0-5 m<strong>on</strong>ths 6-23 m<strong>on</strong>ths 24-59 m<strong>on</strong>ths<br />
Use of ir<strong>on</strong>-folic acid supplements 23%<br />
Household c<strong>on</strong>sumpti<strong>on</strong> of<br />
adequately iodized salt<br />
45<br />
Early initiati<strong>on</strong> of breastfeeding<br />
(within 1 hour of birth)<br />
MATERNAL NUTRITION/HEALTH WATER AND SANITATION<br />
DISPARITIES IN NUTRITION<br />
51<br />
2000 2002 2004 2006 2008<br />
Source: UNICEF<br />
64<br />
45<br />
25%<br />
51% Infants not weighed at birth 66%<br />
<strong>Maternal</strong> mortality ratio, adjusted<br />
(per 100,000 live births)<br />
450 (2005)<br />
<strong>Maternal</strong> mortality ratio, reported<br />
(per 100,000 live births)<br />
250 (2001-2003)<br />
Total number of maternal deaths 117,000 (2005)<br />
Lifetime risk of maternal death (1 in : ) 70 (2005)<br />
Women with low BMI (
Stunting<br />
Underweight<br />
Source:<br />
58<br />
Wasting<br />
DEMOGRAPHICS<br />
Total populati<strong>on</strong> (000) 227,345 (2008)<br />
Total under-fi ve populati<strong>on</strong> (000) 20,891 (2008)<br />
Total number of births (000) 4,220 (2008)<br />
Under-fi ve mortality rate (per 1,000 live births) 41 (2008)<br />
Total number of under-fi ve deaths (000) 173 (2008)<br />
Infant mortality rate (per 1,000 live births) 31 (2008)<br />
Ne<strong>on</strong>atal mortality rate (per 1,000 live births) 17 (2004)<br />
HIV prevalence rate (15–49 years, %) 0.2 (2007)<br />
Populati<strong>on</strong> below internati<strong>on</strong>al<br />
poverty line of US$1.25 per day (%)<br />
NUTRITIONAL STATUS<br />
Burden of undernutriti<strong>on</strong> (2008)<br />
WHO <strong>Child</strong> Growth St<strong>and</strong>ards<br />
Current nutriti<strong>on</strong>al status<br />
Percentage of children < 5 years old suffering from:<br />
14<br />
18<br />
37<br />
INDONESIA<br />
WHO <strong>Child</strong> Growth St<strong>and</strong>ards<br />
NCHS reference populati<strong>on</strong><br />
0 20 40 60 80 100%<br />
Other NS 2007<br />
INFANT AND YOUNG CHILD FEEDING<br />
Infant feeding practices, by age<br />
100%<br />
90<br />
80<br />
70<br />
60<br />
50<br />
40<br />
30<br />
20<br />
10<br />
0<br />
- -<br />
Under-five mortality rate<br />
Deaths per 1,000 live births<br />
<str<strong>on</strong>g>Tracking</str<strong>on</strong>g> <str<strong>on</strong>g>Progress</str<strong>on</strong>g> <strong>on</strong> <strong>Child</strong> <strong>and</strong> <strong>Maternal</strong> Nutriti<strong>on</strong><br />
120<br />
80<br />
40<br />
0<br />
86<br />
1990 1995 2000 2005 2010 2015<br />
Source: IGME 2009<br />
Stunting trends<br />
Percentage of children < 5 years old stunted<br />
NCHS reference populati<strong>on</strong><br />
0-1 2-3 4-5 6-7 8-9 10-11 12-13 14-15 16-17 18-19 20-21 22-23<br />
age (m<strong>on</strong>ths)<br />
Source: DHS 2007<br />
100%<br />
80<br />
60<br />
40<br />
20<br />
0<br />
42<br />
1995<br />
MICS<br />
41<br />
29<br />
MDG<br />
Target<br />
Causes of under-fi ve deaths, 2004<br />
Malaria<br />
1%<br />
Pneum<strong>on</strong>ia<br />
8%<br />
Injuries<br />
17%<br />
Measles<br />
9%<br />
Source: WHO 2008<br />
Underweight trends<br />
Percentage of children < 5 years old<br />
underweight, WHO <strong>Child</strong> Growth St<strong>and</strong>ards<br />
On track towards MDG1<br />
100%<br />
80<br />
60<br />
40<br />
20<br />
0<br />
100 100 %<br />
80 80<br />
60 60<br />
40 40<br />
20 20<br />
00<br />
63 63<br />
1987<br />
DHS<br />
27 23<br />
1995<br />
Other NS<br />
Weaned (not breastfed)<br />
Breastfed <strong>and</strong> solid/<br />
semi-solid foods<br />
Breastfed <strong>and</strong> other<br />
milk/formula<br />
45 45<br />
1991<br />
DHS<br />
Globally,<br />
undernutriti<strong>on</strong><br />
c<strong>on</strong>tributes to more<br />
than <strong>on</strong>e third of<br />
child deaths<br />
37 37<br />
1994<br />
DHS<br />
2003<br />
Other NS<br />
42 42<br />
1997<br />
DHS<br />
Others<br />
11%<br />
40 40<br />
2002-<br />
2003<br />
DHS<br />
18<br />
2007<br />
Other NS<br />
Breastfed <strong>and</strong><br />
n<strong>on</strong>-milk liquids<br />
Breastfed <strong>and</strong> plain<br />
water <strong>on</strong>ly<br />
Exclusively breastfed<br />
Ne<strong>on</strong>atal<br />
41%<br />
Diarrhoea<br />
13%<br />
Stunted (under-fi ves, 000): 7,688 Underweight (under-fi ves, 000): 3,844<br />
Share of developing world stunting burden (%): 3.9 Wasted (under-fi ves, 000): 2,841<br />
Stunting country rank: 5 Severely wasted (under-fi ves, 000): 1,295<br />
Exclusive breastfeeding<br />
Percentage of of infants < 6 m<strong>on</strong>ths old exclusively<br />
breastfed<br />
32 32<br />
2007<br />
DHS
100%<br />
80<br />
60<br />
40<br />
20<br />
0<br />
MICRONUTRIENTS<br />
Vitamin A supplementati<strong>on</strong><br />
Percentage of children 6-59 m<strong>on</strong>ths old receiving two doses<br />
of vitamin A during calendar year<br />
68<br />
57<br />
63<br />
ESSENTIAL NUTRITION INTERVENTIONS DURING THE LIFE CYCLE<br />
Pregnancy Birth 0-5 m<strong>on</strong>ths 6-23 m<strong>on</strong>ths 24-59 m<strong>on</strong>ths<br />
Use of ir<strong>on</strong>-folic acid supplements 29%<br />
Household c<strong>on</strong>sumpti<strong>on</strong> of<br />
adequately iodized salt<br />
62<br />
Early initiati<strong>on</strong> of breastfeeding<br />
(within 1 hour of birth)<br />
MATERNAL NUTRITION/HEALTH WATER AND SANITATION<br />
DISPARITIES IN NUTRITION<br />
73<br />
2000 2002 2004 2006 2008<br />
Source: UNICEF<br />
76<br />
82<br />
39%<br />
62% Infants not weighed at birth 17%<br />
<strong>Maternal</strong> mortality ratio, adjusted<br />
(per 100,000 live births)<br />
420 (2005)<br />
<strong>Maternal</strong> mortality ratio, reported<br />
(per 100,000 live births)<br />
230 (2007)<br />
Total number of maternal deaths 19,000 (2005)<br />
Lifetime risk of maternal death (1 in : ) 97 (2005)<br />
Women with low BMI (
Underweight<br />
60<br />
Stunting<br />
Wasting<br />
DEMOGRAPHICS<br />
KENYA<br />
Total populati<strong>on</strong> (000) 38,765 (2008)<br />
Total under-fi ve populati<strong>on</strong> (000) 6,540 (2008)<br />
Total number of births (000) 1,506 (2008)<br />
Under-fi ve mortality rate (per 1,000 live births) 128 (2008)<br />
Total number of under-fi ve deaths (000) 189 (2008)<br />
Infant mortality rate (per 1,000 live births) 81 (2008)<br />
Ne<strong>on</strong>atal mortality rate (per 1,000 live births) 34 (2004)<br />
HIV prevalence rate (15–49 years, %) - -<br />
Populati<strong>on</strong> below internati<strong>on</strong>al<br />
poverty line of US$1.25 per day (%)<br />
NUTRITIONAL STATUS<br />
Burden of undernutriti<strong>on</strong> (2008)<br />
NCHS reference populati<strong>on</strong><br />
Current nutriti<strong>on</strong>al status<br />
Percentage of children < 5 years old suffering from:<br />
6<br />
21<br />
35<br />
WHO <strong>Child</strong> Growth St<strong>and</strong>ards<br />
NCHS reference populati<strong>on</strong><br />
0 20 40 60 80 100%<br />
Source: Other NS 2005–2006<br />
INFANT AND YOUNG CHILD FEEDING<br />
Infant feeding practices, by age<br />
100%<br />
90<br />
80<br />
70<br />
60<br />
50<br />
40<br />
30<br />
20<br />
10<br />
0<br />
20 (2005-2006)<br />
Under-five mortality rate<br />
Deaths per 1,000 live births<br />
<str<strong>on</strong>g>Tracking</str<strong>on</strong>g> <str<strong>on</strong>g>Progress</str<strong>on</strong>g> <strong>on</strong> <strong>Child</strong> <strong>and</strong> <strong>Maternal</strong> Nutriti<strong>on</strong><br />
160<br />
120<br />
80<br />
40<br />
0<br />
105<br />
128<br />
1990 1995 2000 2005 2010 2015<br />
Source: IGME 2009<br />
Stunting trends<br />
Percentage of children < 5 years old stunted<br />
NCHS reference populati<strong>on</strong><br />
100%<br />
80<br />
60<br />
40<br />
20<br />
0<br />
33 33 35<br />
0-1 2-3 4-5 6-7 8-9 10-11 12-13 14-15 16-17 18-19 20-21 22-23<br />
age (m<strong>on</strong>ths)<br />
Source: DHS 2003<br />
1993<br />
DHS<br />
1998<br />
DHS<br />
2000<br />
MICS<br />
30<br />
2003<br />
DHS<br />
35<br />
MDG<br />
Target<br />
35<br />
2005-2006<br />
Other NS<br />
Causes of under-fi ve deaths, 2004<br />
Malaria<br />
13%<br />
Pneum<strong>on</strong>ia<br />
18%<br />
Injuries<br />
3%<br />
Measles<br />
1%<br />
Diarrhoea<br />
15%<br />
Source: WHO 2008<br />
Underweight trends<br />
Percentage of children < 5 years old<br />
underweight NCHS reference populati<strong>on</strong><br />
Insufficient progress towards MDG1<br />
100%<br />
80<br />
60<br />
40<br />
20<br />
0<br />
100 100 % %<br />
80 80<br />
60 60<br />
40 40<br />
20 20<br />
0 0<br />
22 22 21<br />
1993<br />
DHS<br />
23 23<br />
1989 1989<br />
DHS DHS<br />
1998<br />
DHS<br />
Weaned (not breastfed)<br />
Breastfed <strong>and</strong> solid/<br />
semi-solid foods<br />
Breastfed <strong>and</strong> other<br />
milk/formula<br />
Globally,<br />
undernutriti<strong>on</strong><br />
c<strong>on</strong>tributes to more<br />
than <strong>on</strong>e third of<br />
child deaths<br />
12 12<br />
1993 1993<br />
DHS DHS<br />
2000<br />
MICS<br />
12 12<br />
1998 1998<br />
DHS DHS<br />
HIV/AIDS<br />
10%<br />
20<br />
2003<br />
DHS<br />
Breastfed <strong>and</strong><br />
n<strong>on</strong>-milk liquids<br />
Breastfed <strong>and</strong> plain<br />
water <strong>on</strong>ly<br />
Exclusively breastfed<br />
Others<br />
10%<br />
Ne<strong>on</strong>atal<br />
30%<br />
Stunted (under-fi ves, 000): 2,269 Underweight (under-fi ves, 000): 1,367<br />
Share of developing world stunting burden (%): 1.2 Wasted (under-fi ves, 000): 412<br />
Stunting country rank: 16 Severely wasted (under-fi ves, 000): 78<br />
21<br />
2005-2006<br />
Other NS<br />
Exclusive breastfeeding<br />
Percentage of of infants < < 6 6 m<strong>on</strong>ths old old exclusively<br />
breastfed<br />
13 13<br />
2003 2003<br />
DHS DHS
100%<br />
80<br />
60<br />
40<br />
20<br />
0<br />
MICRONUTRIENTS<br />
Vitamin A supplementati<strong>on</strong><br />
Percentage of children 6-59 m<strong>on</strong>ths old receiving two doses<br />
of vitamin A during calendar year<br />
41<br />
ESSENTIAL NUTRITION INTERVENTIONS DURING THE LIFE CYCLE<br />
Pregnancy Birth 0-5 m<strong>on</strong>ths 6-23 m<strong>on</strong>ths 24-59 m<strong>on</strong>ths<br />
Use of ir<strong>on</strong>-folic acid supplements 3%<br />
Household c<strong>on</strong>sumpti<strong>on</strong> of<br />
adequately iodized salt<br />
0<br />
0<br />
Early initiati<strong>on</strong> of breastfeeding<br />
(within 1 hour of birth)<br />
MATERNAL NUTRITION/HEALTH WATER AND SANITATION<br />
DISPARITIES IN NUTRITION<br />
46<br />
2000 2002 2004 2006 2008<br />
Source: UNICEF<br />
69<br />
52<br />
52%<br />
91% Infants not weighed at birth 55%<br />
<strong>Maternal</strong> mortality ratio, adjusted<br />
(per 100,000 live births)<br />
560 (2005)<br />
<strong>Maternal</strong> mortality ratio, reported<br />
(per 100,000 live births)<br />
410 (1993-2003)<br />
Total number of maternal deaths 7,700 (2005)<br />
Lifetime risk of maternal death (1 in : ) 39 (2005)<br />
Women with low BMI (
Underweight<br />
Source:<br />
62<br />
Stunting<br />
Wasting<br />
DEMOGRAPHICS<br />
Total populati<strong>on</strong> (000) 19,111 (2008)<br />
Total under-fi ve populati<strong>on</strong> (000) 3,060 (2008)<br />
Total number of births (000) 687 (2008)<br />
Under-fi ve mortality rate (per 1,000 live births) 106 (2008)<br />
Total number of under-fi ve deaths (000) 71 (2008)<br />
Infant mortality rate (per 1,000 live births) 68 (2008)<br />
Ne<strong>on</strong>atal mortality rate (per 1,000 live births) 41 (2004)<br />
HIV prevalence rate (15–49 years, %) 0.1 (2007)<br />
Populati<strong>on</strong> below internati<strong>on</strong>al<br />
poverty line of US$1.25 per day (%)<br />
NUTRITIONAL STATUS<br />
Burden of undernutriti<strong>on</strong> (2008)<br />
WHO <strong>Child</strong> Growth St<strong>and</strong>ards<br />
Current nutriti<strong>on</strong>al status<br />
Percentage of children < 5 years old suffering from:<br />
15<br />
13<br />
36<br />
42<br />
MADAGASCAR<br />
53<br />
48<br />
WHO <strong>Child</strong> Growth St<strong>and</strong>ards<br />
NCHS reference populati<strong>on</strong><br />
0 20 40 60 80 100%<br />
DHS 2003-2004<br />
INFANT AND YOUNG CHILD FEEDING<br />
Infant feeding practices, by age<br />
100 %<br />
90<br />
80<br />
70<br />
60<br />
50<br />
40<br />
30<br />
20<br />
10<br />
0<br />
68 (2005)<br />
Under-five mortality rate<br />
Deaths per 1,000 live births<br />
<str<strong>on</strong>g>Tracking</str<strong>on</strong>g> <str<strong>on</strong>g>Progress</str<strong>on</strong>g> <strong>on</strong> <strong>Child</strong> <strong>and</strong> <strong>Maternal</strong> Nutriti<strong>on</strong><br />
200<br />
160<br />
120<br />
80<br />
40<br />
0<br />
167<br />
1990 1995 2000 2005 2010 2015<br />
Source: IGME 2009<br />
100%<br />
80<br />
60<br />
40<br />
20<br />
0<br />
106<br />
Stunting trends<br />
Percentage of children < 5 years old stunted<br />
NCHS reference populati<strong>on</strong><br />
51 50 47 49<br />
0-1 2-3 4-5 6-7 8-9 10-11 12-13 14-15 16-17 18-19 20-21 22-23<br />
age (m<strong>on</strong>ths)<br />
Source: DHS 2003-2004<br />
1992<br />
DHS<br />
1995<br />
MICS<br />
1997<br />
DHS<br />
2000<br />
MICS<br />
56<br />
MDG<br />
Target<br />
48<br />
2003-2004<br />
DHS<br />
Causes of under-fi ve deaths, 2004<br />
Malaria<br />
2%<br />
Pneum<strong>on</strong>ia<br />
24%<br />
Injuries<br />
3%<br />
Measles<br />
3%<br />
Source: WHO 2008<br />
Underweight trends<br />
Percentage of children < 5 years old<br />
underweight NCHS reference populati<strong>on</strong><br />
No progress towards MDG1<br />
100%<br />
80<br />
60<br />
40<br />
20<br />
0<br />
100 100 % %<br />
80 80<br />
60 60<br />
40 40<br />
20 20<br />
0 0<br />
39<br />
1992<br />
DHS<br />
38 38<br />
1992 1992<br />
DHS DHS<br />
34<br />
1995<br />
MICS<br />
Weaned (not breastfed)<br />
Breastfed <strong>and</strong> solid/<br />
semi-solid foods<br />
Breastfed <strong>and</strong> other<br />
milk/formula<br />
Globally,<br />
undernutriti<strong>on</strong><br />
c<strong>on</strong>tributes to more<br />
than <strong>on</strong>e third of<br />
child deaths<br />
48 48<br />
1997 1997<br />
DHS DHS<br />
40<br />
1997<br />
DHS<br />
41 41<br />
33<br />
2000 2000<br />
MICS MICS<br />
2000<br />
MICS<br />
Breastfed <strong>and</strong><br />
n<strong>on</strong>-milk liquids<br />
Breastfed <strong>and</strong> plain<br />
water <strong>on</strong>ly<br />
Exclusively breastfed<br />
42<br />
2003-2004<br />
DHS<br />
Exclusive breastfeeding<br />
Percentage of of infants infants < < 6 6 m<strong>on</strong>ths old old exclusively<br />
breastfed<br />
67 67<br />
Others<br />
13%<br />
Ne<strong>on</strong>atal<br />
34%<br />
Diarrhoea<br />
20%<br />
Stunted (under-fi ves, 000): 1,622 Underweight (under-fi ves, 000): 1,093<br />
Share of developing world stunting burden (%): 0.8 Wasted (under-fi ves, 000): 459<br />
Stunting country rank: 21 Severely wasted (under-fi ves, 000): 162<br />
2003-2004 2003-2004<br />
DHS DHS
100%<br />
80<br />
60<br />
40<br />
20<br />
0<br />
MICRONUTRIENTS<br />
Vitamin A supplementati<strong>on</strong><br />
Percentage of children 6-59 m<strong>on</strong>ths old receiving two doses<br />
of vitamin A during calendar year<br />
38<br />
47<br />
ESSENTIAL NUTRITION INTERVENTIONS DURING THE LIFE CYCLE<br />
Pregnancy Birth 0-5 m<strong>on</strong>ths 6-23 m<strong>on</strong>ths 24-59 m<strong>on</strong>ths<br />
Use of ir<strong>on</strong>-folic acid supplements 3%<br />
Household c<strong>on</strong>sumpti<strong>on</strong> of<br />
adequately iodized salt<br />
0<br />
84<br />
Early initiati<strong>on</strong> of breastfeeding<br />
(within 1 hour of birth)<br />
MATERNAL NUTRITION/HEALTH WATER AND SANITATION<br />
DISPARITIES IN NUTRITION<br />
87<br />
97<br />
100<br />
100<br />
2000 2002 2004 2006 2008<br />
Source: UNICEF<br />
62%<br />
75% Infants not weighed at birth 61%<br />
<strong>Maternal</strong> mortality ratio, adjusted<br />
(per 100,000 live births)<br />
510 (2005)<br />
<strong>Maternal</strong> mortality ratio, reported<br />
(per 100,000 live births)<br />
470 (1999-2003)<br />
Total number of maternal deaths 3,600 (2005)<br />
Lifetime risk of maternal death (1 in : ) 38 (2005)<br />
Women with low BMI (
Underweight<br />
Source:<br />
64<br />
Stunting<br />
Wasting<br />
DEMOGRAPHICS<br />
NUTRITIONAL STATUS<br />
3<br />
2<br />
2<br />
5<br />
16<br />
13<br />
MEXICO<br />
Total populati<strong>on</strong> (000) 108,555 (2008)<br />
Total under-fi ve populati<strong>on</strong> (000) 10,281 (2008)<br />
Total number of births (000) 2,049 (2008)<br />
Under-fi ve mortality rate (per 1,000 live births) 17 (2008)<br />
Total number of under-fi ve deaths (000) 36 (2008)<br />
Infant mortality rate (per 1,000 live births) 15 (2008)<br />
Ne<strong>on</strong>atal mortality rate (per 1,000 live births) 11 (2004)<br />
HIV prevalence rate (15–49 years, %) 0.3 (2007)<br />
Populati<strong>on</strong> below internati<strong>on</strong>al<br />
poverty line of US$1.25 per day (%)<br />
Burden of undernutriti<strong>on</strong> (2008)<br />
WHO <strong>Child</strong> Growth St<strong>and</strong>ards<br />
Current nutriti<strong>on</strong>al status<br />
Percentage of children < 5 years old suffering from:<br />
WHO <strong>Child</strong> Growth St<strong>and</strong>ards<br />
NCHS reference populati<strong>on</strong><br />
0 20 40 60 80 100%<br />
Other NS 2005<br />
INFANT AND YOUNG CHILD FEEDING<br />
Infant feeding practices, by age<br />
100%<br />
90<br />
80<br />
70<br />
60<br />
50<br />
40<br />
30<br />
20<br />
10<br />
0<br />
MICRONUTRIENTS<br />
Vitamin A supplementati<strong>on</strong><br />
Percentage of children 6-59 m<strong>on</strong>ths old receiving two doses<br />
of vitamin A during calendar year<br />
ESSENTIAL NUTRITION INTERVENTIONS DURING THE LIFE CYCLE<br />
Pregnancy Birth 0-5 m<strong>on</strong>ths 6-23 m<strong>on</strong>ths 24-59 m<strong>on</strong>ths<br />
Use of ir<strong>on</strong>-folic acid supplements -<br />
Household c<strong>on</strong>sumpti<strong>on</strong> of<br />
adequately iodized salt<br />
Subnati<strong>on</strong>al Programme<br />
Early initiati<strong>on</strong> of breastfeeding<br />
(within 1 hour of birth)<br />
91% Infants not weighed at birth -<br />
MATERNAL NUTRITION/HEALTH WATER AND SANITATION<br />
<strong>Maternal</strong> mortality ratio, adjusted<br />
(per 100,000 live births)<br />
60 (2005)<br />
<strong>Maternal</strong> mortality ratio, reported<br />
(per 100,000 live births)<br />
56 (2007)<br />
Total number of maternal deaths 1,300 (2005)<br />
Lifetime risk of maternal death (1 in : ) 670 (2005)<br />
Women with low BMI (
Underweight<br />
66<br />
Stunting<br />
Wasting<br />
DEMOGRAPHICS<br />
Total populati<strong>on</strong> (000) 22,383 (2008)<br />
Total under-fi ve populati<strong>on</strong> (000) 3,820 (2008)<br />
Total number of births (000) 876 (2008)<br />
Under-fi ve mortality rate (per 1,000 live births) 130 (2008)<br />
Total number of under-fi ve deaths (000) 110 (2008)<br />
Infant mortality rate (per 1,000 live births) 90 (2008)<br />
Ne<strong>on</strong>atal mortality rate (per 1,000 live births) 35 (2004)<br />
HIV prevalence rate (15–49 years, %) 12.5 (2007)<br />
Populati<strong>on</strong> below internati<strong>on</strong>al<br />
poverty line of US$1.25 per day (%)<br />
NUTRITIONAL STATUS<br />
Burden of undernutriti<strong>on</strong> (2008)<br />
NCHS reference populati<strong>on</strong><br />
Current nutriti<strong>on</strong>al status<br />
Percentage of children < 5 years old suffering from:<br />
4<br />
Source: MICS 2008<br />
18<br />
44<br />
MOZAMBIQUE<br />
WHO <strong>Child</strong> Growth St<strong>and</strong>ards<br />
NCHS reference populati<strong>on</strong><br />
0 20 40 60 80 100%<br />
INFANT AND YOUNG CHILD FEEDING<br />
Infant feeding practices, by age<br />
100%<br />
90<br />
80<br />
70<br />
60<br />
50<br />
40<br />
30<br />
20<br />
10<br />
0<br />
75 (2002-2003)<br />
Under-five mortality rate<br />
Deaths per 1,000 live births<br />
<str<strong>on</strong>g>Tracking</str<strong>on</strong>g> <str<strong>on</strong>g>Progress</str<strong>on</strong>g> <strong>on</strong> <strong>Child</strong> <strong>and</strong> <strong>Maternal</strong> Nutriti<strong>on</strong><br />
280<br />
240<br />
200<br />
160<br />
120<br />
80<br />
40<br />
0<br />
249<br />
1990 1995 2000 2005 2010 2015<br />
Source: IGME 2009<br />
100%<br />
80<br />
60<br />
40<br />
20<br />
0<br />
55<br />
1995<br />
MICS<br />
40<br />
1997<br />
DHS<br />
130<br />
Stunting trends<br />
Percentage of children < 5 years old stunted<br />
NCHS reference populati<strong>on</strong><br />
44 41<br />
2000<br />
Other NS<br />
0-1 2-3 4-5 6-7 8-9 10-11 12-13 14-15 16-17 18-19 20-21 22-23<br />
age (m<strong>on</strong>ths)<br />
Source: MICS 2008<br />
2003<br />
DHS<br />
83<br />
MDG<br />
Target<br />
44<br />
2008<br />
MICS<br />
Causes of under-fi ve deaths, 2004<br />
Malaria<br />
16%<br />
Pneum<strong>on</strong>ia<br />
17%<br />
Injuries<br />
3%<br />
Diarrhoea<br />
13%<br />
Source: WHO 2008<br />
Underweight trends<br />
Percentage of children < 5 years old<br />
underweight NCHS reference populati<strong>on</strong><br />
On track towards MDG1<br />
100%<br />
80<br />
60<br />
40<br />
20<br />
0<br />
100 100 %<br />
80 80<br />
60 60<br />
40 40<br />
20 20<br />
00<br />
27 24 26<br />
1995<br />
MICS<br />
Weaned (not breastfed)<br />
Breastfed <strong>and</strong> solid/<br />
semi-solid foods<br />
Breastfed <strong>and</strong> other<br />
milk/formula<br />
30 30<br />
1997 1997<br />
DHS DHS<br />
Globally,<br />
undernutriti<strong>on</strong><br />
c<strong>on</strong>tributes to more<br />
than <strong>on</strong>e third of<br />
child deaths<br />
1997<br />
DHS<br />
2000<br />
Other NS<br />
30 30<br />
2003 2003<br />
DHS DHS<br />
24<br />
2003<br />
DHS<br />
Breastfed <strong>and</strong><br />
n<strong>on</strong>-milk liquids<br />
Breastfed <strong>and</strong> plain<br />
water <strong>on</strong>ly<br />
Exclusively breastfed<br />
HIV/AIDS<br />
14%<br />
37 37<br />
2008 2008<br />
MICS MICS<br />
Others<br />
13%<br />
Ne<strong>on</strong>atal<br />
24%<br />
Stunted (under-fi ves, 000): 1,670 Underweight (under-fi ves, 000): 669<br />
Share of developing world stunting burden (%): 0.9 Wasted (under-fi ves, 000): 160<br />
Stunting country rank: 20 Severely wasted (under-fi ves, 000): 53<br />
18<br />
2008<br />
MICS<br />
Exclusive breastfeeding<br />
Percentage of of infants < 6 m<strong>on</strong>ths old old exclusively<br />
breastfed
100%<br />
80<br />
60<br />
40<br />
20<br />
0<br />
MICRONUTRIENTS<br />
Vitamin A supplementati<strong>on</strong><br />
Percentage of children 6-59 m<strong>on</strong>ths old receiving two doses<br />
of vitamin A during calendar year<br />
0<br />
ESSENTIAL NUTRITION INTERVENTIONS DURING THE LIFE CYCLE<br />
Pregnancy Birth 0-5 m<strong>on</strong>ths 6-23 m<strong>on</strong>ths 24-59 m<strong>on</strong>ths<br />
Use of ir<strong>on</strong>-folic acid supplements 14%<br />
Household c<strong>on</strong>sumpti<strong>on</strong> of<br />
adequately iodized salt<br />
0<br />
2000 2002 2004 2006 2008<br />
Source: UNICEF<br />
Early initiati<strong>on</strong> of breastfeeding<br />
(within 1 hour of birth)<br />
MATERNAL NUTRITION/HEALTH WATER AND SANITATION<br />
DISPARITIES IN NUTRITION<br />
16<br />
33<br />
42<br />
63%<br />
25% Infants not weighed at birth 42%<br />
<strong>Maternal</strong> mortality ratio, adjusted<br />
(per 100,000 live births)<br />
520 (2005)<br />
<strong>Maternal</strong> mortality ratio, reported<br />
(per 100,000 live births)<br />
410 (1994-2003)<br />
Total number of maternal deaths 4,000 (2005)<br />
Lifetime risk of maternal death (1 in : ) 45 (2005)<br />
Women with low BMI (
Underweight<br />
Source:<br />
68<br />
Stunting<br />
Wasting<br />
DEMOGRAPHICS<br />
NUTRITIONAL STATUS<br />
11<br />
9<br />
32<br />
30<br />
32<br />
41<br />
MYANMAR<br />
Total populati<strong>on</strong> (000) 49,563 (2008)<br />
Total under-fi ve populati<strong>on</strong> (000) 4,629 (2008)<br />
Total number of births (000) 1,020 (2008)<br />
Under-fi ve mortality rate (per 1,000 live births) 98 (2008)<br />
Total number of under-fi ve deaths (000) 98 (2008)<br />
Infant mortality rate (per 1,000 live births) 71 (2008)<br />
Ne<strong>on</strong>atal mortality rate (per 1,000 live births) 49 (2004)<br />
HIV prevalence rate (15–49 years, %) 0.7 (2007)<br />
Populati<strong>on</strong> below internati<strong>on</strong>al<br />
poverty line of US$1.25 per day (%)<br />
Burden of undernutriti<strong>on</strong> (2008)<br />
WHO <strong>Child</strong> Growth St<strong>and</strong>ards<br />
Current nutriti<strong>on</strong>al status<br />
Percentage of children < 5 years old suffering from:<br />
WHO <strong>Child</strong> Growth St<strong>and</strong>ards<br />
NCHS reference populati<strong>on</strong><br />
0 20 40 60 80 100%<br />
MICS 2003<br />
INFANT AND YOUNG CHILD FEEDING<br />
<strong>Child</strong> feeding practices, by age<br />
Complementary feeding<br />
(6 - 9 mos.)<br />
C<strong>on</strong>tinued breastfeeding<br />
(12 - 15 mos.)<br />
C<strong>on</strong>tinued breastfeeding<br />
(20 - 23 mos.)<br />
Source: MICS 2003<br />
- -<br />
Under-five mortality rate<br />
Deaths per 1,000 live births<br />
<str<strong>on</strong>g>Tracking</str<strong>on</strong>g> <str<strong>on</strong>g>Progress</str<strong>on</strong>g> <strong>on</strong> <strong>Child</strong> <strong>and</strong> <strong>Maternal</strong> Nutriti<strong>on</strong><br />
150<br />
120<br />
90<br />
60<br />
30<br />
0<br />
120<br />
1990 1995 2000 2005 2010 2015<br />
Source: IGME 2009<br />
Stunting trends<br />
Percentage of children < 5 years old stunted<br />
NCHS reference populati<strong>on</strong><br />
100%<br />
80<br />
60<br />
40<br />
20<br />
0<br />
48<br />
1991<br />
Other NS<br />
66<br />
67<br />
53<br />
1994<br />
Other NS<br />
85<br />
98<br />
34 32<br />
2000<br />
MICS<br />
40<br />
MDG<br />
Target<br />
2003<br />
MICS<br />
0 10 20 30 40 50 60 70 80 90 100%<br />
Causes of under-fi ve deaths, 2004<br />
Malaria<br />
3%<br />
Pneum<strong>on</strong>ia<br />
16%<br />
Injuries<br />
2%<br />
Measles<br />
3%<br />
Diarrhoea<br />
20%<br />
Source: WHO 2008<br />
Underweight trends<br />
Percentage of children < 5 years old<br />
underweight NCHS reference populati<strong>on</strong><br />
Insufficient progress towards MDG1<br />
100%<br />
80<br />
60<br />
40<br />
20<br />
0<br />
100<br />
%<br />
80 80<br />
60 60<br />
40 40<br />
20 20<br />
00<br />
41<br />
1991<br />
Other NS<br />
Globally,<br />
undernutriti<strong>on</strong><br />
c<strong>on</strong>tributes to more<br />
than <strong>on</strong>e third of<br />
child deaths<br />
35<br />
1994<br />
Other NS<br />
43<br />
1995<br />
MICS<br />
15 15<br />
2003<br />
MICS<br />
39<br />
1997<br />
MICS<br />
35<br />
2000<br />
MICS<br />
Data not available to produce infant feeding practices<br />
area graph<br />
Others<br />
10%<br />
Ne<strong>on</strong>atal<br />
45%<br />
HIV/AIDS<br />
1%<br />
Stunted (under-fi ves, 000): 1,880 Underweight (under-fi ves, 000): 1,370<br />
Share of developing world stunting burden (%): 1.0 Wasted (under-fi ves, 000): 495<br />
Stunting country rank: 18 Severely wasted (under-fi ves, 000): 134<br />
32<br />
2003<br />
MICS<br />
Exclusive breastfeeding<br />
Percentage of of infants < 6 m<strong>on</strong>ths old exclusively<br />
breastfed
100%<br />
80<br />
60<br />
40<br />
20<br />
0<br />
MICRONUTRIENTS<br />
Vitamin A supplementati<strong>on</strong><br />
Percentage of children 6-59 m<strong>on</strong>ths old receiving two doses<br />
of vitamin A during calendar year<br />
66<br />
96<br />
92<br />
ESSENTIAL NUTRITION INTERVENTIONS DURING THE LIFE CYCLE<br />
Pregnancy Birth 0-5 m<strong>on</strong>ths 6-23 m<strong>on</strong>ths 24-59 m<strong>on</strong>ths<br />
Use of ir<strong>on</strong>-folic acid supplements -<br />
Household c<strong>on</strong>sumpti<strong>on</strong> of<br />
adequately iodized salt<br />
87<br />
96 94<br />
Early initiati<strong>on</strong> of breastfeeding<br />
(within 1 hour of birth)<br />
93% Infants not weighed at birth -<br />
MATERNAL NUTRITION/HEALTH WATER AND SANITATION<br />
DISPARITIES IN NUTRITION<br />
96<br />
2000 2002 2004 2006 2008<br />
Source: UNICEF<br />
<strong>Maternal</strong> mortality ratio, adjusted<br />
(per 100,000 live births)<br />
380 (2005)<br />
<strong>Maternal</strong> mortality ratio, reported<br />
(per 100,000 live births)<br />
320 (2004-2005)<br />
Total number of maternal deaths 3,700 (2005)<br />
Lifetime risk of maternal death (1 in : ) 110 (2005)<br />
Women with low BMI (
Underweight<br />
Source:<br />
70<br />
Stunting<br />
Wasting<br />
DEMOGRAPHICS<br />
NEPAL<br />
Total populati<strong>on</strong> (000) 28,810 (2008)<br />
Total under-fi ve populati<strong>on</strong> (000) 3,535 (2008)<br />
Total number of births (000) 732 (2008)<br />
Under-fi ve mortality rate (per 1,000 live births) 51 (2008)<br />
Total number of under-fi ve deaths (000) 37 (2008)<br />
Infant mortality rate (per 1,000 live births) 41 (2008)<br />
Ne<strong>on</strong>atal mortality rate (per 1,000 live births) 32 (2004)<br />
HIV prevalence rate (15–49 years, %) 0.5 (2007)<br />
Populati<strong>on</strong> below internati<strong>on</strong>al<br />
poverty line of US$1.25 per day (%)<br />
NUTRITIONAL STATUS<br />
Burden of undernutriti<strong>on</strong> (2008)<br />
WHO <strong>Child</strong> Growth St<strong>and</strong>ards<br />
Current nutriti<strong>on</strong>al status<br />
Percentage of children < 5 years old suffering from:<br />
13<br />
12<br />
39<br />
49<br />
43<br />
45<br />
WHO <strong>Child</strong> Growth St<strong>and</strong>ards<br />
NCHS reference populati<strong>on</strong><br />
0 20 40 60 80 100%<br />
DHS 2006<br />
INFANT AND YOUNG CHILD FEEDING<br />
Infant feeding practices, by age<br />
100%<br />
90<br />
80<br />
70<br />
60<br />
50<br />
40<br />
30<br />
20<br />
10<br />
0<br />
55 (2003-2004)<br />
Under-five mortality rate<br />
Deaths per 1,000 live births<br />
<str<strong>on</strong>g>Tracking</str<strong>on</strong>g> <str<strong>on</strong>g>Progress</str<strong>on</strong>g> <strong>on</strong> <strong>Child</strong> <strong>and</strong> <strong>Maternal</strong> Nutriti<strong>on</strong><br />
160<br />
120<br />
80<br />
40<br />
0<br />
142<br />
1990 1995 2000 2005 2010 2015<br />
Source: IGME 2009<br />
Stunting trends<br />
Percentage of children < 5 years old stunted<br />
NCHS reference populati<strong>on</strong><br />
100%<br />
80<br />
60<br />
40<br />
20<br />
0<br />
57 54 51<br />
1996<br />
DHS<br />
1998<br />
Other NS<br />
0-1 2-3 4-5 6-7 8-9 10-11 12-13 14-15 16-17 18-19 20-21 22-23<br />
age (m<strong>on</strong>ths)<br />
Source: DHS 2006<br />
2001<br />
DHS<br />
51<br />
47<br />
MDG<br />
Target<br />
43<br />
2006<br />
DHS<br />
Causes of under-fi ve deaths, 2004<br />
Pneum<strong>on</strong>ia<br />
17%<br />
Injuries<br />
2%<br />
Measles<br />
3%<br />
Diarrhoea<br />
24%<br />
Source: WHO 2008<br />
Underweight trends<br />
Percentage of children < 5 years old<br />
underweight NCHS reference populati<strong>on</strong><br />
No No progress towards MDG1 MDG 1<br />
100%<br />
80<br />
60<br />
40<br />
20<br />
0<br />
100<br />
100<br />
%<br />
%<br />
80<br />
80<br />
60<br />
60<br />
40<br />
40<br />
20<br />
20<br />
0<br />
0<br />
52<br />
1996<br />
DHS<br />
Weaned (not breastfed)<br />
Breastfed <strong>and</strong> solid/<br />
semi-solid foods<br />
Breastfed <strong>and</strong> other<br />
milk/formula<br />
74<br />
74<br />
1996<br />
1996<br />
DHS<br />
DHS<br />
Globally,<br />
undernutriti<strong>on</strong><br />
c<strong>on</strong>tributes to more<br />
than <strong>on</strong>e third of<br />
child deaths<br />
47<br />
1998<br />
Other NS<br />
68<br />
68<br />
2001<br />
2001<br />
DHS<br />
DHS<br />
48<br />
2001<br />
DHS<br />
Breastfed <strong>and</strong><br />
n<strong>on</strong>-milk liquids<br />
Breastfed <strong>and</strong> plain<br />
water <strong>on</strong>ly<br />
Exclusively breastfed<br />
53<br />
53<br />
45<br />
2006<br />
DHS<br />
Exclusive breastfeeding<br />
Percentage<br />
Percentage<br />
of<br />
of<br />
infants<br />
infants<br />
<<br />
<<br />
6<br />
6<br />
m<strong>on</strong>ths<br />
m<strong>on</strong>ths<br />
old<br />
old<br />
exclusively<br />
exclusively<br />
breastfed<br />
breastfed<br />
2006<br />
2006<br />
DHS<br />
DHS<br />
Others<br />
12%<br />
Ne<strong>on</strong>atal<br />
42%<br />
Stunted (under-fi ves, 000): 1,743 Underweight (under-fi ves, 000): 1,365<br />
Share of developing world stunting burden (%): 0.9 Wasted (under-fi ves, 000): 445<br />
Stunting country rank: 19 Severely wasted (under-fi ves, 000): 92
100%<br />
80<br />
60<br />
40<br />
20<br />
0<br />
MICRONUTRIENTS<br />
Vitamin A supplementati<strong>on</strong><br />
Percentage of children 6-59 m<strong>on</strong>ths old receiving two doses<br />
of vitamin A during calendar year<br />
73<br />
96<br />
83<br />
ESSENTIAL NUTRITION INTERVENTIONS DURING THE LIFE CYCLE<br />
Pregnancy Birth 0-5 m<strong>on</strong>ths 6-23 m<strong>on</strong>ths 24-59 m<strong>on</strong>ths<br />
Use of ir<strong>on</strong>-folic acid supplements 7%<br />
Household c<strong>on</strong>sumpti<strong>on</strong> of<br />
adequately iodized salt<br />
96<br />
96 95<br />
Early initiati<strong>on</strong> of breastfeeding<br />
(within 1 hour of birth)<br />
MATERNAL NUTRITION/HEALTH WATER AND SANITATION<br />
DISPARITIES IN NUTRITION<br />
96<br />
2000 2002 2004 2006 2008<br />
Source: UNICEF<br />
35%<br />
63% Infants not weighed at birth 83%<br />
<strong>Maternal</strong> mortality ratio, adjusted<br />
(per 100,000 live births)<br />
830 (2005)<br />
<strong>Maternal</strong> mortality ratio, reported<br />
(per 100,000 live births)<br />
280 (1999-2005)<br />
Total number of maternal deaths 6,500 (2005)<br />
Lifetime risk of maternal death (1 in : ) 31 (2005)<br />
Women with low BMI (
Underweight<br />
Source:<br />
72<br />
Stunting<br />
Wasting<br />
DEMOGRAPHICS<br />
NIGER<br />
Total populati<strong>on</strong> (000) 14,704 (2008)<br />
Total under-fi ve populati<strong>on</strong> (000) 3,121 (2008)<br />
Total number of births (000) 791 (2008)<br />
Under-fi ve mortality rate (per 1,000 live births) 167 (2008)<br />
Total number of under-fi ve deaths (000) 121 (2008)<br />
Infant mortality rate (per 1,000 live births) 79 (2008)<br />
Ne<strong>on</strong>atal mortality rate (per 1,000 live births) 41 (2004)<br />
HIV prevalence rate (15–49 years, %) 0.8 (2007)<br />
Populati<strong>on</strong> below internati<strong>on</strong>al<br />
poverty line of US$1.25 per day (%)<br />
NUTRITIONAL STATUS<br />
Burden of undernutriti<strong>on</strong> (2008)<br />
WHO <strong>Child</strong> Growth St<strong>and</strong>ards<br />
Current nutriti<strong>on</strong>al status<br />
Percentage of children < 5 years old suffering from:<br />
12<br />
11<br />
36<br />
39<br />
43<br />
47<br />
WHO <strong>Child</strong> Growth St<strong>and</strong>ards<br />
NCHS reference populati<strong>on</strong><br />
0 20 40 60 80 100%<br />
Other NS 2008<br />
INFANT AND YOUNG CHILD FEEDING<br />
Infant feeding practices, by age<br />
100%<br />
90<br />
80<br />
70<br />
60<br />
50<br />
40<br />
30<br />
20<br />
10<br />
0<br />
66 (2005)<br />
Under-five mortality rate<br />
Deaths per 1,000 live births<br />
<str<strong>on</strong>g>Tracking</str<strong>on</strong>g> <str<strong>on</strong>g>Progress</str<strong>on</strong>g> <strong>on</strong> <strong>Child</strong> <strong>and</strong> <strong>Maternal</strong> Nutriti<strong>on</strong><br />
360<br />
320<br />
280<br />
240<br />
200<br />
160<br />
120<br />
80<br />
40<br />
0<br />
305<br />
1990 1995 2000 2005 2010 2015<br />
Source: IGME 2009<br />
100 %<br />
80<br />
60<br />
40<br />
20<br />
0<br />
38<br />
1985<br />
Other NS<br />
40<br />
1992<br />
DHS<br />
47<br />
1998<br />
DHS<br />
40<br />
2000<br />
MICS<br />
167<br />
Stunting trends<br />
Percentage of children < 5 years old stunted<br />
NCHS reference populati<strong>on</strong><br />
0-1 2-3 4-5 6-7 8-9 10-11 12-13 14-15 16-17 18-19 20-21 22-23<br />
age (m<strong>on</strong>ths)<br />
Source: DHS 2006<br />
50<br />
2006<br />
DHS<br />
102<br />
MDG<br />
Target<br />
39<br />
2008<br />
Other NS<br />
Causes of under-fi ve deaths, 2004<br />
Others<br />
13%<br />
Malaria<br />
16%<br />
Pneum<strong>on</strong>ia<br />
29%<br />
Source: WHO 2008<br />
Underweight trends<br />
Percentage of children < 5 years old<br />
underweight NCHS reference populati<strong>on</strong><br />
No progress towards MDG1<br />
100%<br />
80<br />
60<br />
40<br />
20<br />
0<br />
100 100 % %<br />
80 80<br />
60 60<br />
40 40<br />
20 20<br />
00<br />
49 49<br />
43<br />
1985<br />
Other NS<br />
33<br />
1992<br />
DHS DHS<br />
1992<br />
DHS<br />
Weaned (not breastfed)<br />
Breastfed <strong>and</strong> solid/<br />
semi-solid foods<br />
Breastfed <strong>and</strong> other<br />
milk/formula<br />
Globally,<br />
undernutriti<strong>on</strong><br />
c<strong>on</strong>tributes to more<br />
than <strong>on</strong>e third of<br />
child deaths<br />
11<br />
1998<br />
DHS DHS<br />
1998<br />
DHS<br />
11<br />
2000<br />
MICS<br />
40<br />
2000<br />
MICS<br />
14 14<br />
44<br />
2006<br />
DHS<br />
Breastfed <strong>and</strong><br />
n<strong>on</strong>-milk liquids<br />
Breastfed <strong>and</strong> plain<br />
water <strong>on</strong>ly<br />
Exclusively breastfed<br />
99<br />
Ne<strong>on</strong>atal<br />
16%<br />
Diarrhoea<br />
21%<br />
Measles<br />
3%<br />
Injuries<br />
1%<br />
Stunted (under-fi ves, 000): 1,473 Underweight (under-fi ves, 000): 1,108<br />
Share of developing world stunting burden (%): 0.8 Wasted (under-fi ves, 000): 362<br />
Stunting country rank: 23 Severely wasted (under-fi ves, 000): 87<br />
43<br />
2008<br />
Other NS<br />
Exclusive breastfeeding<br />
Percentage of of infants < < 6 6 m<strong>on</strong>ths old old exclusively<br />
breastfed<br />
44<br />
2006<br />
2007<br />
2008<br />
DHS DHS Other NS NS Other NS NS
100%<br />
80<br />
60<br />
40<br />
20<br />
0<br />
MICRONUTRIENTS<br />
Vitamin A supplementati<strong>on</strong><br />
Percentage of children 6-59 m<strong>on</strong>ths old receiving two doses<br />
of vitamin A during calendar year<br />
92<br />
88<br />
94 88<br />
100<br />
92<br />
77<br />
68<br />
2000 2002 2004 2006 2008<br />
Source: UNICEF<br />
ESSENTIAL NUTRITION INTERVENTIONS DURING THE LIFE CYCLE<br />
Pregnancy Birth 0-5 m<strong>on</strong>ths 6-23 m<strong>on</strong>ths 24-59 m<strong>on</strong>ths<br />
Use of ir<strong>on</strong>-folic acid supplements 14%<br />
Household c<strong>on</strong>sumpti<strong>on</strong> of<br />
adequately iodized salt<br />
Early initiati<strong>on</strong> of breastfeeding<br />
(within 1 hour of birth)<br />
MATERNAL NUTRITION/HEALTH WATER AND SANITATION<br />
DISPARITIES IN NUTRITION<br />
100%<br />
38%<br />
46% Infants not weighed at birth 79%<br />
<strong>Maternal</strong> mortality ratio, adjusted<br />
(per 100,000 live births)<br />
1,800 (2005)<br />
<strong>Maternal</strong> mortality ratio, reported<br />
(per 100,000 live births)<br />
650 (1996-2006)<br />
Total number of maternal deaths 14,000 (2005)<br />
Lifetime risk of maternal death (1 in : ) 7 (2005)<br />
Women with low BMI (
Underweight<br />
74<br />
Stunting<br />
Wasting<br />
DEMOGRAPHICS<br />
NUTRITIONAL STATUS<br />
14<br />
12<br />
23<br />
27<br />
41<br />
37<br />
NIGERIA<br />
Total populati<strong>on</strong> (000) 151,212 (2008)<br />
Total under-fi ve populati<strong>on</strong> (000) 25,020 (2008)<br />
Total number of births (000) 6,028 (2008)<br />
Under-fi ve mortality rate (per 1,000 live births) 186 (2008)<br />
Total number of under-fi ve deaths (000) 1,077 (2008)<br />
Infant mortality rate (per 1,000 live births) 96 (2008)<br />
Ne<strong>on</strong>atal mortality rate (per 1,000 live births) 47 (2004)<br />
HIV prevalence rate (15–49 years, %) 3.1 (2007)<br />
Populati<strong>on</strong> below internati<strong>on</strong>al<br />
poverty line of US$1.25 per day (%)<br />
Burden of undernutriti<strong>on</strong> (2008)<br />
WHO <strong>Child</strong> Growth St<strong>and</strong>ards<br />
Current nutriti<strong>on</strong>al status<br />
Percentage of children < 5 years old suffering from:<br />
Source: pDHS 2008<br />
WHO <strong>Child</strong> Growth St<strong>and</strong>ards<br />
NCHS reference populati<strong>on</strong><br />
0 20 40 60 80 100%<br />
INFANT AND YOUNG CHILD FEEDING<br />
Infant feeding practices, by age<br />
100%<br />
90<br />
80<br />
70<br />
60<br />
50<br />
40<br />
30<br />
20<br />
10<br />
0<br />
64 (2003-2004)<br />
Under-five mortality rate<br />
Deaths per 1,000 live births<br />
<str<strong>on</strong>g>Tracking</str<strong>on</strong>g> <str<strong>on</strong>g>Progress</str<strong>on</strong>g> <strong>on</strong> <strong>Child</strong> <strong>and</strong> <strong>Maternal</strong> Nutriti<strong>on</strong><br />
280<br />
240<br />
200<br />
160<br />
120<br />
80<br />
40<br />
0<br />
230<br />
1990 1995 2000 2005 2010 2015<br />
Source: IGME 2009<br />
100%<br />
80<br />
60<br />
40<br />
20<br />
0<br />
43<br />
1990<br />
DHS<br />
186<br />
Stunting trends<br />
Percentage of children < 5 years old stunted<br />
NCHS reference populati<strong>on</strong><br />
38 37<br />
0-1 2-3 4-5 6-7 8-9 10-11 12-13 14-15 16-17 18-19 20-21 22-23<br />
age (m<strong>on</strong>ths)<br />
Source: DHS 2008<br />
2003<br />
DHS<br />
2008<br />
pDHS<br />
77<br />
MDG<br />
Target<br />
Causes of under-fi ve deaths, 2004<br />
Malaria<br />
20%<br />
Pneum<strong>on</strong>ia<br />
17%<br />
Injuries<br />
2% Measles<br />
11%<br />
Source: WHO 2008<br />
Underweight trends<br />
Percentage of children < 5 years old<br />
underweight NCHS reference populati<strong>on</strong><br />
Insufficient progress towards MDG1<br />
100%<br />
80<br />
60<br />
40<br />
20<br />
0<br />
100 100 % %<br />
80 80<br />
60 60<br />
40 40<br />
20 20<br />
0 0<br />
36<br />
1990<br />
DHS<br />
Weaned (not breastfed)<br />
Breastfed <strong>and</strong> solid/<br />
semi-solid foods<br />
Breastfed <strong>and</strong> other<br />
milk/formula<br />
11<br />
1990 1990<br />
DHS DHS<br />
Globally,<br />
undernutriti<strong>on</strong><br />
c<strong>on</strong>tributes to more<br />
than <strong>on</strong>e third of<br />
child deaths<br />
17 17<br />
1999 1999<br />
DHS DHS<br />
29<br />
2003<br />
DHS<br />
17 17<br />
2003 2003<br />
DHS DHS<br />
27<br />
2008<br />
pDHS<br />
Breastfed <strong>and</strong><br />
n<strong>on</strong>-milk liquids<br />
Breastfed <strong>and</strong> plain<br />
water <strong>on</strong>ly<br />
Exclusively breastfed<br />
Exclusive breastfeeding<br />
Percentage of of infants < < 6 6 m<strong>on</strong>ths old old exclusively<br />
breastfed<br />
13 13<br />
2008 2008<br />
pDHS<br />
DHS<br />
Others<br />
10%<br />
Ne<strong>on</strong>atal<br />
24%<br />
HIV/AIDS<br />
3%<br />
Diarrhoea<br />
13%<br />
Stunted (under-fi ves, 000): 10,158 Underweight (under-fi ves, 000): 5,780<br />
Share of developing world stunting burden (%): 5.2 Wasted (under-fi ves, 000): 3,478<br />
Stunting country rank: 3 Severely wasted (under-fi ves, 000): 1,751
100%<br />
80<br />
60<br />
40<br />
20<br />
0<br />
MICRONUTRIENTS<br />
Vitamin A supplementati<strong>on</strong><br />
Percentage of children 6-59 m<strong>on</strong>ths old receiving two doses<br />
of vitamin A during calendar year<br />
0<br />
60<br />
31<br />
ESSENTIAL NUTRITION INTERVENTIONS DURING THE LIFE CYCLE<br />
Pregnancy Birth 0-5 m<strong>on</strong>ths 6-23 m<strong>on</strong>ths 24-59 m<strong>on</strong>ths<br />
Use of ir<strong>on</strong>-folic acid supplements 21%<br />
Household c<strong>on</strong>sumpti<strong>on</strong> of<br />
adequately iodized salt<br />
Early initiati<strong>on</strong> of breastfeeding<br />
(within 1 hour of birth)<br />
MATERNAL NUTRITION/HEALTH WATER AND SANITATION<br />
DISPARITIES IN NUTRITION<br />
76<br />
2000 2002 2004 2006 2008<br />
Source: UNICEF<br />
73<br />
70<br />
32%<br />
97% Infants not weighed at birth 73%<br />
<strong>Maternal</strong> mortality ratio, adjusted<br />
(per 100,000 live births)<br />
1,100 (2005)<br />
<strong>Maternal</strong> mortality ratio, reported<br />
(per 100,000 live births)<br />
- -<br />
Total number of maternal deaths 59,000 (2005)<br />
Lifetime risk of maternal death (1 in : ) 18 (2005)<br />
Women with low BMI (
Underweight<br />
Source:<br />
76<br />
Stunting<br />
Wasting<br />
DEMOGRAPHICS<br />
NUTRITIONAL STATUS<br />
14<br />
13<br />
31<br />
42<br />
37<br />
38<br />
PAKISTAN<br />
Total populati<strong>on</strong> (000) 176,952 (2008)<br />
Total under-fi ve populati<strong>on</strong> (000) 23,778 (2008)<br />
Total number of births (000) 5,337 (2008)<br />
Under-fi ve mortality rate (per 1,000 live births) 89 (2008)<br />
Total number of under-fi ve deaths (000) 465 (2008)<br />
Infant mortality rate (per 1,000 live births) 72 (2008)<br />
Ne<strong>on</strong>atal mortality rate (per 1,000 live births) 53 (2004)<br />
HIV prevalence rate (15–49 years, %) 0.1 (2007)<br />
Populati<strong>on</strong> below internati<strong>on</strong>al<br />
poverty line of US$1.25 per day (%)<br />
Burden of undernutriti<strong>on</strong> (2008)<br />
WHO <strong>Child</strong> Growth St<strong>and</strong>ards<br />
Current nutriti<strong>on</strong>al status<br />
Percentage of children < 5 years old suffering from:<br />
100%<br />
90<br />
80<br />
70<br />
60<br />
50<br />
40<br />
30<br />
20<br />
10<br />
0<br />
Source:<br />
WHO <strong>Child</strong> Growth St<strong>and</strong>ards<br />
NCHS reference populati<strong>on</strong><br />
0 20 40 60 80 100%<br />
Other NS 2001-2002<br />
INFANT AND YOUNG CHILD FEEDING<br />
Infant feeding practices, by age<br />
Under-five mortality rate<br />
Deaths per 1,000 live births<br />
<str<strong>on</strong>g>Tracking</str<strong>on</strong>g> <str<strong>on</strong>g>Progress</str<strong>on</strong>g> <strong>on</strong> <strong>Child</strong> <strong>and</strong> <strong>Maternal</strong> Nutriti<strong>on</strong><br />
160<br />
120<br />
80<br />
40<br />
0<br />
130<br />
1990 1995 2000 2005 2010 2015<br />
Source: IGME 2009<br />
0-1 2-3 4-5 6-7 8-9 10-11 12-13 14-15 16-17 18-19 20-21 22-23<br />
age (m<strong>on</strong>ths)<br />
DHS 2006-2007<br />
23 (2004-2005)<br />
89<br />
43<br />
MDG<br />
Target<br />
Causes of under-fi ve deaths, 2004<br />
Pneum<strong>on</strong>ia<br />
15%<br />
Injuries<br />
2%<br />
Measles<br />
5%<br />
Diarrhoea<br />
11%<br />
Source: WHO 2008<br />
Weaned (not breastfed)<br />
Breastfed <strong>and</strong> solid/<br />
semi-solid foods<br />
Breastfed <strong>and</strong> other<br />
milk/formula<br />
Exclusive breastfeeding<br />
Percentage of of infants < < 6 6 m<strong>on</strong>ths old old exclusively<br />
breastfed<br />
100 100 % %<br />
80 80<br />
60 60<br />
40 40<br />
20 20<br />
00<br />
Globally,<br />
undernutriti<strong>on</strong><br />
c<strong>on</strong>tributes to more<br />
than <strong>on</strong>e third of<br />
child deaths<br />
16 16<br />
1995 1995<br />
MICS MICS<br />
Breastfed <strong>and</strong><br />
n<strong>on</strong>-milk liquids<br />
Breastfed <strong>and</strong> plain<br />
water <strong>on</strong>ly<br />
Exclusively breastfed<br />
37 37<br />
2006-2007<br />
DHS DHS<br />
Others<br />
15%<br />
Ne<strong>on</strong>atal<br />
52%<br />
Stunted (under-fi ves, 000): 9,868 Underweight (under-fi ves, 000): 7,442<br />
Share of developing world stunting burden (%): 5.1 Wasted (under-fi ves, 000): 3,376<br />
Stunting country rank: 4 Severely wasted (under-fi ves, 000): 1,403<br />
Stunting trends<br />
Percentage of children < 5 years old stunted<br />
NCHS reference populati<strong>on</strong><br />
100%<br />
80%<br />
60%<br />
40%<br />
20%<br />
0%<br />
58<br />
1985<br />
Other NS<br />
50<br />
1990–1991<br />
DHS<br />
37<br />
2001–2002<br />
Other NS<br />
Underweight trends<br />
Percentage of children < 5 years old underweight<br />
NCHS reference populati<strong>on</strong><br />
Insuffi cient progress towards MDG 1<br />
100%<br />
80%<br />
60%<br />
40%<br />
20%<br />
0%<br />
49<br />
1985<br />
Other NS<br />
40<br />
1990–1991<br />
DHS<br />
38<br />
1995<br />
MICS<br />
38<br />
2001–2002<br />
Other NS
100%<br />
80<br />
60<br />
40<br />
20<br />
0<br />
MICRONUTRIENTS<br />
Vitamin A supplementati<strong>on</strong><br />
Percentage of children 6-59 m<strong>on</strong>ths old receiving two doses<br />
of vitamin A during calendar year<br />
95<br />
100<br />
95<br />
ESSENTIAL NUTRITION INTERVENTIONS DURING THE LIFE CYCLE<br />
Pregnancy Birth 0-5 m<strong>on</strong>ths 6-23 m<strong>on</strong>ths 24-59 m<strong>on</strong>ths<br />
Use of ir<strong>on</strong>-folic acid supplements 16%<br />
Household c<strong>on</strong>sumpti<strong>on</strong> of<br />
adequately iodized salt<br />
95<br />
100<br />
100 100<br />
Early initiati<strong>on</strong> of breastfeeding<br />
(within 1 hour of birth)<br />
MATERNAL NUTRITION/HEALTH WATER AND SANITATION<br />
DISPARITIES IN NUTRITION<br />
100<br />
2000 2002 2004 2006 2008<br />
Source: UNICEF<br />
29%<br />
17% Infants not weighed at birth 90%<br />
<strong>Maternal</strong> mortality ratio, adjusted<br />
(per 100,000 live births)<br />
320 (2005)<br />
<strong>Maternal</strong> mortality ratio, reported<br />
(per 100,000 live births)<br />
280 (2006-2007)<br />
Total number of maternal deaths 15,000 (2005)<br />
Lifetime risk of maternal death (1 in : ) 74 (2005)<br />
Women with low BMI (
Underweight<br />
Source:<br />
78<br />
Stunting<br />
Wasting<br />
DEMOGRAPHICS<br />
Total populati<strong>on</strong> (000) 90,348 (2008)<br />
Total under-fi ve populati<strong>on</strong> (000) 10,701 (2008)<br />
Total number of births (000) 2,236 (2008)<br />
Under-fi ve mortality rate (per 1,000 live births) 32 (2008)<br />
Total number of under-fi ve deaths (000) 73 (2008)<br />
Infant mortality rate (per 1,000 live births) 26 (2008)<br />
Ne<strong>on</strong>atal mortality rate (per 1,000 live births) 15 (2004)<br />
HIV prevalence rate (15–49 years, %) - -<br />
Populati<strong>on</strong> below internati<strong>on</strong>al<br />
poverty line of US$1.25 per day (%)<br />
NUTRITIONAL STATUS<br />
Burden of undernutriti<strong>on</strong> (2008)<br />
WHO <strong>Child</strong> Growth St<strong>and</strong>ards<br />
Current nutriti<strong>on</strong>al status<br />
Percentage of children < 5 years old suffering from:<br />
6<br />
6<br />
21<br />
34<br />
30<br />
28<br />
PHILIPPINES<br />
WHO <strong>Child</strong> Growth St<strong>and</strong>ards<br />
NCHS reference populati<strong>on</strong><br />
0 20 40 60 80 100%<br />
Other NS 2003<br />
INFANT AND YOUNG CHILD FEEDING<br />
Infant feeding practices, by age<br />
100%<br />
90<br />
80<br />
70<br />
60<br />
50<br />
40<br />
30<br />
20<br />
10<br />
0<br />
23 (2006)<br />
Under-five mortality rate<br />
Deaths per 1,000 live births<br />
<str<strong>on</strong>g>Tracking</str<strong>on</strong>g> <str<strong>on</strong>g>Progress</str<strong>on</strong>g> <strong>on</strong> <strong>Child</strong> <strong>and</strong> <strong>Maternal</strong> Nutriti<strong>on</strong><br />
100<br />
80<br />
60<br />
40<br />
20<br />
0<br />
61<br />
1990 1995 2000 2005 2010 2015<br />
Source: IGME 2009<br />
Stunting trends<br />
Percentage of children < 5 years old stunted<br />
NCHS reference populati<strong>on</strong><br />
100%<br />
80<br />
60<br />
40<br />
20<br />
0<br />
42 39 37<br />
33<br />
30<br />
32<br />
31<br />
20<br />
MDG<br />
Target<br />
1982 1987 1989- 1993 1996 2001 2003<br />
Other NS Other NS 1990<br />
Other NS<br />
Other NS Other NS Other NS Other NS<br />
0-1 2-3 4-5 6-7 8-9 10-11 12-13 14-15 16-17 18-19 20-21 22-23<br />
age (m<strong>on</strong>ths)<br />
Source: DHS 2003<br />
30<br />
Causes of under-fi ve deaths, 2004<br />
Pneum<strong>on</strong>ia<br />
13%<br />
Injuries<br />
3%<br />
Diarrhoea<br />
14%<br />
Source: WHO 2008<br />
Underweight trends<br />
Percentage of children < 5 years old<br />
underweight NCHS reference populati<strong>on</strong><br />
Insufficient progress towards MDG1<br />
100%<br />
80<br />
60<br />
40<br />
20<br />
0<br />
100<br />
% %<br />
80 80<br />
60 60<br />
40 40<br />
20 20<br />
0 0<br />
33 33 34<br />
30<br />
1982 1987 1989- 1993 1996 2001 2003<br />
Other NS Other NS 1990<br />
Other NS<br />
Other NS Other NS Other NS Other NS<br />
Weaned (not breastfed)<br />
Breastfed <strong>and</strong> solid/<br />
semi-solid foods<br />
Breastfed <strong>and</strong> other<br />
milk/formula<br />
Exclusive breastfeeding<br />
Percentage of of infants < < 6 6 m<strong>on</strong>ths old exclusively<br />
breastfed<br />
26 26<br />
1993<br />
DHS<br />
Globally,<br />
undernutriti<strong>on</strong><br />
c<strong>on</strong>tributes to more<br />
than <strong>on</strong>e third of<br />
child deaths<br />
37 37<br />
1998<br />
DHS<br />
28<br />
34 34<br />
2003<br />
DHS<br />
31<br />
Breastfed <strong>and</strong><br />
n<strong>on</strong>-milk liquids<br />
Breastfed <strong>and</strong> plain<br />
water <strong>on</strong>ly<br />
Exclusively breastfed<br />
34 34<br />
28<br />
2008<br />
DHS<br />
Others<br />
26%<br />
Ne<strong>on</strong>atal<br />
44%<br />
Stunted (under-fi ves, 000): 3,617 Underweight (under-fi ves, 000): 2,215<br />
Share of developing world stunting burden (%): 1.9 Wasted (under-fi ves, 000): 642<br />
Stunting country rank: 9 Severely wasted (under-fi ves, 000): 171
100%<br />
80<br />
60<br />
40<br />
20<br />
0<br />
MICRONUTRIENTS<br />
Vitamin A supplementati<strong>on</strong><br />
Percentage of children 6-59 m<strong>on</strong>ths old receiving two doses<br />
of vitamin A during calendar year<br />
82<br />
76<br />
86<br />
ESSENTIAL NUTRITION INTERVENTIONS DURING THE LIFE CYCLE<br />
Pregnancy Birth 0-5 m<strong>on</strong>ths 6-23 m<strong>on</strong>ths 24-59 m<strong>on</strong>ths<br />
Use of ir<strong>on</strong>-folic acid supplements 29%<br />
Household c<strong>on</strong>sumpti<strong>on</strong> of<br />
adequately iodized salt<br />
76<br />
Early initiati<strong>on</strong> of breastfeeding<br />
(within 1 hour of birth)<br />
MATERNAL NUTRITION/HEALTH WATER AND SANITATION<br />
DISPARITIES IN NUTRITION<br />
59<br />
2000 2002 2004 2006 2008<br />
Source: UNICEF<br />
85<br />
86<br />
54%<br />
45% Infants not weighed at birth 28%<br />
<strong>Maternal</strong> mortality ratio, adjusted<br />
(per 100,000 live births)<br />
230 (2005)<br />
<strong>Maternal</strong> mortality ratio, reported<br />
(per 100,000 live births)<br />
160 (2006)<br />
Total number of maternal deaths 4,600 (2005)<br />
Lifetime risk of maternal death (1 in : ) 140 (2005)<br />
Women with low BMI (
Underweight<br />
Source:<br />
80<br />
Stunting<br />
Wasting<br />
DEMOGRAPHICS<br />
Total populati<strong>on</strong> (000) 49,668 (2008)<br />
Total under-fi ve populati<strong>on</strong> (000) 5,200 (2008)<br />
Total number of births (000) 1,091 (2008)<br />
Under-fi ve mortality rate (per 1,000 live births) 67 (2008)<br />
Total number of under-fi ve deaths (000) 73 (2008)<br />
Infant mortality rate (per 1,000 live births) 48 (2008)<br />
Ne<strong>on</strong>atal mortality rate (per 1,000 live births) 17 (2004)<br />
HIV prevalence rate (15–49 years, %) 18.1 (2007)<br />
Populati<strong>on</strong> below internati<strong>on</strong>al<br />
poverty line of US$1.25 per day (%)<br />
NUTRITIONAL STATUS<br />
Burden of undernutriti<strong>on</strong> (2008)<br />
NCHS reference populati<strong>on</strong><br />
Current nutriti<strong>on</strong>al status<br />
Percentage of children < 5 years old suffering from:<br />
12<br />
5<br />
27<br />
SOUTH AFRICA<br />
WHO <strong>Child</strong> Growth St<strong>and</strong>ards<br />
NCHS reference populati<strong>on</strong><br />
0 20 40 60 80 100%<br />
DHS 2003<br />
INFANT AND YOUNG CHILD FEEDING<br />
Infant feeding practices, by age<br />
100%<br />
90<br />
80<br />
70<br />
60<br />
50<br />
40<br />
30<br />
20<br />
10<br />
0<br />
26 (2000)<br />
Under-five mortality rate<br />
Deaths per 1,000 live births<br />
<str<strong>on</strong>g>Tracking</str<strong>on</strong>g> <str<strong>on</strong>g>Progress</str<strong>on</strong>g> <strong>on</strong> <strong>Child</strong> <strong>and</strong> <strong>Maternal</strong> Nutriti<strong>on</strong><br />
100<br />
80<br />
60<br />
40<br />
20<br />
0<br />
56<br />
1990 1995 2000 2005 2010 2015<br />
Source: IGME 2009<br />
Stunting trends<br />
Percentage of children < 5 years old stunted<br />
NCHS reference populati<strong>on</strong><br />
100%<br />
80<br />
60<br />
40<br />
20<br />
0<br />
67<br />
25 25 27<br />
1994<br />
Other NS<br />
1999<br />
Other NS<br />
0-1 2-3 4-5 6-7 8-9 10-11 12-13 14-15 16-17 18-19 20-21 22-23<br />
age (m<strong>on</strong>ths)<br />
Source: DHS 2003<br />
2003<br />
DHS<br />
19<br />
MDG<br />
Target<br />
Causes of under-fi ve deaths, 2004<br />
Pneum<strong>on</strong>ia<br />
8%<br />
Injuries<br />
3%<br />
Diarrhoea<br />
8%<br />
Source: WHO 2008<br />
Underweight trends<br />
Percentage of children < 5 years old<br />
underweight NCHS reference populati<strong>on</strong><br />
No progress towards MDG1<br />
100%<br />
80<br />
60<br />
40<br />
20<br />
0<br />
100 100 % %<br />
80 80<br />
60 60<br />
40 40<br />
20 20<br />
00<br />
9<br />
1994<br />
Other NS<br />
Weaned (not breastfed)<br />
Breastfed <strong>and</strong> solid/<br />
semi-solid foods<br />
Breastfed <strong>and</strong> other<br />
milk/formula<br />
Globally,<br />
undernutriti<strong>on</strong><br />
c<strong>on</strong>tributes to more<br />
than <strong>on</strong>e third of<br />
child deaths<br />
77<br />
1998 1998<br />
DHS DHS<br />
12<br />
1999<br />
Other NS<br />
88<br />
2003 2003<br />
DHS DHS<br />
12<br />
2003<br />
DHS<br />
Breastfed <strong>and</strong><br />
n<strong>on</strong>-milk liquids<br />
Breastfed <strong>and</strong> plain<br />
water <strong>on</strong>ly<br />
Exclusively breastfed<br />
Others<br />
12%<br />
Ne<strong>on</strong>atal<br />
24%<br />
HIV/AIDS<br />
45%<br />
Stunted (under-fi ves, 000): 1,425 Underweight (under-fi ves, 000): 598<br />
Share of developing world stunting burden (%): 0.7 Wasted (under-fi ves, 000): 270<br />
Stunting country rank: 24 Severely wasted (under-fi ves, 000): 94<br />
Exclusive breastfeeding<br />
Percentage of of infants infants < < 6 6 m<strong>on</strong>ths m<strong>on</strong>ths old old exclusively<br />
breastfed
100%<br />
80<br />
60<br />
40<br />
20<br />
0<br />
MICRONUTRIENTS<br />
Vitamin A supplementati<strong>on</strong><br />
Percentage of children 6-59 m<strong>on</strong>ths old receiving two doses<br />
of vitamin A during calendar year<br />
2000 2002 2004 2006 2008<br />
Source: UNICEF<br />
ESSENTIAL NUTRITION INTERVENTIONS DURING THE LIFE CYCLE<br />
Pregnancy Birth 0-5 m<strong>on</strong>ths 6-23 m<strong>on</strong>ths 24-59 m<strong>on</strong>ths<br />
Use of ir<strong>on</strong>-folic acid supplements 11%<br />
Household c<strong>on</strong>sumpti<strong>on</strong> of<br />
adequately iodized salt<br />
Early initiati<strong>on</strong> of breastfeeding<br />
(within 1 hour of birth)<br />
MATERNAL NUTRITION/HEALTH WATER AND SANITATION<br />
DISPARITIES IN NUTRITION<br />
29<br />
15<br />
61%<br />
62% Infants not weighed at birth 32%<br />
<strong>Maternal</strong> mortality ratio, adjusted<br />
(per 100,000 live births)<br />
400 (2005)<br />
<strong>Maternal</strong> mortality ratio, reported<br />
(per 100,000 live births)<br />
170 (2003)<br />
Total number of maternal deaths 4,300 (2005)<br />
Lifetime risk of maternal death (1 in : ) 110 (2005)<br />
Women with low BMI (
82<br />
DEMOGRAPHICS<br />
NUTRITIONAL STATUS<br />
SUDAN<br />
Total populati<strong>on</strong> (000) 41,348 (2008)<br />
Total under-fi ve populati<strong>on</strong> (000) 5,836 (2008)<br />
Total number of births (000) 1,296 (2008)<br />
Under-fi ve mortality rate (per 1,000 live births) 109 (2008)<br />
Total number of under-fi ve deaths (000) 138 (2008)<br />
Infant mortality rate (per 1,000 live births) 70 (2008)<br />
Ne<strong>on</strong>atal mortality rate (per 1,000 live births) 27 (2004)<br />
HIV prevalence rate (15–49 years, %) 1.4 (2007)<br />
Populati<strong>on</strong> below internati<strong>on</strong>al<br />
poverty line of US$1.25 per day (%)<br />
Burden of undernutriti<strong>on</strong> (2008)<br />
WHO <strong>Child</strong> Growth St<strong>and</strong>ards<br />
Underweight<br />
Source:<br />
100%<br />
90<br />
80<br />
70<br />
60<br />
50<br />
40<br />
30<br />
20<br />
10<br />
0<br />
Stunting<br />
Wasting<br />
16<br />
15<br />
27<br />
40<br />
33<br />
31<br />
0 20 40 60 80 100%<br />
Other NS 2006<br />
INFANT AND YOUNG CHILD FEEDING<br />
Infant feeding practices, by age<br />
- -<br />
Current nutriti<strong>on</strong>al status<br />
Percentage of children < 5 years old suffering from:<br />
WHO <strong>Child</strong> Growth St<strong>and</strong>ards<br />
NCHS reference populati<strong>on</strong><br />
Under-five mortality rate<br />
Deaths per 1,000 live births<br />
<str<strong>on</strong>g>Tracking</str<strong>on</strong>g> <str<strong>on</strong>g>Progress</str<strong>on</strong>g> <strong>on</strong> <strong>Child</strong> <strong>and</strong> <strong>Maternal</strong> Nutriti<strong>on</strong><br />
160<br />
120<br />
80<br />
40<br />
0<br />
124<br />
109<br />
1990 1995 2000 2005 2010 2015<br />
Source: IGME 2009<br />
Stunting trends<br />
Percentage of children < 5 years old stunted<br />
NCHS reference populati<strong>on</strong><br />
100%<br />
80<br />
60<br />
40<br />
20<br />
0<br />
32<br />
1986<br />
Other NS<br />
33<br />
1992-1993<br />
Other NS<br />
0-1 2-3 4-5 6-7 8-9 10-11 12-13 14-15 16-17 18-19 20-21 22-23<br />
age (m<strong>on</strong>ths)<br />
Source: Other NS 2006<br />
43<br />
2000<br />
MICS<br />
41<br />
MDG<br />
Target<br />
33<br />
2006<br />
Other NS<br />
Causes of under-fi ve deaths, 2004<br />
Others<br />
15%<br />
Malaria<br />
21%<br />
Pneum<strong>on</strong>ia<br />
15%<br />
Source: WHO 2008<br />
Underweight trends<br />
Percentage of children < 5 years old<br />
underweight NCHS reference populati<strong>on</strong><br />
Insufficient progress towards MDG1<br />
100%<br />
80<br />
60<br />
40<br />
20<br />
0<br />
100 100%<br />
%<br />
80 80<br />
60 60<br />
40 40<br />
20 20<br />
0<br />
20<br />
1986<br />
Other NS<br />
Weaned (not breastfed)<br />
Breastfed <strong>and</strong> solid/<br />
semi-solid foods<br />
Breastfed <strong>and</strong> other<br />
milk/formula<br />
13 13<br />
1989-1990<br />
DHS DHS<br />
Globally,<br />
undernutriti<strong>on</strong><br />
c<strong>on</strong>tributes to more<br />
than <strong>on</strong>e third of<br />
child deaths<br />
34<br />
1992-1993<br />
Other NS<br />
16 16<br />
2000 2000<br />
MICS MICS<br />
Injuries<br />
5%<br />
41<br />
2000<br />
MICS<br />
Breastfed <strong>and</strong><br />
n<strong>on</strong>-milk liquids<br />
Breastfed <strong>and</strong> plain<br />
water <strong>on</strong>ly<br />
Exclusively breastfed<br />
31<br />
2006<br />
Other NS<br />
Exclusive breastfeeding<br />
Percentage of of infants < 6 m<strong>on</strong>ths old old exclusively<br />
breastfed<br />
34 34<br />
2006 2006<br />
Other Other NS NS<br />
Ne<strong>on</strong>atal<br />
26%<br />
HIV/AIDS<br />
3%<br />
Diarrhoea<br />
13%<br />
Measles<br />
3%<br />
Stunted (under-fi ves, 000): 2,305 Underweight (under-fi ves, 000): 1,576<br />
Share of developing world stunting burden (%): 1.2 Wasted (under-fi ves, 000): 945<br />
Stunting country rank: 15 Severely wasted (under-fi ves, 000): 403
100%<br />
80<br />
60<br />
40<br />
20<br />
0<br />
MICRONUTRIENTS<br />
Vitamin A supplementati<strong>on</strong><br />
Percentage of children 6-59 m<strong>on</strong>ths old receiving two doses<br />
of vitamin A during calendar year<br />
15<br />
88<br />
93<br />
2000 2002 2004 2006 2008<br />
Source: UNICEF<br />
ESSENTIAL NUTRITION INTERVENTIONS DURING THE LIFE CYCLE<br />
Pregnancy Birth 0-5 m<strong>on</strong>ths 6-23 m<strong>on</strong>ths 24-59 m<strong>on</strong>ths<br />
Use of ir<strong>on</strong>-folic acid supplements -<br />
Household c<strong>on</strong>sumpti<strong>on</strong> of<br />
adequately iodized salt<br />
Early initiati<strong>on</strong> of breastfeeding<br />
(within 1 hour of birth)<br />
11% Infants not weighed at birth -<br />
MATERNAL NUTRITION/HEALTH WATER AND SANITATION<br />
<strong>Maternal</strong> mortality ratio, adjusted<br />
(per 100,000 live births)<br />
450 (2005)<br />
<strong>Maternal</strong> mortality ratio, reported<br />
(per 100,000 live births)<br />
1,100 (2006)<br />
Total number of maternal deaths 5,300 (2005)<br />
Lifetime risk of maternal death (1 in : ) 53 (2005)<br />
Women with low BMI (
Underweight<br />
Source:<br />
84<br />
Stunting<br />
Wasting<br />
DEMOGRAPHICS<br />
NUTRITIONAL STATUS<br />
6<br />
5<br />
16<br />
20<br />
38<br />
32<br />
UGANDA<br />
Total populati<strong>on</strong> (000) 31,657 (2008)<br />
Total under-fi ve populati<strong>on</strong> (000) 6,182 (2008)<br />
Total number of births (000) 1,466 (2008)<br />
Under-fi ve mortality rate (per 1,000 live births) 135 (2008)<br />
Total number of under-fi ve deaths (000) 190 (2008)<br />
Infant mortality rate (per 1,000 live births) 85 (2008)<br />
Ne<strong>on</strong>atal mortality rate (per 1,000 live births) 30 (2004)<br />
HIV prevalence rate (15–49 years, %) 5.4 (2007)<br />
Populati<strong>on</strong> below internati<strong>on</strong>al<br />
poverty line of US$1.25 per day (%)<br />
Burden of undernutriti<strong>on</strong> (2008)<br />
WHO <strong>Child</strong> Growth St<strong>and</strong>ards<br />
Current nutriti<strong>on</strong>al status<br />
Percentage of children < 5 years old suffering from:<br />
WHO <strong>Child</strong> Growth St<strong>and</strong>ards<br />
NCHS reference populati<strong>on</strong><br />
0 20 40 60 80 100%<br />
DHS 2006<br />
INFANT AND YOUNG CHILD FEEDING<br />
Infant feeding practices, by age<br />
100%<br />
90<br />
80<br />
70<br />
60<br />
50<br />
40<br />
30<br />
20<br />
10<br />
0<br />
52 (2005)<br />
Under-five mortality rate<br />
Deaths per 1,000 live births<br />
<str<strong>on</strong>g>Tracking</str<strong>on</strong>g> <str<strong>on</strong>g>Progress</str<strong>on</strong>g> <strong>on</strong> <strong>Child</strong> <strong>and</strong> <strong>Maternal</strong> Nutriti<strong>on</strong><br />
200<br />
160<br />
120<br />
80<br />
40<br />
0<br />
186<br />
1990 1995 2000 2005 2010 2015<br />
Source: IGME 2009<br />
100%<br />
80<br />
60<br />
40<br />
20<br />
0<br />
45<br />
1988-1989<br />
DHS<br />
40 39<br />
1995<br />
DHS<br />
135<br />
Stunting trends<br />
Percentage of children < 5 years old stunted<br />
NCHS reference populati<strong>on</strong><br />
2000-2001<br />
DHS<br />
0-1 2-3 4-5 6-7 8-9 10-11 12-13 14-15 16-17 18-19 20-21 22-23<br />
age (m<strong>on</strong>ths)<br />
Source: DHS 2006<br />
62<br />
MDG<br />
Target<br />
32<br />
2006<br />
DHS<br />
Causes of under-fi ve deaths, 2004<br />
Others<br />
10%<br />
Malaria<br />
21%<br />
Pneum<strong>on</strong>ia<br />
19%<br />
Source: WHO 2008<br />
Underweight trends<br />
Percentage of children < 5 years old<br />
underweight NCHS reference populati<strong>on</strong><br />
Insufficient progress towards MDG1<br />
100%<br />
80<br />
60<br />
40<br />
20<br />
0<br />
100 100 % %<br />
80 80<br />
60 60<br />
40 40<br />
20 20<br />
0 0<br />
23<br />
1988-1989<br />
DHS<br />
Weaned (not breastfed)<br />
Breastfed <strong>and</strong> solid/<br />
semi-solid foods<br />
Breastfed <strong>and</strong> other<br />
milk/formula<br />
67 67<br />
1988-1989 1988-1989<br />
DHS DHS<br />
Globally,<br />
undernutriti<strong>on</strong><br />
c<strong>on</strong>tributes to more<br />
than <strong>on</strong>e third of<br />
child deaths<br />
25 23<br />
1995<br />
DHS<br />
57 57<br />
1995 1995<br />
DHS DHS<br />
Injuries<br />
4%<br />
2000-2001<br />
DHS<br />
Breastfed <strong>and</strong><br />
n<strong>on</strong>-milk liquids<br />
Breastfed <strong>and</strong> plain<br />
water <strong>on</strong>ly<br />
Exclusively breastfed<br />
63 63<br />
2000-2001 2000-2001<br />
DHS DHS<br />
Ne<strong>on</strong>atal<br />
23%<br />
HIV/AIDS<br />
8%<br />
Diarrhoea<br />
15%<br />
Stunted (under-fi ves, 000): 2,355 Underweight (under-fi ves, 000): 983<br />
Share of developing world stunting burden (%): 1.2 Wasted (under-fi ves, 000): 377<br />
Stunting country rank: 14 Severely wasted (under-fi ves, 000): 124<br />
20<br />
2006<br />
DHS<br />
Exclusive breastfeeding<br />
Percentage of of infants infants < < 6 6 m<strong>on</strong>ths m<strong>on</strong>ths old old exclusively<br />
breastfed<br />
60 60<br />
2006 2006<br />
DHS DHS
100%<br />
80<br />
60<br />
40<br />
20<br />
0<br />
MICRONUTRIENTS<br />
Vitamin A supplementati<strong>on</strong><br />
Percentage of children 6-59 m<strong>on</strong>ths old receiving two doses<br />
of vitamin A during calendar year<br />
0<br />
31<br />
ESSENTIAL NUTRITION INTERVENTIONS DURING THE LIFE CYCLE<br />
Pregnancy Birth 0-5 m<strong>on</strong>ths 6-23 m<strong>on</strong>ths 24-59 m<strong>on</strong>ths<br />
Use of ir<strong>on</strong>-folic acid supplements 1%<br />
Household c<strong>on</strong>sumpti<strong>on</strong> of<br />
adequately iodized salt<br />
0<br />
Early initiati<strong>on</strong> of breastfeeding<br />
(within 1 hour of birth)<br />
MATERNAL NUTRITION/HEALTH WATER AND SANITATION<br />
DISPARITIES IN NUTRITION<br />
55<br />
2000 2002 2004 2006 2008<br />
Source: UNICEF<br />
78<br />
71<br />
42%<br />
96% Infants not weighed at birth 65%<br />
<strong>Maternal</strong> mortality ratio, adjusted<br />
(per 100,000 live births)<br />
550 (2005)<br />
<strong>Maternal</strong> mortality ratio, reported<br />
(per 100,000 live births)<br />
440 (1997-2006)<br />
Total number of maternal deaths 8,100 (2005)<br />
Lifetime risk of maternal death (1 in : ) 25 (2005)<br />
Women with low BMI (
Stunting<br />
Underweight<br />
Source:<br />
86<br />
Wasting<br />
DEMOGRAPHICS<br />
Total populati<strong>on</strong> (000) 42,484 (2008)<br />
Total under-fi ve populati<strong>on</strong> (000) 7,566 (2008)<br />
Total number of births (000) 1,771 (2008)<br />
Under-fi ve mortality rate (per 1,000 live births) 104 (2008)<br />
Total number of under-fi ve deaths (000) 175 (2008)<br />
Infant mortality rate (per 1,000 live births) 67 (2008)<br />
Ne<strong>on</strong>atal mortality rate (per 1,000 live births) 35 (2004)<br />
HIV prevalence rate (15–49 years, %) 6.2 (2007)<br />
Populati<strong>on</strong> below internati<strong>on</strong>al<br />
poverty line of US$1.25 per day (%)<br />
NUTRITIONAL STATUS<br />
Burden of undernutriti<strong>on</strong> (2008)<br />
WHO <strong>Child</strong> Growth St<strong>and</strong>ards<br />
Current nutriti<strong>on</strong>al status<br />
Percentage of children < 5 years old suffering from:<br />
4<br />
3<br />
17<br />
22<br />
44<br />
38<br />
UNITED REPUBLIC OF TANZANIA<br />
WHO <strong>Child</strong> Growth St<strong>and</strong>ards<br />
NCHS reference populati<strong>on</strong><br />
0 20 40 60 80 100%<br />
DHS 2004-2005<br />
INFANT AND YOUNG CHILD FEEDING<br />
Infant feeding practices, by age<br />
100%<br />
90<br />
80<br />
70<br />
60<br />
50<br />
40<br />
30<br />
20<br />
10<br />
0<br />
89 (2000-2001)<br />
Under-five mortality rate<br />
Deaths per 1,000 live births<br />
<str<strong>on</strong>g>Tracking</str<strong>on</strong>g> <str<strong>on</strong>g>Progress</str<strong>on</strong>g> <strong>on</strong> <strong>Child</strong> <strong>and</strong> <strong>Maternal</strong> Nutriti<strong>on</strong><br />
200<br />
160<br />
120<br />
80<br />
40<br />
0<br />
157<br />
1990 1995 2000 2005 2010 2015<br />
Source: IGME 2009<br />
100%<br />
80<br />
60<br />
40<br />
20<br />
0<br />
47<br />
1991-1992<br />
DHS<br />
43<br />
1996<br />
DHS<br />
44<br />
1999<br />
DHS<br />
104<br />
Stunting trends<br />
Percentage of children < 5 years old stunted<br />
NCHS reference populati<strong>on</strong><br />
0-1 2-3 4-5 6-7 8-9 10-11 12-13 14-15 16-17 18-19 20-21 22-23<br />
age (m<strong>on</strong>ths)<br />
Source: DHS 2004-2005<br />
52<br />
MDG<br />
Target<br />
38<br />
2004-2005<br />
DHS<br />
Causes of under-fi ve deaths, 2004<br />
Others<br />
12%<br />
Malaria<br />
19%<br />
Pneum<strong>on</strong>ia<br />
15%<br />
Source: WHO 2008<br />
Underweight trends<br />
Percentage of children < 5 years old<br />
underweight NCHS reference populati<strong>on</strong><br />
Insufficient progress towards MDG1<br />
100%<br />
80<br />
60<br />
40<br />
20<br />
0<br />
100 100 % %<br />
80 80<br />
60 60<br />
40 40<br />
20 20<br />
0 0<br />
29<br />
1991-1992<br />
DHS<br />
Weaned (not breastfed)<br />
Breastfed <strong>and</strong> solid/<br />
semi-solid foods<br />
Breastfed <strong>and</strong> other<br />
milk/formula<br />
23 23<br />
1991-1992 1991-1992<br />
DHS DHS<br />
Globally,<br />
undernutriti<strong>on</strong><br />
c<strong>on</strong>tributes to more<br />
than <strong>on</strong>e third of<br />
child deaths<br />
31 29<br />
1996<br />
DHS<br />
29 29<br />
1996 1996<br />
DHS DHS<br />
Injuries<br />
3%<br />
1999<br />
DHS<br />
Breastfed <strong>and</strong><br />
n<strong>on</strong>-milk liquids<br />
Breastfed <strong>and</strong> plain<br />
water <strong>on</strong>ly<br />
Exclusively breastfed<br />
32 32<br />
1999 1999<br />
Other Other NS NS<br />
Ne<strong>on</strong>atal<br />
29%<br />
HIV/AIDS<br />
10%<br />
Diarrhoea<br />
12%<br />
Stunted (under-fi ves, 000): 3,359 Underweight (under-fi ves, 000): 1,263<br />
Share of developing world stunting burden (%): 1.7 Wasted (under-fi ves, 000): 265<br />
Stunting country rank: 10 Severely wasted (under-fi ves, 000): 76<br />
22<br />
2004-2005<br />
DHS<br />
Exclusive breastfeeding<br />
Percentage of of infants infants < < 6 6 m<strong>on</strong>ths old old exclusively<br />
breastfed<br />
41 41<br />
2004-2005 2004-2005<br />
DHS DHS
100%<br />
80<br />
60<br />
40<br />
20<br />
0<br />
MICRONUTRIENTS<br />
Vitamin A supplementati<strong>on</strong><br />
Percentage of children 6-59 m<strong>on</strong>ths old receiving two doses<br />
of vitamin A during calendar year<br />
22<br />
81<br />
90<br />
ESSENTIAL NUTRITION INTERVENTIONS DURING THE LIFE CYCLE<br />
Pregnancy Birth 0-5 m<strong>on</strong>ths 6-23 m<strong>on</strong>ths 24-59 m<strong>on</strong>ths<br />
Use of ir<strong>on</strong>-folic acid supplements 10%<br />
Household c<strong>on</strong>sumpti<strong>on</strong> of<br />
adequately iodized salt<br />
91<br />
95 94<br />
Early initiati<strong>on</strong> of breastfeeding<br />
(within 1 hour of birth)<br />
MATERNAL NUTRITION/HEALTH WATER AND SANITATION<br />
DISPARITIES IN NUTRITION<br />
93<br />
2000 2002 2004 2006 2008<br />
Source: UNICEF<br />
67%<br />
43% Infants not weighed at birth 50%<br />
<strong>Maternal</strong> mortality ratio, adjusted<br />
(per 100,000 live births)<br />
950 (2005)<br />
<strong>Maternal</strong> mortality ratio, reported<br />
(per 100,000 live births)<br />
580 (2004-2005)<br />
Total number of maternal deaths 13,000 (2005)<br />
Lifetime risk of maternal death (1 in : ) 24 (2005)<br />
Women with low BMI (
Underweight<br />
Source:<br />
88<br />
Stunting<br />
Wasting<br />
DEMOGRAPHICS<br />
NUTRITIONAL STATUS<br />
8<br />
20<br />
36<br />
VIET NAM<br />
Total populati<strong>on</strong> (000) 87,096 (2008)<br />
Total under-fi ve populati<strong>on</strong> (000) 7,316 (2008)<br />
Total number of births (000) 1,494 (2008)<br />
Under-fi ve mortality rate (per 1,000 live births) 14 (2008)<br />
Total number of under-fi ve deaths (000) 21 (2008)<br />
Infant mortality rate (per 1,000 live births) 12 (2008)<br />
Ne<strong>on</strong>atal mortality rate (per 1,000 live births) 12 (2004)<br />
HIV prevalence rate (15–49 years, %) 0.5 (2007)<br />
Populati<strong>on</strong> below internati<strong>on</strong>al<br />
poverty line of US$1.25 per day (%)<br />
Burden of undernutriti<strong>on</strong> (2008)<br />
NCHS reference populati<strong>on</strong><br />
Current nutriti<strong>on</strong>al status<br />
Percentage of children < 5 years old suffering from:<br />
WHO <strong>Child</strong> Growth St<strong>and</strong>ards<br />
NCHS reference populati<strong>on</strong><br />
0 20 40 60 80 100%<br />
MICS 2006<br />
INFANT AND YOUNG CHILD FEEDING<br />
Infant feeding practices, by age<br />
100%<br />
90<br />
80<br />
70<br />
60<br />
50<br />
40<br />
30<br />
20<br />
10<br />
0<br />
22 (2006)<br />
Under-five mortality rate<br />
Deaths per 1,000 live births<br />
<str<strong>on</strong>g>Tracking</str<strong>on</strong>g> <str<strong>on</strong>g>Progress</str<strong>on</strong>g> <strong>on</strong> <strong>Child</strong> <strong>and</strong> <strong>Maternal</strong> Nutriti<strong>on</strong><br />
80<br />
60<br />
40<br />
20<br />
0<br />
56<br />
1990 1995 2000 2005 2010 2015<br />
Source: IGME 2009<br />
Stunting trends<br />
Percentage of children < 5 years old stunted<br />
NCHS reference populati<strong>on</strong><br />
100%<br />
80<br />
60<br />
40<br />
20<br />
0<br />
57<br />
1987<br />
Other NS<br />
14<br />
34 36 36<br />
1998<br />
Other NS<br />
0-1 2-3 4-5 6-7 8-9 10-11 12-13 14-15 16-17 18-19 20-21 22-23<br />
age (m<strong>on</strong>ths)<br />
Source: MICS 2006<br />
2000<br />
MICS<br />
19<br />
MDG<br />
Target<br />
2006<br />
MICS<br />
Causes of under-fi ve deaths, 2004<br />
Pneum<strong>on</strong>ia<br />
11%<br />
Injuries<br />
5%<br />
Measles<br />
1%<br />
Diarrhoea<br />
13%<br />
HIV/AIDS<br />
1%<br />
Source: WHO 2008<br />
Underweight trends<br />
Percentage of children < 5 years old<br />
underweight NCHS reference populati<strong>on</strong><br />
On track towards MDG1<br />
100%<br />
80<br />
60<br />
40<br />
20<br />
0<br />
100<br />
100<br />
%<br />
%<br />
80<br />
80<br />
60<br />
60<br />
40<br />
40<br />
20<br />
20<br />
0<br />
0<br />
45<br />
1987<br />
Other NS<br />
Weaned (not breastfed)<br />
Breastfed <strong>and</strong> solid/<br />
semi-solid foods<br />
Breastfed <strong>and</strong> other<br />
milk/formula<br />
17 17<br />
1997<br />
1997<br />
DHS<br />
DHS<br />
Globally,<br />
undernutriti<strong>on</strong><br />
c<strong>on</strong>tributes to more<br />
than <strong>on</strong>e third of<br />
child deaths<br />
39<br />
1998<br />
Other NS<br />
15 15<br />
2002<br />
2002<br />
DHS<br />
DHS<br />
33<br />
2000<br />
MICS<br />
Breastfed <strong>and</strong><br />
n<strong>on</strong>-milk liquids<br />
Breastfed <strong>and</strong> plain<br />
water <strong>on</strong>ly<br />
Exclusively breastfed<br />
12 12<br />
2005<br />
2005<br />
Other<br />
Other<br />
NS<br />
NS<br />
Others<br />
15%<br />
Ne<strong>on</strong>atal<br />
54%<br />
Stunted (under-fi ves, 000): 2,619 Underweight (under-fi ves, 000): 1,478<br />
Share of developing world stunting burden (%): 1.3 Wasted (under-fi ves, 000): 615<br />
Stunting country rank: 13 Severely wasted (under-fi ves, 000): 212<br />
20<br />
2006<br />
MICS<br />
Exclusive breastfeeding<br />
Percentage Percentage of of infants infants < < 6 6 m<strong>on</strong>ths m<strong>on</strong>ths old old exclusively exclusively<br />
breastfed breastfed<br />
17 17<br />
2006<br />
2006<br />
MICS<br />
MICS
MICRONUTRIENTS<br />
Vitamin A supplementati<strong>on</strong><br />
Percentage of children 6-59 m<strong>on</strong>ths old receiving two doses<br />
of vitamin A during calendar year<br />
99 99 99 99 99 98<br />
100%<br />
98<br />
80<br />
60<br />
40<br />
20<br />
0<br />
58<br />
ESSENTIAL NUTRITION INTERVENTIONS DURING THE LIFE CYCLE<br />
Pregnancy Birth 0-5 m<strong>on</strong>ths 6-23 m<strong>on</strong>ths 24-59 m<strong>on</strong>ths<br />
Use of ir<strong>on</strong>-folic acid supplements -<br />
Household c<strong>on</strong>sumpti<strong>on</strong> of<br />
adequately iodized salt<br />
55<br />
2000 2002 2004 2006 2008<br />
Source: UNICEF<br />
Early initiati<strong>on</strong> of breastfeeding<br />
(within 1 hour of birth)<br />
MATERNAL NUTRITION/HEALTH WATER AND SANITATION<br />
DISPARITIES IN NUTRITION<br />
100%<br />
58%<br />
93% Infants not weighed at birth 13%<br />
<strong>Maternal</strong> mortality ratio, adjusted<br />
(per 100,000 live births)<br />
150 (2005)<br />
<strong>Maternal</strong> mortality ratio, reported<br />
(per 100,000 live births)<br />
160 (1994-2006)<br />
Total number of maternal deaths 2,500 (2005)<br />
Lifetime risk of maternal death (1 in : ) 280 (2005)<br />
Women with low BMI (
Underweight<br />
Source:<br />
90<br />
Stunting<br />
Wasting<br />
DEMOGRAPHICS<br />
NUTRITIONAL STATUS<br />
12<br />
15<br />
43<br />
46<br />
YEMEN<br />
Total populati<strong>on</strong> (000) 22,917 (2008)<br />
Total under-fi ve populati<strong>on</strong> (000) 3,733 (2008)<br />
Total number of births (000) 846 (2008)<br />
Under-fi ve mortality rate (per 1,000 live births) 69 (2008)<br />
Total number of under-fi ve deaths (000) 57 (2008)<br />
Infant mortality rate (per 1,000 live births) 53 (2008)<br />
Ne<strong>on</strong>atal mortality rate (per 1,000 live births) 41 (2004)<br />
HIV prevalence rate (15–49 years, %) - -<br />
Populati<strong>on</strong> below internati<strong>on</strong>al<br />
poverty line of US$1.25 per day (%)<br />
Burden of undernutriti<strong>on</strong> (2008)<br />
WHO <strong>Child</strong> Growth St<strong>and</strong>ards<br />
Current nutriti<strong>on</strong>al status<br />
Percentage of children < 5 years old suffering from:<br />
58<br />
53<br />
WHO <strong>Child</strong> Growth St<strong>and</strong>ards<br />
NCHS reference populati<strong>on</strong><br />
0 20 40 60 80 100%<br />
Other NS 2003<br />
INFANT AND YOUNG CHILD FEEDING<br />
Infant feeding practices, by age<br />
100%<br />
90<br />
80<br />
70<br />
60<br />
50<br />
40<br />
30<br />
20<br />
10<br />
0<br />
18 (2005)<br />
Under-five mortality rate<br />
Deaths per 1,000 live births<br />
<str<strong>on</strong>g>Tracking</str<strong>on</strong>g> <str<strong>on</strong>g>Progress</str<strong>on</strong>g> <strong>on</strong> <strong>Child</strong> <strong>and</strong> <strong>Maternal</strong> Nutriti<strong>on</strong><br />
160<br />
120<br />
80<br />
40<br />
0<br />
127<br />
1990 1995 2000 2005 2010 2015<br />
Source: IGME 2009<br />
Stunting trends<br />
Percentage of children < 5 years old stunted<br />
NCHS reference populati<strong>on</strong><br />
100%<br />
80<br />
60<br />
40<br />
20<br />
0<br />
44<br />
1991-1992<br />
Other NS<br />
0-1 2-3 4-5 6-7 8-9 10-11 12-13 14-15 16-17 18-19 20-21 22-23<br />
age (m<strong>on</strong>ths)<br />
Source: DHS 1997<br />
39<br />
1996<br />
MICS<br />
52<br />
69<br />
1997<br />
DHS<br />
42<br />
MDG<br />
Target<br />
53<br />
2003<br />
Other NS<br />
Causes of under-fi ve deaths, 2004<br />
Others<br />
19%<br />
Malaria<br />
1%<br />
Pneum<strong>on</strong>ia<br />
20%<br />
Injuries<br />
4%<br />
Underweight trends<br />
Percentage of children < 5 years old<br />
underweight NCHS reference populati<strong>on</strong><br />
No progress towards MDG1<br />
100%<br />
80<br />
60<br />
40<br />
20<br />
0<br />
100 100 % %<br />
80 80<br />
60 60<br />
40 40<br />
20 20<br />
00<br />
Measles<br />
4%<br />
Source: WHO 2008<br />
30<br />
1991-1992<br />
Other NS<br />
Weaned (not breastfed)<br />
Breastfed <strong>and</strong> solid/<br />
semi-solid foods<br />
Breastfed <strong>and</strong> other<br />
milk/formula<br />
13 13<br />
1991-1992 1991-1992<br />
DHS DHS<br />
Globally,<br />
undernutriti<strong>on</strong><br />
c<strong>on</strong>tributes to more<br />
than <strong>on</strong>e third of<br />
child deaths<br />
39<br />
1996<br />
MICS<br />
18 18<br />
1997 1997<br />
DHS DHS<br />
46<br />
1997<br />
DHS<br />
Breastfed <strong>and</strong><br />
n<strong>on</strong>-milk liquids<br />
Breastfed <strong>and</strong> plain<br />
water <strong>on</strong>ly<br />
Exclusively breastfed<br />
46<br />
2003<br />
Other NS<br />
Exclusive breastfeeding<br />
Percentage of of infants < < 6 6 m<strong>on</strong>ths old old exclusively exclusive<br />
breastfed<br />
12 12<br />
2003 2003<br />
Other Other NSN<br />
Ne<strong>on</strong>atal<br />
37%<br />
Diarrhoea<br />
16%<br />
Stunted (under-fi ves, 000): 2,154 Underweight (under-fi ves, 000): 1,609<br />
Share of developing world stunting burden (%): 1.1 Wasted (under-fi ves, 000): 567<br />
Stunting country rank: 17 Severely wasted (under-fi ves, 000): 235
100%<br />
80<br />
60<br />
40<br />
20<br />
0<br />
MICRONUTRIENTS<br />
Vitamin A supplementati<strong>on</strong><br />
Percentage of children 6-59 m<strong>on</strong>ths old receiving two doses<br />
of vitamin A during calendar year<br />
0<br />
ESSENTIAL NUTRITION INTERVENTIONS DURING THE LIFE CYCLE<br />
Pregnancy Birth 0-5 m<strong>on</strong>ths 6-23 m<strong>on</strong>ths 24-59 m<strong>on</strong>ths<br />
Use of ir<strong>on</strong>-folic acid supplements -<br />
Household c<strong>on</strong>sumpti<strong>on</strong> of<br />
adequately iodized salt<br />
0<br />
0<br />
2000 2002 2004 2006 2008<br />
Source: UNICEF<br />
Early initiati<strong>on</strong> of breastfeeding<br />
(within 1 hour of birth)<br />
MATERNAL NUTRITION/HEALTH WATER AND SANITATION<br />
DISPARITIES IN NUTRITION<br />
15<br />
55<br />
30%<br />
30% Infants not weighed at birth 92%<br />
<strong>Maternal</strong> mortality ratio, adjusted<br />
(per 100,000 live births)<br />
430 (2005)<br />
<strong>Maternal</strong> mortality ratio, reported<br />
(per 100,000 live births)<br />
370 (2002-2003)<br />
Total number of maternal deaths 3,600 (2005)<br />
Lifetime risk of maternal death (1 in : ) 39 (2005)<br />
Women with low BMI (
ACRONYMS USED IN<br />
THE COUNTRY PROFILES<br />
BMI body mass index<br />
DHS Demographic <strong>and</strong> Health Survey<br />
IDD iodine defi ciency disorder<br />
IGME Inter-agency Group for <strong>Child</strong><br />
Mortality Estimati<strong>on</strong><br />
ILO Internati<strong>on</strong>al Labour Organizati<strong>on</strong><br />
MDG Millennium Development Goal<br />
MICS Multiple Indicator Cluster Survey<br />
NCHS Nati<strong>on</strong>al Center for Health Statistics<br />
NS nati<strong>on</strong>al survey<br />
ORS oral rehydrati<strong>on</strong> salts<br />
pDHS Preliminary Demographic <strong>and</strong> Health Survey<br />
WHO World Health Organizati<strong>on</strong><br />
WHO/UNICEF JMP<br />
WHO/UNICEF Joint M<strong>on</strong>itoring Programme<br />
for Water Supply <strong>and</strong> Sanitati<strong>on</strong><br />
92 <str<strong>on</strong>g>Tracking</str<strong>on</strong>g> <str<strong>on</strong>g>Progress</str<strong>on</strong>g> <strong>on</strong> <strong>Child</strong> <strong>and</strong> <strong>Maternal</strong> Nutriti<strong>on</strong><br />
INTERPRETING INFANT AND<br />
YOUNG CHILD FEEDING<br />
AREA GRAPHS<br />
The infant feeding practices area graphs that appear in<br />
the country nutriti<strong>on</strong> profi les offer a snapshot of data <strong>on</strong><br />
breastfeeding <strong>and</strong> infant feeding practices as captured<br />
by the MICS, DHS, or other surveys. These graphs highlight<br />
the status of infant feeding in a country, how close or far it<br />
is from the ‘ideal’, <strong>and</strong> what some of the major problems<br />
may be.<br />
The area graphs are color coded. Ideally, the graphs should<br />
be pink before 6 m<strong>on</strong>ths old, which indicates that all<br />
children are exclusively breastfed, <strong>and</strong> then grey until<br />
24 m<strong>on</strong>ths, which is an indicati<strong>on</strong> that child feeding is<br />
optimal am<strong>on</strong>g young children.<br />
The 2006 graph for Ug<strong>and</strong>a (Figure 1) has a very large pink<br />
area at the youngest ages, indicating that a large proporti<strong>on</strong><br />
of children under 6 m<strong>on</strong>ths old are exclusively breastfed.<br />
The large grey area after 6 m<strong>on</strong>ths old indicates that a<br />
substantial proporti<strong>on</strong> of children receive both breastmilk<br />
<strong>and</strong> complementary foods as recommended.<br />
To improve feeding patterns in Ug<strong>and</strong>a, exclusive<br />
breastfeeding until an infant is 6 m<strong>on</strong>ths old can be further<br />
increased if the introducti<strong>on</strong> of milks <strong>and</strong> other liquids is<br />
delayed (indicated by lavender <strong>and</strong> two shades of blue).<br />
The 2006 graph for Niger (Figure 2) indicates that although<br />
most children receive breastmilk during their fi rst 6 m<strong>on</strong>ths,<br />
very few are breastfed exclusively (almost no pink area).<br />
To increase the exclusive breastfeeding rate, programmes<br />
can discourage feeding of plain water to children under<br />
6 m<strong>on</strong>ths old (bright blue porti<strong>on</strong> of the graph) <strong>and</strong> discourage<br />
introducti<strong>on</strong> of solid or semi-solid foods before<br />
6 m<strong>on</strong>ths of age (grey).<br />
All available country area graphs can be found at:<br />
.
Figure 1. Breastfeeding practices by age, Ug<strong>and</strong>a, 2006<br />
Infant feeding practices, by age<br />
100%<br />
90<br />
80<br />
70<br />
60<br />
50<br />
40<br />
30<br />
20<br />
10<br />
0<br />
0-1 2-3 4-5 6-7 8-9 10-11 12-13 14-15 16-17 18-19 20-21 22-23<br />
age (m<strong>on</strong>ths)<br />
Source: DHS 2006<br />
Figure 2. Breastfeeding practices by age, Niger, 2006<br />
Infant feeding practices, by age<br />
100%<br />
90<br />
80<br />
70<br />
60<br />
50<br />
40<br />
30<br />
20<br />
10<br />
0<br />
0-1 2-3 4-5 6-7 8-9 10-11 12-13 14-15 16-17 18-19 20-21 22-23<br />
age (m<strong>on</strong>ths)<br />
Source: DHS 2006<br />
Weaned (not breastfed)<br />
Breastfed <strong>and</strong> solid/<br />
semi-solid foods<br />
Breastfed <strong>and</strong> other<br />
milk/formula<br />
Breastfed <strong>and</strong><br />
n<strong>on</strong>-milk liquids<br />
Breastfed <strong>and</strong> plain<br />
water <strong>on</strong>ly<br />
Exclusively breastfed<br />
Country Nutriti<strong>on</strong> Profi les<br />
93
DATA SOURCES<br />
Indicator<br />
Demographics<br />
Data source Global database<br />
General Total populati<strong>on</strong> United Nati<strong>on</strong>s Populati<strong>on</strong> Divisi<strong>on</strong> United Nati<strong>on</strong>s Populati<strong>on</strong> Divisi<strong>on</strong><br />
Total under-fi ve populati<strong>on</strong> United Nati<strong>on</strong>s Populati<strong>on</strong> Divisi<strong>on</strong> United Nati<strong>on</strong>s Populati<strong>on</strong> Divisi<strong>on</strong><br />
Total number of births United Nati<strong>on</strong>s Populati<strong>on</strong> Divisi<strong>on</strong> United Nati<strong>on</strong>s Populati<strong>on</strong> Divisi<strong>on</strong><br />
<strong>Child</strong> mortality Under-fi ve mortality rate Inter-agency Group for <strong>Child</strong> Mortality Inter-agency Group for <strong>Child</strong> Mortality<br />
Estimati<strong>on</strong> (IGME) United Nati<strong>on</strong>s Estimati<strong>on</strong> (IGME) United Nati<strong>on</strong>s<br />
<strong>Child</strong>ren’s Fund, World Health <strong>Child</strong>ren’s Fund, World Health<br />
Organizati<strong>on</strong>, World Bank,<br />
Organizati<strong>on</strong>, World Bank,<br />
United Nati<strong>on</strong>s Populati<strong>on</strong> Divisi<strong>on</strong> United Nati<strong>on</strong>s Populati<strong>on</strong> Divisi<strong>on</strong><br />
Total number of under-fi ve deaths Inter-agency Group for <strong>Child</strong> Mortality Inter-agency Group for <strong>Child</strong> Mortality<br />
Estimati<strong>on</strong> (IGME) United Nati<strong>on</strong>s Estimati<strong>on</strong> (IGME) United Nati<strong>on</strong>s<br />
<strong>Child</strong>ren’s Fund, World Health <strong>Child</strong>ren’s Fund, World Health<br />
Organizati<strong>on</strong>, World Bank,<br />
Organizati<strong>on</strong>, World Bank,<br />
United Nati<strong>on</strong>s Populati<strong>on</strong> Divisi<strong>on</strong> United Nati<strong>on</strong>s Populati<strong>on</strong> Divisi<strong>on</strong><br />
Causes of under-fi ve deaths World Health Organizati<strong>on</strong>, The Global World Health Organizati<strong>on</strong><br />
Burden of Disease, 2004 Update (2008)<br />
Infant mortality rate Inter-agency Group for <strong>Child</strong> Mortality Inter-agency Group for <strong>Child</strong> Mortality<br />
Estimati<strong>on</strong> (IGME) United Nati<strong>on</strong>s Estimati<strong>on</strong> (IGME) United Nati<strong>on</strong>s<br />
<strong>Child</strong>ren’s Fund, World Health <strong>Child</strong>ren’s Fund, World Health<br />
Organizati<strong>on</strong>, World Bank,<br />
Organizati<strong>on</strong>, World Bank,<br />
United Nati<strong>on</strong>s Populati<strong>on</strong> Divisi<strong>on</strong> United Nati<strong>on</strong>s Populati<strong>on</strong> Divisi<strong>on</strong><br />
Ne<strong>on</strong>atal mortality rate World Health Organizati<strong>on</strong> World Health Organizati<strong>on</strong><br />
HIV <strong>and</strong> AIDS HIV prevalence rate (15–49 years old) Report <strong>on</strong> the Global AIDS<br />
Joint United Nati<strong>on</strong>s Programme<br />
Epidemic, 2008<br />
<strong>on</strong> HIV/AIDS (UNAIDS)<br />
Poverty Populati<strong>on</strong> below internati<strong>on</strong>al<br />
poverty line of US$1.25 per day (%)<br />
World Bank World Bank<br />
Nutriti<strong>on</strong>al status<br />
Anthropometry<br />
Stunting prevalence Demographic <strong>and</strong> Health Surveys,<br />
Multiple Indicator Cluster Surveys,<br />
other nati<strong>on</strong>al household surveys<br />
Underweight prevalence Demographic <strong>and</strong> Health Surveys,<br />
Multiple Indicator Cluster Surveys,<br />
other nati<strong>on</strong>al household surveys<br />
Wasting prevalence Demographic <strong>and</strong> Health Surveys,<br />
Multiple Indicator Cluster Surveys,<br />
other nati<strong>on</strong>al household surveys<br />
Infant feeding Early initiati<strong>on</strong> of breastfeeding<br />
(
(c<strong>on</strong>tinued)<br />
Indicator Data source Global database<br />
Nutriti<strong>on</strong>al status (c<strong>on</strong>tinued)<br />
Iodized salt c<strong>on</strong>sumpti<strong>on</strong> Demographic <strong>and</strong> Health Surveys,<br />
Multiple Indicator Cluster Surveys,<br />
other nati<strong>on</strong>al household surveys<br />
Anaemia prevalence Worldwide Prevalence of Anaemia<br />
1993–2005, WHO Global Database <strong>on</strong><br />
Anaemia, with additi<strong>on</strong>al data from<br />
Demographic <strong>and</strong> Health Surveys <strong>and</strong><br />
the World Health Organizati<strong>on</strong> global<br />
database <strong>on</strong> anaemia<br />
Use of ir<strong>on</strong>-folic acid supplements<br />
Demographic <strong>and</strong> Health Surveys<br />
(2003–2008)<br />
Low birthweight Low birthweight incidence Demographic <strong>and</strong> Health Surveys,<br />
Multiple Indicator Cluster Surveys,<br />
other nati<strong>on</strong>al household surveys<br />
<strong>Maternal</strong> nutriti<strong>on</strong> <strong>and</strong> health<br />
<strong>Maternal</strong><br />
mortality<br />
<strong>Child</strong>ren not weighed at birth Demographic <strong>and</strong> Health Surveys,<br />
Multiple Indicator Cluster Surveys,<br />
other nati<strong>on</strong>al household surveys<br />
<strong>Maternal</strong> mortality ratio (adjusted)<br />
Inter-agency adjusted estimates<br />
<strong>Maternal</strong> mortality ratio (reported)<br />
Nati<strong>on</strong>al authority estimates<br />
United Nati<strong>on</strong>s <strong>Child</strong>ren’s Fund,<br />
World Health Organizati<strong>on</strong>,<br />
United Nati<strong>on</strong>s Populati<strong>on</strong> Fund,<br />
World Bank<br />
Vital registrati<strong>on</strong> systems, routine<br />
data reporting, Demographic <strong>and</strong><br />
Health Surveys, Multiple Indicator<br />
Cluster Surveys, <strong>and</strong> other nati<strong>on</strong>al<br />
household surveys<br />
Total number of maternal deaths United Nati<strong>on</strong>s <strong>Child</strong>ren’s Fund, World<br />
Health Organizati<strong>on</strong>, United Nati<strong>on</strong>s<br />
Populati<strong>on</strong> Fund, World Bank<br />
Lifetime risk of maternal death United Nati<strong>on</strong>s <strong>Child</strong>ren’s Fund, World<br />
Health Organizati<strong>on</strong>, United Nati<strong>on</strong>s<br />
Populati<strong>on</strong> Fund, World Bank<br />
United Nati<strong>on</strong>s <strong>Child</strong>ren’s Fund<br />
World Health Organizati<strong>on</strong><br />
N/A<br />
United Nati<strong>on</strong>s <strong>Child</strong>ren’s Fund<br />
United Nati<strong>on</strong>s <strong>Child</strong>ren’s Fund<br />
United Nati<strong>on</strong>s <strong>Child</strong>ren’s Fund,<br />
World Health Organizati<strong>on</strong>,<br />
United Nati<strong>on</strong>s Populati<strong>on</strong> Fund,<br />
World Bank<br />
United Nati<strong>on</strong>s <strong>Child</strong>ren’s Fund<br />
United Nati<strong>on</strong>s <strong>Child</strong>ren’s Fund,<br />
World Health Organizati<strong>on</strong>,<br />
United Nati<strong>on</strong>s Populati<strong>on</strong> Fund,<br />
World Bank<br />
United Nati<strong>on</strong>s <strong>Child</strong>ren’s Fund,<br />
World Health Organizati<strong>on</strong>,<br />
United Nati<strong>on</strong>s Populati<strong>on</strong> Fund,<br />
World Bank<br />
Nutriti<strong>on</strong> Women with low BMI Demographic <strong>and</strong> Health Surveys United Nati<strong>on</strong>s <strong>Child</strong>ren’s Fund<br />
Anaemia, n<strong>on</strong>-pregnant women Worldwide Prevalence of Anaemia<br />
1993–2005, WHO Global Database <strong>on</strong><br />
Anaemia; with additi<strong>on</strong>al data from<br />
Demographic <strong>and</strong> Health Surveys <strong>and</strong><br />
the World Health Organizati<strong>on</strong> global<br />
database <strong>on</strong> anaemia<br />
World Health Organizati<strong>on</strong><br />
<strong>Maternal</strong> health Antenatal care (at least <strong>on</strong>e visit) Demographic <strong>and</strong> Health Surveys,<br />
Multiple Indicator Cluster Surveys,<br />
Reproductive Health Survey, Family<br />
Health Survey<br />
Antenatal care (at least four visits) Demographic <strong>and</strong> Health Surveys,<br />
Multiple Indicator Cluster Surveys,<br />
other nati<strong>on</strong>al household surveys<br />
Delivery care Skilled attendant at birth Demographic <strong>and</strong> Health Surveys,<br />
Multiple Indicator Cluster Surveys,<br />
other nati<strong>on</strong>al household surveys<br />
United Nati<strong>on</strong>s <strong>Child</strong>ren’s Fund<br />
United Nati<strong>on</strong>s <strong>Child</strong>ren’s Fund,<br />
World Health Organizati<strong>on</strong><br />
United Nati<strong>on</strong>s <strong>Child</strong>ren’s Fund<br />
Country Nutriti<strong>on</strong> Profi les<br />
95
Data sources (c<strong>on</strong>tinued)<br />
Indicator Data source Global database<br />
Educati<strong>on</strong><br />
Educati<strong>on</strong> Primary school net enrolment ratio or<br />
net attendance ratio (female, male)<br />
Water <strong>and</strong> sanitati<strong>on</strong><br />
96 <str<strong>on</strong>g>Tracking</str<strong>on</strong>g> <str<strong>on</strong>g>Progress</str<strong>on</strong>g> <strong>on</strong> <strong>Child</strong> <strong>and</strong> <strong>Maternal</strong> Nutriti<strong>on</strong><br />
Attendance: Demographic <strong>and</strong> Health<br />
Surveys, Multiple Indicator Cluster<br />
Surveys, other surveys<br />
Enrolment: UNESCO Institute for<br />
Statistics (UIS)<br />
Gender parity index (primary school) UNESCO Institute for Statistics,<br />
Demographic <strong>and</strong> Health Surveys,<br />
Multiple Indicator Cluster Surveys<br />
Water Drinking water coverage United Nati<strong>on</strong>s <strong>Child</strong>ren’s Fund,<br />
World Health Organizati<strong>on</strong><br />
Sanitati<strong>on</strong> Sanitati<strong>on</strong> coverage United Nati<strong>on</strong>s <strong>Child</strong>ren’s Fund,<br />
World Health Organizati<strong>on</strong><br />
Policies<br />
Policies Internati<strong>on</strong>al Code of Marketing of<br />
Breastmilk Substitutes<br />
Maternity protecti<strong>on</strong> in accordance<br />
with Internati<strong>on</strong>al Labour<br />
Organizati<strong>on</strong> (ILO) C<strong>on</strong>venti<strong>on</strong> no. 183<br />
Nati<strong>on</strong>al guidelines for management<br />
of severe acute malnutriti<strong>on</strong> (SAM)<br />
incorporating the community-based<br />
approach<br />
New oral rehydrati<strong>on</strong> salts (ORS)<br />
formula <strong>and</strong> zinc for management<br />
of diarrhoea<br />
Community treatment of pneum<strong>on</strong>ia<br />
with antibiotics<br />
United Nati<strong>on</strong>s <strong>Child</strong>ren’s Fund,<br />
World Health Organizati<strong>on</strong><br />
World Health Organizati<strong>on</strong>,<br />
United Nati<strong>on</strong>s <strong>Child</strong>ren’s Fund,<br />
Zinc Task Force<br />
United Nati<strong>on</strong>s <strong>Child</strong>ren’s Fund,<br />
Nutriti<strong>on</strong> Secti<strong>on</strong><br />
ILOLEX (Database of Internati<strong>on</strong>al<br />
Labour St<strong>and</strong>ards)<br />
World Health Organizati<strong>on</strong>,<br />
United Nati<strong>on</strong>s <strong>Child</strong>ren’s Fund<br />
United Nati<strong>on</strong>s <strong>Child</strong>ren’s Fund<br />
United Nati<strong>on</strong>s <strong>Child</strong>ren’s Fund<br />
Joint M<strong>on</strong>itoring Programme for<br />
Water Supply <strong>and</strong> Sanitati<strong>on</strong> –<br />
World Health Organizati<strong>on</strong>,<br />
United Nati<strong>on</strong>s <strong>Child</strong>ren’s Fund<br />
Joint M<strong>on</strong>itoring Programme for<br />
Water Supply <strong>and</strong> Sanitati<strong>on</strong> –<br />
World Health Organizati<strong>on</strong>,<br />
United Nati<strong>on</strong>s <strong>Child</strong>ren’s Fund<br />
Special data compilati<strong>on</strong> by World<br />
Health Organizati<strong>on</strong> for Countdown<br />
2008 Report. Updates <strong>and</strong> informati<strong>on</strong><br />
for n<strong>on</strong>-Countdown countries<br />
provided by United Nati<strong>on</strong>s <strong>Child</strong>ren’s<br />
Fund in August 2009.<br />
Special data compilati<strong>on</strong> by<br />
World Health Organizati<strong>on</strong> for<br />
Countdown 2008 Report. Updates<br />
<strong>and</strong> informati<strong>on</strong> for n<strong>on</strong>-Countdown<br />
countries provided by United Nati<strong>on</strong>s<br />
<strong>Child</strong>ren’s Fund in August 2009.<br />
Special data compilati<strong>on</strong> by UNICEF<br />
for regular programme m<strong>on</strong>itoring.<br />
Updated in August 2009.<br />
Internati<strong>on</strong>al Labor Organizati<strong>on</strong><br />
(2009)<br />
Special data compilati<strong>on</strong> by<br />
World Health Organizati<strong>on</strong> for<br />
Countdown 2008 Report. Updates<br />
<strong>and</strong> informati<strong>on</strong> for n<strong>on</strong>-Countdown<br />
countries provided by United Nati<strong>on</strong>s<br />
<strong>Child</strong>ren’s Fund in August 2009.
DEFINITIONS OF KEY INDICATORS<br />
Indicator name Defi niti<strong>on</strong> Numerator Denominator<br />
Demographics<br />
Under-fi ve mortality rate Probability of dying between birth <strong>and</strong> exactly 5 years of age, expressed per 1,000 live births<br />
Infant mortality rate Probability of dying between birth <strong>and</strong> exactly 1 year of age, expressed per 1,000 live births<br />
Ne<strong>on</strong>atal mortality rate Probability of dying during the fi rst 28 completed days of life, expressed per 1,000 live births<br />
HIV prevalence rate (15–49 years old) Percentage of adults (15–49 years old) living with HIV as of 2007<br />
Populati<strong>on</strong> below internati<strong>on</strong>al Percentage of populati<strong>on</strong> living <strong>on</strong> less than US$1.25 per day at 2005 prices, adjusted for<br />
poverty line of US$1.25 per day (%) purchasing power parity<br />
Nutriti<strong>on</strong>al status<br />
Stunting prevalence Percentage of children under<br />
5 years old who fall below<br />
minus two (moderate <strong>and</strong><br />
severe) <strong>and</strong> below minus<br />
three (severe) st<strong>and</strong>ard<br />
deviati<strong>on</strong>s from median<br />
height for age of<br />
reference populati<strong>on</strong><br />
Underweight prevalence Percentage of children under<br />
5 years old who fall below<br />
minus two (moderate <strong>and</strong><br />
severe) <strong>and</strong> below minus<br />
three (severe) st<strong>and</strong>ard<br />
deviati<strong>on</strong>s from median<br />
weight for age of<br />
reference populati<strong>on</strong><br />
Wasting prevalence Percentage of children under<br />
5 years old who fall below<br />
minus two (moderate <strong>and</strong><br />
severe) <strong>and</strong> below minus<br />
three (severe) st<strong>and</strong>ard<br />
deviati<strong>on</strong>s from median<br />
weight for height of<br />
reference populati<strong>on</strong><br />
Early initiati<strong>on</strong> of breastfeeding<br />
(
Defi niti<strong>on</strong>s of key indicators (c<strong>on</strong>tinued)<br />
Indicator name Defi niti<strong>on</strong> Numerator Denominator<br />
<strong>Child</strong> nutriti<strong>on</strong> (c<strong>on</strong>tinued)<br />
Anaemia am<strong>on</strong>g n<strong>on</strong>-pregnant<br />
women<br />
Percentage of n<strong>on</strong>-pregnant<br />
women 15–49 years of<br />
age with haemoglobin<br />
c<strong>on</strong>centrati<strong>on</strong>
(c<strong>on</strong>tinued)<br />
Indicator name Defi niti<strong>on</strong> Numerator Denominator<br />
Educati<strong>on</strong><br />
Primary school net enrolment ratio<br />
or attendance ratio<br />
Gender parity index<br />
(primary school)<br />
Water <strong>and</strong> Sanitati<strong>on</strong><br />
Number of children enrolled<br />
in or attending primary school<br />
who are of offi cial primary<br />
school age or higher,<br />
expressed as a percentage<br />
of the total number of children<br />
of offi cial primary school age<br />
Ratio of proporti<strong>on</strong> of girls<br />
to proporti<strong>on</strong> of boys in<br />
primary educati<strong>on</strong><br />
Drinking water coverage Percentage of the<br />
populati<strong>on</strong> using improved<br />
drinking-water source<br />
Percentage of the<br />
populati<strong>on</strong> using<br />
unimproved drinkingwater<br />
source<br />
Sanitati<strong>on</strong> Percentage of the<br />
populati<strong>on</strong> using an improved<br />
sanitati<strong>on</strong> facility<br />
Percentage of the<br />
populati<strong>on</strong> using<br />
unimproved<br />
sanitati<strong>on</strong> facilities<br />
Number of children enrolled in or attending<br />
primary school who are of offi cial primary<br />
school age<br />
Net primary school enrolment/attendance<br />
ratio for girls<br />
Piped into dwelling, plot or yard –<br />
Number of household members living in<br />
households using piped drinking-water<br />
c<strong>on</strong>necti<strong>on</strong> located inside the user’s<br />
dwelling, plot or yard<br />
Other improved – Number of household<br />
members living in households using public<br />
taps or st<strong>and</strong>pipes, tube wells or boreholes,<br />
protected dug wells, protected springs or<br />
rainwater collecti<strong>on</strong><br />
Unimproved – Number of household<br />
members living in households using<br />
unprotected dug well; unprotected spring<br />
cart with small tank/drum; tanker truck;<br />
surface water (river dam, lake, p<strong>on</strong>d,<br />
stream, canal, irrigati<strong>on</strong> channels); <strong>and</strong><br />
bottled water<br />
Improved – Number of household members<br />
using improved sanitati<strong>on</strong> facilities (facilities<br />
that ensure hygienic separati<strong>on</strong> of human<br />
excreta from human c<strong>on</strong>tact), including<br />
fl ush or pour fl ush toilet/latrine to piped<br />
sewer system, septic tank or pit latrine;<br />
ventilated improved pit (VIP) latrine;<br />
pit latrine with slab; <strong>and</strong> composting toilet<br />
Shared – Number of household members<br />
using sanitati<strong>on</strong> facilities of an otherwise<br />
acceptable type shared between two or<br />
more households including public toilets<br />
Unimproved – Number of household<br />
members using sanitati<strong>on</strong> facilities that do<br />
not ensure hygienic separati<strong>on</strong> of human<br />
excreta from human c<strong>on</strong>tact, including pit<br />
latrines without a slab or platform, hanging<br />
latrines <strong>and</strong> bucket latrines<br />
Open defecati<strong>on</strong> – Number of household<br />
members defecating in fi elds, forests,<br />
bushes, bodies of water or other open spaces<br />
Total number of<br />
children who are<br />
of offi cial primary<br />
school age<br />
Net primary school<br />
enrolment/attendance<br />
ratio for boys<br />
Total number<br />
of household<br />
members in<br />
households<br />
surveyed<br />
Total number<br />
of household<br />
members in<br />
households<br />
surveyed<br />
Total number<br />
of household<br />
members in<br />
households<br />
surveyed<br />
Country Nutriti<strong>on</strong> Profi les<br />
99
DEFINITIONS OF POLICY INDICATORS<br />
Indicator Indicator defi niti<strong>on</strong> Criteria for ranking<br />
Internati<strong>on</strong>al Code of Marketing<br />
of Breastmilk Substitutes<br />
Maternity protecti<strong>on</strong> in accordance<br />
with Internati<strong>on</strong>al Labour<br />
Organizati<strong>on</strong> (ILO) C<strong>on</strong>venti<strong>on</strong><br />
no. 183<br />
Nati<strong>on</strong>al guidelines for<br />
management of severe acute<br />
malnutriti<strong>on</strong> (SAM) incorporating<br />
the community-based approach<br />
New oral rehydrati<strong>on</strong> salts (ORS)<br />
formula <strong>and</strong> zinc for management<br />
of diarrhoea<br />
Community treatment of<br />
pneum<strong>on</strong>ia with antibiotics<br />
100 <str<strong>on</strong>g>Tracking</str<strong>on</strong>g> <str<strong>on</strong>g>Progress</str<strong>on</strong>g> <strong>on</strong> <strong>Child</strong> <strong>and</strong> <strong>Maternal</strong> Nutriti<strong>on</strong><br />
Nati<strong>on</strong>al policy adopted <strong>on</strong> all provisi<strong>on</strong>s<br />
stipulated in the Internati<strong>on</strong>al Code of<br />
Marketing of Breastmilk Substitutes<br />
Yes: All provisi<strong>on</strong>s of the Internati<strong>on</strong>al Code<br />
adopted in legislati<strong>on</strong><br />
Partial: Voluntary agreements or some<br />
provisi<strong>on</strong>s of the Internati<strong>on</strong>al Code adopted<br />
in legislati<strong>on</strong><br />
No: No legislati<strong>on</strong> <strong>and</strong> no voluntary agreements<br />
adopted in relati<strong>on</strong> to the Internati<strong>on</strong>al Code<br />
ILO C<strong>on</strong>venti<strong>on</strong> no. 183 ratifi ed by the country Yes: ILO C<strong>on</strong>venti<strong>on</strong> no. 183 ratifi ed<br />
Partial: ILO C<strong>on</strong>venti<strong>on</strong> no. 183 not ratifi ed<br />
but previous maternity c<strong>on</strong>venti<strong>on</strong> ratifi ed<br />
No: No ratifi cati<strong>on</strong> of any maternity<br />
protecti<strong>on</strong> c<strong>on</strong>venti<strong>on</strong><br />
Indicates the status of each country regarding<br />
adopti<strong>on</strong> of nati<strong>on</strong>al guidelines <strong>on</strong><br />
management of SAM incorporating the<br />
community-based approach<br />
Nati<strong>on</strong>al policy guidelines adopted <strong>on</strong><br />
management of diarrhoea with low<br />
osmolarity oral rehydrati<strong>on</strong> salts (ORS)<br />
<strong>and</strong> zinc supplements<br />
Nati<strong>on</strong>al policy adopted authorizing community<br />
health workers to identify <strong>and</strong> manage<br />
pneum<strong>on</strong>ia with antibiotics<br />
Yes: Nati<strong>on</strong>al guidelines have been adopted<br />
Partial: Nati<strong>on</strong>al guidelines are at some<br />
stage of development (e.g., process started,<br />
pending fi nalizati<strong>on</strong>)<br />
No: Nati<strong>on</strong>al guidelines have not been adopted<br />
<strong>and</strong> the process of development<br />
has not been initiated<br />
Not applicable: The country’s wasting rate does<br />
not merit development of such guidelines (e.g.,<br />
wasting rate is too low)<br />
Yes: Low osmolarity ORS <strong>and</strong> zinc supplements<br />
in nati<strong>on</strong>al policy<br />
Partial: Low osmolarity ORS or zinc supplements<br />
in nati<strong>on</strong>al policy<br />
No: Low ORS <strong>and</strong> zinc supplements not<br />
promoted in nati<strong>on</strong>al policy<br />
Yes: Community health workers authorized<br />
to give antibiotics for pneum<strong>on</strong>ia<br />
Partial: No nati<strong>on</strong>al policy but some<br />
implementati<strong>on</strong> of community-based<br />
management of pneum<strong>on</strong>ia<br />
No: No nati<strong>on</strong>al policy <strong>and</strong> no implementati<strong>on</strong>
STATISTICAL<br />
TABLES
Table 1. Country ranking, based <strong>on</strong> numbers of moderately <strong>and</strong> severely stunted children under 5 years old<br />
Ranking Country<br />
102 <str<strong>on</strong>g>Tracking</str<strong>on</strong>g> <str<strong>on</strong>g>Progress</str<strong>on</strong>g> <strong>on</strong> <strong>Child</strong> <strong>and</strong> <strong>Maternal</strong> Nutriti<strong>on</strong><br />
Stunting prevalence (%)<br />
Number of stunted children<br />
(thous<strong>and</strong>s)<br />
2003–2008 2008<br />
Percentage of<br />
developing world total<br />
(195.1 milli<strong>on</strong>)<br />
1 India 48 60,788 31.2%<br />
2 China 15 12,685 6.5%<br />
3 Nigeria 41 10,158 5.2%<br />
4 Pakistan 42 9,868 5.1%<br />
5 Ind<strong>on</strong>esia 37 7,688 3.9%<br />
6 Bangladesh 43 7,219 3.7%<br />
7 Ethiopia 51 6,768 3.5%<br />
8 Democratic Republic of the C<strong>on</strong>go 46 5,382 2.8%<br />
9 Philippines 34 3,617 1.9%<br />
10 United Republic of Tanzania 44 3,359 1.7%<br />
11 Afghanistan 59 2,910 1.5%<br />
12 Egypt 29 2,730 1.4%<br />
13 Viet Nam 36 2,619 1.3%<br />
14 Ug<strong>and</strong>a 38 2,355 1.2%<br />
15 Sudan 40 2,305 1.2%<br />
16 Kenya 35 2,269 1.2%<br />
17 Yemen 58 2,154 1.1%<br />
18 Myanmar 41 1,880 1.0%<br />
19 Nepal 49 1,743 < 1%<br />
20 Mozambique 44 1,670 < 1%<br />
21 Madagascar 53 1,622 < 1%<br />
22 Mexico 16 1,594 < 1%<br />
23 Niger 47 1,473 < 1%<br />
24 South Africa 27 1,425 < 1%<br />
25 Malawi 53 1,368 < 1%<br />
26 Côte d’Ivoire 40 1,246 < 1%<br />
27 Iraq 26 1,175 < 1%<br />
28 Guatemala 54 1,150 < 1%<br />
29 Brazil 7 1,129 < 1%<br />
30 Camero<strong>on</strong> 36 1,080 < 1%<br />
31 Burkina Faso 36 1,053 < 1%<br />
32 Zambia 45 1,036 < 1%<br />
33 Russian Federati<strong>on</strong> 13 938 < 1%<br />
34 Ghana 28 929 < 1%<br />
35 Angola 29 926 < 1%<br />
36 Peru 30 886 < 1%<br />
37 Rw<strong>and</strong>a 51 836 < 1%<br />
38 Mali 38 832 < 1%<br />
39 Chad 41 812 < 1%<br />
40 Syrian Arab Republic 28 778 < 1%<br />
41 Thail<strong>and</strong> 16 756 < 1%<br />
42 United States of America 3 714 < 1%<br />
43 Democratic People’s Republic of Korea 45 704 < 1%<br />
44 Colombia 15 686 < 1%<br />
45 Morocco 23 684 < 1%<br />
46 Cambodia 42 683 < 1%<br />
47 Somalia 42 675 < 1%<br />
48 Turkey 10 674 < 1%<br />
49 Guinea 40 654 < 1%<br />
50 Benin 43 625 < 1%<br />
51 Burundi 53 607 < 1%<br />
52 Zimbabwe 33 570 < 1%<br />
53 Saudi Arabia 20 569 < 1%<br />
54 Algeria 15 496 < 1%<br />
55 Uzbekistan 19 489 < 1%<br />
56 Papua New Guinea 43 405 < 1%<br />
57 Senegal 19 395 < 1%<br />
58 Lao People's Democratic Republic 48 370 < 1%<br />
59 Haiti 29 357 < 1%<br />
60 Eritrea 44 354 < 1%<br />
61 Sierra Le<strong>on</strong>e 36 345 < 1%<br />
62 Venezuela (Bolivarian Republic of) 12 343 < 1%<br />
63 Tajikistan 39 341 < 1%<br />
64 Ecuador 23 323 < 1%<br />
65 Sri Lanka 18 321 < 1%<br />
66 Iran (Islamic Republic of) 5 301 < 1%<br />
67 H<strong>on</strong>duras 29 282 < 1%<br />
68 Central African Republic 43 280 < 1%<br />
69 Argentina 8 276 < 1%<br />
70 Bolivia (Plurinati<strong>on</strong>al State of) 22 271 < 1%<br />
71 Togo 27 255 < 1%<br />
72 Liberia 39 244 < 1%<br />
73 Kazakhstan 17 233 < 1%
(c<strong>on</strong>tinued)<br />
Ranking Country<br />
Stunting prevalence (%)<br />
Number of stunted children<br />
(thous<strong>and</strong>s)<br />
2003–2008 2008<br />
Percentage of<br />
developing world total<br />
(195.1 milli<strong>on</strong>)<br />
74 Dominican Republic 18 197 < 1%<br />
75 Azerbaijan 25 185 < 1%<br />
76 C<strong>on</strong>go 30 165 < 1%<br />
77 Mauritania 32 153 < 1%<br />
78 Nicaragua 22 146 < 1%<br />
79 Libyan Arab Jamahiriya 21 145 < 1%<br />
80 Romania 13 136 < 1%<br />
81 Paraguay 18 129 < 1%<br />
82 Guinea-Bissau 47 125 < 1%<br />
83 El Salvador 19 117 < 1%<br />
84 Lesotho 42 113 < 1%<br />
85 Timor-Leste 54 100 < 1%<br />
86 Turkmenistan 19 97 < 1%<br />
87 Kyrgyzstan 18 96 < 1%<br />
88 Jordan 12 90 < 1%<br />
89 Namibia 29 80 < 1%<br />
90 Panama 22 74 < 1%<br />
91 Gambia 28 74 < 1%<br />
92 Occupied Palestinian Territory 10 71 < 1%<br />
93 Botswana 29 64 < 1%<br />
94 M<strong>on</strong>golia 27 61 < 1%<br />
95 Kuwait 24 59 < 1%<br />
96 Ukraine 3 58 < 1%<br />
97 Albania 26 57 < 1%<br />
98 United Arab Emirates 17 51 < 1%<br />
99 Tunisia 6 48 < 1%<br />
100 Swazil<strong>and</strong> 29 46 < 1%<br />
101 Gab<strong>on</strong> 25 46 < 1%<br />
102 Equatorial Guinea 43 44 < 1%<br />
103 Comoros 44 43 < 1%<br />
104 M<strong>on</strong>tenegro 7 40 < 1%<br />
105 Armenia 18 40 < 1%<br />
106 Oman 13 38 < 1%<br />
107 Uruguay 15 37 < 1%<br />
108 Leban<strong>on</strong> 11 35 < 1%<br />
109 Djibouti 33 35 < 1%<br />
110 Bhutan 48 34 < 1%<br />
111 Georgia 13 32 < 1%<br />
112 Cuba 5 31 < 1%<br />
113 Solom<strong>on</strong> Isl<strong>and</strong>s 33 24 < 1%<br />
114 Costa Rica 6 23 < 1%<br />
115 Belarus 4 21 < 1%<br />
116 Republic of Moldova 10 21 < 1%<br />
117 Bosnia <strong>and</strong> Herzegovina 10 18 < 1%<br />
118 Chile 1 16 < 1%<br />
119 The former Yugoslav Republic of Maced<strong>on</strong>ia 11 12 < 1%<br />
120 Guyana 17 12 < 1%<br />
121 Jamaica 4 9 < 1%<br />
122 Mauritius 10 9 < 1%<br />
123 Singapore 4 9 < 1%<br />
124 Maldives 32 9 < 1%<br />
125 Belize 22 8 < 1%<br />
126 Cape Verde 12 7 < 1%<br />
127 Sao Tome <strong>and</strong> Principe 29 7 < 1%<br />
128 Bahrain 10 7 < 1%<br />
129 Vanuatu 20 7 < 1%<br />
130 Qatar 8 6 < 1%<br />
131 Suriname 11 5 < 1%<br />
132 Trinidad <strong>and</strong> Tobago 4 3 < 1%<br />
133 Serbia 7 3 < 1%<br />
134 Croatia 1 2 < 1%<br />
135 Nauru 24 0 < 1%<br />
136 Tuvalu 10 0 < 1%<br />
Note: Estimates are calculated according to the WHO <strong>Child</strong> Growth St<strong>and</strong>ards, except in cases where data are <strong>on</strong>ly available according to the previously used Nati<strong>on</strong>al<br />
Center for Health Statistics (NCHS) reference populati<strong>on</strong>. Estimates for 96 countries are from surveys c<strong>on</strong>ducted in 2003 or later. For more informati<strong>on</strong> <strong>on</strong> countries<br />
with estimates calculated according to the NCHS reference populati<strong>on</strong> or countries with surveys c<strong>on</strong>ducted before 2003, please refer to data notes <strong>on</strong> page 116.<br />
Statistical Tables 103
Table 2. Demographic <strong>and</strong> nutriti<strong>on</strong>al status indicators<br />
Countries <strong>and</strong> territories<br />
104 <str<strong>on</strong>g>Tracking</str<strong>on</strong>g> <str<strong>on</strong>g>Progress</str<strong>on</strong>g> <strong>on</strong> <strong>Child</strong> <strong>and</strong> <strong>Maternal</strong> Nutriti<strong>on</strong><br />
% of under-fi ves (2003–2008*) suffering from: Average<br />
Under-5<br />
mortality<br />
Under-5<br />
populati<strong>on</strong><br />
stunting<br />
(WHO)<br />
wasting<br />
(WHO)<br />
underweight<br />
(WHO)<br />
underweight annual rate<br />
(NCHS/ of reducti<strong>on</strong><br />
WHO) of underweight<br />
% of infants<br />
with low<br />
rate (thous<strong>and</strong>s) moderate moderate moderate<br />
moderate (%) <str<strong>on</strong>g>Progress</str<strong>on</strong>g> towards birthweight<br />
2008 2008 & severe & severe & severe severe & severe 1990–2008 the MDG 1 target 2003–2008*<br />
Afghanistan 257 4,907 59 y 9 y 33 y 12 y 39 y 3.1 On track –<br />
Albania 14 217 26 7 6 2 8 12.7 On track 7<br />
Algeria 41 3,328 15 4 3 1 4 6.1 On track 6<br />
Andorra 4 4 – – – – – – – –<br />
Angola 220 3,170 29 y 8 y 16 y 7 y – 7.6 On track 12 x<br />
Antigua <strong>and</strong> Barbuda 12 4 – – – – – – – 5<br />
Argentina 16 3,361 8 y 1 y 2 y 0 y 4 y 3.5 On track 7<br />
Armenia 23 221 18 5 4 1 4 -2.0 On track 7<br />
Australia 6 1,327 – – – – – – – 7 x<br />
Austria 4 391 – – – – – – – 7 x<br />
Azerbaijan 36 738 25 7 8 2 10 1.6 Insuffi cient progress 10<br />
Bahamas 13 28 – – – – – – – 11<br />
Bahrain 12 69 10 z 5 z – 2 z 9 x – – 8 x<br />
Bangladesh 54 16,710 43 17 41 12 46 2.3 Insuffi cient progress 22<br />
Barbados 11 14 – – – – – – – 14<br />
Belarus 13 472 4 2 1 1 1 – On track 4<br />
Belgium 5 590 – – – – – – – 8 x<br />
Belize 19 36 22 2 4 1 6 -0.2 No progress 7<br />
Benin 121 1,450 43 8 18 5 23 2.2 Insuffi cient progress 15<br />
Bhutan 81 71 48 x 3 x 14 x 3 x 19 x 6.4 On track 15 x<br />
Bolivia (Plurinati<strong>on</strong>al State of) 54 1,245 22 z 1 z – 1 z 6 3.4 On track 7<br />
Bosnia <strong>and</strong> Herzegovina 15 172 10 4 1 0 2 18.2 On track 5<br />
Botswana 31 221 29 x 6 x 11 x 4 x 13 x 7.8 On track 10 x<br />
Brazil 22 16,125 7 2 2 – – 3.0 On track 8<br />
Brunei Darussalam 7 37 – – – – – – – 10 x<br />
Bulgaria 11 349 – – – – – – – 9<br />
Burkina Faso 169 2,934 36 z 19 z – – 32 -0.4 No progress 16<br />
Burundi 168 1,155 53 z 7 z 35 14 z 39 -0.2 No progress 11<br />
Cambodia 90 1,611 42 9 28 7 36 4.2 On track 14<br />
Camero<strong>on</strong> 131 3,016 36 7 16 5 19 -2.3 No progress 11<br />
Canada 6 1,753 – – – – – – – 6 x<br />
Cape Verde 29 59 12 z 7 z – 2 z 9 y 3.0 On track 6<br />
Central African Republic 173 656 43 12 24 8 29 -1.6 No progress 13<br />
Chad 209 1,985 41 z 14 z – 14 z 37 0.7 Insuffi cient progress 22<br />
Chile 9 1,238 1 z 0 z – – 1 y 2.3 On track 6<br />
China 21 86,881 15 – 6 – 7 6.4 On track 4<br />
Colombia 20 4,485 15 y 2 y 5 y 2 y 7 y 2.7 On track 6<br />
Comoros 105 97 44 z 8 z – – 25 -3.7 No progress 25 x<br />
C<strong>on</strong>go 127 551 30 8 11 3 14 2.7 On track 13<br />
Cook Isl<strong>and</strong>s 15 2 – – – – 10 x – – 3 x<br />
Costa Rica 11 376 6 z 2 z – 0 z 5 x – – 7<br />
Côte d’Ivoire 114 3,139 40 8 16 5 20 1.8 Insuffi cient progress 17<br />
Croatia 6 208 1 z 1 z – – 1 x – – 5<br />
Cuba 6 613 5 z 2 z – 0 z 4 8.5 On track 5<br />
Cyprus 4 49 – – – – – – – –<br />
Czech Republic 4 519 – – – – – – – 7 x<br />
Democratic<br />
People’s Republic of Korea 55 1,575 45 y 9 y 18 y 7 y 23 y – – 7 x<br />
Democratic Republic of the C<strong>on</strong>go 199 11,829 46 10 25 8 31 0.8 Insuffi cient progress 12 x<br />
Denmark 4 320 – – – – – – – 5 x<br />
Djibouti 95 108 33 y 17 y 31 y 9 y 33 y -2.2 No progress 10<br />
Dominica 11 3 – – – – – – – 10<br />
Dominican Republic 33 1,086 18 3 7 2 4 4.7 On track 11<br />
Ecuador 25 1,392 23 z 2 z 6 1 z 9 2.9 On track 10<br />
Egypt 23 9,447 29 7 6 1 8 2.4 Insuffi cient progress 13<br />
El Salvador 18 608 19 y – 6 y – 9 y 2.7 On track 7<br />
Equatorial Guinea 148 103 43 x 9 x 16 x 5 x 19 x – – 13 x<br />
Eritrea 58 811 44 x 15 x 35 x 13 x 40 x 0.7 Insuffi cient progress 14 x<br />
Est<strong>on</strong>ia 6 73 – – – – – – – 4 x<br />
Ethiopia 109 13,323 51 12 33 11 38 1.7 Insuffi cient progress 20<br />
Fiji 18 87 – – – – – – – 10<br />
Finl<strong>and</strong> 3 291 – – – – – – – 4 x<br />
France 4 3,870 – – – – – – – 7 x<br />
Gab<strong>on</strong> 77 182 25 x 4 x 8 x 2 x 12 x – – 14 x<br />
Gambia 106 267 28 7 16 4 20 2.1 Insuffi cient progress 20<br />
Georgia 30 241 13 3 2 1 2 6.3 On track 5<br />
Germany 4 3,446 – – – – – – – 7 x<br />
Ghana 76 3,319 28 9 14 3 – 3.1 On track 9<br />
Greece 4 532 – – – – – – – 8 x<br />
Grenada 15 9 – – – – – – – 9<br />
Guatemala 35 2,118 54 x 2 x 18 x 4 x 23 x 2.7 On track 12 x<br />
Guinea 146 1,635 40 8 21 7 26 0.3 No progress 12
(c<strong>on</strong>tinued)<br />
Countries <strong>and</strong> territories<br />
% of under-fi ves (2003–2008*) suffering from: Average<br />
Under-5<br />
mortality<br />
Under-5<br />
populati<strong>on</strong><br />
stunting<br />
(WHO)<br />
wasting<br />
(WHO)<br />
underweight<br />
(WHO)<br />
underweight annual rate<br />
(NCHS/ of reducti<strong>on</strong><br />
WHO) of underweight<br />
% of infants<br />
with low<br />
rate (thous<strong>and</strong>s) moderate moderate moderate<br />
moderate (%) <str<strong>on</strong>g>Progress</str<strong>on</strong>g> towards birthweight<br />
2008 2008 & severe & severe & severe severe & severe 1990–2008 the MDG 1 target 2003–2008*<br />
Guinea-Bissau 195 265 47 8 15 4 19 4.1 On track 24<br />
Guyana 61 69 17 8 10 3 12 2.4 Insuffi cient progress 19<br />
Haiti 72 1,252 29 10 18 6 22 1.9 Insuffi cient progress 25<br />
Holy See – – – – – – – – – –<br />
H<strong>on</strong>duras 31 958 29 1 8 1 11 2.8 On track 10<br />
Hungary 7 486 – – – – – – – 9 x<br />
Icel<strong>and</strong> 3 22 – – – – – – – 4 x<br />
India 69 126,642 48 20 43 16 48 0.9 Insuffi cient progress 28<br />
Ind<strong>on</strong>esia 41 20,891 37 14 18 5 – 2.7 On track 9<br />
Iran (Islamic Republic of) 32 6,402 5 z 4 z – – 5 11.6 On track 7<br />
Iraq 44 4,450 26 6 6 2 8 0.6 Insuffi cient progress 15<br />
Irel<strong>and</strong> 4 335 – – – – – – – 6 x<br />
Israel 5 693 – – – – – – – 8 x<br />
Italy 4 2,892 – – – – – – – 6 x<br />
Jamaica 31 255 4 2 2 – – 5.8 On track 12<br />
Japan 4 5,400 – – – – – – – 8 x<br />
Jordan 20 750 12 x 3 x 4 x 1 x 4 x 4.7 On track 13<br />
Kazakhstan 30 1,384 17 5 4 1 4 0.7 On track 6<br />
Kenya 128 6,540 35 z 6 z – 4 z 21 y 0.8 Insuffi cient progress 10<br />
Kiribati 48 10 – – – – 13 x – – 5 x<br />
Kuwait 11 249 24 z 11 z – 3 z 10 x – – 7 x<br />
Kyrgyzstan 38 547 18 3 2 0 3 12.8 On track 5<br />
Lao People’s Democratic Republic 61 776 48 7 31 9 37 1.0 Insuffi cient progress 11<br />
Latvia 9 109 – – – – – – – 5 x<br />
Leban<strong>on</strong> 13 323 11 z 5 z – – 4 -3.3 On track 6 x<br />
Lesotho 79 272 42 y 2 y 14 y 3 y – -2.0 No progress 13<br />
Liberia 145 619 39 8 19 6 24 1.5 Insuffi cient progress 14<br />
Libyan Arab Jamahiriya 17 700 21 x 4 x 4 x – 5 x – – 7 x<br />
Liechtenstein 2 2 – – – – – – – –<br />
Lithuania 7 151 – – – – – – – 4 x<br />
Luxembourg 3 27 – – – – – – – 8 x<br />
Madagascar 106 3,060 53 15 36 12 42 -0.4 No progress 17<br />
Malawi 100 2,591 53 4 15 3 21 2.4 Insuffi cient progress 13<br />
Malaysia 6 2,732 – – – 1 z 8 7.6 On track 9 x<br />
Maldives 28 27 32 x 13 x 26 x 7 x 30 x 4.3 On track 22 x<br />
Mali 194 2,207 38 15 27 10 32 1.4 Insuffi cient progress 19<br />
Malta 6 19 – – – – – – – 6 x<br />
Marshall Isl<strong>and</strong>s 36 6 – – – – – – – 18<br />
Mauritania 118 475 32 y 12 y 24 y 7 y 31 y 1.5 Insuffi cient progress 34<br />
Mauritius 17 91 10 z 14 z – 2 z 15 x – – 14<br />
Mexico 17 10,281 16 2 3 – 5 5.9 On track 8<br />
Micr<strong>on</strong>esia (Federated States of) 39 14 – – – – 15 x – – 18 x<br />
M<strong>on</strong>aco 4 2 – – – – – – – –<br />
M<strong>on</strong>golia 41 229 27 3 5 1 6 7.0 On track 6<br />
M<strong>on</strong>tenegro 8 38 7 4 2 1 3 – On track 4<br />
Morocco 36 3,041 23 10 9 2 10 1.8 Insuffi cient progress 15<br />
Mozambique 130 3,820 44 z 4 z – 4 z 18 2.9 On track 15<br />
Myanmar 98 4,629 41 11 30 9 32 1.2 Insuffi cient progress 15 x<br />
Namibia 42 277 29 8 17 4 21 1.5 Insuffi cient progress 16<br />
Nauru 45 1 24 1 5 1 – – – 27<br />
Nepal 51 3,535 49 13 39 11 45 0.3 No progress 21<br />
Netherl<strong>and</strong>s 5 958 – – – – – – – –<br />
New Zeal<strong>and</strong> 6 288 – – – – – – – 6 x<br />
Nicaragua 27 675 22 1 6 1 7 4.3 On track 8<br />
Niger 167 3,121 47 y 12 y 36 y 12 y 43 y 0.0 No progress 27<br />
Nigeria 186 25,020 41 14 23 9 27 1.6 Insuffi cient progress 14<br />
Niue – 0 – – – – – – – 0 x<br />
Norway 4 293 – – – – – – – 5x<br />
Occupied Palestinian Territory 27 697 10 z 1 z – 0 z 3 1.3 On track 7<br />
Oman 12 293 13 x 7 x 11 x 2 x 18 x 4.2 On track 9<br />
Pakistan 89 23,778 42 x 14 x 31 x 13 x 38 x 1.7 Insuffi cient progress 32<br />
Palau 15 2 – – – – – – – 9 x<br />
Panama 23 345 22 x 1 x 6 x 1 x 8 x -1.2 No progress 10<br />
Papua New Guinea 69 950 43 y 5 y 18 y 5 y 26 y – – 10<br />
Paraguay 28 736 18 1 3 – 4 -0.1 On track 9<br />
Peru 24 2,975 30 1 6 1 5 3.6 On track 8<br />
Philippines 32 10,701 34 6 21 5 28 0.9 Insuffi cient progress 20<br />
Pol<strong>and</strong> 7 1,810 – – – – – – – 6 x<br />
Portugal 4 538 – – – – – – – 8 x<br />
Qatar 10 77 8z 2z – – 6x – – 10x<br />
Republic of Korea 5 2,292 – – – – – – – 4 x<br />
Republic of Moldova 17 200 10 5 3 1 4 -3.3 On track 6<br />
Statistical Tables 105
Table 2. (c<strong>on</strong>tinued)<br />
Countries <strong>and</strong> territories<br />
Romania 14 1,059 13 x 4 x 4 x 1 x 3 x 6.0 On track 8<br />
Russian Federati<strong>on</strong> 13 7,389 13 z 4 z – 1 z 3 x – – 6<br />
Rw<strong>and</strong>a 112 1,646 51 5 18 4 23 1.9 Insuffi cient progress 6<br />
Saint Kitts <strong>and</strong> Nevis 16 2 – – – – – – – 11<br />
Saint Lucia 13 15 – – – – – – – 11<br />
Saint Vincent <strong>and</strong> the Grenadines 13 9 – – – – – – – 8<br />
Samoa 26 22 – – – – – – – 4 x<br />
San Marino 2 2 – – – – – – – –<br />
Sao Tome <strong>and</strong> Principe 98 23 29 9 7 1 9 5.5 On track 8<br />
Saudi Arabia 21 2,859 20 z 11 z – 3 z 14 x – – 11 x<br />
Senegal 108 2,046 19 9 14 4 17 1.1 Insuffi cient progress 19<br />
Serbia 7 576 7 4 1 0 2 – On track 5<br />
Seychelles 12 14 – – – – – – – –<br />
Sierra Le<strong>on</strong>e 194 947 36 10 21 7 – -0.2 No progress 24<br />
Singapore 3 200 4 x 4 x 3 x 0 x 3 x – On track 8 x<br />
Slovakia 8 266 – – – – – – – 7 x<br />
Slovenia 4 94 – – – – – – – –<br />
Solom<strong>on</strong> Isl<strong>and</strong>s 36 73 33 4 12 2 – – – 13<br />
Somalia 200 1,611 42 13 32 12 36 -7.0 No progress –<br />
South Africa 67 5,200 27 z 5 z – 3 z 12 -2.6 No progress 15 x<br />
Spain 4 2,373 – – – – – – – 6 x<br />
Sri Lanka 15 1,784 18 15 22 4 – 2.9 On track 18<br />
Sudan 109 5,836 40 16 27 10 31 0.6 Insuffi cient progress 31 x<br />
Suriname 27 49 11 5 7 1 10 4.8 On track 13 x<br />
Swazil<strong>and</strong> 83 159 29 3 5 1 7 5.4 On track 9<br />
Sweden 3 527 – – – – – – – 4 x<br />
Switzerl<strong>and</strong> 5 364 – – – – – – – 6 x<br />
Syrian Arab Republic 16 2,807 28 10 9 2 10 2.7 On track 9<br />
Tajikistan 64 871 39 7 15 6 18 – – 10<br />
Thail<strong>and</strong> 14 4,843 16 5 7 1 9 5.5 On track 9<br />
The former Yugoslav<br />
Republic of Maced<strong>on</strong>ia 11 112 11 3 2 0 2 12.8 On track 6<br />
Timor-Leste 93 185 54 z 25 z – 15 z 49 -2.3 No progress 12<br />
Togo 98 947 27 6 21 3 21 0.3 No progress 12<br />
T<strong>on</strong>ga 19 14 – – – – – – – 3 x<br />
Trinidad <strong>and</strong> Tobago 35 94 4 z 4 z – 1 z 6 x 1.3 Insuffi cient progress 19<br />
Tunisia 21 780 6 z 2 z – 0 z 3 6.6 On track 5<br />
Turkey 22 6,543 10 z 1 z – 0 z 3 9.2 On track 16 x<br />
Turkmenistan 48 518 19 7 8 2 11 1.7 Insuffi cient progress 4<br />
Tuvalu 36 1 10 3 2 0 – – – 5x<br />
Ug<strong>and</strong>a 135 6,182 38 6 16 4 20 0.7 Insuffi cient progress 14<br />
Ukraine 16 2,132 3 z 0 z – 0 z 1 x – On track 4<br />
United Arab Emirates 8 307 17z 15 z – 3 z 14 x – – 15 x<br />
United Kingdom of Great Britain<br />
<strong>and</strong> Northern Irel<strong>and</strong> 6 3,601 – – – – – – – 8 x<br />
United Republic of Tanzania 104 7,566 44 4 17 4 22 2.2 Insuffi cient progress 10<br />
United States of America 8 21,624 3 x 0 x 1 x 0 x 2 x – – 8 x<br />
Uruguay 14 249 15 x 2 x 5 x 2 x 5 x 2.2 On track 9<br />
Uzbekistan 38 2,576 19 4 4 1 5 11.4 On track 5<br />
Vanuatu 33 33 20 z 7 z – 2 z 16 – – 10<br />
Venezuela (Bolivarian Republic of) 18 2,911 12 z 4 z – – 5 1.6 On track 9<br />
Viet Nam 14 7,316 36 z 8 z – 5 z 20 4.1 On track 7<br />
Yemen 69 3,733 58 15 43 19 46 -3.6 No progress 32 x<br />
Zambia 148 2,282 45 5 15 3 19 1.6 Insuffi cient progress 11<br />
Zimbabwe 96 1,707 33 7 12 3 17 -1.7 No progress 11<br />
SUMMARY INDICATORS<br />
Africa (a) 132 151,830 40 10 21 7 25 1.0 Insuffi cient progress 14<br />
Sub-Saharan Africa (s) 144 134,534 42 10 23 8 27 1.1 Insuffi cient progress 15<br />
Eastern <strong>and</strong> Southern Africa 120 61,795 45 8 23 7 26 1.3 Insuffi cient progress 14<br />
West <strong>and</strong> Central Africa 169 66,795 40 11 22 8 28 1.0 Insuffi cient progress 16<br />
Middle East <strong>and</strong> North Africa 43 46,256 32 10 14 5 14 0.8 Insuffi cient progress 11<br />
Asia 54 323,567 36 17 27 13 31 1.5 Insuffi cient progress 18<br />
South Asia 76 177,453 48 19 42 15 47 1.2 Insuffi cient progress 27<br />
East Asia <strong>and</strong> the Pacifi c 28 146,114 22 – 11 – 12 3.7 On track 6<br />
Latin America <strong>and</strong> the Caribbean 23 53,618 14 2 4 – 6 3.3 On track 9<br />
CEE/CIS 23 26,561 – – – – 5 8.8 On track 6<br />
Industrialized countries (t) 6 56,038 – – – – – – – –<br />
Developing countries (t) 72 566,411 34 13 23 10 26 1.5 Insuffi cient progress 16<br />
Least developed countries (t) 129 122,674 45 11 28 9 33 1.6 Insuffi cient progress 17<br />
World 65 634,631 34 13 23 10 26 1.5 Insuffi cient progress 16<br />
106 <str<strong>on</strong>g>Tracking</str<strong>on</strong>g> <str<strong>on</strong>g>Progress</str<strong>on</strong>g> <strong>on</strong> <strong>Child</strong> <strong>and</strong> <strong>Maternal</strong> Nutriti<strong>on</strong><br />
% of under-fi ves (2003–2008*) suffering from: Average<br />
Under-5<br />
mortality<br />
Under-5<br />
populati<strong>on</strong><br />
stunting<br />
(WHO)<br />
wasting<br />
(WHO)<br />
underweight<br />
(WHO)<br />
underweight annual rate<br />
(NCHS/ of reducti<strong>on</strong><br />
WHO) of underweight<br />
% of infants<br />
with low<br />
rate (thous<strong>and</strong>s) moderate moderate moderate<br />
moderate (%) <str<strong>on</strong>g>Progress</str<strong>on</strong>g> towards birthweight<br />
2008 2008 & severe & severe & severe severe & severe 1990–2008 the MDG 1 target 2003–2008*
DEFINITIONS OF THE INDICATORS<br />
Under-fi ve mortality rate – Probability of dying between birth <strong>and</strong> exactly 5 years of age, expressed per 1,000 live births.<br />
Stunting (WHO) – Moderate & severe: Percentage of children 0–59 m<strong>on</strong>ths old who are below minus two st<strong>and</strong>ard deviati<strong>on</strong>s from median height for age of the WHO<br />
<strong>Child</strong> Growth St<strong>and</strong>ards.<br />
Wasting (WHO) – Moderate & severe: Percentage of children 0–59 m<strong>on</strong>ths old who are below minus two st<strong>and</strong>ard deviati<strong>on</strong>s from median weight for height of the<br />
WHO <strong>Child</strong> Growth St<strong>and</strong>ards.<br />
Underweight (WHO) – Moderate & severe: Percentage of children 0–59 m<strong>on</strong>ths old who are below minus two st<strong>and</strong>ard deviati<strong>on</strong>s from median weight for age of<br />
WHO <strong>Child</strong> Growth St<strong>and</strong>ards; Severe: Percentage of children 0–59 m<strong>on</strong>ths old who are below minus three st<strong>and</strong>ard deviati<strong>on</strong>s from median weight for age of the<br />
WHO <strong>Child</strong> Growth St<strong>and</strong>ards.<br />
Underweight (NCHS/WHO) – Moderate & severe: Percentage of children 0–59 m<strong>on</strong>ths old who are below minus two st<strong>and</strong>ard deviati<strong>on</strong>s from median weight for<br />
age of the Nati<strong>on</strong>al Center for Health Statistics/World Health Organizati<strong>on</strong> (NCHS/WHO) reference populati<strong>on</strong>.<br />
Average annual rate of reducti<strong>on</strong> of underweight – Underweight prevalence am<strong>on</strong>g children under 5 years old is the indicator used to measure progress towards the<br />
MDG target to reduce by half the proporti<strong>on</strong> of people who suffer from hunger. <str<strong>on</strong>g>Progress</str<strong>on</strong>g> is calculated by comparing the average annual rate of reducti<strong>on</strong> (AARR) based<br />
<strong>on</strong> multiple data estimates available for around the period of 1990–2008 with the AARR needed to achieve a 50 per cent reducti<strong>on</strong> over a 25-year period (1990–2015).<br />
The rate of change required to achieve the goal is a c<strong>on</strong>stant of 2.8 per cent per year for all countries.<br />
<str<strong>on</strong>g>Progress</str<strong>on</strong>g> towards the MDG 1 target – Countries <strong>and</strong> regi<strong>on</strong>s are classifi ed according to the following thresholds: On track: AARR is 2.6 per cent or more or latest<br />
available estimate of underweight prevalence (from 2003 or later) is 5 per cent or less, regardless of AARR. Insuffi cient progress: AARR is between 0.6 per cent <strong>and</strong><br />
2.5 per cent, inclusive. No progress: AARR is 0.5 per cent or less.<br />
Low birthweight – Percentage of infants weighing less than 2,500 grams at birth.<br />
MAIN DATA SOURCES<br />
Under-fi ve mortality rate – Inter-agency Group for <strong>Child</strong> Mortality Estimati<strong>on</strong> (IGME), UNICEF, World Health Organizati<strong>on</strong>, United Nati<strong>on</strong>s Populati<strong>on</strong> Divisi<strong>on</strong><br />
<strong>and</strong> World Bank.<br />
Under-fi ve populati<strong>on</strong> – United Nati<strong>on</strong>s Populati<strong>on</strong> Divisi<strong>on</strong>.<br />
Stunting, wasting <strong>and</strong> underweight – Demographic <strong>and</strong> Health Surveys (DHS), Multiple Indicator Cluster Surveys (MICS), other nati<strong>on</strong>al household surveys,<br />
UNICEF <strong>and</strong> WHO.<br />
Low birthweight – DHS, MICS, other nati<strong>on</strong>al household surveys, data from routine reporting systems, UNICEF.<br />
NOTES<br />
(a) Africa includes sub-Saharan Africa, Algeria, Egypt, the Libyan Arab Jamahiriya, Morocco <strong>and</strong> Tunisia.<br />
(s) Sub-Saharan Africa includes Djibouti <strong>and</strong> the Sudan.<br />
(t) Includes territories within each country category or regi<strong>on</strong>al group.<br />
– Data not available.<br />
x Data refer to years or periods other than those specifi ed in the column heading, differ from the st<strong>and</strong>ard defi niti<strong>on</strong> or refer to <strong>on</strong>ly part of a country. Such data are not<br />
included in the calculati<strong>on</strong> of regi<strong>on</strong>al <strong>and</strong> global averages.<br />
y Data refer to years or periods other than those specifi ed in the column heading, differ from the st<strong>and</strong>ard defi niti<strong>on</strong> or refer to <strong>on</strong>ly part of a country. Such data are<br />
included in the calculati<strong>on</strong> of regi<strong>on</strong>al <strong>and</strong> global averages.<br />
* Data refer to the most recent year available during the period specifi ed in the column heading.<br />
z Estimates according to NCHS/WHO reference populati<strong>on</strong>. Refer to underweight moderate <strong>and</strong> severe (NCHS/WHO) estimate for applicable footnotes.<br />
Such data are not included in the calculati<strong>on</strong> of regi<strong>on</strong>al <strong>and</strong> global averages.<br />
For a complete list of countries <strong>and</strong> territories in the regi<strong>on</strong>s <strong>and</strong> subregi<strong>on</strong>s, see page 114.<br />
Statistical Tables 107
Table 3. Infant feeding practices <strong>and</strong> micr<strong>on</strong>utrient indicators<br />
% of children (2003–2008*) who are:<br />
Vitamin A<br />
Annual no.<br />
of births<br />
(thous<strong>and</strong>s)<br />
Early initiati<strong>on</strong><br />
of breastfeeding<br />
(%)<br />
exclusively<br />
breastfed<br />
breastfed with<br />
complementary<br />
food<br />
still<br />
breastfeeding<br />
supplementati<strong>on</strong><br />
coverage rate<br />
(6–59 m<strong>on</strong>ths) 2008<br />
% of households<br />
c<strong>on</strong>suming iodized salt<br />
Countries <strong>and</strong> territories 2008 2003–2008 (
(c<strong>on</strong>tinued)<br />
% of children (2003–2008*) who are:<br />
Vitamin A<br />
Annual no.<br />
of births<br />
(thous<strong>and</strong>s)<br />
Early initiati<strong>on</strong><br />
of breastfeeding<br />
(%)<br />
exclusively<br />
breastfed<br />
breastfed with<br />
complementary<br />
food<br />
still<br />
breastfeeding<br />
supplementati<strong>on</strong><br />
coverage rate<br />
(6–59 m<strong>on</strong>ths) 2008<br />
% of households<br />
c<strong>on</strong>suming iodized salt<br />
Countries <strong>and</strong> territories 2008 2003–2008 (
Table 3. (c<strong>on</strong>tinued)<br />
% of children (2003–2008*) who are:<br />
Vitamin A<br />
Annual no.<br />
of births<br />
(thous<strong>and</strong>s)<br />
Early initiati<strong>on</strong><br />
of breastfeeding<br />
(%)<br />
exclusively<br />
breastfed<br />
breastfed with<br />
complementary<br />
food<br />
still<br />
breastfeeding<br />
supplementati<strong>on</strong><br />
coverage rate<br />
(6–59 m<strong>on</strong>ths) 2008<br />
% of households<br />
c<strong>on</strong>suming iodized salt<br />
Countries <strong>and</strong> territories 2008 2003–2008 (
DEFINITIONS OF THE INDICATORS<br />
Early initiati<strong>on</strong> of breastfeeding – Percentage of infants who are put to the breast within <strong>on</strong>e hour of birth.<br />
Exclusively breastfed (
112 <str<strong>on</strong>g>Tracking</str<strong>on</strong>g> <str<strong>on</strong>g>Progress</str<strong>on</strong>g> <strong>on</strong> <strong>Child</strong> <strong>and</strong> <strong>Maternal</strong> Nutriti<strong>on</strong>
ANNEXES
SUMMARY INDICATORS<br />
Averages presented at the end of Table 2 <strong>on</strong> page 106 <strong>and</strong> Table 3 <strong>on</strong> page 110 are calculated using data from the countries<br />
<strong>and</strong> territories as classifi ed below.<br />
Changes in UNICEF regi<strong>on</strong>al <strong>and</strong> country classifi cati<strong>on</strong>s<br />
In additi<strong>on</strong> to reporting <strong>on</strong> countries according to its st<strong>and</strong>ard regi<strong>on</strong>al classifi cati<strong>on</strong>s, UNICEF now reports<br />
statistical indicators for Africa <strong>and</strong> Asia.<br />
Africa includes all countries <strong>and</strong> territories of Eastern <strong>and</strong> Southern Africa <strong>and</strong> of West <strong>and</strong> Central Africa, as well<br />
as the following countries <strong>and</strong> territories of the Middle East <strong>and</strong> North Africa: Algeria, Djibouti, Egypt, the Libyan<br />
Arab Jamahiriya, Morocco, the Sudan <strong>and</strong> Tunisia.<br />
Sub-Saharan Africa includes Djibouti <strong>and</strong> the Sudan, as well as all the countries <strong>and</strong> territories of Eastern<br />
<strong>and</strong> Southern Africa, <strong>and</strong> of West <strong>and</strong> Central Africa. As a c<strong>on</strong>sequence of these changes, regi<strong>on</strong>al estimates for<br />
sub-Saharan Africa appearing in earlier UNICEF publicati<strong>on</strong>s are not strictly comparable with those published in<br />
this report.<br />
Asia includes all countries <strong>and</strong> territories of South Asia <strong>and</strong> of East Asia <strong>and</strong> the Pacifi c.<br />
Industrialized countries/territories refers to countries <strong>and</strong> territories that are not included in any of UNICEF’s<br />
st<strong>and</strong>ard regi<strong>on</strong>al classifi cati<strong>on</strong>s.<br />
Developing countries/territories are classifi ed as such for purposes of statistical analysis <strong>on</strong>ly; there is no<br />
c<strong>on</strong>venti<strong>on</strong> for classifying countries or territories ‘developed’ or ‘developing’ in the United Nati<strong>on</strong>s system.<br />
Least developed countries/territories are classifi ed as such by the United Nati<strong>on</strong>s.<br />
UNICEF regi<strong>on</strong>al classifi cati<strong>on</strong>s<br />
Africa<br />
Sub-Saharan Africa; North Africa (Algeria, Egypt,<br />
Libyan Arab Jamahiriya, Morocco, Tunisia)<br />
Sub-Saharan Africa<br />
Eastern <strong>and</strong> Southern Africa; West <strong>and</strong> Central Africa;<br />
Djibouti <strong>and</strong> the Sudan<br />
Eastern <strong>and</strong> Southern Africa<br />
Angola; Botswana; Burundi; Comoros; Eritrea; Ethiopia;<br />
Kenya; Lesotho; Madagascar; Malawi; Mauritius;<br />
Mozambique; Namibia; Rw<strong>and</strong>a; Seychelles; Somalia;<br />
South Africa; Swazil<strong>and</strong>; Ug<strong>and</strong>a; United Republic of<br />
Tanzania; Zambia; Zimbabwe<br />
West <strong>and</strong> Central Africa<br />
Benin; Burkina Faso; Camero<strong>on</strong>; Cape Verde; Central African<br />
Republic; Chad; C<strong>on</strong>go; Côte d’Ivoire; Democratic Republic<br />
of the C<strong>on</strong>go; Equatorial Guinea; Gab<strong>on</strong>; Gambia; Ghana;<br />
Guinea; Guinea-Bissau; Liberia; Mali; Mauritania; Niger;<br />
Nigeria; Sao Tome <strong>and</strong> Principe; Senegal; Sierra Le<strong>on</strong>e; Togo<br />
114 <str<strong>on</strong>g>Tracking</str<strong>on</strong>g> <str<strong>on</strong>g>Progress</str<strong>on</strong>g> <strong>on</strong> <strong>Child</strong> <strong>and</strong> <strong>Maternal</strong> Nutriti<strong>on</strong><br />
Middle East <strong>and</strong> North Africa<br />
Algeria; Bahrain; Djibouti; Egypt; Iran (Islamic Republic of);<br />
Iraq; Jordan; Kuwait; Leban<strong>on</strong>; Libyan Arab Jamahiriya;<br />
Morocco; Occupied Palestinian Territory; Oman; Qatar;<br />
Saudi Arabia; Sudan; Syrian Arab Republic; Tunisia;<br />
United Arab Emirates; Yemen<br />
Asia<br />
South Asia; East Asia <strong>and</strong> the Pacifi c<br />
South Asia<br />
Afghanistan; Bangladesh; Bhutan; India; Maldives; Nepal;<br />
Pakistan; Sri Lanka<br />
East Asia <strong>and</strong> the Pacifi c<br />
Brunei Darussalam; Cambodia; China; Cook Isl<strong>and</strong>s;<br />
Democratic People’s Republic of Korea; Fiji; Ind<strong>on</strong>esia; Kiribati;<br />
Lao People’s Democratic Republic; Malaysia; Marshall Isl<strong>and</strong>s;<br />
Micr<strong>on</strong>esia (Federated States of); M<strong>on</strong>golia; Myanmar; Nauru;<br />
Niue; Palau; Papua New Guinea; Philippines; Republic of<br />
Korea; Samoa; Singapore; Solom<strong>on</strong> Isl<strong>and</strong>s; Thail<strong>and</strong>;<br />
Timor-Leste; T<strong>on</strong>ga; Tuvalu; Vanuatu; Viet Nam
Latin America <strong>and</strong> the Caribbean<br />
Antigua <strong>and</strong> Barbuda; Argentina; Bahamas; Barbados;<br />
Belize; Bolivia (Plurinati<strong>on</strong>al State of); Brazil; Chile;<br />
Colombia; Costa Rica; Cuba; Dominica; Dominican<br />
Republic; Ecuador; El Salvador; Grenada; Guatemala;<br />
Guyana; Haiti; H<strong>on</strong>duras; Jamaica; Mexico; Nicaragua;<br />
Panama; Paraguay; Peru; Saint Kitts <strong>and</strong> Nevis; Saint Lucia;<br />
Saint Vincent <strong>and</strong> the Grenadines; Suriname; Trinidad <strong>and</strong><br />
Tobago; Uruguay; Venezuela (Bolivarian Republic of)<br />
CEE/CIS<br />
Albania; Armenia; Azerbaijan; Belarus; Bosnia <strong>and</strong><br />
Herzegovina; Bulgaria; Croatia; Georgia; Kazakhstan;<br />
Kyrgyzstan; M<strong>on</strong>tenegro; Republic of Moldova; Romania;<br />
Russian Federati<strong>on</strong>; Serbia; Tajikistan; The former<br />
Yugoslav Republic of Maced<strong>on</strong>ia; Turkey; Turkmenistan;<br />
Ukraine; Uzbekistan<br />
UNICEF country classifi cati<strong>on</strong>s<br />
Industrialized countries/territories<br />
Andorra; Australia; Austria; Belgium; Canada; Cyprus;<br />
Czech Republic; Denmark; Est<strong>on</strong>ia; Finl<strong>and</strong>; France;<br />
Germany; Greece; Holy See; Hungary; Icel<strong>and</strong>; Irel<strong>and</strong>;<br />
Israel; Italy; Japan; Latvia; Liechtenstein; Lithuania;<br />
Luxembourg; Malta; M<strong>on</strong>aco; Netherl<strong>and</strong>s; New Zeal<strong>and</strong>;<br />
Norway; Pol<strong>and</strong>; Portugal; San Marino; Slovakia; Slovenia;<br />
Spain; Sweden; Switzerl<strong>and</strong>; United Kingdom of Great<br />
Britain <strong>and</strong> Northern Irel<strong>and</strong>; United States of America<br />
Developing countries/territories<br />
Afghanistan; Algeria; Angola; Antigua <strong>and</strong> Barbuda;<br />
Argentina; Armenia; Azerbaijan; Bahamas; Bahrain;<br />
Bangladesh; Barbados; Belize; Benin; Bhutan; Bolivia<br />
(Plurinati<strong>on</strong>al State of); Botswana; Brazil; Brunei Darussalam;<br />
Burkina Faso; Burundi; Cambodia; Camero<strong>on</strong>; Cape Verde;<br />
Central African Republic; Chad; Chile; China; Colombia;<br />
Comoros; C<strong>on</strong>go; Cook Isl<strong>and</strong>s; Costa Rica; Côte d’Ivoire;<br />
Cuba; Cyprus; Democratic Republic of the C<strong>on</strong>go;<br />
Democratic People’s Republic of Korea; Djibouti; Dominica;<br />
Dominican Republic; Ecuador; Egypt; El Salvador;<br />
Equatorial Guinea; Eritrea; Ethiopia; Fiji; Gab<strong>on</strong>; Gambia;<br />
Georgia; Ghana; Grenada; Guatemala; Guinea; Guinea-<br />
Bissau; Guyana; Haiti; H<strong>on</strong>duras; India; Ind<strong>on</strong>esia;<br />
Iran (Islamic Republic of); Iraq; Israel; Jamaica; Jordan;<br />
Kazakhstan; Kenya; Kiribati; Kuwait; Kyrgyzstan;<br />
Lao People’s Democratic Republic; Leban<strong>on</strong>; Lesotho;<br />
Liberia; Libyan Arab Jamahiriya; Madagascar; Malawi;<br />
Malaysia; Maldives; Mali; Marshall Isl<strong>and</strong>s; Mauritania;<br />
Mauritius; Mexico; Micr<strong>on</strong>esia (Federated States of);<br />
M<strong>on</strong>golia; Morocco; Mozambique; Myanmar; Namibia;<br />
Nauru; Nepal; Nicaragua; Niger; Nigeria; Niue; Occupied<br />
Palestinian Territory; Oman; Pakistan; Palau; Panama;<br />
Papua New Guinea; Paraguay; Peru; Philippines; Qatar;<br />
Republic of Korea; Rw<strong>and</strong>a; Saint Kitts <strong>and</strong> Nevis; Saint<br />
Lucia; Saint Vincent <strong>and</strong> the Grenadines; Samoa; Sao Tome<br />
<strong>and</strong> Principe; Saudi Arabia; Senegal; Seychelles; Sierra Le<strong>on</strong>e;<br />
Singapore; Solom<strong>on</strong> Isl<strong>and</strong>s; Somalia; South Africa;<br />
Sri Lanka; Sudan; Suriname; Swazil<strong>and</strong>; Syrian Arab<br />
Republic; Tajikistan; Thail<strong>and</strong>; Timor-Leste; Togo; T<strong>on</strong>ga;<br />
Trinidad <strong>and</strong> Tobago; Tunisia; Turkey; Turkmenistan; Tuvalu;<br />
Ug<strong>and</strong>a; United Arab Emirates; United Republic of Tanzania;<br />
Uruguay; Uzbekistan; Vanuatu; Venezuela (Bolivarian<br />
Republic of); Viet Nam; Yemen; Zambia; Zimbabwe<br />
Least developed countries/territories<br />
Afghanistan; Angola; Bangladesh; Benin; Bhutan;<br />
Burkina Faso; Burundi; Cambodia; Central African Republic;<br />
Chad; Comoros; Democratic Republic of the C<strong>on</strong>go;<br />
Djibouti; Equatorial Guinea; Eritrea; Ethiopia; Gambia;<br />
Guinea; Guinea-Bissau; Haiti; Kiribati; Lao People’s<br />
Democratic Republic; Lesotho; Liberia; Madagascar;<br />
Malawi; Maldives; Mali; Mauritania; Mozambique;<br />
Myanmar; Nepal; Niger; Rw<strong>and</strong>a; Samoa; Sao Tome <strong>and</strong><br />
Principe; Senegal; Sierra Le<strong>on</strong>e; Solom<strong>on</strong> Isl<strong>and</strong>s; Somalia;<br />
Sudan; Timor-Leste; Togo; Tuvalu; Ug<strong>and</strong>a; United Republic<br />
of Tanzania; Vanuatu; Yemen; Zambia<br />
Annexes<br />
115
GENERAL NOTES<br />
ON THE DATA<br />
The data presented in this report are derived from UNICEF<br />
global databases, which include <strong>on</strong>ly internati<strong>on</strong>ally<br />
comparable <strong>and</strong> statistically sound data. In additi<strong>on</strong>, data<br />
from the resp<strong>on</strong>sible United Nati<strong>on</strong>s organizati<strong>on</strong> have<br />
been used wherever possible. In the absence of such<br />
internati<strong>on</strong>ally st<strong>and</strong>ardized estimates, the profi les draw<br />
<strong>on</strong> other sources, particularly data drawn from nati<strong>on</strong>ally<br />
representative household surveys such as Multiple<br />
Indicator Cluster Surveys (MICS) <strong>and</strong> Demographic <strong>and</strong><br />
Health Surveys (DHS). Data presented refl ect the latest<br />
available estimates as of mid-2009. More detailed informati<strong>on</strong><br />
<strong>on</strong> methodology <strong>and</strong> the data sources is available at<br />
.<br />
Nutriti<strong>on</strong> indicators<br />
Overview of internati<strong>on</strong>al reference populati<strong>on</strong><br />
Prevalence of underweight, stunting <strong>and</strong> wasting am<strong>on</strong>g<br />
children under 5 years old is estimated by comparing actual<br />
measurements to an internati<strong>on</strong>al st<strong>and</strong>ard reference<br />
populati<strong>on</strong>. In April 2006, the World Health Organizati<strong>on</strong><br />
(WHO) released the WHO <strong>Child</strong> Growth St<strong>and</strong>ards to<br />
replace the widely used Nati<strong>on</strong>al Center for Health Statistics<br />
(NCHS)/WHO reference populati<strong>on</strong>, which was based <strong>on</strong><br />
a limited sample of children from the United States of<br />
America. The new <strong>Child</strong> Growth St<strong>and</strong>ards are the result of<br />
an intensive study project involving more than 8,000 children<br />
from Brazil, Ghana, India, Norway, Oman <strong>and</strong> the United<br />
States of America. Overcoming the technical <strong>and</strong> biological<br />
drawbacks of the old reference, the new st<strong>and</strong>ards c<strong>on</strong>fi rm<br />
that children born anywhere in the world <strong>and</strong> given the<br />
optimum start in life have the potential to develop to within<br />
the same range of height <strong>and</strong> weight, i.e., differences in<br />
children’s growth to age 5 are more infl uenced by nutriti<strong>on</strong>,<br />
feeding practices, envir<strong>on</strong>ment <strong>and</strong> health care than<br />
genetics or ethnicity.<br />
UNICEF is c<strong>on</strong>verting its global databases <strong>on</strong> children’s<br />
nutriti<strong>on</strong>al status towards the WHO <strong>Child</strong> Growth St<strong>and</strong>ards.<br />
It should be noted that due to the differences between the<br />
old reference populati<strong>on</strong> <strong>and</strong> the new st<strong>and</strong>ards, prevalence<br />
estimates of child anthropometry indicators based <strong>on</strong> these<br />
two references are not readily comparable.<br />
Reference populati<strong>on</strong> used in this report<br />
To c<strong>on</strong>form to the new internati<strong>on</strong>al guidelines regarding<br />
reference populati<strong>on</strong>s, nutriti<strong>on</strong>al status indicators are<br />
calculated according to the new WHO <strong>Child</strong> Growth<br />
116 <str<strong>on</strong>g>Tracking</str<strong>on</strong>g> <str<strong>on</strong>g>Progress</str<strong>on</strong>g> <strong>on</strong> <strong>Child</strong> <strong>and</strong> <strong>Maternal</strong> Nutriti<strong>on</strong><br />
St<strong>and</strong>ards whenever possible. Current global <strong>and</strong> regi<strong>on</strong>al<br />
estimates are based <strong>on</strong>ly <strong>on</strong> the WHO <strong>Child</strong> Growth<br />
St<strong>and</strong>ards. To more accurately calculate progress, trends<br />
are based <strong>on</strong> the NCHS reference populati<strong>on</strong> to ensure that<br />
estimates are based <strong>on</strong> the maximum number of data<br />
points. In additi<strong>on</strong>, to avoid missing data, current estimates<br />
at the country level are always presented according to WHO<br />
<strong>Child</strong> Growth St<strong>and</strong>ards, except for the following countries<br />
<strong>and</strong> territories: Bahrain, Bolivia (Plurinati<strong>on</strong>al State of),<br />
Burkina Faso, Burundi, Cape Verde, Chad, Chile, Comoros,<br />
Cook Isl<strong>and</strong>s, Costa Rica, Croatia, Cuba, Ecuador, Iran<br />
(Islamic Republic of), Kenya, Kiribati, Kuwait, Leban<strong>on</strong>,<br />
Libyan Arab Jamahiriya, Malaysia, Mauritius, Micr<strong>on</strong>esia<br />
(Federated States of), Mozambique, Occupied Palestinian<br />
Territory, Qatar, Russian Federati<strong>on</strong>, Saudi Arabia,<br />
South Africa, Timor-Leste, Trinidad <strong>and</strong> Tobago, Tunisia,<br />
Turkey, Ukraine, United Arab Emirates, Vanuatu, Venezuela<br />
(Bolivarian Republic of) <strong>and</strong> Viet Nam.<br />
Dates of estimates used in this report<br />
Throughout this report, estimates presented are from<br />
2003 or later unless otherwise specifi ed. In the stunting,<br />
wasting <strong>and</strong> underweight maps that present individual<br />
country or territory data, estimates for 96 countries <strong>and</strong><br />
territories are from surveys c<strong>on</strong>ducted in 2003 or later.<br />
Estimates for the following countries are derived from<br />
data collected before 2003: Bahrain, Bhutan, Botswana,<br />
Cook Isl<strong>and</strong>s, Costa Rica, Croatia, Equatorial Guinea,<br />
Eritrea, Gab<strong>on</strong>, Guatemala, Jordan, Kiribati, Kuwait,<br />
Libyan Arab Jamahiriya, Maldives, Mauritius, Micr<strong>on</strong>esia<br />
(Federated States of), Oman, Pakistan, Panama, Qatar,<br />
Romania, Russian Federati<strong>on</strong>, Saudi Arabia, Singapore,<br />
Trinidad <strong>and</strong> Tobago, Ukraine, United Arab Emirates,<br />
United States of America <strong>and</strong> Uruguay.<br />
In the exclusive breastfeeding map that presents individual<br />
country data, estimates for 108 countries <strong>and</strong> territories are<br />
from surveys c<strong>on</strong>ducted in 2003 or later. Estimates for the<br />
following countries are derived from data collected before<br />
2003: Angola, Bahrain, Botswana, Comoros, Cook Isl<strong>and</strong>s,<br />
Croatia, Equatorial Guinea, Eritrea, Gab<strong>on</strong>, Grenada,<br />
Guatemala, Kiribati, Kuwait, Leban<strong>on</strong>, Malaysia, Maldives,<br />
Mauritius, Mexico, Micr<strong>on</strong>esia (Federated States of),<br />
Palau, Panama, Qatar, Saint Kitts <strong>and</strong> Nevis, Saudi Arabia,<br />
The former Yugoslav Republic of Maced<strong>on</strong>ia, T<strong>on</strong>ga,<br />
United Arab Emirates <strong>and</strong> Venezuela (Bolivarian Republic of).<br />
Calculati<strong>on</strong> of nutriti<strong>on</strong>al status burden<br />
Numbers of children who are stunted, underweight or<br />
wasted are cited throughout this report. The approach<br />
used to calculate these burden numbers is to multiply the<br />
prevalence rate for a particular geographical area by the
elevant populati<strong>on</strong> for the same area. The prevalence<br />
rates are generally based <strong>on</strong> data collected in 2003 or later.<br />
The same method was also used to calculate numbers of<br />
newborns with low birthweight, numbers of newborns<br />
not weighed at birth <strong>and</strong> numbers of newborns protected<br />
against iodine defi ciency disorders. The populati<strong>on</strong> estimates<br />
for children under fi ve <strong>and</strong> annual number of births<br />
come from the United Nati<strong>on</strong>s Populati<strong>on</strong> Divisi<strong>on</strong> <strong>and</strong><br />
refer to the year 2008.<br />
Low birthweight<br />
The low birthweight incidence reported by household<br />
surveys in developing countries is often biased because<br />
many infants are not weighed at birth <strong>and</strong> not included<br />
in the calculati<strong>on</strong>. Also, for those whose birthweight is<br />
measured, the readings are often clustered around multiples<br />
of 500 grams. Therefore, a porti<strong>on</strong> of infants noted<br />
as weighing exactly 2,500 grams actually weigh less than<br />
2,500 grams. UNICEF reanalysed data from household<br />
surveys to adjust for under-reporting <strong>and</strong> misreporting,<br />
using methodology jointly developed by UNICEF <strong>and</strong><br />
WHO. The adjusted incidence is usually higher than<br />
what is reported by the survey.<br />
Vitamin A supplementati<strong>on</strong><br />
The ‘full coverage’ indicator is derived from coverage<br />
reported for the period from January–June (round 1) <strong>and</strong><br />
from July–December (round 2). The lower of the two rounds<br />
in a given calendar year is reported as the full coverage<br />
estimate. This is a proxy for the proporti<strong>on</strong> of children<br />
who received two doses of vitamin A in a given year,<br />
approximately six m<strong>on</strong>ths apart.<br />
Iodized salt c<strong>on</strong>sumpti<strong>on</strong> trend<br />
The household c<strong>on</strong>sumpti<strong>on</strong> of iodized salt trend data are<br />
based <strong>on</strong> individual year estimates that have different<br />
iodizati<strong>on</strong> cut-off levels (expressed in parts per milli<strong>on</strong>)<br />
<strong>and</strong> therefore may not be comparable. These data provide<br />
a general impressi<strong>on</strong> of programme evoluti<strong>on</strong>.<br />
Anaemia data<br />
Anaemia data come primarily from the WHO global database<br />
<strong>on</strong> anaemia, which is based <strong>on</strong> data from household surveys,<br />
particularly DHS. Data from individual countries or territories<br />
may have a numerator or denominator that varies from<br />
the defi niti<strong>on</strong> in the ‘General notes <strong>on</strong> the data’, p. 117. For<br />
example, data for anaemia am<strong>on</strong>g preschool-age children<br />
frequently refer to children 6–59 m<strong>on</strong>ths old but sometimes<br />
refer to a different age range, for example, 0–59 m<strong>on</strong>ths. For<br />
more informati<strong>on</strong>, refer to <strong>and</strong> .<br />
Mortality<br />
<strong>Child</strong> mortality estimates<br />
The child mortality estimates published in this report<br />
(infant mortality rate, under-fi ve mortality rate <strong>and</strong> underfi<br />
ve deaths) are based <strong>on</strong> the work of the Inter-agency<br />
Group for <strong>Child</strong> Mortality Estimati<strong>on</strong>, which includes<br />
UNICEF, WHO, the United Nati<strong>on</strong>s Populati<strong>on</strong> Divisi<strong>on</strong> <strong>and</strong><br />
the World Bank. The group updates these estimates every<br />
year, undertaking a detailed review of all newly available<br />
data points, <strong>and</strong> at times, this review results in adjustments<br />
to previously reported estimates. The full time series for all<br />
countries <strong>and</strong> territories is published at <br />
<strong>and</strong> , the group’s website.<br />
<strong>Maternal</strong> mortality estimates<br />
<strong>Maternal</strong> mortality estimates are also presented in this<br />
report. ‘Reported estimates’ are those that come directly<br />
from a country’s nati<strong>on</strong>al authorities. ‘Adjusted estimates’,<br />
which refer to the year 2005, are based <strong>on</strong> the work of the<br />
Inter-agency Group for <strong>Maternal</strong> Mortality Estimati<strong>on</strong>.<br />
The process generates estimates for countries with<br />
no nati<strong>on</strong>al data <strong>and</strong> adjusts available country data<br />
to correct for under-reporting <strong>and</strong> misclassifi cati<strong>on</strong>.<br />
(For more informati<strong>on</strong> see <strong>Maternal</strong> Mortality in 2005<br />
at .)<br />
Other indicators<br />
Populati<strong>on</strong> below internati<strong>on</strong>al poverty line of<br />
US$1.25 per day (%)<br />
The World Bank recently announced a new poverty line that<br />
is based <strong>on</strong> revised estimates of purchasing power parity<br />
(PPP) price levels around the world. The nutriti<strong>on</strong> profi les<br />
refl ect this updated poverty line, <strong>and</strong> thus present the<br />
proporti<strong>on</strong> of the populati<strong>on</strong> living below US$1.25 per day<br />
at 2005 prices, adjusted for PPP. The new poverty threshold<br />
refl ects revisi<strong>on</strong>s to PPP exchange rates based <strong>on</strong> the<br />
results of the 2005 Internati<strong>on</strong>al Comparis<strong>on</strong> Program. The<br />
revisi<strong>on</strong>s reveal that the cost of living is higher across the<br />
developing world than previously estimated. More detailed<br />
informati<strong>on</strong> <strong>on</strong> the defi niti<strong>on</strong>, methodology <strong>and</strong> sources of<br />
the data presented is available at .<br />
Water <strong>and</strong> sanitati<strong>on</strong><br />
The drinking water <strong>and</strong> sanitati<strong>on</strong> coverage estimates<br />
were produced by the WHO-UNICEF Joint M<strong>on</strong>itoring<br />
Programme for Water Supply <strong>and</strong> Sanitati<strong>on</strong> (JMP). They<br />
are the offi cial UN estimates for measuring progress<br />
towards the MDG drinking water <strong>and</strong> sanitati<strong>on</strong> targets<br />
<strong>and</strong> use a st<strong>and</strong>ard classifi cati<strong>on</strong> of what c<strong>on</strong>stitutes<br />
coverage. The JMP does not report the fi ndings of the<br />
Annexes<br />
117
latest nati<strong>on</strong>ally representative household survey or census.<br />
Instead, it estimates coverage using a linear regressi<strong>on</strong> line<br />
that is based <strong>on</strong> coverage data from all available household<br />
sample surveys <strong>and</strong> censuses. Specifi c country data can be<br />
found at <strong>and</strong> at .<br />
Primary school net enrolment/attendance ratios<br />
The estimates presented are either the primary school<br />
net enrolment ratio (derived from administrative data) or<br />
the primary school net attendance ratio (derived from<br />
household survey data). In general, if both indicators<br />
are available, the primary school net enrolment ratio is<br />
preferred unless the data for primary school attendance<br />
is c<strong>on</strong>sidered to be of superior quality.<br />
118 <str<strong>on</strong>g>Tracking</str<strong>on</strong>g> <str<strong>on</strong>g>Progress</str<strong>on</strong>g> <strong>on</strong> <strong>Child</strong> <strong>and</strong> <strong>Maternal</strong> Nutriti<strong>on</strong>
ACKNOWLEDGEMENTS<br />
Editorial <strong>and</strong> research<br />
Wivina Belm<strong>on</strong>te, Offi cer-in-Charge/Director ad interim,<br />
Divisi<strong>on</strong> of Communicati<strong>on</strong>; Catherine Langevin-Falc<strong>on</strong>,<br />
Editor ; David Anth<strong>on</strong>y; Marilia Di Noia; Hirut Gebre-Egziabher;<br />
Nelly Ingraham; Maria J<strong>on</strong>c kheere; Natalie Lest<strong>on</strong>;<br />
Charlotte Maitre; Meedan Mek<strong>on</strong>nen; Kristin Moehlmann;<br />
Baishalee Nayak; Catherine Rutgers; Anastasia Warpinski;<br />
Judith Yemane<br />
Statistics <strong>and</strong> m<strong>on</strong>itoring<br />
Richard Morgan, Director, Divisi<strong>on</strong> of Policy <strong>and</strong> Practice;<br />
Tessa Wardlaw, Associate Director, Statistics <strong>and</strong><br />
M<strong>on</strong>itoring Secti<strong>on</strong>, Divisi<strong>on</strong> of Policy <strong>and</strong> Practice;<br />
Danielle Burke; Xiaod<strong>on</strong>g Cai; Archana Dwivedi;<br />
Rouslan Karimov; Rolf Luyendijk; Nyein Nyein Lwin;<br />
Holly Newby; Kin Wityee Oo; Danzhen You<br />
Programme guidance<br />
Nicholas Alipui, Director, Programme Divisi<strong>on</strong>;<br />
Maniza Zaman, Deputy Director, Programme Divisi<strong>on</strong>;<br />
Werner Schultink, Associate Director, Nutriti<strong>on</strong> Secti<strong>on</strong>,<br />
Programme Divisi<strong>on</strong>; M<strong>and</strong>ana Arabi; Anirban Chatterjee;<br />
David Clark; Nita Dalmiya; Ilka Esquivel; Tanya Khara;<br />
Julia Krasevec; Nune Mangasaryan; Christiane Rudert;<br />
Arnold Timmer; Juliawati Untoro<br />
Country profi les<br />
DevInfo Support Group <br />
Producti<strong>on</strong> <strong>and</strong> distributi<strong>on</strong><br />
Jaclyn Tierney, Producti<strong>on</strong> Chief, Divisi<strong>on</strong> of<br />
Communicati<strong>on</strong>; Germain Ake; Fanuel Endalew;<br />
Eki Kairupan; Farid Rashid; Elias Salem; Edward Ying Jr.<br />
Translati<strong>on</strong><br />
French Editi<strong>on</strong>: Marc Chalamet<br />
Spanish Editi<strong>on</strong>: Carlos Perellón<br />
Design <strong>and</strong> pre-press producti<strong>on</strong><br />
Green Communicati<strong>on</strong> Design inc., M<strong>on</strong>treal<br />
www.greencom.ca<br />
Photo credits<br />
Cover photo: © UNICEF/BANA2007-00556/Siddique<br />
Page 9: © UNICEF/NYHQ2004-0573/Ramos<br />
Page 43: © UNICEF/NYHQ2009-0596/Noorani<br />
Page 101: © UNICEF/NYHQ2006-2235/Pirozzi<br />
Page 113: © UNICEF/NYHQ2005-2131/Pirozzi<br />
Acknowledgements<br />
119
Published by UNICEF<br />
Divisi<strong>on</strong> of Communicati<strong>on</strong><br />
3 United Nati<strong>on</strong>s Plaza<br />
New York, NY 10017, USA<br />
Website: www.unicef.org<br />
Email: pubdoc@unicef.org<br />
ISBN 978-92-806-4482-1<br />
Sales Number: E.09.XX.25<br />
Price: US$25<br />
© United Nati<strong>on</strong>s <strong>Child</strong>ren’s Fund (UNICEF)<br />
November 2009<br />
>