Revegetation - OSM Technology Transfer - Office of Surface Mining
Revegetation - OSM Technology Transfer - Office of Surface Mining
Revegetation - OSM Technology Transfer - Office of Surface Mining

You also want an ePaper? Increase the reach of your titles
YUMPU automatically turns print PDFs into web optimized ePapers that Google loves.
2000 Billings Land Reclamation Symposium<br />
REFERENCE AREA REALITY CHECK<br />
Michael S. Savage 1<br />
ABSTRACT<br />
Application <strong>of</strong> revegetation success criteria regulations during initial permitting <strong>of</strong><br />
surface coal mining operations in Colorado predominantly required the use <strong>of</strong> reference<br />
areas; small enclosures (0.8-2.0 ha) <strong>of</strong> native vegetation communities which would<br />
provide the parameter values for vegetation cover, herbaceous production, woody plant<br />
density, and species composition during a liability release evaluation. During the past<br />
two decades <strong>of</strong> revegetation experience at surface coal mining operations, it has become<br />
apparent that the reference areas do not reflect the character <strong>of</strong> the early seral vegetation<br />
communities developing after revegetation. Data from revegetation monitoring and bond<br />
release evaluations in the eastern plains and Colorado plateau support this observation.<br />
Therein lies the conundrum. What is the useful purpose in comparing one or several,<br />
native vegetation communities to a revegetated community? One alternative to<br />
employing reference areas is a modified historic record. An area is selected that most<br />
closely approximates the early seral stages <strong>of</strong> a revegetated area and the desired postmining<br />
land use. This area is sampled for the desired parameters for a specified period,<br />
including a range <strong>of</strong> precipitation regimes. An abandoned homestead pasture at the West<br />
Elk Mine near Somerset, Colorado was selected by Mountain Coal Company and the<br />
Colorado Division <strong>of</strong> Minerals and Geology as such an area. Three years <strong>of</strong> data from<br />
this study area indicates excellent correlation between the precipitation regime and<br />
vegetation cover and herbaceous production, leading to the development <strong>of</strong> a realistic<br />
simple predictive model for revegetation success criteria for these parameters.<br />
_______________<br />
1<br />
Savage and Savage, Inc., 464 W. Sumac Ct., Louisville, Colorado 80027
INTRODUCTION<br />
The Colorado <strong>Surface</strong> Coal <strong>Mining</strong> Reclamation Act (CRS 34-33-120 and 121)<br />
performance standards require that reclamation establish "a diverse, effective, and<br />
permanent vegetative cover <strong>of</strong> the same seasonal variety native to the area <strong>of</strong> land to be<br />
affected and capable <strong>of</strong> self-regeneration and plant succession at least equal in extent <strong>of</strong><br />
cover to the natural vegetation <strong>of</strong> the area." In implementing the provisions <strong>of</strong> the statute,<br />
the constructors <strong>of</strong> the Colorado regulations concluded that in order to meet revegetation<br />
success, reclaimed and revegetated areas must have a stabilizing cover <strong>of</strong> vegetation <strong>of</strong><br />
the same seasonal variety as that disturbed, and for those areas that are not cropland or to<br />
be developed (the majority <strong>of</strong> areas in Colorado), herbaceous production, species<br />
diversity, and woody plant density equal to that <strong>of</strong> the vegetation on the approved<br />
reference area or standards.<br />
While it is obvious from the comments and discussion regarding the use <strong>of</strong> technical<br />
standards (such as USDA and USDI technical guides) for establishment <strong>of</strong> revegetation<br />
success criteria in the federal regulatory program (Federal Register 1979), reference areas<br />
are the first method discussed and the predominantly employed method in Colorado<br />
(CDMG rule 4.15.7.2(d)). A review <strong>of</strong> the forty-four coal mines currently active or in<br />
reclamation in Colorado (December 1999) revealed that thirty-two use one or more<br />
reference areas to judge one or more vegetation parameters for reclamation success. Of<br />
the twelve mines that do not use reference areas, ten are, or were, small underground<br />
mines that had been operated prior to the passage <strong>of</strong> SMCRA and state reclamation<br />
statutes. One is a large surface mine and one is a large underground mine whose<br />
alternative approach is discussed below. There are sixty-seven total reference areas for<br />
these mines, <strong>of</strong> which fifty are shrub or tree dominated vegetation communities, fifteen<br />
are dominated by graminoids, and two are extended reference areas that encompass a<br />
variety <strong>of</strong> vegetation physiognomy.<br />
A CONUNDRUM OF COMPARISON:<br />
REVEGETATED vs. NATIVE COMMUNITIES<br />
The overarching concern with using a reference area in evaluating the success <strong>of</strong><br />
revegetation centers on comparison <strong>of</strong> a native vegetation community with an<br />
anthropogenic vegetation community. There are two predominant concerns with<br />
comparing native vegetation communities with reclaimed vegetation communities; first,<br />
the revegetated community has been developed on a significantly different (or altered)<br />
physical environment, and second, revegetation success comparisons are being made<br />
between a mature native vegetation community and an early seral stage vegetation<br />
community.<br />
Revegetated communities on mined areas generally have a significantly different physical<br />
environment. The geology and stratigraphy <strong>of</strong> the area has been altered through<br />
fragmentation, extraction, and replacement. With the removal and replacement <strong>of</strong> the
ock layers, the topography <strong>of</strong> the reclaimed landscape has been changed, <strong>of</strong>ten creating a<br />
more uniform landscape than that present prior to disturbance. The fragmentation,<br />
removal, and replacement <strong>of</strong> the rock materials has altered the groundwater hydrologic<br />
regime in the disturbance area, and likely has altered the surface water hydrology from<br />
the standpoint <strong>of</strong> drainage location, drainage pattern complexity, and chemical<br />
composition <strong>of</strong> the water. Removal, stockpiling, and replacement <strong>of</strong> topsoil or suitable<br />
plant growth media changes the character <strong>of</strong> the original soil pr<strong>of</strong>ile as well as the<br />
numbers and character <strong>of</strong> macro- and microorganisms within the removed and replaced<br />
soil, including the dormant seed bank. Lastly, the revegetated communities are young,<br />
they represent early seral stages in the development <strong>of</strong> the vegetation community.<br />
The native vegetation communities that are being used as reference areas have their own<br />
set <strong>of</strong> characteristics. Whether largely unaffected by man's presence or modified in the<br />
last centuries, the native vegetation communities have developed over long periods <strong>of</strong><br />
time, generally hundreds or thousands <strong>of</strong> years. As a result <strong>of</strong> this lengthy development,<br />
the vegetation communities are complex, in terms <strong>of</strong> numbers <strong>of</strong> species and their<br />
distribution throughout the landscape. Native vegetation communities have adapted to<br />
the physical and biotic environment in macro- and micro- distributional patterns,<br />
resulting in patchiness, and distributions dependent on time <strong>of</strong> species arrival and<br />
competition. Contrasted to revegetated communities, the native communities are old, and<br />
represent later stages in vegetation community development.<br />
Therein lies the conundrum. Is it reasonable to expect comparability between these two<br />
disparate types <strong>of</strong> vegetation communities? Rickliefs (1973) reports the results <strong>of</strong><br />
vegetation community successional studies as particularly variable, ranging from twenty<br />
to forty years recovery time for Colorado eastern plains grasslands (Shantz 1917) to 150<br />
years for a forest climax (Oosting 1942), while a complete successional sequence from<br />
barren sand to climax forest may require a millennium (Olson 1958).<br />
Empirical Evidence from Colorado<br />
To evaluate the question posed above, a review <strong>of</strong> quantitative data from revegetated<br />
mine sites and their associated reference areas was conducted. The mine sites selected<br />
represent locations that have been quantitatively evaluated by the author and represent<br />
disparate locations within Colorado. Table 1 presents a summary <strong>of</strong> salient vegetation<br />
information from the mines.<br />
Meadows No. 1 Mine<br />
The Meadows No. 1 Mine was located in Routt County, Colorado between Steamboat<br />
Springs and Craig. The open pit strip mine was opened in 1976 at an elevation <strong>of</strong><br />
approximately 2375 meters (7800'). The pre-disturbance vegetation <strong>of</strong> the mine site<br />
included mountain shrub, sage steppe, and mixed grassland. The reference area for the<br />
mine was a mix <strong>of</strong> big sage (Artemisia tridentata) and smooth brome (Bromus inermis),
eflecting both native vegetation and grazing interseeding. The reclaimed area was<br />
revegetated to a mix <strong>of</strong> cool season graminoids and forbs. The reclaimed area was<br />
seeded in the spring <strong>of</strong> 1984 and final bond release sought in late 1996. The information<br />
from two vegetation studies prepared in support <strong>of</strong> the final bond release application<br />
(Savage and Savage 1994, 1996) is found in Table 1.<br />
While total vegetation cover from each <strong>of</strong> the areas is equivalent in both years, the<br />
distribution <strong>of</strong> relative cover is widely different. Relative cover <strong>of</strong> woody shrubs in the<br />
sage-grass dominated reference area is significantly greater in both years. Within the<br />
reference area in 1995, a very wet year in the area, the response <strong>of</strong> ephemeral forbs<br />
(present but dormant in the seed bank) to the increased moisture is evident, with a<br />
doubling <strong>of</strong> relative cover. Herbaceous production in both areas varied significantly in<br />
response to the precipitation regime, however, relative contributions <strong>of</strong> graminoids and<br />
forbs remained relatively equivalent. The most significant difference between the<br />
reference area and the revegetated area in species numbers is the lack <strong>of</strong> woody species<br />
on the revegetated area.<br />
Bacon Mine<br />
The Bacon Mine is located in El Paso County, Colorado east <strong>of</strong> Colorado Springs. This<br />
mine was operated briefly in the early 1980's and reclaimed in 1989. Approximately 29<br />
acres was reclaimed and revegetated at an elevation <strong>of</strong> 1860 meters (6100'). The predisturbance<br />
vegetation <strong>of</strong> the mine site was warm season short grass prairie, dominated<br />
by blue grama (Bouteloua gracilis). The reference area for the mine is a small (1.2 ha)<br />
enclosure <strong>of</strong> the native Bouteloua vegetation community. The reclaimed area was<br />
revegetated to a mix <strong>of</strong> warm and cool season graminoids, forbs, and woody shrubs.<br />
Reseeding was undertaken in the autumn <strong>of</strong> 1989. Information in Table 1 for the Bacon<br />
Mine is contained in the application for final bond release (Savage and Savage 1998,<br />
1999).<br />
Total vegetation cover on both the reference area and revegetated area is equivalent.<br />
Significant differences exist in the distribution <strong>of</strong> the cover. The reference area exhibits<br />
dominance by graminoids, not unexpected for a short grass prairie community. The<br />
reference area also contains a small component <strong>of</strong> succulents and woody shrubs,<br />
predominantly cacti (Echinocereus and Opuntia polyacantha) and yucca (Yucca glauca)<br />
and well as the opportunistic broom snakeweed (Guterrezia sarothrae). In deference to<br />
the regulatory authority, and in order to meet woody plant density requirements, the<br />
reclaimed area was seeded with relatively aggressive woody shrubs (particularly Atriplex<br />
canescens), which now contribute significantly to relative cover, as well as creating a<br />
distinctly different community structure within the surrounding short grass prairie. To<br />
assuage concerns regarding the ability to successfully revegetate warm season grasses, a<br />
number <strong>of</strong> cool season grasses were seeded (Agropyron dasystachyum, Agropyron<br />
smithii, Agropyron trachycaulum, and Stipa viridula). As with the Atriplex canescens,<br />
these species have flourished and created a significantly different community structure.
Table 1. Comparision <strong>of</strong> Reference Areas and Revegetated Areas at Three Colorado Coal Mines<br />
Location<br />
Meadows No. 1 Mine<br />
1994 Reference Area<br />
1994 Revegetated Area<br />
1995 Reference Area<br />
1995 Revegetated Area<br />
Bacon Mine<br />
1998 Reference Area<br />
1998 Revegetated Area<br />
1999 Reference Area<br />
1999 Revegetated Area<br />
Keenesburg Mine<br />
1998 Reference Area<br />
1998 Revegetated Area (1985)<br />
1998 Revegetated Area (1986)<br />
1998 Revegetated Area (1987)<br />
1998 Revegetated Area (1995)<br />
Total<br />
Cover<br />
52.20<br />
47.33<br />
68.60<br />
60.13<br />
53.20<br />
60.50<br />
59.87<br />
59.60<br />
45.00<br />
40.20<br />
44.20<br />
43.80<br />
33.40<br />
Relative Cover<br />
graminoid forb succulent shrub<br />
46.63 15.03 38.34<br />
68.71 30.78 0.51<br />
41.35 32.01 26.64<br />
62.81 37.19<br />
75.97 22.26 0.65 1.13<br />
59.15 31.83 0.12 8.90<br />
78.59 19.68 1.15 0.57<br />
70.11 25.06 4.83<br />
36.77 2.91 0.53 59.79<br />
86.64 9.75 3.25 0.36<br />
86.25 7.50 2.50 2.50<br />
60.84 25.89 2.27 11.00<br />
55.66 44.34<br />
notes: cover values in percent (%), hebaceous production values in grams/square meter<br />
Herbaceous Production<br />
total graminoid forb<br />
114.78 98.03 16.75<br />
135.75 107.19 28.57<br />
406.19 317.42 88.77<br />
342.32 269.28 73.04<br />
155.37<br />
240.01<br />
140.09<br />
187.70<br />
109.65 101.55 8.10<br />
165.45 153.29 12.16<br />
152.67 141.93 10.73<br />
179.84 154.99 24.85<br />
108.71 79.87 28.84<br />
Number <strong>of</strong> Species<br />
graminoid forb succulent shrub<br />
5 9 4<br />
11 6 1<br />
4 15 3<br />
15 9 0<br />
5 12 3 1<br />
11 6 1 3<br />
5 13 3 1<br />
14 11 3<br />
5 3 1 1<br />
8 5 2 1<br />
10 5 1 1<br />
13 7 1 1<br />
10 9
Keenesburg Mine<br />
The Keenesburg Mine is located in Weld County, Colorado approximately fifty miles<br />
northeast <strong>of</strong> the Denver metropolitan area. <strong>Mining</strong> occurred between 1980 and 1988.<br />
Reclamation operations have been ongoing since 1985. Approximately 413 acres was<br />
disturbed during the operation, with 195 acres reclaimed by the end <strong>of</strong> 1998 (CEC 1998).<br />
The mine elevation is approximately 1460 meters (4800'). Although the expected<br />
vegetation community would be similar to that <strong>of</strong> the Bacon Mine with a mix <strong>of</strong> warm<br />
season grasses and forbs, the pre-disturbance vegetation consisted largely <strong>of</strong> a shrub<br />
community dominated by sand sage (Artemisia filifolia). The dominance <strong>of</strong> this shrub is<br />
likely due to the long history <strong>of</strong> range grazing, the porous nature <strong>of</strong> the aeolian sandy<br />
soils, and the low level <strong>of</strong> annual precipitation (31.5 cm). The reference area for the mine<br />
is dominated by Artemisia filifolia with contributions by Stipa viridula, Calamovilfa<br />
longifolia, Andropogon hallii, and Bouteloua gracilis. Reclaimed areas at the mine have<br />
been revegetated to a seed mix dominated by warm season grasses. In order to improve<br />
the post-mining vegetation community, no Artemisia or other woody species were<br />
included in the seed mix.<br />
Since 1994, the author has been conducting annual monitoring <strong>of</strong> the reference area and<br />
revegetated areas (Savage and Savage 1994a, 1995, 1996a, 1997, 1998a). Qualitative<br />
observations <strong>of</strong> the revegetated areas reveal continued development <strong>of</strong> a warm season<br />
graminoid prairie community. Reference area observations over the same period reveal a<br />
shrub-dominated community with low diversity. In 1998, the reference area and four<br />
revegetated areas ranging in age from three to thirteen years were quantitatively sampled.<br />
Table 1 presents selected results. As with the other mines examined, total vegetation<br />
cover is equivalent on all areas except the three-year-old revegetation. The differences<br />
lie in the composition <strong>of</strong> the vegetation cover. The shrub Artemisia filifolia dominates<br />
the reference area. Graminoids account for approximately one-third <strong>of</strong> the relative cover<br />
and forbs three percent. Within the older revegetated areas graminoids dominate, with<br />
significant contributions by forbs, succulents, and shrubs. Herbaceous production<br />
remains greater on the revegetated area, largely due to the absence <strong>of</strong> competition from<br />
Artemisia. The revegetated areas contain greater numbers <strong>of</strong> species, particularly<br />
graminoids and forbs.<br />
Conclusions<br />
The above three mines are illustrative <strong>of</strong> the concerns with using reference areas for<br />
generating revegetation success criteria for vegetation communities. In two <strong>of</strong> the above<br />
reference areas, a predominantly shrub dominated community is or was being compared<br />
to a predominantly herbaceous community. In the other example, a revegetated<br />
community differing significantly in structure and composition was created to satisfy one<br />
revegetation success parameter at the expense <strong>of</strong> others. Though overall total vegetation<br />
cover was generally equivalent, the structure <strong>of</strong> the vegetation cover and composition <strong>of</strong><br />
the relative cover <strong>of</strong> the vegetation communities was not. Herbaceous production was
generally greater on the revegetated communities, as would be expected since there were<br />
significantly less woody species that were not sampled. The species composition <strong>of</strong> the<br />
reference and revegetated communities differed significantly, with a general dominance<br />
<strong>of</strong> graminoids in the revegetated areas, largely due to seeding greater numbers <strong>of</strong><br />
graminoids. While forb numbers are relatively consistent between reference and<br />
revegetated areas, the majority <strong>of</strong> forbs within the reference areas are native and<br />
ephemeral; the majority <strong>of</strong> forbs in young revegetated areas are annual invaders.<br />
ALTERNATIVE REVEGETATION SUCCESS CRITERIA<br />
These differences require investigation <strong>of</strong> other measures for evaluation <strong>of</strong> successful<br />
revegetation <strong>of</strong> the early seral stage revegetated areas. One option has been widely<br />
applied for the evaluation <strong>of</strong> woody plant density and species diversity (composition).<br />
This option allows the regulatory authority to set revegetation success criteria for these<br />
two parameters based on pre-mining data. While this is commonly done, it begs the<br />
question <strong>of</strong> the legitimacy <strong>of</strong> utilizing native pre-mine vegetation community<br />
characteristics to set revegetation success criteria for the early seral stage revegetation<br />
community.<br />
Two additional options exist in the present Colorado regulations for setting revegetation<br />
success criteria for vegetation cover and herbaceous production: technical standards from<br />
technical document sources approved by the Colorado Division <strong>of</strong> Minerals and Geology<br />
(CDMG) and the Director <strong>of</strong> the <strong>Office</strong> <strong>of</strong> <strong>Surface</strong> <strong>Mining</strong> Reclamation and Enforcement<br />
(<strong>OSM</strong>RE), and historic records. Neither <strong>of</strong> these options has been widely used in<br />
Colorado due to the lack <strong>of</strong> approved technical documents and the need to collect a<br />
historic record <strong>of</strong> vegetation parameters over a number <strong>of</strong> years (typically five to seven).<br />
Development <strong>of</strong> the Approach<br />
The Modified Historic Record Approach<br />
During the initial permitting <strong>of</strong> the Mountain Coal Company (MCC) West Elk Mine<br />
(a large underground coal mine in Gunnison County, Colorado) in 1980 and 1981,<br />
revegetation success was proposed to be based on two reference areas established in<br />
Sylvester Gulch. As two vegetation communities were initially disturbed during the<br />
construction <strong>of</strong> surface facilities at the mine, a dry meadow reference area and an<br />
oakbrush reference area were established. The reference areas were to be used for<br />
evaluation <strong>of</strong> total vegetation cover and herbaceous production during revegetation<br />
evaluations for bond and liability release.<br />
In 1995, the West Elk Mine began an expansion project that involved additional surface<br />
development and expansion <strong>of</strong> the surface facilities. As a result <strong>of</strong> these projects,<br />
additional vegetation communities would be disturbed at the mine. Additional reference<br />
areas would need to be established and an existing reference area would need to be
elocated. Location, establishment, and maintenance <strong>of</strong> reference areas for each<br />
vegetation community disturbed or affected was no longer a viable option for<br />
determining revegetation success criteria. An evaluation <strong>of</strong> technical standard and<br />
historic record approaches to establishing revegetation success criteria for total vegetation<br />
cover and herbaceous production was undertaken.<br />
Meetings and discussions with CDMG yielded agreement on a site-specific historic<br />
record approach to establishing revegetation success criteria for cover and herbaceous<br />
production based on a reasonable expectation <strong>of</strong> the vegetation community to be<br />
established after reclamation. MCC and CDMG selected a vegetation community in the<br />
immediate vicinity <strong>of</strong> the mine that closely approximated the biologic composition and<br />
character <strong>of</strong> a post-mine plant community as well as the physical characteristics <strong>of</strong> the<br />
affected areas <strong>of</strong> the mine. Reconnaissance <strong>of</strong> the mine site and adjacent areas under the<br />
mines control revealed three locations characteristic <strong>of</strong> early seral stage vegetation<br />
communities. After collaboration and on-site inspections, one site was selected. This<br />
vegetation community was an abandoned homestead and pasture area surrounded by the<br />
native oakbrush, mountain shrub and sagebrush communities above the existing facilities<br />
area. The vegetation community and physical characteristics <strong>of</strong> the site (slope, aspect,<br />
drainage patterns) closely approximated the anticipated character <strong>of</strong> the reclaimed<br />
landscape and vegetation community.<br />
Use <strong>of</strong> historic records to generate revegetation success criteria has always been based on<br />
obtaining a representation <strong>of</strong> the range <strong>of</strong> parameter values for the historic record<br />
community. This meant quantitatively sampling a range <strong>of</strong> environmental conditions that<br />
would affect the vegetation parameters. As the physical characteristics <strong>of</strong> the site<br />
selected were very similar to those <strong>of</strong> the disturbed areas <strong>of</strong> the mine, the significant<br />
apparent variable was moisture, or precipitation regime.<br />
In order to obtain a representative record <strong>of</strong> the variability <strong>of</strong> the microclimate <strong>of</strong> the<br />
area, and therefore the effect on vegetation growth, it was determined that three years<br />
representing the variability <strong>of</strong> precipitation to be encountered at the site would comprise<br />
the historic record.<br />
For the purposes <strong>of</strong> the historic record; one low, one average, and one high precipitation<br />
year would be represented, based on precipitation records from a weather recording<br />
station in the area. Precipitation data over a ninety-year period was analyzed to specify a<br />
precipitation regime range. From the historic precipitation records, a "normal"<br />
precipitation regime (in inches <strong>of</strong> precipitation) was developed based on the amount <strong>of</strong><br />
precipitation received during the eight months preceding the growing season (October<br />
through May). The months comprising the precipitation regime were selected as those<br />
months during which precipitation would most likely have a significant effect on the<br />
following growing season's vegetation. Serendipitously, these months also corresponded<br />
with the period <strong>of</strong> the majority <strong>of</strong> precipitation at the mine. Determination <strong>of</strong> the year<br />
type (low, average, or high) was made based on the precipitation sum preceding the
growing season. Low and high precipitation years were defined as years where the<br />
precipitation sum differed by approximately 23 percent (one standard deviation) or more<br />
from the average precipitation sum for the October-May time period.<br />
After the selection <strong>of</strong> the historic record vegetation community within the historic record<br />
study area in concert with CDMG, the selected area was initially quantitatively sampled<br />
for four vegetation parameters during 1996; vegetation cover, herbaceous production,<br />
species composition, and woody plant numbers. Additionally, the soil characteristics <strong>of</strong><br />
the selected area were quantitatively analyzed and evaluated.<br />
Results: 1996-1998<br />
Quantitative sampling <strong>of</strong> the historic record vegetation community took place in 1996,<br />
1997, and 1998. The precipitation regime in 1996 was characterized as dry, 1997 was<br />
normal by definition, and 1998 was intermediate between 1996 and 1997.<br />
The historic record vegetation community was selected because <strong>of</strong> a close resemblance<br />
(location, elevation, aspect, soils, and vegetation community structure) to the dry<br />
meadow herbaceous vegetation community present within the West Elk Mine permit area<br />
(Savage and Savage, 1996b, 1997a). The dry meadow community was sampled in 1982<br />
(baseline) and the dry meadow reference area was sampled in 1982 and 1995 (Mountain<br />
Coal Company, 1997, Savage and Savage, 1995a). While the dry meadow community is<br />
no longer being quantitatively sampled, it is productive to compare observations made at<br />
the historic record vegetation community to those from the dry meadow community and<br />
dry meadow reference area within Sylvester Gulch. Table 2 provides a comparison <strong>of</strong> the<br />
sampled parameters for the dry meadow community, dry meadow reference area, and the<br />
historic record vegetation community from the years 1982 through 1998.<br />
A Predictive Model: An Unexpected Benefit<br />
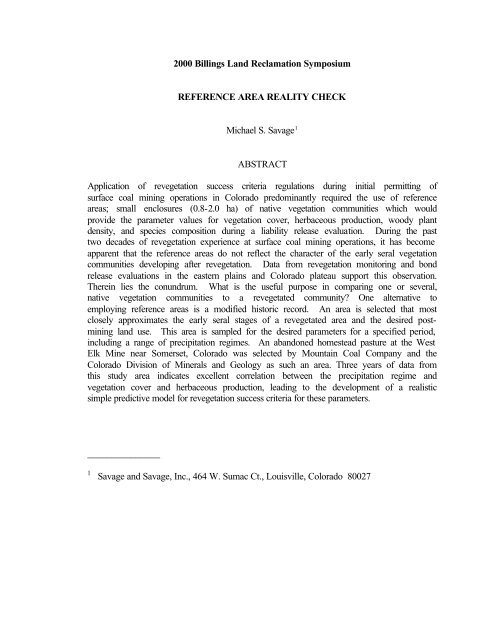
Figure 1 depicts the relationship between total vegetation cover and total herbaceous<br />
production and precipitation regime in the historic record vegetation community (HRSA),<br />
the dry meadow community (DM) and the dry meadow reference area (DMRA). Five<br />
years <strong>of</strong> data from the three communities illustrates distinct relationships directly related<br />
to the precipitation regime. With three years <strong>of</strong> data, it appears that the communities<br />
have characteristics that warrant separating them into individual units. The historic<br />
record vegetation community total vegetation cover and total herbaceous production<br />
values vary significantly from those <strong>of</strong> the dry meadow community and dry meadow<br />
reference area. Though the range <strong>of</strong> precipitation values does not correspond exactly, it<br />
is apparent that the historic record vegetation community has total vegetation cover<br />
values slightly higher than those <strong>of</strong> the dry meadow community and dry meadow<br />
reference area. Total herbaceous production values in the historic record vegetation<br />
community are much less than those recorded for the dry meadow community and dry<br />
meadow reference area.
Total Vegetation Cover (%) or Total Herbaceous Production (g/sq.m)<br />
400<br />
350<br />
300<br />
250<br />
200<br />
150<br />
100<br />
50<br />
0<br />
Figure 1. Comparison <strong>of</strong> Total Vegetation Cover and Total Herbaceous Production with Precipitation Regime<br />
in the Dry Meadow and Historic Record Vegetation Communities<br />
HRSA Total Vegetation Cover By Year<br />
Dry Meadow Total Vegetation Cover By Year<br />
HRSA Total Herbaceous Production By Year<br />
Dry Meadow Total Herbaceous Production By Year<br />
1996 HRSA<br />
1996 HRSA<br />
1998 HRSA<br />
1998 HRSA<br />
1982 DMRA<br />
1982 DM<br />
1997 HRSA<br />
1997 HRSA<br />
1982 DMRA<br />
1982 DM<br />
0 2 4 6 8 10 12 14 16<br />
October-May Precipitation (inches)<br />
1995 DMRA<br />
1995 DMRA
Table 2. Comparison <strong>of</strong> Vegetation Parameters in Graminoid<br />
Communities at the West Elk Mine<br />
Growing Season Herb. Production Total<br />
Date and Location Precipitation (in.) Mean Cover (%) (g/sq. meter) Species Number*<br />
1982 Dry Meadow 11.42 40.97 278.86 13<br />
1982 Dry Meadow Reference Area 11.42 46.85 363.91 15<br />
1995 Dry Meadow Reference Area 14.23 65.20 344.50 21<br />
1996 Historic Record Veg. Comm. 7.78 38.27 127.71 6<br />
1997 Historic Record Veg. Comm. 11.15 66.80 184.94 15<br />
1998 Historic Record Veg. Comm. 8.94 50.67 174.06 12<br />
* note: species number reflects species with cover equal or greater than 0.1 %
Mathematical evaluation <strong>of</strong> the relationship between precipitation regime and total<br />
vegetation cover and total herbaceous production was undertaken. In 1998 (Savage and<br />
Savage 1998b), data was separated by vegetation community, either historic record<br />
vegetation community or dry meadow community (undisturbed or reference area). Using<br />
this data, both total vegetation cover and total herbaceous production are positively<br />
correlated with precipitation. The data from the historic record vegetation community<br />
show a very strong correlation for both total vegetation cover and total herbaceous<br />
production (r=0.99 and r=0.86, respectively). For the dry meadow communities the<br />
correlation was strong for total vegetation cover (r=0.97), but very low for total<br />
herbaceous production (r=0.29).<br />
Based on the strength <strong>of</strong> the correlation for the historic record vegetation community,<br />
linear regressions were calculated for both total vegetation cover and total herbaceous<br />
production. For total vegetation cover in the historic record vegetation community, the<br />
linear equation y = 8.311862x - 25.3039 explained approximately 98 percent <strong>of</strong> the<br />
variation in total cover (y variable) through use <strong>of</strong> precipitation (x variable). Within the<br />
range <strong>of</strong> values sampled, this indicates that total vegetation cover can be satisfactorily<br />
predicted through use <strong>of</strong> the October-May precipitation value. Using the linear<br />
regression equation for total herbaceous production (y = 15.39103x + 19.25399) plotted<br />
against October-May precipitation, the explained variation was approximately 75 percent.<br />
Refinement <strong>of</strong> these regression equations through additional data collection will likely<br />
lead to models through which expected total vegetation cover values and total herbaceous<br />
production values can be predicted based on October-May precipitation values. This<br />
would prove a useful tool in establishing realistic revegetation success criteria for the<br />
West Elk Mine.<br />
SUMMARY<br />
Two decades <strong>of</strong> experience in revegetating disturbances associated with coal mining<br />
operations has revealed that establishment <strong>of</strong> revegetation success criteria based on<br />
comparisons with native, relatively undisturbed vegetation communities presents<br />
questions <strong>of</strong> equity and applicability, given the significant differences in seral stage<br />
development and physical environmental conditions between the two types <strong>of</strong><br />
communities. Alternative solutions to the use <strong>of</strong> reference areas are available based on<br />
careful selection <strong>of</strong> vegetation communities that represent the seral stage <strong>of</strong> development<br />
a revegetated community should be expected to attain during the extended liability<br />
period. When such an approach was undertaken at an underground coal mine in<br />
Colorado, subsequent evaluation <strong>of</strong> the data for vegetation cover and herbaceous<br />
production yielded a predictive mathematical model based on precipitation data. Use <strong>of</strong><br />
the model will provide a sliding scale for two revegetation success criteria; closely<br />
tailoring expected results to environmental conditions.
REFERENCES<br />
CEC. 1998. Coors Energy Company Keenesburg Mine 1998 Annual Hydrologic Report<br />
Federal Register. 1979. Department <strong>of</strong> the Interior, <strong>Office</strong> <strong>of</strong> <strong>Surface</strong> <strong>Mining</strong> Reclamation<br />
and Enforcement. <strong>Surface</strong> Coal <strong>Mining</strong> and Reclamation Operations:<br />
Permanent Regulatory Program. Vol.44-No.50. 3-13-79. Book 2: Pages 14901-<br />
15309<br />
MCC. 1997. West Elk Mine <strong>Mining</strong> and Reclamation Plan. CDMG File C-80-007<br />
Olson, J.S. 1958. Rates <strong>of</strong> succession and soil changes on southern Lake Michigan sand<br />
dunes. Bot. Gaz. 119: 125-170<br />
Oosting, H.J. 1942. An ecological analysis <strong>of</strong> the plant communities <strong>of</strong> Piedmont, North<br />
Carolina. Amer. Midl. Nat. 28: 1-126<br />
Rickliefs, R.E. 1973. Ecology. Chiron Press.861 p.<br />
Savage and Savage, Inc. 1994. Grassy Creek Reclaimed Area Quantitative Vegetation<br />
Study (1994), Final Bond Release, Meadows No. 1 Mine, Milner, Colorado<br />
Savage and Savage, Inc. 1994a.1994 Vegetation Monitoring: Coors Energy Company,<br />
Keenesburg Mine, Keenesburg, Colorado<br />
Savage and Savage, Inc. 1995. 1995 Vegetation Monitoring: Coors Energy Company,<br />
Keenesburg Mine, Keenesburg, Colorado<br />
Savage and Savage, Inc. 1995a. 1995 Dry Meadow Reference Area Vegetation<br />
Monitoring, West Elk Mine, Somerset, Colorado<br />
Savage and Savage, Inc. 1996. Grassy Creek Reclaimed Area Quantitative Vegetation<br />
Study (1995), Final Bond Release, Meadows No. 1 Mine, Milner, Colorado<br />
Savage and Savage, Inc. 1996a. 1996 Quantitative Vegetation Study, Phase II Bond<br />
Release: Coors Energy Company, Keenesburg Mine, Keenesburg, Colorado<br />
Savage and Savage, Inc. 1996b. Historic Record Study Area Baseline Characterization<br />
(1996): Precipitation Soils, Vegetation, West Elk Mine, Somerset, Colorado<br />
Savage and Savage, Inc. 1997. 1997 Vegetation Monitoring: Coors Energy Company,<br />
Keenesburg Mine, Keenesburg, Colorado
Savage and Savage, Inc. 1997a. Historic Record Study Area, Vegetation and Precipitation<br />
Characterization (1997), West Elk Mine, Somerset, Colorado<br />
Savage and Savage, Inc. 1998. 1998 Vegetation Sampling, Blue Grama Reference Area<br />
and Reclaimed Areas, Capstan <strong>Mining</strong> Company Bacon Mine, Colorado Springs,<br />
Colorado<br />
Savage and Savage, Inc. 1998a. 1998 Vegetation Monitoring: Coors Energy Company,<br />
Keenesburg Mine, Keenesburg, Colorado<br />
Savage and Savage, Inc. 1998b. Historic Record Study Area, Vegetation and Precipitation<br />
Characterization (1998), West Elk Mine, Somerset, Colorado<br />
Savage and Savage, Inc. 1999. 1999 Vegetation Sampling, Blue Grama Reference Area<br />
and Reclaimed Areas, Capstan <strong>Mining</strong> Company Bacon Mine, Colorado Springs,<br />
Colorado<br />
Shantz, H.L. 1917. Plant succession on abandoned roads in eastern Colorado. J. Ecol. 5:<br />
19-42
2000 Billings Land Reclamation Symposium<br />
THE USE OF REFERENCE AREAS FOR BOND RELEASE OF RECLAIMED<br />
RANGELAND IN NORTH DAKOTA<br />
Guy Welch<br />
ABSTRACT<br />
The revegetation success <strong>of</strong> reclaimed rangeland in North Dakota is demonstrated by using<br />
reference area data or technical standards based on SCS (NRCS) data. This report compares<br />
production, diversity and seasonality standards <strong>of</strong> silty range sites derived from reference areas to<br />
those from NRCS data. Data from silty range site reference areas established at six North<br />
Dakota surface coal mines was used for this evaluation. It was collected over a period <strong>of</strong> two<br />
(Beulah Mine) to ten (Glenharold Mine) years during 1989 through 1998. The reference areas’<br />
mean production (1,657 lbs./acre) was less than the NRCS technical standard (1,888 lbs./acre)<br />
and significant year to year differences due to annual climatic variations were observed.<br />
Reference area diversity determined using weight data averaged one count less than the NRCS<br />
technical standard (5) while diversity determined using cover data was equal to the NRCS<br />
technical standard. The reference areas’ seasonality values tended to be significantly higher than<br />
the NRCS technical standard (14.5 %), and cover data tended to produce higher values (34.9%)<br />
than weight data (24.4%). The NRCS technical standards were developed from rangeland in<br />
excellent ecological condition while the reference areas tend to be in good range condition. Thus,<br />
the measured parameters responded as expected.<br />
Environmental Scientist, North Dakota Public Service Commission, 600 E Blvd Ave, Dept 408,<br />
Bismarck, ND 58505-0480 Telephone: (701) 328-2298 Email:<br />
msmail.gaw@oracle.psc.state.nd.us
INTRODUCTION<br />
SMCRA and North Dakota law and rules (North Dakota State Program, 1998) require that<br />
reclaimed native rangeland be established with a diverse, effective and permanent vegetative<br />
cover that is at least equal to that <strong>of</strong> lands in the surrounding area under equivalent management.<br />
Production, cover, diversity, seasonality and permanence are parameters used to demonstrate<br />
reclamation success on native grasslands in North Dakota. North Dakota revegetation guidelines<br />
allow the use <strong>of</strong> range site reference areas or technical standards derived from NRCS data to<br />
prove reclamation success. The technical standards for diversity and seasonality are developed<br />
based on composition by weight from NRCS range site descriptions for plant communities in<br />
excellent ecological condition; and individual species comprising 5 percent or more composition<br />
by weight are counted to establish the diversity standard. Diversity and seasonality standards<br />
from reference areas are developed by using either weight or cover data. Individual species<br />
comprising 5 percent or more composition by weight or 3 percent or more by relative cover are<br />
counted to establish a diversity standard from reference areas. The seasonality standard is the<br />
relative composition <strong>of</strong> all warm season species.<br />
Production and cover data from at least one reference area are required to bond release<br />
reclaimed rangeland in North Dakota. Actual production from the major pre-mine soil types is<br />
used to develop the bond release production standard. NRCS production values can be used for<br />
soils not represented by reference areas but the NRCS values must be adjusted for annual<br />
climatic variation. The ground cover standard is developed from reference areas or fixed<br />
standards. For the sites not represented by a reference area, the cover standard is 73 percent<br />
basal or 83 percent first-hit based on studies by Ries and H<strong>of</strong>mann (1984).<br />
Reference areas must represent the geology, soil, slope and vegetation <strong>of</strong> the permit area.<br />
However, it is not practical to establish reference areas for every pre-mine range site, and thus<br />
NRCS derived technical standards may be used in conjunction with reference area data to<br />
develop standards for tracts requested for bond release. Technical standards are weighted by<br />
pre-mine range site acreage to develop the bond release standards for production, cover,<br />
diversity and seasonality. The reclaimed tract must equal or exceed the standards for final bond<br />
release.<br />
The silty range site is typically the predominant pre-mine range site and, in most instances, is the<br />
range site that is expected to be the most similar to postmining conditions. Therefore, silty<br />
reference areas are used extensively to verify reclamation success. There were two objectives to<br />
this report. 1) To compare NRCS-based technical standards to those derived from the reference<br />
areas, and 2) to compare diversity and seasonality standards derived from production data to<br />
those derived from cover data.
METHODS<br />
Six mining companies submitted silty reference area monitoring data so that the standards for<br />
production, diversity and seasonality developed from each <strong>of</strong> these data sets could be compared<br />
with the technical standards based on NRCS data. Thirty-three data sets gathered from 1989<br />
through 1998 were evaluated. Five <strong>of</strong> the silty reference areas are located in the Missouri Slope<br />
Major Land Resource Area (MLRA) while one reference area, Falkirk, is located in the Coteau<br />
MLRA. The sampled silty reference areas have been <strong>of</strong>ficially approved as reference areas at<br />
each <strong>of</strong> the mines and were sampled in accordance with methods approved by the North Dakota<br />
program. Production data was typically sampled using ¼ meter square quadrant, and cover was<br />
measured using a 10-point frame. The NRCS standards for diversity and seasonality are based<br />
on species composition by weight (SCS, 1975 and 1987). The reference area standards for<br />
these parameters are based on species composition by weight as well as by cover. Table 1<br />
shows the years reference area data were collected from the silty reference areas established at<br />
the six different mines.<br />
Table 1: Years Reference Areas Sampled<br />
Reference Area<br />
Years Sampling Data Collected<br />
Location 1989 1990 1991 1992 1993 1994 1995 1996 1997 1998<br />
Center x x x x x x<br />
Coteau x x x x<br />
Falkirk x x x<br />
Glenharold x x x x x x x x x x<br />
Indian Head x x x x x x x x<br />
Beulah x x<br />
Production<br />
RESULTS AND DISCUSSION<br />
The NRCS production standards for the mines’ silty reference areas range from 1800 to 2100<br />
pounds per acre with an average value <strong>of</strong> 1888 pounds per acre. This value was calculated by<br />
weighting the NRCS production standard with the number <strong>of</strong> samples obtained at each reference<br />
area location. NRCS production values are based on silty range sites in excellent ecological<br />
condition. The reference areas tended to be in good range condition and their actual production<br />
during the 10-year period ranged from 780 to 2593 pounds per acre, averaging 1,657 pounds<br />
per acre. The 90% confidence interval estimate for the reference mean was 1,526 to 1,788<br />
pounds per acre. The reference areas’ mean yields were comparable to the NRCS standards<br />
only at the Falkirk and Beulah Mines. The comparison, however, was based on only two to<br />
three years <strong>of</strong> observations when more favorable weather conditions may have prevailed. A
comparison <strong>of</strong> mean production values from the reference areas and the NRCS technical<br />
standards is given in Table 2.<br />
Table 2: NRCS and Reference Area Production Data<br />
NRCS<br />
Reference Area Production Data<br />
Reference Area Soil Type Standard Mean Yield No. <strong>of</strong> Years Range<br />
Location<br />
Yield<br />
Sampled<br />
Center Williams 2,000 1,458 6 851 - 1,983<br />
Coteau Williams 2,000 1,625 4 1,294 - 2,324<br />
Falkirk Williams 2,100 2,150 3 1,903 - 2,593<br />
Glenharold Amor 1,800 1,672 10 1,169 - 2,049<br />
Indian Head Amor 1,800 1,463 8 780 - 2,352<br />
Beulah Amor 1,800 2,280 2 2,242 - 2,318<br />
Mean 1,888 1,657 - -<br />
Diversity<br />
Using production data, a species was counted towards diversity if it comprised at least 5% <strong>of</strong> the<br />
total production. Only native, non-noxious grass and sedge species were counted. According to<br />
the NRCS range site description data, the diversity value for a silty range site in the Missouri<br />
Slope and Coteau MLRA is 5 and 7, respectively, and averaged 5.2 (or 5) for the six mines.<br />
The NRCS derived diversity standard is based on production data measured by weight. Based<br />
on production data, the mean diversity values for the reference areas were less than NRCS<br />
diversity values, except for the Beulah Mine, and averaged 4.1 (or 4). The actual diversity values<br />
ranged from 3 to 6 with a value <strong>of</strong> 4 occurring 48 percent <strong>of</strong> the time. Table 3 compares the<br />
NRCS derived diversity standards with the reference area standards derived from production<br />
data.<br />
Table 3: Diversity based on Production Data<br />
Reference Area Production Data<br />
Reference Area NRCS Standard Mean Diversity No. <strong>of</strong> Years Range<br />
Location Diversity Value<br />
Value<br />
Sampled<br />
Center 5 4.3 6 4 - 6<br />
Coteau 5 3.5 4 3 - 4<br />
Falkirk 7 5.3 3 5 - 6<br />
Glenharold 5 3.4 10 3 - 4<br />
Indian Head 5 4.4 8 4 - 5<br />
Beulah 5 5.0 2 5 - 5<br />
Mean 5.2 4.1 - -<br />
With cover data, a species must comprise at least 3% <strong>of</strong> the relative composition to be counted<br />
towards diversity. Table 4 indicates that the mean diversity value <strong>of</strong> the silty reference areas was<br />
4.7 (or 5). The cover diversity values ranged 3 to 10 with 5 being present 39 percent <strong>of</strong> the time.<br />
The majority <strong>of</strong> the cover data was gathered using basal-hits; however, first-hits were recorded at<br />
the Falkirk and Beulah reference areas. The highest diversity values were obtained using first-hit<br />
measuring methods while the basal-derived values were lower and, generally, lower than the
NRCS derived standard. The NRCS derived standard is based on production data measured by<br />
weight.
Table 4: Diversity based on Cover Data<br />
Reference Area Cover Data<br />
Reference Area NRCS Standard Mean Diversity Value No. <strong>of</strong> Years Range<br />
Location<br />
Diversity Value<br />
Sampled<br />
Center 5 5.0 6 3 - 7<br />
Coteau 5 4.3 4 4 - 5<br />
Falkirk 7 5.0 3 5 - 5<br />
Glenharold 5 3.8 10 3 - 5<br />
Indian Head 5 4.6 8 4 - 5<br />
Beulah 5 8.5 2 7 - 10<br />
Mean 5.2 4.7 - -<br />
Seasonality<br />
A silty range site in the Missouri Slope MLRA is comprised <strong>of</strong> 15% warm season species, by<br />
weight, when the range site is in excellent ecological condition. In the Coteau MLRA the value is<br />
10%, according to NRCS range site description data. The NRCS weighted warm season<br />
composition <strong>of</strong> all the reference areas was 14.5%. The actual warm season species composition<br />
from the reference areas was 24.4% based on the production data (Table 5), and 34.9% based<br />
on cover data (Table 6). Based on production data, the seasonality values ranged from 8.5% to<br />
49.5%. Based on cover data, the seasonality values ranged from 13.6% to 69.0%. The<br />
seasonality values derived from either production or cover data far exceeded the seasonality<br />
values based on NRCS data at each mine site. Tables 5 and 6 compare the NRCS derived<br />
seasonality standards with reference area derived standards based on production and cover data.<br />
Table 5: Seasonality based on Production Data<br />
Reference Area Production Data<br />
Reference Area NRCS Standard Mean Seasonality No. <strong>of</strong> Years Range<br />
Location Seasonality Value<br />
Value<br />
Sampled<br />
Center 15 30.3 6 18.1 - 44.4<br />
Coteau 15 35.1 4 25.0 - 49.5<br />
Falkirk 10 25.8 3 14.0 - 37.0<br />
Glenharold 15 21.3 10 11.8 - 35.4<br />
Indian Head 15 14.2 8 8.5 - 21.4<br />
Beulah 15 40.3 2 39.3 - 41.3<br />
Mean 14.5 24.4 - -<br />
Table 6: Seasonality based on Cover Data<br />
Reference Area Cover Data<br />
Reference Area NRCS Standard Mean Seasonality No. <strong>of</strong> Years Range<br />
Location Seasonality Value Value<br />
Sampled<br />
Center 15 51.5 6 28.9 - 68.3<br />
Coteau 15 50.0 4 37.0 - 69.0<br />
Falkirk 10 21.6 3 15.7 - 23.0<br />
Glenharold 15 29.1 10 17.5 - 46.0<br />
Indian Head 15 26.7 8 13.6 - 44.5<br />
Beulah 15 37.3 2 33.0 - 41.6<br />
Mean 14.5 34.9 - -
SUMMARY<br />
Production, diversity and seasonality standards derived from silty reference areas were compared<br />
to technical standards derived from NRCS data. The silty reference areas production values<br />
averaged 231 pounds less than the NRCS derived estimate. Significant annual variations in<br />
production were observed which are evidently due to year to year climatic differences. In a few<br />
instances, total production nearly doubled or was reduced by 50 percent between consecutive<br />
years. Diversity determined using weight data remained relatively stable throughout the 10-year<br />
period but averaged one count less than the NRCS technical standard. Diversity based on cover<br />
data varied as much as plus or minus two counts between consecutive years but on average<br />
equaled the NRCS technical standard. Seasonality values varied considerably between years and<br />
the average value computed from production data was less than the value computed from cover<br />
data. However, the reference areas consistently averaged higher seasonality value, using either<br />
production or cover data, compared to the NRCS derived standard. This may be due to the<br />
differences in range condition between the reference areas and the NRCS range site description<br />
data. North Dakota’s program requires that the same measurement methods be used for the<br />
reclaimed land and the reference area when sampling for bond release purposes. Therefore, the<br />
differences noted between the measurement methods should not be a factor when releasing<br />
reclaimed rangeland from bond. Reference areas should be monitored annually since significant<br />
annual climatic changes can occur, and both measurement methods should be considered.<br />
Annual monitoring will allow trend analysis <strong>of</strong> the data, which may be an important consideration<br />
at the time <strong>of</strong> final bond release.<br />
ACKNOWLEDGMENTS<br />
The author thanks the environmental staff at the BNI Center Mine, Coteau Freedom Mine,<br />
Falkirk Mine, Glenharold Mine, Indian Head Mine and Knife River Beulah Mine for allowing to<br />
use their reference area monitoring data in this study.
REFERENCES<br />
North Dakota State Program. 1998. Standards for Evaluation <strong>of</strong> <strong>Revegetation</strong> Success and<br />
Recommended Procedures for Pre- and Postmining Vegetation Assessments. North<br />
Dakota Public Service Commission, Bismarck.<br />
Ries, R. E. and L. H<strong>of</strong>mann. 1984. Pasture and hayland: measures <strong>of</strong> reclamation success.<br />
Minerals and the Environment 6:85-90.<br />
Soil Conservation Service. 1987. Soil series - range yield data (Tech. Notes, Sec. VI). USDA<br />
NRCS (North Dakota State <strong>Office</strong>, Bismarck). Soil Tech. Note No. HD-4, 430-VI.<br />
Soil Conservation Service. 1975. Range Sites (Range and Native Grass Interpretations, Sec. II<br />
E). USDA NRCS (North Dakota State <strong>Office</strong>, Bismarck). Tech. Guide.
SUCCESSFUL RECLAMATION TECHNIQUES AND BOND RELEASE FOR A COAL<br />
MINE IN WYOMING<br />
Anna Krzyszowska-Waitkus, Joseph Smith, Georgia Cash 1 , and Mark Moxley 2<br />
ABSTRACT<br />
Bond release criteria and successful reclamation techniques are discussed for one <strong>of</strong> the coal mines in<br />
south-central Wyoming. This mine participated in developing the bond release criteria for 43 hectares<br />
<strong>of</strong> Category 4 land (land where coal was removed prior to May 3, 1978). The process <strong>of</strong> bond<br />
release was completed on August 13, 1999, after four rounds <strong>of</strong> technical review between the operator<br />
and the Land Quality Division (LQD) <strong>of</strong> the Wyoming Department <strong>of</strong> Environmental Quality<br />
(WYDEQ) staff. The guidance document concerning bond release criteria is still in preparation. This<br />
was one <strong>of</strong> the first cases <strong>of</strong> bond release for Category 4 coal mine land in Wyoming. The bond<br />
release evaluation was based on the analysis <strong>of</strong> grading, positive drainage, overburden suitability,<br />
depressions, topsoil, wildlife, grazing, hydrology, and vegetation. Postmining land usages for the mine<br />
are livestock grazing and wildlife habitat. The dominant vegetation type at the mine is western<br />
wheatgrass complex/sagebrush grassland growing on sandy/clay loam. Spoil piles were graded,<br />
ripped, sampled, covered with topsoil, harrowed, seeded with a cover crop or hay mulch and finally<br />
seeded with specific mine reclamation seed mixture. The cover crop included winter wheat, or barley<br />
and was applied at the rate <strong>of</strong> 46 kg ha -1 . Several seed mixtures were utilized (at the rate <strong>of</strong><br />
approximately 15 kg Pure Live Seed ha -1 ) comprised <strong>of</strong> mainly cool season perennial grasses and<br />
shrubs. Different seed mixtures were planted on different types <strong>of</strong> soil (loamy soil, sandy sites, and<br />
drainage channel bottoms). Shrub/warm season grass seed mixtures were planted at a rate <strong>of</strong> 4.6 kg<br />
ha -1 . Fertilizer was not applied and native hay mulch was applied at the rate <strong>of</strong> 4.9 tons ha -1 .<br />
Additional key words: reclamation, revegetation, bond release, coal mines.<br />
1 Anna Waitkus, Senior Analyst, Joseph Smith, Senior Analyst and Georgia Cash, District I<br />
Supervisor, Land Quality Division, Department <strong>of</strong> Environmental Quality, Cheyenne, WY 82002. 2<br />
Mark Moxley, District II Supervisor, Land Quality Division, Department <strong>of</strong> Environmental Quality,<br />
Lander, WY 82520.
Introduction<br />
Bond release criteria and reclamation practices and revegetation results are discussed for the Rosebud<br />
coal mine located in south-central Wyoming. Since the mine started operation in 1964, a few<br />
subsequent environmental laws were passed regulating mining and reclamation activities. There were no<br />
reclamation laws in effect prior to May 24, 1969 when the Wyoming Open Cut Land Reclamation Act<br />
(OCLRA) was implemented. This act established general requirements for the postmining topography,<br />
and stated that “reasonable effort must be made to encourage the revegetation <strong>of</strong> lands disturbed by<br />
mining operations” (WYDEQ, LQD, 1998 a). The Wyoming Environmental Quality Act (WEQA),<br />
adopted July 1, 1973, established more comprehensive requirements for environmental protection and<br />
mine reclamation in regards to the post-mining uses <strong>of</strong> land, surface topography, revegetation,<br />
protection <strong>of</strong> topsoil, handling wastes and management <strong>of</strong> the hydrologic system. The first Land Quality<br />
Division Rules and Regulations became effective May 25, 1975. Specific performance standards<br />
required that the postmine slopes not exceed the average <strong>of</strong> the pre-mine slopes in the area, that<br />
drainage be reestablished and that the land be restored to a condition equal or greater than the highest<br />
previous use. These regulations also required submittal <strong>of</strong> quantitative data to verify vegetation cover<br />
amounts and required the restoration <strong>of</strong> wildlife habitat. The <strong>Surface</strong> <strong>Mining</strong> Control and Reclamation<br />
Act (SMCRA) went into effect on May 3, 1978. These various acts established bond release criteria<br />
for land affected by mining activities during the specific time such land was affected. Establishment <strong>of</strong> a<br />
vegetation cover is one <strong>of</strong> the basic requirements for final bond release and revegetation results are<br />
discussed for the Rosebud mine.<br />
Mine location<br />
Rosebud Coal Sales Company (RCSC) is located in the Hanna Basin, in south-central Wyoming, 113<br />
km northwest <strong>of</strong> Laramie. The basin is characteristic <strong>of</strong> a plains-type topography ranging from 1950 m<br />
asl to 2250 m asl. The climate is semiarid with an average annual temperature <strong>of</strong> 4 o C and an average<br />
annual precipitation <strong>of</strong> 28 cm with the maximum occurring in the spring. The mining operation began at<br />
the present location in 1964. Presently, the mine is in the reclamation phase <strong>of</strong> operation. The affected<br />
area covers 1639 hectares and contained 11 pits. RCSC used a mining technique that is classified as<br />
area strip mining with overburden removed using scrapers and draglines.<br />
Bond release criteria<br />
The Wyoming Department <strong>of</strong> Environmental Quality (WYDEQ), Land Quality Division (LQD),<br />
in cooperation with industry has established five regulatory time frames or categories for assigning bond<br />
release criteria for reclaimed mined land (WYDEQ, LQD, 1998 a). A guidance document outlining the<br />
specific criteria for bond release on each <strong>of</strong> these five categories is still in preparation however, the<br />
major criteria have been established. Finalization <strong>of</strong> the bond release guidance document is a high<br />
priority for LQD and the coal industry.<br />
LQD bond release criteria<br />
The LQD approach to bond release is based primarily on the time frame when an area was<br />
initially affected and/or when coal removal was completed and which law/rule was in effect at the<br />
specific time. Five categories were established. Land, where mining operations were completed:<br />
before May 24, 1969 (date <strong>of</strong> the implementation <strong>of</strong> Wyoming Open Cut Land Reclamation Act-<br />
OCLRA) belongs to Category 1; between May 24, 1969 and June 30, 1973 (date when the Wyoming<br />
Environmental Quality Act-WEQA was adopted) belongs to Category 2; between July 1, 1973 and
May, 24, 1975 (LQD Rules and Regulations became effective) belongs to Category 3; between May<br />
25, 1975 and May 3, 1978 (date <strong>of</strong> the implementation <strong>of</strong> the <strong>Surface</strong> <strong>Mining</strong> Control and Reclamation<br />
Act-SMCRA) belongs to Category 4; and after May 3, 1978 to present belongs to Category 5.<br />
A general summary <strong>of</strong> bond release requirements for each category is provided in Table 1.<br />
Bond release requirements include: postmine topography and erosional stability verification, topsoil<br />
depth verification, release from sediment control, evaluation <strong>of</strong> the hydrologic system, overburden<br />
suitability evaluation, quantitative vegetation cover and productivity sampling, species diversity, shrub<br />
density, and minimum bond release period. All these elements are analyzed during field inspections and<br />
verified on the basis <strong>of</strong> submitted documents. The main general bond release consideration before<br />
requesting final bond release is to obtain release from the area bond (for pit backfill), release from<br />
sediment control and reclamation or rehabilitation (if ponds are to be left for the post-mining land use)<br />
<strong>of</strong> sediment ponds. Any remedial work must be completed before the areas can be released from the<br />
bond. Water quality and quantity <strong>of</strong> approved postmining impoundments must follow the requirements<br />
included in LQD Guideline No.17 (WYDEQ, LQD, 1996).
Table 1 Bond release requirements for five categories land (WYDEQ, LQD, 1998 a).<br />
Bond release<br />
requirement<br />
Postmine<br />
topography<br />
verification<br />
Overburden<br />
suitability<br />
evaluation<br />
Verification <strong>of</strong><br />
erosional<br />
stability<br />
Topsoil depth<br />
evaluation<br />
Stability <strong>of</strong><br />
permanent<br />
impoundments<br />
Release from<br />
sediment<br />
control<br />
Quantitative<br />
vegetation<br />
sampling<br />
Minimum bond<br />
release period 2)<br />
Shrub density<br />
requirements<br />
Category<br />
1<br />
Pre-<br />
5/24/1969<br />
Pre-<br />
OCLRA<br />
Category 2<br />
5/24/1969-<br />
6/30/1973<br />
OCLRA<br />
no Minor scrutiny<br />
1)spoil peaks and<br />
ridges graded;<br />
2)documentation<br />
and results <strong>of</strong> all<br />
attempts <strong>of</strong><br />
seeding<br />
Category 3<br />
7/1/1973-<br />
5/24/1975<br />
post-EQA/pre<br />
1975 rules<br />
Category 4<br />
5/25/1975-<br />
5/3/1978<br />
post-1975<br />
rules/pre<br />
SMCRA<br />
Must conform to approved plan 1) ,<br />
but LQD will only pursue obvious<br />
inconsistencies or instability.<br />
Drainage systems must be stable<br />
and functioning<br />
no no yes<br />
no Minor scrutiny yes<br />
Category 5<br />
5/3/1978present<br />
post-<br />
SMCRA<br />
Must<br />
conform to<br />
approved<br />
plan.<br />
Drainage<br />
systems -<br />
functional<br />
and stable<br />
no no No topsoil depth verification Depth<br />
verification<br />
no no Analysis <strong>of</strong> conditions <strong>of</strong> permanent<br />
impoundments<br />
no no no - but absence <strong>of</strong> excessive<br />
sediment release must be<br />
ascertained<br />
no no no yes: for one<br />
growing<br />
season 1)<br />
yes<br />
yes: for two<br />
consecutive<br />
growing<br />
seasons 1)<br />
none none 5 years 5 years 10 years<br />
no no no no yes: goal<br />
and<br />
standard as<br />
appropriate<br />
1) at the end <strong>of</strong> the bond release period<br />
2) Time required after final seeding before this area can be inspected for potential release from bond<br />
OCLRA-Open Cut Land Reclamation Act<br />
SMCRA-<strong>Surface</strong> <strong>Mining</strong> Control and Reclamation Act/Wyoming State Program
Bond release requirements for the Rosebud mine<br />
The Land Quality Division and Rosebud Coal Sales Company have been working on the<br />
development <strong>of</strong> final bond release procedures for the Rosebud mine. The initial meetings began on<br />
March 22, 1995 and the requirements are still in preparation. In the meanwhile, the process <strong>of</strong> bond<br />
release for the Category 4 land in Pit 9 was completed on August 13, 1999, after four rounds <strong>of</strong><br />
technical review between the operator and LQD staff (RCSC, 1998/99). The Final Bond Release<br />
Requirements document was written as an agreement reached between RCSC and the WYDEQ (Final<br />
bond release..., 1995). The list <strong>of</strong> criteria, by category, comprising the final bond release package is<br />
presented in Table 2.<br />
Requirements concerning grading, positive drainage, overburden suitability, depressions, and<br />
topsoil were included in the regraded spoil packages that were approved by the LQD. The Rosebud<br />
mine voluntarily participated in the Regraded Spoil Program and documents were submitted<br />
progressively while specific pits were reclaimed. The submitted packages contained reclaimed contour<br />
maps, cross-sections, locations <strong>of</strong> spoil samples and their chemical characteristics, and a longitudinal<br />
pr<strong>of</strong>ile <strong>of</strong> major stream channels. As-built contour maps were compared to the approved reclaimed<br />
surface map in the permit document and the LQD allowed a deviation in elevation <strong>of</strong> +/- 3 meters from<br />
the approved elevations (WYDEQ, 1998 b). The land units have been backfilled to final contours,<br />
with drainage configurations restored as approved in the permit document. The various Regraded Spoil<br />
Approval Packages were referenced in the final bond release package.<br />
Restoration <strong>of</strong> wildlife habitat was evaluated through Annual Report reviews and Permit maps.<br />
<strong>Surface</strong> water hydrology was evaluated through the annual survey cross-section data on all second and<br />
third order reclaimed drainages presented in Annual Reports and through regraded spoil packages on<br />
first order drainages. Suitability <strong>of</strong> permanent impoundments for Category 4 and 5 lands are analyzed<br />
before requesting bond release. Groundwater data were referenced from the current Annual Report<br />
and this is a requirement for the Category 5 land only. Quantitative vegetation data from the reclaimed<br />
area were compared to vegetation baseline data for the appropriate vegetation type, adjusted for<br />
climatic variation using control area data.<br />
On the basis <strong>of</strong> the Final Bond Release Requirement documents, the bond was released for an<br />
area consisting <strong>of</strong> 43 hectares <strong>of</strong> Category 4 land in Pit 9. This Category includes lands where<br />
operations were completed between May 25, 1975 and May 3, 1978. The field evaluation was based<br />
on the analysis <strong>of</strong> the following criteria: grading, positive drainage, overburden suitability, depressions,<br />
topsoil, wildlife, grazing, hydrology, and vegetation (Table 2).
Table 2 Final Bond Release Requirements for land Category 4 and 5 (Rosebud mine).<br />
Requirements Category 4<br />
5/25/1975- 5/3/1978<br />
post-1975 rules/pre SMCRA<br />
Category 5<br />
5/3/1978-present<br />
post-SMCRA<br />
Grading • The design and “as-built elevations are within +/-3 meters.<br />
• Regraded area blend in with adjacent native, undisturbed lands.<br />
Positive<br />
drainage/depression<br />
Overburden<br />
suitability<br />
• 617 m 3 and larger requires permit from the State Engineer’s <strong>of</strong>fice.<br />
• Sampling in accordance with permit. Data submitted with regraded spoils<br />
packages demonstrated suitable overburden in top 1.3 meters.<br />
Topsoil • No depth verification • Depth verification<br />
Wildlife • Wildlife habitat features restored and shrubs reestablished<br />
Grazing • Land demonstrated to be able to withstand grazing at pre-mine levels.<br />
Hydrology • Review <strong>of</strong> annual surveyed cross-section data on second and higher order<br />
reclaimed drainages<br />
• Analysis <strong>of</strong> the stability and suitability <strong>of</strong> permanent impoundments for postmine<br />
land use.<br />
• Analysis <strong>of</strong> groundwater recharge<br />
capacity<br />
Vegetation • Production and cover estimated <strong>of</strong> reclaimed areas and compared with<br />
baseline.<br />
Vegetation sampling • One year <strong>of</strong> monitoring data at the<br />
end <strong>of</strong> 5 year periods <strong>of</strong> vegetation<br />
establishment.<br />
Species composition/<br />
diversity<br />
• Qualitative analysis based on a<br />
seed mixture from the approved<br />
mine permit.<br />
• Two years <strong>of</strong> monitoring data at the<br />
end <strong>of</strong> 10 year periods <strong>of</strong> vegetation<br />
establishment.<br />
• Quantitative and qualitative analysis <strong>of</strong><br />
reclaimed areas compared to baseline<br />
based on:<br />
- species and life form % cover,<br />
- relative cover,<br />
- relative frequency,<br />
- utility and number <strong>of</strong> individual species<br />
and life forms<br />
Shrub density • Not required • Goal- 1 shrub/m 2 on 10% land<br />
(3/27/1981-8/6/1996)<br />
• Standard - 1 shrub/m 2 on 20% land<br />
(post 8/6/1996)
The bond release area blended well with the adjacent native undisturbed land. The<br />
approximate original contours <strong>of</strong> the land were reestablished and elevations were within +/- 3 meters <strong>of</strong><br />
the approved post-mining topography (Table 2). Positive drainage was established and depressions<br />
617 m 3 or smaller did not require a permit from the State Engineer’s <strong>of</strong>fice. Topsoil depth verification<br />
was not needed for the Category 4 land (as well as Category 1, 2 and 3 land). However, for Category<br />
5 land, the topsoil depth needs to be verified in the field by an LQD representative. Wildlife habitat<br />
restoration was evaluated for the Category 4 and 5 lands.<br />
Grazing effects were analyzed for Category 4 and 5 lands on the basis <strong>of</strong> ability <strong>of</strong> vegetation to<br />
recovered and it was compared to such ability prior mining. This was analyzed on the basis <strong>of</strong> the<br />
vegetative production data collected during the last growing season <strong>of</strong> the bond release period for<br />
Category 4 lands or on the basis <strong>of</strong> successful implementation <strong>of</strong> an approved grazing program in<br />
conjunction with the collection <strong>of</strong> vegetation cover data. A grazing plan is required to be presented by<br />
the operator.<br />
Vegetation data were evaluated by comparison <strong>of</strong> the baseline control area data and current<br />
control area data. If the difference is 10% or more, then a climatic adjustment is needed. The<br />
Rosebud mine has chosen three control areas: shallow loamy, steep loamy, and very shallow range<br />
sites. The shallow loamy range sites comprised 76% <strong>of</strong> the total mine disturbance, the steep loamy and<br />
very shallow loamy sites each comprised 12% <strong>of</strong> the total acreage. Production and cover data from<br />
this bond release area were compared to the most productive control area, the shallow loamy site.<br />
Vegetation sampling is required for one year, at the end <strong>of</strong> a five-year period <strong>of</strong> vegetation<br />
establishment for Category 4 land, and two years at the end <strong>of</strong> a 10-year period for Category 5 land<br />
(Table 2). The other approach for Category 4 land is to establish the successful implementation <strong>of</strong> an<br />
approved grazing program. Baseline plant communities were documented on maps. Each plant<br />
community, and its control areas, was sampled for: vegetation cover by species, total cover, total<br />
ground cover, and bare ground. This was determined using line transects with a 25-meter line and 125<br />
points or “hits” per line. Annual herbaceous production was analyzed for two plots <strong>of</strong> 0.5 m 2 randomly<br />
placed along each cover transect.<br />
Shrub density requirements applies to Category 5 land only. Lands disturbed between March<br />
27, 1981 and August 6, 1996 have a shrub density goal <strong>of</strong> 1 shrub m -2 on 10% <strong>of</strong> the affected lands.<br />
Lands disturbed after August 6, 1996 have a shrub density standard <strong>of</strong> 1 shrub m -2 on 20% <strong>of</strong> the<br />
affected lands. The operator must document the effort to apply best available current technology to<br />
obtain the shrub density goal, but if the goal is not achieved no further action is required. In such case,<br />
the land should be compared to grassland not to shrub land for the bond release purpose.<br />
One <strong>of</strong> the difficulties with bond release at the Rosebud mine is the patchwork pattern <strong>of</strong><br />
various land categories and reclaimed areas. For example Pit No.9 (where 43 hectares <strong>of</strong> Category 4<br />
land was released) contained 9 reclaimed units differentiated by the time <strong>of</strong> being reclaimed, seed<br />
mixture, and topsoil depths. Within each unit, various parcels were disturbed at different times. For<br />
example one <strong>of</strong> the units contained 13 parcels that were disturbed during three different time periods.<br />
Another complication is the number <strong>of</strong> different disturbance time frames for the Rosebud mine, which<br />
differ from time frames established by LQD. This issue <strong>of</strong> tracking disturbance areas containing various<br />
categories can be complicated and can affect the reporting <strong>of</strong> acreage <strong>of</strong> disturbed areas.
The approach for evaluating bond release would be to choose a relatively homogenous area<br />
such as an entire pit area including an entire watershed. Unfortunately, such an approach is complicated<br />
by different drainage patterns, varying slopes and aspects, and different reclamation units. One way the<br />
LQD approach such obstacles was to tabulate and “bank” the reclaimed acreage by vegetation type.<br />
The 76% <strong>of</strong> reclaimed acreage was compared to shallow loamy range sites, 12% to steep loamy, and<br />
12% to very shallow range sites. These types <strong>of</strong> range sites are the same as current control areas. The<br />
percentage <strong>of</strong> the acreage <strong>of</strong> specific land categories, at the end <strong>of</strong> the bond releases process should<br />
not exceed its percentage <strong>of</strong> the reclaimed area totals. RCSC, in coming years, will apply for bond<br />
release on all <strong>of</strong> the reclaimed areas. The basic requirements for various land categories have been<br />
established but specific criteria for the Category 5 bond release is still in preparation.<br />
Reclamation practices<br />
The mine (1639 hectares) has been fully reclaimed as <strong>of</strong> October, 1999 with the exception <strong>of</strong><br />
the railroad loop. Postmining land usages for the mine are livestock grazing and wildlife habitat. A<br />
western wheatgrass complex/sagebrush grassland growing on sandy/clay loam is the dominant<br />
reclaimed vegetation unit at the Rosebud mine.<br />
Grading and topsoiling<br />
Rolling hills and irregular surfaces were established to minimize erosion, conserve soil moisture<br />
and promote a greater diversity <strong>of</strong> vegetation types. A dragline method <strong>of</strong> mining creates favorable<br />
conditions for such diverse landscape. The landscape <strong>of</strong> the reclaimed mine consists mostly <strong>of</strong> hills with<br />
slopes not exceeding a ratio <strong>of</strong> 4:1 and a network <strong>of</strong> drainages. These types <strong>of</strong> surfaces facilitate the<br />
postmine land uses <strong>of</strong> domestic livestock grazing and wildlife habitat. In addition, rockpiles were<br />
constructed in the area to improve raptor and small game habitats. RCSC made an outstanding effort<br />
to reestablish a diverse landscape, to create micro-topographic diversity including small depressions,<br />
transplanted shrub clumps, and stockponds.<br />
Spoil was recontured, sampled and analyzed to demonstrate suitability for plant growth.<br />
Suitability <strong>of</strong> spoil and topsoil are specified in Guideline No.1- Topsoil and Overburden (WYDEQ,<br />
LQD, 1994). After spoil preparation, areas were ripped on the contour, cross-ripped, and /or disced<br />
depending on the compaction to minimize erosion and slippage <strong>of</strong> the soil (RCSC, 1994). Topsoil was<br />
replaced by scrapers from stockpiles and applied at a minimum thickness <strong>of</strong> 15 centimeters. Reapplied<br />
topsoil was disced, chisel plowed or roller harrowed on the contour immediately after application to<br />
increase the roughness <strong>of</strong> the soil surface and minimize erosion. Contour ditches were installed on long<br />
slopes to prevent erosional cuts and concentrations <strong>of</strong> run<strong>of</strong>f. All second and higher order channels<br />
were constructed as stable channels for the 100 year run<strong>of</strong>f.<br />
Seeding<br />
The prepared areas were planted with a cover crop in the fall or spring and with the native<br />
mixture planted into the cover crop the following fall (RCSC, 1994). The cover crop consisted <strong>of</strong><br />
winter wheat (planted in the fall) or barley (planted in the spring) applied at the rate <strong>of</strong> 46 kg bulk ha -1 .<br />
The seeding <strong>of</strong> the cover crop was performed on the contour with flatter areas seeded perpendicular to<br />
the prevailing winds. Cover crops increase the moisture conservation, site stabilization, and are an<br />
effective trap for snow. At times instead <strong>of</strong> a cover crop, hay mulch was crimped into the soil followed
y the planting <strong>of</strong> the native seed mixture. Native hay mulch applied at the rate <strong>of</strong> 4.9 tons ha -1 was<br />
used to protect the soil surface from erosion, retard evaporation, and increase infiltration <strong>of</strong> rain and<br />
snow melt.<br />
Fall planting occurred from mid September to mid-October. The permanent seed mixture was<br />
planted on the contour with a rangeland drill. The types <strong>of</strong> seed mixture depended on the topography<br />
<strong>of</strong> the retopsoiled mine spoil, type <strong>of</strong> soil, and dates <strong>of</strong> the initial disturbance. Two seed mixtures were<br />
used due to the two main soil texture types. A third seed mixture was seeded at the bottom <strong>of</strong> drainage<br />
channels. The components <strong>of</strong> seed mixtures evolved over time. The seed mixtures did not contain<br />
warm season grass species after 1984. Cool season grass species are more adapted to the dry climate.<br />
Specially adaptable to Wyoming conditions and better able to stabilize disturbed lands are sod forming<br />
grasses. In the seed mixture applied at the Rosebud mine, 38% <strong>of</strong> the revegetation species were sodforming<br />
grasses and 62% were bunch grasses. Seed mixes were generally applied at a rate <strong>of</strong><br />
approximately 15 kg Pure Live Seed ha -1 .<br />
Establishing shrub communities<br />
Shrub communities are <strong>of</strong>ten difficult to establish on reclaimed lands. The Rosebud mine has<br />
achieved good reclamation results in reestablishing diverse shrub/ perennial grass communities. At the<br />
Rosebud mine drilling and broadcasting shrub seeds or transplanting were used. When drilling was<br />
used, the outer compartments <strong>of</strong> the seed box were partitioned <strong>of</strong>f for shrub seed placed in the two<br />
sections. This practice decreased the competition that exists when shrub seed is mixed with grass and<br />
forb seeds. Broadcasting was done by hand or by a broadcaster mounted on the rangeland drill in the<br />
case <strong>of</strong> planting very fine seeds at shallow depth. The seeding rate <strong>of</strong> broadcasting was double that <strong>of</strong><br />
the drill seeding rate. The transplanting <strong>of</strong> shrubs done by hand or by a front-end loader is quite<br />
expensive. According to mine staff, the most important point for successful transplanting was to move<br />
the plant while it was dormant, and locate it at the proper site (protected from the harsh weather and<br />
where there was moisture accumulation). Transplanting activities at the Rosebud mine were limited to<br />
older revegetated areas that lack in shrubs (RCSC, 1994). Shrub patch seed mixture contained Big<br />
sagebrush, Fourwing saltbush, Gardner saltbush, Rubber rabbitbrush, Winterfat, Blue flax, Yellow<br />
sweetclover, Bluebunch wheatgrass, Slender wheatgrass, and Western wheatgrass. Big sagebrush was<br />
broadcast seeded only. The rest <strong>of</strong> the mixture was drill seeded at the rate <strong>of</strong> 4.6 kg ha -1 or<br />
broadcasted at the rate <strong>of</strong> 9.2 kg ha -1 .<br />
Reclamation results<br />
Rosebud’s reclamation practices have resulted in the reestablishment <strong>of</strong> a diverse perennial<br />
grass/shrub vegetative cover which supports the post-mining land uses. An example is 43 hectares <strong>of</strong><br />
Category 4 land in Pit 9 that was released in 1999. This area was sampled for vegetation cover and<br />
production during the 1998 field season. For land Category 4 there are no standards for species<br />
diversity and composition, therefore the sampling results were compared with the approved seed<br />
mixture for this area.
Table 3. Cover and relative cover <strong>of</strong> various lifeforms in control and revegetated areas (LQD,<br />
1999).<br />
Lifeform Native Control Revegetated area Seed mix<br />
% cover % relative<br />
cover<br />
% cover % relative<br />
cover<br />
% by<br />
weight<br />
Perennial cool season grass 27.7 42.1 64.9 92.6 83.3<br />
Perennial warm season grass 0.4 0.6 0 0 0.4<br />
Annual grass 0 0 0.1 0.2 0<br />
Perennial forbs 3.0 4.5 2.4 3.4 0.6<br />
Annual forbs 0.1 0.1 1.1 1.5 0<br />
Full Shrubs 26.7 40.5 1.4 2.0 13.1<br />
Half Shrubs 3.7 5.7 0 0 2.2<br />
Total 61.6 69.9<br />
The cover data indicated that perennial cool season grasses dominated the area (Table 3)<br />
(LQD, 1999). Shrub establishment was more difficult although they were planted at a relatively high<br />
rate (15.3% <strong>of</strong> the total seed mixture). This thought to be caused by the competition <strong>of</strong> the perennial<br />
cool season. For Category 4 land there are no shrub density requirements.<br />
<strong>Revegetation</strong> in the bond release area met the standards for bond release described in<br />
WYDEQ, LQD (1998 b). Vegetation cover stabilized the land, was capable <strong>of</strong> self-renewal under<br />
natural conditions and was comparable to the surrounding undisturbed areas. Vegetation was capable<br />
<strong>of</strong> withstanding grazing pressure, wildlife habitat was restored and the approved post-mining land use<br />
goals were met.
References<br />
Final bond release criteria to Permit 376-T3. 1995. Temporary File Number 3 4/107.<br />
Rosebud Coal Sales Company (RCSC). Rosebud Mine. 1994. Reclamation Plan. Volume 11. Permit<br />
376-T3.<br />
Rosebud Coal Sales Co. (RCSC). Rosebud Mine. 1998/99. Bond Release Information. Full/partial<br />
volume 2 <strong>of</strong> 2. Start Aug.1999. Permit 376-T3.<br />
WYDEQ, LQD, 1994. Guideline No. 1. Topsoil and overburden. Wyoming Department <strong>of</strong><br />
Environmental Quality. Land Quality Division. pp. 40<br />
WYDEQ, LQD, 1996. Guideline No. 17. Permanent postmine impoundments. Wyoming Department<br />
<strong>of</strong> Environmental Quality. Land Quality Division. pp.18<br />
WYDEQ, LQD, 1998 a. How to Handle Bond Release on Coal Mined Lands Affected During<br />
Various Regulatory Time Frames? Wyoming Department <strong>of</strong> Environmental Quality, Land<br />
Quality Division. pp.27<br />
WYDEQ, LQD, 1998 b. Coal Rules and Regulations. Wyoming Department <strong>of</strong> Environmental Quality,<br />
Land Quality Division.<br />
Land Quality Division (LQD), 1999. July Bond Release Inspection Report, 1999. pp.8
2000 Billings Land Reclamation Symposium<br />
REVEGETATION EVALUATIONS -- HOW LONG MUST WE WAIT?<br />
R. A. Prodgers 1 , T. Keck 2 , and L. K. Holzworth 3<br />
ABSTRACT<br />
Is revegetation a “permanent” fix that will function indefinitely? Or is it merely a long-lived cover<br />
crop? When monitored for more than a decade, revegetation success becomes a time-dependent<br />
variable. This investigation focuses on how well short-term evaluations in Butte, Montana, related<br />
to midterm results. Twenty single-species plantings replicated in three treatments in a primary<br />
succession scenario were evaluated over a 15-year period. The treatments were preparatory crop<br />
(green manure), stockyard manure, and no amendment. Each stand was numerically ranked on a<br />
scale <strong>of</strong> one to ten every few years. The correlations between second-year and 15 th - year<br />
evaluations ranged from 43 to 60 percent. The correlations between sixth-year and 15 th - year<br />
evaluations were stronger in two <strong>of</strong> the three treatments, and yet the appearance <strong>of</strong> vegetation six<br />
years following planting may be an inadequate basis for prescribing treatments over large areas at<br />
great cost. By the 11 th year, correlations <strong>of</strong> ratings with year 15 were greater than 80% in two<br />
treatments, but only 66% in the remaining treatment. The number <strong>of</strong> satisfactory and unsatisfactory<br />
stands in all treatments tended to equilibrate between years 10 and 15, presumably for the life spans<br />
<strong>of</strong> successful species. Correlations were strengthened by the high number <strong>of</strong> early revegetation<br />
failures, which always remained failures. Correlations were weakened by plantings that established<br />
and persisted for several years but later declined. Since fertility and nutrient cycling are major<br />
limitations in primary succession, the highest correlations were found within the most successful<br />
treatment: stockyard-manure amendment. We believe that our findings relating short-term to<br />
midterm plant performance are relevant where plant-limiting substrates (biologically inert coversoils,<br />
contaminated soil, tailings, etc.) are being revegetated. It can take a decade for plant-limiting site<br />
factors to manifest themselves in plant performance, or for nutrient immobility to curtail primary<br />
production. Eventually, long-term trends become the dominating ones.<br />
Key words: premature revegetation evaluations, short-term and midterm plant performance, hardrock<br />
revegetation, primary succession, nutrient mobility, organic amendments, fertility.<br />
_______________<br />
1 Bighorn Environmental Sciences, 305 W. Mercury, Butte, MT 59701<br />
2 USDA Natural Resource Conservation Service, 3 Whitetail Road, Whitehall, MT, 59759.<br />
3 USDA Natural Resource Conservation Service, 10 E Babcock Rm. 443, Bozeman, MT, 59715.
It is familiar that many successions do not occur in time scales<br />
convenient for human examination... Robert McIntosh<br />
INTRODUCTION<br />
Long-term studies are rare in the ecological sciences (Michener 1997). In evaluating revegetation<br />
treatments, an ecological perspective is <strong>of</strong>ten subordinate to the pressure to declare victory or<br />
conclude investigations while funds are available. Briggs and others (1995) observed that many<br />
riparian revegetation projects have been evaluated just two or three years following project<br />
completion, leaving questions <strong>of</strong> long-term success unaddressed. Josselyn and others (1993) found<br />
that the lack <strong>of</strong> uniform, long-term monitoring and the application <strong>of</strong> knowledge gleaned from past<br />
projects to new ones was the least effective element <strong>of</strong> wetland restoration programs. The same<br />
<strong>of</strong>ten is true <strong>of</strong> upland revegetation.<br />
The test plots investigated here were seeded in 1981 and sampled throughout a 15-year period.<br />
Many <strong>of</strong> the findings from these revegetation trials apply to a particular type <strong>of</strong> substrate, climate,<br />
organic amendment, and set <strong>of</strong> species. More generally, this 15-year monitoring program showed<br />
how long it may take to evaluate accurately the effectiveness <strong>of</strong> revegetation prescriptions in a<br />
primary succession scenario. The primary questions was, to what degree are early evaluations<br />
indicative <strong>of</strong> later trends and long-term success?<br />
TEST PLOT CONDITIONS, TREATMENTS, AND LAYOUT<br />
Location<br />
The study area is located southeast <strong>of</strong> the Texas Avenue overpass near the Berkeley Pit in Butte,<br />
Montana. Butte is located at latitude 45.95, longitude 111.05. The test plots are at about 1,676 m<br />
(5,500 feet) elevation. Climate is cool and dry. Based on National Oceanic and Atmospheric<br />
Administration (NOAA) compilations, average annual precipitation between 1964-1998 was 32<br />
cm (12.8 inches). During that period, precipitation exceeded 46 cm (18") in four years, but in six<br />
years it was less than 23 cm (9"), including a series <strong>of</strong> three consecutive years. Mean annual<br />
snowfall is 145 cm (57"). Mean monthly temperature is 4 o C (39 o F), ranging from around -8 o C<br />
(17 o F) in December and January to slightly more than 16 o C (60 o F) in July and August. The<br />
frost-free season is 60 to 80 days.<br />
Substrates<br />
The test area began as a flat, coarse substrate <strong>of</strong> residual soil, not necessarily the original soil<br />
surface, covered in places with mine waste and slag. The residual soil contains significantly more<br />
clay than granitic borrow material, and hence has greater cation exchange capacity (CEC) and<br />
water-holding capacity. Concentrations <strong>of</strong> metals in the buried soil and waste rock have not been<br />
characterized, but 15 years after test plot construction, reactivity was extremely acid to strongly<br />
acid (pH = 4.5 to 5.5).
In 1979, what appeared to be mine waste in the southwest portion <strong>of</strong> the test area was leveled and<br />
covered to a depth <strong>of</strong> about 15 cm (6") inches with about 1,300 m 3 (1700 cy) <strong>of</strong> pit-run crushed<br />
limestone (minus 1/4 inch) from the quarry west <strong>of</strong> Anaconda. Portions without mine waste<br />
appeared to decomposed granite (grus). A layer <strong>of</strong> granitic alluvium 0.5 to 0.6 meters (1.6 to 2.0<br />
feet) thick was applied over the entire area, which was approximately 220 by 90 meters (two<br />
hectares, five acres).<br />
Coversoil material applied at the Texas Avenue test plot area consists <strong>of</strong> coarse, granitic alluvium<br />
from the southeast corner <strong>of</strong> the Berkeley Pit. As applied, this material was devoid <strong>of</strong> organic<br />
matter. Textures range from very gravelly, loamy coarse sand to gravelly, coarse sandy loam with<br />
an approximate range in clay content <strong>of</strong> four to eight percent. Rock fragments are predominantly<br />
pea gravel from decomposed granite (grus) with some larger angular gravel from granite and alpite.<br />
Rock fragments (>2 mm) comprise 20 to 40 percent <strong>of</strong> the coversoils material by volume. This<br />
material has characteristically low CEC and water-holding capacity. Fifteen years following<br />
application, field pH <strong>of</strong> coversoils ranged from mildly alkaline (pH = 7.4) to moderately alkaline<br />
(pH = 8.0). After drying, laboratory analysis indicated moderately alkaline pHs <strong>of</strong> 8.2-8.3.<br />
Distinctions between coversoils originating as deep borrow materials and those originating from the<br />
A or A + B horizons <strong>of</strong> stripped soils are extremely important. Coversoils from deep borrow<br />
materials contain virtually no organic matter and lack important soil organisms such as heterotroph<br />
and nitrifying bacteria, fungi, ammonifying organisms, mycorrhizal fungi, and protozoa. It is useful to<br />
think <strong>of</strong> them as “biologically inert coversoils” because nutrient quantity and mobility eventually<br />
become critical limiting factors. In addition to having humus and soil organisms, native soils in<br />
uplands around Butte have a higher clay content than granitic coversoil material and have developed<br />
distinct horizons, whereas coversoils are relatively uniform throughout.<br />
Amendments<br />
The area was divided into three treatments along east-west boundaries. Before permanent planting,<br />
all treatment areas were fertilized with 340 kg/ha (300 pounds/acre) <strong>of</strong> 16-20-0 and 113 kg/ha<br />
(100 pounds/acre) <strong>of</strong> 0-0-60. All treatment areas were chisel-plowed and harrowed several times<br />
in late October. Anaconda Minerals Company/ARCO did the site preparation work and provided<br />
some seed.<br />
The northern portion was planted to winter wheat in June 1981. This preparatory crop did not<br />
establish well, although short-term effects were evident. That summer, approximately 380 m 3 (500<br />
cy) <strong>of</strong> stockyard manure were applied to the middle segment, or about 570 m 3 /ha (300 cy/A). The<br />
depth <strong>of</strong> the poorly incorporated manure averaged two inches. The southern third received no<br />
amendment other than fertilizer. In the interest <strong>of</strong> brevity, we will refer to the treatments as no<br />
amendment (NA), preparatory crop treatment (PCT), and stockyard manure treatment (SMT).<br />
After a decade and a half, soils <strong>of</strong> the PCT and NA areas could not be distinguished based on<br />
physical or chemical characteristics. Soils <strong>of</strong> the SMT had greater organic content and fertility than
soils <strong>of</strong> the NA and PCT areas (Table 1). With the exception <strong>of</strong> alfalfa plantings, plant-available<br />
and organic nitrogen was very limited in soils <strong>of</strong> areas not treated with stockyard manure. Since<br />
partially decomposed manure fragments remained at the surface in the SMT, the two- to six-inchdepth<br />
increments best characterize the effects <strong>of</strong> manure amendment.<br />
Seedings<br />
The USDA Soil Conservation Service (SCS, now Natural Resource Conservation Service,<br />
NRCS) provided seed <strong>of</strong> 14 cultivars from the Bridger Plant Material Center and oversaw planting,<br />
which was done by the Anaconda Minerals Company using a 10-foot Brillion seeder in early<br />
November 1981. A dormant fall seeding, such as this one, aims at germination the following spring<br />
when moisture conditions are optimal. In this report, the year following planting (i.e., 1982) is<br />
considered year one.<br />
Plot layout is portrayed in Figure 1, with cultivars identified. (Cultivars won’t be mentioned again,<br />
in the interest <strong>of</strong> brevity, unless more than one cultivar <strong>of</strong> a species was seeded.) Twenty plots,<br />
each planted to an individual species, were made across the three treatments. Large test plots are<br />
approximately 12 meters wide by 30.5 meters long (40' x 100'), whereas the smaller ones are six<br />
meters wide. The smaller planting accommodated limited quantities <strong>of</strong> some types <strong>of</strong> seed. More<br />
than 15 years after planting, the crisp boundaries <strong>of</strong> successful seedings remain.<br />
Management<br />
<strong>Mining</strong> ceased in 1983 and ownership changed in 1986, so the plots were not refertilized and<br />
weeds were uncontrolled. Once seeded, the plants were on their own. This scenario is not unusual<br />
in the Butte-Anaconda area and is a practical test <strong>of</strong> revegetation<br />
treatments.<br />
SAMPLE AND STATISTICAL METHODS<br />
Plant performance was sampled in two ways. SCS personnel provided stand ratings in years 1, 2,<br />
3,4,5,6,7, and 11. Various attributes were ranked. The most useful for evaluating revegetation<br />
success was “stand ratings.” Each stand was numerically ranked on a scale <strong>of</strong> one to ten. In this<br />
report, these rankings were used for statistics and further combined to distinguish satisfactory,<br />
moderately satisfactory, and unsatisfactory stands.<br />
In year 15, each planting/treatment was evaluated for species canopy coverage (Daubenmire 1959)<br />
with ten 0.5 m 2 rectangular plots. Plots were systematically located at least three meters from<br />
boundaries. The chief advantage <strong>of</strong> this ocular estimation technique is that it provides species<br />
composition information with minimal sampling. The frame perimeter was marked to indicate<br />
reference area percentages, e.g., one percent, five percent, 10 percent, etc.
Table 1. Nitrates and Organic Matter in Manured and Nonmanured Coversoils at Texas<br />
Avenue Test Plots, 15 Years Following Fertilization. (Based on samples from four grass<br />
and one alfalfa seedings.)<br />
DEPTH INCREMENT MANURED NONMANURED<br />
(INCHES) NO 3 (Mg/Kg)<br />
0-2 30.0 2.6<br />
2-6 2.5 0.6<br />
6-12 0.6 0.5<br />
ORGANIC MATTER (%)<br />
0-2 6.9 0.6<br />
2-6 1.1 0.1<br />
6-12 0.2 0.1<br />
For this report, the quantitative cover data collected in year 15 were transposed to rank level,<br />
complementing data collected in earlier years. The Kruskal-Wallis (nonparametric) one-way<br />
analysis <strong>of</strong> variance was used to determine significant differences in rankings among years.<br />
Significant differences were defined based on p
In the SMT and NA areas, the correlation between second- and 15 th -year stand ratings began in<br />
the 40 to 60 percent range. Ratings in year six were somewhat better correlated with year 15<br />
(Table 3). By year 11, correlations with year 15 were greater than 80 percent. In the PCT area,<br />
the correlation <strong>of</strong> second- and 15 th -year stand ratings was similar, but instead <strong>of</strong> strengthening, the<br />
correlation <strong>of</strong> sixth- and 15 th -year ratings weakened. This can be explained by a great increase in<br />
the number <strong>of</strong> satisfactory ratings in the sixth year, but in later years the number <strong>of</strong> satisfactory<br />
ratings declined to initial levels (Table 2). The correlation between years 11 and 15 also was<br />
weaker than in the other treatments (Table 3), although the number <strong>of</strong> satisfactory treatments<br />
remained constant (Table 2). Summing up, the older the stands, the more ratings approach<br />
equilibrium. But even after 10 years, a risk <strong>of</strong> premature evaluation remains.<br />
No Amendment. Establishment and early plant growth <strong>of</strong> nonweedy species were best in the NA<br />
area. In year two, 11 species/cultivars were rated good to excellent. The best were Ladak alfalfa<br />
and Russian Wildrye.<br />
Fifteen years later, spotted knapweed was the dominant species across the NA area. Among<br />
planted species only alfalfa could be called a success apart from volunteers. Canopy coverage <strong>of</strong><br />
the two alfalfa varieties averaged 41 percent, with only two percent knapweed cover. However,<br />
the Rambler alfalfa stand contained 34 percent cheatgrass, whereas Ladak alfalfa had only about<br />
five percent. Alfalfa had spread to adjacent planting areas, where it helped Russian wildrye,<br />
presumably by providing available nitrogen. The beneficial role <strong>of</strong> alfalfa and previously identified<br />
volunteer legumes in accelerating primary succession is obvious.<br />
Rank correlations (Table 3) indicate that stands less than about 10 years old were poor indicators<br />
<strong>of</strong> later stand condition. Rankings in year two did not differ significantly from year six. Year six<br />
ratings also didn’t differ from year 15. Rankings in the 11th year did not differ from year 15, but<br />
were dissimilar from years one and six.<br />
Table 2. Stand Condition in Relation to Years Since Planting. (n = 20 plots/treatment.)<br />
---------------------------------------------------------------------------------------------------------<br />
NO PREP. CROP MANURE<br />
AMENDMENT TREATMENT TREATMENT<br />
SPECIES ----------------------------------YEAR--------------------------------------<br />
RATINGS 2 6 11 15 2 6 11 15 2 6 11 15<br />
--------------------------------------------------------------------------------------------------------------<br />
SATISFACTORY 11 9 2 2 2 7 2 2 2 8 3 3<br />
MOD. SATISFACTORY 4 4 3 3 5 4 0 0 5 5 7 4<br />
UNSATISFACTORY 5 7 15 15 13 9 18 18 13 7 10 13<br />
-------------------------------------------------------------------------------------------------------------
Table 3. Spearman Rank Correlations.<br />
--------------------------------------------------------------------------------------------------------------------<br />
NO PREP. CROP MANURE<br />
YEAR AMENDMENT TREATMENT TREATMENT<br />
-------------------------------------------------------------------------------------------------------------------<br />
----------------------------------------%--------------------------------------------<br />
2 vs. 15 43 49 60<br />
6 vs. 15 50 32 71<br />
11 vs. 15 81 66 84<br />
-------------------------------------------------------------------------------------------------------------------<br />
Preparatory Crop Treatment. Ultimately the PCT area came to resemble the NA area, but in<br />
the early years differences were significant. Whereas three-quarters <strong>of</strong> the plantings<br />
in the NA area were initially successful to some degree, fewer than half were satisfactory in the<br />
PCT. Most successful were big bluegrass and Ladak alfalfa. By year six, the PCT had 11<br />
satisfactory and moderately satisfactory plantings (Table 2), still lower than other treatments but a<br />
marked improvement from year two.<br />
After 15 years, the area initially planted with winter wheat had the poorest overall plant<br />
performance. Levels <strong>of</strong> cheatgrass and knapweed were the same as in the NA area. Only alfalfa<br />
could be judged a success, but both alfalfa cultivars did better in the NA area.<br />
Although the PCT seemed to have negative effects on plant performance in both the short- and<br />
long-term, it is extremely unlikely that a preparatory crop was harmful. Soil/substrate factors may<br />
have varied across the test area, and for reasons not obvious alfalfa did not spread in the PCT area.<br />
Also, volunteer legumes were not as abundant as in the NA area. Reduced abundance <strong>of</strong> soilnitrifying<br />
symbionts probably impaired the performance <strong>of</strong> other species within the NA area.<br />
Because contagious distributions <strong>of</strong>ten are phenomena in themselves, we cannot conclude that the<br />
relative lack <strong>of</strong> volunteer legumes was caused by the PCT, and in fact more legumes have<br />
volunteered since completion <strong>of</strong> this study..<br />
Rank correlations (Table 3) indicate that early stand ratings were mediocre predictions <strong>of</strong> long-term<br />
plant performance. Sixth-year rankings were particularly poor predictors <strong>of</strong> plant performance in<br />
year 15. Rankings in years two and six did not differ significantly, nor did rankings in years 11 and<br />
15. The relation <strong>of</strong> ranking in years 11 and 15 was weaker than in other treatments.<br />
Stockyard Manure Treatment. After 15 years, total live plant cover was almost double that <strong>of</strong><br />
other treatments. The yield advantage <strong>of</strong> rather heavy manure amendment can remain 40 years<br />
after treatment (Heady 1952). The manured amendment resulted in the most satisfactory perennial<br />
grass performance but also the most weeds. Knapweed cover was double, and cheatgrass cover<br />
triple the amounts found in NA and PCT areas.
All the grasses performed better on the more fertile, physically enhanced soils. The following<br />
grasses, most <strong>of</strong> which did poorly on other treatments, were at least marginally satisfactory in the<br />
SMT: thickspike wheatgrass (which also volunteered into the Ladak alfalfa planting), bluebunch<br />
wheatgrass, slender wheatgrass, quackgrass and Kentucky bluegrass (both volunteers), basin<br />
wildrye (two cultivars), and Russian wildrye. Of these, Russian wildrye and basin wildrye were the<br />
standout successes, both in abundance and in demonstrated ability to exclude weeds.<br />
The early appearance <strong>of</strong> the SMT area, however, was not promising. Two years after planting,<br />
almost every stand in the SMT was rated very poor to fair. Weeds were abundant, and only big<br />
bluegrass and streambank wheatgrass established stands that were judged good in year two. Of<br />
the ultimately successful grasses, basin wildrye was rated fair, and Russian wildrye was rated a little<br />
below that. However, vigor <strong>of</strong> plants established at that time was better than in nonmanured<br />
treatments. None <strong>of</strong> the legumes did as well in the SMT as in the NA area. Typically, nitrogen<br />
additions reduce nodule weight and density (Alexander 1991, Chapter 19).<br />
Rank correlations between years six and 15 were better than in other treatments (Table 3),<br />
probably because soil fertility wasn’t so limiting in the manured treatment. By year 11, rankings<br />
were well correlated with plant performance in the 15 th year. Correlations between years were<br />
stronger in all cases, and there were no significant differences among mean ranks in any years.<br />
DISCUSSION<br />
Most revegetation failures at Texas Avenue and on the Butte Hill can be attributed to the<br />
interactions <strong>of</strong> five factors:<br />
1. Droughty, infertile, and shallow soils,<br />
2. Lack <strong>of</strong> adequate N and nitrogen cycling,<br />
3. Species/cultivars unsuited to their environment,<br />
4. Elevated metal concentrations in coversoils, and<br />
5. Weed infestations.<br />
Some combination <strong>of</strong> these limiting factors typify much <strong>of</strong> the revegetation being done in the Butte-<br />
Anaconda area and at hard rock mines elsewhere.<br />
The observations reported here indicate that plant performance a half-dozen years after planting<br />
can be a poor basis for predicting how well seedings will ultimately perform. Even on in situ soils,<br />
revegetated plant communities are in a state <strong>of</strong> flux for at least three years following establishment.<br />
Not only can composition shift significantly, but productivity <strong>of</strong>ten exceeds sustainable levels.<br />
Ziemkiewicz and Takyi (1990) found that revegetation in cold regions <strong>of</strong>ten appears successful for<br />
several years, only to deteriorate as surface cover diminishes and erosion occurs, largely as a result<br />
<strong>of</strong> nutrient immobilization.
In revegetating barren substrates, single plantings may not be realistic approaches to enduring plant<br />
communities. The lack <strong>of</strong> available nitrogen and the tendency for nutrient immobilization are so<br />
limiting that a combination <strong>of</strong> good organic amendment and nitrogen fixation are the quickest routes<br />
to a substrate that can support enough plants to prevent accelerated erosion. What would<br />
otherwise take centuries, including the development <strong>of</strong> nutrient reservoirs in the organic fraction and<br />
a functioning soil food web, can in important respects be compressed into a few decades. At that<br />
time, slower-growing species requiring lower soil fertility are most appropriate and in many cases<br />
should be planted.<br />
If a single seed mix is planted, one has to ask what will happen when the initial generation <strong>of</strong> plants<br />
dies. The longevity <strong>of</strong> plants relative to pr<strong>of</strong>essional careers is a major limitation to successional<br />
studies. Woody plants are long-lived, but even individual bunchgrasses may persist for three<br />
decades (Houston 1982, Appendix 6, figure 6.15.), and the life spans <strong>of</strong> genets are indeterminate.<br />
When successions occur, will they be the more or less natural successions <strong>of</strong> natives or the<br />
unnatural successions <strong>of</strong> exotics? Rarely is this investigated.<br />
CONCLUSION<br />
Our evaluations over a 15-year period show that plant performance rankings six years following<br />
seeding may have only a 50 percent correlation with plant performance nine years later. About<br />
two-thirds <strong>of</strong> the plantings across all treatment were rated as satisfactory in year six, but most <strong>of</strong><br />
them ended up dominated by knapweed and assorted other weeds. Hence, we conclude that the<br />
appearance <strong>of</strong> vegetation six years following planting may be an inadequate basis for prescribing<br />
treatments over large areas at great cost.<br />
In this study, correlations were bolstered by plantings that quickly failed and remained failures.<br />
Correlations would be even lower if long shots such as prairie clover, Indian ricegrass, and<br />
fourwing saltbush has been replaced with more likely prospects.<br />
Enhanced revegetation success on the manured treatment in conjunction with the satisfactory<br />
performance <strong>of</strong> alfalfa alone on the NA and PCT treatments after 15 years indicates how important<br />
it is to provide plant-available nitrogen in a substrate lacking a nitrogen reservoir. With nitrogen<br />
fixation comes productivity, and with productivity comes niches for decomposer soil organisms<br />
which also are agents <strong>of</strong> soil aggregation. Primary succession is largely a matter <strong>of</strong> soil<br />
development, largely through autogenic processes, in which the site becomes suitable for different<br />
species or plant communities. In this progression (as it is <strong>of</strong>ten conceived), competitive species<br />
generally replace stress-tolerant species and ruderals (sensu Grime 1979). The fact that the<br />
manured treatment had twice the plant cover <strong>of</strong> other treatments and the only fully satisfactory<br />
stands <strong>of</strong> grass also indicates the need for an organic nutrient pool and soil food web.<br />
Where important limiting conditions are present, treatment evaluations must focus not just on shortterm<br />
performance, but also on how the treatment addresses each limiting factor. <strong>Revegetation</strong><br />
success is a time-dependent variable. Eventually, long-term trends become the dominating ones.
We believe that our findings relating short-term to midterm plant performance have relevance<br />
beyond the particulars <strong>of</strong> these test plots. They are applicable when revegetating plant-limiting<br />
substrates (primary succession, contaminated soil, tailings, etc.) but not topsoil with an accumulation<br />
<strong>of</strong> organic matter and a healthy pool <strong>of</strong> soil microorganisms.<br />
REFERENCES<br />
Alexander, M. 1991. Introduction to Soil Microbiology. Second ed. Krieger Pub. Co., Malabar,<br />
FL. 467 pp.<br />
Briggs, M., Roundy, B., and W. Shaw. 1995. Trial and error. Restoration and Management<br />
Notes 12: 160-166.<br />
Daubenmire, R. 1959. A canopy-coverage method <strong>of</strong> vegetational analysis. Northwest Sci.<br />
33(1): 43-64.<br />
Grime, J. 1979. Plant Strategies and Vegetation Processes. Wiley, N.Y.<br />
Heady, H. 1952. Reseeding, fertilizing, and renovating an ungrazed mixed prairie. J. Range Mgt.<br />
5:144-149.<br />
Houston, D. 1982. The Northern Yellowstone Elk: Ecology and Management. Macmillan Pub.<br />
Co., NY. 474 pp.<br />
Josselyn, M., Chamberlain, S., Goodnight, K., Hopkins, H., and A. Fiorillo. 1993. Evaluation <strong>of</strong><br />
coastal conservancy enhancement projects, 1978-1992. San Francisco State Univ., Tiburon, Ca.<br />
McIntosh, R. 1980. The relationship between succession and the recovery process in ecosystems.<br />
pp. 11-62 In: J. Cains (ed.) The recovery process in damaged ecosystems. Ann Arbor Sci. Pub.<br />
167 pp.<br />
Michener, W. 1997. Quantitatively evaluating restoration experiments: research design, statistical<br />
analysis, and data management considerations. Ecol. Restoration 5(4):324-337.<br />
Ziemkiewicz, P., and S. Takyi. 1990. Organic matter dynamics on reclaimed coal mines in the<br />
Canadian Rockies. pp. 127-133 In: Proc. <strong>of</strong> the 1990 <strong>Mining</strong> and Reclamation Conference and<br />
Exhibition, Vol. I. Charleston, W. Va. 319 pp.
CULLED FINDINGS<br />
In some cases, the course <strong>of</strong> plant succession following the death <strong>of</strong> planted dominants is likely to<br />
be affected more by the status <strong>of</strong> the soil and propagule influx than the species composition <strong>of</strong> initial<br />
revegetation.<br />
The success <strong>of</strong> Trifolium pratense and T. repens, volunteers in the NT and to a lesser extent the<br />
PCT area, is potentially one <strong>of</strong> the most useful developments at the Texas Avenue test plots. With 6<br />
percent canopy coverage across all plantings, these species ranked third in abundance behind<br />
knapweed and alfalfa. Since sampling in 1997, clover coverage appears to have increased in both<br />
nonmanured treatments, and Melilotus <strong>of</strong>ficinalis and Medicago lupulina are locally wellrepresented<br />
some years. Not only can legumes can be recommended for planting on coarse, infertile<br />
soils in a cold continental climate, they well may invade without assistance. Their demonstrated ability<br />
to reproduce gives them special status among the successful species. Where planted species are<br />
fairly dense and plant competition is keen, especially for soil moisture, they perform less well. In<br />
other words, they’re pioneers.<br />
It was Daubenmire’s conviction (1968, p. 39) that the presence/abundance <strong>of</strong> each species reveals<br />
something about the plants’ environment -- whether or not we can discern it. At the test plots, some<br />
weeds were associated with infertile substrates, others with more fertile, organic-rich soils, and the<br />
most pernicious weed around Butte (spotted knapweed) is well-suited to both substrates. The NT<br />
and PCT areas invited these colonizers: Phacelia hastata, Chaenactis douglasii, and Achillea<br />
millefolium. Common weeds were Gypsophila paniculata (Table 4) and Linaria dalmatica, the<br />
latter <strong>of</strong>ten a weed <strong>of</strong> rocky substrates. These species were rare on the manure treatment in 1996.<br />
Cheatgrass did much better on the SMT. Elsewhere it was found in abundance only in conjunction<br />
with the taprooted, late developing alfalfa, which also made nitrate much more available in the soil.<br />
Quackgrass was virtually absent from other treatments, but volunteered on the manure substrate.<br />
Kentucky bluegrass is another species that prospered on more fertile soils. While never abundant,<br />
dandelions were found only on the manure treatment.<br />
Spotted knapweed was the most abundant species on all treatments. Cover was approximately 15<br />
percent on infertile substrates and twice that on the SMT. In the terminology <strong>of</strong> Grime (1979) but<br />
perhaps defying his classification, this biennial could be classed a “stress-tolerant, competitive<br />
ruderal” – a most successful combination.<br />
We conclude by cautioning that faulty revegetation assessments are likely to occur based on<br />
premature evaluation. Once important decisions have been implemented, there is a tendency for all<br />
parties to declare victory and decamp. Failures boost no one’s career, and there are powerful<br />
incentives for both regulators and responsible parties to boast success when both have shared<br />
responsibility for design and implementation <strong>of</strong> reclamation plans.<br />
Based on our research at Butte, grass/forb stands that exhibit progressive decline within five or six<br />
years are good candidates for ultimate revegetation failure -- not that they can’t play important roles<br />
in revegetation when temporal factors are considered in fashioning revegetation prescriptions. In<br />
contrast, the apparently satisfactory condition <strong>of</strong> stands even after more than five years may<br />
unreliably indicate eventual success. Stands rated good or excellent after 10 years are likely to persist
for the life spans <strong>of</strong> the dominant species. However, reproduction is a separate issue -- and one<br />
seldom monitored. It is possible that the best revegetation at Butte is no more than a persistent<br />
preparatory crop. Whether further vegetational development will lead to semi-natural vegetation or<br />
fields <strong>of</strong> exotic weeds remains unknown.<br />
CITATIONS<br />
Josselyn, M., Chamberlain, S., Goodnight, K., Hopkins, H., and A. Fiorillo. 1993. Evaluation <strong>of</strong><br />
coastal conservancy enhancement projects, 1978-1992. San Francisco State Univ., Tiburon, Ca.<br />
Munshower, F. 1994. Practical handbook <strong>of</strong> disturbed land revegetation. Lewis Pub, CRC Press,<br />
Boca Raton, FL. 265 pp.<br />
Ryerson, D., and J. Taylor. 1974. Rangeland fertilization in Montana - a literature review. pp. 1-19<br />
IN: Proc. Range Fertilization Symposium, Havre, MT. July. Mt. Ag. Expt. Sta. Res. Rep. 70. Pages<br />
not consecutively numbered.
2000 Billings Land Reclamation Symposium<br />
STATUS OF LAND CAPABILITY BASED PIPELINE RECLAMATION<br />
ASSESSMENT IN ALBERTA<br />
A.W. Fedkenheuer<br />
ABSTRACT<br />
Pipelines in Alberta, Canada, require a reclamation certificate be issued for them by the<br />
Alberta government upon abandonment in order for the operator to no longer be liable for<br />
further reclamation on the right-<strong>of</strong>-way. The only current exception may be for lines that<br />
are "plowed-in". For a reclamation certificate to be issued the right-<strong>of</strong>-way must be deemed<br />
to have land capability equivalent to that which existed prior to the area being disturbed for<br />
the pipeline. This requires a judgement by Alberta Environment personnel. Much<br />
discussion has taken place over time on the issue <strong>of</strong> what should be assessed and how it<br />
should be assessed. This paper discusses the work <strong>of</strong> a group <strong>of</strong> oil and gas industry and<br />
government personnel, along with non-oil and gas members, to develop an acceptable<br />
system for assessing the reclamation status <strong>of</strong> a pipeline right-<strong>of</strong>-way. The process and<br />
technical portions <strong>of</strong> the work, as well as the current status <strong>of</strong> the work is presented.<br />
________________________<br />
ALCLA Native Plant Restoration Inc., 3208 Bearspaw Drive N.W., Calgary, Alberta<br />
T2L 1T2
INTRODUCTION<br />
Concern about the environmental impacts from construction <strong>of</strong> pipelines has brought<br />
legislation governing their construction, operation and decommissioning even though most<br />
people are not aware <strong>of</strong> the presence <strong>of</strong> pipelines. They are generally buried and rarely are<br />
seen as the soil over them continues to support pre-disturbance activities such as agriculture,<br />
forestry and wildlife habitat.<br />
Within Alberta there was no legislated requirement for the reclamation <strong>of</strong> disturbed lands<br />
prior to 1963 when the <strong>Surface</strong> Reclamation Act was proclaimed (Brocke 1988). Ten years<br />
later, in 1973, the Land <strong>Surface</strong> Conservation and Reclamation Act was proclaimed. This<br />
new Act required that environmental protection and reclamation be part <strong>of</strong> the development<br />
planning (Landsburg and Fedkenheuer 1990). A review and approval system that included<br />
Environmental Impact Assessments and Development and Reclamation Approvals was<br />
subsequently implemented. Regulatory changes were made in 1983 and again in 1993 with<br />
the passage <strong>of</strong> the Alberta “Environmental Protection and Enhancement Act” (Alberta<br />
Environmental Protection 1994).<br />
The 1993 legislation contained a requirement to return land disturbed by pipeline<br />
construction to an equivalent land capability at the time <strong>of</strong> abandonment. Equivalent land<br />
capability is currently defined as, “The ability <strong>of</strong> the land to support various land uses after<br />
reclamation is similar to the ability that existed prior to any activity being conducted on the<br />
land, but that the individual land uses will not necessarily be identical” (Powter 1998).<br />
The requirement to have equivalent land capability at the time <strong>of</strong> application for a<br />
reclamation certificate brought the need to be able to measure equivalent land capability.<br />
Some documentation is required to enable the regulator to acknowledge that the area is<br />
suitably reclaimed and to release the proponent from further reclamation liability, as well as<br />
to assure the public that a suitable reclamation job has been done. This documentation has<br />
been difficult to obtain agreement on and it has been the subject <strong>of</strong> much discussion since<br />
the mid-1980s. The definition <strong>of</strong> reclamation success and how to measure it was the topic <strong>of</strong><br />
a workshop in 1992 (Mahnic and Toogood 1992). Following the workshop, focus shifted to<br />
oil and gas wellsite reclamation criteria development for several years where a parameter<br />
based checklist was developed and used. For these areas, specific individual parameters are<br />
compared on and <strong>of</strong>f the wellsite and each must pass or the site fails.<br />
There has been a desire by some to utilize this system for pipelines as well. Others have<br />
suggested using a capability rating system such as has been used in agriculture for many<br />
years. It is recognized that some modifications may be required to either system if they are<br />
to be applied to pipelines. In 1996, NOVA Gas Transmission Ltd. (NGTL) <strong>of</strong>fered to take<br />
the lead in working to develop a land capability rating system to demonstrate what it might<br />
contain and how it might work for pipeline reclamation assessment. This paper addresses<br />
the approach, the results, and the current status <strong>of</strong> the approach.
PROCESS<br />
In 1995, as interest in reclamation standards for pipelines again began to increase, several<br />
joint government-industry working groups were established. In mid-1996, a version <strong>of</strong> the<br />
wellsite reclamation criteria was modified and tabled for consideration as pipeline<br />
reclamation criteria. The wellsite criteria are basically a parameter-by-parameter pass or fail<br />
system.<br />
To deal with the issue <strong>of</strong> developing a capability-based assessment <strong>of</strong> pipeline reclamation,<br />
a varied group <strong>of</strong> people were required around the table. A group <strong>of</strong> people consisting <strong>of</strong><br />
representatives from government regulatory bodies, industry and also some independent<br />
experts, were invited to participate. The group was formally named the NGTL External<br />
Soils Advisory Board.<br />
As NGTL initiated the Board, it subsequently provided much <strong>of</strong> the administrative support<br />
as well as the Chair (A.W. Fedkenheuer) and Assistant chair (J.D. Burke). A key<br />
component <strong>of</strong> this board were members that were not directly involved in oil and gas from<br />
an industry or government regulatory perspective. They brought both a practical and<br />
scientific perspective to the Board, as well as considerable experience.<br />
The Board’s primary short-term objective was to develop a pipeline reclamation evaluation<br />
tool. There was much discussion as to when this tool would be applied, either at postconstruction<br />
or upon abandonment <strong>of</strong> the pipeline or at both times. It was agreed that the<br />
Board would focus on abandonment criteria which would be applied at the end <strong>of</strong> the life <strong>of</strong><br />
a pipeline. In this way, the operator would know, in the planning stages <strong>of</strong> construction,<br />
what would be measured at the end. This would encourage good planning <strong>of</strong> soils handling<br />
and other environmental issues during construction in order to minimize the cost over the<br />
life <strong>of</strong> the pipeline.<br />
Important components <strong>of</strong> the reclamation evaluation tool as identified by the Board were:<br />
• scientific validity,<br />
• identification <strong>of</strong> important environmental parameters,<br />
• clear description <strong>of</strong> how to measure those environmental parameters,<br />
• relatively easy usage,<br />
• cost-effectiveness, and<br />
• provision <strong>of</strong> reproducible results.<br />
It was also a desire that time not be spent initially building new systems but to evaluate<br />
systems and processes already available. In the end, it was decided that a visual assessment<br />
as well as several others, one with a more detailed level than the visual, but not requiring<br />
laboratory analyses, and another allowing for laboratory analyses needed to be developed.<br />
As well, the Land Suitability Rating System (Agronomic Interpretations Working Group<br />
1995) and a version <strong>of</strong> the wellsite reclamation criteria system (Wellsite Criteria Working<br />
Group 1995) were tested. Along with these systems, a landowner reclamation evaluation<br />
form was also developed.
Following agreement on the systems to use, the Board retained three senior consultants to<br />
take the systems to the field and evaluate their field performance. This was done in October<br />
and November, 1997. The consultants were sent to three central areas <strong>of</strong> the province and<br />
asked to employ the systems on five pipeline segments, chosen by representatives <strong>of</strong> the<br />
Board, in each area. The consultants were not to be on the same site at the same time, nor<br />
were they to discuss their findings with each other until after their reports had been<br />
submitted to the Board. One day was spent in the field by the Board and each consultant was<br />
visited at a different pipeline location. Subsequent to the receipt <strong>of</strong> the reports, three<br />
members <strong>of</strong> the Board undertook to summarize the consultant reports into one summary<br />
report.<br />
The Board took the results <strong>of</strong> the 1997 field evaluation and the consultant recommendations<br />
and revised the evaluation tool into a three-step process for a re-test in the field season <strong>of</strong><br />
1998. One step was a landowner reclamation evaluation form that reflects the parameters<br />
being assessed by consultants. The other two steps were done by consultants. During<br />
Phase 1, factors under landscape (drainage, coarse fragments and micro-topography),<br />
vegetation (plant growth and species composition) and soil (color, texture and surface<br />
structure) must be met in order for the site to pass. If the area fails the Phase 1 portion,<br />
assessment must continue under a Phase 2 evaluation consisting <strong>of</strong> a more detailed soils<br />
assessment only.<br />
The 1998 field study covered a range <strong>of</strong> ecological conditions in Alberta. This included<br />
approximately five pipeline sites in the dry Prairies, salt-affected and clayey soils in the<br />
Aspen Parkland region, the southern Boreal Forest, and the foothills Montane. All areas<br />
included both cultivation and grazing land uses.<br />
RESULTS<br />
Accomplishments <strong>of</strong> the Board consist <strong>of</strong>: development <strong>of</strong> Board objectives, an evaluation<br />
tool framework, tool parameters, an evaluation process, completion <strong>of</strong> a field evaluation<br />
study in 1997 and 1998, comparison <strong>of</strong> seven systems initially in 1997, comparison <strong>of</strong><br />
selected modified systems in 1998, development <strong>of</strong> a summary report for each <strong>of</strong> the 1997<br />
and 1998 field studies, completion <strong>of</strong> landowner reclamation evaluations and completion <strong>of</strong><br />
two manuals describing the systems and how to use them (NGTL External Advisory Board<br />
1999a, b).<br />
General results from the 1997 field study comparing the on-right-<strong>of</strong>-way areas to the <strong>of</strong>fright-<strong>of</strong>-way<br />
were:<br />
• Agreement on pass/fail results among the three consultants who visited the same sites<br />
was about 45 percent in all <strong>of</strong> the reclamation evaluation systems tested in 1997, except<br />
for the Visual system where there was about 90 percent agreement,<br />
• Across the 18 quarter sections (65 ha, 160 ac) in the study, the average topsoil depth was<br />
16 cm (+/- 8 cm) both on and <strong>of</strong>f the pipeline right-<strong>of</strong>-way. Topsoil depth recordings by<br />
the consultants reflected this natural variability as one consultant reported finding 10 to<br />
26 cm <strong>of</strong> topsoil, another reported finding 10 to 19 cm and the third consultant reported<br />
12 to 26 cm. These readings were all for the same 65 ha and were done by qualified
soils pr<strong>of</strong>essionals. This is a reflection <strong>of</strong> the natural variability across an agricultural<br />
field,<br />
• Topsoil thickness alone is a poor indicator <strong>of</strong> reclamation success. Systems that relied<br />
heavily on topsoil depth as a measure <strong>of</strong> reclamation success had failure rates <strong>of</strong> greater<br />
than 40 percent based on topsoil depth by itself, while removing the topsoil depth<br />
parameter resulted in failure rates <strong>of</strong> about 15 percent,<br />
• Using the visual parameters caught about 73 percent <strong>of</strong> 183 right-<strong>of</strong>-way transect<br />
failures. This means many <strong>of</strong> the failures were apparent to the evaluator before<br />
subsurface parameters were evaluated.<br />
In response to the results from the 1997 field test, a general field protocol was developed<br />
along with a Phase 1 and 2 pipeline reclamation assessment process (NGTL External<br />
Advisory Board, 1999b). In addition, a process was developed for obtaining the<br />
landowner's assessment <strong>of</strong> the reclamation on his property (NGTL External Advisory Board<br />
1999a).<br />
The field protocol covers field procedure issues such as developing map units, how to<br />
handle small problems or spot units, selection <strong>of</strong> controls, transect location, minimum size<br />
area to evaluate, how to deal with variability, what is equivalent land capability, how to deal<br />
with the topsoil issue (land capability depends on more than just topsoil thickness) and what<br />
to do with special circumstances where an over-ride may be desirable. Also discussed is<br />
how to determine whether a transect and a pipeline segment, should pass or fail.<br />
Recommendations are included for what pre-field preparation should be undertaken as well<br />
as for field procedures and how to approach the final assessment and reporting.<br />
The Phase 1 level includes detail and guidance regarding each <strong>of</strong> the components,<br />
Landscape, Soils and Vegetation. The factors evaluated in the Landscape component are<br />
surface drainage, coarse fragments (number <strong>of</strong> stones, wood fragments, amount <strong>of</strong> gravel)<br />
and micro-topography. Factors to be evaluated in surface Soil are soil color (estimate <strong>of</strong> soil<br />
organic matter content), surface aggregate size and strength (evaluation <strong>of</strong> compaction, soil<br />
admixing) and soil texture. Vegetation factors in Phase 1 are plant growth (plant density,<br />
cover, height, health) and species composition (focus on unsuitable species including<br />
weeds).<br />
Phase 2 is intended to be implemented on those transects or pipeline segments that fail Phase<br />
1. In Phase 2 the emphasis is on the soils component as no landscape or vegetation<br />
evaluation is done in this phase. Both mineral and organic soil are addressed in the primary<br />
areas <strong>of</strong> water supplying ability, various surface and subsurface factors, and internal<br />
drainage. This phase is based on a modification <strong>of</strong> the Land Suitability Rating System put<br />
forth by the Agronomic Interpretations Working Group (1995).<br />
The landowner evaluation is targeted to evaluate similar factors to those in the Phase 1.<br />
Specific parameters are: surface drainage/ponding, stoniness, surface roughness, topsoil<br />
color, surface clods, tilth, plant cover or density, crop yield, crop growth, plant species and<br />
weeds. The landowner is also asked for an overall assessment <strong>of</strong> the right-<strong>of</strong>-way on his
land with respect to whether it is similar to the <strong>of</strong>f-right-<strong>of</strong>-way or at least 20 percent better<br />
or worse.<br />
In the 1998 field study, pipeline segments were evaluated in 32 quarter sections (65 ha, 160<br />
ac) by each <strong>of</strong> three consultant companies in August and September by applying both Phase<br />
1 and Phase 2 to all areas. Results <strong>of</strong> the study were:<br />
• On 44% <strong>of</strong> the line segments all three consultants agreed whether the area passed or<br />
failed the Phase 1. Of the remaining areas, in 34% <strong>of</strong> the cases two <strong>of</strong> three consultants<br />
passed them and in the remaining 22%, two <strong>of</strong> three consultants failed them,<br />
• In 66% <strong>of</strong> the Phase 2 assessments all three consultants agreed (all were passes), <strong>of</strong> the<br />
remaining line segments 28% were rated as passes by two <strong>of</strong> three consultants and 6%<br />
were rated as fails,<br />
• There were no cases where an area passing Phase 1 was failed under the Phase 2<br />
assessment. This implies this part <strong>of</strong> the system works as designed,<br />
In the landowner input part <strong>of</strong> this process, the following results were obtained:<br />
• In the 1998 study, 94% <strong>of</strong> the 31 landowners contacted responded, with some<br />
encouragement, by filling out the forms evaluating reclamation success as they saw it for<br />
the study pipelines on their land,<br />
• 72% <strong>of</strong> the line segments were rated as passes by the landowners,<br />
• The landowner evaluation and the Phase 1 rating by all three consultants agreed on 72%<br />
<strong>of</strong> the line segments (15 pass and 6 fail ratings, respectively),<br />
• On three line segments (10%) the landowners rated the area as pass and the Phase 1<br />
ratings by all these consultants was a fail.<br />
Following revisions to the reclamation evaluation tool in 1999, the manuals (NGTL External<br />
Advisory Board 1999a,b) were forwarded to the Alberta Pipeline Environmental Steering<br />
Committee (APESC). They subsequently forwarded them to Alberta Environment for<br />
circulation to approximately 200 organizations and individuals for review and comment<br />
prior to releasing them for a widespread trial in the year 2000.<br />
In summary:<br />
SUMMARY<br />
• The general concept <strong>of</strong> a land capability based, relatively rapid Phase 1 “screening”<br />
assessment and an “as required” more detailed Phase 2 soil evaluation is workable and<br />
appears to address the proper concerns and issues,<br />
• The weaknesses identified thus far in the process are manageable,<br />
• Landowners are willing to participate, there is generally good agreement between the<br />
landowner and consultant ratings, and the landowner evaluation form can be a useful<br />
first evaluation <strong>of</strong> pipeline reclamation,<br />
• orientation (training) sessions are expected to increase the level <strong>of</strong> agreement among<br />
evaluators,
• The Phase I evaluation tool should include Landscape (drainage, coarse fragments and<br />
micro-topography), Soil (color, surface aggregate size and strength), and Vegetation<br />
(plant growth and species composition) parameters, and<br />
• The process is ready for a broad-based trial in summer, 2000, and a subsequent revision,<br />
if necessary in fall.<br />
• Alberta Environment, with the support <strong>of</strong> the Alberta Pipeline Environmental Steering<br />
Committee (APESC), has sent both manuals out to various organizations and individuals<br />
for review.<br />
ACKNOWLEDGEMENTS<br />
Appreciation is extended to all members <strong>of</strong> the NGTL External Soils Advisory Board for<br />
their commitment <strong>of</strong> time and energy to this project.<br />
Financial support for the project was provided by TransCanada Transmission (formerly<br />
NOVA Gas Transmission Ltd.), the Canadian Association <strong>of</strong> Petroleum Producers (CAPP)<br />
and Alberta Environment.<br />
REFERENCES<br />
Agronomic Interpretations Working Group. 1995. Land suitability rating system for<br />
agricultural crops: 1. Spring-seeded small grains. W.W. Pettapiece (ed.). Tech. Bull.<br />
1995-6E. Center for Land and Biological Resources Research, Agriculture and Agri-<br />
Food Canada, Ottawa. 90 p. 2 maps.<br />
Alberta Environmental Protection. 1994. Guide for pipelines pursuant to the Environmental<br />
Protection and Enhancement Act and Regulations. Alberta Environmental Protection,<br />
Land Reclamation Division. Edmonton, Alberta.<br />
Brocke, L. 1988. Alberta legislation as it relates to soil reclamation and energy extraction.<br />
In: Energy Extraction: Concerns and Issues Related to Soil Reclamation. Partial<br />
Proceedings <strong>of</strong> the 34 th Annual CSSS/AIC Meeting. University <strong>of</strong> Calgary, Calgary,<br />
Alberta. pp. 1-7.<br />
Landsburg, S. and Fedkenheuer, A.W. 1990. Pipeline construction in NOVA’s Alberta Gas<br />
Transmission Division. In: Proceedings <strong>of</strong> Planning, Rehabilitation and Treatment <strong>of</strong><br />
Disturbed Lands Billings Symposium. Billings, Montana. March 25-30, 1990.<br />
Reclamation Research Unit Publication No. 9002, Montana State University,<br />
Bozeman. Vol. II, 9 pp.<br />
Mahnic, R.J. and J.A. Toogood, J.A. 1992. Proceedings <strong>of</strong> the Industry/Government<br />
Pipeline Success Measurement Workshop. Alberta Land Conservation and<br />
Reclamation Council Report No. RRTAC 92-3. ISBN 0-7732-0886-0. 75 pp.<br />
Mutrie, D.F. and Gilmore, K.B. 1995. Pipelining in Canada and the U.S.: an<br />
environmental comparison. In: Proceedings <strong>of</strong> the 5 th International Symposium on
Environmental Concerns in Rights-<strong>of</strong>-Way Management, Montreal, Quebec, Sept. 19-<br />
22, 1993.<br />
NGTL External Advisory Board. 1999. Alberta landowner pipeline reclamation assessment<br />
manual. A.W. Fedkenheuer (ed.). TransCanada Transmission, Calgary, Alberta. 8 p.<br />
NGTL External Advisory Board. 1999. Alberta pipeline reclamation assessment manual.<br />
A.W. Fedkenheuer and W.W. Pettapiece (eds.). TransCanada Transmission, Calgary,<br />
Alberta. 126 p.<br />
Powter, C.B. (compiler). 1998. Glossary <strong>of</strong> reclamation terms used in Alberta. (5 th ed.).<br />
Alberta Conservation and Reclamation Management Group Report No. RRTAC OF-<br />
1A. Alberta Conservation and Reclamation Management Group, Alberta<br />
Environmental Protection. Edmonton, Alberta.<br />
Wellsite Criteria Working Group. 1995. Reclamation criteria for wellsites and associated<br />
facilities. Alberta Environmental Protection, Land Reclamation Division, Edmonton.
2000 Billings Land Reclamation Symposium<br />
HOW NORTH DAKOTA MINE RECLAMATION STANDS IN TIME<br />
David Bickel 1<br />
ABSTRACT<br />
The long-term fitness <strong>of</strong> reclaimed environments can be evaluated by comparing the brief<br />
time interval in which successful reclamation has been achieved under SMCRA with<br />
long-term climatic patterns. Short-term records <strong>of</strong> groundwater aquifers, surface water<br />
bodies, county annual crop production, temperature and precipitation at or near surface<br />
mines in west central North Dakota are compared with longer-term climatic records.<br />
Directly measured weather records exist only since the late 19 th Century. Tree ring<br />
chronologies and drought indices reconstructed from them extend back to the 17 th<br />
Century and are available for the Northern Plains. Drought indices generally show<br />
stronger relationships with mining related variables than do precipitation or temperature<br />
alone, because indices include these variables and memory <strong>of</strong> duration as inputs.<br />
Reclamation over the past 20 years has occurred concurrently with a severe drought<br />
period in the late 1980’s, followed by a notable wet period in the 1990’s. Spectral<br />
analysis <strong>of</strong> the PDSI record indicates that the 20 years <strong>of</strong> modern reclamation have<br />
probably included high frequency events in the regional climate. Although not extremes<br />
in the paleoclimatic record, annual scale weather events were <strong>of</strong> above normal duration<br />
and intensity during the period from 1979 through 1998, and were sufficient to test the<br />
resilience <strong>of</strong> reclaimed systems to climatic variations characteristic <strong>of</strong> the Northern Plains<br />
over the past 300 years.<br />
_______________<br />
1 Environmental Scientist, Reclamation Division, North Dakota Public Service<br />
Commission, State Capitol Building, Bismarck, ND 58505. Telephone (701)328-<br />
2249. E-mail edb@oracle.psc.state.nd.us
INTRODUCTION<br />
North Dakota enacted its first surface coal mining reclamation law in 1969, which<br />
became more stringent with each biannual legislative session until interim federal<br />
regulation based on the <strong>Surface</strong> <strong>Mining</strong> Control and Reclamation Act <strong>of</strong> 1977 (SMCRA)<br />
came in force in 1978. North Dakota law based on SMCRA and U.S. <strong>Office</strong> <strong>of</strong> <strong>Surface</strong><br />
<strong>Mining</strong> Regulation and Enforcement (<strong>OSM</strong>) permanent program regulations became<br />
effective on August 1, 1980. In the formative years <strong>of</strong> surface mine regulation in the<br />
1970’s, successful reclamation <strong>of</strong> mined land to fully productive agricultural use was<br />
largely unproved, and the permanence <strong>of</strong> stability and productivity on reclaimed lands<br />
over long periods <strong>of</strong> time was commonly questioned. Mined lands successfully<br />
reclaimed under SMCRA are now common, and fundamental questions are seldom raised<br />
about their long term fitness over a scale <strong>of</strong> hundreds or even thousands <strong>of</strong> years or the<br />
suitability <strong>of</strong> the regulatory framework that shaped them.<br />
Departures from present land uses driven by changes in population demographics and<br />
technology cannot be predicted nor can long-term changes in climate. However, the<br />
long-term fitness <strong>of</strong> reclaimed environments can be evaluated somewhat by comparing<br />
the brief time interval in which successful reclamation has been achieved under SMCRA<br />
with historic climatic patterns on the Northern Great Plains. This approach assumes that<br />
similar patterns will reoccur in the future albeit modulated by natural millennial scale<br />
changes or human interventions. Along with evaluating the climatic extremes that may<br />
face successfully reclaimed areas in the future, comparison <strong>of</strong> the SMCRA time frame<br />
with longer climatic records lets us consider the fitness <strong>of</strong> our regulatory requirements<br />
and expectations for accommodating the potential range <strong>of</strong> long-term climatic variation.<br />
This report compares short-term records <strong>of</strong> groundwater aquifers, surface water bodies<br />
and vegetation production at or near surface mines with long term climatic records. Data<br />
specific to west central North Dakota includes about 50 years <strong>of</strong> records from US<br />
Weather Service stations in Beulah, Center and Underwood, ND. The longest records<br />
include Palmer Drought Indices calculated for the region from weather station records<br />
extending back to 1895 and proxy values reconstructed to 1691 from tree ring<br />
chronologies as described by Cook, et al. (1996). Other tree ring chronologies not<br />
reconstructed into proxy climate data and lake sediment records from eastern North<br />
Dakota were also available but not used. Environmental records from mines or mining<br />
areas spanning all or most <strong>of</strong> the last 20 years are less common but include NDPDES<br />
water discharges from mines, vegetation production on mine reference areas, average<br />
annual county crop production records, and monitoring well head levels.<br />
The climate <strong>of</strong> western North Dakota is cool, semiarid and continental with hot periods in<br />
summer months having maximum temperatures above 95�F and more frequent cold<br />
waves in winter with minimum temperatures below -20�F. The average annual<br />
precipitation at Beulah, ND is about 16 inches with most falling as thundershowers in<br />
spring and summer. Winter snow cover is generally light but variable and provided by<br />
periodic snowstorms. Late winter and early spring warm periods typically produce rapid<br />
melting <strong>of</strong> accumulated snow. Since evapotranspiration and plant use typically exceeds
late spring and summer rainfall contributions, retention and infiltration <strong>of</strong> snowmelt water<br />
is a significant source <strong>of</strong> recharge for the hydrologic regime.<br />
Woodhouse and Overpeck (1998) review the several air masses that influence Great<br />
Plains precipitation climatology. Dry westerly Pacific circulation, cold and dry arctic air<br />
and warm, moist tropical flow from the south interact seasonally to produce typical<br />
Northern Plains weather as well as extreme events and patterns <strong>of</strong> varying frequency.<br />
Drought on the Great Plains appears controlled by anticyclonic circulation over the<br />
region which is sustained by anticyclones over the eastern central Pacific and Atlantic<br />
Oceans which block Gulf <strong>of</strong> Mexico moisture from reaching the Great Plains. The<br />
Bermuda high when positioned normally directs moist Gulf air moving around it into the<br />
central United States. When the high is northeast <strong>of</strong> its normal position, moist air flows<br />
into the eastern United States. Sea surface temperatures in the Equatorial Pacific and the<br />
El Niño-Southern Oscillation (ENSO) seem to influence summer precipitation on the<br />
Northern Great Plains. Relationships between western US low frequency weather<br />
patterns and the approximate 20-year solar-lunar cycle have been found in enough proxy<br />
climatic records for it to be considered a climatic factor in the western US. However, a<br />
physical link between solar-lunar cycles and the atmospheric circulation controlling<br />
climate in the western US has not been demonstrated. The causes <strong>of</strong> persistent multi-year<br />
to century scale weather patterns are poorly understood.<br />
MATERIALS AND METHODS<br />
Data in this analysis came from two sources, monitoring reports and bond release<br />
applications submitted by mining companies to fulfill regulatory requirements <strong>of</strong> mine<br />
permitting and from NOAA and USDA Internet sites which distribute environmental<br />
data. All environmental data submitted to meet regulatory requirements are publicly<br />
available, but commonly not in digital format at present. Some typical data sets are listed<br />
in Table 1.<br />
Direct meterologic and hydrologic measurements can be manipulated and combined to<br />
characterize or monitor weather events more accurately than the records <strong>of</strong> individual<br />
environmental variables. Climatic indices <strong>of</strong> varying complexity are used worldwide<br />
(Hayes, 1999) but all have strengths and limitations suited to certain uses and regional<br />
climates. The Palmer Drought Severity Index (PDSI) is widely used in the USA and<br />
Canada and seems best suited to regions with relatively uniform topography. Extensive<br />
background information and data sets for the Palmer indices are available from several<br />
sources on the Internet.<br />
The PDSI uses evapotranspiration, soil moisture gain, run<strong>of</strong>f, soil moisture loss and<br />
precipitation along with the previous month’s PDSI value in a recursive calculation to get<br />
a value for the current period. This calculation also includes a moisture balance term that<br />
is dependent upon a month falling within or transitioning from a wet or dry period.<br />
Values are calculated simultaneously each month for each <strong>of</strong> these three possible states,<br />
and the value ultimately used is determined by conditions in subsequent months defining<br />
a wet or dry spell. This strong feedback mechanism more accurately portrays climatic
eality by lessening the impact <strong>of</strong> a short reversal amid an established wet or dry period.<br />
Palmer (1965) and Guttman (1991) give details on computation <strong>of</strong> the PDSI. The multimonth<br />
delays in getting a final PDSI value led to use <strong>of</strong> a modification, termed the<br />
Palmer Hydrologic Drought Index (PHDI), that avoids the PDSI’s backtracking to define<br />
transitions between wet and dry spells and provides immediate availability <strong>of</strong> a final<br />
value. The two indices are identical during an established wet or dry period and differ<br />
only during transitions between wet and dry spells. Correlation <strong>of</strong> both indices with<br />
mining-related variables early in this investigation confirmed that the PDSI generally<br />
provided correlations equal to the PHDI.<br />
Daily climatic data from U.S. Weather Service stations are generally available for sites<br />
close to North Dakota mines for about the last 50 years. Longer daily weather records<br />
are available for a few stations in the state. Longer directly measured records extend into<br />
the latter decades <strong>of</strong> the 19 th Century but are fewer and less continuous. Proxy climate<br />
data are records obtained from measurement <strong>of</strong> a natural process that is controlled by<br />
climate and has made a permanent record <strong>of</strong> climatic effects that can cover periods <strong>of</strong><br />
time for which direct measurements are not available. Tree rings provide reconstructed<br />
proxy records <strong>of</strong> climatic variability over an annual scale. Temperature, precipitation and<br />
climatic indices can be reconstructed by correlating tree ring properties with instrument<br />
data from overlapping time intervals, and the derived regression relationships are used to<br />
reconstruct climatic records from tree ring data spanning earlier time intervals.<br />
The drought indices data sets used here were obtained from two Internet sites. Monthly<br />
PDSI, PHDI, temperature and precipitation from U.S. Weather Service records were<br />
obtained from the NOAA National Climatic Data Center Web site at<br />
www.ncdc.noaa.gov/ onlineprod/drought/ftppage.html. These data were for North<br />
Dakota regional climatic Division 4 which includes the west-central region where mines<br />
and counties considered in this report are located. Annual PDSI values from U.S.<br />
Weather Service data and reconstructed from tree ring data for Grid Point 65 in westcentral<br />
North Dakota by Cook, et al. (1996) were obtained from the NOAA<br />
Paleoclimatology Program Web site at www.ngdc.noaa.gov/paleo/usclient2.html. The<br />
instrument based PDSI data in this set were updated from 1995 through 1998 using the<br />
average <strong>of</strong> June through August PDSI values for North Dakota Division 4 to approximate<br />
the methods <strong>of</strong> Cook, et al. (1996). The reconstructions selected tree ring chronologies<br />
that showed strong responses to drought to develop the nation-wide 155-point grid <strong>of</strong><br />
proxy data. The reconstruction at Grid Point 65 included tree ring records from<br />
Minnesota, South Dakota and Montana. A few tree ring chronologies are available in the<br />
International Tree Ring Data Bank (http://tree.ltrr. arizona.edu/~grissino/ itrdb.htm) for<br />
sites closer to the coal mining areas <strong>of</strong> North Dakota. However, these sites were not<br />
checked for suitability as proxy climatic records for this investigation, and Sieg, et al.<br />
(1996) note possible limitations to deriving reliable long climatic records from these bur<br />
oak chronologies.<br />
Characteristic time series records <strong>of</strong> vegetation and water resources at or in the vicinity <strong>of</strong><br />
operating surface mines and spanning all or most <strong>of</strong> the last 20 years were first correlated<br />
with regional temperature, precipitation and the PDSI. Sufficient pairs <strong>of</strong> data were
Table 1<br />
Examples <strong>of</strong> correlation <strong>of</strong> mine-related vegetation production and hydrologic variables<br />
with temperature, precipitation and the PDSI.
compared to show the relationship <strong>of</strong> climate variables to mine related phenomena over the time<br />
interval <strong>of</strong> SMCRA-based mine reclamation. The regional PDSI data for Grid Point 65<br />
was selected as the best climatic indicator for providing a long and well-documented<br />
record for this investigation. A hybrid data set was used with instrument records<br />
extending back through 1895 and reconstructed values covering the period from 1691 to<br />
1894 (Figure 1). The 20 years from 1979 through 1998 were considered the span fully<br />
influenced by modern mine regulation, and this subset was then correlated year by year<br />
with each 20-year interval from 1691 to 1978. The lengths <strong>of</strong> runs <strong>of</strong> positive or negative<br />
PDSI values were evaluated as a measure <strong>of</strong> wet and dry spells. Patterns <strong>of</strong> intensity<br />
were examined through the occurrence <strong>of</strong> severe wet or dry years which are generally<br />
defined as having PDSI values at or more extreme than +3 or –3. Spectral analyses were<br />
made <strong>of</strong> the PDSI and results <strong>of</strong> the year-wise correlation to identify major cycles for<br />
comparison with the 20 years <strong>of</strong> modern reclamation. Algorithms in Micros<strong>of</strong>t Excel 97<br />
and Statgraphics Plus Version 3.1 were used for data analysis.<br />
PDSI<br />
6<br />
4<br />
2<br />
0<br />
-2<br />
-4<br />
-6<br />
Figure 1<br />
West-central North Dakota PDSI 1691-1998 and Spectral Model<br />
Linear Trend Removed (slope = -.0029x)<br />
PDSI detrended<br />
Spectral Model<br />
1691<br />
1702<br />
1713<br />
1724<br />
1735<br />
1746<br />
1757<br />
1768<br />
1779<br />
1790<br />
1801<br />
1812<br />
1823<br />
1834<br />
1845<br />
1856<br />
1867<br />
1878<br />
1889<br />
1900<br />
1911<br />
1922<br />
1933<br />
1944<br />
1955<br />
1966<br />
1977<br />
1988<br />
Year
RESULTS<br />
The PDSI correlated as well as or better than regional temperature and precipitation<br />
records with various mine-related water resources and vegetation production data (Table<br />
1). It was assumed that local weather data would generally correlate better with local<br />
mine variables than would regional averages or indices. However, the PDSI provided<br />
better correlations with static water levels in shallow monitoring wells at Falkirk Mine<br />
than precipitation totals at nearby Underwood, ND. It correlated poorly with the<br />
hydrograph from a deeper monitoring well, Well 92-1, which is completed in the lower <strong>of</strong><br />
two lignites mined at Falkirk Mine. It correlated better with NDPDES discharges and<br />
estimated county production <strong>of</strong> wheat and hay than did regional precipitation. Regional<br />
precipitation had slightly stronger but comparable correlation with reference area<br />
production data from Glenharold Mine. The PDSI appeared to be the best available<br />
variable representatiing the regional climatic conditions influencing water and vegetation<br />
resources related to mine reclamation in west-central North Dakota.<br />
Year-wise correlation <strong>of</strong> the PDSI record for 1979 through 1998 with the record from<br />
1691 through 1978 found 14 closely matching intervals with correlation coefficients <strong>of</strong><br />
0.40-0.78 among the total number <strong>of</strong> positively correlated intervals (Table 2). In 7 <strong>of</strong> the<br />
matches, 2 or 3 successive years showed positive correlation in this range and these were<br />
considered one match. A time plot <strong>of</strong> all correlation values showed about 22 cycles over<br />
the 288-year record that could be modeled with a 12.8-year cycle (Figure 2). To confirm<br />
these results, time series plots for the two intervals were visually correlated on a light<br />
table as an independent exercise. The manual correlation found 8 20-year intervals in the<br />
period 1691-1978 that showed close correlation with 1979-98. Comparison <strong>of</strong> starting<br />
dates <strong>of</strong> matches from the two methods (Table 2) shows reasonable agreement allowing<br />
for some differences in interpretation <strong>of</strong> fit. The correlation coefficient appeared to<br />
identify matching patterns effectively, but produced comparable correlation coefficients<br />
for a few intervals that lacked consistent match over the entire 20-year period. The<br />
correlation coefficient generated low positive values (highest 0.297) over a late 1930’s<br />
interval that matched well visually, and the visual correlation method seemed to be overly<br />
discriminating and possibly biased toward strong agreement in amplitude. The climatic<br />
pattern in the west-central North Dakota PDSI from 1979 to 1998 has occurred multiple<br />
times in the reconstructed regional PDSI.<br />
The pattern in the lengths <strong>of</strong> wet and dry intervals is the distinguishing characteristic <strong>of</strong><br />
the years 1979-98 in west-central North Dakota. The first 9 years <strong>of</strong> the period were<br />
alternating 2-year wet and dry spells through 1987. These are followed by 5 dry years, 4<br />
wet years and by 2 dry years in 1997-98. The PDSI record from 1691 to 1998 has 177<br />
wet and 131 dry years distributed in 104 alternating wet and dry spells <strong>of</strong> 1 to 13 years in<br />
length (Figure 2). The 5-year dry spell from 1988-92 ranked as 5 th longest in the record<br />
and above the 75 th percentile with the longest dry period being the 12 years from 1929 to<br />
1940. The 4-year wet period from 1993-1996 ranked 15 th longest and at the 75 th<br />
percentile with the longest wet spell running 13 years from 1770 to 1782. The lengths <strong>of</strong><br />
periods had a slight linear trend <strong>of</strong> decreasing period duration (slope <strong>of</strong> –0.01x) and<br />
seemed to show a transition to shorter climatic periods occurring near the beginning <strong>of</strong>
the last quarter <strong>of</strong> the 19 th Century. Wet and dry spells 5 years or longer in length are<br />
listed in Table 2. With exception <strong>of</strong> the 1929-40 drought, the latter part <strong>of</strong> the 19 th and<br />
most <strong>of</strong> the 20 th Century appeared characterized by more frequent changes between wet<br />
and dry conditions than occurred prior to the 1880’s. The periodic pattern in the length<br />
<strong>of</strong> spells seemed to agree with measured and reconstructed event frequency patterns<br />
reported for the ENSO by Michaelsen (1989).<br />
Correlation (.40-.78)<br />
<strong>of</strong> 1979-98 with 20year<br />
intervals<br />
beginning:<br />
1709<br />
1723<br />
1746<br />
1763<br />
1772<br />
1789<br />
1807<br />
1836<br />
1854<br />
1862<br />
1880<br />
1924<br />
1948<br />
1961<br />
Table 2<br />
Years <strong>of</strong> events in the West-central North Dakota climatic record<br />
Visual Curve<br />
Matching: 1979-<br />
98 with 20-yr.<br />
intervals<br />
beginning:<br />
1711<br />
1750<br />
1775<br />
1808<br />
1865<br />
1883<br />
1935<br />
1952<br />
Periods <strong>of</strong> 5 or more<br />
Wet Years<br />
1691-95<br />
1723-30<br />
1750-55<br />
1770-82<br />
1786-90<br />
1802-07<br />
1810-14<br />
1825-35<br />
1849-54<br />
1876-80<br />
1904-09<br />
1920-24<br />
1941-45<br />
1962-66<br />
Periods <strong>of</strong> 5 or more Dry<br />
Years<br />
1704-08<br />
1815-20<br />
1859-66<br />
1869-75<br />
1929-40<br />
1988-92<br />
Severe Wet Years Severe Dry Years<br />
1726-29, 33, 37-38, 40<br />
1754<br />
1767, 1775, 77-78<br />
1787<br />
1828-30, 32-33<br />
1851<br />
1877-79<br />
1895-97<br />
1902, 07, 09, 16<br />
1927-28<br />
1942-43<br />
1953<br />
1972, 75, 78<br />
1983<br />
1993<br />
1718<br />
1817, 23<br />
1865<br />
1934, 36-37<br />
1961<br />
1988, 91<br />
With severe drought or wet conditions defined as PDSI values at or more extreme than<br />
3.0 or –3.0, 1691 to 1998 had 40 wet years and 10 dry years that represented severe to<br />
extreme conditions (Table 2). The 1979-98 period had two severe wet years, 1983 and<br />
1993, and two severe dry years, 1988 and 1991. Throughout the record, severe wet and<br />
dry years occurred during multi-year periods <strong>of</strong> corresponding wet or drought with the<br />
exception <strong>of</strong> 1975 which was a single-year severe wet period. Events related to wet<br />
conditions rather than drought have characterized climatic history in the region for the<br />
past 300 years. Over the preceding 308 years in west-central North Dakota, there have
een more wet than dry spells spanning 5 or more years, and there have been 4 times as<br />
many severe wet years as dry years.<br />
Periodicity in climatic records and their relationship to known and hypothesized forcing<br />
mechanisms is extensively documented. Cook et al. (1997) investigated drought rhythms<br />
in the western United States using the grid network <strong>of</strong> 115 regional PDSI reconstructions<br />
that includes the grid point 65 data set used here. They counted the number <strong>of</strong> points<br />
each year with a PDSI less than –0.1 as a drought index and found significant spectral<br />
peaks in the data at 20-23, 7.8, 4.1 and 2.5 years. Cursory spectral analysis <strong>of</strong> the grid<br />
point 65 data set in the present investigation found proximate fits for the 20-23, 7.8 and<br />
4.1-year periods observed by Cook, et al. (1997) in the larger western US data set.<br />
Periodogram evaluation and fitting <strong>of</strong> a spectral model (Figure 1) after removal <strong>of</strong> a slight<br />
linear trend (R 2 =0.31) found significant periods <strong>of</strong> 4.1, 7.5, 8.3, 9.3, 12.8, 19, 22, 23 and<br />
61.6 years in the data set. A 20-year moving average over the data showed 5 cycles that<br />
were estimated adequately (R 2 =0.58) with 58 and 72-year periods. Correlation<br />
coefficients from year-wise correlation <strong>of</strong> the 1979-98 interval across the data set were<br />
fitted with the 12.8 and 9.3-year periods (R 2 = 0.30). The 8.3 to 12.8 year periods suggest<br />
the 11-year sunspot cycle which Cook, et al. (1997) did not find in their investigation. A<br />
low frequency period at 58 to 62 years may be comparable to similar periods Michaelsen<br />
(1989) found in ENSO data.<br />
Length (Yrs.)<br />
14<br />
12<br />
10<br />
8<br />
6<br />
4<br />
2<br />
0<br />
1691<br />
1709<br />
1720<br />
1732<br />
1743<br />
1758<br />
1766<br />
Figure 2<br />
Length <strong>of</strong> Wet and Dry Periods<br />
Linear Trend = -0.01x + 3.4841<br />
1786<br />
1795<br />
1802<br />
1821<br />
1837<br />
1849<br />
1867<br />
1882<br />
Year Period Begins<br />
1888<br />
1894<br />
1901<br />
1912<br />
1920<br />
1941<br />
1950<br />
1957<br />
1969<br />
1978<br />
1986
DISCUSSION<br />
The PDSI has several advantages over other climatic variables for comparing the past 20<br />
years with the climatic history <strong>of</strong> western North Dakota. The index is widely used, well<br />
documented and high quality proxy data sets are publicly available. Data correlate well<br />
with time series records <strong>of</strong> plant growth and water resources related to mine reclamation,<br />
and the structure <strong>of</strong> the index makes evaluation <strong>of</strong> the intensity and duration <strong>of</strong> climatic<br />
events relatively easy.<br />
Comparisons <strong>of</strong> paleoclimate with annual scale mine-related events become less<br />
meaningful further back in time, because there are few high-resolution proxy climatic<br />
data for the western U.S. before the 17 th Century. High quality tree ring chronologies<br />
from long-lived tree species are uncommon and records from even less common banded<br />
fluvial, eolian, and lake sediments rarely have the distinct and continuous annual record<br />
<strong>of</strong> tree rings. Woodhouse and Overpeck (1998) reviewed reconstructed drought<br />
information for the Great Plains region and noted that two drought events in the 13 th and<br />
16 th Centuries evidently exceeded the severity, length and geographic extent <strong>of</strong> 20 th<br />
Century droughts, and similar or longer drought periods occurred prior to the 13 th<br />
Century. Mann, et al. (1998) reconstructed Northern Hemisphere temperature anomalies<br />
from 1400 to present and concluded that the last decade had the warmest intervals in the<br />
millennium; although, the late 11 th , 12 th and 14 th Centuries had mean temperatures similar<br />
to the mean for the second half <strong>of</strong> the 20 th Century.<br />
Strong but complex periodicity exists in all climatic data, and any 20-year segment would<br />
correlate with multiple intervals over a 300 year span in such a system. The two essential<br />
questions, beyond the repetition <strong>of</strong> climatic cycles, are have the last 20 years included<br />
enough variety in climatic events to assure that modern mine reclamation has<br />
successfully coped with conditions likely to occur on the scale <strong>of</strong> centuries and how does<br />
the 20-year span <strong>of</strong> SMCRA compare with the periods <strong>of</strong> cycles in the regional climate?<br />
The 20-year time interval in which our regulatory program matured and successful<br />
reclamation occurred under SMCRA began with alternating biennial wet and dry periods<br />
followed by a longer drought and wet spell. The 1993-96 wet period and 1988-92<br />
drought were longer than three-fourths <strong>of</strong> the comparable intervals in the past three<br />
centuries. The 50 years with severe to extreme PDSI values were not uniformly<br />
distributed over the 308-year record, so four occurring in the past 20 years exceeded<br />
expectations from a uniform distribution and strengthened 1979-98 as a representative<br />
sample <strong>of</strong> long-term climatic events. The duration and intensity <strong>of</strong> events in the PDSI<br />
data agree well with climatic events that were notable for their impact on human affairs.<br />
Although, the duration <strong>of</strong> spells defines extreme wet or drought periods in the PDSI<br />
record better than their intensity, the severe drought years, 1934, 1936, 1937, 1988 and<br />
1991 mark the 1930’s and the 1988-92 droughts. Wet events are more prominent in the<br />
climatic record for west-central North Dakota than drought; however, the region is<br />
commonly perceived as being drought prone largely because dry spells <strong>of</strong> moderate<br />
intensity or length have far greater impact on human affairs than wet spells <strong>of</strong> comparable<br />
severity and duration.
Cook, et al. (1997) infer that North Dakota is significantly less drought prone than most<br />
<strong>of</strong> the United States west <strong>of</strong> the Mississippi River. Mock (1991) found from a cluster<br />
analysis <strong>of</strong> weather station precipitation records over the Great Plains that North Dakota<br />
and eastern Montana form a distinct region <strong>of</strong> high June rainfall. Data selected for<br />
paleoclimatic analysis in North Dakota should honor these boundaries in regional<br />
weather, but attempts to differentiate patterns within the region will probably be limited<br />
by the poor availability over most <strong>of</strong> the state <strong>of</strong> good tree ring chronologies for climate<br />
reconstruction. The shorter life span and limited availability <strong>of</strong> suitable bur oak stands<br />
have forced climate reconstructions so far to rely on pine records in the extreme<br />
southwest <strong>of</strong> North Dakota and adjacent states and on chronologies from Minnesota for<br />
proxy data. Paleoclimate reconstructions from tree rings spanning three centuries for<br />
subdivisions within the climatic region may not be feasible for North Dakota, but bur oak<br />
chronologies within the state probably hold good climatic records for about the last 150<br />
years that may be useful in localized water resources investigations.<br />
Although economically and emotionally hard to bear, stress <strong>of</strong> the above normal lengths<br />
and intensities <strong>of</strong> wet and dry events during the SMCRA years in western North Dakota<br />
have contributed to the quality and resilience <strong>of</strong> modern surface mine reclamation and the<br />
regulatory frame work that guides it. Periods roughly <strong>of</strong> 4, 7, 12, 20 and 60-year<br />
frequencies appear to be present in the climatic record <strong>of</strong> western North Dakota. The 20<br />
years <strong>of</strong> modern reclamation have probably encompassed the high frequency patterns in<br />
the regional climate. All <strong>of</strong> the currently operating large-scale surface mines in North<br />
Dakota will continue for at least two or more decades in operation or final reclamation.<br />
At least 40 years <strong>of</strong> reclamation practice and environmental monitoring can be<br />
anticipated for these operations which will span all but the low frequency climatic cycles.<br />
REFERENCES<br />
Cook, E. R., D. M. Meko, D. W. Stahle and M. K. Cle aveland. 1996. Tree-ring reconstructions <strong>of</strong><br />
past drought across the coterminous United States: Tests <strong>of</strong> a regression method and<br />
calibration/verification results. Radiocarbon 1966:155-169.<br />
Cook, E. R., D. M. Meko and C. W. Stockton. 1997. A new assessment <strong>of</strong> possible solar and<br />
lunar forcing <strong>of</strong> the bidecadal drought rhythm in the western United States. Jour. Climate<br />
10:1343-1356.<br />
Guttman, N. 1991. Sensitivity <strong>of</strong> the Palmer Hydrologic Drought Index to temperature and<br />
precipitation departures from average conditions. Water Resources Res. 27:797-807.<br />
Hayes, M. J. 1999. Drought Indices. National Drought Mitigation Center, URL:<br />
http://enso.unl.edu/ndmc/enigma/indices.htm<br />
Mann, M. E., R. S. Bradley and M. K. Hughes. 1998. Global-scale temperature patterns and<br />
climate forcing over the past six centuries. Nature 392:779-787.<br />
Michaelsen, J. 1989. Long-period fluctuations in El Niño amplitude and frequency reconstructed<br />
from tree-rings. Amer. Geophys. Union Geophys. Monogr. 55:69-74.
Mock, C. J. 1991. Drought and precipitation fluctuations in the Great Plains during the late<br />
Nineteenth Century. Great Plains Res. 1(1):26-57.<br />
Palmer, W. C. 1965. Meteorological drought. U.S. Weather Bureau Res. Paper 45, 58p.<br />
Sieg, C. H., D. Meko, A. T. DeGaetano and W. Ni. 1966. Dendroclimatic potential in the<br />
Northern Great Plains. Radiocarbon 1996:295-302.<br />
Woodhouse, C. A. and J. T. Overpeck. 1998. 2000 years <strong>of</strong> drought variability in the central<br />
United States. Bull. Amer. Meteorol. Soc. 79(12):2693-2714
2000 Billings Land Reclamation Symposium<br />
RECLAMATION INFORMATION MANAGEMENT SYSTEM FOR<br />
THE SURFACE MINING INDUSTRY<br />
Thomas G. Parker<br />
ABSTRACT<br />
Coal mine operators in Montana and Wyoming and regulatory agencies have expressed<br />
interest in developing the conceptual framework for a Reclamation Information<br />
Management System (RIMS). The system would provide a means for standardized<br />
handling <strong>of</strong> information relating to reclamation activities on surface mines that will<br />
ultimately lead to full bond release. The initial emphasis would be on the later phases <strong>of</strong><br />
bond release that involve restoring native plant communities. Bitterroot Restoration, Inc.,<br />
working with surface mine operators and regulatory agencies, is developing this<br />
conceptual framework. RIMS will be a phased process. Phase I is the concept<br />
development phase. Phase I will include technical concept development, i.e. database<br />
structure, reporting formats, core functionality, selection <strong>of</strong> appropriate internetcompatible<br />
tools, and discussion <strong>of</strong> data sources and data integrity/security. Phase I will<br />
also include needs identification, which will involve communication with surface mine<br />
operators and regulators, summary <strong>of</strong> current information flow vs. desired information<br />
flow patterns, and discussion <strong>of</strong> priorities for Phase II pilot implementation. During<br />
Phase II, we would implement a pilot RIMS involving two or more surface mine<br />
operators and regulatory agencies. Phase III would be an expanded implementation.<br />
_______________<br />
Bitterroot Restoration, Inc., 445 Quast Lane, Corvallis, Montana 59828
2000 Billings Land Reclamation Symposium<br />
NORTH DAKOTA PRIME FARMLAND RECLAMATION PROGRAM<br />
Dean Moos<br />
ABSTRACT<br />
North Dakota adopted prime farmland regulations following the passage <strong>of</strong> SMCRA in<br />
1977. Many <strong>of</strong> the currently permitted areas are grandfathered or exempt from the prime<br />
farmland standards. The mine operator must submit an operations and reclamation plan<br />
for the prime farmland areas that are subject to the prime farmland regulations. North<br />
Dakota regulations allow the mixing <strong>of</strong> prime topsoil and subsoil with nonprime topsoil<br />
and subsoil, respectively, provided that the mixed soil is <strong>of</strong> equal or better quality than<br />
that <strong>of</strong> the prime farmland soil. Full restoration <strong>of</strong> production must be achieved for a<br />
minimum <strong>of</strong> three years before final bond release can be granted.<br />
__________________<br />
Environmental Scientist, Reclamation Division, ND Public Service Commission, 600 E<br />
Boulevard Ave, Dept. 408 Bismarck, ND 58505
INTRODUCTION<br />
Currently, there are four large surface mines operating in North Dakota. These mines<br />
are located in central and western North Dakota and produce approximately 30 million<br />
tons <strong>of</strong> lignite per year. The soils in this area developed from glacial till and s<strong>of</strong>t<br />
sedimentary bedrock. The pre-mining land use <strong>of</strong> the area consists primarily <strong>of</strong> cropland<br />
and native grassland. Small grains, primarily spring wheat, are the dominant crops grown<br />
in the area. Average annual precipation in this area is approximately 16 inches.<br />
In central and western North Dakota, 13 soil types have been identified as prime<br />
farmland soils by the Natural Resource Conservation Service (NRCS). These prime soils<br />
occur primarily on footslopes, swales, or mild depressions and are usually 5 to 30 acres in<br />
size. Generally, the prime farmland soils receive run-on water from higher surrounding<br />
upland areas that do not meet prime farmland criteria.<br />
In many cases, the soils <strong>of</strong> the adjacent prime and nonprime areas are<br />
morphologically similar. They differ only in thickness <strong>of</strong> the A and B horizons, presence<br />
<strong>of</strong> argillic horizons, depth to carbonates, etc. The prime soils generally have a thicker,<br />
darker (higher organic matter content) topsoil layer and a thicker solum (A and B<br />
horizons) than the adjacent nonprime soils.<br />
The prime soils generally have a higher productive capacity than the adjacent<br />
nonprime soils. Numerous studies (Richardson and Wollenhaupt 1983, Schroeder and<br />
Doll 1984, and Wollenhaupt and Richardson 1983) have shown that the higher<br />
productivity <strong>of</strong> the prime soils is due to their more favorable moisture regime because <strong>of</strong><br />
the additional water received as run<strong>of</strong>f from the adjacent upland areas. The authors did<br />
not believe that the higher productivity <strong>of</strong> the prime soils was related to their inherent soil<br />
properties other than higher soil water availability due to their landscape position.<br />
Identifying and Reclaiming Prime Farmland<br />
<strong>Mining</strong> companies are required to identify prime farmland areas as part <strong>of</strong> the permit<br />
application. This determination is based on the NRCS county soil surveys that have been<br />
completed for each county in the state. The NRCS has identified the soil map units in<br />
each county that are considered prime farmland. The NRCS county soil surveys are<br />
prepared at a scale <strong>of</strong> 1:20,000 and the minimum size delineation is approximately five<br />
acres.<br />
The mining company is also required to prepare a detailed soil survey for each permit<br />
area. A Pr<strong>of</strong>essional Soil Classifier prepares this soil survey and it is more detailed than<br />
the NRCS Soil Survey. This survey is prepared at a scale <strong>of</strong> 1:4800 and the minimum
size delineation is approximately two acres. The detailed soil survey is used to determine<br />
the soil salvage depths and the adequacy <strong>of</strong> the soil resources for reclamation. It is also<br />
used for the development <strong>of</strong> site-specific reclamation success standards.<br />
When the NRCS soil survey map (from which the prime farmland determination is<br />
made) is enlarged to the same scale and overlain on the detailed permit soil survey map,<br />
the locations <strong>of</strong> prime farmland as mapped by the NRCS may not correspond with those<br />
shown on the detailed soil survey map. Stomberg (1985) found that within the areas<br />
mapped as prime farmland by the NRCS, about 35% <strong>of</strong> the acreage was actually<br />
comprised <strong>of</strong> nonprime soils and, for any particular landowner, nonprime soils comprised<br />
from 22 to 91% <strong>of</strong> the areas mapped as prime in the county soil survey. The prime<br />
farmland section <strong>of</strong> <strong>Surface</strong> Coal <strong>Mining</strong> Permit NAFK-9503 for the Falkirk Mine<br />
indicates nonprime components (based on the detailed soil survey) comprise from 7 to<br />
93% <strong>of</strong> the prime farmland delineations within this permit area. Oftentimes, the<br />
discrepancies may be minor, such as similar, nonprime soils being included in the prime<br />
delineation; however, significantly contrasting soils may be within the prime delineation.<br />
If significant differences exist between the two surveys, the NRCS and the Pr<strong>of</strong>essional<br />
Soil Classifier who prepared the permit soil survey may be requested to field review the<br />
questionable areas and, if necessary, make the appropriate adjustments.<br />
Several exemptions to the prime farmland success standards exist. Lands that the<br />
permittee had the legal right to mine before August 3, 1977 and are part <strong>of</strong> continuous<br />
mining plan that was under permit before August 3, 1977 are exempt from the prime<br />
farmland standards. This is commonly referred to as the “grandfather clause”. In<br />
addition, areas not “historically used as cropland” are not subject to the prime farmland<br />
standards. These include native grassland areas, tame pastureland, woodlands, and<br />
industrial areas.<br />
Of the 55,425 acres currently under permit at the four active mines, approximately<br />
26,665 acres (48%) are exempt (grandfathered) from the prime farmland standards.<br />
There are approximately 4285 acres <strong>of</strong> prime farmland within the 28,760 acres that are<br />
not grandfathered from the prime farmland standards.<br />
Since 1975, North Dakota has required the removal and segregation <strong>of</strong> both topsoil<br />
and subsoil from all mined lands. Topsoil normally consists <strong>of</strong> the A horizon and the<br />
upper part <strong>of</strong> the B horizon, typically the dark colored organic-rich, non-calcareous, nonsodic,<br />
and non-saline upper horizons <strong>of</strong> the soil pr<strong>of</strong>ile. Subsoil typically consists <strong>of</strong> the<br />
calcareous, non-sodic and non-saline material to a depth <strong>of</strong> 5’. The stark color change<br />
between topsoil and subsoil makes it a fairly simple task for trained equipment operators<br />
to successfully segregate topsoil and subsoil materials.<br />
The actual handling <strong>of</strong> prime and nonprime soils is similar with the exception that the<br />
prime farmland soils are removed, stockpiled, and respread separately from nonprime<br />
soils. A total <strong>of</strong> 48 inches <strong>of</strong> topsoil and subsoil (if available) must be removed and<br />
respread on the prime farmland areas. Required respread depths <strong>of</strong> nonprime areas are<br />
typically determined by the graded spoil quality with total soil respread depths ranging
from 24 to 48 inches depending on graded spoil quality. Mine operators prefer to direct<br />
respread soils when possible, but when suitable areas are not available for direct<br />
respreading, the soil materials must be stockpiled.<br />
Reclaimed prime farmland areas must have topography similar to the pre-mine prime<br />
farmland areas, i.e., concave or swale positions with gentle slopes (0-6% slopes) to<br />
ensure they receive run-on water. Schroeder (1991) found that lower slope positions<br />
(footslope and toeslope positions) had a positive effect on available soil water at planting<br />
and wheat yields. The postmining topography <strong>of</strong> all reclaimed lands, including prime<br />
farmland areas, must be approved by the Commission prior to beginning soil respread.<br />
Typical cropland (prime and nonprime) reclamation consists <strong>of</strong> planting a pre-crop<br />
mixture <strong>of</strong> grasses and legumes following soil respread. The purpose <strong>of</strong> the pre-crop<br />
mixture is to stabilize the soil following reclamation and promote soil structure<br />
development. After a few years, the pre-crop mixture is plowed down and cropping with<br />
small grains begins. Recently, some mining companies have gone directly into small<br />
grain production following soil respread rather than planting the reclaimed areas to a precrop<br />
mixture <strong>of</strong> grasses and legumes.<br />
North Dakota prime farmland rules allow for the mixing <strong>of</strong> prime topsoil and subsoil<br />
with nonprime topsoil and subsoil, respectively, provided that the mixed soil is <strong>of</strong> equal<br />
or better quality. The permittee must demonstrate that the mixed soil is <strong>of</strong> equal or better<br />
quality than that <strong>of</strong> the prime farmland soils. If this demonstration cannot be made, the<br />
prime and nonprime materials must be handled separately.<br />
Mixing <strong>of</strong> prime and nonprime subsoil has been routinely allowed in those instances<br />
where the resulting mixture is <strong>of</strong> equal or better quality. The permittee must include a<br />
comparison in the permit application demonstrating that the resulting mixture will be <strong>of</strong><br />
equal or better quality; i.e., that the prime and nonprime subsoil materials are <strong>of</strong> similar<br />
quality. In certain instances when the adjacent nonprime subsoil is <strong>of</strong> marginal quality,<br />
segregation <strong>of</strong> the prime subsoil is required.<br />
Historically, prime topsoil has been segregated from nonprime topsoil. Halvorson<br />
and Nathan (1993, 1995) and Halvorson (1996) indicated that certain prime and<br />
nonprime topsoil materials could be mixed without affecting crop yields or reclamation<br />
success. This research found that landscape position was the most important factor in<br />
determining reclamation success <strong>of</strong> reclaimed prime farmland.<br />
The dominant prime and nonprime soils in the coal-mining region <strong>of</strong> North Dakota<br />
are very similar in terms <strong>of</strong> soil classification, drainage class, bulk density, and texture.<br />
Generally, the prime soils tend to have slightly thicker A and B horizons. A comparison<br />
<strong>of</strong> the soil properties based on laboratory analysis <strong>of</strong> typical prime and nonprime soils <strong>of</strong><br />
the coal-mining region <strong>of</strong> North Dakota is provided in Table 1. A weighted average is<br />
provided for the topsoil and subsoil materials <strong>of</strong> the prime and nonprime soils. The prime<br />
and nonprime soils in Table 1 are similar in chemical and physical characteristics.
Table 1. Comparison <strong>of</strong> Williams & Bowbells Topsoil & Subsoil Properties Based<br />
on NRCS Lab Data (weighted averages).<br />
Williams soil<br />
Bowbells soil<br />
(nonprime)<br />
(prime)<br />
Soil Property<br />
Topsoil Subsoil Topsoil Subsoil<br />
n (# <strong>of</strong> pedons) 4 4 3 3<br />
Average Topsoil Thickness 10.2 40 22.3” 37.7<br />
Electrical Conductivity<br />
(mmhos/cm)<br />
0.57 0.71 0.71 0.43<br />
Sodium Adsorption Ratio 0.12 1.9 Not<br />
available<br />
1.33<br />
Calcium Carbonate Equivalent < 0.1 14.1 Not<br />
available<br />
7.6<br />
Organic Matter % 3.38% 0.5% 2.8% 0.96%<br />
% Sand 27% 23.1 26.6% 29.3%<br />
% Clay 28.4 29.2 29.3% 31.5%<br />
In 1997, The Falkirk <strong>Mining</strong> Company submitted the first proposal to mix prime and<br />
nonprime topsoil materials. Table 2 provides a comparison <strong>of</strong> the soil laboratory data <strong>of</strong><br />
the most common prime and nonprime soil types occurring within this permit area.<br />
These three soil types comprise approximately 80% <strong>of</strong> the entire permit area.<br />
Table 2. Comparison <strong>of</strong> Williams, Bowbells, and Falkirk Topsoil Properties Based<br />
on Soil Lab Data Submitted with Permit NAFK-9503 (weighted averages).<br />
Williams soil Bowbells soil Falkirk soil<br />
Soil Property<br />
(nonprime) (prime)<br />
(prime)<br />
N (# <strong>of</strong> pedons) 20 3 26<br />
Average Topsoil Thickness 12.2” 17.1” 19.5<br />
Electrical Conductivity<br />
(mmhos/cm)<br />
0.33 0.46 0.41<br />
Sodium Adsorption Ratio 0.41 0.35 0.39<br />
Calcium Carbonate Equivalent 1.66 1.67 1.57<br />
pH 6.7 7.1 6.9<br />
Organic Matter % 2.77% 3.06% 2.9%<br />
% Sand 31.5 28.5% 30.8%<br />
% Clay 25.3% 23.8% 23.2%<br />
Falkirk’s proposal to mix certain prime and nonprime topsoil materials was approved.<br />
The Commission determined that the practice <strong>of</strong> segregating prime and nonprime topsoil<br />
was not warranted in this permit area and that the benefits <strong>of</strong> such segregation were<br />
negligible for the following reasons:<br />
• The dominant prime and nonprime soils are very similar in chemical and physical<br />
characteristics.
• A significant amount <strong>of</strong> mixing <strong>of</strong> prime and nonprime topsoil is already taking place<br />
under the current practice <strong>of</strong> segregating prime and nonprime topsoil materials. (The<br />
detailed soil survey shows that a considerable amount <strong>of</strong> nonprime soils are within<br />
the areas identified as prime by the NRCS.)<br />
• The required productivity standard for the reclaimed prime areas is generally not<br />
significantly higher than the nonprime cropland areas (frequently less than a bushel<br />
per acre for spring wheat).<br />
• The topsoil respread thickness for prime and nonprime respread areas is not<br />
significantly different. Usually the prime topsoil thickness is only slightly thicker<br />
(<strong>of</strong>tentimes less than 2” difference) than the adjacent nonprime areas.<br />
Even though segregation <strong>of</strong> the prime and nonprime topsoil is currently being<br />
practiced, a significant amount <strong>of</strong> mixing <strong>of</strong> prime and nonprime topsoil is taking place<br />
due to the amount <strong>of</strong> nonprime “inclusions” within the prime areas. These nonprime<br />
inclusions lower the site specific productivity standards for the prime areas and result in<br />
thinner topsoil respread thicknesses. Although mixing <strong>of</strong> prime and nonprime topsoil<br />
was approved at the Falkirk Mine, the permittee is still required to meet the required<br />
revegetation standard for the prime areas for three years prior to bond release.<br />
The types and amounts <strong>of</strong> nonprime topsoil that can be mixed must be restricted to<br />
similar prime and nonprime soils with only minor inclusions <strong>of</strong> dissimilar soils. In<br />
Falkirk’s case, mixtures <strong>of</strong> prime and nonprime topsoils will be limited to no more than<br />
10% <strong>of</strong> volume <strong>of</strong> certain nonprime soils; however, no restrictions were placed on the<br />
amount <strong>of</strong> similar prime and nonprime soils that could be mixed.<br />
Determining Reclamation Success<br />
North Dakota has a 10-year revegetation responsibility period, i.e., the reclaimed area<br />
must remain under bond for a minimum <strong>of</strong> 10 years from the last augmented seeding.<br />
Production (crop yield) is the only vegetation parameter that must be assessed on prime<br />
farmland for final bond release. Reclamation success is achieved when the annual<br />
average crop production from the area is equal to or greater than that <strong>of</strong> the approved<br />
reference area or standard with 90% statistical confidence for a minimum <strong>of</strong> 3 years on<br />
reclaimed prime farmlands. The nonprime cropland must meet the appropriate<br />
production standard with 90% statistical confidence for the last 2 consecutive years <strong>of</strong> the<br />
10-year liability period or 3 out <strong>of</strong> 5 consecutive years starting no sooner than the eighth<br />
year <strong>of</strong> the responsibility period. The productivity <strong>of</strong> the nonprime cropland must also be<br />
restored to 100% <strong>of</strong> the pre-mine level.<br />
For assessment <strong>of</strong> revegetation success <strong>of</strong> reclaimed prime farmland, the permittee<br />
may use either a reference area standard or a technical standard based on NRCS data.<br />
These methods provide procedures for climatic correction <strong>of</strong> yields. A separate yield<br />
standard must be developed and separate yield measurements must be taken for each<br />
landowner’s property. Spring wheat must be used to determine reclamation success for at
least 2 <strong>of</strong> the 3 years that productivity measurements are taken. Barley or oats may be<br />
used for the remaining year.<br />
The cropland reference area standard combines a reference area with NRCS<br />
productivity indices for soil mapping units. This method is well suited to reclaimed<br />
prime farmland tracts and reclaimed nonprime cropland tracts that subtend only a few<br />
soil map units. A cropland reference area is established for soil mapping units that were<br />
predominant in the reclaimed tract prior to mining. The reference area must include one<br />
or two reference soils which singly or together occupy more than 50% <strong>of</strong> the reclaimed<br />
tract. The reference area must be topographically similar to the reclaimed tract and must<br />
be established in the vicinity <strong>of</strong> the mine area.<br />
If the reference area contains prime and nonprime soil map units, each soil map unit<br />
in the reference area must be separately harvested or sampled to determine the yield <strong>of</strong><br />
each. The crop yield <strong>of</strong> one <strong>of</strong> the reference soils must be used along with the NRCS soil<br />
productivity indices to calculate the expected yields for the other premining mapping<br />
units not represented in the reference area. The current year’s actual yield from the<br />
reclaimed tract is then compared to the derived standard. The yield standard must be<br />
derived for each year that the reclaimed tract is evaluated for bond release. Appropriate<br />
statistical tests must be applied as necessary to determine if the yields are significantly<br />
different.<br />
Under the technical standard using only NRCS productivity indices, productivity<br />
index values for all premining soil map units that existed in the reclaimed cropland tract<br />
are obtained. Index values are converted to yields using the assigned county yield for the<br />
Productivity Index <strong>of</strong> 100%. A yield value is determined for each soil mapping unit in<br />
the tract and multiplied by the acreage each mapping unit occupied in the tract. These<br />
weighted yields are summed and divided by the total acreage <strong>of</strong> the tract to obtain a<br />
weighted average yield per acre. This value is the unadjusted yield standard for the<br />
reclaimed cropland tract. NRCS yield ratings for productivity indices are based on longterm<br />
average data and do not account for annual climatic variations. Therefore, the<br />
unadjusted yield standard must be adjusted using one <strong>of</strong> the four approved methods. The<br />
most common method is to adjust the standard using county-wide average yield data<br />
published annually by the Agricultural Statistical Service.<br />
To date, no final bond release applications have been received for reclaimed prime<br />
farmland in North Dakota.
References<br />
Halvorson, G.A., 1996, “Comparative Evaluation <strong>of</strong> Productivity <strong>of</strong> Prime and Nonprime<br />
Land,” Final Status Report, Contract No. LRC-XVIII-58, North Dakota State<br />
University, Land Reclamation Research Center, Mandan, ND.<br />
Halvorson, G.A., and Nathan, M.V., 1993, “Research on the Reclamation <strong>of</strong> Prime<br />
Farmland in North Dakota,” Report to the ND Legislative Council pursuant to<br />
Section 5 <strong>of</strong> H.B. 1005 <strong>of</strong> the 52 nd Legislative Session, North Dakota State<br />
University, Land Reclamation Research Center, Mandan, ND.<br />
Halvorson, G.A., and Nathan, M.V., 1995, “Reclamation <strong>of</strong> Prime and Nonprime Soils,”<br />
Mineland Reclamation Review, March 29, 1995, North Dakota State University,<br />
Land Reclamation Research Center, Mandan, ND.<br />
North Dakota Public Service Commission, 1997, “Rules Governing <strong>Surface</strong> <strong>Mining</strong> and<br />
Reclamation Operations, June 1, 1997,” Bismarck, ND.<br />
North Dakota Public Service Commission, 1995, “Standards for Evaluation <strong>of</strong><br />
<strong>Revegetation</strong> Success and Recommended Procedures for Pre- and Postmining<br />
Assessments, Revised May 1995,”Bismarck, ND.<br />
Richardson, J.L., and Wollenhaupt, N.C., 1983, “Natural Soil and Landscape<br />
Development,” Can Mined Land Be Made Better Than Before <strong>Mining</strong>? Conference<br />
Proceedings, November 7, 1982, Stronghold Press, pp. 95-96.<br />
Schroeder, S.A., 1991, “Topographic Position Effects on Soil Water and Wheat Yields on<br />
Reclaimed Minelands,” North Dakota Farm Research, Vol. 48, No. 5, pp. 3-5.<br />
Schroeder, S.A., and Doll, E.C., 1984, “Productivity <strong>of</strong> Prime, Nonprime, and Reclaimed<br />
Soils in Western North Dakota,” North Dakota Farm Research, Vol. 41, No. 5, pp. 3-<br />
6, 31.<br />
Soil Conservation Service, 1984, “North Dakota Important Farmlands,” Bismarck, ND.<br />
Stomberg, A., 1985, “Prime Soils Handling in North Dakota,” Proceedings <strong>of</strong> the 1985<br />
Annual Meeting <strong>of</strong> American Institute <strong>of</strong> <strong>Mining</strong> Engineers, Albuquerque, NM, pp.<br />
1-3.<br />
The Falkirk <strong>Mining</strong> Company, 1995, “<strong>Surface</strong> Coal <strong>Mining</strong> Permit No. NAFK-9503,”<br />
The Falkirk <strong>Mining</strong> Company, Underwood, ND.<br />
Wollenhaupt, N.C. and Richardson, J.L., 1982, “The Role <strong>of</strong> Topography in <strong>Revegetation</strong><br />
<strong>of</strong> Disturbed Lands,” Symposium on <strong>Surface</strong> Coal <strong>Mining</strong> and Reclamation in the<br />
Northern Great Plains Proceedings, March 8-9, 1982, pp. C.2.1-C.2.11.
2000 Billings Land Reclamation Symposium<br />
TILLAGE AND PRIOR CROP EFFECTS ON RECLAIMED MINELAND<br />
SMALL GRAIN YIELDS<br />
Dr. Stephan A. Schroeder 1<br />
ABSTRACT<br />
Compaction caused by heavy equipment during soil respreading may restrict root growth<br />
plus reduce air and water movement which may lead to poor vegetative growth. The<br />
objective <strong>of</strong> this study was to determine the effect over time <strong>of</strong> two initial tillage<br />
treatments and prior cropping history on spring wheat yields. Split-split plot designs<br />
were used to determine the effects <strong>of</strong> tillage and prior cropping at the Knife River<br />
Corporation Mine near Beulah and the Basin Cooperative Services Glenharold Mine near<br />
Stanton, North Dakota. Initial tillage treatments applied in 1989 were chisel ( 6-inch<br />
depth) or subsoiling (24-inch depth). All subsequent tillage on the spring wheat plots<br />
consisted <strong>of</strong> a chisel/disk/harrow operation prior to planting each spring. Half <strong>of</strong> all<br />
forage strips were killed in the fall following the third year <strong>of</strong> growth, the rest after six<br />
years, and planted to spring wheat. All spring wheat plots were fertilized for a minimum<br />
yield <strong>of</strong> a 40 bu/ac. Initial tillage treatments had very little effect on either spring wheat<br />
or forage yields over the five or more years <strong>of</strong> data collection. Early yields were<br />
probably affected more by the dry conditions that prevailed in the late 1980s and early<br />
1990s. Prior forage crops grown on the plots had more significant effects on resultant<br />
spring wheat yields but the results varied over years due to variability within the plots;<br />
the differences in yield, in most cases, were not large. Over time, initial tillage had little<br />
or no consistent effect on spring wheat yields. Forages grown for several years before the<br />
initial spring wheat crop also do not have a consistent effect on spring wheat yields but<br />
did require initially heavier fertilization than the continuous spring wheat plots.<br />
_______________<br />
1 Environmental Scientist, Reclamation Division, North Dakota Public Service<br />
Commission, 600 E. Boulevard Ave. Dept. 408, Bismarck, ND 58505
INTRODUCTION<br />
Soil compaction can be defined as compressing soil particles together resulting in higher<br />
bulk density (weight per unit volume). As bulk density increases, soil porosities and pore<br />
sizes (especially the large pores or macropores) decrease. Generally speaking, a<br />
compacted soil has poor aeration, low nutrient and water availability, slow permeability,<br />
and mechanical impedance to root growth (Raney et al. 1955).<br />
Phillips and Kirkham (1962) stated that mechanical impedance to root growth measured<br />
with a cone penetrometer may be a better indicator than bulk density since the cone more<br />
closely represents the resistance a root may encounter. One study (Materechera et al.<br />
1992) indicated that the size <strong>of</strong> the root had a significant influence on whether or not the<br />
root penetrated compacted layers and that root tips were much larger for plants grown in<br />
compacted versus noncompacted subsoils. Also, bulk density and penetrometer<br />
resistances were both found to be highly correlated to root length density in the lower<br />
portion <strong>of</strong> a reclaimed root zone (Thompsom et al. 1987).<br />
Meek et al. (1988) showed that surface traffic similar to that applied by a producer<br />
reduced alfalfa yields by about 10% compared to areas with no surface traffic. When the<br />
entire surface was compacted, yields were reduced by about 17% from noncompacted<br />
surfaces.<br />
Climatic factors such as freezing/thawing and wetting/drying cycles have been thought to<br />
alleviate some compaction. However, Voorhees (1990) found that freeze-thaw cycles in<br />
Minnesota failed to reduce compaction caused by large farm machinery even 9 years<br />
after the initial compaction. In addition, compaction in arid climates may last even<br />
longer since the soils in the fall generally contain insufficient amounts <strong>of</strong> soil water for<br />
frost heaving to occur (Brenneman 1991).<br />
Tillage has probably been the most prevalent method employed to alleviate soil<br />
compaction although results on subsequent yields <strong>of</strong> crops have been mixed. For<br />
example, Barnhisel et al. (1988a) found that subsoiling increased wheat yields over nonsubsoiled<br />
areas for two out <strong>of</strong> three years in one study but ripping and/or subsoiling had<br />
no significant effect on bulk density and generally reduced alfalfa yields in another study<br />
(Barnhisel et al. 1988b). In a recent study, Pikul and Aase (1999) found that while some<br />
residual effects <strong>of</strong> subsoiling on soil properties were found 2.5 years after subsoiling, soil<br />
changes attributed to subsoiling had no significant effect on wheat yields.<br />
<strong>Surface</strong> mine operators have become acutely aware <strong>of</strong> the deleterious effects <strong>of</strong> soil<br />
compaction caused by large equipment especially since the passage <strong>of</strong> the <strong>Surface</strong><br />
<strong>Mining</strong> Control and Reclamation Act <strong>of</strong> 1977 (SMCRA). Since 1975, North Dakota law<br />
has required reclaimed lands to have productivity values equal to that <strong>of</strong> the premine<br />
state. If vegetative growth is restricted due to poor rooting conditions as a result <strong>of</strong> soil<br />
compaction, then reaching these premine productivity levels becomes difficult and<br />
release from bonding requirements becomes tenuous.
This reclaimed mineland study was developed to evaluate two major objectives. The first<br />
objective was to determine the effects <strong>of</strong> initial tillage on bulk density and various crop<br />
yields with time. And secondly, the study was to determine the effect <strong>of</strong> prior crops<br />
grown for various lengths on subsequent small grain yields.<br />
METHODS AND MATERIALS<br />
Experimental sites were established in the spring <strong>of</strong> 1989 on reclaimed mineland<br />
locations at the Basin Cooperative Services Glenharold Mine near Stanton, North Dakota<br />
and the Knife River Corporation mine near Beulah, North Dakota. Both locations had<br />
been reclaimed the previous fall using scrapers that respread an average depth <strong>of</strong> 12<br />
inches <strong>of</strong> topsoil and 24 inches <strong>of</strong> subsoil. Each location was 390 by 160 feet<br />
(approximately 1.5 ac) in size.<br />
Each location was divided into four strips lengthwise upon which alternate tillage<br />
treatments <strong>of</strong> either chisel (6 inch depth, 24 inch spacing) or subsoiler (24 inch depth, 20<br />
inch spacing) were applied. A broadcast application <strong>of</strong> 100 lbs/ac <strong>of</strong> ammonium nitrate<br />
was applied and followed by a light disk/harrow operation. Each location was then<br />
divided into half perpendicular to the tillage treatments and each <strong>of</strong> these halves further<br />
subdivided into six equal-sized strips. Five forage crops (monocultures and mixes) and<br />
Stoa spring wheat were randomly seeded into the strips at the rates shown in Table 1 to<br />
give four subplots for each crop by tillage treatment. <strong>Mining</strong> personnel seeded all but the<br />
spring wheat plots. All spring wheat plots (after harvest the first year) were fall chiseled<br />
and spring disked/harrowed before seeding.<br />
Table 1. Seeding mixtures and rates used on the tillage locations.<br />
Seeding Mixture Rate (lbs/ac )<br />
Alfalfa (Medicago sativa L.) 10<br />
Native Mix<br />
Sideoats grama (Bouteloua curtipendula) 33% 1<br />
Green needle (Stipa viridula) 19%<br />
Big bluestem (Andropogon gerardii) 17%<br />
18<br />
Western wheatgrass (Pascopyrum smithii) 14%<br />
Blue gram (Bouteloua gracilis) 11%<br />
Slender wheatgrass (Elymus trachycaulus) 6%<br />
Precrop Mix<br />
Alfalfa 33%<br />
Pubescent wheatgrass (Thinopyrum intermedium) 20%<br />
Tall wheatgrass (Thinopyrum pentium) 20%<br />
Smooth bromegrass (Bromus inermis) 20%<br />
Pubescent wheatgrass 8 / 10 2<br />
Tall wheatgrass 8 / 10 2<br />
Spring wheat (Triticum aestivum) 75<br />
1 Percent <strong>of</strong> mixture by weight<br />
2 Higher rate at Knife River location<br />
15
Soil bulk density was measured by depth from soil cores removed following spring wheat<br />
planting each spring. Soil fertility samples were taken in the fall from all spring wheat<br />
subplots following harvesting. Fertilizer was broadcast and drill applied in the spring on<br />
the spring wheat subplots based upon these fertility samples to produce a 40 bu/ac crop.<br />
All forage and spring wheat plots were hand harvested. Following sample harvesting, the<br />
remaining forage and spring wheat was removed from the subplots by either mine<br />
personnel or cooperating farmers.<br />
Following the third year <strong>of</strong> spring wheat harvest, each tillage strip was subdivided<br />
lengthwise into half. Random halves <strong>of</strong> each tillage strip were sprayed to kill all<br />
vegetationand fertility samples taken. These former forage subplots and the spring wheat<br />
subplots were then fall chiseled for preparation for planting in the spring. The remaining<br />
forage plots were similarly treated following the sixth year <strong>of</strong> the study.<br />
All site data were analyzed as a nonrandomized modified strip-split block design. Where<br />
appropriate, least significant difference (LSD) values at the P=10% level were calculated.<br />
RESULTS AND DISCUSSION<br />
The mean characteristics <strong>of</strong> the soil materials are listed in Table 2. The Knife River<br />
location was somewhat more coarse textured than the Glenharold location but pH values<br />
and electrical conductivity values were similar. The sodium adsorption (SAR) value for<br />
the subsoil at Glenharold was higher than expected and greater than that allowed by rules<br />
(a value <strong>of</strong> 10) for subsoil. However, it was thought that the slightly higher value for<br />
SAR at this location had only a little or no effect on the yields measured.<br />
Table 2. Mean physical and chemical properties <strong>of</strong> the respread soil materials at the two<br />
reclaimed mineland locations. 1<br />
Glenharold Knife River<br />
Variable 2<br />
Topsoil Subsoil Topsoil Subsoil<br />
Sand (%) 27 23 65 56<br />
Silt (%) 48 45 20 24<br />
Clay (%) 25 32 15 20<br />
pH 7.8 8.0 7.7 7.8<br />
EC (S m –1 ) 0.1 0.3 0.1 0.2<br />
SAR 2.5 11.4 0.4 0.8<br />
1<br />
12 replications per mean value, 1989 cores<br />
2<br />
EC is electrical conductivity and SAR is sodium adsorption ratio<br />
Tillage treatment had essentially no significant effect on bulk density by depth either<br />
initially or over time (Table 3) except for the 0 to 1 foot depth in 1990 and the 2 to 3 foot<br />
depth in 1992 at Knife River. The lack <strong>of</strong> significant differences between tillage<br />
treatments in 1989 was caused by the fertilizer broadcast, disk/harrow and planting
surface traffic which followed the tillage treatments. Variability among years was also<br />
affected by soil moisture at sampling plus additional settling and surface traffic.<br />
Table 3. Calculated bulk density mean values (g/cc) for the two tillage treatments at the<br />
two tillage treatments at the two research locations.<br />
Chisel (CH) 1.22 1.72<br />
Subsoiled (SS) 1.16 1.62<br />
CH 1.40 1.73<br />
SS 1.29 1.70<br />
CH 1.43 1.71<br />
SS 1.42 1.74<br />
CH 1.49 1.72<br />
SS 1.48 1.62<br />
CH 1.73 1.45<br />
SS 1.56 1.70<br />
CH 1.58 1.71<br />
SS 1.56 1.74<br />
1989 1990<br />
Year <strong>of</strong> Data<br />
1991<br />
Glenharold<br />
0 to 1 foot<br />
1992 1994<br />
1.50 1.52 1.30<br />
1.45<br />
1 to 2 feet<br />
1.52 1.26<br />
1.64 1.75 1.41<br />
1.58<br />
2 to 3 feet<br />
1.75 1.40<br />
1.36 1.62 1.49<br />
1.61 1.80 1.48<br />
Knife River<br />
0 to 1 foot<br />
1.46<br />
1.45<br />
1 to 2 feet<br />
1.64<br />
1.57<br />
2 to 3 feet<br />
1.63<br />
1.61<br />
1.52 1.56<br />
1.52 1.53<br />
1.75 1.69<br />
1.75 1.65<br />
1.62 1.62<br />
1.80 1.66<br />
The initial tillage treatments also showed very few significant effects on forage and<br />
spring wheat yields at the two mineland locations as shown in Tables 4 and 5. Most <strong>of</strong><br />
the differences found were attributed to variability within rather than between the tillage<br />
treatments. In addition, the overall difference between the tillage treatments varied only<br />
slightly between the two locations. The subsoiled plots at both locations showed<br />
generally higher yields for the forage crops in the latter years <strong>of</strong> the study. This may be<br />
an indication that the subsoiler tillage may be more beneficial after several years by<br />
possibly allowing for deeper root penetration into the pr<strong>of</strong>ile. This would, <strong>of</strong> course,<br />
allow for potentially greater water and nutrient uptake if available at the deeper depths.<br />
The significant differences found within the spring wheat data were largely attributed to<br />
variability in the yield data from within the tillage treatment subplots. However, the<br />
significant difference in 1989 at the Knife River location was attributed to deeper water<br />
penetration from a large rainstorm (estimated at about 2 to 3 inches in an hour) that<br />
occurred just after the subsoiling treatment was finished but before the chisel plots were<br />
chiseled. This allowed the rain to penetrate much more deeply in the subsoiled plots as
compared to the soon-to-be chisel plots. In a similar manner, the large increase in wheat<br />
yields from 1993 to 1994 at Glenharold was attributed to increased soil water. The 1993<br />
crop was hailed out and did not draw down the water that was available for the entire<br />
growing season as was the case at Knife River.<br />
Table 4. Tillage effects on forage and spring wheat yields at the Glenharold location.<br />
Tillage<br />
Year <strong>of</strong> Data<br />
1989 1 1990 1991 1992 1993 1994 1995 1996 Mean<br />
Chisel (CH) - 0.9<br />
Subsoiled (SS) - 0.8<br />
LSD(0.10) 2<br />
Alfalfa (t/ac)<br />
1.0 0.7 1.5 1.7 - - 1.1<br />
1.1 0.6 1.9 2.3 - - 1.3<br />
NS NS NS NS NS<br />
CH - 0.6<br />
SS - 1.1<br />
LSD(0.10) NS<br />
CH - 0.8<br />
SS - 1.1<br />
LSD(0.10) NS<br />
CH - 1.3<br />
SS - 1.2<br />
LSD(0.10) NS<br />
CH - 0.5<br />
SS - 0.4<br />
LSD(0.10) NS<br />
CH 1.6 19.7<br />
SS 1.5 18.0<br />
LSD(0.10) NS NS<br />
Native Mix (t/ac)<br />
1.1 0.7 1.1<br />
1.4 0.7 1.3<br />
NS NS NS<br />
Precrop Mix (t/ac)<br />
1.9 0.9 1.9<br />
1.7 0.8 2.1<br />
NS
Another factor that may have contributed to the lack <strong>of</strong> significant differences between<br />
the tillage treatment for both the forages and wheat yields was the amount <strong>of</strong> precipitation<br />
received. Table 6 shows the deviation from “normal” rainfall from planting to harvest <strong>of</strong><br />
the spring wheat (forages were usually harvested first but the trends did not differ much).<br />
All but two years at Glenharold and three years <strong>of</strong> the experiment at Knife River had less<br />
than “normal” rainfall as determined by the difference between the long-term average<br />
from nearby National Oceanic and Atmospheric Administration weather stations and the<br />
rain gages set up at each location.<br />
Table 5. Tillage effects on forage and spring wheat yields at the Knife River location.<br />
Year <strong>of</strong> Data<br />
Tillage 1989 1 1990 1991 1992 1993 1994 1995 1 1996 1 Mean<br />
Chisel (CH) - 0.6<br />
Subsoiled (SS) - 1.0<br />
LSD(0.10) 2<br />
NS<br />
CH - 1.1<br />
SS - 1.4<br />
LSD(0.10) NS<br />
CH - 1.2<br />
SS - 1.4<br />
LSD(0.10) - NS<br />
CH - 1.5<br />
SS - 1.8<br />
LCD(0.10) NS<br />
CH - 1.7<br />
SS - 1.6<br />
LCD(0.10) NS<br />
CH 2.7 11.0<br />
SS 10.9 12.8<br />
LCD(0.10) 2.0 NS<br />
Alfalfa (t/ac)<br />
1.0 0.7 1.6 0.9 - - 1.0<br />
0.9 0.8 1.5 1.0 - - 1.1<br />
NS NS NS NS<br />
Native Mix (t/ac)<br />
1.3 0.8 1.3 1.1 - - 1.1<br />
1.5 1.0 1.4 1.1 - - 1.3<br />
NS NS NS NS<br />
Precrop Mix (t/ac)<br />
1.5 1.3 2.0 1.1 - - 1.4<br />
1.6 1.2 1.9 1.0 - - 1.4<br />
NS NS NS
Table 6. Deviation from long-term normal rainfall for the spring wheat crops grown at<br />
the two mineland locations.<br />
Year <strong>of</strong> Data<br />
Location 1989 1990 1991 1992 1993 1994 1995 1996<br />
Deviation from Long-term Normal (in)<br />
Glenharold - 3.1 2.3 - 0.9 - 3.1 ND 1<br />
- 2.3 0.9 ND<br />
Knife River - 1.6 3.4 - 0.7 - 3.8 4.4 - 2.9 2.0 - 0.3<br />
1 No data since the crop was lost due to a hail storm.<br />
Table 7 shows the effects <strong>of</strong> growing the forages either 3 or 6 years on the resultant<br />
spring wheat yields. The below normal rainfall amounts contributed to the below<br />
expected yields at both locations in 1992. The coarser-textured reclaimed soil at Knife<br />
River also contained less available soil water, on average within the subplots, than did the<br />
soils at Glenharold (data not shown) which also contributed to the difference seen in<br />
1992. Although the rainfall amount was below normal in 1994 at Glenharold, this<br />
location had very good yields because <strong>of</strong> excellent stored soil moisture. The significant<br />
differences were believed to have been the result <strong>of</strong> stand variability within the plots<br />
Table 7. Prior cropping effects on spring wheat yields at the Glenharold and Knife River<br />
mineland locations.<br />
Location<br />
Glenharold Knife River<br />
Prior Crop 1 1992 1993 1994 1995 1996 1992 1993 1994 1995 1996<br />
SG 18.7 - 2<br />
57.0 13.0 - 2<br />
22.2 39.6 28.4 29.5 42.3<br />
AL3Y 21.0 - 60.3 8.5 - 13.9 47.7 27.6 32.8 42.4<br />
NM3Y 24.3 - 56.4 12.3 - 19.3 46.2 28.0 33.1 45.1<br />
PM3Y 22.0 - 56.8 11.9 - 13.8 52.6 30.1 33.2 41.6<br />
PW3Y 22.0 - 55.4 12.1 - 17.4 46.6 27.6 31.4 35.7<br />
TW3Y 20.3 - 53.3 15.8 - 18.4 45.4 28.4 32.8 42.6<br />
AL6Y 14.6 - 25.9 46.0<br />
NM6Y 12.0 - 21.5 49.7<br />
PM6Y 11.1 - 24.8 45.8<br />
PW6Y 12.5 - 19.8 44.0<br />
TW6Y 17.9 - 24.5 44.8<br />
LSD(0.10) 3<br />
Spring Wheat Yield (bu/ac)<br />
2.4 - 3.4 2.8 - 1.9 NS NS 2.4 NS<br />
1 SG= small grain, AL= alfalfa, NM= native mix, PM= precrop mix, PW= pubescent<br />
wheatgrass, and TW= tall wheatgrass. 3Y and 6y indicate the number <strong>of</strong> years <strong>of</strong><br />
forage growth before seeding to spring wheat.<br />
2 Crop lost to hail.<br />
3 Least significant difference at the P=0.10 level. NS indicates no significant difference.
since the plots were only fertilized for a 40 bu/ac crop standard. A late seeding date in<br />
1995 at the Glenharold location due to wet conditions resulted in the low yields that were<br />
obtained and probably caused the significant difference seen in Table 7.<br />
The Knife River location plots showed no significance differences among mean values<br />
for prior cropping effect in 1993 and 1994. The main controlling factor for both years<br />
was water availability (both soil and rainfall) for crop growth. The above-normal rainfall<br />
in 1993 was directly responsible for the increased spring wheat yields above the 40 bu/ac<br />
standard. Removal <strong>of</strong> some <strong>of</strong> the fertilizer for the breakdown <strong>of</strong> the forage residues in<br />
1995 caused the 6-year old plots to have significantly smaller spring wheat yields. As<br />
was the case in 1993 and 1994, the main contributing factor controlling yields in 1995<br />
was available water and thus no significant difference were found.<br />
CONCLUSIONS<br />
The initial tillage treatment applied at these two reclaimed mineland locations, chisel and<br />
subsoiling, had no significant effect on forage and spring wheat yields for the following<br />
six years. Traffic across the surface following the initial tillage treatments (including<br />
planting, harvesting, and preparation for the next planting) most likely was the cause <strong>of</strong><br />
no significant differences in bulk densities by depth measured over the years. The data<br />
would also seem to indicate that some reduction in yield for spring wheat would be likely<br />
after forages are grown due to applied fertilizer being used for residue breakdown.<br />
However, by the second year following the conversion from forage to spring wheat, the<br />
spring wheat yields seem to be more dependent upon available water assuming adequate<br />
fertilizer has been applied. Late seeding also resulted in decreased yields since the crop<br />
had to get established during the hotter portion <strong>of</strong> the growing season.<br />
REFERENCES<br />
Barnhisel, R.I., J.L. Powell and W.O. Thom. 1988a. Use <strong>of</strong> s<strong>of</strong>t red winter wheat for<br />
reclamation <strong>of</strong> surface-mined lands in western Kentucky. I. Effects <strong>of</strong><br />
cultivar selection, soil depth and ripping. J. Prod Agric. 1:304-308.<br />
Barnhisel, R.I., J.L. Powell, J.R. Armstrong, M.L. Ellis and F.A. Craig. 1988b. Effect <strong>of</strong><br />
soil depth, liming, and subsoiling <strong>of</strong> reconstructed prime farmland on<br />
alfalfa production. Pp. 266-273. In: 1988 Mine Drainage and <strong>Surface</strong><br />
Mine Reclamation Conference Proceedings. Am. Soc. <strong>Surface</strong> <strong>Mining</strong><br />
and Reclamation, USDI, Pittsburgh, PA. April 17-22, 1988.<br />
Brenneman, W.S. 1991. Soil compaction. J. Soil and Water Conserv. 45(1):3.<br />
Materechera, S.A., A.M. Alston, J.M. Kirby, and A.R. Dexter. 1992. Influence <strong>of</strong> root<br />
diameter on the penetration <strong>of</strong> seminal roots into a compacted subsoil.<br />
Plant and Soil 144:297-303.
Meek, B.D., E.A. Rechel, L.M. Carter, and W.R. Detar. 1988. Soil compaction and its<br />
effect on alfalfa in zone production systems. Soil Sci. Soc. Am. J. 52:232-<br />
236.<br />
Phillips, R.E. and D. Kirkham. 1962. Mechanical impedance and corn seedling root<br />
growth. Soil Sci. Soc. Am. Proc. 26:319-322.<br />
Pikul, J.L. and J.K. Aase. 1999. Wheat response and residual soil properties following<br />
subsoiling <strong>of</strong> a sandy loam in eastern Montana. Soil and Tillage Res.<br />
51(1-2):61-70.<br />
Thompson, P.J., I.J. Jansen, and C.L. Hooks. 1987. Penetrometer resistance and bulk<br />
density procedures for predicting root system performance in minesoils.<br />
Soil Sci. Soc. Am. J. 51:1288-1293.<br />
Voorhees, W. 1990. Winters can’t undo modern compaction. J. Soil and Water<br />
Conserv. 45(6):632.
2000 Billings Land Reclamation Symposium<br />
THREE MINES - THREE CLIMATIC REGIONS<br />
Don A. Dahlgren *<br />
ABSTRACT<br />
A visual comparison (nonscientific review) <strong>of</strong> reclamation efforts in three climatic regions.<br />
Climatic regions for this paper include arid, semi-arid, and tropical. Bentonite mines in Colony,<br />
Wyoming (semi-arid) and Lovell, Wyoming (arid) and a barite mine in Camamu, Brazil (tropical). Brief<br />
history <strong>of</strong> each mine and the method <strong>of</strong> mining. We will discuss soil resource and handling for<br />
revegetation efforts at each mine. Finally, a discussion <strong>of</strong> revegetation practices in each climatic region<br />
and the reclamation performance.<br />
*Environmental Manager, Bentonite Performance Minerals, Belle Fourche, South Dakota 57717.
INTRODUCTION<br />
What is bentonite? Bentonite is a clay mineral that is the result <strong>of</strong> the alteration <strong>of</strong> volcanic ash.<br />
Wyoming bentonite originated from volcanic ash ejected in western Wyoming and Idaho during<br />
the late Cretaceous period about 120 million years ago. Prevailing westerly winds blew the ash<br />
into Mowry Sea that cover most <strong>of</strong> the northern plains. Because <strong>of</strong> the chemical alteration to<br />
the ash by the sea water, Wyoming bentonite is a sodium-based bentonite. Most <strong>of</strong> the<br />
world’s known reserves <strong>of</strong> sodium bentonite are found in the northern great plains <strong>of</strong> the United<br />
States. Bentonite is used in everything from drilling muds to pharmaceutical applications.<br />
What is Barite? Barite is a heavy industrial mineral with specific gravity <strong>of</strong> 4.5. Barite is used<br />
in making paint, drilling mud additive, fine glass, and medical x-ray fluids.<br />
Location<br />
This paper represents reclamation observations made by company personnel at three <strong>of</strong> its<br />
mines. The Colony Mine is 85 miles northeast <strong>of</strong> Gillette, Wyoming, in Wyoming’s Black<br />
Hills - Bentonite Spur District. The Lovell Mine is 100 miles south <strong>of</strong> Billings, Montana in<br />
Wyoming’s Big Horn Basin. Finally, Camamu, Brazil is 650 miles north <strong>of</strong> Rio de Janeiro along<br />
Brazil’s central coast.<br />
Colony is located in a semi-arid climate zone with an annual precipitation <strong>of</strong> 16 inches. Rolling<br />
to flat topography with sagebrush dominate grasslands to rough barren breaks with hardpan soil<br />
conditions. Soils are typically clay-loam with thickness ranging from 5-30 inches. Lovell is<br />
located in an arid climate zone with an annual precipitation <strong>of</strong> 6-8 inches. Soils are typically<br />
sandy-loam with thickness ranging from 2-20 inches. Camamu is located in a tropical climate<br />
zone with an annual precipitation 80 inches. Organic vegetal soil that is less than 6 inches.<br />
Brief History<br />
<strong>Mining</strong> by the company in the Colony district began in the mid 1930's. We built the Colony<br />
Plant and rail line in 1948. Wyoming’s first reclamation regulations were past in 1969. The<br />
majority <strong>of</strong> the land ownership is by private ranchers. Lovell mining began in 1977 and we built<br />
the Lovell Plant in 1981. The plant was temporary shut down between 1986 and 1994.<br />
Bentonite Performance Minerals is the world’s third largest producer <strong>of</strong> bentonite, because <strong>of</strong><br />
production achieved at the Colony and Lovell mines. Camamu began its mining operation in<br />
1953. In the 1980's Brazil past a reclamation law. Three consulting firms conducted several<br />
environmental remediation studies during the 1990's.<br />
Bentonite <strong>Mining</strong> for Colony & Lovell Mines<br />
Bentonite mining is surface cast-back strip mining. A sequence <strong>of</strong> small pits with a volume<br />
between 50,000 and 150,000 yards (2-5 acres in size) is used to mine the clay deposit. BPM<br />
has developed a “tiered” (a stair step) system <strong>of</strong> backfill previous pits with material from the<br />
next pit. This consists <strong>of</strong> placing poor quality spoil from the pit excavation to fill the lower third<br />
<strong>of</strong> the previous pit. The upper portion <strong>of</strong> shale from the next pit is placed on top <strong>of</strong> the poor<br />
quality material. Third lift material (paralithic) immediately below the subsoil from the next
successive pit is then placed on top <strong>of</strong> the upper shale spoil <strong>of</strong> the previous pit. Then we can<br />
haul to the backfill and place subsoil and topsoil on top <strong>of</strong> the third lift material. Overburden<br />
has bentonitic clay lenses that are high in sodium salts. By selectively handling overburden we<br />
can isolate material <strong>of</strong> lower quality from the root zone. The backfills are contoured to blend in<br />
with surrounding topography. As we strip each progressive pit, spoil is used to reclaim the<br />
previous pits in a timely and contemporous manor.<br />
<strong>Revegetation</strong> Efforts for Colony & Lovell Mines<br />
We schedule all permanent revegetation efforts (seedbed preparations and seeding) for the fall<br />
during October-November period <strong>of</strong> each year after the backfill has been contoured and<br />
topsoiled. The fall seeding allows us to maximize water retention <strong>of</strong> the winter and spring<br />
precipitation. In addition, weather conditions and soil conditions during the spring may not<br />
allow farm equipment to properly prepare the seedbed. We conduct all seedbed preparations<br />
on the contour. <strong>Revegetation</strong> <strong>of</strong> the disturbed lands is accomplished by preparing the seedbed<br />
with a spring tooth chisel plow. We have mounted a seedbox onto the chisel plow enabling an<br />
economical one pass seeding operation. The chisel plow creates deep furrows to trap moisture<br />
for the revegetation effort and control erosion.<br />
The Colony Seedmix applied is the following:<br />
Common Name Scientific Name lbs/PLS<br />
Prairie Sandreed Calamovilfa longifolia 2.0<br />
Thickspike Wheatgrass Agropyron dasystachyum 1.5<br />
Western Wheatgrass Agropyron smithii 3.0<br />
Bluebunch Wheatgrass Agropyron spicatum 1.0<br />
Indian Ricegrass Oryzopsis hymenoides 2.0<br />
Green Needlegrass Stipa viridula 1.0<br />
Alkali Sacaton Sporobolus airoides 1.25<br />
Great Basin Wildrye Elymus junceus 0.5<br />
Russian Wildrye Elymus cinerus 1.5<br />
Purple Prairie clover Dalea purpurea 0.25<br />
Fall rye Secale cereale 10.0<br />
Total 25.0<br />
The fall rye is seeded as nurse crop with permanent seedmix. The fall rye protects the soil from<br />
erosion, adds organic mulch, and reduces weed infestation until the permanent vegetation is<br />
established. Permanent vegetation species were selected because <strong>of</strong> their drought and alkaline<br />
tolerance, and we discovered most <strong>of</strong> the species during the baseline study.
The Lovell Seedmix applied is the following:<br />
Common Name Scientific Name lbs/PLS<br />
Gardner Saltbush Atriplex gardneri 7.0<br />
Four-wing Saltbush Atriplex canescens 1.5<br />
Alkali Sacaton Sporobolus airoides 2.0<br />
Bluebunch Wheatgrass Agropyron spicatum 2.5<br />
Indian Ricegrass Oryzopsis hymenoides 2.5<br />
Prairie Sandreed Calamovilfa longifolia 2.0<br />
Russian Wildrye Elymus cinerus 2.5<br />
Total 20.0<br />
Rubber Rabbit brush Chrysothamnus nauseosus is spot seeded on side slopes. Permanent<br />
vegetation species were selected because <strong>of</strong> their drought and alkaline tolerance, and we<br />
discovered most <strong>of</strong> the species during the baseline study.<br />
We can describe the seeding method as broadcasting, and nothing dragged behind the plow to<br />
cover the seeds. We apply no fertilizer, amendments nor irrigation to reclaimed ground. In my<br />
opinion, water is the limiting factor for successful revegetation. By preparing the seedbed to<br />
trap as much moisture as possible until the plant matures with deep roots to reach subsoil<br />
moisture.<br />
<strong>Revegetation</strong> results at Colony are very visible. We have restored the tall grass prairie with a<br />
minor shrub component. Results at Lovell are also impressive by restoring shrub habitat with<br />
an increased grass component compared with the undisturbed land.<br />
Camamu Barite <strong>Mining</strong><br />
The mining operation is located on a small <strong>of</strong>f the coast <strong>of</strong> Brazil. Historically they conducted<br />
mining on two islands. Today mining is limited to the larger island. Small truck- shovel<br />
operation is used to mine barite. Spoil from the advancing pit sequence is used to backfill the<br />
previous pit. The overburden is acidic with high levels <strong>of</strong> aluminum. The backfill is contoured to<br />
reduce erosion. We salvage and stockpiled vegetal soil to be used to reclaim the pit sequence.<br />
<strong>Revegetation</strong> Efforts at Camamu<br />
We construct terraces across the pre-law spoil piles for erosion control. Every ten meters a<br />
tree was transplanted. Small trees (20-30 cm in height) were either purchased, donated or<br />
removed from the advancing pit area to be transplanted. Three species <strong>of</strong> trees were used for<br />
the ongoing revegetation efforts: Dende palm, Eucalyptus, and Pine. A 20X30X10 cm hole was<br />
prepared for each tree. Vegetal soil was placed into the hole to support the small trees. This
gave the trees moisture retaining soil media and nutrients. To protect these trees from the harsh<br />
tropical sun, we constructed a canopy with palm leaves. Between the trees, we transplanted<br />
native sod from the advancing pit area. We worked the area between the transplants to<br />
encourage the invasion <strong>of</strong> native vegetation. Wherever possible furrows were made by the D-6<br />
to breakup the compaction-hardpan and provide increase moisture retention.<br />
<strong>Revegetation</strong> results 90 percent <strong>of</strong> the small trees transplanted have survived. The trees have<br />
grown 300 percent in 8 months. The sod transplants also have a survival rate near 90 percent.<br />
The sod has expanded to cover 20 times the area <strong>of</strong> original transplant size. The reclamation<br />
goal for Camamu mine is to stabilize the disturbed area s, revegetate the land, and establish a<br />
productive post-mine land use. The reforestation the islands will achieve these goals and<br />
provide an income source for the island’s population.
2000 Billings Land Reclamation Symposium<br />
ENHANCING DIVERSITY THROUGH SUBSTRATE VARIABILITY<br />
Douglas E. Romig and David L. Clark 1<br />
ABSTRACT<br />
Reclamation diversity continues to receive much attention in reaction to the apparent<br />
homogeneity <strong>of</strong> many reclaimed rangelands in the west. Despite improved seed mixes and<br />
topsoil handling, reclaimed minelands in New Mexico remain relatively uniform, <strong>of</strong>ten<br />
dominated by a few aggressive grasses and four-wing saltbush. To date, regulators and operators<br />
have primarily focused on species richness or intra-community diversity <strong>of</strong> reclaimed plant<br />
communities, presumably because it is the easiest to evaluate. In conjunction with cautious<br />
suitability guidelines for rootzone reconstruction, this has sometimes led to the reestablishment<br />
<strong>of</strong> a single shrub-grassland plant community. While there are a number <strong>of</strong> parameters that<br />
influence post-mine diversity, we believe the physical and chemical variability <strong>of</strong> soil substrates<br />
is <strong>of</strong>ten overlooked and vital to creating long-term landscape diversity. Native soil-landscapes<br />
exhibit a broad spectrum <strong>of</strong> physio-chemical properties that give rise to large-scale, horizontal<br />
diversity between plant communities. Through the suitability guidelines and soil salvaging<br />
operations, there is a dramatic reduction <strong>of</strong> soil variability from pre-mine soils. Moreover,<br />
baseline information is seldom fully utilized in reclamation plans to increase species diversity or<br />
landscape heterogeneity. In this review <strong>of</strong> soil handling plans at selected mine sites, we critique<br />
the regulatory constraints that guide reclamation toward uniformity. In particular, rules<br />
regarding soil substitution, topsoil redistribution, desired plant community, potentially toxic<br />
materials, and landform reconstruction need to provide more flexibility to build soil-landscapes<br />
that enhance inter-community or horizontal diversity. Opportunities to <strong>of</strong>fset this decrease in the<br />
soil variability will be illustrated while considering agronomic and toxicity issues.<br />
1 Soil Scientist and Ecologist, respectively, NM <strong>Mining</strong> and Minerals Division, 2040 S. Pacheco St.,<br />
Santa Fe, NM 87505.
INTRODUCTION<br />
While numerous studies over the past 25 years have addressed reconstructed minesoils<br />
and their relationship to post-mine diversity and production, reclamation diversity continues to<br />
receive much attention. We’ve been successful establishing minimal diversity within a shrubgrassland<br />
built on clean four foot root zones and seed mixes dominated by selected (aggressive)<br />
grasses. That pattern has demonstrated its limits with respect to horizontal diversity and many<br />
would argue that it needs adjustment.<br />
Post-mine productivity has long been a topic <strong>of</strong> reclamation research. McCormack<br />
(1976), quoted extensively in SMCRA’s preamble, argued for selective handling <strong>of</strong> soils with<br />
maximum potential and productive capacity. Many authors have focused on the minimum soil<br />
replacement depth needed for maximum post-mine productivity in the upper Great Plains<br />
(Merrill et al., 1985; Power et al., 1981; Barth and Martin, 1984). Though actual<br />
recommendations for soil depth depended on post-mining land use and spoil quality, all have<br />
concluded that a deeper soil produces more biomass.<br />
Several authors have focused on varying the reconstructed soil properties and soil<br />
handling methods to increase post-mine diversity. DePuit (1984) recognized a number <strong>of</strong> soil<br />
handling strategies to increase diversity including direct haul, separate lifts <strong>of</strong> soil horizons, use<br />
<strong>of</strong> supplemental materials, depth variation, fertilization/treatment differences, and selective<br />
handling <strong>of</strong> soil types. In reclamation trials in oil shale areas in NW Colorado, soil properties<br />
associated with low productivity (shallow depth, high SAR and elevated coarse fragments)<br />
inhibited grass dominance, resulting in higher diversity (Stark and Redente, 1985; Biondini and<br />
Redente, 1986). A recent double wedge experiment in New Mexico demonstrated that within<br />
five years <strong>of</strong> a uniform seeding, specific spoil/soil depths gave rise to distinct plant communities<br />
(Buchanan et al., 1999).<br />
Topographic effects on water redistribution has been shown to influence species diversity<br />
and production. Stark and Redente (1985) found a significant inverse correlation between a<br />
landscape positions ability to retain or harvest water and species richness measure by the<br />
Shannon Index. Merrill and coworkers (1998) observed those landscape positions that collected<br />
water tended to minimize production differences despite varying subsoil and total soil thickness.<br />
To date, bond release applications approved by the New Mexico <strong>Mining</strong> and Minerals<br />
Division (MMD) have easily met the intra-community (alpha) diversity standards established in<br />
permits. Yet our post-mine plant communities continue to appear rather homogenous, with<br />
minor differences related to planting date and climatic variability during stand establishment.<br />
Prodgers and Keck (1996) attributed the apparent homogeneity to the lack <strong>of</strong> physiognomic<br />
(community structure) differences that are not discernable to the eye, even though measured<br />
floristic differences may be evident. We need to be clear here because we’re comparing apples<br />
and oranges: alpha diversity is being achieved, but we desire more beta or inter-community<br />
diversity. It is our belief that there are two processes working in tandem that continue to guide<br />
us toward uniform appearing post-mine plant communities: homogenous reconstructed soil<br />
materials and “standard” reclamation methods.<br />
Prodgers and Keck (1996) posed the question whether increased diversity on reclaimed<br />
minelands is truly desirable, implying that regulators were unwilling to permit strategies that<br />
would result in increased diversity. In New Mexico, we hope to encourage diversity without it<br />
becoming burdensome in an economic or regulatory sense. We fully understand to enhance<br />
post-mine diversity we must allow flexibility in reclamation plans. Moreover, we must know<br />
what we are capable <strong>of</strong> accomplishing given the tools and materials at our disposal. Here we<br />
examine some premine soil-landscapes to look for clues and opportunities to build more diverse
plant communities and landscapes following mining. We also review the soil handling and<br />
reclamation plans at selected mine sites and critique the regulatory constraints that guide<br />
reclamation toward uniformity.<br />
PREMINE LANDSCAPES & DIVERSITY<br />
Baseline soils and vegetation data are the best means to decipher the intrinsic diversity <strong>of</strong><br />
a native landscape and identify gradients that may increase reclamation diversity. Examination<br />
<strong>of</strong> the physical and chemical variability <strong>of</strong> soils that influence premine plant communities can<br />
assist in the development <strong>of</strong> reclamation plans that may produce greater diversity.<br />
To illustrate how baseline data might be used to help design a diverse and beneficial postmine<br />
landscape, we consider a current case in northwest New Mexico. The Bureau <strong>of</strong> Land<br />
Management recently changed the land use in the vicinity <strong>of</strong> an active coal mine to exclude<br />
grazing and improve mule deer winter range. The original reclamation plan developed by the<br />
mine operator for a grazing post-mine land use must now be revised for wildlife exclusively.<br />
This presented an opportunity to consider alternative reclamation methods that could potentially<br />
create more post-mine diversity and support wildlife.<br />
The premine toposequence illustrates the relationship between genetic soil (A & B<br />
horizons) depth and differing plant communities (Figure 1). The Pinon-Juniper woodland was a<br />
major premine community<br />
found on shallow, gravelly<br />
soils on ridges and shoulder<br />
slopes. Portions <strong>of</strong> the P-J<br />
type were chained in 1961,<br />
and these areas subsequently<br />
developed into highly<br />
diverse mixed-shrub<br />
communities. Moving<br />
downslope, Sagebrushgrassland<br />
and Grassland<br />
communities occupied<br />
Pinyon-Juniper<br />
& P-J Chained<br />
Lithic<br />
Torriorthents<br />
Sage Grassland<br />
Ustollic Orthids & Argids<br />
Greasewood/Sage<br />
Ustic Torrifluvents<br />
Sage Grassland<br />
Ustollic Orthids<br />
Figure 1: Toposequence <strong>of</strong> premine soils and<br />
associated plant communities in NW New Mexico.<br />
Genetic soil (A & B horizons) are indicated by clear<br />
portion <strong>of</strong> the figure<br />
deeper Aridisols <strong>of</strong> alluvial fans and upland valleys. In upland drainages, arroyos, and swales,<br />
deep alluvial Fluvents support shrubland communities <strong>of</strong> greasewood and sagebrush.<br />
Similarities between the premine plant communities are given in Table 1. Despite the<br />
moderately high level <strong>of</strong> similarity as measured by Sorenson’s (1948) Index, when one views the<br />
premine landscape it is easy to discern the different plant communities. This physiognomic<br />
Table 1: Sorenson’s Index <strong>of</strong> Similarity for premine plant communities in NW New Mexico<br />
Plant Community Pinon-Juniper P-J Chained Grassland Sage Grassland<br />
P-J Chained 0.70 -<br />
Grassland 0.47 0.53 -<br />
Sage Grassland 0.66 0.61 0.67 -<br />
Greasewood/Sage 0.64 0.55 0.62 0.76<br />
diversity is certainly what most reclamationists would like to recreate, but we must recognize<br />
that the species differences are not that extreme.
In desert ecosystems <strong>of</strong> North America, soil<br />
salinity, sodicity and cation relationships have been<br />
shown to affect plant distributions and species<br />
diversity, especially at the landscape scale<br />
(Wallace et al., 1973; Franco-Vizcaino et al.,<br />
1993). Gates and others (1956) found significant<br />
edaphic differences between soils occupied by<br />
various shrub species in Utah, though no one<br />
species was completely restricted by a narrow<br />
range <strong>of</strong> a specific soil factor. Sagebrush and<br />
winterfat distribution were restricted by relatively<br />
high levels <strong>of</strong> salinity and sodium. Shadscale<br />
typically occupied soils with more intermediate<br />
levels <strong>of</strong> salt and sodium in the subsurface. Soils<br />
under greasewood were <strong>of</strong>ten, though not<br />
exclusively, high in salt throughout and alkaline<br />
below 6 in. (Gates et al., 1956).<br />
Examination <strong>of</strong> the soil physical and<br />
chemical properties in the northwest NM premine<br />
toposequence (Figure 2) shows similar plant-soil<br />
relationships as described by Gates et al. (1956).<br />
For EC and SAR, variability increases both within<br />
and between soils as one moves downslope. While<br />
Greasewood-sagebrush communities may not be<br />
desirable in a reclaimed landscape, they are found<br />
on soils that are saline-alkali, especially at depth.<br />
This suggests that it may be necessary to have<br />
higher EC and sodicity in the lower portions <strong>of</strong> the<br />
reconstructed soil for certain post-mine plant<br />
communities.<br />
Clay at depth is typical <strong>of</strong> well developed<br />
Aridisols with argillic horizons. In this landscape,<br />
argillic clay <strong>of</strong>ten occurs under Sagebrush<br />
grasslands (Figure 2). Current suitability standards<br />
restrict material >45% clay, presumably for<br />
agronomic and permeability reasons. Rejection <strong>of</strong><br />
certain spoil materials could be a consequence <strong>of</strong><br />
sample collection and preparation techniques (i.e.<br />
over-grinding) that may mask the positive effects<br />
<strong>of</strong> coarse fragments and minimal weathering that<br />
alleviate compaction and permeability problems.<br />
Soil reactivity appears to be uniformly<br />
alkaline across the landscape. Opportunities to<br />
introduce some habitat diversity based on acidic<br />
soil pH exist when one considers the expected<br />
70<br />
60<br />
50<br />
40<br />
30<br />
20<br />
10<br />
0<br />
25<br />
20<br />
15<br />
Pinyon-Juniper<br />
& P-J Chained<br />
Suitability Limit<br />
Marginal Soil<br />
10<br />
5<br />
0<br />
9.5<br />
8.5<br />
7.5<br />
6.5<br />
5.5<br />
4.5<br />
3.5<br />
80<br />
70<br />
60<br />
50<br />
40<br />
30<br />
20<br />
10<br />
Spoil Limit<br />
Good<br />
Suitability Limits<br />
Suitability Limit<br />
Sage Grassland<br />
Greasewood/Sage<br />
0<br />
Orthents Orthids & Argids Fluvents Spoil<br />
Figure 2: Physio-chemical variability<br />
<strong>of</strong> selected soils along a premine<br />
toposequence. Weighted average for<br />
salvageable topsoil indicated by<br />
marker; lines show variability within<br />
soil pr<strong>of</strong>ile. Expected spoil<br />
variability on far right from premine<br />
variability <strong>of</strong> the spoil materials (Figure 2). Fortunately the spoils also have low acid generation<br />
potential. But with a truck-shovel operation, it is expected that only small areas <strong>of</strong> lower pH<br />
areas will occur sporadically in the regrade. The use <strong>of</strong> spoil pH as a gradient seems unlikely.
Figure 2 demonstrates that native plant communities in New Mexico <strong>of</strong>ten thrive on what<br />
the current guidelines and rules consider unsuitable. Suitability standards truncate the natural<br />
variability <strong>of</strong> soils and may need to be revisited if we desire reclamation diversity. For example,<br />
State and Federal single-factor suitability guidelines for sodicity were originally developed from<br />
agricultural standards (SAR=13) and modified for the purposes <strong>of</strong> SMCRA. New Mexico has<br />
graduated SAR suitability thresholds linked to clay content, but sodicity hazards are dependent<br />
on several other factors including pH, EC, mineralogy and soil-water regime (Munk, 1996).<br />
More recent agricultural standards recognize that relatively high levels <strong>of</strong> sodicity (e.g.,<br />
SAR=40) are tolerable in the lower root zone when one considers other soil properties in the<br />
hazard assessment (Munk et al., 1999).<br />
POST-MINE DIVERSITY<br />
In New Mexico, we have been pleased by the level <strong>of</strong> alpha diversity on much <strong>of</strong> our<br />
reclaimed lands. Given that, we would still like to have more horizontal, inter-community<br />
diversity in reclamation within the liability period without imposing additional standards.<br />
In the premine landscape, we discovered some opportunities to manipulate certain soil<br />
gradients that give rise to distinct plant communities: soil depth, texture, salinity and sodicity.<br />
But the gradients in native landscapes are quite different than those we encounter in reclaimed<br />
soils. Naturals soils are highly correlated to landscape position and vary less on a local scale.<br />
Properties <strong>of</strong> reclaimed soils vary across short distances from 1-10 m, while total variation is<br />
reduced on a larger scale (Schafer, 1979). Moreover, most minesoils properties have a weak<br />
spatial correlation at best, <strong>of</strong>ten exhibiting random variation horizontally (Keck et al., 1993;<br />
Keck and Wraith, 1996). The resultant gradients for plants in reclamation are both reduced and<br />
less connected than in natural landscapes (Prodgers and Keck, 1996). Suitability guidelines<br />
further constrain potential landscape variability as spoil and mitigation materials must meet a<br />
narrower set <strong>of</strong> criteria. As reclamationists, we need to overcome the homogenization <strong>of</strong><br />
mining/reclamation process if we desire more post-mine diversity.<br />
It goes without saying that the factors that created a diverse native landscape (parent<br />
material, organisms, climate, topography, and time) will not assist us much during the liability<br />
period. Because spoils and reclaimed soils are intimately mixed, we must create more dramatic<br />
soil habitat variations in reclamation if horizontal diversity is a goal. This may require regulators<br />
to rethink performance and suitability standards while asking the question what is truly<br />
phytotoxic or inhibits plant establishment so that the post-mining land use is not achieved.<br />
Regulators, however, cannot go it alone; operators need to propose alternative plans that enhance<br />
diversity that work within their specific mine operations.<br />
For example, uniform soil replacement depth has been a standard reclamation method for<br />
the past 20 years. Uniform topdressing thickness makes for easy permit review and inspection,<br />
but it is a relic and slight misinterpretation <strong>of</strong> McCormack’s (1976) observations on Eastern<br />
reclamation methods where the A and B horizons are segregated. McCormack’s focus was on<br />
post-mine productivity, which has been shown to exclude diversity (Stark and Redente, 1985;<br />
Prodgers and Keck, 1996). He also suggested that only topsoil be uniformly returned and the B<br />
horizon material be place on the graded spoil “to the planned thickness to form the subsurface<br />
horizons.” One final note about uniformity – only with respect to soils is it applied in the rules<br />
and uniformity is clearly discouraged for slopes and stream channels.<br />
Returning to our example in northwest NM, standard topsoil replacement methods would<br />
likely recreate post-mine soils that have six inches <strong>of</strong> topsoil over 42 inches <strong>of</strong> neutral spoil.
Physically, the reconstructed soil would<br />
resemble those associated with Sagebrushgrasslands<br />
with deep effective root zones<br />
but modest genetic soil materials (Figures<br />
3). To expect greater diversity beyond the<br />
inherent richness <strong>of</strong> the Sagebrushgrassland<br />
and the reclamation seed mix<br />
would be unreasonable.<br />
A possible reclamation plan that<br />
would, in the view <strong>of</strong> the MMD, lead to<br />
successful achievement <strong>of</strong> the post-mine<br />
land use might include the following. The<br />
re-establishment <strong>of</strong> Pinyon-Juniper<br />
woodlands would be both difficult and <strong>of</strong><br />
questionable value for the mule deer winter<br />
range land use, and the PJ type is<br />
abundantly available on unmined lands in<br />
the area. Reclamation that emulates the<br />
70<br />
60<br />
50<br />
40<br />
30<br />
20<br />
10<br />
0<br />
Pinyon-Juniper<br />
& P-J Chained<br />
Outcrop<br />
Sage Grassland<br />
Greasewood/Sage<br />
Orthents Orthids & Argids Fluvents<br />
Figure 3: Soil depth along a topographic<br />
gradient in NW New Mexico. Genetic (A &<br />
B) horizons are clear portion <strong>of</strong> bars.<br />
Shaded portion is the effective depth <strong>of</strong><br />
the pr<strong>of</strong>ile. Typical reclaimed soil on<br />
PJ-chained type could be accomplished by establishing a half-dozen shrub species, along with<br />
four or five taxa each <strong>of</strong> relatively noncompetitive grasses and forbs. Since spoil materials are<br />
not consolidated enough to be considered paralithic (Keck et al., 1993), this community may<br />
require a thin veneer <strong>of</strong> topdressing (12” topsoil) could be seeded with more<br />
aggressive, alkali-tolerant (and perhaps non-native) wheatgrasses, ryegrasses, and rhizomatous<br />
forbs. Within this matrix, occasional rock piles, ledges, talus slopes, and small depressions<br />
would further enhance vegetative diversity and wildlife habitat.<br />
The past 20 years <strong>of</strong> coal mine reclamation history has shown that if enhancing diversity<br />
requires an excessive amount <strong>of</strong> paper work, it rarely happens. The key to making the plan<br />
become reality is to create a framework that will allow the operator to construct the various<br />
reclaimed communities and features without the need for constant permit modification, and that<br />
simultaneously gives the regulatory authority assurance that the reclamation plan is being<br />
followed. Narrative descriptions <strong>of</strong> the topographical settings and the approximate sizes that<br />
will be targeted for the reclaimed communities and features give the operator more flexibility<br />
than maps. Adequate detail should be provided in the reclamation plan so that an inspector can<br />
verify that an approved procedure was or is being used at any given location.<br />
Establishing different technical standards or reference areas for comparison with each<br />
reclamation community will probably be advantageous, particularly with respect to stocking and<br />
production. As seen in Table 1, premine communities as visibly different as Pinyon-Juniper and<br />
Grassland may share fifty percent <strong>of</strong> their species composition. Communities with more similar<br />
physiognomy are even more similar in terms <strong>of</strong> species makeup. It seems unlikely that<br />
revegetation efforts would result in greater inter-community (beta) diversity than existed prior to<br />
disturbance <strong>of</strong> “native” communities. The establishment <strong>of</strong> inter-community species diversity<br />
Reclaim
standards for reclaimed areas therefore seems unreasonable, and establishing the approved<br />
species on the approved acreage should be considered satisfactory. The exclusion from<br />
quantitative revegetation standards for roads, water bodies, and rock piles can and should be<br />
extended to other small diversity enhancing features.<br />
SUMMARY<br />
The following are a sample <strong>of</strong> strategies that have been (or could be) employed by coal mine<br />
operators and regulatory authorities in an attempt to increase post-mine diversity and the<br />
achievement <strong>of</strong> the post-mine land use:<br />
Reclamation Plans<br />
1. Create dramatic variations in soils to enhance horizontal diversity using chemical and<br />
physical soil properties.<br />
2. Vary soil depths according to topographic position and aspect and tailor seed mixes to soil<br />
depths as previously described. Consider hydrologic properties <strong>of</strong> various landscape<br />
positions and their contribution to post-mine diversity.<br />
3. Use specialized seed mixes <strong>of</strong> saline- or alkali-adapted species on reclaimed areas having<br />
marginally suitable spoil within the root zone.<br />
4. Avoid soil laydown on erosion control terraces and transplant shrubs directly in spoil. The<br />
terraces concentrate soil moisture, and soil is deposited from adjacent slopes over time. The<br />
temporary absence <strong>of</strong> topdressing favors shrub establishment. Small depressions provide<br />
similar advantages for vegetation requiring mesic soils.<br />
5. Create ledges, outcrops, and talus slopes. These features do not have to be particularly high<br />
or extensive to provide habitat diversity for plants and animals. Ten to fifteen-foot relief is<br />
ample, and even ledges that are three or four feet tall can trap snow and provide burrowing<br />
sites. The key to incorporating these features during reclamation is to permit opportunistic<br />
construction where competent rock is available.<br />
6. Expand the seeding window to allow early spring and late fall seedings. Designate substitute<br />
species and seeding rate ranges, so that operators can take advantage <strong>of</strong>, rather than be<br />
troubled by, variations in weather, soil moisture, topdressing and seed bank sources (e.g.,<br />
stockpiled or live-hauled, weedy or pristine), and seed availability.<br />
7. Make reclamation plans flexible by describing methods to be applied to and take advantage<br />
<strong>of</strong> certain regraded landforms rather than using maps. Minimize the need for permit<br />
modifications.<br />
8. Be patient whenever non-uniform reclamation is attempted. Establishment <strong>of</strong> the desired<br />
species <strong>of</strong>ten takes three to five years harsher sites.<br />
Regulatory Considerations<br />
1. Encourage the use <strong>of</strong> soil substitute materials at any time rather than when there is a deficit<br />
<strong>of</strong> topsoil. These materials are <strong>of</strong>ten more coarse textured and skeletal, and can be used to<br />
armor slopes or replicate paralithic/torric soil conditions.<br />
2. Revisit spoil/soil suitability standards and have them capture more <strong>of</strong> the variability found in<br />
premine soils. Keck and Wraith (1996) suggest that clear distinctions be made in suitability<br />
criteria between properties that severely limit plant growth or present environmental hazards<br />
and those that represent the normal variability found in native soil landscapes. Allow for a
small percentage <strong>of</strong> inhibitory soil properties to occur in the reclamation based on the<br />
distribution <strong>of</strong> native soil properties.<br />
3. Use multiple factors rather than single factors to determine hazard associated with marginal<br />
soil chemistry components such as SAR and selenium.<br />
4. Promote variable rather than uniform topdressing replacement in order to resemble premine<br />
soil landscapes.<br />
REFERENCES<br />
Barth, R.C. and B.K. Martin. 1984. Soil depth requirements for vegetation <strong>of</strong> surface-mined areas in Wyoming,<br />
Montana and North Dakota. JEQ 13:399-404.<br />
Biondini, M.E., and E.F. Redente. 1986. Interactive effect <strong>of</strong> stimulus and stress on plant community diversity in<br />
reclaimed lands. Reclamation & Reveg. Res. 4:211-222.<br />
Buchanan, B., T Ramsey and D. Romig. 1999. Building a foundation for diversity. Paper presented at the <strong>OSM</strong><br />
Interactive Forum: Approaching bond release. Sept. 1999. Flagstaff, AZ.<br />
DePuit, E. J. 1984. Potential topsoiling strategies for enhancement <strong>of</strong> vegetation diversity on mined lands. In F.F.<br />
Munshower and S.E. Fischer (eds.) Third Biennial Symp. on <strong>Surface</strong> Coal Mine Reclamation on the Great Plains.<br />
Billings, MT<br />
Franco-Vizcaino, E., R. Graham and E. Alexander. 1993. Plant species diversity and chemical properties <strong>of</strong> soils in<br />
the central desert <strong>of</strong> Baja California, Mexico. Soil Sci 155:406-416.<br />
Gates, D.H., L.A. Stoddart and C.W. Cook. 1956. Soil as a factor influencing plant distribution on salt deserts <strong>of</strong><br />
Utah. Ecol. Mono. 26:155-175.<br />
Keck, T.J. and J.M. Wraith. 1996. Variations among different reclamation materials ar Western Energy’s Rosebud<br />
Mine. In F.F. Munshower and S.E. Fischer (eds.) Planning, Rehabilitation and Treatment <strong>of</strong> Disturbed Lands, 7 th<br />
Billings Symp., Billings, MT.<br />
Keck, T.J. W.F. Quimby and G.A. Nielsen. 1993. Spatial distribution <strong>of</strong> soil attributes on reconstructed minesoils.<br />
Soil. Sci. Soc. Am. J. 57:782-786.<br />
Merrill, S.D., R.F. Ries and J.D. Power. 1998. Subsoil characteristics and landscape position affect productivity <strong>of</strong><br />
reconstructed mine soils. Soil Sci. Soc. Am. J. 62:263-271.<br />
Merrill, S.D., S.J. Smith and J.D. Power. 1985. Effect <strong>of</strong> disturbed soil thickness on soil water use and movement<br />
under perennial grass. Soil Sci. Soc. Am. J. 49:196-202.<br />
Munk, L.P. 1996. Sodicity and salinity in mined land reclamation. In F.F. Munshower and S.E. Fischer (eds.)<br />
Planning, Rehabilitation and Treatment <strong>of</strong> Disturbed Lands, 7 th Billings Symp., Billings, MT.<br />
Munk, L.P., D.E. Romig, and M.D. Coates. 1999. Spoil sodicity standards: Reconciling science and regulation. In<br />
Proc. Am. Soc. <strong>Surface</strong> <strong>Mining</strong> Reclamation 16 th Annual Mtg. Scotsdale, AZ.<br />
Power, J.D., F.M. Sandoval, R.F. Ries and S.D. Merrill. 1981. Effect <strong>of</strong> topsoil and subsoil thickness on soil water<br />
content and crop production on a disturbed soil. Soil Sci. Soc. Am. J. 45:124-129.<br />
Prodgers, R.A. and T.J. Keck. 1996. Vegetation diversity concepts and strategies for reclamation. In F.F.<br />
Munshower and S.E. Fischer (eds.) Planning, Rehabilitation and Treatment <strong>of</strong> Disturbed Lands, 7 th Billings<br />
Symp., Billings, MT.<br />
Schafer, W.M. 1979 Variability <strong>of</strong> minesoils and natural soils in SE Montana. Soil Sci. Soc. Am. J. 43:1207-1212.<br />
Sorenson, T. 1948. A method for establishing groups <strong>of</strong> equal amplitude. I. Plant sociology based on similarity <strong>of</strong><br />
species content. Det. Kong. Danske Vidensk. Selsk Biol. Skr. 5:1-24.<br />
Stark, J.M., and E.F. Redente. 1985. Soil-plant diversity relationships on a disturbed site in northwestern Colorado.<br />
Soil Sci. Soc. Am. J. 49:1028-1034.<br />
Wallace, A., E.M. Romney and V.Q. Hale. 1973. Sodium relations in desert plants: I. Cation contents <strong>of</strong> some plant<br />
species from the Mojave and Great Basin deserts. Soil Sci. 115:284-287.
2000 Billings Land Reclamation Symposium<br />
THE EFFECTS OF VARYING TOPSOIL REPLACEMENT DEPTH ON<br />
VARIOUS PLANT PARAMETERS WITHIN RECLAIMED AREAS<br />
Brenda K. Schladweiler 1 , Larry C. Munn 2 , Rose Haroian 3 , and Scott Belden 3<br />
ABSTRACT<br />
Within native ecosystems, plant cover, production and diversity are <strong>of</strong>ten affected by the<br />
amount, type and quality (physical and chemical) <strong>of</strong> the topsoil present. Reclaimed areas at<br />
coal mines have federally mandated post-mining cover and production standards which are not<br />
difficult to meet; however, pre-mine levels <strong>of</strong> plant diversity have been difficult to attain.<br />
According to current mining regulations, a uniform topsoil replacement depth must be utilized<br />
over a given mine permit area. For mine permit areas that have widely varying topsoil depths<br />
within large portions <strong>of</strong> their permit area, this poses significant complications from a mine<br />
planning standpoint. Approving variances for such conditions <strong>of</strong> existing coal mines <strong>of</strong>ten<br />
results in concerns from the Wyoming Department <strong>of</strong> Environmental Quality. Widely varying<br />
topsoil availability is inherent to abandoned mine situations where topsoil is <strong>of</strong>ten lacking or very<br />
limited.<br />
In order to address concerns over utilizing varying topsoil replacement depth within a given<br />
permit area to enhance plant diversity, a study was funded by the Wyoming Abandoned Coal<br />
Mine Land Research Program (ACMLRP) to: 1) determine if shallower replacement depths <strong>of</strong><br />
topsoil enhance plant species diversity; 2) determine if shallower replacement depths <strong>of</strong> topsoil<br />
affect vegetation cover and production; 3) evaluate the quality <strong>of</strong> replaced topsoil through time<br />
and between variable replacement depths; and based on these findings, 4) determine if variable<br />
soil replacement depths enhance the development and/or differentiation <strong>of</strong> post-mine vegetation<br />
communities.<br />
Information derived from this study will be used to quantitatively assess the issue <strong>of</strong> variable<br />
topsoil replacement depths and resulting plant diversity, as well as other vegetation parameters.<br />
This issue is currently a concern within the state’s mining industry, as well as the regulatory<br />
authority. Information from this study will be used to assess the direction <strong>of</strong> future reclamation<br />
work regarding vegetation/topsoil issues.<br />
Study site construction was completed in Fall 1999. Data collection will be initiated in Summer<br />
2000 and extend through Summer 2002. This paper presents the status <strong>of</strong> the project to date.<br />
____________________<br />
1 BKS Environmental Associates, Inc., Gillette, WY 82717-3467<br />
2 Department <strong>of</strong> Renewable Resources, University <strong>of</strong> Wyoming, Laramie, WY 82071<br />
3 Powder River Coal Company, Gillette, WY 82717
INTRODUCTION<br />
In order to address concerns over utilizing varying topsoil replacement depth within a given<br />
permit area to enhance plant diversity, a study was funded by the Wyoming Abandoned Coal<br />
Mine Land Research Program to: 1) determine if shallower replacement depths <strong>of</strong> topsoil<br />
enhance plant species diversity; 2) determine if shallower replacement depths <strong>of</strong> topsoil affect<br />
vegetation cover and production; 3) evaluate the quality <strong>of</strong> replaced topsoil through time and<br />
between variable replacement depths; and based on these findings, 4) determine if variable soil<br />
replacement depths enhance the development and/or differentiation <strong>of</strong> post-mine vegetation<br />
communities.<br />
Based on these objectives, the following specific null hypotheses will be tested: 1) variable<br />
topsoil replacement depths do not influence vegetation cover and production; 2) variable topsoil<br />
replacement depths do not influence plant diversity; and 3) quality, in terms <strong>of</strong> electrical<br />
conductivity and pH, <strong>of</strong> the replaced topsoil layer will not deteriorate with topsoil depth.<br />
ACTIVITY SUMMARY TO DATE<br />
This project has been divided into three major tasks. This does not include summarization <strong>of</strong><br />
the data on an annual basis and disseminating information to interested parties, both ACMLRP<br />
funding requirements.<br />
Task I, Review Existing Vegetation/Soil Information<br />
Previous topsoil depth studies on mined lands have included, in part: DePuit 1984; Doll, et al.<br />
1984; Faught 1989; Fox 1993; Halvorson, et al. 1986; Oddie and Bailey 1988; and Schuman,<br />
et al. 1985. Previous literature was reviewed in addition to Wyoming Department <strong>of</strong><br />
Environmental Quality, Land Quality Division (WDEQ-LQD) mine permit volumes (Appendix<br />
D-8, Vegetation, and D-7, Soil) and annual reports for various mines throughout the state on<br />
record at the WDEQ-LQD <strong>of</strong>fices in Cheyenne, Sheridan (for Campbell County), and<br />
Cheyenne (for Converse County).<br />
Task II, Establish and Construct the Study Site<br />
The study site is located on the Rochelle Mine which is approximately 10 miles southeast <strong>of</strong><br />
Wright, Wyoming. Refer to Figure 1. Rochelle Mine provided the equipment and manpower<br />
necessary to construct the field site. Site selection was determined by specific mine limitations,<br />
i.e., spoil grading, spoil sampling, topsoil/seeding contractor schedules.<br />
The study site location was rough graded in Spring 1998. Block construction activities were<br />
conducted from late August to October 1998 with the exception <strong>of</strong> the cover crop seeding<br />
which was conducted in early December 1998. A two year extension on this project enabled<br />
the cover crop aspect <strong>of</strong> typical reclamation at the Rochelle Mine to be maintained. The<br />
permanent reclamation seed mix was seeded in late November 1999 and was derived to<br />
represent the pre-mining Breaks Grassland vegetation type. Within the time frame <strong>of</strong> the study,
the permanent reclamation will be evaluated for three growing seasons (2000, 2001, and<br />
2002).<br />
The area was mowed during the 1999 growing season (mid-July). Mowing <strong>of</strong> the cover crop is<br />
a normal practice at the Rochelle and North Antelope Mines to reduce competition from the<br />
barley stubble with the permanent seed mix.<br />
The chosen design alternative was randomized complete block (RCB) and was chosen based<br />
on mine limitations with equipment and available area. Within the RCB, one contiguous<br />
rectangular area was selected within the reclaimed topography with three distinct replicate<br />
blocks. Refer to Figure 2 which also depicts 1998 soil sample locations. Treatment<br />
alternatives included: 1) 22 inch “designated permit” replacement depth; 2) 12 inch<br />
replacement depth; and 3) 6 inch replacement depth. The treatment blocks were constructed<br />
on: 1) a uniform site to control variables other than topsoil depth (e.g., similar slope, aspect,<br />
stockpiled topsoil source, and seed mix); and 2) a landscape position that would best represent<br />
a pre- and post-mine Breaks Grassland community. Slopes were generally 5:1 and westfacing.<br />
The three designated depths were approximate over the treatment replicate and will<br />
have minor variation based on weather limitations present during 1998, topsoil source, and<br />
equipment utilized for topsoil replacement.<br />
Treatment replication dimensions were 175 feet by 250 feet. A 25 foot buffer strip on all sides<br />
<strong>of</strong> the treatment replication was considered to minimize edge effect between replications due to<br />
equipment limitations. Therefore, a sample area <strong>of</strong> 125' x 200' was created within each<br />
treatment replication. Corners <strong>of</strong> treatment replicates were staked with appropriate depth<br />
indicators for equipment operators. Both Rochelle and BKS personnel were present during the<br />
course <strong>of</strong> study area construction to visually ensure proper depth placement.<br />
Normal backfill suitability sampling <strong>of</strong> the study site was conducted by Rochelle Mine on 500<br />
foot centers prior to topsoil placement. Refer to Table 1 for analysis. Approximate three-yearold<br />
stockpiled material was utilized for this area and was previously removed from former<br />
Breaks Grassland topography. Soils within undisturbed Breaks Grassland type consist <strong>of</strong><br />
shallow entisols on side slopes and hill tops with moderately deep to deep entisols on fans and<br />
narrow drainages.<br />
Existing Breaks Grassland and Upland Grassland native reference areas will be used to<br />
distinguish plant community development and differentiation between treatments. The RCB<br />
design was utilized in these native areas as much as possible. Three distinct areas were chosen<br />
in each reference area to represent the general slope, aspect and soil depth found in the<br />
reclaimed portion <strong>of</strong> the study. Within these three areas, general replication <strong>of</strong> the 22, 12, and<br />
6 inch blocks were chosen, wherever possible.<br />
In order to establish baseline soil fertility status at the reclaimed area treatments and reference<br />
areas, a minimum <strong>of</strong> 2 sample locations were collected within each reclaimed treatment<br />
replication. For general comparison purposes only, two samples within each <strong>of</strong> two native
areas by soil depth were also gathered. Samples, at six-inch increments, were collected at 2<br />
random locations within each respective treatment block before cover crop seeding on<br />
reclaimed areas in 1998. In the reference areas, samples were collected by horizon up to<br />
paralithic contact. Analysis parameters followed Table I-3 in WDEQ-LQD, Guideline 1<br />
(1994). Listed analysis parameters include: organic matter, pH, electrical<br />
conductivity (EC), nitrate-nitrogen, phosphorus, potassium, soluble cations: calcium (Ca),<br />
magnesium (Mg), and sodium (Na), sodium adsorption ratio, texture and particle size analysis.<br />
The University <strong>of</strong> Wyoming Soil Testing Laboratory conducted the analysis. Refer to Table 2<br />
for results.<br />
The study site, including treatments, were marked after permanent reclamation seeding in<br />
November 1999. Original corners were surveyed by Rochelle personnel and were easily<br />
remarked after equipment disturbance.<br />
Task III, Obtain Quantitative Information<br />
Vegetation and soil information gathering will be initiated in summer 2000. Field data collection<br />
will be conducted in 2000, 2001 and 2002. Cover, production, and plant diversity will be<br />
evaluated over all treatment levels.<br />
REFERENCES<br />
DePuit, E.J. 1984. Potential Topsoiling Strategies for Enhancement <strong>of</strong> Vegetation<br />
Diversity on Mined Lands. Proc. <strong>of</strong> the 3 rd Billings Symposium on <strong>Surface</strong> Coal<br />
Mine Reclamation in the Great Plains, Billings, MT.<br />
Doll, E.C., S.D. Merrill, and G.A. Halvorson. 1984. Soil Replacement for Reclamation<br />
<strong>of</strong> Stripmined Lands in North Dakota. North Dakota State Agricultural<br />
Experiment Station Bulletin 514, Fargo, ND. 23 p.<br />
Faught, C.K. 1989. Effects <strong>of</strong> Selectively Handling Topsoil on Edaphic Conditions for<br />
<strong>Revegetation</strong>. University <strong>of</strong> Wyoming, Department <strong>of</strong> Plant, Soil and Insect<br />
Sciences, MS Thesis.<br />
Fox, D. 1993. Soil Depth and Herbaceous Yield Relationships on Reclaimed <strong>Surface</strong><br />
Mined Lands in North Dakota. North Dakota State University, Department<br />
Animal and Range Sciences, MS Thesis.<br />
Halvorson, G.A. and et al. 1986. Topsoil and subsoil thickness requirements for<br />
reclamation <strong>of</strong> nonsodic mined-land. Soil Sci. Soc. Am. 50 (Mar/Apr):419-422.<br />
Oddie, T.A. and A.W. Bailey. 1988. Subsoil Thickness Effects on Yield and Soil Water<br />
when Reclaiming Sodic Minespoil. J. Environ. Qual. 17(4):623-627.
Schuman, G.E., E.M. Taylor, Jr., F. Rauzi and B.A. Pinchak. 1985. <strong>Revegetation</strong> <strong>of</strong><br />
Mined Land: Influence <strong>of</strong> Topsoil Depth and Mulching Method. J. <strong>of</strong> Soil and<br />
Water Conser. (March-April):249-252.<br />
Wyoming Department <strong>of</strong> Environmental Quality-Land Quality Division. 1994c.<br />
Guidelines 1, 2, and 14.
T52N<br />
Powder River Coal-<br />
Rawhide<br />
T50N<br />
T48N<br />
T46N<br />
T44N<br />
T42N<br />
Ruhr-<br />
Eagle Butte<br />
Kennecott-<br />
Fort Union Pit 2<br />
Jun 1999<br />
Vulcan-Buckskin<br />
Hwy. 14-16<br />
Ruhr-Belle Ayr<br />
Wright<br />
Hwy.<br />
387<br />
Gillette<br />
Hwy. 59<br />
Hwy. 59<br />
Arco-Black Thunder<br />
Vulcan-North Rochelle<br />
Powder River Coal-<br />
North Antelope/Rochelle<br />
Complex<br />
BN/C&NW<br />
R71W R70W<br />
Phillips/WFA-<br />
Dry Fork/East Gillette Federal<br />
Kfx (Fuels)-<br />
Fort Union Pit 1<br />
Wyodak-<br />
Clovis Point<br />
Black Hills-Wyodak<br />
BN Only<br />
BN/C&NW<br />
I-90<br />
BNRR<br />
Powder River Coal - Caballo<br />
Kennecott<br />
Cordero Rojo<br />
Arco-Coal Creek<br />
Kerr McGee-<br />
Jacobs Ranch<br />
Hwy.450<br />
Kennecott-Antelope<br />
Campbell County<br />
Converse County<br />
FIGURE 1. LOCATION OF<br />
NORTH ANTELOPE/ROCHELLE<br />
PERMIT AREA<br />
WITHIN<br />
EASTERN POWDER RIVER<br />
BASIN<br />
Idaho<br />
Campbell County<br />
Utah<br />
Montana<br />
Colorado<br />
Nebraska South Dakota<br />
Denotes Active Mine
Table 1. 1998 Backfill Suitability Analysis in the Vicinity <strong>of</strong> the AML Variable Topsoil Study (WDEQ-LQD Guideline 1, 1994).<br />
Location Depth<br />
(ft)<br />
pH EC<br />
mmhos/cm<br />
SAR TOC % Total S<br />
%<br />
Total S ABP<br />
t/1000t<br />
Nitrate N<br />
ppm<br />
98BF27 0-2 7.8 1.23 7.61 5.6 0.05 11.6 2.90 0.11<br />
2-4 7.9 1.42 8.72 6.1 0.06 4.24 6.70 0.14<br />
98BF28 0-2 7.5 1.55 5.89 6.6 0.13 2.81 1.48 0.19<br />
2-4 7.4 1.81 5.87 7.8 0.24 -0.91 2.26 0.19<br />
98BF32 0-2 7.5 1.33 6.47 7.6 0.13 7.88 2.40 0.12<br />
Hot Water<br />
Selenium ppm<br />
2-4 7.7 1.33 6.62 7.2 0.12 6.74 2.92 0.15 0.18<br />
98BF33 0-2 8.0 1.25 6.97 5.2 0.05 5.47 0.90 0.18<br />
2-4 8.0 1.24 6.73 5.3 0.06 5.09 1.02 0.20<br />
98BF34 0-2 7.8 1.39 6.19 4.2 0.04 3.29 3.84 0.21<br />
2-4 7.8 1.31 5.81 4.2 0.04 2.45 0.98 0.17<br />
98BF39 0-2 6.5 2.98 4.54 6.4 0.15 -0.42 0.34 0.12<br />
2-4 5.1 4.04 3.90 6.5 0.24 -4.47 0.26 0.11 0.15<br />
98BF41 0-2 7.2 2.69 6.43 5.9 0.13 2.70 10.10 0.30<br />
2-4 7.4 1.88 6.90 5.6 0.06 3.70 6.28 0.26<br />
98BF42 0-2 6.8 3.18 5.72 7.0 0.10 2.13 1.98 0.30<br />
2-4 7.1 2.87 4.99 3.9 0.18 -1.95 2.66 0.14<br />
98BF43 0-2 7.4 4.60 5.13 5.1 0.14 0.30 14.20 0.36 0.40<br />
2-4 7.4 5.16 5.51 5.2 0.14 4.65 12.70 0.30<br />
98BF-44 0-2 6.3 3.92 4.30 6.9 0.17 -1.85 4.26 0.22<br />
2-4 6.4 4.01 4.43 7.7 0.16 0.20 10.20 0.2<br />
AB-DTPA Se<br />
ppm
Table 2. Study Area Compared to Breaks/Upland Grassland Reference<br />
BREAKS<br />
SAMPLE<br />
LOCATION<br />
b-6-1<br />
b-6-2<br />
b-12-1<br />
b-12-2<br />
b-22-1<br />
b-22-1<br />
UPLAND GRASSLAND<br />
SAMPLE<br />
LOCATION<br />
ug-6-1<br />
ug-6-2<br />
ug-12-1<br />
ug-22-1<br />
SAMPLE<br />
LOCATION<br />
6a1, 6a2, 6b1, 6b2, 6c1, 6c2<br />
6a1, 6a2, 6b1, 6b2, 6c1, 6c2<br />
6a1, 6a2, 6b1, 6b2, 6c1, 6c2<br />
WEIGHTED VALUES<br />
EC<br />
Depth dS/m SAR<br />
0-6 1.15 0.22<br />
0-6 0.59 0.21<br />
0-6 0.45 0.33<br />
0-6 0.57 0.21<br />
6-12 0.64 0.20<br />
0-6 0.39 0.36<br />
6-12 0.42 0.56<br />
12-18 0.42 0.56<br />
0-6 0.57 2.95<br />
6-12 0.92 4.47<br />
12-18 1.33 4.61<br />
WEIGHTED VALUES<br />
EC<br />
Depth dS/m SAR<br />
0-6 0.30 0.48<br />
6-12 1.32 1.12<br />
12-18 1.86 1.29<br />
0-6 4.13 1.74<br />
6-12 10.16 4.34<br />
0-6 3.97 2.61<br />
6-12 7.78 3.97<br />
12-18 11.12 4.28<br />
0-6 1.15 0.36<br />
6-12 1.01 0.60<br />
AVERAGE VALUES<br />
EC<br />
Depth dS/m SAR<br />
0-6 2.0 0.7<br />
6-12 1.5 2.6<br />
12-18 1.9 4.7<br />
12a1, 12a2, 12b1, 12b2, 12c1, 12c2 0-6 2.0 0.9<br />
12a1, 12a2, 12b1, 12b2, 12c1, 12c2 6-12 2.2 1.5<br />
12a1, 12a2, 12b1, 12b2, 12c1, 12c2 12-18 1.7 3.0<br />
12a1 18-24 1.9 5.5<br />
22a1, 22a2, 22b1, 22b2, 22c1, 22c2 0-6 2.9 1.7<br />
22a1, 22a2, 22b1, 22b2, 22c1, 22c2 6-12 3.1 1.8<br />
22a1, 22a2, 22b1, 22b2, 22c1, 22c2 12-18 2.4 1.3<br />
22a1, 22a2, 22b1, 22b2, 22c1, 22c2 18-24 1.9 3.2<br />
22b2, 22c2 24-30 1.7 2.2
Mix # 28037<br />
Table 3. Study Area Permanent Seed Mix for 2.5 Acres<br />
Shrub-Grass Mix/Drill % Pure Lbs. Pls Pure * Lbs<br />
Prairie Sandreed 0.0346 31.27 1.08<br />
Munro Globemallow 0.0353 31.27 1.10<br />
Western Wheatgrass 0.0670 31.27 2.10<br />
Rocky Mountain Penstemon 0.0691 31.27 2.16<br />
Green Needlegrass 0.0714 31.27 2.23<br />
Sandberg Bluegrass 0.0738 31.27 2.31<br />
Little Bluestem 0.0755 31.27 2.36<br />
Cicer Milkvetch 0.1037 31.27 3.24<br />
Thickspike Wheatgrass 0.1368 31.27 4.28<br />
Fourwing Saltbush 0.1418 31.27 4.43<br />
Gardner Saltbush 0.1559 31.27 4.87<br />
Other Crop 0.0004 31.27 0.01<br />
Inert Matter 0.0343 31.27 1.07<br />
Weed Seed 0.0004 31.27 0.01<br />
Subtotal 31.25<br />
Mix # 28038<br />
Shrub-Grass Mix/Broadcast % Pure Lbs. Pls Pure * Lbs<br />
Winterfat 0.0708 9.21 0.65<br />
Blue Grama 0.0775 9.21 0.71<br />
Wyoming Big Sagebrush 0.1117 9.21 1.03<br />
Subtotal 2.39<br />
Total 33.64
2000 Billings Land Reclamation Symposium<br />
ALTERATION OF TOPSOIL DEPTH FOR SHRUB ESTABLISHMENT<br />
By<br />
Tim W. Meikle¹, Vern Pfannenstiel 2 , and Roy Karo 3<br />
ABSTRACT<br />
Topsoil is vital to the establishment <strong>of</strong> many grass and forb species on reclamation areas.<br />
Woody species, however, have a greater adaptation to coarse, rocky and shallow soils and<br />
may be inhibited by grass competition resulting from topsoil application. The purpose <strong>of</strong><br />
this study was to investigate edaphic controls <strong>of</strong> plant community establishment by<br />
comparing shrub growth and survival on topsoiled and graded spoil treatments. Adjacent<br />
topsoiled and non-topsoiled plots were planted with serviceberry (Amelanchier alnifolia),<br />
chokecherry (Prunus virginiana) and Gambel’s oak (Quercus gambelii). A total <strong>of</strong> ten<br />
50 m2 belt transects were randomly placed along a baseline within each plot. Data was<br />
collected annually for three years. Variables measured included presence/ absence,<br />
herbaceous cover, growth and mycorrhizal colonization. Shrub survival was significantly<br />
higher (p
INTRODUCTION<br />
The Colorado <strong>Surface</strong> Coal Mine Reclamation Act <strong>of</strong> 1979 requires woody plant<br />
restoration as criteria for bond release in the coal mining regions <strong>of</strong> northwest Colorado.<br />
Woody plant restoration has been problematic, however, due to quickly establishing<br />
rhizomatous grasses and browse by deer and elk (Mathews and Savage 1990). The<br />
ability to control grass competition could greatly increase shrub survival and<br />
establishment within shrub establishment areas. In particular, the control <strong>of</strong> grass<br />
establishment through modification <strong>of</strong> soil depth and quality could result in a method for<br />
shrub establishment that also reduces reclamation costs. The purpose <strong>of</strong> this study was to<br />
investigate edaphic controls <strong>of</strong> plant community establishment by comparing shrub<br />
growth and survival on topsoiled and graded spoil treatments.<br />
Plant community composition is ultimately determined by the physical, chemical and<br />
biological properties <strong>of</strong> the substrates on which they form. Indeed, restorationists have<br />
attempted to manipulate and predict community composition based upon specific soil<br />
factors. Several studies have demonstrated that soil nitrogen level strongly affects plant<br />
community composition (Tilman and Wedin 1991; McLendon and Redente 1992).<br />
Researchers have also used soil texture and depth in attempts to predict species<br />
composition and establishment (Blomquist and Lyon 1993; Chambers, Brown et al. 1994;<br />
Pendleton, Nelson et al. 1996; Brown, Sidle et al. 1991). In general, these studies have<br />
identified strong relationships between increasing grass biomass and increasing nutrient<br />
level and soil quality. Thus, topsoil application on shrub restoration areas may create<br />
edaphic conditions that typically select for grass as opposed to shrubs.<br />
A divergent concept is the designed placement <strong>of</strong> spoils on shrub establishment areas to<br />
provide an environmental filter that favors shrub establishment. The concept <strong>of</strong><br />
“environmental filtering” is best described by Wilson as a condition in which species are<br />
excluded from a site based upon their inability to tolerate the physical environment<br />
(Wilson 1999). For example, serviceberry (Amelanchier alnifolia), chokecherry (Prunus<br />
virginiana), and Gambel’s oak (Quercus gambelii) are particularly well adapted to coarse<br />
soils and rocky sites (USDA 1988). Creation <strong>of</strong> these conditions may well favor shrub<br />
establishment while creating unfavorable conditions for the vigorous establishment <strong>of</strong><br />
competing grasses.
STUDY AREA<br />
The study area is Seneca II Mine which is located in the Upper Yampa River Basin near<br />
Hayden , Colorado. The area is characterized by mountainous terrain with deeply<br />
dipping coal seams. Dominant vegetation <strong>of</strong> native areas consists <strong>of</strong> sagebrush/grass<br />
communities on lower elevations <strong>of</strong> the site and mountain shrub communities at midelevations.<br />
Characteristic shrubs within the mountain shrub community are serviceberry,<br />
chokecherry, and Gambel’s oak. Rainfall varies from 16 to 20 inches with most<br />
occurring as snowfall during the winter months.<br />
METHODS<br />
The study was conducted on an unreclaimed northwest-facing slope. The treatments<br />
tested were: 1) topsoil application <strong>of</strong> approximately 21 centimeters; and 2) unaltered<br />
spoil. Half <strong>of</strong> the slope received topsoil application while the other half remained bare.<br />
A commercial tree planting crew planted the site with a mixture <strong>of</strong> containerized<br />
serviceberry, chokecherry, and Gambel’s oak during fall 1995. Neither seed nor fertilizer<br />
were applied to the site.<br />
Soil analysis was conducted on both topsoil and spoil substrates (Table 1). Spoil had a<br />
larger clay fraction and higher salinity level than topsoil. Topsoil, in contrast, contained<br />
higher levels <strong>of</strong> organic matter and nitrogen. Phosphorus, potassium and pH were similar<br />
between the two substrates. As an observation, the spoil portion <strong>of</strong> the site contained a<br />
substantially higher portion <strong>of</strong> rock.<br />
The site was monitored for a period <strong>of</strong> three years. A total <strong>of</strong> ten randomly placed 2<br />
meter X 25 meter transects were placed within each treatment plot. Variables measured<br />
on the site were presence/absence <strong>of</strong> woody species, herbaceous cover, shoot height, root<br />
length, and mycorrhizal status. Herbaceous cover was measured by placing five 0.5<br />
meter X 0.5 meter quadrats along each transect line and visually estimating cover.<br />
Mycorrhizal status was measured from root cuttings that were cleared, stained, and<br />
evaluated using standard methodologies. Analysis consisted <strong>of</strong> comparison <strong>of</strong> variables<br />
and factors using Analysis <strong>of</strong> Variance.
Table 1. Physical and chemical characteristics <strong>of</strong> treatment substrates.<br />
Topsoil Spoil<br />
Texture silt loam silt clay loam<br />
pH 6.7 6.9<br />
Salts (mmhos/cm) 0.9 1.7<br />
Organic Matter (%) 2.5 1.3<br />
Organic N (lbs/acre) 46.7 31.7<br />
Nitrate-N (ppm) 32.7 4.3<br />
Phosphorus (ppm) 10.0 14.3<br />
Potassium (ppm) 103.3 100.0<br />
RESULTS<br />
Shrub survival was significantly higher (p
Plant competition did not significantly affect survival in this study. Indeed, grass<br />
competition was non-existent during the course <strong>of</strong> the study with less than 1% cover by<br />
grasses on either site during the course <strong>of</strong> three years. During the second year <strong>of</strong><br />
monitoring, weed cover on the topsoil treatment tended to be substantially higher with<br />
11.5% cover as opposed to 3.4% cover on the spoil treatment. After three growing<br />
seasons, weedy species, such as Canada thistle (Cirsium arvense), appeared in similar<br />
amounts (8.6% vs. 8.3% cover) in spoil and topsoil treatments. Overall, plant<br />
competition never appeared to reach levels that would inhibit establishment <strong>of</strong> woody<br />
species on the site.<br />
Colonization by mycorrhizal fungi was essentially the same between the topsoil and spoil<br />
treatment at the end <strong>of</strong> three years. Neither treatment appeared to inhibit or promote<br />
colonization within the timeframe <strong>of</strong> the study.<br />
DISCUSSION<br />
In contrast to our original theory, plant competition did not significantly alter shrub<br />
establishment potential on either site. Lack <strong>of</strong> a seed bank and possibly herbicide<br />
application prior to planting prevented large amounts <strong>of</strong> grass or weed coverage from<br />
developing. Despite sufficient levels <strong>of</strong> nitrate-N in the topsoil, these species did not<br />
establish and dominate either site. Thus, this study did not provide an adequate test the<br />
“environmental filter” concept. Despite this, the study did identify that shrub survival<br />
was significantly greater and plant growth similar on graded spoil substrates.<br />
Browse damage is most likely responsible for the higher mortality on the topsoil<br />
treatment. Other studies have identified this as a limiting factor on heavily used sites<br />
(H<strong>of</strong>fman and Wambolt 1996). The spoil substrate may have mitigated the impacts <strong>of</strong><br />
browse due to substrate texture. A majority <strong>of</strong> shrub mortality occurred during the year<br />
following substantial browse damage. It is hypothesized that the lower bulk density <strong>of</strong><br />
the topsoil may cause deer and elk to pull up entire plants rather than simply nipping the<br />
tips <strong>of</strong> the shoots. In contrast, the heavier spoil substrate may anchor seedlings more<br />
securely and prevent removal <strong>of</strong> the roots. Intact but extracted plants were found on the<br />
site as evidence. This phenomenon has been observed at other heavily browsed sites.<br />
Existing volunteer plant cover may also have mitigated the loss <strong>of</strong> shrubs due to browse.<br />
Plants with the greatest growth were observed in the canopy <strong>of</strong> Canada thistle suggesting<br />
that herbivores avoided browsing these microsites. A more desirable, short-lived plant<br />
species that provides similar protection could potentially be used over large areas to<br />
increase growth on shrub restoration sites.
CONCLUSION<br />
Research has successfully demonstrated the benefits <strong>of</strong> topsoil application to grass<br />
establishment. Where restoration objectives are different and topsoil resources are<br />
limited, however, topsoil may impede the establishment <strong>of</strong> desired plant associations.<br />
This is particularly true in the establishment <strong>of</strong> mountain shrub communities <strong>of</strong> Colorado.<br />
Spoil provided a superior media for shrub survival in this study. The results do not<br />
necessarily reflect differences in edaphic factors however, but a greater tolerance to<br />
browse pressure. Although plant competition was not determined to be a factor, the<br />
concept <strong>of</strong> “environmental filters” to selectively promote establishment <strong>of</strong> shrubs over<br />
grasses deserves further research.<br />
REFERENCES<br />
Blomquist, K. W. and G. E. Lyon. 1993. Effects <strong>of</strong> soil quality and depth on seed<br />
germination and seedling survival at the Nevada Test Site. Wildland Shrub and Arid<br />
Land Restoration Symposium, Las Vegas, NV, USDA Intermountain Research Station.<br />
Brown, R. W., R. C. Sidle, et al. 1991. Reclamation Research Results on the Borealis<br />
Mine: Progress Report 1987-1990. Logan, UT, USDA Forest Service Intermountain<br />
Research Station Forestry Sciences Laboratory: 69.<br />
Chambers, J. C., R. W. Brown, et al. 1994. “An evaluation <strong>of</strong> reclamation success on<br />
Idaho's phosphate mines.” Restoration Ecology 2(1): 4-16.<br />
H<strong>of</strong>fman, T. L. and C. L. Wambolt. 1996. Growth response <strong>of</strong> Wyoming big sagebrush to<br />
heavy browsing by wild ungulates. Proceedings: Shrubland Ecosystem Dynamics in a<br />
Changing Environment, Las Cruces, NM, USDA Forest Service Intermountain Research<br />
Station.<br />
Mathews, D. T. and M. S. Savage. 1990. <strong>Revegetation</strong> observations at surface coal mines<br />
in the Axial Basin, Yampa River Basin, and North Park, Colorado. Fifth Billings<br />
Symposium on Disturbed Land Rehabilitation, Billings, MT, Montana State University.<br />
McLendon, T. and E. F. Redente. 1992. “Effects <strong>of</strong> nitrogen limitation on species<br />
replacement dynamics during early secondary succession on a semiarid sagebrush site.”<br />
Oecologia 91: 312-317.<br />
Pendleton, R. L., S. D. Nelson, et al. 1996. Do soil factors determine the distribution <strong>of</strong><br />
spineless hopsage (Grayia brandegei)? Proceedings: Shrubland Ecosystem Dynamics in<br />
a Changing Environment, Las Cruces, NM, USDA Intermountain Research Station.
Tilman, D. and D. Wedin. 1991. “Dynamics <strong>of</strong> nitrogen competition between<br />
successional grasses.” Ecology 72: 1038-1049.<br />
USDA. 1988. Range Plant Handbook. Mineola, NY, Dover Publishing.<br />
Wilson, J. B. 1999. Assembly rules in plant communities. Ecological Assembly Rules. E.<br />
Weiher and P. Keddy. New York, Cambridge University Press: 130-164.
2000 Billings Land Reclamation Symposium<br />
MIXED SHRUB RECLAMATION:<br />
THE RECLAMATION OF AN IMPORTANT HABITAT<br />
Bruce Waage1, Chris Yde2, Pete Martin3 and Steve Regele4<br />
ABSTRACT<br />
Current regulations under the <strong>Surface</strong> Mine Control and Reclamation Act (SMCRA) require that<br />
land disturbed by surface coal mining be reclaimed to a condition that supports the approved<br />
postmining land use. Western Energy Company's Rosebud Mine occurs in the eastern Montana<br />
ponderosa pine belt typified by wide-open valleys outlined with rugged steep buttes. Livestock<br />
grazing and wildlife usage are the primary premining and postmining land uses.<br />
While mined land generally has been reclaimed to a productive, useful state for both livestock<br />
and wildlife, need for improvements to Western Energy's reclamation program was evident. The<br />
State regulatory authority and reclamation managers at the mine recognized that the postmining<br />
land surface had been simplified and in some instances overly smoothed. Consequently, it<br />
appeared that important habitats such as the mixed shrub type have not been replaced, postmine<br />
plant species diversity for wildlife associated with these sites maybe reduced, and the likelihood<br />
<strong>of</strong> achieving one aspect <strong>of</strong> our reclamation goals and standards was questionable.<br />
The "mixed shrub" term is used in this paper to include three U.S. Soil Conservation Service<br />
(now the NRCS) Technical Range Site Descriptions "thin breaks", "badlands" and "thin hilly".<br />
These range sites are similar in several aspects. Slopes are generally steep, with some nearly<br />
vertical escarpments, ranging from 25 to 75 percent. Soil development is nearly absent with<br />
sandy, shale, or clay parent material exposed at the surface. Total annual herbage production<br />
(dry air) is low, ranging from 100 pounds per acre in unfavorable years to 900 pounds in<br />
favorable years. These types, however, provide important habitat components for a number <strong>of</strong><br />
plant and animal species.<br />
Western Energy's reclamation program now includes the mixed shrub habitat type. It enhances<br />
both the topographic and vegetative diversity required for these postmine habitats. The habitat<br />
needs for both niche specific wildlife and vegetation species are being provided. Wildlife habitat<br />
generalists and cattle also use this type for both food and shelter. Results are presented with the<br />
understanding that these sites are in an early seral developmental stage.<br />
Key words: Topography, thin breaks, diversity reclamation badlands, vegetation<br />
______________<br />
1, 3 Scientific Specialist, Western Energy Company, P.O. Box 99, Colstrip, MT 59323.<br />
2 Wildlife Biologist, Montana Department <strong>of</strong> Environmental Quality, Industrial and Energy<br />
Minerals Bureau, Helena, MT 59620<br />
4 Steve Regele, Coal Program Supervisor Montana Department <strong>of</strong> Environmental Quality,<br />
Industrial and Industrial and Energy Minerals Bureau, Airport Industrial Park, Building IP-9,<br />
Billings, MT 59102.
INTRODUCTION<br />
The Montana Strip and Underground Mine Reclamation Act (MSUMRA) and the<br />
associated Administrative Rules <strong>of</strong> Montana (ARM) require that all disturbance within<br />
active coal mines be reclaimed to the approximate original contour (AOC). As defined<br />
by ARM 17.24.301(13) AOC means “that surface configuration achieved by backfilling<br />
and grading <strong>of</strong> disturbed areas so that the reclaimed area, including any terracing or<br />
access roads, closely resembles the general surface configuration <strong>of</strong> the land prior to<br />
disturbance and blends into and compliments the drainage pattern <strong>of</strong> the surrounding<br />
terrain, with all highwalls, spoil piles, waste piles, and depressions [except as provided in<br />
ARM 17.24.503(1)] eliminated.”<br />
Current coal mining regulations also require that land disturbed by mining be<br />
reclaimed to a condition that supports the approved postmining land use (ARM<br />
17.24.762). The approved postmine land uses are livestock grazing and wildlife habitat.<br />
To a lesser extent, agricultural fields (small grains and alfalfa hayland) have been<br />
approved through the alternate reclamation process. Although currently reclaimed areas<br />
are recognized to be highly productive and useful for both wildlife and livestock,<br />
generally showing an increase in vegetative production and cover, there has been concern<br />
that the reclaimed landscape has been modified (i.e. simplified, overly smoothed<br />
topographically) to the detriment <strong>of</strong> landscape, vegetation and wildlife diversity.<br />
Therefore, the quality <strong>of</strong> the postmine habitats as it relates to diversity may be reduced<br />
for a select group <strong>of</strong> plants and wildlife species.<br />
Complex topographic features found in nature contribute to vegetative diversity<br />
and the formation <strong>of</strong> microhabitat niches. Odum (1959) emphasized that “the ecological<br />
niche <strong>of</strong> an organism depends not only on where it lives but also on what it does.” In our<br />
region, many important habitat features for various plants, as well as for big game, small<br />
mammals, raptors and other wildlife are found in areas <strong>of</strong> steep slopes, incised drainages<br />
and "badlands". Wood et.al. (1989) indicated badlands were especially important as they<br />
accounted for fifty percent or more <strong>of</strong> the use measured by both mule deer and whitetailed<br />
deer in a Montana prairie environment. Mackie (1991) states that mule deer are<br />
morplogically adapted to steep rugged terrain. The term "badlands" is used as defined in<br />
U.S.D.A. Soil Conservation Service Technical Range Site Descriptions (Zacek et.al.<br />
1977). Other site descriptions included therein are "thin breaks" and "thin hilly". All<br />
three <strong>of</strong> these sites are common in areas mined by Western Energy Company (WECO).<br />
The "mixed shrub" term is used in this paper in relation to these three site descriptions.<br />
ROSEBUD MINE<br />
Premine “Mixed Shrub” Habitat<br />
WECO's Rosebud Mine occurs in the eastern Montana ponderosa pine belt<br />
typified by wide-open valleys outlined with rugged steep buttes, intermixed with the<br />
“mixed shrub” habitat type. At the Rosebud Mine, the “mixed shrub” type comprises<br />
approximately 250 acres or one percent <strong>of</strong> the total premine habitat. This habitat typically<br />
occurs on exposed elevated ridges and on steep side slopes. The sites have<br />
underdeveloped soils and are generally underlain with weathered and highly eroded
sandstone and shales. The “mixed shrub” type is most distinguished by the lack <strong>of</strong> soil<br />
development and exposed topographic positions (ECON, 1983). Hard rock and resistant<br />
bed outcroppings at different levels on steep irregular slopes are also commonly<br />
associated with this type (Zacek et.al. 1977).<br />
The great variability in regard to soil and topographic makeup results in plant<br />
species and wildlife use unique to these sites. At many points within the “mixed shrub”<br />
area, vegetation is almost non-existent. ECON (1983) reported a standing crop <strong>of</strong> 681<br />
pounds per acre for this type compared to 1,212 pounds per acre for the sagebrush<br />
grassland types. Although these sites have low vegetation production, they are important<br />
for wildlife because <strong>of</strong> topographic and vegetative diversity. Some native plant species<br />
are found only on these sites, and now with the “mixed shrub” reclamation, these plants<br />
are found only at these sites within reclamation. The 1983 ECON study identified seven<br />
plant species found only on the “mixed shrub” samples. Expanded to an equalized<br />
acreage comparison, this number amounts to 73 unique plant species per 1000 acres<br />
compared to 6 unique species per 1000 acres for the other identified habitat types on the<br />
Rosebud Mine.<br />
“Mixed Shrub” Reclamation<br />
WECO developed and implemented the reclamation <strong>of</strong> the “mixed shrub” habitat<br />
type to address three issues.<br />
• To replace the “mixed shrub” plant community and the diversity <strong>of</strong> plant species,<br />
with special emphasis on shrub species lost during mining as per ARM 17.24.711.<br />
• To advance premine topographic diversity (AOC) ARM 17.24.301 (13)<br />
• To improve habitat for a variety <strong>of</strong> wildlife species.<br />
One purpose <strong>of</strong> the mixed shrub replacement is to comply with ARM 17.24.711<br />
requiring reestablishment <strong>of</strong> vegetation <strong>of</strong> equal utility to natural premine vegetation.<br />
Such reclamation also establishes or enhances important wildlife habitat which would be<br />
lost without this habitat being reclaimed as per ARM 17.24.751(2)(f). “Mixed shrub”<br />
sites provide diverse patterns <strong>of</strong> slope, gradient, aspect, increased edge, thin soils and<br />
topographic relief as exist in the premine landscape. By providing these characteristics,<br />
vegetation requiring this environment for establishment, survival and self propagation<br />
will establish and thrive over the long term. The “mixed shrub” reclamation is furthering<br />
our goal <strong>of</strong> reestablishing native vegetation found on the land prior to mining and<br />
facilitating the achievement <strong>of</strong> bond release on mined lands.<br />
Mixed-shrub reclamation increases topographic and vegetative diversity, both <strong>of</strong><br />
which are valuable to wildlife, by providing terrain features not found in much <strong>of</strong> the<br />
previous reclamation performed at the Rosebud mine. These terrain features, though they<br />
represent a very small percentage <strong>of</strong> premine and postmine area, are important as they<br />
contribute to a more complete postmine ecosystem encompassing habitat for wildlife.<br />
Topographic relief enhances animals ability to escape and hide. It also provides thermal<br />
protection in the form <strong>of</strong> warm, wind free winter habitat, as well as shaded areas during<br />
warmer weather. The importance <strong>of</strong> habitat diversity for wildlife species is supported by<br />
a large amount <strong>of</strong> literature (Laycock 1980). For that matter, the same can be said for
livestock. The environmental characteristics <strong>of</strong> natural hill, ridge and breaks habitat in<br />
Montana include largely undeveloped soils, drastic topographic relief and variable<br />
vegetation community types (Wentdland et al 1992). In New Mexico strip mine<br />
reclamation, it was found that species diversity, richness and abundance <strong>of</strong> birds, small<br />
mammals and larger mammals were higher on the diverse unreclaimed spoil than they<br />
were on the reclaimed lands (Steele and Grant 1982).<br />
In a North Dakota study (Wollenhauph and Richardson, 1982) <strong>of</strong> 5,000 acres <strong>of</strong><br />
forty year old strip mine spoil piles which are similar in topography to the mixed shrub<br />
reclamation, the different niches on the variety <strong>of</strong> slopes and aspects were found to<br />
promote vegetative diversity. Every draw, even those exceeding a 100% slope, had<br />
woody, grass and forb vegetation. The areas between spoil piles, as exists in the mixed<br />
shrub reclamation, were found to have “The most remarkable vegetation establishment.”<br />
“Mixed shrub” reclamation is also consistent with rule ARM 17.24.751. (2) (e) "…the<br />
operator shall… ensure that reclamation will provide for habitat needs <strong>of</strong> various wildlife<br />
species in an equal or greater capacity than was provided prior to mining. Special<br />
attention must be given to inanimate elements such as rock outcrops, boulders, rubble,<br />
dead trees, etc., that may have existed on the surface prior to mining and to plant species<br />
with proven nutritional and cover value for fish and wildlife." The “mixed shrub”<br />
reclamation is an attempt to provide for the habitat needs <strong>of</strong> wildlife known to frequent<br />
these areas. Boulders, rubble and gumbo knobs (similar to that which existed prior to<br />
mining) are an integral component <strong>of</strong> the “mixed shrub” reclamation.<br />
The “mixed shrub” reclamation work is accomplished on a site specific basis<br />
primarily with D11 caterpillar dozers and 651 caterpillar scrapers. Occasionally, frontend<br />
loaders and 14 foot blades are also utilized. Seed is normally applied in a mixture <strong>of</strong><br />
water and fiber mulch at the rate <strong>of</strong> approximately 12 PLS pounds per acre. The seed<br />
mix applied to the mixed shrub site, Area D, Rosebud Mine was as follows:<br />
Mixed Shrub – grass<br />
Species<br />
Variety Origin PLS mix %<br />
Western wheatgrass Rosana<br />
MT<br />
15.2<br />
Bluebunch wheatgrass Secar WY 16.0<br />
Green needle grass Lodorm MT 15.9<br />
Sideoats grama Pierre SD 15.9<br />
Indian ricegrass Nezpar MT 15.9<br />
Little bluestem Camper NE 16.2<br />
Fourwing saltbush native WY 4.9
Mixed shrub – forb & shrub<br />
Species<br />
Fringed sagewort<br />
Variety Origin PLS mix %<br />
Prairie sagewort WY 2.0<br />
Sulphur buckwheat NV 9.8<br />
Big sagebrush WY 60.8<br />
Silver sagebrush WY 7.5<br />
Winterfat NM 13.1<br />
Rubber rabbitbrush UT 5.1<br />
Tubelings (1-0, 10 cu. in.) are also planted on the mixed shrub sites. Since the spring <strong>of</strong><br />
1998 there have been 300 Pinus ponderosa, 200 Juniperus scopulorum, 900<br />
Chrysothamnus nauseosus, 300 Rhus trilobata , 200 Artemisia tridentata ,and 600<br />
Artemisia cana hand planted on the Area D site. A survey <strong>of</strong> woody plant density<br />
conducted by Steven Viert (1999) resulted in the data shown in Table D2. The total<br />
density <strong>of</strong> 3753.5 live plants per acre is encouraging for the initial revegetation and<br />
should increase with time.<br />
Discussion<br />
Numerous pr<strong>of</strong>essionals have stated that present reclamation practices <strong>of</strong>ten<br />
permanently reduce or eliminate premine topographic diversity (Wendtland et al 1992).<br />
Specifically concerning strip mine reclamation, provisions <strong>of</strong> the law which limit steep<br />
slopes and rimrock terrain dissected by draws, result in the almost complete elimination<br />
<strong>of</strong> topographic diversity (Harju 1980). Reclamation for wildlife should stress diversity <strong>of</strong><br />
habitat, topography and vegetation. Reclamation <strong>of</strong> premining contours with creation <strong>of</strong><br />
irregularities <strong>of</strong> terrain is encouraged for wildlife (Harju 1980).<br />
Some coal-mining reclamation rules seem to conflict with each other and with the<br />
stated goals and intent <strong>of</strong> reclamation. Yde (1999) made the following statement<br />
regarding some <strong>of</strong> the mining regulations: “It appeared that a straight forward approach<br />
had been established that ensured reclamation to a condition that closely approximated<br />
the premine situation. However, several rules were adopted that actually conflicted with<br />
the AOC (Approximate Original Contour) requirements, each other and/or the intent <strong>of</strong><br />
the law. Examples <strong>of</strong> these include:<br />
• The requirement that slopes could not exceed 5(h): 1(v) unless otherwise approved by<br />
the Department.<br />
• Soil must be redistributed in a manner that achieves approximate uniform thickness.<br />
• The nine-inch rill and gully rule.<br />
• Elimination <strong>of</strong> depressions unless they were approved by the Department or were less<br />
than 1 yd³ in size.<br />
MT<br />
1.7
In Montana, as well as much <strong>of</strong> the West, the premine landscape is <strong>of</strong>ten steeper than<br />
5(h): 1(v), contains a variety <strong>of</strong> topographic and erosional features, and is covered by a<br />
variety <strong>of</strong> growth media <strong>of</strong> varying depths. A diversity <strong>of</strong> vegetation is supported by this<br />
topographic and substrate diversity. The combination <strong>of</strong> topographic and vegetative<br />
diversity supports a diverse wildlife community while providing for livestock grazing”<br />
Statutory mandates to reestablish a "…diverse, effective, and permanent vegetative<br />
cover… capable <strong>of</strong> self-regeneration …", and to "… minimize disturbance and adverse<br />
impacts … on fish, wildlife, and related environmental values and achieve enhancement<br />
<strong>of</strong> such resources where practicable… taking into consideration the physical,<br />
climatological, and other characteristics <strong>of</strong> the site…" are notable Montana coal-mine<br />
reclamation requirements. As stated by Regele (1997) " The ability to meet these<br />
mandates is <strong>of</strong>ten compromised or negated by ardent desires to homogenize postmine<br />
landscapes, by minimizing the variability <strong>of</strong> postmine planting substrates and by<br />
completely eliminating steep slopes, highwall rock outcrops, spoil piles, nick points,<br />
etc."<br />
Montana's coal program has revised many <strong>of</strong> the Administrative Rules to encourage the<br />
development <strong>of</strong> a more diverse postmine landscape to enhance the diversity goals. The<br />
“Mixed Shrub” habitat reclamation is just one approach being used by WECO to meet the<br />
intended goal <strong>of</strong> providing the diverse topography, plant community and wildlife habitat<br />
required following mining.
Table D2<br />
Reclaimed Woody Plant Density - 1999<br />
Thin Breaks - Erosion Feat. Area - Habitat Type - Area D Based on Evaluation <strong>of</strong> 10 2m x 100m Belt Transects<br />
Artemisia tridentata<br />
Atriplex canescens<br />
Ceratoides lanata<br />
Species Life Form<br />
Chrysothamnus nauseosus<br />
Juniperus scopulorum<br />
Pinus ponderosa<br />
Rhus trilobata<br />
Xanthocephalum sarothrae<br />
Shrub<br />
Shrub<br />
Half-Sh<br />
Shrub<br />
Tree<br />
Tree<br />
Shrub<br />
Half-Sh<br />
Seedling<br />
No. <strong>of</strong> Plants by<br />
Life Stage<br />
Young<br />
67<br />
125<br />
8<br />
36<br />
Mature<br />
12<br />
393<br />
1205<br />
3<br />
Decadent<br />
Dead<br />
Total<br />
Young<br />
&<br />
Mature<br />
12<br />
460<br />
1330<br />
3<br />
8<br />
36<br />
3<br />
3<br />
Total<br />
Young & Mature<br />
Per Acre<br />
1<br />
Total by Life Stage 0<br />
3<br />
3<br />
236 1619 1 0 1855 3753.5<br />
24.3<br />
930.8<br />
2691.2<br />
6.1<br />
16.2<br />
72.8<br />
6.1<br />
6.1
REFERENCES<br />
Econ, Inc. 1983. Vegetation Report for the <strong>Mining</strong> Area C. Prepared for Western<br />
Energy Company, Project 295-83-A, Helena, Montana, February 15, 1983.<br />
Harju, H.J. 1980. Reclamation for Wildlife – The Wyoming Viewpoint, Presentation at<br />
Soil Conservation Society <strong>of</strong> America Symposium, March 26, 1980.<br />
Laycock, W.A. 1980. What Is Successful Reclamation? – A Look At the Concepts <strong>of</strong><br />
Adaptability, Productivity, Cover, and Diversity <strong>of</strong> Seeded Species, USDA, SEA-<br />
AR, Forage and Range Management Research, Crops Research Laboratory,<br />
Colorado State University, Fort Collins, Colorado, 1980.<br />
Mackie, R.J. 1991. Big Game Historical Perspective. Abst. Livestock – Big Game<br />
Symposium, Reno, Nevada, September 18-20, 1991.<br />
Regele, S.M., and L. Reichert. 1997. Vegetation at a Glance, GIS approach to Ecology.<br />
Presentation at U.S.DI., O.S.M. Interactive Forum on Computer Applications for<br />
Electronic Permitting, Denver CO. June, 1997.<br />
Steele, B.B., and C.V. Grant. 1982. Topographic Diversity and Islands <strong>of</strong> Natural<br />
Vegetation: Aids in Re-establishing Bird and Mammal Communities on<br />
Reclaimed Mines,” Reclamation and <strong>Revegetation</strong> Research, Vol. 1, 1982, pp.<br />
376-381.<br />
Viert, €S.R. 1999. Rosebud Mine <strong>Revegetation</strong> Monitoring Report Cedar Creek<br />
Associates, Inc. Fort Collins, CO. November 1999.<br />
Wendtland, K.J.1992. Regulatory Directives and Reclamation Strategies in the<br />
Development <strong>of</strong> Ecologically Diverse Post-Mined Landscape, Presentation at<br />
June 14, 1992 meeting for Society for <strong>Surface</strong> <strong>Mining</strong> and Reclamation, Duluth,<br />
Minnesota.<br />
Wollenhaupt, N.C., and J. L. Richardson. 1982. The Role <strong>of</strong> Topography in <strong>Revegetation</strong><br />
<strong>of</strong> Disturbed Land, Symposium on <strong>Surface</strong> Coal <strong>Mining</strong> and Reclamation in the<br />
Northern Great Plains.<br />
Wood, A.K., and K. Hamlin. 1989. Ecology <strong>of</strong> Sympatric Mule and White-tailed Deer<br />
Populations in a Prairie Environment. Tech Bull. Montana Department <strong>of</strong> Fish,<br />
Wildlife and parks, Helena, Montana. 98 pp.<br />
Yde, C. 1999. Build It and They Will Come: Successful Bond Release Begins With the<br />
PMT. <strong>Office</strong> <strong>of</strong> <strong>Surface</strong> <strong>Mining</strong>, Symposium Reclamation Issues, and <strong>Surface</strong><br />
Coal <strong>Mining</strong> Applications in the Arid, Semi-arid West, September 21-24, 1999<br />
Flagstaff, Arizona.<br />
Zacek, J.C., H.E. Hunter., T.A. Bown., and R.L. Ross, 1977, U.S.D.A. Soil Conservation<br />
Service Montana Grazing Guides
2000 Billings Land Reclamation Symposium<br />
THE TOPSOIL DILEMMA<br />
George F. Vance 1 and Lowell K. Spackman 2<br />
ABSTRACT<br />
Wyoming’s noncoal small mines are defined as surface mining operations involving not more than 7,650<br />
m3 (10,000 cubic yards) <strong>of</strong> overburden and 4 ha (10 acres) <strong>of</strong> affected land in any one year. A dispute<br />
over topsoil material classifying as overburden reached the highest court in Wyoming. Although the<br />
Wyoming Department <strong>of</strong> Environmental Quality (WDEQ) classifies topsoil and subsoil separate from<br />
overburden, as defined in the Wyoming Noncoal Rules and Regulations, Wyoming statutes defines<br />
overburden as “... all <strong>of</strong> the earth and other materials which lie above the mineral deposit and also<br />
means such earth and other materials disturbed from their natural state in the process <strong>of</strong> mining, or<br />
mining from exposed natural deposits.” For small mines, the amount <strong>of</strong> material classifying as<br />
overburden for a 4 ha (10 acre) area amounts to a depth <strong>of</strong> approximately 19 cm (7 1/2 inches), or<br />
for a 0.4 ha (1acre) area to a depth <strong>of</strong> about 190 cm (75 inches). As the regulatory agency for small<br />
mines, WDEQ has considered topsoil separate from overburden for several reasons. Topsoil and<br />
subsoil is salvaged and reused for reclamation <strong>of</strong> the disturbed site and topsoil represents surface soils<br />
that will support plant life. Information is presented on the chemical and physical properties <strong>of</strong> samples<br />
collected from topsoil and subsoil piles and native areas at a small Wyoming gravel mining operation.<br />
A greenhouse study was also conducted using thickspike wheatgrass (Agropyron dasystachyum), a<br />
cool-season grass, and blue grama (Bouteloua gracilis), a warm-season grass. Results show that soil<br />
materials supported the growth <strong>of</strong> plants, and that plants grew best in the surface A and B horizon<br />
material. Inferences from this study suggest the Wyoming statutes should be changed to accommodate<br />
the distinct properties <strong>of</strong> topsoil, subsoil and overburden (e.g., spoil).<br />
Additional Key Words: Guidelines, Noncoal Mines, Spoil, Subsoil, Wyoming Statutes<br />
____________________<br />
1 George F. Vance, Pr<strong>of</strong>essor, Soil and Environmental Sciences, University <strong>of</strong> Wyoming, Laramie,<br />
WY 82071-3354, gfv@uwyo.edu<br />
2 Lowell K. Spackman, Senior Soil Scientist, Wyoming Department <strong>of</strong> Environmental Quality-Land<br />
Quality Division, Cheyenne, WY 82002 lspack@state.wy.us
INTRODUCTION<br />
In 1996, owners <strong>of</strong> a small gravel-mining operation appeared before the Wyoming Environmental<br />
Quality Council (WEQC), an <strong>of</strong>ficial administrative committee that resolves issues involving the<br />
Wyoming Department <strong>of</strong> Environmental Quality (WDEQ), for possible violations <strong>of</strong> the state’s small<br />
mining rules and regulations (EQC, 1997). The question <strong>of</strong> topsoil and subsoil being part <strong>of</strong> overburden<br />
was heard by the WEQC due to the definition <strong>of</strong> overburden in the Wyoming statutes. The Wyoming<br />
Supreme Court (WSC) subsequently ruled in favor <strong>of</strong> the EQC, with Justice William Taylor stating that<br />
the statutory definition <strong>of</strong> overburden “could not be more clear”. However, Taylor went on to say that<br />
the definition “is pivotal in the regulatory scheme governing reclamation efforts in the mining process<br />
because topsoil must be separately preserved and managed” (Laramie Boomerang, 1998). His<br />
comments suggest that while topsoil and subsoil must be considered overburden when calculating<br />
volumes, the soil should also be managed separately from overburden materials. However, this<br />
distinction is not totally clear in the Wyoming Statutes (W.S.) <strong>of</strong> the Environmental Quality Act.<br />
Wyoming’s noncoal small mines are defined as “surface mining operations involving not more than<br />
ten thousand (10,000) yards <strong>of</strong> overburden and ten (10) acres <strong>of</strong> affected land in any one (1) year”<br />
(W.S.§35-11-401(j)). The Wyoming Statutes define overburden as “all <strong>of</strong> the earth and other materials<br />
which lie above the mineral deposit and also means such earth and other materials disturbed from their<br />
natural state in the process on mining, or mining from exposed natural deposits.” Although the statutes<br />
do not define spoil material, the WDEQ - Land Quality Division (LQD) Noncoal Rules and Regulations<br />
do define this term. These rules state that "Spoil means overburden removed during the mining<br />
operation to expose the mineral and does not include the marketable mineral, subsoil or topsoil.”<br />
Therefore, the WDEQ has consistently required separating topsoil and subsoil from overburden so<br />
mine operators use the highest quality materials in reclaiming the disturbed areas.<br />
A general definition <strong>of</strong> topsoil is provided in the Statutes. According to these Statutes, "Topsoil<br />
means soil on the surface prior to mining that will support plant life.” However, a more specific<br />
definition is provided in the WDEQ-LQD Noncoal Rules and Regulations. Chapter 1 <strong>of</strong> these rules<br />
further states that "Topsoil means the A and E Horizons or any combination there<strong>of</strong>,” while "Subsoil<br />
means the B and C Horizons excluding consolidated bedrock material.” Inclusion <strong>of</strong> topsoil and subsoil<br />
as overburden for volumetric calculations has confused the users <strong>of</strong> the statutes and regulations. This<br />
confusion may result in minimal amounts <strong>of</strong> surface soil removal in some mining operations. The effects<br />
<strong>of</strong> including soil with overburden in the criteria that defines the allowable amount <strong>of</strong> material removed<br />
is discussed further in the Summary and Conclusions section.<br />
The objectives <strong>of</strong> this study were to determine the chemical and physical properties <strong>of</strong> samples<br />
collected from topsoil piles, subsoil piles and an unmined area at the small, gravel-mining operation that<br />
was the focus <strong>of</strong> citizen, WDEQ, WEQC, and WSC concerns. A greenhouse study was also<br />
conducted using the gravel-mine soil and subsoil materials. Both a warm-season and cool-season grass<br />
were seeded in the soil or subsoil materials to evaluate their plant growth potential. These plant species<br />
were selected because <strong>of</strong> their value in revegetating disturbed environments (Munshower, 1994). In<br />
addition to field and greenhouse results, we also present changes that should be considered in modifying<br />
the Wyoming Statutes for Small Mines.<br />
MATERIALS AND METHODS<br />
The study site is located east <strong>of</strong> Casper, WY and is classified as a small gravel mine based on the
intent to mine 10 acres or less per year. The site is situated between an unimproved road and a<br />
Burlington Northern Railroad right-<strong>of</strong>-way. Site topography is classified as a flood plain bench that<br />
contains sorted gravels. Precipitation in the area averages an annual rate <strong>of</strong> 30 cm (12 inches). Site use<br />
was mainly for rangeland purposes, with the grazing conditions considered fair to good.<br />
Boreholes <strong>of</strong> the permitted area indicated the soil pr<strong>of</strong>ile depth was within the 0 to 150 cm (0 to<br />
60 inch) range specified in a NRCS Soil Survey. An attempt was made by the operators to strip and<br />
preserve the upper soil material (A and B horizons) for future reclamation. These horizons are referred<br />
to as the topsoil for proposes <strong>of</strong> this investigation. The lower or subsoil materials below the topsoil and<br />
above the gravel bed interface were also stripped and stockpiled separately. A thin lens (-15 cm or<br />
6 inches) <strong>of</strong> calcareous precipitate existed between the bottom <strong>of</strong> the soil pr<strong>of</strong>ile and the gravel. A<br />
portion <strong>of</strong> the calcareous material was used as a mining product to bind the segregated gravel.<br />
During the initial quarry process, topsoil from the area to be mined was stripped and placed in three<br />
stockpiles that were marked Stockpile J, L and M. One subsoil stockpile (marked Stockpile K) was<br />
also created from the remaining material that was removed to expose the calcareous precipitate lens<br />
and gravel seam. Soil samples were collected from the stockpiles and a native area using a bucket<br />
auger. Two to three holes were bored on top <strong>of</strong> the stockpiles, which were spaced across the pile<br />
depending upon its size. The depth <strong>of</strong> samples ranged from 0-20, 20-40 and 40-100 cm (0-8, 8-16,<br />
and 16-40 inches). Three boreholes were also sampled on adjacent undisturbed lands that were<br />
expected to be mined the following year. Soil samples on these unmined sites were collected from<br />
depths <strong>of</strong> 0-10, 10-30, 30-90 and 90-165 cm (0-4, 4-12, 12-36, and 36-66 inches). Chemical and<br />
physical analyses were preformed in the University <strong>of</strong> Wyoming soil test laboratory (Table 1). Texture<br />
was determined using the feel method, coarse fragments by separating the greater than 2mm particles<br />
using dry sieving, organic matter (OM) with dry combustion, CaCO 3 by titration, pH and electrical<br />
conductivity (EC) in saturated paste extracts, and P and N by standard soil fertility tests.<br />
The greenhouse study involved the preparation <strong>of</strong> four 7.5 cm (3 inch) pots containing each<br />
stockpiled and native soil material. A total <strong>of</strong> 156 pots were prepared with half planted in thickspike<br />
wheatgrass (Agropyron dasystachyum), a cool-season grass, and half blue grama (Bouteloua<br />
gracilis), a warm-season grass.<br />
RESULTS AND DISCUSSION<br />
Topsoil and Subsoil Characterization<br />
Results <strong>of</strong> the chemical and physical analysis <strong>of</strong> topsoil and subsoil stockpiles (Table 1) suggest the<br />
materials are suitable for use as a surface cover. Based on WDEQ-LQD Guideline No. 1 for topsoil<br />
suitability (Table 2), all stockpiled materials have pH, EC, texture and coarse fragments that are<br />
considered suitable or marginally suitable. Except for sample L2C, which has a high %coarse fragment<br />
and %CaCO 3 contents, the rest <strong>of</strong> the topsoil stockpiled materials appear to be well suited as materials<br />
acceptable for reclamation purposes. Subsoil stockpiled materials had higher pH levels and generally<br />
greater contents <strong>of</strong> CaCO 3 than the stockpiled topsoil. The stockpiled subsoil materials were classified<br />
as marginally suitable because <strong>of</strong> their high pH, but the high %CaCO 3 may also limit these materials for<br />
revegetation purposes.
Table 1. Physical and chemical characteristics <strong>of</strong> topsoil/subsoil stockpiles and native<br />
materials from a small, gravel-mine operation.<br />
Sample Sample<br />
Number ID<br />
Depth Texture Coarse<br />
(cm) Frag (%)<br />
OM<br />
(%)<br />
Paste<br />
pH<br />
EC %CaCO PO4-P NO3-N (dS/m) 3 (mg/kg) (mg/kg)<br />
TOPSOIL PILE<br />
1 J1A 0-20 scl 4.0 0.6 8.0 0.4 0.7 2 1<br />
2 J1B 20-40 scl 2.6 0.9 8.2 0.5 2.8 2 4<br />
3 J1C 40-100 scl 3.0 0.8 8.1 0.4 2.8 4 2<br />
4 J2A 0-20 scl 2.2 1.1 7.9 0.4 0.8 2 3<br />
5 J2B 20-40 scl 3.7 1.6 7.9 0.8 2.1 8 17<br />
6 J2C 40-100 scl 3.8 1.0 8.3 0.4 3.6 4 18<br />
7 J3A 0-20 cl 0.3 1.2 8.3 0.3 0.9 2 3<br />
8 J3B 20-40 sl 2.0 1.2 8.0 0.5 1.1 8 10<br />
9 J3C 40-100 scl 3.3 1.2 8.1 0.4 2.4 4 4<br />
TOPSOIL PILE<br />
10 L1A 0-20 ls 3.7 0.8 8.1 1.0 1.1 4 7<br />
11 L1B 20-40 ls 1.5 0.4 8.1 0.7 1.1 4 6<br />
12 L1C 40-100 ls 5.3 0.7 8.3 0.4 1.5 2 4<br />
13 L2A 0-20 ls 1.2 0.6 8.1 0.5 1.7 4 1<br />
14 L2B 20-40 sl 15.1 0.7 8.0 0.6 1.9 4 10<br />
15 L2C 40-100 sl 25.9 0.6 8.1 0.6 24.2 4 7<br />
TOPSOIL PILE<br />
16 M1A 0-20 sl 0.4 0.9 8.0 0.6 0.8 4 3<br />
17 M1B 20-40 sl 2.2 0.9 8.0 0.6 1.2 2 6<br />
18 M1C 40-100 sl 0.7 1.2 8.0 0.5 0.6 2 3<br />
19 M2A 0-20 sl 2.1 1.0 8.0 0.5 1.3 2 3<br />
20 M2B 20-40 sl 2.0 0.9 8.0 0.5 1.6 2 1<br />
21 M2C 40-100 sl 1.0 1.0 8.1 0.5 1.2 2 2<br />
SUBSOIL PILE<br />
22 K1A 0-20 scl 10.8 0.4 8.7 0.4 10.3 2 1<br />
23 K1B 20-40 scl 10.6 0.5 8.6 0.5 7.1 2 1<br />
24 K1C 40-100 scl 7.3 0.4 8.7 1.0 9.3 2 0<br />
25 K2A 0-20 scl 4.5 0.7 8.6 0.4 6.8 2 0<br />
26 K2B 20-40 scl 6.2 0.5 8.9 0.4 9.2 2 0<br />
27 K2C 40-100 scl 11.8 0.4 8.7 1.0 9.2 2 1<br />
NATIVE SOILS<br />
28 B1A 0-10 sl 0.2 1.4 7.6 0.4 NR 6 0<br />
29 B1B 10-30 sl 0.9 1.1 8.0 0.4 1.1 4 0<br />
30 B1C 30-90 sl 0.6 0.6 8.2 0.4 4.1 2 0<br />
31 B1D 90-165 sl 5.7 0.2 8.7 0.9 9.1 2 0<br />
32 B2A 0-10 sl
Native soil samples had consistent physical and chemical characteristics based on the depth <strong>of</strong><br />
sampling. <strong>Surface</strong> horizons (0-10 cm or 0-4 inch depth) were highest in OM and phosphorus, with the<br />
lowest values for coarse fragments, pH, EC and %CaCO 3. Subsoil materials collected from the 90-<br />
165 cm (36-66 inch) depth were generally the highest in coarse fragments, pH, EC, and %CaCO 3,<br />
and lowest in OM and phosphorus. The high pH and %CaCO 3 may also limit the revegetation potential<br />
<strong>of</strong> these deeper subsoil materials. Although this material was not analyzed, calcareous materials from<br />
the gravel/subsoil interface would be expected to have high salt contents, high pH levels and potentially<br />
high %coarse fragments that would impede the growth <strong>of</strong> most revegetation plant species.<br />
Some mixing <strong>of</strong> topsoil and subsoil during stockpiling is generally expected. However, examination<br />
<strong>of</strong> samples from topsoil pile L suggests that significant amounts <strong>of</strong> gravel (%coarse fragments) were<br />
inadvertently combined with topsoil materials. For example, topsoil samples L2B and L2C have<br />
distinctively high %coarse fragment contents, and L2C has the highest %CaCO 3 <strong>of</strong> all the samples<br />
evaluated in this study.<br />
Table 2. Wyoming Department <strong>of</strong> Environmental Quality criteria for topsoil (or topsoil<br />
substitutes) and overburden suitability. From WDEQ-LQD Guideline No. 1 (1984)<br />
Parameter Suitable Marginally-Suitable Unsuitable<br />
pH 5.5 - 8.5� 5.9 - 5.5<br />
8.5 - 9.0<br />
9.0�<br />
EC (dS/m) 0 - 8 8 - 12 >12�<br />
Texture clay, silty clay, sand�<br />
Coarse Fragments (%) 35%�<br />
Greenhouse Study<br />
Once the grasses germinated, the plants were watered on a biweekly basis for 3 months. Pots were<br />
randomly distributed to prevent selective growth due to light, temperature and watering conditions.<br />
Although field variables would be expected to vary from those encountered in the greenhouse, including<br />
temperature, moisture, light, and wind conditions, the study provides information on the general soil<br />
properties that could potentially impact the revegetation <strong>of</strong> the small mine using the salvaged topsoil and<br />
subsoil materials.<br />
Thickspike wheatgrass, a cool-season grass, resulted in better overall growth when compared to<br />
blue grama, a warm-season grass. The greenhouse study indicated there were differences in biomass<br />
production between the two plant species in the different topsoil/subsoil materials. It should be noted,<br />
however, that both plant species did grow and would be useful for revegetation purposes.<br />
For Topsoil Stockpile J, thickspick wheatgrass growth was best in samples collected from<br />
borehole 2 represented by samples J2A,B,C, although good plant growth was also established in<br />
boreholes 1 and 3 (J1A,B,C and J3A,B,C) materials. Blue grama growth appeared to be impeded in<br />
samples from borehole 1, but grew well in borehole 2 and 3 samples.<br />
For Topsoil Stockpile L samples, favorable thickspike wheatgrass growth was noted in soils<br />
collected from both boreholes (L1A,B,C and L2A,B,C). Blue grama, however, grew best in the
surface soils collected from both boreholes, with a general decrease in biomass production with depth.<br />
Borehole 1 (L1A,B,C) materials resulted in better plant growth for blue grama than did borehole 2<br />
(L2A,B,C) soils. Thickspike wheatgrass also grew well in Topsoil Stockpile M soil materials<br />
(M1A,B,C and M2A,B,C). As with the other topsoil stockpile materials, blue grama growth was less<br />
than that <strong>of</strong> thickspike wheatgrass and showed little variation in the overall biomass production for the<br />
different soils tested.<br />
Subsoil Stockpile K was the only stored subsoil material sampled. With thickspick wheatgrass<br />
there was an evident trend in better plant growth with increasing depth <strong>of</strong> the subsoil material collected.<br />
A different trend was noted with blue grama - better growth was found with subsoil samples collected<br />
from borehole 2 (K2A,B,C).<br />
Native soils were also better growth media for thickspick wheat grass than for blue grama. While<br />
little difference was noted with plant productivity for blue grama from topsoil and subsoil samples<br />
B1A,B,C, B2A,B,C, and B3A,B,C, samples collected from the bottom <strong>of</strong> the pr<strong>of</strong>ile containing<br />
materials from the calcareous gravel/subsoil that interface reduced blue grama germination and growth.<br />
From the three borehole samples collected in the native area it was evident that topsoil samples resulted<br />
in the greatest thickspike wheatgrass production. Interesting among the latter results is that samples<br />
from the deepest sample depth (samples B1D, B2D and B3D) resulted in relatively good growth <strong>of</strong><br />
thickspick wheatgrass in two <strong>of</strong> the three materials.<br />
SUMMARY AND CONCLUSIONS<br />
Results suggest that soil materials collected from the gravel mine topsoil and subsoil stockpiles are<br />
capable <strong>of</strong> supporting the growth <strong>of</strong> the two plant species tested. Plants generally grew best in the<br />
topsoil material. The study also demonstrates that lower biomass production resulted from blue grama<br />
as compared to thickspick wheatgrass. Inferences from this study suggest the Wyoming statutes should<br />
be changed to accommodate and differentiate the distinct properties <strong>of</strong> topsoil, subsoils and overburden<br />
(e.g., spoil) and their relationship to reclamation efforts to restore the environmental quality <strong>of</strong> disturbed<br />
landscapes. These changes need to address the confusion found in the current statutes.<br />
Wyoming Statutes state that “Overburden means all <strong>of</strong> the earth and other materials which lie above<br />
the mineral deposit and also means such earth and other materials disturbed from their natural state in<br />
the process <strong>of</strong> mining, or mining from exposed natural deposits.” A major problem associated with this<br />
definition is based on the original description <strong>of</strong> a small mine. For example, in a 4 ha (10 acre) area,<br />
7,650 m 3 (10,000 yards) <strong>of</strong> overburden, including soil, is the amount <strong>of</strong> material collect from the<br />
surface to a depth <strong>of</strong> approximately 19 cm (7½ inches). Many soils in Wyoming have depths much<br />
deeper than seven inches. Even if only 0.4 ha (1 acre) is considered for a small mining operation, the<br />
law still only allows operators to remove overburden to a depth <strong>of</strong> about 190 cm (75 inches). The<br />
intent <strong>of</strong> the law was probably not to be this restrictive. WDEQ as the regulatory agency for small<br />
mines has considered topsoil/subsoil separate from overburden for several reasons, including: 1) topsoil<br />
is salvaged and reused for reclamation <strong>of</strong> the disturbed site, 2) spoil is defined as overburden removed<br />
during the mining operation to expose the mineral and does not include the marketable mineral, subsoil<br />
or topsoil, whereas topsoil means “soil on the surface prior to mining that will support plant life”, and<br />
3) distinctive references are made throughout the statutes that refer to overburden, topsoil and subsoil<br />
as separate entities.<br />
Suggested Modifications to Wyoming’s Statutes Governing Small Mines<br />
Included below are suggested modifications to the proposed 1999 Wyoming Senate file and House
ill that did not receive favorable recommendations in the respective legislative Joint Minerals, Business<br />
and Economic Development Interim Committees. Due to a lack <strong>of</strong> compromise by legislators in both<br />
governing bodies, the 1999 proposals were not advanced out <strong>of</strong> committee.<br />
Several concerns were noted by individuals opposed to the file and bill; however, one <strong>of</strong> the<br />
primary reasons both file and bill failed was due to the inclusion <strong>of</strong> a forty (40) acre (16 ha) size limit<br />
for small mines. Currently, ten (10) acre (4 ha) limits are used for small mines, but enlarging the area<br />
to be designated as a small mine concerned some legislators, in part, because <strong>of</strong> the need for regulating<br />
larger mines by more rigorous standards. It is our opinion that this change doomed the file and bill from<br />
further consideration by both Senate and House bodies, respectively. These issues are separate<br />
concerns and should be addressed independently.<br />
Separating topsoil and subsoil from overburden needs to be addressed in the Wyoming Statutes<br />
for Small Mines. As noted in the previous section, an area the size <strong>of</strong> current small mining designation<br />
would allow only the removal <strong>of</strong> 19 cm (7½ inches) <strong>of</strong> all surface material above the mineral, per year.<br />
Clearly, this does not take into account the fact that topsoil and subsoil will be utilized in the future for<br />
reclamation purposes. Currently, WDEQ-LQD Noncoal Rules and Regulations prevent small mine<br />
operators from handling topsoil, subsoil, and overburden as one material. Operators are required to<br />
present plans on how topsoil and subsoil will be salvaged and utilized in revegetation efforts. Bond<br />
release is dependent on completing reclamation <strong>of</strong> the small mine disturbance area. <strong>Revegetation</strong><br />
success is directly related to the salvage and subsequent replacement <strong>of</strong> the soil.<br />
In conclusion, we suggest both Wyoming’s Senate and House be presented with a file and bill from<br />
Joint Minerals, Business and Economic Development Interim Committees in the 2000 legislative session<br />
that only considers topsoil/subsoil criteria. There should be adequate protection <strong>of</strong> this material for use<br />
in successful reclamation programs proposed for each small mine. Future legislative considerations<br />
involving reclamation efforts should be coordinated with WDEQ, EQC, and small mine operators.<br />
LITERATURE CITED<br />
Environmental Quality Council. 1997. Smith vs. State <strong>of</strong> Wyoming, Department <strong>of</strong> Environmental<br />
Quality, Docket No. 2749-96.<br />
Laramie Boomerang. 1998. Court rules against mine’s definition <strong>of</strong> topsoil. Nov. 8, 1998. Laramie,<br />
WY.<br />
Munshower, F.F. 1994. Practical Handbook <strong>of</strong> Disturbed Land <strong>Revegetation</strong>. CRC Press, Inc. Boca<br />
Raton, FL.<br />
Wyoming Department <strong>of</strong> Environmental Quality-Land Quality Division (WDEQ-LQD). 1984. Guideline<br />
No. 1, Cheyenne, WY.<br />
Wyoming Statutes. 1998. Wyoming Environmental Quality Act and Industrial Development Information<br />
and Siting Act, Annotated and Supplement. WDEQ, Cheyenne, WY.
2000 Billings Land Reclamation Symposium<br />
IN-PLACE TOPSOIL PRESERVATION AND STORAGE AS AN EXPERIMENTAL<br />
PRACTICE<br />
Paul Baker 1 , Sharon Falvey 1* , Robert Davidson 1 , and Robert Postle 2<br />
ABSTRACT<br />
When planning a new mine, all aspects <strong>of</strong> final reclamation, including erosion control, slope stability,<br />
channel reconstruction, and revegetation must be considered in the initial facility design and permitting<br />
processes. As part <strong>of</strong> this process, mine construction planning must include the regulatory requirements<br />
for topsoil removal, storage and replacement. In steep, rugged and rocky canyons <strong>of</strong> central Utah,<br />
salvaging topsoil can be difficult, expensive, or even impossible. West Ridge Resources is conducting<br />
an Experimental Practice at its new West Ridge Mine that involves protecting topsoil in place rather<br />
than using the traditional method <strong>of</strong> salvaging and stockpiling the soil. On steep slopes and in<br />
ephemeral channel areas where topsoil removal was difficult, the undisturbed topsoil was protected in<br />
place by covering the soil with geotextile fabric prior to placement <strong>of</strong> mine yard construction non-toxic<br />
fill material. Saving topsoil in place should not only preserve soil structure but also soil integrity, which<br />
includes the integration <strong>of</strong> soil, roots and rocks. This Experimental Practice procedure has the added<br />
benefits <strong>of</strong> preserving the original ground surface configuration, existing stream channel and bank<br />
morphology which all should work together to promote reclamation slope stability and erosion control.<br />
1 State <strong>of</strong> Utah Department <strong>of</strong> Natural Resources, Division <strong>of</strong> Oil, Gas and <strong>Mining</strong><br />
2 United States Department <strong>of</strong> Interior, <strong>Office</strong> <strong>of</strong> <strong>Surface</strong> <strong>Mining</strong><br />
* Presenter
INTRODUCTION<br />
During 1999, West Ridge Resources, Inc., (West Ridge) constructed a new underground coal mine<br />
in eastern Carbon County, Utah. The <strong>Surface</strong> <strong>Mining</strong> Control and Reclamation Act, 1977, (SMCRA)<br />
provides an opportunity for a regulatory authority to approve experimental practices that encourage<br />
advances in mining and reclamation, as long as the practices are at least as environmentally protective as<br />
the existing regulations. Construction <strong>of</strong> a new underground coal mine presented an opportunity to try an<br />
alternative material handling practice that could result in improved reclamation success.<br />
Construction practices at underground Utah coal mines commonly require access to coal outcrops<br />
along steep canyon walls. To create level areas adjacent to the coal outcrops, canyon drainages are filled<br />
with materials from adjacent cut slopes. Extreme rocky conditions and steep canyon slopes minimize<br />
topsoil salvage. When topsoil resources are salvaged, stockpiling and mixing activities reduce natural<br />
variations in soil characteristics, ultimately reducing vegetative diversity. Reclamation <strong>of</strong> steep cut slopes<br />
<strong>of</strong>ten results in construction fill being retained in canyon bottoms with topsoil placed over the fill. Difficulties<br />
in duplicating the soil/rock matrix existing prior to mining can affect reclaimed slope and channel stability.<br />
As prescribed under SMCRA, an Experimental Practice allowing a variance from the topsoil<br />
salvage requirements at Code <strong>of</strong> Federal Regulations Part 30 (30 CFR), Section 817.22, was approved<br />
by the Utah Division <strong>of</strong> Oil, Gas and <strong>Mining</strong> and the U. S. <strong>Office</strong> <strong>of</strong> <strong>Surface</strong> <strong>Mining</strong>, Reclamation and<br />
Enforcement. The approved Experimental Practice allowed the operator to bury in-situ topsoil under<br />
imported and native fill rather than salvaging these soils. A geotextile fabric was used to protect the in-situ<br />
topsoil from contamination. In place protection <strong>of</strong> the topsoil maintains the pre-mine topsoil volumes and<br />
diversity.<br />
SMCRA also requires diverse plant community establishment (30 CFR 817.111(a)(1)), wildlife<br />
habitat restoration and enhancement (30 CFR 817.97(a)), and land form restoration to approximate original<br />
contour (30 CFR 817.102(a)). To obtain approximate original contour, the restored mine area must<br />
generally resemble the original surface configuration and complement the drainage pattern <strong>of</strong> the<br />
surrounding area (30 CFR 701.5). Restored drainages must be stable and must minimize additional<br />
contributions <strong>of</strong> suspended solids to streamflow (30 CFR 817.43(a)). The Experimental Practice at the<br />
West Ridge Mine was designed to incorporate these performance standards. Uncovering the buried soil<br />
surface assures removal <strong>of</strong> fill and restoration <strong>of</strong> the original contour. Topsoil preserved in-place is<br />
expected to enhance vegetative diversity. The retained soil/rock matrix and the channel geomorphology<br />
are expected to enhance channel stability while closely approximating original contour.<br />
METHODS<br />
Site Description<br />
The West Ridge Mine is located in a steep, narrow canyon called “C” canyon, approximately 25<br />
miles east <strong>of</strong> Price, Utah, in the Book Cliffs Coal Field. The Book Cliffs, a high plateau, forms an exposed,<br />
rugged escarpment with south and southwest exposures, and it is dissected by canyons such as C canyon.
The Book Cliffs lie within the Price River Basin between 1525 and 3050 m (5,000 and 10,000 feet) above<br />
mean sea level. Precipitation in the Book Cliffs varies from 254 to 508 mm (10 to 20 inches) with a mean<br />
annual precipitation around 305 mm (12 inches); most precipitation occurs during the late summer and early<br />
fall. From October through April above 1830 m (6000 feet), precipitation is primarily snowfall.<br />
Temperatures range from summer highs near 35 B C (95 B F) to lows less than -18 B C (0 B F) during the winter<br />
months.<br />
Geology<br />
Rock outcrops exposed along the Book Cliffs escarpments are primarily sandstone, mudstone and<br />
shale. Outcrops within the project area are part <strong>of</strong> the Cretaceous Mesaverde Group consisting <strong>of</strong> the<br />
Blackhawk Formation and the Castlegate Sandstone. The coal resource is located in the Blackhawk<br />
Formation which includes various sequences <strong>of</strong> mudstone, siltstone, shale and sandstone. The West Ridge<br />
surface facilities are developed where the Lower Sunnyside coal seam outcrops from the Blackhawk<br />
formation, while the Castlegate Sandstone, a massive sandstone unit from the Price River Formation, is<br />
exposed near the edge <strong>of</strong> the disturbed area in the north fork <strong>of</strong> C Canyon.<br />
Hydrology<br />
The C Canyon drainage is ephemeral and flows in response to precipitation or snow melt run<strong>of</strong>f.<br />
Flows within ephemeral drainages in this region are infrequent; however, when flows occur they are <strong>of</strong>ten<br />
high volume flows <strong>of</strong> short duration. Water monitoring conducted above and below the mine site did not<br />
record any flow during the 1997 and 1998 seasons.<br />
The C Canyon drainage is comprised <strong>of</strong> large sandstone boulders embedded with cobble sized<br />
to fine materials (see Figures 1 and 2). Boulders may be greater than 3 m (10 feet) along the long axis.<br />
Where boulders form a large pile in the channel, elevation drops and natural grade controls develop in a<br />
stair-step fashion. The elevation drops are steep and range from about 1 to 3.5 m (3-12 feet) in height.<br />
Up-gradient from these rock controls, the channel slope flattens to the next rock control structure which<br />
rises quickly. The average gradient <strong>of</strong> C-Canyon in the mine site area is approximately 6.4%.<br />
Soils<br />
Figure 3 shows the mine site and areal extent <strong>of</strong> the soil unit. Soils within the West Ridge Mine<br />
facility area are described in two soil surveys:<br />
•� A Third Order Soil Survey conducted for Carbon County, Utah (Jensen and Borchert, 1988),<br />
delineates the West Ridge mine site soils as primarily Rock Outcrop-Rubbleland-Travessilla<br />
complex, slopes 30-70%, 30-60 m (100-200 feet) long, elevation ranging from 1980 to 2650 m<br />
(6,500 to 8,700 feet). The southeast portion <strong>of</strong> the mine yard includes Midfork family-Commodore<br />
complex soils, slopes 50-70%, 60-90 m (200-300 feet) long, elevation 2410 to 2895 m (7,900-<br />
9,500 feet).
Figure 1. Right fork C Canyon above grade control structure.<br />
Figure 2. Right fork C Canyon grade control structure.
Rock Outcrop<br />
Rubbleland<br />
Topsoil Stockpile<br />
Geotextile Midfork soil<br />
Midfork & Strych Soils<br />
Brycan soil<br />
Marker Strip<br />
Strych soil<br />
Rock Outcrop/Rubbland<br />
Travessilla soil<br />
Experimental Practice Soil Salvage<br />
WP #5<br />
A'<br />
Cross Section (see Fig. 7)<br />
A<br />
Test Plots<br />
(see Fig. 8)
•� The First Order Soil Survey (Nyenhuis, 1997) delineates five soil mapping units within the<br />
mine yard. These soil units are Rock Outcrop, Rock Outcrop-Rubbleland-Travessilla complex,<br />
Strych stony fine sandy loam, Midfork very stony fine sandy loam, and Brycan loam (see<br />
Figure 3). The Travessilla complex soil is classified as an Entisol, the Strych soil is classified as<br />
an Aridisol, and the Brycan and Midfork units are classified as Mollisols. Table 1 shows<br />
chemical and physical characteristics <strong>of</strong> these soils.<br />
The soil surveys identified the Midfork, Brycan and Strych soils as providing salvageable<br />
topsoil material while the Rock Outcrop and the Rock Outcrop-Rubbleland-Travessilla complex<br />
includes salvageable Travessilla soil in isolated pockets. Soil volumes available for salvage within the<br />
6.76 ha (16.69 acre) disturbed area include 6717 m 3 (8,785 yd 3 ) from the Midfork unit, 592 m 3 (774<br />
yd 3 ) <strong>of</strong> Brycan soil and 6217 m 3 (8,131 yd 3 ) <strong>of</strong> Strych, assuming 0.46 m (18 inches) average soil<br />
salvage depth. Soil salvage is estimated to be 7714 m 3 (10,089 yd 3 ) in the Rock Outcrop-Rubbleland-<br />
Travessilla complex.<br />
Vegetation<br />
Plant communities in C Canyon are dominated by shrubs and small to large trees, with<br />
approximately equal understory and overstory cover values. The three vegetation communities,
pinyon/juniper, Douglas fir/Rocky Mountain juniper and Douglas fir/maple, are clearly associated with slope<br />
aspect and soil units.<br />
A pinyon/juniper community occurs on south and southeast facing slopes and on soils with high<br />
rock content, such as the Rock Outcrop-Rubbleland-Travessilla complex. Predominant species are twoneedle<br />
pinyon (Pinus edulis Engelm.), Douglas fir (Pseudotsuga menziesii (Mirbel) Franco), bitterbrush<br />
(Purshia tridentata (Pursh) DC), and Utah juniper (Juniperus osteosperma (Torr.) Little). Total<br />
vegetative cover is about 53%.<br />
Midfork and Brycan soils support a Douglas fir/Rocky Mountain juniper community. Slopes with<br />
this community have a northwest aspect and are dominated by Douglas fir, Penstemon sp., Rocky<br />
Mountain juniper (Juniper scopulorum Sarg.), mountain lover (Pachystima myrsinites (Pursh) Raf), and<br />
spike fescue (Leucopoa kingii (Wats.) W. A. Weber). Total vegetative cover in this area is about 75%.<br />
The soil surface in the Douglas fir/Rocky Mountain juniper community has significant cover from<br />
cryptogams, including unusually large numbers <strong>of</strong> liverworts.<br />
The Strych soil is in the bottom <strong>of</strong> the right (main) fork <strong>of</strong> C Canyon. The vegetation in this area<br />
is a Douglas fir/maple community dominated by Douglas fir, Rocky Mountain and bigtooth maple (Acer<br />
glabrum Torr. and A. grandidentatum Nutt. in T. & G.), Rocky Mountain juniper and mountain lover.<br />
Vegetative cover is about 66%. The canyon bottom in the left fork has Rock Outcrop-Rubbleland-<br />
Travessilla complex soil and is dominated by pinyon and juniper.<br />
Methods<br />
West Ridge used both the traditional method for salvaging and stockpiling topsoil and an<br />
Experimental Practice for preserving topsoil in place. The Experimental Practice was proposed for areas<br />
under the fill where restoring the original, pre-existing soil structure and slope configuration would be<br />
difficult, and where the reclaimed slope stability is expected to be enhanced by retaining the original soil and<br />
surface configuration (See Figure 3 for areas where the Experimental Practice was used). Table 2<br />
summarizes soil salvage and preservation activity conducted at the site. The traditional and experimental<br />
practices used within the 6.76-ha (16.69-acre) disturbed area were as follows:<br />
•� Traditional methods for salvage and topsoil resource protection prior mine pad and surface site<br />
facilities construction occurred on approximately 2.13 ha (5.25 acres).<br />
•� The Experimental Practice for preserving topsoil resources in place, with minimal surface<br />
disturbance, was conducted on 4.71 ha (11.64 acres). The in-place topsoil is buried beneath fill<br />
for the life <strong>of</strong> mine and will be unearthed at reclamation. Two different methods are employed for<br />
the Experimental Practice:<br />
1.� Marker strips - Brightly colored marker strips were placed on 2.4-m (8-foot) centers<br />
within the Rock Outcrop-Rubbleland areas to delineate the location <strong>of</strong> the original soil
surface. This Experimental Practice was used on approximately 2.94 ha (7.27<br />
Table 1. First Order Soil Survey Chemical and Physical Characteristics.<br />
Soil Name<br />
Taxonomi<br />
c<br />
Class<br />
Travessilla<br />
Torriorthe<br />
nt<br />
Midfork<br />
Cryoboroll<br />
Brycan<br />
Haploborol<br />
l<br />
Strych<br />
Calciorthid<br />
Herndandez<br />
Calciorthid<br />
Atrac<br />
Camborthid<br />
Strych<br />
Calciorthid<br />
Texture pH EC<br />
mmhos/c<br />
m<br />
Saturati<br />
on<br />
%<br />
<strong>Surface</strong> Facility area<br />
SAR Selenium<br />
*<br />
ppm<br />
Boron*<br />
ppm<br />
Carbona<br />
te<br />
%<br />
loam 7.8 0.28 35.1 0.37
Construction and Reclamation Sequences<br />
Imported fill material was hauled in by trucks from an <strong>of</strong>f-site, commercial gravel pit and placed<br />
on top <strong>of</strong> the geotextile. Native construction fill was obtained within C Canyon from cutslopes constructed<br />
above the upper pad elevation. The imported and native fills were placed in<br />
Table 2. Soil Salvage and Preservation Summary<br />
Soil Unit<br />
Total<br />
Disturbe<br />
d<br />
(ha)<br />
Soil<br />
Salvag<br />
e<br />
(ha)<br />
Experiment<br />
al<br />
Practice<br />
(ha)<br />
Total<br />
Soil<br />
Available*<br />
(m 3 )<br />
Actual Soil<br />
Salvage<br />
(m 3 )<br />
Brycan 0.13 0.13 0 592 727 0<br />
Midfork 1.47 1.03 0.44 6721 3651 2000<br />
Strych 1.36 0.11 1.25 6220 536 5721<br />
RO/RL<br />
Travessill<br />
a<br />
3.80 0.85 2.94 7718 3695 5981<br />
Totals 6.76 2.13 4.63 21251 8817 13703<br />
*Soil volumes based on:�<br />
Average .0.46 m <strong>of</strong> topsoil depth for Brycan, Midfork, & Strych�<br />
Average 0.20 m <strong>of</strong> soil depth for Rock Outcrop-Rubbleland Travessilla Complex�<br />
Experimental<br />
Practice<br />
Soil Preserved<br />
In-Place*<br />
(m 3 )<br />
separate, compacted lifts until the required yard elevations were reached. To ensure imported fill is<br />
removed, bright marker flagging was placed between the native and imported fills. The imported fill does<br />
not contain any toxic or unsuitable material and meets the soil suitability criteria recommended by the<br />
Division <strong>of</strong> Oil, Gas and <strong>Mining</strong> guidelines (see Table 1). Fill material typically ranges from 3 to 12 m (10<br />
to 40 feet) deep and will remain in place during mine operation, an estimated 20 years.<br />
Figure 4 illustrates the construction sequence in a series <strong>of</strong> generalized cross sections. The<br />
geotextile fabric and marker strip installation are shown in Steps 2 and 3, and in Figures 5 and 6. Figure<br />
7 is a generalized cross section <strong>of</strong> the finished mine yard.<br />
Reclamation will be completed in the reverse order from the construction sequence. During final<br />
reclamation the imported pad fill will be removed and hauled <strong>of</strong>f site exposing the geotextile layers and<br />
flagged surfaces that allow equipment operators to determine the boundaries between buried soils and fills.<br />
Native materials will be used to backfill cutslopes above the pad and the surface will be topsoiled treated<br />
and revegetated.<br />
In geotextile and marker strip areas, the exposed soil surface will be gouged. Hay will be worked<br />
into the soil at the rate <strong>of</strong> 2245 kg·ha -1 (2,000 pounds per acre) to relieve soil compaction and increase<br />
moisture absorption. Gouging depressions will be about 0.6 by 1.0 m and 0.5 m deep (about 24" by 36"<br />
and 18" deep) and create a pattern to control erosion through water and sediment retention. All species
in the seed and planting mixes are native to the area. The operator will broadcast seed in the fall, followed<br />
by mulching with 2245 kg·ha -1 (2,000 pounds per acre) <strong>of</strong> straw and 561 kg·ha -1 (500 pounds per acre)<br />
<strong>of</strong> wood fiber hydromulch with a tackifier (in addition to the hay worked into the soil).
LEGEND:<br />
Cap Layer Material Excess Imported Fill<br />
In-Situ Topsoil (Soil and Rock<br />
in RO/RL Areas)<br />
Geotextile (Marker Strips RO/RL Area)<br />
Figure 4. Construction sequence.<br />
Step 1: Vegetation Removal<br />
- Commercial trees are salvaged.<br />
- Trees and shrubs along the channel are cut <strong>of</strong>f above ground leaving<br />
roots in place.<br />
- Slash is burned and placed near the bottom <strong>of</strong> fill, close to the soil<br />
resource.<br />
Step 2: Culvert Installation and Backfill<br />
- Reposition or modify large boulders within channel banks.<br />
- Geotextile and marker strips are placed in the channel.<br />
- Bedding fill is placed in the channel.<br />
- Fill is ramped accomodating culvert placement over channel<br />
grade control structures.<br />
- Bypass culvert is installed and backfilled.<br />
- Culvert area provides access for remaining pad construction.<br />
Step 3: Extend Geotextile and Marker Strips Up Slopes<br />
- Bright colored marker strips placed over rock/rubbleland soil surface (8' x 8' grid).<br />
- Geotextile fabric is placed over topsoil surface and extended up slopes.<br />
- Place 12" to 18" fill over geotextile for subsequent earthwork<br />
and operations.<br />
Remaining Native Fill<br />
Culvert Backfill/Bedding Material
LEGEND:<br />
Step 5:<br />
Cap Layer Material<br />
Step 4: Cut slope areas<br />
- Pull boulders from cutslope areas.<br />
- Boulders placed along culvert flanks and as fill where<br />
conducive.<br />
Topsoil Salvage<br />
- Salvage topsoil from Brycan, Midfork, Strych, and Rubbleland Travessilla<br />
soil units.<br />
- Transport topsoil, segregate and place in topsoil stockpile.<br />
- Salvage Rubbleland substitute topsoil and place in sedimentation pond<br />
embankments.<br />
Step 6: Excavate Sideslopes/Native<br />
- Fill Placed in Pad<br />
- Excavate sideslopes creating cutslopes above final pad elevation.<br />
- Native cut material used as pad fill and placed over culvert fill.<br />
- Place coal mine waste from portal highwall in designated area.<br />
In-Situ Topsoil (Soil and Rock<br />
in RO/RL Areas)<br />
Geotextile (Marker Strips RO/RL Area)<br />
Figure 4. Construction sequence (continued).<br />
Excess Imported Fill<br />
Remaining Native Fill<br />
Culvert Backfill/Bedding Material
Step 7:<br />
LEGEND:<br />
Cap Layer Material Excess Imported Fill<br />
In-Situ Topsoil (Soil and Rock<br />
in RO/RL Areas)<br />
- Test fill for toxic and acid-forming characteristics.<br />
- Haul fill from commercial borrow areas.<br />
Step 8:<br />
- Place granular road base over operational pad surfaces.<br />
Step 9:<br />
Import Offsite Fill<br />
Install Cap Layer<br />
- Install surface facilities and drainage controls.<br />
Geotextile (Marker Strips RO/RL Area)<br />
Figure 4. Construction sequence (continued).<br />
Finish <strong>Surface</strong> Facility Structures<br />
Remaining Native Fill<br />
Culvert Backfill/Bedding Material
Figure 5. Imported construction fill being placed over geotextile fabric.<br />
Figure 6. Marker strips over Rock Outcrop-Rubbleland and channel.
A<br />
North Slope<br />
Rock, rubble<br />
Sideslope excavation<br />
Rock, rubbleland,<br />
Undisturbed<br />
Cap layer<br />
Flagging<br />
Mine pad surface area<br />
(As-constructed)<br />
Figure 7. Generalized cross section.<br />
Test Plot<br />
Fill material<br />
Bypass culvert<br />
located in original<br />
drainage channel<br />
Topsoil, salvaged<br />
and stockpiled<br />
Geotextile<br />
layer<br />
Topsoil,<br />
undisturbed<br />
South Slope<br />
Perimeter slopes<br />
Sideslope excavation<br />
Topsoil, protected<br />
in-place (12"-18" typical)<br />
To test the Experimental Practice, a test plot was established to simulate the mine yard construction<br />
sequence. The test plots will be used to compare reclamation results for “buried topsoil” with “salvaged<br />
and replaced topsoil.” The test plot area, constructed in spring 1999 during the initial mine yard<br />
construction, was placed where both Strych and Midfork soil types occur equally over the test plot. The<br />
test plots are divided into four different quadrats. The Midfork covers the south and east quadrats and the<br />
Strych covers the north and west quadrats (see Figure 8). The soils were moved according to the steps<br />
illustrated in Figure 8 and the final quadrat descriptions are as follows:<br />
• North Quadrat - This cut area provides the Strych topsoil salvaged for the west quadrat.<br />
C East Quadrat - This cut area provides the Midfork topsoil salvaged for the south quadrat and<br />
provides the Midfork subsoil (fill) for the west quadrat.<br />
• South Quadrat - This fill area retains the Midfork topsoil in place and is covered with geotextile<br />
fabric. The Midfork topsoil salvaged from the east quadrat is stockpiled over the retained Midfork<br />
soils.<br />
• West Quadrate- This fill area retains the Strych topsoil in place and is covered with geotextile<br />
fabric. The Midfork subsoil salvaged from the east quadrat is placed in 0.6-meter (2-foot)<br />
compacted lifts to a depth <strong>of</strong> about 1.8 m (6 feet) over the retained Strych soil. Geotextile is placed<br />
A'
Figure 8. Test plot diagram.<br />
over the fill, and salvaged Strych topsoil from the north quadrat, is stockpiled over the fill.<br />
The West Quadrat area is designed to simulate in-place topsoil preservation and the effects <strong>of</strong><br />
construction fill over topsoil. The material used from the north and east quadrats, and placed on the west<br />
and south quadrats, simulate traditional topsoil salvage and storage including cut, backfill and topsoil<br />
replacement.<br />
In five years, the test plots will be reclaimed using treatments proposed to be applied during mine<br />
reclamation. After the test plots are reclaimed, the operator will monitor them for an additional five years,<br />
or until vegetative results are determined to meet cover and diversity standards as compared to the<br />
reference area for both traditional and Experimental Practice areas. A pre-selected topsoil borrow area<br />
will be used to obtain soils for final reclamation if the test plots show that the Experimental Practice will fail<br />
to establish successful re-vegetation. The borrow area was selected based on similar soil chemical and<br />
physical characteristics as those found in C Canyon (see Table 1 for chemical and physical characteristics).
Approximate Original Contour Restoration<br />
DISCUSSION<br />
Potential Benefits<br />
Traditional coal mining operations require cut and fill practices to create pad areas. Reclaiming the<br />
steep cut faces to meet stability requirements can result in slopes that are less steep than pre-mining slopes<br />
and in some cases can cause the channel base to be elevated above the original channel. Problems<br />
associated with these final land configurations can include unstable channels, steep channel gradients, and<br />
erosive conditions. By committing to uncover the buried soils, the original contour and channel<br />
configuration will be retained in these areas. After reclamation, the drainages and slopes in the<br />
Experimental Practice area will be in almost exactly the same configuration as before mining.<br />
Channel<br />
The Experimental Practice will minimize changes to channel geomorphology which should result<br />
in decreased erosion and downstream sedimentation and a stable channel configuration similar to what<br />
existed before mining construction, reducing downcutting or headcutting. Although some <strong>of</strong> the largest<br />
rocks were moved out <strong>of</strong> the channel, the base <strong>of</strong> the channel and most grade control structures were<br />
retained; therefore, the channel is expected to be more stable than a reconstructed drainage over fill.<br />
Soils<br />
Soil salvage within the Rock Outcrop-Rubbleland areas at the West Ridge Mine would have been<br />
difficult due to topography and the extremely rocky nature <strong>of</strong> the native soils. Little topsoil would have<br />
been salvaged. Topsoil removal, stockpiling and redistribution result in soil loss and adversely affect soil<br />
characteristics, such as soil structure and the soil, root and rock makeup. The Experimental Practice will<br />
minimize these losses and enhance reclamation success.<br />
Saving topsoil in place retains the existing soil structure and the natural soil integrity. Unlike<br />
stockpiled soil, soil buried in-place is protected from wind and water erosion. Soil structure is important<br />
for plant growth because it influences water movement, soil moisture, temperature, air, and root<br />
penetration. Each <strong>of</strong> these factors affects other soil development processes. Soil integrity is provided by<br />
the natural occurrence <strong>of</strong> soil particles, roots, and rocks that influence the physical properties <strong>of</strong> soil, thus<br />
affecting soil stability and productivity. Once fills are removed and buried soils are exposed, soil stability<br />
should be enhanced because many rocks, tree stumps, and large roots will still be intact.<br />
Vegetation<br />
Traditional soil salvage and replacement is not conducive to creating a diverse plant community.<br />
Most mine operators, especially those operating in space-restricted areas, salvage and store topsoil without
Figure 9. Reclaimed area in foreground.<br />
regard to segregating varying soil types. When the mine is reclaimed, many <strong>of</strong> the rocks in the soil may be<br />
used for riprap, so the resulting soil tends to be a homogenous mixture with little rock microrelief. In Utah,<br />
this can lead to a predominance <strong>of</strong> grasses on reclaimed sites and little structural diversity or ecotone<br />
development (Figure 9, Standardville). Less desirable species, such as rabbitbrush and snakeweed, tend<br />
to invade the site.<br />
A more diverse seedbed with a variety <strong>of</strong> soil conditions, including differing soil texture,<br />
rock content, structure, depth, and topography, gives greater variation in habitat conditions and is more<br />
likely to result in a wider species composition and improved structural diversity within the plant community.<br />
More variety improves habitat for a wider variety <strong>of</strong> wildlife species.<br />
The Experimental Practice provides a means to preserve most <strong>of</strong> the surface topographic variability<br />
on part <strong>of</strong> the West Ridge Mine property. This should result in additional microclimates where a variety<br />
<strong>of</strong> plant forms can establish and provide more diverse wildlife habitat.<br />
Because the soils are closely associated with particular plant communities, leaving the soils in place<br />
as part <strong>of</strong> the Experimental Practice should speed development <strong>of</strong> the communities that existed prior to<br />
mining.
Regulatory Concerns with the Experimental Practice<br />
The soil regulations are intended to protect and preserve the topsoil resource for the purpose <strong>of</strong><br />
revegetation, and supporting the designated post-mining land use. The proposed Experimental Practice,<br />
including operation and reclamation procedures, should provide protection equal to or greater than that<br />
obtained through traditional methods.<br />
Concerns and issues related to the proposed Experimental Practice are listed and discussed below:<br />
Soil Compaction<br />
During construction, installation <strong>of</strong> construction fill will compact the in-place soils. Through the life<br />
<strong>of</strong> the mine, pad-fill materials will further compact the soil over time. However, during reclamation, the<br />
mine operator will gouge the surface about 0.46 m (18 inches) deep and incorporate alfalfa hay. Gouging<br />
and hay incorporation, combined with natural processes (e.g., freeze/thaw), should alleviate compaction<br />
and allow vegetation to establish. Little difference is expected between the Experimental Practice and<br />
traditional practices because backfilling and grading operations compact subsoils and replaced fills. When<br />
using traditional topsoil replacement methods, surface compaction is diminished in the top 0.46 m (18<br />
inches) using common surface treatments; in the Experimental Practice areas, gouging will similarly relieve<br />
compaction.<br />
Decreased Soil Microbial Activity<br />
Microorganisms are beneficial in plant establishment and growth (Cundell, 1977). Soil that has<br />
been stockpiled for several years has fewer microorganisms when it is uncovered as compared to<br />
undisturbed areas (Fresquez et al., 1982). Buried soils are expected to have little microbial activity when<br />
they are uncovered after 20 years. However, it is the authors’ opnion that there will be little difference<br />
between soils buried in place and soils placed in a large stockpile.<br />
Natural inoculation is likely to occur quickly since the site is surrounded by undisturbed areas.<br />
Nearly all <strong>of</strong> the proposed disturbed area is less than 60 m (200 feet) from undisturbed areas. At a nearby<br />
reclaimed coal mine, cryptobiotic soils have become established naturally on a soil borrow area after eight<br />
years (R. Davidson, personal observations). West Ridge has committed to conducting a soil activation<br />
treatment on the test plots.<br />
Contamination<br />
Native soils could be contaminated by imported fill material. A buffer <strong>of</strong> native fill or non toxic<br />
imported fill will be placed between the native soil surface and imported fill. Bright marker flagging placed<br />
between the native and imported fill will allow equipment operators to determine the boundary line between<br />
these materials.
After removing imported fill, native fill will be excavated and placed on the cutslopes to achieve<br />
approximate original contour. Mixing native fill with the undisturbed Brycan soil should be minimized by<br />
using the geotextile fabric. There will be some mixing in Rock Outcrop-Rubbleland areas, but the native<br />
fill is essentially the same material as the Rock Outcrop-Rubbleland soil (see Table 1). In addition, soil will<br />
not be salvaged in the Rock Outcrop-Rubbleland areas in the traditional regulatory scenario, so there is<br />
no disadvantage to the Experimental Practice.<br />
Economics<br />
West Ridge did not do a detailed cost comparison between the Experimental Practice and<br />
traditional soil salvage, but the project manager believes construction costs will show little difference<br />
between the two methods (D. Shaver, personal communication). Reclamation costs are expected to be<br />
slightly lower using the Experimental Practice because there will be less backfilling and less soil handling.<br />
Subsequently, there will be much less work to reestablish the channel and fewer stability and revegetation<br />
problems are expected.<br />
CONCLUSION<br />
This Experimental Practice procedure which retains topsoil in place not only preserves soil structure<br />
but also soil integrity, which includes the integration <strong>of</strong> soil, roots and rocks. The Experimental Practice<br />
should preserve the original ground surface configuration, the existing stream channel and bank morphology,<br />
which should promote reclamation slope stability and erosion control. The Experimental Practice described<br />
in this paper is expected to have several benefits, but a complete analysis will have to wait until after<br />
reclamation <strong>of</strong> the mine in about 30 years. In five years, West Ridge will reclaim the test plots, and those<br />
results will assist in determining success <strong>of</strong> the Experimental Practice. The proposed reclamation plan<br />
should result in vegetative cover that meets or exceeds SMCRA performance standards.<br />
ACKNOWLEDGMENTS<br />
We appreciate the cooperation <strong>of</strong> West Ridge Resources, particularly Jean Semborski, Dave<br />
Shaver, and Mike Glasson, in providing information for this paper.<br />
REFERENCES<br />
Cundell, A. M. 1977. The role <strong>of</strong> microorganisms in the revegetation <strong>of</strong> strip-mined land in the western<br />
United States. J. Range Manage. 30: 299-305.<br />
Fresquez, P. R., W. C. Lindemann, and D. L. Lindsey. 1982. Soil biota in southwestern coal strip-mine<br />
spoils. In: E. F. Aldon and W. R. Oaks (eds.) Reclamation <strong>of</strong> mined lands in the southwest: a<br />
symposium. Soil Conservation Society <strong>of</strong> America New Mexico Chapter. 218 pp.<br />
Jensen, E. H. and J. W. Borchert. 1988. Soil survey <strong>of</strong> Carbon area, Utah. U. S. D. A. Soil Conservation<br />
Service. U. S. Government Printing <strong>Office</strong> 1988 0-183-510:QL3. 294 pp.
Nyenhuis, J. H. 1997. Soil resource assessment West Ridge Mine area, Carbon County, Utah. In: West<br />
Ridge Mine permit application package. West Ridge Resources, Inc., Price Utah.<br />
APPENDIX A<br />
The geotextile fabric will have the following minimum properties:<br />
MECHANICAL PROPERTIES<br />
Grab Tensile Strength<br />
ASTM D 4632<br />
MD @ Ultimate 0.89 (200)<br />
CMD @ Ultimate 0.89 (200)<br />
MD/CMD Elongation @ Ultimate<br />
Mullen Burst Strength<br />
ASTM D 3786<br />
2756 (400)<br />
Trapezoidal Tear Strength<br />
ASTM D 4533<br />
Puncture Strength<br />
ASTM D 4833<br />
UV Resistance after 500 hrs.<br />
ASTM D 4355<br />
HYDRAULIC PROPERTIES<br />
Apparent Opening Size<br />
ASTM D 4751<br />
Permissivity<br />
0.33 (75)<br />
0.40 (90)<br />
70<br />
0.300 (50)<br />
0.05<br />
UNITS<br />
kN (lbs)<br />
kN (lbs)<br />
15 %<br />
kPa (psi)<br />
kN (lbs)<br />
kN (lbs)<br />
% Strength<br />
mm(US sieve)<br />
sec-1
2000 Billings Land Reclamation Symposium<br />
TOPSOIL STOCKPILING vs. EXPOSURE TO TRAFFIC;<br />
A CASE STUDY ON AN IN-SITU URANIUM WELLFIELD<br />
Peter D. Stahl, Barry L. Perryman, Shankar Sharmasarkar,<br />
and Larry C. Munn 1<br />
ABSTRACT<br />
Management <strong>of</strong> soils on mine sites is crucial to post-mining reclamation. We conducted<br />
a study to determine which <strong>of</strong> the following two topsoil management strategies results in<br />
the least negative impact to the soil and best promotes site reclamation on in-situ uranium<br />
wellfields: 1) removal <strong>of</strong> topsoil from an entire wellfield and stockpiling until mining<br />
activity is complete; or 2) leaving the majority <strong>of</strong> topsoil on the wellfield allowing it to be<br />
exposed to disturbance associated with wellfield development activity (primarily heavy<br />
vehical traffic). The study was conducted by comparing selected soil properties from<br />
areas on in-situ uranium wellfields that were managed by the two strategies stated above<br />
and with adjacent relatively undisturbed sites. Results indicated that levels <strong>of</strong> vehicular<br />
traffic on wellfields did not cause significant soil compaction and that removal and<br />
stockpiling <strong>of</strong> topsoil results in more negative impacts than disturbance inflicted when<br />
topsoil is left in place.<br />
1 Department <strong>of</strong> Renewable Resources, University <strong>of</strong> Wyoming, Laramie, Wyoming<br />
82071
INTRODUCTION<br />
Management <strong>of</strong> soils on lands subjected to human perturbation is crucial to postdisturbance<br />
restoration <strong>of</strong> the impacted area. Because soils are a fundamental component<br />
<strong>of</strong> terrestrial ecosystems from which most organisms obtain essential materials such as<br />
nutrients and energy, as well as habitat, successful restoration <strong>of</strong> a disturbed area is highly<br />
dependent on maintenance <strong>of</strong> soil quality. Therefore, management practices which<br />
minimize detrimental impacts <strong>of</strong> human activities to the soil resource can prevent further<br />
site degradation and facilitate site restoration.<br />
Removal and stockpiling <strong>of</strong> soil from an area is a method commonly employed to<br />
protect this valuable resource from loss or damage due to human activities such as surface<br />
mining operations, contamination with foreign materials, or compaction from vehicular<br />
traffic. Removal and stockpiling <strong>of</strong> topsoil, however, has serious detrimental effects on<br />
it's physical, chemical and biological properties and usually results in a significant<br />
reduction in soil quality (Pedersen et al., 1978; Severson and Gough, 1983; Visser et. al.,<br />
1984). These impacts include complete loss <strong>of</strong> the vegetation growing in the topsoil,<br />
destruction <strong>of</strong> soil structure and elimination <strong>of</strong> the habitat topsoil provides for a myriad <strong>of</strong><br />
organisms. Therefore, the negative effects <strong>of</strong> removing and stockpiling a topsoil must be<br />
considered in comparison to the impact <strong>of</strong> the site disturbance on soil properties and<br />
related considerations such as reclamation and revegetation. For example, the detrimental<br />
impacts <strong>of</strong> topsoil removal and stockpiling are relatively minor compared to complete<br />
loss due to removal and mixing with overburden were it not salvaged before surface<br />
mining. Revegetating a surface-mine site with respread stockpiled topsoil is less<br />
problematic than a site with no topsoil. On the other hand, few soil disturbances other<br />
than complete loss or contamination with toxic materials, have as many adverse effects as<br />
removal and storage.<br />
Soil compaction <strong>of</strong>ten results from human activities on a site, especially when<br />
vehicular traffic is involved. Compaction, in most cases, is detrimental to soil structure;<br />
causing a reduction in volume <strong>of</strong> pore space, increasing bulk density and alteration <strong>of</strong><br />
hydraulic properties. These changes can affect the movement <strong>of</strong> water and solutes in soil<br />
(Ankeny et al., 1990). Growth and metabolism <strong>of</strong> organisms in the soil can be adversely<br />
affected through a loss <strong>of</strong> colonizable habitats (Foster, 1988) and reduced gas and water<br />
exchange (Huysman et al., 1989; Kaiser et al., 1991). Plant growth in compacted soils<br />
can be adversely affected through reduced root extension and shoot growth (Taylor and<br />
Brar, 1991; Lipiec et al., 1991) as well as lowered nutrient uptake due to nutrient<br />
restriction (Dolan et el., 1992). Vehicular traffic on soil is a common cause <strong>of</strong><br />
compaction, the extent <strong>of</strong> which is related to the natural compressibility <strong>of</strong> the soil,<br />
amount <strong>of</strong> traffic and weight <strong>of</strong> vehicles. Fine textured soils and wet soils are most<br />
compressible (Plaster, 1997). The impact on soil is generally limited to the area directly<br />
beneath the vehicles' wheels.<br />
In-situ extraction <strong>of</strong> uranium is a recently developed method for obtaining uranium<br />
from deep deposits without excavation <strong>of</strong> overlying materials. Acidified water is pumped<br />
down into deposits where uranium goes into solution; the solution is then pumped back to<br />
the surface for removal <strong>of</strong> uranium. In-situ uranium wellfield development activities<br />
potentially damaging to soils on the site include well drilling, small building and road
construction, pipeline installment, and vehicular traffic associated with these activities.<br />
The topsoil management strategy commonly employed at in-situ uranium extraction<br />
wellfields was salvage <strong>of</strong> topsoil from pipeline right-<strong>of</strong>-ways, building, drilling and<br />
storage sites as well as access roads subjected to repetitive heavy duty vehicular traffic.<br />
Wellfield traffic, however, is not limited to the access roads but includes substantial <strong>of</strong>f<br />
road traffic from access roads to individual well drilling sites. Under this management<br />
plan, it is estimated that topsoil was removed from less than 15% <strong>of</strong> the entire wellfield<br />
area leaving much <strong>of</strong> the remaining soil exposed to random vehicular traffic. Recently, an<br />
alternative topsoil management strategy has been proposed that would involve topsoil<br />
removal from the entire wellfield and storage until wellfield activities are completed.<br />
The objective <strong>of</strong> this research has been to determine which <strong>of</strong> the following two<br />
topsoil management strategies result in the least negative impact to the soil resource on<br />
in-situ uranium wellfields and best promotes site restoration: 1) removal <strong>of</strong> all topsoil<br />
from an entire wellfield and stockpiling until it is respread or 2) leaving the majority <strong>of</strong><br />
topsoil on a wellfield in place, removing topsoil from selected areas <strong>of</strong> heaviest<br />
disturbance where it might be lost or contaminated such as mudpits, pipeline right-<strong>of</strong>ways,<br />
and access roads. The basic question involved in this comparison is whether<br />
wellfield development activities, primarily heavy vehicular traffic, results in more or less<br />
damage to the topsoil resource than removal <strong>of</strong> topsoil from an entire wellfield, indefinite<br />
storage, and subsequent replacement.<br />
METHODS<br />
This study is based on analysis and comparison <strong>of</strong> selected soil properties at the<br />
Highland Uranium Project near Glenrock, WY and the Irigaray Ranch Uranium Mine<br />
near Pumpkin Buttes, WY as well as relatively undisturbed sites directly adjacent to both<br />
mines for comparative purposes. Vegetation characteristics <strong>of</strong> disturbed and relatively<br />
undisturbed sites were also examined at the Highland Uranium Project as indicators <strong>of</strong><br />
the influence <strong>of</strong> soil management practices on site revegetation. In-situ uranium<br />
wellfields at these mines were managed according to the strategies described above.<br />
At the Highland Uranium Project, two different aged wellfields were examined; a<br />
wellfield at which the mining process was initiated 2 years prior to sampling (Wellfield<br />
F) and one at which mining was initiated 7 years prior to sampling (Wellfield C). Soil<br />
samples were obtained from areas on both wellfields that had been subjected to the<br />
following management practices: 1) Topsoil removed, stockpiled and replaced<br />
(stockpiled); 2) Topsoil left in place, subjected to wellfield development activities (insitu).<br />
At the Irigaray Ranch Uranium Mine, at which mining activities were initiated 17<br />
years prior to sampling, soils were collected from areas which had been subjected to the<br />
following management practices: 1) Topsoil removed and stockpiled but not replaced<br />
(stockpiled); 2) Topsoil left in place, subjected to wellfield development activities (insitu);<br />
3) Subsoil left in place after topsoil removal, subjected to wellfield development<br />
activities (stripped).<br />
Native, relatively undisturbed topsoil from undeveloped areas directly adjacent to insitu<br />
uranium wellfields were sampled at both mines for comparative purposes.
Soil samples were collected from the stockpiled, in-situ and stripped wellfield sites by<br />
first identifying areas that had been so managed. Replicate samples (ca. 1500 g) were<br />
then obtained at a depth <strong>of</strong> from 3 to 15 cm. Samples <strong>of</strong> native, relatively undisturbed<br />
soils were collected at regularly spaced intervals on a randomly placed transect in an<br />
undeveloped area directly adjacent to the wellfields. Native soils were sampled from the<br />
same depth as wellfield soils. All soil samples were placed in a cooler immediately after<br />
collection, returned to the laboratory and placed in cold storage within 12 hrs <strong>of</strong><br />
collection.<br />
Specific soil properties examined and compared in this study include: soil texture,<br />
pH, bulk density, electrical conductivity, water infiltration rate, extractable phosphate and<br />
nitrogen, total nitrogen, organic matter, microbial biomass carbon and mycorrhizal fungal<br />
spore numbers.<br />
Water infiltration rate measurements were conducted in the field at the time <strong>of</strong><br />
sampling (Bertrand, 1965). Intact soil cores were also collected in the field for soil<br />
moisture content and bulk density determinations using the methods <strong>of</strong> Klute (1986) and<br />
Blake and Hartge (1986), respectively. Microbial biomass carbon in soil samples was<br />
determined by chlor<strong>of</strong>orm fumigation and extraction with 0.5 M K2SO4 on 20 g sieved<br />
field moist soil samples (Tate et al., 1988; Horwath and Paul, 1994). Mycorrhizal fungal<br />
spore examinations were performed as described by Stahl and Christensen (1982). All<br />
other soil analyses were conducted by the University <strong>of</strong> Wyoming Soil Testing Lab.<br />
Soils data was analyzed using single factor analysis <strong>of</strong> variance (Systat, 1992) to test<br />
the hypothesis <strong>of</strong> main effects and post-hoc analysis t-tests (Systat, 1992) to compare<br />
mean values between treatments.<br />
RESULTS AND DISCUSSION<br />
All soils sampled at the Highland Uranium Project were very fine textured. At<br />
Wellfield C, soil from both the stockpiled and in-situ managed areas as well as the<br />
adjacent native area were classified as clays or silty clays. Stockpiled, in-situ and native<br />
soil from Wellfield F were all classified as silty clays. Soils from the Irigaray Ranch<br />
Uranium Mine were only slightly less fine textured than those at Highland Uranium<br />
Project. Soil from three <strong>of</strong> the four management types examined at Irigaray (in-situ,<br />
stripped and native) were silty clays whereas stockpiled soil was classified as a silty clay<br />
loam. Topsoil management practices compared in this study probably have little<br />
influence on soil textural characteristics. That is, stockpiling and wellfield activities will<br />
most likely not alter soil particle size. Soil texture, however, may have important<br />
implications as to how it is affected by management and disturbance. For example, fine<br />
textured soils, such as those at the two mines examined in this study, are known to be<br />
highly susceptible to compaction (Brady, 1990).<br />
Native, relatively undisturbed soil at the Highland Uranium Project had pH values<br />
just below neutral (Table 1). At Wellfield C, in-situ soil was found to have a pH value<br />
slightly higher but statistically similar to the native soil. Stockpiled soil from Wellfield C<br />
had a pH <strong>of</strong> over 7.7 and was determined to be statistically different than native and insitu<br />
soil. At Wellfield F, both in-situ and stockpiled soil had similar soil pH values which
were statistically higher than the nearby native soil. At the Irigaray Ranch Mine, native<br />
soil was found to have a pH value <strong>of</strong> close to 8. In-situ and stockpiled soil had ph values<br />
slightly lower than, but not statistically different from, the native soil. Stripped soil had a<br />
pH value statistically lower than all others.<br />
All soils examined in this study from the Highlands Uranium Project had high bulk<br />
density including the relatively undisturbed native soil (Table 1). At Wellfield C, native<br />
soil, in fact, had highest bulk density and was followed, in order, by in-situ soil and<br />
stockpiled soil. At Wellfield F, where all three soil bulk density values were quite close<br />
to one another, stockpiled soil was found to have the highest bulk density while native<br />
and in-situ soil had identical bulk density values. Bulk density <strong>of</strong> all soils from the<br />
Irigaray Ranch Mine were lower than those from the Highland Uranium Project. At this<br />
mine, native, relatively undisturbed soil had lowest bulk density. Of the three disturbed<br />
soils analyzed, in-situ had the lowest bulk density value followed by stripped and<br />
stockpiled, respectively. These data suggest that heavy vehicle traffic associated with<br />
wellfield activities does not cause enough soil compaction to affect soil bulk density. In<br />
fact, the soil with highest bulk density observed in this study was a native soil adjacent to<br />
Wellfield C. This native site was obviously grazed by cattle and may have been<br />
compacted to some extent by grazing. Data on soil bulk density collected in this study<br />
indicate that no long term compaction <strong>of</strong> topsoil resulted from mining activities on<br />
Wellfields C or F at the Highland Uranium Project or at the wellfield examined at the<br />
Irigaray Ranch Mine.<br />
Native soil directly adjacent to Wellfield C at the Highland Uranium Project had a<br />
mean organic matter content value <strong>of</strong> 2.25 percent (Fig. 1). In-situ soil from Wellfield C<br />
had a statistically similar value <strong>of</strong> 2.28 percent. Stockpiled soil from Wellfield C had<br />
slightly greater than half as much organic matter as either the native or in-situ soil with a<br />
mean value <strong>of</strong> 1.20 percent. The three differently managed soils from Wellfield F all had<br />
statistically different mean organic matter content values; native soil had the greatest,<br />
followed by in-situ soil and then by the stockpiled soil which had lowest organic matter<br />
content at less than 1 percent. Analysis <strong>of</strong> variance in the data from soils collected at the<br />
Irigaray Ranch Mine showed that stripped and stockpiled soils had organic matter<br />
contents significantly lower than nearby native soil. In-situ soil had a mean organic<br />
matter content value that was not significantly different than native soil (Fig. 1).<br />
Data from the 2 year old wellfield (Wellfield F) showing reduced levels <strong>of</strong> soil<br />
organic matter in both the in-situ and stockpiled soils suggests that the initial disturbance<br />
<strong>of</strong> wellfield activity under both management strategies (heavy vehicle traffic vs. removal<br />
and stockpiling) has negative effects on soil organic matter levels, although more<br />
pronounced under stockpiling. At the 7 year old site (Wellfield C), however, organic<br />
matter levels in the in-situ soil are statistically similar to native soil and organic matter<br />
remains low in the stockpiled soil suggesting that it is taking more time for organic matter<br />
levels to increase in stockpiled soil. The low levels <strong>of</strong> soil organic matter in both the insitu<br />
and stockpiled soils at the 2 year old wellfield may be due to the interuption <strong>of</strong> plant<br />
primary productivity and associated microbial secondary productivity by wellfield<br />
development activity. The more rapid increase in soil organic matter content in in-situ<br />
soil may be the result <strong>of</strong> more timely recovery <strong>of</strong> plant and microbial productivity on in-
situ soil. Data from the Irigaray Ranch Mine show that stripped soil and soil in stockpiles<br />
continue to have reduced levels <strong>of</strong> organic matter after 17 years.<br />
Measurements on soils from Wellfield C at the Highlands Uranium Project showed<br />
that all three soils had mean EC values between 0.26 and 0.41 decisiemens per meter<br />
(Table 1). Analysis <strong>of</strong> variance (ANOVA) indicated that these values were all<br />
statistically similar. At Wellfield F, stockpiled soil had a statistically higher mean EC<br />
value than either native or in-situ soils which were statistically similar. At the Irigaray<br />
Ranch Mine, stripped and stockpiled soils had significantly greater mean EC values than<br />
the native, relatively undisturbed soil. In-situ soil had a mean EC value that was not<br />
statistically different than native soil.<br />
Data from Wellfield F and the Irigaray Mine indicate that removal, storage and<br />
replacement <strong>of</strong> topsoil may result in an increase in soil electrical conductivity but<br />
stockpiled soil in Wellfield C did not have an elevated EC. Results from this study are<br />
inconclusive as to the influence <strong>of</strong> topsoil stockpiling on soil EC. In-situ management<br />
did not appear to affect soil EC.<br />
Measurements <strong>of</strong> infiltration rates on Wellfield C at the Highland Uranium Project<br />
demonstrated that all three soils had different rates <strong>of</strong> water intake (Fig. 2). Stockpiled<br />
soil had the greatest infiltration rate followed in decreasing order by in-situ soil and then<br />
finally native soil. At Wellfield F, measurements showed that the stockpiled and in-situ<br />
soils had very similar infiltration rates and were greater than that <strong>of</strong> the adjacent native<br />
soil. Comparing infiltration rates <strong>of</strong> Irigaray soils, native soil had the greatest rate <strong>of</strong><br />
water intake followed by in-situ soil and stripped soil, respectively.<br />
Infiltration rates generally correlated well with bulk density values, except at<br />
Wellfield F where bulk density <strong>of</strong> all three soils were similar. At both Wellfield C and<br />
the Irigaray Ranch Mine soils with highest bulk density had lowest infltration rates. Data<br />
collected in this study provides no evidence that mining activity negatively impacts water<br />
infiltration rate <strong>of</strong> in-situ soils. Results are inconclusive as to the influence <strong>of</strong> removal<br />
and stockpiling on infiltration rates.<br />
Analysis <strong>of</strong> variance in the data from soil samples collected at the Highlands Uranium<br />
Project indicated that there were no statistical differences in the amount <strong>of</strong> available<br />
phosphate in the three soils from Wellfield C or in the soils from Wellfield F (Table 1).<br />
All <strong>of</strong> the soils sampled at the Irigaray Ranch Mine, including the native soil, were found<br />
to contain low levels <strong>of</strong> available phosphate. Soils from the stripped an stockpiled<br />
treatments, however, were found to have undetectably low levels <strong>of</strong> available phosphate.<br />
The two different topsoil management practices employed at the Highland Uranium<br />
Project do not appear to be influencing available phosphate content. Stripped and<br />
stockpiled soils at the Irigaray Mine, however, do have significantly lower available<br />
phosphate contents than native and in-situ soils. The exact reason for this is not apparent.<br />
Soil samples from Wellfield C at the Highland Uranium Project indicated that<br />
stockpiled soil had similar levels <strong>of</strong> nitrate to the native soil (Table 1). In-situ soil had<br />
slightly, but significantly, higher nitrate levels. At Wellfield F, in-situ soil had similar<br />
nitrate levels to native soil while stockpiled soil had significantly greater amounts. All<br />
soils at the Irigaray Ranch Mine had similarly low amounts <strong>of</strong> nitrate. Results <strong>of</strong> nitrate<br />
analyses conducted on soils in this study are do not show any apparent trends and are<br />
difficult to interpret but show no obvious effects <strong>of</strong> management practices.
Analysis <strong>of</strong> the data from soils collected at the Highland Uranium Project shows that<br />
at Wellfield C in-situ soil had a total nitrogen content statistically similar to native soil<br />
adjacent to the wellfield while stockpiled soil had significantly lower total nitrogen<br />
contents (Table 1). Identical results were obtained from Wellfield F; native and in-situ<br />
soils had similar levels <strong>of</strong> total nitrogen while that in stockpiled soil was significantly<br />
lower. Results <strong>of</strong> total nitrogen analysis on soils from the Irigaray Ranch Mine resembled<br />
those from the Highland Uranium Project. Total nitrogen contents <strong>of</strong> in-situ soil were not<br />
statistically different than native soil while both the stripped and stockpiled soils had<br />
significantly lower total nitrogen.<br />
Because most <strong>of</strong> the nitrogen in surface soils is associated with organic matter, lower<br />
levels <strong>of</strong> total soil nitrogen in stockpiled soil at the Highland Uranium Project and<br />
stockpiled and stripped soils at the Irigaray Ranch Mine may be a result <strong>of</strong> the low levels<br />
<strong>of</strong> soil organic matter in these soils.<br />
Results <strong>of</strong> the soil analyses from the Highland Uranium Project indicate that at<br />
Wellfield C in-situ soils had similar numbers <strong>of</strong> mycorrhizal fungal spores to the adjacent<br />
native, relatively undisturbed site (Fig. 3). Stockpiled soil in Wellfield C had about one<br />
third as many spores as the native and in-situ soils. At Wellfield F, both the in-situ and<br />
stockpiled soils were found to have significantly lower spore numbers than the native<br />
soil. Examination <strong>of</strong> spore populations in soils from the Irigaray Ranch Mine that show<br />
that all <strong>of</strong> the managed soils (in-situ, stripped and stockpiled) had statistically lower<br />
numbers <strong>of</strong> mycorrhizal fungal spores than did native soil. Lowest spore numbers were<br />
found in stripped and stockpiled soils and were significantly lower than in in-situ soil.<br />
The observation that mycorrhizal spore numbers were similarly low in both the in-situ<br />
and stockpiled soils in the 2 year old wellfield (Wellfield F) suggests that the initial<br />
disturbance <strong>of</strong> wellfield activity may impact mycorrhizal spore numbers under both the<br />
management strategies (heavy vehicle traffic vs. removal and stockpiling) in a similar<br />
ways. At the 7 year old site (Wellfield C), however, spore numbers in the in-situ soil are<br />
statistically similar to native soil and spore numbers remain low in the stockpiled soil<br />
suggesting that it is taking more time for mycorrhizal fungal spore numbers to recover in<br />
stockpiled soil. The initial decline in spore numbers is probably due to damage to the<br />
vegetation, which provide the fungus with carbon and a source <strong>of</strong> energy. The more<br />
timely recovery <strong>of</strong> spore numbers in in-situ than in stockpiled soil may be due to more<br />
rapid recovery <strong>of</strong> vegetation on in-situ soil. Data from the Irigaray Ranch Mine show that<br />
stripped soil and soil in stockpiles will have to recover from very low spore levels.<br />
At the Highlands Uranium Project on Wellfield C, soil microbial biomass levels were<br />
statistically similar in the native and in-situ soils (Fig. 4). Stockpiled soil had<br />
significantly lower amounts <strong>of</strong> microbial biomass with about one third that found in the<br />
other two soils. Native soil adjacent to Wellfield F had highest levels <strong>of</strong> the three soils<br />
sampled at this site. Although the mean value for microbial biomass in in-situ soil was<br />
almost four times that in stockpiled soil, no statistically significant differences in these<br />
means were revealed by t-tests. Analysis <strong>of</strong> variance in the data from soils collected at<br />
the Irigaray Ranch Mine showed that stripped and stockpiled soils had similar microbial<br />
biomass contents which were significantly less than nearby native soil. In-situ soil from<br />
the Irigaray Ranch Mine had a mean microbial biomass content that was not statistically<br />
different from the native soil or the stripped and stockpiled soils.
The data on soil microbial biomass contents displayed the same type <strong>of</strong> trends<br />
observed in soil organic matter data and mycorrhizal fungal spore data. Again, the data<br />
indicate that initial wellfield activity <strong>of</strong> either heavy vehicle traffic on in-situ soil or<br />
removal and storage <strong>of</strong> stockpiled soil result in a similar decline in levels <strong>of</strong> microbial<br />
biomass. Microbial biomass levels recover much more rapidly, however, in in-situ soils,<br />
possibly due to the faster reestablishment <strong>of</strong> vegetation.<br />
References<br />
Ankeny, M. D., T. C. Kaspar, and R. Horton. 1990. Characterization <strong>of</strong> tillage and<br />
traffic effects on unconfined infiltration measurements. Soil Sci. Soc. Am. J. 54:837-<br />
840.<br />
Bertrand, A.R. 1965. Rate <strong>of</strong> water intake in the field. Pages 197-209 in C.A. Black,<br />
D.D. Evans, J.L. White, L.E. Ensminger, and F.E. Clark, editors. Methods <strong>of</strong> Soil<br />
Analysis, Part 1: Physical and Mineralogical Properties. Soil Science Society <strong>of</strong><br />
America, Madison, WI.<br />
Blake, G.R. and Hartge, K.H. 1986. Bulk density. Pages 363-375 in A. Klute, editor.<br />
Methods <strong>of</strong> Soil Analysis, Part 1: Physical and Mineralogical Methods. Soil Science<br />
Society <strong>of</strong> America, Madison, WI.<br />
Brady, N.C. 1990. The Nature and Properties <strong>of</strong> Soils. MacMillan, New York.<br />
Foster, R. C. 1988. Microenvironments and soil microorganisms. Biol. Fertil. Soils<br />
6:189-203.<br />
Heady, H.F. and Rader, L. 1958. Modifications <strong>of</strong> the point frame. J. Range Manage.<br />
11:96-99.<br />
Horwath, W.R. and Paul, E.A. 1994. Microbial Biomass. Pages 753-773 in Weaver,<br />
R.W., Angle, S., Bottomley, P., Bezdicek, D., Smith, S., Tabatabai, A., Wollum, A.,<br />
editors. Methods <strong>of</strong> Soil Analysis, Part 2: Microbiological and Biochemical<br />
Properties. Soil Science Society <strong>of</strong> America, Madison, WI.<br />
Huysman, F., W.M.I.S. Gunasekara, Y. Avnimelech, and W. Vestraete. 1989. Hydrogen<br />
consumption rate in a soil as an indicator <strong>of</strong> compaction and gas diffusion status.<br />
Biol. Fertil. Soils 8: 231-234.<br />
Kaiser, E.-A., G. Walenzik, and O. Heinemeyer. 1991. The influence <strong>of</strong> soil compaction<br />
on the decomposition <strong>of</strong> plant residues and on microbial biomass. Pages 207-216 in<br />
W.S. Wilson, editor. Advances in Soil Organic Matter Research: The Impact on<br />
Agriculture and the Environment. Royal Soc. Chem., Cambridge, U.K.<br />
Klute, A. 1986. Water retention: laboratory methods. Pages 635-662 in A. Klute, editor.<br />
Methods <strong>of</strong> Soil Analysis, Part 1: Physical and Mineralogical Methods. Soil Science<br />
Society <strong>of</strong> America, Madison, WI.<br />
Mueller-Dombois, D. and Ellenberg, H. 1974. Aims and methods <strong>of</strong> vegetation ecology.<br />
John Wiley & Sons, New York. 547 p.<br />
Plaster, E. J. 1997. Soil Science and Management. Delmar Publishers, Albany, N.Y.<br />
Pederson, T. A., A. S. Rogowski and R. Pennock. 1978. Comparison <strong>of</strong> morphological<br />
and chemical characteristics <strong>of</strong> some soils and minesoils. Recl. Rev. 1: 143-156.
Severson, R. C. and L. P. Gough. 1983. Rehabilitation materials from surface coal mines<br />
in the western U.S.A. I. Chemical characteristics <strong>of</strong> spoil and replaced cover soil.<br />
Recl. and Reveg. Res. 2: 83-102.<br />
Visser, S., J. Fujikawa, C. L. Griffiths and D. Parkinson. 1984. Effect <strong>of</strong> topsoil storage<br />
on microbial activity, primary production and decomposition potential. Plant and Soil<br />
82: 41-50.
2000 Billings Land Reclamation Symposium<br />
DESIGN AND IMPLEMENTATION OF A STEEP SLOPE REVEGETATION PROJECT<br />
Steven G. Renner 1<br />
ABSTRACT<br />
The State <strong>of</strong> Colorado, Division <strong>of</strong> Minerals and Geology is in the process <strong>of</strong> accomplishing<br />
reclamation <strong>of</strong> a previously permitted coal mining operation located in a high mountain basin.<br />
Five underground coal mine portal facility sites are situated in a rugged sub-alpine environment<br />
at an average elevation <strong>of</strong> 10,000 feet. Annual precipitation averages about thirty-one inches per<br />
year.<br />
The underground mines were developed in the 1950’s and 1960’s along the flanks <strong>of</strong> Huntsman<br />
Ridge in the coal bearing Mesaverde Group. Due to the extremely steep topography, backwalls<br />
to over one hundred feet in height were excavated into the steep slopes. The excavated material<br />
was downcast over the edge <strong>of</strong> the mine benches created during excavation <strong>of</strong> the backwalls.<br />
The downcast material formed an artificial colluvial cover over the underlying Mancos Shale<br />
slopes. The downcast material, or mine bench outslopes, approach angle <strong>of</strong> repose in some<br />
instances, and average about 1.25 Horizontal to 1 Vertical. The mine bench outslopes are very<br />
susceptible to erosion as a result <strong>of</strong> the slope gradient, slope length, high annual average<br />
precipitation and the physical characteristics <strong>of</strong> the overcast material. The Division <strong>of</strong> Minerals<br />
and Geology determined that attempting to control mine bench outslope erosion through<br />
revegetation processes was a desirable component <strong>of</strong> reclaiming this site.<br />
Due to the size, location and volume <strong>of</strong> the mine bench outslopes, it was determined that<br />
revegetation <strong>of</strong> the slopes in place was the only practical manner in which to attempt<br />
stabilization. A number <strong>of</strong> revegetation techniques were attempted in 1995 and 1996. At one<br />
location in 1996, a simple machine was developed and used to create small shelves on the<br />
outslopes for the purpose <strong>of</strong> providing a site for seed germination. Observation and sampling <strong>of</strong><br />
the revegetated areas in 1998 indicated that this technique, when evaluated in conjunction with<br />
the many logistical and environmental constraints <strong>of</strong> these sites, provided the best revegetation<br />
results.<br />
A large scale revegetation effort was undertaken during the 1999 construction season utilizing<br />
the techniques demonstrated in 1996. These efforts are being combined with constructed passive<br />
treatment systems in order to minimize sedimentation from the mine bench outslopes.<br />
1 Environmental Protection Specialist, Colorado Division <strong>of</strong> Minerals and Geology
BACKGROUND<br />
The State <strong>of</strong> Colorado, Division <strong>of</strong> Minerals and Geology (DMG) is in the process <strong>of</strong><br />
accomplishing reclamation <strong>of</strong> a previously permitted underground coal mining complex in Pitkin<br />
County, Colorado (Figure 1). The Coal Basin Mine complex is large and diverse, with great<br />
variations in elevation, exposure, soil types, slope and topography throughout the Basin.<br />
Reclamation <strong>of</strong> the Coal Basin Mine complex has been subdivided into numerous subcomponents<br />
or tasks. Generally, any one reclamation project addresses one <strong>of</strong> these subcomponents.<br />
One recently completed reclamation project involved an attempt to establish<br />
vegetation on the mine bench outslopes. The primary goal <strong>of</strong> the Mine Bench Outslope<br />
<strong>Revegetation</strong> Project was to minimize erosion at these areas, and thus to minimize the resultant<br />
delivery <strong>of</strong> sediment to nearby water resources.<br />
The original Coal Basin Mine began operations in the 1890’s. Coal was mined from near the<br />
headwaters <strong>of</strong> Coal Creek as a part <strong>of</strong> the coal mining and steel empire <strong>of</strong> John Osgood.<br />
Operations ceased in the early 1900’s. <strong>Mining</strong> resumed at Coal Basin in about 1953. Production<br />
continued until 1991. Metallurgical quality coal was produced from five separate underground<br />
mines located in the western portion <strong>of</strong> the Basin (Figure 1). The mine entries are located high in<br />
the Basin at elevations <strong>of</strong> about 10,000 feet.<br />
In the early 1980’s, a mining permit was issued to the operator <strong>of</strong> the facility under the terms <strong>of</strong><br />
the Colorado <strong>Surface</strong> Coal <strong>Mining</strong> and Reclamation Act. This permit outlined the operating<br />
parameters for the mine, and described the reclamation requirements for the site. Included in the<br />
permit was the requirement to revegetate such disturbances as the fill slopes located below the<br />
mine entries. These slopes had been created as a result <strong>of</strong> mine development in the 1950’s.<br />
<strong>Mining</strong> continued until 1991 when operations ceased. The operator <strong>of</strong> the facility tried to sell the<br />
operation for over a year, but ultimately these efforts proved to be unsuccessful. The mining<br />
permit was revoked and the reclamation bond forfeited by the State <strong>of</strong> Colorado. In 1992 the<br />
company filed for Chapter 11 bankruptcy protection. The State <strong>of</strong> Colorado, Mined Land<br />
Reclamation Board, was a secured creditor in the bankruptcy proceedings. The State eventually<br />
received three million dollars in cash and services to satisfy its claims in bankruptcy. The cash<br />
proceeds have been used to finance the on-going reclamation projects at the site.<br />
ENVIRONMENTAL SETTING<br />
The Coal Basin Mine is located within a topographic feature known as Coal Basin. Coal Basin is<br />
a large erosional feature situated on the flank <strong>of</strong> the Grand Hogback, just north <strong>of</strong> the West Elk<br />
Mountains. Coal Creek and Dutch Creek drain Coal Basin. These streams are confluent near the<br />
eastern margin <strong>of</strong> Coal Basin. Coal Creek is confluent with the Crystal River near Redstone,<br />
Colorado, four miles downstream from the mine site. The Crystal is confluent with the Roaring<br />
Fork River at Carbondale, Colorado, approximately eighteen miles downstream <strong>of</strong> Redstone.<br />
Coal Basin is located in a sub-alpine environment. Plant communities are predominately aspen at<br />
lower elevations and Engelmann spruce at the mine entry areas. Average annual precipitation<br />
within the Basin is thirty-one inches.
Coal Basin is characterized by unique geologic conditions. Cretaceous Mancos Shale, a deep<br />
marine grey to black silty shale, predominates within the Basin up to an elevation <strong>of</strong> about 9,800<br />
feet above mean sea level. The Mancos Shale forms steep slopes throughout the region. Slopes<br />
approaching 0.75H: 1V are not uncommon for Mancos Shale hill sides.<br />
Conformably overlying the Mancos Shale is the upper Cretaceous Mesaverde Formation. The<br />
Mesaverde is a thick sequence <strong>of</strong> interbedded sandstones, shales and minable coal units. The<br />
Mesaverde Formation is a steep cliff-forming unit, with sandstone members forming the vertical<br />
walls <strong>of</strong> Huntsman Ridge at the western margin <strong>of</strong> the Basin.<br />
Due in large part to the relatively high annual average precipitation and the great exposures <strong>of</strong> the<br />
erosive Mancos Shale and Mesaverde Formation, the Basin experiences a very high degree <strong>of</strong><br />
erosion annually. Because <strong>of</strong> the high natural erosion rates, Coal and Dutch Creeks transport<br />
large volumes <strong>of</strong> sediment annually. The mining permit application estimates that 15,225 tons <strong>of</strong><br />
sediment per year is generated due to naturally occurring processes within Coal Basin.<br />
MINE BENCH OUTSLOPES<br />
The five underground mines are generally located on the nose <strong>of</strong> easterly trending ridges, which<br />
descend from the north-to-south trending Huntsman Ridge. In order to develop the mines,<br />
highwalls were excavated in the ridges at each face up area. Excavation continued until a nearly<br />
vertical highwall was created. The highwalls vary in height from twenty feet (20’) to about one<br />
hundred feet (100’). In order to create the highwalls, large quantities <strong>of</strong> earth were excavated<br />
from the ridgelines. In conjunction with the highwall development, large flat benches were<br />
created. These benches served as the initial coal processing areas, supported <strong>of</strong>fices,<br />
warehouses, shops, and truck loading facilities and served as the mine staging areas. The<br />
excavated material was cast over the side <strong>of</strong> the ridges, down the steep slopes. This overcast<br />
material formed large fills <strong>of</strong> unconsolidated shale and sandstone debris. In some cases, trommel<br />
reject was added to the downslope area, creating layers <strong>of</strong> coarse coal, sandstone and shale<br />
materials within the upper twenty five percent <strong>of</strong> these long fill slopes.<br />
Commonly the outslopes are over 550 feet in length and reside at or near the angle <strong>of</strong> repose.<br />
The slopes are generally devoid <strong>of</strong> vegetation and are subject to significant erosion, as<br />
evidenced by the well developed gullies, which are common on each slope. Soil is essentially<br />
non-existent on the outslopes.<br />
The outslopes are predominately composed <strong>of</strong> dark, generally fine-grained sandstone and shale<br />
materials. The fine-grained, clay like surficial outslope material tends to form a surface crust on<br />
the slopes. Field measurements indicate that the slopes vary in size from between 2.1 and 7.8<br />
acres. Overall slope angles vary from between 72% and 80%. Vegetative cover on the<br />
unreclaimed slopes varies from zero to two percent. Table 1 summarizes the physical<br />
characteristics <strong>of</strong> each mine bench outslope.<br />
Observations indicate that the mine bench outslopes are significant areas <strong>of</strong> sediment<br />
generation. It is apparent that the timing <strong>of</strong> sediment delivery from the outslopes to the<br />
adjacent streams is coincident with spring snow melt and run<strong>of</strong>f from summer rain events.
Sediment loading within Coal Creek and Dutch Creek may be detrimental to macroinvertebrate<br />
species populations. A loss <strong>of</strong> macroinvertebrate species, in turn, could impact local fisheries.<br />
The reclamation challenge presented to Minerals and Geology was to minimize the delivery <strong>of</strong><br />
sediment to Coal and Dutch Creeks as a result <strong>of</strong> erosion on the mine bench outslopes. This goal<br />
is to be attained by the establishment <strong>of</strong> an effective, diverse and long lasting vegetative cover on<br />
the mine bench outslopes. The constraints <strong>of</strong> elevation, access and steepness <strong>of</strong> the mine bench<br />
outslopes, as well as the sheer volume <strong>of</strong> material contained on the slopes required that they be<br />
stabilized in place. Therefore, one or more methods <strong>of</strong> revegetating the mine bench outslopes<br />
had to be developed.<br />
REVEGETATION EFFORTS<br />
Development <strong>of</strong> a large scale steep slope revegetation project would be dependent upon<br />
experience gained from initial, small scale revegetation efforts at various locations in Coal<br />
Basin. An effort to revegetate the north and south facing slopes <strong>of</strong> Mine 3 was made in 1995.<br />
Observations indicated that seed would bounce <strong>of</strong>f the outslopes unless the surficial crusting<br />
was broken. To accomplish this, a steel I-Beam was suspended by cable from a light dozer.<br />
The dozer traversed the crest <strong>of</strong> the outslope, dragging the I-Beam across the surface <strong>of</strong> the<br />
slopes. The action <strong>of</strong> the I-Beam and cable on the slope served to greatly disrupt the surficial<br />
crusting, thus scarifying the outslope for a distance <strong>of</strong> approximately two hundred feet (200’)<br />
downslope. A Hydro-mulcher was used to seed, fertilize and mulch the scarified slopes.<br />
Immediately subsequent to this effort, an intense summer thunder shower developed, with<br />
torrential rains falling on the south facing outslope. <strong>Revegetation</strong> efforts were largely<br />
unsuccessful in this location, presumably because the seed was washed <strong>of</strong>f <strong>of</strong> the scarified slope<br />
during this event. Interestingly, the north facing slope did not experience the severity <strong>of</strong> the<br />
storm event. The treated portion <strong>of</strong> the north facing slope did not lose its seed, and was<br />
successfully revegetated. The loss <strong>of</strong> the seed from the south facing outslope highlighted the<br />
need to not only scarify the slope, but to provide for small slope breaks in order that seed can<br />
accumulate in various niches when, and if, it becomes mobile prior to germination.<br />
Following the experience at Mine 3, a small scale revegetation effort was undertaken at Mine 4.<br />
Shelves were constructed on the southeast facing slope <strong>of</strong> Mine 4 for the purpose <strong>of</strong><br />
accomplishing scarification <strong>of</strong> the clay-like surface while providing for seed holding capabilities<br />
and moisture retention. The shelves were constructed by placing six to eight feet (6’ – 8’) long<br />
aspen poles perpendicular to the slope, and securing them in place using rebar driven into the<br />
slope surface. The slope behind the aspen poles was dug out to create a dirt shelf about ten to<br />
twelve inches (10” – 12”) wide.<br />
The shelves were seeded, fertilized and mulched using three techniques: hand broadcast, hydroseed<br />
/ mulch and hand broadcast in conjunction with an application <strong>of</strong> a Bonded Fiber Matrix<br />
(BFM). The initial results were promising. The hand broadcast and hydro-seeded areas<br />
displayed a relatively consistent cover after one year <strong>of</strong> growth. The area treated with BFM<br />
exhibited a greater cover than either <strong>of</strong> the other two treatment areas.
A problem developed the summer following seeding, however. Snowmelt on the constructed<br />
shelves and from the inter-shelf areas tended to collect on the shelves. Due to the coarseness <strong>of</strong><br />
the dirt particles and due to the lack <strong>of</strong> soil cohesion, the accumulated water tended to cause the<br />
edges <strong>of</strong> the shelves to fail. Eventually, the shelf sides eroded toward the middle, resulting in<br />
loss <strong>of</strong> many <strong>of</strong> the shelves over the next two years. It was observed, however, that the intershelf<br />
areas in the BFM treated areas displayed an effective vegetative cover. However, the use<br />
<strong>of</strong> BFM and hydro mulch at locations other than Mine 4 was considered to be impractical due to<br />
access constraints, costs and the lack <strong>of</strong> readily available water.<br />
Cursory observations <strong>of</strong> the 1995 revegetation efforts were made in September 1996. These<br />
observations indicated that the most successful revegetation without the use <strong>of</strong> BFM was in those<br />
areas where the slope had been adequately scarified, providing sites for seed catchment.<br />
However, the impacts <strong>of</strong> erosion on the constructed shelves had to be over come.<br />
In order to address the observed benefits and obvious limitations <strong>of</strong> the shelves, smaller,<br />
entrenched shelves were designed for construction on a small portion <strong>of</strong> the Mine 1 outslope and<br />
on the steep fill slope <strong>of</strong> a nearby haul road.<br />
A four feet (4’) diameter drum roller was fitted with steel blades welded with a twelve inch (12”)<br />
spacing (horizontal and vertical) between plates. The plates, made <strong>of</strong> one half inch (1/2”) steel,<br />
are twelve inches (12”) in length and six inches (6”) in height, and are welded to the drum<br />
perpendicular to the curvature <strong>of</strong> the roller in an alternating pattern. The roller is designed with a<br />
tongue so that it can be pulled up and down the outslopes by a cable attached to a heavy dozer.<br />
After some experimentation on the outslope <strong>of</strong> Mine 1, it was apparent that the desired effect <strong>of</strong><br />
building numerous small shelves could be created by pulling the roller up and down the slopes.<br />
It should be noted that the roller performs differently than an imprinter in a very important way.<br />
While an imprinter creates a depression by compressing the ground surface into a depression, in<br />
which seed, fertilizer and moisture can accumulate, the modified roller gouges a shelf in the<br />
slope. This distinction is important in that the full weight <strong>of</strong> the approximately four ton roller is<br />
applied to two or three twelve inch (12”) by one half inch (1/2”) plates at any one time. This<br />
pressure forces the plates into the outslope material, and creates a gouge by digging material out<br />
<strong>of</strong> the slope as the roller moves up or down the outslope. It is felt that an imprinter, with a broad,<br />
blunt projection from the barrel <strong>of</strong> the roller, would not be as effective in preparing the slope.<br />
This is because the weight <strong>of</strong> the imprinter is distributed across a larger surface area, creating a<br />
basin, rather than producing the scooping effect <strong>of</strong> the modified roller blades. Further, due to the<br />
broader surface area <strong>of</strong> the imprinter, it tends to walk over areas that contain any significant<br />
amount <strong>of</strong> surficial or near-surface rock. The modified roller, because <strong>of</strong> the limited width <strong>of</strong> the<br />
blades, was observed to wedge between rock particles, continuing to create the desired surface<br />
modifications.<br />
Following initial tests with the roller, a larger scale demonstration was undertaken. The roller<br />
was applied to an approximately seventy five feet (75’) wide (across the slope crest) by one<br />
hundred twenty five feet (125’) long (down the slope) area <strong>of</strong> the Mine 1 outslope. Seed was<br />
hand broadcast at a rate <strong>of</strong> about fifteen to twenty pounds pure live seed per acre. Commercial<br />
fertilizer (18-24-0) was applied at a rate <strong>of</strong> three hundred (300) pounds per acre. Hay mulch was<br />
applied to the slopes at a rate <strong>of</strong> about two tons per acre. Slope scarification and seeding in this<br />
manner were also accomplished at this time on a steep, east facing fill slope located below Road<br />
D immediately north <strong>of</strong> Mine 1.
The use <strong>of</strong> mulch as a cover was intended to shade the seed from the sun on these dark colored<br />
slopes. The dark colored, generally south and southeast facing slopes get very hot at the Project<br />
area elevation. Therefore, the use <strong>of</strong> the mulch as a shade mechanism was thought to be<br />
beneficial to the germination potential <strong>of</strong> the seed.<br />
INITIAL REVEGETATION RESULTS<br />
Initial observations <strong>of</strong> the slope in 1997 were encouraging. Visually, vegetative cover at Mine 1<br />
was estimated to be about fifteen percent (15%) to twenty percent (20%). In 1998,<br />
representative transects were evaluated for cover and species composition. The results <strong>of</strong> this<br />
analysis are presented in Table 2, 1998 Vegetative Cover Estimates.<br />
The preliminary sampling results obtained after two growing seasons indicated that the technique<br />
<strong>of</strong> seeding many small shelves and shading the seed with straw mulch was reasonably successful<br />
at establishing an effective vegetative cover on the outslopes. Careful observation <strong>of</strong> the<br />
vegetated portions <strong>of</strong> Mine 1 outslope also clearly showed that soil particles tended to migrate<br />
down the slopes until they reached an establishing plant. When the migrating soil particles<br />
intercept an establishing plant, they collect on the uphill side <strong>of</strong> the plant. This action results in<br />
the formation <strong>of</strong> a deltaic build up <strong>of</strong> dirt on the upslope side <strong>of</strong> the plant. This pattern suggests<br />
that the outslope particles are mobile between plants, but tend to become immobile when they<br />
come into contact with a plant. It is postulated that these small flat areas <strong>of</strong> recently deposited<br />
dirt will provide sites for seed to accumulate and germinate as the establishing plants mature.<br />
During the early stages <strong>of</strong> developing a revegetation procedure for the mine bench outslopes, it<br />
was observed that a native grass species, purple reedgrass (Calamagrostis purpurascens) was<br />
growing on the outslopes and on adjacent, undisturbed steep slopes. Seed from the plant was<br />
harvested in the early fall <strong>of</strong> 1996 and 1997. The seed was cleaned by hand, and broadcast onto<br />
the scarified outslopes in conjunction with the commercial seed mixture used during the<br />
revegetation efforts at Mine 1 and Road D.<br />
An effort to establish a stand <strong>of</strong> Calamagrostis separate from the commercial species being used<br />
was undertaken near Mine 1 in 1996. Cleaned Calamagrostis seed was distributed at a north<br />
facing disturbed hillside. A portion <strong>of</strong> the area was covered by hay mulch, and a portion was not<br />
mulched. No germination was detected until the summer <strong>of</strong> 1998, when Calamagrostis<br />
seedlings were observed to be growing on the site. Visual estimations indicate a cover <strong>of</strong> zero to<br />
fifteen percent has been established. It is postulated that the disparity in germination success is<br />
related to variations in the percentages <strong>of</strong> coarse trommel reject material and finer grained,<br />
decomposing shales across this slope area.<br />
In an effort to promulgate a seed source for this material, DMG entered into a contract with the<br />
Upper Colorado Environmental Plant Center (UCEPC), located near Meeker, Colorado. UCEPC<br />
agreed to accept some <strong>of</strong> the Calamagrostis seed, to clean it, conduct germination tests and<br />
attempt to cultivate it on a limited scale. Germination tests had a positive result, with a 48% to<br />
50% <strong>of</strong> the seed tested germinating. Cultivation, however, proved to be difficult, with field<br />
plantings bearing few seedlings. Greenhouse germination was more successful. UCEPC
delivered to the DMG over one thousand seedlings suitable for transplanting in the summer <strong>of</strong><br />
1999.<br />
1999 OUTSLOPE REVEGETATION PROJECT<br />
Due to the success observed as a result <strong>of</strong> the demonstrations conducted at Mine 1 and at Road<br />
D, DMG decided to undertake revegetation <strong>of</strong> the remaining mine bench outslopes.<br />
DMG was interested in replicating the hill slope scarification and shelf construction,<br />
accomplished in 1996. However, it was recognized that, for the most part, the slopes which<br />
needed to be treated and seeded were much more remote, and provided much greater access<br />
challenges than the relatively accessible upper reaches <strong>of</strong> the Mine 1 outslope. Therefore, an<br />
invitation for bid was issued which did not specify the mechanisms <strong>of</strong> shelf construction to be<br />
employed. Rather, the invitation specified minimum dimensions <strong>of</strong> shelves, shelf spacing and<br />
the minimum number <strong>of</strong> shelves per acre to be established.<br />
The invitation specified that shelves would be no less than twelve inches (12”) in width and<br />
eight-inches (8”) deep. The spacing was to be three feet (3’) horizontally (perpendicular to the<br />
fall <strong>of</strong> the slope) and five feet (5’) vertically (parallel to the fall <strong>of</strong> the slope). However, field<br />
modifications to the contract specifications decreased the shelf size to ten inches (10”) in width,<br />
and decreased the spacing interval to three feet (3’) horizontally and three feet (3’) feet<br />
vertically. This change resulted in a net increase in the number <strong>of</strong> shelves from 2,184 per acre to<br />
3,588 per acre. Construction <strong>of</strong> the shelves to this specification would result in the creation <strong>of</strong><br />
approximately 1,596 square feet <strong>of</strong> flat surface per acre on the steep mine bench outslopes.<br />
Because the goal <strong>of</strong> the revegetation effort is to minimize sediment delivery to adjacent streams<br />
through stabilization <strong>of</strong> the slopes, the invitation for bid provided for planting shrubs at the base<br />
<strong>of</strong> the slopes to act as natural sediment barriers as the shrubs mature. The invitation also<br />
specified the planting <strong>of</strong> seedling trees at the crests <strong>of</strong> the outslopes. It is postulated that the<br />
establishment <strong>of</strong> trees along the crests will help to slow the melting <strong>of</strong> avalanches that<br />
accumulate at the crests, and to disperse the outflow from the avalanches as they melt in the<br />
spring.<br />
Due to litigation associated with Coal Basin reclamation that was pending during the summer <strong>of</strong><br />
1998, the Project was delayed until 1999. In the interim, DMG applied for, and eventually<br />
received, a non-point source grant (Clean Water Act, Section 319) through the Colorado<br />
Department <strong>of</strong> Public Health and Environment. The grant provided DMG with the unique<br />
opportunity to enhance the scope <strong>of</strong> the Project by providing the financial ability to contract for<br />
the increased density <strong>of</strong> shelves on the slope, to purchase and apply a slow release fertilizer, and<br />
to increase the number and variety <strong>of</strong> shrubs to be planted at the base <strong>of</strong> the outslopes.<br />
The goals <strong>of</strong> the non-point source grant are to:<br />
- Stabilize the mine bench outslopes through revegetation processes;<br />
- Control sediment migration through the establishment <strong>of</strong> vegetative barriers;<br />
- Control sediment migration through the use <strong>of</strong> constructed wetlands or other barriers as site<br />
conditions allow;<br />
- Monitor slope erosion by establishing gully monitoring points at each outslope;
- Monitor sediment loads in Coal Creek, Dutch Creek and their tributaries;<br />
- Provide opportunities for public involvement in revegetation efforts.<br />
To accomplish these goals, numerous tasks were undertaken in 1999 as part <strong>of</strong> the mine bench<br />
outslope revegetation project. Tasks included measuring the degree <strong>of</strong> current sedimentation,<br />
accomplishing seeding <strong>of</strong> the outslopes, planting <strong>of</strong> containerized shrubs, construction <strong>of</strong><br />
sediment traps and other sediment barriers at appropriate locations, and establishment <strong>of</strong> a<br />
stream monitoring network. Public involvement will be solicited in 2000 to help plant shrubs<br />
and increase the number <strong>of</strong> vegetative sediment barriers.<br />
In early September 1999, Dirt-N-Iron, the Project contractor, began work as crews were brought<br />
onto the site. Using Macleod Fire Rake / Hoe, the shelves were dug into the slopes. The<br />
Macleod Fire Rake / Hoe is a rake-like tool that is composed <strong>of</strong> a steel plate fastened<br />
perpendicularly to the base <strong>of</strong> a four and a half-foot (4.5’) wood handle. One side <strong>of</strong> the steel<br />
plate is a sharpened flat blade, measuring about ten inches (10”) across. The opposite end is a<br />
four pronged rake, also measuring about ten inches (10”) across the outside <strong>of</strong> the rake.<br />
The crew members worked ten to fifteen feet (10’ to 15’) distant from each other, spread<br />
horizontally across the slope. The crew worked from the top to the bottom <strong>of</strong> each slope. It is<br />
estimated that perhaps twenty five percent (25%) more shelves than was specified were actually<br />
created, yielding approximately 4,448 shelves per acre, representing up to 1,958 square feet <strong>of</strong><br />
flat area per acre <strong>of</strong> mine bench outslope.<br />
While the hand crew was creating the shelves, a second crew was collecting and cleaning<br />
Calamagrostis seed. In addition, seed from a locally occurring aster (tentatively identified as<br />
Aster glaucodes) was collected and cleaned.<br />
Seeding was accomplished as the crew worked down the slopes. The commercially obtained<br />
seed (Table 3) was distributed with a hand held seeding machine. The seed from the two native<br />
species, including the Calamagrostis chaff, was distributed on the slope by hand broadcast<br />
methods.<br />
Biosol 7-2-3, a slow release fertilizer, was applied by helicopter at a rate <strong>of</strong> 1,800 pounds per<br />
acre. Certified weed free straw mulch was applied at a rate <strong>of</strong> 2,000 pounds per acre. At four <strong>of</strong><br />
the five outslopes, the mulch was also applied by helicopter.<br />
Approximately twenty-four (24) acres <strong>of</strong> steep mine bench outslopes were scarified, seeded<br />
fertilized and mulched during performance <strong>of</strong> this Project. Due to the steepness <strong>of</strong> the slopes and<br />
because <strong>of</strong> the density and depth <strong>of</strong> the gullies present on the slopes, a precise measurement <strong>of</strong><br />
the acreage involved is extremely difficult. Acreage estimations were made using aerial photos,<br />
topographic maps, real-time Global Positioning System (GPS) mapping and through the use <strong>of</strong> a<br />
range finder.<br />
Using the Calamagrostis seedlings provided by the UCEPC, approximately two hundred (200)<br />
tublings were planted across each <strong>of</strong> the five mine bench outslopes at mid-slope. The mid-slope<br />
area was chosen for planting, as it is anticipated that seed produced from the plants will have an<br />
equal chance <strong>of</strong> being distributed either up- or down-slope by winds.
A variety <strong>of</strong> containerized shrubs (Table 4) were planted at the base <strong>of</strong> each slope.<br />
Approximately 540 shrubs were planted at the base <strong>of</strong> each slope. The purpose <strong>of</strong> this planting<br />
was to begin the establishment <strong>of</strong> vegetative sediment barriers. This planting effort will be<br />
followed up in 2000 by planting large volumes <strong>of</strong> willow cuttings at the base <strong>of</strong> some <strong>of</strong> the mine<br />
bench outslopes. The 2000 planting will establish a shrub layering affect in the target areas. It is<br />
anticipated that this follow-up planting will largely be accomplished with the help and assistance<br />
<strong>of</strong> volunteers.<br />
In order to help control sediment at the base <strong>of</strong> three <strong>of</strong> the slopes which were relatively<br />
accessible, sediment traps were constructed. In one instance, this required the excavation <strong>of</strong><br />
existing, but non-functional, sediment traps. These broad shallow traps were excavated so that<br />
run<strong>of</strong>f from a portion <strong>of</strong> Mines 1 and 2, as well as runout from a large avalanche, would pass<br />
through this sequence <strong>of</strong> three traps, allowing water to stand for a short period <strong>of</strong> time,<br />
permitting sediment to drop out <strong>of</strong> suspension. Locally obtained willow cuttings were planted<br />
around the perimeter <strong>of</strong> these sediment traps in order to further slow water as it exits the traps.<br />
In some areas, adequate room to construct sediment traps does not exist. At one such location,<br />
logs and timber were placed into semi-concentric arrangements along the length <strong>of</strong> the slope<br />
base. This approach is a short term sediment control measure, due primarily to the limited<br />
detention time afforded by the logs and timber. Intensive shrub planting will occur at this<br />
location in 2000 to provide for a greater degree <strong>of</strong> sediment control.<br />
Measurement <strong>of</strong> the project success will be accomplished not only in terms <strong>of</strong> vegetative cover,<br />
but also in terms <strong>of</strong> erosion control and sediment retention. In order to help assess sediment<br />
retention, staff gauges were placed within each sediment trap in order to measure sediment<br />
accumulation over time.<br />
In an effort to indirectly measure the relative success <strong>of</strong> the revegetation effort as it relates to<br />
erosion and sediment delivery from the outslopes to the adjacent water resources, gully<br />
monitoring points were established within representative gullies on each <strong>of</strong> the treated slopes.<br />
Parameters such as gully width, depth, steepness, soil characteristics and relative percent<br />
vegetative cover within each gully contributing area were recorded.<br />
A stream monitoring network has been established on Coal and Dutch Creeks. Parameters<br />
monitored include discharge and suspended solids. This network is designed to isolate the mine<br />
bench outslope contributions from naturally occurring sediment so that an analysis <strong>of</strong> the relative<br />
success <strong>of</strong> the mine bench outslope revegetation effort can be made as vegetation matures.<br />
SUMMARY<br />
DMG has applied vegetative stabilization treatments to the long, erosive outslopes located below<br />
the mine entry benches at Coal Basin. Various revegetation techniques were evaluated following<br />
test plot establishment in 1995 and 1996. The test plots represent an effort to find reasonable,<br />
economic methods that demonstrate an acceptable degree <strong>of</strong> success. Selected technologies with<br />
the highest potential for success were implemented on a large scale in 1999.
<strong>Revegetation</strong> <strong>of</strong> steep features such as the mine bench outslopes in a difficult environment is<br />
challenging at best. Initial efforts appear to be successful in the short term. It is anticipated that,<br />
baring unforeseen environmental circumstances, the large scale revegetation effort undertaken in<br />
1999 should be equally successful to that <strong>of</strong> earlier efforts. It is thought that success <strong>of</strong> the 1999<br />
revegetation and sediment retention project will be measured by a reduction in sediment<br />
production from the mine bench outslopes. Monitoring <strong>of</strong> the outslopes and receiving streams<br />
will help to determine the degree <strong>of</strong> success over time.<br />
TABLE 1. OUTSLOPE MEASUREMENTS<br />
Mine 1 Mine 1 West Mine 3 North Mine 3 South Mine 5 Fan<br />
Slope Angle 72 % 75 - 80 % 70 % 83% 72 %<br />
Vegetative<br />
Cover * 1 % 0 –2 % 0 – 1 % 0 % - 1 % 0 %<br />
Slope Length<br />
(Ft.) 670 800 415 400 550<br />
Fill Depth<br />
(Ft.) * 4 - 20 10 - 15 10 - 20 7 - 15 12 - 15<br />
Slope Size<br />
(Ac.) 2.2 7.8 2.2 3.7 2.4<br />
Particle Size 90 % < 1” 90% < 1” 80 % < 1” 50 % < 1” 50 % < 1”<br />
Cohesion<br />
Estimate Poor Poor to Fair Poor Fair Poor to Fair<br />
• * Estimated<br />
TABLE 2. 1998 VEGETATIVE COVER ESTIMATES<br />
Mine 4 Outslope<br />
1<br />
1 Seeded September, 1995<br />
2 Seeded September, 1996<br />
Mine 1 Outslope<br />
2<br />
Mine 3 North<br />
1<br />
Outslope<br />
Road D Outslope<br />
2<br />
Vegetative<br />
Cover (%) 20 - 25 25 25 20 – 25<br />
Agropyron Agropyron Agropyron Bromus inermis,<br />
trachycaulum, trachycaulum, trachycaulum, Agropyron<br />
Bromus inermis, Bromus inermis, Festuca ovina, trachycaulum,<br />
Predominate Phleum pratense, Festuca ovina, Dactylis Phleum pratense,<br />
Species Agropyron Poa pratensis, glomerata, Festuca ovina,<br />
intermedium, Achillea Deschampsia Achillea<br />
Festuca ovina, millifolium, caespitosa, millifolium,<br />
Dactylis glomerata, Penstemon Penstemon Penstemon<br />
Agropyron smithii, strictus, Linum strictus, Poa strictus, Linum<br />
Poa pratensis, lewisii,<br />
pratensis lewisii,<br />
Achillea<br />
millifolium,<br />
Penstemon<br />
strictus<br />
Astragalus cicer<br />
Astragalus cicer
TABLE 3. OUTSLOPE SEED MIXTURE<br />
SPECIES<br />
SCIENTIFIC<br />
NAME VARIETY<br />
LBS/Acre<br />
PLS<br />
Kentucky Bluegrass Poa pratensis Banff 0.25<br />
Slender<br />
Wheatgrass<br />
Agropyron<br />
trachycaulum Primar 4.00<br />
Mountain Brome Bromus arginatus Bromar 4.00<br />
Sheep Fescue Festuca ovina Covar 1.50<br />
Timothy Phleum pratense Climax 0.25<br />
Orchardgrass Dactylis glomerata Latar 0.50<br />
Smooth Brome Bromus inermis Manchar 1.00<br />
White Dutch Clover Trifolium repens Ladino 0.50<br />
Cicer Milkvetch<br />
Astragalus cicer Monarch 1.00<br />
Blue Flax Linum lewisii Appar 1.00<br />
Yarrow Achillea<br />
Rocky Mountain<br />
Penstemon<br />
Penstemon<br />
millifolium<br />
strictus<br />
VNS 0.10<br />
Bandera 0.50<br />
TABLE 4. SHRUBS PLANTED AT THE BASE OF THE MINE BENCH OUTSLOPES<br />
Serviceberry (Amelanchier alnifolia)<br />
Mountain Big Sagebrush (Artemisia tridentata vaseyana)<br />
Mountain Mahogany (Cercocarpus montanus)<br />
Shrubby Cinquefoil (Potetilla fruticosa)<br />
Chokecherry (Prunus virginiana)<br />
Wax Currant (Ribes inerme)<br />
Woods Rose (Rosa woodsii)<br />
Mountain Snowberry (Symphoricarpos oreophilas)
2000 Billings Land Reclamation Symposium<br />
EFFECT OF SLOPE GRADIENT AND PLANT GROWTH ON SOIL LOSS<br />
ON RECONSTRUCTED HIGH ALTITUDE SLOPES<br />
N.M. Kapolka 1 and D.J. Dollhopf 2<br />
ABSTRACT<br />
The objectives <strong>of</strong> this study were to 1) evaluate effect <strong>of</strong> slope gradient and plant<br />
growth on soil loss on high altitude (2590 meters) sites, 2) evaluate effect <strong>of</strong> coversoil<br />
thickness on plant growth, and 3) determine if the Revised Universal Soil Loss Equation<br />
(RUSLE) version 1.06 computer model could predict the quantity <strong>of</strong> soil loss in a high<br />
altitude steep slope environment.<br />
Four slopes each with a different gradient (25%, 33%, 40%, and 50%) were<br />
constructed and each slope was divided into four plots with different coversoil thicknesses<br />
(0 cm, 15 cm, 30 cm, and 45 cm). These sixteen plots received an identical seed mixture and<br />
fertilizer application.<br />
Soil loss increased with slope gradients up to 40% and then decreased as slope<br />
gradient increased to 50%. First year mean soil loss was 16.38 Mg/ha and decreased to 1.01<br />
Mg/ha during the second season. Soil loss rates the second year approached those on<br />
undisturbed lands. Plots without coversoil had the lowest soil loss which was attributed to<br />
high rock cover on the soil surface. Plots with coversoil had more plant growth than plots<br />
without coversoil. There was a significant correlation during the first and second years<br />
(r = 0.65 and 0.70, respectively) between coversoil thickness and plant production. Increased<br />
plant production on plots with thicker coversoil, however, did not reduce soil loss.<br />
The RUSLE computer model underestimated soil loss by 15 +/- 17 Mg/ha during the<br />
first year following slope construction. During the second year, predicted soil loss was, on<br />
average, 0.4 +/- 0.6 Mg/ha lower than measured soil loss rates. Results from this study<br />
indicated that RUSLE v. 1.06 is an effective long-term planning tool to use on steep slopes at<br />
high altitudes.<br />
1 Montana State University, Bozeman, MT 59717-0290<br />
2 Reclamation Research Unit, Montana State University, Bozeman, MT 59717-0290
INTRODUCTION<br />
Hard rock mines in the Western United States <strong>of</strong>ten have to reclaim steep slopes.<br />
One <strong>of</strong> the most important concerns with respect to steep slope reclamation is soil erosion.<br />
Soil loss can have a negative effect on plant establishment and is a potential source <strong>of</strong> down<br />
gradient watershed degradation. One <strong>of</strong> the primary challenges when reclaiming these slopes<br />
is to control soil loss. To reconstruct slopes in an environmentally sound and cost effective<br />
manner, mining companies need to maximize slope gradient, have adequate coversoil to<br />
support vegetation, and minimize soil erosion rates.<br />
Sediment yields tend to increase roughly linearly with slope gradient (Hahn, 1985;<br />
Hartley and Schuman, 1984; Liu et al., 1994; McIssac, 1987; Schroeder, 1987). The ease<br />
with which soil particles are detached appears to increase with slope gradient. Rainsplash,<br />
which provides most <strong>of</strong> the energy for detachment <strong>of</strong> soil particles, is more active on steeper<br />
slopes (Mathier et al., 1989). The influence <strong>of</strong> gravity increases with gradient and may cause<br />
aggregates to break loose more easily (Grosh, 1994). There is evidence, however, that<br />
suggests as slope gradients become more steep than 35 - 40%, soil loss may stabilize or<br />
decrease (Bradford and Foster, 1996; Singer & Blackard, 1982). On very steep slopes, direct<br />
raindrop impact on a given area <strong>of</strong> soil surface is reduced, thereby reducing the likelihood <strong>of</strong><br />
detachment <strong>of</strong> soil particles (Bradford and Foster, 1996; Singer & Blackard, 1982).<br />
Rill erosion increases on steep slopes (Hahn, 1985; Hartley & Schuman, 1984;<br />
McCool, 1987). Once a slope exceeds a critical steepness, rill erosion causes sediment yields<br />
to increase rapidly with slope gradient (McCool et al., 1987). McCool et al (1987) found that<br />
rills usually formed on slopes with gradients steeper than 30%. Hahn (1985) showed a linear<br />
relationship between length <strong>of</strong> rills and slope gradient and stated that it was likely that soil<br />
loss and rill formation are related to and are dependent on slope steepness.<br />
There is an inverse relationship between soil loss and rock cover (Ashby et al., 1984;<br />
McIssac, 1987; Sidle and Brown, 1993; Simanton et al., 1984). High rock content increases<br />
infiltration rates and surface roughness decreasing run<strong>of</strong>f and soil loss. In addition, the<br />
higher the rock content, the less soil available for soil loss (Ashby et al., 1984; Sidle and<br />
Brown, 1993). As erosion occurs on rocky soils, rock cover increases as the coarse<br />
fragments below the surface are exposed. This armoring <strong>of</strong> the soil can further help to<br />
reduce soil erosion (Box and Meyer, 1984).<br />
Investigators have found soil erosion decreases as plant growth increased (Hartley &<br />
Schuman, 1984; Kirkby, 1980). Vegetation intercepts precipitation and reduces the energy<br />
<strong>of</strong> the raindrops thereby decreasing soil detachment. Vegetation also increases the<br />
infiltration capacity <strong>of</strong> the soil which decreases run<strong>of</strong>f and increases soil roughness which<br />
reduces run<strong>of</strong>f velocity and encourages deposition <strong>of</strong> soil particles. Soil structual stability is<br />
also increased due to an increase in soil organic matter.<br />
Investigators have reported that plant growth increases significantly with increased<br />
coversoil depths up to about 50 cm (Barth & Martin, 1982; McGinnies and Nicholas, 1980;<br />
Power et al., 1981; Redente & Hargis, 1985). Redente et al. (1997) studied the long-term<br />
effects <strong>of</strong> coversoil thickness on plant growth. While results from this study show that plant<br />
growth increases with increased coversoil depth it also suggests that shallow coversoil depths<br />
can support productive plant communities. Redente et al. suggested that 15 cm <strong>of</strong> coversoil<br />
over non-toxic spoil is sufficient for the establishment and continued productivity <strong>of</strong><br />
rangeland vegetation.
The Revised Universal Soil Loss Equation (RUSLE) Version 1.06 on Mined Lands,<br />
Construction Sites, and Reclaimed Lands is a computer model developed by the <strong>Office</strong> <strong>of</strong><br />
<strong>Surface</strong> <strong>Mining</strong> and Reclamation in Denver, Colorado (Galetovic, 1998). This model was<br />
designed to estimate the long-term soil erosion rates based on site-specific environmental<br />
conditions for disturbed lands.<br />
Research was conducted at the Treasure Mine to (i) evaluate the effect <strong>of</strong> slope<br />
gradient and plant growth on soil loss; (ii) evaluate the effect <strong>of</strong> coversoil thickness <strong>of</strong> plant<br />
growth; and (iii) determine if the Revised Universal Soil Loss Equation (RUSLE) version<br />
1.06 can predict soil loss in a high altitude steep slope environment.<br />
METHODOLOGY<br />
Research was conducted at the Barretts Minerals Inc, Treasure Mine, an open-pit talc<br />
mine, located about 15 miles east northeast <strong>of</strong> Dillon, Montana. Elevation is approximately<br />
2590 meters and average annual precipitation is 26 cm. The mine has a snowpack for about<br />
half <strong>of</strong> the year.<br />
The experimental design consisted <strong>of</strong> four slopes, each with a different slope<br />
gradient: 25%, 33%, 40%, and 50%. Each slope was divided into four plots, each with a<br />
different coversoil depth: 0 centimeters, 15 centimeters, 30 centimeters, and 45 centimeters<br />
<strong>of</strong> coversoil. In total, there were sixteen plots, each measuring 3.1 x 30.5 meters. At the base<br />
<strong>of</strong> each plot was a trough designed to capture run<strong>of</strong>f and sediment.<br />
Coversoil and subsoil were analyzed for organic matter percentage using the Walkey<br />
Black method. Electrical conductivity, pH, Na, Ca, and Mg levels were determined using a<br />
saturated paste extract. Coarse fragment percentage was determined by seiving the 2 mm<br />
fraction and then volumetrically analyzing the coarse fragments. Soil texture was determined<br />
using the hydrometer method.<br />
All plots were broadcast seeded by hand with an identical seed mixture in November<br />
1997. Triticum aestivum and Hordeum vulgare were planted as cover crops for the first<br />
season. Cover crops grow quickly and provide short-term protection against erosion before<br />
perennial vegetation is established.<br />
Precipitation was measured using a rain gauge, and a solar powered datalogger<br />
recorded precipitation data on an hourly basis. Sediment accumulated in collection troughs<br />
and was measured every two weeks in the late spring and summer months. Sediment was<br />
removed from the troughs, dried at 41�C, weighed, and calculated on a Mg/ha basis. Rills<br />
that formed on the plots were described quantitatively using the Erosion Condition<br />
Classification System Montana Revised Method (Clark, 1980). This method classifies rills<br />
based on depth and frequency <strong>of</strong> rills. Plant canopy cover, basal cover, rock cover, and<br />
aboveground production were estimated using 10 systematically placed quadrants on a<br />
transect on each plot during 1998 and 1999. These variables were analyzed by lifeform (i.e.<br />
grass, forb). Canopy cover, basal cover, and rock cover were estimated visually and on a<br />
percent cover basis. Production was measured by clipping vegetation 2 cm above the<br />
ground, oven-drying at 21�C to a constant weight, and then weighing.<br />
RUSLE version 1.06 was used to calculate predicted soil loss rates. Various input<br />
variables were required for each factor in the RUSLE model. Input values were obtained<br />
from field data, from Renard et al. (1987), or from the United States Department <strong>of</strong><br />
Agriculture Natural Resource Conservation Service State Agronomist (Fasching, 1999).
RESULTS AND DISCUSSION<br />
Coversoil and subsoil material had a sandy loam texture. Coarse fragment percentage<br />
by volume was 33% for the coversoil and 52% for the subsoil. EC, pH, Na, Ca, and Mg<br />
levels were all considered suitable by current reclamation standards (Munshower, 1994).<br />
Soil loss rates decreased from the first year to the second year <strong>of</strong> the study (Figure 1).<br />
Normal soil loss rates for undisturbed lands are about 0.2 – 0.5 Mg/ha (Mg/ha = 0.45<br />
tons/acre) (Brady and Weil, 1996). Soil erosion rates for the first year (mean = 16.38 Mg/ha)<br />
were much greater than these normal rates. Soil loss decreased dramatically during the<br />
second year (mean = 1.01 Mg/ha). After just one year soil loss rates loss rates on these<br />
reconstructed slopes were similar to undisturbed slopes. This decrease in soil loss may be<br />
attributed to increased vegetative cover the second year. Plots had no vegetation for the first<br />
two months <strong>of</strong> data collection the first year. During this time precipitation was high and very<br />
high soil loss occurred. During the second year vegetative litter increased from 0% to 12%<br />
and perennial grasses and forbs continued to develop on all plots providing additional cover<br />
and slope stability.<br />
In 1998 precipitation was about average but precipitation was below average<br />
(-6.46 cm) in 1999. Greater total precipitation in 1998 may have increased soil loss<br />
compared to 1999; however, it was more likely that the intensity <strong>of</strong> the precipitation events<br />
had a greater effect on soil loss. Soil loss is dominated by high-intensity storms (Larson,<br />
1997; McCool, 1984). Both years had seven storms when greater than 2.5 cm <strong>of</strong><br />
precipitation fell in one hour, but in 1998 several <strong>of</strong> these storms occurred when the soil was<br />
bare <strong>of</strong> vegetation. High intensity storms that occurred while soil was bare may have been<br />
responsible for the high soil loss rates in 1998.<br />
As slope gradient increased from 25% to 40% soil loss increased; however as slope<br />
gradient increased to 50% soil loss decreased (Table 1). Both years the 40% slope had the<br />
highest soil erosion rate and the 50% slope had less soil loss than the 40% slope (Figure 1).<br />
This nonlinear relationship between soil loss and slope gradients has been reported by<br />
other investigators (Bradford and Foster, 1996; Singer and Blackard, 1982). Rainsplash<br />
provides the energy for detaching soil particles that are then transported downslope. As<br />
slope gradient increases rainsplash becomes more active increasing soil loss (Mathier et al.,<br />
1989), but as slope gradients become very steep (approximately 35 – 40%) there is less direct<br />
rainsplash impact on the surface, thereby reducing detachment <strong>of</strong> soil particles and<br />
decreasing soil loss (Bradford and Foster, 1996; Singer and Blackard, 1982).<br />
Rill severity increased with slope gradients up to 40%. Rills were more severe on the<br />
40% slope than the 50% slope, reflecting the fact that the 40% slope yielded the greatest soil<br />
loss. Rills did not form on the plots without coversoil due to high rock cover (86%). On<br />
plots with coversoil rill severity was least on plots with 15 cm <strong>of</strong> coversoil and was greatest<br />
on plots with 30 cm <strong>of</strong> coversoil. These plots with 30 cm <strong>of</strong> coversoil also had the highest<br />
soil loss rates (Figure 1).<br />
When sediment was collected from troughs it was <strong>of</strong>ten concentrated directly below<br />
rills present on these plots. Soil loss was correlated significantly with rill formation in 1998<br />
(r = 0.88) and in 1999 (r = 0.65) at this site. In 1998 large quantities <strong>of</strong> soil were eroded as<br />
the rills formed, but in 1999 the rills acted mainly as conduits for sediment transport. Data in<br />
this study suggest that soil loss and rill formation are related to one another and depend on<br />
slope gradient.<br />
Plots without coversoil had a mean <strong>of</strong> 86% rock cover whereas plots with coversoil<br />
had a mean <strong>of</strong> 39% rock cover. Plots with high rock cover had less soil loss and less severe
Figure 1. Comparison <strong>of</strong> total annual soil loss from all test plots in 1998 and 1999.<br />
Total Annual Soil Loss (Mg/ha)<br />
70<br />
60<br />
50<br />
40<br />
30<br />
20<br />
10<br />
0<br />
0 15 30 45 0 15 30 45 0 15 30 45 0 15 30 45<br />
_______________________ ____________________ _____________________ ________________________<br />
25% 33% 40% 50%<br />
Plot Treatment (coversoil thickness (cm) / slope gradient)<br />
Table 1. Effect <strong>of</strong> slope gradient on total annual soil loss (Mg/ha).<br />
Slope Gradient<br />
Year 25% 33% 40% 50%<br />
1998 6.32 46.16 128.08 81.56<br />
1999 3.08 4.48 5.64 2.92<br />
rills. There was a significant negative correlation between soil loss and rock cover during the<br />
first (r = -0.66) and the second (r = -0.61) year. Plots without coversoil had very little soil<br />
loss (Figure 1). Although general principles <strong>of</strong> soil reconstruction recommend that coarse<br />
fragment percentage by volume be less than 20%, on high elevation steep slopes it is<br />
appropriate to exceed this criterion to reduce soil loss rates.<br />
In general, plant canopy cover, basal cover, and production increased with increased<br />
coversoil thickness (Table 2). During the first year there was a significant correlation<br />
between coversoil thickness and canopy cover (r = 0.58) and basal cover (r = 0.48). During<br />
the second year correlations between coversoil thickness and canopy cover (r = 0.49) and<br />
basal cover (r = 0.36) were not as strong, and only the correlation for canopy cover and<br />
coversoil thickness was significant. Production and coversoil thickness were significantly<br />
correlated in 1998 (r = 0.65) and in 1999 (r = 0.70). Results from this study indicated that<br />
1998<br />
1999
Table 2. Effect <strong>of</strong> coversoil thickness on mean* plant growth characteristics.<br />
Plant Coversoil Thickness<br />
Characteristic 0 cm 15 cm 30 cm 45cm<br />
1998<br />
Canopy cover (%) 30.0 47.3 45.5 47.3<br />
Basal cover (%) 24.0 34.0 31.5 33.0<br />
Production (kg/ha) 597 1795 1522 2858<br />
1999<br />
Canopy cover (%) 23.3 26.3 27.8 30.8<br />
Basal cover (%) 21.8 22.0 22.8 24.8<br />
Production (kg/ha)<br />
* n = 160<br />
775 1233 1369 1613<br />
vegetation increased with increased coversoil depths. There were no significant correlations<br />
between plant growth characteristics and slope gradient indicating that slope gradient did not<br />
have an effect on plant growth. Total vegetative canopy cover, basal cover, and production<br />
values decreased from 1998 to 1999, however, perennial grass cover, forb cover, and<br />
production all increased after the first year. Decreases in total vegetative canopy and<br />
production were due to the absence <strong>of</strong> the cover crop during the second year.<br />
On plots without coversoil, rock cover was very high (86%), and, as a result, both<br />
plant growth and soil loss rates were low (Figure 1). Increasing the coversoil depth resulted<br />
in increased plant production, however increased plant production did not result in decreased<br />
soil loss rates. Results from 1998 may not have shown a relationship between plant growth<br />
and soil loss since most soil loss occurred before the plant community established. An<br />
inverse relationship between plant growth and soil loss would have been more likely during<br />
1999, but did not occur. Results from this study indicated that although increased coversoil<br />
depths yielded increased plant production, these increases in plant production were not<br />
sufficient to minimize soil losses.<br />
The RUSLE version 1.06 computer model was used to calculate annual soil loss<br />
values for both years <strong>of</strong> this study. On average, predicted values for 1998 underestimated the<br />
rate <strong>of</strong> soil loss by 15 +/- 17 Mg/ha. RUSLE predicted soil loss rates for 1999 more<br />
accurately than for 1998. In 1999, RULSE, on average, underestimated soil loss by<br />
0.4 +/- 0.6 Mg/ha. Although the RUSLE model accounts for rill and interrill erosion, data<br />
suggested that RUSLE was not able to account for the extreme quantity <strong>of</strong> soil loss during<br />
the first season as rills formed.<br />
To account for the inaccuracy <strong>of</strong> soil loss prediction by RUSLE in the first year a rill<br />
formation factor was determined. Plots were divided into three groups based on the average<br />
rill severity rating for each plot: plots with stable to slight rill erosion, plots with slight to<br />
moderate rill erosion, and plots with moderate to critical rill erosion. Using nonlinear<br />
variable estimation (Wraith and Or, 1999), a rill formation factor was determined for plots<br />
with slight to moderate rill severity and for plots with moderate to critical rill severity. The<br />
rill formation factor (F) was multiplied by the soil erodibility factor (K) to generate a new<br />
soil erodibility factor (K1). This new soil erodibility factor (K1) was then used to generate<br />
optimized soil loss values. Using the new soil erodibility factor the optimized soil losses<br />
were closer to the measured soil losses. On average, the optimized soil losses were 1.4 +/-<br />
8.5 Mg/ha lower than measured soil losses. These rill formation factors were generated from<br />
a small sample size and are not necessarily applicable to other sites.
There may be other reasons why the RUSLE model predicted soil loss rates notably<br />
low on many <strong>of</strong> the plots in 1998; however, if the reason for underestimation is due to the<br />
formation <strong>of</strong> rills it would be useful to incorporate this factor into RUSLE v. 1.06. This<br />
computer model was designed for mined sites, reclaimed lands, and construction sites. First<br />
year rill formation is likely to occur on these newly constructed steep slopes. Hopefully,<br />
future research will serve to corroborate the need for a special rill formation factor when<br />
using RUSLE v. 1.06 on newly constructed steep slopes.<br />
CONCLUSIONS<br />
As slope gradient increased to 40% soil loss increased; but as slope gradient increased<br />
to 50% soil loss decreased. Although soil loss generally increased with slope gradient, soil<br />
loss after the second year was less than 2.5 Mg/ha regardless <strong>of</strong> slope gradient or coversoil<br />
thickness. These soil loss rates are considered stable. Soil losses the first year following<br />
reclamation were higher for all slope gradients. To protect downgradient water quality<br />
during the first year following reclamation, a support practice (i.e., mulching, constructing<br />
sediments basins) should be considered.<br />
Soil loss was least on the plots without coversoil, but this treatment is not<br />
recommended. Use <strong>of</strong> coversoil is recommended as a best management practice for land<br />
reclamation. All plots with coversoil, regardless <strong>of</strong> thickness, had more plant growth than<br />
plots without coversoil. Plant growth increased with increasing coversoil thickness.<br />
Although increased coversoil thickness yielded increased plant cover and plant production,<br />
these increases in plant growth did not have the effect <strong>of</strong> reducing soil loss. At least 15 cm <strong>of</strong><br />
coversoil should be applied to reconstructed slopes, however, long term monitoring <strong>of</strong> a site<br />
may show that increased coversoil thicknesses have a greater effect on vegetation and<br />
subsequent soil loss as the plant community matures.<br />
RUSLE v. 1.06 underestimated soil loss during the first year by 14.98 +/- 17.35<br />
Mg/ha, but predictions for the second year underestimated soil losses by only 0.38<br />
+/- 0.59 Mg/ha. Although RUSLE is designed to account for rill and interrill erosion, results<br />
from this study indicated that it was not able to account for the severe erosion that occurred<br />
as rills formed. Based on results <strong>of</strong> this study RUSLE is an effective tool to use for long term<br />
planning on reconstructed high altitude steep slopes.<br />
REFERENCES<br />
Ashby, W.C., W.G. Vogel, C.A. Kolar, and G.R. Philo. 1984. Productivity <strong>of</strong> stony<br />
soils on strip mines. In Soil Erosion: Prediction and Control. Soil Conservation<br />
Society <strong>of</strong> America, Ankeny, IA. pp. 31-43.<br />
Barth, R.C. and B.K. Martin. 1982. Soil-depth requirements to reclaim surface-mined<br />
areas in the Northern Great Plains. Restoration Institute, Colorado School <strong>of</strong><br />
Mines, Golden, CO. 11p.<br />
Box, J.E. Jr., and L.D. Meyer. 1984. Adjustment <strong>of</strong> the universal soil loss equation for<br />
cropland soils containing coarse fragment. In Soil Erosion: Prediction and<br />
Control. Soil Conservation Society <strong>of</strong> America, Ankeny, IA. pp. 31-43.<br />
Bradford, J.M. and G.R. Foster. 1996. Interrill soil erosion and slope steepness factors.<br />
Soil Science Society <strong>of</strong> America Journal. 60:909-915.
Brady, Nyle C. and R.R. Weil. 1996. The Nature and Properties <strong>of</strong> Soils. Eleventh<br />
Edition. Prentice Hall. Upper Saddle River, NJ.<br />
Clark, Ronnie. 1980. Erosion condition classification system. Determination <strong>of</strong> soil<br />
erosion condition Montana revised method. US Department <strong>of</strong> the Interior,<br />
Bureau <strong>of</strong> Land Management Technical Note #346.<br />
Fasching, Richard A. USDA NRCS State Agronomist. Bozeman, MT.<br />
Personal communication. July, 1999.<br />
Galetovic, Joesph R., 1998. Guidelines for the use <strong>of</strong> the revised universal soil loss<br />
equation (RUSLE) version 1.06 on mined lands, construction sites, and reclaimed<br />
lands. <strong>Office</strong> <strong>of</strong> <strong>Surface</strong> <strong>Mining</strong>, Denver, CO.<br />
Grosh J.L. and A.R. Jarrett. 1994. Interrill erosion and run<strong>of</strong>f on very steep slopes.<br />
Transactions <strong>of</strong> the ASAE. 37:1127-1133.<br />
Hahn, D.T., W. Moldenhauer, and C.B. Roth. 1985. Slope gradient effect on erosion <strong>of</strong><br />
reclaimed soil. Transactions <strong>of</strong> the ASAE. 28:805-808.<br />
Hartley, D.M., G.E. Schuman. 1984. Soil erosion potential <strong>of</strong> reclaimed mined lands.<br />
Transactions <strong>of</strong> the ASAE. 27:1067-1073<br />
Kirkby, M.J. and R.P.C. Morgan. 1980. Soil Erosion. John Wiley & Sons, New York, NY.<br />
Larson, W.E., M.J. Lindstrom, and T.E. Schumacher. 1997. The role <strong>of</strong> severe storms<br />
in soil erosion: A problem needing consideration. Journal <strong>of</strong> Soil and Water<br />
Conservation. 5:90-95.<br />
Liu, B.Y., M.A. Nearing, and L.M Risse. 1994. Slope gradient effects on soil loss for<br />
steep slopes. Transactions <strong>of</strong> the ASAE. 37:1835-1839.<br />
Mathier, L.A. G. Roy, and J.P. Pare. 1989. The effect <strong>of</strong> slope gradient and length on<br />
the variables <strong>of</strong> a sediment transport equation for sheetwash. Catena.<br />
16:545-558.<br />
McCool, D.K. and K.G. Renard. 1990. Water erosion and quality. Advances in Soil<br />
Sciences. 13:175-185.<br />
McCool, D.K., L.C. Brown, G.R. Foster, C.K. Mutchler and L.D. Meyer. 1987.<br />
Revised slope steepness factor for the Universal Soil Loss Equation. Transactions<br />
<strong>of</strong> the ASAE. 30:1387-1396.<br />
McGinnies, W.J. and P.J. Nicholas. 1980. Effects <strong>of</strong> topsoil thickness and nitrogen<br />
fertilizer on the revegetation <strong>of</strong> coal mine spoils. J. Environmental Quality.<br />
4: 681-685.
McIssac, G.F., J.K. Mitchell and M.C. Hirschi. 1987. Slope steepness effects on soil<br />
loss from disturbed lands. Transactions <strong>of</strong> the ASAE. 30:1005-1013.<br />
Munshower, Frank F. 1994. Practical Handbook <strong>of</strong> Disturbed Land <strong>Revegetation</strong>.<br />
Lewis Publishers, Boca Raton, FL. 265p.<br />
Power, J.F., F.M. Sanduval, R.E. Ries, and S.D. Merrill. 1981. Effects <strong>of</strong> topsoil and<br />
subsoil thickness on soil water content and crop production on a disturbed soil.<br />
Soil Science Society <strong>of</strong> America Journal. 45:124-129.<br />
Redente, E.F., and H.E. Hargis. 1985. An evaluation <strong>of</strong> soil thickness and manipulation<br />
<strong>of</strong> soil and spoil for reclaiming mined land in northwestern Colorado.<br />
Reclamation and <strong>Revegetation</strong> Research. 4: 1729-1732.<br />
Redente, E.F., T. McLendon, W. Agnew. 1997. Influence <strong>of</strong> topsoil depth on plant<br />
community dynamics <strong>of</strong> a seeded site in Northwest Colorado. Arid Soil Research<br />
Land Rehabilitation. 11:139-149.<br />
Renard, K.G., G.R. Foster, G.A. Weesies, D.K. McCool, D.C. Yoder. January 1997.<br />
Predicting soil erosion by water: a guide to conservation planning with the<br />
revised universal soil loss equation (RUSLE). USDA ARS Agricultural<br />
Handbook 703.<br />
Schroeder, S.A. 1987. Slope gradient effect on erosion <strong>of</strong> reshaped spoil. Soil Science<br />
Society <strong>of</strong> America Journal. 51:405-409.<br />
Sidle, Roy C., R.W. Brown, and B.D. Williams. 1993. Erosion processes on arid<br />
minespoil slopes. Soil Science Society <strong>of</strong> America Journal. 57:1341-1347.<br />
Simanton, J.R., E. Rawitz, and E.D. Shirley. 1984. Effects <strong>of</strong> rock fragments on<br />
erosion <strong>of</strong> semiarid rangeland soils. In Soil Erosion: Prediction and Control.<br />
Soil Conservation Society <strong>of</strong> America, Ankeny, IA. pp. 65-72.<br />
Singer, Micheal J., and J. Blackard. 1982. Slope angle – Interrill soil loss relationships<br />
for slopes up to 50%. Soil Science Society <strong>of</strong> America Journal. 46:1270 – 1273.<br />
Toy, Terrence J. 1989. Geomorphic responses <strong>of</strong> natural and reclaimed hillslopes to<br />
precipitation events in Wyoming. In: Proceedings <strong>of</strong> the American Society for<br />
<strong>Surface</strong> <strong>Mining</strong> and Reclamation 6 th Annual National Meeting. Calgary, Alberta.<br />
219-228.<br />
Wraith, Jon M. and Dani Or. 1998. Nonlinear variable estimation using spreadsheet<br />
s<strong>of</strong>tware. Journal <strong>of</strong> Natural Resources, Life Science and Education. 27.<br />
pp. 13-19
2000 Billings Land Symposium<br />
SUCCESSFUL TECHNIQUES FOR HIGH ALTITUDE STEEP SLOPE REVEGETATION<br />
J. T. Harrington 1 , A. M. Wagner 2 , and D. R. Dreesen 3<br />
ABSTRACT<br />
The Molycorp, Inc. Questa mine is located in northern New Mexico in an area <strong>of</strong> steep<br />
topography. Dump construction during the open pit operation utilized steep canyons to<br />
create the dumps. The resulting overburden slopes are relatively shallow, steep and high<br />
(over 500 feet). A state highway and river, located near the toe <strong>of</strong> the slopes preclude<br />
reshaping <strong>of</strong> the piles. The angle (steepness) <strong>of</strong> the slopes is similar to the natural<br />
topography, which supports primarily a mixed conifer ecosystem. Development <strong>of</strong> a selfsustaining<br />
ecosystem appropriate to the site is the underlying goal <strong>of</strong> the revegetation<br />
program. The relatively rapid physical weathering <strong>of</strong> the waste rock creates a suitable<br />
planting medium for the seedlings. An in situ method for reclamation was developed based<br />
on over 20 years <strong>of</strong> research and planting programs. Both the fast growing early successional<br />
overstory species (Populus angustifolia, Quercus gambelii, Robinia neomexicana, etc.) and<br />
the slower growing, later successional overstory species (Pinus ponderosa, P. flexilis, Abies<br />
concolor, etc.) are planted simultaneously along with appropriate understory species. The<br />
differential growth <strong>of</strong> the two types <strong>of</strong> overstory species is intended to shorten the time frame<br />
to achieve a more stable, later successional plant community. Standard forestry techniques<br />
were adapted for the reclamation program. In general, seedlings <strong>of</strong> the overstory and shrub<br />
species are hand planted on the slopes using hoedads and grasses and forbs are established<br />
using direct seeding techniques. First year survival for transplants has averaged 80%. This<br />
survival rate has been attributed to three main features <strong>of</strong> the program: 1) using site adapted<br />
(genetic) stock; 2) planting pre-conditioned container grown stock; and 3) proper planting<br />
techniques. The expanded revegetation program is in its fourth year with over 130,000<br />
seedlings planted.<br />
________________<br />
Additional Key Words: reforestation, reclamation.<br />
1<br />
Associate Pr<strong>of</strong>essor, Mora Research Center, New Mexico State University, Mora, NM<br />
87732<br />
2<br />
Molycorp, Inc., Questa, NM, 87556<br />
3<br />
Los Lunas Plant Materials Center, Natural Resources Conservation Service, Los Lunas, NM<br />
87031.
INTRODUCTION<br />
The Molycorp Inc., Questa Molybdenum Mine has been in operation since 1921. The<br />
mine is located in an area <strong>of</strong> steep, mountainous topography in narrow canyons adjacent to<br />
the Red River five miles east <strong>of</strong> the town <strong>of</strong> Questa, New Mexico in Taos County.<br />
Underground mining occurred from 1921 to the early 1960s when open pit development <strong>of</strong><br />
the ore body began. The open pit mine operated from 1965 through 1983. From 1983 to the<br />
present mining is an underground block caving operation.<br />
The open pit period <strong>of</strong> extraction generated 328 million tons <strong>of</strong> overburden.<br />
Deposition <strong>of</strong> this overburden material utilized the natural steep, long slopes and narrow<br />
canyons for the development <strong>of</strong> the overburden piles. Today, the overburden pile surfaces<br />
are steep and long, in some cases exceeding 500 feet in length. Unlike other mining<br />
operations where overburden piles are situated on relatively flat ground and the height <strong>of</strong> the<br />
piles is indicative <strong>of</strong> pile depth, the depth <strong>of</strong> the overburden piles at Molycorp range from 60<br />
to 125 feet in thickness (depth) (Robertson GeoConsultants, Inc. 1999). The resulting<br />
overburden depth was a function <strong>of</strong> several factors including underlying topographic features<br />
including slope, slope length and overburden structural composition and its influence on<br />
angle <strong>of</strong> repose. The resultant surface <strong>of</strong> the overburden piles has similar slope intensity to<br />
the adjacent natural topography.<br />
The terrain surrounding the mine supports primarily coniferous ecosystems with<br />
riparian ecosystems in the bottoms <strong>of</strong> many canyons having perennial streams or rivers. The<br />
conifer dominated ecosystems range from ponderosa pine (Pinus ponderosa), mixed conifer<br />
(P. flexilis, Pseudotsuga menziesii, Abies concolor) to spruce-fir (Picea engelmannii and<br />
Abies concolor) stands. Topographic features, specifically elevation and aspect strongly<br />
influence species distribution (Wagner and Harrington, 1994). Areas in which the coniferous<br />
overstory have been disturbed, various shrub (Quercus spp., Cercocarpus montanus, Ribes<br />
spp.), aspen (Populus tremuloides) and narrowleaf cottonwood (P. angustifolia) dominated<br />
communities occur. Again, the distribution <strong>of</strong> these various communities is strongly<br />
influenced by topographic features and most likely edaphic features that impact rooting<br />
mantle thickness and water holding capacity.<br />
The other natural feature which appears to strongly influence vegetation distribution<br />
in this region are hydrothermal scars. These naturally occurring areas have highly erodible,<br />
and acidic “soils” (Meyer and Leonardson 1990). During the open pit-mining operations,<br />
hydrothermal scars were excavated along with intervening areas <strong>of</strong> more neutral geologic<br />
materials. Heterogeneous overburden piles resulted with a wide range <strong>of</strong> particle sizes, and<br />
chemistries (specifically pH).<br />
Through the influence <strong>of</strong> overburden management and natural variability in the area,<br />
the piles represent a broad array <strong>of</strong> planting sites with a wide range <strong>of</strong> attributes which can<br />
influence revegetation success. Elevation ranges from 8,000 feet to 10,000 feet and almost<br />
every aspect occurs. In addition to the variability in the overburden thickness, overburden<br />
particle size ranges from clay sized fines to large cobble and overburden pH ranges from<br />
neutral (pH 7.0) to very acidic (pH < 3.0). In short, the overall site provides an ideal<br />
laboratory to evaluate the robustness <strong>of</strong> different revegetation treatments.
Traditional approaches to revegetation <strong>of</strong> overburden materials <strong>of</strong>ten involves drastic<br />
recontouring and capping with various materials to support plant growth, and in several cases<br />
manipulate water movement. However, many features <strong>of</strong> this site indicate that developing<br />
new revegetation techniques and technologies or modifying existing ones would be more<br />
advantageous to both Molycorp and the overall watershed. Some <strong>of</strong> the technologies and<br />
techniques developed from the in situ revegetation <strong>of</strong> the overburden would be applicable to<br />
other, natural areas in the watershed which are actively eroding.<br />
REVEGETATION RESEARCH<br />
Beginning in the mid-1970s Molycorp has been actively funding revegetation<br />
research at their Questa mine. Initially, this research effort began with the then Soil<br />
Conservation Service Plant Materials Center in Los Lunas, New Mexico (currently, the<br />
Natural Resource Conservation Service, Los Lunas Plant Materials Center (NRCS-LL-<br />
PMC). This research effort continues today. In 1992, Molycorp expanded this effort by<br />
expanding funding to include New Mexico State University researchers at the Mora Research<br />
Center (NMSU-MRC). This research effort also continues today. This report will<br />
summarize the accomplishments <strong>of</strong> several <strong>of</strong> these research projects. For sake <strong>of</strong> brevity,<br />
only those studies or portions <strong>of</strong> studies relating to the development <strong>of</strong> the revegetation<br />
project will be presented in this manuscript. Also, discussed will be the results <strong>of</strong> initial<br />
plantings associated with the operational revegetation plantings that began in fall 1996. Most<br />
data presented will be first year survival data or survival data after one growing season unless<br />
otherwise noted.<br />
MATERIALS AND METHODS<br />
The plants used in these studies and the operational program are container grown<br />
seedlings produced in greenhouses. The NMSU-MRC and NRCS-LL-PMC facilities have<br />
produced the plant materials used in these studies and operational plantings under appropriate<br />
production regimes. Seed or cutting sources are identified in each respective study. When<br />
possible and depending on the purpose <strong>of</strong> the study, local seed sources have been used.<br />
Planting <strong>of</strong> seedlings involved using traditional container planting techniques (dibble bars,<br />
hoedads, etc.) adjusted to accommodate unique site features such as rockiness and steep<br />
slopes.<br />
Study A. Fertilization Effects on Early Survival and Vigor <strong>of</strong> Shrub Seedlings Planted on<br />
Neutral Overburden.<br />
The purpose <strong>of</strong> this study was to evaluate the effects <strong>of</strong> fertilizer incorporation at<br />
planting on the survival and vigor <strong>of</strong> 24 shrub species.<br />
Twenty-four species and ecotypes were evaluated in this study. Seedlings were<br />
grown in Supercells (10 in 3 ). Seedlings were planted at the end <strong>of</strong> July 1994 on a ripped<br />
bench plot (ripped to an average depth <strong>of</strong> 10 inches). Plots were watered before or after<br />
planting. Two planting locations on the overburden piles were used in this study.<br />
Replications varied from five to seven seedlings per source with fourteen rows per treatment<br />
replication. Half <strong>of</strong> the Super Cells were fertilized at planting with the other half receiving no<br />
fertilizer (control). Fertilizer treatment consisted <strong>of</strong> 6 grams/seedling <strong>of</strong> 17-6-23 3-4 month
controlled release fertilizer. All plots were top dressed with 17-17-17 fertilizer in July 1996<br />
and 1997. The plots were evaluated in September 1995 and 1997. Individual seedlings were<br />
classified with numeric vigor ratings <strong>of</strong> 4 = excellent, 3 = good, 2 = fair, 1 = poor, and 0 =<br />
dead.<br />
RESULTS<br />
Initial fertilizer application effects on survival was species and ecotype specific<br />
(Table 1). Ten <strong>of</strong> the 24 sources evaluated had pronounced (>10%) reductions in first year<br />
survival with the fertilizer treatment. By the 1997 survival evaluation only two sources, one<br />
Artemesia frigida and one Rosa woodsii source, appeared to have been negatively influenced<br />
by initial fertilization beyond the initial first year effects. Overall, three year survival was<br />
influenced by source rather than initial fertilization treatment. This trend is indicated by<br />
similar shifts in survival rates regardless <strong>of</strong> fertilization treatment from the 1995 to the 1997<br />
evaluation (Table 1).<br />
Seedling vigor after one year was impacted the fertilizer treatment, with those plants<br />
fertilized initially, in general showing higher vigor ratings. By the 1997 evaluation, this<br />
difference had become less pronounced (Table 1).<br />
Study B. Grass Species Trial.<br />
The purpose <strong>of</strong> this study was to evaluate grass species and varieties on overburden<br />
when planted as transplants. The influence <strong>of</strong> fertilization at time <strong>of</strong> planting and<br />
fertilization after two growing seasons was also evaluated.<br />
Grass seedlings were grown in horticultural six-pack containers, placed outside for<br />
hardening and fertilized with soluble fertilizer prior to transplanting. Sixty species and<br />
varieties (sources) were used in this study. Transplants were planted in two locations in<br />
ripped (to 10 inches) bench plots. Six plots were used with two plots receiving fertilizer (6<br />
grams/seedling <strong>of</strong> 17-6-12, 3-4 month controlled release fertilizer) and four plots without<br />
fertilizer at planting. Seedlings were transplanted August 8 and 9, 1994 and plots were<br />
watered before and immediately after planting. All plots received fertilizer (17-17-17) in<br />
July 1995 and 1997. The plantings were evaluated September 1995 and 1997 for vigor and<br />
survival. Vigor was rated as described above.<br />
RESULTS<br />
Only data from 18 <strong>of</strong> the 60 cultivars/species are shown, including the best<br />
performing grasses and those with Molycorp accesssions. The best performing grasses are<br />
listed below. In general, vigor was improved by fertilizer treatment (Figure 1). The average<br />
vigor rating for best performing species were greater than 3.25 in the fertilizer treatment and<br />
greater than 1.5 in the control. In general, survival was not affected by initial fertilizer<br />
treatment (Figure 2).<br />
Native cool season grasses: Canada Wildrye, Streambank Wheatgrass,<br />
Western Wheatgrass, Reed Canarygrass<br />
Native warm season grasses: Spike Muhly<br />
Introduced cool season grasses: Orchardgrass, Tall Fescue, Timothy
Table 1. Survival and mean vigor ratings for shrubs planted in 1994 and evaluated in 1995<br />
and 1997. Fertilizer treatment was applied at initial planting.<br />
Species 1995 Survival 1997 Survival 1995 Vigor 1997 Vigor<br />
Cont Fertil. Cont Fertil. Cont Fert Cont Fertil.<br />
Achillea spp. 98 98 97 100 1.89 3.58 3.80 3.40<br />
Artemesia frigida 98 94 62 66 1.81 3.19 3.39 3.41<br />
Artemesia frigida 97 83 76 28 1.62 2.93 3.83 3.77<br />
Artemesia frigida 100 82 48 40 1.85 3.11 3.56 2.80<br />
Artemesia spp. 96 91 87 88 1.60 3.08 3.45 3.43<br />
Artemesia tridentata 80 58 56 47 1.53 2.49 2.25 1.0<br />
Atriplex canescens 93 88 33 32 1.14 1.75 2.38 2.38<br />
Berberis fendleri -- 84 -- 92 -- 2.75 -- 2.22<br />
Cercocarpus montanus 95 81 82 69 1.73 2.58 3.21 3.41<br />
Chrysothamnus nauseosus 95 89 87 89 2.11 2.55 3.73 3.55<br />
Chrysothamnus nauseosus 95 91 82 93 2.00 2.45 3.44 3.58<br />
Eriogonum spp. 97 77 95 76 2.08 3.11 3.72 3.47<br />
Eriogonum spp. 94 81 95 77 2.20 3.64 3.66 3.59<br />
Jamesia americana 88 70 80 62 1.07 2.42 2.49 3.31<br />
Prunus virginiana 93 82 96 82 2.47 2.83 3.43 3.13<br />
Prunus virginiana 86 69 86 69 2.34 2.44 3.04 3.28<br />
Ribes cereum 81 82 81 79 1.08 1.55 3.23 2.94<br />
Ribes spp. (spiny) 93 84 78 78 1.09 1.52 3.33 2.59<br />
Ribes spp. (spiny) 95 93 78 89 1.14 1.78 3.15 2.49<br />
Robinia neomexicana 74 81 27 17 3.00 2.78 3.17 2.33<br />
Robinia fertilis 82 86 70 67 3.29 2.83 3.19 2.43<br />
Rosa woodsii 99 100 95 98 2.07 2.34 3.18 3.38<br />
Rosa woodsii 96 87 95 71 2.00 2.26 2.99 2.76<br />
Rubus spp. 100 51 93 68 1.64 2.90 3.88 3.36<br />
Study C. Effects <strong>of</strong> Seed Source and Container Size on the Survival <strong>of</strong> Ponderosa Pine<br />
Seedlings.<br />
The objectives for this study were to evaluate the effect <strong>of</strong> seed source and container<br />
size on the survival <strong>of</strong> ponderosa pine (Pinus ponderosa) seedlings planted on steep<br />
overburden slopes.<br />
The study used seedlings from four ponderosa pine seed sources. The sources were<br />
from throughout New Mexico representing 4 USDA Forest Service seed zones including the<br />
mine’s seed zone (USDA Forest Service seed zone 710), one adjacent to the mine’s seed<br />
zone to the west (620), and two southern seed zones (170 and 840).<br />
Seedlings from each <strong>of</strong> the four seed sources tested were produced in one <strong>of</strong> three<br />
growing containers. Sizes evaluated included 1 in 3 , 7 in 3 , and 10 in 3 containers. Seedlings<br />
were produced at the NMSU-MRC facility using a standard production regime.
Table 2. Species shown in Figures 1 and 2 listed below:<br />
NUMBER SCIENTIFIC NAME COMMON NAME SOURCE/VARIET<br />
Y<br />
1 Dactylis glomerata Orchardgrass Paiute<br />
2 Festuca arundinacea Tall Fescue Fawn<br />
3 Festuca ovina Sheep Fescue Covar<br />
4 Festuca ovina Sheep Fescue Molycorp H<br />
5 Festuca ovina Sheep Fescue Molycorp LS<br />
6 Festuca ovina Sheep Fescue Molycorp LT<br />
7 Schizachyrium scoparium Little Bluestem Molycorp GHS<br />
8 Schizachyrium scoparium Little Bluestem Pastura<br />
9 Bouteloua gracilis Blue Grama Alma<br />
10 Bouteloua gracilis Blue Grama Willis<br />
11 Elymus canadensis Canada Wildrye<br />
12 Elymus lanceolatus Thickspike Wheatgrass Critana<br />
13 Elymus lanceolatus Streambank Wheatgrass Sodar<br />
14 Muhlenbergia wrightii Spike Muhly El Vado<br />
15 Pascopyrum smithii Western Wheatgrass Arriba<br />
16 Pascopyrum smithii Western Wheatgrass Rosanna<br />
17 Phalaris arundinacea Reed Canarygrass<br />
18 Phleum pratense Timothy Climax<br />
Vigor<br />
4<br />
3.5<br />
3<br />
2.5<br />
2<br />
1.5<br />
1<br />
0.5<br />
0<br />
����� ���<br />
�����<br />
�����<br />
�����<br />
�����<br />
�����<br />
�����<br />
�����<br />
�����<br />
�����<br />
�����<br />
�����<br />
�����<br />
���<br />
���<br />
���<br />
���<br />
���<br />
���<br />
���<br />
���<br />
���<br />
���<br />
���<br />
���<br />
����<br />
����<br />
����<br />
����<br />
����<br />
����<br />
����<br />
����<br />
����<br />
����<br />
����<br />
����<br />
����<br />
�� ���� ��<br />
��<br />
��<br />
��<br />
��<br />
��<br />
��<br />
��<br />
��<br />
��<br />
��<br />
��<br />
��<br />
����<br />
����<br />
����<br />
����<br />
����<br />
����<br />
����<br />
����<br />
����<br />
����<br />
����<br />
����<br />
��<br />
��<br />
��<br />
��<br />
��<br />
��<br />
��<br />
��<br />
��<br />
��<br />
��<br />
��<br />
����<br />
����<br />
����<br />
����<br />
����<br />
����<br />
����<br />
����<br />
����<br />
����<br />
����<br />
��<br />
��<br />
��<br />
��<br />
��<br />
��<br />
��<br />
�����<br />
�����<br />
�����<br />
�����<br />
�����<br />
�����<br />
������<br />
95 Fert 95 ������ Ctrl 97 Fert 97 Ctrl<br />
���<br />
����� ��� ����� ��� ����� ��� ����� ���<br />
���<br />
��<br />
����<br />
��<br />
����<br />
��<br />
��� �����<br />
��� �����<br />
��� �����<br />
��� �����<br />
���<br />
�����<br />
1 2 3 4 5 6 7 8 9 10 11 12 13 14 15 16 17 18<br />
���<br />
���<br />
���<br />
���<br />
���<br />
���<br />
���<br />
���<br />
Spe cie s<br />
Figure 1. Effect <strong>of</strong> fertilizer at planting on vigor <strong>of</strong> grass transplants, with planting occurring<br />
in 1994. See Table 2 for species codes.<br />
�����<br />
�����<br />
�����<br />
�����<br />
�����<br />
�����<br />
�����<br />
�����<br />
�����<br />
�����<br />
�����<br />
�����<br />
���<br />
���<br />
���<br />
���<br />
���<br />
���<br />
���<br />
���<br />
���<br />
���<br />
���<br />
���<br />
�����<br />
�����<br />
�����<br />
�����<br />
�����<br />
�����<br />
�����<br />
�����<br />
�����<br />
�����<br />
�����<br />
�����<br />
���<br />
���<br />
���<br />
���<br />
���<br />
���<br />
���<br />
���<br />
���<br />
���<br />
���<br />
���<br />
�����<br />
�����<br />
�����<br />
�����<br />
�����<br />
�����<br />
�����<br />
�����<br />
�����<br />
�����<br />
�����<br />
�����<br />
���<br />
���<br />
���<br />
���<br />
���<br />
���<br />
���<br />
���<br />
���<br />
���<br />
���<br />
���<br />
�����<br />
�����<br />
�����<br />
�����<br />
�����<br />
�����<br />
�����<br />
�����<br />
�����<br />
�����<br />
�����<br />
�����<br />
���<br />
���<br />
���<br />
���<br />
���<br />
���<br />
���<br />
���<br />
���<br />
���<br />
���<br />
���
Survival (%)<br />
100<br />
80<br />
60<br />
40<br />
20<br />
0<br />
���<br />
���<br />
���<br />
���<br />
���<br />
���<br />
���<br />
���<br />
���<br />
���<br />
���<br />
�����<br />
�����<br />
�����<br />
�����<br />
�����<br />
�����<br />
�����<br />
�����<br />
�����<br />
���<br />
���<br />
���<br />
���<br />
���<br />
�����<br />
�����<br />
�����<br />
�����<br />
�����<br />
�����<br />
�����<br />
�����<br />
�����<br />
����<br />
����<br />
����<br />
�����<br />
�����<br />
�����<br />
�����<br />
�����<br />
�����<br />
�����<br />
�����<br />
�����<br />
���<br />
���<br />
���<br />
���<br />
���<br />
���<br />
���<br />
������<br />
������<br />
������<br />
������<br />
������<br />
����<br />
����<br />
����<br />
�����<br />
�����<br />
�����<br />
�����<br />
�����<br />
�����<br />
�����<br />
���� ������ ���� ������<br />
���<br />
���� �����<br />
����<br />
�����<br />
1 2 3 4 5 6 7 8 9 10 11 12 13 14 15 16 17 18<br />
Spec i es<br />
����<br />
����<br />
����<br />
����<br />
����<br />
����<br />
����<br />
����<br />
����<br />
����<br />
������<br />
������<br />
������<br />
������<br />
������<br />
������<br />
������<br />
������<br />
������<br />
������<br />
����<br />
����<br />
����<br />
����<br />
����<br />
����<br />
����<br />
����<br />
����<br />
����<br />
������<br />
������<br />
������<br />
������<br />
������<br />
������<br />
������<br />
������<br />
������<br />
������<br />
��������<br />
95 Fert 95 �������� Ctrl 97 Fert 97 Ctrl<br />
Figure 2. Effect <strong>of</strong> fertilizer at planting on survival <strong>of</strong> grass transplants, planting occurred in<br />
1994. See Table 2 for species codes.<br />
The seedlings were planted September 13-16, 1993. Dibble bars were used for the<br />
larger containers and a sharpshooter shovel for the 1 inch 3 container. Treatments, seed<br />
source and container size, were randomly allocated in each planting block. Two planting<br />
sites were used in the study. Both sites were near the base <strong>of</strong> the slopes.<br />
The treatment design was a factorial design <strong>of</strong> seed source (four), and container size<br />
(three) for 12 treatments. The outplanting design was a split plot design with the two main<br />
plots being the planting sites. Each main plot consisted <strong>of</strong> six randomized complete blocks.<br />
Each treatment was represented in each block by a 10 tree row plot.<br />
The response unit was the average <strong>of</strong> the 10 tree row plot <strong>of</strong> each treatment within<br />
each block. Because the plots were installed at the base <strong>of</strong> slopes some areas were lost by<br />
covering by overburden material. Survival values were adjusted to be a percentage <strong>of</strong> the<br />
number <strong>of</strong> living seedlings based on total number <strong>of</strong> non-covered seedlings.<br />
RESULTS<br />
Smaller seedlings were more prone to covering than were larger stock types (39%<br />
compared to 30%). Survival was greater for the largest two stock types, 10 in 3 and 7 in 3<br />
(Figure 3). Some treatments had 90% survival. The smaller stock type, 1 in 3 , had a survival<br />
rate <strong>of</strong> 5%. The poorest performing seed source was the southern seed source (seed zone<br />
170). The three other seed sources performed comparably, with an average survival <strong>of</strong> 24%<br />
(Figure 4).<br />
����<br />
����<br />
����<br />
����<br />
����<br />
����<br />
����<br />
����<br />
����<br />
������<br />
������<br />
������<br />
������<br />
������<br />
������<br />
������<br />
������<br />
������<br />
����<br />
����<br />
����<br />
����<br />
����<br />
����<br />
����<br />
����<br />
����<br />
����<br />
����<br />
������<br />
������<br />
������<br />
������<br />
������<br />
������<br />
������<br />
������<br />
������
Survival (%)<br />
50<br />
40<br />
30<br />
20<br />
10<br />
0<br />
������������<br />
������������<br />
������������<br />
������������<br />
������������<br />
������������<br />
������������<br />
������������<br />
������������ ���� �����<br />
����<br />
�����������<br />
��������������<br />
�����������<br />
�����������<br />
��������������<br />
�����������<br />
��������������<br />
������������� �����������<br />
������������<br />
������������<br />
����������<br />
����������<br />
�������������<br />
�������������<br />
����������<br />
�������������<br />
������������<br />
�������������<br />
������������<br />
����������<br />
�����������<br />
�����������<br />
�����������<br />
�����������<br />
��������������<br />
��������������<br />
�������������<br />
��������������<br />
�������������<br />
�����������<br />
��������������<br />
��������������<br />
��������������<br />
��������������<br />
��������������<br />
��������������<br />
Site 1 Site 2 Mean<br />
�������������<br />
�������������<br />
10 cu in<br />
�������<br />
������� 7 cu in<br />
�������<br />
1 cu in<br />
Figure 3. Effect <strong>of</strong> container size on transplanted ponderosa pine seedling survival.<br />
Survival (%)<br />
40<br />
30<br />
20<br />
10<br />
0<br />
����������<br />
�������������<br />
������������<br />
�������������<br />
������������<br />
����������<br />
����������<br />
�������������<br />
������������<br />
�������������<br />
������������<br />
����������<br />
��������������<br />
�������������<br />
�����������<br />
�������������<br />
�����������<br />
��������������<br />
������������<br />
������������<br />
�������������<br />
������������<br />
�����������<br />
������������<br />
�����������<br />
�������������<br />
�������������<br />
������������<br />
�����������<br />
������������<br />
�����������<br />
�������������<br />
�������������<br />
�����������<br />
�����������<br />
�������������<br />
������������<br />
��������������<br />
Site 1 Site 2 Mean<br />
������� ������<br />
�����<br />
Source 1 (710) Source 2 (620) Source 3 (170) Source 4 (840)<br />
Figure 4. Effect <strong>of</strong> seed source on transplanted ponderosa pine seedling survival.<br />
Study F. Effects <strong>of</strong> Planting Site Aspect, Elevation and Substrate Chemistry on Survival <strong>of</strong><br />
Spring and Fall Planting Conifer Seedlings.<br />
The objectives <strong>of</strong> this study were to survey effects <strong>of</strong> aspect and elevation on conifer<br />
transplant survival for spring and late summer planted seedlings and to examine the impact <strong>of</strong><br />
substrate chemistry on conifer transplant survival for spring and late summer planted<br />
material.<br />
This study utilized seedlings generated from two ponderosa pine (Pinus ponderosa)<br />
seed sources, one seed source <strong>of</strong> Douglas fir (Pseudotsuga menziesii) and one seed source <strong>of</strong><br />
Englemann spruce (Picea engelmannii). All seedlings were greenhouse grown in 9 in 3<br />
containers. Seedlings were removed from their containers, bagged, boxed and refrigerated<br />
(34 o F) until planted. All seedlings were dormant when planted.
Seven planting sites were evaluated providing a range <strong>of</strong> aspects, elevations and<br />
substrate chemistry (see Table 3). Planting dates were early June and late August 1994.<br />
Only ponderosa pine was planted in June, and all four sources were planted in August.<br />
Treatments evaluated were species and seed sources and planting date. Other factors<br />
examined were elevation, aspect and substrate chemistry. The treatment design was an<br />
incomplete factorial design with main factors being species – seed source and planting date.<br />
The outplanting study design was a randomized complete block. The seven planting sites<br />
served as complete blocks.<br />
Each seed source by planting date combination was represented in each block by 10,<br />
10-tree row plots. The response unit was the average <strong>of</strong> the 10-tree row plot <strong>of</strong> each<br />
treatment within each block. The survival response is as described above in Study E.<br />
Table 3: Elevation, aspect, field pH and field conductivity for planting sites.<br />
Site Number Elevation (feet) Aspect Field pH Field<br />
Conductivity<br />
A 9200 South 2.9 2900 µS<br />
B 9000 Southwest 5.0 110 µS<br />
C 9000 South 5.5 70 µS<br />
D 9000 Southeast -- --<br />
E 9400 South 3.7 720 µS<br />
F 9400 East 2.8 1450 µS<br />
G 8550 East 6.5 40 µS<br />
The overall adjusted survival <strong>of</strong> this study was 44% with spring planted seedlings<br />
having an average survival <strong>of</strong> 68% (Table 4). On four sites, spring planted ponderosa pine<br />
seedlings had survival rates <strong>of</strong> 80%, with two sites in excess <strong>of</strong> 90%. Fall planted material<br />
from the same seed sources did not perform as well, with one site having a decline in survival<br />
from over 80% to 11%. Englemann spruce, planted only in the fall, had a survival rate <strong>of</strong><br />
65%. It was the only species to do well with the late summer planting.<br />
Average survival by planting site ranged from 20% to 65% with all plantings having<br />
some replications with 0% and 100% survival. Planting sites A and F were acidic sites and<br />
had similar survival <strong>of</strong> approximately 47%. Species seed source and planting date trends <strong>of</strong><br />
reduced survival and overall ranking were similar for both sites with the exception <strong>of</strong> late<br />
summer planting <strong>of</strong> one source <strong>of</strong> ponderosa. This seed source had almost no survival at<br />
planting site F while planting site A had survival <strong>of</strong> over 33% (Table 4). The somewhat less<br />
acidic site, planting site E, also had good spring ponderosa pine survival (91%), however fall<br />
planting performance was significantly reduced. The only trend in survival for neutral<br />
planting sites was the better performance for spring planted ponderosa pine.<br />
First Year Survival <strong>of</strong> a Fall Operational Planting<br />
In September <strong>of</strong> 1996, a trial operational planting was conducted on the top portion <strong>of</strong><br />
one <strong>of</strong> the lower (elevation) overburden piles. The planting was done by hand using a<br />
contract planting crew. The plant material, consisted <strong>of</strong> a wide range <strong>of</strong> plant species. In<br />
general the relative proportion <strong>of</strong> plant forms was 35% deciduous trees; 40% coniferous<br />
trees; and, 25% shrubs. All plant materials were grown in reforestation containers
Table 4. Effect <strong>of</strong> planting location, species and planting date on seedling survival.<br />
Mean Survival (%)<br />
Treatment Plot A Plot B Plot C Plot D Plot E Plot F Plot G<br />
Spring ponderosa<br />
(1)<br />
76 37 39 75 84 90 86<br />
Spring ponderosa<br />
(2)<br />
56 23 22 86 97 84 96<br />
Fall ponderosa (1) 45 38 2 17 12 39 70<br />
Fall ponderosa (2) 33 5 5 42 9 3 34<br />
Fall Englemann<br />
spruce<br />
42 74 48 67 52 76 99<br />
Fall Douglas fir 21 13 8 5 0 19 9<br />
(Supercells or Styro77 Styroblocks) at the NMSU-MRC Research Nursery. Planting crews<br />
were told to select plant materials to maximize diversity at the planting site. (Note: some<br />
members <strong>of</strong> the planting crew were better at this than others.) The planting crews were given<br />
instructions to plant seedlings four feet apart within rows and the rows were to be 4 feet<br />
apart.<br />
In August <strong>of</strong> 1997, nine 100m 2 (50m x 2m) transects in the planting area were<br />
randomly selected and measured. Species composition and frequency were recorded. Status<br />
categories included: living, dead, living and partially buried, dead and partially buried. No<br />
interpretations <strong>of</strong> the vigor <strong>of</strong> the seedlings were made. For ease <strong>of</strong> installation and<br />
consistency, all transects were placed perpendicular to the slope direction.<br />
RESULTS<br />
Overall, survival ranged from 89% to 69%. The plot containing the 31% mortality<br />
was unique in that large portions <strong>of</strong> this transect (in excess <strong>of</strong> 35%) were covered by cobble<br />
sized material and those areas were not planted. The majority <strong>of</strong> the mortality was observed<br />
immediately adjacent to these cobble areas. Therefore, this plot was eliminated from the<br />
summary analysis (Table 5). The next highest mortality level was 24%. When separated by<br />
life form (conifer tree, deciduous tree, shrub) the deciduous tree, primarily narrowleaf<br />
cottonwood (Populus angustifolia) had the lowest survival rate <strong>of</strong> 62% (live and buried live).<br />
Coniferous trees had a survival rate <strong>of</strong> 88% <strong>of</strong> which 9% were partially buried. Shrubs had<br />
the highest survival rate <strong>of</strong> 92% (Table 5).<br />
Partially buried seedling frequency ranged from none to 19% with an average <strong>of</strong> 9%<br />
(Table 5). Shrubs had the highest frequency <strong>of</strong> partial burying at 14% while the coniferous<br />
and deciduous trees had partial burying rates <strong>of</strong> 9% and 5% respectively.<br />
Species diversity across the plots ranged from 10 to 16 species per plot averaging 11<br />
species per plot. All life forms were represented in each plot. Plant density ranged from<br />
6.700 plants per hectare (2,735 plants per acre) to 10,500 plants per hectare (4,286 plants per<br />
acre) and averaging 8,838 plants per hectare (3,648 plants per acre).
Table 5. Summary survival and partially buried responses <strong>of</strong> the 1996 Fall Operational<br />
Planting. Evaluation occurred late August 1997.<br />
Total Percent Percent Non- Percent Buried Percent<br />
Life form percent Non-Buried Buried Dead Alive (Mean + Buried Dead<br />
survival Alive (Mean (Mean + SE) SE)<br />
(Mean + SE)<br />
(%) + SE)<br />
Conifers 88 78 + 4 9 + 3 9 + 3
the end <strong>of</strong> the growing season. This may have caused unnecessary shoot growth late in the<br />
growing season. Further work will need to be done on the timing <strong>of</strong> fertilization treatments.<br />
REFERENCES<br />
Meyer, J. and R. Leonardson. 1990. Tectonic, Hydrothermal and Geomorphic Controls on<br />
Alteration Scar Formation near Questa, New Mexico. New Mexico Geological<br />
Society Guidebook, 41 st Field Conference, Southern Sangre de Cristo Mountains,<br />
New Mexico, 1990.<br />
Robertson GeoConsultants, Inc. 1999. Interim Report: Questa Waste Rock Pile Drilling,<br />
Instrumentation and Characterization Study. Interim Report 052007/1. Prepared for<br />
Molycorp, Inc. September 6, 1999.<br />
Wagner, A. M. and J. T. Harrington. 1994. <strong>Revegetation</strong> Report for Molycorp, Inc. Report<br />
prepared for Molycorp, Inc. – New Mexico Mine Permit TA001RE.
2000 Billings Land Reclamation Symposium<br />
RESTORATION WITH NATIVE INDIGENOUS PLANTS<br />
IN<br />
YELLOWSTONE AND GLACIER NATIONAL PARKS<br />
Mark Majerus 1<br />
ABSTRACT<br />
The U.S. Department <strong>of</strong> Interior National Park Service has adopted a policy <strong>of</strong><br />
‘restoration’ with native indigenous plants on all disturbances related to road construction, visitor<br />
impact, and facility maintenance. The National Park Service is committed to maintaining the<br />
genetic integrity <strong>of</strong> the, <strong>of</strong>ten, unique native flora, with secondary goals <strong>of</strong> erosion control,<br />
competition with exotic and noxious invasive plants, and improved aesthetics. Since 1986,<br />
Yellowstone and Glacier National Parks have been working cooperatively with the USDA-NRCS<br />
Plant Materials Center in Bridger, Montana to determine which native plant species can be readily<br />
collected, increased, and successfully reestablished on disturbed sites. To maximize species<br />
diversity and compatibility, plant mixtures are designed to minimize competitive interactions. Seed<br />
mixtures are a combination <strong>of</strong> short-lived perennials (early colonizers) and long-lived perennials<br />
(late seral dominants). To capture the genetic diversity <strong>of</strong> early successional (primarily selfed)<br />
plants, seed is collected from several populations within a project area. However, with the late<br />
seral dominants (primarily outcrossed) the number <strong>of</strong> populations needed to harvest is significantly<br />
less. Early colonizing species usually have abundant and consistent seed production, effective seed<br />
dissemination, higher germination percentages, and broad tolerances <strong>of</strong> disturbed sites. Late seral<br />
dominants are found on older, less severely impacted areas. They are included in mixtures to<br />
accelerate succession, but they may not always be suited to the edaphic conditions <strong>of</strong> a severely<br />
impacted site. The production <strong>of</strong> seed and/or plants <strong>of</strong> native species at a site remote to the Parks<br />
had been found to be possible with minimal genetic drift or natural selection. With topsoil salvage<br />
and utilizing native indigenous plant material, Yellowstone and Glacier National Parks have<br />
developed very successful restoration programs.<br />
---------------------<br />
1 USDA-NRCS Plant Materials Center, Route 2, Box 1189, Bridger, Montana 59014
INTRODUCTION<br />
<strong>Revegetation</strong>, reclamation, and restoration--all imply the reestablishment <strong>of</strong> plant cover on<br />
a disturbed site, but if taken literally may imply three levels or intensities <strong>of</strong> site mitigation.<br />
‘<strong>Revegetation</strong>’ is simply the re-establishment <strong>of</strong> a plant cover, <strong>of</strong>ten a monoculture <strong>of</strong> an introduced<br />
plant species. Although relatively inexpensive, revegetation may not <strong>of</strong>fer permanence or<br />
ecological stability. ‘Reclamation’ has been defined historically as the process <strong>of</strong> returning<br />
disturbed land to a condition that approximates the original site conditions and is habitable by the<br />
same or similar plants and animals which existed on the site before disturbance (Redente et. al<br />
1994). ‘Restoration’ strives to emulate the structure, function, diversity, and dynamics <strong>of</strong> a specific<br />
ecosystem. Topsoil salvage can preserve the soil biota along with viable propagules <strong>of</strong> indigenous<br />
plant materials. By utilizing native indigenous plant material (seed, cuttings, transplants), the genetic<br />
integrity and diversity <strong>of</strong> the native plant communities will be maintained. Even with soil salvage and<br />
the use <strong>of</strong> native indigenous plant materials, restoration must not be interpreted as a discrete event,<br />
but rather as an ongoing process involving the reestablishment <strong>of</strong> nutrient cycling, plant succession,<br />
and plant community dynamics.<br />
The U.S. Department <strong>of</strong> Interior National Park Service (NPS) has adopted a policy <strong>of</strong><br />
‘restoration’ <strong>of</strong> all disturbed sites related to road construction, visitor impact, and facility<br />
maintenance. The NPS is committed to maintaining the genetic integrity <strong>of</strong> the, <strong>of</strong>ten, unique native<br />
flora, with secondary goals <strong>of</strong> erosion control, competition with exotic and noxious invasive plants,<br />
and improved overall aesthetics <strong>of</strong> disturbed sites. In 1985, with financial support from the Federal<br />
Highway Administration, both Yellowstone National Park (northwestern Wyoming) and Glacier<br />
National Park (northwestern Montana) initiated a restoration program that involved topsoil and<br />
plant salvage, native indigenous seed collection and production, plant propagation from seed and<br />
cuttings, and extensive seeding and planting <strong>of</strong> disturbed sites. A nationwide cooperative<br />
agreement between the National Park Service and the U.S. Department <strong>of</strong> Agriculture--Natural<br />
Resources Conservation Service Plant Materials Centers (PMCs) was established in 1986 to assist<br />
in the determination <strong>of</strong> which native species could be readily collected, increased, and successfully<br />
reestablished on disturbed sites. The decision by the NPS to adopt a restoration policy has<br />
generated many unanswered questions and much controversy concerning the protection and<br />
preservation <strong>of</strong> the indigenous gene pools, e.g.,<br />
+What plant species can be considered indigenous to an open disturbance in a forest<br />
community?<br />
+What constitutes the limits <strong>of</strong> a genotype? How far away from the project area can<br />
plant propagules be collected and still be within these limits?<br />
+What species can be readily collected and produced using standard agricultural<br />
techniques?<br />
+By taking seed outside <strong>of</strong> the park to a dissimilar environment to increase seed or<br />
plants, is genetic drift or natural selection going to impact the genetic integrity <strong>of</strong> the<br />
plant material?<br />
+What plant species will be compatible in mixtures and what type <strong>of</strong> plant community is<br />
an acceptable restoration goal?
SPECIES SELECTION<br />
Once the NPS made the decision to utilize native indigenous plant materials in its<br />
restoration efforts, its next decision was to determine what species would naturally colonize on<br />
open disturbances within forest communities. In Yellowstone National Park, the first road project<br />
was through lodgepole pine (Pinus contorta) habitat types, whereas in Glacier National Park, the<br />
first project was along Lake McDonald through a cedar-hemlock (Thuja plicata/Tsuga<br />
heterophylla) habitat type. It was assumed that the understory species <strong>of</strong> the adjacent forest<br />
communities would not be adapted for use on the open road corridors. By examining abandoned<br />
roads, burns, old disturbance areas (both manmade and natural) the early colonizing species were<br />
identified and by examining open parks and meadows the late seral dominants were identified.<br />
Chambers et al. (1984), working in the alpine zone <strong>of</strong> the Beartooth Mountains <strong>of</strong> South-Central<br />
Montana, found early colonizing species to have characteristics most desirable for reclamation <strong>of</strong><br />
alpine disturbances. These species exhibited an ability to establish and grow on harsh phytotoxic<br />
sites, frequently have larger ecological amplitudes, and are distributed over wide geographic areas.<br />
Harper (1977) stated that early colonizing species usually had abundant and consistent seed<br />
production, effective seed dissemination, higher germination percentages, and broad tolerance for<br />
establishment on disturbed sites. Late seral dominants, on the other hand, as defined by Johnson<br />
and Billings (1962), are found on older and less severely disturbed sites. These species are <strong>of</strong>ten<br />
included in seed mixtures to accelerate succession, but may not be completely successful because<br />
<strong>of</strong> competition from early colonizers, or simply may not be suited to the edaphic conditions <strong>of</strong> the<br />
disturbed site. Both Yellowstone and Glacier Parks are creating mixtures for each specific project<br />
that include both early colonizing and late seral dominant species (table 1). Mixtures are relatively<br />
simple, relying somewhat on existing propagules in the salvaged topsoil and seed rain from adjacent<br />
areas to compliment the seeded material.<br />
Table 1. Native plant species found to reestablish naturally on disturbed sites in Yellowstone and<br />
Glacier Parks.<br />
-----------------------------------------------------------------------------------------------------------------------<br />
-------<br />
COLONIZERS<br />
Short-lived Perennial Grasses Perennial Forbs<br />
Elymus trachycaulus slender wheatgrass Achillea millefolium western yarrow<br />
Bromus marginatus mountain brome Anaphalis margaritacea pearlyeverlasting<br />
Elymus elymoides bottlebrush squirreltail Phacelia hastata silverleaf phacelia<br />
Elymus glaucus blue wildlrye Aster integrifolius thickstem aster<br />
Solidago canadensis goldenrod<br />
Viguiera multiflora showy goldeneye<br />
LATE SERAL DOMINANTS<br />
Long-lived Perennial Grasses Perennial Forbs<br />
Poa ampla big bluegrass Lupinus argenteus silvery lupine<br />
Deschampsia cespitosa tufted hairgrass Eriogonum umbellatum sulfur eriogonum<br />
Pseudoroegneria spicata bluebunch wheatgrass Penstemon confertus<br />
yellow penstemon<br />
Festuca idahoensis Idaho fescue Geranium viscosissimum sticky geranium<br />
Poa alpina alpine bluegrass Potentilla gracilis cinquifoil
Phleum alpinum alpine timothy<br />
Agrostis scabra rough bentgrass<br />
-----------------------------------------------------------------------------------------------------------------------<br />
--------<br />
GENOTYPE DETERMINATION<br />
The genetic variability within and among plant populations vary by species as a function <strong>of</strong><br />
geographic range, reproduction mode, mating system, seed dispersal mechanism, and stage <strong>of</strong><br />
succession (Hamrick 1983). Whether a species is self-pollinating or outcrossing makes a<br />
difference in genetic variability. The selfing mode <strong>of</strong> reproduction limits the movement <strong>of</strong> alleles<br />
from one population to another, so these species are found in small disjunct populations with little<br />
variation within a population, but distinct variation among populations. Outbreeding plants have<br />
widely dispersed pollen and seed, and tend to exhibit significant variation among individuals but less<br />
variation among populations. Species with winged or plumose seeds have the greatest potential for<br />
gene movement and subsequently have less variability among populations.<br />
To capture the genetic diversity <strong>of</strong> early successional stage (primarily selfed) plants, seed<br />
would have to be sampled from several populations within a project area. However, with late seral<br />
dominants (primarily outcrossed), the number <strong>of</strong> populations that would need to be harvested is<br />
significantly less.<br />
When a disturbed site is planted with seed from an adjacent or close proximity site there is<br />
a possibility that a distinct, new genotype may develop. Jain and Bradshaw (1966) found that<br />
those species that evolve on a disturbed site may actually be genetically different than individuals <strong>of</strong><br />
the same species on adjacent undisturbed sites. Antonovics (1968) found that on harsh sites<br />
characterized by low pH and heavy metals, grass species had the ability to change from an<br />
outcrossing to a self-pollinating mode <strong>of</strong> reproduction in order to prevent dilution <strong>of</strong> the gene pool<br />
by adjacent unadapted populations. This raises the question <strong>of</strong> the need to harvest from many sites<br />
if a new distinct genotype will evolve on disturbed sites as influenced by the harshness and edaphic<br />
conditions <strong>of</strong> the site.<br />
At this point, what actually constitutes a genotype is more theory than fact. Presently,<br />
some national parks have self-imposed collection restrictions <strong>of</strong> 5 km for short-lived, self-<br />
pollinating species, 8 km for short-lived outcrossing species, and up to 16 km for long-lived<br />
outcrossing species. These distances may be smaller if there are major changes in geography and<br />
plant community types within the project area. Yellowstone Park has adhered to these collection<br />
radiuses, while Glacier Park is collecting in close proximity <strong>of</strong> the projects sites in the alpine region<br />
(Logan Pass) and the fescue grasslands (east slope <strong>of</strong> Continental Divide), but have gone outside<br />
the park to burned areas and forest clearcuts to meet the needs for colonizing species to use along<br />
road corridors through the dense Cedar\Hemlock habitat types west <strong>of</strong> the Continental Divide.<br />
SEED AND PLANT PRODUCTION
There is some question as to how much natural selection and genetic drift will occur when<br />
seed is grown at a site remote from the original source. Merrell (1981) stated that individuals<br />
developing at the same time, but under different environmental regimes, may have different<br />
phenotypes develop, even though their genotype is essentially the same. Seed production at a site<br />
remote from and dissimilar to the original collection site, has the potential for natural selection and<br />
genetic drift. There is a potential for a decrease in genetic diversity at several stages <strong>of</strong> production,<br />
i.e., the sizing nature <strong>of</strong> the cleaning process may exclude the largest and smallest seeds, harsh<br />
conditions at the time <strong>of</strong> germination and emergence may limit the survival to only the most viable<br />
seeds, as individual plants compete for space and nutrients in the seed production field some<br />
individuals may succumb to others, and during the harvesting process only those seeds that are<br />
mature at the time <strong>of</strong> harvest will be represented--early and late maturing individuals will be<br />
excluded. Samples <strong>of</strong> three generations <strong>of</strong> mountain brome were evaluated both phenotypically<br />
and genotypically by Dr. Thomas Mitchell-Olds and Dianne Pavek at the University <strong>of</strong> Montana-<br />
Missoula. The original collection (G0) was collected in the Dickie Creek drainage at the southern<br />
border <strong>of</strong> Glacier Park (1987), the second generation (G1) was produced at the Bridger PMC<br />
(1990) in a field established with G0 seed, and the third generation (G2 ) was produced at the<br />
Bridger PMC (1992) from a stand established with G1 seed. Mitchell-Olds (1993) found the<br />
phenotypic variation (comparing morphological characteristics at three common garden sites in<br />
GNP) and genotypic variation (isozyme electrophoretic analysis utilizing 25 scorable bands) was<br />
non-significant among the three generations <strong>of</strong> mountain brome. The distance coefficients (after<br />
Johnson and Wischern 1982) and the similarity coefficients (after Gottlieb 1977) indicated that<br />
there was very little difference among the original mountain brome collection and the two<br />
subsequent generations grown at the Bridger PMC. Although this data is for only one species, it<br />
supports the potential for producing native indigenous plant materials at sites remote from their<br />
source with minimum impact on the genetic integrity <strong>of</strong> the original gene pool.<br />
If commercially produced native seed is to be used in restoration projects, the planning<br />
process must allow at least three years; the first to collect seed, the second to plant and establish a<br />
seed production field, and the third to make the first seed harvest. Three to four harvests can be<br />
taken from a field before production drops to an uneconomical level. The cost <strong>of</strong> producing seed<br />
under commercial conditions varies greatly with species, size <strong>of</strong> field, yearly environmental<br />
conditions, and the timing <strong>of</strong> harvest. Seed production under cultivated conditions, however,<br />
produces a more reliable quantity and quality <strong>of</strong> seed than under natural conditions. Both<br />
Yellowstone and Glacier National Parks utilize multiple sources <strong>of</strong> plant material for their<br />
restoration projects. Salvaged plant material is either directly transplanted or potted for later use.<br />
Seed <strong>of</strong> native indigenous plants is collected for direct seeding, seeding <strong>of</strong> flats or containers, or for<br />
seed increase at the Bridger Plant Materials Center; cuttings are propagated at each Park’s own<br />
nursery facilities, and containerized material is grown at their nurseries or contracted to commercial<br />
nurseries.<br />
To date, there are only a few private growers that are attempting to grow native indigenous<br />
ecotypes under contract with the National Park Service and the U.S. Forest Service. Contracts<br />
with private growers include stipulations to guarantee genetic purity, and usually a set price and<br />
maximum/minimum amount <strong>of</strong> seed that will be purchased. Many <strong>of</strong> the native species <strong>of</strong> grasses<br />
and forbs that are under consideration for use in restoration projects have not been grown<br />
commercially—leaving questions about germination and dormancy problems, establishment<br />
techniques, cultural management, and harvest. The cost <strong>of</strong> production is dependent on the size <strong>of</strong>
the production field, difficulty in maintaining a clean pure stand, uniformity <strong>of</strong> ripening, ease <strong>of</strong><br />
harvesting, and ease <strong>of</strong> cleaning (table 2).<br />
Table 2. Average cost <strong>of</strong> production <strong>of</strong> seed production <strong>of</strong> native plants based on field size, ease<br />
<strong>of</strong> production, and ease <strong>of</strong> cleaning. Average <strong>of</strong> several Plant Materials Centers involved in<br />
National Park Restoration Projects.<br />
Ease <strong>of</strong> Production and Cleaning<br />
Easy Moderate Difficult<br />
GRASSES<br />
Small amount (0.1 acre or less) $35/lb $50/lb $100/lb<br />
Medium amount (0.1 to 0.25 acres) $25/lb $40/lb $ 75/lb<br />
Large amounts (0.25 + acres) $15/lb $30/lb $ 60/lb<br />
FORBS $50-$100/lb $100-$300/lb $300+/lb<br />
The cost <strong>of</strong> production varies drastically among different native species. Grasses such as<br />
mountain brome and slender wheatgrass are relatively easy to grow and are very productive under<br />
cultivated conditions. Species like needlegrasses and bottlebrush squirreltail are difficult to harvest<br />
and process because <strong>of</strong> awns, while some sedges, junegrass (Koeleria macrantha), and<br />
reedgrasses/hairgrasses (Calamagrostis/Deschampsia) are notoriously poor seed producers.<br />
Seed <strong>of</strong> the forbs are relatively difficult to produce because stands are <strong>of</strong>ten difficult to establish by<br />
direct seeding and control <strong>of</strong> broadleaf weeds is limited to hand rogueing and a few agricultural<br />
chemicals.<br />
The production <strong>of</strong> large quantities <strong>of</strong> seed <strong>of</strong> a few collections is far more cost-affective<br />
than the production <strong>of</strong> small quantities <strong>of</strong> several collections. More work needs to be done to<br />
determine what constitutes a genotype or how broad <strong>of</strong> an area can a specific collection be used<br />
and still protect the genetic integrity <strong>of</strong> the indigenous plant material.<br />
PLANTING AND MONITORING<br />
To maximize species diversity and compatibility, plant mixtures are designed to minimize<br />
competitive interactions. The goal <strong>of</strong> the restoration effort is to produce a plant community that is<br />
as stable as the adjacent undisturbed area, which can sustain itself while progressing through<br />
successional stages. The nature <strong>of</strong> the disturbance may place constraints on both the ability to<br />
restore the site and the subsequent success that occurs on that site (Chambers et al. 1990). To<br />
minimize competition, seed mixtures should not be too complex. With linear disturbances, in<br />
particular, seed rain from adjacent areas will provide added species diversity to a seeded plant<br />
community.
Restoration within Yellowstone and Glacier National Parks begins with the salvage <strong>of</strong><br />
topsoil. The topsoil is carefully stripped and stored in windrows along the upper edge <strong>of</strong> the road<br />
project and redistributed on the prepared cuts and fills during the same growing season. The<br />
surface is left rough and downfall logs and rock are strategically placed to create micro-niches.<br />
Most <strong>of</strong> the seeding is done by hand broadcasting, followed by hand-raking or dragging the surface<br />
to bury seed and improve seed-soil contact. Mulching with wood chips, extruded aspen fiber, or<br />
straw is done on most projects to protect against surface soil erosion and reduce soil surface drying<br />
during germination and emergence. Seed mixtures are a combination <strong>of</strong> short-lived perennials<br />
(colonizers) and long-lived perennials (late seral dominants). The seed mixtures are relatively<br />
simple, consisting <strong>of</strong> four to six grasses and three to five forbs (table 3). Shrubs and some forbs<br />
are planted as transplants, containerized material or as bareroot stock.<br />
Table 3. Basic seed mixtures developed for different vegetation types in Glacier and Yellowstone<br />
National Parks (other species are used as available).<br />
---------------------------------------------------------------------------------------------------<br />
------------<br />
GNP--Alpine<br />
GNP--Fescue Grassland<br />
GNP--Cedar\Hemlock<br />
Poa alpina*<br />
Phleum alpinum*<br />
Poa gracillima*<br />
Deschampsia atropurpurea*<br />
Carex hoodii*<br />
Aster laevis<br />
Sibbaldia procumbens<br />
Senecio triangularis<br />
Epilobium alpinum<br />
Hypericum formosum<br />
YNP--Lodgepole Pine Forest<br />
Bromus marginatus*<br />
Elymus trachycaulus*<br />
Elymus elymoides*<br />
Agrostis scabra*<br />
Poa ampla*<br />
Achillea millefolium*<br />
Lupinus sericeus*<br />
Phacelia hastata*<br />
Potentilla gracilis*<br />
Eriogonum umbellatum*<br />
Viguiera multiflora*<br />
Bromus marginatus*<br />
Pseudoroegneria spicata*<br />
Festuca idahoensis*<br />
Festuca campestris*<br />
Koeleria macrantha*<br />
Elymus trachycaulus*<br />
Gaillardia aristata*<br />
Hedysarum boreale*<br />
Geranium viscosissimum<br />
Heuchera cylindrica<br />
Potentilla gracilis*<br />
YNP--Northern Grasslands<br />
Stipa comata*<br />
Pascopyrum smithii*<br />
Leymus cinereus*<br />
Nassella viridula*<br />
Bromus anomalus*<br />
Achillea millefolium*<br />
Linum lewisii*<br />
Potentilla fruticosa<br />
Bromus marginatus*<br />
Elymus glaucus*<br />
Deschampsia cespitosa*<br />
Calamagrostis rubescens<br />
Achillea millefolium*<br />
Penstemon confertus<br />
Penstemon albertinus<br />
Aster laevis<br />
Antennaria neglecta<br />
YNP--Wetlands<br />
Deschampsia cespitosa*<br />
Agrostis scabra*<br />
Elymus trachycaulus*<br />
Pedicularis groenlandica<br />
Gentiana detonsa<br />
* Species <strong>of</strong> which seed or plants have successfully been<br />
produced at the Bridger Plant Materials Center.<br />
-----------------------------------------------------------------------------------------------------------------------<br />
--------
Monitoring is an integral part <strong>of</strong> the restoration process; providing information on the<br />
success <strong>of</strong> establishment techniques, individual species establishment and survival, species<br />
compatibility, and the long range stability <strong>of</strong> the established plant communities. Glacier National<br />
Park’s monitoring program is loosely based on the U.S. Forest Service ECODATA (Jensen et al.<br />
1992) ocular plot methodology. This technique utilizes both microplot and ocular surveys <strong>of</strong><br />
ground cover, species cover, species composition, erosion status, plant mortality, plant growth, and<br />
invasion <strong>of</strong> exotics. Both Parks utilize varying intensities <strong>of</strong> monitoring: Level I is basic<br />
documentation <strong>of</strong> ground cover and the presence <strong>of</strong> exotics (<strong>of</strong>ten used to document conditions on<br />
small backcountry projects); Level II is a general evaluation <strong>of</strong> surface status and total vegetation<br />
cover including species lists, mortality, plant density and overall plant vigor (most commonly used<br />
along road shoulders); Level III involves microplots and shrub transects to collect data suitable for<br />
statistical analysis (utilized on large obliterated turnouts and larger cut and fill slopes); and Level IV<br />
utilizes replicated plot designs to evaluate the effectiveness <strong>of</strong> various combinations <strong>of</strong> restoration<br />
treatments (seeded vs. unseeded, mulching vs. unmulched, fertilized vs. unfertilized, chemical<br />
control <strong>of</strong> weeds and exotics, nurse/cover crop alternatives).<br />
The restoration attempts in Yellowstone and Glacier National Parks have made every<br />
effort to maintain the genetic integrity <strong>of</strong> the plant material, to salvage and protect the viability <strong>of</strong> the<br />
soil biota (micro-organisms, mycorrhizae, and plant propagules), and to create stable, self-<br />
sustaining plant communities on disturbed sites. These new plant communities continue to change<br />
as some <strong>of</strong> the colonizer species give way to the late seral species and as additional species appear<br />
as a result <strong>of</strong> seed rain from adjacent sites and topsoil borne plant propagules. Research results<br />
indicate that seeding and associated mulching practices provide erosion control, but do not totally<br />
restrict the encroachment <strong>of</strong> exotics without additional weed control measures.<br />
Glacier Park has seeded the entire road-cut/fill, the barrow-ditch, and the road-edge.<br />
Much <strong>of</strong> the road-edge is periodically mowed. This mowing has had a significant impact on native<br />
species, reducing the stand density and cover. Most <strong>of</strong> the native species indigenous the higher<br />
elevations are bunchgrasses and many <strong>of</strong> the species used for restoration are short-lived perennials<br />
(pioneer-early colonizers). The bunchgrasses do not tolerate mowing and the short-lived<br />
perennials rely on seed shatter and reestablishment to maintain themselves in a plant community.<br />
Rhizomatous species would better tolerate mowing, but these species may not be indigenous to<br />
these sites.<br />
Both Parks are satisfied that the seeding and planting <strong>of</strong> native indigenous plant material on<br />
major disturbances, rather than letting nature take its course, is the proper procedure for the<br />
preservation and protection <strong>of</strong> the native gene pools.<br />
REFERENCES<br />
Antonovics, J., 1968. Evolution in closely adjacent plant populations. V. Evolution <strong>of</strong><br />
Self-Fertility. Heredity, London. 23:219-238.<br />
Chambers, J. C., R. W. Brown, and R. S. Johnston. 1984. Examination <strong>of</strong> plant<br />
successional stages in disturbed alpine ecosystems: A method <strong>of</strong> selecting<br />
revegetation species. In Colbert, T. A. and R. L. Cuany (eds) Proceedings: High
Altitude <strong>Revegetation</strong> Workshop, No. 6, Water Resources Research Institute,<br />
Colorado State University, Information Series, No. 53, pp. 215-224.<br />
Chambers, J. C., J. A. McMahon, and G. L. Wade. 1990. Difference in successional<br />
processes among biomes: Importance in obtaining and evaluating reclamation<br />
success. In J. C. Chambers and G.L. Wade (eds) Evaluating Reclamation<br />
Success: The Ecological Consideration--Proceedings <strong>of</strong> a Symposium.<br />
Charleston, West Virginia. April 23-26, 1990. USDA-Forest Service General<br />
Technical Report NE-164.<br />
Hamrick, J. L., 1983. The distribution <strong>of</strong> genetic variation within and among natural plant<br />
populations. pp. 335-348, In C. M. Schonewald-Cox, S. M. Chambers, G.<br />
MacBryde, and L. Thomas (eds), Genetics and Conservation--A reference for<br />
managing wild animals and plant populations. Benjamin Cummings Publishing<br />
Co., Inc., Menlo Park, CA.<br />
Harper, J. L. 1977. Population Biology <strong>of</strong> Plants. Academic Press, New York<br />
Jain, S. K., and A. D. Bradshaw. 1966. Evolutionary divergence among adjacent plant<br />
populations. I. The Evidence and Its Theoretical Analysis. Heredity 21: 407-441.<br />
Jensen, M.E., W. Hann, and R.E. Keane. 1992. Ecosytem Inventory and Analysis Guide.<br />
USDA Forest Service, Northern Region, Missoula, MT.<br />
Johnson, P. L., and W. D. Billings. 1962. The alpine vegetation <strong>of</strong> the Beartooth Plateau<br />
in relation to cryopedogenic processes and patterns. Ecological Monographs 32:<br />
105-135.<br />
Johnson, R. A., and D. W. Wischern. 1982. Applied Multivariate Statistical Analysis.<br />
Englewood Cliffs, MJ:Prentice Hall, Inc.<br />
Gottlieb, L. 1977. Electrophoretic evidence and applied systematics. Annals <strong>of</strong> the<br />
Missouri Botanical Garden 64: 161-180.<br />
Mitchell-Olds, T. 1993. Genetic diversity <strong>of</strong> plant species in Glacier National Park:<br />
Implications in Management. Annual Report--National Park Service Contract No.<br />
CA-1463-5-0001.<br />
Merrell, D. 1981. Ecological Genetics. University <strong>of</strong> Minnesota, Minneapolis.
2000 Billings Land Reclamation Symposium<br />
THE USE OF LOCAL ECOTYPES FOR THE REVEGETATION OF ACID/HEAVY<br />
METAL CONTAMINATED LANDS IN WESTERN MONTANA<br />
Leslie Marty 1<br />
ABSTRACT<br />
Current reclamation efforts to revegetate abandoned mine sites in western Montana rely<br />
primarily on commercial seed sources and limited native seed collection. Very few<br />
species <strong>of</strong> commercially available seeds are adapted to acid/metalliferrous soil, or to<br />
western Montana. The Development <strong>of</strong> Acid Tolerant Plant Cultivars project seeks to<br />
address this problem by selecting plant ecotypes from western Montana that demonstrate<br />
superior tolerance to acid/heavy metal soil conditions. In 1995, two initial evaluation<br />
plots were constructed on the Anaconda Smelter Superfund Site in southwestern<br />
Montana. Plant materials in this study were assembled from wildland collections on<br />
degraded sites throughout western Montana and from commercial seed sources. The<br />
plots were replicated three times in a randomized complete block design and collectively<br />
tested 95 species consisting <strong>of</strong> 51 grass, 29 forb, 14 shrub, and 1 tree species. The entries<br />
were evaluated for percent survival, vigor, height, and seedhead production. After three<br />
growing seasons, the superior performing entries were identified. The best performing<br />
collections are presently being tested in a comparative evaluation planting near Anaconda<br />
with comparisons to other accessions and cultivars <strong>of</strong> the same species. Concurrently, 13<br />
grass, 6 forb, and 7 shrub species are being grown at the Bridger Plant Material Center<br />
(BPMC) to determine cultural techniques and to increase seed. The results <strong>of</strong> the<br />
comparative evaluation planting and the success <strong>of</strong> seed production will provide valuable<br />
information for the selection <strong>of</strong> plant materials. Releases will be made through the Pre-<br />
Varietal Release process at the “Source-Identified” and “Selected” level. Foundation<br />
seed for the releases will be maintained at the BPMC for distribution through the<br />
Montana and Wyoming Crop Improvement Association to commercial seed producers.<br />
1 Deer Lodge Valley Conservation District in cooperation with the Bridger Plant Materials Center, Route 2,<br />
Box 1189, Bridger, MT 59014. (406) 662-3579.
INTRODUCTION<br />
The legacy <strong>of</strong> Montana’s mining past has left a wide range <strong>of</strong> problems and challenges<br />
for those charged with reclamation and associated activities in the next century. There<br />
are an estimated 6,000 abandoned hardrock and milling sites in Montana (Montana<br />
Department <strong>of</strong> State Lands 1994). Serious environmental and safety issues have been<br />
identified at 286 <strong>of</strong> these sites (Montana Department <strong>of</strong> State Lands 1995). Additionally,<br />
Montana has the largest Superfund site in the United States. The Upper Clark Fork Basin<br />
Superfund complex extends 225 km (140 mi) from Silver Bow Creek north <strong>of</strong> Butte to<br />
the Milltown Dam near Missoula. In the Clark Fork Basin alone, there are approximately<br />
51.8 km 2 (20 mi 2 ) <strong>of</strong> tailing ponds; more than 453.2 km 2 (175 mi 2 ) <strong>of</strong> soils and vegetation<br />
contaminated by air pollution from smelting operations; at least 77.7 km 2 (30 mi 2 ) <strong>of</strong><br />
unproductive agricultural land; over 241 km (150 mi) <strong>of</strong> contaminated river bed and<br />
riparian habitat; and millions <strong>of</strong> gallons <strong>of</strong> contaminated groundwater (Johnson and<br />
Schmidt 1988; Moore and Luoma 1990).<br />
Metal mine and mill wastes are the most difficult and highly visible reclamation<br />
problems facing land rehabilitation specialists today (Munshower 1994, Neuman et al.<br />
1993). At the Anaconda smelter site, 40 km (25 mi) northwest <strong>of</strong> Butte, copper ore<br />
milling, smelting, and refining operations took place between 1884 and 1980. Today,<br />
this 777 km 2 (300 mi 2 ) site contains large volumes <strong>of</strong> wastes, debris, and contaminated<br />
soil. Re-entrainment <strong>of</strong> these wastes continues to be a problem. Release mechanisms<br />
include air dispersion, surface water run<strong>of</strong>f, and wind erosion, resulting in secondary<br />
contaminant sources in surface and subsurface soils, sediments, surface water, and<br />
fugitive dust (CDM Federal 1997).<br />
As global populations grow, the demand for natural resources accelerates. New mining<br />
and mineral extraction technology also has spurred a resurgence in the mining industry.<br />
Such developments can create severe disturbances that potentially threaten the integrity<br />
<strong>of</strong> watersheds including water quality, wildlife habitat, aesthetic resources, and other<br />
environmental concerns. These severe disturbances <strong>of</strong>ten suspend succession and thus<br />
intensify contamination problems. The resulting loss <strong>of</strong> vegetation decreases soil<br />
stability, soil shading, organic matter, nutrient cycling, and in turn, degrades wildlife<br />
habitat.<br />
The arid and semi-arid climate prevalent in the Intermountain and Northern Great Plains<br />
region increases the time required for disturbances to rehabilitate naturally. Depending<br />
on soil conditions (rootzone characteristics), drastic disturbances may require hundreds or<br />
thousands <strong>of</strong> years to achieve functional plant communities. Hardrock minelands pose<br />
additional problems for revegetation, primarily: steep slopes; unfertile soil media (low<br />
cation exchange capacity, low water holding capacity, low organic matter); extreme<br />
moisture, temperature, and wind fluctuations; acidic soils; and heavy metal<br />
contamination. To accelerate rehabilitation, proper plant selection on these harsh sites is<br />
crucial.<br />
Although the <strong>Surface</strong> <strong>Mining</strong> Control and Reclamation Act <strong>of</strong> 1977 allows the use <strong>of</strong><br />
introduced species, State and Federal regulatory agencies recognizing the importance <strong>of</strong><br />
adaptation and biological diversity, frequently require the re-establishment <strong>of</strong> a
permanent vegetative cover <strong>of</strong> the same variety native to the area (Roundy et al. 1997).<br />
Scientists contend it is essential that indigenous native plant species be selected that are<br />
evolutionary products <strong>of</strong> that environment. Native indigenous species have a long history<br />
<strong>of</strong> genetic sorting and natural selection by the local environment. Over the long-term,<br />
these plants are <strong>of</strong>ten better able to survive, grow and reproduce under the environmental<br />
extremes <strong>of</strong> the local area than introduced plants originating in other environments<br />
(Brown 1997, Munshower 1994).<br />
The utilization <strong>of</strong> tolerant races, even on amended or topsoiled sites, is suggested because<br />
the subsoil is <strong>of</strong>ten a major portion <strong>of</strong> the rootzone materials. Species exhibiting<br />
acid/heavy metal tolerances may also reduce the need for lime and are a precaution<br />
against poor mixing <strong>of</strong> amendments with acidic wastes. Populations <strong>of</strong> acid and metaltolerant<br />
vegetation have been successfully selected, propagated and established on<br />
abandoned mine sites in Europe and Africa. Tolerant populations have been identified in<br />
North America but none have been propagated for seed production.<br />
Improving the metal tolerance <strong>of</strong> plants is <strong>of</strong> interest to scientists internationally. Many<br />
papers have recently been published on developing transgenic metal tolerance (Hasegawa<br />
et al. 1997, Manual de la Fuente et al. 1997, Vatamaniuk et al. 1999). However, the<br />
biology is complex, poorly understood, and the technology needed to transfer genes to<br />
wildland plants is not well developed. Ethical and biological questions related to<br />
releasing genetically engineered organisms into the environment are also pertinent.<br />
Traditional plant breeding (plant selection) seems to be the best approach at present.<br />
Except when extensive amelioration has been employed, reclamation efforts on hardrock<br />
minelands in western Montana have met with limited success. At the Anaconda<br />
Superfund Site, for example, the region’s plant cover and diversity remains low although<br />
revegetation efforts began in the 1940s (RRU 1993). The majority <strong>of</strong> native seed<br />
currently being used on metal mine reclamation projects in Montana were developed for<br />
coal strip-mine reclamation and range renovation in the dry, saline soils <strong>of</strong> eastern<br />
Montana. The few cultivars adapted to western Montana, where the bulk <strong>of</strong> reclamation<br />
occurs, were not selected for acid or heavy metal tolerance. The Development <strong>of</strong><br />
Acid/Heavy Metal-Tolerant Cultivars (DATC) project seeks to identify, select and<br />
release naturally occurring acid/heavy metal-tolerant plant ecotypes desirable for<br />
reclamation and commercial seed production.<br />
The project objective is to develop plants for use on lands where ameliorative and<br />
adaptive revegetation methods are implemented. In an agricultural approach the<br />
contaminated soil media is removed and replaced with hauled topsoil and typically<br />
planted using highly productive exotic species. The ameliorative/adaptive approach, in<br />
contrast, involves amending/shaping the soil in-situ, and identifying, specifying, and<br />
establishing plants that are ecotypically differentiated, or adapted, and tolerant <strong>of</strong> the site<br />
conditions. Although, this approach has been used in Europe since the 1960s, its use in<br />
the United States is relatively new (Morrey 1996). The ameliorative/adaptive<br />
reclamation method may be the preferred approach in the future due to diminishing<br />
economical topsoil resources, and available land for repositories. This approach also<br />
addresses concerns regarding biodiversity, self-sustaining plant communities, and the<br />
need for an alternative method on steep slopes.
METHODS AND MATERIALS<br />
The project design is based on the assumption that the best plants for acid/heavy metal<br />
contaminated soils would be those found growing at such sites. Plants that are able to<br />
survive in nutrient poor, acidic rooting media contaminated with heavy metals such as<br />
copper, zinc, lead, cadmium, and arsenic are thought to possess inheritable genetic traits<br />
for tolerance to those conditions. This assumption is based on numerous studies. Jain et<br />
al. (1966) documented the existence <strong>of</strong> localized races or ecotypes each adapted to the<br />
particular environment conditions <strong>of</strong> its habitat. The study concluded that distances as<br />
low as 1-2 meters are sufficient to permit populations <strong>of</strong> certain species occupying<br />
contrasting habitats to become very distinct from one another. Bradshaw et al. 1965<br />
found that Agrostis tenuis, a common perennial grass in temperate climates, evolved<br />
unique populations in old mine workings that exhibited tolerances to various heavy<br />
metals. Furthermore, these tolerances were not lost in cultivation in the absence <strong>of</strong> the<br />
metal, and were heritable. Surbrugg (1982) reported two cool season grass species<br />
growing on copper tailings at Anaconda that possessed tolerances to elevated levels <strong>of</strong><br />
copper and zinc. Chambers et al. (1984) working in the Beartooth Mountains <strong>of</strong><br />
southcentral Montana found that species colonizing severe disturbances exhibited an<br />
ability to establish on phytotoxic sites. Additionally, there is evidence that metal tolerant<br />
strains tend to be more drought tolerant and translocate fewer contaminates to their aerial<br />
portions than non-tolerant plants (Smith and Bradshaw 1972).<br />
The process <strong>of</strong> developing plants for mineland revegetation encompasses a number <strong>of</strong><br />
stages: 1) seed/plant collection from affected sites and assemblage <strong>of</strong> commercially<br />
available plant material, 2) initial evaluation <strong>of</strong> assembled germplasm, 3) secondary<br />
large-scale seed collection <strong>of</strong> better performing germplasm, 4) seed increase <strong>of</strong> superior<br />
collections, 5) field testing <strong>of</strong> superior germplasm, and 6) release <strong>of</strong> foundation quality<br />
seed to commercial seed producers. The project has concentrated on collecting and<br />
testing plant materials at the Anaconda Smelter Superfund site because <strong>of</strong> the extent <strong>of</strong><br />
contamination, elevation, varied terrain, and cool, semi-arid climate.<br />
Initial Evaluation Planting<br />
The project was initiated in 1995 with 124 collections made at 26 mine impacted sites<br />
throughout western Montana. Seed and occasionally plants were collected from a range<br />
<strong>of</strong> elevations, precipitation zones, aspects, contamination types and concentrations, soil<br />
and plant community types. In addition, released cultivars and other commercially<br />
available plant materials were assembled. Three initial evaluation plantings (IEPs) were<br />
established - one plot near East Helena and two plots near Anaconda, Montana. The<br />
plots collectively tested 95 species (220 accessions). Only data from the Anaconda sites<br />
(Site 1 and Site 2) are presented, however, due to subsequent burial <strong>of</strong> the East Helena<br />
plot.<br />
The soil at Site 1, located near the junction <strong>of</strong> Highways 1 and 48, has been impacted by<br />
aerial fallout from smelter emissions and the ongoing re-deposition <strong>of</strong> exposed hazardous<br />
substances. The site was sparsely vegetated and mostly devoid <strong>of</strong> topsoil due to severe
wind and water erosion. Prior to plowing, the site had an average pH <strong>of</strong> 5.5. The plot<br />
site was deep plowed, cultivated with sweeps, and roller packed. After plowing, the pH<br />
increased due to a calcareous layer in the top 30 cm (1 ft) <strong>of</strong> the soil pr<strong>of</strong>ile. Composite<br />
samples from the top 25.4 cm (0.83 ft) <strong>of</strong> the pr<strong>of</strong>iles indicated levels <strong>of</strong> cadmium,<br />
copper and zinc that exceeded the upper limits for phytotoxicity established by the EPA.<br />
The surface soil samples had metal concentrations several times greater in magnitude<br />
than the composite samples. <strong>Surface</strong> water run<strong>of</strong>f during storm events, soil crusting and<br />
stoniness were other factors observed at the site.<br />
Site 2 is located on the Opportunity Ponds about 3 km (2 mi) northeast <strong>of</strong> Site 1. The<br />
Opportunity Ponds were used as a disposal site for mill tailings. During active disposal<br />
<strong>of</strong> smelter wastes, a portion <strong>of</strong> the ponds was covered with water, but has since been<br />
allowed to dewater. Very high levels <strong>of</strong> copper, lead, and zinc, in combination with<br />
extremely poor fertility, low pH and organic matter characterize Site 2. The site was<br />
devoid <strong>of</strong> vegetation except for sparse patches <strong>of</strong> Agrostis gigantea. The average pH<br />
prior to plowing was 3.0. Quick lime was incorporated at this site at three different rates:<br />
0, 11, and 22 metric tons per ha (0, 30, and 60 tons per ac). The composite soil samples<br />
at the site contained extremely high levels <strong>of</strong> cadmium, copper and zinc. One sample<br />
contained cadmium concentrations 21 times, copper 53 times, and zinc 266 times greater<br />
than the upper limits established for phytotoxicity. Other growth factors include a hard<br />
surface crust, high winds and subsequent particle movement that can sand blast, bury, and<br />
defoliate plants. The site’s total exposure to incoming solar radiation and associated high<br />
ground surface temperatures and reflectance also influences plant growth.<br />
The sites were planted with a push type, single-row, belt seeder in rows 9 m (30 ft) long,<br />
with 0.45 m (1.5 ft) row spacing, approximately 1 cm (0.5 in) deep. Both sites were a<br />
randomized complete block design replicated 3 times. Of the 220 entries tested, 80 were<br />
released cultivars and 140 were wildland collections or common sources. Distribution <strong>of</strong><br />
cultivar lifeforms was 59 grasses, 18 forbs, and 3 shrubs. Distribution <strong>of</strong> wildland<br />
collections and common sources was 69 grasses, 26 forbs, 35 shrubs, and 8 trees.<br />
Comparative Evaluation Planting<br />
A Comparative Evaluation Planting (CEP) was installed to test the wildland plant<br />
material that performed well in the IEP. The CEP is located on the Willow Glenn Road,<br />
approximately 3 km (2 mi) east <strong>of</strong> Anaconda. Soil contamination in this area is<br />
concentrated in the upper few centimeters <strong>of</strong> the pr<strong>of</strong>ile and is the result <strong>of</strong> past stack<br />
emission fallout and the ongoing re-deposition <strong>of</strong> fugitive dust. The plot site is<br />
approximately 0.2 ha (0.5 acres) and had an average pH <strong>of</strong> 4.5 [0-15 cm (0-6 in)<br />
composite samples] after tillage to a depth <strong>of</strong> 15 cm (6 in). Most soil samples contained<br />
arsenic and copper concentrations exceeding EPAs upper range for phytotoxicity. Some<br />
samples had phytotoxic levels <strong>of</strong> zinc.<br />
The CEP is testing multiple accessions <strong>of</strong> 6 forb species, 13 grass species and 6<br />
forb/grass mixes. The plot contains 84 entries in a randomized complete block design,<br />
replicated 4 times. The entries were planted in May 1999, using a single row, push-type
elt seeder based on a seeding rate <strong>of</strong> 82 PLS per m (25 PLS per ft). During the<br />
unusually dry growing season <strong>of</strong> 1999, the CEP was evaluated twice.<br />
RESULTS AND DISCUSSION<br />
Initial Evaluation Planting<br />
The IEP plots have been evaluated annually since 1996 for height, integrated vigor<br />
(incorporates assessment <strong>of</strong> leafiness, basal area, tillering, and color), and percent<br />
stand/survival. The results are from 1999 at Site 1 and 1998 at Site 2, the fourth and third<br />
growing seasons, respectively. The entries were ranked using the scores for vigor and<br />
percent stand weighted equally. The top performing entries (up to the fifteenth rank if<br />
applicable) from each lifeform from Site 1 and Site 2 are listed below in tables 1 and 2.<br />
None <strong>of</strong> the forbs, trees or shrubs planted at Site 2 survived. At both sites potted woody<br />
material was transplanted in early July during particularly hot weather. Transplant timing<br />
may have contributed to the mortality <strong>of</strong> the woody material at Site 2. The more<br />
sheltered position <strong>of</strong> Site 1 may have enabled the woody material to survive there.<br />
Leymus racemosus ND-691, which performed the best at Site 2, was not included in the<br />
entries at Site 1. Second ranking, Leymus racemosus ‘Volga’ ranked in the middle <strong>of</strong> the<br />
field at Site 1. Pseudoroegneria ssp. inermis ‘Whitmar’ performed very well at both<br />
sites. Other grasses that performed well at both sites include Elymus lanceolatus<br />
‘Sodar’, Elymus lanceolatus ssp. lanceolatus ‘Schwendimar’, Pseudoroegneria spicata<br />
ssp. spicata ‘Goldar’, Leymus angustus ‘Prairieland’, and Pascopyrum smithii ‘Rosana’.<br />
Deschampsia cespitosa performed well at both sites although the two high ranking entries<br />
were different accessions. Both accessions outperformed Deschampsia cespitosa ‘Peru<br />
Creek’, a released cultivar. Elytrigia repens X Pseudoroegneria spicata ‘Newhy’ was a<br />
top performer at Site 2 and also performed fairly well at Site 1, although not a top<br />
performer. Poa alpina 9016273 and Festuca rubra ‘Penlawn’ that were top performers at<br />
Site 2 did not fare well at Site 1.
Table 1. Anaconda Initial Evaluation Planting Site 1 Top Performing Species.<br />
LIFEFORM SPECIES<br />
ACCESSION/<br />
CULTIVAR<br />
RANK ORIGIN<br />
Forb Potentilla hippiana 9076289 1 Native<br />
Forb Epilobium angustifolium 9076267 2 Native<br />
Forb Penstemon strictus Bandera 3 Native<br />
Forb Heuchera parviflora 9076279 4 Native<br />
Forb Coronilla varia Chemung 4 Introduced<br />
Forb Lotus corniculatus Kalo 5 Introduced<br />
Forb Sphaeralcea coccinea 9076283 6 Native<br />
Forb Dalea purpurea Keneb 7 Native<br />
Forb Lotus corniculatus Norcen 7 Introduced<br />
Forb Aster chilensis 9078675 8 Native<br />
Forb Medicago sativa Spredor-3 8 Introduced<br />
Forb Phacelia hastata 9058019 9 Native<br />
Forb Lathyrus sylvestris Lathco 10 Introduced<br />
Grass Pseudoroegneria spicata ssp. spicata Secar 1 Native<br />
Grass Pseudoroegneria spicata ssp. inermis Whitmar 2 Native<br />
Grass Psathyrostachys juncea Bozoisky-Select 3 Introduced<br />
Grass Elymus lanceolatus Sodar 4 Native<br />
Grass Deschampsia cespitosa 9076290 5 Native<br />
Grass Psathyrostachys juncea Mankota 6 Introduced<br />
Grass Leymus cinereus Magnar 7 Native<br />
Grass Leymus cinereus Trailhead 8 Native<br />
Grass Elymus lanceolatus ssp. lanceolatus Schwendimar 9 Native<br />
Grass Pseudoroegneria spicata ssp. spicata Goldar 10 Native<br />
Grass Elymus trachycaulus ssp. trachycaulus Pryor 11 Native<br />
Grass Pascopyrum smithii Rodan 12 Native<br />
Grass Elymus elymoides 9040189 13 Native<br />
Grass Leymus angustus Prairieland 14 Native<br />
Grass Pascopyrum smithii Rosana 15 Native<br />
Shrub Salix alba 9078386 1 Introduced<br />
Shrub Rosa woodsii 9078385 2 Native<br />
Shrub Lonicera spp. 9081306 3 Native<br />
Shrub Artemisia longifolia 9076289 4 Native<br />
Shrub Caragana spp. 9078379 5 Introduced<br />
Shrub Symphoricarpos albus 9078388 6 Native<br />
Shrub Shepherdia argentea 9081334 7 Native<br />
Shrub Atriplex canescens Rincon 8 Native<br />
Shrub Rhus trilobata Bighorn 9 Native<br />
Shrub Atriplex X aptera Wytana 10 Native<br />
Tree Populus deltoides ssp. monilifera 9078382 1 Native
Table 2. Anaconda Initial Evaluation Planting Site 2 Top Performing Species.<br />
LIFEFORM SPECIES<br />
ACCESSION/<br />
CULIVAR<br />
RANK ORIGIN<br />
Grass Leymus racemosus ND-691 1 Introduced<br />
Grass Leymus racemosus Volga 2 Introduced<br />
Grass Pseudoroegneria spicata ssp. inermis Whitmar 3 Native<br />
Grass Poa alpina 9016273 4 Native<br />
Grass Festuca rubra Pennlawn 5 Introduced<br />
Grass Leymus arenarius ND-2100 6 Introduced<br />
Grass Elytrigia repens X Pseudoroegneria spicata Newhy 7 Native<br />
Grass Leymus angustus Prairieland 8 Unknown<br />
Grass Deschampsia cespitosa 9076280 9 Native<br />
Grass Elymus lanceolatus ssp. lanceolatus Critana 10 Native<br />
Grass Pseudoroegneria spicata ssp. spicata Goldar 11 Native<br />
Grass Elymus lanceolatus ssp. lanceolatus Schwendimar 12 Native<br />
Grass Pascopyrum smithii Rosana 13 Native<br />
Grass Elymus lanceolatus Sodar 14 Native<br />
Grass Poa secunda Canbar 15 Native<br />
At both sites, cultivars, both native and introduced, overwhelmingly outperformed<br />
wildland collections. This may be due to the higher pure live seed (PLS) content <strong>of</strong> the<br />
cultivar seed. The wildland seed was not tested for viability or purity. All seed was<br />
sown at 25 PLS per ft when PLS was known. When unknown, the seed was sown at 25<br />
seeds per foot. This variance may account for the seemingly superior performance <strong>of</strong><br />
cultivars.<br />
In general, grasses seemed to outperform forb, shrub and tree lifeforms. The wildryes<br />
and wheatgrasses, known for their drought tolerance, were the best performing grasses.<br />
Many <strong>of</strong> the best performing forbs were legumes and many also pioneering species<br />
Comparative Evaluation Planting<br />
The emergence rates in the CEP was extremely low. Less than half (42%) the entries<br />
emerged. The highest emergence rate was 15.7% for Oryzopsis hymenoides ‘Nezpar’. A<br />
month later seedling survival had declined greatly and only 9% <strong>of</strong> the entries (table 3)<br />
contained live seedlings. In early November, the CEP was replanted in hopes that a more<br />
favorable growing season would result in better plant establishment. The pH <strong>of</strong> the site<br />
may prove to be too acidic for plant establishment unless plowed to a greater depth<br />
and/or amended.
Table 3. Anaconda Comparative Evaluation Planting Results. Planted May, 1999.<br />
LIFEFORM SPECIES ACCESSION/CULTIVAR % SURVIVAL<br />
Grass Elymus trachycaulus 9081620 0.33<br />
Grass Elymus trachycaulus Pryor 0.33<br />
Grass Oryzopsis hymenoides Nezpar 0.33<br />
Grass Psuedorogeneria spicata Secar 0.33<br />
Grass/Forb Cultivated Plains Seed Mix 0.17<br />
Grass Agrostis gigantea 9076266 0.05<br />
Grass Agrostis gigantea 9076276 0.05<br />
Seed Increase<br />
Seed increase <strong>of</strong> the promising collections has been initiated at the USDA NRCS Plant<br />
Materials Center at Bridger, Montana. The objective <strong>of</strong> seed production is to provide<br />
foundation seed and cultural information to commercial growers. Currently, there are<br />
approximately 1.4 ha (3.5 ac) <strong>of</strong> promising acid/heavy metal-tolerant plant materials in<br />
seed increase including 6 forb species, 13 grass species and 7 shrub species (table 4).<br />
Some <strong>of</strong> these native species have not previously been cultivated.<br />
Table 4. Ecotypes in Production at the Bridger Plant Materials Center<br />
LIFEFORM SPECIES COMMON NAME ELEVATION* ORIGIN<br />
Forb Aster chilensis creeping aster foothills to subalpine Native<br />
Forb Heuchera parviflora littleflower alumroot montane to alpine Native<br />
Forb Penstemon eriantherus fuzzy-tongued penstemon plains to montane Native<br />
Forb Phacelia hastata silverleaf phacelia plains to alpine Native<br />
Forb Potentilla hippiana woolly cinquefoil Foothills Native<br />
Forb Sphaeralcea coccinea scarlet globemallow plains to montane Native<br />
Grass Agrostis gigantea redtop plains to montane Introduced<br />
Grass Carex paysonis Payson’s sedge foothills to alpine Native<br />
Grass Deschampsia cespitosa tufted hairgrass foothills to alpine Native<br />
Grass Elymus trachycaulus slender wheatgrass plains to alpine Native<br />
Grass Juncus balticus Baltic rush plains to subalpine Native<br />
Grass Leymus cinereus basin wildrye plains to montane Native<br />
Grass Oryzopsis hymenoides Indian ricegrass plains to foothills Native<br />
Grass Pascopyrum smithii western wheatgrass plains to subalpine Native<br />
Grass Poa alpina alpine bluegrass subalpine to alpine Native<br />
Grass Poa ampla big bluegrass plains to montane Native<br />
Grass Poa compressa Canada bluegrass plains to montane Naturalized<br />
Grass Poa species bluegrass species foothills Native<br />
Grass Pseudoroegneria spicata bluebunch wheatgrass plains to foothills Native<br />
Shrub Juniperus horizontalis creeping juniper plains to subalpine Native<br />
Shrub Purshia tridentata antelope bitterbrush plains to foothills Native<br />
Shrub Rosa woodsii Prairie rose plains to subalpine Native<br />
Shrub Shepherdia argentea silver buffaloberry plains to foothills Native<br />
Shrub Symphoricarpos albus common snowberry plains to subalpine Native<br />
Shrub Symphoricarpos occidentalis western snowberry foothills to montane Native<br />
Shrub Ribes species currant species foothills to alpine Native<br />
* Kershaw et al. 1998
Planting begins with seedbed preparation that includes the isolation <strong>of</strong> accessions <strong>of</strong> the<br />
same or similar species to protect the genetic integrity <strong>of</strong> the accessions. Seed production<br />
fields are commonly established by seeding 1 m (3 ft) rows at 90 PLS per m (30 PLS per<br />
ft). Many <strong>of</strong> the forb and woody species require pre-treatments to break dormancy. In<br />
some cases, hard seeded species can be dormant fall planted without pretreatment. In the<br />
establishment year, weed control is difficult due to the generally slow establishment <strong>of</strong><br />
native species. Weeds are controlled by timely mowing, tilling, and spraying with<br />
herbicides formulated for seedlings. Fields are fall fertilized to insure the slow release <strong>of</strong><br />
nutrients and to initiate development <strong>of</strong> seedhead primordia.<br />
Seed production usually begins in the second growing season. Many native grass species<br />
can be combine harvested. The forbs are <strong>of</strong>ten harvested using a swather equipped with a<br />
canvas catch basin. The woody species are usually hand stripped. To optimize seed<br />
yields, the harvested plant material is <strong>of</strong>ten left to afterripen and dry on tarps for 1-2<br />
weeks. Specialized equipment is then utilized to clean the seed. Cleaning methods vary<br />
depending on the type, size, shape, and amount <strong>of</strong> debris in each harvest. Most<br />
commonly, the plant material is processed by running it through a hammermill, which<br />
liberates the seed by flailing the material. Next, the material is run over a seed mill<br />
which uses wind and vibrating screens to further separate the good seed from the chaff.<br />
The end product <strong>of</strong> the project will be the release <strong>of</strong> indigenous, native plant materials<br />
that demonstrate superior tolerance to acidic conditions and heavy metal contamination.<br />
In addition, the plant material chosen for release will consider the following criteria:<br />
commercial production potential, heavy metal uptake in aerial plant tissues, and the<br />
ability to add to the ecosystem’s resilience by initiating and/or accelerating the process <strong>of</strong><br />
succession. Releases will be made through the Pre-Varietal Release certification process<br />
at the “Selected” and “Source-Identified” levels. The foundation seed will be maintained<br />
at the BPMC and distributed to commercial seed producers through the Montana and<br />
Wyoming Crop Improvement Association. Each release will have a companion Planting<br />
Guide that provides information such as plant adaptation, uses, compatibility, growing<br />
techniques, etc. Plant releases are anticipated to begin in 2001.
CONCLUSION<br />
The results <strong>of</strong> the IEP suggest that there are a number <strong>of</strong> species that have not been<br />
released for revegetation purposes but have reclamation potential. These species include<br />
Aster chilensis, Epilobium angustifolium, Heuchera parviflora, Potentilla hippiana,<br />
Sphaeralcea coccinea, Artemisia longifolia, Populus deltoides ssp. monilifera, Rosa<br />
woodsii, Symphoricarpos albus, and Symphoricarpos occidentalis. Many <strong>of</strong> the cultivars<br />
that performed well originated from other regions. New ecotypic releases <strong>of</strong> these<br />
species may be <strong>of</strong> value. Deschampsis cespitosa Peru Creek, for example, is a cultivar<br />
originating from Colorado, however, at the IEP two collections from mine affected sites<br />
in western Montana outperformed Peru Creek. Some species that merit further<br />
investigation include Deschampsia cespitosa, Elymus lanceolatus, Elymus trachycaulus,<br />
Leymus cinereus, Pascopyrum smithii, Poa alpina and Pseudoroegneria spicata.<br />
Many cultivars on the market performed well. The outstanding forb cultivars included<br />
Penstemon strictus ‘Bandera’, Coronilla varia ‘Chemung’ and Lotus corniculatus ‘Kalo’.<br />
The outstanding grass cultivars include Pseudoroegneria spicata ssp. inermis Whitmar,<br />
Elymus lanceolatus Sodar, Elymus lanceolatus ssp. lanceolatus Schwendimar, and<br />
Pseudoroegneria spicata ssp. spicata Goldar. Although only a small sampling <strong>of</strong> shrub<br />
cultivars were tested, the best performers were Atriplex canescens ‘Rincon’, Rhus<br />
trilobata ‘Bighorn’ and Atriplex X aptera ‘Wytana’.<br />
Information on the performance <strong>of</strong> the entries at the CEP is forthcoming. Until more data<br />
from the CEP is collected it is impossible to make any conclusions on the performance <strong>of</strong><br />
local ecotypes versus broadly adapted cultivars. The success <strong>of</strong> seed increase efforts at<br />
the BPMC will also help determine the potential <strong>of</strong> future releases.
REFERENCES<br />
Bradshaw, A.D.; McNeilly, T.S.; Gregory, R.P.G. 1965. Industrialization, evolution and<br />
the development <strong>of</strong> heavy metal tolerance in plants. British Ecological Society<br />
Symposium 6: 327-343.<br />
Brown, R.W.; Amacher, M.C. 1997. Selecting plant species for ecological restoration: a<br />
perspective for land managers. <strong>Revegetation</strong> with native species, pp.1-16 In:<br />
Proceedings, 1997 Society for Ecological Restoration Annual Meeting. U.S.D.A. Forest<br />
Service Rocky Mountain Research Station. Proceedings RMRS-P-8.<br />
CDM Federal. 1997. Final baseline ecological risk assessment. Anaconda regional<br />
water, waste, and soil operable unit; Anaconda Smelter NPL Site, Anaconda, Montana,<br />
Vol. 1. Prepared for EPA, Region VIII, Montana <strong>Office</strong>. (October).<br />
Chambers, J.C.; Brown, R.W.; Johnston, R.S. 1984. Examination <strong>of</strong> plant successional<br />
stages in disturbed alpine ecosystems: a method <strong>of</strong> selecting revegetation species. In:<br />
Proceedings: High Altitude <strong>Revegetation</strong> Workshop. No. 6 Information Series: 215-224.<br />
Hasegawa, I.; Terada, E.; Sunairi, M.; Walota, H.; Shinmachi, F.; Noguchi, A.;<br />
Nakajima, M.; Yazaki, J. 1997. Genetic improvement <strong>of</strong> heavy metal tolerance in plants<br />
by transfer <strong>of</strong> the yeast metallothionein gene (CUP1). In: Plant and Soil 196: 277-281.<br />
Jain, S.K.; Bradshaw, A.D. 1966. Evolutionary divergence among adjacent plant<br />
populations. Heredity, 21: 407-441.<br />
Johnson, H.E.; Schmidt, C.L. 1988. Clark Fork Basin Project: status report and action<br />
plan. Prepared for the <strong>Office</strong> <strong>of</strong> the Governor, Helena, MT.<br />
Kershaw, L; MacKinnon, A; Pojar, J. 1998. Plants <strong>of</strong> the Rocky Mountains. Lone Pine<br />
Publishing. 384 p.<br />
Manual de la Fuente, J.; Ramires-Redriguez, V.; Cabrera-Ponce, J.L.; Herrera-Estrella, L.<br />
1997. Aluminum tolerance in transgenic plants by alteration <strong>of</strong> citrate synthesis. Science<br />
Magazine Vol. 276 June 6, 1997:1566-1568.<br />
Montana Department <strong>of</strong> State Lands, Abandoned Mine Reclamation Bureau. 1994. 1994<br />
Summary report. (December).<br />
Montana Department <strong>of</strong> State Lands, Abandoned Mine Reclamation Bureau. 1995. 1995<br />
Summary report.<br />
Moore, J.N.; Luoma, S. N. 1990. Hazardous waste from large-scale metal extraction:<br />
The Clark Fork Waste Complex, Montana. Prepared by the University <strong>of</strong> Montana,<br />
Missoula, MT, and the U.S. Geological Survey. 34 p.<br />
Morrey, D. 1996. Vegetation on Barren <strong>Mining</strong> Land. Land and Water: 41-44.
Munshower, F.F. 1994. Practical handbook <strong>of</strong> disturbed land revegetation. CRC Press,<br />
Inc. 265 p.<br />
Neuman, D.R.; Munshower, F. F.; and Dollhopf, D. J. 1993. <strong>Revegetation</strong> <strong>of</strong> mining<br />
wastes in Montana. Montana AgReseach Vol.1, Issue 1: 3-7.<br />
Reclamation Research Unit (RRU). 1993. Arts Phase I Report. Anaconda <strong>Revegetation</strong><br />
Treatability Studies Phase I: Literature Review, Reclamation Assessments, And<br />
Demonstration Site Selection. 28 P. Document No.: Asss-Arts-I-Fr-R1-102293.<br />
Roundy, B.A.; Shaw, N.L.; Booth, D.T. 1997. Lessons from historical rangeland<br />
revegetation for today’s restoration:1-8. In Proceedings: Using Seeds <strong>of</strong> Native Species<br />
on Rangelands. Society <strong>of</strong> Range Management 50 th Annual Meeting. U.S.D.A. Forest<br />
Service Intermountain Research Station. General Tech. Report INT-GTR-372.<br />
Smith R. A. H.; Bradshaw, A. D. 1972. Stabilization <strong>of</strong> toxic mine wastes by the use <strong>of</strong><br />
tolerant plant populations. Trans. Inst. Min. Metall. 81 (A): 230-237.<br />
Surbrugg, J.E. 1982. Copper and zinc tolerance in two Montana grass species growing<br />
on copper mill tailings. Montana State University master’s thesis.<br />
Vatamaniuk, O.K.; Mari, S.; Lu, Y.; Rea, P. 1999. AtPCS1, phytochelatin synthase from<br />
Arabidopsis: isolation and in vitro reconstitution. In: Proceedings <strong>of</strong> the National<br />
Academy <strong>of</strong> Science, Vol. 96, June, 1999: 7110-7115.