Highs & Lows Stocks & Storage Biotech Varieties Floriculture ...
Highs & Lows Stocks & Storage Biotech Varieties Floriculture ...
Highs & Lows Stocks & Storage Biotech Varieties Floriculture ...

You also want an ePaper? Increase the reach of your titles
YUMPU automatically turns print PDFs into web optimized ePapers that Google loves.
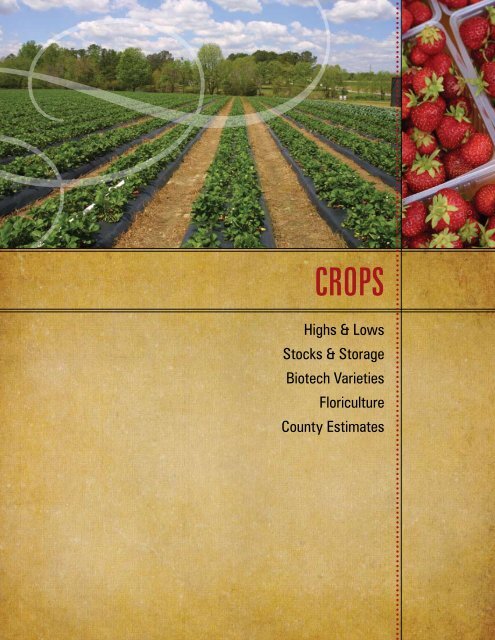
CROPS<br />
<strong>Highs</strong> & <strong>Lows</strong><br />
<strong>Stocks</strong> & <strong>Storage</strong><br />
<strong>Biotech</strong> <strong>Varieties</strong><br />
<strong>Floriculture</strong><br />
County Estimates<br />
North Carolina Agricultural Statistics 57
Crops<br />
58 North Carolina Agricultural Statistics<br />
USUAL PLANTING AND HARVESTING DATES<br />
Usual Planting Dates Usual Harvest Dates<br />
Begin Most Active End Begin Most Active End<br />
Field Crops:<br />
Barley: Grain Sep 25 Oct 15-Nov 10 Dec 01 May 25 Jun 10-Jun 30 Jul 25<br />
Corn: Grain Apr 01 Apr 10-Apr 25 May 20 Aug 20 Sep 10-Oct 10 Oct 10<br />
Silage Apr 01 Apr 10-Apr 25 May 20 Aug 01 Aug 20-Sep 20 Oct 20<br />
Cotton Apr 20 May 01-May 20 Jun 10 Sep 30 Oct 10-Nov 15 Dec 15<br />
Hay: Alfalfa Apr. 30 - Nov 15<br />
Other Apr. 30 - Nov 15<br />
Irish Potatoes Mar 05 Mar 10-Apr 10 Apr 30 Jun 10 Jun 25-Jul 15 Aug 10<br />
Oats: Grain Sep 15 Oct 15-Nov 25 Dec 10 May 30 Jun 10-Jun 30 Jul. 25<br />
Peanuts Apr 30 May 10-May 30 Jun 01 Sep 25 Oct 10-Oct 30 Nov 15<br />
Sorghum: Grain May 05 May 25-Jun 15 Jul 15 Aug 15 Oct 01-Oct 20 Nov 25<br />
Silage May 01 May 10-Jun 10 Jul 05 Jul 25 Aug 10-Sep 15 Oct 01<br />
Soybeans May 01 May 20-Jun 30 Jul 20 Oct 10 Nov 10-Dec 05 Dec 20<br />
Sweet Potatoes May 05 May 20-Jun 15 Jul 15 Sep 01 Sep 25-Nov 05 Nov 20<br />
Tobacco: Burley May 15 May 20-Jun 10 Jun 30 Aug 20 Sep 01-Sep 20 Oct 15<br />
Flue-cured Apr 15 Apr 20-May 25 Jun 05 Jul 01 Jul 20-Sep 15 Oct 10<br />
Wheat: Grain Sep 20 Oct 15-Nov 20 Dec 20 May 30 Jun 10-Jun 30 Jul 25<br />
Vegetables:<br />
Cabbage: Spring Jan 01 Feb 05-Mar 01 Mar 20 Apr 20 May 10-Jun 15 Jun 30<br />
Summer Mar 20 Mar 25-Apr 05 Apr 15 Jun 10 Jul 15-Oct 15 Oct 30<br />
Fall Jul 15 Jul 20-Aug 05 Aug 10 Oct 10 Oct 15-Dec30 Jan 30<br />
Cucumbers: Fresh Market Spring Mar 25 Apr 01-May 01 May 05 Jun 01 Jun 01-Jun 30 Jul 05<br />
Fresh Market Summer Apr 25 May 01-May 15 May 20 Jun 01 Jun 01-Jul 30 Oct 20<br />
Cucumbers: Processing Spring Mar 25 Apr 01-May 15 May 20 Jun 01 Jun 10-Jul 30 Jul 25<br />
Processing Summer Jul 10 Jul 15-Sep 01 Sep 05 Jul 01 Oct 01-Oct 15 Oct 30<br />
Peppers: Bell Apr 01 Apr 10-May 01 May 15 Oct 10 Jul 01-Jul 30 Sep 01<br />
Snap Beans: Fresh Market Spring Mar 10 Mar 15-Apr 05 Apr 15 May 15 Jun 01-Jun 30 Jul 20<br />
Fresh Market Summer Apr 15 Apr 20-May 15 May 20 Jul 01 Jul 15-Sep 15 Oct 01<br />
Fresh Market Fall Aug 05 Aug 10-Aug 20 Aug 25 Sep 25 Oct 01-Oct 30 Nov 10<br />
Squash Apr 01 Apr 15-May 05 May 30 Jun 01 Jun 15-Jul 30 Sep 01<br />
Strawberries Sep 20 Sep 25-Oct 15 Nov 01 Apr 10 Apr 20-May 20 Jun 10<br />
Sweet Corn Mar 05 Mar 10-Jun 01 Jun 05 Jun 01 Jun 15-Jul 30 Sep 10<br />
Tomatoes Apr 15 Apr 20-Jun 01 Jun 05 Jun 15 Jul 15-Sep 15 Oct 15<br />
Watermelons Mar 25 Mar 30-May 05 May 10 Jul 01 Jul 15-Aug 20 Sep 10<br />
1,800<br />
1,600<br />
1,400<br />
1,200<br />
1,000<br />
800<br />
600<br />
400<br />
200<br />
NORTH CAROLINA PLANTED ACRES<br />
(Thousand Acres)<br />
1999 2000 2001 2002 2003 2004 2005 2006 2007 2008<br />
Wheat Corn Soybeans Cotton
Crops Unit<br />
Date<br />
Series<br />
Began<br />
CROP RECORD HIGHS<br />
Record High<br />
Acres Harvested Yield Per Acre Production<br />
Year Acres Year Yield Year Production<br />
Thousands Thousands<br />
FIELD CROPS:<br />
Barley Bu. 1924 1981 75 2006 80.0 1981 4,125<br />
Corn for Grain Bu. 1866 1899 2,726 2006 132.0 1982 155,430<br />
Corn for Silage Ton 1919 1983 152 2004 19.0 1984 2,240<br />
Cotton: Upland 1 Lb. 1866 1926 1,802 2004 900.0 2001 1,673<br />
Cottonseed Ton 1866 - - - - 2001 559<br />
Hay: All Ton 1909 1945 1,374 2003 2.61 2003 2,030<br />
Hay: Alfalfa Ton 1919 1957 88 2006 3.10 1957 185<br />
Hay: Other Ton 1919 1945 1,274 2003 2.60 2003 1,976<br />
Irish Potatoes Cwt. 1866 1943 110 2006 210.0 1946 7,774<br />
Oats Bu. 1866 1889 542 2008 80.0 1956 19,680<br />
Peanuts Lb. 1909 1945 320 2008 3,700.0 1981 555,560<br />
Sorghum for Grain Bu. 1929 1971 120 2001 70.0 1971 6,240<br />
Sorghum for Silage Ton 1949 1972 34 1981 13.5 1971 390<br />
Soybeans Bu. 1924 1982 2,100 2004 34.0 2008 55,110<br />
Sweet Potatoes Cwt. 1868 1932 101 2008 190.0 2008 8,740<br />
Tobacco: All Lb. 1866 1939 851 1994 2,467.0 1951 999,725<br />
Tobacco: Burley Lb. 1919 1945 13 1969 2,570.0 1982 31,179<br />
Tobacco: Flue-cured Lb. 1919 1939 843 1994 2,478.0 1955 978,775<br />
Wheat: Winter Bu. 1866 1901 800 2008 60.0 2008 43,200<br />
FRUITS AND NUTS:<br />
Apples: Commercial Lb. 1934 - - - - 1983 415,000<br />
Blueberries Lb. 1972 2005 5.0 2008 5,940 2008 28,500<br />
Grapes Ton 1909 - - - - 1912 8.6<br />
Peaches Ton 1899 - - - - 1941 76<br />
Pecans: Improved Lb. 1919 - - - - 1971 4,300<br />
Pecans: Seedings Lb. 1919 - - - - 1994 2,800<br />
Pecans: All Lb. 1919 - - - - 1971 6,500<br />
Strawberries Cwt. 1949 1950 2.9 2006 135 2000 231<br />
Crops Unit<br />
Date<br />
Series<br />
Began<br />
CROP RECORD LOWS<br />
Record Low<br />
Acres Harvested Yield Per Acre Production<br />
Year Acres Year Yield Year Production<br />
Thousands Thousands<br />
FIELD CROPS:<br />
Barley Bu. 1924 1924 5 1932 15.0 1924 90<br />
Corn for Grain Bu. 1866 2001 625 1881 9.5 1866 15,912<br />
Corn for Silage Ton 1919 1919 4 1932 4.5 1919 26<br />
Cotton: Upland 1 Lb. 1866 1978 42 1878 124.0 1983 43<br />
Cottonseed Ton 1866 - - - - 1979 15<br />
Hay: All Ton 1909 1973 325 1925 0.64 1911 398<br />
Hay: Alfalfa Ton 1919 1921 3 1921 1.35 1921 4<br />
Hay: Other Ton 1919 1973 312 1925 0.61 1925 313<br />
Irish Potatoes Cwt. 1866 1867 10 1911 29.0 1866 444<br />
Oats Bu. 1866 2007 15 1871 8.0 2007 825<br />
Peanuts Lb. 1909 2006 84 1909 675.0 1911 119,350<br />
Sorghum for Grain Bu. 1929 1945 2 1946 23.0 1945 50<br />
Sorghum for Silage Ton 1949 1950 1 1993 4.0 1949 7<br />
Soybeans Bu. 1924 1924 75 1943 9.0 1933 1,026<br />
Sweet Potatoes Cwt. 1868 1964 18 1900 34.0 1869 1,691<br />
Tobacco: All Lb. 1866 1866 16 1883 340.0 1866 7,840<br />
Tobacco: Burley Lb. 1919 1921 2.1 1922 500.0 1919 1,412<br />
Tobacco: Flue-cured Lb. 1919 2005 123 1924 585.0 1921 246,540<br />
Wheat: Winter Bu. 1866 1966 165 1885 4.0 1866 1,800<br />
FRUITS AND NUTS:<br />
Apples: Commercial Lb. 1934 - - - - 1955 1,680<br />
Blueberries Lb. 1972 2001 2.7 1976 440 1976 1,496<br />
Grapes Ton 1909 - - - - 1957 0.8<br />
Peaches Ton 1899 - - - - 1955 2<br />
Pecans: Improved Lb. 1919 - - - - 1920 66<br />
Pecans: Seedings Lb. 1919 - - - - 2004 30<br />
Pecans: All Lb. 1919 - - - - 2004 100<br />
Strawberries Cwt. 1949 1956 1.3 1972 9 1955 13<br />
1 2 Production in 480-lb. net weight bales. Production is too small to estimate. NOTE: In some cases, the acreage or yield or production is identical for more than one year. In<br />
such cases, the year shown is the latest year of occurrence.<br />
North Carolina Agricultural Statistics 59
Crops Unit<br />
60 North Carolina Agricultural Statistics<br />
ANNUAL CROP SUMMARY<br />
Acres Planted<br />
Acres<br />
Harvested<br />
2007 1<br />
Yield per Acre Production Price per Unit Value<br />
Thousands Units Thousands Dollars Thousand Dollars<br />
FIELD CROPS<br />
Barley Bu. 22 14 49 686 2.65 1,818<br />
Corn for Grain 2 Bu. 1,090 1,010 100 101,000 4.00 404,000<br />
Corn for Silage 3 Ton - 60 11 660 - -<br />
Cotton: Upland 4 Lb. 500 490 767 783 0.558 209,719<br />
Cottonseed Ton - - - 244 148.00 36,112<br />
Hay: All Ton - 699 1.50 1,050 91.50 95,880<br />
Hay: Alfalfa Ton - 9 1.70 15 182.00 2,730<br />
Hay: Other Ton - 690 1.50 1,035 90.00 93,150<br />
Irish Potatoes Cwt. 16.0 14.5 186 2,700 8.35 22,545<br />
Oats Bu. 50 15 55.0 825 2.50 2,063<br />
Peanuts Lb. 92 90 2,900 261,000 0.210 54,810<br />
Sorghum for Grain 2 Cwt. 12 8 55 440 6.95 1,712<br />
Sorghum for Silage 3 Ton - 3 10 30 - -<br />
Soybeans for Beans Bu. 1,440 1,380 22 30,360 10.10 306,636<br />
Sweet Potatoes Cwt. 44 43 155 6,665 16.40 109,306<br />
Tobacco: All Lb. - 170 2,255 383,420 1.53 587,029<br />
Tobacco: Flue-cured Lb. - 166 2,270 376,820 1.53 576,535<br />
Tobacco: Burley Lb. - 4.0 1,650 6,600 1.59 10,494<br />
Wheat Bu. 630 500 40 20,000 4.90 98,000<br />
FRUITS AND NUTS Actual Acres<br />
Apples: Commercial Lb. - 6,800 8,820 60,000 0.098 5,864<br />
Blueberries Lb. - 4,700 3,450 16,200 2.110 34,200<br />
Grapes Ton - 1,700 2.15 3.65 1,270.00 4,630<br />
Peaches Ton - 1,200 0.54 0.65 1,130.00 735<br />
Pecans: All Lb. - - - 200 1.37 274<br />
Pecans: Improved Lb. - - - 160 1.51 242<br />
Pecans: Seedlings Lb. - - - 40 0.81 32<br />
VEGETABLES<br />
Fresh Market<br />
Actual Acres<br />
Bell Peppers Cwt. 2,800 2,700 230 624 25.00 15,600<br />
Cabbage: All Cwt. 5,300 5,200 240 1,248 10.00 12,480<br />
Cucumbers Cwt. 7,200 7,000 105 735 16.00 11,760<br />
Snap Beans: All Cwt. 6,400 6,300 40 252 30.00 7,560<br />
Squash Cwt. 3,200 3,000 130 390 30.00 11,700<br />
Strawberries: All Cwt. 1,700 1,500 125 189 95.00 17,955<br />
Sweet Corn Cwt. 6,600 6,200 100 620 15.00 9,300<br />
Tomatoes Cwt. 3,400 3,300 290 957 30.00 28,710<br />
Watermelons<br />
Processing<br />
Cwt. 6,700 6,600 210 1,386 8.00 11,088<br />
Cucumbers Ton 12,100 10,700 3.95 42,270 305.00 12,892<br />
1 2 3 4 Revised. Planted for all purposes. Green-weight. Production in 480-lb. net weight bales.
Crops Unit<br />
ANNUAL CROP SUMMARY<br />
Acres Planted<br />
Acres<br />
Harvested<br />
2008 1<br />
Yield per Acre Production Price per Unit Value<br />
Thousands Units Thousands Dollars Thousand Dollars<br />
FIELD CROPS<br />
Barley Bu. 21 14 71 994 4.00 3,976<br />
Corn for Grain 2 Bu. 900 830 78 64,740 4.80 310,752<br />
Corn for Silage 3 Ton - 55 15 825 - -<br />
Cotton: Upland 4 Lb. 430 428 847 755 0.397 146,731<br />
Cottonseed Ton - - - 231 177.00 43,542<br />
Hay: All Ton - 808 2.01 1,622 101.00 163,130<br />
Hay: Alfalfa Ton - 8 2.70 22 215.00 4,730<br />
Hay: Other Ton - 800 2.00 1,600 99.00 158,400<br />
Irish Potatoes Cwt. 14.5 14.0 180 2,520 10.30 25,956<br />
Oats Bu. 60 30 80.0 2,400 3.20 7,680<br />
Peanuts Lb. 98 97 3,700 358,900 0.189 67,832<br />
Sorghum for Grain 2 Cwt. 16 13 56 728 6.90 2,813<br />
Sorghum for Silage 3 Ton - 2 11 22 - -<br />
Soybeans for Beans Bu. 1,690 1,670 33 55,110 8.65 476,702<br />
Sweet Potatoes Cwt. 47 46 190 8,740 18.20 159,068<br />
Tobacco: All Lb. - 174.3 2,240 390,360 1.76 686,921<br />
Tobacco: Flue-cured Lb. - 171 2,250 384,750 1.76 677,160<br />
Tobacco: Burley Lb. - 3.3 1,700 5,610 1.74 9,761<br />
Wheat Bu. 820 720 60 43,200 5.80 250,560<br />
FRUITS AND NUTS Actual Acres<br />
Apples: Commercial Lb. - 6,800 24,300 165,000 0.142 23,487<br />
Blueberries Lb. - 4,800 5,940 28,500 1.680 47,950<br />
Grapes Ton - 1,700 3.29 5.60 1,170.00 6,563<br />
Peaches Ton - 1,200 4.67 5.25 1,010.00 5,303<br />
Pecans: All Lb. - - - 700 1.20 840<br />
Pecans: Improved Lb. - - - 600 1.30 780<br />
Pecans: Seedlings Lb. - - - 100 0.60 60<br />
VEGETABLES<br />
Fresh Market<br />
Actual Acres<br />
Bell Peppers Cwt. 2,900 2,800 120 336 30.00 10,080<br />
Cabbage: All Cwt. 5,300 5,000 250 1,250 13.00 16,250<br />
Cucumbers Cwt. 7,300 7,000 105 735 18.00 13,230<br />
Snap Beans: All Cwt. 6,300 6,200 40 248 28.00 6,944<br />
Squash Cwt. 3,400 3,300 110 363 28.00 10,164<br />
Strawberries: All Cwt. 1,700 1,600 130 208 100.00 20,800<br />
Sweet Corn Cwt. 6,800 6,500 100 650 19.00 12,350<br />
Tomatoes Cwt. 3,500 3,400 320 1,088 31.00 33,728<br />
Watermelons<br />
Processing<br />
Cwt. 6,800 6,700 200 1,340 9.00 12,060<br />
Cucumbers Ton 10,700 9,400 4.50 42,300 285.00 12,056<br />
1 2 3 4 Preliminary. Planted for all purposes. Green-weight. Production in 480-lb. net weight bales.<br />
North Carolina Agricultural Statistics 61
Year<br />
62 North Carolina Agricultural Statistics<br />
GRAIN STOCKS<br />
On-Farm <strong>Stocks</strong> Off-Farm <strong>Stocks</strong> 1 Total <strong>Stocks</strong> All Positions<br />
Mar 1 Jun 1 Sep 1 Dec 1 Mar 1 Jun 1 Sep 1 Dec 1 Mar 1 Jun 1 Sep 1 Dec 1<br />
Thousand Bushels<br />
CORN<br />
2004 8,000 2,500 1,400 28,000 14,778 10,016 7,473 22,779 22,778 12,516 8,873 50,779<br />
2005 13,000 5,800 2,800 29,000 18,692 10,235 5,029 25,271 31,692 16,035 7,829 54,271<br />
2006 16,000 4,000 1,000 25,000 21,407 11,071 5,988 28,196 37,407 15,071 6,988 53,196<br />
2007 12,000 2,600 700 30,000 22,103 14,178 5,239 33,515 34,103 16,778 5,939 63,515<br />
2008 13,000 2,400 850 20,000 27,069 17,132 7,185 26,691 40,069 19,532 8,035 46,691<br />
SOYBEANS<br />
2004 * * * * 10,289 5,634 1,593 10,692 * * * *<br />
2005 * * * * 7,318 4,163 2,919 10,725 * * * *<br />
2006 * * * * 6,858 2,790 * 9,292 * * * *<br />
2007 * * * * 6,578 5,842 3,911 10,139 * * * *<br />
2008 * * * * 7,013 2,811 1,275 14,842 * * * *<br />
WHEAT<br />
2004 200 20 2,500 1,400 3,629 2,083 7,144 4,917 3,829 2,103 9,644 6,317<br />
2005 400 150 2,600 1,150 4,557 2,712 12,100 7,571 4,957 2,862 14,700 8,721<br />
2006 700 70 2,600 1,350 5,900 3,547 9,750 7,908 6,600 3,617 12,350 9,258<br />
2007 300 30 1,000 520 5,857 1,374 8,535 4,750 6,157 1,404 9,535 5,270<br />
2008 100 10 4,600 3,200 4,265 1,514 12,650 9,736 4,365 1,524 17,250 12,936<br />
1 Includes stocks at mills, elevators, warehouses, terminals and processors. *“On-Farm” estimates not published at state level. “Off-Farm” estimates not published to avoid<br />
disclosure of individual farms.<br />
HAY STOCKS ON FARMS<br />
Year May 1 Dec 1<br />
Thousand Tons<br />
2004 405 1,545<br />
2005 350 1,245<br />
2006 282 1,280<br />
2007 120 682<br />
2008 79 962<br />
Year<br />
Insect<br />
Resistant (BT)<br />
GRAIN STORAGE CAPACITY<br />
On-Farm and Off-Farm Facilities, December 1<br />
Year Off-Farm Facilities<br />
Rated Off-Farm<br />
<strong>Storage</strong> Capacity<br />
Rated On-Farm<br />
<strong>Storage</strong> Capacity<br />
Number Thousand Bushels Thousand Bushels<br />
2004 195 68,000 75,000<br />
2005 195 67,000 75,000<br />
2006 190 69,000 75,000<br />
2007 180 72,000 80,000<br />
2008 180 80,000 85,000<br />
UPLAND COTTON BIOTECHNOLOGY VARIETIES<br />
Percent Planted<br />
Herbicide<br />
Resistant<br />
North Carolina United States<br />
Stacked<br />
Gene<br />
All <strong>Biotech</strong><br />
<strong>Varieties</strong><br />
Insect<br />
Resistant (BT)<br />
Herbicide<br />
Resistant<br />
Stacked<br />
Gene<br />
All <strong>Biotech</strong><br />
<strong>Varieties</strong><br />
2005 17 24 54 95 18 27 34 79<br />
2006 19 19 60 98 18 26 39 83<br />
2007 13 16 64 93 17 28 42 87<br />
2008 19 14 62 95 18 23 45 86<br />
2009 15 13 68 96 17 23 48 88
Crop Unit<br />
SELECTED FLORICULTURE CROPS<br />
Quantity Sold and Wholesale Value<br />
Total Quantity Sold Percent<br />
Wholesale Value<br />
Change<br />
1<br />
2007 2008 2007 2008<br />
Thousand Thousand Dollars<br />
Percent<br />
Change<br />
TOTAL VALUE OF REPORTED CROPS<br />
For operations with $100,000+ sales<br />
- - - 187,110 207,727 +11<br />
TOTAL VALUE OF REPORTED CROPS<br />
For operations with $10,000+ sales<br />
BEDDING/GARDEN PLANTS<br />
- - - 197,469 217,183 +10<br />
Impatiens Flats 458 616 +34 3,985 4,922 +24<br />
Petunias Flats 350 578 +65 3,157 4,930 +56<br />
Vegetable Type Bedding Plants Flats 132 157 +19 1,546 1,749 +13<br />
Begonia Flats 352 422 +20 2,893 3,300 +14<br />
Marigold Flats 291 343 +18 2,316 2,651 +14<br />
Pansy/Viola Flats 1,300 1,560 +20 11,349 13,697 +21<br />
Other Plants in flats 2 Flats 970 1,436 +48 9,723 12,577 +29<br />
Potted Geraniums (Cutting) Pots 2,120 1,972 -7 6,915 8,306 +20<br />
Potted Geraniums (Seed) Pots 938 1,014 +8 742 972 +31<br />
New Guinea Impatiens Pots 1,050 894 -15 2,405 3,949 +64<br />
Other Potted Flowering Plants 3 Pots 21,236 21,200 0 36,789 34,636 -6<br />
Hanging Baskets, Flowering 4 Baskets 3,927 4,604 +17 21,173 23,111 +9<br />
Total Bedding/Garden Plants<br />
POTTED FLOWERING PLANTS FOR<br />
INDOOR OR PATIO USE<br />
33,124 34,796 +5 102,993 114,800 +11<br />
Poinsettias Pots 4,799 4,622 -4 15,217 17,902 +18<br />
Chrysanthemums (Florist) Pots 940 683 -27 3,660 3,282 -10<br />
Lilies, Easter Pots 302 465 +54 1,454 2,158 +48<br />
Finished Florist Azaleas Pots 89 99 +11 797 849 +7<br />
Other Flowering Plants 5 Pots 5,038 4,881 -3 13,442 17,039 +27<br />
Total Potted Flowering Plants<br />
HERBACEOUS PERENNIALS<br />
11,168 10,750 -4 34,570 41,230 +19<br />
Potted Hardy/Garden Chrysanthemums Pots 8,555 8,338 -3 19,343 16,180 -16<br />
Other Herbaceous Perennials 6 Pots 8,523 5,796 -32 18,665 18,819 +1<br />
Total Potted Herbaceous Perennials<br />
FOLIAGE FOR INDOOR OR PATIO USE<br />
17,078 14,134 -17 38,008 34,999 -8<br />
Potted Foliage - - - 2,744 4,302 +57<br />
Foliage Hanging Baskets Baskets 468 1,117 +139 2,513 6,289 +150<br />
Total Foliage - - - 5,257 10,591 +101<br />
Total Cut Flowers 7 6,428 4,275 -33 3,429 2,857 -17<br />
Total Propagative Sales 8 - - - - - -<br />
1 Equivalent wholesale value of all sales for operations with $100,000+ sales.<br />
2 Includes Geraniums, New Guinea Impatiens and Other Flowering or Foliar Type Bedding Plants.<br />
3 Includes Impatiens, Petunias, Pansy/Viola, Begonia, Marigold, Vegetable and Other Potted Plants.<br />
4 Includes Geraniums, Impatiens, New Guinea Impatiens, Petunias, Begonia, Marigold Pansy/Viola and Other Flowering Hanging Baskets.<br />
5 Includes African Violets, Florist Roses, Orchids, Spring Flowering Bulbs and Other Flowering Potted Plants.<br />
6 Includes Ferns (hardy/garden), Hosta, Iris, Peony, and Other Herbaceous Perennials.<br />
7 Includes Chrysanthemums, Lilies, Orchids, Roses and Other Cut Flowers.<br />
8 Not published to avoid disclosure of individual operations.<br />
North Carolina Agricultural Statistics 63
64 North Carolina Agricultural Statistics
Counties and<br />
Districts<br />
Planted All<br />
Purposes<br />
Harvested for<br />
Grain<br />
BARLEY<br />
Acres, Yield and Production 1 2<br />
2007 2008<br />
Yield per<br />
Harvested<br />
Acre<br />
Production<br />
Planted All<br />
Purposes<br />
Harvested for<br />
Grain<br />
Yield per<br />
Harvested<br />
Acre<br />
Production<br />
Acres Bushels Acres Bushels<br />
Surry 1,600 1,500 54 81,000 1,700 1,600 93 148,000<br />
Yadkin 2,000 900 43 39,000 2,500 2,400 71 170,600<br />
N. Mountain 4,500 2,800 50 140,000 5,000 4,200 79 333,000<br />
W. Mountain * * * * 500 200 65 13,000<br />
Guilford 800 700 69 48,000 1,200 1,200 52 62,000<br />
N. Piedmont 2,400 2,000 64 128,000 2,700 2,500 59 148,000<br />
Alexander * * * * 600 100 78 7,800<br />
Catawba 500 400 48 19,000 600 500 77 38,700<br />
Davidson 500 300 43 13,000 700 600 73 44,000<br />
Iredell * * * * 3,000 500 62 31,000<br />
Randolph * * * * 1,100 300 69 20,700<br />
Rowan 1,800 1,600 72 115,000 1,600 1,400 84 117,000<br />
C. Piedmont 9,000 5,000 50 250,000 8,100 3,700 74 272,000<br />
Cabarrus 600 400 36 14,500 * * * *<br />
Cleveland * * * * 600 500 84 42,000<br />
Lincoln 900 700 37 26,000 1,100 600 73 44,000<br />
Stanly 700 500 38 19,000 * * * *<br />
S. Piedmont 3,400 2,300 37 85,000 3,200 2,200 73 160,000<br />
N. Coastal * * * * * * * *<br />
C. Coastal * * * * * * * *<br />
S. Coastal 1,100 900 24 22,000 1,000 800 56 45,000<br />
Other Counties 12,600 7,000 271 311,500 6,300 4,300 62 268,200<br />
State Total 22,000 14,000 49 686,000 21,000 14,000 71 994,000<br />
1 2008 Preliminary. 2 Counties may not add to district total because undisclosed data are included in other counties. * USDA NASS County Estimating Program Policy and<br />
Standards require districts and counties with less than 500 acres planted to a crop, or practice of a crop, are included in other counties. Coverage standards also apply to<br />
district and county estimates.<br />
Leading Counties 1 Bushels<br />
Yadkin 170,600<br />
Surry 148,000<br />
Rowan 117,000<br />
Guilford 62,000<br />
Davidson 44,000<br />
Lincoln 44,000<br />
Cleveland 42,000<br />
Catawba 38,700<br />
Iredell 31,000<br />
Randolph 20,700<br />
1 Ranking of published counties only.<br />
35<br />
30<br />
25<br />
20<br />
15<br />
10<br />
BARLEY<br />
2008 Production<br />
BARLEY<br />
Planted and Harvested (Thousand Acres)<br />
1999 2000 2001 2002 2003 2004 2005 2006 2007 2008<br />
Planted Harvested<br />
Bushels<br />
Under 10,000 / Undisclosed<br />
10,000 to 39,999<br />
40,000 to 59,999<br />
60,000 to 119,999<br />
120,000 and up<br />
North Carolina Agricultural Statistics 65
Counties and<br />
Districts<br />
Planted All<br />
Purposes<br />
Harvested for<br />
Grain<br />
66 North Carolina Agricultural Statistics<br />
CORN FOR GRAIN<br />
Acres, Yield and Production 1 2<br />
2007 2008<br />
Yield per<br />
Harvested<br />
Acre<br />
Production<br />
Planted All<br />
Purposes<br />
Harvested for<br />
Grain<br />
Yield per<br />
Harvested<br />
Acre<br />
Acres Bushels Acres Bushels<br />
Production<br />
Alleghany 1,900 * * * * * * *<br />
Caldwell 1,000 580 103 60,000 900 600 105 63,000<br />
Surry 8,300 6,640 115 761,000 6,800 5,700 118 670,000<br />
Wilkes 5,700 560 69 38,600 6,600 1,500 75 113,000<br />
Yadkin 13,500 7,800 92 717,000 11,100 8,400 99 830,000<br />
N. Mountain 30,600 15,700 101 1,583,000 27,800 16,400 102 1,680,000<br />
Buncombe 900 140 81 11,300 1,200 100 67 6,700<br />
Burke 1,400 1,000 70 70,000 1,200 900 96 86,300<br />
Cherokee 700 480 179 86,000 1,000 700 130 91,000<br />
Haywood 1,500 60 113 6,800 * * * *<br />
Henderson 2,200 1,100 126 139,000 3,100 1,400 129 181,000<br />
McDowell * * * * 800 400 68 27,000<br />
Transylvania 500 150 147 22,000 * * * *<br />
W. Mountain 8,600 3,400 110 375,000 11,500 4,600 109 500,000<br />
Alamance 4,000 2,500 80 200,000 4,200 3,000 82 245,000<br />
Caswell 1,400 620 44 27,100 1,500 800 71 57,000<br />
Durham * * * * 700 500 87 43,500<br />
Forsyth 3,700 3,400 59 199,000 1,000 800 82 65,500<br />
Franklin 3,600 3,200 54 172,500 2,700 2,600 68 177,000<br />
Granville 2,800 900 29 26,500 4,200 1,900 49 93,000<br />
Guilford 5,000 2,200 51 112,000 5,700 2,500 82 206,000<br />
Orange 3,000 1,600 70 112,000 2,900 1,900 107 203,000<br />
Person 3,200 1,800 48 85,500 3,200 3,000 71 212,000<br />
Rockingham 3,300 1,900 77 147,000 3,600 1,800 67 121,000<br />
Stokes 1,500 1,200 77 92,300 1,500 1,200 71 85,000<br />
Warren 1,000 760 28 21,000 * * * *<br />
N. Piedmont 33,400 20,700 59 1,218,000 32,200 20,700 76 1,568,000<br />
Alexander 2,100 1,000 45 45,400 2,200 900 106 95,000<br />
Catawba 2,600 1,600 59 94,000 2,600 2,100 123 259,000<br />
Chatham 2,900 1,100 76 84,000 3,000 1,900 96 183,000<br />
Davidson 6,800 5,400 93 501,000 6,400 4,900 76 371,000<br />
Davie 6,100 5,100 69 354,000 5,000 4,200 80 335,000<br />
Iredell 16,500 5,000 80 400,000 16,600 7,700 109 840,000<br />
Lee 900 850 72 61,000 1,300 1,300 72 93,000<br />
Randolph 7,700 4,050 79 321,000 7,400 4,300 89 382,000<br />
Rowan 8,700 7,000 86 604,000 9,000 7,600 113 860,000<br />
Wake 2,100 1,600 52 82,600 1,500 1,400 46 65,000<br />
C. Piedmont 56,400 32,700 78 2,547,000 55,000 36,300 96 3,483,000<br />
Anson 7,800 7,300 108 790,000 7,600 7,200 89 644,000<br />
Cabarrus 3,700 2,000 59 118,000 3,500 2,800 102 285,000<br />
Cleveland 1,600 700 45 31,300 2,000 700 71 50,000<br />
Lincoln 2,800 1,300 50 65,600 2,800 1,000 98 98,000<br />
Montgomery 900 800 61 49,000 * * * *<br />
Moore 1,600 1,400 58 81,000 1,400 1,400 68 95,000<br />
Stanly 12,300 11,100 101 1,126,000 10,600 9,800 96 940,000<br />
Union 29,800 29,400 110 3,238,000 27,400 26,000 66 1,728,000<br />
S. Piedmont 65,000 57,500 100 5,726,000 62,000 54,500 77 4,217,000<br />
Bertie 25,700 25,000 63 1,565,000 16,500 16,500 82 1,346,000<br />
Camden 18,200 18,000 178 3,209,000 14,600 14,600 131 1,913,000<br />
Chowan 8,400 8,200 104 850,000 5,500 5,500 95 522,000<br />
Currituck 11,000 10,500 168 1,759,000 8,800 8,800 138 1,215,000<br />
Edgecombe 22,300 22,000 70 1,541,000 13,000 12,700 63 802,000<br />
Gates 9,600 9,500 76 719,000 5,200 5,100 91 465,000<br />
Halifax 17,800 16,600 63 1,050,000 9,600 9,200 73 674,000<br />
Hertford 14,300 13,800 50 690,000 10,300 10,200 95 971,000<br />
Martin 12,100 11,900 96 1,144,000 7,200 7,000 52 365,000<br />
Northampton 10,200 9,500 74 706,000 7,000 7,000 101 704,000<br />
Pasquotank 24,600 24,400 155 3,793,000 17,500 17,400 115 2,000,000<br />
Perquimans 22,600 22,300 122 2,712,000 12,600 12,600 101 1,270,000<br />
Tyrrell 28,200 28,000 160 4,467,000 25,400 25,300 131 3,302,000<br />
Washington 31,300 31,000 140 4,330,000 25,100 25,000 87 2,176,000<br />
N. Coastal 264,000 258,000 113 29,114,000 183,500 182,000 100 18,124,000
Counties and<br />
Districts<br />
Planted All<br />
Purposes<br />
Harvested for<br />
Grain<br />
CORN FOR GRAIN<br />
Acres, Yield and Production 1 2<br />
2007 2008<br />
Yield per<br />
Harvested<br />
Acre<br />
Production<br />
Planted All<br />
Purposes<br />
Harvested for<br />
Grain<br />
Yield per<br />
Harvested<br />
Acre<br />
Acres Bushels Acres Bushels<br />
Production<br />
Beaufort 55,900 55,700 142 7,900,000 46,500 43,800 79 3,480,000<br />
Carteret 18,500 18,300 152 2,790,000 22,000 22,000 123 2,700,000<br />
Craven 24,300 24,000 114 2,735,000 20,500 20,000 60 1,200,000<br />
Greene 18,500 18,400 117 2,150,000 14,700 12,500 43 533,000<br />
Hyde 31,100 30,000 166 4,970,000 27,000 26,900 134 3,600,000<br />
Johnston 14,200 13,800 58 806,000 10,500 10,200 75 761,000<br />
Jones 20,200 19,800 99 1,970,000 17,000 17,000 25 433,000<br />
Lenoir 29,300 29,100 112 3,270,000 22,500 22,200 35 770,000<br />
Pamlico 13,000 12,800 156 2,000,000 12,700 12,700 118 1,496,000<br />
Pitt 34,200 34,000 86 2,913,000 22,200 21,100 34 722,000<br />
Wayne 38,300 38,000 87 3,292,000 30,500 29,700 46 1,352,000<br />
Wilson 14,500 14,100 76 1,070,000 10,900 10,900 65 705,000<br />
C. Coastal 312,000 308,000 116 35,866,000 257,000 249,000 71 17,752,000<br />
Bladen 30,300 30,000 67 2,000,000 23,000 22,600 45 1,028,000<br />
Brunswick 7,700 7,400 76 565,000 7,200 7,100 89 630,000<br />
Columbus 44,900 44,400 77 3,405,000 35,000 34,700 71 2,450,000<br />
Cumberland 13,100 12,400 60 742,000 12,500 12,300 84 1,030,000<br />
Duplin 63,900 63,300 90 5,680,000 50,500 49,700 52 2,600,000<br />
Harnett 6,300 5,800 54 316,000 4,900 4,700 105 495,000<br />
Hoke 5,200 5,000 76 379,000 6,000 6,000 103 620,000<br />
Onslow 14,200 13,700 122 1,669,000 12,300 12,300 64 793,000<br />
Robeson 62,300 61,700 67 4,115,000 54,000 53,000 70 3,690,000<br />
Sampson 47,600 46,800 76 3,565,000 42,000 40,800 60 2,450,000<br />
Scotland 4,400 4,100 80 330,000 4,900 4,900 94 460,000<br />
S. Coastal 320,000 314,000 78 24,571,000 271,000 266,500 65 17,416,000<br />
Other Counties 34,800 31,410 85 2,680,500 38,200 31,100 68 2,118,000<br />
State Total 1,090,000 1,010,000 100 101,000,000 900,000 830,000 78 64,740,000<br />
1 2008 Preliminary. 2 Counties may not add to district total because undisclosed data are included in other counties. * USDA NASS County Estimating Program Policy and Standards<br />
require districts and counties with less than 500 acres planted to a crop, or practice of a crop, are included in other counties. Coverage standards also apply to district<br />
and county estimates.<br />
Leading Counties 1 Bushels<br />
Robeson 3,690,000<br />
Hyde 3,600,000<br />
Beaufort 3,480,000<br />
Tyrrell 3,302,000<br />
Carteret 2,700,000<br />
Duplin 2,600,000<br />
Columbus 2 2,450,000<br />
Sampson 2 2,450,000<br />
Washington 2,176,000<br />
Pasquotank 2,000,000<br />
1 Ranking of published counties only.<br />
2 Ranked 7th.<br />
1,200<br />
1,000<br />
800<br />
600<br />
400<br />
200<br />
CORN FOR GRAIN<br />
2008 Production<br />
CORN FOR GRAIN<br />
Planted and Harvested (Thousand Acres)<br />
1999 2000 2001 2002 2003 2004 2005 2006 2007 2008<br />
Planted Harvested<br />
Bushels<br />
Under 50,000 / Undisclosed<br />
50,000 to 199,999<br />
200,000 to 999,999<br />
1,000,000 to 2,999,999<br />
3,000,000 and up<br />
North Carolina Agricultural Statistics 67
Counties and<br />
Districts<br />
Harvested for<br />
Silage<br />
68 North Carolina Agricultural Statistics<br />
CORN FOR SILAGE<br />
Acres, Yield and Production 1 2<br />
2007 2008<br />
Yield per<br />
Harvested Acre<br />
Production<br />
Harvested for<br />
Silage<br />
Yield per<br />
Harvested Acre<br />
Acres Tons Acres Tons<br />
Production<br />
Alleghany 1,800 21.0 38,300 1,900 21.5 41,200<br />
Caldwell 320 16.0 5,200 300 12.5 3,800<br />
Surry 1,600 17.0 26,600 1,100 15.0 16,700<br />
Wilkes 5,000 11.0 54,300 * * *<br />
Yadkin 5,300 9.0 47,000 2,600 14.5 38,300<br />
N. Mountain 14,200 12.0 175,000 11,000 16.5 179,500<br />
Buncombe 700 17.0 12,000 1,100 13.5 15,100<br />
Cherokee * * * 300 24.0 7,200<br />
Haywood 1,400 22.0 30,100 1,500 16.5 25,100<br />
Henderson * * * 1,700 17.5 30,000<br />
Transylvania 300 17.0 5,000 300 18.5 5,600<br />
W. Mountain 5,000 19.0 93,000 6,800 17.5 118,800<br />
Alamance 1,400 10.0 14,000 1,100 13.0 14,500<br />
Caswell 500 5.0 2,700 * * *<br />
Forsyth 140 16.0 2,200 200 15.5 3,100<br />
Granville 1,250 8.0 9,500 1,400 10.0 14,300<br />
Guilford 1,600 7.0 10,400 2,700 12.0 33,000<br />
Orange 1,300 13.0 16,800 1,000 16.0 16,100<br />
Rockingham 1,100 10.0 10,600 1,100 14.0 15,600<br />
Stokes 280 18.0 5,000 300 15.5 4,700<br />
N. Piedmont 9,000 9.0 85,000 9,200 13.5 122,300<br />
Alexander 850 9.0 7,600 1,300 17.0 22,400<br />
Chatham 1,700 9.0 14,600 1,100 15.0 16,700<br />
Davidson 1,250 11.0 13,400 1,200 11.5 14,000<br />
Davie 950 13.0 12,000 * * *<br />
Iredell 10,750 10.0 112,600 8,900 15.0 135,700<br />
Randolph 3,350 6.0 19,900 3,000 11.5 35,200<br />
Rowan 1,650 13.0 22,000 1,300 14.0 18,500<br />
C. Piedmont 21,500 10.0 205,000 18,200 14.5 263,500<br />
Cabarrus 1,400 7.0 9,400 700 17.0 12,000<br />
Cleveland 600 4.0 2,200 1,300 10.0 13,300<br />
Lincoln 1,500 8.0 12,200 * * *<br />
Stanly * * * 800 19.0 15,000<br />
S. Piedmont 6,700 8.0 54,000 6,700 13.5 90,500<br />
Halifax 800 17.0 13,600 * * *<br />
N. Coastal 1,000 17.0 17,000 * * *<br />
C. Coastal 600 20.0 12,000 * * *<br />
S. Coastal 2,000 10.0 19,000 * * *<br />
Other Counties 11,210 11.7 130,800 16,800 15.4 257,900<br />
State Total 60,000 11.0 660,000 55,000 15.0 825,000<br />
1 2 2008 Preliminary. Counties may not add to district total because undisclosed data are included in other counties. * USDA NASS County Estimating Program Policy and Standards<br />
require districts and counties with less than 500 acres planted to a crop, or practice of a crop, are included in other counties. Coverage standards also apply to district<br />
and county estimates.
Leading Counties 1 Tons<br />
Iredell 135,700<br />
Alleghany 41,200<br />
Yadkin 38,300<br />
Randolph 35,200<br />
Guilford 33,000<br />
Henderson 30,000<br />
Haywood 25,100<br />
Alexander 22,400<br />
Rowan 18,500<br />
Surry 2 16,700<br />
Chatham 2 16,700<br />
1 Ranking of published counties only.<br />
2 Ranked 10th.<br />
100<br />
80<br />
60<br />
40<br />
20<br />
0<br />
CORN FOR SILAGE<br />
2008 Production<br />
CORN FOR SILAGE<br />
Harvested (Thousand Acres)<br />
1999 2000 2001 2002 2003 2004 2005 2006 2007 2008<br />
Tons<br />
Under 5,000 / Undisclosed<br />
5,000 to 9,999<br />
10,000 to 19,999<br />
20,000 to 39,999<br />
40,000 and up<br />
North Carolina Agricultural Statistics 69
Counties and<br />
Districts<br />
Planted<br />
Acres<br />
Harvested<br />
70 North Carolina Agricultural Statistics<br />
COTTON<br />
Acres, Yield and Production 1 2<br />
2007 2008<br />
Yield per<br />
Harvested<br />
Acre<br />
Production Planted<br />
Acres<br />
Harvested<br />
Yield per<br />
Harvested<br />
Acre<br />
Acres 480-Pound Bales Acres 480-Pound Bales<br />
Production<br />
N. Mountain * * * * * * * *<br />
W. Mountain * * * * * * * *<br />
Warren 1,080 1,080 600 1,350 * * * *<br />
N. Piedmont 1,400 1,400 610 1,780 1,700 1,700 791 2,800<br />
C. Piedmont 2,100 1,480 486 1,500 * * * *<br />
Cleveland * * * * 1,600 1,600 900 3,000<br />
Stanly 8,400 8,330 789 13,700 7,200 6,900 974 14,000<br />
Union * * * * 2,000 2,000 912 3,800<br />
S. Piedmont 21,300 21,230 617 27,300 14,000 13,400 946 26,400<br />
Bertie 27,700 27,700 847 48,900 25,400 25,300 755 39,800<br />
Chowan 11,000 11,000 973 22,300 11,000 10,900 705 16,000<br />
Edgecombe 28,700 28,700 786 47,000 27,100 27,000 782 44,000<br />
Gates 10,800 10,700 852 19,000 11,000 10,900 727 16,500<br />
Halifax 42,600 42,500 750 66,400 45,000 44,900 855 80,000<br />
Hertford 9,560 9,560 653 13,000 10,100 10,000 888 18,500<br />
Martin 33,400 33,300 891 61,800 32,200 32,100 782 52,300<br />
Nash 9,300 9,300 702 13,600 8,000 8,000 720 12,000<br />
Northampton 41,800 41,800 745 64,900 32,800 32,700 983 67,000<br />
Pasquotank 1,590 1,590 785 2,600 1,900 1,900 707 2,800<br />
Perquimans 11,800 11,800 1,119 27,500 12,300 12,300 937 24,000<br />
Washington 7,280 7,240 1,054 15,900 6,900 6,900 1,113 16,000<br />
N. Coastal 239,000 238,660 825 410,000 227,600 226,800 836 395,000<br />
Beaufort 15,400 15,400 1,309 42,000 14,000 13,900 1,036 30,000<br />
Craven 2,400 2,380 847 4,200 3,000 3,000 800 5,000<br />
Greene * * * * 10,300 10,300 699 15,000<br />
Hyde 15,700 15,700 1,318 43,100 12,300 12,300 1,112 28,500<br />
Johnston 9,350 9,350 431 8,400 5,300 5,300 761 8,400<br />
Jones 8,700 8,700 960 17,400 7,700 7,700 873 14,000<br />
Lenoir 18,400 18,200 881 33,400 17,700 17,700 765 28,200<br />
Pamlico 1,350 1,350 1,280 3,600 * * * *<br />
Pitt 17,400 17,400 761 27,600 15,100 15,100 734 23,100<br />
Wayne 9,400 9,300 640 12,400 8,600 8,600 726 13,000<br />
Wilson 18,600 18,600 570 22,100 12,700 12,500 768 20,000<br />
C. Coastal 134,000 133,680 880 245,000 110,000 109,700 836 191,100<br />
Bladen * * * * 4,100 4,090 822 7,000<br />
Columbus * * * * 4,900 4,870 789 8,000<br />
Cumberland 5,500 5,100 433 4,600 4,700 4,680 903 8,800<br />
Duplin 4,340 4,140 997 8,600 3,600 3,600 800 6,000<br />
Harnett 12,100 11,600 426 10,300 11,000 11,000 873 20,000<br />
Hoke 12,400 12,400 495 12,800 8,000 8,000 1,014 16,900<br />
Robeson 23,000 18,400 337 12,900 12,500 12,400 883 22,800<br />
Sampson * * * * 16,800 16,700 851 29,600<br />
S. Coastal 102,000 93,450 500 97,300 75,500 75,200 878 137,500<br />
Other Counties 80,950 77,380 631 101,650 23,200 22,860 861 41,000<br />
State Total 500,000 490,000 767 783,000 430,000 428,000 847 755,000<br />
1 2 2008 Preliminary. Counties may not add to district total because undisclosed data are included in other counties. * USDA NASS County Estimating Program Policy and Standards<br />
require districts and counties with less than 500 acres planted to a crop, or practice of a crop, be included in other counties. Coverage standards also apply to district<br />
and county estimates.
Leading Counties 1 480-Pound Bales<br />
Halifax 80,000<br />
Northampton 67,000<br />
Martin 52,300<br />
Edgecombe 44,000<br />
Bertie 39,800<br />
Beaufort 30,000<br />
Sampson 29,600<br />
Hyde 28,500<br />
Lenoir 28,200<br />
Perquimans 24,000<br />
1 Ranking of published counties only.<br />
1,200<br />
1,000<br />
800<br />
600<br />
400<br />
200<br />
COTTON<br />
2008 Production<br />
COTTON<br />
Planted and Harvested (Thousand Acres)<br />
1999 2000 2001 2002 2003 2004 2005 2006 2007 2008<br />
Planted Harvested<br />
480-Pound Bales<br />
Under 5,000 / Undisclosed<br />
5,000 to 9,999<br />
10,000 to 19,999<br />
20,000 to 29,999<br />
30,000 and up<br />
North Carolina Agricultural Statistics 71
Counties and<br />
Districts<br />
Acres<br />
Harvested<br />
72 North Carolina Agricultural Statistics<br />
ALL HAY<br />
Acres, Yield and Production 1 2<br />
2007 2008<br />
Yield per<br />
Harvested Acre<br />
Production<br />
Acres<br />
Harvested<br />
Yield per<br />
Harvested Acre<br />
Production<br />
Acres Tons Acres Tons<br />
Alleghany 11,000 1.29 14,200 15,600 1.45 22,500<br />
Ashe 10,200 2.10 21,400 9,000 1.80 16,200<br />
Avery 1,000 1.10 1,100 1,000 1.40 1,400<br />
Caldwell 5,400 1.30 7,000 7,000 1.70 11,800<br />
Surry 14,800 1.48 21,900 16,000 2.25 35,800<br />
Watauga 5,600 1.96 11,000 8,000 2.05 16,400<br />
Wilkes 22,000 1.76 38,700 22,400 2.25 50,300<br />
Yadkin 10,000 1.37 13,700 14,000 1.95 27,600<br />
N. Mountain 80,000 1.61 129,000 93,000 1.95 182,000<br />
Buncombe 15,800 1.53 24,200 19,500 1.55 30,000<br />
Burke * * * 5,100 1.95 10,000<br />
Cherokee 3,600 1.67 6,000 4,000 2.25 9,000<br />
Clay 2,800 1.79 5,000 2,700 2.65 7,100<br />
Graham 900 1.67 1,500 800 2.00 1,600<br />
Haywood 9,500 1.63 15,500 13,000 1.70 21,800<br />
Henderson * * * 5,400 1.70 9,200<br />
Jackson 900 1.22 1,100 1,300 1.25 1,600<br />
McDowell 1,800 1.39 2,500 2,000 1.50 3,000<br />
Macon * * * 3,000 1.70 5,100<br />
Madison 6,200 1.27 7,900 8,200 2.15 17,500<br />
Mitchell * * * 4,500 1.70 7,700<br />
Polk 2,500 0.96 2,400 4,300 1.45 6,200<br />
Rutherford 14,400 0.85 12,300 18,500 1.20 22,500<br />
Swain 600 2.50 1,500 700 1.70 1,200<br />
Transylvania 4,000 2.15 8,600 4,500 1.75 7,800<br />
Yancey 5,800 1.00 5,800 5,500 1.50 8,300<br />
W. Mountain 85,000 1.40 119,000 103,000 1.65 169,600<br />
Alamance 15,000 1.21 18,200 17,000 1.75 30,000<br />
Caswell 15,000 1.31 19,600 16,000 1.70 26,900<br />
Durham 2,500 1.28 3,200 2,900 1.55 4,500<br />
Forsyth 8,000 1.45 11,600 7,200 1.50 10,700<br />
Franklin 8,400 1.33 11,200 11,400 1.70 19,600<br />
Granville 9,800 1.19 11,700 11,000 1.50 16,400<br />
Guilford 16,700 1.14 19,000 19,600 1.65 32,000<br />
Orange 13,800 1.12 15,500 14,900 2.00 29,600<br />
Person 8,700 1.37 11,900 9,700 1.85 18,000<br />
Rockingham 16,500 1.31 21,600 19,000 1.70 32,400<br />
Stokes 13,000 1.28 16,600 17,000 1.65 28,000<br />
Vance 2,600 1.35 3,500 2,700 1.65 4,400<br />
Warren 5,000 0.88 4,400 5,600 1.70 9,500<br />
N. Piedmont 135,000 1.24 168,000 154,000 1.70 262,000<br />
Alexander 9,100 1.27 11,600 9,600 2.40 23,000<br />
Catawba 11,000 1.07 11,800 18,400 1.95 35,600<br />
Chatham 22,000 1.27 28,000 21,600 2.05 44,000<br />
Davidson 19,500 1.21 23,500 21,300 1.70 36,500<br />
Davie 14,300 1.90 27,200 25,000 1.80 45,000<br />
Iredell 27,500 1.60 44,000 27,000 2.10 57,000<br />
Lee 1,600 1.44 2,300 2,000 1.95 3,900<br />
Randolph 17,000 1.43 24,300 23,000 2.00 46,000<br />
Rowan 19,500 1.46 28,500 18,500 2.20 40,700<br />
Wake 3,500 1.37 4,800 4,100 1.65 6,800<br />
C. Piedmont 145,000 1.42 206,000 170,500 2.00 338,500<br />
Anson 4,600 1.87 8,600 4,600 2.55 11,800<br />
Cabarrus 14,500 1.52 22,000 26,000 2.70 70,500<br />
Cleveland 20,000 1.08 21,500 19,000 1.50 28,200<br />
Gaston * * * 10,700 1.55 16,600<br />
Lincoln 10,000 0.90 9,000 12,000 1.70 20,200<br />
Mecklenburg * * * 3,300 1.70 5,600<br />
Montgomery 4,000 2.15 8,600 6,400 2.20 14,000<br />
Moore 5,500 1.55 8,500 5,700 2.45 13,900<br />
Richmond 2,400 0.96 2,300 5,600 1.85 10,400<br />
Stanly 12,000 1.63 19,500 12,000 2.05 24,300<br />
Union * * * 16,200 2.60 42,000<br />
S. Piedmont 99,000 1.34 133,000 121,500 2.10 257,500
Counties and<br />
Districts<br />
Acres<br />
Harvested<br />
ALL HAY<br />
Acres, Yield and Production 1 2<br />
2007 2008<br />
Yield per<br />
Harvested Acre<br />
Production<br />
Acres<br />
Harvested<br />
Yield per<br />
Harvested Acre<br />
Production<br />
Acres Tons Acres Tons<br />
Edgecombe 800 2.88 2,300 2,700 2.20 5,900<br />
Gates * * * 800 1.65 1,300<br />
Halifax 1,800 2.00 3,600 4,000 1.75 7,000<br />
Martin 1,500 1.40 2,100 1,000 1.80 1,800<br />
Nash 5,000 1.44 7,200 6,000 2.50 15,000<br />
N. Coastal 13,000 1.85 24,000 17,000 2.10 35,400<br />
Beaufort 500 3.00 1,500 1,200 1.10 1,300<br />
Craven 900 3.22 2,900 1,300 3.45 4,500<br />
Greene 2,700 2.48 6,700 2,500 2.50 6,200<br />
Johnston 9,500 1.89 18,000 12,000 2.55 30,500<br />
Jones 1,100 2.55 2,800 1,900 2.60 4,900<br />
Lenoir 2,800 2.57 7,200 2,300 3.10 7,100<br />
Pitt 3,800 1.61 6,100 5,000 1.85 9,200<br />
Wayne 8,000 2.56 20,500 10,500 2.70 28,300<br />
Wilson 1,300 1.54 2,000 1,000 1.90 1,900<br />
C. Coastal 31,000 2.23 69,000 38,500 2.50 96,000<br />
Bladen 5,400 1.30 7,000 3,000 2.50 7,500<br />
Brunswick 2,600 2.77 7,200 2,300 2.85 6,500<br />
Columbus 3,400 1.82 6,200 4,900 2.25 11,000<br />
Cumberland 2,300 1.74 4,000 2,700 2.65 7,200<br />
Duplin 45,000 1.56 70,000 36,500 2.80 101,500<br />
Harnett 6,800 1.84 12,500 6,300 2.15 13,500<br />
Hoke 2,300 1.30 3,000 4,000 3.00 12,000<br />
Onslow 2,500 2.16 5,400 2,900 2.25 6,500<br />
Pender 1,700 1.88 3,200 1,500 2.00 3,000<br />
Robeson 10,500 2.19 23,000 9,700 2.10 20,400<br />
Sampson 27,500 2.18 60,000 35,500 2.50 89,500<br />
S. Coastal 111,000 1.82 202,000 110,500 2.55 281,000<br />
Other Counties 47,500 1.44 68,300 4,500 1.98 8,900<br />
State Total 699,000 1.50 1,050,000 808,000 2.00 1,622,000<br />
1 2008 Preliminary. 2 Counties may not add to district total because undisclosed data are included in other counties. * USDA NASS County Estimating Program Policy and<br />
Standards require districts and counties with less than 500 acres planted to a crop, or practice of a crop, are included in other counties. Coverage standards also apply to<br />
district and county estimates.<br />
Leading Counties 1 Tons<br />
Duplin 101,500<br />
Sampson 89,500<br />
Cabarrus 70,500<br />
Iredell 57,000<br />
Wilkes 50,300<br />
Randolph 46,000<br />
Davie 45,000<br />
Chatham 44,000<br />
Union 42,000<br />
Rowan 40,700<br />
1 Ranking of published counties only.<br />
800<br />
750<br />
700<br />
650<br />
600<br />
550<br />
ALL HAY<br />
2008 Production<br />
ALL HAY<br />
Harvested (Thousand Acres)<br />
1999 2000 2001 2002 2003 2004 2005 2006 2007 2008<br />
Tons<br />
Under 5,000 / Undisclosed<br />
5,000 to 9,999<br />
10,000 to 19,999<br />
20,000 to 39,999<br />
40,000 and up<br />
North Carolina Agricultural Statistics 73
Counties and<br />
Districts<br />
Acres<br />
Harvested<br />
74 North Carolina Agricultural Statistics<br />
IRISH POTATOES<br />
Acres, Yield and Production 1 2<br />
2007 2008<br />
Yield per<br />
Harvested Acre<br />
Production<br />
Acres<br />
Harvested<br />
Yield per<br />
Harvested Acre<br />
Acres Hundredweight Acres Hundredweight<br />
Production<br />
N. Mountain * * * * * *<br />
W. Mountain * * * * * *<br />
N. Piedmont * * * * * *<br />
C. Piedmont * * * * * *<br />
S. Piedmont * * * * * *<br />
Pasquotank 3,500 185 647,000 3,500 190 665,000<br />
Washington 2,000 180 356,000 1,800 152 273,000<br />
N. Coastal 11,000 195 2,134,000 11,100 182 2,023,000<br />
C. Coastal 3,100 165 512,000 2,800 175 490,000<br />
S. Coastal * * * * * *<br />
Other Counties 9,000 189 1,697,000 8,700 182 1,582,000<br />
State Total 14,500 186 2,700,000 14,000 180 2,520,000<br />
1 2008 Preliminary. 2 Counties may not add to district total because undisclosed data are included in other counties. * USDA NASS County Estimating Program Policy and Standards<br />
require districts and counties with less than 500 acres planted to a crop, or practice of a crop, are included in other counties. Coverage standards also apply to district<br />
and county estimates.<br />
20<br />
18<br />
16<br />
14<br />
12<br />
10<br />
IRISH POTATOES<br />
Planted and Harvested (Thousand Acres)<br />
1999 2000 2001 2002 2003 2004 2005 2006 2007 2008<br />
Planted Harvested
Counties and<br />
Districts<br />
Planted All<br />
Purposes<br />
Harvested for<br />
Grain<br />
SORGHUM<br />
Acres, Yield and Production 1 2<br />
2007 2008<br />
Yield per<br />
Harvested<br />
Acre<br />
Production<br />
Planted All<br />
Purposes<br />
Harvested for<br />
Grain<br />
Yield per<br />
Harvested<br />
Acre<br />
Acres Bushels Acres Bushels<br />
Production<br />
N. Mountain * * * * * * * *<br />
W. Mountain * * * * * * * *<br />
N. Piedmont 1,400 800 56 45,000 * * * *<br />
C. Piedmont 1,600 700 49 34,000 * * * *<br />
S. Piedmont 1,500 800 44 34,800 1,100 700 69 48,500<br />
Chowan 1,000 800 45 36,000 1,000 1,000 54 54,000<br />
Northampton * * * * 1,300 1,300 52 67,600<br />
Pasquotank * * * * 1,900 1,900 46 87,400<br />
Perquimans 1,000 800 81 65,000 500 500 53 26,500<br />
N. Coastal 4,700 3,800 57 217,800 7,100 6,900 53 364,700<br />
Beaufort * * * * 500 500 82 41,000<br />
Pamlico * * * * 600 600 80 48,000<br />
C. Coastal 1,500 1,100 63 69,400 2,500 2,000 72 144,500<br />
S. Coastal 1,000 700 46 32,200 * * * *<br />
Other Counties 10,000 6,400 53 339,000 10,200 7,200 56 403,500<br />
State Total 12,000 8,000 55 440,000 16,000 13,000 56 728,000<br />
1 2008 Preliminary. 2 Counties may not add to district total because undisclosed data are included in other counties. * USDA NASS County Estimating Program Policy and Standards<br />
require districts and counties with less than 500 acres planted to a crop, or practice of a crop, are included in other counties. Coverage standards also apply to district<br />
and county estimates.<br />
Leading Counties 1 Bushels<br />
Pasquotank 87,400<br />
Northampton 67,600<br />
Chowan 54,000<br />
Pamlico 48,000<br />
Beaufort 41,000<br />
1 Ranking of published counties only.<br />
20<br />
15<br />
10<br />
5<br />
0<br />
SORGHUM<br />
2008 Production<br />
SORGHUM<br />
Planted and Harvested (Thousand Acres)<br />
1998 1999 2000 2001 2002 2003 2004 2005 2006 2007<br />
Planted Harvested<br />
Bushels<br />
Under 40,000 / Undisclosed<br />
40,000 to 49,999<br />
50,000 to 59,999<br />
60,000 to 69,999<br />
70,000 and up<br />
North Carolina Agricultural Statistics 75
Counties and<br />
Districts<br />
Planted All<br />
Purposes<br />
Harvested for<br />
Grain<br />
76 North Carolina Agricultural Statistics<br />
OATS<br />
Acres, Yield and Production 1 2<br />
2007 2008<br />
Yield per<br />
Harvested<br />
Acre<br />
Production<br />
Planted All<br />
Purposes<br />
Harvested for<br />
Grain<br />
Yield per<br />
Harvested<br />
Acre<br />
Production<br />
Acres Bushels Acres Bushels<br />
N. Mountain * * * * 2,000 1,100 82 90,000<br />
W. Mountain * * * * 1,100 600 38 23,000<br />
Alamance * * * * 700 400 82 32,700<br />
Caswell * * * * 500 250 76 19,000<br />
Franklin 1,700 700 64 44,600 1,000 400 55 21,900<br />
Granville 1,300 100 34 3,400 1,300 350 57 20,000<br />
Guilford 900 350 49 17,000 * * * *<br />
Orange 500 100 76 7,600 800 300 70 21,000<br />
Rockingham * * * * 900 350 93 32,500<br />
Warren 1,300 250 33 8,200 1,700 400 58 23,000<br />
N. Piedmont 8,500 2,200 53 116,000 9,200 3,200 72 230,000<br />
Catawba 500 100 60 6,000 * * * *<br />
Chatham 600 150 77 11,500 * * * *<br />
Davidson 1,000 350 34 11,900 1,800 750 77 57,700<br />
Lee * * * * 900 300 91 27,400<br />
Randolph 1,400 200 46 9,200 1,800 800 83 66,500<br />
Rowan 500 200 45 9,000 * * * *<br />
Wake 1,800 500 28 14,000 2,300 950 69 65,600<br />
C. Piedmont 7,000 1,700 42 72,000 8,700 3,700 77 286,000<br />
Anson 800 300 52 15,500 * * * *<br />
Cabarrus 2,100 1,000 46 46,000 1,500 1,100 69 75,600<br />
Cleveland 1,700 350 43 15,200 1,900 800 100 80,000<br />
Lincoln 700 100 45 4,500 * * * *<br />
Moore 600 50 20 1,000 1,000 300 77 23,000<br />
Stanly 1,600 300 83 25,000 2,200 1,000 79 78,500<br />
Union 1,800 300 96 28,900 * * * *<br />
S. Piedmont 10,300 2,500 55 137,000 11,900 5,600 82 459,000<br />
Nash 500 200 55 11,000 * * * *<br />
N. Coastal 2,300 950 68 64,500 3,300 2,800 86 240,000<br />
Beaufort 1,900 1,800 80 144,000 1,800 1,700 105 178,000<br />
Johnston 1,800 400 56 22,500 2,000 1,100 85 93,000<br />
Pitt 700 * * * * * * *<br />
Wayne 1,100 300 37 11,200 950 500 88 44,000<br />
C. Coastal 8,300 3,700 68 250,000 8,600 5,000 88 440,000<br />
Bladen 600 100 63 6,300 750 350 70 24,500<br />
Columbus 1,200 200 48 9,500 1,250 650 63 41,000<br />
Cumberland * * * * 600 450 109 49,000<br />
Duplin 3,300 800 51 41,000 1,700 750 70 52,500<br />
Harnett 2,300 350 64 22,500 1,200 500 82 40,800<br />
Hoke 600 250 48 12,000 * * * *<br />
Robeson 1,100 500 48 24,000 2,900 1,400 81 112,700<br />
Sampson 1,800 800 29 23,000 3,150 1,700 78 132,300<br />
Scotland * * * * * * * *<br />
S. Coastal 12,300 3,500 46 162,000 15,200 8,000 79 632,000<br />
Other Counties 12,300 3,900 56 219,500 23,400 12,450 79 987,800<br />
State Total 50,000 15,000 55 825,000 60,000 30,000 80 2,400,000<br />
1 2 2008 Preliminary. Counties may not add to district total because undisclosed data are included in other counties. * USDA NASS County Estimating Program Policy and Standards<br />
require districts and counties with less than 500 acres planted to a crop, or practice of a crop, be included in other counties. Coverage standards also apply to district<br />
and county estimates.
Leading Counties 1 Bushels<br />
Beaufort 178,000<br />
Sampson 132,300<br />
Robeson 112,700<br />
Johnston 93,000<br />
Cleveland 80,000<br />
Stanly 78,500<br />
Cabarrus 75,600<br />
Randolph 66,500<br />
Wake 65,600<br />
Davidson 57,700<br />
1 Ranking of published counties only.<br />
75<br />
60<br />
45<br />
30<br />
15<br />
0<br />
OATS<br />
2008 Production<br />
OATS<br />
Planted and Harvested (Thousand Acres)<br />
1999 2000 2001 2002 2003 2004 2005 2006 2007 2008<br />
Planted Harvested<br />
Bushels<br />
Under 10,000 / Undisclosed<br />
10,000 to 24,999<br />
25,000 to 59,999<br />
50,000 to 199,999<br />
200,000 and up<br />
North Carolina Agricultural Statistics 77
Counties and<br />
Districts<br />
Acres<br />
Harvested<br />
78 North Carolina Agricultural Statistics<br />
PEANUTS<br />
Acres, Yield and Production 1 2<br />
2007 2008<br />
Yield per<br />
Harvested Acre<br />
Production<br />
Acres<br />
Harvested<br />
Yield per<br />
Harvested Acre<br />
Acres Pounds Acres Pounds<br />
Production<br />
N. Mountain * * * * * *<br />
W. Mountain * * * * * *<br />
N. Piedmont * * * * * *<br />
C. Piedmont * * * * * *<br />
S. Piedmont * * * * * *<br />
Bertie 9,500 3,370 32,000,000 9,700 3,555 34,500,000<br />
Chowan 5,550 3,800 21,100,000 5,000 4,000 20,000,000<br />
Edgecombe 9,500 2,475 23,500,000 7,500 3,360 25,200,000<br />
Gates 3,700 3,785 14,000,000 3,600 4,305 15,500,000<br />
Halifax 6,800 2,060 14,000,000 7,400 3,310 24,500,000<br />
Hertford 4,700 2,660 12,500,000 5,000 3,560 17,800,000<br />
Martin 9,350 3,155 29,500,000 10,300 3,835 39,500,000<br />
Nash 3,700 2,460 9,100,000 3,900 3,435 13,400,000<br />
Northampton 5,400 2,720 14,700,000 5,000 3,700 18,500,000<br />
Perquimans 2,600 3,775 9,820,000 2,400 4,040 9,700,000<br />
Washington 1,700 2,575 4,380,000 1,700 2,530 4,300,000<br />
N. Coastal 62,500 2,955 184,600,000 61,500 3,625 222,900,000<br />
Greene 1,300 3,000 3,900,000 1,600 3,815 6,100,000<br />
Johnston * * * 1,100 3,725 4,100,000<br />
Jones * * * 900 4,000 3,600,000<br />
Pitt 4,250 2,705 11,500,000 5,100 3,530 18,000,000<br />
Wayne * * * 1,900 3,735 7,100,000<br />
C. Coastal 9,100 2,955 26,900,000 13,500 3,705 50,000,000<br />
Bladen 5,350 2,615 14,000,000 6,000 4,265 25,600,000<br />
Columbus 3,600 2,445 8,800,000 3,200 3,905 12,500,000<br />
Duplin 2,400 3,625 8,700,000 3,100 3,905 12,100,000<br />
Robeson 1,200 3,535 4,240,000 2,700 3,750 10,125,000<br />
Scotland * * * 2,100 3,335 7,000,000<br />
S. Coastal 18,350 2,690 49,400,000 22,000 3,910 86,000,000<br />
Other Counties 9,400 2,687 25,260,000 7,800 3,817 29,775,000<br />
State Total 90,000 2,900 261,000,000 97,000 3,700 358,900,000<br />
1 2 2008 Preliminary. Counties may not add to district total because undisclosed data are included in other counties. * USDA NASS County Estimating Program Policy and Standards<br />
require districts and counties with less than 500 acres planted to a crop, or practice of a crop, be included in other counties. Coverage standards also apply to district<br />
and county estimates.
Leading Counties 1 Pounds<br />
Martin 39,500,000<br />
Bertie 34,500,000<br />
Bladen 25,600,000<br />
Edgecombe 25,200,000<br />
Halifax 24,500,000<br />
Chowan 20,000,000<br />
Northampton 18,500,000<br />
Pitt 18,000,000<br />
Hertford 17,800,000<br />
Gates 15,500,000<br />
1 Ranking of published counties only.<br />
140<br />
120<br />
100<br />
80<br />
60<br />
PEANUTS<br />
2008 Production<br />
PEANUTS<br />
Planted and Harvested (Thousand Acres)<br />
1999 2000 2001 2002 2003 2004 2005 2006 2007 2008<br />
Planted Harvested<br />
Pounds<br />
Under 5,000,000 / Undisclosed<br />
5,000,000 to 9,999,999<br />
10,000,000 to 14,999,999<br />
15,000,000 to 24,999,999<br />
25,000,000 and up<br />
North Carolina Agricultural Statistics 79
Counties and<br />
Districts<br />
Planted All<br />
Purposes<br />
Harvested for<br />
Grain<br />
80 North Carolina Agricultural Statistics<br />
SOYBEANS FOR BEANS<br />
Acres, Yield and Production 1 2<br />
2007 2008<br />
Yield per<br />
Harvested<br />
Acre<br />
Production<br />
Planted All<br />
Purposes<br />
Harvested for<br />
Grain<br />
Yield per<br />
Harvested<br />
Acre<br />
Acres Bushels Acres Bushels<br />
Production<br />
Caldwell 800 800 16.0 12,800 800 800 35.0 28,000<br />
Surry 8,100 7,300 32.0 231,200 9,600 9,300 35.5 332,000<br />
Yadkin 13,700 13,000 20.0 255,200 16,800 16,700 31.5 528,000<br />
N. Mountain 23,000 21,500 23.0 505,000 27,800 27,200 33.0 902,000<br />
Burke 600 600 18.0 10,700 700 700 33.0 23,000<br />
Rutherford 1,000 860 19.0 16,200 * * * *<br />
W. Mountain 2,600 2,400 20.0 47,000 3,100 2,800 24.5 69,000<br />
Alamance 3,700 2,080 10.0 21,000 3,200 2,900 32.0 93,000<br />
Caswell 2,400 1,580 15.0 24,100 2,400 2,200 24.0 53,000<br />
Durham 900 280 14.0 4,000 * * * *<br />
Forsyth 2,500 2,130 16.0 35,000 3,800 3,300 30.5 101,000<br />
Franklin 17,200 16,500 11.0 176,500 17,100 16,900 29.0 491,000<br />
Granville 5,000 1,700 10.0 16,900 4,500 3,500 21.5 76,000<br />
Guilford 9,000 8,000 13.0 103,100 9,200 8,800 30.5 267,000<br />
Orange 3,500 2,310 22.0 50,000 3,400 3,000 27.5 83,000<br />
Person 12,800 9,000 8.0 74,400 13,100 11,300 26.5 302,000<br />
Rockingham 5,000 3,750 18.0 68,000 5,100 4,100 28.0 115,000<br />
Stokes 1,500 1,070 15.0 16,000 * * * *<br />
Vance 6,000 4,800 14.0 66,000 6,800 6,500 34.0 222,000<br />
Warren 7,700 6,800 10.0 67,000 8,100 8,000 32.5 260,000<br />
N. Piedmont 77,200 60,000 12.0 722,000 79,200 72,600 29.0 2,108,000<br />
Alexander 1,500 1,000 15.0 15,000 1,700 1,600 37.0 59,000<br />
Catawba 6,700 5,750 9.0 53,200 6,400 6,300 39.0 246,000<br />
Chatham 2,800 1,300 16.0 20,700 2,600 2,500 26.5 66,000<br />
Davidson 7,800 6,850 21.0 142,500 8,300 8,100 32.0 261,000<br />
Davie 5,200 4,850 16.0 75,500 6,600 6,600 32.0 211,000<br />
Iredell 13,000 11,000 18.0 195,600 14,400 14,300 35.0 500,000<br />
Lee 5,900 2,550 8.0 19,600 5,600 5,500 30.0 166,000<br />
Randolph 9,900 7,600 16.0 119,000 9,200 8,600 31.0 268,000<br />
Rowan 17,000 16,200 12.0 191,400 17,200 17,100 37.0 632,000<br />
Wake 17,000 14,000 10.0 143,500 17,400 17,300 25.0 434,000<br />
C. Piedmont 86,800 71,100 14.0 976,000 89,400 87,900 32.5 2,843,000<br />
Anson 10,400 10,000 13.0 127,500 12,400 12,300 38.5 474,000<br />
Cabarrus 6,100 4,630 8.0 39,300 6,300 6,200 36.5 227,000<br />
Cleveland 11,000 10,000 7.0 69,000 11,700 11,600 32.0 370,000<br />
Gaston * * * * 2,000 2,000 39.5 79,000<br />
Lincoln 5,600 4,700 7.0 33,500 5,200 5,200 33.5 175,000<br />
Mecklenburg 1,400 900 10.0 8,800 1,200 1,100 32.0 35,000<br />
Montgomery 500 430 15.0 6,400 * * * *<br />
Moore 5,200 4,330 13.0 54,200 5,000 5,000 28.5 142,000<br />
Stanly 17,500 17,500 13.0 234,800 21,500 21,100 36.5 775,000<br />
Union 50,500 50,000 13.0 632,300 55,500 55,400 39.5 2,201,000<br />
S. Piedmont 112,000 106,000 12.0 1,239,000 127,000 126,000 37.0 4,667,000<br />
Bertie 21,000 20,100 26.0 525,100 30,100 30,000 31.0 930,000<br />
Camden 30,000 28,900 38.0 1,085,300 31,600 31,400 36.5 1,147,000<br />
Currituck 14,500 14,400 37.0 531,500 17,100 17,000 36.5 623,000<br />
Edgecombe 33,900 33,800 21.0 702,600 44,000 43,800 28.0 1,219,000<br />
Gates 16,200 16,100 30.0 489,000 20,500 20,400 35.0 711,000<br />
Halifax 31,000 31,000 25.0 763,200 33,200 33,100 32.5 1,082,000<br />
Hertford 14,500 14,500 20.0 287,000 17,400 17,200 29.5 509,000<br />
Martin 15,900 15,800 24.0 373,000 21,300 21,000 31.5 662,000<br />
Nash 30,000 29,500 13.0 378,500 33,300 33,200 28.5 938,000<br />
Northampton 32,000 31,800 22.0 695,200 42,700 42,400 33.0 1,400,000<br />
Pasquotank 44,800 44,800 28.0 1,263,000 51,100 50,700 33.0 1,670,000<br />
Perquimans 31,000 31,000 32.0 1,002,400 39,900 39,800 35.0 1,384,000<br />
Tyrrell 34,000 33,500 44.0 1,473,000 40,300 40,100 37.5 1,510,000<br />
Washington 32,400 32,000 35.0 1,127,000 42,900 42,700 35.0 1,500,000<br />
N. Coastal 392,000 388,000 28.0 11,004,000 479,500 476,500 33.0 15,767,000
Counties and<br />
Districts<br />
Planted All<br />
Purposes<br />
Harvested for<br />
Grain<br />
SOYBEANS FOR BEANS<br />
Acres, Yield and Production 1 2<br />
2007 2008<br />
Yield per<br />
Harvested<br />
Acre<br />
Production<br />
Planted All<br />
Purposes<br />
Harvested for<br />
Grain<br />
Yield per<br />
Harvested<br />
Acre<br />
Acres Bushels Acres Bushels<br />
Production<br />
Beaufort 58,000 57,600 37.0 2,120,700 69,800 69,200 36.0 2,478,000<br />
Carteret 21,400 21,300 41.0 874,900 21,600 21,500 42.0 905,000<br />
Craven 24,000 23,900 25.0 607,000 27,200 27,000 36.0 973,000<br />
Greene 24,800 24,700 21.0 518,800 30,800 30,700 28.0 867,000<br />
Hyde 25,500 25,300 42.0 1,057,700 30,500 30,200 39.0 1,185,000<br />
Johnston 51,000 49,500 14.0 674,000 58,500 57,900 31.5 1,825,000<br />
Jones 15,700 15,500 27.0 423,000 19,700 19,500 35.0 683,000<br />
Lenoir 29,200 29,000 25.0 714,300 36,000 35,600 29.5 1,052,000<br />
Pamlico 20,000 19,700 41.0 803,700 18,900 18,700 40.0 747,000<br />
Pitt 54,500 54,200 22.0 1,172,500 66,800 66,200 28.0 1,868,000<br />
Wayne 55,300 55,200 20.0 1,082,200 60,200 59,700 32.0 1,925,000<br />
Wilson 30,300 30,100 20.0 610,200 38,000 37,800 31.0 1,163,000<br />
C. Coastal 409,700 406,000 26.0 10,659,000 478,000 474,000 33.0 15,671,000<br />
Bladen 15,500 14,900 16.0 236,000 23,900 23,600 27.5 649,000<br />
Brunswick 7,300 7,230 16.0 115,900 7,700 7,500 30.0 225,000<br />
Columbus 42,000 41,000 18.0 718,700 52,700 52,100 28.0 1,448,000<br />
Cumberland 18,000 16,800 14.0 243,400 19,000 18,900 35.5 670,000<br />
Duplin 41,300 39,500 20.0 784,600 53,000 52,800 32.0 1,702,000<br />
Harnett 24,000 22,600 13.0 293,400 26,500 26,300 33.5 875,000<br />
Hoke 10,700 10,500 11.0 118,000 14,000 13,900 39.0 541,000<br />
Onslow 13,000 13,000 28.0 361,400 15,300 15,200 33.0 500,000<br />
Robeson 90,000 87,100 13.0 1,138,600 104,500 104,000 32.5 3,370,000<br />
Sampson 50,800 48,700 16.0 780,300 59,900 59,700 35.5 2,126,000<br />
Scotland 10,400 9,970 10.0 96,200 13,200 13,000 35.0 456,000<br />
S. Coastal 336,700 325,000 16.0 5,208,000 406,000 403,000 32.5 13,083,000<br />
Other Counties 29,700 29,350 23.5 688,800 42,100 40,400 32.1 1,297,000<br />
State Total 1,440,000 1,380,000 22.0 30,360,000 1,690,000 1,670,000 33.0 55,110,000<br />
1 2008 Preliminary. 2 Counties may not add to district total because undisclosed data are included in other counties. * USDA NASS County Estimating Program Policy and Standards<br />
require districts and counties with less than 500 acres planted to a crop, or practice of a crop, are included in other counties. Coverage standards also apply to district<br />
and county estimates.<br />
Leading Counties 1 Bushels<br />
Robeson 3,370,000<br />
Beaufort 2,478,000<br />
Union 2,201,000<br />
Sampson 2,126,000<br />
Wayne 1,925,000<br />
Pitt 1,868,000<br />
Johnston 1,825,000<br />
Duplin 1,702,000<br />
Pasquotank 1,670,000<br />
Tyrrell 1,510,000<br />
1 Ranking of published counties only.<br />
1600<br />
1500<br />
1400<br />
1300<br />
1200<br />
1100<br />
SOYBEANS FOR BEANS<br />
2008 Production<br />
SOYBEANS FOR BEANS<br />
Planted and Harvested (Thousand Acres)<br />
1999 2000 2001 2002 2003 2004 2005 2006 2007 2008<br />
Planted Harvested<br />
Bushels<br />
Under 100,000 / Undisclosed<br />
100,000 to 499,999<br />
500,000 to 999,999<br />
1,000,000 to 1,499,999<br />
1,500,000 and up<br />
North Carolina Agricultural Statistics 81
Counties and<br />
Districts<br />
Acres<br />
Harvested<br />
82 North Carolina Agricultural Statistics<br />
SWEET POTATOES<br />
Acres, Yield and Production 1 2<br />
2007 2008<br />
Yield per<br />
Harvested Acre<br />
Production<br />
Acres<br />
Harvested<br />
Yield per<br />
Harvested Acre<br />
Acres Hundredweight Acres Hundredweight<br />
Production<br />
N. Mountain * * * * * *<br />
W. Mountain * * * * * *<br />
N. Piedmont * * * * * *<br />
C. Piedmont 900 100 90,000 800 180 145,000<br />
S. Piedmont * * * * * *<br />
Chowan * * * 300 200 59,700<br />
Edgecombe * * * 4,500 130 595,000<br />
Nash 6,800 155 1,049,500 6,500 205 1,337,000<br />
N. Coastal 11,800 155 1,805,000 12,000 175 2,118,000<br />
Johnston 6,800 135 918,000 6,900 175 1,210,000<br />
Wayne 2,200 165 358,000 2,900 240 700,000<br />
Wilson 3,600 260 936,000 4,400 255 1,130,000<br />
C. Coastal 17,000 170 2,900,000 18,800 205 3,900,000<br />
Columbus 2,100 120 256,000 * * *<br />
Harnett 1,500 120 180,000 1,000 175 173,000<br />
Sampson 6,200 160 998,000 7,300 205 1,480,000<br />
S. Coastal 13,100 140 1,854,000 14,000 180 2,540,000<br />
Other Counties 13,800 143 1,969,500 12,200 168 2,055,300<br />
State Total 43,000 155 6,665,000 46,000 190 8,740,000<br />
1 2008 Preliminary. 2 Counties may not add to district total because undisclosed data are included in other counties. * USDA NASS County Estimating Program Policy and Standards<br />
require districts and counties with less than 100 acres planted to a crop, or practice of a crop, are included in other counties. Coverage standards also apply to district<br />
and county estimates.<br />
Leading Counties 1 Hundredweight<br />
Sampson 1,480,000<br />
Nash 1,337,000<br />
Johnston 1,210,000<br />
Wilson 1,130,000<br />
Wayne 700,000<br />
Edgecombe 595,000<br />
Harnett 173,000<br />
Chowan 59,700<br />
1 Ranking of published counties only.<br />
49<br />
44<br />
39<br />
34<br />
29<br />
24<br />
SWEET POTATOES<br />
2008 Production<br />
SWEET POTATOES<br />
Planted and Harvested (Thousand Acres)<br />
1999 2000 2001 2002 2003 2004 2005 2006 2007 2008<br />
Planted Harvested<br />
Hundredweight<br />
Under 100,000 / Undisclosed<br />
100,000 to 499,999<br />
500,000 to 699,999<br />
700,000 to 999,999<br />
1,000,000 and up
Counties and<br />
Districts<br />
Acres<br />
Harvested<br />
BURLEY TOBACCO<br />
Acres, Yield and Production 1 2<br />
2007 2008<br />
Yield per<br />
Harvested Acre<br />
Production Acres Harvested<br />
Yield per<br />
Harvested Acre<br />
Acres Pounds Acres Pounds<br />
Production<br />
Alleghany 205 1,810 371,000 175 1,880 329,000<br />
Ashe 110 1,480 163,000 * * *<br />
Surry 325 1,585 515,000 285 1,545 440,000<br />
Yadkin 120 1,875 225,000 * * *<br />
N. Mountain 830 1,685 1,398,000 660 1,695 1,120,000<br />
Buncombe 180 1,035 186,000 150 965 145,000<br />
Madison 315 1,670 526,000 220 1,590 350,000<br />
Yancey 100 1,340 134,000 * * *<br />
W. Mountain 740 1,420 1,051,000 570 1,405 800,000<br />
Caswell 190 1,815 345,000 150 1,800 270,000<br />
Person 135 2,350 317,000 140 2,100 294,000<br />
Rockingham 400 2,095 837,000 310 2,000 620,000<br />
Stokes 200 1,625 325,000 260 1,760 458,000<br />
N. Piedmont 1,360 1,880 2,556,000 1,170 1,865 2,180,000<br />
C. Piedmont 400 1,510 604,000 320 1,640 525,000<br />
S. Piedmont * * * * * *<br />
N. Coastal * * * * * *<br />
C. Coastal * * * 325 1,845 600,000<br />
S. Coastal * * * * * *<br />
* * * * * *<br />
Other Counties 1,720 1,544 2,656,000 1,610 1,680 2,704,000<br />
State Total 4,000 1,650 6,600,000 3,300 1,700 5,610,000<br />
1 2008 Preliminary. 2 Counties may not add to district total because undisclosed data are included in other counties. * USDA NASS County Estimating Program Policy and Standards<br />
require districts and counties with less than 100 acres planted to a crop, or practice of a crop, are included in other counties. Coverage standards also apply to district<br />
and county estimates.<br />
Leading Counties 1 Pounds<br />
Rockingham 620,000<br />
Stokes 458,000<br />
Surry 440,000<br />
Madison 350,000<br />
Alleghany 329,000<br />
Person 294,000<br />
Caswell 270,000<br />
Buncombe 145,000<br />
1 Ranking of published counties only.<br />
10<br />
8<br />
6<br />
4<br />
2<br />
0<br />
BURLEY TOBACCO<br />
2008 Production<br />
BURLEY TOBACCO<br />
Harvested (Thousand Acres)<br />
1999 2000 2001 2002 2003 2004 2005 2006 2007 2008<br />
Pounds<br />
Under 145,000 / Undisclosed<br />
145,000 to 299,999<br />
300,000 to 399,999<br />
400,000 to 499,999<br />
500,000 and up<br />
North Carolina Agricultural Statistics 83
Counties and<br />
Districts<br />
Acres<br />
Harvested<br />
84 North Carolina Agricultural Statistics<br />
FLUE-CURED TOBACCO<br />
Acres, Yield and Production 1 2<br />
2007 2008<br />
Yield per<br />
Harvested Acre<br />
Production<br />
Acres<br />
Harvested<br />
Yield per<br />
Harvested Acre<br />
Acres Pounds Acres Pounds<br />
Production<br />
Surry 3,520 2,010 7,070,000 3,340 2,140 7,143,000<br />
Yadkin 3,050 2,000 6,100,000 2,810 2,420 6,804,000<br />
N. Mountain 7,000 2,055 14,390,000 6,600 2,300 15,169,000<br />
W. Mountain * * * * * *<br />
Alamance 1,490 1,555 2,320,000 1,430 2,110 3,019,000<br />
Caswell 2,520 1,700 4,287,000 2,350 2,460 5,783,000<br />
Durham 220 2,060 453,000 260 2,735 711,000<br />
Forsyth 770 2,015 1,550,000 860 2,085 1,793,000<br />
Franklin 3,650 2,645 9,650,000 3,180 2,630 8,368,000<br />
Granville 3,200 1,565 5,000,000 3,060 2,370 7,258,000<br />
Guilford 1,840 1,825 3,360,000 1,840 2,655 4,882,000<br />
Orange 810 1,915 1,550,000 700 2,755 1,929,000<br />
Person 3,250 2,045 6,650,000 3,310 2,425 8,022,000<br />
Rockingham 3,600 2,210 7,960,000 3,490 2,365 8,250,000<br />
Stokes 1,920 1,970 3,780,000 2,020 2,095 4,234,000<br />
Vance 2,070 2,410 4,990,000 1,790 2,770 4,958,000<br />
Warren 1,060 2,360 2,500,000 1,210 2,660 3,218,000<br />
N. Piedmont 26,400 2,045 54,050,000 25,500 2,450 62,425,000<br />
Alexander 450 1,710 770,000 * * *<br />
Davidson 635 1,985 1,260,000 700 2,135 1,494,000<br />
Davie 205 2,510 515,000 240 2,465 592,000<br />
Iredell * * * 300 2,925 877,000<br />
Lee 1,700 2,530 4,300,000 2,260 2,250 5,090,000<br />
Randolph 780 1,845 1,440,000 810 2,150 1,743,000<br />
Wake 2,725 2,090 5,700,000 2,770 2,460 6,814,000<br />
C. Piedmont 6,900 2,155 14,861,000 7,900 2,330 18,398,000<br />
Moore 1,280 2,150 2,750,000 1,210 2,250 2,720,000<br />
Richmond 450 2,065 930,000 * * *<br />
S. Piedmont 1,900 2,145 4,080,000 1,500 2,275 3,415,000<br />
Bertie 2,690 2,480 6,667,000 3,490 2,460 8,588,000<br />
Chowan * * * 100 2,030 203,000<br />
Edgecombe 6,220 2,290 14,250,000 7,200 2,325 16,737,000<br />
Halifax 1,810 2,530 4,575,000 2,500 2,740 6,854,000<br />
Hertford 1,480 2,145 3,175,000 1,540 2,405 3,706,000<br />
Martin 4,180 2,705 11,300,000 4,570 2,435 11,138,000<br />
Nash 9,130 2,365 21,610,000 9,670 2,495 24,109,000<br />
N. Coastal 26,000 2,405 62,559,000 29,500 2,455 72,470,000<br />
Beaufort 2,690 2,365 6,360,000 2,410 2,030 4,889,000<br />
Craven 1,570 2,515 3,950,000 1,690 2,115 3,576,000<br />
Greene 6,030 2,440 14,700,000 6,330 2,005 12,702,000<br />
Johnston 11,100 2,305 25,600,000 10,610 2,395 25,404,000<br />
Jones 1,830 2,460 4,500,000 1,610 1,855 2,989,000<br />
Lenoir 7,500 2,305 17,300,000 8,030 1,790 14,366,000<br />
Pamlico 200 2,400 480,000 * * *<br />
Pitt 8,210 2,325 19,100,000 8,780 1,895 16,637,000<br />
Wayne 8,890 2,450 21,800,000 9,490 2,120 20,109,000<br />
Wilson 8,560 2,640 22,600,000 9,130 2,520 23,013,000<br />
C. Coastal 56,600 2,410 136,440,000 58,300 2,130 124,168,000
Counties and<br />
Districts<br />
Acres<br />
Harvested<br />
FLUE-CURED TOBACCO<br />
Acres, Yield and Production 1 2<br />
2007 2008<br />
Yield per<br />
Harvested Acre<br />
Production<br />
Acres<br />
Harvested<br />
Yield per<br />
Harvested Acre<br />
Acres Pounds Acres Pounds<br />
Production<br />
Bladen 820 2,305 1,890,000 690 2,290 1,579,000<br />
Brunswick 640 2,345 1,500,000 520 2,010 1,046,000<br />
Columbus 5,060 2,125 10,750,000 5,100 1,980 10,097,000<br />
Cumberland 2,680 1,680 4,500,000 2,730 1,885 5,141,000<br />
Duplin 6,290 2,240 14,100,000 6,250 1,925 12,030,000<br />
Harnett 6,020 2,500 15,050,000 7,310 2,500 18,264,000<br />
Hoke 430 1,630 700,000 300 2,230 669,000<br />
Onslow 1,320 2,575 3,400,000 990 1,610 1,594,000<br />
Pender 770 2,595 2,000,000 700 2,290 1,604,000<br />
Robeson 5,190 1,925 10,000,000 4,780 2,260 10,809,000<br />
Sampson 11,750 2,240 26,300,000 12,180 2,100 25,553,000<br />
S. Coastal 41,200 2,195 90,440,000 41,700 2,125 88,705,000<br />
Other Counties 1,745 2,165 3,778,000 2,360 2,391 5,642,000<br />
State Total 166,000 2,270 376,820,000 171,000 2,250 384,750,000<br />
1 2008 Preliminary. 2 Counties may not add to district total because undisclosed data are included in other counties. * USDA NASS County Estimating Program Policy and Standards<br />
require districts and counties with less than 100 acres planted to a crop, or practice of a crop, are included in other counties. Coverage standards also apply to district<br />
and county estimates.<br />
Leading Counties 1 Pounds<br />
Sampson 25,553,000<br />
Johnston 25,404,000<br />
Nash 24,109,000<br />
Wilson 23,013,000<br />
Wayne 20,109,000<br />
Harnett 18,264,000<br />
Edgecombe 16,737,000<br />
Pitt 16,637,000<br />
Lenoir 14,366,000<br />
Greene 12,702,000<br />
1 Ranking of published counties only.<br />
250<br />
200<br />
150<br />
100<br />
50<br />
0<br />
FLUE-CURED TOBACCO<br />
2008 Production<br />
FLUE-CURED TOBACCO<br />
Harvested (Thousand Acres)<br />
1999 2000 2001 2002 2003 2004 2005 2006 2007 2008<br />
Pounds<br />
Under 1,000,000 / Undisclosed<br />
1,000,000 to 4,999,999<br />
5,000,000 to 9,999,999<br />
10,000,000 to 14,999,999<br />
15,000,000 and up<br />
North Carolina Agricultural Statistics 85
Counties and<br />
Districts<br />
Planted<br />
All Purposes<br />
Harvested for<br />
Grain<br />
86 North Carolina Agricultural Statistics<br />
WHEAT<br />
Acres, Yield and Production 1 2<br />
2007 2008<br />
Yield per<br />
Harvested<br />
Acre<br />
Production<br />
Planted<br />
All Purposes<br />
Harvested for<br />
Grain<br />
Yield per<br />
Harvested<br />
Acre<br />
Acres Bushels Acres Bushels<br />
Production<br />
Caldwell 500 400 35.0 14,000 500 400 44.0 17,500<br />
Surry 2,600 2,000 55.0 110,000 3,000 2,600 61.5 160,000<br />
Yadkin 4,600 3,900 44.0 173,000 6,700 6,100 67.0 409,000<br />
N. Mountain 11,000 9,000 42.0 378,000 13,500 10,000 62.5 627,000<br />
Burke 500 200 27.0 5,400 * * * *<br />
W. Mountain 4,000 1,000 32.0 32,000 3,000 1,000 54.0 54,000<br />
Alamance 3,300 2,300 41.0 94,000 3,500 3,000 56.0 168,000<br />
Caswell 1,900 1,300 42.0 55,000 2,500 2,000 50.0 100,000<br />
Durham 1,000 800 60.0 48,000 * * * *<br />
Forsyth 1,400 900 30.0 27,000 1,200 1,000 51.0 51,000<br />
Franklin 5,800 4,900 43.0 209,000 7,300 6,500 63.0 410,000<br />
Granville 4,100 2,600 33.0 86,000 4,400 2,500 54.5 136,000<br />
Guilford 5,400 4,500 46.0 209,000 6,500 6,000 52.5 315,000<br />
Orange 3,000 1,900 55.0 105,000 3,700 2,900 58.5 170,000<br />
Person 7,500 6,300 36.0 226,000 9,700 9,000 54.5 491,000<br />
Rockingham 5,500 4,500 42.0 190,000 6,100 5,600 55.0 308,000<br />
Stokes 900 700 43.0 30,000 * * * *<br />
Vance 2,200 1,800 46.0 82,000 3,100 2,800 59.5 167,000<br />
Warren 2,000 1,500 46.0 69,000 2,800 2,400 63.5 152,000<br />
N. Piedmont 44,000 34,000 42.0 1,430,000 52,500 45,000 56.5 2,550,000<br />
Alexander 1,200 700 31.0 22,000 1,600 1,000 56.0 56,000<br />
Catawba 3,900 3,000 38.0 114,000 4,300 4,000 65.0 260,000<br />
Chatham 1,800 1,400 46.0 65,000 2,000 1,600 61.5 98,000<br />
Davidson 3,000 2,400 44.0 105,000 3,500 2,900 64.0 186,000<br />
Davie 4,000 3,200 36.0 116,000 4,200 3,500 66.5 233,000<br />
Iredell 8,700 6,500 42.0 273,000 12,000 8,400 65.5 549,000<br />
Lee 1,800 1,300 42.0 55,000 2,000 2,000 65.0 130,000<br />
Randolph 4,200 3,000 46.0 138,000 5,500 4,400 58.0 255,000<br />
Rowan 8,400 6,500 45.0 292,000 10,100 9,200 71.5 656,000<br />
Wake 4,000 3,000 30.0 90,000 4,800 4,000 52.0 208,000<br />
C. Piedmont 41,000 31,000 41.0 1,270,000 50,000 41,000 64.0 2,631,000<br />
Anson 3,800 3,000 35.0 105,000 6,200 5,300 64.5 343,000<br />
Cabarrus 3,300 2,500 28.0 70,000 3,800 3,000 59.5 179,000<br />
Cleveland 3,700 2,900 27.0 78,000 6,500 6,000 66.5 398,000<br />
Gaston * * * * 1,200 800 56.5 45,000<br />
Lincoln 3,300 2,700 31.0 84,000 3,800 3,400 63.0 215,000<br />
Mecklenburg 1,400 1,000 41.0 41,000 1,000 900 60.0 54,000<br />
Moore 1,100 800 15.0 12,000 1,300 1,100 55.5 61,000<br />
Stanly 8,500 6,800 43.0 290,000 13,000 8,500 63.5 540,000<br />
Union 40,000 32,000 38.0 1,216,000 42,800 42,000 69.5 2,909,000<br />
S. Piedmont 67,000 53,000 36.0 1,920,000 82,500 73,500 66.0 4,850,000<br />
Bertie 4,200 3,700 44.0 162,000 9,000 6,500 59.5 388,000<br />
Camden 10,800 9,800 54.0 530,000 14,000 12,000 70.5 843,000<br />
Chowan 4,200 3,100 58.0 180,000 8,000 7,200 70.5 509,000<br />
Currituck 6,600 5,200 65.0 339,000 8,500 8,300 69.5 578,000<br />
Edgecombe 12,000 9,900 37.0 363,000 18,500 17,000 53.0 904,000<br />
Gates 4,700 4,300 56.0 242,000 10,500 9,500 74.0 702,000<br />
Halifax 24,000 3,500 33.0 115,000 18,000 9,000 52.0 467,000<br />
Hertford * * * * 5,800 5,000 63.0 315,000<br />
Martin 7,200 5,600 46.0 257,000 11,500 9,500 55.0 523,000<br />
Nash 8,000 5,600 48.0 270,000 10,500 9,000 57.0 511,000<br />
Northampton 11,000 6,500 50.0 328,000 15,800 12,500 65.0 811,000<br />
Pasquotank 23,000 21,000 46.0 966,000 31,000 29,000 68.5 1,992,000<br />
Perquimans 14,500 13,200 64.0 844,000 23,800 22,000 71.5 1,577,000<br />
Tyrrell 19,200 17,500 62.0 1,085,000 23,500 20,500 62.5 1,286,000<br />
Washington 19,000 17,300 47.0 813,000 26,000 24,000 57.0 1,369,000<br />
N. Coastal 172,000 129,000 51.0 6,640,000 235,000 201,000 63.5 12,775,000
Counties and<br />
Districts<br />
Planted<br />
All Purposes<br />
Harvested for<br />
Grain<br />
WHEAT<br />
Acres, Yield and Production 1 2<br />
2007 2008<br />
Yield per<br />
Harvested<br />
Acre<br />
Production<br />
Planted<br />
All Purposes<br />
Harvested for<br />
Grain<br />
Yield per<br />
Harvested<br />
Acre<br />
Acres Bushels Acres Bushels<br />
Production<br />
Beaufort 31,800 26,000 46.0 1,200,000 43,500 42,500 62.0 2,627,000<br />
Carteret 7,000 5,800 46.0 268,000 9,500 7,800 65.5 512,000<br />
Craven 5,800 4,800 46.0 222,000 11,000 9,000 62.5 563,000<br />
Greene 6,900 5,700 47.0 266,000 9,900 8,800 59.5 524,000<br />
Hyde 11,400 9,400 55.0 516,000 16,100 15,500 64.5 997,000<br />
Johnston 10,500 8,800 44.0 388,000 15,500 13,900 61.5 853,000<br />
Jones 4,200 3,400 35.0 120,000 11,500 11,000 45.0 495,000<br />
Lenoir 11,500 9,200 27.0 250,000 15,500 15,000 48.5 730,000<br />
Pamlico 8,500 7,200 48.0 345,000 10,500 9,500 55.5 529,000<br />
Pitt 20,500 17,800 41.0 725,000 29,000 27,000 57.0 1,540,000<br />
Wayne 27,900 23,900 30.0 720,000 32,500 30,000 60.0 1,806,000<br />
Wilson 10,000 5,000 40.0 200,000 13,000 10,000 59.0 588,000<br />
C. Coastal 156,000 127,000 41.0 5,220,000 217,500 200,000 59.0 11,764,000<br />
Bladen 5,000 4,000 23.0 93,000 7,500 6,000 42.5 254,000<br />
Brunswick 1,400 1,300 25.0 33,000 1,400 1,200 49.0 59,000<br />
Columbus 13,200 11,500 25.0 285,000 17,000 14,500 49.0 710,000<br />
Cumberland 5,200 4,800 28.0 135,000 6,500 5,000 58.5 293,000<br />
Duplin 18,000 15,500 24.0 372,000 23,800 22,000 52.5 1,152,000<br />
Harnett 5,400 4,800 33.0 158,000 6,500 5,500 57.0 313,000<br />
Hoke 4,800 4,200 36.0 151,000 7,000 6,000 55.5 334,000<br />
Onslow 4,400 3,800 41.0 156,000 6,500 6,000 42.0 252,000<br />
Pender 4,200 3,500 29.0 100,000 * * * *<br />
Robeson 45,000 38,000 25.0 950,000 53,000 50,000 55.0 2,746,000<br />
Sampson 23,000 21,000 26.0 537,000 25,000 22,000 58.0 1,276,000<br />
Scotland 5,400 3,600 39.0 140,000 5,000 4,100 60.0 245,000<br />
S. Coastal 135,000 116,000 27.0 3,110,000 166,000 148,500 53.5 7,949,000<br />
Other Counties 12300 7600 36.5 277600 18,300 11,900 50.2 597,500<br />
State Total 630,000 500,000 40.0 20,000,000 820,000 720,000 60.0 43,200,000<br />
1 2008 Preliminary. 2 Counties may not add to district total because undisclosed data are included in other counties. USDA NASS County Estimating Program Policy and Standards<br />
require districts and counties with less than 500 acres planted to a crop, or practice of a crop, be included in other counties. Coverage standards also apply to district<br />
and county estimates.<br />
Leading Counties 1 Bushels<br />
Union 2,909,000<br />
Robeson 2,746,000<br />
Beaufort 2,627,000<br />
Pasquotank 1,992,000<br />
Wayne 1,806,000<br />
Perquimans 1,577,000<br />
Pitt 1,540,000<br />
Washington 1,369,000<br />
Tyrrell 1,286,000<br />
Sampson 1,276,000<br />
1 Ranking of published counties only.<br />
800<br />
700<br />
600<br />
500<br />
400<br />
300<br />
WHEAT<br />
2008 Production<br />
WHEAT<br />
Planted and Harvested (Thousand Acres)<br />
1999 2000 2001 2002 2003 2004 2005 2006 2007 2008<br />
Planted Harvested<br />
Bushels<br />
Under 100,000 / Undisclosed<br />
100,000 to 249,999<br />
250,000 to 499,999<br />
500,000 to 999,999<br />
1,000,000 and up<br />
North Carolina Agricultural Statistics 87
88 North Carolina Agricultural Statistics<br />
NORTH CAROLINA FRUIT & VEGETABLES<br />
2007 Census of Agriculture<br />
TOP APPLE COUNTIES<br />
(Bearing and Non-Bearing Acres)<br />
TOP BLUEBERRY COUNTIES<br />
(Harvested Acres - Tame Blueberries)<br />
TOP GRAPE COUNTIES<br />
(Bearing and Non-Bearing Acres)<br />
Rank<br />
Rank<br />
Rank<br />
1 - Henderson<br />
2 - Polk<br />
3 - Wilkes<br />
4 - Alexander<br />
5 - Lincoln<br />
1 - Bladen<br />
2 - Pender<br />
3 - Sampson<br />
4 - Duplin<br />
5 - Columbus<br />
1 - Surry<br />
2 - Yadkin<br />
3 - Bladen<br />
4 - Wilkes<br />
5 - Polk
NORTH CAROLINA FRUIT & VEGETABLES<br />
2007 Census of Agriculture<br />
TOP PEACH COUNTIES<br />
(Bearing and Non-Bearing Acres)<br />
TOP STRAWBERRY COUNTIES<br />
(Harvested Acres)<br />
TOP CUCUMBER COUNTIES<br />
(Harvested Acres - Fresh Market and Processing)<br />
Rank<br />
Rank<br />
Rank<br />
1 - Montgomery<br />
2 - Anson<br />
3 - Moore<br />
4 - Cleveland<br />
5 - Alexander<br />
1 - Pender<br />
2 - Jackson<br />
3 - Guilford<br />
4 - Surry<br />
5 - Wilson<br />
1 - Nash<br />
2 - Sampson<br />
3 - Edgecombe<br />
4 - Johnston<br />
5 - Hyde<br />
North Carolina Agricultural Statistics 89
90 North Carolina Agricultural Statistics<br />
NORTH CAROLINA FRUIT & VEGETABLES<br />
2007 Census of Agriculture<br />
TOP HEAD CABBAGE COUNTIES<br />
(Harvested Acres - Fresh Market and Processing)<br />
TOP SWEET CORN COUNTIES<br />
(Harvested Acres - Fresh Market and Processing)<br />
TOP TOMATO COUNTIES<br />
(Harvested Acres - Fresh Market and Processing)<br />
Rank<br />
Rank<br />
Rank<br />
1 - Pasquotank<br />
2 - Gates<br />
3 - Sampson<br />
4 - Lenoir<br />
5 - Robeson<br />
1 - Hyde<br />
2 - Washington<br />
3 - Henderson<br />
4 - Halifax<br />
5 - Richmond<br />
1 - Brunswick<br />
2 - Henderson<br />
3 - Rowan<br />
4 - Buncombe<br />
5 - Haywood