
Create successful ePaper yourself
Turn your PDF publications into a flip-book with our unique Google optimized e-Paper software.
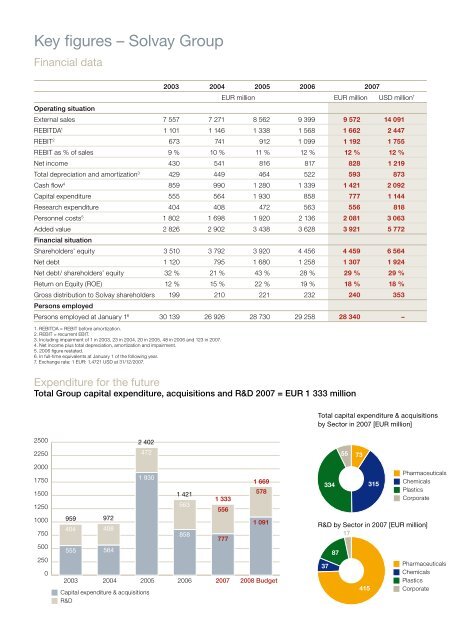
Key figures – <strong>Solvay</strong> Group<br />
Financial data<br />
2003 2004 2005 2006 2007<br />
EUR million EUR million USD million 7<br />
Operating situation<br />
External sales 7 557 7 271 8 562 9 399 9 572 14 091<br />
REBITDA1 1 101 1 146 1 338 1 568 1 662 2 447<br />
REBIT2 673 741 912 1 099 1 192 1 755<br />
REBIT as % of sales 9 % 10 % 11 % 12 % 12 % 12 %<br />
Net income 430 541 816 817 828 1 219<br />
Total depreciation and amortization 3 429 449 464 522 593 873<br />
Cash flow4 859 990 1 280 1 339 1 421 2 092<br />
Capital expenditure 555 564 1 930 858 777 1 144<br />
Research expenditure 404 408 472 563 556 818<br />
Personnel costs5 1 802 1 698 1 920 2 136 2 081 3 063<br />
Added value<br />
Financial situation<br />
2 826 2 902 3 438 3 628 3 921 5 772<br />
Shareholders’ equity 3 510 3 792 3 920 4 456 4 459 6 564<br />
Net debt 1 120 795 1 680 1 258 1 307 1 924<br />
Net debt/ shareholders’ equity 32 % 21 % 43 % 28 % 29 % 29 %<br />
Return on Equity (ROE) 12 % 15 % 22 % 19 % 18 % 18 %<br />
Gross distribution to <strong>Solvay</strong> shareholders<br />
Persons employed<br />
199 210 221 232 240 353<br />
Persons employed at January 16 30 139 26 926 28 730 29 258 28 340 –<br />
1. REBITDA = REBIT before amortization.<br />
2. REBIT = recurrent EBIT.<br />
3. Including impairment of 1 in 2003, 23 in 2004, 20 in 2005, 48 in 2006 and 123 in 2007.<br />
4. Net income plus total depreciation, amortization and impairment.<br />
5. 2006 figure restated.<br />
6. In full-time equivalents at January 1 of the following year.<br />
7. Exchange rate: 1 EUR: 1,4721 USD at 31/12/2007.<br />
Expenditure for the future<br />
Total Group capital expenditure, acquisitions and R&D 2007 = EUR 1 333 million<br />
2500<br />
2250<br />
2000<br />
1750<br />
1500<br />
1250<br />
1000<br />
750<br />
500<br />
250<br />
0<br />
959 972<br />
404<br />
555<br />
408<br />
564<br />
2 402<br />
472<br />
1 930<br />
1 333<br />
2003 2004 2005 2006 2007 2008 Budget<br />
� Capital expenditure & acquisitions<br />
� R&D<br />
1 421<br />
563<br />
858<br />
556<br />
777<br />
1 669<br />
578<br />
1 091<br />
Total capital expenditure & acquisitions<br />
by Sector in 2007 [EUR million]<br />
334<br />
37<br />
87<br />
55<br />
73<br />
415<br />
315<br />
� Pharmaceuticals<br />
� Chemicals<br />
� Plastics<br />
� Corporate<br />
R&D by Sector in 2007 [EUR million]<br />
17<br />
� Pharmaceuticals<br />
� Chemicals<br />
� Plastics<br />
� Corporate

![PROC.1 [LETTRE] - Solvay](https://img.yumpu.com/16585746/1/184x260/proc1-lettre-solvay.jpg?quality=85)