North Carolina Visitor & Relocation Guide - Franklin Chamber of ...
North Carolina Visitor & Relocation Guide - Franklin Chamber of ...
North Carolina Visitor & Relocation Guide - Franklin Chamber of ...

Create successful ePaper yourself
Turn your PDF publications into a flip-book with our unique Google optimized e-Paper software.
Geography & Climate<br />
Geography<br />
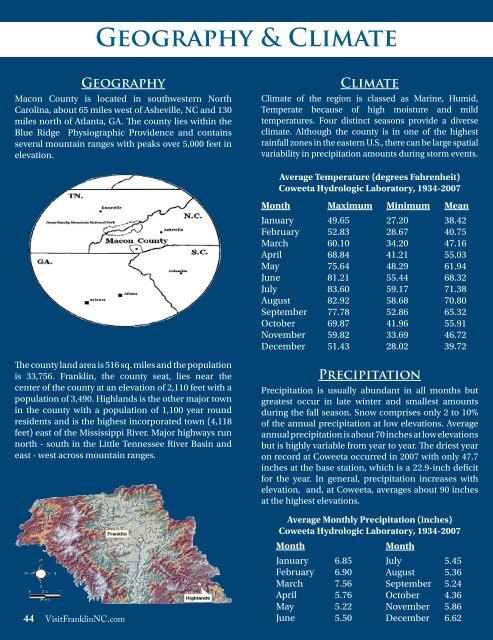
Macon County is located in southwestern <strong>North</strong><br />
<strong>Carolina</strong>, about 65 miles west <strong>of</strong> Asheville, NC and 130<br />
miles north <strong>of</strong> Atlanta, GA. The county lies within the<br />
Blue Ridge Physiographic Providence and contains<br />
several mountain ranges with peaks over 5,000 feet in<br />
elevation.<br />
The county land area is 516 sq. miles and the population<br />
is 33,756. <strong>Franklin</strong>, the county seat, lies near the<br />
center <strong>of</strong> the county at an elevation <strong>of</strong> 2,110 feet with a<br />
population <strong>of</strong> 3,490. Highlands is the other major town<br />
in the county with a population <strong>of</strong> 1,100 year round<br />
residents and is the highest incorporated town (4,118<br />
feet) east <strong>of</strong> the Mississippi River. Major highways run<br />
north - south in the Little Tennessee River Basin and<br />
east - west across mountain ranges.<br />
44 Visit<strong>Franklin</strong>NC.com<br />
Climate<br />
Climate <strong>of</strong> the region is classed as Marine, Humid,<br />
Temperate because <strong>of</strong> high moisture and mild<br />
temperatures. Four distinct seasons provide a diverse<br />
climate. Although the county is in one <strong>of</strong> the highest<br />
rainfall zones in the eastern U.S., there can be large spatial<br />
variability in precipitation amounts during storm events.<br />
Average Temperature (degrees Fahrenheit)<br />
Coweeta Hydrologic Laboratory, 1934-2007<br />
Month Maximum Minimum Mean<br />
January 49.65 27.20 38.42<br />
February 52.83 28.67 40.75<br />
March 60.10 34.20 47.16<br />
April 68.84 41.21 55.03<br />
May 75.64 48.29 61.94<br />
June 81.21 55.44 68.32<br />
July 83.60 59.17 71.38<br />
August 82.92 58.68 70.80<br />
September 77.78 52.86 65.32<br />
October 69.87 41.96 55.91<br />
November 59.82 33.69 46.72<br />
December 51.43 28.02 39.72<br />
Precipitation<br />
Precipitation is usually abundant in all months but<br />
greatest occur in late winter and smallest amounts<br />
during the fall season. Snow comprises only 2 to 10%<br />
<strong>of</strong> the annual precipitation at low elevations. Average<br />
annual precipitation is about 70 inches at low elevations<br />
but is highly variable from year to year. The driest year<br />
on record at Coweeta occurred in 2007 with only 47.7<br />
inches at the base station, which is a 22.9-inch deficit<br />
for the year. In general, precipitation increases with<br />
elevation, and, at Coweeta, averages about 90 inches<br />
at the highest elevations.<br />
Average Monthly Precipitation (inches)<br />
Coweeta Hydrologic Laboratory, 1934-2007<br />
Month<br />
Month<br />
January 6.85 July 5.45<br />
February 6.90 August 5.36<br />
March 7.56 September 5.24<br />
April 5.76 October 4.36<br />
May 5.22 November 5.86<br />
June 5.50 December 6.62