Store Manager Incentive Design and Retail Performance: An ...
Store Manager Incentive Design and Retail Performance: An ...
Store Manager Incentive Design and Retail Performance: An ...

Create successful ePaper yourself
Turn your PDF publications into a flip-book with our unique Google optimized e-Paper software.
MANUFACTURING & SERVICE<br />
OPERATIONS MANAGEMENT<br />
Vol. 9, No. 4, Fall 2007, pp. 518–534<br />
issn 1523-4614 � eissn 1526-5498 � 07 � 0904 � 0518<br />
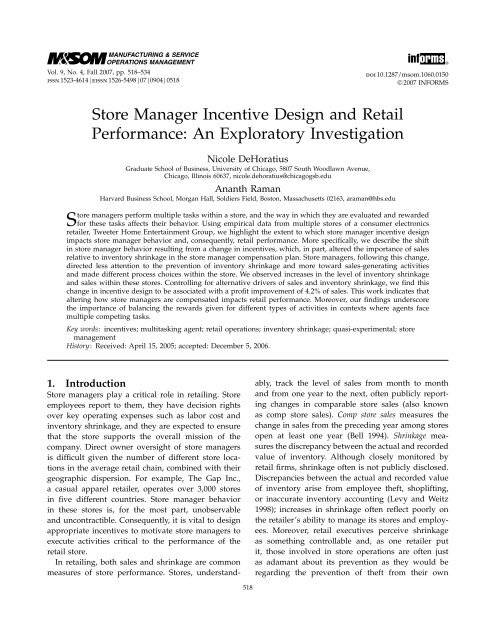
<strong>Store</strong> <strong>Manager</strong> <strong>Incentive</strong> <strong>Design</strong> <strong>and</strong> <strong>Retail</strong><br />
<strong>Performance</strong>: <strong>An</strong> Exploratory Investigation<br />
Nicole DeHoratius<br />
Graduate School of Business, University of Chicago, 5807 South Woodlawn Avenue,<br />
Chicago, Illinois 60637, nicole.dehoratius@chicagogsb.edu<br />
<strong>An</strong>anth Raman<br />
Harvard Business School, Morgan Hall, Soldiers Field, Boston, Massachusetts 02163, araman@hbs.edu<br />
informs ®<br />
doi 10.1287/msom.1060.0150<br />
© 2007 INFORMS<br />
<strong>Store</strong> managers perform multiple tasks within a store, <strong>and</strong> the way in which they are evaluated <strong>and</strong> rewarded<br />
forthese tasks affects theirbehavior. Using empirical data from multiple stores of a consumerelectronics<br />
retailer, Tweeter Home Entertainment Group, we highlight the extent to which store manager incentive design<br />
impacts store manager behavior <strong>and</strong>, consequently, retail performance. More specifically, we describe the shift<br />
in store manager behavior resulting from a change in incentives, which, in part, altered the importance of sales<br />
relative to inventory shrinkage in the store manager compensation plan. <strong>Store</strong> managers, following this change,<br />
directed less attention to the prevention of inventory shrinkage <strong>and</strong> more toward sales-generating activities<br />
<strong>and</strong> made different process choices within the store. We observed increases in the level of inventory shrinkage<br />
<strong>and</strong> sales within these stores. Controlling for alternative drivers of sales <strong>and</strong> inventory shrinkage, we find this<br />
change in incentive design to be associated with a profit improvement of 4.2% of sales. This work indicates that<br />
altering how store managers are compensated impacts retail performance. Moreover, our findings underscore<br />
the importance of balancing the rewards given for different types of activities in contexts where agents face<br />
multiple competing tasks.<br />
Key words: incentives; multitasking agent; retail operations; inventory shrinkage; quasi-experimental; store<br />
management<br />
History: Received: April 15, 2005; accepted: December 5, 2006.<br />
1. Introduction<br />
<strong>Store</strong> managers play a critical role in retailing. <strong>Store</strong><br />
employees report to them, they have decision rights<br />
overkey operating expenses such as laborcost <strong>and</strong><br />
inventory shrinkage, <strong>and</strong> they are expected to ensure<br />
that the store supports the overall mission of the<br />
company. Direct owner oversight of store managers<br />
is difficult given the number of different store locations<br />
in the average retail chain, combined with their<br />
geographic dispersion. For example, The Gap Inc.,<br />
a casual apparel retailer, operates over 3,000 stores<br />
in five different countries. <strong>Store</strong> manager behavior<br />
in these stores is, for the most part, unobservable<br />
<strong>and</strong> uncontractible. Consequently, it is vital to design<br />
appropriate incentives to motivate store managers to<br />
execute activities critical to the performance of the<br />
retail store.<br />
In retailing, both sales <strong>and</strong> shrinkage are common<br />
measures of store performance. <strong>Store</strong>s, underst<strong>and</strong>-<br />
518<br />
ably, track the level of sales from month to month<br />
<strong>and</strong> from one year to the next, often publicly reporting<br />
changes in comparable store sales (also known<br />
as comp store sales). Comp store sales measures the<br />
change in sales from the preceding year among stores<br />
open at least one year(Bell 1994). Shrinkage measures<br />
the discrepancy between the actual <strong>and</strong> recorded<br />
value of inventory. Although closely monitored by<br />
retail firms, shrinkage often is not publicly disclosed.<br />
Discrepancies between the actual <strong>and</strong> recorded value<br />
of inventory arise from employee theft, shoplifting,<br />
or inaccurate inventory accounting (Levy <strong>and</strong> Weitz<br />
1998); increases in shrinkage often reflect poorly on<br />
the retailer’s ability to manage its stores <strong>and</strong> employees.<br />
Moreover, retail executives perceive shrinkage<br />
as something controllable <strong>and</strong>, as one retailer put<br />
it, those involved in store operations are often just<br />
as adamant about its prevention as they would be<br />
regarding the prevention of theft from their own
DeHoratius <strong>and</strong> Raman: <strong>Store</strong> <strong>Manager</strong> <strong>Incentive</strong> <strong>Design</strong> <strong>and</strong> <strong>Retail</strong> <strong>Performance</strong><br />
Manufacturing & Service Operations Management 9(4), pp. 518–534, © 2007 INFORMS 519<br />
home. In spite of this, shrinkage cost U.S. retailers<br />
more than an estimated $33 billion in 2002 (Hollinger<br />
<strong>and</strong> Langton 2004). One retailer, Federated Department<br />
<strong>Store</strong>s, found its inventory shrinkage plus its<br />
expenditure to prevent it, 1 cost over$250 million a<br />
year—the fifth largest expense in its portfolio (Chain<br />
<strong>Store</strong> Age 2001). Given the magnitude of these expenditures,<br />
it is not surprising that retailers monitor<br />
shrinkage along with sales.<br />
Using data from a consumer electronics retailer, we<br />
quantify the impact of changing store manager incentives<br />
on these two measures of store performance,<br />
namely, sales <strong>and</strong> shrinkage. The change in store managerincentives<br />
that we examine can be described<br />
largely as a change in the relative importance of<br />
sales <strong>and</strong> shrinkage in the store manager’s compensation.<br />
We argue that this incentive change resulted<br />
in the reported alteration of store manager behavior<br />
on two key dimensions: effort allocation <strong>and</strong> process<br />
choice. <strong>Store</strong> managers perform multiple tasks within<br />
a store, <strong>and</strong> the way in which they are evaluated <strong>and</strong><br />
rewarded for these tasks affects their effort allocation.<br />
<strong>Store</strong> managers face a similar trade-off with respect<br />
to process choice. They can choose to establish store<br />
processes that influence the ease with which certain<br />
tasks can be executed. Both dimensions of behavior,<br />
effort allocation <strong>and</strong> process choice, are unobservable<br />
in this context, <strong>and</strong> thus both are influenced by the<br />
design of incentives. We suggest that the alteration in<br />
store manager incentives, <strong>and</strong> the resulting change in<br />
behavior, account for the observed difference in store<br />
performance.<br />
Section 2 reviews the existing literature related to<br />
incentive design in general <strong>and</strong> retailing in particular.<br />
Section 3 presents our research setting followed by the<br />
development of ourhypotheses in §4. Section 5 delineates<br />
our data collection process, provides descriptive<br />
statistics of our sample, <strong>and</strong> introduces our regression<br />
analysis. Section 6 discusses ourempirical findings,<br />
followed by the managerial implications of this study<br />
in §7 <strong>and</strong> concluding remarks in §8.<br />
1 Shrinkage prevention techniques espoused in the popular press<br />
include, but are not limited to, employee training, inventory audits,<br />
closed-circuit television, loss-prevention inspection teams, revised<br />
store design, <strong>and</strong> item tagging. Each of these techniques comes at<br />
a cost to the organization.<br />
2. Literature Review<br />
The impact of incentives on the performance of individuals<br />
within organizations has been studied empirically<br />
by a number of researchers. Lazear (2000) <strong>and</strong><br />
Knez <strong>and</strong> Simester(2001) show that the introduction<br />
of performance-based incentive plans can alter<br />
employee performance. Using data from an autoglass<br />
installation company, Lazear(2000) examines<br />
the introduction of a piece-rate payment plan <strong>and</strong><br />
the resulting change in individual employee output,<br />
measured by units installed perday peremployee.<br />
He traces a 35% increase in output to this change<br />
in incentive <strong>and</strong> notes that the departure of lessproductive<br />
workers (a selection effect) accounts for<br />
a proportion of this performance improvement. Similarly,<br />
Knez <strong>and</strong> Simester (2001) find that the introduction<br />
of a group-incentive scheme substantially<br />
improved performance at multiple airports run by<br />
Continental Airlines. For a detailed review of these<br />
<strong>and</strong> other studies on incentives, see Prendergast<br />
(1999) <strong>and</strong> Jenkins et al. (1998).<br />
Empirical studies of the impact of incentives<br />
have been conducted in retail organizations as well.<br />
Eisenhardt (1985, 1988) investigates what factors (e.g.,<br />
type of merch<strong>and</strong>ise, job characteristics, store age, use<br />
of information system) predict the use of commission<br />
versus salary compensation for salespeople. Banker<br />
et al. (1996a) demonstrate that implementing a payfor-performance<br />
incentive plan for sales consultants<br />
is associated with retail sales increases. Although<br />
Banker et al. (1996a) are unable to control for worker<br />
selection orshifts in effort allocation due to the use of<br />
organizational-level data, their work is critical in that<br />
it attempts to link firm performance (measured by<br />
retail sales) with compensation design. Furthermore,<br />
Bankeret al. (1996b) extend this work by examining<br />
how various measures of sales, profitability, <strong>and</strong> customerservice<br />
change with the implementation of an<br />
outcome-based performance plan used to support a<br />
customer service strategy. Included in their analysis<br />
are specific controls representing different contextual<br />
factors such as competition, customer profiles, <strong>and</strong><br />
level of supervisory monitoring. Once again, Banker<br />
et al. (1996b) find support for productivity increases<br />
resulting from pay-for-performance compensation.
DeHoratius <strong>and</strong> Raman: <strong>Store</strong> <strong>Manager</strong> <strong>Incentive</strong> <strong>Design</strong> <strong>and</strong> <strong>Retail</strong> <strong>Performance</strong><br />
520 Manufacturing & Service Operations Management 9(4), pp. 518–534, © 2007 INFORMS<br />
Focusing specifically on store management (i.e.,<br />
store managers, assistant managers, <strong>and</strong> merch<strong>and</strong>ising<br />
managers), Terborg <strong>and</strong> Ungson (1985) study the<br />
relationship between store performance <strong>and</strong> bonus<br />
pay. More specifically, they examine how sales volume<br />
<strong>and</strong> sales efficiency, measured as the ratio of<br />
annual sales volume less laborcost to total numberof<br />
employees, differdepending on whetherstore management<br />
is paid a bonus forsales ora bonus for<br />
store profitability. As expected, when store management<br />
was paid a bonus forsales volume, bonuses<br />
were more highly correlated with sales volume than<br />
sales efficiency, <strong>and</strong> vice versa. Terborg <strong>and</strong> Ungson<br />
(1985, p. 74) emphasize the importance of designing<br />
a compensation system that “supports <strong>and</strong> facilitates<br />
the achievement of corporate goals.”<br />
Holmstrom <strong>and</strong> Milgrom (1991), hereafter H&M,<br />
argue that incentive pay can be used not only to<br />
motivate employees oragents (like store managers)<br />
to work in the interest of the firm, but also to allocate<br />
effort among several activities. H&M show how<br />
increasing the compensation of a multitasking agent<br />
(an employee performing multiple activities) for any<br />
one activity will result in reallocation of the agent’s<br />
effort away from other activities. Several researchers<br />
have modified H&M’s multitasking model in order<br />
to illustrate different aspects of incentive design. For<br />
instance, Feltham <strong>and</strong> Xie (1994) propose that the<br />
effort of a multitasking agent is allocated suboptimally<br />
across tasks when a performance measure does<br />
not accurately reflect the consequences of managerial<br />
action on the principal’s expected payoff. Gabel <strong>and</strong><br />
Sinclair-Desgagne (1993) discuss the optimal design of<br />
incentive contracts for multitasking agents choosing<br />
to allocate effort between two tasks, enhancing firm<br />
profit <strong>and</strong> reducing environmental risk.<br />
Empirical verification of H&M’s model has focused<br />
on the contracts offered under different conditions.<br />
Slade (1996) models the relationship between oil companies<br />
<strong>and</strong> service-station operators as a multitasking<br />
problem. Through empirical analysis, Slade (1996)<br />
found support for H&M’s prediction that the degree<br />
of complementarity between one activity, the selling<br />
of gasoline, <strong>and</strong> anotheractivity, the operation of a<br />
repairshop ora convenience store, determines the<br />
form of contract offered by oil companies to servicestation<br />
operators. More recently, Cockburn et al.<br />
(1999) uses H&M’s multitasking model to describe the<br />
importance of balancing the incentives for basic <strong>and</strong><br />
applied research work in the pharmaceutical industry.<br />
Our work differs from these studies in that we<br />
focus on the multitasking agent’s (i.e., store manager’s)<br />
behavior as a consequence of a change in the<br />
incentive contract offered to the agent. H&M argue<br />
that agents, when faced with a choice between multiple<br />
activities, will allocate effort based on the cost<br />
<strong>and</strong> rewards associated with each of those activities.<br />
Agents may also exhibit otherbehavioral responses to<br />
incentives in addition to effort allocation (Prendergast<br />
1999). Within the context of retailing, we examine how<br />
store managers respond to changes in the rewards<br />
given to two distinct activities forwhich they are<br />
accountable, sales <strong>and</strong> shrinkage, <strong>and</strong> measure the<br />
impact on store profitability that these changes generate.<br />
<strong>Store</strong> managers can respond in two ways. First,<br />
they can shift theireffort allocation among the tasks<br />
forwhich they are accountable. Second, they can<br />
choose to alter store processes to facilitate the execution<br />
of certain tasks. Neither the store manager’s<br />
choice of effort allocation nor of process choice is<br />
observable in this context. Thus, store managers face<br />
a trade-off with respect to both effort allocation <strong>and</strong><br />
process choice. Our findings, although not a precise<br />
test of H&M, illustrate how poorly designed contracts<br />
lead to both suboptimal allocation of effort <strong>and</strong> poor<br />
process choice, which in turn result in suboptimal<br />
firm performance.<br />
3. Research Setting<br />
We examine the impact of changing store manager<br />
incentives at Bryn Mawr Stereo (hereafter BMS), a<br />
chain of 13 consumer electronics stores in Pennsylvania,<br />
Maryl<strong>and</strong>, New Jersey, <strong>and</strong> Delaware. Tweeter<br />
Home Entertainment Group (hereafter Tweeter), 2 a<br />
New Engl<strong>and</strong>-based retail chain of comparable stores,<br />
acquired BMS in 1996 <strong>and</strong> changed store manager<br />
incentives immediately afterthe acquisition. We now<br />
give an overview of the products <strong>and</strong> customers<br />
served by both retailers, an account of store manager<br />
activities, <strong>and</strong> a comparison of the BMS <strong>and</strong> Tweeter<br />
store manager incentive plans. Section 5 details the<br />
2 TweeterHome Entertainment Group was known as New Engl<strong>and</strong><br />
Audio prior to July 17, 1998.
DeHoratius <strong>and</strong> Raman: <strong>Store</strong> <strong>Manager</strong> <strong>Incentive</strong> <strong>Design</strong> <strong>and</strong> <strong>Retail</strong> <strong>Performance</strong><br />
Manufacturing & Service Operations Management 9(4), pp. 518–534, © 2007 INFORMS 521<br />
data-gathering techniques used to inform our underst<strong>and</strong>ing<br />
of these two companies.<br />
3.1. Customers <strong>and</strong> Products<br />
Tweeter <strong>and</strong> BMS served the same customers, selling<br />
a variety of consumer electronics products falling<br />
into three categories: audio (e.g., receivers, amplifiers,<br />
speakers, car stereos, personal stereo devices), video<br />
(e.g., televisions, camcorders, DVD players), <strong>and</strong> accessories<br />
(e.g., cables, cassettes, batteries). Because<br />
Tweeter<strong>and</strong> BMS had been part of the same buying<br />
group, a group of small specialty retailers making<br />
collective purchases from suppliers in order to<br />
obtain favorable prices, Tweeter <strong>and</strong> BMS had identical<br />
product assortments. The buying group focused<br />
on purchasing products in the mid-to-high end of a<br />
manufacturer’s range. Both BMS <strong>and</strong> Tweeter sold<br />
primarily to well-educated, affluent customers interested<br />
in quality products.<br />
3.2. <strong>Store</strong> <strong>Manager</strong> Activities<br />
<strong>Store</strong> managers were integral to the operation of these<br />
consumer electronics stores. Their role consisted of two<br />
key activities: sales generation <strong>and</strong> shrinkage control.<br />
Each store manager could choose the amount of effort<br />
that he orshe allocated to each of these activities.<br />
At Tweeter<strong>and</strong> BMS, sales-generating activities performed<br />
by store managers included promoting <strong>and</strong><br />
closing customer sales. This often required educating<br />
the customer about the nature of the products. In<br />
addition, store managers helped to generate sales by<br />
directing the efforts of the salespeople who reported<br />
to them. <strong>Store</strong> managers motivated <strong>and</strong> trained salespeople<br />
to provide customer service <strong>and</strong> helped sheltersalespeople<br />
from nonsales-oriented tasks such as<br />
operating the cash register, h<strong>and</strong>ling returns, receiving<br />
inventory, <strong>and</strong> monitoring shrinkage. Moreover,<br />
store managers also influenced store sales by affecting<br />
the display of merch<strong>and</strong>ise at the store (e.g., permitting<br />
items that required h<strong>and</strong>s-on sampling, like personal<br />
stereo devices, to be accessible for customers to<br />
try out).<br />
<strong>Store</strong> managers also played an important role in<br />
affecting store operating expenses. One notable expense<br />
under the store manager’s control at BMS <strong>and</strong><br />
Tweeter stores was shrinkage. As with sales, store<br />
managers could affect shrinkage by directing the efforts<br />
of salespeople <strong>and</strong> by their own actions. For<br />
example, store managers could direct salespeople to<br />
more closely monitor colleagues <strong>and</strong> customers in<br />
order to identify shoplifters. <strong>Store</strong> managers could<br />
also monitor inventory receipts carefully <strong>and</strong> change<br />
the display of merch<strong>and</strong>ise, placing readily stolen<br />
items like batteries, personal stereo devices, or cables<br />
behind lock <strong>and</strong> key rather than on open shelves<br />
where customers could easily browse these products.<br />
Although labor is the largest store-operating expense,<br />
it is not underthe control of BMS orTweeter<br />
store managers—store employees are paid purely on<br />
commission. Although store managers at BMS <strong>and</strong><br />
Tweeterare unable to substantially influence labor<br />
costs, it is easy to visualize how, when store employees<br />
are salaried, store managers could affect labor<br />
costs through scheduling of store employees. For example,<br />
when store employees are salaried, store managers<br />
can ensure that more salaried employees are<br />
scheduled to work during times of high customer traffic<br />
orwhen inventory shipments in need of stocking<br />
arrive at the store. Failing to coordinate the schedule<br />
of salaried employees could result in multiple<br />
employees on the sales floorwith limited work to<br />
complete. The retailer then incurs the cost of these<br />
employees but derives little benefit from their time<br />
at work.<br />
3.3. <strong>Store</strong> <strong>Manager</strong> <strong>Incentive</strong> Plans<br />
In return fortheireffort in generating sales <strong>and</strong> controlling<br />
shrinkage, BMS <strong>and</strong> Tweeter offered store<br />
managers performance-based compensation contracts.<br />
The form of these performance-based contracts differed<br />
substantially between the two companies. The<br />
primary difference, described in detail below, was the<br />
degree to which the store manager was penalized for<br />
shrinkage relative to being rewarded for sales.<br />
The BMS contract, before Tweeter’s acquisition,<br />
included both a reward for sales <strong>and</strong> a penalty for<br />
shrinkage. In particular, BMS store managers were<br />
offered a bonus for generating sales that ranged from<br />
0.2% to 5% of the sales dollars above store-specific targets.<br />
These same store managers were penalized one<br />
dollarof pay forevery dollarof shrinkage at their<br />
store. This penalty resulted in an extreme concern<br />
with shrinkage control at BMS stores. Although such<br />
an incentive design seems uncommon, it is often used<br />
in retailing for individuals controlling cash receipts.
DeHoratius <strong>and</strong> Raman: <strong>Store</strong> <strong>Manager</strong> <strong>Incentive</strong> <strong>Design</strong> <strong>and</strong> <strong>Retail</strong> <strong>Performance</strong><br />
522 Manufacturing & Service Operations Management 9(4), pp. 518–534, © 2007 INFORMS<br />
Should the expected value of cash not amount to the<br />
actual on-h<strong>and</strong> value, retail employees are often held<br />
accountable forthe difference.<br />
In contrast to the BMS store manager incentive<br />
plan, store managers were penalized less for shrinkage<br />
underthe Tweeterincentive plan. Tweeterrewarded<br />
its store managers a percentage, as much<br />
as 20%, of additional store-operating income (SOI),<br />
which is defined as store sales minus both the cost of<br />
goods sold <strong>and</strong> inventory shrinkage. Thus, the bonus<br />
of a Tweeterstore managerwould be reduced by,<br />
at most, $20 forhaving an additional $100 in store<br />
shrinkage (=20% of $100). This amounted to $80 less<br />
than a store managerunderthe old BMS incentive<br />
plan, whose bonus would be reduced by the entire<br />
$100 shrinkage amount.<br />
The change in sales incentives was less dramatic<br />
than the simultaneous change in shrinkage incentives.<br />
Fora store managerobtaining the average bonus<br />
(2.6% of sales forBMS, 10% of SOI forTweeter), an<br />
additional dollarof sales would result in a bonus of<br />
$0.026 underthe BMS plan, roughly similarto that<br />
obtained underthe Tweeterplan, $0.036 (=$1×10%×<br />
36% 3 ). On the otherh<strong>and</strong>, the penalty foran additional<br />
dollarof shrinkage decreased substantially.<br />
In the following section, we reveal how retail performance<br />
changed as BMS store managers went from<br />
being rewarded by an incentive system that emphasized<br />
shrinkage, the BMS plan, to one that placed less<br />
emphasis on it, the Tweeterplan. We show that this<br />
change is associated with a positive difference in performance<br />
that was both statistically <strong>and</strong> economically<br />
significant. In fact, we show that the changes in store<br />
manager incentives resulted in increasing store profits<br />
by an estimated 4.2% of sales.<br />
4. Hypothesis Development<br />
Multitasking agents, such as store managers, will allocate<br />
constrained effort to different activities based on<br />
rewards that accrue from, <strong>and</strong> the cost of, pursuing<br />
each of these activities. More specifically, H&M<br />
demonstrate that the amount of effort allocated to a<br />
particular activity by a multitasking agent is a function<br />
of the reward associated with that activity, as<br />
3 This is Tweeter’s gross margin percentage. See §6.3 for additional<br />
details on the source of this number.<br />
well as the rewards associated with other activities for<br />
which the agent is accountable. Changing the relative<br />
importance of one store manager activity to another<br />
in a performance-based incentive plan should induce<br />
a shift in the store managers’ allocation of effort.<br />
At BMS the change in store manager incentives<br />
resulted in shrinkage being given less emphasis in<br />
the bonus plan. We therefore expect store managers<br />
to divert some of the effort previously allocated to<br />
reducing shrinkage to other activities, including generating<br />
sales. We posit that store managers that once<br />
emphasized shrinkage control at the expense of generating<br />
sales will allocate less effort toward activities<br />
that control shrinkage <strong>and</strong> more to those that generate<br />
sales. Although increases in eithersales orshrinkage<br />
alone could be explained by a change in the absolute<br />
level of incentive pay, a concurrent increase in both<br />
sales <strong>and</strong> shrinkage suggests a change in the relative<br />
importance of both measures of store performance in<br />
the store manager’s compensation plan.<br />
This expectation stems from the belief that the<br />
two components of store manager effort, sales generation<br />
<strong>and</strong> shrinkage control, are substitutes rather<br />
than complements. That is, according to H&M, the<br />
marginal cost of a unit of effort directed toward one<br />
activity (e.g., shrink prevention) is higher when the<br />
multitasking agent (e.g., the store manager) is also<br />
allocating more effort to the other activity (e.g., sales<br />
generation). Although this shift in effort allocation is<br />
unobservable, the outcome is not. Thus, we expect the<br />
change in store manager incentive design to induce<br />
a shift in store manager effort that is observable<br />
through increases in both sales <strong>and</strong> shrinkage.<br />
In addition to changes in effort allocation, agents<br />
may have otherbehavioral responses to compensation<br />
schemes. When faced with a change in incentive<br />
contract, agents may choose to altertheiractivities in<br />
order to benefit from the new compensation scheme<br />
(Prendergast 1999). <strong>Store</strong> managers facing a change<br />
in the relative importance of one activity to another<br />
in theirperformance-based incentive plan may make<br />
different process choices. For example, under the new<br />
incentive contract, a store manager may choose to<br />
alter store processes to facilitate the execution of sales<br />
activities but no longerfacilitate the prevention of<br />
shrinkage. Such activities, described in detail in §3.2,<br />
include locking up merch<strong>and</strong>ise, keeping the store
DeHoratius <strong>and</strong> Raman: <strong>Store</strong> <strong>Manager</strong> <strong>Incentive</strong> <strong>Design</strong> <strong>and</strong> <strong>Retail</strong> <strong>Performance</strong><br />
Manufacturing & Service Operations Management 9(4), pp. 518–534, © 2007 INFORMS 523<br />
closed during periods of low staffing, <strong>and</strong> deciding<br />
not to open additional cash registers to expedite customer<br />
service when inventory is being delivered.<br />
In sum, store sales <strong>and</strong> shrinkage should differ<br />
when store managers are rewarded according to the<br />
BMS plan orthe Tweeterplan, as hypothesized below.<br />
When store managers are rewarded according to the<br />
BMS incentive plan, stores have lower levels of sales<br />
than when store managers are rewarded under the<br />
Tweeterincentive plan. In otherwords, there is a positive<br />
association between the change in store manager<br />
incentive plan <strong>and</strong> store sales. Reducing the penalty<br />
for shrinkage could cause store managers to shift their<br />
effort allocated from shrink prevention to sales generation<br />
<strong>and</strong> to make different process choices influencing<br />
the generation of sales in their stores.<br />
Hypothesis 1 (H1). <strong>Store</strong> sales is positively correlated<br />
with the change in store manager incentive plan.<br />
When store managers are rewarded according to the<br />
BMS incentive plan, stores have lower levels of shrinkage<br />
than when the store managers are rewarded under<br />
the Tweeterincentive plan. In otherwords, we expect<br />
a positive association between the change in store<br />
managerincentive plan <strong>and</strong> store shrinkage. Reducing<br />
the penalty for shrinkage increases the observed level<br />
of shrinkage as store managers exert less effort <strong>and</strong><br />
make different process choices influencing the prevention<br />
of shrinkage in their stores.<br />
Hypothesis 2 (H2). <strong>Store</strong> shrinkage is positively correlated<br />
with the change in store manager incentive plan.<br />
Attributing an increase in store sales <strong>and</strong> shrinkage<br />
to a change in incentive design requires that we control<br />
forotherfactors that influence store sales <strong>and</strong> shrinkage.<br />
Figure 1 illustrates the variables that could plausibly<br />
accountfor differencesintheretailperformancemetrics,<br />
sales <strong>and</strong> shrinkage. These variables include changes<br />
in retail sales for the consumer electronics industry,<br />
store inventory levels, <strong>and</strong> firm advertising expenditure.<br />
We would expect sales to increase with overall<br />
growth in the consumer electronics retail industry<br />
<strong>and</strong> with additional store inventory as stores experience<br />
fewerstockouts (Wolfe 1968). Although evidence<br />
supporting a relationship between sales <strong>and</strong> advertising<br />
is inconclusive (Lodish et al. 1995, Dekimpe <strong>and</strong><br />
Hanssens 1999, Gijsbrechts et al. 2003), we do control<br />
foradvertising expenditure.<br />
Figure 1 Underst<strong>and</strong>ing the Drivers of Sales <strong>and</strong> Shrinkage at BMS<br />
<strong>and</strong> Tweeter<br />
<strong>Incentive</strong>s<br />
Industry growth<br />
Assortment<br />
Sales<br />
<strong>Store</strong><br />
manager<br />
Turnover<br />
behavior Inventory Process/<br />
training<br />
Shrinkage<br />
Advertising<br />
<strong>Store</strong><br />
profit<br />
The factors influencing inventory shrinkage are far<br />
less developed in the existing literature. However,<br />
one could imagine that the availability of inventory<br />
in the store could also impact store shrinkage levels.<br />
Moreover, other aspects of store operations such<br />
as employee turnover (Lucas 1985), pricing policy,<br />
<strong>and</strong> product assortment might impact both sales <strong>and</strong><br />
shrinkage. Section 5 details our analytical strategy as<br />
well as the data we collected to test ourhypotheses.<br />
5. Empirical<strong>An</strong>alysis<br />
The change in ownership of the BMS stores presented<br />
us with an opportunity to observe monthly sales,<br />
monthly shrinkage, <strong>and</strong> store managerbehaviorin<br />
BMS stores both before <strong>and</strong> after the implementation<br />
of a new store manager incentive plan. Viewing the<br />
store manager as a multitasking agent who allocates<br />
effort to different activities based on the rewards that<br />
accrue from, <strong>and</strong> the cost of pursuing, each of these<br />
activities, <strong>and</strong> who makes process choices based on<br />
the rewards that accrue from, <strong>and</strong> the cost of executing,<br />
such choices, we expect store manager behavior<br />
to differdepending on the incentive policy in place.<br />
Ourobjective is to isolate the effect that changing<br />
store manager incentives had on retail performance<br />
<strong>and</strong> test the hypotheses detailed in §4. We do so not<br />
only by controlling for variables such as inventory<br />
levels, advertising, <strong>and</strong> industry retail sales growth,<br />
but also by determining that, beyond the reward
DeHoratius <strong>and</strong> Raman: <strong>Store</strong> <strong>Manager</strong> <strong>Incentive</strong> <strong>Design</strong> <strong>and</strong> <strong>Retail</strong> <strong>Performance</strong><br />
524 Manufacturing & Service Operations Management 9(4), pp. 518–534, © 2007 INFORMS<br />
given to store managers for sales <strong>and</strong> shrinkage activities,<br />
Tweeter ownership did not dramatically alter<br />
other aspects of store operations such as training or<br />
employee turnover, or aspects of store identity such<br />
as name or location, during the period under study.<br />
Ourmethodological approach can be classified as<br />
“quasi-experimental” in that we have a series of observations<br />
for periods of time both prior to <strong>and</strong> subsequent<br />
to an event of interest (i.e., change in incentive<br />
design; Campbell <strong>and</strong> Ross 1968). Quasi-experimental<br />
research designs differ from true experiments in that<br />
the researcher does not have the ability to r<strong>and</strong>omly<br />
assign study participants (i.e., store managers) to different<br />
experimental treatments <strong>and</strong> to maintain a<br />
control group for comparison. Nevertheless, quasiexperimental<br />
designs are appropriate for the test of<br />
well-formulated theory (Yin 1994). After observing a<br />
particular phenomenon in its natural context, we then<br />
match the data collected in the field to alternative theoretical<br />
explanations of our observations (Yin 1994).<br />
5.1. Data Collection <strong>and</strong> Descriptive Statistics<br />
We used multiple data-gathering techniques, including<br />
the collection of archival company records, newspaperclippings,<br />
annual reports, <strong>and</strong> otherpublicly<br />
available documents pertaining to our research site<br />
during the period of study (Yin 1994). In addition,<br />
we conducted nearly 150 hours of field work during<br />
which we met with on-site personnel familiar with<br />
both BMS <strong>and</strong> Tweeter, including store, merch<strong>and</strong>ising,<br />
operations, finance, <strong>and</strong> regional sales management.<br />
It is from these open-ended interviews that<br />
we were able to recreate the operating environment<br />
(see §3) <strong>and</strong> characterize the behavior of store managers<br />
during the period of study. The use of multiple<br />
sources of evidence in field research facilitates<br />
the process of triangulation, where each source helps<br />
to corroborate the hypothesized explanation of an<br />
observed phenomenon (Yin 1994).<br />
The relevant data gathered from the firm’s sales<br />
<strong>and</strong> operating records include monthly sales (SALES),<br />
shrinkage (SHRINK), advertising (AD), <strong>and</strong> inventory<br />
dollars (INVEN) for 12 different stores. We collected<br />
data for12 of the 13 stores in the chain because data<br />
from the preacquisition period was missing for one<br />
store. Both SHRINK <strong>and</strong> INVEN were measured at<br />
vendor cost rather than retail price. The period of<br />
Table 1 Summary of Variable Names <strong>and</strong> Definitions Used for<br />
Empirical <strong>An</strong>alysis<br />
Variable<br />
name Variable definition<br />
SALES Monthly store sales in U.S. dollars<br />
SHRINK Monthly store shrinkage in U.S. dollars<br />
TWTR TWTR = 0 under BMS incentive plan,<br />
TWTR = 1 under Tweeter incentive plan<br />
INVEN Monthly store inventory in U.S. dollars<br />
RETAIL U.S. retail sales of electronics industry stores with SIC<br />
code 5731 (Radio & Television <strong>Store</strong>s), in million U.S. dollars<br />
AD Monthly advertising expenditure in U.S. dollars<br />
S01–S12 <strong>Store</strong> dummy variables, one for each of 12 stores<br />
Notes. Under the TWTR incentive plan store managers were rewarded a percentage<br />
of additional SOI. Under the BMS incentive plan store managers<br />
received a bonus for additional sales <strong>and</strong> a dollar-for-dollar reduction in pay<br />
for shrinkage.<br />
interest ranged from 11 months prior to Tweeter’s<br />
acquisition (May 1995–April 1996) to 11 months after<br />
(May 1996–April 1997). The sample does not include<br />
any data forthe month of Decemberbecause neither<br />
shrinkage nor inventory was counted during<br />
that month—it is common for retailers not to perform<br />
physical counts of inventory during the peaksales<br />
month. We also obtained monthly sales data for<br />
all stores under SIC code 5731 (i.e., U.S. Radio <strong>and</strong><br />
Television) from the U.S. Department of Commerce,<br />
Bureau of the Census Office (RETAIL). See Table 1<br />
fora definition of each variable. These data allow us<br />
to test ourhypotheses while controlling forindustry<br />
trends, inventory levels, <strong>and</strong> advertising expenditure.<br />
Preliminary analyses show that both sales <strong>and</strong><br />
shrinkage increased afterTweeterimplemented the<br />
change in store manager incentives. When store managers<br />
were rewarded as a percentage of sales <strong>and</strong><br />
a dollar-for-dollar reduction for shrinkage, monthly<br />
sales averaged $155,890, while monthly shrinkage<br />
averaged $123 (Table 2).<br />
Alternatively, when store managers were rewarded<br />
based on SOI, monthly sales averaged $189,867, while<br />
monthly shrinkage averaged $676, an increase of 22%<br />
<strong>and</strong> 450%, respectively (Table 2). Shrinkage levels<br />
increased at each <strong>and</strong> every store following the acquisition,<br />
while sales increased at all but two stores.<br />
Otheraspects of store operations besides those<br />
noted above could impact sales orshrinkage (see<br />
Figure 1). We rely on the qualitative data collected<br />
throughout our study in order to control for these
DeHoratius <strong>and</strong> Raman: <strong>Store</strong> <strong>Manager</strong> <strong>Incentive</strong> <strong>Design</strong> <strong>and</strong> <strong>Retail</strong> <strong>Performance</strong><br />
Manufacturing & Service Operations Management 9(4), pp. 518–534, © 2007 INFORMS 525<br />
Table 2 Descriptive Sample Characteristics Before <strong>and</strong> After the<br />
Change in <strong>Incentive</strong> Plan<br />
Sample characteristics Sample characteristics<br />
before change after change<br />
St<strong>and</strong>ard St<strong>and</strong>ard<br />
Variable Mean deviation Mean deviation<br />
SALES 155�890 77�577 189�867 81�948<br />
SHRINK 123 707 676 1�444<br />
INVEN 311�900 92�475 350�642 81�747<br />
RETAIL 2�601 249 2�624 247<br />
AD 8�964 9�202 20�062 7�333<br />
factors. What follows is an account of our qualitative<br />
data pertaining to employee turnover, product pricing,<br />
<strong>and</strong> product assortment at these retail stores.<br />
5.2. Employee Turnover<br />
Employee turnover during the period under study<br />
was minimal. All but one of the BMS store managers,<br />
according to our interviews, remained in their<br />
positions underTweeterownership. Similarly, no<br />
turnover occurred in the commissioned sales staff<br />
during this period. Even the store manager’s reporting<br />
structure remained intact <strong>and</strong> staffed by BMS<br />
employees. Tweeter’s acquisition was not one that<br />
involved the radical overhaul of key staff positions.<br />
Such continuity in personnel is critical to our analysis.<br />
<strong>An</strong>y majorshifts in personnel at multiple levels<br />
of the organization would not allow us to determine<br />
if the observed differences in performance measures,<br />
i.e., sales <strong>and</strong> shrinkage, were the result of the incentive<br />
change or merely differences in individual ability<br />
at store management, sales, or operational control<br />
(Hise et al. 1983, Lusch <strong>and</strong> Serpkenci 1990).<br />
5.3. Pricing Policies <strong>and</strong> Product Assortment<br />
Similarly, there was no change in the pricing policies<br />
or the product assortment at the stores. As previously<br />
noted, BMS <strong>and</strong> Tweeterwere part of the same<br />
buying group, The Progressive <strong>Retail</strong>ers Organization.<br />
Thus, both had access to the same manufacturers<br />
<strong>and</strong> obtained theirproducts forthe same price. Our<br />
interviews revealed that BMS’s <strong>and</strong> Tweeter’s product<br />
assortments, defined as the set of products carried<br />
in each store (Kök et al. 2006), were virtually identical<br />
<strong>and</strong> that retail prices did not change substantially<br />
afterthe acquisition. In fact, both BMS <strong>and</strong> Tweeter<br />
had price guarantees in place during our period of<br />
analysis such that the store would match the price<br />
of any other consumer electronics retailer. Moreover,<br />
none of the six merchants we interviewed was able to<br />
identify specific ways in which pricing or assortment<br />
changed afterthe acquisition. The chief merchant<br />
specifically stated that any changes in assortment <strong>and</strong><br />
pricing were minor <strong>and</strong> not a critical factor in explaining<br />
the changes to sales <strong>and</strong> shrinkage.<br />
5.4. Regression <strong>An</strong>alysis<br />
To test ourhypotheses, we fit a series of nested, fixedeffects<br />
regression models. One series of regression<br />
models tests the hypothesized relationship between<br />
monthly store sales (SALES) <strong>and</strong> store manager<br />
incentives (TWTR). TWTR is a dichotomous variable<br />
because the incentives at each store were changed<br />
simultaneously. TWTR is set equal to zero for those<br />
months before the incentive change <strong>and</strong> one for those<br />
months afterthe incentive change. Had we been able<br />
to design the experiment on our own, we would have<br />
considered changing incentives gradually over time<br />
at a number of stores while keeping the remaining<br />
stores as is, to act as our comparative control group.<br />
Given that the incentive change happened simultaneously<br />
for all stores observed, we rely on this dichotomous<br />
variable, TWTR, to accurately characterize the<br />
onetime step-change in store manager incentives that<br />
occurred in the field.<br />
As specified below, the variables SALES, INVEN,<br />
RETAIL, <strong>and</strong> AD were transformed by taking their natural<br />
log <strong>and</strong> were renamed, respectively, LNSALES,<br />
LNINVEN, LNRETAIL, <strong>and</strong> LNAD.<br />
LNSALES st = B s + B 13TWTR t + B 14LNRETAIL t<br />
+ B 15LNINVEN st + B 16LNAD t<br />
s = 1–12� t= 1–22�<br />
where s represents each store <strong>and</strong> t each month in<br />
our sample. The primary reason for transforming our<br />
variables in this way was to linearize the regression<br />
model (Kleinbaum et al. 1998). <strong>An</strong>alysis of the raw<br />
data suggests a nonlinearrelationship between the<br />
outcome variable, SALES, <strong>and</strong> each of the predictors.<br />
We found the log transformation to be the most effective<br />
at inducing linearity <strong>and</strong> such transformations<br />
are commonly used when assessing the drivers of<br />
retail sales (see, for example, Montgomery 1997, Hoch
DeHoratius <strong>and</strong> Raman: <strong>Store</strong> <strong>Manager</strong> <strong>Incentive</strong> <strong>Design</strong> <strong>and</strong> <strong>Retail</strong> <strong>Performance</strong><br />
526 Manufacturing & Service Operations Management 9(4), pp. 518–534, © 2007 INFORMS<br />
et al. 1995, Blattberg <strong>and</strong> Wisniewski 1989). Moreover,<br />
several of the variables, in their raw form, have<br />
st<strong>and</strong>ard deviations that are large relative to their<br />
means. Afifi <strong>and</strong> Clark (1997) recommend transforming<br />
such variables to induce normality prior to model<br />
estimation.<br />
The addition of store effects, B s, enables us to<br />
control for differences among stores (e.g., store size,<br />
layout, <strong>and</strong> location) <strong>and</strong> store personnel. Using<br />
industry retail sales data as a control has the added<br />
benefit of controlling not only for trends in consumer<br />
electronics sales but also for expected seasonality (i.e.,<br />
month-to-month variation in sales). Because of missing<br />
data, advertising expenditure for some months<br />
had to be estimated by us in collaboration with BMS<br />
<strong>and</strong> Tweetermanagers. See the online appendix for<br />
robustness checks on these estimates. 4<br />
The other set of nested, fixed-effects regression<br />
models tests the hypothesized relationship between<br />
store shrinkage (SHRINK) <strong>and</strong> store manager incentives<br />
(TWTR). The control variables in these models<br />
include inventory level <strong>and</strong> store differences as specified<br />
in the fixed-effects model below. Forpurposes<br />
of this analysis of shrinkage, we measured inventory<br />
dollars in thous<strong>and</strong>s of dollars <strong>and</strong> defined a new<br />
variable called ADJ_INVEN.<br />
SHRINK st = B s + B 13TWTR t + B 14ADJ_INVEN st<br />
s = 1–12� t= 1–22�<br />
where s represents each store <strong>and</strong> t each month in our<br />
sample.<br />
We did not use logarithmic variables to model<br />
shrinkage for two reasons. First, due to the limited<br />
academic research on shrinkage, we did not have<br />
substantive reasons to favor multiplicative relations<br />
between shrinkage <strong>and</strong> ourcontrol orexplanatory<br />
variables. Second, a logarithmic model was difficult to<br />
implement because shrinkage was zero during many<br />
months at different stores. We did, however, regress<br />
the natural log of shrinkage, where zero or negative<br />
shrinkage was equated to a small number, onto<br />
the natural log of inventory, the store dummies, <strong>and</strong><br />
4 <strong>An</strong> online appendix to this paperis available on the Manufacturing<br />
& Service Operations Management website (http://msom.pubs.<br />
informs.org/ecompanion.html.)<br />
TWTR, <strong>and</strong> we found results consistent with those<br />
presented in §6.2. Specifically, TWTR is statistically<br />
significant (t = 4�24, p �� crit; df=1��=0�05� 33�40 > 3�84). In<br />
this model, TWTR is statistically significant (t = 3�40,<br />
p = 0�0009) <strong>and</strong> positively associated with changes<br />
in sales (LNSALES) aftercontrolling forstore effects,<br />
increases in inventory (LNINVEN), <strong>and</strong> consumer<br />
electronics industry sales (LNRETAIL).
DeHoratius <strong>and</strong> Raman: <strong>Store</strong> <strong>Manager</strong> <strong>Incentive</strong> <strong>Design</strong> <strong>and</strong> <strong>Retail</strong> <strong>Performance</strong><br />
Manufacturing & Service Operations Management 9(4), pp. 518–534, © 2007 INFORMS 527<br />
Table 3 The Impact of <strong>Incentive</strong> System <strong>and</strong> Select Independent Variables, Controlling for <strong>Store</strong> Effects, on<br />
the Natural Log of Sales �n = 264�<br />
Parameter estimate (st<strong>and</strong>ard error)<br />
Model 1 Model 2 Model 3 Model 4 Model 5<br />
Fixed effects<br />
S01–S12 ∗∗∗ ∗∗∗ ∗∗∗ ∗∗∗ ∗∗∗<br />
TWTR 0�24∗∗∗ (0.04) 0�20∗∗∗ (0.03) 0�12∗∗∗ (0.03) 0�11∗∗∗ (0.03)<br />
LNRETAIL 1�58∗∗∗ (0.13) 1�49∗∗∗ (0.13) 1�48∗∗∗ (0.13)<br />
LNINVEN 0�72∗∗∗ (0.11) 0�71∗∗∗ (0.11)<br />
LNAD 0�002 (0.003)<br />
−2LL (df) −0�31 (12) −26�37 (13) −143�91 (14) −177�30 (15) −177�71 (16)<br />
Comparison model Model 1 Model 2 Model 3 Model 4<br />
�−2LL ��df� 26.06 (1) 117.54 (1) 33.40 (1) 0.41 (1)<br />
p-value p
DeHoratius <strong>and</strong> Raman: <strong>Store</strong> <strong>Manager</strong> <strong>Incentive</strong> <strong>Design</strong> <strong>and</strong> <strong>Retail</strong> <strong>Performance</strong><br />
528 Manufacturing & Service Operations Management 9(4), pp. 518–534, © 2007 INFORMS<br />
in shrinkage aftercontrolling forstore effects <strong>and</strong><br />
increases in inventory (ADJ_INVEN). We found no<br />
evidence of serious multicollinearity on examination<br />
of the variance inflation factors for the independent<br />
variables predicting shrinkage. We observed variance<br />
inflation factors ranging from 1.8 to 5.8. Problematic<br />
collinearity arises, as noted in §6.1, when variance<br />
inflation factors exceed 10 (Kennedy 2001).<br />
Consequently, whethera store managerwas rewarded<br />
according to the BMS or Tweeter incentive<br />
plan accounts foran estimated difference, on average,<br />
of $785 in monthly inventory shrinkage, after controlling<br />
for store differences <strong>and</strong> the increase in inventory.<br />
Clearly, more store shrinkage existed in Tweeter<br />
when store manager bonuses were no longer deducted<br />
dollarfordollarin store shrinkage. This change in<br />
incentives, a change that reduced the emphasis on<br />
shrink prevention in the store manager compensation<br />
plan, substantially increased store shrinkage (H2:<br />
confirmed).<br />
6.3. Supporting Field Evidence<br />
The linkage between incentives <strong>and</strong> performance asserted<br />
above is supported by field observations of<br />
managerial behavior. We did not directly observe<br />
store managerbehaviorbefore the incentive change,<br />
but relied on the accounts of others familiar with both<br />
the BMS <strong>and</strong> TWTR incentive regime to describe any<br />
observed changes. Interviewees consistently claimed<br />
that because the penalty forshrinkage was reduced,<br />
store managers not only shifted their effort allocation<br />
away from activities that prevented shrinkage toward<br />
activities that increased sales, but also chose to alter<br />
store processes to facilitate sales activities. For example,<br />
BMS store managers were described as creating a<br />
“defensive” (i.e., theft-preventing) store environment.<br />
They would lock up any inventory that could be<br />
stolen readily, which included product categories such<br />
as accessories (e.g., cassettes, batteries, <strong>and</strong> cables),<br />
personal stereo devices, <strong>and</strong> camcorders. However,<br />
forthose items it was also true that allowing consumers<br />
to touch <strong>and</strong> feel the product might increase<br />
sales. Moreover, executives recounted BMS store managers<br />
avoiding selling merch<strong>and</strong>ise on display in<br />
cases forwhich they had lost the keys. Although<br />
such displays make products inaccessible to thieves<br />
<strong>and</strong> helped control shrinkage, it also made the product<br />
inaccessible to potential customers, thus creating<br />
an atmosphere of “sales prevention,” according<br />
to formerBMS <strong>and</strong> current Tweeterexecutives. Such<br />
concern over shrinkage seemed to influence other<br />
operational decisions made by store managers. For<br />
instance, BMS store managers often refused to open<br />
a store for business should too few salespeople be on<br />
h<strong>and</strong> during a particular time period. Furthermore,<br />
BMS store managers monitored the product delivery<br />
process by personally reconciling shipments between<br />
the store <strong>and</strong> the warehouse even if this meant leaving<br />
customers unserved. The former BMS operations<br />
manager<strong>and</strong> current Tweeterdirectorof operations<br />
summed up the atmosphere at BMS succinctly: “We<br />
had control of everything.”<br />
However, underthe Tweeterincentive plan, store<br />
managers became business managers who were “out<br />
on the sales floorwatching what was going on <strong>and</strong><br />
assisting theirsalespeople in making sales, making<br />
sure the merch<strong>and</strong>ising was right, <strong>and</strong> the operational<br />
stuff was sound.” <strong>Store</strong> managers became “sales motivators”<br />
<strong>and</strong> could be seen on the sales floor more<br />
often. Products were no longer kept in locked displays,<br />
but ratherout on the floorwhere individual<br />
customers could h<strong>and</strong>le them. Additionally, Tweeter<br />
store managers did not insist on personally monitoring<br />
receipts at the store when their presence was<br />
required for sales assistance.<br />
This reported change in store manager behavior<br />
afterthe implementation of the Tweeterincentive plan<br />
lends support to our analytical findings. The way in<br />
which store managers are rewarded for the set of<br />
activities that control shrinkage <strong>and</strong> the set of activities<br />
that generate sales is associated with variations<br />
in sales <strong>and</strong> shrinkage. We argue that this variation<br />
in sales <strong>and</strong> shrinkage is the direct result of the transfer<br />
of effort away from shrink-prevention activities,<br />
given the reduction in the penalty for shrinkage, <strong>and</strong><br />
toward creating a positive sales environment within<br />
the store with respect to both effort allocation <strong>and</strong><br />
process choice.<br />
The observed change in behavior among store<br />
managers is consistent with the assumption of selfinterested<br />
agents. If we view the principal as offering<br />
eithera punitive (BMS) ora rewarding (TWTR) incentive<br />
contract, an agent orstore managermaximizing<br />
her self-interest would choose shrink-prevention
DeHoratius <strong>and</strong> Raman: <strong>Store</strong> <strong>Manager</strong> <strong>Incentive</strong> <strong>Design</strong> <strong>and</strong> <strong>Retail</strong> <strong>Performance</strong><br />
Manufacturing & Service Operations Management 9(4), pp. 518–534, © 2007 INFORMS 529<br />
Table 5 Payoff to <strong>Store</strong> <strong>Manager</strong>s<br />
Behavior<br />
Contract type Shrink prevention Sales promotion<br />
BMS $3�930 $3�672<br />
TWTR $5�600 $6�251<br />
behaviorunderthe BMS regime <strong>and</strong> sales promotion<br />
behaviorunderthe TWTR regime. We define shrinkprevention<br />
behavior as behavior that results in preacquisition<br />
sales <strong>and</strong> shrinkage, namely $155,890 <strong>and</strong><br />
$123, respectively (Table 2). Sales promotion behavioris<br />
defined as behaviorthat results in postacquisition<br />
sales <strong>and</strong> shrinkage aftercontrolling forother<br />
drivers of sales <strong>and</strong> shrinkage, namely a 13% increase<br />
in preacquisition sales ($176,155) <strong>and</strong> a $785 increase<br />
in shrinkage ($908). Table 5 summarizes the monthly<br />
payoff to store managers, given the type of contract<br />
offered <strong>and</strong> the behavior chosen.<br />
To derive these numbers we made the following<br />
assumptions. First, we assume that under the<br />
BMS contract store managers receive an average sales<br />
bonus (e.g., 2.6%). According to our interviews, store<br />
managers under the BMS contract typically received<br />
bonuses below this average. Recall that store managers<br />
under a BMS contract received a percentage<br />
of sales <strong>and</strong> a dollar-for-dollar reduction in pay for<br />
shrinkage. Under the TWTR contract, we assume<br />
store managers receive a bonus on store-operating<br />
income of 10%, also average. To obtain an estimate<br />
of SOI, we multiply store sales with a 36%<br />
gross margin rate <strong>and</strong> then subtract store shrinkage.<br />
Tweeter requested that we not disclose its gross margin<br />
rate when it was privately owned. Consequently,<br />
we derived our gross margin estimate by averaging<br />
the gross margin numbers disclosed in its 1998, 1999,<br />
<strong>and</strong> 2001 annual reports after the company had gone<br />
public.<br />
In sum, if offered the BMS contract, it is in the<br />
best interest of store managers to behave as shrink<br />
preventers because their reward for doing so ($3,930)<br />
is greater than it is if they elect to be sales promoters<br />
($3,672). If offered the TWTR contract, it is<br />
in the best interest of store managers to behave as<br />
sales promoters because the reward for doing so<br />
($6,251) is greater than the $5,600 they would obtain<br />
by behaving as shrink preventers. This predicted shift<br />
in behaviorgiven the payoffs undereach contract is<br />
exactly the shift in behaviorobserved.<br />
6.4. RivalExplanations<br />
Because this incentive change occurred in conjunction<br />
with a change in firm ownership, one could argue that<br />
the observed increase in sales stemmed from the new<br />
interest customers may have had in the store after<br />
this takeover. However, Tweeter chose not to advertise<br />
the change in ownership at BMS stores forfearof<br />
alienating existing customers. These newly acquired<br />
stores advertised under the BMS name <strong>and</strong>, during<br />
the period of our study, no significant store remodeling<br />
took place. Thus, it seems unlikely that the change<br />
in sales is associated with the advertising of new ownership.<br />
However, while we did control for advertising<br />
expenditure, we were unable to control for changes<br />
in the advertising media used due to the lack of<br />
detailed records. We do know that BMS primarily<br />
used newspaperinserts while Tweeterrelied on radio<br />
advertising. The extent to which this change in advertising<br />
media influenced sales during this period is<br />
unknown. That said, not one of the interviewees questioned<br />
about this case mentioned advertising as the<br />
primary explanation for the observed change in store<br />
managerbehavior<strong>and</strong> the measured changes in both<br />
store sales <strong>and</strong> shrinkage.<br />
7. <strong>Manager</strong>ialImplications<br />
Reducing inventory shrinkage is a key objective for<br />
many retailers, <strong>and</strong> store managers are often asked<br />
to target a shrink number that is a certain percentage<br />
of sales. Flanagan <strong>and</strong> Kahn (1989) warn that focusing<br />
too much attention on shrink prevention could<br />
be suboptimal forthe firm because prevention techniques<br />
(e.g., hiring a detective) are costly. They argue<br />
that a profit-maximizing firm will not want to take<br />
steps to reduce shoplifting, a form of shrinkage, if the<br />
added costs incurred in doing so exceed the generated<br />
savings. We show that if store manager compensation<br />
is linked to shrinkage in addition to sales, it is<br />
not only the cost of shrink prevention that matters,<br />
but also the potential forlost sales. In the sections<br />
that follow, we quantify the impact that altering the<br />
penalty for shrinkage among store managers had at<br />
Tweeter<strong>and</strong> highlight the implications of ourfindings<br />
to retailers at large.
DeHoratius <strong>and</strong> Raman: <strong>Store</strong> <strong>Manager</strong> <strong>Incentive</strong> <strong>Design</strong> <strong>and</strong> <strong>Retail</strong> <strong>Performance</strong><br />
530 Manufacturing & Service Operations Management 9(4), pp. 518–534, © 2007 INFORMS<br />
7.1. Impact at Tweeter<br />
In sum, ourfindings indicate that as a result of<br />
the change in incentive plan, both store sales <strong>and</strong><br />
shrinkage increased. On average, sales increased by<br />
approximately 13%, controlling for store differences<br />
<strong>and</strong> changes in inventory, advertising expenditure,<br />
<strong>and</strong> U.S. retail sales of consumer electronics. Given<br />
that monthly store sales averaged $155,890 prior to the<br />
change in incentives, a predicted 13% increase in sales,<br />
on average, associated with the change in incentives,<br />
amounts to nearly $20,266 more sales per month per<br />
store. This dramatic increase in sales was accompanied<br />
by only a slight increase in the predicted monthly<br />
shrinkage, roughly $785, controlling for store differences<br />
<strong>and</strong> the addition of store inventory. Hence, using<br />
a gross margin rate 5 of 36%, average monthly store<br />
profit increased 6 by roughly $6,511 as a direct result of<br />
the change in incentive. Across the entire chain of 12<br />
stores <strong>and</strong> over the entire year, we estimate that the<br />
incentive change improved profits by approximately<br />
$938,000, 7 or4.2% of annual preacquisition sales. By<br />
ascertaining that store manager activities were not<br />
rewarded appropriately, Tweeter was able to dramatically<br />
improve its retail performance. The chain was<br />
better off when store managers were rewarded with a<br />
percentage of additional SOI rather than a percentage<br />
of additional sales with a dollar-for-dollar penalty for<br />
shrinkage.<br />
These findings are among the first to link incentives<br />
to retail profit <strong>and</strong> to quantify the impact of store<br />
managerincentives on retail performance. We conclude<br />
by generalizing from this study of Tweeter <strong>and</strong><br />
by arguing its importance to retail organizations <strong>and</strong><br />
academics alike.<br />
7.2. Implications for Other <strong>Retail</strong>ers<br />
<strong>Retail</strong> executives from the more than 40 retailers we<br />
have studied during the last few years agree on<br />
the importance of performance-based store manager<br />
5 See §6.3 for the source of this gross margin percentage.<br />
6 We calculate the increase in average monthly store profit by determining<br />
the additional monthly gross margin dollars generated <strong>and</strong><br />
subtracting the additional monthly shrinkage dollars lost under<br />
the Tweeterstore managerincentive plan (0�36 × $20�266 − $785� ∼<br />
$6�511.<br />
7 ($6,511 permonth perstore) × (12 months/yr) × (12 stores) ∼<br />
$938�000.<br />
incentives, but struggle with the optimal design for<br />
these incentives. Our research underscores the importance<br />
of using a multitasking agent framework to<br />
evaluate incentive design. <strong>Store</strong> managers perform<br />
multiple tasks <strong>and</strong> are responsible for multiple performance<br />
measures. Consequently, it is important that<br />
firms set appropriate weights on different performance<br />
measures when designing incentives for store<br />
managers.<br />
<strong>Incentive</strong>s need to be designed differently in different<br />
retail contexts, based on the relative importance<br />
of select performance measures to the firm’s<br />
profitability <strong>and</strong> the store manager’s ability to impact<br />
each of these performance measures. Consider, for<br />
example, the reward for incremental sales. The relative<br />
importance of sales to profitability differs among<br />
retailers because of differences in their relative gross<br />
margins. For example, a high-end jewelry retailer like<br />
Tiffany & Co. (hereafter Tiffany) has gross margin in<br />
excess of 50% of sales, while Price/Costco Wholesale<br />
Corporation, a warehouse club, has a gross margin<br />
of roughly 11%. In other words, $100 of additional<br />
sales adds $50 to Tiffany’s gross profits, whereas it<br />
adds only $11 to that of Price/Costco. Underst<strong>and</strong>ably,<br />
all else remaining equal, a chain like Tiffany<br />
should reward store managers more for generating<br />
sales than a chain with lower gross margins. In addition,<br />
retailers with high gross margins should be willing<br />
to tolerate more shrinkage if effort can be effectively<br />
shifted from shrink prevention to sales generation.<br />
Using the example above, Price/Costco could<br />
allow foronly one dollarin shrinkage forevery 10<br />
dollars of sales, while Tiffany could allow five dollars<br />
of shrinkage for this amount of sales. Similarly, a<br />
store manager’s ability to improve sales <strong>and</strong> control<br />
expenses can vary substantially from one retail context<br />
to another. Thus, we would expect the relative<br />
emphasis on sales in the store manager’s reward to<br />
differ in different retail contexts.<br />
Identifying store manager incentives that are set<br />
suboptimally <strong>and</strong> altering them suitably can result in<br />
tremendous gains. As evidence of this, we note that<br />
BMS had set incentives suboptimally fora long time<br />
by placing much greater emphasis on shrinkage over<br />
sales. Tweeter was able to improve annual profits by<br />
an estimated 4.2% of sales at BMS by changing these<br />
incentives so that they were aligned with the ability
DeHoratius <strong>and</strong> Raman: <strong>Store</strong> <strong>Manager</strong> <strong>Incentive</strong> <strong>Design</strong> <strong>and</strong> <strong>Retail</strong> <strong>Performance</strong><br />
Manufacturing & Service Operations Management 9(4), pp. 518–534, © 2007 INFORMS 531<br />
of the store manager to impact sales <strong>and</strong> shrinkage<br />
<strong>and</strong> the relative importance of each measure to firm<br />
profitability.<br />
Moreover, Tweeter has successfully achieved similar<br />
results at other retailers acquired since BMS. Once<br />
again, incentives played a key role in changing behavior<br />
<strong>and</strong> performance at these newly acquired retailers.<br />
Forexample, at anotherchain acquired by Tweeter,<br />
salespeople had been rewarded based on sales revenue<br />
rather than on gross margin or store-operating<br />
profit. Not surprisingly, high-price items (e.g., largescreen<br />
TVs) that often had low gross margins received<br />
more attention <strong>and</strong> accounted for a relatively large<br />
portion of this chain’s sales. <strong>Manager</strong>s even allowed<br />
salespeople to negotiate price on such items in order<br />
to achieve store sales goals. By changing the incentives<br />
at these stores to emphasize operating profit,<br />
Tweeterwas able to change the sales mix at these<br />
stores considerably. High gross margin items such as<br />
receivers <strong>and</strong> amplifiers increased from 27% to more<br />
than 30% of the overall business. Despite the fact that<br />
comp store sales decreased following the acquisition,<br />
this focus on profitable sales ensured that the contribution<br />
that each store made to the retailer’s profit<br />
increased. We have anecdotal evidence that retailers<br />
in othersegments face similarchallenges in designing<br />
incentives forstore managers. At one Texas-based<br />
convenience store chain, store managers were paid<br />
according to seniority rather than according to the<br />
performance of their stores. Recently, the incentives<br />
were changed so store managers received a percentage<br />
of store profit. In doing so, the chain found that<br />
not only were expenses controlled more effectively,<br />
but that sales also increased substantially.<br />
<strong>Retail</strong>ers often seem to forget that they are dealing<br />
with multitasking agents in theirstores. Consequently,<br />
when faced with a situation where they<br />
want to affect one performance measure, retailers may<br />
change the incentives associated with that measure<br />
alone. They often fail to note that changing the incentives<br />
associated with one performance measure without<br />
regard to others might substantially hurt other<br />
performance measures. Two examples serve to illustrate<br />
this notion. In spite of the dramatic performance<br />
achieved afterthe acquisition of BMS, some Tweeter<br />
managers were uncomfortable with the higher levels<br />
of store shrinkage, <strong>and</strong> hence advocated a return to<br />
tighter control. Some of them even advocated reverting<br />
to the BMS incentive system, where store managers<br />
were penalized severely for every dollar of<br />
shrinkage. The plan to revert to the old incentive system<br />
was scuttled by othermanagers who pointed<br />
out that such punitive measures would divert attention<br />
from generating sales. To support their position,<br />
these managers were able to point to historical data<br />
as to how the stores had performed under the old<br />
incentive plan compared to their current performance.<br />
Emphasizing the multitasking nature of retailing is<br />
key because rewarding store managers for their performance<br />
on one measure has implications for their<br />
performance on others.<br />
A second example can be drawn from Gamma (see<br />
DeHoratius <strong>and</strong> Raman 2006), a large public retailer<br />
with annual sales of roughly 10 billion dollars, <strong>and</strong><br />
its concern over the accuracy of its inventory records.<br />
Afterphysical audits revealed that the company’s<br />
inventory records were often inaccurate (i.e., the company<br />
had substantially more or less inventory in its<br />
stores than indicated by the inventory computer systems),<br />
some Gamma managers suggested tying the<br />
bonus of store managers <strong>and</strong> salespeople to the accuracy<br />
of the physical audits. Although this bonus system<br />
might have reduced the discrepancy between the<br />
inventory records <strong>and</strong> the actual inventory held in<br />
the store, company managers did not consider the<br />
adverse effect that such a system might have on<br />
sales by diverting the attention of store-level employees<br />
away from key sales-generating activities. When<br />
we pointed out this trade-off, managers at Gamma<br />
quickly renounced their proposed incentive change.<br />
Additional analysis would be needed to determine<br />
whether the value of greater inventory record accuracy<br />
would offset the profit lost from foregone sales.<br />
Ouranalysis shows the importance of both using<br />
performance-based incentives <strong>and</strong> appropriately balancing<br />
the rewards for retail store managers. <strong>Retail</strong>ers<br />
must be cognizant of the way in which firm performance<br />
depends on the behaviorof store employees,<br />
<strong>and</strong> they must be sure to induce behaviors that contribute<br />
to firm profit. Doing so requires that retailers<br />
underst<strong>and</strong> how the reward for one activity impacts<br />
not only the effort allocated to that activity, but each<br />
of the otheractivities forwhich the individual is<br />
accountable.
DeHoratius <strong>and</strong> Raman: <strong>Store</strong> <strong>Manager</strong> <strong>Incentive</strong> <strong>Design</strong> <strong>and</strong> <strong>Retail</strong> <strong>Performance</strong><br />
532 Manufacturing & Service Operations Management 9(4), pp. 518–534, © 2007 INFORMS<br />
8. Concluding Remarks<br />
Ourwork focuses on the behaviorof store managers<br />
facing two different incentive contracts in a single<br />
retail context. Using data gathered from the field,<br />
we examine the performance implications of different<br />
compensation designs, revealing that the same store<br />
managers behave vastly differently under two types<br />
of incentive regimes <strong>and</strong> how this change in behavior<br />
led to a substantial improvement in store performance<br />
during the period observed. The strength of<br />
ourquasi-experiment lies in ourability to make causal<br />
inferences in the actual context of interest (Shadish<br />
et al. 2002). However, identifying <strong>and</strong> controlling<br />
foralternative explanations of ourobserved effect is<br />
critical in experiments such as ours that lack r<strong>and</strong>om<br />
assignments <strong>and</strong> pre-established control groups.<br />
We therefore attribute the observed change in store<br />
performance to the change in store manager incentive<br />
design only aftercontrolling forplausible rival<br />
hypotheses.<br />
Advantages of field research within one organization<br />
include the use of detailed, firm-specific data <strong>and</strong><br />
a deep underst<strong>and</strong>ing of the study context gained<br />
through observation <strong>and</strong> interviews. However, our<br />
ability to claim that incentives matteroutside this context<br />
is limited. More specifically, it is not certain that<br />
the causal relationship between incentives <strong>and</strong> performance<br />
observed in this retail firm generalizes to a<br />
larger sample of retail firms, let alone other organizations.<br />
Consequently, additional research is required to<br />
assess the extent to which ourfindings hold beyond<br />
those stores for which we have data, <strong>and</strong> to account<br />
forany differences identified.<br />
In other contexts, researchers have found incentives<br />
to have a detrimental impact on performance<br />
by negatively influencing intrinsic motivation (Kohn<br />
1993), job satisfaction (Herzberg 1968), R&D intensity<br />
(Hoskinsson et al. 1993), <strong>and</strong> organizational<br />
citizenship behavior(Deckop et al. 1999). Pfeffer<br />
(1998) argues that individual incentive pay undermines<br />
teamwork <strong>and</strong> encourages short-term decision<br />
making, both of which threaten organizational performance.<br />
Both Kerr (1975) <strong>and</strong> Smith (1993) highlight<br />
the unintended consequences of outcome-based<br />
incentives in the public sector. Moreover, Beer <strong>and</strong><br />
Katz (2003) discoverthat when making daily business<br />
decisions, executives claim not to considertheir<br />
incentive plan, a finding they claim calls into question<br />
whetherincentives actually do influence behavior.<br />
Ourwork does not evaluate such individual-level<br />
factors such as managerial perception of incentives,<br />
job satisfaction, orintrinsic motivation. Instead, we<br />
use organizational performance measures to capture<br />
individual store manager performance. Although this<br />
approach is consistent with many empirical studies<br />
of management, particularly on executive compensation<br />
(see, forexample, Lambert <strong>and</strong> Larcker1987), it is<br />
important to recognize that such measures are likely<br />
to capture managerbehaviorwith more noise <strong>and</strong><br />
less sensitivity than a manager-specific performance<br />
measure (Banker<strong>and</strong> Datar1989). Nevertheless, inferences<br />
about managerial behavior are often made<br />
from observing organizational performance measures<br />
in the absence of manager-specific measures—given<br />
the inability to directly observe managerial behavior(Bushman<br />
et al. 1995, Lambert <strong>and</strong> Larcker1987).<br />
Future work is needed to assess whether any of these<br />
individual-level factors might moderate the relationship<br />
between incentive change <strong>and</strong> firm performance<br />
observed in our context.<br />
Finally, in our work with retailers, we have observed<br />
a multitude of store manager payment schemes. This<br />
variation in store manager pay is akin to the variation<br />
in CEO compensation found across multiple<br />
firms. Several researchers have attempted to identify<br />
the drivers of variation in CEO compensation across<br />
multiple firms (see, for example, Walls 1999, Zajac<br />
<strong>and</strong> Westphal 1994, Ramanan et al. 1993). <strong>An</strong> analysis<br />
of a cross section of retail firms may provide<br />
additional insight into the structure <strong>and</strong> effectiveness<br />
of different store manager incentive plans. Barkema<br />
<strong>and</strong> Gomez-Mejia (1998) provide a general theoretical<br />
framework for underst<strong>and</strong>ing CEO compensation<br />
across firms that could be applied to the retail context<br />
with the addition of some context-specific variables.<br />
With this framework, one might be able to explain<br />
the different choices of store manager incentive design<br />
across firms <strong>and</strong> provide additional insight into the<br />
structure <strong>and</strong> effectiveness of different store manager<br />
incentive plans.<br />
Acknowledgments<br />
The authors wish to thank the many employees of Tweeter<br />
Home Entertainment Group fortheirparticipation in this
DeHoratius <strong>and</strong> Raman: <strong>Store</strong> <strong>Manager</strong> <strong>Incentive</strong> <strong>Design</strong> <strong>and</strong> <strong>Retail</strong> <strong>Performance</strong><br />
Manufacturing & Service Operations Management 9(4), pp. 518–534, © 2007 INFORMS 533<br />
study. Forhis generous contribution of time <strong>and</strong> data, they<br />
would particularly like to thank Bernie Sapienza, formerly<br />
of the TweeterHome Entertainment Group. This paper<br />
benefited tremendously from discussions with Bill Simpson<br />
<strong>and</strong> Suzanne Graham. The authors also would like to<br />
acknowledge the insightful comments of Aleda Roth, the<br />
senior editor, <strong>and</strong> two anonymous referees, each of whom<br />
contributed to improving this paper. Working versions of<br />
this paper bore the titles “<strong>Store</strong> <strong>Manager</strong> <strong>Incentive</strong> <strong>Design</strong><br />
<strong>and</strong> <strong>Retail</strong> <strong>Performance</strong> at Tweeter Home Entertainment<br />
Group” <strong>and</strong> “<strong>Retail</strong> <strong>Performance</strong> Improvement Through<br />
Appropriate <strong>Store</strong> <strong>Manager</strong> <strong>Incentive</strong> <strong>Design</strong>: <strong>An</strong> Empirical<br />
<strong>An</strong>alysis.”<br />
References<br />
Afifi, A. A., V. Clark. 1997. Computer-Aided Multivariate <strong>An</strong>alysis.<br />
Chapman <strong>and</strong> Hall, Boca Raton, FL.<br />
Banker, R. D., S. M. Datar. 1989. Sensitivity, precision, <strong>and</strong> linear<br />
aggregation of signals for performance evaluation. J. Accounting<br />
Res. 27 21–39.<br />
Banker, R. D., L. Seok-Young, G. Potter. 1996a. A field study of the<br />
impact of a performance-based incentive plan. J. Accounting<br />
Econom. 21 195–226.<br />
Banker, R. D., L. Seok-Young, G. Potter, D. Srinivasan. 1996b.<br />
Contextual analysis of performance impacts of outcome-based<br />
incentive compensation. Acad. Management J. 39 920–948.<br />
Barkema, H. G., L. R. Gomez-Mejia. 1998. <strong>Manager</strong>ial compensation<br />
<strong>and</strong> firm performance: A general research framework. Acad.<br />
Management J. 41 135–145.<br />
Beer, M., N. Katz. 2003. Do incentives work? The perceptions of a<br />
worldwide sample of senior executives. Human Resource Planning<br />
26 30–44.<br />
Bell, D. E. 1994. Harvard note on retail economics. Note 595006.<br />
Harvard Business School Press, Boston, MA.<br />
Blattberg, R. C., K. J. Wisniewski. 1989. Price-induced patterns of<br />
competition. Marketing Sci. 8 291–309.<br />
Bushman, R. M., R. J. Indjejikian, A. Smith. 1995. Aggregate performance<br />
measures in business unit manager compensation:<br />
The role of intrafirm interdependencies. J. Accounting Res. 33<br />
101–128.<br />
Campbell, D. T., H. L. Ross. 1968. The connecticut crackdown on<br />
speeding: Time series data in quasi-experimental analysis. Law<br />
Soc. Rev. 3 22–52.<br />
Chain <strong>Store</strong> Age. 2001. Tackling the high cost of theft. 77 108–110.<br />
Cockburn, I., R. Henderson, S. Stern. 1999. Balancing incentives:<br />
The tension between basic <strong>and</strong> applied research. Working<br />
Paper 6882, National Bureau of Economic Research, Cambridge,<br />
MA.<br />
Deckop, J. R., R. Mangel, C. C. Cirka. 1999. Getting more than<br />
you pay for: Organizational citizenship behavior <strong>and</strong> pay-forperformance<br />
plans. Acad. Management J. 42 420–428.<br />
DeHoratius, N., A. Raman. 2006. Inventing record inaccuracy:<br />
<strong>An</strong> empirical analysis. Working paper, University of Chicago,<br />
Chicago, IL.<br />
Dekimpe, M. G., D. M. Hanssens. 1999. Sustained spending <strong>and</strong><br />
persistent reponse: A new look at long-term marketing profitability.<br />
J. Marketing Res. 36 397–412.<br />
Eisenhardt, K. M. 1985. Control: Organizational <strong>and</strong> economic<br />
approaches. Management Sci. 31 134–149.<br />
Eisenhardt, K. M. 1988. Agency- <strong>and</strong> institutional-theory explanations:<br />
The case of retail-sales compensation. Acad. Management<br />
J. 31 488–511.<br />
Feltham, G. A., J. Xie. 1994. <strong>Performance</strong> measure congruity <strong>and</strong><br />
diversity in multi-task principal/agent relations. Accounting<br />
Rev. 69 429–453.<br />
Flanagan, R. J., L. M. Kahn. 1989. Economics of the Employment Relationship.<br />
Addison-Wesley Publishing Company, Boston, MA.<br />
Gabel, H. L., B. Sinclair-Desgagne. 1993. <strong>Manager</strong>ial incentives <strong>and</strong><br />
environmental compliance. J. Environ. Econom. Management 24<br />
229–240.<br />
Gijsbrechts, E., K. Campo, T. Goossens. 2003. The impact of<br />
store flyers on store traffic <strong>and</strong> store sales: A geo-marketing<br />
approach. J. <strong>Retail</strong>ing 79 1–16.<br />
Greene, W. H. 2000. Econometric <strong>An</strong>alysis. Prentice Hall, Upper Saddle<br />
River, NJ.<br />
Hanssens, D. M., L. J. Parsons, R. L. Schultz. 1990. Market Response<br />
Models: Econometric <strong>and</strong> Time Series <strong>An</strong>alysis. KluwerAcademic<br />
Publishers, Norwell, MA.<br />
Herzberg, F. 1968. One more time: How do we motivate employees?<br />
Harvard Bus. Rev. 46 53–62.<br />
Hise, R. T., J. P. Kelly, M. Gable, J. B. McDonald. 1983. Factors<br />
affecting the performance of individual chain store units: <strong>An</strong><br />
empirical analysis. J. <strong>Retail</strong>ing 59 22–39.<br />
Hoch, S. J., B. Kim, A. L. Montgomery, P. E. Rossi. 1995. Determinants<br />
of store-level price elasticity. J. Marketing Res. 31 17–29.<br />
Hollinger, R. C., L. Langton. 2004. National retail security survey:<br />
Final report. Report, University of Flordia, Gainesville, FL.<br />
Holmstrom, B., P. Milgrom. 1991. Multitask principal-agent analyses:<br />
<strong>Incentive</strong> contracts, asset ownership, <strong>and</strong> job design. J. Law<br />
Econom. Organ. 7 24–52.<br />
Hoskisson, R. E., M. A. Hitt, C. W. L. Hill. 1993. <strong>Manager</strong>ial incentives<br />
<strong>and</strong> investment in R&D in large multiproduct firms.<br />
Organ. Sci. 4 325–341.<br />
Jenkins, G. D., A. Mitra, N. Gupta, J. D. Shaw. 1998. Are financial<br />
incentives related to performance? A meta-analytic review of<br />
empirical research. J. Appl. Psych. 83 777–787.<br />
Kennedy, P. 2001. A Guide to Econometrics. MIT Press, Cambridge,<br />
MA.<br />
Kerr, S. 1975. On the folly of rewarding A, while hoping for B. Acad.<br />
Management J. 18 769–783.<br />
Kleinbaum, D. G., L. L. Kupper, K. E. Muller, A. Nizam. 1998.<br />
Applied Regression <strong>An</strong>alysis <strong>and</strong> Other Multivariable Methods.<br />
Duxbury Press, Pacific Grove, CA.<br />
Knez, M., D. Simester. 2001. Firm-wide incentives <strong>and</strong> mutual monitoring<br />
at continental airlines. J. Labor Econom. 19 743–772.<br />
Kohn, A. 1993. Why incentive plans cannot work. Harvard Bus. Rev.<br />
71 54–63.<br />
Kök, A. G., M. Fisher, R. Vaidyanathan. 2006. <strong>Retail</strong> assortment<br />
planning: Review of literature <strong>and</strong> industry practice. Working<br />
paper, Fuqua School of Business, Duke University, Durham,<br />
NC.<br />
Lambert, R. A., D. F. Larcker. 1987. <strong>An</strong> analysis of the use of<br />
accounting <strong>and</strong> market measures of performance in executive<br />
compensation contracts. J. Accounting Res. 25 85–125.<br />
Lazear, E. P. 2000. <strong>Performance</strong> pay <strong>and</strong> productivity. Amer. Econom.<br />
Rev. 90 1346–1361.
DeHoratius <strong>and</strong> Raman: <strong>Store</strong> <strong>Manager</strong> <strong>Incentive</strong> <strong>Design</strong> <strong>and</strong> <strong>Retail</strong> <strong>Performance</strong><br />
534 Manufacturing & Service Operations Management 9(4), pp. 518–534, © 2007 INFORMS<br />
Levy, M., B. A. Weitz. 1998. <strong>Retail</strong>ing Management. Irwin McGraw-<br />
Hill, Boston, MA.<br />
Lodish, L. M., M. Abraham, S. Kalmenson, J. Livelsberger,<br />
B. Lubetkin, B. Richardson, M. E. Stevens. 1995. How T.V.<br />
advertising works: A meta-analysis of 389 real-world split<br />
cable T.V. advertising experiments. J. Marketing Res. 32 125–139.<br />
Lucas, G. H. 1985. The relationship between job attitudes, personal<br />
characteristics, <strong>and</strong> job outcomes: A study of retail store managers.<br />
J. <strong>Retail</strong>ing 61 35–62.<br />
Lusch, R. F., R. R. Serpkenci. 1990. Personal differences, job tension,<br />
job outcomes, <strong>and</strong> store performance: A study of retail store<br />
managers. J. Marketing 54 85–102.<br />
Montgomery, A. L. 1997. Creating micro-marketing pricing strategies<br />
using supermarket scanner data. Marketing Sci. 16 315–337.<br />
Pfeffer, J. 1998. Six dangerous myths about pay. Harvard Bus. Rev.<br />
76 109–119.<br />
Prendergast, C. 1999. The provision of incentives in firms. J. Econom.<br />
Literature 37 7–63.<br />
Ramanan, R., D. T. Simon, D. Harris. 1993. Chief executive compensation<br />
surrounding strategic divestitures. Internat. J. Management<br />
10 256–263.<br />
Shadish, W. R., T. D. Cook, D. T. Campbell. 2002. Experimental<br />
<strong>and</strong> Quasi-Experimental <strong>Design</strong>s. Houghton Mifflin Company,<br />
Boston, MA.<br />
Slade, M. E. 1996. Multitask agency <strong>and</strong> contract choice: <strong>An</strong> empirical<br />
exploration. Internat. Econom. Rev. 37 465–486.<br />
Smith, P. 1993. Outcome-related performance indicators <strong>and</strong> organizational<br />
control in the public sector. British J. Management 4<br />
135–151.<br />
Terborg, J. R., G. R. Ungson. 1985. Group-administered bonus pay<br />
<strong>and</strong> retail store performance: A two-year study of management<br />
compensation. J. <strong>Retail</strong>ing 61 63–77.<br />
Walls, W. D. 1999. Tournaments <strong>and</strong> management compensation:<br />
Evidence from the U.S. commercial banking industry. Internat.<br />
J. Management 16 171–179.<br />
Wolfe, H. B. 1968. A model for control of style merch<strong>and</strong>ise. Indust.<br />
Management Rev. 9 69–82.<br />
Yin, R. K. 1994. Case Study Research: <strong>Design</strong> <strong>and</strong> Methods. Sage Publications,<br />
Thous<strong>and</strong> Oaks, CA.<br />
Zajac, E. J., J. D. Westphal. 1994. The costs <strong>and</strong> benefits of managerial<br />
incentives <strong>and</strong> monitoring in large U.S. corporations:<br />
When is more not better? Strategic Management J. 15 121–142.