Agency Budget Chapters - Office of the Chief Financial Officer
Agency Budget Chapters - Office of the Chief Financial Officer
Agency Budget Chapters - Office of the Chief Financial Officer

You also want an ePaper? Increase the reach of your titles
YUMPU automatically turns print PDFs into web optimized ePapers that Google loves.
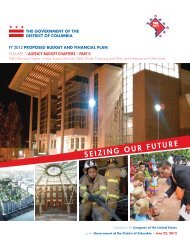
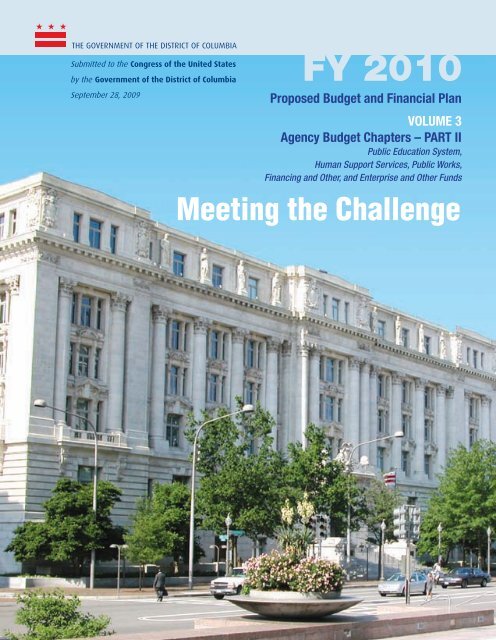
The GovernmenT <strong>of</strong> The DiSTriCT <strong>of</strong> ColumbiA<br />
Submitted to <strong>the</strong> Congress <strong>of</strong> <strong>the</strong> United States<br />
by <strong>the</strong> Government <strong>of</strong> <strong>the</strong> District <strong>of</strong> Columbia<br />
September 28, 2009 Proposed <strong>Budget</strong> and <strong>Financial</strong> Plan<br />
Volume 3<br />
<strong>Agency</strong> <strong>Budget</strong> <strong>Chapters</strong> – PART II<br />
Public Education System,<br />
Human Support Services, Public Works,<br />
Financing and O<strong>the</strong>r, and Enterprise and O<strong>the</strong>r Funds<br />
Meeting <strong>the</strong> Challenge
Government <strong>of</strong> <strong>the</strong> District <strong>of</strong> Columbia<br />
FY 2010 Proposed <strong>Budget</strong> and<br />
<strong>Financial</strong> Plan<br />
Volume 3 - <strong>Agency</strong> <strong>Budget</strong> <strong>Chapters</strong> - Part II<br />
(Public Education System, Human Support Services, Public Works, Financing and O<strong>the</strong>r,<br />
and Enterprise and O<strong>the</strong>r Funds)<br />
Meeting<br />
<strong>the</strong><br />
Challenge<br />
Submitted<br />
to <strong>the</strong><br />
Congress <strong>of</strong> <strong>the</strong> United States<br />
by <strong>the</strong><br />
Government <strong>of</strong> <strong>the</strong> District <strong>of</strong> Columbia
The Government Finance <strong>Office</strong>rs Association <strong>of</strong> <strong>the</strong> United States and Canada (GFOA) presented an award <strong>of</strong><br />
Distinguished <strong>Budget</strong> Presentation to <strong>the</strong> District <strong>of</strong> Columbia for its annual and capital budget for <strong>the</strong> fiscal year<br />
beginning October 1, 2008.<br />
In order to receive this award, a governmental unit must publish a budget document that meets program criteria<br />
<strong>of</strong> a policy document, a financial plan, an operational guide and a communications device.<br />
The award is <strong>the</strong> ninth in <strong>the</strong> history <strong>of</strong> <strong>the</strong> District <strong>of</strong> Columbia. The <strong>Office</strong> <strong>of</strong> <strong>Budget</strong> and Planning will<br />
submit this FY 2010 <strong>Budget</strong> and <strong>Financial</strong> Plan for consideration by GFOA, and believes <strong>the</strong> FY 2010 Proposed<br />
<strong>Budget</strong> and <strong>Financial</strong> Plan continues to conform to <strong>the</strong> GFOA’s requirements.
Neil O. Albert<br />
City Administrator<br />
Carrie Kohns<br />
<strong>Chief</strong> <strong>of</strong> Staff<br />
Government <strong>of</strong> <strong>the</strong><br />
District <strong>of</strong> Columbia<br />
Adrian M. Fenty, Mayor<br />
Natwar M. Gandhi<br />
<strong>Chief</strong> <strong>Financial</strong> <strong>Office</strong>r<br />
Members <strong>of</strong> <strong>the</strong> Council<br />
Vincent C. Gray<br />
Chairman - At Large<br />
Victor Reinoso<br />
Deputy Mayor for Education<br />
David A. Catania ........................................................ At Large<br />
Phil Mendelson ............................................................At Large<br />
Kwame R. Brown.........................................................At Large<br />
Michael A. Brown .......................................................At Large<br />
Jim Graham ....................................................................Ward 1<br />
Jack Evans ......................................................................Ward 2<br />
Mary M. Cheh ................................................................Ward 3<br />
Muriel Bowser.................................................................Ward 4<br />
Harry Thomas, Jr.. ........................................................Ward 5<br />
Tommy Wells ...................................................................Ward 6<br />
Yvette M. Alexander.......................................................Ward 7<br />
Marion Barry ..................................................................Ward 8<br />
Eric Goulet<br />
<strong>Budget</strong> Director<br />
William Singer<br />
<strong>Chief</strong> <strong>of</strong> <strong>Budget</strong> Execution
Lasana Mack<br />
Deputy <strong>Chief</strong> <strong>Financial</strong> <strong>Office</strong>r<br />
<strong>Office</strong> <strong>of</strong> Finance and Treasury<br />
Robert Ebel<br />
Deputy <strong>Chief</strong> <strong>Financial</strong> <strong>Office</strong>r<br />
<strong>Office</strong> <strong>of</strong> Revenue Analysis<br />
Deloras Shepherd<br />
Human Support Services<br />
George Dines<br />
Government Services<br />
Angelique Hayes<br />
Public Safety and Justice<br />
<strong>Office</strong> <strong>of</strong> <strong>the</strong> <strong>Chief</strong> <strong>Financial</strong> <strong>Office</strong>r<br />
Lucille Dickinson<br />
<strong>Chief</strong> <strong>of</strong> Staff<br />
David Tseng<br />
General Counsel<br />
Stephanie Royal<br />
Associate General Counsel<br />
Associate <strong>Chief</strong> <strong>Financial</strong> <strong>Office</strong>rs<br />
<strong>Office</strong> <strong>of</strong> <strong>the</strong> CIO<br />
Michael Teller, <strong>Chief</strong> Information <strong>Office</strong>r<br />
Sonny Hashmi, Deputy CIO<br />
Lillian Copelin, Director<br />
Freeman Murray, Deputy Director<br />
Narayan Ayyagari<br />
Surjeet Kalsi-Heneghan<br />
Stephen Durity<br />
Darryl Miller<br />
Anthony F. Pompa<br />
Deputy <strong>Chief</strong> <strong>Financial</strong> <strong>Office</strong>r<br />
<strong>Office</strong> <strong>of</strong> <strong>Financial</strong> Operations and Systems<br />
Stephen Cordi<br />
Deputy <strong>Chief</strong> <strong>Financial</strong> <strong>Office</strong>r<br />
<strong>Office</strong> <strong>of</strong> Tax and Revenue<br />
Mohamed Mohamed<br />
Government Operations<br />
Cyril Byron, Jr.<br />
Economic Development and Regulation<br />
Tom Berger<br />
Education
<strong>Office</strong> <strong>of</strong> <strong>Budget</strong> and Planning<br />
<strong>Budget</strong> Administration<br />
Eric Cannady, Director<br />
Renee Waddy<br />
Human Services & Public Works<br />
Kenneth Evans, Deputy Director<br />
Joshua Agbehakun<br />
Rasheed Dawodu<br />
Lydia Hallums<br />
Carolyn Johnson<br />
Hilton Marcus<br />
Sunday Okparaocha<br />
Government Operations and<br />
Economic Development<br />
Viola Davies, Deputy Director<br />
Ernest Chukwuma<br />
Amina Elzeneiny<br />
Daniel Kalegha<br />
William Powell<br />
David Smith<br />
Public Education and Public Safety<br />
David Hines, Deputy Director<br />
Gary Ayers<br />
Nicole Dean<br />
Timothy Mattock<br />
Alonso Montalvo<br />
Ana Reyes<br />
Gizele Richards<br />
Grants Management<br />
Janice Walker<br />
Robin Moore<br />
Gordon McDonald<br />
Deputy <strong>Chief</strong> <strong>Financial</strong> <strong>Office</strong>r<br />
James Spaulding<br />
Associate Deputy <strong>Chief</strong> <strong>Financial</strong> <strong>Office</strong>r<br />
Executive <strong>Office</strong><br />
Hea<strong>the</strong>r McCabe<br />
Michael Sheaffer<br />
<strong>Financial</strong> Planning and Analysis<br />
Leticia Stephenson, Director<br />
David Kobes<br />
Randall Myers<br />
Duane Smith<br />
<strong>Financial</strong> Management Services<br />
and Operations<br />
Sumita Chaudhuri, Director<br />
Travis Allen<br />
Robert Johnson<br />
Sharon Nelson<br />
Carlotta Osorio<br />
Sue Taing<br />
Margaret Myers, Production Manager<br />
Capital<br />
Improvements Program<br />
David Clark, Director<br />
John McGaw, Deputy Director<br />
Sherrie Greenfield<br />
Omar Herzi<br />
Bharat Kothari<br />
Joseph Wolfe<br />
A special thank you to <strong>the</strong> analysts from o<strong>the</strong>r District agencies who assisted <strong>the</strong> <strong>Office</strong> <strong>of</strong> <strong>Budget</strong> and<br />
Planning during <strong>the</strong> preparation <strong>of</strong> <strong>the</strong> budget.
District <strong>of</strong> Columbia<br />
- Organization Chart
Government <strong>of</strong> <strong>the</strong> District <strong>of</strong> Columbia<br />
Legislative<br />
Branch<br />
Council <strong>of</strong> <strong>the</strong><br />
District<br />
<strong>of</strong> Columbia*<br />
D.C. Auditor<br />
Advisory<br />
Neighborhood<br />
Commissions*<br />
D.C. Public<br />
Schools<br />
Public Charter<br />
Schools<br />
Independent Agencies<br />
<strong>Office</strong> <strong>of</strong> <strong>the</strong><br />
<strong>Chief</strong> <strong>Financial</strong><br />
<strong>Office</strong>r<br />
<strong>Office</strong> <strong>of</strong> <strong>Budget</strong><br />
and Planning<br />
<strong>Office</strong> <strong>of</strong> Tax and<br />
Revenue<br />
<strong>Office</strong> <strong>of</strong> <strong>Financial</strong><br />
Operations and<br />
Systems<br />
<strong>Office</strong> <strong>of</strong> Finance<br />
and Treasury<br />
<strong>Office</strong> <strong>of</strong> Revenue<br />
Analysis<br />
<strong>Office</strong> <strong>of</strong> Finance<br />
and Resource<br />
Management<br />
Deputy Mayor for<br />
Education<br />
<strong>Office</strong> <strong>of</strong> <strong>the</strong> State<br />
Superintendent <strong>of</strong><br />
Education<br />
<strong>Office</strong> <strong>of</strong> Public<br />
Education<br />
Facilities<br />
Modernization<br />
Water and Sewer Authority<br />
District <strong>of</strong> Columbia Retirement Board<br />
<strong>Office</strong> <strong>of</strong> Employee Appeals<br />
Public Employee Relations Board<br />
Washington Convention Center Authority<br />
Housing Finance <strong>Agency</strong><br />
Public Defenders Services<br />
Pretrial Services <strong>Agency</strong><br />
D.C. Lottery and Charitable Games Control Board<br />
Board <strong>of</strong> Library Trustees<br />
University <strong>of</strong> <strong>the</strong> District <strong>of</strong> Columbia Board <strong>of</strong> Trustees<br />
<strong>Office</strong> <strong>of</strong> <strong>the</strong> People’s Counsel<br />
D. C. Housing Authority<br />
Contract Appeals Board<br />
Board <strong>of</strong> Real Property Assessments and Appeals<br />
Alcoholic Beverage Regulation Administration<br />
Criminal Justice Coordinating Council<br />
*Elected <strong>of</strong>ficials<br />
<strong>Office</strong> <strong>of</strong> <strong>the</strong><br />
Attorney General <strong>of</strong><br />
<strong>the</strong> District <strong>of</strong><br />
Columbia<br />
Deputy Mayor for<br />
Planning and<br />
Economic<br />
Development<br />
Department <strong>of</strong><br />
Consumer and<br />
Regulatory Affairs<br />
Department <strong>of</strong><br />
Employment Services<br />
Department <strong>of</strong><br />
Housing and<br />
Community<br />
Development<br />
Department <strong>of</strong><br />
Insurance, Securities<br />
and Banking<br />
<strong>Office</strong> <strong>of</strong> Planning<br />
Commission on <strong>the</strong><br />
Arts and Humanities<br />
Department <strong>of</strong> Small<br />
and Local Business<br />
Development<br />
<strong>Office</strong> <strong>of</strong> Cable<br />
Television<br />
<strong>Office</strong> <strong>of</strong> <strong>the</strong> Tenant<br />
Advocate<br />
Executive Branch<br />
Mayor*<br />
Charter Independent Agencies<br />
Zoning Commission<br />
Public Charter Schools<br />
Public Service Commission<br />
Board <strong>of</strong> Elections and Ethics<br />
Department<br />
<strong>of</strong> Motor Vehicles<br />
Department<br />
<strong>of</strong> Public Works<br />
District Department<br />
<strong>of</strong> <strong>the</strong> Environment<br />
Department <strong>of</strong> Parks<br />
and Recreation<br />
Department <strong>of</strong><br />
Transportation<br />
D.C. Taxicab<br />
Commission<br />
<strong>Office</strong> <strong>of</strong> <strong>the</strong><br />
Inspector<br />
General<br />
Executive <strong>Office</strong><br />
<strong>of</strong> <strong>the</strong> Mayor<br />
<strong>Office</strong> <strong>of</strong> <strong>the</strong><br />
Secretary <strong>of</strong> <strong>the</strong><br />
District <strong>of</strong> Columbia<br />
<strong>Office</strong> <strong>of</strong> Community<br />
Affairs<br />
<strong>Office</strong> on Latino<br />
Affairs<br />
Serve DC<br />
<strong>Office</strong> <strong>of</strong> <strong>the</strong> City<br />
Administrator<br />
Department <strong>of</strong><br />
Human Services<br />
Department <strong>of</strong><br />
Health<br />
Department <strong>of</strong><br />
Mental Health<br />
<strong>Office</strong> on Aging<br />
Child and Family<br />
Services <strong>Agency</strong><br />
Department <strong>of</strong><br />
Youth<br />
Rehabilitation<br />
Services<br />
Department <strong>of</strong><br />
Disability Services<br />
Department <strong>of</strong><br />
Health Care<br />
Finance<br />
Department <strong>of</strong><br />
Corrections<br />
Fire and<br />
Emergency<br />
Medical Services<br />
Department<br />
Metropolitan<br />
Police Department<br />
Homeland Security<br />
and Emergency<br />
Management<br />
<strong>Agency</strong><br />
<strong>Office</strong> <strong>of</strong> <strong>the</strong> <strong>Chief</strong><br />
Medical Examiner<br />
<strong>Office</strong> <strong>of</strong> Unified<br />
Communications<br />
<strong>Office</strong> <strong>of</strong><br />
Administrative<br />
Hearings<br />
Regional Bodies<br />
Judicial Branch<br />
D.C. Court<br />
<strong>of</strong> Appeals<br />
D.C. Superior<br />
Court<br />
Joint Commission<br />
on Judicial<br />
Administration<br />
Commission on<br />
Judicial<br />
Disabilities and<br />
Tenure<br />
Judicial<br />
Nomination<br />
Commission<br />
District <strong>of</strong><br />
Columbia Bar<br />
Sentencing and<br />
Criminal Code<br />
Revision<br />
Commission<br />
<strong>Office</strong> <strong>of</strong> Risk<br />
Management<br />
<strong>Office</strong> <strong>of</strong> Human<br />
Rights<br />
<strong>Office</strong> <strong>of</strong> <strong>the</strong> <strong>Chief</strong><br />
Technology <strong>Office</strong>r<br />
<strong>Office</strong> <strong>of</strong> Contracts<br />
and Procurement<br />
DC Department <strong>of</strong><br />
Human Resources<br />
Department <strong>of</strong> Real<br />
Estate Services<br />
<strong>Office</strong> <strong>of</strong> Disability<br />
Rights<br />
Metropolitan Washington Council <strong>of</strong> Governments<br />
National Capital Planning Commission<br />
Washington Metropolitan Area Transit Authority<br />
Washington Metropolitan Area Transit Commission<br />
Washington Metropolitan Airports Authority
Transmittal Letter
Transmittal Letter<br />
FY 2010 Proposed <strong>Budget</strong> and <strong>Financial</strong> Plan<br />
Volume 3<br />
<strong>Agency</strong> <strong>Budget</strong> <strong>Chapters</strong><br />
(by Appropriation Title)<br />
Contents<br />
<strong>Agency</strong> <strong>Budget</strong> <strong>Chapters</strong> by Appropriation Title<br />
(Public Education System, Human Support Services, Public Works, Financing and O<strong>the</strong>r and<br />
Enterprise and O<strong>the</strong>r Funds)<br />
D. Public Education System<br />
1. District <strong>of</strong> Columbia Public Schools (GA) .............................................................................................................D-1<br />
2. Teachers’ Retirement System (GX)........................................................................................................................D-23<br />
3. <strong>Office</strong> <strong>of</strong> <strong>the</strong> State Superintendent <strong>of</strong> Education (GD).......................................................................................D-27<br />
4. District <strong>of</strong> Columbia Public Charter Schools (GC) ............................................................................................D-51<br />
5. University <strong>of</strong> <strong>the</strong> District <strong>of</strong> Columbia Subsidy Account (GG)..........................................................................D-61<br />
6. District <strong>of</strong> Columbia Public Library (CE) ............................................................................................................D-65<br />
7. District <strong>of</strong> Columbia Public Charter School Board (GB) ...................................................................................D-77<br />
8. Deputy Mayor for Education (GW).....................................................................................................................D-81<br />
9. <strong>Office</strong> <strong>of</strong> Public Education Facilities Modernization (GM)................................................................................D-87<br />
10. Non-Public Tuition (GN).......................................................................................................................................D-97<br />
11. Special Education Transportation (GO)..............................................................................................................D-101<br />
E. Human Support Services<br />
1. Department <strong>of</strong> Human Services (JA) ......................................................................................................................E-1<br />
2. Child and Family Services <strong>Agency</strong> (RL) ...............................................................................................................E-17<br />
3. Department <strong>of</strong> Mental Health (RM).....................................................................................................................E-35<br />
4. Department <strong>of</strong> Health (HC) ..................................................................................................................................E-53<br />
5. Department <strong>of</strong> Parks and Recreation (HA)...........................................................................................................E-75<br />
6. D.C. <strong>Office</strong> on Aging (BY)....................................................................................................................................E-89<br />
7. Unemployment Compensation Fund (BH) ..........................................................................................................E-99<br />
8. Disability Compensation Fund (BG)...................................................................................................................E-103<br />
9. <strong>Office</strong> <strong>of</strong> Human Rights (HM)............................................................................................................................E-107<br />
10. <strong>Office</strong> on Latino Affairs (BZ)...............................................................................................................................E-117<br />
11. Children and Youth Investment Collaborative (JY)...........................................................................................E-125<br />
12. <strong>Office</strong> on Asian and Pacific Islander Affairs (AP) ..............................................................................................E-131<br />
13. <strong>Office</strong> <strong>of</strong> Veterans’ Affairs (VA)............................................................................................................................E-137<br />
14. Department <strong>of</strong> Youth Rehabilitation Services ( JZ)............................................................................E-143<br />
15. Department on Disability Services ( JM)............................................................................................E-155<br />
16. Department <strong>of</strong> Health Care Finance (HT)........................................................................................E-171<br />
FY 2010 Proposed <strong>Budget</strong> and <strong>Financial</strong> Plan: <strong>Agency</strong> <strong>Budget</strong> <strong>Chapters</strong>
F. Public Works<br />
1. Department <strong>of</strong> Public Works (KT)...........................................................................................................................F-1<br />
2. Department <strong>of</strong> Transportation (KA).......................................................................................................................F-13<br />
3. Department <strong>of</strong> Motor Vehicles (KV) .....................................................................................................................F-29<br />
4. District Department <strong>of</strong> <strong>the</strong> Environment (KG) ....................................................................................................F-41<br />
5. D.C. Taxicab Commission (TC).............................................................................................................................F-55<br />
6. Washington Metropolitan Area Transit Commission (KC) .................................................................................F-63<br />
7. Washington Metropolitan Area Transit Authority (KE) ......................................................................................F-67<br />
8. School Transit Subsidy (KD)...................................................................................................................................F-73<br />
G. Financing and O<strong>the</strong>r<br />
1. Debt Service (DS, ZA, CP, ZB, SM, DT)..............................................................................................................G-1<br />
2. Settlements and Judgments (ZH) ..........................................................................................................................G-15<br />
3. John A. Wilson Building Fund (ZZ).....................................................................................................................G-19<br />
4. Workforce Investments (UP)..................................................................................................................................G-23<br />
5. Non-Departmental (DO) .......................................................................................................................................G-27<br />
6. Emergency Planning and Security Fund (EP)......................................................................................................G-31<br />
7. Cash Reserve (CS)...................................................................................................................................................G-35<br />
8. Master Equipment Lease/Purchase Program (EL) ..............................................................................................G-39<br />
9. Pay-As-You-Go Capital Fund (PA).......................................................................................................................G-43<br />
10. District Retiree Health Contribution (RH) ..........................................................................................................G-47<br />
11. Baseball Transfer-Dedicated Taxes (BO)...............................................................................................................G-51<br />
12. Inaugural Expenses (SB) .........................................................................................................................................G-55<br />
13. Highway Trust Fund Transfer Dedicated Taxes (KZ)..........................................................................................G-59<br />
14. Convention Center Transfer Dedicated Taxes (EZ).............................................................................................G-63<br />
15. TIF and PILOT Transfer Dedicated Taxes (TZ).................................................................................................G-67<br />
H. Enterprise and O<strong>the</strong>r Funds<br />
1. Water and Sewer Authority (LA) ............................................................................................................................H-1<br />
2. Washington Aqueduct (LB) .....................................................................................................................................H-7<br />
3. D.C. Lottery and Charitable Games Control Board (DC).................................................................................H-11<br />
4. D.C. Sports and Entertainment Commission (SC) .............................................................................................H-17<br />
5. District <strong>of</strong> Columbia Retirement Board (DY)......................................................................................................H-23<br />
6. Washington Convention Center Authority (ES)..................................................................................................H-29<br />
7. Housing Finance <strong>Agency</strong> (HF)..............................................................................................................................H-35<br />
8. University <strong>of</strong> <strong>the</strong> District <strong>of</strong> Columbia (GF).........................................................................................................H-41<br />
9. D.C. Department <strong>of</strong> Human Resources <strong>Agency</strong> Trust (UV)..............................................................................H-55<br />
10. D.C. Public Library <strong>Agency</strong> Trust (UW) .............................................................................................................H-59<br />
11. Unemployment Insurance Trust Fund (UI) ..........................................................................................................H-63<br />
12. Housing Production Trust Fund (UZ) ..................................................................................................................H-67<br />
13. Tax Increment Financing (TIF) Program (TX) ...................................................................................................H-71<br />
14. Ballpark Revenue Fund (BK) .................................................................................................................................H-75<br />
15. Repayment <strong>of</strong> PILOT Financing (TY) ................................................................................................................H-79<br />
FY 2010 Proposed <strong>Budget</strong> and <strong>Financial</strong> Plan
Volumes Bound Separately<br />
Volume 1 - FY 2010 Proposed <strong>Budget</strong> and <strong>Financial</strong> Plan - Executive Summary<br />
Volume 2 - FY 2010 Proposed <strong>Budget</strong> and <strong>Financial</strong> Plan - <strong>Agency</strong> <strong>Budget</strong> <strong>Chapters</strong> - Part I<br />
Volume 4 - FY 2010 Proposed <strong>Budget</strong> and <strong>Financial</strong> Plan - Operating Appendices - Part 1.................................<br />
Volume 5 - FY 2010 Proposed <strong>Budget</strong> and <strong>Financial</strong> Plan - Operating Appendices - Part 2.................................<br />
Volume 6 - FY 2010 Proposed <strong>Budget</strong> and <strong>Financial</strong> Plan - FY 2010 - FY 2015 Capital Appendices<br />
Volume 7 - FY 2010 Proposed <strong>Budget</strong> and <strong>Financial</strong> Plan - FY 2010 - FY 2015 Highway Trust Fund<br />
FY 2010 Proposed <strong>Budget</strong> and <strong>Financial</strong> Plan: <strong>Agency</strong> <strong>Budget</strong> <strong>Chapters</strong>
How to Read <strong>the</strong> <strong>Budget</strong> and <strong>Financial</strong><br />
Plan<br />
The District <strong>of</strong> Columbia’s FY 2010 Proposed <strong>Budget</strong> and <strong>Financial</strong><br />
Plan is a communications tool that presents and explains policy priorities;<br />
agency operations, including program/organizational structures;<br />
and performance measures in <strong>the</strong> context <strong>of</strong> <strong>the</strong> financial plan that<br />
shows <strong>the</strong> District’s sources <strong>of</strong> revenue and planned expenditures.<br />
Included are forecasts <strong>of</strong> economic and financial conditions, current<br />
and planned long-term debt financing, policy decisions, and o<strong>the</strong>r<br />
important financial information for <strong>the</strong> District's government. These<br />
elements are essential for accurate financial reporting and sound management<br />
<strong>of</strong> public resources.<br />
How to Read <strong>the</strong> <strong>Budget</strong> and <strong>Financial</strong> Plan<br />
describes <strong>the</strong> sections <strong>of</strong> this budget volume that<br />
define <strong>the</strong> budget priorities for <strong>the</strong> District. These sections<br />
are consistent with <strong>the</strong> National Advisory<br />
Council on State and Local <strong>Budget</strong>ing’s recommended<br />
budget practices that call for a presentation <strong>of</strong><br />
information that provides <strong>the</strong> reader with a guide to<br />
government programs and organizational structure.<br />
Additionally, <strong>the</strong>se sections are consistent with <strong>the</strong><br />
standards <strong>of</strong> <strong>the</strong> Government Finance <strong>Office</strong>rs<br />
Association for <strong>the</strong> Distinguished <strong>Budget</strong><br />
Presentation Award.<br />
The FY 2010 <strong>Budget</strong> and <strong>Financial</strong> Plan is presented<br />
in seven volumes summarized as follows:<br />
Executive Summary (Volume 1) - Provides a highlevel<br />
summary <strong>of</strong> <strong>the</strong> general budget and financial<br />
information, including sections describing <strong>the</strong> new<br />
initiatives within <strong>the</strong> District's proposed budget, <strong>the</strong><br />
transmittal letters from <strong>the</strong> Mayor, information on<br />
<strong>the</strong> strategic budgeting process, <strong>the</strong> District’s 5-year<br />
financial plan, detailed information on <strong>the</strong> District’s<br />
projected revenues and expenditures, and various<br />
appendices. In addition, this volume includes information<br />
about <strong>the</strong> District's budgetary and financial<br />
management policies, grant match and maintenance<br />
<strong>of</strong> effort, statistical pr<strong>of</strong>ile <strong>of</strong> <strong>the</strong> District, glossary <strong>of</strong><br />
budget terms, budget summary tables by agency and<br />
fund type, and <strong>the</strong> <strong>Budget</strong> Request Act legislation<br />
that serves as <strong>the</strong> basis for <strong>the</strong> District’s federal appropriations<br />
act.<br />
<strong>Agency</strong> <strong>Budget</strong> <strong>Chapters</strong> (Volumes 2 and 3) -<br />
Describes <strong>the</strong> operating budgets for each <strong>of</strong> <strong>the</strong><br />
District's agencies by appropriation title.<br />
Appropriation titles categorize <strong>the</strong> general areas <strong>of</strong> services<br />
provided by <strong>the</strong> District on behalf <strong>of</strong> its citizens<br />
and are listed in <strong>the</strong> Table <strong>of</strong> Contents. Examples are<br />
Public Education System and Human Support<br />
Services.<br />
How to Read <strong>the</strong> <strong>Budget</strong> and <strong>Financial</strong> Plan<br />
i
Operating Appendices (Volumes 4 and 5) - Includes<br />
detailed supporting tables displaying <strong>the</strong> proposed<br />
expenditures and full-time equivalents in <strong>the</strong> operating<br />
budgets that are described in Volume 2.<br />
Note: These volumes are available exclusively on <strong>the</strong><br />
Government <strong>of</strong> <strong>the</strong> District <strong>of</strong> Columbia website at<br />
http://cfo.dc.gov/.<br />
Capital Appendices (Volume 6) - Describes <strong>the</strong><br />
District’s proposed six-year capital improvement plan<br />
for all <strong>of</strong> <strong>the</strong> District's agencies (excluding <strong>the</strong><br />
Highway Trust Fund).<br />
Highway Trust Fund (Volume 7) - Describes <strong>the</strong><br />
District’s proposed FY 2010 to 2015 planned projects.<br />
Detailed information on <strong>the</strong> chapter contents <strong>of</strong><br />
each volume include:<br />
Volume 1: Executive Summary<br />
Includes:<br />
Introduction: FY 2010 Proposed <strong>Budget</strong> and<br />
<strong>Financial</strong> Plan<br />
This chapter is a narrative and graphic summary <strong>of</strong><br />
<strong>the</strong> proposed budget and financial plan. It describes<br />
<strong>the</strong> overall proposed budget, including <strong>the</strong> sources<br />
and uses <strong>of</strong> public funds versus <strong>the</strong> prior year's<br />
approved budget. The chapter also explains <strong>the</strong> budget<br />
development process and calendar for FY 2010.<br />
Strategic <strong>Budget</strong>ing<br />
This chapter describes <strong>the</strong> initiatives that <strong>the</strong> District<br />
is undertaking to improve budgeting and management<br />
<strong>of</strong> resources. It includes a description <strong>of</strong> <strong>the</strong><br />
District's continued efforts and progress in<br />
Performance-Based <strong>Budget</strong>ing (PBB), which is <strong>the</strong><br />
District's initiative to align resources with results,<br />
benchmarking, performance measurement, performance<br />
planning, and service-level budgeting. PBB<br />
greatly improves <strong>the</strong> District's ability to make policy<br />
and funding decisions based on anticipated results<br />
and improve <strong>the</strong> District's ability to hold program<br />
managers accountable for achieving results.<br />
FY 2010 Proposed <strong>Budget</strong> and <strong>Financial</strong> Plan<br />
ii<br />
<strong>Financial</strong> Plan<br />
The <strong>Financial</strong> Plan summarizes planned revenues and<br />
expenditures for FY 2010-2013. This chapter<br />
includes financing sources and uses and assumptions<br />
applied to derive <strong>the</strong> short-term and long-term economic<br />
outlook. It also includes an assessment <strong>of</strong> <strong>the</strong><br />
impact <strong>of</strong> budgetary decisions on <strong>the</strong> financial health<br />
<strong>of</strong> <strong>the</strong> District.<br />
Revenue<br />
This chapter shows current revenue projections for<br />
each revenue type as certified by <strong>the</strong> <strong>Office</strong> <strong>of</strong> <strong>the</strong><br />
<strong>Chief</strong> <strong>Financial</strong> <strong>Office</strong>r It also details <strong>the</strong> District's<br />
revenue sources, provides an overview <strong>of</strong> <strong>the</strong> District’s<br />
and regional economy and economic trends, and <strong>the</strong><br />
outlook for revenue through FY 2013.<br />
Operating Expenditures<br />
This chapter describes <strong>the</strong> District's recent local<br />
expenditures and future projections. It includes<br />
analysis <strong>of</strong> expenditures between FY 2005 and 2008,<br />
both by agency and by expense category such as personnel,<br />
supplies, or fixed costs.<br />
Capital Improvements Plan<br />
This chapter describes <strong>the</strong> overall CIP including <strong>the</strong><br />
sources and uses <strong>of</strong> Capital funds.<br />
Appendices<br />
This last section <strong>of</strong> <strong>the</strong> Executive Summary volume<br />
contains a number <strong>of</strong> items to clarify <strong>the</strong> District's<br />
budget:<br />
■ The D.C. Comprehensive <strong>Financial</strong> Management<br />
Policy provides a framework for fiscal decision-making<br />
by <strong>the</strong> District to ensure that financial resources<br />
are available to meet <strong>the</strong> present and future needs <strong>of</strong><br />
District citizens;<br />
■ The Grant Match and Maintenance <strong>of</strong> Effort<br />
section includes a table by agency and grant number<br />
that provides <strong>the</strong> required grant match and<br />
maintenance <strong>of</strong> effort contributions for federal<br />
and private grants received by <strong>the</strong> District;
■ The Basis <strong>of</strong> <strong>Budget</strong>ing and Accounting section<br />
describes <strong>the</strong> basis <strong>of</strong> budgeting and accounting,<br />
which allows <strong>the</strong> reader to understand <strong>the</strong> different<br />
presentation methods <strong>of</strong> <strong>the</strong> District's<br />
finances;<br />
■ The Glossary <strong>of</strong> <strong>Budget</strong> Terms section describes<br />
unique budgeting, accounting, and District terms<br />
that may not be known by <strong>the</strong> general reader;<br />
■ The Summary Tables detail <strong>the</strong> District's proposed<br />
operating budget by agency and fund type<br />
for both <strong>the</strong> budgeted dollars and positions; and<br />
■ The <strong>Budget</strong> Request Act is <strong>the</strong> legislation that <strong>the</strong><br />
District Council and Mayor use to enact <strong>the</strong><br />
District's budget via local law, and serves as <strong>the</strong><br />
basis for <strong>the</strong> District’s federal appropriations act to<br />
be enacted into law by <strong>the</strong> United States Congress<br />
and President via <strong>the</strong> federal appropriations<br />
process.<br />
Volumes 2 and 3: <strong>Agency</strong> <strong>Budget</strong><br />
<strong>Chapters</strong> - Part I & II<br />
Includes:<br />
<strong>Agency</strong> chapters illustrate available resources, what<br />
<strong>the</strong> resources are spent on, and <strong>the</strong> outcomes achieved<br />
and anticipated as a result <strong>of</strong> <strong>the</strong>se expenditures.<br />
Changes from <strong>the</strong> previous year include:<br />
■ The FY 2010 <strong>Budget</strong> and <strong>Financial</strong> Plan provides<br />
<strong>the</strong> budget in a table format and <strong>the</strong> bulk <strong>of</strong> <strong>the</strong><br />
budget detail is presented in tabular form, with<br />
expanded information in <strong>the</strong> tables for FY 2010<br />
as well as narrative summaries.<br />
■ For those agencies with performance plans, a table<br />
is included in <strong>the</strong> agency chapter that contains <strong>the</strong><br />
agency’s performance measures.<br />
<strong>Chapters</strong> are grouped by appropriation title and each<br />
chapter contains <strong>the</strong> following sections, as appropriate:<br />
Header Information:<br />
■ <strong>Agency</strong> name and budget code;<br />
■ Website address and telephone; and<br />
■ FY 2010 proposed operating budget table.<br />
Introduction:<br />
■ <strong>Agency</strong> mission; and<br />
■ Summary <strong>of</strong> Services.<br />
<strong>Financial</strong> and Program Information:<br />
■ Proposed Funding by Source table;<br />
■ Proposed Full-Time Equivalents table;<br />
■ Proposed Expenditure by Comptroller Source<br />
Group table;<br />
■ Program Descriptions;<br />
■ Proposed Expenditure by Program (PBB agencies)<br />
table;<br />
■ Major Baseline, Cost Savings and Policy<br />
Initiatives;<br />
■ FY 2009 Approved <strong>Budget</strong> to FY 2010 Proposed<br />
<strong>Budget</strong> reconciliation table;<br />
■ <strong>Agency</strong> Performance Plan Objectives; and<br />
■ <strong>Agency</strong> Performance Measures table.<br />
To help <strong>the</strong> reader navigate <strong>the</strong> <strong>Agency</strong> <strong>Budget</strong><br />
Chapter volume, an example <strong>of</strong> an agency narrative is<br />
presented at <strong>the</strong> end <strong>of</strong> this chapter. This example<br />
represents a performance plan agency. Callout boxes<br />
highlight <strong>the</strong> features discussed above.<br />
Volumes 4 and 5: Operating<br />
Appendices - Part I and II<br />
These two volumes provide supporting tables to each<br />
agency's proposed operating budget. The tables generally<br />
include FY 2008 actual expenditures, FY 2009<br />
approved budgets, <strong>the</strong> FY 2010 proposed budget, and<br />
<strong>the</strong> change from FY 2009 to FY 2010 (unless noted).<br />
The following tables are provided for Agencies that<br />
have been converted to a performance-based budgeting<br />
format:<br />
Schedule 30-PBB - Dollars summarized by program,<br />
activity, and governmental fund (governmental fund<br />
breakout is for FY 2010 only and includes general<br />
fund detail);<br />
How to Read <strong>the</strong> <strong>Budget</strong> and <strong>Financial</strong> Plan<br />
iii
Schedule 40-PBB - Dollars summarized by program,<br />
comptroller source group and governmental fund;<br />
Schedule 40G-PBB - Dollars summarized by program,<br />
comptroller source group and appropriated<br />
fund within <strong>the</strong> general fund;<br />
Schedule 41 - Dollars and FTEs summarized by<br />
comptroller source group and governmental fund;<br />
Schedule 41G - Dollars and FTEs summarized by<br />
comptroller source group and appropriated fund<br />
within <strong>the</strong> general fund; and<br />
Schedule 80 - Dollars and FTEs summarized by revenue<br />
type, appropriated fund, and revenue source (for<br />
FY 2010 proposed budget only).<br />
The following tables are provided for agencies that<br />
have not been converted to a PBB format:<br />
Schedule 30 - Dollars summarized by control center,<br />
responsibility center, and governmental fund (governmental<br />
fund breakout is for FY 2009 only and<br />
includes general fund detail);<br />
Schedule 40 - Dollars summarized by control center,<br />
comptroller source group and governmental fund;<br />
Schedule 40G - Dollars summarized by control center,<br />
comptroller source group and appropriated fund<br />
within <strong>the</strong> general fund;<br />
Schedule 41 - Dollars and FTEs summarized by<br />
comptroller source group and governmental fund;<br />
Schedule 41G - Dollars and FTEs summarized by<br />
comptroller source group and appropriated fund<br />
within <strong>the</strong> general fund; and<br />
Schedule 80 - Dollars and FTEs summarized by revenue<br />
type, appropriated fund, and revenue source (for<br />
FY 2010 proposed budget only).<br />
Volume 6: Capital Appendices<br />
This volume covers <strong>the</strong> District's FY 2010-FY 2015<br />
Capital Improvements Plan (CIP), excluding <strong>the</strong><br />
Highway Trust Fund. The volume includes:<br />
FY 2010 Proposed <strong>Budget</strong> and <strong>Financial</strong> Plan<br />
iv<br />
■ The Introduction chapter describes <strong>the</strong> overall<br />
CIP including <strong>the</strong> sources and uses <strong>of</strong> capital<br />
funds, <strong>the</strong> District's policies and procedures for its<br />
capital budget and debt, <strong>the</strong> FY 2010 planning<br />
process, and an overview <strong>of</strong> <strong>the</strong> District <strong>of</strong><br />
Columbia's Water and Sewer Authority's FY<br />
2009-FY 2016 capital improvement plan.<br />
■ The Project Description Forms comprise <strong>the</strong><br />
major portion <strong>of</strong> <strong>the</strong> capital appendices volume.<br />
The project description forms provide details on<br />
capital projects funded by general obligation<br />
bonds, pay-as-you-go (paygo) capital, <strong>the</strong> Master<br />
Equipment Lease program, and <strong>the</strong> Local Street<br />
Maintenance Fund. Each page shows one subproject's<br />
planned allotments for fiscal years 2010<br />
through 2015, description, annual operating<br />
impact, milestone data, and location on a map.<br />
■ The Appendices provide supporting tables and a<br />
glossary about <strong>the</strong> District's capital budget,<br />
including:<br />
- The FY 2010 Appropriated <strong>Budget</strong><br />
Authority Request table summarizes <strong>the</strong> proposed<br />
new projects and changes (increase or<br />
decrease) for ongoing projects by agency, subproject,<br />
and fund (Local versus Local Street<br />
Maintenance);<br />
- The FY 2010 - FY 2015 Planned<br />
Expenditures From New Allotments table<br />
summarizes <strong>the</strong> new allotments' planned FY<br />
2010-FY 2014 expenditures by agency, project,<br />
and subproject;<br />
- The FY 2010-FY 2015 Planned Funding<br />
table summarizes <strong>the</strong> FY 2010 and six-year<br />
funding sources for all new allotments by<br />
agency, subproject, and funding source;<br />
- The Balance <strong>of</strong> Capital <strong>Budget</strong> Authority, All<br />
Projects table summarizes <strong>the</strong> lifetime budget<br />
authority, life-to-date expenditures, total commitments,<br />
and balance <strong>of</strong> budget authority for<br />
all ongoing capital projects by agency, project,<br />
and authority (District versus federal); and
- The Capital Project Cost Estimate Variance<br />
table displays changes to project costs since <strong>the</strong><br />
FY 2009 <strong>Budget</strong>.<br />
Volume 7: Highway Trust Fund<br />
This volume covers <strong>the</strong> District's FY 2010-FY 2015<br />
proposed Highway Trust Fund expenditures, including:<br />
■ The Introduction chapter describes <strong>the</strong> Highway<br />
Trust Fund program, including <strong>the</strong> sources and<br />
uses <strong>of</strong> <strong>the</strong> funds, <strong>the</strong> District's policies and procedures<br />
for <strong>the</strong> trust fund, and <strong>the</strong> FY 2010 planning<br />
process.<br />
■ The next section, <strong>the</strong> Project Description Forms,<br />
comprise <strong>the</strong> majority <strong>of</strong> <strong>the</strong> Highway Trust Fund<br />
volume. Each page shows one sub-project's<br />
planned allotments for FY 2010 through FY<br />
2015, description, annual operating impact, milestone<br />
data, and location on a map.<br />
■ The last section, <strong>the</strong> Appendices, provides supporting<br />
tables about <strong>the</strong> District's Highway Trust<br />
Fund program.<br />
How to Read <strong>the</strong> <strong>Budget</strong> and <strong>Financial</strong> Plan<br />
v
FTE actuals are <strong>the</strong><br />
number <strong>of</strong> Full Time<br />
Equivalent positions<br />
paid.<br />
<strong>Agency</strong> Website address<br />
& Telephone<br />
Summary <strong>of</strong> Services -<br />
a concise explanation<br />
<strong>of</strong> <strong>the</strong> agency’s key<br />
functions.<br />
<strong>Agency</strong> budget code<br />
This section describes<br />
<strong>the</strong> agency’s mission<br />
and purpose.<br />
<strong>Agency</strong><br />
name<br />
This shows <strong>the</strong> agency’s FY<br />
2008 actual expenditures, FY<br />
2009 approved budget, <strong>the</strong> FY<br />
2010 proposed budget and <strong>the</strong><br />
variance from FY 2010 to FY<br />
2009. This includes <strong>the</strong><br />
agency’s operating budget and<br />
FTEs.<br />
How to Read <strong>the</strong> <strong>Budget</strong> and <strong>Financial</strong> Plan<br />
vii
FY 2010 Proposed <strong>Budget</strong> and <strong>Financial</strong> Plan<br />
viii<br />
This table presents <strong>the</strong> agency's total operating budget<br />
from each funding source (Local, Dedicated Taxes, Special<br />
Purpose Revenue, Federal Payments, Federal Grants,<br />
Medicaid, Private Grants, and Intra-District sources).<br />
Shown is a comparison <strong>of</strong> <strong>the</strong> FY 2007 actual, FY 2008<br />
actual, FY 2009 approved, and FY 2010 proposed budgets.
This table lists <strong>the</strong> agency’s FTEs<br />
for two prior years, <strong>the</strong> current<br />
year, and upcoming fiscal year by<br />
revenue type.<br />
How to Read <strong>the</strong> <strong>Budget</strong> and <strong>Financial</strong> Plan<br />
ix
FY 2010 Proposed <strong>Budget</strong> and <strong>Financial</strong> Plan<br />
x<br />
This table lists <strong>the</strong> agency's total<br />
operating expenditures for FY 2007 ,<br />
FY 2008, FY 2009 approved budget,<br />
and FY 2010 proposed budget at <strong>the</strong><br />
Comptroller Source Group level.
This indicates <strong>the</strong> specific programs and<br />
activities within an agency. It contains<br />
detailed descriptions <strong>of</strong> <strong>the</strong>ir purpose and<br />
how <strong>the</strong>y contribute to <strong>the</strong> lives <strong>of</strong> District<br />
residents and visitors.<br />
How to Read <strong>the</strong> <strong>Budget</strong> and <strong>Financial</strong> Plan<br />
xi
FY 2010 Proposed <strong>Budget</strong> and <strong>Financial</strong> Plan<br />
xii<br />
This describes <strong>the</strong><br />
agency’s programs &<br />
activities.<br />
This provides an overall budgeted<br />
funding level and number <strong>of</strong><br />
approved full-time equivalent<br />
employees (FTEs) for FY 2008<br />
actuals, approved FY 2009 and FY<br />
2010 proposed for specific programs<br />
and activities.
New for FY 2010, <strong>the</strong> Major Baseline<br />
Adjustments, Cost Savings and Policy<br />
Initiatives section, provides a more comprehensive<br />
explanation <strong>of</strong> Table 5; it includes<br />
major changes within <strong>the</strong> budget from <strong>the</strong> initial<br />
agency request through <strong>the</strong> policy<br />
decisions made by <strong>the</strong> Mayor and <strong>the</strong> Council.<br />
How to Read <strong>the</strong> <strong>Budget</strong> and <strong>Financial</strong> Plan<br />
xiii
Describes policy decreases<br />
that are <strong>the</strong> result <strong>of</strong> proposed<br />
Cost Savings initiatives.<br />
FY 2010 Proposed <strong>Budget</strong> and <strong>Financial</strong> Plan<br />
xiv<br />
Baseline Adjustments<br />
Describes adjustments to <strong>the</strong><br />
agency’s FY 2010 proposed budget<br />
compared to <strong>the</strong> FY 2009<br />
approved budget.<br />
Describes increases<br />
and transfers that<br />
are a result <strong>of</strong><br />
District Policy<br />
Initiatives.<br />
Using a revised format,<br />
this table<br />
describes <strong>the</strong><br />
changes made to an<br />
agency during <strong>the</strong><br />
overall budget formulation<br />
process.
Describes specific<br />
agency performance<br />
objectives from FY 2007<br />
through <strong>the</strong> projected<br />
measure goal in FY 2011.<br />
How to Read <strong>the</strong> <strong>Budget</strong> and <strong>Financial</strong> Plan<br />
xv
D<br />
Public Education System<br />
District <strong>of</strong> Columbia Public Schools (GA) ............................................................D-1<br />
Teachers’ Retirement System (GX).......................................................................D-23<br />
<strong>Office</strong> <strong>of</strong> <strong>the</strong> State Superintendent <strong>of</strong> Education (GD)......................................D-27<br />
District <strong>of</strong> Columbia Public Charter Schools (GC) ...........................................D-51<br />
University <strong>of</strong> <strong>the</strong> District <strong>of</strong> Columbia Subsidy Account (GG).........................D-61<br />
District <strong>of</strong> Columbia Public Library (CE) ...........................................................D-65<br />
District <strong>of</strong> Columbia Public Charter School Board (GB)...................................D-77<br />
Deputy Mayor for Education (GW) ....................................................................D-81<br />
<strong>Office</strong> <strong>of</strong> Public Education Facilities Modernization (GM)...............................D-87<br />
Non-Public Tuition (GN)......................................................................................D-97<br />
Special Education Transportation (GO).............................................................D-101<br />
Public Education System
District <strong>of</strong> Columbia Public Schools<br />
www.k12.dc.us<br />
Telephone: 202-442-5635<br />
(GA0)<br />
% Change<br />
FY 2008 FY 2009 FY 2010 from<br />
Description Actual Approved Proposed FY 2009<br />
Operating <strong>Budget</strong> $1,009,136,763 $764,573,263 $779,574,349 2.0<br />
FTEs 9,411.0 7,375.5 6,909.4 -6.3<br />
The mission <strong>of</strong> <strong>the</strong> District <strong>of</strong> Columbia Public Schools (DCPS) is to<br />
educate all children in <strong>the</strong> District <strong>of</strong> Columbia, providing <strong>the</strong> knowledge<br />
and skills <strong>the</strong>y need to achieve academic success and choose a<br />
rewarding pr<strong>of</strong>essional path.<br />
Summary <strong>of</strong> Services<br />
DCPS delivers all services required to provide students<br />
with a quality education. These include:<br />
■ Operating schools that provide a consistent foundation<br />
in academics, strong support for social and<br />
emotional needs, challenging <strong>the</strong>mes and programs;<br />
■ Hiring, developing, and rewarding teachers, principals,<br />
aides, and o<strong>the</strong>r staff;<br />
■ Developing and implementing academic tools<br />
that provide all students with meaningful options<br />
for life;<br />
■ Collecting data and providing decision and policy-makers<br />
with accurate information about how<br />
students and <strong>the</strong> school district are performing;<br />
■ Providing schools <strong>the</strong> administrative and operational<br />
support <strong>the</strong>y need to foster student achievement;<br />
and<br />
■ Creating forums for interaction and continued<br />
dialogue between DCPS and families and community<br />
members.<br />
The Local funds budget for <strong>the</strong> District <strong>of</strong> Columbia<br />
Public Schools is developed through <strong>the</strong> Uniform Per<br />
Student Funding Formula (UPSFF). For FY 2010,<br />
Local funds for <strong>the</strong> UPSFF are being augmented with<br />
funding received pursuant to <strong>the</strong> American Recovery<br />
and Reinvestment Act <strong>of</strong> 2009. It provides a per student<br />
base foundation funding level as well as weighting<br />
factors for grade level. The UPSFF assigns additional<br />
funds for special education categories, summer<br />
school, and English language learners. For more information,<br />
refer to District <strong>of</strong> Columbia Official Code<br />
Section 38-29.<br />
The agency’s FY 2010 proposed budget is presented<br />
in <strong>the</strong> following tables:<br />
District <strong>of</strong> Columbia Public Schools<br />
D-1
FY 2010 Proposed Gross Funds Operating <strong>Budget</strong>, by Revenue Type<br />
Table GA0-1 contains <strong>the</strong> proposed FY 2010 agency budget compared to <strong>the</strong> FY 2009 approved budget. It also<br />
provides FY 2007 and FY 2008 actual expenditures.<br />
Table GA0-1<br />
(dollars in thousands)<br />
Change<br />
Actual Actual Approved Proposed from Percent<br />
Appropriated Fund FY 2007 FY 2008 FY 2009 FY 2010 FY 2009 Change*<br />
General Fund<br />
Local Funds 813,902 868,141 562,109 510,881 -51,228 -9.1<br />
Special Purpose Revenue Funds 13,894 6,072 3,671 4,005 334 9.1<br />
Total for General Fund 827,796 874,214 565,780 514,886 -50,895 -9.0<br />
Federal Resources<br />
Federal Payments 16,035 17,056 40,000 42,200 2,200 5.5<br />
Federal Grant Funds 121,381 1,376 9,514 9,955 441 4.6<br />
Total for Federal Resources 137,416 18,433 49,514 52,155 2,641 5.3<br />
Private Funds<br />
Private Grant Funds 8,216 6,194 3,784 3,784 0 0.0<br />
Total for Private Funds 8,216 6,194 3,784 3,784 0 0.0<br />
Intra-District Funds<br />
Intra-District Funds 61,603 110,297 145,495 208,750 63,255 43.5<br />
Total for Intra-District Funds 61,603 110,297 145,495 208,750 63,255 43.5<br />
Gross Funds 1,035,030 1,009,137 764,573 779,574 15,001 2.0<br />
*Percent Change is based on whole dollars.<br />
Note: If applicable, for a breakdown <strong>of</strong> each Grant (Federal and Private), Special Purpose Revenue type and Intra-District agreement,<br />
please refer to Schedule 80 <strong>Agency</strong> Summary by Revenue Source in <strong>the</strong> Operating Appendices located on <strong>the</strong> <strong>Office</strong> <strong>of</strong> <strong>the</strong> <strong>Chief</strong><br />
<strong>Financial</strong> <strong>Office</strong>r’s website.<br />
FY 2010 Proposed <strong>Budget</strong> and <strong>Financial</strong> Plan<br />
D-2
FY 2010 Proposed Full-Time Equivalents, by Revenue Type<br />
Table GA0-2 contains <strong>the</strong> proposed FY 2010 FTE level compared to <strong>the</strong> FY 2009 approved FTE level by revenue<br />
type. It also provides FY 2007 and FY 2008 actual data.<br />
Table GA0-2<br />
Change<br />
Actual Actual Approved Proposed from Percent<br />
Appropriated Fund FY 2007 FY 2008 FY 2009 FY 2010 FY 2009 Change<br />
General Fund<br />
Local Funds 8,963.3 8,392.6 6,012.5 5,075.0 -937.5 -15.6<br />
Special Purpose Revenue Funds 27.0 9.8 16.0 16.0 0.0 0.0<br />
Total for General Fund 8,990.3 8,402.4 6,028.5 5,091.0 -937.5 -15.6<br />
Federal Resources<br />
Federal Payments 0.0 0.0 0.0 156.0 156.0 N/A<br />
Federal Grant Funds 932.9 117.5 140.0 135.1 -4.9 -3.5<br />
Total for Federal Resources 932.9 117.5 140.0 291.1 151.1 107.9<br />
Private Funds<br />
Private Grant Funds 0.0 47.5 49.0 49.0 0.0 0.0<br />
Total for Private Funds 0.0 47.5 49.0 49.0 0.0 0.0<br />
Intra-District Funds<br />
Intra-District Funds 602.2 843.6 1,158.0 1,478.4 320.4 27.7<br />
Total for Intra-District Funds 602.2 843.6 1,158.0 1,478.4 320.4 27.7<br />
Total Proposed FTEs 10,525.4 9,411.0 7,375.5 6,909.4 -466.1 -6.3<br />
District <strong>of</strong> Columbia Public Schools<br />
D-3
FY 2010 Proposed Operating <strong>Budget</strong>, by Comptroller Source Group<br />
Table GA0-3 contains <strong>the</strong> proposed FY 2010 budget at <strong>the</strong> Comptroller Source Group (object class) level compared<br />
to <strong>the</strong> FY 2009 approved budget. It also provides FY 2007 and FY 2008 actual expenditures.<br />
Table GA0-3<br />
(dollars in thousands)<br />
Actual Actual Approved Proposed<br />
Change<br />
from Percent<br />
Comptroller Source Group FY 2007 FY 2008 FY 2009 FY 2010 FY 2009 Change*<br />
11 Regular Pay - Cont Full Time 383,103 403,237 353,092 342,161 -10,931 -3.1<br />
12 Regular Pay - O<strong>the</strong>r 135,730 124,496 110,251 136,234 25,983 23.6<br />
13 Additional Gross Pay 17,204 26,400 14,553 17,001 2,448 16.8<br />
14 Fringe Benefits - Curr Personnel 69,262 67,640 67,425 72,701 5,276 7.8<br />
15 Overtime Pay 11,754 7,843 2,912 2,395 -517 -17.8<br />
99 Unknown Payroll Postings -20 0 0 0 0 N/A<br />
Subtotal Personal Services (PS) 617,032 629,616 548,232 570,492 22,260 4.1<br />
20 Supplies and Materials 27,198 32,580 38,431 14,531 -23,900 -62.2<br />
30 Energy, Comm. and Bldg Rentals 35,457 36,274 24,402 36,851 12,449 51.0<br />
31 Telephone, Telegraph, Telegram, Etc 6,462 4,854 4,144 5,964 1,820 43.9<br />
32 Rentals - Land and Structures 7,609 7,616 7,093 5,355 -1,738 -24.5<br />
33 Janitorial Services 35 53 53 339 286 535.8<br />
34 Security Services 421 582 489 347 -142 -29.0<br />
35 Occupancy Fixed Costs 452 673 547 464 -82 -15.1<br />
40 O<strong>the</strong>r Services and Charges 37,400 25,085 27,566 20,962 -6,604 -24.0<br />
41 Contractual Services - O<strong>the</strong>r 90,969 224,024 67,155 96,829 29,674 44.2<br />
50 Subsidies and Transfers 180,427 6,858 11,646 9,928 -1,718 -14.8<br />
70 Equipment & Equipment Rental 32,133 14,988 34,816 17,512 -17,304 -49.7<br />
91 Expense Not <strong>Budget</strong>ed O<strong>the</strong>rs -566 25,933 0 0 0 N/A<br />
Subtotal Nonpersonal Services (NPS) 417,998 379,521 216,342 209,083 -7,259 -3.4<br />
Gross Funds 1,035,030 1,009,137 764,573 779,574 15,001 2.0<br />
*Percent Change is based on whole dollars.<br />
FY 2010 Proposed <strong>Budget</strong> and <strong>Financial</strong> Plan<br />
D-4
Program Description<br />
The District <strong>of</strong> Columbia Public Schools operates<br />
through <strong>the</strong> following 8 programs:<br />
School System Management – provides leadership,<br />
management and operational support to schools.<br />
This program contains <strong>the</strong> following 5 activities:<br />
■ School Leadership – Principals and Assistant<br />
Principals;<br />
■ School Administrative Support – school-based<br />
administration, including business managers,<br />
clerks, registrars and o<strong>the</strong>r positions;<br />
■ School Operations Support – provides support to<br />
schools to improve operational efficiency;<br />
■ Management, Direction & Oversight; and<br />
■ School transformation - provides Instructional<br />
Superintendent services.<br />
Instructional Programs – provides <strong>the</strong> foundation<br />
and resources that comprise <strong>the</strong> District <strong>of</strong> Columbia<br />
Public Schools core curriculum.<br />
This program contains <strong>the</strong> following 13 activities:<br />
■ General Education – teachers and o<strong>the</strong>r resources<br />
to provide and support general education teaching<br />
and learning;<br />
■ Gifted and Talented – provides services for students<br />
who demonstrate exceptional ability;<br />
■ Early Childhood Education – includes preschool,<br />
pre-kindergarten programs; and headstart program;<br />
■ ESL/Bilingual Education – assists students whose<br />
primary language is not English or who are bilingual;<br />
■ Vocational Education – provides vocational technical<br />
education programs;<br />
■ After-school Programs – operates programs for<br />
students after school hours;<br />
■ Summer School Programs – operates summer<br />
school;<br />
■ Textbook Program – Procures and distributes<br />
textbooks;<br />
■ Library and Media – provides procurement for<br />
and operations <strong>of</strong> school-based libraries;<br />
■ Instructional Technical Support – provides technical<br />
support services to teachers;<br />
■ Alternative Education - provides educational programs<br />
and services to students outside <strong>the</strong> general<br />
education classroom;<br />
■ Differentiated Instruction - provides teaching<br />
strategies to ensure teaching reaches a full range <strong>of</strong><br />
learners; and<br />
■ Substitute teachers - provides for a central pool <strong>of</strong><br />
substitute teachers to support educational programs.<br />
Special Education - Local - provides special education<br />
and related services in accordance with local and federal<br />
law for students with disabilities so that <strong>the</strong>y will<br />
be able to benefit from <strong>the</strong>ir education and maximize<br />
<strong>the</strong>ir ability to be full and active members <strong>of</strong> society.<br />
This program contains <strong>the</strong> following 5 activities:<br />
■ Special Education Classroom Support – provides<br />
aides for special education students;<br />
■ Special Education Instruction – provides teachers<br />
and resources to assist special education students;<br />
■ Special Education Instruction Support – provides<br />
instruction support to Special Education<br />
classrooms;<br />
■ Special Education Supplement Instruction –<br />
provides centralized support to Special Education<br />
classrooms, and<br />
■ Special Education Tuition Payments – provides<br />
tuition payments for Special Education services.<br />
Instructional Support Services – provides support to<br />
major activities leading to improved curriculum and<br />
instructional quality. These activities improve <strong>the</strong><br />
curriculum for teachers to follow and <strong>of</strong>fer teachers<br />
and staff opportunities for pr<strong>of</strong>essional training and<br />
development.<br />
This program contains <strong>the</strong> following 6 activities:<br />
■ Curriculum Development – provides assistance<br />
with improving <strong>the</strong> school curriculum;<br />
■ School-Based Pr<strong>of</strong>essional Development – provides<br />
training to teachers and o<strong>the</strong>r school-based<br />
staff;<br />
■ Transportation – provides transportation for field<br />
trips;<br />
■ Local Grants Administration – assists with<br />
administration <strong>of</strong> federal and private grants<br />
received by DCPS;<br />
■ Central Based Pr<strong>of</strong>essional Development<br />
Programs – provides agency wide pr<strong>of</strong>essional<br />
development and training to all staff; and<br />
District <strong>of</strong> Columbia Public Schools<br />
D-5
■ Educational Assessment and Accountability –<br />
provides student data systems and testing.<br />
Student Support Services – provides direction and<br />
support to schools and serves as a resource to students,<br />
parents, and community-based organizations.<br />
This program contains <strong>the</strong> following 14 activities:<br />
■ Student Support Services – provides support services<br />
to students;<br />
■ Health Services – provides school nurse services<br />
to students;<br />
■ Youth Engagement – works to engage youth in<br />
comprehensive services;<br />
■ Athletics – operates <strong>the</strong> student athletics program;<br />
■ Co-Curriculum/Extra Curriculum – provides<br />
additional curriculum resources;<br />
■ Parent Resource Center – funds parent resource<br />
centers in <strong>the</strong> communities to engage parents in<br />
<strong>the</strong> education process;<br />
■ Student Attendance – provides services that work<br />
to increase student attendance at schools;<br />
■ Student Hearings – provides student suspension<br />
hearings;<br />
■ Truancy Services – provides services to truant students;<br />
■ Student Affairs – provides guidance and oversight<br />
to student support services;<br />
■ Student Residency – provides student registration,<br />
enrollment and certification services;<br />
■ School-Based Partnerships – provides oversight<br />
and administration to program partnerships with<br />
schools and outside entities;<br />
■ Guidance counseling - provides direction<br />
through goals and objective setting to DCPS students;<br />
and<br />
■ School social and psychological services - provides<br />
social worker and school psychologist services<br />
to <strong>the</strong> students.<br />
Non-Instructional Support Services – comprises<br />
activities essential to <strong>the</strong> operation <strong>of</strong> <strong>the</strong> school system,<br />
providing resources for a safe and healthy educational<br />
environment.<br />
This program contains <strong>the</strong> following 5 activities:<br />
■ Custodial Services – provides custodians and<br />
cleaning supplies;<br />
■ Food Services – operates <strong>the</strong> school nutrition pro-<br />
FY 2010 Proposed <strong>Budget</strong> and <strong>Financial</strong> Plan<br />
D-6<br />
gram to ensure students receive healthy meals;<br />
■ Security Services – provides security services to<br />
ensure schools are safe;<br />
■ Public Utilities – holds <strong>the</strong> utility costs for school<br />
and o<strong>the</strong>r DCPS buildings; and<br />
■ Logistics - provides mail and printing services.<br />
<strong>Agency</strong> Management - provides for administrative<br />
support and <strong>the</strong> required tools to achieve operational<br />
and programmatic results. This program is standard<br />
for all agencies using performance-based budgeting.<br />
<strong>Agency</strong> <strong>Financial</strong> Operations – provides comprehensive<br />
and efficient financial management services, to<br />
and on behalf <strong>of</strong>, District agencies so that <strong>the</strong> financial<br />
integrity <strong>of</strong> <strong>the</strong> District <strong>of</strong> Columbia is maintained.<br />
This program is standard for all agencies using<br />
performance-based budgeting.<br />
Program Structure Change<br />
As a result <strong>of</strong> <strong>the</strong> Public Education Reform<br />
Amendment Act <strong>of</strong> 2007, many state-level functions<br />
formerly budgeted within DCPS were transferred to<br />
<strong>the</strong> <strong>Office</strong> <strong>of</strong> <strong>the</strong> State Superintendent <strong>of</strong> Education<br />
(OSSE), and DCPS underwent restructuring. As a<br />
result, for FY 2010, DCPS discontinued several programs<br />
formerly used for state-level functions. Since<br />
most Federal grant funds are now received through<br />
<strong>the</strong> Intra-District process from OSSE, DCPS also<br />
discontinued several individual programs formerly<br />
used for <strong>the</strong> direct receipt <strong>of</strong> grant funds and budgeted<br />
most federal grant funds in a single program.<br />
Table 4 fully sets out <strong>the</strong> DCPS program/activity<br />
structure, and Schedule 80 in <strong>the</strong> Operating<br />
Appendices volume shows <strong>the</strong> federal and private<br />
grants directly received by DCPS as well as <strong>the</strong> details<br />
<strong>of</strong> <strong>the</strong> agency’s Intra-District funds budget.
FY 2010 Proposed Operating <strong>Budget</strong> and FTEs, by Program and Activity<br />
Table GA0-4 contains <strong>the</strong> proposed FY 2010 budget by program and activity compared to <strong>the</strong> FY 2009 approved budget.<br />
It also provides FY 2008 actual data.<br />
Table GA0-4<br />
(dollars in thousands)<br />
Dollars in Thousands Full-Time Equivalents<br />
Change Change<br />
Actual Approved Proposed from Actual Approved Proposed from<br />
Program/Activity FY 2008 FY 2009 FY 2010 FY 2009 FY 2008 FY 2009 FY 2010 FY 2009<br />
(1000) <strong>Agency</strong> Management Program<br />
(1010) Personnel 6,679 10,335 10,982 646 48.3 58.0 66.0 8.0<br />
(1015) Training/Employee Development (Central) 0 0 1,219 1,219 0.0 0.0 0.0 0.0<br />
(1017) Labor Management and Partnerships 0 0 292 292 0.0 0.0 1.0 1.0<br />
(1030) Property Management 489 0 0 0 5.0 0.0 0.0 0.0<br />
(1045) Contracting and Procurement 1,569 1,879 1,847 -33 26.0 19.0 19.0 0.0<br />
(1050) Purchase Reports 0 0 2,512 2,512 0.0 0.0 0.0 0.0<br />
(1055) Property Management 3,218 558 0 -558 5.8 0.0 0.0 0.0<br />
(1080) Communications 11,827 20,202 1,017 -19,185 57.5 0.0 9.0 9.0<br />
(1080) Information Technology 0 0 0 0 0.0 73.0 0.0 -73.0<br />
(1085) Customer Service 0 0 503 503 0.0 0.0 2.0 2.0<br />
(1090) Performance Management 0 0 2,289 2,289 0.0 0.0 8.5 8.5<br />
(1095) <strong>Financial</strong> Services/Business Operations 690 1,130 2,752 1,623 5.0 3.0 0.0 -3.0<br />
(1110) Risk Management 1,511 0 1,693 1,693 0.0 0.0 10.0 10.0<br />
(1120) Legal 878 0 0 0 8.0 0.0 0.0 0.0<br />
(1140) Fleet -33 0 0 0 0.0 0.0 0.0 0.0<br />
(1160) Communications 672 349 0 -349 6.0 2.0 0.0 -2.0<br />
(1200) Customer Service 0 502 0 -502 0.0 6.0 0.0 -6.0<br />
(1220) Performance Management 0 7,566 0 -7,566 0.0 4.0 0.0 -4.0<br />
(1400) Special Education-Local Funded -69 0 0 0 0.0 0.0 0.0 0.0<br />
Subtotal (1000) <strong>Agency</strong> Management Program 27,430 42,521 25,105 -17,415 161.6 165.0 115.5 -49.5<br />
(100F) <strong>Agency</strong> <strong>Financial</strong> Operations<br />
(110F) <strong>Budget</strong> Operations 2,353 1,728 1,501 -227 20.8 11.0 22.9 11.9<br />
(120F) Accounting Operations 2,312 2,082 3,892 1,810 37.4 38.0 36.7 -1.3<br />
Subtotal (100F) <strong>Agency</strong> <strong>Financial</strong> Operations 4,665 3,810 5,392 1,582 58.3 49.0 59.6 10.6<br />
(1500) School System Management<br />
(1501) School Leadership 0 0 27,171 27,171 0.0 0.0 47.0 47.0<br />
(1502) School Administrative Support 0 0 26,973 26,973 0.0 0.0 437.2 437.2<br />
(1510) School Based Administration 56,086 41,273 0 -41,273 667.9 488.0 0.0 -488.0<br />
(1520) School Operations Support 8,346 23,773 1,406 -22,367 34.7 51.0 12.0 -39.0<br />
(1530) Governance 253 0 0 0 2.0 0.0 0.0 0.0<br />
(1540) Management, Direction & Oversight 5,568 3,913 6,564 2,650 41.8 29.0 18.0 -11.0<br />
(1550) School Transformation 0 118 5,508 5,390 0.0 1.0 31.0 30.0<br />
Subtotal (1500) School System Management 70,254 69,078 67,621 -1,456 746.4 569.0 545.2 -23.8<br />
(Continued on next page)<br />
District <strong>of</strong> Columbia Public Schools<br />
D-7
Table GA0-4 (Continued)<br />
(dollars in thousands)<br />
Dollars in Thousands Full-Time Equivalents<br />
Change Change<br />
Actual Approved Proposed from Actual Approved Proposed from<br />
Program/Activity FY 2008 FY 2009 FY 2010 FY 2009 FY 2008 FY 2009 FY 2010 FY 2009<br />
(2000) Instructional Programs<br />
(1700) State Education <strong>Agency</strong> -114 0 0 0 0.0 0.0 0.0 0.0<br />
(2010) Vocational Education- Carl D. Perkins 4,114 5,045 0 -5,045 7.0 22.0 0.0 -22.0<br />
(2100) General Education 283,787 252,469 234,706 -17,763 3,641.9 2,724.0 2,529.5 -194.5<br />
(2120) Alternative Education 0 0 7,096 7,096 0.0 0.0 100.1 100.1<br />
(2130) Differentiated Instruction 0 0 167 167 0.0 0.0 1.0 1.0<br />
(2140) Substitute Teachers 4,661 0 1,269 1,269 29.4 93.0 0.0 -93.0<br />
(2150) Gifted and Talented 271 0 1,128 1,128 2.0 0.0 5.0 5.0<br />
(2200) Early Childhood Education 12,980 58,780 42,317 -16,463 212.6 871.7 684.7 -187.0<br />
(2300) ESL/Bilingual Education 12,933 15,159 22,244 7,085 166.9 189.0 246.1 57.1<br />
(2400) Vocational Education 7,958 2,064 3,816 1,752 80.8 55.0 20.5 -34.5<br />
(2500) Afterschool Programs 12,640 16,091 15,854 -237 33.3 41.0 0.0 -41.0<br />
(2600) Summer School Programs 7,619 6,194 8,407 2,213 1.8 80.0 132.0 52.0<br />
(2700) Textbook Program 3,597 8,077 782 -7,295 2.0 2.0 2.0 0.0<br />
(2750) Library & Media 28 0 374 374 0.0 0.0 0.0 0.0<br />
(2900) Instructional Tech and System Support 1,232 4,708 17,478 12,770 10.3 0.0 23.0 23.0<br />
(SUPT) Superintendent Initiatives 3,639 596 0 -596 0.0 5.0 0.0 -5.0<br />
Subtotal (2000) Instructional Programs<br />
(2001) Pr<strong>of</strong>essional Develop - Music Educator<br />
355,346 369,182 355,638 -13,544 4,188.0 4,082.7 3,743.9 -338.8<br />
(2051) Arts in Education - Music 103 0 0 0 0.0 0.0 0.0 0.0<br />
Subtotal (2001) Pr<strong>of</strong>essional Develop - Music Educator<br />
(2008) School Based Support<br />
103 0 0 0 0.0 0.0 0.0 0.0<br />
(2882) Toge<strong>the</strong>r Everyone Achieves More (TEAM) 597 0 0 0 0.0 0.0 0.0 0.0<br />
(2883) Citigroup <strong>Financial</strong> 2 0 0 0 0.0 0.0 0.0 0.0<br />
(2887) The Gilder Lehrman Inst <strong>of</strong> American History 8 0 0 0 0.0 0.0 0.0 0.0<br />
Subtotal (2008) School Based Support<br />
(2011) HIV/AIDS<br />
607 0 0 0 0.0 0.0 0.0 0.0<br />
(2061) HIV/AIDS 74 0 0 0 0.0 0.0 0.0 0.0<br />
Subtotal (2011) HIV/AIDS<br />
(3000) Special Education Local<br />
74 0 0 0 0.0 0.0 0.0 0.0<br />
(3010) Special Education- IDEA 10,545 16,657 0 -16,657 59.6 153.0 0.0 -153.0<br />
(3020) Special Education- Preschool 225 314 17,356 17,042 0.0 1.0 241.2 240.2<br />
(3030) Special Education Instruction 0 0 89,038 89,038 0.0 0.0 1,169.8 1,169.8<br />
(3040) Special Education Classroom Support 0 0 6,454 6,454 0.0 0.0 53.0 53.0<br />
(3050) Special Ed Supplemental Instruction 0 0 27,277 27,277 0.0 0.0 0.0 0.0<br />
(3100) Special Ed Local Program and Services 22,014 9,161 0 -9,161 372.6 200.0 0.0 -200.0<br />
(3200) Special Education Local Administration 65,213 64,827 0 -64,827 803.5 809.8 0.0 -809.8<br />
(BKJO) Blackmon-Jones Decree 1,950 0 0 0 2.0 0.0 0.0 0.0<br />
(COMP) Blackmon-Jones Decree 0 0 0 0 0.0 0.0 0.0 0.0<br />
Subtotal (3000) Special Education Local<br />
(Continued on next page)<br />
99,946 90,959 140,125 49,166 1,237.6 1,163.8 1,464.0 300.2<br />
FY 2010 Proposed <strong>Budget</strong> and <strong>Financial</strong> Plan<br />
D-8
Table GA0-4 (Continued)<br />
(dollars in thousands)<br />
Dollars in Thousands Full-Time Equivalents<br />
Change Change<br />
Actual Approved Proposed from Actual Approved Proposed from<br />
Program/Activity FY 2008 FY 2009 FY 2010 FY 2009 FY 2008 FY 2009 FY 2010 FY 2009<br />
(4000) Instructional Support Services<br />
(4001) Title I 0 10 0 -10 0.0 0.0 0.0 0.0<br />
(4200) Curriculum Development & Implementation 2,798 2,877 3,961 1,084 24.0 15.0 25.0 10.0<br />
(4300) Pr<strong>of</strong>essional Development Programs 227 3,433 25,163 21,730 1.0 2.0 232.5 230.5<br />
(4400) Transportation 8 0 283 283 0.0 0.0 0.0 0.0<br />
(4500) Local Assessment & Accountability Programs 0 0 45 45 0.0 0.0 0.0 0.0<br />
(4600) Local Grants Administration 5,917 4,101 12,529 8,428 4.6 20.0 80.5 60.5<br />
(4700) Parental Engagement 406 3,338 0 -3,338 0.0 2.0 0.0 -2.0<br />
Subtotal (4000) Instructional Support Services<br />
(4002) Title 2 Grants<br />
9,357 13,760 41,981 28,221 29.6 39.0 338.0 299.0<br />
(4250) Administration LEA Programs 54 830 0 -830 18.0 11.0 0.0 -11.0<br />
(4255) Pr<strong>of</strong>essional Development Program 4,494 4,966 0 -4,966 12.0 13.0 0.0 -13.0<br />
(4260) Pr<strong>of</strong>. Development Literacy and Numeracy 2,301 3,548 0 -3,548 12.0 35.0 0.0 -35.0<br />
(4265) Pr<strong>of</strong>. Development Mentoring Program 1,931 2,500 0 -2,500 0.0 21.0 0.0 -21.0<br />
(4270) Pr<strong>of</strong>essional Development Schools Pgm 2,016 3,480 0 -3,480 0.0 0.0 0.0 0.0<br />
Subtotal (4002) Title 2 Grants<br />
(4003) Title 3 Grants<br />
10,797 15,324 0 -15,324 42.0 80.0 0.0 -80.0<br />
(4365) ESL/Bilingual Education-Local Schools 507 446 0 -446 0.0 0.0 0.0 0.0<br />
(4370) ESL/Bilingual Education- Private Schools 6 23 0 -23 0.0 0.0 0.0 0.0<br />
(4375) ESL/Bilingual Education-Significant Incr 3 75 0 -75 0.0 0.0 0.0 0.0<br />
Subtotal (4003) Title 3 Grants<br />
(4004) Title 4 Grants<br />
516 543 0 -543 0.0 0.0 0.0 0.0<br />
(4450) Administration- LEA Programs 837 1,245 0 -1,245 8.8 15.0 0.0 -15.0<br />
(4455) Safe & Drug Free Schs Pgrm-Parochial Schs 71 140 0 -140 0.0 0.0 0.0 0.0<br />
(4460) Safe & Drug Free Schs Pgrm- Non-Parochial 5 66 0 -66 0.0 0.0 0.0 0.0<br />
Subtotal (4004) Title 4 Grants<br />
(4005) Title 5 Grants<br />
912 1,451 0 -1,451 8.8 15.0 0.0 -15.0<br />
(4550) Administration- LEA Programs 13 0 0 0 0.0 0.0 0.0 0.0<br />
(4560) Innovative Education LEA Programs 405 439 0 -439 0.0 5.0 0.0 -5.0<br />
Subtotal (4005) Title 5 Grants<br />
(4011) Title 1 SEA Set-Aside<br />
419 439 0 -439 0.0 5.0 0.0 -5.0<br />
(4060) School Improvement Program LEA Grants 1,000 1,283 0 -1,283 0.0 14.0 0.0 -14.0<br />
Subtotal (4011) Title 1 SEA Set-Aside<br />
(4012) Ma<strong>the</strong>matics & Science Partnership<br />
1,000 1,283 0 -1,283 0.0 14.0 0.0 -14.0<br />
(4280) Ma<strong>the</strong>matics & Science Partnership 181 0 0 0 0.0 0.0 0.0 0.0<br />
Subtotal (4012) Ma<strong>the</strong>matics & Science Partnership<br />
(4014) After School Learning Center<br />
181 0 0 0 0.0 0.0 0.0 0.0<br />
(4480) After School Learning Progs- Competitive 640 481 0 -481 2.0 3.0 0.0 -3.0<br />
Subtotal (4014) After School Learning Center 640 481 0 -481 2.0 3.0 0.0 -3.0<br />
(Continued on next page)<br />
District <strong>of</strong> Columbia Public Schools<br />
D-9
Table GA0-4 (Continued)<br />
(dollars in thousands)<br />
Dollars in Thousands Full-Time Equivalents<br />
Change Change<br />
Actual Approved Proposed from Actual Approved Proposed from<br />
Program/Activity FY 2008 FY 2009 FY 2010 FY 2009 FY 2008 FY 2009 FY 2010 FY 2009<br />
(4021) Title 1 Part B<br />
(4070) Reading First 1,232 943 0 -943 18.5 0.0 0.0 0.0<br />
Subtotal (4021) Title 1 Part B<br />
(4022) Title 2 Part D<br />
1,232 943 0 -943 18.5 0.0 0.0 0.0<br />
(4290) Instructional Technology LEA-Programs 447 501 0 -501 0.0 0.0 0.0 0.0<br />
Subtotal (4022) Title 2 Part D<br />
(4032) Title 2 Part D<br />
447 501 0 -501 0.0 0.0 0.0 0.0<br />
(4295) Instructional Technology-Competitive 0 500 0 -500 0.0 0.0 0.0 0.0<br />
Subtotal (4032) Title 2 Part D<br />
(4101) Title 1 Grant<br />
0 500 0 -500 0.0 0.0 0.0 0.0<br />
(4010) LEA Administration 1,519 3,812 0 -3,812 43.0 37.0 0.0 -37.0<br />
(4015) Homeless Children Program 0 0 0 0 1.0 0.0 0.0 0.0<br />
(4020) Parental Involvement Reserve 119 389 0 -389 0.0 0.0 0.0 0.0<br />
(4025) Neglected & Delinquent Youth Reserve 469 479 0 -479 4.0 6.0 0.0 -6.0<br />
(4030) School Improvement Program Reserve 2,887 3,866 0 -3,866 21.0 31.0 0.0 -31.0<br />
(4035) O<strong>the</strong>r Title 1 Services Reserve 2,804 5,016 0 -5,016 17.2 5.0 0.0 -5.0<br />
(4040) Pr<strong>of</strong>essional Development Reserves 1,365 1,943 0 -1,943 0.0 0.0 0.0 0.0<br />
(4045) Supplemental Services Reserve 3,863 5,799 0 -5,799 0.0 0.0 0.0 0.0<br />
(4050) Choice Transportation Reserve 1,549 1,933 0 -1,933 0.0 0.0 0.0 0.0<br />
(4055) Educational Programs-Schools 14,730 20,758 0 -20,758 46.2 250.0 0.0 -250.0<br />
Subtotal (4101) Title 1 Grant<br />
(5000) Student Support Services<br />
29,304 43,995 0 -43,995 132.5 329.0 0.0 -329.0<br />
(5050) Student Services 453 588 0 -588 5.0 4.0 0.0 -4.0<br />
(5070) Student Support Services 0 0 2,501 2,501 0.0 0.0 10.0 10.0<br />
(5100) Guidance Counseling 192 0 8 8 3.0 0.0 0.0 0.0<br />
(5200) Health Services 1,494 904 1,685 782 1.0 4.0 8.0 4.0<br />
(5350) Youth Engagement 0 0 3,143 3,143 0.0 0.0 14.0 14.0<br />
(5400) Transitory Services 740 0 0 0 6.0 0.0 0.0 0.0<br />
(5500) Athletics 2,208 5,679 5,124 -555 0.0 15.0 14.0 -1.0<br />
(5600) Truancy Services 96 369 0 -369 1.0 2.0 0.0 -2.0<br />
(5700) Cocurriculum/Extra-Curricular Activities 221 1,014 2,258 1,245 0.0 0.0 36.0 36.0<br />
(5800) Student Affairs 6 75 0 -75 0.0 1.0 0.0 -1.0<br />
(5850) Scholarships 0 72 0 -72 0.0 0.0 0.0 0.0<br />
(5900) Student Hearings 11 0 0 0 0.0 0.0 0.0 0.0<br />
(5910) Parent Resource Centers 0 0 2,105 2,105 0.0 0.0 19.0 19.0<br />
(5920) School-Based Partnerships 0 0 13,747 13,747 0.0 0.0 4.0 4.0<br />
(5930) Student Attendance 0 0 1 1 0.0 0.0 0.0 0.0<br />
Subtotal (5000) Student Support Services<br />
(Continued on next page)<br />
5,422 8,701 30,571 21,871 16.0 26.0 105.0 79.0<br />
FY 2010 Proposed <strong>Budget</strong> and <strong>Financial</strong> Plan<br />
D-10
Table GA0-4 (Continued)<br />
(dollars in thousands)<br />
Dollars in Thousands Full-Time Equivalents<br />
Change Change<br />
Actual Approved Proposed from Actual Approved Proposed from<br />
Program/Activity FY 2008 FY 2009 FY 2010 FY 2009 FY 2008 FY 2009 FY 2010 FY 2009<br />
(6000) Non-Instructional Support Services<br />
(6100) Custodial Services 33,415 33,824 28,214 -5,610 543.9 513.0 476.0 -37.0<br />
(6200) Facilities and Infrastructure -391 0 0 0 364.9 0.0 0.0 0.0<br />
(6300) Food Services 24,831 19,238 11,321 -7,916 259.3 265.0 5.0 -260.0<br />
(6400) Security Services 12,662 3,588 19,705 16,117 38.0 44.0 25.3 -18.8<br />
(6600) Public Utilities 45,959 36,176 48,323 12,147 0.0 0.0 0.0 0.0<br />
(6700) Data Integrity & Business Systems Improv 0 6,258 0 -6,258 0.0 3.0 0.0 -3.0<br />
(6800) Logistics- Mail, Printing & Duplicating 0 0 1,936 1,936 0.0 0.0 32.0 32.0<br />
Subtotal (6000) Non-instructional Support Services<br />
(7000) Special Education State<br />
116,476 99,084 109,500 10,417 1,206.0 825.0 538.3 -286.8<br />
(7100) Special Education Litigation 3,325 0 0 0 0.0 0.0 0.0 0.0<br />
(7200) Special Ed State Program and Services -1,129 100 0 -100 5.0 0.0 0.0 0.0<br />
(7300) Special Education Transportation 80,377 0 0 0 1,371.2 0.0 0.0 0.0<br />
(7400) Special Education Tuition Payments 159,241 0 0 0 0.0 0.0 0.0 0.0<br />
Subtotal (7000) Special Education State<br />
(8000) O<strong>the</strong>r State Functions<br />
241,814 100 0 -100 1,376.2 0.0 0.0 0.0<br />
(8100) Assessment and Accountability Programs 1,302 1,089 0 -1,089 6.0 5.0 0.0 -5.0<br />
(8300) Correction System Instructional Programs 2,039 0 0 0 9.0 0.0 0.0 0.0<br />
(8400) General Education Tuition Payments 275 529 0 -529 5.0 1.0 0.0 -1.0<br />
(8500) Grants Administration 277 300 0 -300 1.0 4.0 0.0 -4.0<br />
Subtotal (8000) O<strong>the</strong>r State Functions<br />
(9000) NCLB No Child Left Behind<br />
3,893 1,919 0 -1,919 21.0 10.0 0.0 -10.0<br />
(9500) Staff Development-Highly Qualified Staff -2 0 0 0 0.0 0.0 0.0 0.0<br />
Subtotal (9000) NCLB No Child Left Behind<br />
(9090) Non-Programmatic Departments<br />
-2 0 0 0 0.0 0.0 0.0 0.0<br />
(9093) Pass Throughs & Sub-Grants to Charter/Pri. 0 0 3,640 3,640 0.0 0.0 0.0 0.0<br />
(9900) Non-Programmatic Departments 77 0 0 0 0.0 0.0 0.0 0.0<br />
Subtotal (9090) Non-Programmatic Departments<br />
(9960) Yr End Close<br />
77 0 3,640 3,640 0.0 0.0 0.0 0.0<br />
No Activity Assigned 28,227 0 0 0 0.0 0.0 0.0 0.0<br />
Subtotal (9960) Yr End Close<br />
(9980) Payroll Default Program<br />
28,227 0 0 0 0.0 0.0 0.0 0.0<br />
No Activity Assigned 0 0 0 0 166.5 0.0 0.0 0.0<br />
Subtotal (9980) Payroll Default Program 0 0 0 0 166.5 0.0 0.0 0.0<br />
Total Proposed Operating <strong>Budget</strong> 1,009,137 764,573 779,574 15,001 9,411.0 7,375.5 6,909.4 -466.1<br />
(Change is calculated by whole numbers and numbers may not add up due to rounding)<br />
Note: For more detailed information regarding <strong>the</strong> proposed funding for <strong>the</strong> activities within this agency’s programs, please see Schedule 30-PBB<br />
Program Summary by Activity in <strong>the</strong> FY 2010 Operating Appendices located on <strong>the</strong> <strong>Office</strong> <strong>of</strong> <strong>the</strong> <strong>Chief</strong> <strong>Financial</strong> <strong>Office</strong>r’s website.<br />
District <strong>of</strong> Columbia Public Schools<br />
D-11
Major Baseline Adjustments, Cost Savings<br />
and Policy Initiatives<br />
Initial Adjustments: The target provided by <strong>the</strong><br />
<strong>Office</strong> <strong>of</strong> <strong>the</strong> City Administrator included, in Local<br />
funds, an adjustment for a 4.0 percent inflation<br />
increase in <strong>the</strong> base foundation level for <strong>the</strong> Uniform<br />
Per Student Funding Formula (UPSFF), a 1.0 percent<br />
estimated enrollment decrease from <strong>the</strong> FY 2009<br />
approved budget level, and $12 million for <strong>the</strong> summer<br />
school program.<br />
Baseline Adjustments: An increase <strong>of</strong> $113,095 in<br />
Local funds and $1,226,457 in Special Purpose<br />
Revenue and $1,339,551 in Intra-District Funds, to<br />
correct <strong>the</strong> budget for <strong>the</strong> School Nutrition program<br />
and a decrease <strong>of</strong> $27,000,000 in Federal payments to<br />
align to historical levels.<br />
Cost Savings: The FY 2010 budget for <strong>the</strong> D.C.<br />
Public Schools is built through a combination <strong>of</strong><br />
adjustments to projected enrollment for <strong>the</strong> coming<br />
school year, a modest increase to <strong>the</strong> Unified Per<br />
Student Funding Formula (UPSFF), an adjustment<br />
to weights supporting students with <strong>the</strong> most acute<br />
special needs, and enhanced funding made available<br />
through <strong>the</strong> American Recovery and Reinvestment<br />
Act <strong>of</strong> 2009. To align <strong>the</strong> DCPS budget with projected<br />
enrollment for <strong>the</strong> coming school year, <strong>the</strong> budget<br />
reduces UPSFF funds by $15,433,000 and 229.2<br />
FTEs in FY 2010. Holding <strong>the</strong> UPSFF foundation<br />
level to 2 percent annual growth (while adjusting<br />
weighted values for special education and English<br />
Language Learner students) results in cost savings <strong>of</strong><br />
an additional $11,016,000 from <strong>the</strong> baseline budget.<br />
In addition, <strong>the</strong> UPSFF allocation to DCPS is<br />
reduced by $29,400,000 in Local Funds and completely<br />
restored by <strong>the</strong> addition <strong>of</strong> $29,400,000 in<br />
State Fiscal Stabilization funds. This change<br />
(described more fully under <strong>the</strong> Stimulus section<br />
below) will have no net effect on funding for DCPS.<br />
Overview<br />
The District’s public schools receive Local funding via<br />
<strong>the</strong> UPSFF. This system <strong>of</strong> funding was established<br />
by <strong>the</strong> District <strong>of</strong> Columbia School Reform Act <strong>of</strong><br />
1995 and was designed to ensure that all public<br />
schools across <strong>the</strong> District received <strong>the</strong> same level <strong>of</strong><br />
funding on a per student basis, regardless <strong>of</strong> what<br />
FY 2010 Proposed <strong>Budget</strong> and <strong>Financial</strong> Plan<br />
D-12<br />
neighborhood <strong>the</strong> school is in or where students live.<br />
This formula is derived from a “market basket” <strong>of</strong><br />
goods and services determined by an analysis that uses<br />
local, regional and national education funding<br />
research and practices to develop a foundation. There<br />
are no adjustments to <strong>the</strong> contents <strong>of</strong> <strong>the</strong> “market basket”<br />
for <strong>the</strong> fiscal year 2010. The UPSFF is intended<br />
to cover all local education agency operational costs<br />
for District public schools which include: school<br />
based instruction, student classroom support, utilities,<br />
administration and instructional support such as curriculum<br />
and testing. The UPSFF is based on a “foundation”<br />
amount which is <strong>the</strong>n enhanced according to<br />
different weights for higher cost grade levels and supplemental<br />
funding weights for students with special<br />
needs.<br />
The FY 2010 <strong>Budget</strong> and <strong>Budget</strong> Support Act<br />
support a 2 percent increase over <strong>the</strong> FY 2009<br />
UPSFF base, arriving at a foundation level <strong>of</strong><br />
$8,945 per student. This represents an increase<br />
<strong>of</strong> $175 over <strong>the</strong> FY 2009 foundation <strong>of</strong> $8,770.<br />
The UPSFF has increased significantly over <strong>the</strong><br />
past five years to keep pace with <strong>the</strong> rising costs<br />
<strong>of</strong> <strong>the</strong> challenges associated with providing a high<br />
quality education to students in an urban setting.<br />
The growth rate has supported efforts to direct<br />
adequate resources to <strong>the</strong> classroom, where students<br />
directly benefit. Even in this challenging<br />
budget year, adequate funding for <strong>the</strong> public<br />
schools through <strong>the</strong> UPSFF is a top priority for<br />
<strong>the</strong> District.<br />
Policy Initiatives: Research and practice demonstrate<br />
that supplemental funding is required to provide<br />
appropriate educational services to students with special<br />
needs, consistent with best practices and federal<br />
law. Moreover, DCPS has a goal <strong>of</strong> expanding and<br />
improving <strong>the</strong> delivery <strong>of</strong> high quality instruction and<br />
services for all students in neighborhood schools in<br />
<strong>the</strong> least restrictive environment. While this goal is in<br />
part to ensure that DCPS can best serve <strong>the</strong> students<br />
currently in DCPS schools, it is also designed to both<br />
curb <strong>the</strong> need for non-public placements and return<br />
children to <strong>the</strong> DCPS schools that are currently in<br />
non-public placements. To meet this challenge and<br />
provide <strong>the</strong> appropriate resources to all public schools<br />
for students with <strong>the</strong> highest levels <strong>of</strong> special needs,<br />
<strong>the</strong> FY 2010 budget supports an increase in supplemental<br />
weights for <strong>the</strong> most seriously challenged spe-
cial education students. These students are categorized<br />
as Level 3 and Level 4 students, and <strong>the</strong> FY 2010<br />
UPSFF supports an increase to Level 3 <strong>of</strong> 0.20 and to<br />
Level 4 <strong>of</strong> 0.46. In total, students at <strong>the</strong>se weighted<br />
levels <strong>of</strong> need account for $58,770,000 <strong>of</strong> <strong>the</strong><br />
resources in DCPS schools.<br />
Supplemental funding is provided through<br />
increased weights for students who are designated<br />
limited or non-English pr<strong>of</strong>icient (LEP/NEP). The<br />
number <strong>of</strong> English language learners in <strong>the</strong> District is<br />
steadily increasing and <strong>the</strong>re are increased costs associated<br />
with ensuring adequate resources to guarantee<br />
academic achievement among this population.<br />
Because funding for this population has not increased<br />
since 1996, <strong>the</strong> FY 2010 budget and <strong>Budget</strong> Support<br />
Act propose an increase to <strong>the</strong> LEP/NEP weight <strong>of</strong><br />
0.05. This will provide an additional $4,025 per student<br />
in <strong>the</strong>se categories.<br />
DCPS posted initial school-by-school budgets<br />
online on Friday, February 27th. Afterwards, DCPS<br />
held a series <strong>of</strong> roundtable sessions with principals to<br />
refine each school budget for 2010. The Mayor’s<br />
proposed FY 2010 budget supports <strong>the</strong><br />
school-based budgets posted online on<br />
DCPS website.<br />
The District <strong>of</strong> Columbia Public Schools FY<br />
2010 budget also holds a designation <strong>of</strong> $325,000 to<br />
transfer to <strong>the</strong> <strong>Office</strong> <strong>of</strong> <strong>the</strong> District <strong>of</strong> Columbia<br />
Auditor [refer to agency (AC0) in this volume] to pay<br />
for a study on school reform via <strong>the</strong> Intra-District<br />
budget process.<br />
Finally, <strong>the</strong> proposed budget includes a transfer <strong>of</strong><br />
$376,000 in Intra-District Funds, representing an<br />
adjustment in school transit subsidies <strong>of</strong>fered to students<br />
to reduce <strong>the</strong> expense <strong>of</strong> Metro fare cards.<br />
Transfers-In: The FY 2010 DCPS Local funds budget<br />
includes funding above and beyond that generated by <strong>the</strong><br />
Uniform Per Student Funding Formula as a result <strong>of</strong><br />
three transfers <strong>of</strong> budget and functions from o<strong>the</strong>r<br />
District agencies:<br />
1) School security was enhanced several years ago<br />
through additional contracted security guards and<br />
assignment <strong>of</strong> <strong>the</strong> Metropolitan Police Department to<br />
administer school security. The UPSFF was not<br />
adjusted at <strong>the</strong> time to reflect <strong>the</strong> increased costs,<br />
which were budgeted in <strong>the</strong> Metropolitan Police<br />
Department (MPD) [refer to agency (FA0) in this<br />
volume]. For FY 2010, <strong>the</strong> budget for <strong>the</strong> school<br />
security cost formerly budgeted in MPD has been<br />
returned to DCPS as a $5,900,000 Local funds<br />
appropriation above <strong>the</strong> Local funding generated by<br />
<strong>the</strong> UPSFF.<br />
2) Additionally, 12.0 FTEs and $650,000 in Local<br />
funds have been transferred to DCPS from <strong>the</strong> <strong>Office</strong><br />
<strong>of</strong> Public Education Facilities Modernization<br />
(OPEFM) [refer to agency (GM0) in <strong>the</strong> volume.].<br />
When <strong>the</strong> <strong>Office</strong> <strong>of</strong> Facilities Maintenance was transferred<br />
from OPEFM to DCPS two years ago, certain<br />
logistics FTEs that do not perform school maintenance<br />
functions were included in <strong>the</strong> transfer, and for<br />
FY 2010 <strong>the</strong>se FTEs are transferred back to DCPS.<br />
3) Also, 8.0 FTEs and $2,297,000 in Local funds<br />
have been transferred to DCPS from <strong>the</strong> <strong>Office</strong> <strong>of</strong> <strong>the</strong><br />
Deputy Mayor for Education [refer to agency (GW0)<br />
in this volume]. This represents <strong>the</strong> transfer <strong>of</strong> <strong>the</strong><br />
Interagency Collaborative Services Integration<br />
Commisssion (ICSIC) that will now be operated by<br />
<strong>the</strong> DCPS <strong>Office</strong> <strong>of</strong> Youth Engagement.<br />
Transfers-Out: The DCPS FY 2010 Local funds<br />
budget generated by <strong>the</strong> Uniform Per Student<br />
Funding Formula was decreased by $27,500,000,<br />
and those funds have been transferred to <strong>the</strong> Non-<br />
Departmental Fund [refer to agency (DO0) in this<br />
volume]. This funding represents <strong>the</strong> foundation<br />
level ($8,945/student) funding for approximately<br />
3,076 students.<br />
In recent years, DCPS audited student enrollment<br />
has decreased annually. However, <strong>the</strong>re was no<br />
mechanism to decrease <strong>the</strong> DCPS budget during <strong>the</strong><br />
fiscal year when <strong>the</strong> Student Enrollment Audit issued<br />
by <strong>the</strong> <strong>Office</strong> <strong>of</strong> <strong>the</strong> State Superintendent <strong>of</strong><br />
Education showed that <strong>the</strong> actual DCPS enrollment<br />
was below <strong>the</strong> budgeted level. This is at variance with<br />
<strong>the</strong> UPSFF payments for <strong>the</strong> District <strong>of</strong> Columbia<br />
Public Charter Schools (DCPCS) [refer to agency<br />
(GC0) in this volume] since DCPCS schools are paid<br />
only per <strong>the</strong> actual audited enrollment per District <strong>of</strong><br />
Columbia Official Code Section 38-2906.<br />
In accordance with <strong>the</strong> Fiscal Year 2010 <strong>Budget</strong><br />
Support Act <strong>of</strong> 2009, on October 1, 2009, <strong>the</strong> first<br />
day <strong>of</strong> <strong>the</strong> fiscal year, <strong>the</strong> Mayor is authorized to transfer<br />
$24,163,515, representing UPSFF foundationlevel<br />
funding for approximately 2,703 students, from<br />
District <strong>of</strong> Columbia Public Schools<br />
D-13
<strong>the</strong> Non-Departmental Fund to <strong>the</strong> District <strong>of</strong><br />
Columbia Public Schools. This will result in <strong>the</strong><br />
DCPS agency budget holding UPSFF funding for<br />
44,681 students, <strong>the</strong> same level <strong>of</strong> audited actual<br />
D.C. resident student enrollment for FY 2009. In <strong>the</strong><br />
event that actual FY 2010 audited DCPS student<br />
enrollment exceeds that level, $3,336,485 remains in<br />
<strong>the</strong> Non-Departmental Fund that can be transferred<br />
to DCPS or DCPCS for any actual audited student<br />
enrollment in excess <strong>of</strong> <strong>the</strong> agency budgeted levels.<br />
Protected Programs: The FY 2010 budget protects<br />
critical programs and new initiatives that directly<br />
impact classroom achievement <strong>of</strong> students with special<br />
needs. The District continues to act in accordance<br />
with a consent decree and alternative dispute resolution<br />
agreement in <strong>the</strong> Blackman/Jones special education<br />
class action litigation. Under <strong>the</strong> consent decree,<br />
DCPS and OSSE will continue reforms that improve<br />
<strong>the</strong> IEP process by implementing and following a<br />
newly updated policy manual, ensuring consistency<br />
in service delivery, ongoing pr<strong>of</strong>essional development<br />
and training and increased resources dedicated to<br />
related services. Moreover, <strong>the</strong> <strong>Office</strong> <strong>of</strong> Special<br />
Education continues to integrate key data solutions<br />
that drive performance and <strong>the</strong> ability to positively<br />
influence targeted areas <strong>of</strong> academic achievement.<br />
The FY 2010 Proposed <strong>Budget</strong> supports <strong>the</strong>se<br />
reforms with an increase <strong>of</strong> $3.5 million to <strong>the</strong><br />
Blackman/Jones budget in <strong>the</strong> OSSE, which provides<br />
DCPS with Intra-District funding. This program<br />
was initially established to support <strong>the</strong> joint commitments<br />
<strong>of</strong> <strong>the</strong> State and DCPS and remains a critical<br />
program.<br />
DCPS will also continue to receive funding in<br />
FY 2010 through local school improvement dollars<br />
disbursed by OSSE. These funds allow<br />
DCPS to invest in critical reforms as articulated<br />
in <strong>the</strong> DCPS Five Year Plan (available online at<br />
http://www.k12.dc.us/strategic-documents.htm)<br />
to ensure a complete transformation <strong>of</strong> <strong>the</strong> DCPS<br />
schools. The FY 2010 budget includes a $2.5<br />
million increase in Intra-District authority to<br />
account for local school improvement dollars.<br />
Stimulus: The students <strong>of</strong> <strong>the</strong> District <strong>of</strong> Columbia<br />
Public Schools will directly benefit from <strong>the</strong> funds<br />
made available for education through <strong>the</strong> American<br />
Recovery and Reinvestment Act (ARRA). The<br />
FY 2010 Proposed <strong>Budget</strong> and <strong>Financial</strong> Plan<br />
D-14<br />
ARRA directs funding to local schools through <strong>the</strong><br />
existing formulas for Federal Grants from both Title I<br />
<strong>of</strong> <strong>the</strong> Elementary and Secondary Education Act <strong>of</strong><br />
1965 and <strong>the</strong> Individuals With Disabilities Education<br />
Act (IDEA). In accordance with <strong>the</strong> ARRA, both <strong>the</strong><br />
Title I and <strong>the</strong> IDEA funding will be directed initially<br />
to <strong>the</strong> <strong>Office</strong> <strong>of</strong> <strong>the</strong> State Superintendent <strong>of</strong><br />
Education and will pass pursuant to <strong>the</strong> existing distribution<br />
formulas. This funding is not restricted by<br />
“supplement not supplant” or “maintenance <strong>of</strong> effort”<br />
rules that <strong>of</strong>ten accompany Federal Grants. The purpose<br />
<strong>of</strong> Title I <strong>of</strong> <strong>the</strong> Elementary and Secondary<br />
Education Act <strong>of</strong> 1965 is to “ensure that all children<br />
have a fair, equal, and significant opportunity to<br />
obtain a high-quality education and reach, at a minimum,<br />
pr<strong>of</strong>iciency on challenging State academic<br />
achievement standards and state academic assessments”<br />
1. The U.S. Department <strong>of</strong> Education estimates<br />
that <strong>the</strong> District <strong>of</strong> Columbia will receive<br />
$37,602,347 in Title I funds over <strong>the</strong> next 2 years.<br />
Similarly, DCPS will receive increased funding in <strong>the</strong><br />
amount <strong>of</strong> $5.5 million through <strong>the</strong> ARRA under <strong>the</strong><br />
IDEA formula grant. IDEA requires that DCPS provide<br />
a “free and appropriate public education (FAPE)<br />
that emphasizes special education and related services<br />
designed to meet <strong>the</strong>ir unique needs and prepare <strong>the</strong>m<br />
for fur<strong>the</strong>r education, employment, and independent<br />
living” and <strong>the</strong>se increased funds will significantly help<br />
<strong>the</strong> District meet its goals for special education.<br />
In addition to increased formula grant funds, <strong>the</strong><br />
UPSFF allocation to DCPS is reduced by $29,400,000<br />
in Local Funds and completely restored by <strong>the</strong> addition<br />
<strong>of</strong> $29,400,000 in State Fiscal Stabilization funds<br />
provided through <strong>the</strong> Recovery Act. These <strong>of</strong>fsetting<br />
changes will have no net effect on funding levels for<br />
DCPS. The infusion <strong>of</strong> State Fiscal Stabilization<br />
funds for public education in FY 2010 enables <strong>the</strong><br />
District <strong>of</strong> Columbia to afford <strong>the</strong> proposed 2 percent<br />
increase in UPSFF funding for DCPS and for Public<br />
Charter LEAs alike. Both OSSE and <strong>the</strong> U.S.<br />
Department <strong>of</strong> Education will exercise oversight on<br />
<strong>the</strong> use <strong>of</strong> <strong>the</strong>se funds.<br />
1 http://www.ed.gov/policy/elsec/leg/esea02/pg1.html
Gap-Closing Initiatives: The FY 2010 budget proposed<br />
by <strong>the</strong> Mayor and approved by Council included<br />
funding made available through <strong>the</strong> American<br />
Recovery and Reinvestment Act (ARRA) <strong>of</strong> 2009.<br />
The gap-closing budget expands and corrects <strong>the</strong> use<br />
<strong>of</strong> <strong>the</strong> ARRA funding in <strong>the</strong> FY 2010 budget. The<br />
$29,400,000 in State Fiscal Stabilization funds originally<br />
budgeted for DCPS in <strong>the</strong> FY 2010 intra-<br />
District budget is reduced by $11,320,102 to correctly<br />
distribute ARRA funds among LEAs, as<br />
required by <strong>the</strong> United States Department <strong>of</strong><br />
Education. The use <strong>of</strong> <strong>the</strong> State Fiscal Stabilization<br />
funds provided through <strong>the</strong> Recovery Act is also<br />
expanded in FY 2010 by $22,077,155 for DCPS<br />
(intra-District). The UPSFF allocation to DCPS is<br />
reduced by $10,757,053 and completely restored by<br />
<strong>the</strong> net <strong>of</strong> <strong>the</strong> changes in State Fiscal Stabilization<br />
Funds for DCPS in <strong>the</strong> amount <strong>of</strong> $10,757,053.<br />
The budget is represented as an Intra-District funds<br />
transfer from <strong>the</strong> <strong>Office</strong> <strong>of</strong> <strong>the</strong> State Superintendent<br />
for Education, <strong>the</strong> agency that implements <strong>the</strong> State<br />
Fiscal Stabilization Fund program.<br />
The proposed budget shifts $24,163,515 from<br />
<strong>the</strong> Non-Departmental Fund back to DCPS.<br />
District <strong>of</strong> Columbia Public Schools<br />
D-15
FY 2009 Approved <strong>Budget</strong> to FY 2010 Proposed <strong>Budget</strong>, by Revenue Type<br />
Table GA0-5 itemizes <strong>the</strong> changes by revenue type between <strong>the</strong> FY 2009 approved budget and <strong>the</strong> FY 2010 proposed<br />
budget. The four categories <strong>of</strong> changes reflected in this table are: (1) changes to <strong>the</strong> baseline budget (includes<br />
agency request), (2) changes representing cost savings or efficiencies, (3) changes related to policy initiatives, and (4)<br />
changes to specifically address <strong>the</strong> projected revenue shortfall.<br />
Table GA0-5<br />
(dollars in thousands)<br />
PROGRAM BUDGET FTE<br />
LOCAL FUND: FY 2009 Approved <strong>Budget</strong> and FTE 562,109 6,012.5<br />
Initial and Baseline Adjustments<br />
Net effect <strong>of</strong> fixed cost adjustments - Funding adjustments for OPM Multiple Programs 18,009 0.0<br />
fixed cost estimates<br />
Net effect <strong>of</strong> salary and benefits changes - Salary step and o<strong>the</strong>r Multiple Programs 12,021 5.0<br />
Personal services funding adjustments<br />
Intra-<strong>Agency</strong> changes - Title 1 centralized thru OSSE; realign schools Multiple Programs -2,890 0.0<br />
to revised staffing model for special education<br />
Baseline Adjustments: Net effect <strong>of</strong> fixed cost adjustments - Funding Multiple Programs -1,644 0.0<br />
adjustments for OPM estimates<br />
Baseline Adjustments: Net effect <strong>of</strong> salary and benefits changes - Salary Multiple Programs 477 0.0<br />
step increases and o<strong>the</strong>r Personal services funding adjustments<br />
Baseline Adjustments: Intra-<strong>Agency</strong> changes - Alignment to fixed cost Multiple Programs 1,167 0.0<br />
projections<br />
Policy Initiatives and Cost Savings<br />
Reduce - Reduce funds provided through <strong>the</strong> Uniform Per Student<br />
Funding Formula to reflect enrollment projection for SY 2009-10<br />
Multiple -15,443 -229.2<br />
Transfer to Non-Departmental fund - Transfer to Non-<br />
Departmental fund pending release <strong>of</strong> <strong>the</strong> student enrollment census audit<br />
Various Progams -27,500 0.0<br />
Reduce - Adjust UPSFF to reflect a 2 percent increase in <strong>the</strong> foundation level<br />
and adjustments to <strong>the</strong> supplemental weights for special education and<br />
limited/non-English pr<strong>of</strong>icient students<br />
Multiple -11,016 0.0<br />
Shift - Shift a portion <strong>of</strong> UPSFF costs from Local funds to State Fiscal<br />
Stabilization Fund created by <strong>the</strong> Recovery Act<br />
Instructional Programs -29,400 -496.5<br />
One Time funds from DME - ICSIC 8 FTEs - One-time funding from <strong>the</strong><br />
Deputy Mayor for Education - Interagency Collaboration and Service<br />
Integration Commission program - <strong>Office</strong> <strong>of</strong> Youth Engagement<br />
Student Support Services 2,297 8.0<br />
Cost Decrease - Align procurement assessment budget with revised OCP<br />
estimates<br />
<strong>Agency</strong> Management Program -66 0.0<br />
Transfer-in from OPEFM 12 FTEs mainly in <strong>the</strong> logistic activity Non-Instructional Support Services 650 12.0<br />
Adjustment made by DCPS - <strong>Agency</strong> Management program <strong>Agency</strong> Management Program 5,899 0.0<br />
Correct - Reallocate budget estimates based on updated school<br />
enrollment projections<br />
(Continued on next page)<br />
Instructional Programs 66 0.0<br />
FY 2010 Proposed <strong>Budget</strong> and <strong>Financial</strong> Plan<br />
D-16
Table GA0-5 (continued)<br />
(dollars in thousands)<br />
Program BUDGET FTE<br />
Gap-Closing Initiatives<br />
Reduction - Reduction in funding for Interagency Collaboration Student Support Services -381 0.0<br />
and Service Integration Commission program<br />
Reduction - number <strong>of</strong> summer schools slots - Reduce number <strong>of</strong> Multiple Programs -9,102 0.0<br />
summer school slots by 50 percent (from $17,856,356 for 11,743 students at<br />
$1,521 per student to $8,928,181 for 5,872 students at $1,491 per<br />
student) adjusted cost per student based on foundation level<br />
Interagency changes - Shift - Expand use <strong>of</strong> ARRA State Fiscal Multiple Programs -22,077 0.0<br />
Stabilization Funds in FY 2010<br />
Reduction - foundation level - Reduce foundation level <strong>of</strong> Uniform Per Multiple Programs -8,139 0.0<br />
Student Funding Formula by 2 percent (from $8,945 to $8,770) - Restores<br />
base funding to FY 2009 level and decreases total budget by $8,139,086<br />
Inter-agency Change - Transfer In - Adjust distribution <strong>of</strong> ARRA funds Multiple Programs 11,320 0.0<br />
among LEAs, as required by US Department <strong>of</strong> Education<br />
Reduction - - Transfer $501,379 and 7.0 FTEs from DCPS to Realty <strong>Office</strong> -501 -7.0<br />
OPEFM for <strong>the</strong> Realty <strong>Office</strong><br />
Increase - Transfer $24,163,515 from Non-Departmental Multiple Programs 24,164 0.0<br />
Reduction - Reduction <strong>of</strong> FTEs associated with original decrease <strong>of</strong> Multiple Programs 0 -229.8<br />
Non-Departmental<br />
Increase - Inter-<strong>Agency</strong> Change - Shift - Expand use <strong>of</strong> ARRA State Multiple Programs 861 0.0<br />
Fiscal Multiple Programs Stabilization Funds in FY 2010: - Reduce <strong>the</strong><br />
Intra-District stimulus funds by $860,737 transfer to local funds<br />
LOCAL FUND: FY 2010 Proposed <strong>Budget</strong> and FTE 510,881 5,075.0<br />
SPECIAL PURPOSE REVENUE FUNDS: FY 2009 Approved <strong>Budget</strong> and FTE 3,671 16.0<br />
Initial and Baseline Adjustments<br />
Net effect <strong>of</strong> fixed cost adjustments - Funding adjustments for OPM Non-instructional Support Services -2 0.0<br />
estimates<br />
Net effect <strong>of</strong> salary and benefits changes - Salary step and o<strong>the</strong>r Multiple Programs -479 0.0<br />
personal services funding adjustments<br />
Intra-agency Changes - Increase <strong>of</strong> Special Purpose Revenue for Multiple Programs 815 0.0<br />
vending machines and cafeteria sales<br />
Baseline Adjustments: Intra-agency Changes - Increased revenues in <strong>the</strong> Non-Instructional Support Services 1,226 0.0<br />
nutrition program for vending machines and cafeteria sales<br />
Policy Initiatives and Cost Savings<br />
Cost Decrease - Align budget with certified Cafeteria revenues Non-Instructional Support Services -936 0.0<br />
Cost Decrease - Align budget with certified revenues from Vending Non-Instructional Support Services -290 0.0<br />
Machine Sales<br />
SPECIAL PURPOSE REVENUE FUNDS: FY 2010 Proposed <strong>Budget</strong> and FTE 4,005 16.0<br />
(Continued on next page)<br />
District <strong>of</strong> Columbia Public Schools<br />
D-17
Table GA0-5 (continued)<br />
(dollars in thousands)<br />
FY 2010 Proposed <strong>Budget</strong> and <strong>Financial</strong> Plan<br />
D-18<br />
PROGRAM BUDGET FTE<br />
FEDERAL PAYMENTS: FY 2009 Approved <strong>Budget</strong> and FTE 40,000 0.0<br />
Initial and Baseline Adjustments<br />
Baseline Adjustments: Reduction - to historical levels Multiple -27,000 0.0<br />
Net effect <strong>of</strong> salary and benefits changes - Salary step and o<strong>the</strong>r Instructional Programs 10,694 0.0<br />
personal services funding adjustments<br />
Intra-<strong>Agency</strong> changes - Transfer to Personal Services in <strong>the</strong> instructional Multiple Programs -10,694 0.0<br />
program<br />
Policy Initiatives and Cost Savings<br />
Enhancement - Stimulus to multiple programs Multiple Programs 29,200 0.0<br />
Shift - Shift a portion <strong>of</strong> UPSFF costs from Local funds to State Fiscal Instructional Programs 29,400 496.5<br />
Stabilization Fund created by <strong>the</strong> Recovery Act<br />
Gap-Closing Initiatives<br />
Intra-<strong>Agency</strong> Change - Shift - Reclassify State Fiscal Stabilization Fund<br />
resources as Intra-District from OSSE<br />
Multiple Programs -29,400 -496.5<br />
Increase - Adjust Federal Payment FTEs from Intra-District funds Multiple Programs 0 156.0<br />
FEDERAL PAYMENTS: FY 2010 Proposed <strong>Budget</strong> and FTE 42,200 156.0<br />
FEDERAL GRANT FUND: FY 2009 Approved <strong>Budget</strong> and FTE<br />
Initial and Baseline Adjustments<br />
9,514 140.0<br />
Net effect <strong>of</strong> fixed cost adjustments - Funding adjustments for OPM<br />
estimates<br />
Instructional Programs -19 0.0<br />
Net effect <strong>of</strong> salary and benefits changes - Salary step increases and<br />
o<strong>the</strong>r personal services funding adjustments.<br />
Multiple Programs 1,781 5.0<br />
Intra-agency Changes - To realign budget to <strong>the</strong> revised staffing model<br />
for special education.<br />
Multiple Programs -1,320 0.0<br />
Policy Initiatives and Cost Savings<br />
Correct - Eliminate unfunded FTEs Multiple 0 -9.8<br />
FEDERAL GRANT FUND: FY 2010 Proposed <strong>Budget</strong> and FTE 9,955 135.1<br />
PRIVATE GRANT FUND: FY 2009 Approved <strong>Budget</strong> and FTE 3,784 49.0<br />
PRIVATE GRANT FUND: FY 2010 Proposed <strong>Budget</strong> and FTE 3,784 49.0<br />
INTRA-DISTRICT FUNDS: FY 2009 Approved <strong>Budget</strong> and FTE<br />
Initial and Baseline Adjustments<br />
145,495 1,158.0<br />
Net effect <strong>of</strong> fixed cost adjustments - Funding adjustments for OPM<br />
estimates<br />
Multiple Programs 30 0.0<br />
Net effect <strong>of</strong> salary and benefits changes - Alignment <strong>of</strong> Personal<br />
Services funding adjustments<br />
Multiple Programs -14,789 0.0<br />
Intra-<strong>Agency</strong> Changes - Estimate for grants/Intra-District for Special<br />
Education. Exact amounts to be determined when carryover balances<br />
and grant awards are finalized<br />
Multiple Programs 14,759 0.0<br />
Baseline Adjustments: Net effect <strong>of</strong> salary and benefits changes<br />
(Continued on next page)<br />
Special Education State 0 -265.0
Table GA0-5 (continued)<br />
(dollars in thousands)<br />
<strong>Agency</strong> Performance Plan<br />
The agency’s Performance Plan has <strong>the</strong> following<br />
objectives for FY 2010:<br />
Objective 1: Ensure that schools provide a consistent<br />
foundation in academics, strong support for<br />
social/emotional needs, and a variety <strong>of</strong> challenging<br />
<strong>the</strong>mes and programs.<br />
Objective 2: Retain <strong>the</strong> most highly effective and<br />
highly compensated educators in <strong>the</strong> country.<br />
Objective 3: Implement a rigorous, relevant, college<br />
PROGRAM BUDGET FTE<br />
Policy Initiatives and Cost Savings<br />
Enhance - Improve <strong>the</strong> ability <strong>of</strong> DCPS to continue to make necessary<br />
programmatic improvements to help students achieve academic success<br />
Instructional Programs 2,500 30.9<br />
Enhance - Expand <strong>the</strong> delivery <strong>of</strong> special education services in<br />
neighborhood schools in <strong>the</strong> least restrictive environment<br />
Special Education Local 3,500 0.0<br />
Enhance - Increase services provided to pre-school age children under<br />
IDEA Part B (619)through increased funding made available in <strong>the</strong><br />
American Recovery and Reinvestment Act<br />
Special Education Local 85 0.0<br />
Enhance - Through <strong>the</strong> American Recovery and Reinvestment Act,<br />
improve <strong>the</strong> ability <strong>of</strong> DCPS to provide high quality special education<br />
services pursuant to <strong>the</strong> Federal Individuals with Disabilities in Education Act<br />
Part B (611)<br />
Special Education Local 5,434 64.9<br />
Enhance - Through <strong>the</strong> American Recovery and Reinvestment Act,<br />
improve <strong>the</strong> services provided to District students through Title I eligible schools<br />
Title 1 Grant 12,064 148.9<br />
Transfer In - Transfer in funding from KD0 for school transit subsidies Non-Instructional Support Services 376 0.0<br />
Transfer in - Funding from Metropolitan Police Department for Security<br />
contract - Transfer in funding for <strong>the</strong> Security contract<br />
. 5,900 0.0<br />
Adjustment - DCPS to multiple programs Multiple Programs -5,900 0.0<br />
Gap-Closing Initiatives<br />
Intra-District Change - Shift - Reclassify State Fiscal Stabilization Fund<br />
resources as Intra-District from OSSE<br />
Multiple Programs 29,400 496.5<br />
Intra-District Change - Transfer Out - Adjust distribution <strong>of</strong> ARRA funds<br />
among LEAs, as required by US Department <strong>of</strong> Education<br />
Multiple Program -11,320 0.0<br />
Intra-District - Shift - Expand use <strong>of</strong> ARRA State Fiscal Stabilization<br />
Funds in FY 2010<br />
Multiple Programs 22,077 0.0<br />
Reduction - Inter-<strong>Agency</strong> Change - Shift - Expand use <strong>of</strong> ARRA State<br />
Fiscal Multiple Programs Stabilization Funds in FY 2010: - Reduce <strong>the</strong><br />
Intra-district stimulus funds by $860,737 increase in Local<br />
Multiple Programs -861 0.0<br />
Reduction - Shift Intra-District FTEs from Federal Payments fund 0 -156.1<br />
INTRA-DISTRICT FUNDS: FY 2010 Proposed <strong>Budget</strong> and FTE 208,750 1,478.4<br />
Gross for GA0 - District <strong>of</strong> Columbia Public Schools 779,574 6,909.4<br />
preparatory curriculum that gives all students meaningful<br />
options for life.<br />
Objective 4: Support decision-making with accurate<br />
information about how our students and <strong>the</strong> school<br />
district are performing.<br />
Objective 5: Provide schools with <strong>the</strong> central <strong>of</strong>fice<br />
support <strong>the</strong>y need to foster student achievement.<br />
Objective 6: Partner with families and community<br />
members who demand better schools.<br />
District <strong>of</strong> Columbia Public Schools<br />
D-19
<strong>Agency</strong> Performance Measures<br />
Table GA0-6<br />
FY 2010 Proposed <strong>Budget</strong> and <strong>Financial</strong> Plan<br />
D-20<br />
FY 2007 FY 2008 FY 2008<br />
Year-End Original Year-End FY 2009 FY 2010 FY 2011<br />
Measure Actual* Target Actual Projection Projection Projection<br />
Objective 1:<br />
Percent <strong>of</strong> elementary students pr<strong>of</strong>icient in reading 38% N/A 46% 49% 54% 59%<br />
Percent <strong>of</strong> elementary students pr<strong>of</strong>icient in math 29% N/A 40% 43% 48% 53%<br />
Percent <strong>of</strong> secondary students pr<strong>of</strong>icient in reading 30% N/A 39% 42% 47% 52%<br />
Percent <strong>of</strong> secondary students pr<strong>of</strong>icient in math 27% N/A 36% 39% 44% 49%<br />
Black-White reading achievement gap 57 N/A 52 49 44 39<br />
Black-White math achievement gap 58 N/A 53 50 45 40<br />
Hispanic-White reading achievement gap 46 N/A 39 36 31 26<br />
Hispanic-White math achievement gap 46 N/A 41 38 33 28<br />
Timely completion rate for IEPs N/A 65% 75% 80% 85% 90%<br />
Timely completion rate for OSE assessments N/A 65% 72% 78% 82% 87%<br />
Number <strong>of</strong> students referred to non-public schools<br />
by DCPS<br />
N/A N/A N/A TBD TBD TBD<br />
Decrease in <strong>the</strong> number <strong>of</strong> categorized security<br />
incidents per 100 students<br />
N/A N/A 3.8 3 4 5<br />
Percent <strong>of</strong> faculty and staff satisfied with school<br />
facilities<br />
N/A N/A 62% 67% 72% 77%<br />
Percent <strong>of</strong> parents satisfied with safety inside school<br />
Objective 2:<br />
N/A N/A 76% 76% 80% 85%<br />
Principal applicant to hire ratio<br />
Objective 3:<br />
N/A N/A 14:1 14:1 14:1 14:1<br />
Increase in <strong>the</strong> graduation rate 68% N/A N/A 3% 5% 5%<br />
Percent <strong>of</strong> high school students taking at least 1<br />
AP exam<br />
N/A N/A 14% 17% 20% 24%<br />
Percent <strong>of</strong> tests scored at 3 or better 27% N/A 21% 25% 30% 35%<br />
Percent <strong>of</strong> 9-11th grade students taking PSAT N/A 75% 72% 78% 80% 85%<br />
Percent <strong>of</strong> HS students with IGPs<br />
Objective 4:<br />
N/A N/A N/A TBD TBD TBD<br />
Number <strong>of</strong> active STARS users N/A N/A N/A TBD TBD TBD<br />
Number <strong>of</strong> active users <strong>of</strong> benchmark assessment<br />
system<br />
(Continued on next page)<br />
N/A N/A N/A TBD TBD TBD
<strong>Agency</strong> Performance Measures<br />
Table GA0-6 (continued)<br />
FY 2007 FY 2008 FY 2008<br />
Year-End Original Year-End FY 2009 FY 2010 FY 2011<br />
Measure Actual Target Actual Projection Projection Projection<br />
Objective 5:<br />
Percent <strong>of</strong> students completing free and reduced<br />
meal applications<br />
N/A N/A N/A TBD TBD TBD<br />
Number <strong>of</strong> schools eligible for Provision 2 N/A N/A N/A 24 58 70<br />
Food service participation rate N/A N/A 48% 55% 65% 70%<br />
Days to complete small purchase N/A N/A 6 5 5 5<br />
Days to complete purchase <strong>of</strong>f DC Supply Schedule N/A N/A 6.5 6.5 6 5<br />
Percent <strong>of</strong> faculty and staff satisfied with central<br />
<strong>of</strong>fice services<br />
Objective 6:<br />
N/A N/A 54% 59% 65% 70%<br />
Percent <strong>of</strong> parents satisfied with opportunities for<br />
engagement<br />
N/A N/A 77% 85% 85% 85%<br />
Percent <strong>of</strong> students missing 15 or more days<br />
unexcused<br />
15.7% N/A 19.7% 17% 15% 10%<br />
Number <strong>of</strong> unique parents utilizing PRC resources<br />
and programs<br />
N/A N/A N/A TBD TBD TBD<br />
Number <strong>of</strong> users <strong>of</strong> DCPS website N/A N/A N/A TBD TBD TBD<br />
For additional information on o<strong>the</strong>r agency budgets that directly support <strong>the</strong> District public school system please refer to following agency budget<br />
chapters in this volume:<br />
(GX0) Teachers’ Retirement System<br />
This agency budgets <strong>the</strong> employer’s required contribution to <strong>the</strong> defined benefit pension plan for teachers in <strong>the</strong> District <strong>of</strong> Columbia Public Schools.<br />
(GM0) <strong>Office</strong> <strong>of</strong> Public Education Facilities Modernization<br />
This agency is charged with management <strong>of</strong> <strong>the</strong> capital improvement program for <strong>the</strong> District <strong>of</strong> Columbia Public School buildings and <strong>the</strong> day-to-day<br />
maintenance <strong>of</strong> <strong>the</strong> buildings and grounds.<br />
(KD0) School Transit Subsidy<br />
This agency budgets funds that are used to provide a subsidy for public school students who use public transportation to and from schoool.<br />
(HC0) Department <strong>of</strong> Health<br />
This agency operates programs that provide public health services to students.<br />
District <strong>of</strong> Columbia Public Schools<br />
D-21
FY 2010 Proposed <strong>Budget</strong> and <strong>Financial</strong> Plan<br />
D-22
Teachers’ Retirement System<br />
www.dcrb.dc.gov<br />
Telephone: 202-343-3200<br />
(GX0)<br />
% Change<br />
FY 2008 FY 2009 FY 2010 from<br />
Description Actual Approved Proposed FY 2009<br />
Operating <strong>Budget</strong> $5,964,261 $0 $3,000,000 N/A<br />
The Teachers' Retirement System provides <strong>the</strong> District's required contribution<br />
to this retirement plan, which is administered by <strong>the</strong> District<br />
<strong>of</strong> Columbia Retirement Board (DCRB).<br />
Under provisions <strong>of</strong> <strong>the</strong> National Capital<br />
Revitalization and Self-Government Improvement<br />
Act (<strong>the</strong> “Act”) <strong>of</strong> 1997, <strong>the</strong> federal government<br />
assumed <strong>the</strong> District’s unfunded pension liability for<br />
<strong>the</strong> retirement plans for teachers, police <strong>of</strong>ficers, firefighters,<br />
and judges. Pursuant to <strong>the</strong> Act, <strong>the</strong> federal<br />
government will pay <strong>the</strong> retirement and death benefits,<br />
and a defined share <strong>of</strong> disability benefits, for<br />
employees for service accrued prior to July 1, 1997.<br />
The costs for benefits earned after June 30, 1997, are<br />
<strong>the</strong> responsibility <strong>of</strong> <strong>the</strong> Government <strong>of</strong> <strong>the</strong> District<br />
<strong>of</strong> Columbia. This budget reflects <strong>the</strong> required annual<br />
District contribution to fund <strong>the</strong>se earned benefits.<br />
Pursuant to District Code § 1-907.02(a) (2006<br />
Repl.), <strong>the</strong> District is required to budget <strong>the</strong> pension<br />
contribution at an amount equal to or greater than<br />
<strong>the</strong> amount certified by <strong>the</strong> DCRB on <strong>the</strong> basis <strong>of</strong> a<br />
prescribed actuarial study and formula calculation<br />
that is set forth in § 1-907.03. On January 16, 2009,<br />
DCRB transmitted <strong>the</strong> certified contribution for<br />
inclusion in <strong>the</strong> District’s FY 2010 proposed budget<br />
as reflected in this chapter.<br />
The agency’s FY 2010 proposed budget is presented<br />
in <strong>the</strong> following tables:<br />
Teachers’ Retirement System<br />
D-23
FY 2010 Proposed Gross Funds Operating <strong>Budget</strong>, by Revenue Type<br />
Table GX0-1 contains <strong>the</strong> proposed FY 2010 agency budget compared to <strong>the</strong> FY 2009 approved budget. It also<br />
provides <strong>the</strong> FY 2007 and FY 2008 actual expenditures.<br />
Table GX0-1<br />
(dollars in thousands)<br />
Actual Actual Approved Proposed<br />
Change<br />
from Percent<br />
Appropriated Fund<br />
General Fund<br />
FY 2007 FY 2008 FY 2009 FY 2010 FY 2009 Change*<br />
Local Funds 14,540 5,964 0 3,000 3,000 N/A<br />
Total for General Fund 14,540 5,964 0 3,000 3,000 N/A<br />
Gross Funds 14,540 5,964 0 3,000 3,000 N/A<br />
*Percent Change is based on whole dollars.<br />
Note: If applicable, for a breakdown <strong>of</strong> each Grant (Federal and Private), Special Purpose Revenue type and Intra-District agreement, please refer to<br />
Schedule 80 <strong>Agency</strong> Summary by Revenue Source in <strong>the</strong> Operating Appendices located on <strong>the</strong> <strong>Office</strong> <strong>of</strong> <strong>the</strong> <strong>Chief</strong> <strong>Financial</strong> <strong>Office</strong>r’s website.<br />
FY 2010 Proposed Operating <strong>Budget</strong>, by Comptroller Source Group<br />
Table GX0-2 contains <strong>the</strong> proposed FY 2010 budget at <strong>the</strong> Comptroller Source group (object class) level compared<br />
to <strong>the</strong> FY 2009 approved budget. It also provides FY 2007 and FY 2008 actual expenditures.<br />
Table GX0-2<br />
(dollars in thousands)<br />
Actual Actual Approved Proposed<br />
Change<br />
from Percent<br />
Comptroller Source Group FY 2007 FY 2008 FY 2009 FY 2010 FY 2009 Change*<br />
50 Subsidies and Transfers 14,540 5,964 0 3,000 3,000 N/A<br />
Subtotal Nonpersonal Services (NPS) 14,540 5,964 0 3,000 3,000 N/A<br />
Gross Funds 14,540 5,964 0 3,000 3,000 N/A<br />
*Percent Change is based on whole dollars.<br />
Program Description<br />
The Teachers’ Retirement System operates through<br />
<strong>the</strong> following program:<br />
Teachers’ Retirement System - D.C. Code § 1-<br />
907.02(a) requires <strong>the</strong> District to appropriate funds<br />
that are equal to, or greater than, <strong>the</strong> actuarially determined<br />
amount as <strong>the</strong> District’s annual payment to<br />
<strong>the</strong> District <strong>of</strong> Columbia Retirement Board.<br />
FY 2010 Proposed <strong>Budget</strong> and <strong>Financial</strong> Plan<br />
D-24<br />
Program Structure Change<br />
The Teachers’ Retirement System had no program<br />
structure changes in <strong>the</strong> FY 2010 Proposed <strong>Budget</strong>.
FY 2010 Proposed Operating <strong>Budget</strong> and FTEs, by Program and Activity<br />
Table GX0-3 contains <strong>the</strong> proposed FY 2010 budget by program and activity compared to <strong>the</strong> FY 2009 approved budget.<br />
It also provides <strong>the</strong> FY 2008 actual data.<br />
Table GX0-3<br />
(dollars in thousands)<br />
Dollars in Thousands Full-Time Equivalents<br />
Change Change<br />
Actual Approved Proposed from Actual Approved Proposed from<br />
Program/Activity<br />
(1000) Teachers' Retirement System<br />
FY 2008 FY 2009 FY 2010 FY 2009 FY 2008 FY 2009 FY 2010 FY 2009<br />
(1100) Teachers' Retirement System 5,964 0 3,000 3,000 0.0 0.0 0.0 0.0<br />
Subtotal (1000) Teachers' Retirement System 5,964 0 3,000 3,000 0.0 0.0 0.0 0.0<br />
Total Proposed Operating <strong>Budget</strong> 5,964 0 3,000 3,000 0.0 0.0 0.0 0.0<br />
(Change is calculated by whole numbers and numbers may not add up due to rounding)<br />
Note: For more detailed information regarding <strong>the</strong> proposed funding for <strong>the</strong> activities within this agency’s programs, please see Schedule 30-PBB<br />
Program Summary By Activity in <strong>the</strong> FY 2010 Operating Appendices located on <strong>the</strong> <strong>Office</strong> <strong>of</strong> <strong>the</strong> <strong>Chief</strong> <strong>Financial</strong> <strong>Office</strong>r’s website.<br />
Major Baseline Adjustments, Cost Savings and<br />
Policy Initiatives<br />
Initial adjustment - Increased $10,269,955, based on an<br />
initial estimate for <strong>the</strong> required contribution for FY<br />
2010.<br />
FY 2009 Approved <strong>Budget</strong> to FY 2010 Proposed <strong>Budget</strong><br />
Table GX0-4 itemizes <strong>the</strong> changes by revenue type between <strong>the</strong> FY 2009 approved budget and <strong>the</strong> FY 2010 proposed<br />
budget. The four categories <strong>of</strong> changes reflected in this table are: (1) changes to <strong>the</strong> baseline budget (includes<br />
agency request), (2) changes representing cost savings or efficiencies, (3) changes related to policy initiatives, and (4)<br />
changes to specifically address <strong>the</strong> projected revenue shortfall.<br />
Table GX0-4<br />
(dollars in thousands)<br />
Baseline adjustment: Reduced $7,269,955 to reflect<br />
<strong>the</strong> DCRB-approved amount in <strong>the</strong> actuarial certification<br />
letter dated January 16, 2009.<br />
Program BUDGET FTE<br />
LOCAL FUND: FY 2009 Approved <strong>Budget</strong> and FTE 0 0.0<br />
Initial and Baseline Adjustments<br />
Intra-<strong>Agency</strong> changes - Increase in subsidies and transfers Teachers' Retirement System 10,270 0.0<br />
Baseline Adjustments: Intra-<strong>Agency</strong> changes - Reduction in subsidies<br />
and transfers<br />
Teachers' Retirement System -7,270 0.0<br />
LOCAL FUND: FY 2010 Proposed <strong>Budget</strong> and FTE 3,000 0.0<br />
Gross for GX0 - Teachers’ Retirement System 3,000 0.0<br />
Teachers’ Retirement System<br />
D-25
<strong>Office</strong> <strong>of</strong> <strong>the</strong> State Superintendent<br />
<strong>of</strong> Education<br />
www.osse.dc.gov<br />
Telephone: 202-727-6436<br />
(GD0)<br />
% Change<br />
FY 2008 FY 2009 FY 2010 from<br />
Description Actual Approved Proposed FY 2009<br />
Operating <strong>Budget</strong> $317,898,378 $388,708,039 $465,144,407 19.7<br />
FTEs 223.5 408.5 339.3 -17.0<br />
The mission <strong>of</strong> <strong>the</strong> <strong>Office</strong> <strong>of</strong> <strong>the</strong> State Superintendent <strong>of</strong> Education is to<br />
set high expectations, provide resources and support, and exercise accountability<br />
to ensure that all residents receive an excellent education.<br />
Summary <strong>of</strong> Services<br />
Pursuant to Title III <strong>of</strong> <strong>the</strong> Public Education Reform<br />
Amendment Act <strong>of</strong> FY 2007, <strong>the</strong> <strong>Office</strong> <strong>of</strong> <strong>the</strong> State<br />
Superintendent <strong>of</strong> Education (OSSE) serves as <strong>the</strong><br />
District <strong>of</strong> Columbia’s State Education <strong>Agency</strong> (SEA),<br />
<strong>the</strong>reby granting <strong>the</strong> agency oversight responsibility<br />
over all federal education programs and related grants<br />
administered in <strong>the</strong> District <strong>of</strong> Columbia. OSSE has<br />
responsibility for setting state-level standards aligned<br />
with school, college and workforce readiness expectations;<br />
providing <strong>the</strong> resources and support to assist<br />
childcare, Pre-Kindergarten, and adult education<br />
providers and Local Education Agencies (LEAs) in<br />
achieving <strong>the</strong>se objectives; ensuring <strong>the</strong> state tracks<br />
and makes available accurate and reliable data and<br />
assessing meaningful state-level sanctions and interventions<br />
to ensure quality and compliance with both<br />
state and federal law.<br />
The agency’s FY 2010 proposed budget is presented<br />
in <strong>the</strong> following tables:<br />
<strong>Office</strong> <strong>of</strong> <strong>the</strong> State Superintendent <strong>of</strong> Education<br />
D-27
FY 2010 Proposed Gross Funds Operating <strong>Budget</strong>, by Revenue Type<br />
Table GD0-1 contains <strong>the</strong> proposed FY 2010 agency budget compared to <strong>the</strong> FY 2009 approved budget. It also<br />
provides FY 2007 and FY 2008 actual expenditures.<br />
Table GD0-1<br />
(dollars in thousands)<br />
Actual Actual Approved Proposed<br />
Change<br />
from Percent<br />
Appropriated Fund<br />
General Fund<br />
FY 2007 FY 2008 FY 2009 FY 2010 FY 2009 Change*<br />
Local Funds 14,423 102,998 117,544 111,990 -5,554 -4.7<br />
Special Purpose Revenue Funds 164 136 10,567 10,728 161 1.5<br />
Total for General Fund 14,587 103,135 128,111 122,718 -5,393 -4.2<br />
Federal Resources<br />
Federal Payments 41,171 35,194 55,100 56,600 1,500 2.7<br />
Federal Grant Funds 29,418 128,922 160,535 245,394 84,859 52.9<br />
Total for Federal Resources 70,590 164,117 215,635 301,994 86,359 40.0<br />
Private Funds<br />
Private Grant Funds 50 0 0 0 0 N/A<br />
Total for Private Funds 50 0 0 0 0 N/A<br />
Intra-District Funds<br />
Intra-District Funds 167 50,647 44,962 40,432 -4,529 -10.1<br />
Total for Intra-District Funds 167 50,647 44,962 40,432 -4,529 -10.1<br />
Gross Funds 85,395 317,898 388,708 465,144 76,436 19.7<br />
*Percent Change is based on whole dollars.<br />
Note: If applicable, for a breakdown <strong>of</strong> each Grant (Federal and Private), Special Purpose Revenue type and Intra-District agreement,<br />
please refer to Schedule 80, <strong>Agency</strong> Summary by Revenue Source, in <strong>the</strong> Operating Appendices located on <strong>the</strong> <strong>Office</strong> <strong>of</strong> <strong>the</strong> <strong>Chief</strong><br />
<strong>Financial</strong> <strong>Office</strong>r’s website.<br />
FY 2010 Proposed <strong>Budget</strong> and <strong>Financial</strong> Plan<br />
D-28
FY 2010 Proposed Full-Time Equivalents, by Revenue Type<br />
Table GD0-2 contains <strong>the</strong> proposed FY 2010 FTE level compared to <strong>the</strong> FY 2009 approved FTE level by revenue<br />
type. It also provides FY 2007 and FY 2008 actual data.<br />
Table GD0-2<br />
Change<br />
Actual Actual Approved Proposed from Percent<br />
Appropriated Fund FY 2007 FY 2008 FY 2009 FY 2010 FY 2009 Change<br />
General Fund<br />
Local Funds 41.0 192.6 239.3 223.5 -15.8 -6.6<br />
Special Purpose Revenue Funds 2.0 2.0 0.0 2.7 2.7 N/A<br />
Total for General Fund 43.0 194.6 239.3 226.2 -13.1 -5.5<br />
Federal Resources<br />
Federal Payments 17.0 13.9 19.0 22.5 3.5 18.4<br />
Federal Grant Funds 20.0 15.0 142.3 90.6 -51.7 -36.3<br />
Total for Federal Resources 37.0 28.9 161.3 113.1 -48.2 -29.9<br />
Intra-District Funds<br />
Intra-District Funds 0.0 0.0 8.0 0.0 -8.0 -100.0<br />
Total for Intra-District Funds 0.0 0.0 8.0 0.0 -8.0 -100.0<br />
Total Proposed FTEs 80.0 223.5 408.5 339.3 -69.3 -17.0<br />
<strong>Office</strong> <strong>of</strong> <strong>the</strong> State Superintendent <strong>of</strong> Education<br />
D-29
FY 2010 Proposed Operating <strong>Budget</strong>, by Comptroller Source Group<br />
Table GD0-3 contains <strong>the</strong> proposed FY 2010 budget at <strong>the</strong> Comptroller Source Group (object class) level compared<br />
to <strong>the</strong> FY 2009 approved budget. It also provides FY 2007 and FY 2008 actual expenditures.<br />
Table GD0-3<br />
(dollars in thousands)<br />
Actual Actual Approved Proposed<br />
Change<br />
from Percent<br />
Comptroller Source Group FY 2007 FY 2008 FY 2009 FY 2010 FY 2009 Change*<br />
11 Regular Pay - Cont Full Time 1,875 10,083 23,590 12,519 -11,071 -46.9<br />
12 Regular Pay - O<strong>the</strong>r 2,896 18,616 2,956 10,728 7,772 262.9<br />
13 Additional Gross Pay 81 354 0 0 0 N/A<br />
14 Fringe Benefits - Curr Personnel 830 3,820 5,226 4,111 -1,115 -21.3<br />
15 Overtime Pay 2 15 20 0 -20 -100.0<br />
Subtotal Personal Services (PS) 5,684 32,889 31,793 27,358 -4,435 -13.9<br />
20 Supplies and Materials 102 525 1,395 651 -744 -53.4<br />
30 Energy, Comm. and Bldg Rentals 57 82 92 422 330 358.6<br />
31 Telephone, Telegraph, Telegram, Etc 106 487 148 465 317 213.9<br />
32 Rentals - Land and Structures 0 2,029 1,417 3,088 1,672 118.0<br />
33 Janitorial Services 23 27 85 35 -50 -59.2<br />
34 Security Services 32 545 149 25 -124 -83.3<br />
35 Occupancy Fixed Costs 41 164 183 96 -88 -47.8<br />
40 O<strong>the</strong>r Services and Charges 1,763 7,949 15,322 13,996 -1,326 -8.7<br />
41 Contractual Services - O<strong>the</strong>r 1,594 36,721 36,856 32,437 -4,419 -12.0<br />
50 Subsidies and Transfers 75,934 234,650 299,168 385,961 86,793 29.0<br />
70 Equipment & Equipment Rental 59 1,833 2,099 610 -1,489 -70.9<br />
Subtotal Nonpersonal Services (NPS) 79,711 285,010 356,915 437,787 80,871 22.7<br />
Gross Funds 85,395 317,898 388,708 465,144 76,436 19.7<br />
*Percent Change is based on whole dollars.<br />
FY 2010 Proposed <strong>Budget</strong> and <strong>Financial</strong> Plan<br />
D-30
Program Description<br />
The <strong>Office</strong> <strong>of</strong> <strong>the</strong> State Superintendent <strong>of</strong> Education<br />
operates through <strong>the</strong> following 6 programs:<br />
Superintendent’s <strong>Office</strong> - Supports <strong>the</strong> mission <strong>of</strong> <strong>the</strong><br />
<strong>Office</strong> <strong>of</strong> <strong>the</strong> State Superintendent <strong>of</strong> Education.<br />
This program contains <strong>the</strong> following 4 activities:<br />
■ State Superintendent Support - Supports <strong>the</strong><br />
mission <strong>of</strong> <strong>the</strong> <strong>Office</strong> <strong>of</strong> <strong>the</strong> State Superintendent<br />
<strong>of</strong> Education;<br />
■ Special Education Reform (Blackman Jones) –<br />
provides leadership for <strong>the</strong> state system <strong>of</strong> special<br />
education services related to <strong>the</strong> Blackman/Jones<br />
vs. District <strong>of</strong> Columbia court case;<br />
■ Special Education Incarcerated Youth – provides<br />
services to detained youth; and<br />
■ Planning and Performance – establishes strategies<br />
for <strong>the</strong> OSSE and performance metrics associated<br />
with each initiative identified in <strong>the</strong> OSSE<br />
plan.<br />
Deputy Superintendent for Business and Support<br />
Services - provides human resources, procurement,<br />
administrative management, facilities and risk management<br />
services to <strong>the</strong> OSSE, nutrition services to<br />
<strong>the</strong> residents <strong>of</strong> <strong>the</strong> District <strong>of</strong> Columbia, and facilities<br />
financing and technical assistance to Public<br />
Charter Schools.<br />
This program contains <strong>the</strong> following 8 activities:<br />
■ Deputy Superintendent Business and Support<br />
Services - provides Executive direction;<br />
■ Human Resources – provides Human Resources<br />
Services to OSSE;<br />
■ Facilities and Maintenance – <strong>Budget</strong>s <strong>the</strong><br />
agency’s fixed costs for facility utilities, security<br />
and rent/lease payments;<br />
■ Procurement – provides Procurement Services to<br />
OSSE;<br />
■ Administration and Facilities Management -<br />
Manages OSSE’s facilities and administrative<br />
management;<br />
■ Nutrition Services – ensures that children and<br />
families receive year-round access to well-balanced<br />
meals;<br />
■ Public Charter Financing and Support – The<br />
mission <strong>of</strong> <strong>the</strong> <strong>Office</strong> <strong>of</strong> Public Charter School<br />
Financing and Support (OPCSFS) is to support<br />
<strong>the</strong> creation <strong>of</strong> high quality educational choices<br />
for District residents through <strong>the</strong> efficient and<br />
effective distribution <strong>of</strong> financial and technical<br />
support for <strong>the</strong> development, expansion, and<br />
improvement <strong>of</strong> quality public charter schools;<br />
and<br />
■ Residency Coordination – provides general education<br />
tuition payments for children who are<br />
wards <strong>of</strong> <strong>the</strong> District <strong>of</strong> Columbia, but who are<br />
enrolled in non-DC Public Schools based on <strong>the</strong><br />
location <strong>of</strong> <strong>the</strong> foster home.<br />
Teaching and Learning - is comprised <strong>of</strong> <strong>the</strong> Early<br />
Care and Education Administration (ECEA), K-12,<br />
Post Secondary Education, Workforce Readiness programs,<br />
and Special Education.<br />
This program contains <strong>the</strong> following 27 activities:<br />
■ Education Excellence - sets education policy<br />
goals;<br />
■ Early Care and Education Administration –<br />
works to develop an effective early childhood<br />
education system by implementing high standards<br />
for programs and pr<strong>of</strong>essionals, creating<br />
supports to meet standards, adhering to rigorous<br />
accountability measures, engaging community<br />
stakeholders and securing strong financial supports;<br />
■ Childcare Program Development - Parents,<br />
schools, child care providers, Head Start, Early<br />
Intervention, libraries, community organizations,<br />
and o<strong>the</strong>r stakeholders work toge<strong>the</strong>r to build<br />
and support <strong>the</strong> early childhood development<br />
system for <strong>the</strong> achievement <strong>of</strong> long-term academic<br />
success;<br />
■ Pre-K and School Readiness - provides leadership<br />
and coordination to ensure all District <strong>of</strong><br />
Columbia children from birth to kindergarten<br />
entrance have access to high quality early learning<br />
programs;<br />
■ Standards and Accountability - establishes, in<br />
conjunction with <strong>the</strong> State Board <strong>of</strong> Education,<br />
strong learning standards and assessments for all<br />
District learners. The No Child Left Behind<br />
(NCLB) Act requires all students to perform at or<br />
above grade-level pr<strong>of</strong>iciency in reading and math<br />
by <strong>the</strong> end <strong>of</strong> <strong>the</strong> 2013-14 school year;<br />
<strong>Office</strong> <strong>of</strong> <strong>the</strong> State Superintendent <strong>of</strong> Education<br />
D-31
■ Post Secondary Education and Workforce<br />
Readiness - assists District residents in acquiring<br />
<strong>the</strong> skills and credentials needed to be productive<br />
workers, family members and citizens and is composed<br />
<strong>of</strong> <strong>the</strong> following functional areas:<br />
- The State Higher Education Executive <strong>Office</strong><br />
(SHEEO)<br />
- Higher Education <strong>Financial</strong> Services and<br />
Preparatory Programs<br />
- Career and Technical Education<br />
- GED Testing Center<br />
- Adult and Family Education<br />
- Education Licensure Commission<br />
- The Workforce Community Transition<br />
Training for Incarcerated Youth Offenders;<br />
■ Career and Technology Education - provides<br />
vocational training in information technology;<br />
■ Adult and Family Education - provides education<br />
services for adults and families;<br />
■ Education Licensure Commission - provides<br />
license and accreditation for teachers;<br />
■ Gear Up – College readiness programs;<br />
■ DC Tag – A federally funded program that<br />
allows DC resident students to attend out <strong>of</strong> state<br />
universities and colleges at in-state tuition rates;<br />
■ LEAP – <strong>Financial</strong> Aid Programs to DC residents<br />
to attend College and Universities;<br />
■ GED Testing – provides GED testing and preparation;<br />
■ K-12 Services (Elementary and Secondary) - is<br />
responsible for disbursing and monitoring federal<br />
funds to Local Education Agencies including<br />
Title I (No Child Left Behind), licensing teachers,<br />
school-based service providers and administrators;<br />
approving educator preparation programs<br />
<strong>of</strong>fered at colleges/universities located within <strong>the</strong><br />
District <strong>of</strong> Columbia; providing technical assistance<br />
to and oversight for LEAs in meeting <strong>the</strong><br />
NCLB highly qualified requirements for teachers<br />
and parapr<strong>of</strong>essionals; and collecting and analyzing<br />
statewide educator quality data. The <strong>Office</strong><br />
<strong>of</strong> School Improvement exists to assist LEAs and<br />
schools internalize systems, processes, and capacities<br />
that will ensure a continued commitment to<br />
<strong>the</strong> difficult work <strong>of</strong> continuous improvement;<br />
■ Federal Grant Programs – provides guidance on<br />
Federal Grants and management reform and<br />
holds <strong>the</strong> budget for Federal Grants transferred<br />
via intra-District to DCPS (refer to agenc GA0);<br />
FY 2010 Proposed <strong>Budget</strong> and <strong>Financial</strong> Plan<br />
D-32<br />
■ Special Population and Competitive Program –<br />
handles grants geared towards special population<br />
(i.e. homeless children, homeschoolers, English as<br />
a second language students), and competitive<br />
grants;<br />
■ School Improvement – gives pr<strong>of</strong>essional development<br />
and technical assistance for D.C. Public<br />
Schools who consistently fail to meet adequate<br />
yearly progress;<br />
■ Reading First – promotes literacy;<br />
■ Accountability and Testing - provides instructional<br />
and learning support to local education<br />
agency improvement efforts, addressing topics<br />
and issues that cross learning areas. Standards<br />
teams conduct various analyses <strong>of</strong> local education<br />
agencies including results <strong>of</strong> state tests, provide<br />
technical assistance on development <strong>of</strong> local education<br />
agency improvement plans for improving<br />
student performance, and provide technical assistance<br />
and pr<strong>of</strong>essional development to advance<br />
Career and Technical programs for District learners<br />
■ Curriculum and Instruction – develops content<br />
standards for D.C. Public Schools;<br />
■ Educator Quality – provides teacher certification<br />
and development for D.C. Public School teachers<br />
■ English Language Learners – Grants dollars to<br />
assist students for whom English is a second language;<br />
■ Special Education - aids <strong>the</strong> agency in <strong>the</strong> development,<br />
implementation, and evaluation <strong>of</strong> <strong>the</strong><br />
state’s special education initiatives to establish and<br />
maintain high-quality special education services<br />
for children and families in <strong>the</strong> District <strong>of</strong><br />
Columbia;<br />
■ Special Education Compliance and Monitoring<br />
- responsible for ensuring full implementation <strong>of</strong><br />
Individuals with Disabilities Education Act<br />
requirements (IDEA) in all Local Education<br />
Agencies (LEAs), through <strong>the</strong> establishment <strong>of</strong> a<br />
system <strong>of</strong> monitoring;<br />
■ Special Education Training and Technical<br />
Assistance - responsible for ensuring full implementation<br />
<strong>of</strong> IDEA in all LEAs, through <strong>the</strong><br />
establishment <strong>of</strong> a system <strong>of</strong> monitoring, technical<br />
assistance, and grant management;
■ Special Education Attorney Fees - represents<br />
OSSE in litigation in courts, recommends decisions<br />
in adjudicatory matters before <strong>the</strong> agency,<br />
and assists <strong>the</strong> agency in its decision-making<br />
capacity; and<br />
■ Special Education (Infants and Toddlers) - leads<br />
<strong>the</strong> agency in <strong>the</strong> development, implementation,<br />
and evaluation <strong>of</strong> <strong>the</strong> state’s special education initiatives<br />
for infants and toddlers to establish and<br />
maintain high-quality special education services<br />
for children and families in <strong>the</strong> District <strong>of</strong><br />
Columbia.<br />
The <strong>Office</strong> <strong>of</strong> <strong>the</strong> <strong>Chief</strong> <strong>Financial</strong> <strong>Office</strong>r - enhances<br />
<strong>the</strong> fiscal and financial stability, accountability and<br />
integrity <strong>of</strong> <strong>the</strong> agency by providing financial and<br />
budgetary information to OSSE’s divisions and program/administrative<br />
departments in order to ensure<br />
<strong>the</strong> appropriate collection/allocation, utilization, and<br />
control <strong>of</strong> city resources. This division monitors<br />
statewide financial data and activity including OSSE’s<br />
budget and projections, oversight <strong>of</strong> DCPS and<br />
Public Charter school budgets, and statewide financial<br />
reporting, planning, analysis, and accounting.<br />
This program contains <strong>the</strong> following 4 activities:<br />
■ <strong>Chief</strong> <strong>Financial</strong> <strong>Office</strong>r – provides overall financial<br />
guidance to OSSE;<br />
■ <strong>Budget</strong> – provides budget oversight to OSSE;<br />
■ <strong>Financial</strong> Grants Management – provides grants<br />
management oversight to OSSE; and<br />
■ Accounting – provides accounting oversight to<br />
OSSE.<br />
The <strong>Chief</strong> Information <strong>Office</strong>r - develops and<br />
enforces policies and standards for information technology<br />
in OSSE. This division identifies where and<br />
how technology can systematically support <strong>the</strong> business<br />
processes <strong>of</strong> <strong>the</strong> agency as well as assesses new<br />
and emerging technologies to determine <strong>the</strong>ir potential<br />
application to OSSE’s programs and services.<br />
This program contains <strong>the</strong> following 6 activities:<br />
■ <strong>Chief</strong> Information <strong>Office</strong>r – provides overall IT<br />
support to OSSE;<br />
■ Knowledge Management – provides IT knowledge<br />
support to OSSE;<br />
■ Applications – provides IT applications support<br />
to OSSE;<br />
■ Infrastructure – provides IT infrastructure support<br />
to OSSE;<br />
■ Project Management – provides IT project management<br />
to OSSE; and<br />
■ Data Management – provides IT data management<br />
to OSSE.<br />
The <strong>Office</strong> <strong>of</strong> Review and Compliance (ORC) -<br />
conducts special education administrative due process<br />
hearings per <strong>the</strong> IDEA. In addition, <strong>the</strong> <strong>of</strong>fice conducts<br />
internal control reviews and provides technical<br />
assistance to all government <strong>of</strong>fices receiving federal<br />
funds for <strong>the</strong> purpose <strong>of</strong> education, including <strong>the</strong><br />
OSSE, LEAs and District Private Schools to ensure<br />
compliance with federal laws, grants and state<br />
requirements. The ORC also conducts reviews and<br />
investigations on issues <strong>of</strong> waste, fraud and abuse as<br />
well as prepares an annual audit plan.<br />
This program contains <strong>the</strong> following 2 activities:<br />
■ Student Hearing <strong>Office</strong> – conducts required<br />
administrative hearings; and<br />
■ Records Management – maintains files and<br />
records.<br />
Program Structure Change<br />
The <strong>Office</strong> <strong>of</strong> <strong>the</strong> State Superintendent <strong>of</strong> Education<br />
underwent a reorganization in FY 2009 that reallocated<br />
resources among programs. During this reorganization,<br />
<strong>the</strong> agency discontinued <strong>the</strong> use <strong>of</strong> <strong>the</strong> following<br />
programs and reallocated resources within <strong>the</strong><br />
agency: <strong>Agency</strong> Management Program; Planning<br />
and Performance and Public Engagement; and<br />
Educational facilities and Partnerships.<br />
<strong>Office</strong> <strong>of</strong> <strong>the</strong> State Superintendent <strong>of</strong> Education<br />
D-33
FY 2010 Proposed Operating <strong>Budget</strong> and FTEs, by Program and Activity<br />
Table GD0-4 contains <strong>the</strong> proposed FY 2010 budget by program and activity compared to <strong>the</strong> FY 2009 approved budget.<br />
It also provides FY 2008 actual data.<br />
Table GD0-4<br />
(dollars in thousands)<br />
Dollars in Thousands Full-Time Equivalents<br />
Change Change<br />
Actual Approved Proposed from Actual Approved Proposed from<br />
Program/Activity<br />
(1000) <strong>Agency</strong> Management Program<br />
FY 2008 FY 2009 FY 2010 FY 2009 FY 2008 FY 2009 FY 2010 FY 2009<br />
(1010) Personnel 199 38 0 -38 3.1 0.0 0.0 0.0<br />
(1015) Training and Employee Development 75 0 0 0 0.2 0.0 0.0 0.0<br />
(1017) Labor Relations 11 0 0 0 0.1 0.0 0.0 0.0<br />
(1020) Contracting and Procurement 54 87 0 -87 1.1 0.0 0.0 0.0<br />
(1030) Property Management 41 0 0 0 0.1 0.0 0.0 0.0<br />
(1040) Information Technology 2,456 0 0 0 1.2 0.0 0.0 0.0<br />
(1050) <strong>Financial</strong> Management 25 0 0 0 0.1 0.0 0.0 0.0<br />
(1055) Risk Management 50 0 0 0 1.2 0.0 0.0 0.0<br />
(1060) Legal 47 0 0 0 1.1 0.0 0.0 0.0<br />
(1070) Fleet Management 25 0 0 0 0.2 0.0 0.0 0.0<br />
(1080) Information Technology 204 0 0 0 3.1 0.0 0.0 0.0<br />
(1085) Customer Service 13 0 0 0 0.2 0.0 0.0 0.0<br />
(1090) Performance Management 4,393 0 0 0 53.8 0.0 0.0 0.0<br />
Subtotal (1000) <strong>Agency</strong> Management Program<br />
(2000) Nutrition Services<br />
7,595 125 0 -125 65.5 0.0 0.0 0.0<br />
(0200) Nutrition Services - Activity 28,132 0 0 0 11.0 0.0 0.0 0.0<br />
Subtotal (2000) Nutrition Services<br />
(3000) Higher Education <strong>Financial</strong> Services<br />
28,132 0 0 0 11.0 0.0 0.0 0.0<br />
(0300) Higher Education <strong>Financial</strong> Services 26,769 0 0 0 15.9 0.0 0.0 0.0<br />
(0302) DC Tuition Assistance Grant 608 0 0 0 0.0 0.0 0.0 0.0<br />
(0303) DC Leveraging Ed. Assistance Partnership 5,927 0 0 0 0.0 0.0 0.0 0.0<br />
Subtotal (3000) Higher Education <strong>Financial</strong> Services<br />
(4000) Policy, Research, and Analysis<br />
33,304 0 0 0 15.9 0.0 0.0 0.0<br />
(0400) Policy, Research, and Analysis - Activity 5,363 0 0 0 6.0 0.0 0.0 0.0<br />
Subtotal (4000) Policy, Research, and Analysis<br />
(6000) Educational Licensure<br />
5,363 0 0 0 6.0 0.0 0.0 0.0<br />
(0600) Educational Licensure 2,736 0 0 0 11.0 0.0 0.0 0.0<br />
(0601) State Higher Education Executive <strong>Office</strong> 1,501 0 0 0 0.0 0.0 0.0 0.0<br />
(0602) Education Licensure Commission 50 0 0 0 0.0 0.0 0.0 0.0<br />
(0603) DC Gear-up 363 0 0 0 0.0 0.0 0.0 0.0<br />
Subtotal (6000) Educational Licensure<br />
(Continued on next page)<br />
4,650 0 0 0 11.0 0.0 0.0 0.0<br />
FY 2010 Proposed <strong>Budget</strong> and <strong>Financial</strong> Plan<br />
D-34
FY 2010 Proposed Operating <strong>Budget</strong> and FTEs, by Program and Activity<br />
Table GD0-4 contains <strong>the</strong> proposed FY 2010 budget by program and activity compared to <strong>the</strong> FY 2009 approved budget.<br />
It also provides FY 2008 actual data.<br />
Table GD0-4 (Continued)<br />
(dollars in thousands)<br />
Dollars in Thousands Full-Time Equivalents<br />
Change Change<br />
Actual Approved Proposed from Actual Approved Proposed from<br />
Program/Activity<br />
(7000) Educational Facilities and Partnerships<br />
FY 2008 FY 2009 FY 2010 FY 2009 FY 2008 FY 2009 FY 2010 FY 2009<br />
(0700) Public Charter School Fin and Support 9,011 20,000 0 -20,000 3.0 0.0 0.0 0.0<br />
(0701) Educational Facilities and Partnerships 281 0 0 0 0.0 0.0 0.0 0.0<br />
Subtotal (7000) Educational Facilities And Partnerships<br />
(9960) Year End Close<br />
9,292 20,000 0 -20,000 3.0 0.0 0.0 0.0<br />
No Activity Assigned -669 0 0 0 0.0 0.0 0.0 0.0<br />
Subtotal (9960) Year End Close<br />
(9980) Payroll Default Program<br />
-669 0 0 0 0.0 0.0 0.0 0.0<br />
No Activity Assigned 0 0 0 0 7.0 0.0 0.0 0.0<br />
Subtotal (9980) Payroll Default Program<br />
(A100) Superintendent <strong>Office</strong><br />
0 0 0 0 7.0 0.0 0.0 0.0<br />
(A110) State Superintendent Support 208 587 36,487 35,900 0.0 5.0 6.0 1.0<br />
(A120) State Board Of Education 274 1,039 0 -1,039 0.0 14.0 0.0 -14.0<br />
(A130) Transition Team 1,858 539 0 -539 0.0 2.0 0.0 -2.0<br />
(A140) Special Ed Reform-Blackman Jones 0 13,511 17,800 4,289 0.0 7.0 6.0 -1.0<br />
(A141) Special Ed-incarcerated Youth 0 0 900 900 0.0 0.0 0.0 0.0<br />
(A142) Special Ed-Petties 0 0 0 0 0.0 0.0 0.0 0.0<br />
(A143) Special Ed-o<strong>the</strong>r Court Obligations 0 0 0 0 0.0 0.0 0.0 0.0<br />
(A160) Federal Grants Reform 0 921 0 -921 0.0 11.0 0.0 -11.0<br />
(A170) Education Data Warehouse 0 151 0 -151 0.0 1.0 0.0 -1.0<br />
(A180) Policy Research & Analysis 0 2,116 0 -2,116 0.0 6.0 0.0 -6.0<br />
(A190) Planning & Performance 0 260 264 4 0.0 1.0 3.0 2.0<br />
Subtotal (A100) Superintendent <strong>Office</strong><br />
(A150) Contracts and Procurement<br />
2,340 19,124 55,451 36,328 0.0 47.0 15.0 -32.0<br />
No Activity Assigned 16 0 0 0 0.0 0.0 0.0 0.0<br />
(A155) Contracts and Procurement 209 0 0 0 0.0 0.0 0.0 0.0<br />
Subtotal (A150) Contracts and Procurement<br />
(Continued on next page)<br />
225 0 0 0 0.0 0.0 0.0 0.0<br />
<strong>Office</strong> <strong>of</strong> <strong>the</strong> State Superintendent <strong>of</strong> Education<br />
D-35
FY 2010 Proposed Operating <strong>Budget</strong> and FTEs, by Program and Activity<br />
Table GD0-4 contains <strong>the</strong> proposed FY 2010 budget by program and activity compared to <strong>the</strong> FY 2009 approved budget.<br />
It also provides FY 2008 actual data.<br />
Table GD0-4 (Continued)<br />
(dollars in thousands)<br />
Dollars in Thousands Full-Time Equivalents<br />
Change Change<br />
Actual Approved Proposed from Actual Approved Proposed from<br />
Program/Activity<br />
(A200) Deputy Superintendent - Bus and Support<br />
FY 2008 FY 2009 FY 2010 FY 2009 FY 2008 FY 2009 FY 2010 FY 2009<br />
(A210) Deputy Superintendent Business and Sup Svs 0 636 636 0 0.0 2.0 3.0 1.0<br />
(A220) Human Resources 3,726 472 676 204 0.0 7.0 10.0 3.0<br />
(A225) Facilities & Maintenance 2,803 1,577 3,436 1,859 0.0 0.0 0.0 0.0<br />
(A230) Procurement 0 272 652 380 0.0 2.0 5.0 3.0<br />
(A235) Administration & Facilities Management 624 820 610 -210 0.0 11.0 7.0 -4.0<br />
(A240) Nutrition Services 0 27,563 23,635 -3,928 0.0 16.5 17.3 0.8<br />
(A245) Public Charter Financing and Support 0 21,998 39,843 17,845 0.0 9.0 8.0 -1.0<br />
(A260) Residency Coordination 0 2,628 2,285 -342 0.0 0.0 0.0 0.0<br />
Subtotal (A200) Dpty Super - Bus & Support<br />
(A300) Standards and Accountability<br />
7,153 55,966 71,773 15,807 0.0 47.5 50.3 2.8<br />
(A320) Educator Quality 64 0 0 0 0.0 0.0 0.0 0.0<br />
(A330) Assessment and Reporting 1,333 0 0 0 0.0 0.0 0.0 0.0<br />
Subtotal (A300) Standards and Accountability<br />
(A400) Teaching and Learning<br />
1,397 0 0 0 0.0 0.0 0.0 0.0<br />
(A410) Education Excellence 1,095 633 63 -570 0.0 1.0 0.0 -1.0<br />
(A430) Early Care & Education Administration 0 85,943 81,647 -4,296 0.0 28.0 1.0 -27.0<br />
(A431) Childcare Program Development 0 6,322 9,341 3,019 0.0 6.0 38.0 32.0<br />
(A432) Pre-k and School Readiness 0 12,172 8,307 -3,865 0.0 11.0 6.0 -5.0<br />
(A433) Early Childhood Infants and Toddlers 0 459 0 -459 0.0 6.0 0.0 -6.0<br />
(A434) Income Eligibility Determination 0 2,036 0 -2,036 0.0 27.0 0.0 -27.0<br />
(A440) Career & Technical Education 26 315 0 -315 0.0 2.0 0.0 -2.0<br />
(A450) Standards & Accountability 1,110 755 124 -631 0.0 19.0 0.0 -19.0<br />
(A470) Post Secondary Educ & Workforce Readines 0 674 1,636 962 0.0 12.0 2.0 -10.0<br />
(A471) Career and Tech Education 0 4,296 4,524 228 0.0 3.0 5.0 2.0<br />
(A472) Adult and Family Education 0 3,237 4,668 1,431 0.0 0.0 5.0 5.0<br />
(A473) Education Licensure Commission 0 820 433 -387 0.0 4.0 5.0 1.0<br />
(A474) Gear Up 0 778 1,356 578 0.0 0.0 8.0 8.0<br />
(Continued on next page)<br />
FY 2010 Proposed <strong>Budget</strong> and <strong>Financial</strong> Plan<br />
D-36
FY 2010 Proposed Operating <strong>Budget</strong> and FTEs, by Program and Activity<br />
Table GD0-4 contains <strong>the</strong> proposed FY 2010 budget by program and activity compared to <strong>the</strong> FY 2009 approved budget.<br />
It also provides FY 2008 actual data.<br />
Table GD0-4 (Continued)<br />
(dollars in thousands)<br />
Dollars in Thousands Full-Time Equivalents<br />
Change Change<br />
Actual Approved Proposed from Actual Approved Proposed from<br />
Program/Activity FY 2008 FY 2009 FY 2010 FY 2009 FY 2008 FY 2009 FY 2010 FY 2009<br />
(A475) DC Tag 0 35,127 35,286 159 0.0 12.0 16.0 4.0<br />
(A476) LEAP 144 3,433 3,194 -239 0.0 0.0 0.0 0.0<br />
(A477) Adult Scholarship 75 1,800 0 -1,800 0.0 0.0 0.0 0.0<br />
(A479) GED Testing 0 325 354 29 0.0 0.0 3.0 3.0<br />
(A480) Federal Grants 0 0 0 0 50.0 0.0 0.0 0.0<br />
(A480) K-12 Services 99,577 2,113 2,535 422 2.1 30.0 25.0 -5.0<br />
(A481) Federal Grant Programs 0 58,282 109,240 50,959 0.0 0.0 5.0 5.0<br />
(A482) Special Population & Competitive Programs 0 1,926 375 -1,551 0.0 0.0 2.0 2.0<br />
(A483) School Improvement 0 2,936 2,224 -712 0.0 0.0 0.0 0.0<br />
(A484) Reading First 0 3,148 1,094 -2,054 0.0 0.0 3.0 3.0<br />
(A485) Accountability and Testing 0 7,333 6,040 -1,294 0.0 0.0 12.0 12.0<br />
(A486) Curriculum and Instruction 0 317 598 280 0.0 0.0 5.0 5.0<br />
(A487) Educator Quality 0 15,965 15,193 -772 0.0 0.0 5.0 5.0<br />
(A488) English Language Learners 0 961 1,077 116 0.0 0.0 0.0 0.0<br />
(A490) Special Education 0 22,319 27,619 5,301 0.0 90.0 46.0 -44.0<br />
(A491) Special Education Compliance & Monitoring 0 11 128 117 0.0 0.0 0.0 0.0<br />
(A492) Special Education State Complaints 0 154 0 -154 0.0 0.0 0.0 0.0<br />
(A493) Special Education Training & Tech Assistance 0 296 627 331 0.0 0.0 0.0 0.0<br />
(A495) Special Education Attorney Fees 0 8,091 8,091 0 0.0 0.0 0.0 0.0<br />
(A496) Special Education-infants and Toddlers 0 0 2,839 2,839 0.0 0.0 19.0 19.0<br />
(A497) Special Education-placement Oversight 0 0 0 0 0.0 0.0 0.0 0.0<br />
Subtotal (A400) Teaching & Learning 102,027 282,975 328,614 45,639 52.1 251.0 211.0 -40.0<br />
(Continued on next page)<br />
<strong>Office</strong> <strong>of</strong> <strong>the</strong> State Superintendent <strong>of</strong> Education<br />
D-37
FY 2010 Proposed Operating <strong>Budget</strong> and FTEs, by Program and Activity<br />
Table GD0-4 contains <strong>the</strong> proposed FY 2010 budget by program and activity compared to <strong>the</strong> FY 2009 approved budget.<br />
It also provides FY 2008 actual data.<br />
Table GD0-4 (Continued)<br />
(dollars in thousands)<br />
Dollars in Thousands Full-Time Equivalents<br />
Change Change<br />
Actual Approved Proposed from Actual Approved Proposed from<br />
Program/Activity<br />
(A500) <strong>Chief</strong> <strong>Financial</strong> <strong>Office</strong>r<br />
FY 2008 FY 2009 FY 2010 FY 2009 FY 2008 FY 2009 FY 2010 FY 2009<br />
(A510) <strong>Chief</strong> <strong>Financial</strong> <strong>Office</strong>r 0 252 193 -58 0.0 2.0 2.0 0.0<br />
(A520) <strong>Budget</strong> 159 231 433 202 0.0 3.0 4.0 1.0<br />
(A530) <strong>Financial</strong> Grants Management 0 542 425 -116 0.0 5.0 4.0 -1.0<br />
(A540) Accounting 0 565 1,109 544 0.0 8.0 17.0 9.0<br />
Subtotal (A500) <strong>Chief</strong> <strong>Financial</strong> <strong>Office</strong>r<br />
(A600) <strong>Chief</strong> Information <strong>Office</strong>r<br />
159 1,590 2,161 571 0.0 18.0 27.0 9.0<br />
(A610) <strong>Chief</strong> Information <strong>Office</strong>r 0 1,975 1,584 -392 0.0 2.0 3.0 1.0<br />
(A620) Knowledge Management 3,585 126 105 -22 0.0 0.0 1.0 1.0<br />
(A630) Applications 0 431 591 161 0.0 6.0 6.0 0.0<br />
(A640) Infrastructure 0 254 495 242 0.0 3.0 5.0 2.0<br />
(A650) Project Management 63 135 209 74 0.0 0.0 2.0 2.0<br />
(A660) Data Management 0 802 627 -175 0.0 11.0 7.0 -4.0<br />
Subtotal (A600) <strong>Chief</strong> Information <strong>Office</strong>r<br />
(A700) General Counsel<br />
3,648 3,723 3,611 -112 0.0 22.0 24.0 2.0<br />
(A710) General Counsel 496 0 0 0 0.0 0.0 0.0 0.0<br />
Subtotal (A700) General Counsel<br />
(A800) Compliance<br />
496 0 0 0 0.0 0.0 0.0 0.0<br />
(A810) Review and Compliance 0 529 0 -529 0.0 5.0 0.0 -5.0<br />
(A820) Seid 2,027 0 0 0 0.0 0.0 0.0 0.0<br />
(A830) Investigation 0 429 0 -429 0.0 3.0 0.0 -3.0<br />
(A840) Student Hearing <strong>Office</strong> 0 3,095 3,358 263 0.0 5.0 9.0 4.0<br />
(A850) Records Management 0 180 176 -4 0.0 2.0 3.0 1.0<br />
Subtotal (A800) Compliance<br />
(A900) Plan, Performance and Public Engagement<br />
2,027 4,233 3,534 -699 0.0 15.0 12.0 -3.0<br />
(A920) Policy, Research and Analysis 80 0 0 0 0.0 0.0 0.0 0.0<br />
(A930) Planning and Perform (Ed Stat) 144 0 0 0 0.0 0.0 0.0 0.0<br />
(A950) Student Svcs and Parent Engagement 120 0 0 0 0.0 0.0 0.0 0.0<br />
(A960) Community Outreach and Communications 0 0 0 0 0.0 8.0 0.0 -8.0<br />
(A960) Comunty Outreach and Communications 347 972 0 -972 0.0 0.0 0.0 0.0<br />
(A970) Volunteerism 255 0 0 0 0.0 0.0 0.0 0.0<br />
Subtotal (A900) Plan, Performance and Public Engagmt.<br />
(Continued on next page)<br />
946 972 0 -972 0.0 8.0 0.0 -8.0<br />
FY 2010 Proposed <strong>Budget</strong> and <strong>Financial</strong> Plan<br />
D-38
FY 2010 Proposed Operating <strong>Budget</strong> and FTEs, by Program and Activity<br />
Table GD0-4 contains <strong>the</strong> proposed FY 2010 budget by program and activity compared to <strong>the</strong> FY 2009 approved budget.<br />
It also provides FY 2008 actual data.<br />
Table GD0-4 (Continued)<br />
(dollars in thousands)<br />
Dollars in Thousands Full-Time Equivalents<br />
Change Change<br />
Actual Approved Proposed from Actual Approved Proposed from<br />
Program/Activity<br />
(H400) Early Childhood Development<br />
FY 2008 FY 2009 FY 2010 FY 2009 FY 2008 FY 2009 FY 2010 FY 2009<br />
(4020) Child Care Services 82,987 0 0 0 0.0 0.0 0.0 0.0<br />
(4030) Child Development Provider Services 5,702 0 0 0 0.0 0.0 0.0 0.0<br />
(4040) Early Intervention Services 1,891 0 0 0 0.0 0.0 0.0 0.0<br />
(4060) Quality Assurance 77 0 0 0 0.0 0.0 0.0 0.0<br />
Subtotal (H400) Early Childhood Development<br />
(S100) <strong>Agency</strong> Management Program<br />
90,656 0 0 0 0.0 0.0 0.0 0.0<br />
(1011) Personnel 420 0 0 0 6.0 0.0 0.0 0.0<br />
(1081) Information Technology 394 0 0 0 5.0 0.0 0.0 0.0<br />
(1120) Legal 1,795 0 0 0 7.0 0.0 0.0 0.0<br />
Subtotal (S100) <strong>Agency</strong> Management Program<br />
(S150) School System Management<br />
2,609 0 0 0 18.0 0.0 0.0 0.0<br />
(1530) Governance 116 0 0 0 7.0 0.0 0.0 0.0<br />
(1540) Management, Direction and Oversight 50 0 0 0 1.0 0.0 0.0 0.0<br />
Subtotal (S150) School System Management<br />
(S200) Instructional Programs<br />
166 0 0 0 8.0 0.0 0.0 0.0<br />
(2100) General Education 309 0 0 0 2.0 0.0 0.0 0.0<br />
(2300) ESL/Bilingual Education 57 0 0 0 0.0 0.0 0.0 0.0<br />
Subtotal (S200) Instructional Programs<br />
(S300) Special Education Local<br />
366 0 0 0 2.0 0.0 0.0 0.0<br />
(COMP) Blackmon-Jones Decree 9,624 0 0 0 9.0 0.0 0.0 0.0<br />
Subtotal (S300) Special Education Local<br />
(S700) Special Education State<br />
9,624 0 0 0 9.0 0.0 0.0 0.0<br />
(7200) Special Ed State Program and Services 3,054 0 0 0 12.0 0.0 0.0 0.0<br />
Subtotal (S700) Special Education State<br />
(Continued on next page)<br />
3,054 0 0 0 12.0 0.0 0.0 0.0<br />
<strong>Office</strong> <strong>of</strong> <strong>the</strong> State Superintendent <strong>of</strong> Education<br />
D-39
FY 2010 Proposed Operating <strong>Budget</strong> and FTEs, by Program and Activity<br />
Table GD0-4 contains <strong>the</strong> proposed FY 2010 budget by program and activity compared to <strong>the</strong> FY 2009 approved budget.<br />
It also provides FY 2008 actual data.<br />
Table GD0-4 (Continued)<br />
(dollars in thousands)<br />
Dollars in Thousands Full-Time Equivalents<br />
Change Change<br />
Actual Approved Proposed from Actual Approved Proposed from<br />
Program/Activity<br />
(S800) O<strong>the</strong>r State Functions<br />
FY 2008 FY 2009 FY 2010 FY 2009 FY 2008 FY 2009 FY 2010 FY 2009<br />
No Activity Assigned 72 0 0 0 0.0 0.0 0.0 0.0<br />
(2750) Library and Media 0 0 0 0 1.0 0.0 0.0 0.0<br />
(8100) Assessment and Accountability Programs 0 0 0 0 0.0 0.0 0.0 0.0<br />
(8400) General Education Tuition Payments 2,527 0 0 0 2.0 0.0 0.0 0.0<br />
Subtotal (S800) O<strong>the</strong>r State Functions<br />
(U400) Academic Affairs<br />
2,600 0 0 0 3.0 0.0 0.0 0.0<br />
(4005) Adult Literacy 739 0 0 0 0.0 0.0 0.0 0.0<br />
Subtotal (U400) Academic Affairs 739 0 0 0 0.0 0.0 0.0 0.0<br />
Total Proposed Operating <strong>Budget</strong> 317,898 388,708 465,144 76,436 223.5 408.5 339.3 -69.3<br />
(Change is calculated by whole numbers and numbers may not add up due to rounding)<br />
Note: For more detailed information regarding <strong>the</strong> proposed funding for <strong>the</strong> activities within this agency’s programs, please see Schedule 30-PBB<br />
Program Summary by Activity in <strong>the</strong> FY 2010 Operating Appendices located on <strong>the</strong> <strong>Office</strong> <strong>of</strong> <strong>the</strong> <strong>Chief</strong> <strong>Financial</strong> <strong>Office</strong>r’s website.<br />
Major Baseline Adjustments, Cost Savings<br />
and Policy Initiatives<br />
Initial Adjustment: The <strong>Office</strong> <strong>of</strong> <strong>the</strong> State<br />
Superintendent <strong>of</strong> Education (OSSE) reallocated<br />
$7,315,387 from nonpersonal services to personal<br />
services. This change is due to transfer <strong>of</strong> <strong>the</strong> Early<br />
Childhood Education Administration from <strong>the</strong><br />
Department <strong>of</strong> Human Services (DHS). Temporary<br />
Aid to Needy Families (TANF), federal funds that<br />
DHS had previously transferred into <strong>the</strong> Child Care<br />
Fund, allowed federal funds to support <strong>the</strong> program’s<br />
FTEs. DHS now allocates <strong>the</strong> TANF funds directly<br />
to child care services. Accordingly, OSSE adjusted its<br />
budget to fund <strong>the</strong> FTEs with local funds and child<br />
care services with federal grant funds, resulting in this<br />
change.<br />
FY 2010 Proposed <strong>Budget</strong> and <strong>Financial</strong> Plan<br />
D-40<br />
Cost Savings: OSSE will continue to be a strong state<br />
agency while reducing functions and contractual<br />
expenses more appropriately belonging to local education<br />
agencies. The reductions in OSSE’s FY 2010<br />
budget will allow it to focus on its primary mission as<br />
a state education agency overseeing federal programs<br />
and grants, setting state-level standards, ensuring that<br />
<strong>the</strong> state tracks accurate and reliable data, and assessing<br />
quality and compliance with state and federal law.<br />
OSSE will reduce mostly administrative staff in<br />
several units across <strong>the</strong> agency, resulting in a total savings<br />
<strong>of</strong> $4,493,000 and 52.0 FTEs. The primary staff<br />
reductions will be in <strong>the</strong> <strong>of</strong>fice <strong>of</strong> Business and<br />
Support Services, including a reduction <strong>of</strong> $818,000<br />
and 11.0 FTEs in <strong>the</strong> human resources, procurement<br />
and agency management functions. While OSSE<br />
maintained a robust internal unit for <strong>the</strong>se functions<br />
as it transitioned from <strong>the</strong> District <strong>of</strong> Columbia
Public Schools (DCPS) in FY 2008, <strong>the</strong> agency’s<br />
resources and mission are more closely aligned in FY<br />
2010. Nine vacant staff assistant and support positions<br />
are being eliminated in <strong>the</strong> Division <strong>of</strong> Early<br />
Childhood Education, and three vacant positions are<br />
being eliminated in <strong>the</strong> <strong>Office</strong> <strong>of</strong> <strong>the</strong> <strong>Chief</strong> <strong>Financial</strong><br />
<strong>Office</strong>r, resulting in a savings <strong>of</strong> $767,000. The<br />
remaining staff reductions align resources with <strong>the</strong><br />
agency’s strategic direction by eliminating management<br />
and staff positions and consolidating support<br />
positions within <strong>the</strong> elementary and secondary education<br />
management function, and reducing staff in<br />
<strong>the</strong> <strong>Office</strong> <strong>of</strong> <strong>the</strong> <strong>Chief</strong> Information <strong>Office</strong>r to<br />
achieve <strong>the</strong> appropriate information technology<br />
staffing level for <strong>the</strong> agency.<br />
The $1,547,000 in savings reflect OSSE’s<br />
increased focus on its state education responsibilities<br />
in FY 2010, including reducing funding for direct<br />
educational services more appropriately provided at<br />
<strong>the</strong> local school level, and eliminating funding for <strong>the</strong><br />
Adult Scholarship Fund. O<strong>the</strong>r efficiency savings in<br />
FY 2010 include delaying <strong>of</strong>fice furniture purchases<br />
and o<strong>the</strong>r non-essential equipment acquisitions,<br />
eliminating duplicative information technology contracts,<br />
and reducing funding for supplies, materials<br />
and travel. OSSE’s procurement assessment, fleet,<br />
occupancy, telecom and electricity budgets have also<br />
been decreased based on revised fixed cost estimates.<br />
Transfer: The State Board <strong>of</strong> Education activity in <strong>the</strong><br />
Superintendent’s <strong>Office</strong> program, comprised <strong>of</strong><br />
$547,000 and 12.0 FTEs is removed from <strong>the</strong> OSSE<br />
budget for FY 2010 to establish <strong>the</strong> State Board as a<br />
separate budget agency. For fur<strong>the</strong>r information,<br />
please refer to agency GE0, District <strong>of</strong> Columbia<br />
State Board <strong>of</strong> Education, in this volume.<br />
Protected Programs: The FY 2010 budget maintains<br />
full support for <strong>the</strong> implementation <strong>of</strong> <strong>the</strong> State<br />
Longitudinal Education Data System (SLED) to<br />
serve as a unified repository <strong>of</strong> data needed to<br />
improve education planning, management, reporting,<br />
instruction and evaluation. In FY 2010, <strong>the</strong><br />
SLED will enter Phase II <strong>of</strong> development and will<br />
begin to provide 360 Degree Student Data. Also protected<br />
in <strong>the</strong> FY 2010 budget are funds that allow <strong>the</strong><br />
OSSE to continue to implement a high quality Pre-<br />
K and early education program across <strong>the</strong> District.<br />
OSSE will increase monitoring programs and pro-<br />
viding technical assistance while holding providers<br />
accountable for implementing high quality content<br />
and meeting program standards.<br />
Policy Initiatives: OSSE will continue to support<br />
interventions that allow students with disabilities to<br />
receive an excellent education and life-skills training<br />
to become well-educated, independent, and productive<br />
members <strong>of</strong> <strong>the</strong> community. This commitment<br />
is reflected in <strong>the</strong> $3,500,000 increase in <strong>the</strong> FY 2010<br />
budget to continue support for timely processing <strong>of</strong><br />
special education services, and o<strong>the</strong>r special education<br />
reform efforts. OSSE will also continue to fund <strong>the</strong><br />
Incarcerated Youth Program at <strong>the</strong> D.C. Jail, which<br />
provides educational programs to juvenile inmates.<br />
During FY 2009, OSSE, DCPS, and <strong>the</strong><br />
Department <strong>of</strong> Corrections developed a strong program<br />
that helped <strong>the</strong> District become materially<br />
compliant with Settlement Agreement in <strong>the</strong> special<br />
education class action J.C. et al. v. Paul Vance, et al.<br />
This continued funding will ensure that this strong<br />
program continues to thrive in its second year <strong>of</strong><br />
implementation.<br />
An increase <strong>of</strong> $5,425,000 in Local funds has<br />
been appropriated to <strong>the</strong> “Pre-K and School<br />
Readiness” activity in <strong>the</strong> “Teaching and Learning”<br />
program, pursuant to implementation <strong>of</strong> <strong>the</strong> “Pre-K<br />
Enhancement and Expansion Act <strong>of</strong> 2008.” Of this<br />
amount, $2,400,000 is to be targeted for pre-kindergarten<br />
expansion among community-based organizations.<br />
An increase <strong>of</strong> $2,000,000 in one-time Local<br />
funds has been appropriated to fund an Adult and<br />
Family Education program, and $172,000 in onetime<br />
funds is appropriated for a grant to <strong>the</strong><br />
“EduSeed” organization to develop a pilot mentoring<br />
program to provide opportunities for young girls to<br />
break <strong>the</strong> cycle <strong>of</strong> low education achievement and<br />
poverty. All grantees and amounts listed in this budget<br />
are subject to final approval in <strong>the</strong> Fiscal Year 2010<br />
<strong>Budget</strong> Support Act <strong>of</strong> 2009, Bill Number 18-203,<br />
which supersedes this listing upon its effective date.<br />
Please Note: Pre-Kindergarten slots are also<br />
funded in <strong>the</strong> budgets <strong>of</strong> <strong>the</strong> District <strong>of</strong> Columbia<br />
Public Charter Schools (GC0) and District <strong>of</strong><br />
Columbia Public Schools (GA0). Please refer to<br />
those agency chapters in this volume for additional<br />
information.<br />
<strong>Office</strong> <strong>of</strong> <strong>the</strong> State Superintendent <strong>of</strong> Education<br />
D-41
Stimulus: As <strong>the</strong> State Education <strong>Agency</strong>, OSSE will<br />
be <strong>the</strong> direct recipient <strong>of</strong> much <strong>of</strong> <strong>the</strong> federal funding<br />
for education made available in <strong>the</strong> American<br />
Recovery and Reinvestment Act. OSSE will receive<br />
all Federal Grants under Title I <strong>of</strong> <strong>the</strong> Elementary and<br />
Secondary Education Act <strong>of</strong> 1965 and Individual<br />
with Disabilities Education Act (IDEA) grant funding<br />
and will be responsible for distributing <strong>the</strong>se funds<br />
through <strong>the</strong> existing formulas to District LEAs.<br />
O<strong>the</strong>r non-formula federal education dollars will be<br />
received and managed by OSSE. These funds<br />
include: Head Start and Early Head Start program<br />
funding, <strong>the</strong> Child Care Development Block Grant,<br />
and Education Technology State Grants. OSSE will<br />
have <strong>the</strong> additional responsibility <strong>of</strong> tracking and<br />
monitoring <strong>the</strong> use <strong>of</strong> <strong>the</strong>se funds and ensuring <strong>the</strong>y<br />
are spent for purposes consistent with both <strong>the</strong> Act<br />
and <strong>the</strong> underlying Federal law.<br />
Gap-Closing Initiatives: The <strong>Office</strong> <strong>of</strong> <strong>the</strong> State<br />
Superintendent <strong>of</strong> Education (OSSE) is meeting <strong>the</strong><br />
challenge <strong>of</strong> <strong>the</strong> FY 2010 budget, in part, by holding<br />
<strong>the</strong> adult and family education budget consistent with<br />
FY 2009 service levels, generating $2 million in savings.<br />
In addition, OSSE will generate $2.5 million in<br />
savings by eliminating 8 FTEs and holding 6 percent<br />
<strong>of</strong> remaining positions vacant throughout FY 2010.<br />
OSSE will also shift $1.5 million in charter school<br />
improvement funding to federal payment dollars carried<br />
over from previous fiscal years. Fur<strong>the</strong>r, OSSE<br />
will generate $424,368 in savings by reducing expenditures<br />
on computers, equipment, IT s<strong>of</strong>tware purchases,<br />
<strong>of</strong>fice supplies, printing, travel, employee<br />
training, advertising, and membership dues. Since<br />
<strong>the</strong> GEAR UP grant has ended, OSSE will eliminate<br />
<strong>the</strong> unnecessary local match <strong>of</strong> $278,000 and will<br />
eliminate <strong>the</strong> erroneously double-funded DC Learns<br />
grant for $112,500 in savings. Suspending employee<br />
compensation and step increases will generate<br />
ano<strong>the</strong>r $100,833 in savings. OSSE will shift<br />
$12,984 in pr<strong>of</strong>essional services for <strong>the</strong> Education<br />
Licensure Commission to Special Purpose Revenue<br />
funding to align <strong>the</strong> FY 2010 budget with <strong>the</strong> intent<br />
<strong>of</strong> <strong>the</strong> Public Education Reform Amendment Act <strong>of</strong><br />
2007. In fur<strong>the</strong>r efforts to reduce cost, OSSE will<br />
eliminate <strong>the</strong> non-competitive EduSeed Grants,<br />
$172,000, intended to develop pilot mentoring program<br />
for young girls. OSSE will also eliminate <strong>the</strong><br />
Transition Team activity that is no longer needed due<br />
FY 2010 Proposed <strong>Budget</strong> and <strong>Financial</strong> Plan<br />
D-42<br />
to <strong>the</strong> completed reorganization within <strong>the</strong> agency<br />
saving $254,786. Fur<strong>the</strong>r savings will be met by eliminating<br />
local funds increases in <strong>the</strong> activities for <strong>the</strong><br />
State Superintendent Support programs and Deputy<br />
Superintendent for Business Support totaling<br />
$1,672,820. Lastly, <strong>the</strong> Pre-K and School Readiness<br />
enhancement has been reduced by $2,176,355. Also,<br />
OSSE will intra-District $6,506,800 in State Fiscal<br />
Stabilization grant funding to <strong>the</strong> Department <strong>of</strong><br />
Housing and Community Development.<br />
The students <strong>of</strong> <strong>the</strong> District <strong>of</strong> Columbia Public<br />
Schools and District <strong>of</strong> Columbia Public Charter<br />
Schools will directly benefit from <strong>the</strong> funds made<br />
available for education through <strong>the</strong> American<br />
Recovery and Reinvestment Act (ARRA). The<br />
ARRA directs funding to local schools through <strong>the</strong><br />
existing formulas for both Title I and <strong>the</strong> Individuals<br />
With Disabilities Education Act (IDEA).<br />
The proposed budget anticipates that State Fiscal<br />
Stabilization funds will be distributed among LEAs,<br />
as required by <strong>the</strong> United States Department <strong>of</strong><br />
Education. Both OSSE and <strong>the</strong> U.S. Department <strong>of</strong><br />
Education will exercise oversight <strong>of</strong> <strong>the</strong> use <strong>of</strong> <strong>the</strong>se<br />
funds. As <strong>the</strong> agency that implements <strong>the</strong> State Fiscal<br />
Stabilization Fund program, <strong>the</strong> federal funds will be<br />
managed by <strong>the</strong> OSSE and are represented by an<br />
increase <strong>of</strong> $65,300,000 in <strong>the</strong> FY 2010 federal grants<br />
budget. OSSE will make <strong>the</strong> funding available to <strong>the</strong><br />
DCPS and DCPCS through <strong>the</strong> intra-District transfer<br />
described in each agency’s budget chapter.
FY 2009 Approved <strong>Budget</strong> to FY 2010 Proposed <strong>Budget</strong><br />
Table GD0-5 itemizes <strong>the</strong> changes by revenue type between <strong>the</strong> FY 2009 approved budget and <strong>the</strong> FY 2010 proposed<br />
budget. The four categories <strong>of</strong> changes reflected in this table are: (1) changes to <strong>the</strong> baseline budget (includes<br />
agency request), (2) changes representing cost savings or efficiencies, (3) changes related to policy initiatives, and (4)<br />
changes to specifically address <strong>the</strong> projected revenue shortfall.<br />
Table GD0-5<br />
(dollars in thousands)<br />
Program BUDGET FTE<br />
LOCAL FUND: FY 2009 Approved <strong>Budget</strong> and FTE 117,544 239.3<br />
Initial and Baseline Adjustments<br />
Net effect <strong>of</strong> salary and benefits changes - Changes due to FY 2009 Superintendent <strong>Office</strong> -624 0.0<br />
approved Reorganization<br />
Net effect <strong>of</strong> salary and benefits changes - Changes due to FY 2009 Deputy Super 1,296 13.3<br />
approved Reorganization Bus and Supp<br />
Net effect <strong>of</strong> salary and benefits changes - Changes due to FY 2009 Teaching and Learning 4,916 35.0<br />
approved Reorganization<br />
Net effect <strong>of</strong> salary and benefits changes - Changes due to FY 2009 <strong>Chief</strong> <strong>Financial</strong> <strong>Office</strong>r 1,434 19.0<br />
approved Reorganization and to manage <strong>the</strong> Non-Public Tuition agency<br />
Net effect <strong>of</strong> salary and benefits changes - Changes due to FY 2009 <strong>Chief</strong> Info <strong>Office</strong>r 1,504 9.0<br />
approved Reorganization and to Support <strong>the</strong> Non-Public Tuition agency<br />
and Special Education Transportation agency<br />
Net effect <strong>of</strong> salary and benefits changes - Changes due to FY 2009 Compliance -460 -3.0<br />
approved Reorganization<br />
Net effect <strong>of</strong> salary and benefits changes - Changes due to FY 2009 Plan, Perf and Public Engage -751 -8.0<br />
approved Reorganization - Discontinued use <strong>of</strong> program<br />
Intra-<strong>Agency</strong> changes - Changes due to FY 2009 approved Reorganization - AMP -125 0.0<br />
Discontinued use <strong>of</strong> program<br />
Intra-<strong>Agency</strong> changes - Changes due to FY 2009 approved Reorganization Superintendent <strong>Office</strong> 999 0.0<br />
Intra-<strong>Agency</strong> changes - Changes due to FY 2009 approved Reorganization Deputy Super - Bus and Support -7 0.0<br />
Intra-<strong>Agency</strong> changes - Changes due to FY 2009 approved Reorganization Teaching and Learning -7,706 0.0<br />
Intra-<strong>Agency</strong> changes - Changes due to FY 2009 approved Reorganization <strong>Chief</strong> <strong>Financial</strong> <strong>Office</strong>r -11 0.0<br />
Intra-<strong>Agency</strong> changes - Changes due to FY 2009 approved Reorganization <strong>Chief</strong> Information <strong>Office</strong>r -89 0.0<br />
Intra-<strong>Agency</strong> changes - Changes due to FY 2009 approved Reorganization Compliance -155 0.0<br />
Intra-<strong>Agency</strong> changes - Changes due to FY 2009 approved Reorganization Plan, Perf and Public -221 0.0<br />
Engage<br />
Baseline Adjustments: Baseline Adjustments: Net Effect <strong>of</strong> Fixed Cost Adj - Deputy Super - Bus and Support -286 0.0<br />
Energy Increase $296,662; Rent decrease, $568,781; Security decrease, $7,989;<br />
Fleet decrease, $6,237<br />
Baseline Adjustments: Baseline Adjustments: Net Effect <strong>of</strong> fixed cost Adj - Teaching and Learning 286 0.0<br />
Increase to program due to January fixed cost estimate decrease. Program<br />
was initially reduced in order to absord initial projected fixed cost increases<br />
(Continued on <strong>the</strong> next page)<br />
<strong>Office</strong> <strong>of</strong> <strong>the</strong> State Superintendent <strong>of</strong> Education<br />
D-43
Table GD0-5 (continued)<br />
(dollars in thousands)<br />
FY 2010 Proposed <strong>Budget</strong> and <strong>Financial</strong> Plan<br />
D-44<br />
Program BUDGET FTE<br />
Policy Initiatives and Cost Savings<br />
Transfer - Transfer State Board <strong>of</strong> Education to create new stand Superintendent <strong>Office</strong> -547 -12.0<br />
alone agency (GE0)<br />
Cost Increase - Align procurement assessment budget with revised OCP Deputy Super - Bus and Support 213 0.0<br />
estimates<br />
Increase - One-Time funding for a grant to EduSeed to develop a pilot Teaching and Learning 172 0.0<br />
program to break <strong>the</strong> cycle <strong>of</strong> low education achievement and poverty<br />
Increase - One-Time funding for Adult and Family Education Program Teaching and Learning 2,000 0.0<br />
Increase - Increase to Pre-K and School Readiness Teaching and Learning 5,425 0.0<br />
Cost Increase - Continue support for timely case closure process and Superintendent <strong>Office</strong> 3,500 0.0<br />
management <strong>of</strong> related services in <strong>the</strong> Blackman-Jones special education<br />
reform efforts<br />
Reduce - Reduce funding for supplies, materials, travel within <strong>the</strong> State Superintendent <strong>Office</strong> -213 0.0<br />
Superintendent's <strong>Office</strong><br />
Reduce - Reduce staff in <strong>the</strong> <strong>Office</strong> <strong>of</strong> <strong>the</strong> Superintendent to align staffing with Superintendent <strong>Office</strong> -386 -4.0<br />
<strong>the</strong> state level support functions <strong>of</strong> <strong>the</strong> agency<br />
Cost Decrease - Align electricity budget with revised OPM estimates Deputy Super - Bus and Support -9 0.0<br />
Cost Decrease - Align fleet budget with revised DPW estimates Deputy Super - Bus and Support -8 0.0<br />
Cost Decrease - Align occupancy budget with revised OPM estimates Deputy Super - Bus and Support -9 0.0<br />
Cost Decrease - Align telecom budget with revised OCTO estimates Deputy Super - Bus and Support -476 0.0<br />
Reduce - Delay <strong>of</strong>fice furniture purchases and o<strong>the</strong>r non-essential equipment Deputy Super - Bus and Support -684 0.0<br />
acquisitions<br />
Reduce - Reduce agency management and human resources staff in <strong>the</strong> <strong>Office</strong> Deputy Super - Bus and Support -818 -11.0<br />
<strong>of</strong> Business and Support Services to adequately support <strong>the</strong> agency's needs<br />
Transfer In - Increase allocation for rent <strong>of</strong> three properties occupied by Special Deputy Super - Bus and Support 215 0.0<br />
Education Transportaion (GO0)<br />
Transfer In - Increase funding for <strong>the</strong> land-line telecommunications charges for Deputy Super - Bus and Support 793 0.0<br />
properties occupied by Special Education Transportation<br />
Cost Decrease - Eliminate vacant staff assistant and support positions in <strong>the</strong> Teaching and Learning -516 -9.0<br />
Division <strong>of</strong> Early Childhood Education<br />
Cost Increase - Ensure adequate resources to support school improvement Teaching and Learning 1,500 0.0<br />
activities<br />
Cost Increase - Fund <strong>the</strong> full-year costs <strong>of</strong> <strong>the</strong> Incarcerated Youth Program at Teaching and Learning 400 0.0<br />
<strong>the</strong> D.C. Jail<br />
Reduce - Eliminate strategic management and staff assistant positions and Teaching and Learning -1,914 -19.0<br />
consolidate support positions within <strong>the</strong> elementary and secondary education<br />
management function<br />
Reduce - Reduce state level funding for direct educational services Teaching and Learning -303 0.0<br />
appropriately provided at <strong>the</strong> local school level<br />
Shift - Reduce <strong>the</strong> local budget in <strong>the</strong> <strong>Office</strong> <strong>of</strong> Special Education to reflect <strong>the</strong> Teaching and Learning -279 0.0<br />
alignment <strong>of</strong> positions shifting to Federal grant administrative funds<br />
Cost Decrease - Align budget to meet program needs <strong>Chief</strong> <strong>Financial</strong> <strong>Office</strong>r -64 0.0<br />
Reduce - Eliminate vacant positions in <strong>the</strong> <strong>Office</strong> <strong>of</strong> <strong>the</strong> <strong>Chief</strong> <strong>Financial</strong> <strong>Office</strong>r <strong>Chief</strong> <strong>Financial</strong> <strong>Office</strong>r -251 -3.0<br />
Reduce - Eliminate duplicate IT service contracts <strong>Chief</strong> Information <strong>Office</strong>r -340 0.0<br />
(Continued on <strong>the</strong> next page)
Table GD0-5 (continued)<br />
(dollars in thousands)<br />
Program BUDGET FTE<br />
Policy Initiatives and Cost Savings (continued)<br />
Reduce - Reduce staff in <strong>the</strong> <strong>Office</strong> <strong>of</strong> <strong>the</strong> <strong>Chief</strong> Information <strong>Office</strong>r to <strong>Chief</strong> Information <strong>Office</strong>r -608 -6.0<br />
achieve <strong>the</strong> appropriate IT staffing level for <strong>the</strong> agency<br />
Eliminate - Eliminate funding for <strong>the</strong> Adult Scholarship Fund Teaching and Learning -1,244 0.0<br />
Gap-Closing Initiatives<br />
Cost Decrease - Align PS <strong>Budget</strong> with historical spending & 6% vacancy A400-Teaching & Learning -956 0.0<br />
Reduction - Reduce alignment <strong>of</strong> Adult & Family Education budget A400-Teaching & Learning -2,000 0.0<br />
with 2009 service levels<br />
Cost Decrease - align PS <strong>Budget</strong> with historical spending & 6% vacancy A100- Superintendent <strong>Office</strong> -119 0.0<br />
Cost Decrease - Align PS <strong>Budget</strong> with historical spending & 6% vacancy A200-Dpty Super - Bus & Support -266 0.0<br />
Cost Decrease - Align PS <strong>Budget</strong> with historical spending & 6% vacancy A500-<strong>Chief</strong> <strong>Financial</strong> <strong>Office</strong>r -153 0.0<br />
Cost Decrease - Align PS <strong>Budget</strong> with historical spending & 6% vacancy A600-<strong>Chief</strong> Information <strong>Office</strong>r -232 0.0<br />
Cost Decrease - Align PS <strong>Budget</strong> with historical spending & 6% vacancy A800-Compliance -74 0.0<br />
Shift In Fund Type - Shift Charter School Improvement funds to Federal A400-Teaching & Learning -1,500 0.0<br />
Payment Carryover<br />
Eliminate - Locally funded and vacant FTEs A200-Dpty Super - Bus & Support -85 -1.0<br />
Eliminate - Locally funded and vacant FTEs A400-Teaching & Learning -514 -6.0<br />
Eliminate - locally funded and vacant FTEs A600-<strong>Chief</strong> Information <strong>Office</strong>r -100 -1.0<br />
Eliminate - Local Match for non-existent GEAR UP grant A400-Teaching & Learning -278 0.0<br />
Reduce - Computers, equipment & IT S<strong>of</strong>tware purchases A100- Superintendent <strong>Office</strong> -2 0.0<br />
Reduce - Computers, equipment & IT S<strong>of</strong>tware purchases A200-Dpty Super - Bus & Support -5 0.0<br />
Reduce - Computers, equipment & IT S<strong>of</strong>tware purchases A400-Teaching & Learning -57 0.0<br />
Reduce - Computers, equipment & IT S<strong>of</strong>tware purchases A500-<strong>Chief</strong> <strong>Financial</strong> <strong>Office</strong>r -2 0.0<br />
Reduce - Computers, equipment & IT S<strong>of</strong>tware purchases A600-<strong>Chief</strong> Information <strong>Office</strong>r -112 0.0<br />
Reduce - Computers, equipment & IT S<strong>of</strong>tware purchases A800-Compliance -5 0.0<br />
Reduce - General <strong>Office</strong> Supplies A100- Superintendent <strong>Office</strong> -23 0.0<br />
Reduce - General <strong>Office</strong> Supplies A200-Dpty Super - Bus & Support -10 0.0<br />
Reduce - General <strong>Office</strong> Supplies A400-Teaching & Learning -92 0.0<br />
Reduce - General <strong>Office</strong> Supplies A500-<strong>Chief</strong> <strong>Financial</strong> <strong>Office</strong>r -2 0.0<br />
Reduce - General <strong>Office</strong> Supplies A800-Compliance -3 0.0<br />
Eliminate - Erroneously duplicated budget for DC Learns grant A400-Teaching & Learning -113 0.0<br />
Reduce - Printing Services A100- Superintendent <strong>Office</strong> -6 0.0<br />
Reduce - Printing Services A400-Teaching & Learning -29 0.0<br />
Reduce - local and out <strong>of</strong> town travel A100- Superintendent <strong>Office</strong> -1 0.0<br />
Reduce - local and out <strong>of</strong> town travel A200-Dpty Super - Bus & Support -2 0.0<br />
Reduce - local and out <strong>of</strong> town travel A400-Teaching & Learning -22 0.0<br />
Reduce - local and out <strong>of</strong> town travel A600-<strong>Chief</strong> Information <strong>Office</strong>r -1 0.0<br />
Reduce - local and out <strong>of</strong> town travel A800-Compliance -2 0.0<br />
Reduce - Employee training A200-Dpty Super - Bus & Support -9 0.0<br />
Reduce - Employee training A400-Teaching & Learning -3 0.0<br />
Reduce - Employee training A600-<strong>Chief</strong> Information <strong>Office</strong>r -12 0.0<br />
Reduce - Advertising A400-Teaching & Learning -15 0.0<br />
Shift in Fund Type - Shift Pr<strong>of</strong>essional services for <strong>the</strong> Education A400-Teaching & Learning -13 0.0<br />
Licensure Commission to O-Type<br />
(Continued on <strong>the</strong> next page)<br />
<strong>Office</strong> <strong>of</strong> <strong>the</strong> State Superintendent <strong>of</strong> Education<br />
D-45
Table GD0-5 (continued)<br />
(dollars in thousands)<br />
FY 2010 Proposed <strong>Budget</strong> and <strong>Financial</strong> Plan<br />
D-46<br />
Program BUDGET FTE<br />
Gap-Closing Initiatives (continued)<br />
Reduce - Employee Membership Dues A100- Superintendent <strong>Office</strong> -3 0.0<br />
Reduce - Employee Membership Dues A200-Dpty Super - Bus & Support 0 0.0<br />
Reduce - Employee Membership Dues A400-Teaching & Learning -5 0.0<br />
Reduce - Employee Membership Dues A600-<strong>Chief</strong> Information <strong>Office</strong>r -1 0.0<br />
Reduce - Non Competitive Grants A400-Teaching & Learning -172 0.0<br />
Eliminate - Transition team - No longer needed due to completed reorganization. A100- Superintendent <strong>Office</strong> -255 -2.0<br />
Reduce - Reduce expenditure back to <strong>the</strong> FY2009 <strong>Budget</strong>ed Amount. A100- Superintendent <strong>Office</strong> -1,371 -3.0<br />
Reduce - Reduce expenditure back to <strong>the</strong> FY2009 <strong>Budget</strong>ed Amount. A200-Dpty Super - Bus & Support -302 -4.0<br />
Reduce - Pre-K and School Readiness Enhancement A400-Teaching & Learning -2,176 0.0<br />
LOCAL FUND: FY 2010 Proposed <strong>Budget</strong> and FTE 111,990 223.5<br />
SPECIAL PURPOSE REVENUE FUNDS: FY 2009 Approved <strong>Budget</strong> and FTE 10,567 0.0<br />
Initial and Baseline Adjustments<br />
Teacher Licensing and GED Testing – projected revenue increase and oversight Teaching and Learning 161 2.7<br />
SPECIAL PURPOSE REVENUE FUNDS: FY 2010 Proposed <strong>Budget</strong> and FTE 10,728 2.7<br />
FEDERAL PAYMENTS:: FY 2009 Approved <strong>Budget</strong> and FTE 55,100 19.0<br />
Initial and Baseline Adjustments<br />
Intra-<strong>Agency</strong> changes - Changes due to FY 2009 approved Reorganization - Edu Facilities and Partnerships -13,000 0.0<br />
Discontinued use <strong>of</strong> program<br />
Intra-<strong>Agency</strong> changes - Changes due to FY 2009 approved Reorganization Deputy Super - Bus and Sup 12,892 2.5<br />
Intra-<strong>Agency</strong> changes - Changes due to FY 2009 approved Reorganization <strong>Chief</strong> <strong>Financial</strong> <strong>Office</strong>r 108 0.0<br />
Tuition Assistance Grant (TAG) increase to match Federal Appropriation <strong>of</strong> Teaching and Learning 0 1.0<br />
$35.1 million<br />
Gap-Closing Initiatives<br />
Shift - Shift Charter School Improvement funds from Local to Federal<br />
Payment Carryover<br />
A200-Dpty Super - Bus & Support 1,500 0.0<br />
FEDERAL PAYMENTS: FY 2010 Proposed <strong>Budget</strong> and FTE 56,600 22.5<br />
FEDERAL GRANT FUNDS: FY 2009 Approved <strong>Budget</strong> and FTE<br />
Initial and Baseline Adjustments<br />
160,535 142.3<br />
Reduction in projected carryover and 25 percent reduction in grant awards<br />
that begin July 1, 2009. <strong>Budget</strong> will be adjusted through grant modification<br />
process to reflect actual carryover balances and actual grant awards<br />
Superintendent <strong>Office</strong> -921 -11.0<br />
Reduction in projected carryover and 25 percent reduction in grant awards<br />
that begin July 1, 2009. <strong>Budget</strong> will be adjusted through grant modification<br />
process to reflect actual carryover balances and actual grant awards<br />
Deputy Super - Bus and Sup -6,412 3.0<br />
Reduction in projected carryover and 25 percent reduction in grant awards<br />
that begin July 1, 2009. <strong>Budget</strong> will be adjusted through grant modification<br />
process to reflect actual carryover balances and actual grant awards<br />
Teaching and Learning -10,308 -33.7<br />
(Continued on <strong>the</strong> next page)
Table GD0-5 (continued)<br />
(dollars in thousands)<br />
Program BUDGET FTE<br />
FEDERAL GRANT FUNDS: Initial and Baseline Adjustments (continued)<br />
Reduction in projected carryover and 25 percent reduction in grant awards <strong>Chief</strong> <strong>Financial</strong> <strong>Office</strong>r -366 -6.0<br />
that begin July 1, 2009. <strong>Budget</strong> will be adjusted through grant modification<br />
process to reflect actual carryover balances and actual grant awards<br />
Reduction in projected carryover and 25 percent reduction in grant awards <strong>Chief</strong> Information <strong>Office</strong>r -123 0.0<br />
that begin July 1, 2009. <strong>Budget</strong> will be adjusted through grant modification<br />
process to reflect actual carryover balances and actual grant awards<br />
Policy Initiatives and Cost Savings<br />
Enhance - Increased funding through <strong>the</strong> American Reinvestment and Superintendent <strong>Office</strong> 1,605 0.0<br />
Recovery Act to improve student achievement through <strong>the</strong> use <strong>of</strong><br />
technology in elementary and secondary schools<br />
Enhance - Add American Reinvestment and Recovery funds for Title I Teaching and Learning 18,801 0.0<br />
Enhance - Increase funding through <strong>the</strong> American Reinvestment and Teaching and Learning 1,088 0.0<br />
Recovery Act for Head Start and Early Head Start Programs<br />
Enhance - Increase funding through <strong>the</strong> Child Care Development Block Teaching and Learning 1,343 0.0<br />
Grant to provide increased assistance to child care and <strong>the</strong><br />
improvement <strong>of</strong> child care quality<br />
Enhance - Add American Recovery and Reinvestment Act funds to Teaching and Learning 130 0.0<br />
IDEA Part B (619)<br />
Enhance - Add American Reinvestment and Recovery Act funds Teaching and Learning 8,221 0.0<br />
to IDEA Part B (611)<br />
Reduce - Realign staffing in <strong>the</strong> <strong>Office</strong> <strong>of</strong> State Complaints Teaching and Learning -279 -4.0<br />
Shift - Maximize agency performance by aligning special education Teaching and Learning 279 0.0<br />
federal grant dollars with allowable purposes<br />
Gap-Closing Initiatives<br />
Expand - - Expand use <strong>of</strong> American Recovery Reinvestment Act State<br />
Stabilization Funds in FY2010.<br />
A100- Superintendent <strong>Office</strong> 35,900 0.0<br />
Increase - State Stabilization Funding that will be provided to <strong>the</strong><br />
Department <strong>of</strong> Housing and Community Development via intra-District<br />
A100- Superintendent <strong>Office</strong> 6,500 0.0<br />
Shift - - Reclassify State Stabilization Fund resources as Federal<br />
Grant from DCPS<br />
A100- Superintendent <strong>Office</strong> 29,400 0.0<br />
FEDERAL GRANT FUND: FY 2010 Proposed <strong>Budget</strong> and FTE 245,394 90.6<br />
INTRA-DISTRICT FUNDS: FY 2009 Approved <strong>Budget</strong> and FTE<br />
Initial and Baseline Adjustments<br />
44,962 8.0<br />
Elimination <strong>of</strong> Pre-Kindergarten incentive MOU with DCPS. Program<br />
now in OSSE local funds<br />
Teaching and Learning -4,407 -7.0<br />
Elimination <strong>of</strong> MOU with DHS to fund an accountant position for ECEA <strong>Chief</strong> <strong>Financial</strong> <strong>Office</strong>r -122 -1.0<br />
INTRA-DISTRICT FUNDS: FY 2010 Proposed <strong>Budget</strong> and FTE 40,432 0.0<br />
Gross for GD0 - <strong>Office</strong> <strong>of</strong> <strong>the</strong> Superintendent <strong>of</strong> Education 465,144 339.3<br />
<strong>Office</strong> <strong>of</strong> <strong>the</strong> State Superintendent <strong>of</strong> Education<br />
D-47
<strong>Agency</strong> Performance Plan<br />
The agency’s Performance Plan has <strong>the</strong> following<br />
objectives for FY 2010:<br />
Objective 1: Improve <strong>the</strong> timeliness and accuracy <strong>of</strong><br />
special education information, as well as to monitor<br />
due process complaints, hearings, hearing <strong>of</strong>ficer decisions,<br />
and settlement agreements and <strong>the</strong>ir implementation.<br />
Objective 2: Reform processes and procedures related<br />
to <strong>the</strong> management <strong>of</strong> Federal Grants to ensure<br />
continued and increased access to federal resources<br />
and initiatives to improve education.<br />
Objective 3: Implement a statewide longitudinal data<br />
system (SLED) to serve as a unified repository <strong>of</strong> data<br />
needed to improve education planning, management,<br />
reporting, instruction and evaluation.<br />
FY 2010 Proposed <strong>Budget</strong> and <strong>Financial</strong> Plan<br />
D-48<br />
Objective 4: All District <strong>of</strong> Columbia children will<br />
be prepared for school.<br />
Objective 5: All District <strong>of</strong> Columbia students will<br />
receive an excellent education that prepares <strong>the</strong>m for<br />
success in college, careers and life. Pursuant to <strong>the</strong> No<br />
Child Left Behind (NCLB) Act <strong>of</strong> 2001, OSSE will<br />
develop content and achievement standards and<br />
ensure that schools and LEAs meet <strong>the</strong>se standards<br />
through a robust system <strong>of</strong> assessment and accountability.<br />
OSSE will also ensure public education consumers<br />
are provided with all <strong>the</strong> necessary information<br />
needed to make informed educational decisions.<br />
Objective 6: All District <strong>of</strong> Columbia residents will<br />
be successful in <strong>the</strong> 21st century economy.
<strong>Agency</strong> Performance Measures<br />
Table GD0-6<br />
FY 2007 FY 2008 FY 2008<br />
Year-End Original Year-End FY 2009 FY 2010 FY 2011<br />
Measure<br />
Objective 1:<br />
Actual* Target Actual Projection Projection Projection<br />
Percentage <strong>of</strong> providers meeting national Available<br />
accreditation standards 35.4% 40% Dec. 1 45% 50% 55%<br />
Percentage <strong>of</strong> Pre-K classrooms deemed exemplary New New<br />
according to <strong>the</strong> program quality report card<br />
Objective 2:<br />
Measure Measure 75% 77% 80% 84%<br />
Percent <strong>of</strong> students graduating from high school +5 +5<br />
within four years *The OSSE is in <strong>the</strong> process <strong>of</strong> Establish Percentage Percentage*<br />
adopting <strong>the</strong> National Governors’ Association’s new points over points over<br />
graduation rate calculation methodology N/A N/A 67% baseline* previous previous<br />
points over previous year<br />
Percent <strong>of</strong> LEAs making progress under NCLB<br />
year year<br />
regulations<br />
Percent <strong>of</strong> elementary students scoring pr<strong>of</strong>icient or<br />
N/A N/A 34% 45% 56% 67%<br />
above on DC-CAS English Language Arts Assessment<br />
Percent <strong>of</strong> elementary students scoring pr<strong>of</strong>icient or<br />
N/A N/A 45.5% 60.53% 73.69% 73.69%<br />
above on DC-CAS Math Assessment<br />
Percent <strong>of</strong> secondary students scoring pr<strong>of</strong>icient or<br />
N/A N/A 40.7% 55.21% 70.14% 70.14%<br />
above on DC-CAS Math Assessment N/A N/A 40.90% 55.41% 70.27% 70.27%<br />
Percent <strong>of</strong> fourth-grade students scoring at or Test administered<br />
above pr<strong>of</strong>icient on <strong>the</strong> NAEP Reading Assessment 18 every two years 26 N/A 34<br />
Percent <strong>of</strong> fourth-grade students scoring at or Test administered<br />
above pr<strong>of</strong>icient on <strong>the</strong> NAEP Math Assessment 17 every two years 25 N/A 33<br />
Percent <strong>of</strong> eighth-grade students scoring at or Test administered<br />
above pr<strong>of</strong>icient on <strong>the</strong> NAEP Reading Assessment 13 every two years 21 N/A 29<br />
Percent <strong>of</strong> eighth-grade students scoring at or above Test administered<br />
pr<strong>of</strong>icient on <strong>the</strong> NAEP Math Assessment<br />
Percent <strong>of</strong> core courses taught by highly qualified<br />
9 every two years 17 N/A 25<br />
teachers<br />
Percent <strong>of</strong> appropriately licensed teachers<br />
*DCPS only – current regulations do not apply to<br />
N/A N/A 57.8% 100% 100% 100%<br />
charter schools<br />
Percent <strong>of</strong> appropriately licensed principals and<br />
assistant principals<br />
N/A N/A 85% 88% 91% 94%<br />
*DCPS only – current regulations do not apply New Establish +5 +5<br />
to charter schools N/A N/A measure baseline percentage percentage<br />
points over points over<br />
(Continued on next page)<br />
previous year previous year<br />
<strong>Office</strong> <strong>of</strong> <strong>the</strong> State Superintendent <strong>of</strong> Education<br />
D-49
<strong>Agency</strong> Performance Measures<br />
Table GD0-6 (cont)<br />
FY 2007 FY 2008 FY 2008<br />
Year-End Original Year-End FY 2009 FY 2010 FY 2011<br />
Measure<br />
Objective 2 (cont)<br />
Percent <strong>of</strong> public charter schools making adequate<br />
Actual* Target Actual Projection Projection Projection<br />
yearly progress<br />
Objective 3:<br />
Percent <strong>of</strong> DC residents holding, at minimum, a<br />
GED according to <strong>the</strong> annual US Census Bureau’s<br />
N/A N/A 27% 39% 51% 63%<br />
American Community Survey<br />
Percent <strong>of</strong> adult learners served by <strong>the</strong> OSSE-funded<br />
community-based Adult and Family Education<br />
programs who were both pre- and post-tested, and<br />
received <strong>the</strong> requisite minimum 12 hours <strong>of</strong><br />
N/A N/A 86.18% 87.18% 88.18% 89.18%<br />
instruction that advanced at minimum one functional Available<br />
literacy level 78.73% 82.0% Oct. 1 85% 88% 91%<br />
Objective 4:<br />
Percent <strong>of</strong> districts wherein children with disabilities Available<br />
are meeting <strong>the</strong> state’s AYP targets.<br />
Additional Measure for FY 2010<br />
Number <strong>of</strong> Pre-K program Technical Assistance and<br />
16% 27% Oct. 1 38% 49% 60%<br />
Higher Education Incentive Program grants awarded. N/A N/A N/A N/A TBD TBD<br />
FY 2010 Proposed <strong>Budget</strong> and <strong>Financial</strong> Plan<br />
D-50
District <strong>of</strong> Columbia Public Charter<br />
Schools<br />
www.dcpubliccharter.com<br />
Telephone: 202-328-2660<br />
The District <strong>of</strong> Columbia Public Charter School<br />
Board is authorized to grant charters. Each charter<br />
school is a private, non-pr<strong>of</strong>it corporation. This<br />
agency includes <strong>the</strong> District <strong>of</strong> Columbia appropriations<br />
to <strong>the</strong> DCPCS system. Payments from this<br />
agency to individual charter schools are made quar-<br />
(GC0)<br />
% Change<br />
FY 2008 FY 2009 FY 2010 from<br />
Description Actual Approved Proposed FY 2009<br />
Operating <strong>Budget</strong> $316,674,983 $366,052,576 $405,957,822 10.9<br />
The mission <strong>of</strong> <strong>the</strong> District <strong>of</strong> Columbia Public Charter Schools<br />
(DCPCS) is to provide an alternative free education for students who<br />
reside in <strong>the</strong> District <strong>of</strong> Columbia.<br />
terly on <strong>the</strong> basis <strong>of</strong> enrollment as set forth in <strong>the</strong><br />
District <strong>of</strong> Columbia Official Code, Section 38-<br />
2906.02.<br />
The agency’s FY 2010 proposed budget is presented<br />
in <strong>the</strong> following tables:<br />
District <strong>of</strong> Columbia Public Charter Schools<br />
D-51
FY 2010 Proposed Gross Funds Operating <strong>Budget</strong>, by Revenue Type<br />
Table GC0-1 contains <strong>the</strong> proposed FY 2010 agency budget compared to <strong>the</strong> FY 2009 approved budget. It also<br />
provides FY 2007 and FY 2008 actual expenditures.<br />
Table GC0-1<br />
(dollars in thousands)<br />
Actual Actual Approved Proposed<br />
Change<br />
from Percent<br />
Appropriated Fund<br />
General Fund<br />
FY 2007 FY 2008 FY 2009 FY 2010 FY 2009 Change*<br />
Local Funds 277,159 316,675 366,053 373,969 7,916 2.2<br />
Total for General Fund 277,159 316,675 366,053 373,969 7,916 2.2<br />
Intra-District Funds<br />
Intra-District Funds 0 0 0 31,989 31,989 N/A<br />
Total for Intra-District Funds 0 0 0 31,989 31,989 N/A<br />
Gross Funds 277,159 316,675 366,053 405,958 39,905 10.9<br />
*Percent Change is based on whole dollars.<br />
Note: If applicable, for a breakdown <strong>of</strong> each Grant (Federal and Private), Special Purpose Revenue type and Intra-District agreement,<br />
please refer to Schedule 80 <strong>Agency</strong> Summary by Revenue Source in <strong>the</strong> Operating Appendices located on <strong>the</strong> <strong>Office</strong> <strong>of</strong> <strong>the</strong> <strong>Chief</strong><br />
<strong>Financial</strong> <strong>Office</strong>r’s website.<br />
FY 2010 Proposed Operating <strong>Budget</strong>, by Comptroller Source Group<br />
Table GC0-2 contains <strong>the</strong> proposed FY 2010 budget at <strong>the</strong> Comptroller Source Group (object class) level compared<br />
to <strong>the</strong> FY 2009 approved budget. It also provides FY 2007 and FY 2008 actual expenditures.<br />
Table GC0-2<br />
(dollars in thousands)<br />
Actual Actual Approved Proposed<br />
Change<br />
from Percent<br />
Comptroller Source Group FY 2007 FY 2008 FY 2009 FY 2010 FY 2009 Change*<br />
50 Subsidies and Transfers 277,159 316,675 366,053 405,958 39,905 10.9<br />
Subtotal Nonpersonal Services (NPS) 277,159 316,675 366,053 405,958 39,905 10.9<br />
Gross Funds 277,159 316,675 366,053 405,958 39,905 10.9<br />
*Percent Change is based on whole dollars.<br />
Program Description<br />
Public charter schools in <strong>the</strong> District <strong>of</strong> Columbia are<br />
authorized under <strong>the</strong> provisions <strong>of</strong> law set forth in<br />
Division VI, Title 38, Subtitle IV, Chapter 17 <strong>of</strong> <strong>the</strong><br />
District <strong>of</strong> Columbia Official Code (2001 edition).<br />
Public charter schools are private non-pr<strong>of</strong>it corporations<br />
that operate under <strong>the</strong> terms and conditions<br />
set forth in <strong>the</strong>ir charter as approved by <strong>the</strong><br />
FY 2010 Proposed <strong>Budget</strong> and <strong>Financial</strong> Plan<br />
D-52<br />
District <strong>of</strong> Columbia Public Charter School Board,<br />
<strong>the</strong> chartering authority. The public charter schools<br />
are autonomous, nonsectarian institutions that cannot<br />
charge tuition to District resident students.<br />
Additionally, public charter schools cannot impose<br />
discriminatory admissions policies or tests on District<br />
resident students.<br />
Public charter schools receive <strong>the</strong> same level <strong>of</strong><br />
District funding pursuant to <strong>the</strong> District’s Uniform
Per Student Funding Formula (refer to District <strong>of</strong><br />
Columbia Official Code Section 38-29) for <strong>the</strong>ir<br />
enrolled students as students enrolled in <strong>the</strong> District<br />
<strong>of</strong> Columbia Public Schools. Public charter schools<br />
also receive a facilities allowance to maintain and<br />
operate <strong>the</strong>ir buildings. In addition to D.C. government<br />
funding, public charter schools are eligible to<br />
receive federal and private grants and may engage in<br />
private fund-raising.<br />
The District <strong>of</strong> Columbia Public Charter Schools<br />
operate under <strong>the</strong>se goals:<br />
■ Public charter schools will abide by <strong>the</strong> provisions<br />
set forth in <strong>the</strong>ir individual charters;<br />
■ Individual public charter schools will comply with<br />
all reporting requirements set forth by <strong>the</strong> chartering<br />
authority;<br />
FY 2010 Proposed Operating <strong>Budget</strong> and FTEs, by Program and Activity<br />
■ Public charter schools will provide students with<br />
exposure to career pathways and focus on particular<br />
areas <strong>of</strong> study to fur<strong>the</strong>r enhance students'<br />
academic experiences;<br />
■ Public charter schools will meet all academic performance<br />
goals set forth in <strong>the</strong>ir individual charter<br />
agreements; and<br />
■ The chartering authority will monitor and evaluate<br />
performance <strong>of</strong> public charter schools based<br />
on <strong>the</strong> provisions set forth in each school's charter.<br />
Program Structure Change<br />
D.C. Public Charter Schools had no program structure<br />
changes in <strong>the</strong> FY 2010 Proposed <strong>Budget</strong>.<br />
Table GC0-3 contains <strong>the</strong> proposed FY 2010 budget by program and activity compared to <strong>the</strong> FY 2009 approved budget.<br />
It also provides FY 2008 actual data.<br />
Table GC0-3<br />
(dollars in thousands)<br />
Dollars in Thousands Full-Time Equivalents<br />
Change Change<br />
Actual Approved Proposed from Actual Approved Proposed from<br />
Program/Activity<br />
(1000) DC Charter Schools<br />
FY 2008 FY 2009 FY 2010 FY 2009 FY 2008 FY 2009 FY 2010 FY 2009<br />
(1001) Administrative Expense* 100 0 7,385 7,385 0.0 0.0 0.0 0.0<br />
(1100) DC Charter Schools 316,575 366,053 398,573 32,520 0.0 0.0 0.0 0.0<br />
Subtotal (1000) DC Charter Schools 316,675 366,053 405,958 39,905 0.0 0.0 0.0 0.0<br />
Total Proposed Operating <strong>Budget</strong> 316,675 366,053 405,958 39,905 0.0 0.0 0.0 0.0<br />
(Change is calculated by whole numbers and numbers may not add up due to rounding)<br />
*For FY 2010, this budget line represents funds from <strong>the</strong> Federal American Recovery and Reinvestment Act <strong>of</strong> 2009 that will be allocated to <strong>the</strong><br />
Public Charter Schools.<br />
Note: For more detailed information regarding <strong>the</strong> proposed funding for <strong>the</strong> activities within this agency’s programs, please see Schedule 30-PBB<br />
Program Summary by Activity in <strong>the</strong> FY 2010 Operating Appendices located on <strong>the</strong> <strong>Office</strong> <strong>of</strong> <strong>the</strong> <strong>Chief</strong> <strong>Financial</strong> <strong>Office</strong>r’s website.<br />
District <strong>of</strong> Columbia Public Charter Schools<br />
D-53
Major Baseline Adjustments, Cost Savings<br />
and Policy Initiatives<br />
Initial Adjustments: An increase <strong>of</strong> $29,202,103 in<br />
Local funds for a 4.0 percent increase in <strong>the</strong> base<br />
foundation amount for <strong>the</strong> Uniform Per Student<br />
Funding Formula (UPSFF) and a projected increase<br />
in enrollment.<br />
Baseline Adjustments: An increase <strong>of</strong> $28,690,977 in<br />
Local funds to adjust <strong>the</strong> FY 2010 budgeted enrollment.<br />
The adjustment factor for proposed enrollment<br />
for FY 2010 was based on <strong>the</strong> net effects <strong>of</strong>: (1) <strong>the</strong><br />
multi-year historical trend <strong>of</strong> growth in system-wide<br />
enrollment, factoring in any schools that are at <strong>the</strong>ir<br />
charter’s enrollment cap; (2) absorption <strong>of</strong> <strong>the</strong> enrollment<br />
<strong>of</strong> <strong>the</strong> Center City Public Charter School,<br />
which was approved for opening after <strong>the</strong> FY 2009<br />
budget was developed and was not included in <strong>the</strong> FY<br />
2009 approved budget; (3) <strong>the</strong> enrollment for one<br />
new charter schools scheduled to be opened for FY<br />
2010; and (4) an <strong>of</strong>fset representing a charter school<br />
that closed during February 2009 that has been<br />
removed from <strong>the</strong> FY 2010 proposed budget.<br />
Protected Programs: The proposed FY 2010 budget<br />
for <strong>the</strong> D.C. Public Charter Schools (DCPCS) is built<br />
through a combination <strong>of</strong> a modest increase to <strong>the</strong><br />
UPSFF, an adjustment to weights supporting students<br />
with <strong>the</strong> most acute special needs, and enhanced<br />
funding made available through <strong>the</strong> American<br />
Recovery and Reinvestment Act <strong>of</strong> 2009. The<br />
DCPCS local operating budget has been reduced by<br />
$2,578,261 as a result <strong>of</strong> an adjustment to <strong>the</strong> UPSFF<br />
to reflect a 2 percent increase in <strong>the</strong> foundation level.<br />
Each public charter Local Education <strong>Agency</strong> (LEA)<br />
receives its UPSFF funding directly from <strong>the</strong> <strong>Office</strong> <strong>of</strong><br />
<strong>the</strong> <strong>Chief</strong> <strong>Financial</strong> <strong>Office</strong>r.<br />
The District <strong>of</strong> Columbia’s public schools receive<br />
Local funding through <strong>the</strong> UPSFF. This system <strong>of</strong><br />
funding was established by <strong>the</strong> District <strong>of</strong> Columbia<br />
School Reform Act <strong>of</strong> 1995 and was designed to<br />
ensure that all public schools across <strong>the</strong> District<br />
received <strong>the</strong> same level <strong>of</strong> funding on a per student<br />
basis, regardless <strong>of</strong> what neighborhood <strong>the</strong> school is in<br />
or where students live. This formula is derived from a<br />
“market basket” <strong>of</strong> goods and services determined by<br />
analysis that uses local, regional and national education<br />
funding research and practices to develop a foun-<br />
FY 2010 Proposed <strong>Budget</strong> and <strong>Financial</strong> Plan<br />
D-54<br />
dation. There are no adjustments to <strong>the</strong> contents <strong>of</strong><br />
<strong>the</strong> “market basket” for fiscal year 2010. The UPSFF<br />
is intended to cover all local education agency operational<br />
costs for District public schools which include:<br />
school-based instruction, student classroom support,<br />
utilities, administration, and instructional support<br />
such as curriculum and testing. The UPSFF is based<br />
on a “foundation” amount which is <strong>the</strong>n enhanced<br />
according to different weights for higher cost grade<br />
levels and supplemental funding weights for students<br />
with special needs.<br />
The FY 2010 proposed budget and <strong>Budget</strong> Support<br />
Act maintain <strong>the</strong> foundation level for <strong>the</strong> Uniform Per<br />
Student funding Formula (UPSFF) at <strong>the</strong> fiscal year<br />
2009 level <strong>of</strong> $8,770 per student.<br />
Policy Initiatives: Research and practice demonstrate<br />
that supplemental funding is required to provide<br />
appropriate educational services to students with special<br />
needs, consistent with best practices and federal<br />
law. All public schools must strive to serve students<br />
with different levels <strong>of</strong> special needs in neighborhood<br />
classrooms. To meet this challenge and provide <strong>the</strong><br />
appropriate resources to all public schools for students<br />
with <strong>the</strong> highest levels <strong>of</strong> special needs, <strong>the</strong> proposed<br />
budget supports an increase in supplemental weights<br />
for <strong>the</strong> most seriously challenged special education<br />
students. These students are categorized as Level 3<br />
and Level 4 students, and <strong>the</strong> UPSFF supports an<br />
increase to Level 3 <strong>of</strong> .20 and to Level 4 <strong>of</strong> .46. This<br />
represents total funding <strong>of</strong> $19,482,818 for students<br />
with <strong>the</strong> greatest needs in attending public charter<br />
LEAs.<br />
Supplemental funding is provided through<br />
increased weights for students who are designated<br />
limited or non-English pr<strong>of</strong>icient (LEP/NEP). The<br />
number <strong>of</strong> English language learners in <strong>the</strong> District is<br />
steadily increasing and <strong>the</strong>re are increased costs associated<br />
with ensuring adequate resources to ensure academic<br />
achievement among this population. Because<br />
funding for this population has not increased since<br />
1996, <strong>the</strong> FY 2010 budget and <strong>Budget</strong> Support Act<br />
propose an increase to <strong>the</strong> LEP/NEP weight by 0.05.<br />
This will provide an additional $3,947 per student in<br />
<strong>the</strong>se categories representing total funding<br />
$7,069,207 to be distributed proportionally among<br />
charter LEAs.
Cost Savings: Concerns have been raised in recent<br />
years that <strong>the</strong> per capita facilities allotment for nonresidential<br />
charter school students does not align <strong>the</strong><br />
facilities allotment to actual facilities costs for each<br />
individual charter school. This issue is complex and<br />
requires a detailed study. Accordingly, during FY<br />
2010, a Charter Facilites Task Force will be formed to<br />
prepare a plan to better define and administer <strong>the</strong><br />
facilities allotment beginning in FY 2011. The goal<br />
<strong>of</strong> <strong>the</strong> Task Force will be to present a plan that better<br />
aligns <strong>the</strong> facilities funding to actual facilities costs <strong>of</strong><br />
each charter school.<br />
In <strong>the</strong> interim, for FY 2010, <strong>the</strong> facilities allotment<br />
for non-residential students will be $2,800 per<br />
student, a decrease <strong>of</strong> $309 per student from <strong>the</strong> FY<br />
2009 approved budget. The facilities allotment for<br />
residential charter school students will remain $8,395<br />
per student, a level unchanged from FY 2009. These<br />
amounts were determined after consultation with<br />
representatives from charter schools and <strong>the</strong> D.C.<br />
Public Charter School Board as a short-term solution<br />
while <strong>the</strong> Charter Facilities Task Force study is underway.<br />
Addionally, an internal reallocation <strong>of</strong> <strong>the</strong> budget<br />
was made to reflect changes resulting from <strong>the</strong> closure<br />
<strong>of</strong> a charter school and cancellation <strong>of</strong> a planned<br />
school that were included in <strong>the</strong> FY 2010 baseline<br />
budget.<br />
Background - Establishment <strong>of</strong> <strong>the</strong> Charter School<br />
Facility Allotment: A thriving public charter school<br />
community is an integral part <strong>of</strong> <strong>the</strong> District’s educational<br />
landscape. At <strong>the</strong> start <strong>of</strong> <strong>the</strong> 2008-2009 school<br />
year, <strong>the</strong>re were 60 charter schools on 96 campuses<br />
across <strong>the</strong> District. Serving over 25,000 students, <strong>the</strong><br />
public charter school community is relatively transient<br />
in nature. Many schools lease space on a shortterm<br />
basis and move into larger facilities as <strong>the</strong>y grow.<br />
It is not unusual to have a school move location multiple<br />
times over a few years. For this reason, facilities<br />
costs fluctuate from school to school and depend<br />
heavily on where <strong>the</strong>y are in <strong>the</strong>ir growth process.<br />
The Council <strong>of</strong> <strong>the</strong> District <strong>of</strong> Columbia first<br />
authorized an additional payment for facilities related<br />
costs for public charter schools in 1998. The allotment<br />
has historically been funded on a per-pupil<br />
basis, calculated on a rolling average <strong>of</strong> <strong>the</strong> prior five<br />
years. This averaging system was designed to increase<br />
<strong>the</strong> capital funding availability for public charter<br />
schools at a pace on par with <strong>the</strong> capital budget made<br />
available for District <strong>of</strong> Columbia Public Schools.<br />
The only weight considered in calculating <strong>the</strong> allotment<br />
is for residential schools. In this case, <strong>the</strong> allotment<br />
amount is multiplied by 2.7 for those students<br />
in residence at <strong>the</strong> school. The charter school facility<br />
allotment was intended to support <strong>the</strong> acquisition,<br />
financing and improvements <strong>of</strong> facilities, but through<br />
<strong>the</strong> FY 2009 budget <strong>the</strong>re have been no reporting<br />
requirements or restrictions on <strong>the</strong> use <strong>of</strong> this funding.<br />
While largely attributable to <strong>the</strong> lack <strong>of</strong> guidelines<br />
provided by <strong>the</strong> District on how schools should<br />
use this money, this structure does not ensure that <strong>the</strong><br />
local District funding is being used on actual facility<br />
expenditures as intended.<br />
Since <strong>the</strong> Facilities Allotment was established in<br />
FY 1999 at $617 per student, it has grown over 400<br />
percent to <strong>the</strong> FY 2009 level <strong>of</strong> $3,109 per student.<br />
Previously, <strong>the</strong> Facilities Allotment was never adjusted<br />
to match charter schools’ actual facility costs.<br />
While most states where charter schools thrive <strong>of</strong>fer<br />
additional support for facilities, only 11 jurisdictions<br />
(including <strong>the</strong> District) <strong>of</strong>fer payment on a per pupil<br />
basis. No o<strong>the</strong>r jurisdiction does so without some<br />
type <strong>of</strong> guideline and regulation.<br />
Additional Resources Available for Facilities to Charter<br />
Schools: The FY 2010 <strong>Budget</strong> continues support for<br />
several existing financial programs that support <strong>the</strong><br />
unique facility needs <strong>of</strong> <strong>the</strong> public charter school<br />
community. The <strong>Office</strong> <strong>of</strong> <strong>the</strong> State Superintendent<br />
<strong>of</strong> Education manages five programs designed to provide<br />
financial support for charter schools facility<br />
needs. In addition to <strong>the</strong>se programs, <strong>the</strong> District will<br />
use funds from <strong>the</strong> Federal Payment for School<br />
Improvement to fur<strong>the</strong>r support unmet charter<br />
school facilities needs.<br />
Credit Enhancement Fund<br />
■ The Credit Enhancement fund provides support<br />
for public charter schools in <strong>the</strong> form <strong>of</strong> loan<br />
guarantees, collateral, lease guarantees, debt service<br />
reserves, and o<strong>the</strong>r financing assistance. For<br />
FY 2010, <strong>the</strong> Credit Enhancement Fund will<br />
have a total fund balance <strong>of</strong> approximately $22<br />
million, <strong>of</strong> which up to $10 million may be available<br />
for new transactions (pending actual FY<br />
2009 activity).<br />
■ Direct Loan Fund: The Direct Loan fund pro-<br />
District <strong>of</strong> Columbia Public Charter Schools<br />
D-55
vides loans to public charter schools for acquisition,<br />
construction, renovation, tenant improvements,<br />
and maintenance <strong>of</strong> public charter school<br />
facilities. For FY 2010, <strong>the</strong> Direct Loan Fund will<br />
have a total fund balance <strong>of</strong> $32 million, <strong>of</strong> which<br />
up to $14 million may be available for new transactions<br />
(pending FY 2009 actual activity).<br />
■ Facilities Incentive Grants: The State Charter<br />
School Facilities Incentive Grant is a competitive<br />
grant from <strong>the</strong> U.S. Department <strong>of</strong> Education<br />
that provides additional per-pupil facilities aid to<br />
schools serving a majority <strong>of</strong> students at <strong>the</strong><br />
poverty level. Sub-grants are also available for<br />
facility planning and direct facility project costs.<br />
The District was one <strong>of</strong> four states to receive this<br />
five-year grant in 2005. For FY 2010, up to $1.27<br />
million may be available for this grant, although<br />
OSSE may hold an application competition during<br />
<strong>the</strong> 4th quarter <strong>of</strong> FY 2009.<br />
■ City Build Grants: The City Build Program is a<br />
joint education and neighborhood development<br />
initiative that promotes community revitalization<br />
with a particular emphasis on streng<strong>the</strong>ning public<br />
education, through public charter schools. The<br />
aim <strong>of</strong> City Build stretches beyond excellence in<br />
academics; it also focuses on encouraging <strong>the</strong> creation<br />
<strong>of</strong> partnerships between public charter<br />
schools and community organizations. For FY<br />
2010, up to $4 million may be available through<br />
<strong>the</strong> City Build program.<br />
■ Incubator Facilities: The <strong>Office</strong> <strong>of</strong> <strong>the</strong> State<br />
Superindent <strong>of</strong> Education (OSSE) entered into a<br />
partnership with Building Hope to develop incubator<br />
facilities in <strong>the</strong> District <strong>of</strong> Columbia. The<br />
Incubator Initiative is funded from two sources:<br />
(1) <strong>the</strong> Credit Enhancement Grant awarded by<br />
<strong>the</strong> U.S. Department <strong>of</strong> Education; and (2)<br />
Federal Appropriations. Pending <strong>the</strong> development<br />
<strong>of</strong> new incubator sites in <strong>the</strong> latter half <strong>of</strong> FY<br />
2010, OSSE may develop one or more additional<br />
sites during FY 2010.<br />
Stimulus: The students <strong>of</strong> <strong>the</strong> Public Charter LEAs<br />
will directly benefit from <strong>the</strong> funds made available for<br />
education through <strong>the</strong> American Recovery and<br />
Reinvestment Act (ARRA). The ARRA directs fund-<br />
FY 2010 Proposed <strong>Budget</strong> and <strong>Financial</strong> Plan<br />
D-56<br />
ing to local schools through <strong>the</strong> existing formulas for<br />
federal grants under Title I <strong>of</strong> <strong>the</strong> Elementary and<br />
Secondary Education Act <strong>of</strong> 1965 and <strong>the</strong> Individuals<br />
with Disabilities Education Act (IDEA). In accordance<br />
with <strong>the</strong> ARRA, both <strong>the</strong> Title I and <strong>the</strong> IDEA<br />
funding will be directed initially to <strong>the</strong> <strong>Office</strong> <strong>of</strong> <strong>the</strong><br />
State Superintendent <strong>of</strong> Education and will pass to<br />
schools pursuant to <strong>the</strong> existing distribution formulas.<br />
This funding is not restricted by “supplement not<br />
supplant” or “maintenance <strong>of</strong> effort” rules that <strong>of</strong>ten<br />
accompany Federal Grants. The purpose <strong>of</strong> Title I <strong>of</strong><br />
<strong>the</strong> Elementary and Secondary Education Act <strong>of</strong><br />
1965 is to “ensure that all children have a fair, equal,<br />
and significant opportunity to obtain a high-quality<br />
education and reach, at a minimum, pr<strong>of</strong>iciency on<br />
challenging State academic achievement standards<br />
and state academic assessments.” The U.S.<br />
Department <strong>of</strong> Education estimates that <strong>the</strong> District<br />
<strong>of</strong> Columbia will receive $37,602,347 in Title I funds<br />
over <strong>the</strong> next 2 years and eligible public charter<br />
schools will receive $5,790,000 through <strong>the</strong> existing<br />
formula in FY 2010. Similarly, charter LEAs will<br />
receive increased funding in <strong>the</strong> amount <strong>of</strong><br />
$1,595,000 through <strong>the</strong> ARRA under <strong>the</strong> IDEA formula<br />
grant. IDEA requires that all public LEAs provide<br />
a “free and appropriate public education that<br />
emphasizes special education and related services<br />
designed to meet <strong>the</strong>ir unique needs and prepare<br />
<strong>the</strong>m for fur<strong>the</strong>r education, employment, and independent<br />
living” and <strong>the</strong>se increased funds will significantly<br />
help <strong>the</strong> District meet its goals for special education.<br />
Gap-Closing Initiatives: The FY 2010 budget proposed<br />
by <strong>the</strong> Mayor and passed by Council included<br />
funding made available through <strong>the</strong> American<br />
Recovery and Reinvestment Act (ARRA) <strong>of</strong> 2009.<br />
The gap-closing budget expands and corrects <strong>the</strong> use<br />
<strong>of</strong> <strong>the</strong> ARRA funding in <strong>the</strong> FY 2010 budget by<br />
$24,604,112. The UPSFF allocation to <strong>the</strong> DC<br />
Public Charter Schools is reduced by $11,840,000<br />
and completely restored by <strong>the</strong> use <strong>of</strong> State Fiscal<br />
Stabilization Funds. The FY 2010 budget correctly<br />
distributes ARRA funds among LEAs, as required by<br />
<strong>the</strong> US Department <strong>of</strong> Education. The ARRA funds<br />
are represented as an Intra-District funds transfer<br />
from <strong>the</strong> <strong>Office</strong> <strong>of</strong> <strong>the</strong> State Superintendent for<br />
Education, <strong>the</strong> agency that implements <strong>the</strong> State<br />
Fiscal Stabilization Fund program.
FY 2009 Approved <strong>Budget</strong> to FY 2010 Proposed <strong>Budget</strong>, by Revenue Type<br />
Table GC0-4 itemizes <strong>the</strong> changes by revenue type between <strong>the</strong> FY 2009 approved budget and <strong>the</strong> FY 2010 proposed<br />
budget. The four categories <strong>of</strong> changes reflected in this table are: (1) changes to <strong>the</strong> baseline budget (includes<br />
agency request), (2) changes representing cost savings or efficiencies, (3) changes related to policy initiatives, and (4)<br />
changes to specifically address <strong>the</strong> projected revenue shortfall.<br />
Table GC0-4<br />
(dollars in thousands)<br />
PROGRAM BUDGET FTE<br />
LOCAL FUND: FY 2009 Approved <strong>Budget</strong> and FTE 366,053 0.0<br />
Initial and Baseline Adjustments<br />
Funding Formula - Increase funding 4.0 percent for <strong>the</strong> base foundation for <strong>the</strong><br />
Uniform Per Student Funding Formula (UPSFF) for inflation as required per DC<br />
Code 38-2909 and includes <strong>the</strong> enrollment <strong>of</strong> <strong>the</strong> Center City Public Charter<br />
School<br />
DC Charter Schools 29,202 0.0<br />
Baseline Adjustments:Technical Adjustment - Provides for 10 percent student<br />
enrollment growth based on <strong>the</strong> historic trend and including new schools to open<br />
for FY 2010.<br />
DC Charter Schools 28,691 0.0<br />
Policy Initiatives and Cost Savings<br />
Enhance - Increase to <strong>of</strong>f-set Facility Allowance reduction. In addition, <strong>the</strong> per<br />
pupil facilities allowance rate has been changed from $3,109 to $2,800.<br />
13,046 0.0<br />
Reduce - Adjust UPSFF to reflect a 2% increase in <strong>the</strong> foundation level and<br />
adjustments to <strong>the</strong> supplemental weights for special education and limited/non-<br />
English pr<strong>of</strong>icient students<br />
DC Charter Schools -2,578 0.0<br />
Reduce - Match each public charter school's Facilities Allotment with eligible<br />
expenses on facility costs (including rent, debt service, site acquisition, building<br />
improvements, and depreciation).<br />
DC Charter Schools -24,000 0.0<br />
Gap-Closing Initiatives<br />
Reduce - Shift - Expand use <strong>of</strong> ARRA State Fiscal Stabilization Funds in FY 2010 Multiple -13,823 0.0<br />
Reduce - Transfer Out - Adjust distribution <strong>of</strong> ARRA funds among LEAs, as<br />
required by US Department <strong>of</strong> Education<br />
Multiple -11,320 0.0<br />
Reduce - Reduce UPSFF to FY 2009 level from $8,945 to $8,770 or 2 percent DC Charter Schools -5,335 0.0<br />
Reduce - Reduce <strong>the</strong> number <strong>of</strong> summer schools slots by 50 percent, from<br />
8,726 students to 4,363 at $1,491 per student based on FY 2009<br />
summer foundation <strong>of</strong> $8,770 and a weighting factor <strong>of</strong> .17.<br />
DC Charter Schools -6,505 0.0<br />
Add - Adjust distribution <strong>of</strong> State Stabilization Funds in FY 2010 DC Charter Schools 539 0.0<br />
LOCAL FUND: FY 2010 Proposed <strong>Budget</strong> and FTE<br />
(Continued on next page)<br />
373,969 0.0<br />
District <strong>of</strong> Columbia Public Charter Schools<br />
D-57
Table GC0-4 (continued)<br />
(dollars in thousands)<br />
FY 2010 Proposed <strong>Budget</strong> and <strong>Financial</strong> Plan<br />
D-58<br />
PROGRAM BUDGET FTE<br />
INTRA-DISTRICT FUNDS: FY 2009 Approved <strong>Budget</strong> and FTE 0 0.0<br />
Policy Initiatives and Cost Savings<br />
Enhance - Through <strong>the</strong> American Recovery and Reinvestment Act, improve <strong>the</strong><br />
ability <strong>of</strong> <strong>the</strong> Public Charter Schools to provide high quality special education<br />
services pursuant to <strong>the</strong> Federal Individuals with Disabilities in Education Act<br />
(IDEA PartB, 619)<br />
DC Charter Schools 16 0.0<br />
Enhance - Through <strong>the</strong> American Recovery and Reinvestment Act, improve <strong>the</strong><br />
ability <strong>of</strong> <strong>the</strong> Public Charter Schools to provide high quality special education<br />
services pursuant to <strong>the</strong> Federal Individuals with Disabilities in Education Act<br />
(IDEA Part B, 611)<br />
DC Charter Schools 1,579 0.0<br />
Enhance - Through <strong>the</strong> American Recovery and Reinvestment Act, improve <strong>the</strong><br />
services provided to District students through Title I eligible schools.<br />
DC Charter Schools 5,790 0.0<br />
Gap-Closing Initiatives<br />
Add - Shift - Expand use <strong>of</strong> ARRA State Fiscal Stabilization Funds in FY 2010 Multiple 13,823 0.0<br />
Add - Transfer Out - Adjust distribution <strong>of</strong> ARRA funds among LEAs, as<br />
required by US Department <strong>of</strong> Education<br />
Multiple 11,320 0.0<br />
Reduce - Reduce use <strong>of</strong> State Stabilization Funds for FY 2010 DC Charter Schools -539 0.0<br />
INTRA-DISTRICT FUNDS: FY 2010 Proposed <strong>Budget</strong> and FTE 31,989 0.0<br />
Gross for GC0 - Public Charter Schools 405,958 0.0<br />
For additional information on o<strong>the</strong>r agency budgets that directly support <strong>the</strong> District public school system please refer to following agency budget<br />
chapters in this volume:<br />
(KD0) School Transit Subsidy<br />
This agency budgets funds that are used to provide a subsidy for public school students who use public transportation to and from schoool.
District <strong>of</strong> Columbia Public Charter Schools<br />
D-59
FY 2010 District <strong>of</strong> Columbia Public Charter Schools <strong>Budget</strong>ed Enrollment<br />
FY 2010 FY 2010<br />
<strong>Budget</strong>ed <strong>Budget</strong>ed<br />
School Name Enrollment School Name Enrollment<br />
1 ABC (Bilingual Community Acad.) 75 Ideal Academy (2 Campuses) 428<br />
2 Achievement Preparatory 72 Imagine SE 243<br />
3 ALTA (Academy for Learning) 86 Kamit Institute 198<br />
4 Appletree (3 Campuses) 198 KIPP DC (4 Campuses) 1,207<br />
5 ATA (Arts & Technology) 670 Latin American/LAMB 158<br />
6 Reserved enrollment * 67 Mary McLeod Bethune (3 Campuses) 235<br />
7 Booker T. Washington 330 Maya Angelou ( 3 Campuses) 546<br />
8 Bridges 84 Meridian 558<br />
9 Capital City (2 Campuses) 409 National Collegiate ** 125<br />
10 Carlos Rosario 1,550 Next Step 92<br />
11 Center City (7 Campus) 1,582 Nia Community 183<br />
12 Cesar Chavez (3 Campuses) 1,440 Options 348<br />
13 Children's Studio 84 Paul 630<br />
14 City Collegiate 109 Potomac Lighthouse 238<br />
15 Community Academy (6 Campuses) 1,533 Roots 117<br />
16 DC Bilingual 314 SAIL 149<br />
17 DC Prep (3 Campuses) 812 SEED 362<br />
18 E.L. Haynes 415 Septima Clark 106<br />
19 E.W. Stokes 345 St. Colleta 225<br />
20 Eagle Academy 359 Thea Bowman 51<br />
21 Early Childhood Academy (2 Campuses) 205 Thurgood Marshall 415<br />
22 Education Streng<strong>the</strong>ns Families 206 Tree <strong>of</strong> Life 323<br />
23 Excel 146 Two Rivers 404<br />
24 Friendship Edison (5 Campuses) 4,186 Washington Yu Ying 142<br />
25 Hope Community (2 Campuses) 685 Washington Latin (2 Campuses) 382<br />
26 Hospitality 178 William E. Doar (3 Campuses) 686<br />
27 Howard Road (3 Campuses) 944 Washington Math, Science 384<br />
28 Howard University 303 Young America Works 352<br />
29 Hyde Leadership 781 Youthbuild (LAYC) 92<br />
30 IDEA 520<br />
FY 2010 TOTAL BUDGETED ENROLLMENT FOR 59 SCHOOLS 28,067<br />
*Subsequent to <strong>the</strong> adoption <strong>of</strong> <strong>the</strong> <strong>Budget</strong>, <strong>the</strong> Barbara Jordan School will close effective June 2009<br />
** One new school to open in FY 2010<br />
FY 2010 Proposed <strong>Budget</strong> and <strong>Financial</strong> Plan<br />
D-60
University <strong>of</strong> <strong>the</strong><br />
District <strong>of</strong> Columbia Subsidy Account<br />
www.udc.edu<br />
Telephone: 202-274-5000<br />
% Change<br />
FY 2008 FY 2009 FY 2010 from<br />
Description Actual Approved Proposed FY 2009<br />
Operating <strong>Budget</strong> $62,769,786 $62,070,000 $62,070,000 0.0<br />
The agency’s FY 2010 proposed budget is presented in <strong>the</strong> following tables:<br />
(GG0)<br />
The subsidy account reflects <strong>the</strong> total local funds transfer to <strong>the</strong><br />
University <strong>of</strong> <strong>the</strong> District <strong>of</strong> Columbia to fulfill its operational obligations<br />
during a budgetary year.<br />
FY 2010 Proposed Gross Funds Operating <strong>Budget</strong>, by Revenue Type<br />
Table GG0-1 contains <strong>the</strong> proposed FY 2010 agency budget compared to <strong>the</strong> FY 2009 approved budget. It also<br />
provides FY 2007 and FY 2008 actual expenditures.<br />
Table GG0-1<br />
(dollars in thousands)<br />
Actual Actual Approved Proposed<br />
Change<br />
from Percent<br />
Appropriated Fund<br />
General Fund<br />
FY 2007 FY 2008 FY 2009 FY 2010 FY 2009 Change*<br />
Local Funds 62,636 62,770 62,070 62,070 0 0.0<br />
Total for General Fund 62,636 62,770 62,070 62,070 0 0.0<br />
Gross Funds 62,636 62,770 62,070 62,070 0 0.0<br />
*Percent Change is based on whole dollars.<br />
Note: If applicable, for a breakdown <strong>of</strong> each Grant (Federal and Private), Special Purpose Revenue type and Intra-District agreement,<br />
please refer to Schedule 80, <strong>Agency</strong> Summary by Revenue Source, in <strong>the</strong> Operating Appendices found on <strong>the</strong> <strong>Office</strong> <strong>of</strong> <strong>the</strong> <strong>Chief</strong><br />
<strong>Financial</strong> <strong>Office</strong>r’s website.<br />
University <strong>of</strong> <strong>the</strong> District <strong>of</strong> Columbia Subsidy Account<br />
D-61
FY 2010 Proposed Operating <strong>Budget</strong>, by Comptroller Source Group<br />
Table GG0-2 contains <strong>the</strong> proposed FY 2010 budget at <strong>the</strong> Comptroller Source Group (object class) level compared<br />
to <strong>the</strong> FY 2009 approved budget. It also provides FY 2007 and FY 2008 actual expenditures.<br />
Table GG0-2<br />
(dollars in thousands)<br />
Actual Actual Approved Proposed<br />
Change<br />
from Percent<br />
Comptroller Source Group FY 2007 FY 2008 FY 2009 FY 2010 FY 2009 Change*<br />
50 Subsidies and Transfers 62,636 62,770 62,070 62,070 0 0.0<br />
Subtotal Nonpersonal Services (NPS) 62,636 62,770 62,070 62,070 0 0.0<br />
Gross Funds 62,636 62,770 62,070 62,070 0 0.0<br />
*Percent Change is based on whole dollars.<br />
Program Description<br />
The University <strong>of</strong> <strong>the</strong> District <strong>of</strong> Columbia Subsidy<br />
operates through <strong>the</strong> following program:<br />
UDC Subsidy - The University, as a component <strong>of</strong><br />
<strong>the</strong> District <strong>of</strong> Columbia government, is a legally separate<br />
entity for which <strong>the</strong> elected <strong>of</strong>ficials <strong>of</strong> <strong>the</strong><br />
District <strong>of</strong> Columbia are financially accountable.<br />
Accountability exists because <strong>the</strong> Mayor, with <strong>the</strong><br />
consent <strong>of</strong> <strong>the</strong> Council, appoints members to <strong>the</strong><br />
University’s Board <strong>of</strong> Trustees, and pursuant to<br />
District <strong>of</strong> Columbia Official Code Section 38-<br />
1202.06(4) approves <strong>the</strong> University’s budget. In<br />
addition, <strong>the</strong> District provides financial support to<br />
<strong>the</strong> University.<br />
FY 2010 Proposed <strong>Budget</strong> and <strong>Financial</strong> Plan<br />
D-62<br />
The operating budget <strong>of</strong> this component unit is<br />
shown as an enterprise fund to align <strong>the</strong> University’s<br />
budgetary information with its financial reporting as<br />
reflected in <strong>the</strong> District’s Comprehensive Annual<br />
<strong>Financial</strong> Report in which <strong>the</strong> University’s financial<br />
data is reported separately from that <strong>of</strong> <strong>the</strong> District<br />
government. Accordingly, details <strong>of</strong> <strong>the</strong> University’s<br />
operating budget are provided in <strong>the</strong> Enterprise and<br />
O<strong>the</strong>r Funds chapter. In FY 2005, a subsidy account<br />
for this component was created to show <strong>the</strong> annual<br />
transfer <strong>of</strong> Local funds support from <strong>the</strong> District government<br />
to <strong>the</strong> University.<br />
Program Structure Change<br />
The University <strong>of</strong> <strong>the</strong> District <strong>of</strong> Columbia Subsidy<br />
Account had no program structure changes in <strong>the</strong> FY<br />
2010 Proposed <strong>Budget</strong>.
FY 2010 Proposed Operating <strong>Budget</strong> and FTEs, by Program and Activity<br />
Table GG0-3 contains <strong>the</strong> proposed FY 2010 budget by program and activity compared to <strong>the</strong> FY 2009 approved budget.<br />
It also provides FY 2008 actual data.<br />
Table GG0-3<br />
(dollars in thousands)<br />
Dollars in Thousands Full-Time Equivalents<br />
Change Change<br />
Actual Approved Proposed from Actual Approved Proposed from<br />
Program/Activity<br />
(1000) UDC Subsidy<br />
FY 2008 FY 2009 FY 2010 FY 2009 FY 2008 FY 2009 FY 2010 FY 2009<br />
(1100) UDC Subsidy 62,770 62,070 62,070 0 0.0 0.0 0.0 0.0<br />
Subtotal (1000) UDC Subsidy 62,770 62,070 62,070 0 0.0 0.0 0.0 0.0<br />
Total Proposed Operating <strong>Budget</strong> 62,770 62,070 62,070 0 0.0 0.0 0.0 0.0<br />
(Change is calculated by whole numbers and numbers may not add up due to rounding)<br />
Note: For more detailed information regarding <strong>the</strong> proposed funding for <strong>the</strong> activities within this agency’s programs, please see Schedule 30-PBB<br />
Program Summary By Activity in <strong>the</strong> FY 2010 Operating Appendices located on <strong>the</strong> <strong>Office</strong> <strong>of</strong> <strong>the</strong> <strong>Chief</strong> <strong>Financial</strong> <strong>Office</strong>r’s website.<br />
Major Baseline Adjustments, Cost Savings and Policy Initiatives<br />
Protected Programs: The proposed FY 2010 budget maintains <strong>the</strong> District subsidy to <strong>the</strong> University <strong>of</strong> <strong>the</strong> District <strong>of</strong><br />
Columbia at <strong>the</strong> FY 2009 level. The University Subsidy for FY 2010 remains $62,070,000.<br />
Gap-Closing Initiatives: The UDC Subsidy allocation will be increased by <strong>the</strong> use <strong>of</strong> ARRA funds in <strong>the</strong> amount <strong>of</strong><br />
$1,399,572, by way <strong>of</strong> a wire transfer from <strong>the</strong> <strong>Office</strong> <strong>of</strong> <strong>the</strong> State Superintendent <strong>of</strong> Education.<br />
University <strong>of</strong> <strong>the</strong> District <strong>of</strong> Columbia Subsidy Account<br />
D-63
FY 2009 Approved <strong>Budget</strong> to FY 2010 Proposed <strong>Budget</strong><br />
Table GG0-4 itemizes <strong>the</strong> changes by revenue type between <strong>the</strong> FY 2009 approved budget and <strong>the</strong> FY 2010 proposed<br />
budget. The four categories <strong>of</strong> changes reflected in this table are: (1) changes to <strong>the</strong> baseline budget (includes<br />
agency request), (2) changes representing cost savings or efficiencies, (3) changes related to policy initiatives, and (4)<br />
changes to specifically address <strong>the</strong> projected revenue shortfall.<br />
Table GG0-4<br />
(dollars in thousands)<br />
Program BUDGET FTE<br />
LOCAL FUND: FY 2009 Approved <strong>Budget</strong> and FTE 62,070 0.0<br />
LOCAL FUND: FY 2010 Proposed <strong>Budget</strong> and FTE 62,070 0.0<br />
Gross for GG0 - University <strong>of</strong> <strong>the</strong> District <strong>of</strong> Columbia Subsidy Account 62,070 0.0<br />
FY 2010 Proposed <strong>Budget</strong> and <strong>Financial</strong> Plan<br />
D-64
District <strong>of</strong> Columbia Public Library<br />
www.dclibrary.org<br />
Telephone: 202-727-1101<br />
% Change<br />
FY 2008 FY 2009 FY 2010 from<br />
Description Actual Approved Proposed FY 2009<br />
Operating <strong>Budget</strong> $46,558,698 $46,063,933 $41,851,388 -9.1<br />
FTEs 398.6 478.6 472.2 -1.3<br />
Summary <strong>of</strong> Services<br />
The District <strong>of</strong> Columbia Public Library provides<br />
services in five key areas: service to children, youth<br />
and teens – <strong>the</strong> Library’s most important work; <strong>the</strong><br />
Library as community space with library buildings<br />
that are welcoming and used for programs and community<br />
meetings; better and larger collection <strong>of</strong><br />
books, DVDs, CDs, audio books and o<strong>the</strong>r library<br />
materials; access to technology for users and <strong>the</strong> use<br />
<strong>of</strong> technology to deliver library services; and adult lit-<br />
(CE0)<br />
The mission <strong>of</strong> <strong>the</strong> D.C Public Library (DCPL) is to provide access to<br />
materials, information, programs and services that when combined<br />
with expert staff enables everyone to achieve lifelong learning, improving<br />
quality <strong>of</strong> life and helping to build a thriving city.<br />
eracy and learning. Through its capital program, <strong>the</strong><br />
Library is building and renovating new buildings in<br />
order to better provide <strong>the</strong>se services. The library is<br />
governed by a nine-member Board <strong>of</strong> Trustees, as set<br />
forth in District <strong>of</strong> Columbia Official Code Section<br />
39-104.<br />
The agency’s FY 2010 proposed budget is presented<br />
in <strong>the</strong> following tables:<br />
District <strong>of</strong> Columbia Public Library<br />
D-65
FY 2010 Proposed Gross Funds Operating <strong>Budget</strong>, by Revenue Type<br />
Table CE0-1 contains <strong>the</strong> proposed FY 2010 agency budget compared to <strong>the</strong> FY 2009 approved budget. It also<br />
provides FY 2007 and FY 2008 actual expenditures.<br />
Table CE0-1<br />
(dollars in thousands)<br />
Actual Actual Approved Proposed<br />
Change<br />
from Percent<br />
Appropriated Fund<br />
General Fund<br />
FY 2007 FY 2008 FY 2009 FY 2010 FY 2009 Change*<br />
Local Funds 42,135 44,563 44,725 39,904 -4,821 -10.8<br />
Special Purpose Revenue Funds 542 420 444 840 396 89.3<br />
Total for General Fund 42,677 44,983 45,168 40,743 -4,425 -9.8<br />
Federal Resources<br />
Federal Grant Funds 711 923 840 794 -46 -5.5<br />
Total for Federal Resources 711 923 840 794 -46 -5.5<br />
Private Funds<br />
Private Grant Funds 298 28 55 0 -55 -100.0<br />
Total for Private Funds 298 28 55 0 -55 -100.0<br />
Intra-District Funds<br />
Intra-District Funds 322 624 0 314 314 N/A<br />
Total for Intra-District Funds 322 624 0 314 314 N/A<br />
Gross Funds 44,008 46,559 46,064 41,851 -4,213 -9.1<br />
*Percent Change is based on whole dollars.<br />
Note: If applicable, for a breakdown <strong>of</strong> each Grant (Federal and Private), Special Purpose Revenue type and Intra-District agreement,<br />
please refer to Schedule 80, <strong>Agency</strong> Summary by Revenue Source, in <strong>the</strong> Operating Appendices located on <strong>the</strong> <strong>Office</strong> <strong>of</strong> <strong>the</strong> <strong>Chief</strong><br />
<strong>Financial</strong> <strong>Office</strong>r’s website.<br />
FY 2010 Proposed <strong>Budget</strong> and <strong>Financial</strong> Plan<br />
D-66
FY 2010 Proposed Full-Time Equivalents, by Revenue Type<br />
Table CE0-2 contains <strong>the</strong> proposed FY 2010 FTE level compared to <strong>the</strong> FY 2009 approved FTE level by revenue<br />
type. It also provides FY 2007 and FY 2008 actual data.<br />
Table CE0-2<br />
Change<br />
Actual Actual Approved Proposed from Percent<br />
Appropriated Fund FY 2007 FY 2008 FY 2009 FY 2010 FY 2009 Change<br />
General Fund<br />
Local Funds 415.9 387.4 469.6 463.4 -6.2 -1.3<br />
Special Purpose Revenue Funds 1.0 1.0 1.0 1.0 0.0 0.0<br />
Total for General Fund 416.9 388.4 470.6 464.4 -6.2 -1.3<br />
Federal Resources<br />
Federal Grant Funds 6.8 5.8 8.0 7.8 -0.2 -2.5<br />
Total for Federal Resources 6.8 5.8 8.0 7.8 -0.2 -2.5<br />
Intra-District Funds<br />
Intra-District Funds 4.0 4.4 0.0 0.0 0.0 N/A<br />
Total for Intra-District Funds 4.0 4.4 0.0 0.0 0.0 N/A<br />
Total Proposed FTEs 427.7 398.6 478.6 472.2 -6.4 -1.3<br />
District <strong>of</strong> Columbia Public Library<br />
D-67
FY 2010 Proposed Operating <strong>Budget</strong>, by Comptroller Source Group<br />
Table CE0-3 contains <strong>the</strong> proposed FY 2010 budget at <strong>the</strong> Comptroller Source Group (object class) level compared<br />
to <strong>the</strong> FY 2009 approved budget. It also provides FY 2007 and FY 2008 actual expenditures.<br />
Table CE0-3<br />
(dollars in thousands)<br />
Actual Actual Approved Proposed<br />
Change<br />
from Percent<br />
Comptroller Source Group FY 2007 FY 2008 FY 2009 FY 2010 FY 2009 Change*<br />
11 Regular Pay - Cont Full Time 17,759 19,218 20,584 20,645 61 0.3<br />
12 Regular Pay - O<strong>the</strong>r 2,817 3,250 3,635 3,071 -564 -15.5<br />
13 Additional Gross Pay 473 1,638 572 579 7 1.2<br />
14 Fringe Benefits - Curr Personnel 4,087 4,303 4,500 4,510 11 0.2<br />
15 Overtime Pay 1,135 1,040 618 222 -395 -64.0<br />
Subtotal Personal Services (PS) 26,271 29,449 29,909 29,028 -881 -2.9<br />
20 Supplies and Materials 556 643 938 476 -461 -49.2<br />
30 Energy, Comm. and Bldg Rentals 2,382 2,466 2,177 3,155 978 44.9<br />
31 Telephone, Telegraph, Telegram, Etc 521 625 541 436 -105 -19.4<br />
32 Rentals - Land and Structures 147 357 125 684 558 446.6<br />
33 Janitorial Services 0 0 8 0 -8 -100.0<br />
34 Security Services 0 0 4 0 -4 -100.0<br />
35 Occupancy Fixed Costs 0 0 18 1 -17 -92.7<br />
40 O<strong>the</strong>r Services and Charges 3,769 3,650 4,190 2,307 -1,884 -45.0<br />
41 Contractual Services - O<strong>the</strong>r 2,616 2,190 1,192 1,179 -13 -1.1<br />
50 Subsidies and Transfers 41 56 56 60 4 7.9<br />
70 Equipment & Equipment Rental 7,704 7,123 6,907 4,526 -2,381 -34.5<br />
Subtotal Nonpersonal Services (NPS) 17,737 17,109 16,155 12,823 -3,331 -20.6<br />
Gross Funds 44,008 46,559 46,064 41,851 -4,213 -9.1<br />
*Percent Change is based on whole dollars.<br />
Program Description<br />
The District <strong>of</strong> Columbia Public Library operates<br />
through <strong>the</strong> following 6 programs:<br />
Library Services – promotes reading and library use<br />
through programming and learning common for<br />
children, young adults, and adults. Library services<br />
include quality support services that increase <strong>the</strong> efficiency<br />
<strong>of</strong> our mission and library transformation services<br />
when new dynamic services are developed.<br />
Finally, library services include public service technology<br />
that bridges <strong>the</strong> digital divide.<br />
FY 2010 Proposed <strong>Budget</strong> and <strong>Financial</strong> Plan<br />
D-68<br />
This program contains <strong>the</strong> following 6 activities:<br />
■ Children’s Services – promotes reading to children<br />
from birth to age 13 to build in <strong>the</strong>m a foundation<br />
in reading, a love <strong>of</strong> <strong>the</strong> library, and most<br />
importantly a love <strong>of</strong> reading;<br />
■ Young Adult Services – promotes reading to adolescents<br />
and teens ages 12–19. It encourages<br />
school retention and graduation through homework<br />
help and o<strong>the</strong>r educational supports and<br />
instills in youth a love <strong>of</strong> <strong>the</strong> library and lifelong<br />
learning;<br />
■ Adult Services – provides adult users with access<br />
to books, DVDs and o<strong>the</strong>r library materials, classes,<br />
workshops, programs such as author talks and
ook discussions, computers, and meeting room<br />
space;<br />
■ Support Unit Services – supports all public service<br />
activities including year-round programming<br />
and reference services at <strong>the</strong> Martin Lu<strong>the</strong>r King,<br />
Jr. Memorial Library;<br />
■ Library Transformation Services – makes strategic<br />
changes to <strong>the</strong> operations <strong>of</strong> <strong>the</strong> Library to<br />
improve <strong>the</strong> way Library services are delivered to<br />
District residents. It measures customer satisfaction<br />
and monitors innovation in o<strong>the</strong>r libraries;<br />
and<br />
■ Public Service Technology – provides public<br />
access computers, WiFi, copiers and printers for<br />
customer use. It uses technology to enhance literacy<br />
efforts, educate and inform customers on<br />
use <strong>of</strong> electronic resources.<br />
Outreach Services – provides library collections, reference<br />
services and virtual reference services to nontraditional<br />
library users and to those that do not have<br />
access to neighborhood libraries by employing assistive<br />
and adaptive services and technologies, mobile<br />
libraries and special collections.<br />
This program contains <strong>the</strong> following 3 activities:<br />
■ Adaptive Services – supports outreach and library<br />
services to blind and physically disabled users.<br />
Some <strong>of</strong> <strong>the</strong>se supports include access to specialized<br />
technology such as large font computer<br />
screens, Braille and audio or recorded books, and<br />
programs in American Sign Language;<br />
■ Mobile Libraries – ensures that residents living in<br />
areas that are receiving new libraries continue to<br />
receive services in mobile facilities. These five<br />
interim libraries provide access to books and o<strong>the</strong>r<br />
library materials, age-appropriate programs such<br />
as book discussions for adults and story times for<br />
children, and public computers; and<br />
■ Special Collections – acquires and maintains special<br />
collections <strong>of</strong> books and o<strong>the</strong>r library materials<br />
showcasing <strong>the</strong> District. They include a local<br />
history collection about <strong>the</strong> District <strong>of</strong> Columbia,<br />
a similar collection about Georgetown, and <strong>the</strong><br />
Black Studies Center.<br />
Books and Media – provides for <strong>the</strong> selection, collection<br />
and maintenance <strong>of</strong> books and media for both<br />
circulating and reference collections for <strong>the</strong> use <strong>of</strong><br />
District residents.<br />
This program contains <strong>the</strong> following 3 activities:<br />
■ Children – Books and Media - develops, selects,<br />
purchases and maintains books, DVDs, audio<br />
books and o<strong>the</strong>r materials for children;<br />
■ Young Adults - Books and Media - develops,<br />
selects, purchases and maintains books, DVDs,<br />
audio books and o<strong>the</strong>r materials for adolescents<br />
and teens; and<br />
■ Adults – Books and Media - develops, selects,<br />
purchases and maintains books, DVDs, audio<br />
books and o<strong>the</strong>r materials for adults.<br />
Public Service Support – provides <strong>the</strong> oversight <strong>of</strong><br />
facility improvement in <strong>the</strong> areas <strong>of</strong> custodial, security<br />
and maintenance beyond that measured in <strong>the</strong><br />
administrative programs shared by all agencies. This<br />
program is in direct response to <strong>the</strong> demands <strong>of</strong><br />
District residents for safe and comfortable libraries.<br />
This program contains <strong>the</strong> following 3 activities:<br />
■ Custodial Services – supports all library locations<br />
(central and neighborhood libraries) by maintaining<br />
a clean and inviting environment for District<br />
residents;<br />
■ Security - supports security staff who provide<br />
public oversight and accountability resulting in<br />
improved safety in libraries; and<br />
■ Maintenance Services – supports all library locations<br />
(central and neighborhood libraries) by<br />
maintaining a safe and comfortable environment<br />
for District residents.<br />
<strong>Agency</strong> Management - provides for administrative<br />
support and <strong>the</strong> required tools to achieve operational<br />
and programmatic results. This program is standard<br />
for all agencies using performance-based budgeting.<br />
<strong>Agency</strong> <strong>Financial</strong> Operations – provides comprehensive<br />
and efficient financial management services to<br />
and on behalf <strong>of</strong> District agencies so that <strong>the</strong> financial<br />
integrity <strong>of</strong> <strong>the</strong> District <strong>of</strong> Columbia is maintained.<br />
This program is standard for all agencies using performance-based<br />
budgeting.<br />
Program Structure Change<br />
The District <strong>of</strong> Columbia Public Library had no program<br />
structure changes in <strong>the</strong> FY 2010 Proposed<br />
<strong>Budget</strong>.<br />
District <strong>of</strong> Columbia Public Library<br />
D-69
FY 2010 Proposed Operating <strong>Budget</strong> and FTEs, by Program and Activity<br />
Table CE0-4 contains <strong>the</strong> proposed FY 2010 budget by program and activity compared to <strong>the</strong> FY 2009 approved budget.<br />
It also provides FY 2008 actual data.<br />
Table CE0-4<br />
(dollars in thousands)<br />
Dollars in Thousands Full-Time Equivalents<br />
Change Change<br />
Actual Approved Proposed from Actual Approved Proposed from<br />
Program/Activity FY 2008 FY 2009 FY 2010 FY 2009 FY 2008 FY 2009 FY 2010 FY 2009<br />
(1000) <strong>Agency</strong> Management Program<br />
(1010) Personnel 1,055 1,110 808 -302 8.6 11.1 9.0 -2.1<br />
(1015) Training & Employee Development 762 500 304 -195 1.1 1.1 3.0 1.9<br />
(1017) Labor Management Partnership 24 21 0 -21 0.1 0.1 0.0 -0.1<br />
(1020) Contracting & Procurement 518 804 627 -177 4.1 4.1 4.0 -0.1<br />
(1030) Property Management 6,625 5,480 5,359 -121 7.5 3.1 4.0 0.9<br />
(1040) Information Technology 1,197 1,324 1,128 -196 6.1 7.1 6.0 -1.1<br />
(1050) <strong>Financial</strong> Services 24 21 0 -21 0.1 0.1 0.0 -0.1<br />
(1055) Risk Management 24 24 0 -24 0.1 0.1 0.0 -0.1<br />
(1060) Legal Services 262 251 234 -18 2.1 2.1 2.0 -0.1<br />
(1070) Fleet Management 432 453 463 10 2.0 5.0 6.0 1.0<br />
(1080) Communications 905 985 893 -93 10.1 12.1 11.0 -1.1<br />
(1085) Customer Service 869 751 492 -259 8.4 6.0 5.0 -1.0<br />
(1087) Language Access 3 15 7 -8 0.0 0.0 0.0 0.0<br />
(1090) Performance Management 0 0 578 578 0.0 0.0 2.5 2.5<br />
Subtotal (1000) <strong>Agency</strong> Mangement Program 12,700<br />
(100F) <strong>Agency</strong> <strong>Financial</strong> Operations<br />
11,739 10,894 -845 50.2 52.0 52.5 0.5<br />
(110F) <strong>Budget</strong> Operations 255 262 291 30 3.0 2.8 2.5 -0.3<br />
(120F) Accounting Operations 307 369 386 17 5.0 5.3 4.5 -0.8<br />
Subtotal (100F) <strong>Agency</strong> <strong>Financial</strong> Operations<br />
(2000) Lifetime <strong>of</strong> Learning<br />
562 631 678 47 7.9 8.0 7.0 -1.0<br />
(2010) Children and Young Adult Services -6 0 0 0 0.0 0.0 0.0 0.0<br />
(2030) Creating Environ. that Inspire Reading -13 0 0 0 0.0 0.0 0.0 0.0<br />
Subtotal (2000) Lifetime <strong>of</strong> Learning<br />
(3000) Library Materials and Their Use<br />
-18 0 0 0 0.0 0.0 0.0 0.0<br />
(3010) Reference 0 6 0 -6 0.0 0.1 0.0 -0.1<br />
(3020) Library Collection Services 1 0 0 0 0.0 0.0 0.0 0.0<br />
Subtotal (3000) Library Materials and Their Use<br />
(4000) Removing Barriers To Access<br />
1 6 0 -6 0.0 0.1 0.0 -0.1<br />
(4010) Technology Access -1 0 0 0 0.0 0.0 0.0 0.0<br />
Subtotal (4000) Removing Barriers To Access<br />
(5000) Library Services<br />
-1 0 0 0 0.0 0.0 0.0 0.0<br />
(5010) Children's Services 2,964 3,960 3,273 -687 35.9 45.1 42.3 -2.8<br />
(5020) Young Adult Services 453 1,322 998 -324 1.2 32.0 22.0 -10.0<br />
(5030) Adult Services<br />
(Continued on next page)<br />
8,905 8,085 8,437 352 92.8 115.9 122.8 6.9<br />
FY 2010 Proposed <strong>Budget</strong> and <strong>Financial</strong> Plan<br />
D-70
FY 2010 Proposed Operating <strong>Budget</strong> and FTEs, by Program and Activity<br />
Table CE0-4 contains <strong>the</strong> proposed FY 2010 budget by program and activity compared to <strong>the</strong> FY 2009 approved budget.<br />
It also provides FY 2008 actual data.<br />
Table CE0-4 (Continued)<br />
(dollars in thousands)<br />
Dollars in Thousands Full-Time Equivalents<br />
Change Change<br />
Actual Approved Proposed from Actual Approved Proposed from<br />
Program/Activity FY 2008 FY 2009 FY 2010 FY 2009 FY 2008 FY 2009 FY 2010 FY 2009<br />
(5040) Support Unit Services 4,804 5,005 4,880 -125 97.3 114.2 112.3 -1.9<br />
(5050) Library Transformation Services 446 466 168 -298 1.0 1.0 0.0 -1.0<br />
(5060) Public Service Technology 3,154 2,453 1,843 -610 4.5 4.9 5.0 0.1<br />
Subtotal (5000) Library Services<br />
(6000) Outreach Services<br />
20,726 21,291 19,598 -1,693 232.7 313.1 304.4 -8.7<br />
(6010) Adaptive Services 1,299 1,282 1,125 -157 10.6 12.0 13.8 1.8<br />
(6020) Mobile Libraries 81 46 35 -11 0.0 0.0 0.0 0.0<br />
(6030) Special Collections 417 430 347 -82 4.9 5.0 4.0 -1.0<br />
Subtotal (6000) Outreach Services<br />
(7000) Books and Media<br />
1,798 1,758 1,508 -250 15.5 17.0 17.8 0.8<br />
(7010) Children 1,566 2,256 1,714 -543 10.7 6.2 6.5 0.3<br />
(7020) Young Adult 750 758 724 -34 10.7 2.2 2.3 0.1<br />
(7030) Adult 3,859 3,368 2,502 -865 14.2 16.1 15.7 -0.4<br />
Subtotal (7000) Books and Media<br />
(8000) Public Service Support<br />
6,174 6,382 4,940 -1,442 35.5 24.5 24.5 0.0<br />
(8010) Custodial 1,310 1,503 1,519 15 23.9 29.0 28.0 -1.0<br />
(8020) Security 1,826 1,468 1,366 -102 20.3 20.5 21.5 1.0<br />
(8030) Maintenance 1,480 1,286 1,349 63 12.6 14.4 16.5 2.1<br />
Subtotal (8000) Public Service Support 4,616 4,257 4,234 -23 56.7 63.9 66.0 2.1<br />
Total Proposed Operating <strong>Budget</strong> 46,559 46,064 41,851 -4,213 398.6 478.6 472.2 -6.4<br />
(Change is calculated by whole numbers and numbers may not add up due to rounding)<br />
Note: For more detailed information regarding <strong>the</strong> proposed funding for <strong>the</strong> activities within this agency’s programs, please see Schedule 30-<br />
PBB Program Summary by Activity in <strong>the</strong> FY 2010 Operating Appendices located on <strong>the</strong> <strong>Office</strong> <strong>of</strong> <strong>the</strong> <strong>Chief</strong> <strong>Financial</strong> <strong>Office</strong>r’s website.<br />
District <strong>of</strong> Columbia Public Library<br />
D-71
Major Baseline Adjustments, Cost Savings<br />
and Policy Initiatives<br />
Initial and Baseline Adjustments: A net fixed costs<br />
adjustment <strong>of</strong> $1,154,073 across multiple programs.<br />
Cost Savings: The proposed budget reduces supplies<br />
for operational support by $133,651, and reflects<br />
revised assessments for fixed costs (including electricity,<br />
fleet, and telecom) at a savings <strong>of</strong> approximately<br />
$210,576.<br />
Policy Initiatives: The proposed budget supports <strong>the</strong><br />
anticipated opening <strong>of</strong> as many as six new branch<br />
libraries in FY 2010. Library staff will increase by<br />
8.25 FTEs (representing 11 positions filled one-quarter<br />
into FY 2010, when new locations are scheduled<br />
to open). The proposed budget funds about $63,000<br />
in ongoing information technology support for <strong>the</strong> new<br />
libraries. Additional funds will support utility expenses<br />
at <strong>the</strong> new locations.<br />
Stimulus: DCPL is seeking to partner with <strong>the</strong> <strong>Office</strong><br />
<strong>of</strong> <strong>the</strong> <strong>Chief</strong> Technology <strong>Office</strong>r to apply for competitive<br />
grant funding to support <strong>the</strong> expansion <strong>of</strong> access<br />
to broadband internet services to underserved areas.<br />
Additionally, DCPL is partnering with <strong>the</strong><br />
District Department <strong>of</strong> <strong>the</strong> Environment (DDOE) to<br />
retr<strong>of</strong>it library buildings and infrastructure for energy<br />
efficiency and green house gas emmission reductions.<br />
Gap-Closing Initiatives: The proposed FY 2010 gapclosing<br />
budget fur<strong>the</strong>r reduces Local Funds appropriations<br />
for DCPL by $6,539,000 (14.1 percent), while<br />
providing resources to support DCPL’s day-to-day<br />
library services and <strong>the</strong> opening <strong>of</strong> six new branch<br />
libraries in FY 2010.<br />
DCPL will reduce overtime in <strong>the</strong> Public Service<br />
Support programs by a total <strong>of</strong> $1,024,000. DCPL<br />
will save $837,000 by eliminating 14.5 vacant FTEs<br />
in <strong>the</strong> <strong>Agency</strong> Management, Library Services, and<br />
Public Service Support programs.<br />
Funding in various programs for supplies, contracts,<br />
and o<strong>the</strong>r services and charges will be reduced<br />
by $1,866,000. Working with <strong>the</strong> <strong>Office</strong> <strong>of</strong> <strong>the</strong> <strong>Chief</strong><br />
Technology <strong>Office</strong>r, DCPL plans to seek ARRA grant<br />
opportunities to expand broadband accessibility; this<br />
effort will partially <strong>of</strong>fset <strong>the</strong> effect <strong>of</strong> a $1,420,000<br />
reduction in funding for IT hardware. DCPL will<br />
FY 2010 Proposed <strong>Budget</strong> and <strong>Financial</strong> Plan<br />
D-72<br />
also leverage federal dollars to support materials purchases,<br />
with an estimated savings <strong>of</strong> $1,392,000 in<br />
Local Funds.
FY 2009 Approved <strong>Budget</strong> to FY 2010 Proposed <strong>Budget</strong>, by Revenue Type<br />
Table CE0-5 itemizes <strong>the</strong> changes by revenue type between <strong>the</strong> FY 2009 approved budget and <strong>the</strong> FY 2010 proposed<br />
budget. The four categories <strong>of</strong> changes reflected in this table are: (1) changes to <strong>the</strong> baseline budget (includes<br />
agency request), (2) changes representing cost savings or efficiencies, (3) changes related to policy initiatives, and (4)<br />
changes to specifically address <strong>the</strong> projected revenue shortfall.<br />
Table CE0-5<br />
(dollars in thousands)<br />
PROGRAM BUDGET FTE<br />
LOCAL FUND: FY 2009 Approved <strong>Budget</strong> and FTE 44,725 469.6<br />
Initial and Baseline Adjustments<br />
Net effect <strong>of</strong> fixed cost adjustments - Net change for fixed costs Multiple 1,065 0.0<br />
Net effect <strong>of</strong> salary and benefits changes - Net reduction personnel Multiple -121 0.0<br />
Intra-<strong>Agency</strong> Changes - Supplies and materials reduction Multiple -198 0.0<br />
Intra-<strong>Agency</strong> Changes - Net reduction o<strong>the</strong>r services and charges Lifetime Of Learning -214 0.0<br />
Intra-<strong>Agency</strong> Changes - Contractual services reduction Multiple -26 0.0<br />
Intra-<strong>Agency</strong> Changes - Equipment & equipment rental reduction Multiple -964 0.0<br />
Baseline Adjustments: Net effect <strong>of</strong> fixed cost adjustments - Increase in <strong>Agency</strong> Mangement Program 89 0.0<br />
telecom budget<br />
Baseline Adjustments: Net effect <strong>of</strong> fixed cost adjustments - Centralized Multiple -12 0.0<br />
fixed costs adjustment<br />
Baseline Adjustments: Intra-<strong>Agency</strong> Changes - CFC adjustment Multiple 12 0.0<br />
Policy Initiatives and Cost Savings<br />
Increase - Overtime to partially restore library service hours Multiple 237 0.0<br />
Increase - Overtime to partially restore library service hours Multiple 700 0.0<br />
Enhance - Staff new branch libraries expected to open in FY 2010 Library Services 464 8.3<br />
Enhance - Provide Local funds for information technology operations<br />
supporting <strong>the</strong> new branch libraries, using <strong>the</strong> Federal E-Rate program<br />
Books And Media 63 0.0<br />
Increase - Overtime to partially restore library service hours Books And Media 520 0.0<br />
Increase - Overtime to partially restore library service hours (One-time) Books And Media 446 0.0<br />
Policy Initiatives were reduced under Gap-closing <strong>Agency</strong> Mangement Program 153 0.0<br />
Enhance - Fund utility costs <strong>of</strong> new libraries opening in FY 2010 <strong>Agency</strong> Mangement Program 154 0.0<br />
Reduce - Reduce overtime expenses in agency management, public<br />
service support, and library services<br />
Multiple -305 0.0<br />
Cost Decrease - Reduce supplies budget for Public Service Support to<br />
FY 2008 actual spending<br />
Public Service Support -134 0.0<br />
Cost Decrease - Align electricity budget with revised OPM estimates <strong>Agency</strong> Mangement Program -75 0.0<br />
Cost Decrease - Align fleet budget with revised DPW estimates <strong>Agency</strong> Mangement Program -17 0.0<br />
Cost Decrease - Align occupancy budget with revised OPM estimates <strong>Agency</strong> Mangement Program 0 0.0<br />
Cost Decrease - Align telecom budget with revised OCTO estimates<br />
(Continued on next page)<br />
<strong>Agency</strong> Mangement Program -118 0.0<br />
District <strong>of</strong> Columbia Public Library<br />
D-73
Table CE0-5 (continued)<br />
(dollars in thousands)<br />
FY 2010 Proposed <strong>Budget</strong> and <strong>Financial</strong> Plan<br />
D-74<br />
Program BUDGET FTE<br />
Gap-Closing Initiatives<br />
Reduce - Leverage Federal funding and reduce Local funds for library<br />
materials<br />
Multiple -100 0.0<br />
Reduce - Reduce vacant positions Multiple -837 -14.5<br />
Reduce - Achieve savings in supplies and o<strong>the</strong>r services and charges<br />
to maximize energy efficiencies from stimulus funding<br />
Multiple -1,282 0.0<br />
Reduce - Reduce o<strong>the</strong>r services and charges allocation Multiple -584 0.0<br />
Reduce - Reduce funding Books and Media- Adults Books And Media -846 0.0<br />
Reduce - Maximize stimulus funding opportunities and reduce Local<br />
funds technology budget<br />
Multiple -900 0.0<br />
Reduce - Reduce funding for information technology installation<br />
installations at new libraries opening in FY 2010.<br />
Library Services -520 0.0<br />
Reduce - Overtime to partially restore library service hours Multiple -237 0.0<br />
Reduce - Overtime to partially restore library service hours Multiple -700 0.0<br />
Reduce - Overtime for security Multiple -87 0.0<br />
Reduce - Funding for <strong>the</strong> purchase <strong>of</strong> new books and collection<br />
materials at new branches opening in FY 2010.<br />
Books And Media -446 0.0<br />
LOCAL FUND: FY 2010 Proposed <strong>Budget</strong> and FTE 39,904 463.4<br />
SPECIAL PURPOSE REVENUE FUNDS: FY 2009 Approved <strong>Budget</strong> and FTE 444 1.0<br />
Initial and Baseline Adjustments<br />
Net effect <strong>of</strong> salary and benefits changes - Reduction in personnel Multiple 2 0.0<br />
Intra-<strong>Agency</strong> Changes - Reduction supplies and materials Multiple -6 0.0<br />
Intra-<strong>Agency</strong> Changes - Increase in contractual services Library Materials and Their Use 200 0.0<br />
Intra-<strong>Agency</strong> Changes - Increase in Equipment & equipment rental Library Materials and Their Use 200 0.0<br />
SPECIAL PURPOSE REVENUE FUNDS: FY 2010 Proposed <strong>Budget</strong> and FTE 840 1.0<br />
FEDERAL GRANT FUND: FY 2009 Approved <strong>Budget</strong> and FTE 840 8.0<br />
Initial and Baseline Adjustments<br />
Net effect <strong>of</strong> salary and benefits changes - Reduction personnel services Multiple 3 0.0<br />
Intra-<strong>Agency</strong> Changes - Reduction supplies and materials Multiple -3 0.0<br />
Intra-<strong>Agency</strong> Changes - Reduction o<strong>the</strong>r services and charges Multiple -20 0.0<br />
Intra-<strong>Agency</strong> Changes - Increase subsidies and transfers Multiple 4 0.0<br />
Intra-<strong>Agency</strong> Changes - Reduction equipment & equipment rentals Multiple -30 0.0<br />
FEDERAL GRANT FUND: FY 2010 Proposed <strong>Budget</strong> and FTE 794 7.8<br />
PRIVATE GRANT FUND: FY 2009 Approved <strong>Budget</strong> and FTE 55 0.0<br />
Initial and Baseline Adjustments<br />
Intra-<strong>Agency</strong> Changes - Reduction equipment & equipment rental Multiple -55 0.0<br />
PRIVATE GRANT FUND: FY 2010 Proposed <strong>Budget</strong> and FTE 0 0.0<br />
INTRA-DISTRICT: FY 2009 Approved <strong>Budget</strong> and FTE 0 0.0<br />
Initial and Baseline Adjustments<br />
Intra-<strong>Agency</strong> Changes - Increase in rentals Multiple 314 0.0<br />
INTRA-DISTRICT: FY 2010 Proposed <strong>Budget</strong> and FTE 314 0.0<br />
Gross for CE0 - District <strong>of</strong> Columbia Public Library 41,851 472.2
<strong>Agency</strong> Performance Plan<br />
The agency’s Performance Plan has <strong>the</strong> following<br />
objectives for FY 2010:<br />
Objective 1: Library as community space: DCPL will<br />
create and enhance programming at <strong>the</strong> central library<br />
and neighborhood branches in a dynamic way to<br />
attract residents to <strong>the</strong> libraries.<br />
Objective 2: Library resources for <strong>the</strong> public: DCPL<br />
is committed to enhancing its collections, including<br />
<strong>the</strong> continued expansion into digital media, to meet<br />
<strong>the</strong> needs <strong>of</strong> all District residents.<br />
Objective 3: Technology: Access to <strong>the</strong> on-line world<br />
is critical in <strong>the</strong> 21st century; however, many District<br />
residents do not have on-line access from <strong>the</strong>ir home.<br />
DCPL <strong>of</strong>fers public access computers and databases<br />
to support research, genealogy tracking, and books,<br />
music and videos that can be downloaded.<br />
District <strong>of</strong> Columbia Public Library<br />
D-75
<strong>Agency</strong> Performance Measures<br />
Table CE0-6<br />
FY 2010 Proposed <strong>Budget</strong> and <strong>Financial</strong> Plan<br />
D-76<br />
FY 2007 FY 2008 FY 2008<br />
Year-End Original Year-End FY 2009 FY 2010 FY 2011<br />
Measure Actual Target Actual Projection Projection Projection<br />
Objective 1:<br />
Annual circulation <strong>of</strong> books and o<strong>the</strong>r library<br />
materials 1,462,531 1,608,784 1,781,862 1,769,662 1,946,628 2,141,291<br />
Cardholders as a percent <strong>of</strong> total population N/A Baseline 42.58% +3% +3% +3%<br />
Number <strong>of</strong> website user visits N/A Baseline 408,670 +10% +10% +10%<br />
Number <strong>of</strong> attendees at Library sponsored programs 204,334 224,767 192,441 247,244 271,968 299,165<br />
Number <strong>of</strong> participants at community sponsored<br />
meetings 129,114 142,025 158,521 163,329 187,828 216,002<br />
Number <strong>of</strong> library renovations/constructions on<br />
schedule for design phase N/A 100% 95% 100% 100% 100%<br />
Number <strong>of</strong> library renovations/constructions on<br />
schedule for construction phase N/A N/A N/A 100% 100% 100%<br />
Number <strong>of</strong> libraries re-opened in accordance<br />
with schedule<br />
Objective 2:<br />
N/A N/A N/A 100% 100% 100%<br />
Percent increase in circulation <strong>of</strong> children’s materials N/A Baseline 525,469 578,016 +10% +10%<br />
Percentage increase in <strong>the</strong> number <strong>of</strong> new library<br />
cards for children<br />
Increase participation and completion rates in<br />
N/A Baseline 6,301 6,931 +10% +10%<br />
summer reading for pre-school and elementary<br />
school age children 29,939 32,932 28,382 36,225 39,848 43,833<br />
Percent increase in attendance at programs for<br />
children in <strong>the</strong>ir 1st five years N/A Baseline 77,133 84,846 +10% +10%<br />
Percent increase in <strong>the</strong> number <strong>of</strong> story hours<br />
for children N/A Baseline 1,672 2,508 +50% +50%<br />
Number <strong>of</strong> people using on-line homework help N/A Baseline 2,497 2,747 +10% +10%<br />
Participation in teen reading programs N/A Baseline 4,899 5,389 +10% +10%<br />
Percent increase in <strong>the</strong> number <strong>of</strong> new library<br />
cards for teens N/A Baseline 9,357 10,293 +10% +10%<br />
Percent increase in number <strong>of</strong> books downloaded N/A Baseline 7,355 8,091 +10% +10%<br />
Percent increase in number <strong>of</strong> adult learners<br />
seeking assistance N/A Baseline 2,465 2,712 +10% +10%<br />
Percent increase in number <strong>of</strong> GED practice<br />
tests administered<br />
Objective 3:<br />
N/A Baseline 961 1,057 +10% +10%<br />
Number <strong>of</strong> public access computers increase 25<br />
percent from current level <strong>of</strong> 325 N/A 406 409 508 635 635<br />
Percent increase in <strong>the</strong> number <strong>of</strong> sessions on public<br />
access computers by children N/A Baseline 88,753 +25% +25% +25%<br />
Percent increase in <strong>the</strong> number <strong>of</strong> sessions on public<br />
access computers by teens and adults N/A Baseline 368,621 +25% +25% +25%<br />
Percent increase in <strong>the</strong> number <strong>of</strong> sessions <strong>of</strong> remote<br />
access to Library’s electronic resources<br />
Additional Measure for FY 2010<br />
N/A Baseline 145,400 +25% +25% +25%<br />
The number <strong>of</strong> community working groups, convened<br />
per site, per project, per calendar year. N/A N/A N/A N/A TBD TBD
District <strong>of</strong> Columbia<br />
Public Charter School Board<br />
www.dcpubliccharter.com<br />
Telephone: 202-328-2660<br />
(GB0)<br />
% Change<br />
FY 2008 FY 2009 FY 2010 from<br />
Description Actual Approved Proposed FY 2009<br />
Operating <strong>Budget</strong> $1,718,612 $3,460,277 $3,636,570 5.1<br />
FTEs 0.0 23.0 23.0 0.0<br />
The mission <strong>of</strong> <strong>the</strong> District <strong>of</strong> Columbia Public Charter School Board<br />
is to provide quality public school options for D.C. students, families,<br />
and communities.<br />
The agency’s FY 2010 proposed budget is presented in <strong>the</strong> following tables:<br />
FY 2010 Proposed Gross Funds Operating <strong>Budget</strong>, by Revenue Type<br />
Table GB0-1 contains <strong>the</strong> proposed FY 2010 agency budget compared to <strong>the</strong> FY 2009 approved budget. It also<br />
provides FY 2007 and FY 2008 actual expenditures.<br />
Table GB0-1<br />
(dollars in thousands)<br />
Actual Actual Approved Proposed<br />
Change<br />
from Percent<br />
Appropriated Fund<br />
General Fund<br />
FY 2007 FY 2008 FY 2009 FY 2010 FY 2009 Change*<br />
Local Funds 0 1,719 1,660 1,660 0 0.0<br />
Special Purpose Revenue Funds 0 0 1,800 1,976 176 9.8<br />
Total for General Fund 0 1,719 3,460 3,637 176 5.1<br />
Gross Funds<br />
*Percent Change is based on whole dollars.<br />
0 1,719 3,460 3,637 176 5.1<br />
Note: If applicable, for a breakdown <strong>of</strong> each Grant (Federal and Private), Special Purpose Revenue type and Intra-District agreement,<br />
please refer to Schedule 80, <strong>Agency</strong> Summary by Revenue Source, in <strong>the</strong> Operating Appendices located on <strong>the</strong> <strong>Office</strong> <strong>of</strong> <strong>the</strong> <strong>Chief</strong><br />
<strong>Financial</strong> <strong>Office</strong>r’s website.<br />
District <strong>of</strong> Columbia Public Charter School Board<br />
D-77
FY 2010 Proposed Full-Time Equivalents, by Revenue Type<br />
Table GB0-2 contains <strong>the</strong> proposed FY 2010 budget at <strong>the</strong> Comptroller Source group (object class) level compared<br />
to <strong>the</strong> FY 2009 approved budget. It also provides FY 2007 and FY 2008 actual expenditures.<br />
Table GB0-2<br />
Change<br />
Actual Actual Approved Proposed from Percent<br />
Appropriated Fund FY 2007 FY 2008 FY 2009 FY 2010 FY 2009 Change<br />
General Fund<br />
Local Funds 0.0 0.0 23.0 23.0 0.0 0.0<br />
Total for General Fund 0.0 0.0 23.0 23.0 0.0 0.0<br />
Total Proposed FTEs 0.0 0.0 23.0 23.0 0.0 0.0<br />
FY 2010 Proposed Operating <strong>Budget</strong>, by Comptroller Source Group<br />
Table GB0-3 contains <strong>the</strong> proposed FY 2010 budget at <strong>the</strong> Comptroller Source Group (object class) level compared<br />
to <strong>the</strong> FY 2009 approved budget. It also provides FY 2007 and FY 2008 actual expenditures.<br />
Table GB0-3<br />
(dollars in thousands)<br />
Actual Actual Approved Proposed<br />
Change<br />
from Percent<br />
Comptroller Source Group FY 2007 FY 2008 FY 2009 FY 2010 FY 2009 Change*<br />
11 Regular Pay - Cont Full Time 0 0 1,644 1,645 2 0.1<br />
14 Fringe Benefits - Curr Personnel 0 0 371 404 33 8.9<br />
Subtotal Personal Services (PS) 0 0 2,015 2,050 35 1.7<br />
20 Supplies and Materials 0 0 30 25 -5 -16.8<br />
30 Energy, Comm. and Bldg Rentals 0 0 0 0 0 N/A<br />
31 Telephone, Telegraph, Telegram, etc 0 0 0 35 35 N/A<br />
35 Occupancy Fixed Costs 0 0 239 239 0 0.0<br />
40 O<strong>the</strong>r Services and Charges 0 0 299 247 -52 -17.5<br />
41 Contractual Services - O<strong>the</strong>r 0 0 878 1,032 155 17.6<br />
50 Subsidies and Transfers 0 1,719 0 0 0 N/A<br />
70 Equipment & Equipment Rental 0 0 0 9 9 N/A<br />
Subtotal Nonpersonal Services (NPS) 0 1,719 1,446 1,587 141 9.8<br />
Gross Funds 0 1,719 3,460 3,637 176 5.1<br />
*Percent Change is based on whole dollars.<br />
FY 2010 Proposed <strong>Budget</strong> and <strong>Financial</strong> Plan<br />
D-78
Program Description<br />
The District <strong>of</strong> Columbia Public Charter School<br />
Board carries out its mission through:<br />
■ A comprehensive application review process;<br />
■ Effective oversight;<br />
■ Meaningful support; and<br />
■ Active engagement <strong>of</strong> stakeholders.<br />
The District <strong>of</strong> Columbia Public Charter School<br />
Board was authorized by <strong>the</strong> United States Congress<br />
in <strong>the</strong> District <strong>of</strong> Columbia School Reform Act <strong>of</strong><br />
1995 (as amended in 1996) to grant charters for <strong>the</strong><br />
purpose <strong>of</strong> establishing public charter schools in <strong>the</strong><br />
District. Section 38-18 <strong>of</strong> <strong>the</strong> District <strong>of</strong> Columbia<br />
Official Code (2001 edition) includes <strong>the</strong> majority <strong>of</strong><br />
<strong>the</strong> code provisions relating to public charter schools<br />
in <strong>the</strong> District.<br />
As set forth in Section 38-1802.14 <strong>of</strong> <strong>the</strong> code,<br />
<strong>the</strong> Mayor <strong>of</strong> <strong>the</strong> District <strong>of</strong> Columbia appoints <strong>the</strong><br />
FY 2010 Proposed Operating <strong>Budget</strong> and FTEs, by Program and Activity<br />
seven members <strong>of</strong> <strong>the</strong> D.C. Public Charter School<br />
Board from a list <strong>of</strong> nominees presented to him by <strong>the</strong><br />
U.S. Secretary <strong>of</strong> Education. The Board has been<br />
operating since late February 1997 and has as its goal<br />
to improve education for children, youth, and adults<br />
in <strong>the</strong> District <strong>of</strong> Columbia by chartering public<br />
schools.<br />
The Board is responsible for receiving and reviewing<br />
applications to develop public charter schools;<br />
awarding or denying requests for charters; monitoring<br />
<strong>the</strong> operations <strong>of</strong> public charter schools, as well as<br />
<strong>the</strong> progress <strong>of</strong> students in those schools; and renewing<br />
charters, or revoking <strong>the</strong> charters <strong>of</strong> schools that<br />
fall short <strong>of</strong> <strong>the</strong>ir goals for students.<br />
Program Structure Change<br />
The District <strong>of</strong> Columbia Public Charter School<br />
Board had no program structure changes in <strong>the</strong> FY<br />
2010 Proposed <strong>Budget</strong>.<br />
Table GB0-4 contains <strong>the</strong> proposed FY 2010 budget by program and activity compared to <strong>the</strong> FY 2009 approved budget.<br />
It also provides FY 2008 actual data.<br />
Table GB0-4<br />
(dollars in thousands)<br />
Dollars in Thousands Full-Time Equivalents<br />
Change Change<br />
Actual Approved Proposed from Actual Approved Proposed from<br />
Program/Activity<br />
(0010) DC Public Charter Schools Board<br />
FY 2008 FY 2009 FY 2010 FY 2009 FY 2008 FY 2009 FY 2010 FY 2009<br />
(1000) <strong>Agency</strong> Management Program 1,719 3,460 3,637 176 0.0 23.0 23.0 0.0<br />
Subtotal (0010) DC Public Charter Schools Board 1,719 3,460 3,637 176 0.0 23.0 23.0 0.0<br />
Total Proposed Operating <strong>Budget</strong> 1,719 3,460 3,637 176 0.0 23.0 23.0 0.0<br />
(Change is calculated by whole numbers and numbers may not add up due to rounding)<br />
Note: For more detailed information regarding <strong>the</strong> proposed funding for <strong>the</strong> activities within this agency’s programs, please see Schedule 30-PBB<br />
Program Summary By Activity in <strong>the</strong> FY 2010 Operating Appendices located on <strong>the</strong> <strong>Office</strong> <strong>of</strong> <strong>the</strong> <strong>Chief</strong> <strong>Financial</strong> <strong>Office</strong>r’s website.<br />
District <strong>of</strong> Columbia Public Charter School Board<br />
D-79
Major Baseline Adjustments, Cost Savings and Policy Initiatives<br />
Initial Adjustments: An increase <strong>of</strong> $176,293 in Special Purpose Revenue for board operations. Pursuant to<br />
Section 38-1802.11(b)(2) <strong>of</strong> <strong>the</strong> District <strong>of</strong> Columbia Official Code, <strong>the</strong> Board assesses a fee <strong>of</strong> one half <strong>of</strong> 1 percent<br />
on <strong>the</strong> Local funds budget <strong>of</strong> each charter school, and <strong>the</strong> Board’s revenue increases commensurate with <strong>the</strong><br />
increase in <strong>the</strong> D.C. Public Charter Schools budget.<br />
FY 2009 Approved <strong>Budget</strong> to FY 2010 Proposed <strong>Budget</strong>, by Revenue Type<br />
Table GB0-5 itemizes <strong>the</strong> changes by revenue type between <strong>the</strong> FY 2009 approved budget and <strong>the</strong> FY 2010 proposed<br />
budget. The four categories <strong>of</strong> changes reflected in this table are: (1) changes to <strong>the</strong> baseline budget (includes<br />
agency request), (2) changes representing cost savings or efficiencies, (3) changes related to policy initiatives, and (4)<br />
changes to specifically address <strong>the</strong> projected revenue shortfall.<br />
Table GB0-5<br />
(dollars in thousands)<br />
PROGRAM BUDGET FTE<br />
LOCAL FUND: FY 2009 Approved <strong>Budget</strong> and FTE 1,660 23.0<br />
Initial and Baseline Adjustments<br />
Net effect <strong>of</strong> fixed cost adjustments - occupancy fixed costs reduction DC PCSB -202 0.0<br />
Net effect <strong>of</strong> salary and benefits changes - Net increase for salaries DC PCSB 202 0.0<br />
and fringe benefits<br />
LOCAL FUND: FY 2010 Proposed <strong>Budget</strong> and FTE 1,660 23.0<br />
SPECIAL PURPOSE REVENUE FUNDS: FY 2009 Approved <strong>Budget</strong> and FTE 1,800 0.0<br />
Initial and Baseline Adjustments<br />
Net effect <strong>of</strong> fixed cost adjustments - Increase in Fixed costs DC Public Charter Schools 237 0.0<br />
Board<br />
Net effect <strong>of</strong> salary and benefits changes - Reduction in DC Public Charter Schools -167 0.0<br />
personal services Board<br />
Intra-<strong>Agency</strong> Changes - Reduction in supplies and materials DC Public Charter Schools -5 0.0<br />
Board<br />
Intra-<strong>Agency</strong> Changes - Reduction in o<strong>the</strong>r services and charges DC Public Charter Schools -52 0.0<br />
Board<br />
Intra-<strong>Agency</strong> Changes - Increase in contractual services DC Public Charter Schools 155 0.0<br />
Board<br />
Intra-<strong>Agency</strong> Changes - Increase equipment and equipment rentals DC Public Charter Schools 9 0.0<br />
Board<br />
SPECIAL PURPOSE REVENUE FUNDS: FY 2010 Proposed <strong>Budget</strong> and FTE 1,976 0.0<br />
Gross for GB0 - Public Charter School Board 3,637 23.0<br />
FY 2010 Proposed <strong>Budget</strong> and <strong>Financial</strong> Plan<br />
D-80
<strong>Office</strong> <strong>of</strong> <strong>the</strong> Deputy Mayor for<br />
Education<br />
http://dme.dc.gov<br />
Telephone: 202-727-3636<br />
(GW0)<br />
% Change<br />
FY 2008 FY 2009 FY 2010 from<br />
Description Actual Approved Proposed FY 2009<br />
Operating <strong>Budget</strong> $2,466,847 $4,892,248 $777,908 -84.1<br />
FTEs 1.0 16.0 7.0 -56.3<br />
The mission <strong>of</strong> <strong>the</strong> <strong>Office</strong> <strong>of</strong> <strong>the</strong> Deputy Mayor for Education is to<br />
support <strong>the</strong> Mayor in developing and implementing his vision that<br />
"<strong>the</strong> District <strong>of</strong> Columbia has a world class education system, enabling<br />
children, youth and adults to compete locally and globally."<br />
Summary <strong>of</strong> Services<br />
The function <strong>of</strong> <strong>the</strong> Deputy Mayor for Education is<br />
to plan, coordinate, and supervise all public education<br />
and education-related policy and activities under its<br />
jurisdiction, including development and support <strong>of</strong><br />
programs to improve <strong>the</strong> delivery <strong>of</strong> educational services<br />
and opportunities, from early childhood to <strong>the</strong><br />
post-secondary education level, and coordination <strong>of</strong><br />
interagency initiatives targeted at supporting students<br />
and schools.<br />
The agency’s FY 2010 proposed budget is presented<br />
in <strong>the</strong> following tables:<br />
<strong>Office</strong> <strong>of</strong> <strong>the</strong> Deputy Mayor for Education<br />
D-81
FY 2010 Proposed Gross Funds Operating <strong>Budget</strong>, by Revenue Type<br />
Table GW0-1 contains <strong>the</strong> proposed FY 2010 agency budget compared to <strong>the</strong> FY 2009 approved budget. It also<br />
provides FY 2007 and FY 2008 actual expenditures.<br />
Table GW0-1<br />
(dollars in thousands)<br />
Actual Actual Approved Proposed<br />
Change<br />
from Percent<br />
Appropriated Fund<br />
General Fund<br />
FY 2007 FY 2008 FY 2009 FY 2010 FY 2009 Change*<br />
Local Funds 0 2,467 4,892 778 -4,114 -84.1<br />
Total for General Fund 0 2,467 4,892 778 -4,114 -84.1<br />
Gross Funds 0 2,467 4,892 778 -4,114 -84.1<br />
*Percent Change is based on whole dollars.<br />
Note: If applicable, for a breakdown <strong>of</strong> each Grant (Federal and Private), Special Purpose Revenue type and Intra-District agreement,<br />
please refer to Schedule 80 <strong>Agency</strong> Summary by Revenue Source in <strong>the</strong> Operating Appendices located on <strong>the</strong> <strong>Office</strong> <strong>of</strong> <strong>the</strong> <strong>Chief</strong><br />
<strong>Financial</strong> <strong>Office</strong>r’s website.<br />
FY 2010 Proposed Full-Time Equivalents, by Revenue Type<br />
Table GW0-2 contains <strong>the</strong> proposed FY 2010 FTE level compared to <strong>the</strong> FY 2009 approved FTE level by revenue<br />
type. It also provides FY 2007 and FY 2008 actual data.<br />
Table GW0-2<br />
Change<br />
Actual Actual Approved Proposed from Percent<br />
Appropriated Fund FY 2007 FY 2008 FY 2009 FY 2010 FY 2009 Change*<br />
General Fund<br />
Local Funds 0.0 1.0 16.0 7.0 -9.0 -56.3<br />
Total for General Fund 0.0 1.0 16.0 7.0 -9.0 -56.3<br />
Total Proposed FTEs 0.0 1.0 16.0 7.0 -9.0 -56.3<br />
FY 2010 Proposed <strong>Budget</strong> and <strong>Financial</strong> Plan<br />
D-82
FY 2010 Proposed Operating <strong>Budget</strong>, by Comptroller Source Group<br />
Table GW0-3 contains <strong>the</strong> proposed FY 2010 budget at <strong>the</strong> Comptroller Source Group (object class) level compared<br />
to <strong>the</strong> FY 2009 approved budget. It also provides FY 2007 and FY 2008 actual expenditures.<br />
Table GW0-3<br />
(dollars in thousands)<br />
Actual Actual Approved Proposed<br />
Change<br />
from Percent<br />
Comptroller Source Group FY 2007 FY 2008 FY 2009 FY 2010 FY 2008 Change*<br />
11 Regular Pay - Cont Full Time 0 1,188 1,460 596 -864 -59.2<br />
12 Regular Pay - O<strong>the</strong>r 0 116 101 0 -101 -100.0<br />
13 Additional Gross Pay 0 4 0 0 0 N/A<br />
14 Fringe Benefits - Curr Personnel 0 195 289 133 -156 -53.9<br />
Subtotal Personal Services (PS) 0 1,503 1,850 729 -1,120 -60.6<br />
20 Supplies and Materials 0 10 13 1 -12 -92.3<br />
31 Telephone, Telegraph, Telegram, Etc 0 0 0 31 31 N/A<br />
40 O<strong>the</strong>r Services and Charges 0 452 2,158 17 -2,142 -99.2<br />
41 Contractual Services - O<strong>the</strong>r 0 479 791 0 -791 -100.0<br />
50 Subsidies and Transfers 0 0 75 0 -75 -100.0<br />
70 Equipment & Equipment Rental 0 23 6 0 -6 -100.0<br />
Subtotal Nonpersonal Services (NPS) 0 964 3,043 49 -2,994 -98.4<br />
Gross Funds 0 2,467 4,892 778 -4,114 -84.1<br />
*Percent Change is based on whole dollars.<br />
Program Description<br />
The <strong>Office</strong> <strong>of</strong> <strong>the</strong> Deputy Mayor for Education operates<br />
through <strong>the</strong> following program:<br />
Department <strong>of</strong> Education, which is comprised <strong>of</strong> <strong>the</strong><br />
following activity:<br />
■ <strong>Agency</strong> Oversight and Support – provides for <strong>the</strong><br />
management <strong>of</strong> education-policy initiatives that<br />
accomplish <strong>the</strong> Mayor’s public education objectives.<br />
Program Structure Change<br />
The <strong>Office</strong> <strong>of</strong> <strong>the</strong> Deputy Mayor for Education had<br />
no program structure changes in <strong>the</strong> FY 2010<br />
Proposed <strong>Budget</strong>.<br />
<strong>Office</strong> <strong>of</strong> <strong>the</strong> Deputy Mayor for Education<br />
D-83
FY 2010 Proposed Operating <strong>Budget</strong> and FTEs, by Program and Activity<br />
Table GW0-4 contains <strong>the</strong> proposed FY 2010 budget by program and activity compared to <strong>the</strong> FY 2009 approved budget.<br />
It also provides FY 2008 actual data.<br />
Table GW0-4<br />
(dollars in thousands)<br />
Dollars in Thousands Full-Time Equivalents<br />
Change Change<br />
Actual Approved Proposed from Actual Approved Proposed from<br />
Program/Activity<br />
(1000) <strong>Agency</strong> Management Program<br />
FY 2008 FY 2009 FY 2010 FY 2009 FY 2008 FY 2009 FY 2010 FY 2009<br />
(1010) Personnel 0 0 0 0 0.0 4.0 0.0 -4.0<br />
Subtotal (1000) <strong>Agency</strong> Management Program<br />
(2000) Department <strong>of</strong> Education<br />
0 0 0 0 0.0 4.0 0.0 -4.0<br />
(2010) <strong>Agency</strong> Oversight and Support 1,939 2,108 778 -1,330 1.0 9.0 7.0 -2.0<br />
(2015) <strong>Office</strong> <strong>of</strong> Parent and Community Involvement 346 2,283 0 -2,283 0.0 3.0 0.0 -3.0<br />
(2020) <strong>Office</strong> <strong>of</strong> <strong>the</strong> Ombudsman for Public Education 182 501 0 -501 0.0 0.0 0.0 0.0<br />
Subtotal (2000) Department Of Education 2,467 4,892 778 -4,114 1.0 12.0 7.0 -5.0<br />
Total Proposed Operating <strong>Budget</strong> 2,467 4,892 778 -4,114 1.0 16.0 7.0 -9.0<br />
(Change is calculated by whole numbers and numbers may not add up due to rounding)<br />
Note: For more detailed information regarding <strong>the</strong> proposed funding for <strong>the</strong> agency’s activities within this agency’s programs, please see Schedule<br />
30-PBB, Program Summary by Activity, in <strong>the</strong> FY 2010 Operating Appendices located on <strong>the</strong> <strong>Office</strong> <strong>of</strong> <strong>the</strong> <strong>Chief</strong> <strong>Financial</strong> <strong>Office</strong>r’s website<br />
Major Baseline Adjustments, Cost Savings<br />
and Policy Initiatives<br />
Initial Adjustments: An increase <strong>of</strong> $283,910 to convert<br />
5 contract employees to District employees and a<br />
reallocation <strong>of</strong> 4 positions from <strong>the</strong> <strong>Agency</strong><br />
Management Program to <strong>the</strong> <strong>Agency</strong> Oversight and<br />
Support activity.<br />
Cost Savings: The proposed budget eliminates<br />
$694,000 in contract costs. In addition, <strong>the</strong> proposed<br />
budget reduces funding for <strong>the</strong> Interagency<br />
Collaboration and Service Integration Commission<br />
by $150,000. Finally, <strong>the</strong> proposed budget reduces<br />
funding for <strong>the</strong> <strong>Office</strong> <strong>of</strong> <strong>the</strong> Ombudsman by<br />
$39,000 to align funding with historical expenditures.<br />
The <strong>Office</strong> <strong>of</strong> <strong>the</strong> Ombudsman, comprised <strong>of</strong> 4.0<br />
FTEs and $470,596 in Local funds, was transferred<br />
to <strong>the</strong> District <strong>of</strong> Columbia State Board <strong>of</strong> Education.<br />
FY 2010 Proposed <strong>Budget</strong> and <strong>Financial</strong> Plan<br />
D-84<br />
Additionally, 2 FTEs and $493,000 was transfered<br />
from <strong>Agency</strong> Oversight to <strong>the</strong> District <strong>of</strong> Columbia<br />
State Board <strong>of</strong> Eduction. Please refer to agency<br />
(GE0) in this volume. The Interagency<br />
Collaboration and Service Integration Commission,<br />
comprised <strong>of</strong> $2,297,465 and 8.0 FTEs, was transferred<br />
to <strong>the</strong> District <strong>of</strong> Columbia Public Schools.<br />
For fur<strong>the</strong>r information, please refer to chapter<br />
(GA0) in this volume.<br />
Policy Initiatives: The Deputy Mayor for Education’s<br />
budget for telecommunications will increase by<br />
$31,000 based on revised estimates.
FY 2009 Approved <strong>Budget</strong> to FY 2010 Proposed <strong>Budget</strong>, by Revenue Type<br />
Table GW0-5 itemizes <strong>the</strong> changes by revenue type between <strong>the</strong> FY 2009 approved budget and <strong>the</strong> FY 2010 proposed<br />
budget. The four categories <strong>of</strong> changes reflected in this table are: (1) changes to <strong>the</strong> baseline budget (includes<br />
agency request), (2) changes representing cost savings or efficiencies, (3) changes related to policy initiatives, and (4)<br />
changes to specifically address <strong>the</strong> projected revenue shortfall.<br />
Table GW0-5<br />
(dollars in thousands)<br />
PROGRAM BUDGET FTE<br />
LOCAL FUND: FY 2009 Approved <strong>Budget</strong> and FTE<br />
Initial and Baseline Adjustments<br />
Net effect <strong>of</strong> salary and benefits changes - Align FTEs to<br />
4,892 16.0<br />
correct budget program <strong>Agency</strong> Management Program 0 -4.0<br />
Net effect <strong>of</strong> salary and benefits changes - Conversion <strong>of</strong> 5 Contract<br />
Employees to District FTEs & reallocation <strong>of</strong> 4 FTEs from <strong>Agency</strong><br />
Management Program<br />
Department <strong>of</strong> Education 284 9.0<br />
Intra-<strong>Agency</strong> Changes - Conversion <strong>of</strong> 5 Contract Employees to District FTEs Department <strong>of</strong> Education -284 0.0<br />
Policy Initiatives and Cost Savings<br />
Adjustment - Transfer ICSIC one-time funding to Department <strong>of</strong> Education -2,297 -8.0<br />
DCPS <strong>Office</strong> <strong>of</strong> Youth Engagement<br />
Adjustment - Transfer to new agency State Board <strong>of</strong> Education Department <strong>of</strong> Education -964 -6.0<br />
Cost Decrease - Align budget with anticipated expenditures in <strong>the</strong> Department <strong>of</strong> Education -39 0.0<br />
<strong>Office</strong> <strong>of</strong> <strong>the</strong> Ombudsman<br />
Cost Savings - Reduce funding for <strong>the</strong> Inter-<strong>Agency</strong> Collaboration and Department <strong>of</strong> Education -150 0.0<br />
Service Integration Commission projects<br />
Reduce - Eliminate nonrecurring contract expenses in <strong>the</strong> <strong>Agency</strong> Department <strong>of</strong> Education -694 0.0<br />
Oversight and Support program<br />
Cost Increase - Align telecom budget with revised OCTO estimates Department <strong>of</strong> Education 31 0.0<br />
LOCAL FUND: FY 2010 Proposed <strong>Budget</strong> and FTE 778 7.0<br />
Gross for GW0 - <strong>Office</strong> <strong>of</strong> <strong>the</strong> Deputy Mayor for Education 778 7.0<br />
<strong>Office</strong> <strong>of</strong> <strong>the</strong> Deputy Mayor for Education<br />
D-85
<strong>Agency</strong> Performance Plan<br />
The agency’s Performance Plan has <strong>the</strong> following<br />
objectives for FY 2010:<br />
Objective 1: Execute a District-wide educational<br />
strategy that addresses <strong>the</strong> needs <strong>of</strong> students, parents<br />
and <strong>the</strong> community at all stages <strong>of</strong> <strong>the</strong> education life<br />
cycle (from early childhood to adult education).<br />
Objective 2: Coordinate high-quality services and<br />
programs that reach across city agencies and educational<br />
institutions to improve child and youth outcomes.<br />
<strong>Agency</strong> Performance Measures<br />
Table GW0-6<br />
FY 2010 Proposed <strong>Budget</strong> and <strong>Financial</strong> Plan<br />
D-86<br />
Objective 3: Partner with community-based organizations<br />
and <strong>the</strong> private sector to enhance <strong>the</strong> resources<br />
and opportunities available to <strong>the</strong> public education<br />
system.<br />
FY 2007 FY 2008 FY 2008<br />
Year-End Original Year-End FY 2009 FY 2010 FY 2011<br />
Measure<br />
Objective 1:<br />
Actual Target Actual Projection Projection Projection<br />
Square feet per student in DCPS school facilities 299 260 N/A 240 230 230<br />
Percent <strong>of</strong> excess school space being utilized<br />
Percent <strong>of</strong> target population with access to<br />
N/A Baseline N/A +10% +10% +10%<br />
alternative education programs<br />
Objective 2:<br />
Number <strong>of</strong> students served by evidence-based<br />
N/A Baseline N/A +10% +10% +10%<br />
practices<br />
Percent <strong>of</strong> ICSIC interagency indicators that exhibit<br />
N/A Baseline N/A +10% +10% +10%<br />
interagency gains<br />
Objective 3:<br />
Number <strong>of</strong> students benefiting from partnerships<br />
N/A N/A N/A 70% 75% 80%<br />
with area arts organizations N/A N/A N/A Baseline +10% +10%
<strong>Office</strong> <strong>of</strong> Public Education Facilities<br />
Modernization<br />
www.opefm.dc.gov<br />
Telephone: 202-698-7700<br />
Summary <strong>of</strong> Services<br />
The <strong>Office</strong> <strong>of</strong> Public Education Facilities<br />
Modernization (OPEFM) was established in Title VII<br />
<strong>of</strong> <strong>the</strong> Public Education Reform Amendment Act <strong>of</strong><br />
2007. The agency’s primary services are renovating<br />
and rehabilitating existing public school facilities,<br />
constructing new schools, developing <strong>the</strong> Master<br />
Facilities Plan, and providing routine maintenance to<br />
(GM0)<br />
% Change<br />
FY 2008 FY 2009 FY 2010 from<br />
Description Actual Approved Proposed FY 2009<br />
Operating <strong>Budget</strong> $36,880,556 $38,305,841 $32,199,258 -15.9<br />
FTEs 5.0 400.0 269.0 -32.8<br />
The mission <strong>of</strong> <strong>the</strong> <strong>Office</strong> <strong>of</strong> Public Education Facilities<br />
Modernization is to bring all District <strong>of</strong> Columbia Public Schools<br />
facilities into conformance with a common set <strong>of</strong> standards conducive<br />
to <strong>the</strong> support <strong>of</strong> 21st century education, as rapidly as possible within<br />
<strong>the</strong> financial capacity <strong>of</strong> <strong>the</strong> District <strong>of</strong> Columbia, while also ensuring<br />
<strong>the</strong> provision and maintenance <strong>of</strong> safe, healthy, and comfortable learning<br />
environments.<br />
public school facilities. OPEFM also implements<br />
education-related projects for o<strong>the</strong>r District agencies<br />
as directed.<br />
The agency’s FY 2010 proposed budget is presented<br />
in <strong>the</strong> following tables:<br />
<strong>Office</strong> <strong>of</strong> Public Education Facilities Modernization<br />
D-87
FY 2010 Proposed Gross Funds Operating <strong>Budget</strong>, by Revenue Type<br />
Table GM0-1 contains <strong>the</strong> proposed FY 2010 agency budget compared to <strong>the</strong> FY 2009 approved budget. It also<br />
provides FY 2007 and FY 2008 actual expenditures.<br />
Table GM0-1<br />
(dollars in thousands)<br />
Actual Actual Approved Proposed<br />
Change<br />
from Percent<br />
Appropriated Fund<br />
General Fund<br />
FY 2007 FY 2008 FY 2009 FY 2010 FY 2009 Change*<br />
Local Funds 1,281 34,981 22,368 28,914 6,545 29.3<br />
Special Purpose Revenue Funds 0 0 15,938 3,286 -12,652 -79.4<br />
Total for General Fund 1,281 34,981 38,306 32,199 -6,107 -15.9<br />
Intra-District Funds<br />
Intra-District Funds 0 1,900 0 0 0 N/A<br />
Total for Intra-District Funds 0 1,900 0 0 0 N/A<br />
Gross Funds 1,281 36,881 38,306 32,199 -6,107 -15.9<br />
*Percent Change is based on whole dollars.<br />
Note: If applicable, for a breakdown <strong>of</strong> each Grant (Federal and Private), Special Purpose Revenue type and Intra-District agreement,<br />
please refer to Schedule 80, <strong>Agency</strong> Summary by Revenue Source, in <strong>the</strong> Operating Appendices located on <strong>the</strong> <strong>Office</strong> <strong>of</strong> <strong>the</strong> <strong>Chief</strong><br />
<strong>Financial</strong> <strong>Office</strong>r’s website.<br />
FY 2010 Proposed Full-Time Equivalents, by Revenue Type<br />
Table GM0-2 contains <strong>the</strong> proposed FY 2010 FTE level compared to <strong>the</strong> FY 2009 approved FTE level by revenue<br />
type. It also provides FY 2007 and FY 2008 actual data.<br />
Table GM0-2<br />
Change<br />
Actual Actual Approved Proposed from Percent<br />
Appropriated Fund FY 2007 FY 2008 FY 2009 FY 2010 FY 2009 Change*<br />
General Fund<br />
Local Funds 0.0 5.0 284.0 264.9 -19.1 -6.7<br />
Special Purpose Revenue Funds 0.0 0.0 116.0 4.1 -111.9 -96.5<br />
Total for General Fund 0.0 5.0 400.0 269.0 -131.0 -32.8<br />
Total Proposed FTEs 0.0 5.0 400.0 269.0 -131.0 -32.8<br />
FY 2010 Proposed <strong>Budget</strong> and <strong>Financial</strong> Plan<br />
D-88
FY 2010 Proposed Operating <strong>Budget</strong>, by Comptroller Source Group<br />
Table GM0-3 contains <strong>the</strong> proposed FY 2010 budget at <strong>the</strong> Comptroller Source Group (object class) level compared<br />
to <strong>the</strong> FY 2009 approved budget. It also provides FY 2007 and FY 2008 actual expenditures.<br />
Table GM0-3<br />
(dollars in thousands)<br />
Actual Actual Approved Proposed<br />
Change<br />
from Percent<br />
Comptroller Source Group FY 2007 FY 2008 FY 2009 FY 2010 FY 2009 Change*<br />
11 Regular Pay - Cont Full Time 167 20,249 20,643 16,924 -3,719 -18.0<br />
12 Regular Pay - O<strong>the</strong>r 0 931 70 63 -7 -10.5<br />
13 Additional Gross Pay 41 393 0 260 260 N/A<br />
14 Fringe Benefits - Curr Personnel 29 4,278 2,359 2,892 533 22.6<br />
15 Overtime Pay 0 2,502 5,471 2,205 -3,266 -59.7<br />
Subtotal Personal Services (PS) 237 28,353 28,543 22,343 -6,199 -21.7<br />
20 Supplies and Materials 20 807 2,149 1,762 -387 -18.0<br />
30 Energy, Comm. and Bldg Rentals 6 3 60 575 515 858.0<br />
31 Telephone, Telegraph, Telegram, Etc 23 458 192 381 189 98.3<br />
32 Rentals - Land and Structures 95 210 315 323 8 2.5<br />
33 Janitorial Services 0 24 88 0 -88 -100.0<br />
34 Security Services 0 37 90 135 45 50.0<br />
40 O<strong>the</strong>r Services and Charges 44 754 1,566 498 -1,068 -68.2<br />
41 Contractual Services - O<strong>the</strong>r 556 5,452 3,042 6,017 2,974 97.8<br />
70 Equipment & Equipment Rental 300 783 2,261 166 -2,095 -92.7<br />
Subtotal Nonpersonal Services (NPS) 1,044 8,528 9,763 9,856 93 0.9<br />
Gross Funds 1,281 36,881 38,306 32,199 -6,107 -15.9<br />
*Percent Change is based on whole dollars.<br />
<strong>Office</strong> <strong>of</strong> Public Education Facilities Modernization<br />
D-89
Program Description<br />
The <strong>Office</strong> <strong>of</strong> Public Education Facilities Modernization<br />
operates through <strong>the</strong> following 5 programs:<br />
Repairs and Maintenance and Repairs and<br />
Maintenance/NPS – provide programs that operate<br />
<strong>the</strong> agency’s key function to provide for efficient and<br />
effective repairs and maintenance <strong>of</strong> <strong>the</strong> school buildings<br />
and properties.<br />
This program contains <strong>the</strong> following 3 activities:<br />
■ Repairs and Maintenance/NPS - provides repair<br />
and maintenance <strong>of</strong> school facilities so as to optimize<br />
performance and maintain <strong>the</strong> value <strong>of</strong> <strong>the</strong><br />
school inventory system as well as provide a safe<br />
learning environment for <strong>the</strong> District’s students;<br />
■ Operations and Maintenance Division — provides<br />
activities concerned with keeping <strong>the</strong><br />
grounds, buildings and fixed equipment in <strong>the</strong>ir<br />
original condition or efficient, ei<strong>the</strong>r through<br />
repairs or by replacement during <strong>the</strong> life expectancy<br />
<strong>of</strong> <strong>the</strong> component or building; and<br />
■ Logistics - provides direction and management<br />
for warehousing, shipping and receiving services,<br />
reproduction services and property management.<br />
Business Operations/<strong>Financial</strong> Services – provides<br />
for <strong>the</strong> administrative functions <strong>of</strong> <strong>the</strong> agency including<br />
construction management, planning, and maintenance<br />
operations management.<br />
Realty <strong>Office</strong> – leases <strong>the</strong> facilities <strong>of</strong> <strong>the</strong> DC Public<br />
Schools (DCPS) to various organizations for fees.<br />
These fees are deposited in <strong>the</strong> Lease Income account,<br />
which is a special purpose revenue source to be used<br />
to support <strong>the</strong> maintenance <strong>of</strong> DCPS’ facilities. In<br />
FY 2009, <strong>the</strong> District transferred <strong>the</strong> Lease Income<br />
account from DCPS to OPEFM since OPEFM has<br />
taken over facility maintenance activities from DCPS.<br />
However, <strong>the</strong> Realty <strong>Office</strong>, which manages <strong>the</strong> Lease<br />
Income account, was not transferred from DCPS to<br />
OPEFM in FY 2009. The FY 2010 budget transfers<br />
<strong>the</strong> Realty <strong>Office</strong> from DCPS to OPEFM so that<br />
OPEFM will be able to supervise <strong>the</strong> Realty <strong>Office</strong><br />
and control <strong>the</strong> Lease Income account.<br />
FY 2010 Proposed <strong>Budget</strong> and <strong>Financial</strong> Plan<br />
D-90<br />
<strong>Agency</strong> Management - provides for administrative<br />
support and <strong>the</strong> required tools to achieve operational<br />
and programmatic results. This program is standard<br />
for all agencies using performance-based budgeting.<br />
<strong>Agency</strong> <strong>Financial</strong> Operations – provides comprehensive<br />
and efficient financial management services to<br />
and on behalf <strong>of</strong> District agencies so that <strong>the</strong> financial<br />
integrity <strong>of</strong> <strong>the</strong> District <strong>of</strong> Columbia is maintained.<br />
This program is standard for all agencies using performance-based<br />
budgeting.<br />
Program Structure Change<br />
To better track its expenditures, <strong>the</strong> agency added <strong>the</strong><br />
Business Operations program, and to align with<br />
District-wide standardized budgeting practices, <strong>the</strong><br />
agency established <strong>the</strong> <strong>Agency</strong> <strong>Financial</strong> Operations<br />
standard program (entitled <strong>Agency</strong> OCFO program).<br />
The agency also realigned <strong>the</strong> former Repairs and<br />
Maintenance Program, and established three new<br />
activities within <strong>the</strong> program.
FY 2010 Proposed Operating <strong>Budget</strong> and FTEs, by Program and Activity<br />
Table GM0-4 contains <strong>the</strong> proposed FY 2010 budget by program and activity compared to <strong>the</strong> FY 2009 approved budget.<br />
It also provides FY 2008 actual data.<br />
Table GM0-4<br />
(dollars in thousands)<br />
Dollars in Thousands Full-Time Equivalents<br />
Change Change<br />
Actual Approved Proposed from Actual Approved Proposed from<br />
Program/Activity<br />
(1000) <strong>Agency</strong> Management Program<br />
FY 2008 FY 2009 FY 2010 FY 2009 FY 2008 FY 2009 FY 2010 FY 2009<br />
(1010) Personnel 1,553 2,193 3,136 943 5.0 17.0 13.0 -4.0<br />
(1020) Contracting and Procurement 3,120 1,661 0 -1,661 0.0 0.0 0.0 0.0<br />
(1095) <strong>Agency</strong> Management O<strong>the</strong>r 0 0 159 159 0.0 0.0 2.0 2.0<br />
Subtotal (1000) <strong>Agency</strong> Management Program 4,673<br />
(3000) Facilities Modernization Support Program<br />
3,854 3,295 -559 5.0 17.0 15.0 -2.0<br />
(3010) Facilities Modernization Support Program 1,900 0 0 0 0.0 0.0 0.0 0.0<br />
Subtotal (3000) Facilities Modernization Support Program<br />
(5000) Repairs and Maintenance<br />
1,900 0 0 0 0.0 0.0 0.0 0.0<br />
(5010) Repairs and Maintenance 0 28,304 0 -28,304 0.0 383.0 0.0 -383.0<br />
(5211) <strong>Office</strong> <strong>of</strong> Facilities Management 61 0 0 0 0.0 0.0 0.0 0.0<br />
(5221) Planning, Design & Constr. Division 103 0 354 354 0.0 0.0 3.5 3.5<br />
Subtotal (5000) Repairs and Maintenance<br />
(5001) Repairs and Maintenance/NPS<br />
165 28,304 354 -27,950 0.0 383.0 3.5 -379.5<br />
(5015) Repairs and Maintenance/NPS 0 6,148 2,892 -3,255 0.0 0.0 0.0 0.0<br />
(5231) Operations & Maintenance Division 28,034 0 21,870 21,870 0.0 0.0 221.0 221.0<br />
(5251) Logistic 1,599 0 469 469 0.0 0.0 1.0 1.0<br />
Subtotal (5001) Repairs and Maintenance/NPS 29,634<br />
(5002) Business Operations/<strong>Financial</strong> Services<br />
6,148 25,232 19,084 0.0 0.0 222.0 222.0<br />
(5095) Business Operations/<strong>Financial</strong> Services 509 0 1,724 1,724 0.0 0.0 12.5 12.5<br />
Subtotal (5002) Business Operations/<strong>Financial</strong> Services 509<br />
(6000) <strong>Agency</strong> OCFO<br />
0 1,724 1,724 0.0 0.0 12.5 12.5<br />
(6015) AFO - O<strong>the</strong>r 0 0 234 234 0.0 0.0 2.1 2.1<br />
(6050) AFO - <strong>Budget</strong> 0 0 290 290 0.0 0.0 1.9 1.9<br />
(6055) AFO - Accounting 0 0 569 569 0.0 0.0 5.0 5.0<br />
Subtotal (6000) <strong>Agency</strong> OCFO<br />
(7000) Realty <strong>Office</strong><br />
0 0 1,094 1,094 0.0 0.0 9.0 9.0<br />
(7010) Realty <strong>Office</strong> 0 0 501 501 0.0 0.0 7.0 7.0<br />
Subtotal (7000) Realty <strong>Office</strong> 0 0 501 501 0.0 0.0 7.0 7.0<br />
Total Proposed Operating <strong>Budget</strong> 36,881 38,306 32,199 -6,107 5.0 400.0 269.0 -131.0<br />
Note: For more detailed information regarding <strong>the</strong> proposed funding for <strong>the</strong> activities within <strong>the</strong> agency’s programs, please see Schedule 30-PBB,<br />
Program Summary by Activity, in <strong>the</strong> FY 2010 Operating Appendices located on <strong>the</strong> <strong>Office</strong> <strong>of</strong> <strong>the</strong> <strong>Chief</strong> <strong>Financial</strong> <strong>Office</strong>r’s website.<br />
(Change is calculated by whole numbers and numbers may not add up due to rounding)<br />
<strong>Office</strong> <strong>of</strong> Public Education Facilities Modernization<br />
D-91
Major Baseline Adjustments, Cost Savings<br />
and Policy Initiatives<br />
Initial Adjustments: The agency’s FY 2009 approved<br />
budget included $12.4 million in nonrecurring<br />
Special Purpose Revenue that was not available to <strong>the</strong><br />
FY 2010 Special Purpose Revenue budget. To<br />
remain within <strong>the</strong> level <strong>of</strong> Special Purpose Revenue<br />
projected available for FY 2010, <strong>the</strong> agency’s request<br />
decreased by $12,652,061 in Special Purpose<br />
Revenue. There was a decrease <strong>of</strong> 184.0 gross FTEs<br />
below <strong>the</strong> FY 2009 approved budget level, which<br />
included <strong>the</strong> effects <strong>of</strong> agency reductions to remain<br />
within <strong>the</strong> provided Local funds target, <strong>the</strong> correction<br />
<strong>of</strong> an overstatement <strong>of</strong> <strong>the</strong> agency’s Local funds FTE<br />
count in <strong>the</strong> FY 2009 budget, (<strong>the</strong> approved budget<br />
FTE level is 400.0; however OPEFM is operating for<br />
FY 2009 at 345.0 FTEs) and <strong>the</strong> reduction in Special<br />
Purpose Revenue funds.<br />
Baseline Adjustments: An increase <strong>of</strong> $8,289,682<br />
and 112.0 FTEs in Local funds, which provides<br />
funding and FTE authorization for 112.0 FTEs budgeted<br />
under nonrecurring Special Purpose Revenue<br />
fund balance in <strong>the</strong> FY 2009 Approved budget, as<br />
well as funds for required additional gross pay and<br />
overtime at levels consistent with <strong>the</strong> prior year’s projected<br />
expenditures. The FY 2009 non-recurring<br />
Special Purpose Revenue fund balance supported<br />
129.0 FTEs. The increase in local funding in FY<br />
2010 partially makes up for <strong>the</strong> non-recurring revenue<br />
as it supports 112.0 FTEs, representing a<br />
decrease <strong>of</strong> 17.0 FTEs from <strong>the</strong> FY 2009 level. In<br />
nonpersonal services, funds were added to maintain<br />
contractual services, supplies and equipment at <strong>the</strong><br />
levels <strong>the</strong> agency projected would be required for FY<br />
2010 to maintain current service levels. Additionally,<br />
<strong>the</strong>re was an increase <strong>of</strong> $578,687 for fixed costs for<br />
<strong>the</strong> agency’s operations in <strong>the</strong> Penn Center facility.<br />
Cost Savings: The primary cost savings measure in<br />
<strong>the</strong> OPEFM in FY 2010 is a reduction <strong>of</strong> 66.0 FTEs<br />
within <strong>the</strong> Maintenance Operation, and primarily<br />
within <strong>the</strong> Logistics Unit. This unit includes positions<br />
responsible for repairing District <strong>of</strong> Columbia<br />
Public Schools (DCPS) equipment and furniture,<br />
warehousing, storage, delivery and inventory functions.<br />
These functions are not part <strong>of</strong> <strong>the</strong> OPEFM’s<br />
FY 2010 Proposed <strong>Budget</strong> and <strong>Financial</strong> Plan<br />
D-92<br />
core mission. Accordingly, <strong>the</strong> logistics functions are<br />
transferred to DCPS (12.0 FTEs and $650,460) in<br />
FY 2010 (see Table GM0-5). Additional efficiencies<br />
can be realized in FY 2010. OPEFM’s fleet and<br />
electricity budgets have also been adjusted based on<br />
revised fixed cost estimates.<br />
Protected Programs: The cost savings contained in<br />
OPEFM’s FY 2010 budget will not impact <strong>the</strong><br />
agency’s ability to fulfill its primary mission <strong>of</strong> modernizing<br />
and maintaining public school buildings.<br />
The District remains committed to providing every<br />
DCPS student with a comfortable and safe environment<br />
in which to learn.<br />
Gap-Closing Initiatives: The proposed FY 2010 gapclosing<br />
budget fur<strong>the</strong>r reduces Local Fund appropriations<br />
to OPEFM, saving $474,000.<br />
OPEFM will reduce expenditures for contractual<br />
services, out-<strong>of</strong>-town travel, uniform purchases, and<br />
IT purchases, while also in-sourcing trash hauling at<br />
RFK stadium, saving a total <strong>of</strong> $349,000. OPEFM<br />
will save ano<strong>the</strong>r $125,000 in equipment funding by<br />
delaying <strong>the</strong> purchase <strong>of</strong> a new scissor lift.<br />
The proposed FY 2010 policy initiatives budget<br />
fur<strong>the</strong>r increases Local Fund appropriations to<br />
OPEFM by $501,379 and 7.0 FTEs, which represents<br />
<strong>the</strong> transfer <strong>of</strong> <strong>the</strong> Realty <strong>Office</strong> from DCPS.
FY 2009 Approved <strong>Budget</strong> to FY 2010 Proposed <strong>Budget</strong>, by Revenue Type<br />
Table GM0-5 itemizes <strong>the</strong> changes by revenue type between <strong>the</strong> FY 2009 approved budget and <strong>the</strong> FY 2010 proposed<br />
budget. The four categories <strong>of</strong> changes reflected in this table are: (1) changes to <strong>the</strong> baseline budget (includes<br />
agency request), (2) changes representing cost savings or efficiencies, (3) changes related to policy initiatives, and (4)<br />
changes to specifically address <strong>the</strong> projected revenue shortfall.<br />
Table GM0-5<br />
(dollars in thousands)<br />
PROGRAM BUDGET FTE<br />
LOCAL FUND: FY 2009 Approved <strong>Budget</strong> and FTE 22,368 284.0<br />
Initial and Baseline Adjustments<br />
Net effect <strong>of</strong> fixed cost adjustments - Increase in energy and telephones Business Operations/<strong>Financial</strong> Services 298 0.0<br />
Net effect <strong>of</strong> fixed cost adjustments - Decrease in energy, telephones, <strong>Agency</strong> Management Program -57 0.0<br />
rent janitorial and security services<br />
Net effect <strong>of</strong> fixed cost adjustments - Decrease in telephones Repairs and Maintenance -132 0.0<br />
Net effect <strong>of</strong> salary and benefits changes - Increase in Personal services <strong>Agency</strong> OCFO 860 7.0<br />
Net effect <strong>of</strong> salary and benefits changes - Changes in Personal services Repairs and Maintenance/NPS 13,338 186.5<br />
Net effect <strong>of</strong> salary and benefits changes - Decrease in Personal services <strong>Agency</strong> Management Program -389 -3.0<br />
Net effect <strong>of</strong> salary and benefits changes - Decrease in Personal services Repairs and Maintenance -13,969 -266.0<br />
Net effect <strong>of</strong> salary and benefits changes - Increase in Personal services Business Operations/<strong>Financial</strong> Services 247 3.5<br />
Intra-<strong>Agency</strong> Changes - Decrease in supplies, O<strong>the</strong>r Services and Charges, Repairs and Maintenance -4,241 0.0<br />
Contractual Services and Equipment<br />
Intra-<strong>Agency</strong> Changes - Increase in Supplies, O<strong>the</strong>r Services and Charges, Business Operations/<strong>Financial</strong> Services 78 0.0<br />
Contractual Services and Equipment<br />
Intra-<strong>Agency</strong> Changes - Increase in Supplies, O<strong>the</strong>r Services and Charges, Repair and Maintenance/NPS 3,996 0.0<br />
Contractual Services and Equipment<br />
Intra-<strong>Agency</strong> Changes - Decrease in Supplies, O<strong>the</strong>r Services and Charges, <strong>Agency</strong> Management Program -29 0.0<br />
Contractual Services and Equipment<br />
Baseline Adjustments: Net effect <strong>of</strong> fixed cost adjustments- Business Operations/<strong>Financial</strong> Services 581 0.0<br />
Increase in energy and telephones<br />
Baseline Adjustments: Net effect <strong>of</strong> fixed cost adjustments <strong>Agency</strong> Management Program -3 0.0<br />
Decrease in energy, telephones, rent, janitorial and<br />
security services<br />
Baseline Adjustments: Intra-<strong>Agency</strong> Changes - Decrease <strong>Agency</strong> Management Program -2 0.0<br />
in O<strong>the</strong>r Services and Charges<br />
Baseline Adjustments: Intra-<strong>Agency</strong> Changes - Increase in O<strong>the</strong>r <strong>Agency</strong> Management Program 2 0.0<br />
Services and Charges, Contractual Services and Equipment<br />
Baseline Adjustments: Technical Adjustment - Increase in Personal Repairs and Maintenance 148 2.5<br />
services<br />
Baseline Adjustments: Technical Adjustment - Increase in Personal Business Operations/<strong>Financial</strong> Services 758 14.0<br />
services<br />
Baseline Adjustments: Technical Adjustment - Increase in Personal Repairs and Maintenance/NPS 7,384 95.5<br />
services<br />
Baseline Adjustments: Technical Adjustment - Increase in Supplies, O<strong>the</strong>r Repairs and Maintenance/NPS 1,740 0.0<br />
Services and Charges, Contractual Services and Equipment<br />
Baseline Adjustments: Technical Adjustment - Increase in Supplies, O<strong>the</strong>r Repairs and Maintenance 34 0.0<br />
Services and Charges, Contractual Services and Equipment<br />
Baseline Adjustments: Technical Adjustment - Increase in Supplies and Business Operations/<strong>Financial</strong> Services 67 0.0<br />
equipment<br />
(Continued on next page)<br />
<strong>Office</strong> <strong>of</strong> Public Education Facilities Modernization<br />
D-93
Table GM0-5 (continued)<br />
(dollars in thousands)<br />
Policy Initiatives and Cost Savings<br />
FY 2010 Proposed <strong>Budget</strong> and <strong>Financial</strong> Plan<br />
D-94<br />
PROGRAM BUDGET FTE<br />
Cost Decrease - Align electricity budget with revised OPM estimates <strong>Agency</strong> Management Program -8 0.0<br />
Cost Decrease - Align fleet budget with revised DPW estimates <strong>Agency</strong> Management Program -1 0.0<br />
Reduce - Reduce staffing <strong>of</strong> logistics, warehouse, computer repair,<br />
furniture repair, and musical instrument repair<br />
Multiple -3,531 -54.0<br />
Net effect <strong>of</strong> salary and benefits changes - transfer from -<br />
Logistics to DCPS<br />
Repairs and Maintenance -650 -12.0<br />
Gap-Closing Initiatives<br />
Reduction for nonrecurring costs - Contractual<br />
Services, out-<strong>of</strong>-town travel, uniform purchases, IT purchases, and trash<br />
hauling .<br />
Multiple Programs -474 0.0<br />
Increase - transfer RO functions from DCPS - Transfer $501,379 and 7.0<br />
FTEs from DCPS Realty <strong>Office</strong> program<br />
Realty <strong>Office</strong> Program - 7000 501 7.0<br />
LOCAL FUND: FY 2010 Proposed <strong>Budget</strong> and FTE 28,914 265.0<br />
SPECIAL PURPOSE REVENUE FUNDS: FY 2009 Approved <strong>Budget</strong> and FTE<br />
Initial and Baseline Adjustments<br />
15,938 116.0<br />
Net effect <strong>of</strong> salary and benefits changes - Increase in personal services <strong>Agency</strong> Management Program 159 2.0<br />
Net effect <strong>of</strong> salary and benefits changes - Increase in personal services <strong>Agency</strong> OCFO 234 2.0<br />
Net effect <strong>of</strong> salary and benefits changes - Decrease in personal services Repairs and Maintenance -9,790 -116.0<br />
Net effect <strong>of</strong> salary and benefits changes - Decrease in personal services Repairs and Maintenance/NPS -1,498 0.0<br />
Intra-<strong>Agency</strong> Changes - Decrease in supplies, o<strong>the</strong>r services and charges,<br />
Contractual Services and Equipment<br />
Repairs and Maintenance/NPS -1,757 0.0<br />
SPECIAL PURPOSE REVENUE FUNDS: FY 2010 Proposed <strong>Budget</strong> and FTE 3,286 4.1<br />
Gross for GM0 - <strong>Office</strong> <strong>of</strong> Public Education Facilities Modernization 32,199 269.0
<strong>Agency</strong> Performance Plan<br />
The agency’s Performance Plan has <strong>the</strong> following<br />
objectives for FY 2010:<br />
Objective 1: Modernize existing DCPS schools and<br />
facilities and build new DCPS schools and facilities.<br />
Objective 2: Establish preventive maintenance<br />
schedule for various systems associated with <strong>the</strong> operation<br />
<strong>of</strong> DCPS schools and facilities.<br />
<strong>Agency</strong> Performance Measures<br />
Table GM0-6<br />
Objective 3: Manage routine maintenance, repairs<br />
and small capital projects on DCPS schools and facilities<br />
that are beyond <strong>the</strong> scope <strong>of</strong> <strong>the</strong> janitorial and<br />
custodial staff.<br />
Objective 4: Apply performance benchmarks to<br />
assess and monitor personnel capabilities.<br />
FY 2007 FY 2008 FY 2008<br />
Year-End Original Year-End FY 2009 FY 2010 FY 2011<br />
Measure Actual Target Actual Projection Projection Projection<br />
Number <strong>of</strong> Work Orders Cleared* N/A N/A N/A 10,000 10,000 10,000<br />
Maintenance cost per sq. foot** N/A N/A N/A $1.81 $3.88<br />
Number <strong>of</strong> Projects under Study/Design/Construction*** N/A N/A N/A 18 17 17<br />
LSDBE Participation on Construction Projects**** N/A N/A N/A 50% 50% 50%<br />
*It is anticipated that <strong>the</strong> number <strong>of</strong> work order requests will substantially decrease each year as OPEFM reduces <strong>the</strong> backlogs <strong>of</strong> unresolved work orders and implement an<br />
improved work order tracking system.<br />
**Maintenance costs per square foot will increase with OPEFM’s infusion <strong>of</strong> additional funds and new focus and emphasis on maintenance. The FY 2008 represents a transitional<br />
period and is based on an approximate total <strong>of</strong> 15,500,000 square feet. The FY 2009 Projection is based on an approximate total <strong>of</strong> 12,100,000 square feet and an<br />
increase in maintenance funding.<br />
***It is anticipated that <strong>the</strong> number <strong>of</strong> projects under construction will remain constant for <strong>the</strong> next several fiscal years as projects are multi-year in duration and OPEFM<br />
will bring online new projects and develop new initiatives.<br />
****Local Small Disadvantaged Business Enterprise percentage participation is constant as required by <strong>the</strong> Public Education Reform Act.<br />
<strong>Office</strong> <strong>of</strong> Public Education Facilities Modernization<br />
D-95
Non-Public Tuition<br />
www.osse.dc.gov<br />
Telephone: 202-727-6436<br />
(GN0)<br />
% Change<br />
FY 2008 FY 2009 FY 2010 from<br />
Description Actual* Approved Proposed FY 2009<br />
Operating <strong>Budget</strong> $0 $141,700,442 $149,100,442 5.2<br />
* Prior to FY 2009 <strong>the</strong>se funds were included within agency (GA0) D.C. Public Schools.<br />
The mission <strong>of</strong> Non-Public Tuition is to provide funding for required<br />
education services for children with special needs within <strong>the</strong> school<br />
system and those children under <strong>the</strong> care <strong>of</strong> <strong>the</strong> Child and Family<br />
Services <strong>Agency</strong>, Department <strong>of</strong> Mental Health, and Department <strong>of</strong><br />
Youth Rehabilitation Services. It also holds funding for supplemental<br />
special education services payments to D.C. Public Charter Schools<br />
authorized under section 38-1804.01(b)(3)(D) <strong>of</strong> <strong>the</strong> D.C. <strong>of</strong>ficial<br />
code.The agency is administered by <strong>the</strong> <strong>Office</strong> <strong>of</strong> <strong>the</strong> State<br />
Superintendent <strong>of</strong> Education.<br />
The agency’s FY 2010 proposed budget is presented in <strong>the</strong> following tables:<br />
FY 2010 Proposed Gross Funds Operating <strong>Budget</strong>, by Revenue Type<br />
Table GN0-1 contains <strong>the</strong> proposed FY 2010 agency budget compared to <strong>the</strong> FY 2009 approved budget. It also<br />
provides FY 2007 and FY 2008 actual expenditures.<br />
Table GN0-1<br />
(dollars in thousands)<br />
Actual Actual Approved Proposed<br />
Change<br />
from Percent<br />
Appropriated Fund<br />
General Fund<br />
FY 2007* FY 2008* FY 2009 FY 2010 FY 2009 Change**<br />
Local Funds 0 0 141,700 149,100 7,400 5.2<br />
Total for General Fund 0 0 141,700 149,100 7,400 5.2<br />
Gross Funds 0 0 141,700 149,100 7,400 5.2<br />
*Prior to FY 2009 Non-Public Tuition was included in agency GA0, D.C. Public Schools.<br />
**Percent Change is based on whole dollars.<br />
Note: If applicable, for a breakdown <strong>of</strong> each Grant (Federal and Private), Special Purpose Revenue type and Intra-District agreement, please refer to<br />
Schedule 80 <strong>Agency</strong> Summary by Revenue Source in <strong>the</strong> Operating Appendices located on <strong>the</strong> <strong>Office</strong> <strong>of</strong> <strong>the</strong> <strong>Chief</strong> <strong>Financial</strong> <strong>Office</strong>r’s website.<br />
Non-Public Tuition<br />
D-97
FY 2010 Proposed Operating <strong>Budget</strong>, by Comptroller Source Group<br />
Table GN0-2 contains <strong>the</strong> proposed FY 2010 budget at <strong>the</strong> Comptroller Source Group (object class) level compared<br />
to <strong>the</strong> FY 2009 approved budget. It also provides FY 2007 and FY 2008 actual expenditures.<br />
Table GN0-2<br />
(dollars in thousands)<br />
Actual Actual Approved Proposed<br />
Change<br />
from Percent<br />
Comptroller Source Group FY 2007* FY 2008* FY 2009 FY 2010 FY 2009 Change**<br />
41 Contractual Services - O<strong>the</strong>r 0 0 141,700 0 -141,700 -100.0<br />
50 Subsidies and Transfers 0 0 0 149,100 149,100 N/A<br />
Subtotal Nonpersonal Services (NPS) 0 0 141,700 149,100 7,400 5.2<br />
Gross Funds 0 0 141,700 149,100 7,400 5.2<br />
*Prior to FY 2009 Non-Public Tuition was included in agency GA0, D.C. Public Schools.<br />
**Percent Change is based on whole dollars.<br />
Program Description<br />
The Non-Public Tuition agency holds funding for <strong>the</strong><br />
cost <strong>of</strong> mandatory special education services for 2,219<br />
District students who receive specialized services<br />
through contracted private providers pursuant to<br />
Individual Education Plans (IEPs) developed under<br />
<strong>the</strong> federal Individuals with Disabilities Education<br />
Act (IDEA).<br />
Non-Public Tuition funds a variety <strong>of</strong> specialized<br />
services, including daytime and residential tuition to<br />
private educational organizations, payment for related<br />
services at non-public facilities, education evaluations<br />
performed by evaluators independent <strong>of</strong> <strong>the</strong> District<br />
<strong>of</strong> Columbia Public Schools, parental transportation<br />
FY 2010 Proposed <strong>Budget</strong> and <strong>Financial</strong> Plan<br />
D-98<br />
reimbursement for certain expenses, and o<strong>the</strong>r costs,<br />
such as special equipment and tutoring.<br />
The agency also holds funding for students who<br />
are District residents under <strong>the</strong> care <strong>of</strong> <strong>the</strong> Child and<br />
Family Services <strong>Agency</strong> (CSFA) and <strong>the</strong> Department<br />
<strong>of</strong> Mental Health (DMH) who attend schools outside<br />
<strong>of</strong> <strong>the</strong> District <strong>of</strong> Columbia, and <strong>the</strong> District<br />
must pay those schools for <strong>the</strong>ir education costs, both<br />
for regular and special education services. Beginning<br />
in FY 2010, applicable costs for youth in <strong>the</strong> custody<br />
<strong>of</strong> <strong>the</strong> Department <strong>of</strong> Youth Rehabilitation Services<br />
are also included.<br />
The agency’s budget includes three components<br />
as follows:<br />
FY 2009 FY 2010 Amount Percent<br />
Component Revised <strong>Budget</strong> Proposed <strong>Budget</strong> Variance ($) Variance<br />
Special Education Non-Public Tuition $117,312,734 $123,107,982 $5,795,248 4.9%<br />
CFSA Non-Public Tuition $20,420,216 $21,828,974 $1,408,758 6.9%<br />
Dept <strong>of</strong> Mental Health Non-Public Tuition $3,967,492 $4,163,486 $195,994 4.9%<br />
Total $141,700,442 $149,100,442 $7,400,000 5.2%<br />
Program Structure Change<br />
The Non-Public Tuition agency had no program<br />
structure changes in <strong>the</strong> FY 2010 Proposed <strong>Budget</strong>.
FY 2010 Proposed Operating <strong>Budget</strong> and FTEs, by Program and Activity<br />
Table GN0-3 contains <strong>the</strong> proposed FY 2010 budget by program and activity compared to <strong>the</strong> FY 2009 approved budget.<br />
It also provides FY 2008 actual data.<br />
Table GN0-3<br />
(dollars in thousands)<br />
Dollars in Thousands Full-Time Equivalents<br />
Change Change<br />
Actual Approved Proposed from Actual Approved Proposed from<br />
Program/Activity<br />
(1000) Non-Public Tuition<br />
FY 2008 FY 2009 FY 2010 FY 2009 FY 2008 FY 2009 FY 2010 FY 2009<br />
No Activity Assigned 0 141,700 149,100 7,400 0.0 0.0 0.0 0.0<br />
Subtotal (1000) Non-Public Tuition 0 141,700 149,100 7,400 0.0 0.0 0.0 0.0<br />
Total Proposed Operating <strong>Budget</strong> 0 141,700 149,100 7,400 0.0 0.0 0.0 0.0<br />
(Change is calculated by whole numbers and numbers may not add up due to rounding)<br />
Note: For more detailed information regarding <strong>the</strong> proposed funding for <strong>the</strong> activities within this agency’s programs, please see Schedule 30-PBB Program<br />
Summary by Activity in <strong>the</strong> FY 2010 Operating Appendices located on <strong>the</strong> <strong>Office</strong> <strong>of</strong> <strong>the</strong> <strong>Chief</strong> <strong>Financial</strong> <strong>Office</strong>r’s website.<br />
Major Baseline Adjustments, Cost Savings<br />
and Policy Initiatives<br />
Initial Adjustments – An increase <strong>of</strong> $7,000,000 due<br />
to trends based on prior years’ actual expenditures and<br />
projected program needs.<br />
FY 2009 Approved <strong>Budget</strong> to FY 2010 Proposed <strong>Budget</strong>, by Revenue Type<br />
Table GN0-4 itemizes <strong>the</strong> changes by revenue type between <strong>the</strong> FY 2009 approved budget and <strong>the</strong> FY 2010 proposed<br />
budget. The four categories <strong>of</strong> changes reflected in this table are: (1) changes to <strong>the</strong> baseline budget (includes<br />
agency request), (2) changes representing cost savings or efficiencies, (3) changes related to policy initiatives, and (4)<br />
changes to specifically address <strong>the</strong> projected revenue shortfall.<br />
Table GN0-4<br />
(dollars in thousands)<br />
Transfers In: The budget for Non-Public Tuition will<br />
increase by $400,000 to pay expenses incurred while<br />
serving youth in <strong>the</strong> custody <strong>of</strong> <strong>the</strong> Department <strong>of</strong><br />
Youth Rehabilitation Services at non-public placements.<br />
Program BUDGET FTE<br />
LOCAL FUND: FY 2009 Approved <strong>Budget</strong> and FTE<br />
Initial and Baseline Adjustments<br />
141,700 0.0<br />
Target budget included projected increase in non-public tuition costs<br />
for FY 2010 based on historic trend<br />
Non-Public Tuition 7,000 0.0<br />
Policy Initiatives and Cost Savings<br />
Transfer In - Include expenses <strong>of</strong> youth in non-public educational Non-Public Tuition 400 0.0<br />
placements while in <strong>the</strong> custody <strong>of</strong> <strong>the</strong> Department <strong>of</strong> Youth Rehabilitation<br />
Services<br />
LOCAL FUND: FY 2010 Proposed <strong>Budget</strong> and FTE 149,100 0.0<br />
Gross for GN0 - Non-Public Tuition 149,100 0.0<br />
Non-Public Tuition<br />
D-99
Special Education Transportation<br />
www.osse.dc.gov<br />
Telephone: 202-727-6436<br />
(GO0)<br />
% Change<br />
FY 2008 FY 2009 FY 2010 from<br />
Description Actual Approved Proposed FY 2009<br />
Operating <strong>Budget</strong> $170,530 $75,558,319 $77,430,582 2.5<br />
FTEs 0.0 1,146.0 1,570.1 37.0<br />
The mission <strong>of</strong> Special Education Transportation is to ensure equal<br />
access to education for all learners by providing safe transit services to<br />
children with special needs.<br />
The agency’s FY 2010 proposed budget is presented in <strong>the</strong> following tables:<br />
FY 2010 Proposed Gross Funds Operating <strong>Budget</strong>, by Revenue Type<br />
Table GO0-1 contains <strong>the</strong> proposed FY 2010 agency budget compared to <strong>the</strong> FY 2009 approved budget. It also<br />
provides FY 2007 and FY 2008 actual expenditures.<br />
Table GO0-1<br />
(dollars in thousands)<br />
Actual Actual Approved Proposed<br />
Change<br />
from Percent<br />
Appropriated Fund<br />
General Fund<br />
FY 2007 FY 2008 FY 2009 FY 2010 FY 2009 Change*<br />
Local Funds 0 171 75,558 77,431 1,872 2.5<br />
Total for General Fund 0 171 75,558 77,431 1,872 2.5<br />
Gross Funds 0 171 75,558 77,431 1,872 2.5<br />
*Percent Change is based on whole dollars.<br />
Note: If applicable, for a breakdown <strong>of</strong> each Grant (Federal and Private), Special Purpose Revenue type and Intra-District agreement,<br />
please refer to Schedule 80, <strong>Agency</strong> Summary by Revenue Source, in <strong>the</strong> Operating Appendices found on <strong>the</strong> <strong>Office</strong> <strong>of</strong> <strong>the</strong> <strong>Chief</strong><br />
<strong>Financial</strong> <strong>Office</strong>r’s website.<br />
Special Education Transportation<br />
D-101
FY 2010 Proposed Full-Time Equivalents, by Revenue Type<br />
Table GO0-2 contains <strong>the</strong> proposed FY 2010 FTE level compared to <strong>the</strong> FY 2009 approved FTE level by revenue<br />
type. It also provides FY 2007 and FY 2008 actual data.<br />
Table GO0-2<br />
Change<br />
Actual Actual Approved Proposed from Percent<br />
Appropriated Fund FY 2007 FY 2008 FY 2009 FY 2010 FY 2009 Change*<br />
General Fund<br />
Local Funds 0.0 0.0 1,146.0 1,570.1 424.1 37.0<br />
Total for General Fund 0.0 0.0 1,146.0 1,570.1 424.1 37.0<br />
Total Proposed FTEs 0.0 0.0 1,146.0 1,570.1 424.1 37.0<br />
FY 2010 Proposed Operating <strong>Budget</strong>, by Comptroller Source Group<br />
Table GO0-3 contains <strong>the</strong> proposed FY 2010 budget at <strong>the</strong> Comptroller Source Group (object class) level compared<br />
to <strong>the</strong> FY 2009 approved budget. It also provides FY 2007 and FY 2008 actual expenditures.<br />
Table GO0-3<br />
(dollars in thousands)<br />
Actual Actual Approved Proposed<br />
Change<br />
from Percent<br />
Comptroller Source Group FY 2007 FY 2008 FY 2009 FY 2010 FY 2009 Change*<br />
11 Regular Pay - Cont Full Time 0 0 48,012 14,093 -33,920 -70.6<br />
12 Regular Pay - O<strong>the</strong>r 0 0 0 41,442 41,442 N/A<br />
14 Fringe Benefits - Curr Personnel 0 0 8,800 9,852 1,051 11.9<br />
15 Overtime Pay 0 0 1,586 893 -693 -43.7<br />
Subtotal Personal Services (PS) 0 0 58,399 66,280 7,881 13.5<br />
20 Supplies and Materials 0 0 343 475 132 38.6<br />
30 Energy, Comm. and Bldg Rentals 0 0 0 1,788 1,788 N/A<br />
31 Telephone, Telegraph, Telegram, Etc 0 0 634 634 0 0.0<br />
35 Occupancy Fixed Costs 0 0 2,906 0 -2,906 -100.0<br />
40 O<strong>the</strong>r Services and Charges 0 168 5,244 4,367 -877 -16.7<br />
41 Contractual Services - O<strong>the</strong>r 0 0 3,857 3,692 -165 -4.3<br />
70 Equipment & Equipment Rental 0 2 4,175 195 -3,980 -95.3<br />
Subtotal Nonpersonal Services (NPS) 0 171 17,160 11,151 -6,009 -35.0<br />
Gross Funds 0 171 75,558 77,431 1,872 2.5<br />
*Percent Change is based on whole dollars.<br />
FY 2010 Proposed <strong>Budget</strong> and <strong>Financial</strong> Plan<br />
D-102
Program Description<br />
Special Education Transportation operates through<br />
<strong>the</strong> following program:<br />
Special Education Transportation - is responsible for<br />
ensuring that <strong>the</strong> District’s special needs students are<br />
transported to and from schools and receive related<br />
services in a punctual manner in vehicles that meet<br />
established national standards. These services are<br />
required as part <strong>of</strong> <strong>the</strong> students’ Individual Education<br />
Plans (IEPs) pursuant to <strong>the</strong> Individuals With<br />
Disabilities Education Act (IDEA). There are over<br />
700 bus routes serving approximately 4,000 special<br />
needs students.<br />
This program contains <strong>the</strong> following 3 activities:<br />
■ Transportation Central <strong>Office</strong> - provides transit<br />
services to students with special needs. This area<br />
includes <strong>the</strong> terminal managers, bus drivers,<br />
FY 2010 Proposed Operating <strong>Budget</strong> and FTEs, by Program and Activity<br />
attendants, monitors, and fleet services. Central<br />
<strong>Office</strong> also provides logistical services in order to<br />
maintain efficient and effective transportation for<br />
qualifying students;<br />
■ Transportation Administrator - provides leadership<br />
and oversight to <strong>the</strong> functions that comprise<br />
<strong>the</strong> Division <strong>of</strong> Transportation; and<br />
■ Farecards & Truancy - provides farecards to eligible<br />
students with special needs. The School<br />
Transit Subsidy Act <strong>of</strong> 1978, D.C. Law 2-152,<br />
requires subsidization <strong>of</strong> public transit system use<br />
by students, as set forth in District <strong>of</strong> Columbia<br />
Official Code Sections 35-231 to 35-237 and 38-<br />
1702.11.<br />
Program Structure Change<br />
Special Education Transportation had no program<br />
structure changes in <strong>the</strong> FY 2010 Proposed <strong>Budget</strong>.<br />
Table GO0-4 contains <strong>the</strong> proposed FY 2010 budget by program and activity compared to <strong>the</strong> FY 2009 approved budget.<br />
It also provides FY 2008 actual data.<br />
Table GO0-4<br />
(dollars in thousands)<br />
Dollars in Thousands Full-Time Equivalents<br />
Change Change<br />
Actual Approved Proposed from Actual Approved Proposed from<br />
Program/Activity<br />
(4400) State Special Education Transportation<br />
FY 2008 FY 2009 FY 2010 FY 2009 FY 2008 FY 2009 FY 2010 FY 2009<br />
(4410) Transportation-Central <strong>Office</strong> 171 74,177 75,749 1,572 0.0 1,146.0 1,570.1 424.1<br />
(4420) Transportation-Administrator 0 775 775 0 0.0 0.0 0.0 0.0<br />
(4440) Farecards & Truancy 0 606 906 301 0.0 0.0 0.0 0.0<br />
Subtotal (4400) State Special Education Transportation 171 75,558 77,431 1,872 0.0 1,146.0 1,570.1 424.1<br />
Total Proposed Operating <strong>Budget</strong> 171 75,558 77,431 1,872 0.0 1,146.0 1,570.1 424.1<br />
(Change is calculated by whole numbers and numbers may not add up due to rounding)<br />
Note: For more detailed information regarding <strong>the</strong> proposed funding for <strong>the</strong> activities within this agency’s programs, please see Schedule 30-PBB<br />
Program Summary By Activity in <strong>the</strong> FY 2010 Operating Appendices located on <strong>the</strong> <strong>Office</strong> <strong>of</strong> <strong>the</strong> <strong>Chief</strong> <strong>Financial</strong> <strong>Office</strong>r’s website.<br />
Special Education Transportation<br />
D-103
Major Baseline Adjustments, Cost Savings<br />
and Policy Initiatives<br />
Initial Adjustments: In Local funds, an increase <strong>of</strong><br />
$5,000,000 over <strong>the</strong> FY 2009 approved budget,<br />
based on <strong>the</strong> historical trend <strong>of</strong> annual cost increases<br />
as well as additional routes, and an increase <strong>of</strong> 460.6<br />
FTEs representing a correction <strong>of</strong> <strong>the</strong> agency’s FTE<br />
count resulting from implementation <strong>of</strong> <strong>the</strong><br />
PeopleS<strong>of</strong>t human resources s<strong>of</strong>tware for <strong>the</strong> agency’s<br />
staff. The $5,000,000 increase is <strong>the</strong> net <strong>of</strong> two<br />
changes: an $8,632,090 increase in personal services<br />
costs, for additional staffing <strong>of</strong> increased bus routes,<br />
approved pay raises, step increases, and fringe benefits;<br />
and a net decrease <strong>of</strong> $3,632,090 in nonpersonal services<br />
costs. The largest component <strong>of</strong> <strong>the</strong> nonpersonal<br />
services decrease is $3,980,223 for equipment,<br />
reflecting school buses purchased in 2009 but not in<br />
<strong>the</strong> 2010 budget. Within personal services, reflecting<br />
<strong>the</strong> improved position budgeting, funds shifted from<br />
regular pay—continuing full time to regular pay—<br />
o<strong>the</strong>r.<br />
Cost Savings: The Division <strong>of</strong> Transportation (DOT)<br />
currently operates 23 one-student routes and 32 two-student<br />
routes. At a cost <strong>of</strong> approximately $100,000 per<br />
bus, <strong>the</strong> transportation <strong>of</strong> only 1 percent <strong>of</strong> <strong>the</strong> student<br />
population needing transportation costs <strong>the</strong> District<br />
$5,500,000. This amounts to nearly 7 percent <strong>of</strong> <strong>the</strong><br />
DOT budget. By reducing <strong>the</strong> number <strong>of</strong> one- and<br />
two-student routes by nearly 40 percent through<br />
efforts such as identifying alternative forms <strong>of</strong> transportation<br />
for those students, supporting foster care<br />
placements within <strong>the</strong> District, consolidating bus<br />
routes, and reviewing educational placements to<br />
decrease <strong>the</strong> number <strong>of</strong> placements in private schools<br />
distant from <strong>the</strong> District, <strong>the</strong> District will recognize<br />
savings <strong>of</strong> $2,100,000. Toge<strong>the</strong>r, <strong>the</strong> District <strong>of</strong><br />
Columbia Public Schools, <strong>the</strong> <strong>Office</strong> <strong>of</strong> <strong>the</strong> State<br />
Superintendent <strong>of</strong> Education, and <strong>the</strong> Transportation<br />
Administrator will achieve this goal.<br />
The DOT has done a commendable job <strong>of</strong> reducing<br />
staff absenteeism to a sustainable level. Over <strong>the</strong><br />
past several years, DOT has operated with an absentee<br />
rate <strong>of</strong> less than 7 percent, which is down from <strong>the</strong><br />
level six years ago <strong>of</strong> 22 percent. This reduction in<br />
absenteeism permits a corresponding reduction in<br />
staffing levels. Reducing <strong>the</strong> staffing cushion from 15<br />
FY 2010 Proposed <strong>Budget</strong> and <strong>Financial</strong> Plan<br />
D-104<br />
percent to 12 percent, or 68 employees, (36.5 FTEs),<br />
creates a cost savings <strong>of</strong> $1,338,000.<br />
Additional cost savings may be realized through a<br />
review <strong>of</strong> those IEPs that require students to have a<br />
one-on-one aide on <strong>the</strong> school bus. Every bus has an<br />
attendant, and a careful assessment should be completed<br />
to determine <strong>the</strong> necessity <strong>of</strong> a one-on-one<br />
aide.<br />
The DOT purchases its fuel from Department <strong>of</strong><br />
Public Works fueling stations. As a result <strong>of</strong> anticipated<br />
reductions in <strong>the</strong> unit cost <strong>of</strong> gasoline, <strong>the</strong> FY<br />
2010 budget proposal reduces projected fuel expenses<br />
by $1,516,000. Finally, by maintaining overtime<br />
levels at <strong>the</strong> FY 2009 levels, <strong>the</strong> FY 2010 budget<br />
reduces overtime costs by $186,000.<br />
Policy Initiatives: The majority <strong>of</strong> one- and two-student<br />
bus routes are for children in foster care who are<br />
in homes in Maryland and Virginia. The FY 2010<br />
budget provides an enhancement <strong>of</strong> $560,000 to<br />
contract with <strong>the</strong> neighboring jurisdictions to provide<br />
transportation for <strong>the</strong> District’s children. An<br />
increased effort in this area will provide direct social<br />
benefits for <strong>the</strong> students, environmental benefits<br />
through a reduction in <strong>the</strong> use <strong>of</strong> fuel, and support<br />
<strong>the</strong> cost saving initiatives described above.<br />
The DOT will also work with parents and foster<br />
parents to develop alternative transportation options<br />
for students on one- and two-student bus routes, to<br />
be funded by <strong>the</strong> cost savings realized by eliminating<br />
<strong>the</strong> need for each <strong>of</strong> those routes. These options<br />
could include reimbursement <strong>of</strong> parents or foster parents<br />
for transporting students to school or o<strong>the</strong>r creative<br />
incentives that will result in fewer overall bus<br />
routes. The District will support <strong>the</strong> Division’s provision<br />
<strong>of</strong> incentives to support alternative transportation<br />
options where appropriate.<br />
Going forward, Local Education Agencies (LEAs)<br />
will consider transportation as a relevant factor in<br />
making placement decisions for students for whom<br />
private placements are considered. When schools are<br />
evaluated, information such as <strong>the</strong> approximate cost<br />
to transport <strong>the</strong> student to each <strong>of</strong> <strong>the</strong> schools under<br />
consideration, <strong>the</strong> ease with which <strong>the</strong> student could<br />
be integrated into an existing bus route for each<br />
school, and <strong>the</strong> transportation time to each school<br />
should be weighed. In this way, placements that meet<br />
<strong>the</strong> student’s needs can be distinguished by <strong>the</strong> cost <strong>of</strong>
transportation. A stronger connection between transportation<br />
and placement will ensure mindful decision-making—in<br />
consideration <strong>of</strong> not only avoidable<br />
costs resulting from transportation, but also <strong>the</strong> student’s<br />
well-being when placements are at a great dis-<br />
tance from <strong>the</strong> District. Fur<strong>the</strong>r, LEA attorneys will<br />
have an increased ability to introduce evidence about<br />
transportation in resolution sessions and due process<br />
hearings for <strong>the</strong> hearing <strong>of</strong>ficer to consider, leading to<br />
lower costs for new placements.<br />
FY 2009 Approved <strong>Budget</strong> to FY 2010 Proposed <strong>Budget</strong>, by Revenue Type<br />
Table GO0-5 itemizes <strong>the</strong> changes by revenue type between <strong>the</strong> FY 2009 approved budget and <strong>the</strong> FY 2010 proposed<br />
budget. The four categories <strong>of</strong> changes reflected in this table are: (1) changes to <strong>the</strong> baseline budget (includes<br />
agency request), (2) changes representing cost savings or efficiencies, (3) changes related to policy initiatives, and (4)<br />
changes to specifically address <strong>the</strong> projected revenue shortfall.<br />
Table GO0-5<br />
(dollars in thousands)<br />
PROGRAM BUDGET FTE<br />
LOCAL FUND: FY 2009 Approved <strong>Budget</strong> and FTE 75,558 1,146.0<br />
Initial and Baseline Adjustments<br />
Target budget adjustment and FTE correction due to implementation <strong>of</strong> SSET 5,000 460.6<br />
PeopleS<strong>of</strong>t for agency FTEs<br />
Technical Adjustments - Special Education Farecards - transportation subsidy SSET 346 0.0<br />
for special education students who travel on public transportation<br />
Technical Adjustments - To align target budget to <strong>the</strong> Transportation SSET 772 0.0<br />
Administrator's proposed budget request<br />
Technical Adjustments - Transportation Administrator Fees - Court appointed SSET 775 0.0<br />
<strong>the</strong> firm <strong>of</strong> Gilmore-Keene, LLC<br />
Policy Initiatives and Cost Savings<br />
Cost Decrease - Align fuel budget with DPW fuel cost estimates SSET -1,516 0.0<br />
Transfer out - Shift to OSSE funding for <strong>the</strong> land-line<br />
telecommunications charges for properties occupied by Special<br />
Education Transportation<br />
SSET -793 0.0<br />
Cost Decrease - Maintain overtime budget at FY 2009 level SSET -186 0.0<br />
Cost Increase - Increase funding to accommodate additional<br />
routes added in <strong>the</strong> first and second quarters <strong>of</strong> 2009<br />
SSET 1,100 0.0<br />
Enhance - Improve services for children in foster care by contracting<br />
with surrounding jurisdictions for transportation<br />
SSET 560 0.0<br />
Reduce - Consolidate and eliminate bus routes serving one or two<br />
students<br />
SSET -2,100 0.0<br />
Reduce - Replace contract for outside legal services with OAG/OLRCB<br />
representation <strong>of</strong> <strong>the</strong> agency in personnel, civil litigation, and labor<br />
relations matters<br />
SSET -535 0.0<br />
Reduce - Through attrition, reduce bus driver and attendant staffing<br />
to reflect a decrease in <strong>the</strong> absenteeism rate, <strong>the</strong> consolidation <strong>of</strong> bus<br />
routes, and o<strong>the</strong>r changes to bus routes resulting from annual IEP reviews<br />
SSET -1,338 -36.5<br />
Transfer out - Shift <strong>the</strong> costs for three Special Education Transportation<br />
properties to <strong>Office</strong> <strong>of</strong> <strong>the</strong> State Superintendent <strong>of</strong> Education OSSE<br />
SSET -215 0.0<br />
LOCAL FUND: FY 2010 Proposed <strong>Budget</strong> and FTE 77,431 1,570.1<br />
Gross for GO0 - SPECIAL EDUCATION TRANSPORTATION 77,431 1,570.1<br />
Special Education Transportation<br />
D-105
E<br />
Human Support Services<br />
Department <strong>of</strong> Human Services (JA) ....................................................................E-1<br />
Child and Family Services <strong>Agency</strong> (RL) .............................................................E-17<br />
Department <strong>of</strong> Mental Health (RM) ..................................................................E-35<br />
Department <strong>of</strong> Health (HC) ................................................................................E-53<br />
Department <strong>of</strong> Parks and Recreation (HA).........................................................E-75<br />
D.C. <strong>Office</strong> on Aging (BY)..................................................................................E-89<br />
Unemployment Compensation Fund (BH) ........................................................E-99<br />
Disability Compensation Fund (BG).................................................................E-103<br />
<strong>Office</strong> <strong>of</strong> Human Rights (HM)..........................................................................E-107<br />
<strong>Office</strong> on Latino Affairs (BZ) ............................................................................E-117<br />
Children and Youth Investment Collaborative (JY).........................................E-125<br />
<strong>Office</strong> on Asian and Pacific Islander Affairs (AP) ............................................E-131<br />
<strong>Office</strong> <strong>of</strong> Veterans’ Affairs (VA)..........................................................................E-137<br />
Department <strong>of</strong> Youth Rehabilitation Services ( JZ) ...............................E-143<br />
Department <strong>of</strong> Disability Services ( JM)................................................E-155<br />
Department <strong>of</strong> Health Care Finance (HT)...........................................E-171
Department <strong>of</strong> Human Services<br />
www.dhs.dc.gov<br />
Telephone: 202-671-4200<br />
% Change<br />
FY 2008 FY 2009 FY 2010 from<br />
Description Actual Approved Proposed FY 2009<br />
Operating <strong>Budget</strong> $316,625,860 $339,844,759 $334,525,465 -1.6<br />
FTEs 1,060.5 935.1 884.8 -5.4<br />
(JA0)<br />
The Department <strong>of</strong> Human Services (DHS) provides services that<br />
enhance self sufficiency and quality <strong>of</strong> life for economically and socially<br />
challenged residents.<br />
Summary <strong>of</strong> Services<br />
The services provided by DHS are provided by <strong>the</strong><br />
following administrations: (1) Income Maintenance<br />
Administration (IMA) – makes timely and accurate<br />
determinations <strong>of</strong> eligibility and <strong>the</strong> amount <strong>of</strong> assistance<br />
for those receiving Temporary Assistance for<br />
Needy Families (TANF), Medicaid, Food Stamps,<br />
and childcare subsidy, and promotes economic independence<br />
by helping low-income adults achieve selfsufficiency<br />
through employment and work-related<br />
activities. IMA also administers <strong>the</strong> Burial Assistance<br />
program. (2) Family Services Administration (FSA) –<br />
helps vulnerable homeless people, adults at-risk for<br />
abuse or neglect, low-income residents, teenagers,<br />
dysfunctional families, and refugees become stable<br />
and fully self-sufficient over time through an array <strong>of</strong><br />
social services, assessments, case management, and<br />
crisis intervention services.<br />
The agency’s FY 2010 proposed budget is presented<br />
in <strong>the</strong> following tables:<br />
Department <strong>of</strong> Human Services<br />
E-1
FY 2010 Proposed Gross Funds Operating <strong>Budget</strong>, by Revenue Type<br />
Table JA0-1 contains <strong>the</strong> proposed FY 2010 agency budget compared to <strong>the</strong> FY 2009 approved budget. It also<br />
provides FY 2007 and FY 2008 actual expenditures.<br />
Table JA0-1<br />
(dollars in thousands)<br />
Actual Actual Approved Proposed<br />
Change<br />
from Percent<br />
Appropriated Fund<br />
General Fund<br />
FY 2007 FY 2008 FY 2009 FY 2010 FY 2009 Change*<br />
Local Funds 272,198 137,874 168,882 144,388 -24,494 -14.5<br />
Special Purpose Revenue Funds 3,763 2,776 2,800 2,725 -75 -2.7<br />
Total for General Fund 275,962 140,649 171,682 147,113 -24,569 -14.3<br />
Federal Resources<br />
Federal Payments 0 0 0 19,200 19,200 N/A<br />
Federal Grant Funds 161,846 135,330 146,673 146,170 -503 -0.3<br />
Federal Medicaid Payments 12,264 11,023 9,885 10,777 893 9.0<br />
Total for Federal Resources 174,110 146,353 156,558 176,148 19,590 12.5<br />
Private Funds<br />
Private Grant Funds 71 67 91 0 -91 -100.0<br />
Private Donations 0 -1 0 0 0 N/A<br />
Total for Private Funds 71 66 91 0 -91 -100.0<br />
Intra-District Funds<br />
Intra-District Funds 35,731 29,557 11,514 11,265 -249 -2.2<br />
Total for Intra-District Funds 35,731 29,557 11,514 11,265 -249 -2.2<br />
Gross Funds 485,874 316,626 339,845 334,525 -5,319 -1.6<br />
*Percent Change is based on whole dollars.<br />
Note: If applicable, for a breakdown <strong>of</strong> each Grant (Federal and Private), Special Purpose Revenue type and Intra-District agreement,<br />
please refer to Schedule 80 <strong>Agency</strong> Summary by Revenue Source in <strong>the</strong> Operating Appendices located on <strong>the</strong> <strong>Office</strong> <strong>of</strong> <strong>the</strong> <strong>Chief</strong><br />
<strong>Financial</strong> <strong>Office</strong>r’s website.<br />
FY 2010 Proposed <strong>Budget</strong> and <strong>Financial</strong> Plan<br />
E-2
FY 2010 Proposed Full-Time Equivalents, by Revenue Type<br />
Table JA0-2 contains <strong>the</strong> proposed FY 2010 FTE level compared to <strong>the</strong> FY 2009 approved FTE level by revenue<br />
type. It also provides FY 2007 and FY 2008 actual data.<br />
Table JA0-2<br />
Change<br />
Actual Actual Approved Proposed from Percent<br />
Appropriated Fund FY 2007 FY 2008 FY 2009 FY 2010 FY 2009 Change<br />
General Fund<br />
Local Funds 491.9 298.3 318.9 261.6 -57.3 -18.0<br />
Total for General Fund 491.9 298.3 318.9 261.6 -57.3 -18.0<br />
Federal Resources<br />
Federal Grant Funds 718.8 629.8 446.0 454.5 8.5 1.9<br />
Federal Medicaid Payments 169.7 131.4 144.3 148.7 4.4 3.0<br />
Total for Federal Resources 888.5 761.2 590.3 603.2 12.9 2.2<br />
Private Funds<br />
Private Grant Funds 0.0 0.0 1.0 0.0 -1.0 -100.0<br />
Total for Private Funds 0.0 0.0 1.0 0.0 -1.0 -100.0<br />
Intra-District Funds<br />
Intra-District Funds 1.0 1.0 25.0 20.0 -5.0 -20.0<br />
Total for Intra-District Funds 1.0 1.0 25.0 20.0 -5.0 -20.0<br />
Total Proposed FTEs 1,381.4 1,060.5 935.1 884.8 -50.4 -5.4<br />
Department <strong>of</strong> Human Services<br />
E-3
FY 2010 Proposed Operating <strong>Budget</strong>, by Comptroller Source Group<br />
Table JA0-3 contains <strong>the</strong> proposed FY 2010 budget at <strong>the</strong> Comptroller Source Group (object class) level compared<br />
to <strong>the</strong> FY 2009 approved budget. It also provides FY 2007 and FY 2008 actual expenditures.<br />
Table JA0-3<br />
(dollars in thousands)<br />
Change<br />
Actual Actual Approved Proposed from Percent<br />
Comptroller Source Group FY 2007 FY 2008 FY 2009 FY 2010 FY 2009 Change*<br />
11 Regular Pay - Cont Full Time 69,894 44,866 49,754 49,331 -423 -0.9<br />
12 Regular Pay - O<strong>the</strong>r 6,484 3,786 4,632 2,956 -1,676 -36.2<br />
13 Additional Gross Pay 1,417 1,698 14 0 -14 -100.0<br />
14 Fringe Benefits - Curr Personnel 14,913 9,907 9,975 9,829 -145 -1.5<br />
15 Overtime Pay 1,996 1,861 300 390 90 30.0<br />
Subtotal Personal Services (PS) 94,704 62,118 64,675 62,507 -2,168 -3.4<br />
20 Supplies and Materials 839 487 560 495 -65 -11.5<br />
30 Energy, Comm. and Bldg Rentals 3,216 3,082 3,212 3,017 -195 -6.1<br />
31 Telephone, Telegraph, Telegram, Etc 2,523 2,254 1,770 1,582 -188 -10.6<br />
32 Rentals - Land and Structures 20,502 15,067 16,113 12,236 -3,877 -24.1<br />
33 Janitorial Services 16 26 137 44 -93 -68.0<br />
34 Security Services 7,017 5,030 5,358 1,327 -4,031 -75.2<br />
35 Occupancy Fixed Costs 560 757 989 1,549 560 56.7<br />
40 O<strong>the</strong>r Services and Charges 4,244 2,789 3,068 2,775 -293 -9.6<br />
41 Contractual Services - O<strong>the</strong>r 26,070 12,389 6,358 10,890 4,532 71.3<br />
50 Subsidies and Transfers 324,855 212,022 236,736 237,294 558 0.2<br />
70 Equipment & Equipment Rental 1,327 606 870 810 -60 -6.8<br />
Subtotal Nonpersonal Services (NPS) 391,170 254,508 275,170 272,019 -3,151 -1.1<br />
Gross Funds 485,874 316,626 339,845 334,525 -5,319 -1.6<br />
*Percent Change is based on whole dollars.<br />
Program Description<br />
The Department <strong>of</strong> Human Services operates<br />
through <strong>the</strong> following 4 programs:<br />
Family Services Administration - provides social services,<br />
case management, and crisis intervention to<br />
meet <strong>the</strong> needs <strong>of</strong> vulnerable adults and families with<br />
children so that <strong>the</strong>y can achieve stabilization and selfsufficiency.<br />
The Family Services Administration also<br />
has a division for Homeless Services, which provides<br />
shelter, housing stabilization, and crisis intervention<br />
through a community-based organization to individuals<br />
and families in <strong>the</strong> District <strong>of</strong> Columbia who are<br />
FY 2010 Proposed <strong>Budget</strong> and <strong>Financial</strong> Plan<br />
E-4<br />
homeless or at risk <strong>of</strong> homelessness so that <strong>the</strong>y can<br />
obtain and/or maintain improved housing.<br />
This program contains <strong>the</strong> following 7 activities:<br />
■ Adult Protective Services – provides protection,<br />
counseling, and crisis intervention services to<br />
adult residents <strong>of</strong> <strong>the</strong> District <strong>of</strong> Columbia so that<br />
<strong>the</strong>y can be safe from abuse, neglect and exploitation;<br />
■ Domestic Violence Services – provides protection,<br />
emergency shelter, and crisis intervention<br />
services to victims <strong>of</strong> domestic violence so that<br />
<strong>the</strong>y can seek immediate relief from harm;
■ Homeless Services – provides shelter, housing stabilization,<br />
and crisis intervention services to individuals<br />
and families in <strong>the</strong> District <strong>of</strong> Columbia<br />
who are homeless or at-risk <strong>of</strong> homelessness so<br />
that <strong>the</strong>y can obtain and/or maintain permanent<br />
living arrangements;<br />
■ Refugee Resettlement – provides assistance, cultural<br />
education, and social support services to<br />
refugees resettled in <strong>the</strong> District <strong>of</strong> Columbia by<br />
<strong>the</strong> United States State Department so that <strong>the</strong>y<br />
can assimilate into <strong>the</strong> American culture and<br />
become self-reliant;<br />
■ Teen Pregnancy Prevention – provides pregnancy<br />
prevention services to teens and teen parents so<br />
that <strong>the</strong>y can prevent early parenthood and plan<br />
for a self-sufficient future;<br />
■ Strong Families – provides diagnostic, evaluation,<br />
and plans development services to consumers in<br />
order to determine <strong>the</strong> comprehensiveness <strong>of</strong> <strong>the</strong><br />
consumer’s service needs and plans <strong>the</strong> treatment<br />
and support needed; and<br />
■ Community Services – provides assistance to lowincome<br />
residents working through a network <strong>of</strong><br />
community action agencies and o<strong>the</strong>r neighborhood-based<br />
organizations, in order to reduce<br />
poverty, revitalize low-income communities, and<br />
empower low-income families and individuals to<br />
become self-reliant.<br />
Income Maintenance Administration - determines<br />
<strong>the</strong> eligibility <strong>of</strong> applicants for assistance programs<br />
funded by <strong>the</strong> federal and District governments. Its<br />
mission is to help low-income individuals and families<br />
obtain and maintain employment so that <strong>the</strong>y can<br />
achieve self-sufficiency.<br />
This program contains <strong>the</strong> following 5 activities:<br />
■ Income Assistance – provides financial assistance<br />
services to eligible individuals so that <strong>the</strong>y meet<br />
<strong>the</strong>ir basic needs;<br />
■ Temporary Assistance for Needy Families – provides<br />
employment readiness, skill development<br />
training, educational enrichment, and social support<br />
services to eligible individuals so that <strong>the</strong>y can<br />
be socially and economically self-reliant;<br />
■ Case Management Services – provides diagnostic,<br />
evaluation, and plans development services to<br />
consumers, in order to determine <strong>the</strong> comprehensiveness<br />
<strong>of</strong> <strong>the</strong> consumer’s service needs and<br />
plans <strong>the</strong> treatment and support needed;<br />
■ Eligibility Determination – provides program eligibility<br />
determination services to disadvantaged<br />
individuals <strong>of</strong> <strong>the</strong> District <strong>of</strong> Columbia for which<br />
<strong>the</strong>y qualify; and<br />
■ Subsidy and Childcare Eligibility – provides <strong>the</strong><br />
determination <strong>of</strong> <strong>the</strong> eligibility <strong>of</strong> applicants for<br />
subsidized childcare services funded by <strong>the</strong> federal<br />
and District governments.<br />
<strong>Agency</strong> Management - provides for administrative<br />
support and <strong>the</strong> required tools to achieve operational<br />
and programmatic results. This program is standard<br />
for all agencies using performance-based budgeting.<br />
<strong>Agency</strong> <strong>Financial</strong> Operations - provides comprehensive<br />
and efficient financial management services to<br />
and on behalf <strong>of</strong> District agencies so that <strong>the</strong> financial<br />
integrity <strong>of</strong> <strong>the</strong> District <strong>of</strong> Columbia is maintained.<br />
This program is standard for all agencies using performance-based<br />
budgeting.<br />
Program Structure Change<br />
The Department <strong>of</strong> Human Services had one program<br />
structure change in <strong>the</strong> FY 2010 Proposed<br />
<strong>Budget</strong>. The Homeless Services program was incorporated<br />
into <strong>the</strong> Family Services program.<br />
Department <strong>of</strong> Human Services<br />
E-5
FY 2010 Proposed Operating <strong>Budget</strong> and FTEs, by Program and Activity<br />
Table JA0-4 contains <strong>the</strong> proposed FY 2010 budget by program and activity compared to <strong>the</strong> FY 2009 approved budget.<br />
It also provides FY 2008 actual data.<br />
Table JA0-4<br />
(dollars in thousands)<br />
Dollars in Thousands Full-Time Equivalents<br />
Change Change<br />
Actual Approved Proposed from Actual Approved Proposed from<br />
Program/Activity FY 2008 FY 2009 FY 2010 FY 2009 FY 2008 FY 2009 FY 2010 FY 2009<br />
No Program Assigned<br />
No Activty Assigned 2 0 0 0 0.0 0.0 0.0 0.0<br />
Subtotal No Program Assigned<br />
(1000) <strong>Agency</strong> Management Program<br />
2 0 0 0 0.0 0.0 0.0 0.0<br />
(1010) <strong>Agency</strong> Management/Personnel 1,185 1,183 992 -191 8.1 10.0 7.9 -2.2<br />
(1015) <strong>Agency</strong> Management/Training 372 402 381 -21 6.0 5.1 5.7 0.6<br />
(1017) <strong>Agency</strong> Management/Labor Management Partn 355 349 240 -109 4.4 4.0 2.8 -1.2<br />
(1020) <strong>Agency</strong> Management/Contracts & Procurement 388 863 657 -206 5.3 5.0 5.3 0.3<br />
(1030) <strong>Agency</strong> Management/Property Management 5,545 2,522 2,504 -18 10.0 2.0 2.3 0.4<br />
(1040) <strong>Agency</strong> Management/Information Technology 5,583 5,952 5,314 -638 31.6 34.0 27.8 -6.2<br />
(1050) <strong>Agency</strong> Management/<strong>Agency</strong> <strong>Financial</strong> Svcs 363 435 323 -111 5.2 5.0 5.3 0.3<br />
(1055) <strong>Agency</strong> Management/Risk Management 5,462 5,710 5,326 -384 50.4 57.3 49.3 -7.9<br />
(1060) <strong>Agency</strong> Management/Legal Services 1,120 92 1,122 1,030 1.4 1.0 0.8 -0.2<br />
(1080) <strong>Agency</strong> Management/Communications 391 1,190 289 -901 7.2 11.1 2.8 -8.4<br />
(1085) <strong>Agency</strong> Management/Customer Service 290 394 318 -76 2.3 0.9 1.8 0.8<br />
(1090) <strong>Agency</strong> Management/Performance Mgmt 548 473 387 -86 1.5 3.0 3.7 0.7<br />
Subtotal (1000) <strong>Agency</strong> Management Program 21,601<br />
(100F) <strong>Agency</strong> <strong>Financial</strong> Operations<br />
19,565 17,854 -1,711 133.2 138.5 115.5 -23.0<br />
(110F) <strong>Budget</strong> Operations 475 540 604 65 5.8 6.6 7.0 0.4<br />
(120F) Accounting Operations 2,011 2,182 1,921 -261 33.3 25.8 23.8 -2.0<br />
(130F) ACFO 243 376 281 -94 2.0 3.5 2.0 -1.5<br />
(140F) <strong>Agency</strong> Fiscal <strong>Office</strong>r 402 655 543 -113 1.0 0.2 0.0 -0.2<br />
Subtotal (100F) <strong>Agency</strong> <strong>Financial</strong> Operations 3,131<br />
(2000) Income Maintenance<br />
3,752 3,349 -403 42.1 36.0 32.8 -3.3<br />
(2010) Income Assistance 18,287 19,413 19,293 -120 0.0 0.0 0.0 0.0<br />
(2020) Temporary Asst to Needy Families (TANF) 99,897 151,058 93,944 -57,114 0.0 0.0 0.0 0.0<br />
(2030) Case Management 6,183 6,503 6,132 -370 82.1 93.0 94.0 1.0<br />
(2040) Eligibility Determination Services 47,697 48,494 43,878 -4,616 480.4 529.0 502.0 -27.0<br />
(2050) Quality Assurance 2,909 3,818 4,095 278 163.4 47.0 50.0 3.0<br />
(2060) Subsidy Transfer 37,632 10,187 39,963 29,776 0.0 0.0 0.0 0.0<br />
Subtotal (2000) Income Maintenance<br />
(4000) Early Childhood Development<br />
212,605 239,473 207,305 -32,168 725.9 669.0 646.0 -23.0<br />
(4020) Child Care Services 10,194 0 0 0 17.5 0.0 0.0 0.0<br />
(4030) Child Development Provider Services 6 0 0 0 19.8 0.0 0.0 0.0<br />
(4040) Early Intervention Services 1,891 0 0 0 13.2 0.0 0.0 0.0<br />
(4050) Case Management Services 0 0 0 0 1.0 0.0 0.0 0.0<br />
(4060) Quality Assurance 0 0 0 0 5.0 0.0 0.0 0.0<br />
(4070) OECD: Eligibility Determination 0 0 0 0 17.4 0.0 0.0 0.0<br />
Subtotal (4000) Early Childhood Development 12,090<br />
(Continued on next page)<br />
0 0 0 73.9 0.0 0.0 0.0<br />
FY 2010 Proposed <strong>Budget</strong> and <strong>Financial</strong> Plan<br />
E-6
Table JA0-4 (Continued)<br />
(dollars in thousands)<br />
Dollars in Thousands Full-Time Equivalents<br />
Change Change<br />
Actual Approved Proposed from Actual Approved Proposed from<br />
Program/Activity FY 2008 FY 2009 FY 2010 FY 2009 FY 2008 FY 2009 FY 2010 FY 2009<br />
(5000) Family Services<br />
(5010) Adult Protective Services 3,543 3,317 3,675 359 26.0 29.0 26.0 -3.0<br />
(5020) Domestic Violence Services 696 697 697 0 0.0 0.0 0.0 0.0<br />
(5025) Fa<strong>the</strong>rhood Initiatives 1,315 1,990 1,990 0 4.7 7.0 8.0 1.0<br />
(5030) Homeless Services 0 0 73,817 73,817 8.9 0.0 10.6 10.6<br />
(5040) Refugee Resettlement 620 1,020 928 -91 1.1 0.8 1.8 1.0<br />
(5050) Teen Pregnancy Services 245 615 476 -139 3.0 5.2 6.1 0.9<br />
(5060) Strong Families 3,293 2,896 2,887 -9 25.0 30.1 30.1 0.0<br />
(5070) Quality Assurance 211 341 325 -16 2.0 3.0 2.9 -0.2<br />
(5090) Community Services 11,015 10,495 20,992 10,497 4.0 5.1 5.1 0.0<br />
(5095) Subsidy Transfer 229 220 230 10 0.0 0.0 0.0 0.0<br />
Subtotal (5000) Family Services<br />
(5500) Homeless Services Program<br />
21,168 21,590 106,018 84,427 74.7 80.2 90.5 10.3<br />
(5550) Homeless Services - Crisis Intervention 1,750 1,350 0 -1,350 0.0 0.0 0.0 0.0<br />
(5551) Homeless Services 29,895 27,657 0 -27,657 0.0 11.4 0.0 -11.4<br />
(5552) Homeless Services-CSBG 3,936 3,936 0 -3,936 0.0 0.0 0.0 0.0<br />
(5553) Homeless Services-BSA 10,449 10,450 0 -10,450 0.0 0.0 0.0 0.0<br />
(5554) Homeless Services-Housing First Funding 0 12,071 0 -12,071 0.0 0.0 0.0 0.0<br />
Subtotal (5500) Homeless Services Program 46,029<br />
(6000) Mental Retardation & Development Disab<br />
55,464 0 -55,464 0.0 11.4 0.0 -11.4<br />
(6020) Disability Services 0 0 0 0 1.0 0.0 0.0 0.0<br />
Subtotal (6000) Mental Retardation & Develpmnt Disab<br />
(7000) Rehabilitation Services<br />
0 0 0 0 1.0 0.0 0.0 0.0<br />
(7020) Disability Services 0 0 0 5.9 0.0 0.0 0.0<br />
(7040) Case Management 0 0 0 0 3.9 0.0 0.0 0.0<br />
Subtotal (7000) Rehabilitation Services 0 0 0 0 9.7 0.0 0.0 0.0<br />
Total Proposed Operating <strong>Budget</strong> 316,626 339,845 334,525 -5,319 1,060.5 935.1 884.8 -50.4<br />
(Change is calculated by whole numbers and numbers may not add up due to rounding)<br />
Note: For more detailed information regarding <strong>the</strong> proposed funding for <strong>the</strong> activities within this agency’s programs, please see<br />
Schedule 30-PBB Program Summary by Activity in <strong>the</strong> FY 2010 Operating Appendices located on <strong>the</strong> <strong>Office</strong> <strong>of</strong> <strong>the</strong> <strong>Chief</strong><br />
<strong>Financial</strong> <strong>Office</strong>r’s website.<br />
Department <strong>of</strong> Human Services<br />
E-7
Major Baseline Adjustments, Cost Savings<br />
and Policy Initiatives<br />
Initial Adjustments: The following adjustment was<br />
made in Local funds: an increase <strong>of</strong> $5,159,000 in <strong>the</strong><br />
Family Services program for Subsidies and Transfers.<br />
In Federal Grant funds, <strong>the</strong> agency reduced<br />
$11,518,366 in multiple programs for Subsidies and<br />
Transfers due to a reduction in federal grant carryover<br />
budgeted; an increase <strong>of</strong> $1,031,749 in multiple programs<br />
for contracts due to funding for <strong>the</strong> <strong>Office</strong> <strong>of</strong><br />
<strong>the</strong> Attorney General via an Intra-District.<br />
Baseline Adjustments: The following adjustment was<br />
made in Local funds: a reduction <strong>of</strong> $8,550,000 in<br />
<strong>the</strong> Family Services program for Subsidies and<br />
Transfers that included $8,000,000 for Housing First<br />
and $550,000 for agency earmarks. The funding was<br />
approved as one-time in FY 2009. Also, a reduction<br />
<strong>of</strong> $4,774,000 in multiple programs, due to revised<br />
fixed cost estimates, and an increase <strong>of</strong> $3,989,000 in<br />
multiple programs for contractual services to <strong>of</strong>fset<br />
revised fixed cost estimates.<br />
Cost Savings: In FY 2010, <strong>the</strong> Department <strong>of</strong><br />
Human Services (DHS) will reduce investments in<br />
<strong>the</strong> area <strong>of</strong> fixed costs – bricks and mortar investments<br />
that are better utilized in direct services to vulnerable<br />
residents. As DHS transitions to a completely paperless<br />
and automated system, staff will be consolidated<br />
to increase productivity and three facilities will be<br />
vacated and relocated. These locations include <strong>the</strong><br />
NE Service Center (3917-19 Minnesota Avenue<br />
NE), <strong>the</strong> IMA Change Center (33 N Street NE), and<br />
<strong>the</strong> Family Services Administration (2146 24th Place<br />
NE). Where building leases do not expire in FY<br />
2009, only <strong>the</strong> security costs for <strong>the</strong> locations are<br />
reduced, leading to a total savings <strong>of</strong> $906,939. This<br />
budget also revises two previous estimates, removing<br />
erroneous charges for 717 14th Street NW and rent<br />
at DC Village, a District-owned building – a total<br />
reduction <strong>of</strong> $1,488,974.<br />
Fur<strong>the</strong>r, <strong>the</strong>re are a series <strong>of</strong> shelters for which<br />
building-related services were covered in <strong>the</strong> provider<br />
contract, thus allowing a reduction in fixed costs.<br />
Shelter security savings were completely removed at<br />
<strong>the</strong> Virginia Williams Resource Center and 80 percent<br />
<strong>of</strong> security services were removed from <strong>the</strong> DC<br />
General family shelter, for a total savings <strong>of</strong> $554,517.<br />
FY 2010 Proposed <strong>Budget</strong> and <strong>Financial</strong> Plan<br />
E-8<br />
Shelter occupancy savings were removed from 342<br />
37th Street SE and 1355-57 Valley Avenue totaling<br />
$125,200 in savings. Finally, shelter janitorial costs<br />
for 2210 Adams NE, 4 DC Village, 1725 Lincoln<br />
Road NE and 611 N Street NE were reduced by 80<br />
percent or $95,370, to reflect charges covered in<br />
provider contracts.<br />
Additional adjustments based on revised estimates<br />
include a $57,802 reduction in electricity; a $205,649<br />
reduction in fleet management; a $34,720 decrease<br />
in out-<strong>of</strong>-state travel; a $161,337 decrease in occupancy<br />
costs; a $126,512 telecommunications<br />
decrease; a $350,000 reduction in IT hardware and<br />
consulting contracts; while <strong>the</strong> revised procurement<br />
assessment will decrease by $246,787.<br />
To realize additional local cost savings, multiple<br />
positions will switch funding sources, generally moving<br />
from Local to Federal and Medicaid grant funding<br />
by way <strong>of</strong> filling federal vacancies. The effect <strong>of</strong><br />
<strong>the</strong>se personnel shifts will result in a reduction <strong>of</strong><br />
$139,992 in Medicaid funds and $372,884 in Federal<br />
Grant funds within personal services.<br />
Ano<strong>the</strong>r $1,082,100 in savings will come from<br />
realigning staffing in <strong>the</strong> areas <strong>of</strong> fleet, information<br />
systems, and program monitoring and investigations<br />
for efforts.<br />
There are no reductions in programs or direct<br />
client serving staff. No resident services administered<br />
by IMA will be reduced and <strong>the</strong> funding provided to<br />
<strong>the</strong> Interim Disability Assistance (IDA) program will<br />
see a one-time increase. The District will continue to<br />
meet its required TANF Maintenance <strong>of</strong> Effort<br />
(MOE) and fully utilize <strong>the</strong> TANF Block Grant.<br />
Within <strong>the</strong> Family Services Administration (FSA), <strong>the</strong><br />
Permanent Supportive Housing (PSH) initiatives will<br />
remain funded at its FY 2009 level, and DHS will<br />
continue its tireless efforts to transition individuals<br />
into more appropriate housing and shelter environments.<br />
Fur<strong>the</strong>r, FSA client-serving staff and programs<br />
will remain fully funded.<br />
Policy Initiatives: An important strategy for DHS<br />
involves utilizing TANF carryover cash, which has<br />
accumulated over <strong>the</strong> years as portions <strong>of</strong> <strong>the</strong> federal<br />
TANF Block Grant were not fully drawn down. By<br />
federal regulations, funds that are not drawn down<br />
can only be used in subsequent years as local cash<br />
assistance. To use <strong>the</strong>se funds as local cash assistance,<br />
a jurisdiction must exceed its TANF Maintenance <strong>of</strong>
Effort (MOE) spending in an amount equivalent to<br />
<strong>the</strong> reduction in local cash assistance. Then TANF<br />
carryover funds can be used to backfill reductions in<br />
<strong>the</strong> local cash assistance within <strong>the</strong> TANF Block<br />
Grant. In FY 2010, DHS will claim three additional<br />
programs as MOE for a total reduction <strong>of</strong> $8,200,000<br />
in local spending. These programs include<br />
$5,700,000 in Emergency Rental Assistance (ERAP),<br />
which goes to TANF eligible families, a $500,000<br />
Intra-District transfer from <strong>the</strong> University <strong>of</strong> <strong>the</strong><br />
District <strong>of</strong> Columbia (UDC) for employment programming<br />
for TANF eligible families, and<br />
$2,000,000 in case management services for homeless<br />
families.<br />
In FY 2010, <strong>the</strong> full amount <strong>of</strong> <strong>the</strong> $88,000,000<br />
federal TANF Block Grant will be used. Instead <strong>of</strong><br />
expending local funds on 20 case managers within<br />
FSA, who work exclusively with TANF eligible families,<br />
DHS will charge <strong>the</strong>ir full salaries, $1,720,357, to<br />
<strong>the</strong> TANF Block Grant. They will provide targeted<br />
case management services for clients involved in <strong>the</strong><br />
TANF Employment Program and assist <strong>the</strong>se families<br />
with removing barriers to employment and increasing<br />
self sufficiency.<br />
DHS will <strong>the</strong>n completely expend <strong>the</strong> remainder<br />
<strong>of</strong> <strong>the</strong> FY 2010 TANF Block Grant by funding a portion<br />
<strong>of</strong> <strong>the</strong> District’s Low Income Home Energy<br />
Assistance Program (LIHEAP). Currently, <strong>the</strong><br />
District Department <strong>of</strong> <strong>the</strong> Environment (DDOE)<br />
administers <strong>the</strong> LIHEAP benefit. However, <strong>the</strong>re is a<br />
significant overlap in <strong>the</strong> client populations served by<br />
DHS and <strong>the</strong> LIHEAP population. In FY 2010, all<br />
LIHEAP workers will be co-located at IMA, providing<br />
District residents a more singular front door for<br />
benefits. DHS will also pay for $2,000,000 <strong>of</strong><br />
LIHEAP by including $974,412 in <strong>the</strong> FY 2010<br />
TANF Block Grant and $1,025,588 <strong>of</strong> TANF carryover<br />
funds. This will allow DDOE to reduce<br />
$2,000,000 in local LIHEAP spending.<br />
Finally, <strong>the</strong> Interim Disability Assistance (IDA)<br />
program is designed to provide temporary financial<br />
assistance to disabled individuals who have applied for<br />
and are awaiting approval <strong>of</strong> Supplemental Security<br />
Income (SSI). If individuals are approved for SSI, <strong>the</strong><br />
District’s spending towards those individuals is recovered.<br />
The recoveries from SSI go into a Special<br />
Purpose fund, which is used to meet <strong>the</strong> gap between<br />
<strong>the</strong> District’s allocation to IDA and yearly expenditures<br />
on <strong>the</strong> program. The <strong>Office</strong> <strong>of</strong> <strong>the</strong> <strong>Chief</strong><br />
<strong>Financial</strong> <strong>Office</strong>r projected a $25,000 increase in SSI<br />
recoveries in FY 2010. However, <strong>the</strong>re still remains a<br />
projected $1,998,736 gap between IDA’s projected<br />
expenditures minus SSI recoveries and District spending.<br />
To sustain <strong>the</strong> IDA program, $1,998,736 will be<br />
added to Local funds in FY 2010.<br />
For <strong>the</strong> purposes <strong>of</strong> <strong>the</strong> multiyear financial plan,<br />
<strong>the</strong> proposed budget designates a total <strong>of</strong> $7,593,736<br />
budgeted for IDA payments and $8,693,000 for<br />
ERAP subsidies as expenditures supported with onetime<br />
resources.<br />
The Family Services program has a division for<br />
homeless services for individuals or families in <strong>the</strong><br />
District <strong>of</strong> Columbia who are homeless or at risk <strong>of</strong><br />
homelessness to maintain or obtain improved housing.<br />
Three one-time expenditures were allotted to this<br />
program; $100,000 for <strong>the</strong> Homeless at Friendship<br />
Place, $250,000 to grant Access Housing<br />
Incorporated to support <strong>the</strong> housing needs <strong>of</strong> District<br />
veterans and $250,000 to restore <strong>the</strong> grant for <strong>the</strong><br />
D.C. Central Kitchen.<br />
Additional allocations for <strong>the</strong> Family Services program<br />
are $750,000 to support <strong>the</strong> housing first initiative<br />
and one-time funds <strong>of</strong> $500,000 to fund <strong>the</strong><br />
Evictions with Dignity Act. To sustain <strong>the</strong> Income<br />
and Maintenance program, $1,500,000 will be added<br />
in FY 2010 for TANF. These additional funds will be<br />
used for cash assistance.<br />
The District’s FY 2010 Omnibus Appropriation<br />
Act distributes federal payment funds to District<br />
agencies to enhance <strong>the</strong> quality <strong>of</strong> life for District residents.<br />
DHS was allocated $19,200,000 for permanent<br />
supportive housing to remain available until<br />
September 30, 2011. All grantees and amounts listed<br />
in this budget are subject to final approval in <strong>the</strong><br />
Fiscal Year 2010 <strong>Budget</strong> Support Act <strong>of</strong> 2009, Bill<br />
Number 18-203, which supersedes this listing upon<br />
its effective date.<br />
Stimulus: In FY 2010, DHS will benefit from <strong>the</strong><br />
American Recovery and Reinvestment Act (ARRA) in<br />
four principal ways: (1) increased ability to draw<br />
down TANF carryover funds; (2) an increase in <strong>the</strong><br />
Food Stamp rates <strong>of</strong> 13.6 percent that will go directly<br />
to all Food Stamp recipients; (3) a Community<br />
Services Block Grant that passes through to designated<br />
Community Action agencies; and (4) an<br />
Emergency Contingency Fund for TANF.<br />
First, <strong>the</strong> ARRA allows agencies to draw down<br />
TANF carryover funds for TANF-related purposes in<br />
FY 2010, and DHS will draw down an additional<br />
Department <strong>of</strong> Human Services<br />
E-9
$5,500,000 to backfill a reduction to its capital funds.<br />
These funds will also be used towards creating an<br />
automated case management and client eligibility system.<br />
Secondly, <strong>the</strong> increase to Food Stamps is a direct<br />
benefit to Food Stamps recipients, which will allow<br />
<strong>the</strong>m to receive an increased monthly benefit <strong>of</strong> 13<br />
percent. DHS estimates that, at minimum, an additional<br />
$18,624,000 will go directly to District Food<br />
Stamp recipients in FY 2010. Meanwhile <strong>the</strong><br />
Community Services Block Grant award, totaling<br />
approximately $16,427,550 over FY 2009 and FY<br />
2010, provides funds to lessen poverty and support a<br />
range <strong>of</strong> services for low-income individuals. The<br />
award passes through government agencies to<br />
Community Action agencies, which administer <strong>the</strong><br />
funds. It is estimated that $10,400,000 will benefit<br />
<strong>the</strong> D.C. community in FY 2010. Finally, <strong>the</strong><br />
Emergency Contingency Fund for TANF aims to<br />
provide states with relief during <strong>the</strong> recession. While<br />
<strong>the</strong> specific guidance in calculating this award has not<br />
been issued at this time, DHS estimates that it will<br />
receive between $1,500,000 and $6,000,000 in FY<br />
2010. These funds will likely be used to create a Work<br />
Advantage program that will support TANF eligible<br />
families, who are working at least 20 hours per week,<br />
by providing rental assistance, a savings match and<br />
case management support.<br />
As in FY 2009, DHS will receive $525,746 in FY<br />
2010 to administer <strong>the</strong> Food Stamp stimulus award.<br />
Intra-<strong>Agency</strong> Transfers: DHS will transfer $6 million<br />
from TANF local/MOE to TANF Local/Local for <strong>the</strong><br />
realignment <strong>of</strong> TANF cash assistance. The budget will<br />
be in line with projected expenditures for FY 2010.<br />
Gap-Closing Initiatives: The Department <strong>of</strong> Human<br />
Services will remove one-time grant enhancements<br />
within its budget, for a total savings <strong>of</strong> $600,000. It<br />
will fur<strong>the</strong>r reduce enhancements <strong>of</strong> one-time funds<br />
<strong>of</strong> $500,000 for <strong>the</strong> Evictions with Dignity Act, for<br />
which DHS is not <strong>the</strong> appropriate implementing<br />
agency. The enhancement <strong>of</strong> $1,500,000 in <strong>the</strong><br />
TANF cash assistance program will be reduced due to<br />
significant TANF policy changes and <strong>the</strong> availability<br />
<strong>of</strong> TANF Emergency Contingency Funding. Finally,<br />
<strong>the</strong> enhancement to <strong>the</strong> Housing First Initiative will<br />
be reduced by $750,000 in context <strong>of</strong> anticipated federal<br />
funds for Housing First.<br />
Then, DHS will realize administrative costs savings<br />
by realigning contracts in <strong>the</strong> <strong>Office</strong>s <strong>of</strong> <strong>the</strong><br />
FY 2010 Proposed <strong>Budget</strong> and <strong>Financial</strong> Plan<br />
E-10<br />
Director, Program Monitoring, and Information<br />
Systems for a total savings <strong>of</strong> $175,000. A reduction<br />
in 7 non-direct services positions, with associated<br />
shifts from local to indirect costs, will also yield a local<br />
savings <strong>of</strong> $736,000.<br />
Beginning in FY 2010, $7,400,000 <strong>of</strong> Homeless<br />
Prevention and Rapid Re-housing funding (HPRP)<br />
from <strong>the</strong> American Recovery and Reinvestment Act<br />
(ARRA) will become available to District residents.<br />
These funds are similar to multiple tenant assistance<br />
efforts currently available, allowing DHS to absorb<br />
reductions <strong>of</strong> $344,000 and $1,300,000 in tenant<br />
assistance and Emergency Rental Assistance respectively.<br />
Increased program management, which aligns<br />
funding with program performance and demand, will<br />
allow a realignment <strong>of</strong> $500,000 in general assistance<br />
to children (benefit payments to non-relative caregivers)<br />
with FY 2009 and historic utilization rates.<br />
Finally, DHS will reduce $1,900,000 in spending on<br />
<strong>the</strong> consistently under-performing supported employment<br />
program.<br />
Finally, in FY 2010 DHS will begin significant<br />
reforms to <strong>the</strong> TANF program, which will result in<br />
approximately $3,684,875 in local savings – an<br />
amount which factors increased investments in capacity<br />
building and services/supports that help move<br />
individuals beyond welfare dependency. First, DHS<br />
will focus on implementing existing TANF policies,<br />
including partially sanctioning those customers who<br />
are not meeting at least 50 percent <strong>of</strong> <strong>the</strong>ir work participation<br />
goals. To fur<strong>the</strong>r incentivize work participation<br />
and seize <strong>the</strong> opportunity provided by <strong>the</strong><br />
TANF Emergency Contingency Funding, DHS will<br />
implement a monthly incentive <strong>of</strong> $100 per TANF<br />
family for those who meet full work participation targets.<br />
This additional $100 monthly will serve as a<br />
benefit increase to all individuals meeting work participation<br />
goals and an incentive towards full participation.<br />
Finally, <strong>the</strong>re is a significant need to re-engage<br />
TANF customers who fail to meet work participation<br />
goals and who have remained in partial sanction status<br />
for multiple years. Beginning in FY 2010, those<br />
customers who are sanctioned or become sanctioned<br />
will have 6 months to meet at least 50 percent <strong>of</strong> <strong>the</strong>ir<br />
work participation targets; o<strong>the</strong>rwise, <strong>the</strong>y will face a<br />
50 percent reduction in <strong>the</strong> full TANF benefit<br />
amount. Customers will have ano<strong>the</strong>r 6 months to<br />
move to full participation.
FY 2009 Approved <strong>Budget</strong> to FY 2010 Proposed <strong>Budget</strong>, by Revenue Type<br />
Table JA0-5 itemizes <strong>the</strong> changes by revenue type between <strong>the</strong> FY 2009 approved budget and <strong>the</strong> FY 2010 proposed<br />
budget. The four categories <strong>of</strong> changes reflected in this table are: (1) changes to <strong>the</strong> baseline budget (includes<br />
agency request), (2) changes representing cost savings or efficiencies, (3) changes related to policy initiatives, and (4)<br />
changes to specifically address <strong>the</strong> projected revenue shortfall.<br />
Table JA0-5<br />
(dollars in thousands)<br />
PROGRAM BUDGET FTE<br />
LOCAL FUND: FY 2009 Approved <strong>Budget</strong> and FTE 168,882 318.9<br />
Initial and Baseline Adjustments<br />
Net effect <strong>of</strong> fixed cost adjustments - Revise Fixed Cost estimates for<br />
Energy, Telecom, Rent, Janitorial, Security and Occupancy<br />
Multiple -54 0.0<br />
Net effect <strong>of</strong> salary and benefits changes - Revise Personal Services Multiple 1,040 1.0<br />
Intra-<strong>Agency</strong> Changes - Revise Subsidies & Transfers Multiple 5,159 0.0<br />
Intra-<strong>Agency</strong> Changes - Revise Supplies Multiple -100 0.0<br />
Intra-<strong>Agency</strong> Changes - Revise O<strong>the</strong>r Services and Charges Multiple 27 0.0<br />
Intra-<strong>Agency</strong> Changes - Reduction in Contractual Services Multiple -34 0.0<br />
Intra-<strong>Agency</strong> Changes - Reduction in Equipment Multiple -39 0.0<br />
Baseline Adjustments: Reduction for nonrecurring costs -<br />
Subsidies & Transfers<br />
Family Services -8,550 0.0<br />
Baseline Adjustments: Net effect <strong>of</strong> fixed cost adjustments - Revised Fixed<br />
Cost estimates for Energy, Rent, Janitorial, Security, and Occupancy and Fleet<br />
Multiple -4,774 0.0<br />
Baseline Adjustments: Net effect <strong>of</strong> fixed cost adjustments - Revise telecom to<br />
restore FY 2010 telecom rescission applied as a duplicate entry<br />
Multiple 890 0.0<br />
Baseline Adjustments: Net effect <strong>of</strong> salary and benefits changes -<br />
Reduction in Personal Services<br />
Family Services -101 -1.0<br />
Baseline Adjustments: Net effect <strong>of</strong> salary and benefits changes - Revise<br />
Subsidies and Transfers to <strong>of</strong>fset funds for <strong>the</strong> removal <strong>of</strong> 1 FTE from <strong>the</strong><br />
agency request<br />
Family Services 101 0.0<br />
Baseline Adjustments: - Revise Contractual Services due to new fixed cost<br />
from <strong>the</strong> January revised estimate<br />
Multiple 3,989 0.0<br />
Baseline Adjustments: - Revise Subsidies and Transfers due to new fixed cost<br />
from <strong>the</strong> January revised estimate<br />
Family Services 785 0.0<br />
Policy Initiatives and Cost Savings<br />
Shift - Realign TANF Cash Assistance Income Maintenance 6,000 0.0<br />
Shift - Realignment <strong>of</strong> TANF Cash Assistance Income Maintenance -6,000 0.0<br />
Cost Decrease - Reduce IT consulting contracts <strong>Agency</strong> Management<br />
Progam<br />
-250 0.0<br />
Cost Decrease - Reduce IT hardware purchases <strong>Agency</strong> Management<br />
Progam<br />
-100 0.0<br />
Reduce - Realign <strong>the</strong> <strong>Office</strong> <strong>of</strong> Program Review Monitoring <strong>Agency</strong> Management -406 -5.8<br />
and Investigations Progam<br />
Cost Decrease - Vacate IMA Change Center (33 N Street NE) as part <strong>of</strong><br />
program restructuring/records automation<br />
Income Maintenance -290 0.0<br />
Cost Increase - One-time increase in Local funding for Interim Disability<br />
Assistance to cover projected program expenditures, due to slow SSI<br />
determinations and recoveries<br />
Shift - One-time savings from reducing <strong>the</strong> cash portion <strong>of</strong><br />
Income Maintenance 1,999 0.0<br />
local TANF funding and using TANF cash carryover Income Maintenance -8,200 0.0<br />
Cost Decrease - Reduce security costs by vacating 2146 24th Place NE and Family Services<br />
relocating FSA<br />
(Continued on next page)<br />
-359 0.0<br />
Department <strong>of</strong> Human Services<br />
E-11
Table JA0-5 (continued)<br />
(dollars in thousands)<br />
FY 2010 Proposed <strong>Budget</strong> and <strong>Financial</strong> Plan<br />
E-12<br />
PROGRAM BUDGET FTE<br />
Policy Initiatives and Cost Savings<br />
Cost Decrease - Reflect coverage <strong>of</strong> 80% <strong>of</strong> janitorial costs in provider Family Services -95 0.0<br />
contracts for 2210 Adams NE, 4 DC Village, 1725 Lincoln Road NE<br />
and 611 N St NE<br />
Cost Decrease - Reflect security charges covered in provider contract for DC Family Services -383 0.0<br />
General family shelter<br />
Cost Decrease - Reflect security charges covered in provider contract for Family Services -171 0.0<br />
Virginia Williams Resource Center<br />
Cost Decrease - Reflect shelter occupancy charges covered in provider Family Services -125 0.0<br />
contracts for 342 37th St SE and 1355-57 Valley Avenue<br />
Cost Decrease - Remove erroneous rent charge at DC Village, a District-owned Family Services -84 0.0<br />
building<br />
Shift - Move 20 case management positions within FSA from local funding into Family Services -1,720 -20.0<br />
<strong>the</strong> TANF Block Grant<br />
Cost Decrease - Remove erroneous rent charge for 717 14th Street NW Multiple -1,405 0.0<br />
Cost Decrease - Adjust local travel costs down 5% Multiple Programs -5 0.0<br />
Cost Decrease - Align electricity budget with revised OPM estimates Multiple Programs -58 0.0<br />
Cost Decrease - Align occupancy budget with revised OPM estimates Multiple Programs -161 0.0<br />
Cost Decrease - Align procurement assessment budget with revised OCP Multiple Programs -247 0.0<br />
estimates<br />
Cost Decrease - Align telecom budget with revised OCTO estimates Multiple Programs -107 0.0<br />
Cost Decrease - Realign staffing and right size fleet due to District's new fleet Multiple Programs -363 -3.0<br />
share program and revised DPW estimates<br />
Cost Decrease - Realign telecom usage based on revised DHS utilization Multiple Programs -20 0.0<br />
analysis<br />
Cost Decrease - Reduction in out <strong>of</strong> town travel Multiple Programs -30 0.0<br />
Cost Decrease - Vacate <strong>the</strong> NE Service Center (3917-19 Minnesota Avenue NE) Multiple Programs -258 0.0<br />
as part <strong>of</strong> program restructuring<br />
Reduce - Realign agency-wide administrative supports Multiple Programs -838 -17.0<br />
Reduce - Realign staffing in <strong>the</strong> <strong>Office</strong> <strong>of</strong> Information Systems Multiple Programs -519 -5.0<br />
Cost Increase - One-time Expenditure to restore grant for DC Central Family Services 250 0.0<br />
Kitchen<br />
Cost Increase - One-time grant to <strong>the</strong> Homeless at Friendship Place Family Services 100 0.0<br />
Cost Increase - One-time grant for Access Housing Family Services 250 0.0<br />
Cost Increase - One-time to fund <strong>the</strong> Evictions with Dignity Act Family Services 500 0.0<br />
Cost Increase - TANF Cash Assistance Income Maintenance 1,500 0.0<br />
Cost Increase - To Support <strong>the</strong> Housing First Initiative Family Services 750 0.0<br />
Gap-Closing Initiatives<br />
Cost Decrease - Reduce non-competitive one-time grants Family Services -600 0.0<br />
Cost Decrease - Remove one-time funds for <strong>the</strong> Evictions with Dignity Act Family Services -500 0.0<br />
Cost Decrease - Maintain TANF cash assistance Income Maintenance -1,500 0.0<br />
Cost Decrease - Maintain Housing First Initiative Family Services -750 0.0<br />
Cost Decrease - Contract realignments in Director's <strong>Office</strong> <strong>Agency</strong> Management<br />
Program<br />
-50 0.0<br />
Cost Decrease - Contract realignments in <strong>Office</strong> <strong>of</strong> Program Review <strong>Agency</strong> Management -25 0.0<br />
Monitoring and Investigations Program<br />
Cost Decrease - Contract realignments in <strong>Office</strong> <strong>of</strong> Information Systems <strong>Agency</strong> Management<br />
Program<br />
-100 0.0<br />
Reduce - Absorb tenant assistance funding into <strong>the</strong> $7.4 Million <strong>of</strong><br />
Homeless Prevention and Rapid Refocusing (HPRP) stimulus funding<br />
(Continued on next page)<br />
Income Maintenance -344 0.0
Table JA0-5 (continued)<br />
(dollars in thousands)<br />
PROGRAM BUDGET FTE<br />
Gap-Closing Initiatives (cont)<br />
Reduce - Reduce 6.5 non-direct services positions, with associated shifts Various -736 -6.5<br />
from local to indirect costs<br />
Reduce - Realign TANF policies to ensure implementation <strong>of</strong> current Income Maintenance -3,684 0.0<br />
regulations, reward those meeting work participation rates, and actively<br />
re-engage sanctioned customers into participation and compliance<br />
Reduce - Reduce spending on an under-performing supported Income Maintenance -1,900 0.0<br />
employment program<br />
Reduce - Absorb a 15 percent reduction in ERAP funding into <strong>the</strong> $7.4 Income Maintenance -1,300 0.0<br />
million <strong>of</strong> Homeless Prevention and Rapid Refocusing (HPRP) stimulus funding<br />
Reduce - Realign <strong>the</strong> general assistance to children with demand and Income Maintenance -500 0.0<br />
utilization rates<br />
LOCAL FUND: FY 2010 Proposed <strong>Budget</strong> and FTE 144,388 261.6<br />
SPECIAL PURPOSE REVENUE FUNDS: FY 2009 Approved <strong>Budget</strong> and FTE 2,800 0.0<br />
Initial and Baseline Adjustments<br />
Intra-<strong>Agency</strong> Changes - Reduction in Supplies Income Maintenance -20 0.0<br />
Reduction in contractual services Income Maintenance -80 0.0<br />
Policy Initiatives and Cost Savings<br />
Enhance - Align SSI payback with OCFO projection Income Maintenance 25 0.0<br />
SPECIAL PURPOSE REVENUE FUNDS: FY 2010 Proposed <strong>Budget</strong> and FTE 2,725 0.0<br />
FEDERAL PAYMENTS: FY 2009 Approved <strong>Budget</strong> and FTE 0 0.0<br />
Policy Initiatives and Cost Savings<br />
Cost Increase - FY 2010 Omnibus Appropriation Act -Federal Payment to Family Services 19,200 0.0<br />
support permanent supportive housing<br />
FEDERAL PAYMENTS: FY 2010 Proposed <strong>Budget</strong> and FTE 19,200 0.0<br />
FEDERAL GRANT FUND: FY 2009 Approved <strong>Budget</strong> and FTE 146,673 446.0<br />
Initial and Baseline Adjustments<br />
Net effect <strong>of</strong> fixed cost adjustments - Revised Fixed Cost estimates for Rent <strong>Agency</strong> Management -181 0.0<br />
and Security Program<br />
Net effect <strong>of</strong> salary and benefits changes - Reduction in Personal Services Multiple -609 -6.7<br />
Intra-<strong>Agency</strong> Changes - Revise Supplies Multiple 24 0.0<br />
Intra-<strong>Agency</strong> Changes - Revise O<strong>the</strong>r Services & Charges Multiple 75 0.0<br />
Intra-<strong>Agency</strong> Changes - Revise Contractual Services Multiple 1,032 0.0<br />
Intra-<strong>Agency</strong> Changes - Reduction in Subsidies & Transfers Multiple -11,518 0.0<br />
Intra-<strong>Agency</strong> Changes - Revise Equipment <strong>Agency</strong> Management 23 0.0<br />
Progam<br />
Policy Initiatives and Cost Savings<br />
Cost Decrease - Realign staffing in fleet management <strong>Agency</strong> Management<br />
Progam<br />
-53 -1.0<br />
Enhance - Increase in <strong>the</strong> Community Services Block Grant from <strong>the</strong> American<br />
Recovery and Reinvestment Act. Grant passes through to community action<br />
agencies<br />
Family Services 10,400 0.0<br />
Cost Decrease - Net effect <strong>of</strong> salary and benefits changes, reduction in<br />
personal services<br />
Multiple Programs -373 -3.3<br />
Shift - Move 20 case management positions within FSA from local<br />
funding into <strong>the</strong> TANF Block Grant<br />
(Continued on next page)<br />
Income Maintenance 0 20.0<br />
Department <strong>of</strong> Human Services<br />
E-13
Table JA0-5 (continued)<br />
(dollars in thousands)<br />
Policy Initiatives and Cost Savings (cont)<br />
FY 2010 Proposed <strong>Budget</strong> and <strong>Financial</strong> Plan<br />
E-14<br />
PROGRAM BUDGET FTE<br />
Cost Increase - Food Stamp Stimulus Income Maintenance 526 0.0<br />
Gap Closing Initiatives<br />
Enhance - Associated shift from local to indirect costs resulting from Various 150 -0.5<br />
Personal Services reductions<br />
FEDERAL GRANT FUND: FY 2010 Proposed <strong>Budget</strong> and FTE 146,170 454.5<br />
FEDERAL MEDICAID PAYMENTS: FY 2009 Approved <strong>Budget</strong> and FTE 9,885 144.3<br />
Initial and Baseline Adjustments<br />
Net effect <strong>of</strong> fixed cost adjustments - Revise Fixed Cost estimates for Income Maintenance -214 0.0<br />
Energy and Security<br />
Net effect <strong>of</strong> salary and benefits changes - Revise Personal Services Multiple 913 4.3<br />
Intra-<strong>Agency</strong> Changes - Revise Supplies Income Maintenance 31 0.0<br />
Intra-<strong>Agency</strong> Changes - Revise O<strong>the</strong>r Services & Charges Income Maintenance 116 0.0<br />
Intra-<strong>Agency</strong> Changes - Revise Contractual Services Income Maintenance 50 0.0<br />
Intra-<strong>Agency</strong> Changes - Revise Subsidies & Transfers Income Maintenance 80 0.0<br />
Intra-<strong>Agency</strong> Changes - Revise Equipment Income Maintenance 57 0.0<br />
Policy Initiatives and Cost Savings<br />
Cost Decrease - Net effect <strong>of</strong> salary and benefit changes, reduction in Multiple Programs -140 0.0<br />
Personal Services.<br />
FEDERAL MEDICAID PAYMENTS: FY 2010 Proposed <strong>Budget</strong> and FTE 10,777 148.7<br />
PRIVATE GRANT FUND: FY 2009 Approved <strong>Budget</strong> and FTE 91 1.0<br />
Initial and Baseline Adjustments<br />
Net effect <strong>of</strong> salary and benefits changes - Reduction in Personal Service Family Services -91 -1.0<br />
PRIVATE GRANT FUND: FY 2010 Proposed <strong>Budget</strong> and FTE 0 0.0<br />
INTRA-DISTRICT FUNDS: FY 2009 Approved <strong>Budget</strong> and FTE 11,514 25.0<br />
Initial and Baseline Adjustments<br />
Net effect <strong>of</strong> salary and benefits changes - Reduction in Personal Services Income Maintenance -88 0.0<br />
Intra-<strong>Agency</strong> Changes - Revise Supplies Income Maintenance 28 0.0<br />
Intra-<strong>Agency</strong> Changes - Revise O<strong>the</strong>r Services & Charges Income Maintenance 61 0.0<br />
Baseline Adjustments: Net effect <strong>of</strong> salary and benefits changes -<br />
Reduction in Personal Services and vacancy savings due to a reduced<br />
Intra-District agreement<br />
Income Maintenance -161 -5.0<br />
Baseline Adjustments: Intra-agency Changes - Reduction in Supplies<br />
due to a reduced Inta-District agreement<br />
Income Maintenance -28 0.0<br />
Baseline Adjustments: Intra-agency Changes - Reduction in O<strong>the</strong>r<br />
Services and Charges due to a reduced Inta-District agreement<br />
Income Maintenance -61 0.0<br />
INTRA-DISTRICT FUNDS: FY 2010 Proposed <strong>Budget</strong> and FTE 11,265 20.0<br />
Gross for JA0 - Department <strong>of</strong> Human Services 334,525 884.8
<strong>Agency</strong> Performance Plan<br />
The agency’s Performance Plan has <strong>the</strong> following<br />
objectives for FY 2010:<br />
Objective 1: Connect residents with <strong>the</strong> necessary<br />
range <strong>of</strong> support services that will create <strong>the</strong> enabling<br />
conditions to achieve <strong>the</strong> greatest possible degree <strong>of</strong><br />
self-sufficiency.<br />
Objective 2: End homelessness in <strong>the</strong> District <strong>of</strong><br />
Columbia.<br />
Objective 3: Intervene, protect and grow <strong>the</strong> capacity<br />
<strong>of</strong> District residents vulnerable to abuse, neglect,<br />
and exploitation.<br />
Objective 4: Ensure ease <strong>of</strong> use, coordination,<br />
accountability and efficiency in <strong>the</strong> eligibility determination<br />
system.<br />
Department <strong>of</strong> Human Services<br />
E-15
<strong>Agency</strong> Performance Measures<br />
Table JA0-6<br />
FY 2010 Proposed <strong>Budget</strong> and <strong>Financial</strong> Plan<br />
E-16<br />
FY 2007 FY 2008 FY 2008<br />
Year-End Original Year-End FY 2009 FY 2010 FY 2011<br />
Measure Actual* Target Actual* Projection Projection Projection<br />
Objective 1:<br />
Percent <strong>of</strong> TEP participants that have obtained<br />
employment<br />
Percent <strong>of</strong> TANF participants that move out <strong>of</strong><br />
sanctions (base <strong>of</strong> 3300 in FY08) into employment<br />
40% 40% 44% 45% 50% 55%<br />
or employment activity<br />
Percent <strong>of</strong> families receiving homeless services enrolled<br />
N/A N/A N/A 7% 10% 15%<br />
in person-centric Case Management services<br />
Number <strong>of</strong> <strong>the</strong> 3000 identified TANF families, where<br />
child support payments are in arrears, where income<br />
N/A 75% 46% 85% 90% 100%<br />
increases by at least 5 percent N/A N/A N/A 100 800 1,100<br />
Objective 2:<br />
Number <strong>of</strong> formerly homeless single adults receiving<br />
supportive housing and case management N/A 40 3011 Number <strong>of</strong> formerly homeless families receiving<br />
400 TBD TBD<br />
permanent supportive housing and case management<br />
Percent <strong>of</strong> families moved from DC Village that do not<br />
re-enter emergency homeless system from<br />
N/A 75 213 100 80 80<br />
permanent housing<br />
Percent <strong>of</strong> individuals in PSH that do not re-enter<br />
N/A 95% 97% 95% 95% 95%<br />
homelessness<br />
Objective 3:<br />
Number <strong>of</strong> seniors that have had reported instances<br />
<strong>of</strong> abuse, neglect, or self-neglect that subsequently<br />
N/A N/A N/A 75% 80% 80%<br />
receive personal aide services N/A 50 90 75 75 75<br />
Objective 4:<br />
Number <strong>of</strong> human services cluster interagency<br />
programs or projects linked, enhanced or developed<br />
via <strong>the</strong> Technical Interagency Resources Board<br />
collaboration or s<strong>of</strong>tware implementation<br />
Percent <strong>of</strong> Medicaid eligibility determinations<br />
N/A N/A N/A 5 10 TBD<br />
finalized within 40 days N/A 80% 99% 90% 95% 100%<br />
Percent <strong>of</strong> reduction in <strong>the</strong> FY 2007 food stamp error<br />
rate<br />
N/A N/A 2.14% 1.75% 1.80% 2.5%<br />
2<br />
1 Only includes those housed with local funding, o<strong>the</strong>rs housed with federal funding.<br />
2 The Food Stamp Error rate for FY 2007 was 8.31%. The Error Rate for FY 2008 has only been computed through August 2008 (one month remaining). The rate through August 2008 is 6.21%-an estimated reduction<br />
<strong>of</strong> 2.14%.
Child and Family Services <strong>Agency</strong><br />
www.cfsa.dc.gov<br />
Telephone: 202-442-6000<br />
% Change<br />
FY 2008 FY 2009 FY 2010 from<br />
Description Actual Approved Proposed FY 2009<br />
Operating <strong>Budget</strong> $333,395,766 $290,556,805 $269,961,583 -7.1<br />
FTEs 821.4 940.0 892.0 -5.1<br />
(RL0)<br />
The mission <strong>of</strong> <strong>the</strong> Child and Family Services <strong>Agency</strong> (CFSA) is to<br />
improve <strong>the</strong> safety, permanence, and well-being <strong>of</strong> abused and neglected<br />
children and to streng<strong>the</strong>n troubled families in <strong>the</strong> District <strong>of</strong><br />
Columbia.<br />
Summary <strong>of</strong> Services<br />
The D.C. Child and Family Services <strong>Agency</strong> (CFSA)<br />
investigates reports <strong>of</strong> child abuse and neglect and<br />
provides child protection. Services include foster care,<br />
adoption and supportive community-based services<br />
to enhance <strong>the</strong> safety, permanence and well-being <strong>of</strong><br />
abused, neglected and at-risk children and <strong>the</strong>ir families<br />
in <strong>the</strong> District <strong>of</strong> Columbia. CFSA seeks to<br />
achieve <strong>the</strong> highest quality <strong>of</strong> community-based ser-<br />
vices to increase <strong>the</strong> number <strong>of</strong> families who receive<br />
community-based preventive and support services<br />
and to expand <strong>the</strong> network <strong>of</strong> resources providing services<br />
to at-risk children and <strong>the</strong>ir families.<br />
The agency’s FY 2010 proposed budget is presented<br />
in <strong>the</strong> following tables:<br />
Child and Family Services <strong>Agency</strong><br />
E-17
FY 2010 Proposed Gross Funds Operating <strong>Budget</strong>, by Revenue Type<br />
Table RL0-1 contains <strong>the</strong> proposed FY 2010 agency budget compared to <strong>the</strong> FY 2009 approved budget. It also<br />
provides FY 2007 and FY 2008 actual expenditures.<br />
Table RL0-1<br />
(dollars in thousands)<br />
Actual Actual Approved Proposed<br />
Change<br />
from Percent<br />
Appropriated Fund<br />
General Fund<br />
FY 2007 FY 2008 FY 2009 FY 2010 FY 2009 Change*<br />
Local Funds 181,226 274,265 196,825 194,161 -2,664 -1.4<br />
Special Purpose Revenue Funds 750 1,188 750 750 0 0.0<br />
Total for General Fund 181,976 275,453 197,575 194,911 -2,664 -1.3<br />
Federal Resources<br />
Federal Payments 545 1,649 0 0 0 N/A<br />
Federal Grant Funds 31,405 35,812 30,998 58,203 27,205 87.8<br />
Total for Federal Resources 31,950 37,461 30,998 58,203 27,205 87.8<br />
Private Funds<br />
Private Grant Funds 0 176 0 0 0 N/A<br />
Private Donations 152 133 23 22 -1 -4.3<br />
Total for Private Funds 152 309 23 22 -1 -4.3<br />
Intra-District Funds<br />
Intra-District Funds 72,102 20,174 61,960 16,825 -45,135 -72.8<br />
Total for Intra-District Funds 72,102 20,174 61,960 16,825 -45,135 -72.8<br />
Gross Funds 286,180 333,396 290,557 269,962 -20,595 -7.1<br />
*Percent Change is based on whole dollars.<br />
Note: If applicable, for a breakdown <strong>of</strong> each Grant (Federal and Private), Special Purpose Revenue type and Intra-District agreement,<br />
please refer to Schedule 80, <strong>Agency</strong> Summary by Revenue Source, in <strong>the</strong> Operating Appendices located on <strong>the</strong> <strong>Office</strong> <strong>of</strong> <strong>the</strong> <strong>Chief</strong><br />
<strong>Financial</strong> <strong>Office</strong>r’s website.<br />
FY 2010 Proposed <strong>Budget</strong> and <strong>Financial</strong> Plan<br />
E-18
FY 2010 Proposed Full-Time Equivalents, by Revenue Type<br />
Table RL0-2 contains <strong>the</strong> proposed FY 2010 FTE level compared to <strong>the</strong> FY 2009 approved FTE level by revenue<br />
type. It also provides FY 2007 and FY 2008 actual data.<br />
Table RL0-2<br />
Change<br />
Actual Actual Approved Proposed from Percent<br />
Appropriated Fund FY 2007 FY 2008 FY 2009 FY 2010 FY 2009 Change<br />
General Fund<br />
Local Funds 590.8 572.7 646.0 611.0 -35.0 -5.4<br />
Total for General Fund 590.8 572.7 646.0 611.0 -35.0 -5.4<br />
Federal Resources<br />
Federal Grant Funds 102.0 85.9 116.0 281.0 165.0 142.2<br />
Total for Federal Resources 102.0 85.9 116.0 281.0 165.0 142.2<br />
Intra-District Funds<br />
Intra-District Funds 165.0 162.9 178.0 0.0 -178.0 -100.0<br />
Total for Intra-District Funds 165.0 162.9 178.0 0.0 -178.0 -100.0<br />
Total Proposed FTEs 857.8 821.4 940.0 892.0 -48.0 -5.1<br />
Child and Family Services <strong>Agency</strong><br />
E-19
FY 2010 Proposed Operating <strong>Budget</strong>, by Comptroller Source Group<br />
Table RL0-3 contains <strong>the</strong> proposed FY 2010 budget at <strong>the</strong> Comptroller Source Group (object class) level compared<br />
to <strong>the</strong> FY 2009 approved budget. It also provides FY 2007 and FY 2008 actual expenditures.<br />
Table RL0-3<br />
(dollars in thousands)<br />
Change<br />
Actual Actual Approved Proposed from Percent<br />
Comptroller Source Group FY 2007 FY 2008 FY 2009 FY 2010 FY 2009 Change*<br />
11 Regular Pay - Cont Full Time 54,274 54,027 56,832 58,144 1,311 2.3<br />
12 Regular Pay - O<strong>the</strong>r 43 62 114 0 -114 -100.0<br />
13 Additional Gross Pay 1,401 1,420 654 365 -289 -44.2<br />
14 Fringe Benefits - Curr Personnel 10,873 11,225 10,690 11,538 848 7.9<br />
15 Overtime Pay 1,909 2,879 925 1,289 363 39.3<br />
Subtotal Personal Services (PS) 68,499 69,613 69,217 71,336 2,119 3.1<br />
20 Supplies and Materials 302 253 343 371 28 8.3<br />
30 Energy, Comm. and Bldg Rentals 232 275 139 272 133 96.0<br />
31 Telephone, Telegraph, Telegram, Etc 1,093 1,070 1,150 1,306 156 13.6<br />
32 Rentals - Land and Structures 6,899 7,384 8,150 9,293 1,143 14.0<br />
33 Janitorial Services 0 0 0 256 256 N/A<br />
34 Security Services 828 890 961 1,287 325 33.9<br />
35 Occupancy Fixed Costs 0 0 0 44 44 N/A<br />
40 O<strong>the</strong>r Services and Charges 1,094 1,147 2,428 2,048 -380 -15.6<br />
41 Contractual Services - O<strong>the</strong>r 14,115 15,375 15,491 12,571 -2,920 -18.9<br />
50 Subsidies and Transfers 190,928 194,861 191,352 170,583 -20,769 -10.9<br />
70 Equipment & Equipment Rental 944 1,510 1,326 594 -732 -55.2<br />
91 Expense Not <strong>Budget</strong>ed O<strong>the</strong>rs 1,247 41,017 0 0 0 N/A<br />
Subtotal Nonpersonal Services (NPS) 217,681 263,783 221,340 198,626 -22,714 -10.3<br />
Gross Funds 286,180 333,396 290,557 269,962 -20,595 -7.1<br />
*Percent Change is based on whole dollars.<br />
FY 2010 Proposed <strong>Budget</strong> and <strong>Financial</strong> Plan<br />
E-20
Program Description<br />
The Child and Family Services <strong>Agency</strong> operates<br />
through <strong>the</strong> following 6 programs:<br />
Child Welfare - provides time-limited protective services<br />
to at-risk families and abused and neglected children<br />
so that <strong>the</strong>y can achieve safety, permanency, and<br />
well-being ei<strong>the</strong>r with <strong>the</strong>ir own families or in alternate<br />
family/community settings.<br />
This program contains <strong>the</strong> following 10 activities:<br />
■ In-Home and Reunification - provides crisis and<br />
ongoing intervention services and supports to atrisk<br />
children and families to promote safety, permanence,<br />
and well being. Staff provide broad case<br />
management activities, and supportive services<br />
such as mentoring, tutoring, and treatment services<br />
to families with children remaining in <strong>the</strong><br />
home;<br />
■ Foster Care - provides ongoing intervention services<br />
and supports to foster care children and <strong>the</strong>ir<br />
families to promote safety, permanence, and wellbeing.<br />
Staff provide broad case management<br />
activities and supportive services such as mentoring,<br />
tutoring, and treatment services to children<br />
and families when children have been removed<br />
from home;<br />
■ In-take and Investigations – receives all reports <strong>of</strong><br />
allegations <strong>of</strong> abuse and neglect <strong>of</strong> children living<br />
in <strong>the</strong> District <strong>of</strong> Columbia, or who are wards <strong>of</strong><br />
<strong>the</strong> District <strong>of</strong> Columbia, and investigates such<br />
reports as appropriate;<br />
■ Teen Services – assists older youth in achieving<br />
permanency and provides a coordinated, progressive<br />
series <strong>of</strong> activities and experiences that support<br />
<strong>the</strong>ir successful transition to adulthood;<br />
■ Adoptions - ensures <strong>the</strong> safety and well-being <strong>of</strong><br />
children and <strong>the</strong> timely establishment <strong>of</strong> permanency<br />
for <strong>the</strong> children through adoption. In<br />
addition, this activity is also responsible for <strong>the</strong><br />
initiation <strong>of</strong> <strong>the</strong> adoption process and selection <strong>of</strong><br />
an appropriate resource family for children, facilitation<br />
<strong>of</strong> placements <strong>of</strong> children in pre-adoptive<br />
homes, monitoring <strong>of</strong> placements, conducting<br />
home studies, and completing <strong>the</strong> adoption<br />
process within <strong>the</strong> Court system through finalization;<br />
■ Policy - develops agency policy and provides<br />
review, interpretation and decision-making services<br />
to current or applicant CFSA caregivers and<br />
clients and resolves perceived injustices. Also, this<br />
activity provides policy and protocol service to <strong>the</strong><br />
CFSA director and staff so that <strong>the</strong>y can make<br />
decisions consistent with best practices and with<br />
statutory and regulatory requirements;<br />
■ Facility Licensing - licenses group homes and<br />
independent living facilities located in <strong>the</strong> District<br />
<strong>of</strong> Columbia that serve children and youth outside<br />
<strong>of</strong> <strong>the</strong> juvenile justice and mental health systems,<br />
including youth shelters, runaway shelters,<br />
and emergency care facilities;<br />
■ Quality Assurance - provides assessment, monitoring<br />
and recommendation services to CFSA<br />
staff and key stakeholders so that <strong>the</strong>y can achieve<br />
permanency planning goals for children and<br />
improve agency practice. In addition, <strong>the</strong> administration<br />
is responsible for facilitating qualitative<br />
review processes such as administrative review,<br />
child fatality review, and quality service reviews in<br />
order to identify, both on a case-by-case and systemic<br />
level, areas <strong>of</strong> strength and need in line with<br />
best practices and child welfare standards; and<br />
■ Planning and Data Analysis - provides reporting,<br />
data analysis, technical assistance, and research<br />
services to CFSA managers and external stakeholders<br />
in order to facilitate short and long-term<br />
agency strategic planning; and<br />
■ Training - supports improved performance in<br />
achieving positive outcomes for children and families<br />
by purposefully developing and conducting<br />
training focused on <strong>the</strong> critical knowledge and<br />
skills necessary to implement best practices and to<br />
promote safety, permanence, and well-being.<br />
Adoption and Guardianship Subsidy - provides<br />
financial assistance services to eligible relatives and<br />
adoptive parents so that <strong>the</strong>y can maintain children in<br />
permanent homes.<br />
This program contains <strong>the</strong> following 3 activities:<br />
■ Adoptions Subsidy - provides financial assistance<br />
services to eligible adoptive parents so<br />
that <strong>the</strong>y can maintain children in permanent<br />
homes;<br />
Child and Family Services <strong>Agency</strong><br />
E-21
■ Guardianship Subsidy - provides financial<br />
assistance services to eligible relatives so that <strong>the</strong>y<br />
can maintain children in permanent homes; and<br />
■ Grandparents Subsidy - provides financial assistance<br />
services to eligible grandparents so that <strong>the</strong>y<br />
can maintain children in permanent homes.<br />
Out <strong>of</strong> Home Care and Support - provides placement,<br />
health care, and related services to children living<br />
away from home and in CFSA custody so that<br />
<strong>the</strong>y can be safe and nurtured until <strong>the</strong>y are reunited<br />
with <strong>the</strong>ir families or placed in a permanent home.<br />
This program contains <strong>the</strong> following 5 activities:<br />
■ Child Placement - provides living arrangements<br />
for children who cannot live in <strong>the</strong>ir<br />
birth homes so that <strong>the</strong>y can be safe and to<br />
support a child’s well-being and permanency;<br />
■ Family Resources - provides foster and adoptive<br />
resource recruitment and support services<br />
to current and potential foster, kinship, and<br />
adoptive parents. The activity’s goal is to<br />
ensure that families can meet licensing standards<br />
to assure child safety and well-being and<br />
support a permanent home for <strong>the</strong> child;<br />
■ Health Services and Clinical Support - provides<br />
health and clinical services support to<br />
social workers so that <strong>the</strong>y can ensure <strong>the</strong><br />
health and well-being <strong>of</strong> children and families;<br />
■ Family Licensing - ensures that candidates<br />
seeking to provide foster or adoptive care are<br />
trained, licensed, monitored and supported to<br />
provide appropriate care for children in need<br />
<strong>of</strong> temporary or permanent homes; and<br />
■ Congregate Care Programs - ensures that private<br />
child placement and congregate care<br />
agencies under contract with <strong>the</strong> District to<br />
provide placements for children in foster care<br />
deliver services that maintain <strong>the</strong>ir safety and<br />
well-being and facilitate <strong>the</strong>ir moving to permanent<br />
homes.<br />
Community-Based Services - provides placement,<br />
health care, and related services to children living away<br />
from home and in CFSA custody so that <strong>the</strong>y can be<br />
safe and nurtured until <strong>the</strong>y are reunited with <strong>the</strong>ir<br />
families or placed in a permanent home.<br />
FY 2010 Proposed <strong>Budget</strong> and <strong>Financial</strong> Plan<br />
E-22<br />
This program contains <strong>the</strong> following activity:<br />
■ Community-Based Services - provides community-based<br />
prevention services to at-risk<br />
families and children in <strong>the</strong> neighborhoods so<br />
<strong>the</strong>y can achieve safety, permanency, and wellbeing<br />
in <strong>the</strong> least-restrictive setting, maximizing<br />
<strong>the</strong> use <strong>of</strong> informal and formal support<br />
systems through <strong>the</strong> Healthy Family/Thriving<br />
Community Collaboratives.<br />
<strong>Agency</strong> Management - provides for administrative<br />
support and <strong>the</strong> required tools to achieve operational<br />
and programmatic results. This program is standard<br />
for all agencies using performance-based budgeting.<br />
<strong>Agency</strong> <strong>Financial</strong> Operations - provides comprehensive<br />
and efficient financial management services to,<br />
and on behalf <strong>of</strong>, District agencies so that <strong>the</strong> financial<br />
integrity <strong>of</strong> <strong>the</strong> District <strong>of</strong> Columbia is maintained.<br />
This program is standard for all agencies using<br />
performance-based budgeting.<br />
Program Structure Change<br />
The Child and Family Services <strong>Agency</strong> had no program<br />
structure changes in <strong>the</strong> FY 2010 Proposed<br />
<strong>Budget</strong>.
FY 2010 Proposed Operating <strong>Budget</strong> and FTEs, by Program and Activity<br />
Table RL0-4 contains <strong>the</strong> proposed FY 2010 budget by program and activity compared to <strong>the</strong> FY 2009 approved budget.<br />
It also provides FY 2008 actual data.<br />
Table RL0-4<br />
(dollars in thousands)<br />
Dollars in Thousands Full-Time Equivalents<br />
Change Change<br />
Actual Approved Proposed from Actual Approved Proposed from<br />
Program/Activity FY 2008 FY 2009 FY 2010 FY 2009 FY 2008 FY 2009 FY 2010 FY 2009<br />
(1000) <strong>Agency</strong> Management Program<br />
(1010) Personnel Services Activity 1,592 2,082 1,704 -378 14.2 16.0 16.0 0.0<br />
(1015) Training & Employee Development Activity 2,477 1,880 2,041 160 8.7 25.0 23.0 -2.0<br />
(1020) Contracting and Procurement Actitivy 965 1,059 1,111 52 11.0 11.0 12.0 1.0<br />
(1030) Property Management Actitivy 11,528 12,873 14,411 1,538 18.8 21.0 12.0 -9.0<br />
(1040) Information Technology Activity 8,293 7,770 5,917 -1,853 28.0 32.0 26.0 -6.0<br />
(1050) <strong>Financial</strong> Management Activity 2,044 2,020 2,099 79 18.0 21.0 20.0 -1.0<br />
(1055) Risk Management Activity 329 371 380 9 3.0 3.0 3.0 0.0<br />
(1060) Legal Affairs Activity 305 194 104 -90 0.0 3.0 1.0 -2.0<br />
(1070) Fleet Management Activity 686 844 762 -82 0.0 0.0 0.0 0.0<br />
(1080) Communication Activity 506 475 356 -119 6.0 4.0 4.0 0.0<br />
(1085) Customer Services Activity 966 1,050 657 -393 6.1 9.0 7.0 -2.0<br />
(1087) Language Access 13 15 15 0 0.0 0.0 0.0 0.0<br />
(1090) Performance Management Activity 1,102 2,133 1,076 -1,057 12.0 15.0 8.0 -7.0<br />
(1099) Court Supervision 0 0 599 599 0.0 0.0 0.0 0.0<br />
Subtotal (1000) <strong>Agency</strong> Management Program 30,804<br />
(100F) <strong>Agency</strong> <strong>Financial</strong> Operations<br />
32,767 31,231 -1,537 125.8 160.0 132.0 -28.0<br />
(110F) <strong>Budget</strong> Operations 376 340 343 3 2.8 4.0 4.0 0.0<br />
(120F) Accounting Operations 1,837 2,168 2,227 59 21.9 24.0 23.0 -1.0<br />
Subtotal (100F) <strong>Agency</strong> <strong>Financial</strong> Operations 2,214<br />
(2000) Child Welfare Program<br />
2,509 2,571 62 24.7 28.0 27.0 -1.0<br />
(2010) In-Home Services 10,142 8,418 8,807 389 99.4 104.0 102.0 -2.0<br />
(2011) Foster Care Services 7,734 9,835 8,984 -851 100.1 122.0 116.0 -6.0<br />
(2020) Intake and Investigation Activity 11,340 8,559 10,989 2,430 112.4 128.0 131.0 3.0<br />
(2030) Teen Services Activity 5,993 6,021 5,817 -204 54.3 62.0 61.0 -1.0<br />
(2040) Adoption Activity 5,409 4,403 4,156 -248 42.0 49.0 46.0 -3.0<br />
(2050) Policy Activity 1,461 1,925 1,871 -54 16.5 17.0 14.0 -3.0<br />
(2055) Facility Licensing 0 0 602 602 0.0 0.0 7.0 7.0<br />
(2060) Quality Improvement 2,805 2,972 3,057 85 35.0 36.0 35.0 -1.0<br />
(2070) Planning and Data Analysis 965 1,181 983 -198 10.9 12.0 11.0 -1.0<br />
(2080) Organizational Dev/Practice Improvement 479 460 0 -460 3.0 6.0 0.0 -6.0<br />
Subtotal (2000) Child Welfare Program<br />
(Continued on next page)<br />
46,326 43,774 45,266 1,491 473.5 536.0 523.0 -13.0<br />
Child and Family Services <strong>Agency</strong><br />
E-23
Table RL0-4 (Continued)<br />
(dollars in thousands)<br />
Dollars in Thousands Full-Time Equivalents<br />
Change Change<br />
Actual Approved Proposed from Actual Approved Proposed from<br />
Program/Activity FY 2008 FY 2009 FY 2010 FY 2009 FY 2008 FY 2009 FY 2010 FY 2009<br />
(3000) Out-<strong>of</strong>-Home Care and Support<br />
(3010) Child Placement Activity 100,300 101,835 84,721 -17,114 43.0 49.0 47.0 -2.0<br />
(3020) Family Resources Activity 2,361 3,361 3,271 -90 30.0 36.0 35.0 -1.0<br />
(3030) Health Services and Clinical Support Act 29,079 31,906 29,626 -2,280 45.0 49.0 47.0 -2.0<br />
(3040) Licensing and Monitoring Activity 8,010 7,360 0 -7,360 79.4 82.0 0.0 -82.0<br />
(3041) Family Licensing 0 0 2,637 2,637 0.0 0.0 29.0 29.0<br />
(3060) Congregate Care Program 0 0 5,557 5,557 0.0 0.0 45.0 45.0<br />
Subtotal (3000) Out-<strong>of</strong>-Home Care and Support 139,750<br />
(4000) Adoption and Guardian Subsidy Program<br />
144,463 125,812 -18,650 197.4 216.0 203.0 -13.0<br />
(4010) Adoption & Guardianship Subsidy Activity 47,094 39,868 20,665 -19,203 0.0 0.0 0.0 0.0<br />
(4011) Guardianship Subsidy Activity 0 0 12,565 12,565 0.0 0.0 0.0 0.0<br />
(4012) Grandparent Subsidy Activity 0 0 6,309 6,309 0.0 0.0 0.0 0.0<br />
Subtotal (4000) Adoption and Guardian Subsidy Pgm.<br />
(5000) Community-Based Program<br />
47,094 39,868 39,539 -329 0.0 0.0 0.0 0.<br />
(5010) Community-Based Services 29,535 27,176 25,543 -1,633 0.0 0.0 7.0 7.0<br />
Subtotal (5000) Community-Based Program 29,535<br />
(9960) Yr End Close<br />
27,176 25,543 -1,633 0.0 0.0 7.0 7.0<br />
No Activty Assigned 37,673 0 0 0 0.0 0.0 0.0 0.0<br />
Subtotal (9960) Yr End Close 37,673 0 0 0 0.0 0.0 0.0 0.0<br />
Total Proposed Operating <strong>Budget</strong> 333,396 290,557 269,962 -20,595 821.4 940.0 892.0 -48.0<br />
(Change is calculated by whole numbers and numbers may not add up due to rounding)<br />
Note: For more detailed information regarding <strong>the</strong> proposed funding for <strong>the</strong> activities within this agency’s programs, please see Schedule 30-PBB<br />
Program Summary By Activity in <strong>the</strong> FY 2010 Operating Appendices located on <strong>the</strong> <strong>Office</strong> <strong>of</strong> <strong>the</strong> <strong>Chief</strong> <strong>Financial</strong> <strong>Office</strong>r’s website.<br />
FY 2010 Proposed <strong>Budget</strong> and <strong>Financial</strong> Plan<br />
E-24
Major Baseline Adjustments, Cost Savings<br />
and Policy Initiatives<br />
Initial Adjustment: The following adjustments were<br />
made in Local funds: an increase <strong>of</strong> $1,817,799 in <strong>the</strong><br />
<strong>Agency</strong> Management program in fixed cost adjustments<br />
for OPM estimates; an increase <strong>of</strong> $2,162,731<br />
and a decrease <strong>of</strong> 14.0 FTEs due to salary step and<br />
o<strong>the</strong>r personal services adjustments impacting multiple<br />
programs across <strong>the</strong> agency; a decrease <strong>of</strong><br />
$3,980,530 across multiple programs including projected<br />
decrease <strong>of</strong> <strong>the</strong> number <strong>of</strong> adoptions and<br />
change in <strong>the</strong> federal reimbursement rate from 50/50<br />
to 70/30. An increase <strong>of</strong> $909,968 and a decrease in<br />
FTEs <strong>of</strong> 14.0 in Federal Grant funds in multiple programs<br />
due to salary step and o<strong>the</strong>r personal services<br />
adjustments; an increase <strong>of</strong> $6,722,094 in multiple<br />
programs; and a decrease <strong>of</strong> $2,000 for fixed costs<br />
adjustments. In Intra-District funds: an increase <strong>of</strong><br />
$1,430,795 and 14.0 FTEs in multiple programs is<br />
due to salary step and o<strong>the</strong>r personal services adjustments;<br />
and a decrease <strong>of</strong> $1,482,744 from Medicaid<br />
revenues in multiple programs.<br />
Transitions in Claiming Medicaid Reimbursement:<br />
The FY 2010 budget reflects a necessary and complex<br />
transition in CFSA claims to Medicaid for federal<br />
reimbursement. While this transition is financially<br />
significant, this proposed budget ensures services to<br />
<strong>the</strong> children are being maintained.<br />
By way <strong>of</strong> background, CFSA’s baseline budget<br />
anticipated Medicaid reimbursement totaling<br />
$50,708,000 from <strong>the</strong> Department <strong>of</strong> Health Care<br />
Finance (DHCF). Of that amount, $20,944,920 was<br />
projected for Targeted Case Management (TCM) and<br />
$29,763,080 was projected for <strong>the</strong> Rehabilitative<br />
Option (Rehab Option). These funds were included<br />
in CFSA’s baseline prior to <strong>the</strong> release <strong>of</strong> a final internal<br />
District audit <strong>of</strong> costs reports from FY 2004 and<br />
FY 2005. The internal audit projected financial liabilities<br />
based on a sample <strong>of</strong> <strong>the</strong> agency’s claims for TCM<br />
and Rehab Option and revealed that <strong>the</strong> existing<br />
reimbursement methodology would very likely subject<br />
CFSA to continued liabilities. To reduce those<br />
liabilities, CFSA stopped claiming for TCM and<br />
Rehab Option services based on <strong>the</strong> existing methodology<br />
and is working with DHCF to develop a viable<br />
methodology for Medicaid Rehab Option services.<br />
This transition includes devising a methodology<br />
that provides payment for specific discrete services<br />
versus <strong>the</strong> current bundled methodology and obtaining<br />
approval for <strong>the</strong> methodology from <strong>the</strong> federal<br />
Centers for Medicare and Medicaid Services (CMS).<br />
CMS has increased its scrutiny <strong>of</strong> <strong>the</strong>se services<br />
because <strong>of</strong> questionable practices in o<strong>the</strong>r states.<br />
Additionally, implementing a new system in which<br />
<strong>the</strong> provider submits claims directly to DHCF<br />
instead <strong>of</strong> CFSA will require coordination with<br />
CFSA and <strong>the</strong> provider community. None<strong>the</strong>less,<br />
<strong>the</strong> changes in Medicaid funding do not impact services<br />
for <strong>the</strong> children.<br />
The proposed FY 2010 budget eliminates <strong>the</strong><br />
agency’s risk <strong>of</strong> TCM liability by eliminating <strong>the</strong><br />
entire amount ($20,944,920) <strong>of</strong> those Intra-District<br />
funds. Likewise, <strong>the</strong> budget all but eliminates <strong>the</strong><br />
agency’s liability for Rehab Option by reducing Intra-<br />
District funds by 97 percent ($28,763,080).<br />
Decreases in this Intra-District eliminate funding for<br />
nine (9) vacant FTE positions. The remaining<br />
$1,000,000 in Medicaid Intra-District funds anticipates<br />
reimbursements based on methodology<br />
changes that comply with local and federal regulations<br />
and laws.<br />
In FY 2010, a combination <strong>of</strong> Local funds and<br />
Federal grant payments from Title IV-E will <strong>of</strong>fset<br />
reductions in <strong>the</strong> Medicaid Intra-District funds to<br />
CFSA. Title IV-E Federal payments increase by<br />
$17,317,240. Recovery Act funds will add an additional<br />
$2,432,640, and <strong>the</strong> agency will also receive a<br />
one-time increase <strong>of</strong> $19,415,079 in Local funding.<br />
In FY 2011 and beyond, it is anticipated that <strong>the</strong><br />
agency will be able to obtain federal reimbursements,<br />
generating funding streams appropriately to realize<br />
cost savings to <strong>the</strong> Local budget.<br />
Transfers Out: Children removed from <strong>the</strong>ir homes<br />
must undergo medical screenings prior to out-<strong>of</strong>home<br />
placement. To improve timeliness and quality,<br />
CFSA will transition services for medical screening<br />
from hospital-based services to agency-based clinic<br />
services. <strong>Agency</strong>-based medical pr<strong>of</strong>essionals will<br />
provide immediate medical screenings that will contrast<br />
to <strong>the</strong> longer wait times experienced in hospitals.<br />
Claims to Medicaid for <strong>the</strong>se services will result in a<br />
$491,589 Local budget cost savings from projected<br />
federal reimbursement. In addition, under a new<br />
payment rate structure for Psychiatric Residential<br />
Treatment Facilities, <strong>the</strong>re will be a $793,875 Local<br />
Child and Family Services <strong>Agency</strong><br />
E-25
udget cost savings from projected federal reimbursement<br />
for CFSA placements. Finally, CFSA will transition<br />
services for refugee minors to <strong>the</strong> Department<br />
<strong>of</strong> Human Services to centralize <strong>the</strong> District's services<br />
to refugee populations. As a result, <strong>the</strong>re is a<br />
$175,000 decrease in Intra-District funds. Refugee<br />
minors in CFSA’s care will continue uninterrupted.<br />
Finally, <strong>the</strong> implementation <strong>of</strong> <strong>the</strong> Facilitated Family<br />
Group Decision Making is supported in <strong>the</strong> proposed<br />
budget via a transfer <strong>of</strong> $100,000 to <strong>the</strong> District<br />
Department on Disability Services.<br />
Cost Savings: The cost savings projected for CFSA in<br />
FY 2010 reflect both efficiencies and a renewed focus<br />
on child welfare core practices and will not have an<br />
adverse impact on services to children and <strong>the</strong>ir families.<br />
First, <strong>the</strong> budget reflects a decrease <strong>of</strong> $424,405<br />
for consultant costs in <strong>the</strong> <strong>Agency</strong> Management program<br />
and a decrease <strong>of</strong> $234,017 for temporary<br />
employee services to align with staffing needs. Next,<br />
<strong>the</strong> elimination <strong>of</strong> 9 vacant non-social worker positions<br />
in <strong>Agency</strong> Management accounts for a cost savings<br />
<strong>of</strong> $645,372, while eliminating 5 vacant nonsocial<br />
worker positions in <strong>the</strong> Child Welfare Program<br />
results in a $279,668 cost savings. Two vacant support<br />
positions will also be eliminated within <strong>the</strong> Out-<strong>of</strong>-<br />
Home Care and Support Program, yielding $102,955<br />
in cost decreases. Third, management improvements<br />
will reduce overtime by $96,000 in <strong>the</strong> <strong>Agency</strong><br />
Management program and $10,000 in <strong>the</strong><br />
Community-Based Services program, while a realignment<br />
<strong>of</strong> <strong>the</strong> Communications program will decrease<br />
personal services costs by $215,558. Fourth, <strong>the</strong><br />
complete implementation <strong>of</strong> OCTO ServUs decreases<br />
CFSA costs by $329,839, and <strong>the</strong> Child<br />
Information Services Administration will save<br />
$664,039 by using staff resources to support information<br />
technology needs. Fifth, revised cost estimates<br />
from OPM and DPW result in savings <strong>of</strong><br />
$248,049 for occupancy, electricity, fleet management,<br />
and telecommunications. To align <strong>the</strong> FY<br />
2010 budget with past expenditures and projected<br />
utilization, CFSA will reduce non-visitation local<br />
travel by $110,000; reduce photocopying and printing<br />
by $16,800; reduce new computer hardware purchase<br />
by 50 percent or $335,000; reduce out-<strong>of</strong>-town<br />
travel to conferences by $129,000; reduce recruitment<br />
travel by $50,000; and reduce <strong>of</strong>fice support expenditures<br />
by $3,000. Sixth, <strong>the</strong> elimination <strong>of</strong> all contracts<br />
for paid mentoring after <strong>the</strong>y expire on January 30,<br />
FY 2010 Proposed <strong>Budget</strong> and <strong>Financial</strong> Plan<br />
E-26<br />
2010 accounts for cost savings <strong>of</strong> $2,500,000. Finally,<br />
<strong>the</strong> contract to <strong>the</strong> Collaborative Council will reduce<br />
by $544,055 to focus on documentation, quality<br />
assurance, evaluation and training supports to <strong>the</strong><br />
Healthy Family/Thriving Communities Collaboratives.<br />
The budget continues to fund services provided by<br />
<strong>the</strong> seven community-based collaboratives.<br />
Protected Programs: Achieving positive outcomes for<br />
youth is <strong>the</strong> foundation for <strong>the</strong> FY 2010 budget, as<br />
evidenced by several protected areas. First, direct service<br />
staff is crucial to positive outcomes and this proposed<br />
budget supports <strong>the</strong>m through supervision,<br />
training and quality assurance, which are pivotal to a<br />
solid child welfare practice. With <strong>the</strong> exception <strong>of</strong> 6.0<br />
unfunded social worker FTEs, all social worker positions<br />
were protected in <strong>the</strong> budget. This proposed<br />
budget fully supports CFSA’s commitment to maintaining<br />
social work best-practice caseload standards.<br />
Second, <strong>the</strong> Child Protective Services program will<br />
continue to ensure <strong>the</strong> safety <strong>of</strong> children and youth<br />
through timely, high-quality investigations <strong>of</strong> reported<br />
<strong>of</strong> child abuse and neglect; and <strong>the</strong> In-Home<br />
Services program, which serves approximately 2,000<br />
children that <strong>the</strong> agency determines can be served<br />
safely in <strong>the</strong>ir homes, will continue to provide families<br />
with high-quality community-based support services.<br />
These services will continue to be delivered in<br />
partnership with <strong>the</strong> Healthy Family Thriving<br />
Communities Collaboratives. Third, this proposed<br />
budget continues post-reunification services to prevent<br />
re-entry into care, while <strong>the</strong> Out-<strong>of</strong>-Home Care<br />
program will enhance <strong>the</strong> permanence and well-being<br />
<strong>of</strong> foster care youth through increased focus on reducing<br />
<strong>the</strong> number <strong>of</strong> youth aging out <strong>of</strong> care. Finally,<br />
this proposed budget sustains initiatives from <strong>the</strong> previous<br />
fiscal year including: (1) <strong>the</strong> expansion <strong>of</strong> mental<br />
health services for youth, (2) Title IV-E social<br />
worker training program to promote retention and<br />
recruitment, (3) increased family team meetings, (4)<br />
short-term respite care for foster care families, and (5)<br />
co-location <strong>of</strong> social worker support units in <strong>the</strong> community.<br />
It should be noted that <strong>the</strong> Grandparent<br />
Caregivers Program will continue in FY 2010 and<br />
grants for evidence-based prevention programs will be<br />
sustained in FY 2010.<br />
Policy Initiatives: Removing children from <strong>the</strong>ir<br />
homes to ensure <strong>the</strong>ir safety and well-being is a mea-
sure <strong>of</strong> last resort in child welfare practice. An increase<br />
<strong>of</strong> $1,500,000 for <strong>the</strong> In-Home program will provide<br />
<strong>the</strong> services and supports that allow children to<br />
remain in <strong>the</strong>ir homes when appropriate.<br />
The D.C. Children’s Advocacy Center (CAC) is a<br />
key partner in providing services to children who are<br />
victims <strong>of</strong> physical and sexual abuse. The District will<br />
continue its effort to become a model jurisdiction by<br />
expanding <strong>the</strong> service capacity with construction <strong>of</strong> a<br />
new CAC location. With <strong>the</strong> support <strong>of</strong> one-time<br />
funding <strong>of</strong> $246,073 for build-out, <strong>the</strong> Special Abuse<br />
Unit <strong>of</strong> CFSA’s Child Protective Services program will<br />
co-locate at <strong>the</strong> new CAC. An additional $350,000<br />
in funding will cover <strong>the</strong> cost <strong>of</strong> operating <strong>the</strong> new<br />
CAC.<br />
For older youth in foster care, collaboration with<br />
private entities that provide services in <strong>the</strong> District’s<br />
foster care system presents a means <strong>of</strong> empowering <strong>the</strong><br />
youth as <strong>the</strong>y successfully transition to adulthood.<br />
This proposed budget includes $718,959 in one-time<br />
funds for <strong>the</strong> foster care system to be disbursed as follows:<br />
$75,000 for <strong>the</strong> development <strong>of</strong> a comprehensive<br />
youth centered program as well as a service delivery<br />
action plan for <strong>the</strong> establishment <strong>of</strong> a Youth<br />
Transition Center; $50,000 for a sub-grant to <strong>the</strong><br />
Perry School Community Services Center, Inc.;<br />
$68,359 to commission a longitudinal study conducted<br />
by a local School <strong>of</strong> Social Work on foster<br />
youth who have aged out <strong>of</strong> foster care; $125,000 for<br />
a sub-grant to <strong>the</strong> Parent Advocate Program;<br />
$125,000 for a sub-grant to Adoptions Toge<strong>the</strong>r to<br />
increase <strong>the</strong> number <strong>of</strong> youth served by <strong>the</strong><br />
Permanency Opportunities Program (POP);<br />
$160,000 to expand <strong>the</strong> POP for provision <strong>of</strong> training<br />
and technical assistance to CFSA; $75,600 for a<br />
sub-grant to <strong>the</strong> Healthy Families Thriving<br />
Communities Collaboratives to develop a plan for <strong>the</strong><br />
reduction in <strong>the</strong> incidence <strong>of</strong> abuse and neglect by<br />
geographic area; and $40,000 for a sub-grant to <strong>the</strong><br />
Council for Court Excellence to perform an analysis<br />
and to make policy recommendations regarding <strong>the</strong><br />
D.C. Superior Court, Family Court Division’s, practices<br />
in granting Termination <strong>of</strong> Parental Rights<br />
requests by <strong>the</strong> <strong>Agency</strong>.<br />
Lack <strong>of</strong> adequate housing has been identified in<br />
some cases as an obstacle to keeping children safely<br />
with <strong>the</strong>ir families. From its inception about five years<br />
ago, CFSA’s Rapid Housing Program successfully<br />
supported families and youth aging out <strong>of</strong> foster care<br />
to secure permanent housing. In order to assist <strong>the</strong>se<br />
families and youth in achieving permanency this budget<br />
provides $1,190,000 to maintain funding for <strong>the</strong><br />
Rapid Housing Program. Fur<strong>the</strong>rmore, an additional<br />
provision <strong>of</strong> $1,310,000 has been made for volunteer<br />
mentoring services as CFSA makes <strong>the</strong> transition<br />
from contractual paid mentoring services in FY 2010.<br />
The Grandparents Subsidy Program is supported in<br />
<strong>the</strong> proposed budget by an additional funding <strong>of</strong><br />
$1,465,000. Local funding provides $865,000 <strong>of</strong> <strong>the</strong><br />
amount proposed for <strong>the</strong> program, while <strong>the</strong> remaining<br />
$600,000 will be provided via an Intra-District<br />
arrangement with <strong>the</strong> Department <strong>of</strong> Health Care<br />
Finance. A total <strong>of</strong> $4,199,958 in Intra-District funds<br />
from Special Education Transportation will also be<br />
made available to CFSA for payment <strong>of</strong> <strong>the</strong> costs associated<br />
with <strong>the</strong> transportation <strong>of</strong> District wards with<br />
special needs placed in <strong>the</strong> state <strong>of</strong> Maryland specialized<br />
foster homes. The transferred amount shall be<br />
viewed as a baseline and transportation costs that<br />
exceed this amount shall be <strong>the</strong> responsibility <strong>of</strong><br />
CFSA. All grantees and amounts listed in this budget<br />
are subject to final approval in <strong>the</strong> Fiscal Year 2010<br />
<strong>Budget</strong> Support Act <strong>of</strong> 2009, Bill Number 18-203,<br />
which supersedes this listing upon its effective date.<br />
Stimulus: The American Recovery and Reinvestment<br />
Act provides $2,432,640 in Title IV-E federal funding.<br />
These funds will be used to support <strong>the</strong> transition<br />
in claiming Medicaid reimbursement. This funding<br />
will support CFSA’s services to children in foster care,<br />
training for social workers and staff, training for current<br />
or prospective foster and adoptive parents, and<br />
o<strong>the</strong>r eligible services.<br />
Gap-Closing Initiatives: Additional cost savings for<br />
CFSA fur<strong>the</strong>r represent efforts to focus on child welfare<br />
core practices. Reductions will focus on indirect<br />
services that have minimal to no impact on direct services<br />
provided to children and <strong>the</strong>ir families.<br />
Operating within unanticipated budget constraints,<br />
<strong>the</strong> agency will none<strong>the</strong>less continue to prioritize<br />
reforms necessary to improve child safety, permanence<br />
and well-being, and to streng<strong>the</strong>n families in need <strong>of</strong><br />
supportive services.<br />
First, cost savings in <strong>the</strong> <strong>Agency</strong> Management<br />
Program total $729,155. These savings include: 1)<br />
aligning employee transportation services with utilization,<br />
2) reducing IT consulting contracts, 3) termi-<br />
Child and Family Services <strong>Agency</strong><br />
E-27
nating <strong>the</strong> MOU with DCHR for services no longer<br />
needed, and 4) eliminating moving costs for <strong>the</strong><br />
<strong>Office</strong> <strong>of</strong> Youth Development to <strong>the</strong> Youth Transition<br />
Center at <strong>the</strong> Merritt School. Additional cost savings<br />
<strong>of</strong> $66,512 and $23,430 will result from reductions<br />
in <strong>the</strong> budget for court supervision and for staff training,<br />
respectively.<br />
Just as CFSA incurs budget reductions focused on<br />
internal operations, cost savings will be realized from<br />
external service providers. A reduction in administrative<br />
costs associated with home licensing for out-<strong>of</strong>-<br />
District placements will lead to cost savings <strong>of</strong><br />
$182,945. Moreover, through increased competitive<br />
bidding and aligning abscondance contracts with utilization,<br />
CFSA will attain $201,019 in cost savings.<br />
Fur<strong>the</strong>rmore, $15,000 in cost savings will result from<br />
reducing <strong>the</strong> contract to <strong>the</strong> Foster Parent Association.<br />
Separately, cost savings <strong>of</strong> $10,000 will occur from<br />
reduction for <strong>the</strong> parent advocate program.<br />
The agency will realize $70,922 and $500,000 in<br />
cost savings from contracts for non-special education<br />
transportation services and paid tutoring services,<br />
respectively. All <strong>the</strong> while, <strong>the</strong> <strong>Agency</strong> will maintain<br />
<strong>the</strong> same level <strong>of</strong> services.<br />
CFSA management continues to examine <strong>the</strong><br />
detailed expenditures for contracted services. These<br />
reviews include an analysis <strong>of</strong> <strong>the</strong> variances in prices<br />
paid for comparable services, most notably administrative<br />
and indirect costs. CFSA will make appropriate<br />
adjustments to rates charged by contracted<br />
providers <strong>of</strong> group homes and contracted foster<br />
homes. Standardizing rates to properly align with<br />
actual utilization and costs <strong>of</strong> services will result in<br />
$1,519,653 costs savings for group homes and<br />
$3,995,208 for contracted foster homes.<br />
Historically from fiscal year to fiscal year, <strong>the</strong><br />
CFSA budget has not aligned client service needs with<br />
<strong>the</strong> individual amounts <strong>of</strong> each Collaborative contract.<br />
The agency will attain $1,261,247 in cost savings<br />
from cost management efforts related to <strong>the</strong> contracts<br />
for <strong>the</strong> seven neighborhood-based<br />
Collaboratives. Specifically, <strong>the</strong> shifts in incidence <strong>of</strong><br />
child abuse and neglect have been significantly<br />
impacted by <strong>the</strong> shifts in <strong>the</strong> socioeconomic demographic.<br />
Program management for Community<br />
Based Services will ensure that resources align with<br />
both historic utilization and trends in service need.<br />
The budget for adoption subsidies is adjusted to<br />
align with historical costs and projected need. This<br />
FY 2010 Proposed <strong>Budget</strong> and <strong>Financial</strong> Plan<br />
E-28<br />
adjustment amounts to reducing <strong>the</strong> enhancement by<br />
$1,000,000. None<strong>the</strong>less, <strong>the</strong> $500,000 enhancement<br />
remains for in-home services and supports. The<br />
budget also provides a $25,000 additional funding<br />
for <strong>the</strong> D.C. Children’s Trust Fund.<br />
CFSA strives to budget programs and services in<br />
such a way to minimize year-to-year fluctuations in<br />
<strong>the</strong> continuum <strong>of</strong> services. To avoid such disruptions<br />
in services, programs targeted for enhancements will<br />
be reduced to more sustainable levels. Despite <strong>the</strong><br />
elimination <strong>of</strong> enhancements, CFSA’s programs will<br />
none<strong>the</strong>less be maintained in <strong>the</strong> FY 2010 budget at<br />
more sustainable levels. To account for certification <strong>of</strong><br />
additional Medicaid revenue, $9,420,000 in projected<br />
saving will realized in Local funds. Funding for <strong>the</strong><br />
Children’s Advocacy Center is also reduced by<br />
$250,000 to facilitate CFSA’s ability to <strong>of</strong>fer competitive<br />
grants for providing services. Finally, CFSA will<br />
reduce one-time designated grants by $575,600.
FY 2009 Approved <strong>Budget</strong> to FY 2010 Proposed <strong>Budget</strong><br />
Table RL0-5 itemizes <strong>the</strong> changes by revenue type between <strong>the</strong> FY 2009 approved budget and <strong>the</strong> FY 2010 proposed<br />
budget. The four categories <strong>of</strong> changes reflected in this table are (1) changes to <strong>the</strong> baseline budget (includes<br />
agency request), (2) changes representing cost savings or efficiencies, and (3) changes related to policy initiatives,<br />
and (4) changes to specifically address <strong>the</strong> projected revenue shortfall.<br />
Table RL0-5<br />
(dollars in thousands)<br />
Program BUDGET FTE<br />
LOCAL FUND: FY 2009 Approved <strong>Budget</strong> and FTE 196,825 646.0<br />
Initial and Baseline Adjustments<br />
Net effect <strong>of</strong> fixed cost adjustments - Funding adjustments for OPM estimates <strong>Agency</strong> Management 1,818 0.0<br />
Program<br />
Net effect <strong>of</strong> salary and benefits changes - Salary step and o<strong>the</strong>r Multiple Programs 2,163 -14.0<br />
personal services funding adjustments<br />
Intra-<strong>Agency</strong> Changes - Net impact <strong>of</strong> reduction <strong>of</strong> <strong>the</strong> Adoption and Adoption Guardian -3,981 0.0<br />
Guardian Subsidy program due to a projected decrease in <strong>the</strong> number Subsidy Program<br />
<strong>of</strong> adoptions and a change in <strong>the</strong> federal reimbursement rate from 50/50 to 70/300<br />
Policy Initiatives and Cost Savings<br />
Enhance - Provide additional operating support to operate <strong>the</strong> Children's<br />
Advocacy Center<br />
Child Welfare Program 350 0.0<br />
Cost Decrease - Transition to OCTO ServUs for IT support services <strong>Agency</strong> Management<br />
Program<br />
-330 -4.0<br />
Cost Increase - Using one-time funds, implement a major financial transition<br />
to ensure sustainable funding over <strong>the</strong> long-term for child welfare services<br />
Multiple Programs 19,415 0.0<br />
Enhance - Increase in-home services and supports Child Welfare Program 1,500 0.0<br />
Enhance - Co-locate <strong>the</strong> special abuse unit <strong>of</strong> child protective services at <strong>the</strong><br />
new Bundy Child Advocacy Center (one-time buildout)<br />
Child Welfare Program 246 0.0<br />
Enhance - Establish transition center for youth in foster care at Merritt Out-<strong>of</strong>-Home Care 819 0.0<br />
(one-time buildout costs) and Support<br />
Cost Increase - Align procurement assessment budget with revised OCP <strong>Agency</strong> Management 19 0.0<br />
estimates Program<br />
Shift - Redirected funds from paid mentoring contracts to be allocated for Out-<strong>of</strong>-Home Care 1,190 0.0<br />
<strong>the</strong> continuation <strong>of</strong> <strong>the</strong> Rapid Housing Program and Support<br />
Transfer Out - Transition services for medical screening from hospital-based Out-<strong>of</strong>-Home Care -492 0.0<br />
contract to Medicaid personal services contracts and Support<br />
Shift - Redirected funds from paid mentoring contracts be used in support <strong>of</strong> a Out-<strong>of</strong>-Home Care 1,310 0.0<br />
transition to volunteer mentoring services and Support<br />
Transfer Out - Cost savings from utilization <strong>of</strong> Medicaid Psychiatric Residential Out-<strong>of</strong>-Home Care -794 0.0<br />
Treatment Facilities under new rate structure and Support<br />
Cost Decrease - Align electricity budget with revised OPM estimates All Programs -5 0.0<br />
Shift - Redirected funds for <strong>the</strong> build-out <strong>of</strong> CFSA’s <strong>Office</strong> <strong>of</strong> Youth<br />
Development staff and program space for <strong>the</strong> Youth Transition Center to<br />
subgrants to various entities for foster care and youth related programs<br />
Multiple Programs 719 0.0<br />
Enhance - Expand <strong>the</strong> Grandparent Subsidy Program Adoption and Guardian<br />
Subsidy Program<br />
865 0.0<br />
Cost Decrease - Align fleet budget with revised DPW estimates All Programs -105 0.0<br />
Cost Decrease - Align occupancy estimates with revised OPM estimates All Programs -4 0.0<br />
Cost Decrease - Reduce out-<strong>of</strong>-city travel to conferences<br />
(Continued on next page)<br />
Various Programs -129 0.0<br />
Child and Family Services <strong>Agency</strong><br />
E-29
Table RL0-5 (continued)<br />
(dollars in thousands)<br />
Policy Initiatives and Cost Savings<br />
FY 2010 Proposed <strong>Budget</strong> and <strong>Financial</strong> Plan<br />
E-30<br />
Program BUDGET FTE<br />
Cost Decrease - Align telecom budget with historical expenditures <strong>Agency</strong> Management -157 0.0<br />
Program<br />
Cost Decrease - Align budget with historical expenditures for <strong>of</strong>fice support <strong>Agency</strong> Management -3 0.0<br />
Program<br />
Cost Decrease - Reduce budget for personal services contracts for <strong>Agency</strong> Management -424 0.0<br />
consultants Program<br />
Cost Decrease - Reduce data reporting budget from IT contract by utilizing staff <strong>Agency</strong> Management -664 0.0<br />
resources Program<br />
Cost Decrease - Align local travel budget to historical expenditures <strong>Agency</strong> Management<br />
Program<br />
-110 0.0<br />
Cost Decrease - Reduce purchase <strong>of</strong> <strong>of</strong>fice equipment <strong>Agency</strong> Management<br />
Program<br />
-232 0.0<br />
Cost Decrease - Align budget for printing and duplication to historical <strong>Agency</strong> Management -17 0.0<br />
expenditures Program<br />
Cost Decrease - Reduction in travel for recruitment <strong>Agency</strong> Management<br />
Program<br />
-50 0.0<br />
Cost Decrease - Improve agency management <strong>of</strong> staffing to reduce overtime <strong>Agency</strong> Management<br />
Program<br />
-96 0.0<br />
Cost Decrease - Improve agency management <strong>of</strong> staffing to reduce overtime Community Based<br />
Program<br />
-10 0.0<br />
Cost Decrease - Reduce computer hardware purchases by 50 percent <strong>Agency</strong> Management<br />
Program<br />
-335 0.0<br />
Cost Decrease - Align budget for temporary employee services with staffing <strong>Agency</strong> Management -234 0.0<br />
needs Program<br />
Cost Decrease - Reduce budget for personal services contracts for<br />
consultants<br />
Child Welfare Program -177 0.0<br />
Cost Decrease - Eliminate vacant position <strong>Agency</strong> <strong>Financial</strong><br />
Operations<br />
-58 -1.0<br />
Cost Decrease - Eliminate non-social worker vacant positions <strong>Agency</strong> Management<br />
Program<br />
-645 -9.0<br />
Cost Decrease - Eliminate non-social worker vacant positions Child Welfare Program -280 -5.0<br />
Cost Decrease - Eliminate non-social worker vacant positions Out-<strong>of</strong>-Home Care<br />
and Support<br />
-103 -2.0<br />
Cost Decrease - Eliminate budget for personal services contract for grant Community-Based -85 0.0<br />
monitoring Program<br />
Cost Decrease - Focus <strong>the</strong> scope <strong>of</strong> work for <strong>the</strong> contract with <strong>the</strong> Community Based -544 0.0<br />
Collaborative Council on documentation, quality assurance, evaluation and<br />
training <strong>of</strong> service-providing Collaboratives<br />
Program<br />
Cost Decrease - Eliminate all contracts for paid mentoring after <strong>the</strong>y expire on Out-<strong>of</strong>-Home Care -2,500 0.0<br />
January 30, 2010 and Support<br />
Cost Decrease - Eliminate <strong>the</strong> build-out <strong>of</strong> CFSA’s <strong>Office</strong> <strong>of</strong> Youth<br />
Development staff and program space for <strong>the</strong> Youth Transition Center. and<br />
redirect funds within CFSA for youth programs<br />
Child Welfare Program -719 0.0<br />
Transfer Out - Transferred to <strong>the</strong> Department on Disability Services (DDS) for<br />
<strong>the</strong> implementation <strong>of</strong> Facilitated Family Group Decision Making (FFTM)<br />
Child Welfare Program -100 0.0<br />
(Continued on next page)
Table RL0-5<br />
(dollars in thousands)<br />
Gap-Closing Initiatives<br />
Program BUDGET FTE<br />
Cost decrease - Align employee transportation services with utilization <strong>Agency</strong> Management Program -94 0.0<br />
Cost decrease - Cost savings from reduction in IT consulting contracts <strong>Agency</strong> Management Program -318 0.0<br />
Cost decrease - Terminate MOU with DCHR due to services no longer <strong>Agency</strong> Management Program -217 0.0<br />
Cost decrease - Reduction in budget for court supervision <strong>Agency</strong> Management Program -67 0.0<br />
Cost decrease - Align abscondance contract with utilization and<br />
competitive bid<br />
Child Welfare Program -201 0.0<br />
Cost decrease - Align Collaborative contracts with historic utilization<br />
and trends in service need<br />
Community Based Program -1,261 0.0<br />
Cost decrease - Reduction in administrative costs associated with home<br />
licensing for out-<strong>of</strong>-District placements<br />
Out Of Home Care And Support -183 0.0<br />
Cost decrease - Cost savings in staff training <strong>Agency</strong> Management Program -23 0.0<br />
Cost decrease - Reduction in Foster Parent Association Contract Out Of Home Care And Support -15 0.0<br />
Cost decrease - Reduction in costs for parent advocate program Child Welfare Program -10 0.0<br />
Cost decrease - Cost savings in contract for non-special education<br />
transportation services<br />
Out-<strong>of</strong>-Home Care and Support -71 0.0<br />
Cost decrease - Align adoption subsidies with historical budget and Adoption and Guardian Subsidy -1,000 0.0<br />
projected need Program<br />
Cost decrease - Cost savings from paid tutoring services while<br />
maintaining same level <strong>of</strong> services<br />
Out-<strong>of</strong>-Home Care and Support -500 0.0<br />
Cost decrease - Standardize group home rates to align with actual cost<br />
for services<br />
Out-<strong>of</strong>-Home Care and Support -1,520 0.0<br />
Cost decrease - Standardize contracted foster homes rates to align with<br />
actual cost for services<br />
Out-<strong>of</strong>-Home Care and Support -3,995 0.0<br />
Cost decrease - Reduce One-time designated grants Child Welfare Program -576 0.0<br />
Reduce - Shift Local funds to Federal to Account for <strong>the</strong> Certification <strong>of</strong><br />
additional Medicaid revenue<br />
Out Of Home Care And Support -9,420 0.0<br />
Reduce - Provide additional operating support to operate <strong>the</strong> Children's<br />
Advocacy Center (Reduced Safe Shores CFSA Mayoral designated<br />
grant and utilize this funding to issue a competitive grant for providing<br />
Out Of Home Care And Support -250 0.0<br />
Enhance - DC Children's Trust Fund Community Based Program 25 0.0<br />
LOCAL FUND: FY 2010 Proposed <strong>Budget</strong> and FTE 194,161 611.0<br />
SPECIAL PURPOSE REVENUE FUNDS: FY 2009 Approved <strong>Budget</strong> and FTE 750 0.0<br />
SPECIAL PURPOSE REVENUE FUNDS: FY 2010 Proposed <strong>Budget</strong> and FTE<br />
(Continued on next page)<br />
750 0.0<br />
Child and Family Services <strong>Agency</strong><br />
E-31
Table RL0-5<br />
(dollars in thousands)<br />
Program BUDGET FTE<br />
FEDERAL GRANT FUND: FY 2009 Approved <strong>Budget</strong> and FTE 30,998 116.0<br />
Initial and Baseline Adjustments<br />
Net effect <strong>of</strong> fixed cost adjustments - Funding adjustments for OPM Child Welfare Program -2 0.0<br />
Net effect <strong>of</strong> salary and benefits changes - Salary step and o<strong>the</strong>r Multiple Programs 910 -14.0<br />
personal services funding adjustments.<br />
Intra-agency Changes - Projected increase in funding due to a change Multiple Programs 6,722 0.0<br />
in <strong>the</strong> federal reimbursement rate for Title IV-E Maintenance from<br />
50/50 to 70/30 and shift <strong>of</strong> FTEs from Local funds to Federal Grant<br />
Policy Initiatives and Cost Savings<br />
Shift - Transition in case management claiming to Title IV-E from Multplie Programs 17,317 182.0<br />
Medicaid Targeted Case Management.<br />
Enhance - Add Recovery Act funds for Title IV-E funding for foster care. Multiple Programs 2,433 0.0<br />
Cost Decrease - Realign staff in <strong>the</strong> <strong>Agency</strong> Management program. <strong>Agency</strong> Management Program -242 -3.0<br />
FEDERAL GRANT FUND: FY 2010 Proposed <strong>Budget</strong> and FTE 58,203 281.0<br />
PRIVATE DONATIONS: FY 2009 Approved <strong>Budget</strong> and FTE 23 0.0<br />
Initial and Baseline Adjustments<br />
Intra-agency Changes - Reduced projections Child Welfare Program -1 0.0<br />
PRIVATE DONATIONS: FY 2010 Proposed <strong>Budget</strong> and FTE 22 0.0<br />
INTRA-DISTRICT FUNDS: FY 2009 Approved <strong>Budget</strong> and FTE 61,960 178.0<br />
Initial and Baseline Adjustments<br />
Net effect <strong>of</strong> salary and benefits changes - Salary step and o<strong>the</strong>r Multiple Programs 1,431 14.0<br />
personal services funding adjustments.<br />
Intra-agency Changes - Projected reductions in Medicaid revenue Multiple Programs -1,483 0.0<br />
Policy Initiatives and Cost Savings<br />
Transfer Out - Transition services for refugee minors to DHS as a Child Welfare Program -175 0.0<br />
means <strong>of</strong> centralizing <strong>the</strong> District's services to refugees.<br />
Cost Decrease - Adjust budget to account for reforms in Medicaid Multiple Programs -28,763 0.0<br />
Rehab option claiming.<br />
Shift - Transition in care management claiming from Medicaid Multiple Programs -20,945 -182.0<br />
Targeted Case Management to Title IV-E.<br />
Correct - Eliminate unfunded FTE positions. Out <strong>of</strong> Home Care and Support 0 -3.0<br />
Correct - Eliminate unfunded FTE position. <strong>Agency</strong> <strong>Financial</strong> Operations 0 -1.0<br />
Correct - Eliminate unfunded FTE positions. Multiple Programs 0 -6.0<br />
Enhance - Intra-District transfer from Department <strong>of</strong> Health Care Finance Adoption and Guardian 600 0.0<br />
to support <strong>the</strong> Grandparents Subsidy Program Subsidy Program<br />
Enhance - Transportation <strong>of</strong> District wards with special needs placed in Out <strong>of</strong> Home Care 4,200 0.0<br />
Maryland specialized foster homes. and Support<br />
INTRA-DISTRICT FUNDS: FY 2010 Proposed <strong>Budget</strong> and FTE 16,825 0.0<br />
Gross for RL0 - Child and Family Services <strong>Agency</strong> 269,962 892.0<br />
FY 2010 Proposed <strong>Budget</strong> and <strong>Financial</strong> Plan<br />
E-32
<strong>Agency</strong> Performance Plan<br />
The agency’s Performance Plan has <strong>the</strong> following<br />
objectives for FY 2010:<br />
Objective 1: Ensure child/youth safety.<br />
Objective 2: Expedite permanency for children/<br />
youth.<br />
<strong>Agency</strong> Performance Measures<br />
Table RL0-6<br />
Objective 3: Ensure well-being for children/youth.<br />
Objective 4: Ensure system accountability.<br />
FY 2007 FY 2008 FY 2008<br />
Year-End Original Year-End FY 2009 FY 2010 FY 2011<br />
Measure<br />
Rate <strong>of</strong> substantiated child abuse/neglect per<br />
Actual* Target Actual Projection Projection Projection<br />
1,000 children in DC N/A N/A N/A N/A N/A N/A<br />
Total CFSA population<br />
Objective 1<br />
4,557 N/A 3,979 N/A N/A N/A<br />
Percent <strong>of</strong> CFSA children/youth in foster care<br />
Percent <strong>of</strong> CFSA children/youth receiving in-home<br />
50.5% N/A 55.9% N/A N/A N/A<br />
services<br />
Percent <strong>of</strong> investigations attempted or initiated<br />
48.1% N/A 43.2% N/A N/A N/A<br />
within 24 hours <strong>of</strong> being accepted 48.6% 65% 55.3% 65% 75% 80%<br />
Percent <strong>of</strong> investigations closed within 30 days<br />
Percent <strong>of</strong> children/youth in foster care receiving<br />
56.3% 100% 37.6% 100%* 100%* 100%*<br />
at least 2 visits per month from <strong>the</strong> social worker<br />
Percent <strong>of</strong> children/youth in-home receiving at<br />
74.8% 100%* 86.3% 100%* 100%* 100%*<br />
least 2 visits per month from <strong>the</strong> social worker<br />
Objective 2<br />
Percent <strong>of</strong> children/youth in foster care placed<br />
46.7% 100%* 71.5% 100%* 100%* 100%*<br />
with kin<br />
Percent <strong>of</strong> children/youth with a permanency goal<br />
<strong>of</strong> adoption in an approved adoptive placement<br />
17.5% 16% 14.7% 20% 22% 25%<br />
within 9 months <strong>of</strong> <strong>the</strong>ir goal becoming adoption<br />
Percent <strong>of</strong> children/youth in foster care who<br />
57.7% 100%* 54.4% 100%* 100%* 100%*<br />
achieve permanency 46.9% 45% 1 40.6% 48% 2 50% 2 52% 2<br />
(Continued on next page)<br />
Child and Family Services <strong>Agency</strong><br />
E-33
<strong>Agency</strong> Performance Measures<br />
Table RL0-6 (cont)<br />
FY 2010 Proposed <strong>Budget</strong> and <strong>Financial</strong> Plan<br />
E-34<br />
FY 2007 FY 2008 FY 2008<br />
Year-End Original Year-End FY 2009 FY 2010 FY 2011<br />
Measure Actual* Target Actual Projection Projection Projection<br />
Objective 3<br />
Percent <strong>of</strong> children/youth who were victims <strong>of</strong><br />
substantiated or indicated abuse or neglect during<br />
<strong>the</strong> first 6 months <strong>of</strong> <strong>the</strong> reporting year, who did not<br />
experience ano<strong>the</strong>r incident <strong>of</strong> substantiated or<br />
indicated abuse or neglect within a 6-month<br />
period (Federal Benchmark: 94.6 percent or higher) N/A 2 N/A N/A 100%* 100%* 100%*<br />
Objective 4<br />
Total number <strong>of</strong> licensed foster homes 3 903 920 912 930 940 955<br />
Average caseload per worker 10 11 11 15 15 15<br />
*FY 2008 projection reflects LaShawn v. Fenty Amended Implementation Plan (AIP) which requires 100 percent compliance by <strong>the</strong> end <strong>of</strong> 2008.<br />
1The rate <strong>of</strong> child abuse/neglect is based on <strong>the</strong> number <strong>of</strong> substantiations in FY06 (2,889), divided by <strong>the</strong> child population (114,881), multiplied by 1,000. Source: 2006<br />
Population Estimate, U.S. Census Bureau; FACES INV086, CFSA.<br />
2 Multi-composite national standard measure calculating <strong>the</strong> percentage <strong>of</strong> youth that have exited care at <strong>the</strong> end <strong>of</strong> <strong>the</strong> fiscal year with <strong>the</strong> following exit reasons: adoption,<br />
guardianship and reunification.<br />
3 This measure is reported to CFSA by <strong>the</strong> ACF. The latest numbers reported are 2006. CFSA submitted data to <strong>the</strong> National Child Abuse and Neglect Data System (NCAN-<br />
DS) on March 31, 2008. The data should be available in September 2008.<br />
4 This measure is only <strong>of</strong> licensed foster homes with children placed, not all CFSA licensed foster homes.
Department <strong>of</strong> Mental Health<br />
www.dmh.dc.gov<br />
Telephone: 202.673.7440<br />
(RM0)<br />
% Change<br />
FY 2008 FY 2009 FY 2010 from<br />
Description Actual Approved Proposed FY 2009<br />
Operating <strong>Budget</strong> $224,903,247 $228,485,704 $206,575,758 -9.6<br />
FTEs 1,421.2 1,627.3 1,324.4 -18.6<br />
The mission <strong>of</strong> <strong>the</strong> Department <strong>of</strong> Mental Health (DMH) is to support<br />
prevention, resiliency and recovery for District residents in need<br />
<strong>of</strong> public mental health services.<br />
Summary <strong>of</strong> Services<br />
DMH is responsible for developing, supporting and<br />
overseeing a comprehensive, community-based, consumer<br />
driven, culturally competent, quality mental<br />
health system that is responsive and accessible to children,<br />
youth, adults, and <strong>the</strong>ir families. DMH contracts<br />
with a network <strong>of</strong> community-based private<br />
providers and also provides direct services through<br />
Saint Elizabeths Hospital, <strong>the</strong> District <strong>of</strong> Columbia<br />
Community Services <strong>Agency</strong> (DCCSA), <strong>the</strong><br />
Comprehensive Psychiatric Emergency Program, <strong>the</strong><br />
Homeless Outreach Program, and <strong>the</strong> School-Based<br />
Mental Health Program.<br />
The agency’s FY 2010 proposed budget is presented<br />
in <strong>the</strong> following tables:<br />
Department <strong>of</strong> Mental Health<br />
E-35
FY 2010 Proposed Gross Funds Operating <strong>Budget</strong>, by Revenue Type<br />
Table RM0-1 contains <strong>the</strong> proposed FY 2010 agency budget compared to <strong>the</strong> FY 2009 approved budget. It also<br />
provides <strong>the</strong> FY 2007 and FY 2008 actual expenditures.<br />
Table RM0-1<br />
(dollars in thousands)<br />
Actual Actual Approved Proposed<br />
Change<br />
from Percent<br />
Appropriated Fund<br />
General Fund<br />
FY 2007 FY 2008 FY 2009 FY 2010 FY 2009 Change*<br />
Local Funds 192,871 207,627 209,832 191,390 -18,441 -8.8<br />
Special Purpose Revenue Funds 3,522 2,589 3,808 4,424 616 16.2<br />
Total for General Fund 196,393 210,216 213,640 195,815 -17,825 -8.3<br />
Federal Resources<br />
Federal Payments 5 13 0 0 0 N/A<br />
Federal Grant Funds 138 268 1,642 1,222 -420 -25.6<br />
Federal Medicaid Payments 4,074 4,018 3,924 5,213 1,289 32.9<br />
Total for Federal Resources 4,216 4,298 5,566 6,435 869 15.6<br />
Private Funds<br />
Private Grant Funds 8 -4,543 0 117 117 N/A<br />
Total for Private Funds 8 -4,543 0 117 117 N/A<br />
Intra-District Funds<br />
Intra-District Funds 45,274 14,932 9,280 4,209 -5,071 -54.6<br />
Total for Intra-District Funds 45,274 14,932 9,280 4,209 -5,071 -54.6<br />
Gross Funds 245,891 224,903 228,486 206,576 -21,910 -9.6<br />
*Percent Change is based on whole dollars.<br />
Note: If applicable, for a breakdown <strong>of</strong> each Grant (Federal and Private), Special Purpose Revenue type and Intra-District agreement,<br />
please refer to Schedule 80 <strong>Agency</strong> Summary by Revenue Source in <strong>the</strong> Operating Appendices located on <strong>the</strong> <strong>Office</strong> <strong>of</strong> <strong>the</strong> <strong>Chief</strong><br />
<strong>Financial</strong> <strong>Office</strong>r’s website.<br />
FY 2010 Proposed <strong>Budget</strong> and <strong>Financial</strong> Plan<br />
E-36
FY 2010 Proposed Full-Time Equivalents, by Revenue Type<br />
Table RM0-2 contains <strong>the</strong> proposed FY 2010 FTE level compared to <strong>the</strong> FY 2009 approved FTE level by revenue<br />
type. It also provides FY 2007 and FY 2008 actual data.<br />
Table RM0-2<br />
Change<br />
Actual Actual Approved Proposed from Percent<br />
Appropriated Fund FY 2007 FY 2008 FY 2009 FY 2010 FY 2009 Change<br />
General Fund<br />
Local Funds 1,302.8 1,300.3 1,493.0 1,241.0 -252.0 -16.9<br />
Special Purpose Revenue Funds 36.0 34.4 37.0 37.0 0.0 0.0<br />
Total for General Fund 1,338.8 1,334.7 1,530.0 1,278.0 -252.0 -16.5<br />
Federal Resources<br />
Federal Grant Funds 18.7 12.9 6.5 4.0 -2.5 -38.0<br />
Federal Medicaid Payments 0.0 18.7 0.0 9.4 9.4 N/A<br />
Total for Federal Resources 18.7 31.6 6.5 13.4 7.0 107.8<br />
Intra-District Funds<br />
Intra-District Funds 78.0 54.9 90.9 33.0 -57.9 -63.7<br />
Total for Intra-District Funds 78.0 54.9 90.9 33.0 -57.9 -63.7<br />
Total Proposed FTEs 1,435.5 1,421.2 1,627.3 1,324.4 -302.9 -18.6<br />
Department <strong>of</strong> Mental Health<br />
E-37
FY 2010 Proposed Operating <strong>Budget</strong>, by Comptroller Source Group<br />
Table RM0-3 contains <strong>the</strong> proposed FY 2010 budget at <strong>the</strong> Comptroller Source group (object class) level compared<br />
to <strong>the</strong> FY 2009 approved budget. It also provides FY 2007 and FY 2008 actual expenditures.<br />
Table RM0-3<br />
(dollars in thousands)<br />
Actual Actual Approved Proposed<br />
Change<br />
from Percent<br />
Comptroller Source Group FY 2007 FY 2008 FY 2009 FY 2010 FY 2009 Change*<br />
11 Regular Pay - Cont Full Time 77,334 83,124 94,584 77,825 -16,760 -17.7<br />
12 Regular Pay - O<strong>the</strong>r 7,598 8,318 7,234 7,993 758 10.5<br />
13 Additional Gross Pay 4,889 7,423 3,420 5,643 2,223 65.0<br />
14 Fringe Benefits - Curr Personnel 16,927 18,145 19,032 15,716 -3,316 -17.4<br />
15 Overtime Pay 7,747 7,638 2,527 3,300 773 30.6<br />
99 Unknown Payroll Postings 0 1 0 0 0 N/A<br />
Subtotal Personal Services (PS) 114,496 124,650 126,798 110,476 -16,322 -12.9<br />
20 Supplies and Materials 11,024 12,465 10,318 8,844 -1,474 -14.3<br />
30 Energy, Comm. and Bldg Rentals 9,697 9,344 9,106 11,244 2,138 23.5<br />
31 Telephone, Telegraph, Telegram, Etc 1,621 1,732 1,630 1,471 -159 -9.7<br />
32 Rentals - Land and Structures 5,457 4,413 4,422 3,926 -495 -11.2<br />
33 Janitorial Services 2 3 4 21 18 486.4<br />
34 Security Services 3,553 3,805 3,643 4,193 550 15.1<br />
35 Occupancy Fixed Costs 6 0 20 66 46 225.6<br />
40 O<strong>the</strong>r Services and Charges 7,093 8,783 9,813 8,564 -1,249 -12.7<br />
41 Contractual Services - O<strong>the</strong>r 39,037 33,576 39,227 38,391 -836 -2.1<br />
50 Subsidies and Transfers 45,001 23,720 22,068 18,154 -3,914 -17.7<br />
70 Equipment & Equipment Rental 2,166 1,825 1,438 1,225 -212 -14.8<br />
91 Expense Not <strong>Budget</strong>ed O<strong>the</strong>rs 6,739 588 0 0 0 N/A<br />
Subtotal Nonpersonal Services (NPS) 131,396 100,253 101,688 96,100 -5,588 -5.5<br />
Gross Funds 245,891 224,903 228,486 206,576 -21,910 -9.6<br />
*Percent Change is based on whole dollars.<br />
FY 2010 Proposed <strong>Budget</strong> and <strong>Financial</strong> Plan<br />
E-38
Program Description<br />
The Department <strong>of</strong> Mental Health operates through<br />
<strong>the</strong> following 6 programs:<br />
Mental Health Authority - provides mental health<br />
services to ensure <strong>the</strong>re is access to services, monitors<br />
<strong>the</strong> service system, provides support for service<br />
providers, operates <strong>the</strong> Mental Health Rehabilitation<br />
Services (MHRS) fee-for-service system, and provides<br />
grant funding for services covered through MHRS.<br />
The program regulates <strong>the</strong> District’s public mental<br />
health system, identifies <strong>the</strong> appropriate mix <strong>of</strong> programs,<br />
services, and support necessary to meet <strong>the</strong><br />
mental health needs <strong>of</strong> District <strong>of</strong> Columbia residents.<br />
This program contains <strong>the</strong> following 17 activities:<br />
■ The <strong>Office</strong> <strong>of</strong> <strong>the</strong> Director – provides leadership<br />
for <strong>the</strong> design, development, communication and<br />
delivery <strong>of</strong> mental health services and supports<br />
and identifies approaches to enhance access to<br />
services that support recovery and resilience;<br />
■ <strong>Office</strong> <strong>of</strong> <strong>the</strong> <strong>Chief</strong> Clinical <strong>Office</strong>r – provides<br />
advice to <strong>the</strong> Director and sets standards for provision<br />
<strong>of</strong> clinical care throughout <strong>the</strong> public mental<br />
health system for children, youth and adults.<br />
The Comprehensive Psychiatric Emergency<br />
Program (CPEP), a 24/7 site-based program to<br />
provide emergency care, extended observation,<br />
and mobile crisis services, is also within this <strong>of</strong>fice.<br />
Infrastructure building, practice enhancement<br />
and training to serve persons with co-occurring<br />
mental illnesses and substance abuse disorders is a<br />
function <strong>of</strong> <strong>the</strong> <strong>Office</strong>;<br />
■ Clinical Management - provides a medical management<br />
treatment team for MHRS providers;and<br />
functions as a safety net for psychiatric medications<br />
and pharmacy education services for consumers<br />
enrolled in <strong>the</strong> DMH network who have<br />
no pharmacy benefits;<br />
■ Consumer and Family Affairs - provides expertise<br />
on <strong>the</strong> consumer/family perspective, and promotes<br />
and protects <strong>the</strong> legal, civil and human<br />
rights <strong>of</strong> consumers;<br />
■ <strong>Office</strong> <strong>of</strong> Programs and Policy – provides <strong>the</strong><br />
design, delivery, and evaluation <strong>of</strong> mental health<br />
services and support for children, youth, families,<br />
adults and special populations to maximize <strong>the</strong>ir<br />
ability to lead productive lives;<br />
■ Adult Services – provides information on <strong>the</strong><br />
array <strong>of</strong> services and supports needed by adults to<br />
achieve <strong>the</strong>ir highest level <strong>of</strong> recovery from mental<br />
illness. Adult Services within <strong>the</strong> authority<br />
provides services directly to people who are homeless<br />
and/or in crisis. In addition, Adult Services is<br />
responsible for residential services, developing<br />
affordable housing opportunities for individuals<br />
with serious mental illness, supporting <strong>the</strong> development<br />
and implementation <strong>of</strong> evidenced-based<br />
practices such as Assertive Community Treatment<br />
(ACT), Supported Employment, Supported<br />
Housing and services to individuals with cooccurring<br />
disorders <strong>of</strong> mental illness and substance<br />
abuse disorders;<br />
■ Housing Division - provides bridge housing subsidies<br />
and capital funding to finance <strong>the</strong> development<br />
<strong>of</strong> new affordable permanent housing units<br />
for people with serious mental illness. An array <strong>of</strong><br />
scattered site housing is provided through local<br />
bridge subsidies and federal vouchers;<br />
■ Care Coordination – provides information, support,<br />
crisis services, access and linkages to a full<br />
range <strong>of</strong> mental health services for District residents;<br />
■ Comprehensive Psychiatric Emergency Program<br />
(CPEP) - provides mental health services to adults<br />
in psychiatric crisis who need stabilization to prevent<br />
harm to self or o<strong>the</strong>rs. Services are enhanced<br />
to convert hospitalizations, prevent decompensation<br />
and provide mobile crisis intervention for<br />
this same population;<br />
■ Children and Youth Services – provides services<br />
responsible for developing an all-inclusive system<br />
<strong>of</strong> care for children, adolescents and <strong>the</strong>ir families<br />
that promotes prevention/early intervention, continuity<br />
<strong>of</strong> care, community alternatives to out-<strong>of</strong> -<br />
home and residential placements and diversion<br />
from <strong>the</strong> juvenile justice system. Child and Youth<br />
Services within <strong>the</strong> authority provides direct<br />
school-based services, youth forensic services and<br />
oversight <strong>of</strong> youth placed in Residential<br />
Treatment Centers (RTCs);<br />
■ School Mental Health Program - provides tools<br />
that promote social and emotional development<br />
and address psycho-social and mental health<br />
problems that become barriers to learning. The<br />
program is responsible for <strong>the</strong> direct provision <strong>of</strong><br />
Department <strong>of</strong> Mental Health<br />
E-39
prevention, early intervention and brief treatment<br />
services to 48 D.C. Public and Public Charter<br />
Schools;<br />
■ Forensic Services - provides mental health services<br />
and continuity <strong>of</strong> care to individuals involved in<br />
<strong>the</strong> criminal justice system who have serious<br />
mental illnesses; oversees a network <strong>of</strong> providers to<br />
ensure that individuals under court supervision<br />
and/or leaving <strong>the</strong> criminal justice system have<br />
access to a full range <strong>of</strong> services;<br />
■ The <strong>Office</strong> <strong>of</strong> Strategic Planning, Policy, and<br />
Evaluation - provides guidance regarding mental<br />
health strategic planning, policy development,<br />
grants management and development, and evaluation<br />
<strong>of</strong> services. This includes serving as <strong>the</strong><br />
liaison to <strong>the</strong> Dixon Court Monitor;<br />
■ Grants Management - provides information on<br />
federal, foundation and o<strong>the</strong>r sources <strong>of</strong> funding<br />
for new and continuing program initiatives that<br />
address <strong>the</strong> mandates and directives <strong>of</strong> <strong>the</strong> Dixon<br />
Court order for a comprehensive communitybased<br />
mental health system, by increasing <strong>the</strong><br />
number <strong>of</strong> new program activities and continuing<br />
funding for existing program activities to minimize<br />
<strong>the</strong> use <strong>of</strong> local dollars for <strong>the</strong>se purposes;<br />
■ Integrated Care – seeks to reduce <strong>the</strong> inpatient<br />
census/reducing admissions at St. Elizabeths<br />
Hospital, by identifying consumers who need a<br />
comprehensive array <strong>of</strong> services that include<br />
mental health, non-mental health, and informal<br />
supports to integrate to <strong>the</strong>ir fullest ability <strong>the</strong>ir<br />
communities and families, and coordinates, manages,<br />
and evaluates <strong>the</strong> care for <strong>the</strong>se consumers to<br />
improve <strong>the</strong>ir quality <strong>of</strong> life and tenure in a<br />
community setting;<br />
■ <strong>Office</strong> <strong>of</strong> Accountability and Compliance -<br />
provides oversight <strong>of</strong> providers for DMH to<br />
ensure that <strong>the</strong>y meet or exceed <strong>the</strong> service delivery<br />
and documentation standards for Mental Health<br />
Rehabilitation Services (MHRS) or Mental<br />
Health Community Residence Facilities<br />
(MHCRF) and comply with all applicable<br />
District and federal laws and regulations; monitors<br />
<strong>the</strong> provider network, investigates complaints<br />
and unusual incidents, and makes policy recommendations;<br />
and<br />
■ Provider Relations - provides technical assistance,<br />
training and coaching support to <strong>the</strong> DMH<br />
FY 2010 Proposed <strong>Budget</strong> and <strong>Financial</strong> Plan<br />
E-40<br />
provider network.<br />
Community Services <strong>Agency</strong> (DCCSA) - services<br />
functions have been transferred within DMH to <strong>the</strong><br />
<strong>Agency</strong>’s Mental Health Authority in FY 2010 and<br />
direct client services have been outsourced. The<br />
remaining activity provides funding for <strong>the</strong> residual<br />
payouts <strong>of</strong> employees.<br />
This program contains <strong>the</strong> following activity:<br />
■ <strong>Office</strong> <strong>of</strong> <strong>the</strong> <strong>Chief</strong> Executive <strong>Office</strong>r -<br />
provides management <strong>of</strong> services to <strong>the</strong> D.C.<br />
Community Services <strong>Agency</strong>.<br />
St. Elizabeths Hospital - provides psychiatric, medical,<br />
and psycho-social inpatient psychiatric treatment to<br />
adults to support <strong>the</strong>ir recovery and return to <strong>the</strong> community.<br />
The goal is to maintain an active treatment<br />
program that fosters recovery and independence as<br />
much as possible. In addition, this program manages<br />
housekeeping, building maintenance and nutritional<br />
services, to provide a clean, safe and healthy hospital<br />
environment for patients, families, and employees so<br />
that <strong>the</strong> patients can receive quality care. The St.<br />
Elizabeths Hospital program also ensures staff credentialing,<br />
licensing privileges and provision <strong>of</strong> medication<br />
and medical support services to eligible consumers<br />
in order to effectively treat mental illness and<br />
enhance <strong>the</strong>ir recovery. This program is part <strong>of</strong> <strong>the</strong><br />
system that ensures <strong>the</strong> hospital's compliance with<br />
Centers for Medicare and Medicaid Services/The<br />
Joint Commission standards.<br />
This program contains <strong>the</strong> following 13 activities:<br />
■ The <strong>Office</strong> <strong>of</strong> <strong>the</strong> <strong>Chief</strong> Executive <strong>Office</strong>r - provides<br />
planning, policy development and mental<br />
health system design for <strong>the</strong> District to create a<br />
comprehensive and responsive system <strong>of</strong> mental<br />
health care;<br />
■ Clinical and Medical Affairs (CMA) - provides<br />
active treatment to <strong>the</strong> inpatient population at St.<br />
Elizabeths Hospital to improve <strong>the</strong> quality <strong>of</strong> life<br />
through a recovery-based <strong>the</strong>rapeutic program.<br />
CMA monitors services to eligible consumers in<br />
order to effectively treat mental illness and<br />
enhance clients' recovery;<br />
■ Engineering and Maintenance - provides maintenance<br />
and repairs to <strong>the</strong> hospital to ensure a<br />
functional, safe and secure facility for customers,<br />
visitors and staff in order to maximize <strong>the</strong> benefits
<strong>of</strong> <strong>the</strong>rapeutic treatment;<br />
■ Support Services - provides services for formulation<br />
and management <strong>of</strong> <strong>the</strong> hospital’s budget,<br />
and approves and finances all procurements.<br />
Assures <strong>the</strong> overall financial integrity <strong>of</strong> <strong>the</strong> hospital.<br />
Establishes <strong>the</strong> training curriculum for all levels<br />
<strong>of</strong> hospital staff and assures compliance with<br />
agreed upon training programs, especially clinical<br />
staff to maintain <strong>the</strong> health and safety <strong>of</strong> patients<br />
and employees;<br />
■ Forensic Services - provides court-ordered forensic<br />
diagnostic, treatment, and consultation services<br />
to defendants, <strong>of</strong>fenders and insanity<br />
acquitees committed by <strong>the</strong> criminal divisions <strong>of</strong><br />
<strong>the</strong> local or Federal court;<br />
■ Housekeeping - provides a clean and sanitized<br />
environment throughout St. Elizabeths Hospital<br />
facilities to enhance <strong>the</strong> <strong>the</strong>rapeutic environment<br />
and level <strong>of</strong> clinical performance in all clinical and<br />
non-clinical areas;<br />
■ Materials Management - provides and delivers<br />
materials, supplies, postal and laundry services to<br />
patients, DMH staff employees and customers so<br />
that <strong>the</strong>y can provide and receive quality patient<br />
care, respectively. Provides inventory <strong>of</strong> goods<br />
received and stock replenishment, and performs<br />
electronic receiving for all goods and services<br />
received in <strong>the</strong> hospital;<br />
■ Medical Services - provides prescriptions, medical<br />
screening, and education, medical assessment,<br />
medication (pharmacy), podiatry services, respiratory<br />
care and diet consultation to <strong>the</strong> inpatient<br />
population, and employee Health Services to staff<br />
at SEH, so that <strong>the</strong>y can improve <strong>the</strong> quality <strong>of</strong><br />
life through a recovery-based <strong>the</strong>rapeutic program.<br />
To provide quality medical care for inpatients<br />
at St. Elizabeths Hospital in concert with<br />
psychiatric care to optimize physical and mental<br />
health and facilitate discharge into <strong>the</strong> community<br />
in a recovery-based model;<br />
■ Nursing Services - provides active treatment and<br />
comprehensive, quality nursing care to <strong>the</strong> inpatient<br />
population at St. Elizabeths Hospital, 24<br />
hours a day and 7 days a week, to improve <strong>the</strong><br />
quality <strong>of</strong> life through a recovery-based <strong>the</strong>rapeutic<br />
program;<br />
■ Nutritional Services - provides optimal nutrition<br />
and food services in a safe and sanitary environment,<br />
medical nutrition <strong>the</strong>rapy and nutrition<br />
education services;<br />
■ Psychiatric Services - provides comprehensive<br />
assessment, treatment and aftercare planning,<br />
utilizing <strong>the</strong> most advanced scientific and evidence-based<br />
methods in accordance with <strong>the</strong><br />
recovery-based model for all adult residents <strong>of</strong> <strong>the</strong><br />
District <strong>of</strong> Columbia who may from time to time<br />
require hospitalization;<br />
■ Security and Safety - provides a safe and secure<br />
facility for consumers, visitors and staff in order to<br />
maximize <strong>the</strong> <strong>the</strong>rapeutic environment; and<br />
■ Transportation and Grounds - provides and<br />
manages resources, administrative functions, contracts,<br />
funding and staff, to provide a safe, secure<br />
and <strong>the</strong>rapeutic physical environment for<br />
patients, staff and visitors hospital-wide, and provides<br />
management and oversight <strong>of</strong> <strong>the</strong> full realm<br />
<strong>of</strong> grounds maintenance services, including snow<br />
and ice removal, solid medical waste disposal,<br />
grounds maintenance services for patients and<br />
employees so that <strong>the</strong>y can receive and provide<br />
quality patient care, respectively, and live in a safe<br />
and <strong>the</strong>rapeutic environment. The purpose <strong>of</strong> <strong>the</strong><br />
Transportation and Grounds activity is to provide<br />
vehicles and drivers for transportation services to<br />
include, but not be limited to, patient food deliveries<br />
department-wide, and patient/staff transport<br />
District-wide, among o<strong>the</strong>r services.<br />
Community Contract Providers - provides prevention,<br />
comprehensive assessments, linkage, treatment<br />
and emergency services to promote resilience and<br />
recovery for children, youth, families, and adults.<br />
This program contains <strong>the</strong> following activity:<br />
■ Mental Health Rehabilitation Services - provides<br />
medically-necessary diagnosis/assessment and<br />
treatment services to children, youth, families and<br />
adults who are residents <strong>of</strong> <strong>the</strong> District <strong>of</strong><br />
Columbia so that <strong>the</strong>y can be resilient, experience<br />
recovery and achieve a healthy productive life, in<br />
<strong>the</strong> "least restrictive environment."<br />
<strong>Agency</strong> Management - provides for administrative<br />
support and <strong>the</strong> required tools to achieve operational<br />
and programmatic results. This program is standard<br />
for all agencies using performance-based budgeting.<br />
Department <strong>of</strong> Mental Health<br />
E-41
<strong>Agency</strong> <strong>Financial</strong> Operations - provides comprehensive<br />
and efficient financial management services to,<br />
and on behalf <strong>of</strong>, District agencies so that <strong>the</strong> financial<br />
integrity <strong>of</strong> <strong>the</strong> District <strong>of</strong> Columbia is maintained.<br />
This program is standard for all agencies using<br />
performance-based budgeting.<br />
Program Structure Change<br />
The Department <strong>of</strong> Mental Health program changes<br />
in <strong>the</strong> FY 2010 Proposed <strong>Budget</strong> include <strong>the</strong> addition<br />
FY 2010 Proposed Operating <strong>Budget</strong> and FTEs, by Program and Activity<br />
Table RM0-4 contains <strong>the</strong> proposed FY 2010 budget by program and activity compared to <strong>the</strong> FY 2009 approved budget.<br />
It also provides <strong>the</strong> FY 2008 actual data.<br />
Table RM0-4<br />
(dollars in thousands)<br />
Dollars in Thousands Full-Time Equivalents<br />
Change Change<br />
Actual Approved Proposed from Actual Approved Proposed from<br />
Program/Activity<br />
(0001) Default<br />
FY 2008 FY 2009 FY 2010 FY 2009 FY 2008 FY 2009 FY 2010 FY 2009<br />
(0002) Default Program For <strong>Budget</strong> -729 0 0 0 0.0 0.0 0.0 0.0<br />
Subtotal (0001) Default<br />
(1000) <strong>Agency</strong> Management<br />
-729 0 0 0 0.0 0.0 0.0 0.0<br />
(1010) Personnel 1,887 2,450 1,473 -977 18.6 20.5 8.6 -11.9<br />
(1015) Training & Employee Development 1,175 548 397 -151 12.6 4.5 2.5 -2.0<br />
(1017) Labor Relations 320 460 259 -200 3.0 5.0 2.0 -3.0<br />
(1020) Contracting & Procurement 567 898 1,053 156 5.0 7.0 10.0 3.0<br />
(1030) Property Management 3,390 3,387 6,658 3,271 2.0 2.0 2.0 0.0<br />
(1040) Information Technology 5,525 5,229 5,542 313 23.0 25.0 28.0 3.0<br />
(1050) <strong>Financial</strong> Management-<strong>Agency</strong> 4,579 3,317 2,681 -636 56.7 11.0 19.5 8.5<br />
(1055) Risk Management 256 117 1 -116 2.0 1.0 0.0 -1.0<br />
(1060) Legal Services -1 300 288 -12 0.0 0.0 0.0 0.0<br />
(1070) Fleet Management 135 0 0 0 0.0 0.0 0.0 0.0<br />
(1080) Communications 215 227 339 112 1.0 1.0 2.0 1.0<br />
(1085) Customer Services 65 65 63 -2 0.0 0.0 0.0 0.0<br />
(1087) Language Access 90 75 104 28 0.0 0.0 0.0 0.0<br />
(1099) Court Supervision 0 0 728 728 0.0 0.0 0.0 0.0<br />
Subtotal (1000) <strong>Agency</strong> Management<br />
(100F) DMH <strong>Financial</strong> Operations<br />
18,202 17,074 19,587 2,513 123.9 77.0 74.6 -2.4<br />
(110F) DMH <strong>Budget</strong> Operations 563 555 536 -19 4.0 4.0 4.0 0.0<br />
(120F) DMH Accounting Operations 769 841 848 7 7.0 12.0 12.0 0.0<br />
(130F) DMH Fiscal <strong>Office</strong>r 238 232 242 10 6.0 2.0 2.0 0.0<br />
Subtotal (100F) DMH <strong>Financial</strong> Operations<br />
(Continued on next page)<br />
1,570 1,628 1,627 -1 17.0 18.0 18.0 0.0<br />
FY 2010 Proposed <strong>Budget</strong> and <strong>Financial</strong> Plan<br />
E-42<br />
<strong>of</strong> two new cost centers. The Clinical Management<br />
unit serves as a medical management treatment team<br />
for MHRS providers and functions as a safety net for<br />
psychiatric medications and pharmacy education services<br />
for consumers enrolled in <strong>the</strong> DMH network<br />
who have no pharmacy benefits. The Integrated Care<br />
unit seeks to reduce <strong>the</strong> inpatient census/reducing<br />
admissions at St. Elizabeths Hospital by identifying<br />
consumers who need a comprehensive array <strong>of</strong> services.
Table RM0-4 (Continued)<br />
(dollars in thousands)<br />
Dollars in Thousands Full-Time Equivalents<br />
Change Change<br />
Actual Approved Proposed from Actual Approved Proposed from<br />
Program/Activity<br />
(1800) Mental Health Authority<br />
FY 2008 FY 2009 FY 2010 FY 2009 FY 2008 FY 2009 FY 2010 FY 2009<br />
(1810) <strong>Office</strong> <strong>of</strong> <strong>the</strong> Director/<strong>Chief</strong> Exec <strong>Office</strong>r 2,669 1,775 1,827 51 14.0 6.0 9.0 3.0<br />
(1815) Off Of The <strong>Chief</strong> Clinical <strong>Office</strong>r 0 3,780 4,589 808 0.0 3.2 5.0 1.8<br />
(1816) Clinical Management 0 0 7,164 7,164 0.0 0.0 20.9 20.9<br />
(1820) Consumer & Family Affairs 863 919 1,232 313 2.0 2.0 3.0 1.0<br />
(1825) Off Of Programs & Policy 0 1,112 2,552 1,440 0.0 7.0 25.0 18.0<br />
(1830) Adult Services 3,023 1,912 17,241 15,329 23.3 12.0 13.0 1.0<br />
(1835) Housing 0 6,470 6,455 -15 0.0 7.0 4.0 -3.0<br />
(1840) Care Coordination 7,923 2,021 2,454 433 59.9 24.0 26.0 2.0<br />
(1845) Comprehensive Psych Emer Prog - CPEP 0 7,090 6,713 -377 0.0 72.5 62.5 -10.0<br />
(1850) Children & Youth Services 9,625 4,994 7,560 2,566 67.4 24.3 31.8 7.6<br />
(1855) School Mental Health Program 0 4,076 4,894 818 0.0 52.0 52.0 0.0<br />
(1860) Forensic Services (Jail Diversion) 606 1,529 1,323 -206 4.0 5.0 5.0 0.0<br />
(1865) Off-strategic Planning, Policy Eval & Supp 0 591 694 104 0.0 5.0 6.0 1.0<br />
(1870) Grants Management 227 117 1 -116 2.0 1.0 0.0 -1.0<br />
(1875) Integrated Care 0 0 1,618 1,618 0.0 0.0 4.0 4.0<br />
(1880) <strong>Office</strong> <strong>of</strong> Accountability (QI) 1,609 1,408 2,381 972 14.7 13.5 21.5 8.0<br />
(1890) Provider Relations 450 452 379 -73 4.0 4.0 3.0 -1.0<br />
Subtotal (1800) Mental Health Authority<br />
(2800) Community Services <strong>Agency</strong><br />
26,997 38,246 69,076 30,829 191.4 238.5 291.7 53.2<br />
(2810) <strong>Office</strong> <strong>of</strong> <strong>the</strong> <strong>Chief</strong> Executive <strong>Office</strong>r - CSA 4,898 4,135 3,415 -720 13.0 13.0 16.0 3.0<br />
(2815) Adult & Family Services - CSA 16,122 16,922 0 -16,922 152.5 170.9 0.0 -170.9<br />
(2820) Children Youth & Family Services - CSA 4,983 5,792 0 -5,792 46.3 56.9 0.0 -56.9<br />
(2825) Clinical Support - CSA 520 525 0 -525 3.0 3.0 0.0 -3.0<br />
(2830) Consumer Advocacy - CSA 60 56 0 -56 1.0 1.0 0.0 -1.0<br />
(2845) Intake & Continuity <strong>of</strong> Care - CSA 495 474 0 -474 6.0 6.0 0.0 -6.0<br />
(2850) Pharmacy - CSA 3,981 4,211 0 -4,211 10.0 10.0 0.0 -10.0<br />
(2855) Quality Improvement - CSA 769 828 0 -828 10.0 10.0 0.0 -10.0<br />
(2860) Security & Safety - CSA 1,164 1,300 0 -1,300 0.0 0.0 0.0 0.0<br />
(2865) <strong>Office</strong> <strong>of</strong> <strong>the</strong> <strong>Chief</strong> Operating <strong>Office</strong>r 0 2,053 0 -2,053 0.0 30.0 0.0 -30.0<br />
Subtotal (2800) Community Services <strong>Agency</strong><br />
(3800) Saint Elizabeths Hospital<br />
32,992 36,296 3,415 -32,881 241.7 300.8 16.0 -284.8<br />
(3805) <strong>Office</strong> <strong>of</strong> <strong>the</strong> <strong>Chief</strong> Executive 1,918 1,818 1,948 130 11.8 9.0 15.0 6.0<br />
(3810) Clinical & Medical Affairs - SEH 17,351 13,801 13,906 105 101.8 132.0 137.5 5.5<br />
(3815) Engineering & Maintenance - SEH 12,958 12,643 14,816 2,174 22.0 24.0 22.8 -1.2<br />
(3820) Support Services 0 1,791 1,514 -277 0.0 31.0 20.0 -11.0<br />
(3825) Forensic Services - SEH 2,652 4,071 2,658 -1,413 26.5 29.8 25.0 -4.8<br />
(Continued on next page)<br />
Department <strong>of</strong> Mental Health<br />
E-43
Table RM0-4 (Continued)<br />
(dollars in thousands)<br />
Dollars in Thousands Full-Time Equivalents<br />
Change Change<br />
Actual Approved Proposed from Actual Approved Proposed from<br />
Program/Activity FY 2008 FY 2009 FY 2010 FY 2009 FY 2008 FY 2009 FY 2010 FY 2009<br />
(3830) Housekeeping - SEH 2,669 2,719 2,351 -367 88.8 58.0 49.0 -9.0<br />
(3835) Materials Management - SEH 1,122 896 1,320 424 12.0 12.0 8.0 -4.0<br />
(3840) Medical Services - SEH 9,078 8,069 5,386 -2,684 48.7 56.0 39.8 -16.3<br />
(3845) Nursing - SEH 35,167 31,327 32,046 719 382.3 475.3 454.5 -20.8<br />
(3850) Nutritional Svcs (in/out Patients) - SEH 4,952 4,936 4,565 -372 50.6 50.0 44.0 -6.0<br />
(3855) Psychiatric Services - SEH 7,578 8,411 9,980 1,570 58.9 71.9 72.5 0.6<br />
(3860) Security & Safety - SEH 3,188 2,980 2,803 -177 19.0 21.0 21.0 0.0<br />
(3865) Transportation & Grounds - SEH 1,833 1,886 1,559 -327 25.0 23.0 15.0 -8.0<br />
Subtotal (3800) Saint Elizabeths Hospital<br />
(5000) Direct Community Services<br />
100,466 95,347 94,852 -494 847.2 993.0 924.1 -68.9<br />
(5010) Community Mental Health Services 3 0 0 0 0.0 0.0 0.0 0.0<br />
Subtotal (5000) Direct Community Services 3 0 0 0 0.0 0.0 0.0 0.0<br />
(7000) Active Treatment<br />
(7010) Active Treatment -639 0 0 0 0.0 0.0 0.0 0.0<br />
Subtotal (7000) Active Treatment -639<br />
(7800) Community Contract Providers<br />
0 0 0 0.0 0.0 0.0 0.0<br />
(7820) Mental Health Rehabilitation Services 15,516 17,185 9,697 -7,488 0.0 0.0 0.0 0.0<br />
(7825) Mental Health Rehab Svcs - Local Match 11,541 7,858 8,322 465 0.0 0.0 0.0 0.0<br />
(7830) Mental Health Rehab Svcs - Medicaid FFP -492 0 0 0 0.0 0.0 0.0 0.0<br />
(7840) Residential Treatment Centers 25,238 14,852 0 -14,852 0.0 0.0 0.0 0.0<br />
Subtotal (7800) Community Contract Providers 51,803<br />
(9960) Year End Close<br />
39,895 18,019 -21,876 0.0 0.0 0.0 0.0<br />
No Activity Assigned -4,175 0 0 0 0.0 0.0 0.0 0.0<br />
Subtotal (9960) Year End Close<br />
(SE00) St. Elizabeths Hospital<br />
-4,175 0 0 0 0.0 0.0 0.0 0.0<br />
(GENL) General Cost Centers -1,587 0 0 0 0.0 0.0 0.0 0.0<br />
Subtotal (SE00) St. Elizabeths Hospital -1,587 0 0 0 0.0 0.0 0.0 0.0<br />
Total Proposed Operating <strong>Budget</strong> 224,903 228,486 206,576 -21,910 1,421.2 1,627.3 1,324.4 -302.9<br />
(Change is calculated by whole numbers and numbers may not add up due to rounding)<br />
Note: For more detailed information regarding <strong>the</strong> proposed funding for <strong>the</strong> activities within this agency’s programs, please see Schedule 30-PBB<br />
Program Summary By Activity in <strong>the</strong> FY 2010 Operating Appendices located on <strong>the</strong> <strong>Office</strong> <strong>of</strong> <strong>the</strong> <strong>Chief</strong> <strong>Financial</strong> <strong>Office</strong>r’s website.<br />
FY 2010 Proposed <strong>Budget</strong> and <strong>Financial</strong> Plan<br />
E-44
Major Baseline Adjustments, Cost Savings<br />
and Policy Initiatives<br />
Initial Adjustments: The following adjustments were<br />
made in Local funds: a net increase <strong>of</strong> $3,136,456 for<br />
fixed costs in multiple programs, a net decrease <strong>of</strong><br />
$6,499,736 in personal services due to net effect <strong>of</strong><br />
personal services changes including impact <strong>of</strong> <strong>the</strong><br />
change and governance <strong>of</strong> operations related to <strong>the</strong><br />
DC Community Services <strong>Agency</strong> (DCCSA), and a<br />
net increase <strong>of</strong> $4,429,280 in multiple programs due<br />
to <strong>the</strong> impact <strong>of</strong> FY 2009 one-time rescissions, <strong>the</strong><br />
reallocation <strong>of</strong> funding associated with <strong>the</strong> restructuring<br />
<strong>of</strong> mental health services previously provided by<br />
<strong>the</strong> DCCSA and <strong>the</strong> reallocation <strong>of</strong> funds to properly<br />
reflect <strong>the</strong> operational functions within <strong>the</strong> Mental<br />
Health Authority. In Federal Grants Funds, a<br />
decrease <strong>of</strong> $169,917 reflects projected grant award<br />
reductions. In Federal Medicaid Payments, an<br />
increase <strong>of</strong> $189,188 and 2 FTEs in <strong>the</strong> Mental<br />
Health Authority is due to projected Federal reimbursement<br />
for administrative costs related to provision<br />
<strong>of</strong> Medicaid services. In Intra-District Funds, a<br />
decrease <strong>of</strong> $5,071,127 is related to Medicaid funding<br />
for services formerly reimbursed in <strong>the</strong> DCCSA program.<br />
Transfers In/Out: DMH will continue to work in<br />
FY 2010 to reduce <strong>the</strong> census at Saint Elizabeths<br />
Hospital, in part by transitioning some patients out <strong>of</strong><br />
<strong>the</strong> hospital and into community supported programs.<br />
To help achieve this goal, Saint Elizabeths<br />
Hospital will transfer $500,000 to <strong>the</strong> Department<br />
on Disability Services and <strong>the</strong> Department <strong>of</strong> Health<br />
Care Finance to help <strong>of</strong>fset <strong>the</strong> cost <strong>of</strong> transitioning<br />
patients into <strong>the</strong> Medicaid Home and Community-<br />
Based Waiver program. The budget also allocates<br />
$242,562 transferred from <strong>the</strong> Workforce Investment<br />
Fund to support expenses related to a collective bargaining<br />
agreement with <strong>the</strong> Metal Trades Council.<br />
Cost Savings: Saint Elizabeths Hospital will reduce<br />
its contingent <strong>of</strong> drivers, maintenance mechanics,<br />
materials handlers, and housekeeping staff, eliminating<br />
18 positions and saving $821,461. A billing<br />
department and laboratory at <strong>the</strong> hospital will be<br />
reorganized, with many functions shifted outside <strong>the</strong><br />
agency to save $886,829 while eliminating 13 positions.<br />
The Mental Health Authority (MHA), DMH’s<br />
oversight and administrative unit, will also undergo<br />
significant changes. This budget accommodates a<br />
realignment <strong>of</strong> <strong>the</strong> DMH’s human resources and IT<br />
departments, reducing staffing by 16 positions and saving<br />
$1,219,803. The budget also calls for a reduction<br />
in staffing within MHA, DMH’s <strong>Office</strong> <strong>of</strong> Programs,<br />
and <strong>the</strong> <strong>Office</strong> <strong>of</strong> <strong>the</strong> Director, including <strong>the</strong> elimination<br />
<strong>of</strong> 29 positions and savings <strong>of</strong> $2,274,949.<br />
DMH will also change <strong>the</strong> way it pays clinicians within<br />
its school-based mental health program. In FY<br />
2010, each position in <strong>the</strong> school mental health program<br />
will be reduced to 0.8 FTEs, accounting for <strong>the</strong><br />
10-month school year worked by clinicians, saving<br />
<strong>the</strong> District $682,816. Altoge<strong>the</strong>r, <strong>the</strong>se changes<br />
eliminate 83 FTEs, reducing costs by $5,885,858.<br />
DMH’s proposed budget also calls for<br />
$2,154,157 in reductions to various administrative,<br />
consulting, and training contracts as well as reductions<br />
in supplies and materials costs. In addition,<br />
DMH will seek relatively modest efficiencies within<br />
two programs – supported independent living and<br />
residential group homes – to align spending with<br />
underutilization <strong>of</strong> both programs. The proposed<br />
$145,705 reduction in supported independent living<br />
represents a 6 percent savings, which will be realized<br />
from vacancy rates and not a service reduction.<br />
Likewise, <strong>the</strong> $324,697 savings from residential<br />
group homes amounts to less than 5 percent <strong>of</strong> total<br />
budgeted spending. DMH believes nei<strong>the</strong>r <strong>of</strong> <strong>the</strong>se<br />
reductions, nor a $200,000 proposed reduction to its<br />
forensic program, will result in a reduction in services.<br />
To achieve fur<strong>the</strong>r savings <strong>of</strong> $170,313, DMH<br />
plans to shift a portion <strong>of</strong> assessment services for<br />
youth referred by <strong>the</strong> Child and Family Services<br />
<strong>Agency</strong> from a contract to qualified choice providers<br />
able to provide comparable services at a lower cost.<br />
Saint Elizabeths will significantly reduce its Work<br />
Adjustment Training Program, saving $600,000 by<br />
reducing <strong>the</strong> size <strong>of</strong> a somewhat outdated program<br />
that pays patients a minimum wage to work at <strong>the</strong><br />
hospital. Instead, <strong>the</strong> hospital will limit <strong>the</strong> program<br />
to a small number <strong>of</strong> patients that cannot leave <strong>the</strong><br />
hospital grounds. O<strong>the</strong>rs will be shifted into community-based<br />
work training programs. DMH will<br />
also direct $1,077,377 <strong>of</strong> savings from <strong>the</strong> closure <strong>of</strong><br />
DCCSA to provide fur<strong>the</strong>r savings and help close <strong>the</strong><br />
city’s budget gap. This amount <strong>of</strong> savings represents<br />
less than 3 percent <strong>of</strong> CSA’s FY 2009 budget, and is<br />
<strong>the</strong> only direct savings related to <strong>the</strong> CSA closure.<br />
Efficiencies in <strong>the</strong> operations <strong>of</strong> <strong>the</strong> court monitor<br />
overseeing <strong>the</strong> Dixon lawsuit will generate ano<strong>the</strong>r<br />
$50,000 in savings.<br />
Department <strong>of</strong> Mental Health<br />
E-45
A number <strong>of</strong> o<strong>the</strong>r initiatives will save funding<br />
through policy changes and increased revenues that<br />
will <strong>of</strong>fset Local funds and help fill <strong>the</strong> budget gap.<br />
The agency projects that it will boost Medicaid reimbursements<br />
by $1,954,850 through enhanced<br />
administrative claiming and by implementing new<br />
Medicaid billing codes. DMH will increase reimbursements<br />
by $400,000 by billing MCOs for services<br />
provided through <strong>the</strong> school-based mental<br />
health program. Saint Elizabeths Hospital will collect<br />
an additional $216,000 in reimbursements by claiming<br />
Social Security Disability payments made to<br />
patients at <strong>the</strong> hospital. In addition, DMH projects<br />
that it will save $200,000 in Local funds by enforcing<br />
a requirement that all providers submit claims within<br />
90 days. On a smaller scale, <strong>the</strong> proposed budget<br />
adds $34,280 to account for a revised estimate <strong>of</strong> procurement<br />
costs. Likewise, this budget specifically<br />
reduces electricity costs by $90,764, fleet maintenance<br />
costs by $45,194, and occupancy costs by<br />
$7,373.<br />
Protected Programs: For DMH, FY 2010 will be a<br />
transformational year. This proposed budget achieves<br />
necessary and significant cost savings, while also protecting<br />
<strong>the</strong> resources necessary to accomplish two<br />
major undertakings: <strong>the</strong> opening <strong>of</strong> a new Saint<br />
Elizabeths Hospital; and <strong>the</strong> closure <strong>of</strong> DMH’s<br />
Community Service <strong>Agency</strong> (CSA), through <strong>the</strong> successful<br />
transition <strong>of</strong> approximately 4,000 consumers<br />
into quality care <strong>of</strong>fered by community-based<br />
providers.<br />
Throughout this budget, DMH seeks to protect<br />
resources for <strong>the</strong> District’s most vulnerable residents.<br />
At Saint Elizabeths Hospital, this proposed budget<br />
makes no reductions to direct care staff such as nurses,<br />
technicians, counselors and o<strong>the</strong>r clinicians.<br />
Continuity <strong>of</strong> staffing will foster continued improvement<br />
in treatment as <strong>the</strong> hospital moves to a new<br />
facility, and as DMH works to satisfy requirements <strong>of</strong><br />
a settlement agreement with <strong>the</strong> Department <strong>of</strong><br />
Justice.<br />
The FY 2010 budget also protects resources necessary<br />
for <strong>the</strong> successful closure <strong>of</strong> CSA, which currently<br />
provides direct mental health services to about<br />
4,000 District residents. DMH will continue operating<br />
<strong>the</strong> CSA until March 31, 2010 – six months<br />
longer than originally planned – to ensure that every<br />
CSA consumer makes a successful transition into a<br />
FY 2010 Proposed <strong>Budget</strong> and <strong>Financial</strong> Plan<br />
E-46<br />
quality community mental health care provider. To<br />
accommodate this prolonged timeline, DMH’s budget<br />
shifts roughly $3,409,618 and 40.5 FTEs into<br />
CSA to continue providing direct services through<br />
<strong>the</strong> first six months <strong>of</strong> FY 2010. In addition, DMH’s<br />
budget preserves nearly all o<strong>the</strong>r savings from <strong>the</strong><br />
CSA closure to run an orderly transition and build<br />
capacity among community mental health care<br />
providers. A team <strong>of</strong> DMH staff will ensure that<br />
every consumer currently served by CSA is matched<br />
with a quality provider. And providers throughout<br />
<strong>the</strong> District will receive support from DMH, including<br />
cash vouchers tied to every CSA consumer that<br />
transitions successfully. By redirecting <strong>the</strong>se funds<br />
into <strong>the</strong> community, and by giving consumers choice,<br />
DMH will help build a stronger public mental health<br />
system capable <strong>of</strong> serving more people.<br />
Policy Initiatives: This budget increases DMH’s budget<br />
for overtime pay by $1,225,305 to more accurately<br />
align <strong>the</strong> budget to actual overtime costs at<br />
Saint Elizabeths Hospital. The proposed DMH overtime<br />
budget - $3.7 million for FY 2010 – represents<br />
a substantial increase from <strong>the</strong> FY 2009 Approved<br />
level, but sets an aggressive goal <strong>of</strong> significantly reducing<br />
overtime expenditures from actual spending in<br />
recent years. The budget adds $2,420,000 in onetime<br />
funding to <strong>of</strong>fset <strong>the</strong> utilities costs <strong>of</strong> operating<br />
two hospitals during <strong>the</strong> transition into <strong>the</strong> new Saint<br />
Elizabeths Hospital, as well as moving expenses and<br />
waste removal costs related to <strong>the</strong> move.<br />
Intra-<strong>Agency</strong> Changes: In order to provide additional<br />
funding support for DMH’s core services,<br />
$1,121,000 in Local funds is reallocated via an<br />
agency-wide reduction in fixed costs. DMH’s Mental<br />
Health Authority (MHA) is supported in this budget<br />
by this redirection <strong>of</strong> funds to streng<strong>the</strong>n and optimize<br />
various mental health programs and services.<br />
Specifically, this budget requires MHA to allocate<br />
$250,000 <strong>of</strong> <strong>the</strong> $1,121,000 to support audits <strong>of</strong> all<br />
certified mental health rehabilitation services<br />
providers; $250,000 to support a community grant<br />
for childbirth education and parenting and post-partum<br />
counseling for District residents; $250,000 for<br />
an independent analysis <strong>of</strong> construction costs associated<br />
with <strong>the</strong> new mental health hospital; $250,000<br />
to support ongoing technical assistance and management<br />
support; and $121,000 for <strong>the</strong> Mental Health
Rehabilitation Services. This budget also calls for a<br />
redirection <strong>of</strong> $554,000 <strong>of</strong> Federal Medicaid<br />
Payments budget authority from <strong>the</strong> <strong>Agency</strong><br />
Management Program contractual services. The redirected<br />
funds supports 7.4 FTEs in MHA’s School<br />
Mental Health Program <strong>the</strong>reby granting DMH latitude<br />
in <strong>the</strong> determination <strong>of</strong> staffing needs and discretionary<br />
maintenance <strong>of</strong> full-year service status <strong>of</strong><br />
school-based clinicians.<br />
Gap-Closing Initiatives: The DMH budget achieves<br />
savings, in part, by continuing two major efficiency<br />
initiatives: <strong>the</strong> planned closure <strong>of</strong> <strong>the</strong> DCCSA, and<br />
<strong>the</strong> opening <strong>of</strong> Saint Elizabeths Hospital’s new facility.<br />
By closing DCCSA and transitioning its consumers<br />
to o<strong>the</strong>r community providers, DMH will<br />
save $1,655,579 in reduced security, rent, energy and<br />
telephone costs. In addition, DMH’s budget eliminates<br />
24.5 FTEs from DCCSA while ensuring <strong>the</strong><br />
provision <strong>of</strong> high-quality direct services, <strong>the</strong>reby saving<br />
$1,876,000 in Local Funds, half <strong>of</strong> which –<br />
$938,000 – is redirected both to provide additional<br />
mental health rehabilitative services through private<br />
providers and to streng<strong>the</strong>n <strong>the</strong> District’s public mental<br />
health system. The remaining $938,000 will go to<br />
close <strong>the</strong> District’s budget gap. DMH will continue<br />
to <strong>of</strong>fer direct psychiatric services while realigning its<br />
staffing resources to <strong>the</strong> District’s needs by eliminating<br />
6 <strong>of</strong> 14 FTEs, <strong>the</strong>reby saving $440,457. DMH<br />
will also realign <strong>the</strong> Mental Health Authority’s<br />
(MHA’s) staffing resources to accommodate <strong>the</strong><br />
ongoing transition <strong>of</strong> DCCSA, eliminating 6.5 FTEs<br />
and saving $690,917.<br />
The opening <strong>of</strong> <strong>the</strong> new Saint Elizabeths Hospital<br />
facility in FY 2010 will consolidate certain hospital<br />
operations, saving $630,000 in security service costs.<br />
The hospital will save $600,000 by reducing <strong>the</strong> size<br />
<strong>of</strong> its pharmacy staff to align with <strong>the</strong> reduction <strong>of</strong> <strong>the</strong><br />
hospital patient population, which has shrunk from<br />
400 persons to fewer than 370 persons in FY 2009;<br />
DMH expects <strong>the</strong> population to continue to decline<br />
to approximately 340 patients when <strong>the</strong> new facility<br />
opens in Spring 2010. Saint Elizabeths Hospital will<br />
complete its outsourcing <strong>of</strong> laboratory services, saving<br />
$215,325 and eliminating 5 FTEs. The hospital will<br />
also reduce <strong>the</strong> rate <strong>of</strong> its overtime budget growth<br />
from $1,225,305 in FY 2009 to $825,305 in FY<br />
2010, saving $400,000 by setting more aggressive<br />
management goals. The hospital will also save<br />
$1,646,000 by eliminating 28.1 FTEs as it prepares<br />
to move into its new facility, preserving its staff that<br />
provides direct care and focusing on achieving savings<br />
in ancillary departments, such as engineering and<br />
nutritional services. Finally, <strong>the</strong> hospital will save<br />
$350,000 by re-evaluating its contracts with vendors<br />
and o<strong>the</strong>r third parties.<br />
MHA will generate savings by reducing reimbursements<br />
for Community Residential Facilities by<br />
four percent, saving $360,000; by reducing contract<br />
costs by five percent for <strong>the</strong> youth assessment center<br />
that serves <strong>the</strong> U.S. District Court, saving $50,000;<br />
and by amending an agreement to provide schoolbased<br />
mental health programs in six schools, saving<br />
$575,000. Additionally, DMH will reorganize its<br />
supported employment programs, saving $89,000,<br />
and its clients will receive services from <strong>the</strong><br />
Department <strong>of</strong> Human Services’ Rehabilitation<br />
Services Administration, which has agreed to provide<br />
$500,000 to fund supported employment during FY<br />
2010. This funding will augment existing services<br />
<strong>of</strong>fered through DMH and will make supported<br />
employment available to 150 additional District residents.<br />
Department <strong>of</strong> Mental Health<br />
E-47
FY 2009 Approved <strong>Budget</strong> to FY 2010 Proposed <strong>Budget</strong>, by Revenue Type<br />
Table RM0-5 itemizes <strong>the</strong> changes by revenue type between <strong>the</strong> FY 2009 approved budget and <strong>the</strong> FY 2010 proposed<br />
budget. The four categories <strong>of</strong> changes reflected in this table are: (1) changes to <strong>the</strong> baseline budget (includes<br />
agency request), (2) changes representing cost savings or efficiencies, and (3) changes related to policy initiatives,<br />
and (4) changes to specifically address <strong>the</strong> projected revenue shortfall.<br />
Table RM0-5<br />
(dollars in thousands)<br />
Program BUDGET FTE<br />
LOCAL FUND: FY 2009 Approved <strong>Budget</strong> and FTE 209,832 1,493.0<br />
Initial and Baseline Adjustments<br />
Net effect <strong>of</strong> fixed cost adjustments - Funding adjustments for OPM estimates Multiple Programs 3,136 0.0<br />
Net effect <strong>of</strong> salary and benefits changes - Salary step and o<strong>the</strong>r Multiple Programs -6,500 -139.5<br />
personal services funding adjustments including <strong>the</strong> impact <strong>of</strong> DCCSA<br />
closure<br />
Intra-<strong>Agency</strong> Changes - Reallocation <strong>of</strong> funding due to DCCSA closure Multiple Programs 4,429 0.0<br />
including impact <strong>of</strong> FY 2009 one-time rescissions<br />
Policy Initiatives and Cost Savings<br />
Shift - Allocation <strong>of</strong> funds to support collective bargaining agreement with<br />
metal trades council; funds transferred from workforce investment fund<br />
St. Elizabeths Hospital 243 0.0<br />
Reduce - Realign IT department throughout DMH to reflect changes to<br />
size and structure <strong>of</strong> <strong>the</strong> department<br />
<strong>Agency</strong> Management -400 -5.0<br />
Cost Decrease - Achieves 3.75 percent cost savings within residential group<br />
home program due to excess capacity; savings calculated using<br />
conservative vacancy estimates based on recent usage<br />
Mental Health Authority -325 0.0<br />
Cost Decrease - Achieve cost savings by shifting assessment services for<br />
CFSA youth clients from outside contractor to well-qualified choice providers<br />
Mental Health Authority -170 0.0<br />
Cost Decrease - Adjust school-based mental health staffing to reflect 10month<br />
schedule worked by staff<br />
Mental Health Authority -683 -7.0<br />
Cost Decrease - Enforce timely filing requirements for providers that fail<br />
to submit claims within 90 days<br />
Mental Health Authority -200 0.0<br />
Cost Decrease - Realize efficiencies within forensic services program<br />
through improved procurement and streamlined delivery <strong>of</strong> services<br />
Mental Health Authority -200 0.0<br />
Cost Decrease - Reduce expenditures on court monitor costs through<br />
various ongoing efficiencies, including co-location <strong>of</strong> <strong>of</strong>fices within facilities<br />
Mental Health Authority -50 0.0<br />
Cost Decrease - Structure funding levels for supported independent<br />
living services to align with 9 percent vacancy rates within <strong>the</strong><br />
program, reducing costs by 6 percent<br />
Mental Health Authority -146 0.0<br />
Reduce - Realign staffing within <strong>Office</strong> <strong>of</strong> Programs Mental Health Authority -380 -3.5<br />
Cost Decrease - Reorganize and outsource billing department at St.<br />
Elizabeths Hospital to increase revenues and achieve cost efficiencies<br />
St. Elizabeths Hostipal -478 -7.0<br />
Cost Decrease - Shift <strong>of</strong> $500,000 to DDS and DHCF to <strong>of</strong>fset <strong>the</strong> cost <strong>of</strong><br />
transitioning patients into <strong>the</strong> Medicaid Home and Community Based<br />
Waiver in FY 2010<br />
St. Elizabeths Hospital -500 0.0<br />
Cost Increase - Provide $2.1 million in one-time funding to <strong>of</strong>fset<br />
increased utility costs associated with operating two hospitals during<br />
transition to new St. Elizabeths hospital facility<br />
(Continued on next page)<br />
St. Elizabeths Hospital 2,100 0.0<br />
FY 2010 Proposed <strong>Budget</strong> and <strong>Financial</strong> Plan<br />
E-48
Table RMO-5 (Continued)<br />
(dollars in thousands)<br />
Program BUDGET FTE<br />
Policy Initiatives and Cost Savings (cont.)<br />
Cost Increase - Provide one-time funding to <strong>of</strong>fset moving and waste<br />
disposal costs during <strong>the</strong> move to a new St. Elizabeths Hospital<br />
St. Elizabeths Hospital 320 0.0<br />
Cost Savings - Reorganize and outsource laboratory functions at St.<br />
Elizabeths Hospital to more efficiently provide services through an<br />
outside provider<br />
St. Elizabeths Hospital -409 -6.0<br />
Reduce - Adjust number <strong>of</strong> materials handlers to meet <strong>the</strong> needs <strong>of</strong><br />
new St. Elizabeths Hospital<br />
St. Elizabeths Hospital -188 -4.0<br />
Reduce - Align housekeeping staffing to meet <strong>the</strong> needs <strong>of</strong> new St.<br />
Elizabeths Hospital<br />
St. Elizabeths Hospital -156 -4.0<br />
Reduce - Reduce number <strong>of</strong> vacant and filled maintenance mechanics<br />
positions to align with <strong>the</strong> needs <strong>of</strong> new St. Elizabeths Hospital<br />
St. Elizabeths Hospital -106 -2.0<br />
Reduce - Reorganize and refocus Work Adjustment Training Program to<br />
focus on core in-patient users <strong>of</strong> <strong>the</strong> program at St. Elizabeths<br />
Transition o<strong>the</strong>r users to existing community based work programs<br />
St. Elizabeths Hospital -600 0.0<br />
Reduce - Reorganize motor pool to a more appropriate size to meet <strong>the</strong><br />
needs <strong>of</strong> new, more efficient St. Elizabeths Hopital<br />
St. Elizabeths Hospital -373 -8.0<br />
Cost Decrease - Identify efficiencies to achieve a blanket reduction in<br />
supplies and materials costs throughout DMH<br />
<strong>Agency</strong>-wide -595 0.0<br />
Cost Decrease - Identify efficiencies to make a blanket reduction in<br />
consulting and training contracts<br />
<strong>Agency</strong>-wide -400 0.0<br />
Cost Decrease - Reduction to expenditures within various contracted<br />
services and outside consulting throughout DMH<br />
<strong>Agency</strong>-wide -1,159 0.0<br />
Cost Decrease - Align electricity budget with revised OPM estimate Multiple -91 0.0<br />
Cost Decrease - Align fleet budget with revised DPW estimates Multiple -45 0.0<br />
Cost Decrease - Align occupancy budget with revised OPM estimates Multiple -7 0.0<br />
Cost Decrease - Recapture a portion <strong>of</strong> cost savings related to closure <strong>of</strong><br />
DCCSA <strong>of</strong> an amount less than 3 percent <strong>of</strong> FY 2009 budget levels<br />
Community Services <strong>Agency</strong> -1,077 0.0<br />
Cost Increase - Align procurement assessment budget with revised OCP<br />
estimates<br />
Multiple 34 0.0<br />
Cost Increase - Provide additional funds to align overtime budget with a<br />
more accurate estimate <strong>of</strong> actual expenditures<br />
Multiple 1,225 0.0<br />
Reduce - Realign and reduce human resources staffing throughout DMH Multiple -820 -11.0<br />
Reduce - Realign staffing within MHA to reduce various vacant<br />
and filled staff positions<br />
Multiple -719 -8.0<br />
Reduce - Reduce clerical and <strong>of</strong>fice support staffing Multiple -518 -10.0<br />
Reduce - Reorganize staffing within <strong>the</strong> <strong>Office</strong> <strong>of</strong> <strong>the</strong> Director; eliminate<br />
various vacant and filled positions<br />
Multiple -658 -7.5<br />
Shift - Shift funding from CCP to CSA to reflect costs <strong>of</strong> operating<br />
portions <strong>of</strong> CSA during <strong>the</strong> first six months <strong>of</strong> FY 2010<br />
Community Contract Providers -3,410 0.0<br />
Shift - Increase reimbursements through billing MCOs for services<br />
provided through school-based mental health program<br />
Mental Health Authority -400 0.0<br />
Shift - Shift funding from CCP to CSA to reflect <strong>the</strong> costs <strong>of</strong> operating<br />
portions <strong>of</strong> CSA during <strong>the</strong> first six months <strong>of</strong> FY 2010<br />
Community Services <strong>Agency</strong> 3,410 40.5<br />
Enhance - Shift - Redirect funding from agency-wide reductions in fixed<br />
costs to MHA to support audits <strong>of</strong> all certified mental health<br />
rehabilitation services providers<br />
(Continued on next page)<br />
Mental Health Authority 250 0.0<br />
Department <strong>of</strong> Mental Health<br />
E-49
Table RMO-5 (Continued)<br />
(dollars in thousands)<br />
FY 2010 Proposed <strong>Budget</strong> and <strong>Financial</strong> Plan<br />
E-50<br />
Program BUDGET FTE<br />
Policy Initiatives and Cost Savings (cont.)<br />
Shift - Maximize Medicaid reimbursements through enhanced Mental Health Authority -1,100 0.0<br />
administrative claiming<br />
Enhance - Shift - Redirect funding from agency-wide reductions in fixed Mental Health Authority 250 0.0<br />
costs to MHA to support audits <strong>of</strong> all certified mental health<br />
rehabilitation services providers<br />
Enhance - Shift - Redirect funding from agency-wide reductions in fixed Mental Health Authority 250 0.0<br />
costs to MHA for an independent analysis <strong>of</strong> construction costs<br />
associated with <strong>the</strong> new mental health hospital<br />
Shift - Increase federal medicaid reimbursements through Mental Health Authority -855 0.0<br />
implementation <strong>of</strong> new billing code for multi-systemic <strong>the</strong>rapy, a form<br />
<strong>of</strong> community-based intervention for adolescents<br />
Enhance - Shift - Redirect funding from agency-wide reductions in fixed Mental Health Authority 250 0.0<br />
costs to MHA to support ongoing technical assistance and management<br />
support<br />
Enhance - Shift - Redirect funding from agency-wide reductions in fixed Mental Health Authority 121 0.0<br />
costs to support <strong>the</strong> Mental Health Rehabilitation Services<br />
Shift - Realize cost efficiencies through collection <strong>of</strong> SSDI payments Saint Elizabeths Hospital -216 0.0<br />
from patients at St. Elizabeths<br />
Cost Decrease - Shift - <strong>Agency</strong>-wide reductions in fixed costs; utilities, Mental Health Authority -1,121 0.0<br />
rent, security, occupancy, and janitorial services to be redirected to MHA<br />
Gap-Closing Initiatives<br />
Reduce - Adjust construction analysis contract <strong>Agency</strong> Management -250 0.0<br />
Reduce - Reduction <strong>of</strong> Pharmacy services Mental Health Authority -150 0.0<br />
Reduce - Reduction <strong>of</strong> contracted security services Saint Elizabeths Hospital -630 0.0<br />
Reduce - Reduction due to <strong>the</strong> closing <strong>of</strong> gate 4 (2700 MLK Jr. Avenue SE) Saint Elizabeths Hospital -90 0.0<br />
Reduce - Reduction <strong>of</strong> Pharmacy services Saint Elizabeths Hospital -600 0.0<br />
Reduce - Outsourcing <strong>of</strong> Laboratory services Saint Elizabeths Hospital -215 -5.0<br />
Reduce - Reduction <strong>of</strong> Contractual Services Saint Elizabeths Hospital -350 0.0<br />
Reduce - Across <strong>the</strong> board FTE reductions Saint Elizabeths Hospital -1,646 -28.1<br />
Reduce - Reduction <strong>of</strong> Overtime Saint Elizabeths Hospital -400 0.0<br />
Reduce - Doctors Group for Government Operated Services Mental Health Authority -440 -6.0<br />
Reduce - Across-<strong>the</strong>-board FTE reductions Mental Health Authority -691 -6.5<br />
Reduce - Reduction <strong>of</strong> Contractual Services Mental Health Authority -1,350 0.0<br />
Reduce - DCCSA Transition Mental Health Authority -1,876 -24.5<br />
Redirect - Redirection from DCCSA Transition Reduction <strong>of</strong> FTEs to MHRS Community Contract Providers 938 0.0<br />
Redirect - Reduction <strong>of</strong> rent for 3846 and 3861 Alabama Avenue, SE Mental Health Authority -385 0.0<br />
Redirect - Reduction in fixed costs for rent at 1250 U Street, NW Mental Health Authority -302 0.0<br />
Redirect - Reduction in telephone costs related to <strong>the</strong> closure <strong>of</strong> <strong>the</strong> DCCSA Mental Health Authority -150 0.0<br />
Reduce - Reduction in energy costs related to <strong>the</strong> closure <strong>of</strong> <strong>the</strong> DCCSA Mental Health Authority -170 0.0<br />
Reduce - Reduction in security services related to <strong>the</strong> closure <strong>of</strong> <strong>the</strong> DCCSA Mental Health Authority -648 0.0<br />
LOCAL FUND: FY 2010 Proposed <strong>Budget</strong> and FTE 191,390 1,240.9<br />
SPECIAL PURPOSE REVENUE FUNDS: FY 2009 Approved <strong>Budget</strong> and FTE<br />
Policy Initiatives and Cost Savings<br />
3,808 37.0<br />
Shift - Increase reimbursements through billing MCOs for services<br />
provided through school-based mental health program<br />
Mental Health Authority 400 0.0<br />
Shift - Realize cost efficiencies through collection <strong>of</strong> SSDI payments <strong>of</strong><br />
patients at St. Elizabeths Hospital<br />
St. Elizabeths Hospital 216 0.0<br />
SPECIAL PURPOSE REVENUE FUNDS: FY 2010 Proposed <strong>Budget</strong> and FTE<br />
(Continued on next page)<br />
4,424 37.0
Table RMO-5 (Continued)<br />
(dollars in thousands)<br />
Program BUDGET FTE<br />
FEDERAL GRANT FUND: FY 2009 Approved <strong>Budget</strong> and FTE<br />
Initial and Baseline Adjustments<br />
1,642 6.5<br />
Net effect <strong>of</strong> salary and benefits changes - Salary funding adjustments<br />
to reflect projected reduction in grants awards.<br />
Multiple Programs -170 -2.5<br />
Intra-<strong>Agency</strong> Changes - Adjustment from projected reduction in grant awards Multiple Programs -250 0.0<br />
FEDERAL GRANT FUND: FY 2010 Proposed <strong>Budget</strong> and FTE 1,222 4.0<br />
FEDERAL MEDICAID PAYMENTS: FY 2009 Approved <strong>Budget</strong> and FTE 3,924 0.0<br />
Initial and Baseline Adjustments<br />
Net effect <strong>of</strong> salary and benefits changes - Salary step and o<strong>the</strong>r Mental Health Authority 189 2.0<br />
Personal Services funding adjustments<br />
Policy Initiatives and Cost Savings<br />
Shift - Maximize Medicaid reimbursements through enhanced Mental Health Authority 1,100 0.0<br />
administrative claiming<br />
Enhance - Shift - Utilize redirect funding from AMP to MHA to support Mental Health Authority 0 7.4<br />
additional flexibility within <strong>the</strong> staffing structure <strong>of</strong> <strong>the</strong> SMHP<br />
FEDERAL MEDICAID PAYMENTS: FY 2010 Proposed <strong>Budget</strong> and FTE 5,213 9.4<br />
PRIVATE GRANT FUNDS: FY 2009 Approved <strong>Budget</strong> and FTE 0 0.0<br />
Initial and Baseline Adjustments<br />
Intra-agency Changes - Adjustment for projected private grants award St. Elizabeths Hospital 117 0.0<br />
PRIVATE GRANT FUNDS: FY 2010 Proposed <strong>Budget</strong> and FTE 117 0.0<br />
INTRA-DISTRICT FUNDS: FY 2009 Approved <strong>Budget</strong> and FTE 9,280 90.9<br />
Initial and Baseline Adjustments<br />
Net effect <strong>of</strong> salary and benefits changes - Projected reductions in Community Services <strong>Agency</strong> -4,220 -57.9<br />
Federal Medicaid payments due to closure <strong>of</strong> <strong>the</strong> DCCSA and <strong>the</strong><br />
shifting <strong>of</strong> federal payments to <strong>the</strong> Department <strong>of</strong> Health Care Finance<br />
Intra-<strong>Agency</strong> Changes - Shift <strong>of</strong> Medicaid funding to DHCF St. Elizabeths Hospital -851 0.0<br />
INTRA-DISTRICT FUNDS: FY 2010 Proposed <strong>Budget</strong> and FTE 4,209 33.0<br />
Gross for RM0 - Department <strong>of</strong> Mental Health 206,576 1,324.3<br />
<strong>Agency</strong> Performance Plan<br />
The agency’s Performance Plan has <strong>the</strong> following<br />
objectives for FY 2010:<br />
Objective 1: Expand <strong>the</strong> range <strong>of</strong> mental health services.<br />
Objective 2: Increase access to mental health services..<br />
Objective 3: Continually improve <strong>the</strong> consistency<br />
and quality <strong>of</strong> mental health services.<br />
Objective 4: Ensure system accountability.<br />
Department <strong>of</strong> Mental Health<br />
E-51
<strong>Agency</strong> Performance Measures<br />
Table RM0-6<br />
FY 2007 FY 2008 FY 2008<br />
Year-End Original Year-End FY 2009 FY 2010 FY 2011<br />
Measure<br />
Objective 1:<br />
Number/percent <strong>of</strong> schools with a school-based<br />
Actual Target Actual Projection Projection Projection<br />
mental health program1 42 48 58 58/23.7% 68/27.6% 78/31.3%<br />
Number <strong>of</strong> new affordable housing units developed<br />
Objective 2:<br />
0 150 0 150 100 150<br />
Total number <strong>of</strong> consumers served (adults/children) 2 9,843/3,101 13,365/5,375 11,431/2,777 13,500/5,525 13,800/5,775 14,000/6,000<br />
Number <strong>of</strong> CPEP/Adult Mobile Crisis Team Visits 3,333/N/A 3,780/500 3,605/N/A 3,780/700 3,850/1,400 4,000/1,800<br />
Crisis stabilization bed utilization3 N/A 75% N/A 80% 85% 90%<br />
Total number <strong>of</strong> adult consumers receiving an 440<br />
ACT service<br />
Objective 3:<br />
Percent <strong>of</strong> patients readmitted to St. Elizabeths<br />
N/A (baseline) 500 500 650 850<br />
Hospital within 30 days <strong>of</strong> discharge<br />
Percent <strong>of</strong> patients readmitted to St. Elizabeths<br />
8.3% 10% 8.5% 9% 8% 6%<br />
Hospital within 180 days discharge<br />
Percent <strong>of</strong> MHRS eligible children discharged from<br />
inpatient psychiatric hospitals who receive a<br />
community-based, non-emergency service within<br />
19.0% 25% 20.80% 23% 22% 20%<br />
7 days <strong>of</strong> discharge4 Percent <strong>of</strong> MHRS eligible adults discharged from<br />
inpatient psychiatric hospitals who receive a<br />
community-based, non-emergency service within<br />
45% 80% 46% 60% 70% 80%<br />
7 days <strong>of</strong> discharge5 Objective 4:<br />
35% 80% 51% 60% 70% 80%<br />
Percent <strong>of</strong> Total Federal Revenue Collected6 Percent <strong>of</strong> Medicaid claims submitted to DHCF<br />
52.8% 55% 50.70%<br />
that are paid 76% 76% 79% 82% 85% 88%<br />
Percentage <strong>of</strong> clean claims adjudicated by DHCF N/A<br />
or MCO within 5 business days <strong>of</strong> submission<br />
Number <strong>of</strong> Dixon exit criteria targets met and<br />
approved for inactive monitoring by <strong>the</strong><br />
77% (revised KPI) --- 95% 95% 98%<br />
Court Monitor 1 10 3 13 15 19<br />
1 The denominator for this calculation (249) is <strong>the</strong> total <strong>of</strong> DCPS and Charter Schools based upon information available on www.dc.gov. It includes 57 schools identified as kindergarten and preschool, elementary, middle,<br />
junior and high schools.<br />
2 Reporting for this indicator is calculated based upon <strong>the</strong> requirements <strong>of</strong> Dixon Exit Criterion #5 (penetration rate for services to children & youth) and criterion #7 (penetration rate for services to adults).<br />
3 This indicator was revised during FY 2008, since DMH does not collect data about <strong>the</strong> number <strong>of</strong> consumers referred to a crisis stabilization bed diverted from an inpatient psychiatric bed. DMH has been reporting utilization<br />
<strong>of</strong> crisis beds throughout FY 2008 and will continue to report on this measure throughout FY 2009.<br />
4 This indicator is also tracked as Dixon Exit Criterion #17. The target for exiting <strong>the</strong> Dixon case is 80%. Targets for FY 2009 and FY 2010 have been adjusted to reflect expected performance based upon performance<br />
throughout FY 2008.<br />
5 This indicator is also tracked as Dixon Exit Criterion #17. The target for exiting <strong>the</strong> Dixon case is 80%. Targets for FY 2009 and FY 2010 have been adjusted to reflect expected performance based upon performance<br />
throughout FY 2008.<br />
6 The information reported for this indicator is calculated in accordance with <strong>the</strong> formula required for reporting on Dixon Exit Criterion #19 (collection <strong>of</strong> federal revenue). The Dixon Court Monitor has found that DMH has<br />
satisfied <strong>the</strong> performance requirement for Dixon and has deemed Exit Criterion #19 inactive. Although DMH is required to continue to report on its performance to <strong>the</strong> Court Monitor; it will no longer report on this indicator<br />
for purposes <strong>of</strong> this performance management plan.<br />
FY 2010 Proposed <strong>Budget</strong> and <strong>Financial</strong> Plan<br />
E-52
Department <strong>of</strong> Health<br />
www.dchealth.dc.gov<br />
Telephone: 202-442-5955<br />
(HC0)<br />
% Change<br />
FY 2008 FY 2009 FY 2010 from<br />
Description Actual Approved Proposed FY 2009<br />
Operating <strong>Budget</strong> $1,878,912,050 $268,072,811 $249,846,193 -6.8<br />
FTEs 1,067.1 911.3 836.0 -8.3<br />
The mission <strong>of</strong> <strong>the</strong> Department <strong>of</strong> Health (DOH) is to promote<br />
healthy lifestyles, prevent illness, protect <strong>the</strong> public from threats to <strong>the</strong>ir<br />
health, and provide equal access to quality healthcare services for all in<br />
<strong>the</strong> District <strong>of</strong> Columbia.<br />
Summary <strong>of</strong> Services<br />
DOH provides programs and services with <strong>the</strong> ultimate<br />
goal <strong>of</strong> reducing <strong>the</strong> burden <strong>of</strong> disease, through<br />
a number <strong>of</strong> mechanisms that center around prevention,<br />
promotion <strong>of</strong> health, and expanding access to<br />
health care. The department provides public health<br />
management and leadership through policy, planning,<br />
evaluation, fiscal oversight, human resource<br />
management, grants and contracts management,<br />
information technology, government relations, risk<br />
management, communication and community relations,<br />
legal oversight, and facilities management. The<br />
department’s performance plan is based on three priority<br />
areas: (1) health and wellness promotion, (2)<br />
HIV/AIDS prevention and awareness, and (3) public<br />
health systems enhancement. Success with <strong>the</strong>se priorities<br />
will be measured in part by <strong>the</strong> performance<br />
measures in this document, but also by <strong>the</strong> many<br />
o<strong>the</strong>r measures <strong>of</strong> performance defined by <strong>the</strong> divisions<br />
within <strong>the</strong> agency.<br />
The agency’s FY 2010 proposed budget is presented<br />
in <strong>the</strong> following tables:<br />
Department <strong>of</strong> Health<br />
E-53
FY 2010 Proposed Gross Funds Operating <strong>Budget</strong>, by Revenue Type<br />
Table HC0-1 contains <strong>the</strong> proposed FY 2010 agency budget compared to <strong>the</strong> FY 2009 approved budget. It also<br />
provides <strong>the</strong> FY 2007 and FY 2008 actual expenditures.<br />
Table HC0-1<br />
(dollars in thousands)<br />
Actual Actual Approved Proposed<br />
Change<br />
from Percent<br />
Appropriated Fund<br />
General Fund<br />
FY 2007 FY 2008 FY 2009 FY 2010 FY 2009 Change*<br />
Local Funds 618,367 667,354 95,335 78,190 -17,145 -18.0<br />
Dedicated Taxes 0 3,932 0 0 0 N/A<br />
Special Purpose Revenue Funds 24,068 11,751 14,375 14,272 -103 -0.7<br />
Total for General Fund 642,434 683,038 109,709 92,461 -17,248 -15.7<br />
Federal Resources<br />
Federal Grant Funds 142,022 137,133 137,096 135,859 -1,236 -0.9<br />
Federal Medicaid Payments 1,017,019 1,034,318 0 0 0 N/A<br />
Total for Federal Resources 1,159,041 1,171,451 137,096 135,859 -1,236 -0.9<br />
Private Funds<br />
Private Grant Funds 74 551 0 319 319 N/A<br />
Total for Private Funds 74 551 0 319 319 N/A<br />
Intra-District Funds<br />
Intra-District Funds 7,459 23,872 21,268 21,206 -62 -0.3<br />
Total for Intra-District Funds 7,459 23,872 21,268 21,206 -62 -0.3<br />
Gross Funds 1,809,008 1,878,912 268,073 249,846 -18,227 -6.8<br />
*Percent Change is based on whole dollars.<br />
Note: If applicable, for a breakdown <strong>of</strong> each Grant (Federal and Private), Special Purpose Revenue type and Intra-District agreement, please refer to<br />
Schedule 80 <strong>Agency</strong> Summary by Revenue Source in <strong>the</strong> Operating Appendices located on <strong>the</strong> <strong>Office</strong> <strong>of</strong> <strong>the</strong> <strong>Chief</strong> <strong>Financial</strong> <strong>Office</strong>r’s website.<br />
FY 2010 Proposed <strong>Budget</strong> and <strong>Financial</strong> Plan<br />
E-54
FY 2010 Proposed Full-Time Equivalents, by Revenue Type<br />
Table HC0-2 contains <strong>the</strong> proposed FY 2010 FTE level compared to <strong>the</strong> FY 2009 approved FTE level by revenue<br />
type. It also provides FY 2007 and FY 2008 actual data.<br />
Table HC0-2<br />
(dollars in thousands)<br />
Actual Actual Approved Proposed<br />
Change<br />
from Percent<br />
Appropriated Fund<br />
General Fund<br />
FY 2007 FY 2008 FY 2009 FY 2010 FY 2009 Change<br />
Local Funds 311.3 340.0 211.5 156.9 -54.6 -25.8<br />
Special Purpose Revenue Funds 72.3 124.1 127.8 121.6 -6.2 -4.8<br />
Total for General Fund 383.6 464.1 339.2 278.5 -60.8 -17.9<br />
Federal Resources<br />
Federal Grant Funds 569.9 572.8 562.1 554.0 -8.1 -1.4<br />
Federal Medicaid Payments 78.3 24.2 0.0 0.0 0.0 N/A<br />
Total for Federal Resources 648.2 597.0 562.1 554.0 -8.1 -1.4<br />
Private Funds<br />
Private Grant Funds 0.0 0.5 0.0 0.0 0.0 N/A<br />
Total for Private Funds 0.0 0.5 0.0 0.0 0.0 N/A<br />
Intra-District Funds<br />
Intra-District Funds 0.0 5.5 10.0 3.5 -6.4 -64.5<br />
Total for Intra-District Funds 0.0 5.5 10.0 3.5 -6.4 -64.5<br />
Total Proposed FTEs 1,031.7 1,067.1 911.3 836.0 -75.3 -8.3<br />
Department <strong>of</strong> Health<br />
E-55
FY 2010 Proposed Operating <strong>Budget</strong>, by Comptroller Source Group<br />
Table HC0-3 contains <strong>the</strong> proposed FY 2010 budget at <strong>the</strong> Comptroller Source group (object class) level<br />
compared to <strong>the</strong> FY 2009 approved budget. It also provides FY 2007 and FY 2008 actual expenditures.<br />
Table HC0-3<br />
(dollars in thousands)<br />
Actual Actual Approved Proposed<br />
Change<br />
from Percent<br />
Comptroller Source Group FY 2007 FY 2008 FY 2009 FY 2010 FY 2009 Change*<br />
11 Regular Pay - Cont Full Time 46,529 48,529 45,334 43,928 -1,406 -3.1<br />
12 Regular Pay - O<strong>the</strong>r 18,717 16,426 14,901 12,493 -2,408 -16.2<br />
13 Additional Gross Pay 515 2,756 5 359 354 7,079.0<br />
14 Fringe Benefits - Curr Personnel 12,012 12,333 10,251 9,113 -1,138 -11.1<br />
15 Overtime Pay 404 656 235 134 -101 -43.0<br />
Subtotal Personal Services (PS) 78,178 80,700 70,726 66,027 -4,699 -6.6<br />
20 Supplies and Materials 15,348 17,237 29,149 28,063 -1,086 -3.7<br />
30 Energy, Comm. and Bldg Rentals 512 304 842 480 -362 -43.0<br />
31 Telephone, Telegraph, Telegram, Etc 2,104 1,162 1,471 1,144 -327 -22.2<br />
32 Rentals - Land and Structures 14,542 18,943 10,908 11,830 922 8.5<br />
33 Janitorial Services 27 25 50 29 -22 -42.7<br />
34 Security Services 3,211 2,223 2,808 3,080 272 9.7<br />
35 Occupancy Fixed Costs 39 101 1,164 347 -817 -70.2<br />
40 O<strong>the</strong>r Services and Charges 3,056 2,785 4,679 3,755 -924 -19.7<br />
41 Contractual Services - O<strong>the</strong>r 197,025 193,267 45,739 39,757 -5,982 -13.1<br />
50 Subsidies and Transfers 1,491,968 1,560,801 99,618 94,751 -4,867 -4.9<br />
70 Equipment & Equipment Rental 3,741 1,366 919 582 -336 -36.6<br />
91 Expense Not <strong>Budget</strong>ed O<strong>the</strong>rs -744 0 0 0 0 N/A<br />
Subtotal Nonpersonal Services (NPS) 1,730,830 1,798,212 197,347 183,819 -13,528 -6.9<br />
Gross Funds 1,809,008 1,878,912 268,073 249,846 -18,227 -6.8<br />
*Percent Change is based on whole dollars.<br />
FY 2010 Proposed <strong>Budget</strong> and <strong>Financial</strong> Plan<br />
E-56
Program Description<br />
The Department <strong>of</strong> Health operates through <strong>the</strong> following<br />
8 programs:<br />
Addiction Prevention and Recovery Administration<br />
(APRA) – prevents and reduces <strong>the</strong> disease <strong>of</strong> addiction<br />
in order to improve health and wellness within<br />
<strong>the</strong> District <strong>of</strong> Columbia by promoting access to<br />
quality prevention, treatment, and recovery support<br />
services.<br />
This program contains <strong>the</strong> following 10 activities:<br />
■ Implementation <strong>of</strong> Drug Treatment Choice –<br />
provides treatment services to District residents;<br />
■ Quality Improvement – provides ongoing oversight<br />
<strong>of</strong> APRA-operated and contractor-operated<br />
substance use disorder treatment providers;<br />
■ Certification & Regulation Services – provides<br />
implementation <strong>of</strong> <strong>the</strong> regulatory review process<br />
pursuant to 29 DCMR, Chapter 23, "Certification<br />
Standards for Substance Abuse Treatment<br />
Facilities and Programs" for certification and ongoing<br />
monitoring <strong>of</strong> compliance with certification<br />
requirements <strong>of</strong> substance abuse use disorder<br />
treatment facilities and programs in <strong>the</strong> District <strong>of</strong><br />
Columbia;<br />
■ APRA Support Services – provides Single State<br />
<strong>Agency</strong> operations and management and also<br />
provides support services;<br />
■ Intake Assessment Referral Center (ARC) –<br />
provides a central access/intake point for substance<br />
use disorder treatment services, and ensures<br />
that every individual seeking treatment is assessed<br />
for <strong>the</strong> appropriate level <strong>of</strong> care and length <strong>of</strong> stay.<br />
Vouchers for <strong>the</strong> Choice in Drug Treatment<br />
Program are obtained at <strong>the</strong> ARC;<br />
■ Acute Detox and Residential Treatment –<br />
medically-managed detoxification services and<br />
residential medically-monitored detoxification<br />
services for District <strong>of</strong> Columbia residents with<br />
substance use disorders;<br />
■ Prevention & Youth Treatment Services –<br />
provides classroom presentations to <strong>the</strong> public<br />
and charter schools, as well as at conferences and<br />
community meetings. OPS funds direct services<br />
through prevention grants to community and<br />
faith-based organizations that deliver science and<br />
evidence-based models. OPS is responsible for<br />
<strong>the</strong> annual compliance checks to ensure that merchants<br />
are not selling tobacco products to minors.<br />
In addition, through <strong>the</strong> Central Intake Division<br />
for Youth (CIDY), APRA provides intervention<br />
assistance for DC youth who may need treatment<br />
referrals for substance use, dependence or addiction<br />
treatment services;<br />
■ Adult Treatment Service – provides intensive<br />
outpatient, continuum <strong>of</strong> care, and psychosocial<br />
services for <strong>the</strong> dually-diagnosed;<br />
■ Women Services – provides <strong>the</strong> delivery <strong>of</strong> safety<br />
net substance use disorders treatment services to<br />
District residents with an intensive women’s<br />
treatment focus; and<br />
■ Special Populations – provides <strong>the</strong> delivery <strong>of</strong><br />
culturally competent services to identified special<br />
populations.<br />
Emergency Health and Medical Services<br />
Administration – plans and coordinates <strong>the</strong> timely<br />
delivery <strong>of</strong> emergency and trauma services and provides<br />
an all-hazards response to public health incidents<br />
for <strong>the</strong> residents, workers, and visitors <strong>of</strong> <strong>the</strong><br />
District <strong>of</strong> Columbia. The program also provides via<br />
<strong>the</strong> Public Health Laboratory Program diagnostic and<br />
analytical testing services to detect and identify biological<br />
and chemical agents that may adversely affect<br />
<strong>the</strong> health and safety <strong>of</strong> <strong>the</strong> public.<br />
This program contains <strong>the</strong> following 2 activities:<br />
■ <strong>Office</strong> Emergency Health & Medical Services –<br />
provides <strong>the</strong> District’s ability to respond to <strong>the</strong><br />
emergency medical needs <strong>of</strong> its visitors and residents.<br />
Responsibilities cover a wide range <strong>of</strong><br />
activities including certification and regulation <strong>of</strong><br />
all EMS activities within <strong>the</strong> city; and<br />
■ Public Health Laboratory – provides analytical<br />
and diagnostic support services for programs<br />
within <strong>the</strong> Department <strong>of</strong> Health, and <strong>the</strong> community,<br />
including free and nonpr<strong>of</strong>it clinics and<br />
o<strong>the</strong>r entities within <strong>the</strong> District. The laboratory<br />
conducts a wide range <strong>of</strong> clinical tests and limited<br />
environmental testing, supports emergency preparedness<br />
testing and training functions, and<br />
issues <strong>the</strong> pre-marital Blue Card (DHS-366) for<br />
couples marrying in <strong>the</strong> District <strong>of</strong> Columbia.<br />
Department <strong>of</strong> Health<br />
E-57
HIV/AIDS Administration – provides a comprehensive,<br />
seamless system <strong>of</strong> care to persons with or at risk<br />
for HIV, STDs, TB, and viral hepatitis (adults) living<br />
in <strong>the</strong> District and <strong>the</strong> Washington DC Eligible<br />
Metropolitan Area so that <strong>the</strong>y can minimize <strong>the</strong>ir<br />
chance <strong>of</strong> infection and live healthier lives.<br />
The program also ensures that federal, regional, and<br />
local resources support <strong>the</strong> health, medical, and<br />
administrative services necessary to guarantee that<br />
people living with HIV in <strong>the</strong> District <strong>of</strong> Columbia<br />
have access to ongoing prevention education, health<br />
and medical care services essential for <strong>the</strong> treatment <strong>of</strong><br />
<strong>the</strong> HIV disease and to reduce <strong>the</strong> HIV, STD, TB<br />
and hepatitis-related morbidity and mortality <strong>of</strong><br />
residents <strong>of</strong> <strong>the</strong> District <strong>of</strong> Columbia by <strong>the</strong> application<br />
<strong>of</strong> sound public health policies, practices,<br />
initiatives, disease surveillance, prevention, and health<br />
interventions.<br />
This program contains <strong>the</strong> following 9 activities:<br />
■ HIV/AIDS Support Services – provides overall<br />
management, planning, and direction and support<br />
for <strong>the</strong> HIV/AIDS, STD, TB and adult<br />
Hepatitis surveillance, prevention, treatment,<br />
care, and control programs. Also, provides<br />
HIV/AIDS information to community organizations<br />
and individuals, coordinates HAA participation<br />
in public events, prepares written and o<strong>the</strong>r<br />
resources for public distribution, and manages<br />
special projects;<br />
■ HIV/AIDS Policy and Planning –provides community<br />
capacity to more effectively respond to <strong>the</strong><br />
HIV/AIDS/STD epidemics through <strong>the</strong> Effi<br />
Barry Program, which provides training and<br />
technical assistance to small Ward-based community<br />
organizations, a social marketing program<br />
aiming to promote health behavior to reduce risk<br />
<strong>of</strong> disease, and a free condom distribution program.<br />
Develops and reviews policy, prepares testimony,<br />
reports and o<strong>the</strong>r written materials for public<br />
distribution, provides HIV/AIDS/STD/TB/<br />
Hepatitis information to government agencies,<br />
community organizations, media and individuals.<br />
Also coordinates participation in public events;<br />
■ HIV Health & Support Services – provides a<br />
comprehensive range <strong>of</strong> primary medical care and<br />
supportive services for persons living with HIV<br />
and AIDS;<br />
FY 2010 Proposed <strong>Budget</strong> and <strong>Financial</strong> Plan<br />
E-58<br />
■ HIV/AIDS Data and Research – provides a comprehensive<br />
picture <strong>of</strong> <strong>the</strong> HIV/AIDS epidemic in<br />
<strong>the</strong> District <strong>of</strong> Columbia for purposes <strong>of</strong> ensuring<br />
that <strong>the</strong> needs <strong>of</strong> people infected with HIV, or at<br />
risk <strong>of</strong> infection, are met. Collaborates with<br />
health care providers and laboratories to collect<br />
and maintain comprehensive HIV/AIDS data in<br />
a confidential and secure manner; analyzing,<br />
interpreting, and distributing epidemiologic<br />
information for use in developing public policy,<br />
planning, and evaluating prevention intervention<br />
and health care services, and supporting funding<br />
requests;<br />
■ Prevention and Intervention Services – provides<br />
comprehensive HIV prevention programs and<br />
services through community organizations to <strong>the</strong><br />
residents <strong>of</strong> <strong>the</strong> District <strong>of</strong> Columbia. Prevention<br />
programs <strong>of</strong>fer a myriad <strong>of</strong> services that include<br />
health education, HIV testing and counseling services,<br />
science-based prevention programs and<br />
o<strong>the</strong>r support services, including condom distribution.<br />
In addition, <strong>the</strong> program monitors organizations<br />
to ensure that quality prevention services<br />
are being delivered through program evaluation<br />
and quality assurance activities, as well as through<br />
<strong>the</strong> provision <strong>of</strong> capacity-building, training, and<br />
technical assistance to sub-grantees;<br />
■ Communicable Disease – provides assistance<br />
with <strong>the</strong> Sexually Transmitted Diseases (STD)<br />
Control Program to prevent and control sexually<br />
transmitted diseases in <strong>the</strong> District <strong>of</strong> Columbia<br />
through <strong>the</strong> provision <strong>of</strong> clinical services, partnerships<br />
with local communities by promoting and<br />
maintaining healthy sexual behavior; <strong>the</strong> program<br />
also conducts surveillance for statistical purposes<br />
to track diseases and partner notification. The TB<br />
Control Program provides direct care services to<br />
District <strong>of</strong> Columbia residents, including clinical<br />
follow-up for active and/or suspected TB cases,<br />
directly observed <strong>the</strong>rapy, preventive <strong>the</strong>rapy,<br />
chest x-rays, contact investigations, and case management;<br />
■ Drug Assistance Program (ADAP) – provides<br />
assistance with deductibles, co-payments, and<br />
health insurance/Medicare Part D premiums.<br />
DC ADAP also provides an entry point for o<strong>the</strong>r<br />
District health programs available to people living<br />
with HIV/AIDS;
■ Grants & Contracts Management – provides<br />
fiscal and administrative monitoring <strong>of</strong> District<br />
and federally appropriated funds in <strong>the</strong> form <strong>of</strong><br />
139 grants and sub-grants to 53 providers. Fiscal<br />
monitoring includes ensuring that grant funds are<br />
expended in accordance with Federal and Local<br />
grant regulations; conducting site visits; providing<br />
technical assistance to our grantees and subgrantees;<br />
and providing continued analysis <strong>of</strong><br />
grant spending to program counterparts; and<br />
■ HIV/AIDS Housing and Supportive Services –<br />
provides housing support, emergency shelter, and<br />
o<strong>the</strong>r related services to help persons living with<br />
HIV and AIDS and <strong>the</strong>ir families achieve independent<br />
living.<br />
Health Care Regulation and Licensing<br />
Administration (HCRLA) – administers all District<br />
and federal laws and regulations governing <strong>the</strong> licensing,<br />
certification, and registration <strong>of</strong> health pr<strong>of</strong>essionals<br />
and health care and human services facilities to<br />
ensure <strong>the</strong> protection <strong>of</strong> <strong>the</strong> health and safety <strong>of</strong> residents<br />
and visitors to <strong>the</strong> District <strong>of</strong> Columbia who<br />
receive services from <strong>the</strong>se facilities and health pr<strong>of</strong>essionals.<br />
This program has operated one full year under<br />
its present structure <strong>of</strong> two administrations: Health<br />
Regulation and Health Pr<strong>of</strong>essional Licensing. The<br />
Bureau <strong>of</strong> Community Hygiene (BCH) inspects <strong>the</strong><br />
food supply and health-related business establishments<br />
such as spas, and enforces animal and rodent<br />
control regulations. HCRLA Support Services provides<br />
policy and administrative guidance to <strong>the</strong><br />
bureaus.<br />
This program contains <strong>the</strong> following 5 activities:<br />
■ Community Hygiene – provides abatement<br />
notices, inspection <strong>of</strong> premises, code enforcement,<br />
premises baited, premises abated, catch<br />
basin larvicided, community education and outreach,<br />
investigation <strong>of</strong> bite cases, issuance <strong>of</strong> dog<br />
and cat licenses, vaccinations, animal adoptions,<br />
spay and neutering, dead animal pick-up, dangerous<br />
dog control services in <strong>the</strong> District;<br />
■ Radiation Program – provides elimination <strong>of</strong><br />
radiation overexposure <strong>of</strong> persons to naturally<br />
occurring and man-made radiation by <strong>the</strong> inspection<br />
<strong>of</strong> Dental x-ray tubes, Medical x-rays, and <strong>the</strong><br />
regulation <strong>of</strong> health physicists, suppliers and<br />
radioactive materials users in <strong>the</strong> District <strong>of</strong><br />
Columbia;<br />
■ Health Regulation Administration –provides<br />
licensure, certification, inspection and compliance<br />
<strong>of</strong> health care facilities and intermediate care facilities<br />
for <strong>the</strong> mentally retarded in <strong>the</strong> District <strong>of</strong><br />
Columbia. The OHCF ensures compliance <strong>of</strong><br />
<strong>the</strong>se facilities with all District and federal health<br />
safety laws and regulations;<br />
■ Health Pr<strong>of</strong>essional License Administration –<br />
provides District and Federal laws and regulations<br />
governing <strong>the</strong> licensing, certification and registration<br />
<strong>of</strong> health care related pr<strong>of</strong>essionals and provides<br />
administrative support to <strong>the</strong> health pr<strong>of</strong>essional<br />
Boards and Advisory Committees that regulate<br />
<strong>the</strong> practice <strong>of</strong> <strong>the</strong>ir respective health pr<strong>of</strong>essions;<br />
and<br />
■ HCRLA Support Services – provides <strong>the</strong> day-today<br />
functions and setting priorities, ensuring<br />
performance measures are achieved.<br />
Center for Policy, Planning and Epidemiology – is<br />
responsible for collecting, preserving and administering<br />
<strong>the</strong> District’s system <strong>of</strong> birth and death records in<br />
accordance with <strong>the</strong> DC Vital Records Act and for<br />
Domestic Partnership registration; providing statistical<br />
and technical assistance and for providing <strong>of</strong>ficial<br />
health data to o<strong>the</strong>r local, state and federal agencies;<br />
surveillance, investigation and control <strong>of</strong> reportable<br />
diseases within <strong>the</strong> District; and for State Health<br />
Planning requirements that include Certificate <strong>of</strong><br />
Need (CON) review and State Health Plan development.<br />
This program contains <strong>the</strong> following 3 activities:<br />
■ State Center Health Statistics – provides for<br />
collection, processing, analyzing, and disseminating<br />
birth and death record information and o<strong>the</strong>r<br />
vital statistics data and information. Also<br />
responsible for <strong>the</strong> statistical analyses <strong>of</strong> <strong>the</strong><br />
data generated from birth, death, and o<strong>the</strong>r vital<br />
records information;<br />
■ State Health Planning and Development –<br />
provides for <strong>the</strong> development <strong>of</strong> <strong>the</strong> District’s<br />
State Health Plan and Annual Implementation<br />
and for reviewing and approving Certificate <strong>of</strong><br />
Need applications that allow health care providers<br />
to establish new services, make certain capital<br />
expenditures, or take o<strong>the</strong>r actions as specified in<br />
<strong>the</strong> law; responsible for monitoring free care<br />
requirements <strong>of</strong> hospitals and o<strong>the</strong>r health care<br />
providers; and<br />
Department <strong>of</strong> Health<br />
E-59
■ Epidemiology & Health Risk Assessment –<br />
provides a national state-based telephone survey<br />
conducted in cooperation with <strong>the</strong> Centers for<br />
Disease Control (CDC). It’s a statistically sound<br />
survey accurately portraying <strong>the</strong> health status <strong>of</strong><br />
District residents and used to assist policy makers<br />
in planning and developing programs to address<br />
<strong>the</strong> health needs <strong>of</strong> District residents.<br />
Community Health Administration – seeks to<br />
improve health outcomes for all residents and to<br />
reduce disparities in health status for vulnerable populations<br />
in <strong>the</strong> District <strong>of</strong> Columbia. The administration<br />
supports access to evidence-based preventive<br />
medical and social services through programs that<br />
serve primarily women, infants, children (including<br />
children with special health care needs) and residents<br />
with a disproportionate burden <strong>of</strong> chronic disease<br />
while fostering public participation in <strong>the</strong> design and<br />
implementation <strong>of</strong> <strong>the</strong>se programs.<br />
This program contains <strong>the</strong> following 7 activities:<br />
■ Cancer & Chronic Disease Prevention – provides<br />
cancer control and prevention initiatives to<br />
reduce <strong>the</strong> high rates <strong>of</strong> cancer-related mortality<br />
among District residents by focusing on treatable<br />
or preventable cancers such as: breast and cervical,<br />
lung, prostate, and colorectal malignancy. Defines<br />
<strong>the</strong> burden <strong>of</strong> diabetes mellitus in <strong>the</strong> District <strong>of</strong><br />
Columbia by developing new approaches to<br />
reduce <strong>the</strong> burden <strong>of</strong> disease in <strong>the</strong> District <strong>of</strong><br />
Columbia; building partnerships that help<br />
streng<strong>the</strong>n infrastructure for diabetes care within<br />
<strong>the</strong> District. Defines <strong>the</strong> burden <strong>of</strong> cardiovascular<br />
disease in <strong>the</strong> District <strong>of</strong> Columbia; developing<br />
partnerships to streng<strong>the</strong>n and increase <strong>the</strong> scope<br />
and effect <strong>of</strong> cardiovascular disease interventions,<br />
as well as population-based strategies to promote<br />
cardiovascular health; promotes smoking cessation<br />
programs in <strong>the</strong> District;<br />
■ Pharmaceutical Procurement & Distribution –<br />
provides a timely and efficient drug delivery rate<br />
<strong>of</strong> greater than 99 percent, and assures that <strong>the</strong><br />
Department <strong>of</strong> Health maintain access to drug<br />
discount programs that will allow as many<br />
District residents as possible access to life-saving<br />
medications. It also provides clinical support formulary<br />
management and quality assurance monitoring<br />
to address <strong>the</strong> needs <strong>of</strong> all programs sup-<br />
FY 2010 Proposed <strong>Budget</strong> and <strong>Financial</strong> Plan<br />
E-60<br />
ported by Pharmaceutical Services in addition to<br />
maintaining a state <strong>of</strong> <strong>the</strong> art inventory control<br />
system capable <strong>of</strong> supporting DOH needs and<br />
also supporting <strong>the</strong> Strategic National Stockpile<br />
(SNS) in <strong>the</strong> event <strong>of</strong> an emergency;<br />
■ Primary Care – provides health pr<strong>of</strong>essional<br />
shortage areas for primary care, dental, and mental<br />
health care services. Supports populationbased<br />
programs to improve access to primary care<br />
services for residents regardless <strong>of</strong> <strong>the</strong>ir ability to<br />
pay for services;<br />
■ Support Services – provides coordination <strong>of</strong> <strong>the</strong><br />
Administration’s efforts to help develop an integrated<br />
community-based health delivery system,<br />
ensures access to preventive and primary health<br />
care, and foster citizen and community participation<br />
towards improving <strong>the</strong> health outcomes <strong>of</strong><br />
women, infants, children (including children with<br />
special health care needs), and o<strong>the</strong>r family members<br />
in <strong>the</strong> District <strong>of</strong> Columbia;<br />
■ Perinatal & Infant Health – provides improved<br />
perinatal outcomes for high-risk pregnant and<br />
parenting women, <strong>the</strong> health and development <strong>of</strong><br />
<strong>the</strong>ir infants into early childhood, as well as <strong>the</strong><br />
health outcomes for children with special healthcare<br />
needs by facilitating access to coordinated primary<br />
and specialty health care and o<strong>the</strong>r services<br />
in partnership with <strong>the</strong>ir families and community<br />
organizations. Its overarching goal is to reduce<br />
infant mortality and perinatal health disparities in<br />
<strong>the</strong> District <strong>of</strong> Columbia primarily through a<br />
home visiting approach;<br />
■ Nutrition and Physical Fitness – provides food,<br />
health and nutrition assessments and intervention,<br />
education and referral services to District<br />
families, infants, children, and seniors to affect<br />
dietary habits, foster physical activity, decrease<br />
overweight and obesity rates and thus improve<br />
health outcomes among <strong>the</strong> population; and<br />
■ Children Adolescent and School Health – provides<br />
improvement for <strong>the</strong> health and well-being<br />
<strong>of</strong> all District pre-school and school-age children<br />
and adolescents. Primarily, <strong>the</strong> group seeks to<br />
enhance access to preventive, dental, primary and<br />
specialty care services for all pre-school and<br />
school-age children, and contribute to <strong>the</strong> development<br />
<strong>of</strong> a coordinated, culturally competent,<br />
family-centered health care delivery system for<br />
this population. In addition, this Bureau seeks to
improve age-appropriate immunizations among<br />
District residents and increase health education<br />
and outreach to District residents. This Bureau<br />
also implements a citywide asthma plan that<br />
includes data collection, public education, access<br />
to appropriate care for asthma and related allergies<br />
in addition to developing and implementing<br />
policy changes and delivery systems, including<br />
preventive measures for asthma control.<br />
<strong>Agency</strong> Management – provides for administrative<br />
support and <strong>the</strong> required tools to achieve operational<br />
and programmatic results. This program is standard<br />
FY 2010 Proposed Operating <strong>Budget</strong> and FTEs, by Program and Activity<br />
for all agencies using performance-based budgeting.<br />
<strong>Agency</strong> <strong>Financial</strong> Operations – provides comprehensive<br />
and efficient financial management services to,<br />
and on behalf <strong>of</strong>, District agencies so that <strong>the</strong> financial<br />
integrity <strong>of</strong> <strong>the</strong> District <strong>of</strong> Columbia is maintained.<br />
This program is standard for all agencies using performance-based<br />
budgeting.<br />
Program Structure Change<br />
The Department <strong>of</strong> Health had no program structure<br />
changes in <strong>the</strong> FY 2010 Proposed <strong>Budget</strong>.<br />
Table HC0-4 contains <strong>the</strong> proposed FY 2010 budget by program and activity compared to <strong>the</strong> FY 2009 approved<br />
budget. It also provides <strong>the</strong> FY 2008 actual data.<br />
Table HC0-4<br />
(dollars in thousands)<br />
Dollars in Thousands Full-Time Equivalents<br />
Change Change<br />
Actual Approved Proposed from Actual Approved Proposed from<br />
Program/Activity<br />
(0001) DHD-Dummy Program<br />
FY 2008 FY 2009 FY 2010 FY 2009 FY 2008 FY 2009 FY 2010 FY 2009<br />
No Activity Assigned 1,817 0 0 0 0.0 0.0 0.0 0.0<br />
SubTotal (0001) DHD-Dummy Program -1,817<br />
(1000) <strong>Agency</strong> Management Support<br />
0 0 0 0.0 0.0 0.0 0.0<br />
(1010) Personnel 1,114 798 1,084 286 6.0 6.0 7.0 1.0<br />
(1017) Labor Management 160 95 111 16 2.0 1.0 1.0 0.0<br />
(1020) Contracting and Procurement 553 1,572 1,209 -363 2.7 6.0 6.0 0.0<br />
(1030) Property Management 7,325 3,837 15,041 11,204 2.9 5.0 4.0 -1.0<br />
(1040) Information Technology 811 437 951 515 7.9 5.0 6.0 1.0<br />
(1055) Risk Management 120 105 126 21 1.0 1.0 1.0 0.0<br />
(1060) Legal 487 45 98 52 2.0 1.0 1.0 0.0<br />
(1070) Fleet 0 4 0 -4 0.0 0.0 0.0 0.0<br />
(1080) Communications 808 369 316 -53 5.8 1.0 2.0 1.0<br />
(1085) Customer Service 798 231 400 169 11.5 5.0 4.0 -1.0<br />
(1087) Language Access 0 158 0 -158 0.0 1.0 0.0 -1.0<br />
(1090) Performance Management 2,627 1,037 2,132 1,095 9.7 10.0 10.0 0.0<br />
Subtotal (1000) <strong>Agency</strong> Management Support<br />
(100F) <strong>Agency</strong> <strong>Financial</strong> Operations<br />
14,803 8,686 21,467 12,781 51.5 42.0 42.0 0.0<br />
(110F) <strong>Agency</strong> Fiscal <strong>Office</strong>r Operations 1,339 748 808 60 5.4 8.0 9.0 1.0<br />
(120F) Accounting Operations 1,479 1,071 1,195 123 13.7 14.5 15.0 0.5<br />
(130F) ACFO 707 767 528 -239 9.0 10.5 6.5 -4.0<br />
(140F) <strong>Agency</strong> Fiscal <strong>Office</strong>r 290 436 406 -29 5.0 4.5 5.0 0.5<br />
Subtotal (100F) <strong>Agency</strong> <strong>Financial</strong> Operations<br />
(2000) Addiction Prevention & Recovery Admin<br />
3,815 3,022 2,937 -85 33.1 37.5 35.5 -2.0<br />
(2070) Implementation <strong>of</strong> Drug Treatment Choice 14,759 12,865 15,636 2,771 0.0 0.0 0.0 0.0<br />
(2080) Quality Improvement 1,095 1,143 1,046 -97 12.0 11.0 10.0 -1.0<br />
(2090) Certification & Regulation Services 890 936 1,031 95 10.0 10.0 9.0 -1.0<br />
(2100) APRA Support Services<br />
(Continued on next page)<br />
5,358 6,574 2,377 -4,197 52.0 17.0 19.0 2.0<br />
Department <strong>of</strong> Health<br />
E-61
Table HC0-4 (Continued)<br />
(dollars in thousands)<br />
Dollars in Thousands Full-Time Equivalents<br />
Change Change<br />
Actual Approved Proposed from Actual Approved Proposed from<br />
Program/Activity FY 2008 FY 2009 FY 2010 FY 2009 FY 2008 FY 2009 FY 2010 FY 2009<br />
(2000) Addiction Prevention & Recovery Admin (cont.)<br />
(2200) Intake Assessment & Referral 2,247 2,460 1,566 -894 21.6 19.0 20.0 1.0<br />
(2300) Acute Detox & Residential Treatment 6,024 5,318 3,457 -1,861 21.0 27.0 9.0 -18.0<br />
(2400) Prevention & Youth Treatment Services 7,513 7,575 3,313 -4,263 14.9 17.0 15.0 -2.0<br />
(2510) Adult Treatment Service 6,485 7,071 6,206 -864 31.5 41.0 30.0 -11.0<br />
(2600) Women's Services 727 958 603 -354 4.2 5.5 8.0 2.5<br />
(2700) Special Populations 417 1,746 1,415 -331 4.7 3.0 4.0 1.0<br />
Subtotal (2000) Addiction Prevention & Recovery Admin 45,515<br />
(2500) Emergency Health and Med Services Admin<br />
46,646 36,651 -9,995 171.8 150.5 124.0 -26.5<br />
(2060) <strong>Office</strong> Emergency Health & Med Services 5,998 5,762 5,922 160 29.0 32.0 38.0 6.0<br />
(2548) Public Health Laboratory 3,436 3,226 2,820 -406 15.8 30.0 25.0 -5.0<br />
Subtotal (2500) Emergency Health and Med Services<br />
(3000) HIV/AIDS Administration<br />
9,434 8,988 8,742 -246 44.8 62.0 63.0 1.0<br />
(3010) HIV/AIDS Support Services 11,669 9,712 6,501 -3,211 59.8 14.9 23.6 8.7<br />
(3015) HIV/AIDS Policy and Planning 1,295 0 1,920 1,920 0.0 0.0 0.0 0.0<br />
(3020) HIV Health & Support Services 37,173 39,778 30,330 -9,447 22.6 28.8 16.3 -12.5<br />
(3030) HIV/AIDS Data and Research 2,115 1,310 2,784 1,474 17.7 20.3 21.9 1.6<br />
(3040) Prevention and Intervention Services 7,539 5,536 9,613 4,078 19.1 27.9 26.8 -1.2<br />
(3052) Communicable Disease 0 4,549 4,929 379 0.0 48.0 48.3 0.3<br />
(3060) Drug Assistance Program (ADAP) 18,958 16,712 12,399 -4,312 5.5 12.5 10.0 -2.5<br />
(3070) Grants and Contracts Management 1,235 1,905 1,516 -388 12.3 13.2 15.8 2.7<br />
(3090) HIV/AIDS Housing and Supportive Services 13,088 14,644 15,052 408 0.0 1.3 2.0 0.7<br />
Subtotal (3000) HIV/AIDS Administration<br />
(4000) Environmental Health Administration<br />
93,072 94,145 85,045 -9,100 136.9 166.9 164.6 -2.3<br />
(4060) Environmental Quality -268 0 0 0 2.0 0.0 0.0 0.0<br />
Subtotal (4000) Environmental Health Administration<br />
(4500) Health Care Regulation & Licensing Admin<br />
-268 0 0 0 2.0 0.0 0.0 0.0<br />
(4070) Community Hygiene 6,640 7,172 6,373 -799 46.4 47.0 46.8 -0.2<br />
(4080) Radiation Program 224 513 329 -183 0.0 5.8 4.0 -1.8<br />
(4090) Health Regulation Administration 7,079 8,002 6,699 -1,303 76.0 66.8 63.0 -3.8<br />
(4200) Health Pr<strong>of</strong>essional License Admin 4,442 5,216 5,471 254 30.8 47.8 44.5 -3.3<br />
(4510) HCRLA Support Services 579 214 504 290 4.0 2.0 4.0 2.0<br />
Subtotal (4500) Health Care Regulation & Licensing<br />
(5000) Primary Care & Prevention Administration<br />
18,964 21,118 19,377 -1,741 157.2 169.3 162.3 -7.1<br />
(4880) Public Health Laboratory 8 0 0 0 8.3 0.0 0.0 0.0<br />
(5020) Communicable Disease 3,752 0 0 0 51.6 0.0 0.0 0.0<br />
(5030) Cancer Health Care 8,679 0 0 0 15.8 0.0 0.0 0.0<br />
(5040) Epidemiology & Health Risk Assessment 1,538 0 0 0 17.1 0.0 0.0 0.0<br />
(5100) PCPA Support Services<br />
(Continued on next page)<br />
9,751 0 0 0 18.1 0.0 0.0 0.0<br />
FY 2010 Proposed <strong>Budget</strong> and <strong>Financial</strong> Plan<br />
E-62
Table HC0-4 (Continued)<br />
(dollars in thousands)<br />
Dollars in Thousands Full-Time Equivalents<br />
Change Change<br />
Actual Approved Proposed from Actual Approved Proposed from<br />
Program/Activity FY 2008 FY 2009 FY 2010 FY 2009 FY 2008 FY 2009 FY 2010 FY 2009<br />
(5000) Primary Care & Prevention Administration (cont.)<br />
(5200) Pharmaceutical Procurement & Distribution 553 0 0 0 6.5 0.0 0.0 0.0<br />
(5300) Primary Care -133 0 0 0 4.8 0.0 0.0 0.0<br />
Subtotal (5000) Primary Care & Prevention Admin<br />
(6000) Medical Assistance Administration<br />
24,149 0 0 0 122.1 0.0 0.0 0.0<br />
(6150) Medicaid Rev 1148 0 0 0 0.0 0.0 0.0 0.0<br />
(6200) MAA Support Services 94,325 0 0 0 23.1 0.0 0.0 0.0<br />
(6210) Program Integrity 1,955 0 0 0 19.8 0.0 0.0 0.0<br />
(6220) Quality Management 1,818 0 0 0 12.0 0.0 0.0 0.0<br />
(6230) Children & Families 103,495 0 0 0 9.0 0.0 0.0 0.0<br />
(6240) Managed Care 337,911 0 0 0 9.0 0.0 0.0 0.0<br />
(6250) Disabilities & Aging 911,221 0 0 0 11.4 0.0 0.0 0.0<br />
(6260) Program Operations 27,146 0 0 0 18.7 0.0 0.0 0.0<br />
((6310) DC Public Schools 17,736 0 0 0 0.0 0.0 0.0 0.0<br />
(6315) DC Chartered Schools 89 0 0 0 0.0 0.0 0.0 0.0<br />
(6320) Mental Health 11,586 0 0 0 0.0 0.0 0.0 0.0<br />
(6340) Child & Family Services -14,862 0 0 0 0.0 0.0 0.0 0.0<br />
(6350) Fire And EMS Services 3,693 0 0 0 0.0 0.0 0.0 0.0<br />
Subtotal (6000) Medical Assistance Adminstration 1,496,263<br />
(6500) Health Care Safety Net Admin<br />
0 0 0 103.0 0.0 0.0 0.0<br />
(6510) Health Care Safety Net Oversight 6,757 0 0 0 10.6 0.0 0.0 0.0<br />
(6520) Health Care Safety Net Patient Care 123,519 0 0 0 0.0 0.0 0.0 0.0<br />
Subtotal (6500) Health Care Safety Net Admin<br />
(8000) Maternal & Family Health Administration<br />
130,276 0 0 0 10.6 0.0 0.0 0.0<br />
(8010) Perinatal & Infant Care 5,386 0 0 0 45.4 0.0 0.0 0.0<br />
(8020) Child Health Service 2,554 0 0 0 41.3 0.0 0.0 0.0<br />
(8030) <strong>Office</strong> <strong>of</strong> Nutrition Programs 17,160 0 0 0 43.4 0.0 0.0 0.0<br />
(8040) MFHA Support Serives 5,464 0 0 0 17.2 0.0 0.0 0.0<br />
(8050) School Health 8,416 0 0 0 15.9 0.0 0.0 0.0<br />
(8055) Adult and Family Health Services 1,105 0 0 0 15.3 0.0 0.0 0.0<br />
Subtotal (8000) Maternal & Family Health Admin 40,083 0 0 0 178.4 0.0 0.0 0.0<br />
(8100) Ctr for Policy, Planning and Epidemiology<br />
(8060) State Center Health Statistics 3,772 3,450 3,606 157 49.9 34.6 36.0 1.5<br />
(8070) State Health Planning and Development 924 972 1,049 77 6.0 5.0 5.0 0.0<br />
(8080) Epidemiology & Health Risk Assessment 0 1,285 413 -872 0.0 3.0 2.0 -1.0<br />
Subtotal (8100) Ctr for Policy, Planning and Epidemiology 4,696<br />
(Continued on next page)<br />
5,707 5,069 -638 55.9 42.6 43.0 0.5<br />
Department <strong>of</strong> Health<br />
E-63
Table HC0-4 (Continued)<br />
(dollars in thousands)<br />
Dollars in Thousands Full-Time Equivalents<br />
Change Change<br />
Actual Approved Proposed from Actual Approved Proposed from<br />
Program/Activity FY 2008 FY 2009 FY 2010 FY 2009 FY 2008 FY 2009 FY 2010 FY 2009<br />
(8500) Community Health Administration<br />
(8501) Communicable Disease 0 0 0 0 0.0 0.0 0.0 0.0<br />
(8502) Cancer and Chronic Disease Prevention 0 4,224 6,842 2,619 0.0 34.0 27.1 -6.9<br />
(8503) Pharmaceutical Procurement & Distributio 0 16,933 16,534 -399 0.0 8.0 6.8 -1.3<br />
(8504) Primary Care 0 12,056 5,044 -7,012 0.0 18.5 4.0 -14.5<br />
(8510) Support Services 0 14,178 6,724 -7,454 0.0 40.0 44.5 4.5<br />
(8511) Perinatal & Infant Health 0 5,548 7,386 1,837 0.0 44.5 56.8 12.3<br />
(8512) Special Health Care Needs 0 1,073 0 -1,073 0.0 10.0 0.0 -10.0<br />
(8513) Nutrition and Physical Fitness 0 15,543 17,287 1,744 0.0 42.5 28.5 -14.0<br />
(8514) Children, Adolescent and School Health 0 9,107 10,699 1,592 0.0 28.0 33.0 5.0<br />
(8515) Environmental Hazards & Injury Preventn 0 1,100 44 -1,057 0.0 15.0 1.0 -14.0<br />
Subtotal (8500) Community Health Administration 0 79,762 70,559 -9,203 0.0 240.5 201.6 -39.0<br />
(9960) Yr End Close<br />
No Activity Assigned -73 0 0 0 0.0 0.0 0.0 0.0<br />
Subtotal (9960) Yr End Close -73 0 0 0 0.0 0.0 0.0 0.0<br />
Total Proposed Operating <strong>Budget</strong> 1,878,912 268,073 249,846 -18,227 1,067.1 911.3 836.0 -75.3<br />
(Change is calculated by whole numbers and numbers may not add up due to rounding).<br />
Note: For more detailed information regarding <strong>the</strong> proposed funding for <strong>the</strong> activities within this agency’s programs, please see Schedule 30-PBB Program<br />
Summary By Activity in <strong>the</strong> FY 2010 Operating Appendices located on <strong>the</strong> <strong>Office</strong> <strong>of</strong> <strong>the</strong> <strong>Chief</strong> <strong>Financial</strong> <strong>Office</strong>r’s website.<br />
FY 2010 Proposed <strong>Budget</strong> and <strong>Financial</strong> Plan<br />
E-64
Major Baseline Adjustments, Cost Savings<br />
and Policy Initiatives<br />
Initial Adjustments: The following adjustments were<br />
made in Local funds: a net increase <strong>of</strong> $2,887,677 for<br />
fixed cost in multiple programs; an increase <strong>of</strong><br />
$2,642,399 in contractual services in multiple programs;<br />
and a decrease <strong>of</strong> $6,444,498 in subsidies and<br />
transfers ($1,550,000 for nonrecurring cost and<br />
$4,894,498 for o<strong>the</strong>r funding initiatives to include<br />
Care and Treatment Services, Women with Children<br />
in APRA sub-grant and GU Breast Cancer Center. In<br />
Special Purpose Revenue funds, <strong>the</strong> agency reduced<br />
$712,466 in multiple programs for contractual services.<br />
In Federal Grant funds, <strong>the</strong> agency reduced<br />
$1,467,118 in multiple programs for supplies. In<br />
Intra-District funds, <strong>the</strong> agency reduced $1,148,720<br />
in multiple programs for subsidies and transfers.<br />
Baseline Adjustments: The Department <strong>of</strong> Health<br />
had a reduction <strong>of</strong> $969,759 in <strong>the</strong> Community<br />
Health Administration program for contractual services<br />
due to <strong>the</strong> absence <strong>of</strong> a signed MOU or letter <strong>of</strong><br />
intent for <strong>the</strong> School Health Nursing program and<br />
Immunization program.<br />
Transfers: While <strong>the</strong> proposed budget does not transfer<br />
programs to DOH from o<strong>the</strong>r agencies, it does<br />
make a number <strong>of</strong> budget-neutral changes within<br />
DOH to more accurately assign spending to <strong>the</strong><br />
proper programs. These changes include a shift <strong>of</strong><br />
$442,482 to Community Health Administration<br />
(CHA) to account for a revised fixed cost assessment<br />
that had been added to <strong>the</strong> HIV/AIDS (HAA) budget.<br />
The budget also transfers $700,000 within HAA<br />
to support <strong>the</strong> technical assistance contract and community<br />
sub grants associated with <strong>the</strong> Effi Slaughter<br />
Barry HIV/AIDS Initiative.<br />
FY 2010 also includes a realignment <strong>of</strong> several<br />
fixed cost commodities shifting all funding to <strong>the</strong><br />
<strong>Agency</strong> Management Program and several technical<br />
adjustments. The agency shifted $4,500,000 in supplies<br />
for ADAP drug purchases from <strong>the</strong> HAA<br />
Support Services to <strong>the</strong> HAA Drug Assistance<br />
Program. In <strong>the</strong> CHA program, $4,236,980 was<br />
shifted for primary care service contracts from <strong>the</strong><br />
<strong>Office</strong> <strong>of</strong> <strong>the</strong> Senior Deputy Director to <strong>the</strong> Bureau <strong>of</strong><br />
Primary Care, $100,000 for a primary care shortage<br />
designation contract from <strong>the</strong> Bureau <strong>of</strong> Cancer and<br />
Chronic Disease to <strong>the</strong> Bureau <strong>of</strong> Primary Care and<br />
$1,000,000 from <strong>the</strong> Bureau <strong>of</strong> Primary Care to <strong>the</strong><br />
Bureau <strong>of</strong> Cancer and Chronic Disease respectively.<br />
Policy Initiatives: The FY 2010 budget for DOH<br />
seeks to utilize available resources to maximize <strong>the</strong><br />
agency’s impact on <strong>the</strong> core public health needs <strong>of</strong> <strong>the</strong><br />
District. In some cases, such as within DOH’s<br />
Addiction, Prevention and Recovery Administration<br />
(APRA), this effort will include a significant realignment<br />
in staffing as <strong>the</strong> agency shifts some services to<br />
quality community providers. These changes will<br />
allow <strong>the</strong> agency to streng<strong>the</strong>n and expand community-based<br />
services, while allowing DOH to maintain<br />
its funding and oversight role. APRA will establish a<br />
contract with a qualified provider to run <strong>the</strong> District’s<br />
detoxification center and referral and assessment services,<br />
eliminating 16 locally funded positions within<br />
its FY 2010 budget. APRA will also realign its<br />
administrative staffing, eliminating an additional 11.5<br />
positions. Taken toge<strong>the</strong>r, <strong>the</strong>se realignments will<br />
save <strong>the</strong> District $2,127,474 in FY 2010, enabling<br />
APRA to enhance its support and oversight <strong>of</strong> community-based<br />
organizations that provide treatment,<br />
prevention, and support services to District residents<br />
fighting addiction.<br />
DOH has received additional funding for several<br />
policy initiatives to include, subsidies and transfers,<br />
one-time cost and a $16,000 transfer from contracts<br />
to support <strong>the</strong> HEPRA personal services cost <strong>of</strong> 0.9<br />
FTE for a Supervisory Medical <strong>Office</strong>r. The agency<br />
received $619,000 to security fixed cost and<br />
$467,000 in subsidies and transfers to support any<br />
unanticipated fixed costs in <strong>the</strong> <strong>Agency</strong> Management<br />
Program (AMP) and $1,300,000 in fixed cost savings<br />
from AMP to CHA. Additional program changes to<br />
APRA and CHA include a $150,000 grant to support<br />
<strong>the</strong> Crystal Meth Working group for substance<br />
abuse programs, and $90,000 to support technical<br />
assistance projects as APRA undergoes programmatic<br />
realignment during FY 2010. Several programs have<br />
been realigned and impacted by <strong>the</strong> addition <strong>of</strong> <strong>the</strong>se<br />
funds.<br />
The agency received funding for five one-time<br />
expenditures and NIF funds to support several projects:<br />
a $250,000 grant to <strong>the</strong> Capital Breast Care<br />
Center, $50,000 for <strong>the</strong> Mautner Project, $100,000<br />
to Joseph’s House, $50,000 to <strong>the</strong> Reeves Recovery<br />
Group, and $250,000 for <strong>the</strong> DC Central Kitchen.<br />
Transfers from NIF funds include $100,000 to <strong>the</strong><br />
Concerned Citizens on Alcohol and Drug Abuse,<br />
$75,000 to Ward 8 Clean and Sober and $100,000 to<br />
Department <strong>of</strong> Health<br />
E-65
<strong>the</strong> National Kidney Foundation. Finally,<br />
$2,500,000 and $250,000 were provided to support<br />
emergency operating loans for community health<br />
clinics and Planned Parenthood for sex education<br />
programs for District youth respectively. All <strong>the</strong>se initiatives<br />
will allow <strong>the</strong> agency to continue to support<br />
programs and priority services. All grantees and<br />
amounts listed in this budget are subject to final<br />
approval in <strong>the</strong> Fiscal Year 2010 <strong>Budget</strong> Support Act<br />
<strong>of</strong> 2009, which supersedes this listing upon its effective<br />
date.<br />
Cost Savings: The DOH budget will eliminate 5.1<br />
vacant positions throughout <strong>the</strong> agency, saving<br />
$357,406. The agency will also eliminate 10.25 currently<br />
filled administrative positions, saving<br />
$958,140. The HIV/AIDS Administration (HAA)<br />
will save an additional $189,453 by shifting two positions<br />
from Local funds to Federal funds. Including<br />
<strong>the</strong> APRA changes described above, <strong>the</strong> staffing<br />
realignment throughout DOH totals a reduction <strong>of</strong><br />
42.85 FTEs, and a Local Fund savings <strong>of</strong> $3,632,473.<br />
This proposed budget will achieve additional efficiencies<br />
within its nonpersonal services budget.<br />
The budget proposes a net reduction <strong>of</strong> $2,390 for<br />
utilities, telecommunications, rent and janitorial in<br />
multiple programs. DOH will save $3,050,000 within<br />
<strong>the</strong> Community Health Administration (CHA) by<br />
redesigning funding mechanisms for various outpatient<br />
care contracts and by emphasizing accurate and<br />
timely billing <strong>of</strong> insurance. CHA will also consolidate<br />
prevention grants for several major diseases – including<br />
diabetes, obesity, and cardiovascular disease – into<br />
a single chronic disease prevention grant program. By<br />
focusing <strong>the</strong>se funds into a unified program, CHA<br />
will support more comprehensive, cross-cutting disease<br />
prevention interventions to maximize impact,<br />
while reducing overall costs. CHA will also save<br />
$327,654 through its efforts to designate medically<br />
underserved areas and by eliminating unallocated<br />
grant funds within <strong>the</strong> Bureau <strong>of</strong> Primary Care.<br />
Nei<strong>the</strong>r action will result in a reduction in city services.<br />
CHA will similarly employ efficiencies and<br />
build on past successes to save $54,161 in its asthma<br />
prevention and treatment grant funding. CHA will<br />
also utilize carryover funds from previous years to<br />
maintain its health pr<strong>of</strong>essional loan program, allowing<br />
$100,000 in Local Fund savings in FY 2010.<br />
To achieve additional savings, CHA will work<br />
with providers that currently receive Local funds to<br />
FY 2010 Proposed <strong>Budget</strong> and <strong>Financial</strong> Plan<br />
E-66<br />
perform oral health exams at local schools and day<br />
care programs. CHA will require that providers submit<br />
Medicaid claims for services when possible, lessening<br />
<strong>the</strong> need for local dollars and saving <strong>the</strong> District<br />
$100,000 in FY 2010. In addition, HAA will save<br />
$480,000 by reducing spending on <strong>of</strong>fice supplies<br />
and maximizing <strong>the</strong> use <strong>of</strong> Federal funds to pursue<br />
HIV/AIDS surveillance efforts. APRA will save<br />
$776,000 by scaling back several contracts, reducing<br />
expenditures on janitorial services, consulting fees, IT<br />
services, food services, and various contracts that supported<br />
a model treatment program that closed on<br />
December 31, 2008. Also reduced was $14,000 in<br />
supplies to better align <strong>the</strong> FY 2010 budget with FY<br />
2009 spending trends and $26,000 in o<strong>the</strong>r services<br />
and charges. None <strong>of</strong> <strong>the</strong>se reductions will affect services<br />
currently <strong>of</strong>fered by APRA. APRA will also<br />
reduce by $180,405, funding for a program that provides<br />
capacity building grants to organizations that<br />
also receive fee-for-service payments from APRA to<br />
provide treatment services.<br />
Likewise, DOH’s Center for Policy, Planning and<br />
Epidemiology (CPPE) will reduce costs by eliminating<br />
a $250,000 technical support contract, as well as<br />
$80,000 <strong>of</strong> unutilized funding designated for continuous<br />
quality improvements but not necessary to support<br />
DOH programs. DOH will save $50,000<br />
through various cost efficiencies, including <strong>the</strong> publication<br />
<strong>of</strong> documents electronically ra<strong>the</strong>r than in hard<br />
copy. Finally, DOH’s <strong>Office</strong> <strong>of</strong> <strong>the</strong> Director will<br />
reduce its NPS expenditures by $60,205.<br />
This budget also adds $228,232 in O-type funds<br />
to various DOH programs to account for revised revenue<br />
estimates. The budget also contains a $71,796<br />
reduction to align funding with a recent OCP assessment<br />
<strong>of</strong> FY 2010 procurement costs. Finally, <strong>the</strong><br />
budget proposes a net reduction <strong>of</strong> $368,530 to<br />
account for revised electricity, telecommunications,<br />
fleet, and occupancy estimates.<br />
Protected Programs: In FY 2010, DOH will continue<br />
to pursue an aggressive, comprehensive strategy to<br />
combat HIV and AIDS in <strong>the</strong> District. This includes<br />
maintaining funding for <strong>the</strong> District’s newly developed<br />
needle exchange grant program, which in 2008<br />
helped remove 130,000 used needles from District<br />
streets and refer nearly 600 clients to HIV counseling<br />
and testing. HAA will also disperse over $5,000,000<br />
in o<strong>the</strong>r grant funds for various high-impact prevention,<br />
screening, and treatment programs.
This budget also protects efforts to improve reproductive<br />
health outcomes and <strong>the</strong> reduction <strong>of</strong> infant<br />
mortality. DOH will continue to fund efforts within<br />
<strong>the</strong> agency and in <strong>the</strong> community to send nurses and<br />
family support workers to vulnerable pregnant<br />
women and new mo<strong>the</strong>rs. This budget includes $1<br />
million for this purpose, as well as $400,000 to maintain<br />
targeted pregnancy prevention programs for<br />
District youth. DOH’s budget also preserves funding<br />
to maintain school nurses staffing within all<br />
DCPS and charter schools currently served by <strong>the</strong><br />
program. The program will achieve savings <strong>of</strong><br />
$500,000 by limiting growth in additional schools.<br />
Stimulus: CHA’s resources for immunization programs<br />
will grow by $865,500 in this budget, <strong>the</strong> result<br />
<strong>of</strong> federal stimulus funding approved by Congress.<br />
CHA will use those funds to expand upon recent success<br />
at increasing immunization rates among DCPS<br />
students. The program will realign its resources to<br />
focus on subpopulations that display lower immunization<br />
rates, allowing $17,000 in Local Fund savings<br />
and additional resources to support <strong>the</strong> District’s<br />
immunization registry.<br />
Gap-Closing Initiatives: The Department <strong>of</strong> Health<br />
(DOH) will achieve additional cost savings in FY<br />
2010 by fur<strong>the</strong>r reducing various expenditures on<br />
supplies, equipment, furniture and fixtures, and o<strong>the</strong>r<br />
operating expenses throughout <strong>the</strong> agency. These<br />
reductions will include savings <strong>of</strong> $55,000 by reducing<br />
a maintenance and technical assistance contract to<br />
account for lower staffing levels throughout <strong>the</strong><br />
agency. The DOH will reduce spending on various<br />
furniture, equipment, and supplies to save $125,982<br />
throughout <strong>the</strong> agency. The budget would reduce<br />
various training, postage and travel spending by<br />
$61,000.<br />
The HIV/AIDS Administration HAA would save<br />
$50,000 by eliminating direct donations to various<br />
special events, and $75,000 by maintaining its current<br />
testing procedures for tuberculosis ra<strong>the</strong>r than<br />
implementing a new system. HAA’s budget also calls<br />
for a reduction <strong>of</strong> one administrative position, saving<br />
$120,350 in Local Funds. The District will achieve<br />
$752,663 in savings by aligning spending on<br />
HIV/AIDS pharmaceuticals to more closely meet<br />
projected demand in <strong>the</strong> coming fiscal year, without<br />
denying services to residents who use <strong>the</strong> program.<br />
The DOH will also work closely with <strong>the</strong> Health<br />
Care Finance <strong>Agency</strong> (HCFA) to optimize <strong>the</strong> federal<br />
funding available for <strong>the</strong>se programs as demand<br />
rises in future years.<br />
The Health, Regulation and Licensing<br />
Administration (HRLA) budget would shift its Safe<br />
Rx contract into Special Revenue Funds, saving<br />
$349,278 in Local Funds. Likewise, HRLA would<br />
shift 4.91 FTE into Special Revenue Funds, saving<br />
$490,282. The Community Health Administration<br />
would shift 4 positions into Federal Funds, savings<br />
$399,098 in Local Funds. These positions are<br />
responsible for monitoring federal grants and carrying<br />
out various administrative duties related to federallyfunded<br />
programs. CHA will also reduce repair and<br />
maintenance costs by $24,411 in FY 2010. CHA’s<br />
budget would reduce contract costs by $100,000 by<br />
utilizing in-house personnel to identify health care<br />
shortage areas, as required by federal programs in<br />
underserved areas <strong>of</strong> <strong>the</strong> District. Ano<strong>the</strong>r $250,000<br />
in savings will be generated by reducing various IT<br />
contracts throughout <strong>the</strong> agency.<br />
DOH will also save $2,040,000 in Local funds<br />
and $275,000 in Intra-District funds by reducing<br />
non-competitive, dedicated grants.<br />
Finally, DOH will realign its spending plan for<br />
<strong>the</strong> Community Health Care Financing Fund to<br />
reflect <strong>the</strong> ongoing difficult budget situation, while<br />
maintaining its commitment to ongoing projects<br />
designed to improve health care access in underserved<br />
parts <strong>of</strong> <strong>the</strong> District. This realignment will provide<br />
$4.9 million to help close <strong>the</strong> FY 2010 budget gap.<br />
Department <strong>of</strong> Health<br />
E-67
FY 2009 Approved <strong>Budget</strong> to FY 2010 Proposed <strong>Budget</strong>, by Revenue Type<br />
Table HC0-5 itemizes <strong>the</strong> changes by revenue type between <strong>the</strong> FY 2009 approved budget and <strong>the</strong> FY 2010 proposed<br />
budget. The four categories <strong>of</strong> changes reflected in this table are: (1) changes to <strong>the</strong> baseline budget (includes<br />
agency request), (2) changes representing cost savings or efficiencies, (3) changes related to policy initiatives, and (4)<br />
changes to specifically address <strong>the</strong> projected revenue shortfall.<br />
Table HC0-5<br />
(dollars in thousands)<br />
Program BUDGET FTE<br />
LOCAL FUND: FY 2009 Approved <strong>Budget</strong> and FTE 95,335 211.5<br />
Initial and Baseline Adjustments<br />
Reduction for nonrecurring costs - Reduction in Subsidies and Transfers Multiple -1,550 0.0<br />
Net effect <strong>of</strong> fixed cost adjustments - Revise Fixed Cost estimates for Multiple 2,888 0.0<br />
Energy, Telecom, Rent, Janitorial, Security, and Occupancy<br />
Net effect <strong>of</strong> salary and benefits changes - Reduction <strong>of</strong> Personal Services Multiple -154 0.0<br />
Intra-<strong>Agency</strong> Changes - Revise supplies Multiple 508 0.0<br />
Intra-<strong>Agency</strong> Changes - Revise O<strong>the</strong>r Services and Charges Multiple 176 0.0<br />
Intra-<strong>Agency</strong> Changes - Revise Contractual Services Multiple 2,642 0.0<br />
Intra-<strong>Agency</strong> Changes - Reduction in Subsidies & Transfers Multiple -4,894 0.0<br />
Intra-<strong>Agency</strong> Changes - Reduction in Equipment Multiple -167 0.0<br />
Baseline Adjustments: Revise Contractual Services due to new fixed HIV/AIDS Administration 442 0.0<br />
cost from <strong>the</strong> January revised estimate<br />
Baseline Adjustments: Net effect <strong>of</strong> fixed cost adjustments - Revise Fixed Community Health Administration -442 0.0<br />
Cost estimates for Energy, Rent, Janitorial, Security, Occupancy, and Fleet<br />
Policy Initiatives and Cost Savings<br />
Cost Decrease - Reduction <strong>of</strong> Contractual Services to <strong>of</strong>fset 0.9 FTE <strong>Agency</strong> Management Support -16 0.0<br />
Cost Increase - Support any unanticipated fixed cost <strong>Agency</strong> Management Support 467 0.0<br />
Cost Decrease - O<strong>the</strong>r Services & Charges Addiction Prevention &<br />
Recovery Admin<br />
-26 0.0<br />
Cost Increase - Support grant for Crystal Meth Working group and Addiction Prevention &<br />
Recovery Admin<br />
240 0.0<br />
One-Time - Joseph's House to assist with operating cost Addiction Prevention &<br />
Recovery Admin<br />
100 0.0<br />
One-Time - Reeves Recovery Group Addiction Prevention &<br />
Recovery Admin<br />
50 0.0<br />
Reduce - Eliminate lunch services within APRA's assessment and Addiction Prevention & -73 0.0<br />
referral center. Recovery Admin<br />
Reduce - Reduce various contracts due to closure <strong>of</strong> model treatment Addiction Prevention & -375 0.0<br />
program on Dec. 31, 2008. Recovery Admin<br />
Net effect <strong>of</strong> salary and benefits changes - Fully fund <strong>the</strong> Supervisory Emergency Health and 16 0.1<br />
Medical <strong>Office</strong>r. Med Services Admin<br />
Cost Increase - Support critical health care programs and services Community Health Administration 1,300 0.0<br />
One-Time - Grant to Bread for <strong>the</strong> City Community Health Administration 250 0.0<br />
One-Time Grant - Capital Breast Care Center Community Health Administration 250 0.0<br />
One-Time Grant - Mautner Project Community Health Administration 50 0.0<br />
Net effect <strong>of</strong> fixed cost adjustments - <strong>Agency</strong>-wide reduction to Utilities,<br />
Communication, Rent & Janitorial<br />
Multiple -2,390 0.0<br />
Net effect <strong>of</strong> fixed cost adjustments - Security Increase Multiple 619 0.0<br />
Cost decrease - Reduce various administrative costs within AMP/<strong>Office</strong><br />
<strong>of</strong> <strong>the</strong> Director<br />
<strong>Agency</strong> Management Support -60 0.0<br />
Cost Decrease - Supplies Addiction Prevention &<br />
Recovery Admin<br />
-14 0.0<br />
Cost decrease - Realign administrative and program staffing within APRA Addiction Prevention &<br />
Recovery Admin<br />
-1,058 -11.5<br />
Cost decrease - Reduce janitorial contracts at APRA. Addiction Prevention &<br />
Recovery Admin<br />
-225 0.0<br />
Optimize - Reorganize APRA detoxification center and assessment Addiction Prevention & -1,070 -16.0<br />
services; Shift program from direct service provision to a contract with a<br />
quality private provider.<br />
(Continued on next page)<br />
Recovery Admin<br />
FY 2010 Proposed <strong>Budget</strong> and <strong>Financial</strong> Plan<br />
E-68
Table HC0-5 (Continued)<br />
(dollars in thousands)<br />
Program BUDGET FTE<br />
Policy Initiatives and Cost Savings (cont.)<br />
Reduce - Realign and reduce capacity building grants for some Addiction Prevention & -180 0.0<br />
providers that also receive fee for service payments to provide substance Recovery Admin<br />
abuse treatment services.<br />
Reduce - Reduce expenditures on outside IT support. Addiction Prevention & -50 0.0<br />
Recovery Admin<br />
Reduce - Reduce use <strong>of</strong> outside consultants to write grants and perform Addiction Prevention & -53 0.0<br />
administrative work within APRA. Recovery Admin<br />
Cost savings - Reduce <strong>of</strong>fice supplies spending within HAA. HIV/AIDS Administration -100 0.0<br />
Shift - Identify efficiencies within HIV surveillance to more successfully HIV/AIDS Administration -380 0.0<br />
utilize federal funding.<br />
Eliminate - Eliminate technical support contracts tied to CPPE; perform Ctr For Policy, Planning & -300 0.0<br />
technical support within DOH. Epidemiology<br />
Cost decrease - Eliminate unallocated grant funds within Primary Care Bureau. Community Health Administration -260 0.0<br />
Cost decrease - Identify cost efficiencies within contracts used to fulfill Community Health Administration -68 0.0<br />
federal administrative requirements related to medically underserved areas.<br />
Cost decrease - Reassess and realign contracts with primary care Community Health Administration -3,050 0.0<br />
providers to align spending with current health care needs and costs.<br />
Cost decrease - Refocus immunization program onto underserved age Community Health Administration -17 0.0<br />
groups due to high success rate serving school-aged population.<br />
Cost decrease - Use carryover funds from FY 2009 to support expenses <strong>of</strong> Community Health Administration -100 0.0<br />
<strong>the</strong> health pr<strong>of</strong>essional loan repayment program.<br />
Cost reduction - Manage oral health contracts to incentivize providers to Community Health Administration -100 0.0<br />
more fully claim available Medicaid payments.<br />
Reduce - Consolidate various disease prevention funds into single Community Health Administration -2,500 0.0<br />
metabolic disease grant program; reduce expenditures <strong>of</strong> combined program<br />
Reduce - Maintain DOH school nurse staffing in all DCPS and charter Community Health Administration -500 0.0<br />
schools currently served, while limiting expansion to additional schools.<br />
Reduce - Reduce previously unused funding for continuous quality Community Health Administration -80 0.0<br />
improvement efforts.<br />
Reduce - Scale back grant program to increase adherence to asthma Community Health Administration -54 0.0<br />
guideline by health care providers.<br />
Cost decrease - Align electricity budget with revised OPM estimates. Multiple -21 0.0<br />
Cost decrease - Align fleet budget with revised DPW estimates. Multiple -71 0.0<br />
Cost decrease - Align occupancy budget with revised OPM estimates. Multiple -33 0.0<br />
Cost decrease - Align procurement assessment budget with revised Multiple -72 0.0<br />
OCP estimates.<br />
Cost decrease - Align telecom budget with revised OCTO estimate. Multiple -244 0.0<br />
Cost decrease - Eliminate various vacant positions throughout DOH. Multiple -357 -5.1<br />
Reduce - Realignment and reduction <strong>of</strong> various administrative, Multiple -836 -7.5<br />
program, and financial management staffing across DOH.<br />
Reduce - Reduce clerical and <strong>of</strong>fice support positions across DOH. Multiple -123 -2.8<br />
Shift - Shift positions within HIV/AIDS Administration from local to HIV/AIDS Administration -189 -2.0<br />
federal funding.<br />
Gap-Closing Initiatives<br />
Shift - Shift Safe RX Contract to O-type Health Care Regulation & Licensing -349 0.0<br />
Cost Decrease - Reduce travel expenses Community Health Administration -21 0.0<br />
Cost Decrease - Reduce maintenance and technical assistance to<br />
account for recent staffing reductions<br />
Various -55 0.0<br />
Cost Decrease - Reduce expenses on furniture and fixtures Various -63 0.0<br />
Cost Decrease - Reduce use <strong>of</strong> various supplies <strong>Agency</strong> <strong>Financial</strong> Operations -1 0.0<br />
Cost Decrease - Reduce travel expenses <strong>Agency</strong> <strong>Financial</strong> Operations -6 0.0<br />
Cost Decrease - Reduce Equipment Purchase <strong>Agency</strong> <strong>Financial</strong> Operations -4 0.0<br />
Cost Decrease - Eliminate one administrative support FTE within HAA HIV/AIDS Administration -120 -1.0<br />
Cost Decrease - Reduce employee training costs HIV/AIDS Administration -15 0.0<br />
Cost Decrease - Reduce financial assistance for certain event<br />
(Continued on next page)<br />
HIV/AIDS Administration -50 0.0<br />
Department <strong>of</strong> Health<br />
E-69
Table HC0-5 (Continued)<br />
(dollars in thousands)<br />
FY 2010 Proposed <strong>Budget</strong> and <strong>Financial</strong> Plan<br />
E-70<br />
Program BUDGET FTE<br />
Gap Closing Initiatives (cont)<br />
Cost Decrease - Maintain current TB testing systems HIV/AIDS Administration -75 0.0<br />
Shift - Re-align various HRLA positions from Local to O-type Funds Health Care Regulation & Licensing -490 -5.0<br />
Admin<br />
Cost Decrease - Reduce postage costs in CHA Community Health Administration -20 0.0<br />
Cost Decrease - Reduce equipment expenditures in CHA Community Health Administration -49 0.0<br />
Cost Decrease - Reduce supply expenditures in CHA Community Health Administration -10 0.0<br />
Cost Decrease - Reduce contract costs by utilizing in-house personnel to Community Health Administration -100 0.0<br />
identify health care shortage areas<br />
Shift - Re-align grant monitoring and administrative positions from Community Health Administration -399 -4.0<br />
Local to Federal Funds<br />
Cost Decrease - Reduce costs <strong>of</strong> various IT Contracts Community Health Administration -250 0.0<br />
Cost Decrease - Reduce repairs and maintenance costs at CHA Community Health Administration -24 0.0<br />
Cost Decrease - Reduce Local Fund dollars set aside for HIV HIV/AIDS Administration -753 0.0<br />
pharmacuticals which will not be needed to meet demand in FY 2010.<br />
Cost Decrease - Reduce dedicated grants Multiple -2,040 0.0<br />
LOCAL FUND: FY 2010 Proposed <strong>Budget</strong> and FTE 78,189 156.7<br />
SPECIAL PURPOSE REVENUE FUNDS: FY 2009 Approved <strong>Budget</strong> and FTE 14,375 127.8<br />
Initial and Baseline Adjustments<br />
Net effect <strong>of</strong> fixed cost adjustments - Revised Fixed Cost estimates for Multiple 259 0.0<br />
Energy, Telecom, Rent, Security and Occupancy<br />
Net effect <strong>of</strong> salary and benefits changes - Reduction in personal services Multiple -632 -11.1<br />
Intra-<strong>Agency</strong> Changes - Reduction in Supplies Multiple -33 0.0<br />
Intra-<strong>Agency</strong> Changes - Reduction in O<strong>the</strong>r Services & Charges Multiple -112 0.0<br />
Intra-<strong>Agency</strong> Changes - Reduction in Contractual Services Multiple -712 0.0<br />
Intra-<strong>Agency</strong> Changes - Revise Subsidies & Transfers Multiple 450 0.0<br />
Intra-<strong>Agency</strong> Changes - Reduction in Equipment Multiple -42 0.0<br />
Policy Initiatives and Cost Savings<br />
Enhance - Increase O-type funding due to revised revenue estimates. Multiple 228 0.0<br />
Gap-Closing Initiatives<br />
Shift - Re-align various HRLA positions from Local to O-type Funds Health Care Regulation & Licensing 490 5.0<br />
Admin<br />
SPECIAL PURPOSE REVENUE FUNDS: FY 2010 Proposed <strong>Budget</strong> and FTE 14,272 121.7<br />
FEDERAL GRANT FUND: FY 2009 Approved <strong>Budget</strong> and FTE 137,096 562.1<br />
Initial and Baseline Adjustments<br />
Net effect <strong>of</strong> fixed cost adjustments - Revised Fixed Cost estimates for Multiple -928 0.0<br />
Energy, Telecom, Rent, and Security<br />
Net effect <strong>of</strong> salary and benefits changes - Reduction in personal services Multiple -218 -14.1<br />
Intra-<strong>Agency</strong> Changes - Reduction in supplies Multiple -1,467 0.0<br />
Intra-<strong>Agency</strong> Changes - Reduction in O<strong>the</strong>r Services & Charges Multiple -482 0.0<br />
Intra-<strong>Agency</strong> Changes - Revise Contractual Services Multiple 587 0.0<br />
Intra-<strong>Agency</strong> Changes - Reduction in Subsidies & Transfers Multiple -6 0.0<br />
Intra-<strong>Agency</strong> Changes - Revise Equipment Multiple 27 0.0<br />
(Continued on next page)
Table HC0-5 (Continued)<br />
(dollars in thousands)<br />
Policy Initiatives and Cost Savings<br />
Program BUDGET FTE<br />
Enhance - Add Recovery Act funding to enhance DOH immunization program Community Health Administration 865 0.0<br />
Cost Decrease - Adjust grant budget to revised grant revenue projection Community Health Administration -14 0.0<br />
Shift - Shift positions within HIV/AIDS Administration from local to<br />
federal funding.<br />
HIV/AIDS Administration 0 2.0<br />
Gap-Closing Initiatives<br />
Shift - Re-align grant monitoring and administrative positions from<br />
Local to Federal Funds<br />
Community Health Administration 399 4.0<br />
FEDERAL GRANT FUND: FY 2010 Proposed <strong>Budget</strong> and FTE 135,859 554.0<br />
Private Grant Fund: FY 2009 Approved <strong>Budget</strong> and FTE<br />
Initial and Baseline Adjustments<br />
0 0.0<br />
Intra-<strong>Agency</strong> Changes - Revise Supplies Community Health Administration 26 0.0<br />
Intra-<strong>Agency</strong> Changes - Revise Contractual Services Community Health Administration 293 0.0<br />
Private Grant Fund: FY 2010 Proposed <strong>Budget</strong> and FTE 319 0.0<br />
INTRA-DISTRICT FUNDS: FY 2009 Approved <strong>Budget</strong> and FTE<br />
Initial and Baseline Adjustments<br />
21,268 10.0<br />
Net effect <strong>of</strong> fixed cost adjustments - Revised Fixed Cost estimates for Energy <strong>Agency</strong> Management Support -48 0.0<br />
Net effect <strong>of</strong> salary and benefits changes - Reduction in Personal Services Multiple -301 -3.0<br />
Intra-<strong>Agency</strong> Changes - Revise Supplies Multiple 15 0.0<br />
Intra-<strong>Agency</strong> Changes - Revise O<strong>the</strong>r Services & Charges Multiple 18 0.0<br />
Intra-<strong>Agency</strong> Changes - Revise Contractual Services Multiple 181 0.0<br />
Intra-<strong>Agency</strong> Changes - Reduction in Subsidies & Transfers Multiple -1,149 0.0<br />
Intra-<strong>Agency</strong> Changes - Revise Equipment Multiple 10 0.0<br />
Baseline Adjustments: Net effect <strong>of</strong> salary and benefits changes -<br />
Reduction in personal services due to <strong>the</strong> absence <strong>of</strong> a signed MOU<br />
or letter <strong>of</strong> intent<br />
Community Health Administration -240 -3.5<br />
Baseline Adjustments: - Reduction in Supplies due to <strong>the</strong> absence <strong>of</strong> a<br />
signed MOU or letter <strong>of</strong> intent<br />
Community Health Administration -7 0.0<br />
Baseline Adjustments: - Reduction in O<strong>the</strong>r Services & Charges due to<br />
<strong>the</strong> absence <strong>of</strong> a signed MOU or letter <strong>of</strong> intent<br />
Community Health Administration -21 0.0<br />
Baseline Adjustments: - Reduction in Contractual Services due to <strong>the</strong><br />
absence <strong>of</strong> a signed MOU or letter <strong>of</strong> intent<br />
Community Health Administration -970 0.0<br />
Baseline Adjustments: - Reduction in Equipment due to <strong>the</strong> absence <strong>of</strong><br />
a signed MOU or letter <strong>of</strong> intent<br />
Community Health Administration -49 0.0<br />
Baseline Adjustments: - Reduction in Subsidies & Transfers due to <strong>the</strong> Addiction Prevention & -250 0.0<br />
absence <strong>of</strong> a signed MOU or letter <strong>of</strong> intent<br />
(Continued on next page)<br />
Recovery Admin<br />
Department <strong>of</strong> Health<br />
E-71
Table HC0-5 (Continued)<br />
(dollars in thousands)<br />
FY 2010 Proposed <strong>Budget</strong> and <strong>Financial</strong> Plan<br />
E-72<br />
Program BUDGET FTE<br />
Policy Initiatives and Cost Savings<br />
Cost Increase - Grant from NIF funds for <strong>the</strong> Concerned Citizens on Addiction Prevention & 100 0.0<br />
Alcohol and Drug Abuse Recovery Admin<br />
Cost Increase - Grant from NIF funds for Ward 8 Clean and Sober Addiction Prevention & 75 0.0<br />
Recovery Admin<br />
Inter-<strong>Agency</strong> - Transfer from DHCF to support a grant to Planned Community Health Administration 250 0.0<br />
Parenthood for sexual health education programs<br />
Cost Increase - Grant from NIF funds for National Kidney Foundation Community Health Administration 100 0.0<br />
Inter-<strong>Agency</strong> - Transfer from DHCF to support emergency operating Community Health Administration 2,500 0.0<br />
loans for community health clinics<br />
Gap-Closing Initiatives<br />
Cost Decrease - Reduce dedicated grants Multiple -275 0.0<br />
INTRA-DISTRICT FUNDS: FY 2010 Proposed <strong>Budget</strong> and FTE 21,206 3.6<br />
Gross for HC0 - Department <strong>of</strong> Health 249,846 835.9<br />
<strong>Agency</strong> Performance Plan<br />
The agency’s Performance Plan has <strong>the</strong> following<br />
objectives for FY 2010:<br />
Objective 1: Ensure quality and equitable health outcomes<br />
for children, families and adults in <strong>the</strong> District.<br />
Objective 2: Reduce substance abuse and mitigate its<br />
consequences in <strong>the</strong> District by expanding access to<br />
high quality substance abuse prevention, treatment,<br />
and recovery support services.<br />
Objective 3: Continually improve surveillance, prevention,<br />
and treatment <strong>of</strong> HIV, STD, TB, and<br />
hepatitis-related morbidity in <strong>the</strong> District.<br />
Objective 4: Improve District’s public health<br />
response system via capital, workforce, and<br />
Emergency Preparedness enhancements.
<strong>Agency</strong> Performance Measures<br />
Table HC0-6<br />
FY 2007 FY 2008 FY 2008<br />
Year-End Original Year-End FY 2009 FY 2010 FY 2011<br />
Measure<br />
Objective 1:<br />
Percent <strong>of</strong> children enrolled in DC Public Schools and<br />
Public Charter Schools with a body mass index<br />
Actual Target Actual Projection Projection Projection<br />
(BMI) measurement<br />
Percent <strong>of</strong> Medicaid/Alliance beneficiaries with AMI,<br />
chronic kidney disease, diabetes, stroke, chronic<br />
obstructive pulmonary disease, or hypertension who<br />
43% 46% TBD 70% 80% 90%<br />
are re-hospitalized within 30 days <strong>of</strong> discharge. 30% 30% TBD 29% 28% 25%<br />
Percent <strong>of</strong> low birth weight infants born in DC. 11.6% (2006) 11.3% TBD 11% 10.5% 10%<br />
Objective 2:<br />
Percent <strong>of</strong> APRA clients referred to recovery<br />
support services that redeem vouchers to utilize<br />
those services. A Percent <strong>of</strong> recovery support clients that receive<br />
N/A N/A N/A 80% 85% 90%<br />
6-month post-admission interview. B Percent <strong>of</strong> recovery support clients that maintain<br />
abstinence from alcohol and drugs 6-months post<br />
N/A N/A N/A 85% 90% 95%<br />
admission (quarterly). N/A N/A N/A 40% 45% 50%<br />
Objective 3:<br />
Number <strong>of</strong> new HIV (HIV/AIDS) cases diagnosed<br />
within <strong>the</strong> fiscal year. C 1,361 769 851 1,400 1,500 1,600<br />
Number <strong>of</strong> publically supported HIV tests performed. D 43,271 68,252 72,864 100,000 150,000 150,000E Number <strong>of</strong> persons newly diagnosed with HIV<br />
through expanded partner services (PCRS). F 22G Number <strong>of</strong> needles <strong>of</strong>f <strong>the</strong> streets through DC<br />
19 19 40 80 150<br />
NEX Program. N/A 190,016 190,016 250,000H Number <strong>of</strong> condoms distributed by DC DOH<br />
300,000 350,000<br />
Condom Program. I 550,000J Number <strong>of</strong> youth (15-19 years ) screened for STDs<br />
through youth outreach program (parks and<br />
1.52 million 1.52 million 1.75 million 3 million 3 million<br />
recreation, summer employment, schools, etc.) N/A 1,898 2,091 5,000 10,000 10,000<br />
Number <strong>of</strong> peri-natal HIV infections. 3 K 6 4 0 0 0<br />
Continued on next page<br />
Department <strong>of</strong> Health<br />
E-73
<strong>Agency</strong> Performance Measures<br />
Table HC0-6 (cont)<br />
FY 2007 FY 2008 FY 2008<br />
Year-End Original Year-End FY 2009 FY 2010 FY 2011<br />
Measure<br />
Objective 4:<br />
Percent <strong>of</strong> health care providers contacted through <strong>the</strong><br />
Health Alert Network that confirm message receipt<br />
Actual Target Actual Projection Projection Projection<br />
within 60 minutes.<br />
Percent <strong>of</strong> Department <strong>of</strong> Health network providers<br />
enrolled in pilot program to identify and serve persons<br />
N/A N/A N/A 75% 80% 85%<br />
with special needs in an emergency.<br />
Percent <strong>of</strong> new hires on board within 60 days after<br />
N/A N/A N/A 10% 20% 30%<br />
job posting. N/A N/A N/A 75% 80% 85%<br />
Vacancy rate. N/A N/A N/A 5% 4% 4%<br />
A APRA provides vouchers for community-based support services as clients go through treatment. While not all APRA clients receive vouchers for support services, uptake <strong>of</strong> support services is an important indicator<br />
<strong>of</strong> <strong>the</strong> agency’s ability to support clients’ recoveries.<br />
B The six-month post-admission interview <strong>of</strong> clients who use support services is critical to assessing <strong>the</strong> strength <strong>of</strong> programs and <strong>the</strong> success <strong>of</strong> clients.<br />
C Due to increased testing, DOH expects that <strong>the</strong> number <strong>of</strong> newly diagnosed HIV cases will increase for several years. Identifying <strong>the</strong>se new cases is critical to increase survival <strong>of</strong> patients and decrease future<br />
transmissions. Reporting delays may lead to upward revision <strong>of</strong> actual numbers over time.<br />
D DC DOH policy is routine opt-out HIV testing—we encourage all persons to know <strong>the</strong>ir HIV status and toge<strong>the</strong>r HIV status checked annually as part <strong>of</strong> regular health care. To realize this goal, DOH supports multiple<br />
community outreach and health care partners to increase testing access and provision-thus our goal is to increase <strong>the</strong> number <strong>of</strong> tests provided over <strong>the</strong> next several years.<br />
E The number <strong>of</strong> tests is expected to plateau in 2010 as private providers begin to provide more testing services. The number may expand in future years as costs shift and <strong>the</strong> public health system focuses on special<br />
populations.<br />
F Partner Services provide targeted testing to persons who may have been exposed to HIV but unaware <strong>of</strong> <strong>the</strong>ir exposure. Experience shows that targeted testing <strong>of</strong> partners yields high rates <strong>of</strong> new diagnoses.<br />
G Revised FY 2007, FY 2008 measures and FY 2009-FY 2011 targets based on review <strong>of</strong> data.<br />
H Revised FY 2009-FY 2011 targets due to FY 2008 year-end data dramatically exceeding projected performance. Previous targets were 50k, 60k and 70k for FY 2009-FY 2011, respectively.<br />
I In 2008, Mayor Fenty pledged to triple <strong>the</strong> size <strong>of</strong> <strong>the</strong> public condom distribution program from approximately 1,000,000 condoms per year to 3,000,000 condoms per year. This 3,000,000 goal will place DC on par<br />
with NY City’s program, <strong>the</strong> only o<strong>the</strong>r city-wide public condom program in <strong>the</strong> United States. In addition to providing condoms, social marketing and prevention programs will promote higher regular and correct<br />
usage <strong>of</strong> <strong>the</strong>se condoms. Once achieving this 3,000,000 goal, additional needs assessment will be performed to inform any fur<strong>the</strong>r scale up.<br />
J Revised FY 2007 based on correction: FY 2007 number previously reported included some condoms distributed during FY 2008 as well. Public condom distribution program started in February 2007.<br />
K Revised FY 2007 count: reduced from 7 to 3, based on re-classification: 4 <strong>of</strong> <strong>the</strong> originally-reported cases were not District residents. We expect that each year will result in post-year revisions as final investigations<br />
result in reclassification.<br />
FY 2010 Proposed <strong>Budget</strong> and <strong>Financial</strong> Plan<br />
E-74
Department <strong>of</strong> Parks and Recreation<br />
http://dpr.dc.gov<br />
Telephone: 202-673-7647<br />
(HA0)<br />
% Change<br />
FY 2008 FY 2009 FY 2010 from<br />
Description Actual Approved Proposed FY 2009<br />
Operating <strong>Budget</strong> $63,033,972 $57,638,166 $48,095,331 -16.6<br />
FTEs 754.7 811.4 574.8 -29.2<br />
The mission <strong>of</strong> <strong>the</strong> Department <strong>of</strong> Parks and Recreation is to plan,<br />
preserve, and enhance <strong>the</strong> District’s open space and recreational<br />
amenities to provide a diverse array <strong>of</strong> recreation programs and promote<br />
participation by bridging cultural, physical and economic gaps.<br />
Summary <strong>of</strong> Services<br />
DPR maintains over 900 acres <strong>of</strong> parkland and 68<br />
facilities across <strong>the</strong> District <strong>of</strong> Columbia, including<br />
recreation and community centers, pools, playgrounds,<br />
athletic fields and play courts, and provides<br />
programs and services to individuals and groups<br />
throughout <strong>the</strong> District. DPR delivers a wide range<br />
<strong>of</strong> activities, including summer camps, which serve<br />
children and youth, sports leagues and events, instructional<br />
programs, community outreach to at-risk<br />
youth, <strong>the</strong>rapeutic recreation, and food and nutritional<br />
programs.<br />
The agency’s FY 2010 proposed budget is presented<br />
in <strong>the</strong> following tables:<br />
Department <strong>of</strong> Parks and Recreation<br />
E-75
FY 2010 Proposed Gross Funds Operating <strong>Budget</strong>, by Revenue Type<br />
Table HA0-1 contains <strong>the</strong> proposed FY 2010 agency budget compared to <strong>the</strong> FY 2009 approved budget. It also<br />
provides FY 2007 and FY 2008 actual expenditures.<br />
Table HA0-1<br />
(dollars in thousands)<br />
Actual Actual Approved Proposed<br />
Change<br />
from Percent<br />
Appropriated Fund<br />
General Fund<br />
FY 2007 FY 2008 FY 2009 FY 2010 FY 2009 Change*<br />
Local Funds 46,431 49,029 44,820 39,625 -5,195 -11.6<br />
Special Purpose Revenue Funds 1,381 3,995 2,492 2,014 -478 -19.2<br />
Total for General Fund 47,812 53,024 47,312 41,639 -5,673 -12.0<br />
Federal Resources<br />
Federal Payments 0 -2 0 0 0 N/A<br />
Federal Grant Funds 0 -22 0 0 0 N/A<br />
Total for Federal Resources 0 -23 0 0 0 N/A<br />
Private Funds<br />
Private Grant Funds 831 1,133 1,000 0 -1,000 -100.0<br />
Total for Private Funds 831 1,133 1,000 0 -1,000 -100.0<br />
Intra-District Funds<br />
Intra-District Funds 14,918 8,900 9,326 6,457 -2,869 -30.8<br />
Total for Intra-District Funds 14,918 8,900 9,326 6,457 -2,869 -30.8<br />
Gross Funds 63,561 63,034 57,638 48,095 -9,543 -16.6<br />
*Percent Change is based on whole dollars.<br />
Note: If applicable, for a breakdown <strong>of</strong> each Grant (Federal and Private), Special Purpose Revenue type and Intra-District agreement, please refer to<br />
Schedule 80, <strong>Agency</strong> Summary by Revenue Source, in <strong>the</strong> Operating Appendices located on <strong>the</strong> <strong>Office</strong> <strong>of</strong> <strong>the</strong> <strong>Chief</strong> <strong>Financial</strong> <strong>Office</strong>r’s website.<br />
FY 2010 Proposed <strong>Budget</strong> and <strong>Financial</strong> Plan<br />
E-76
FY 2010 Proposed Full-Time Equivalents, by Revenue Type<br />
Table HA0-2 contains <strong>the</strong> proposed FY 2010 FTE level compared to <strong>the</strong> FY 2009 approved FTE level by revenue<br />
type. It also provides FY 2007 and FY 2008 actual data.<br />
Table HA0-2<br />
Change<br />
Actual Actual Approved Proposed from Percent<br />
Appropriated Fund FY 2007 FY 2008 FY 2009 FY 2010 FY 2009 Change<br />
General Fund<br />
Local Funds 586.9 590.3 658.5 563.3 -95.2 -14.5<br />
Special Purpose Revenue Funds 9.6 10.2 9.9 8.5 -1.4 -13.9<br />
Total for General Fund 596.5 600.5 668.4 571.8 -96.6 -14.4<br />
Private Funds<br />
Private Grant Funds 16.0 4.4 22.0 0.0 -22.0 -100.0<br />
Total for Private Funds 16.0 4.4 22.0 0.0 -22.0 -100.0<br />
Intra-District Funds<br />
Intra-District Funds 145.0 149.8 121.0 3.0 -118.0 -97.5<br />
Total for Intra-District Funds 145.0 149.8 121.0 3.0 -118.0 -97.5<br />
Total Proposed FTEs 757.5 754.7 811.4 574.8 -236.6 -29.2<br />
Department <strong>of</strong> Parks and Recreation<br />
E-77
FY 2010 Proposed Operating <strong>Budget</strong>, by Comptroller Source Group<br />
Table HA0-3 contains <strong>the</strong> proposed FY 2010 budget at <strong>the</strong> Comptroller Source Group (object class) level compared<br />
to <strong>the</strong> FY 2009 approved budget. It also provides FY 2007 and FY 2008 actual expenditures.<br />
Table HA0-3<br />
(dollars in thousands)<br />
Actual Actual Approved Proposed<br />
Change<br />
from Percent<br />
Comptroller Source Group FY 2007 FY 2008 FY 2009 FY 2010 FY 2009 Change*<br />
11 Regular Pay - Cont Full Time 14,445 17,891 14,168 16,756 2,588 18.3<br />
12 Regular Pay - O<strong>the</strong>r 19,077 15,999 18,583 10,092 -8,491 -45.7<br />
13 Additional Gross Pay 609 1,500 411 417 6 1.4<br />
14 Fringe Benefits - Curr Personnel 6,468 7,010 5,798 4,930 -868 -15.0<br />
15 Overtime Pay 912 671 515 524 9 1.7<br />
99 Unknown Payroll Postings 0 0 0 0 0 N/A<br />
Subtotal Personal Services (PS) 41,511 43,070 39,475 32,719 -6756 -17.1<br />
20 Supplies and Materials 1,618 1,759 1,712 799 -913 -53.3<br />
30 Energy, Comm. and Bldg Rentals 4,100 4,209 3,670 365 -3,305 -90.0<br />
31 Telephone, Telegraph, Telegram, Etc 1,298 1,292 1,127 769 -358 -31.8<br />
32 Rentals - Land and Structures 380 238 124 0 -124 -100.0<br />
34 Security Services 1,024 576 1,189 0 -1,189 -100.0<br />
35 Occupancy Fixed Costs 0 0 0 1 1 N/A<br />
40 O<strong>the</strong>r Services and Charges 1,091 2,300 1,420 1,246 -175 -12.3<br />
41 Contractual Services - O<strong>the</strong>r 11,571 8,832 7,985 11,777 3,792 47.5<br />
50 Subsidies and Transfers 144 0 0 0 0 N/A<br />
70 Equipment & Equipment Rental 825 756 934 419 -515 -55.2<br />
Subtotal Nonpersonal Services (NPS) 22,050 19,964 18,163 15,377 -2,787 -15.3<br />
Gross Funds 63,561 63,034 57,638 48,095 -9,543 -16.6<br />
*Percent Change is based on whole dollars.<br />
FY 2010 Proposed <strong>Budget</strong> and <strong>Financial</strong> Plan<br />
E-78
Program Description<br />
The Department <strong>of</strong> Parks and Recreation operates<br />
through <strong>the</strong> following 5 programs:<br />
Development and Community Affairs (<strong>Agency</strong><br />
Support) - provides community outreach, volunteer<br />
opportunities, and development activities for District<br />
residents, visitors, and DPR in order to provide additional<br />
resources and staff, and to meet and exceed customer<br />
expectations.<br />
This program contains <strong>the</strong> following 6 activities:<br />
■ Director’s <strong>Office</strong> - provides vision and support to<br />
<strong>the</strong> department in order to guide senior managers<br />
in a direction most advantageous to <strong>the</strong> government<br />
and residents <strong>of</strong> <strong>the</strong> District <strong>of</strong> Columbia;<br />
■ Inter-governmental Relations Activity – provides<br />
services that establish, maintain and nurture relationships<br />
between <strong>the</strong> department and o<strong>the</strong>r government<br />
entities in order to provide a unified, collaborative<br />
and efficient government to <strong>the</strong> residents<br />
<strong>of</strong> <strong>the</strong> District <strong>of</strong> Columbia;<br />
■ Community Relations Activity - provides structured<br />
partnerships, volunteer opportunities and<br />
community services to citizens, visitors, organizations<br />
and DPR, as a means <strong>of</strong> outreach, partnerships,<br />
community activity and communication<br />
between <strong>the</strong> government and residents <strong>of</strong> <strong>the</strong><br />
District <strong>of</strong> Columbia;<br />
■ Marketing and Development Activity - works<br />
with all areas <strong>of</strong> DPR, o<strong>the</strong>r government entities,<br />
public and private organizations to create, manage<br />
and distribute information and materials for use<br />
by public, media, and staff through use <strong>of</strong> printed,<br />
broadcast and electronic communications;<br />
■ Permitting Activity - provides control, supervision<br />
and governance over <strong>the</strong> use <strong>of</strong> DPR operated<br />
and maintained ball fields, parks, picnic areas<br />
and o<strong>the</strong>r facilities through permits and fees, thus<br />
benefiting <strong>the</strong> users <strong>of</strong> <strong>the</strong>se areas; and<br />
■ Partnerships Activity - fosters support for DPR<br />
through donations, grants, innovative public and<br />
private partnerships, and volunteer service by<br />
individuals, groups, and organizations. The<br />
<strong>Office</strong> <strong>of</strong> Partnerships and Development collaborates<br />
with community groups, businesses, nonpr<strong>of</strong>it<br />
organizations, and concerned individuals to<br />
maintain and improve DPR’s parks and recre-<br />
ation centers, provide free programming at our<br />
facilities and sustain overall mission <strong>of</strong> DPR.<br />
Recreation Programs and Services - provides sports,<br />
health and fitness programs, youth programs, aquatics,<br />
and a diverse array <strong>of</strong> camps for District residents<br />
and visitors so that <strong>the</strong>y can participate in and learn<br />
about sports and leisure activities, as well as improve<br />
<strong>the</strong>ir health and well-being.<br />
This program contains <strong>the</strong> following 9 activities:<br />
■ Recreation Services – provides planning, supervision<br />
and logistical support to <strong>the</strong> ward <strong>of</strong>fices and<br />
multiple recreation centers throughout <strong>the</strong><br />
District so that recreation programs and facilities<br />
may run in an efficient and orderly manner for<br />
<strong>the</strong> residents and visitors <strong>of</strong> <strong>the</strong> District <strong>of</strong><br />
Columbia;<br />
■ Aquatics – provides swimming recreation,<br />
instruction, fitness, and competition opportunities<br />
to District citizens and visitors so that <strong>the</strong>y can<br />
swim safely for recreation, fitness, and competitive<br />
purposes;<br />
■ Sports, Health & Fitness - provides structured<br />
and self-directed recreational sports, health and<br />
fitness programs to District residents and visitors<br />
so that <strong>the</strong>y can learn and/or master athletic skills,<br />
healthy living techniques, and <strong>the</strong> principles <strong>of</strong> fitness;<br />
■ Youth Development - provides specialized outreach<br />
services to DC children and youth ages 9 to<br />
21 at risk <strong>of</strong> negative social behaviors, by providing<br />
opportunities in education, employment,<br />
community service and scholarship, so that <strong>the</strong>y<br />
can reconnect to mainstream society and lead productive<br />
and healthy lives;<br />
■ Urban Camps (Summer Operations) – provide<br />
operations that coordinates <strong>the</strong> planning and<br />
implementation <strong>of</strong> summer activities for <strong>the</strong><br />
department so that District residents and visitors<br />
<strong>of</strong> all ages may easily take advantage <strong>of</strong> cultural,<br />
educational, recreational, leisure and social activities<br />
available through DPR;<br />
■ Environmental Activities - provides environmental<br />
education and gardening programs to District<br />
residents and visitors <strong>of</strong> all ages so that <strong>the</strong>y can<br />
learn about, explore, and experience <strong>the</strong> urban<br />
and natural environment;<br />
Department <strong>of</strong> Parks and Recreation<br />
E-79
■ Senior Services - provides recreational, social,<br />
educational, health promotion, and transportation<br />
services to District residents and visitors, age<br />
50 and older, so that <strong>the</strong>y may enhance <strong>the</strong>ir<br />
mental, social and physical well being;<br />
■ Therapeutic Recreation - provides comprehensive<br />
habilitation and rehabilitation leisure services<br />
to persons <strong>of</strong> all abilities and, in particular, persons<br />
with disabilities, so that <strong>the</strong>y can progress from<br />
<strong>the</strong>rapy to participation in leisure activities within<br />
<strong>the</strong>ir community; and<br />
■ Child and Adult Feeding - distributes year-round<br />
nutritional meals to children and adults.<br />
Park and Facility Management - provides planning,<br />
building, operational, maintenance, custodial, and<br />
security services to DPR and District residents and<br />
visitors so that <strong>the</strong>y can have safe, well-planned and<br />
well-managed facilities.<br />
This program contains <strong>the</strong> following 7 activities:<br />
■ Facility Management Administration – provides<br />
services that operate and maintain DPR facilities<br />
and parks so that District residents and visitors<br />
can recreate at attractive, well-run and well-operated<br />
recreational properties;<br />
■ Natural Resources – provides for <strong>the</strong> management<br />
<strong>of</strong> environmentally safe and beautiful parks<br />
and recreation centers that contributes to <strong>the</strong><br />
environmental, social and recreational well-being<br />
<strong>of</strong> <strong>the</strong> District residents and visitors;<br />
■ Planning and Design - provides planning and<br />
park development services to <strong>the</strong> District community<br />
(internal and external to DPR) so that <strong>the</strong><br />
agency can make informed decisions on land use<br />
and obtain community input on park development<br />
and improvements;<br />
■ Capital Improvement Program - provides technical<br />
and administrative support for construction<br />
services and capital equipment purchases so that<br />
DPR may develop and maintain a broad range <strong>of</strong><br />
state <strong>of</strong> <strong>the</strong> art facilities and parks that meet <strong>the</strong><br />
community’s needs;<br />
■ Park and Facility Operations (Park Rangers) –<br />
provides security and promotes safe and sound<br />
settings for park visitors, prepare exhibits and<br />
informational material about <strong>the</strong> park, lead tours<br />
and nature walks to help visitors learn about <strong>the</strong><br />
natural significance <strong>of</strong> <strong>the</strong> area and assist with crit-<br />
FY 2010 Proposed <strong>Budget</strong> and <strong>Financial</strong> Plan<br />
E-80<br />
ical emergency response;<br />
■ Park and Facility Operations (Stagecraft) - provides<br />
tools, equipments and installation support<br />
necessary to successfully support events for enjoyment<br />
and education <strong>of</strong> District residents; and<br />
■ Park and Facility Operations (Warehouse) - provides<br />
sufficient space to assemble, house, and<br />
manage shipment <strong>of</strong> materials, equipment and<br />
supplies for <strong>the</strong> purpose <strong>of</strong> supporting <strong>the</strong> department’s<br />
programs and administration.<br />
<strong>Agency</strong> Management - provides for administrative<br />
support and <strong>the</strong> required tools to achieve operational<br />
and programmatic results. This program is standard<br />
for all agencies using performance-based budgeting.<br />
<strong>Agency</strong> <strong>Financial</strong> Operations - provides comprehensive<br />
and efficient financial management services to,<br />
and on behalf <strong>of</strong>, District agencies so that <strong>the</strong> financial<br />
integrity <strong>of</strong> <strong>the</strong> District <strong>of</strong> Columbia is maintained.<br />
This program is standard for all agencies using<br />
performance-based budgeting.<br />
Program Structure Change<br />
The Department <strong>of</strong> Parks and Recreation had no program<br />
structure changes in <strong>the</strong> FY 2010 <strong>Budget</strong>.
FY 2010 Proposed Operating <strong>Budget</strong> and FTEs, by Program and Activity<br />
Table HA0-4 contains <strong>the</strong> proposed FY 2010 budget by program and activity compared to <strong>the</strong> FY 2009 approved budget.<br />
It also provides FY 2008 actual data.<br />
Table HA0-4<br />
(dollars in thousands)<br />
Dollars in Thousands Full-Time Equivalents<br />
Change Change<br />
Actual Approved Proposed from Actual Approved Proposed from<br />
Program/Activity<br />
(1000) <strong>Agency</strong> Management Program<br />
FY 2008 FY 2009 FY 2010 FY 2009 FY 2008 FY 2009 FY 2010 FY 2009<br />
(1010) Personnel -23 0 0 0 0.0 0.0 0.0 0.0<br />
(1010) Personnel 367 687 723 37 4.0 5.0 5.0 0.0<br />
(1015) Training & Employee Development 343 125 98 -27 1.0 0.0 0.0 0.0<br />
(1017) Labor/Management Partnerships 86 79 82 3 1.0 1.0 1.0 0.0<br />
(1020) Contracting & Procurement 72 404 371 -33 1.0 1.0 1.0 0.0<br />
(1030) Property Management 0 124 217 93 0.0 0.0 0.0 0.0<br />
(1040) Information Technology 881 531 1,488 957 3.0 3.0 2.0 -1.0<br />
(1055) Risk Management 235 256 194 -62 2.0 2.0 1.0 -1.0<br />
(1060) Legal 16 0 0 0 0.0 0.0 0.0 0.0<br />
(1070) Fleet Management 1,584 1,477 1,523 46 21.0 22.0 23.0 1.0<br />
(1080) Communications 48 49 48 -1 1.0 1.0 1.0 0.0<br />
(1085) Customer Service 108 87 138 51 2.0 1.0 2.0 1.0<br />
Subtotal (1000) <strong>Agency</strong> Management Program<br />
(100F) <strong>Agency</strong> <strong>Financial</strong> Operations<br />
3,715 3,819 4,883 1,064 36.0 36.0 36.0 0.0<br />
(110F) <strong>Agency</strong> <strong>Budget</strong> Operations 87 5 106 101 1.0 0.0 1.0 1.0<br />
(120F) <strong>Agency</strong> Accounting Operations 321 237 220 -17 4.0 4.0 3.0 -1.0<br />
(130F) <strong>Agency</strong> Fiscal <strong>Office</strong>r Operations 2 63 141 78 0.0 0.5 1.0 0.5<br />
Subtotal (100F) <strong>Agency</strong> <strong>Financial</strong> Operations<br />
(2400) <strong>Agency</strong> Support<br />
410 304 467 162 5.0 4.5 5.0 0.5<br />
(2410) Director's <strong>Office</strong> 786 584 625 40 10.0 6.0 6.0 0.0<br />
(2420) Inter-governmental Relations 128 12 0 -12 2.0 0.0 0.0 0.0<br />
(2430) Community Relations 1,163 1,059 376 -683 6.0 6.0 5.0 -1.0<br />
(2440) Marketing and Development 323 314 0 -314 2.0 2.0 0.0 -2.0<br />
(2450) Permitting 142 128 138 10 2.0 2.0 2.0 0.0<br />
(2460) Partnerships 156 158 0 -158 1.0 2.0 0.0 -2.0<br />
Subtotal (2400) <strong>Agency</strong> Support<br />
(Continued on <strong>the</strong> next page)<br />
2,699 2,254 1,139 -1,115 23.0 18.0 13.0 -5.0<br />
Department <strong>of</strong> Parks and Recreation<br />
E-81
FY 2010 Proposed Operating <strong>Budget</strong> and FTEs, by Program and Activity<br />
Table HA0-4 contains <strong>the</strong> proposed FY 2010 budget by program and activity compared to <strong>the</strong> FY 2009 approved budget.<br />
It also provides FY 2008 actual data.<br />
Table HA0-4 (Continued)<br />
(dollars in thousands)<br />
Dollars in Thousands Full-Time Equivalents<br />
Change Change<br />
Actual Approved Proposed from Actual Approved Proposed from<br />
Program/Activity<br />
(3400) Recreational Programs<br />
FY 2008 FY 2009 FY 2010 FY 2009 FY 2008 FY 2009 FY 2010 FY 2009<br />
(3410) Recreational Services/Programs 11,657 12,509 13,169 661 240.5 240.0 218.3 -21.7<br />
(3420) Aquatics 2,630 2,764 2,946 182 56.3 58.0 63.0 5.0<br />
(3430) Sports, Health & Fitness 1,047 1,151 1,148 -3 13.7 12.0 11.5 -0.5<br />
(3440) Youth Development 3,410 2,807 3,071 264 48.8 58.0 45.5 -12.5<br />
(3450) Urban Camps (Summer Operations) 3,366 2,762 329 -2,432 10.2 71.9 0.0 -71.9<br />
(3460) Program Development 171 81 3 -78 1.0 1.0 0.0 -1.0<br />
(4420) Enviornmental Activites 346 183 80 -103 4.0 2.0 0.0 -2.0<br />
(4430) Senior Services 894 817 1,222 405 13.3 13.5 19.5 6.0<br />
(4440) Theraputic Recreation 500 518 548 30 8.4 8.5 8.5 0.0<br />
(4460) Childcare Program (DHS funded) 6,912 6,499 0 -6,499 142.1 115.0 0.0 -115.0<br />
(4476) Yr Round Feeding Prgm (St. Education Off) 309 600 0 -600 0.0 0.0 0.0 0.0<br />
(4477) St. Education (Summer Feeding Prog) 2,223 0 3,094 3,094 2.0 0.0 1.0 1.0<br />
(4480) Headstart - United Planning Organization 1,090 1,000 0 -1,000 4.4 22.0 0.0 -22.0<br />
(4485) Spark - Nat'l Black Child Dvlpmnt Inst 42 0 0 0 0.0 0.0 0.0 0.0<br />
(4490) Score Program 85 103 0 -103 0.0 2.0 0.0 -2.0<br />
Subtotal (3400) Recreational Programs<br />
(4400) Speciality & Targeted Programs<br />
34,681 31,793 25,611 -6,182 544.7 603.9 367.3 -236.6<br />
(4410) Co-op Play (Educational Services) -6 0 0 0 0.0 0.0 0.0 0.0<br />
(4420) Environmental Activites 6 0 0 0 0.0 0.0 0.0 0.0<br />
(4488) Child & Adult Care Feeding Prgm 0 2,424 2,363 -61 0.0 4.0 2.0 -2.0<br />
Subtotal (4400) Speciality & Targeted Programs<br />
(Continued on <strong>the</strong> next page)<br />
0 2,424 2,363 -61 0.0 4.0 2.0 -2.0<br />
FY 2010 Proposed <strong>Budget</strong> and <strong>Financial</strong> Plan<br />
E-82
FY 2010 Proposed Operating <strong>Budget</strong> and FTEs, by Program and Activity<br />
Table HA0-4 contains <strong>the</strong> proposed FY 2010 budget by program and activity compared to <strong>the</strong> FY 2009 approved budget.<br />
It also provides FY 2008 actual data.<br />
Table HA0-4 (Continued)<br />
(dollars in thousands)<br />
Dollars in Thousands Full-Time Equivalents<br />
Change Change<br />
Actual Approved Proposed from Actual Approved Proposed from<br />
Program/Activity<br />
(5400) Park & Facility Management<br />
FY 2008 FY 2009 FY 2010 FY 2009 FY 2008 FY 2009 FY 2010 FY 2009<br />
(5410) Maintenance 1,003 0 0 0 0.0 0.0 0.0 0.0<br />
(5411) Facility Management Administration 10,419 9,218 10,732 1,514 93.4 101.0 113.0 12.0<br />
(5413) Natural Resources 687 652 655 4 13.0 13.0 11.0 -2.0<br />
(5425) Planning & Design 573 414 465 51 4.0 4.0 0.0 -4.0<br />
(5430) Park and Facility Operations (Admin) 5,607 4,900 13 -4,887 0.0 0.0 0.0 0.0<br />
(5440) Capital Improvement Program (CIP) 1,097 66 136 69 6.0 2.0 2.0 0.0<br />
(5450) Park & Facility Operations (Park Rangers) 694 659 591 -68 11.0 11.0 10.0 -1.0<br />
(5460) Park & Facility Operations (Stagecraft) 193 276 334 58 3.0 3.0 4.5 1.5<br />
(5470) Park & Facility Operations (Warehouse) 1,060 859 706 -153 9.9 11.0 11.0 0.0<br />
(5471) Daily Shuttle Service for <strong>the</strong> Homeless 197 0 0 0 5.7 0.0 0.0 0.0<br />
Subtotal (5400) Park & Facility Management 21,529 17,044 13,633 -3,411 146.0 145.0 151.5 6.5<br />
Total Proposed Operating <strong>Budget</strong> 63,034 57,638 48,095 -9,543 754.7 811.4 574.8 -236.6<br />
(Change is calculated by whole numbers and numbers may not add up due to rounding)<br />
Note: For more detailed information regarding <strong>the</strong> proposed funding for <strong>the</strong> activities within this agency’s programs, please see Schedule 30-PBB Program<br />
Summary by Activity in <strong>the</strong> FY 2010 Operating Appendices located on <strong>the</strong> <strong>Office</strong> <strong>of</strong> <strong>the</strong> <strong>Chief</strong> <strong>Financial</strong> <strong>Office</strong>r’s website.<br />
Major Baseline Adjustments, Cost Savings<br />
and Policy Initiatives<br />
Initial and Baseline Adjustments: The following<br />
adjustments were made in Local funds: a reduction <strong>of</strong><br />
$700,000 in nonrecurring costs in <strong>the</strong> <strong>Agency</strong><br />
Support program that pertained to one-time funding<br />
for <strong>the</strong> Boys and Girls Club grant, <strong>the</strong> UNIFEST<br />
grant, and <strong>the</strong> renovation <strong>of</strong> <strong>the</strong> Shoeshop Building; a<br />
net increase <strong>of</strong> $19,364 including a net reduction <strong>of</strong><br />
91.8 FTEs impacting multiple programs for salary,<br />
step, and o<strong>the</strong>r personal services cost adjustments; a<br />
net increase <strong>of</strong> $1,648,375 due to fixed costs adjustments<br />
for OPM and OCTO assessments impacting<br />
multiple programs across <strong>the</strong> agency; and a net<br />
decrease <strong>of</strong> $1,409,124 in intra-agency adjustments<br />
impacting multiple programs. In Special Purpose<br />
Revenue funds: a decrease <strong>of</strong> $525,000 in <strong>the</strong><br />
Recreational Programs for fixed costs adjustments; a<br />
net increase <strong>of</strong> $275,062 and 2.6 FTEs in <strong>the</strong> Park<br />
and Facility Management program and Recreational<br />
Programs for salary, step, and o<strong>the</strong>r personal services<br />
cost adjustments; and a net increase <strong>of</strong> $242,407 in<br />
intra-agency adjustments impacting multiple programs.<br />
In Private Grant funds: a reduction <strong>of</strong> $49,268<br />
and 3.4 FTEs. In Intra-District funds: a net reduction<br />
<strong>of</strong> $386,855 for fixed costs primarily impacting<br />
<strong>the</strong> Recreational Programs; a decrease <strong>of</strong> $1,164,594<br />
and 33.1 FTEs in <strong>the</strong> Recreational Programs and <strong>the</strong><br />
Specialty & Targeted Programs for salary, step, and<br />
Department <strong>of</strong> Parks and Recreation<br />
E-83
o<strong>the</strong>r personal services cost adjustments; and an<br />
increase <strong>of</strong> $3,499,327 in intra-agency adjustments<br />
primarily in <strong>the</strong> Recreational Programs.<br />
Transfers In/Out: In FY 2009 and before, <strong>the</strong><br />
Department <strong>of</strong> Parks and Recreation (DPR), through<br />
its <strong>Office</strong> <strong>of</strong> Educational Services (OES), received<br />
Intra-District funds from <strong>the</strong> <strong>Office</strong> <strong>of</strong> <strong>the</strong> State<br />
Superintendent <strong>of</strong> Education (OSSE) and a<br />
Headstart grant to pay for <strong>the</strong> personnel and administrative<br />
costs <strong>of</strong> being a direct provider <strong>of</strong> subsidized<br />
child care programs. Through memoranda <strong>of</strong> understanding,<br />
DPR received <strong>the</strong> Intra-District funds based<br />
on enrollment at its programs. Due to DPR’s inability<br />
to collect funding sufficient to cover OES operations,<br />
<strong>the</strong> proposed budget anticipates that <strong>the</strong><br />
agency will no longer be a direct provider <strong>of</strong> child care<br />
services. This action reduces DPR’s Intra-District<br />
budget by $5,100,000 and 84.9 FTEs, and reduces<br />
DPR’s Private Grant budget by $951,000 and 18.60<br />
FTEs. OSSE, however, will maintain <strong>the</strong> same level<br />
<strong>of</strong> funding for child care and Pre-K programs demonstrating<br />
attendance, including Pre-K, Before- and<br />
After-Care, and Afterschool programs.<br />
Cost Savings: The proposed budget reduces discretionary<br />
purchases for DPR by $676,401, including<br />
facility rentals, out-<strong>of</strong>-city travel, conference fees,<br />
membership dues, equipment rentals, and contractual<br />
services. The proposed budget also reduces DPR's<br />
fixed costs, by a total <strong>of</strong> $553,879, by aligning budget<br />
lines with revised estimates for telecom, fleet, and<br />
occupancy. Finally, <strong>the</strong> proposed budget reduces contractual<br />
security services $1,102,471, in recognition<br />
<strong>of</strong> <strong>the</strong> fact that DPR staff currently help safeguard<br />
customers and property during hours <strong>of</strong> operation.<br />
Policy Initiatives: Summer is a key time for youth to<br />
take part in activities that keep <strong>the</strong>m safe and healthy,<br />
and in keeping with <strong>the</strong> District’s commitment to <strong>the</strong><br />
maintenance <strong>of</strong> summer camp opportunities, <strong>the</strong><br />
proposed budget provides $975,000 in additional<br />
funding for mowing <strong>of</strong> grass in recreation centers,<br />
landscaping, and athletic field maintenance. The proposed<br />
budget also includes $350,127 to fund staff,<br />
supplies, and equipment needed to operate <strong>the</strong><br />
Wilson Pool upon completion <strong>of</strong> <strong>the</strong> capital project.<br />
DPR's energy and water/sewer fixed costs will go up<br />
by $23,859 in <strong>the</strong> proposed budget; this net increase<br />
FY 2010 Proposed <strong>Budget</strong> and <strong>Financial</strong> Plan<br />
E-84<br />
is due to <strong>the</strong> opening <strong>of</strong> <strong>the</strong> Wilson Pool and revised<br />
OPM estimates. An additional $27,300 is also provided<br />
in <strong>the</strong> budget to fund <strong>the</strong> Recreation Volunteer<br />
Background Check & Screening Act <strong>of</strong> 2000 (B13-<br />
303).<br />
Gap-Closing Initiatives: The proposed FY 2010 gapclosing<br />
budget reduces Local funds appropriations for<br />
DPR by $878,000 and 9.5 FTEs accounting for <strong>the</strong><br />
abolishment <strong>of</strong> positions, including new positions for<br />
Sports and Fitness, Environmental Activities,<br />
Program Development, and <strong>the</strong> CIP Program. The<br />
agency will achieve <strong>the</strong>se savings with little to no<br />
impact to its frontline services. The agency will<br />
reduce $4,046,000 in funding to eliminate an<br />
increase for Property Management over <strong>the</strong> FY 2009<br />
actual. Information Technology is also reduced by<br />
$314,000.<br />
The budget provides a total <strong>of</strong> $1,225,000 in<br />
Local funds, which includes $875,000 <strong>of</strong> recurring<br />
and $350,000 <strong>of</strong> one-time funding for <strong>the</strong> operating<br />
budget fiscal impact <strong>of</strong> Bill 18-338, <strong>the</strong> “Boys and<br />
Girls Club <strong>of</strong> Greater Washington Property<br />
Acquisition Emergency Act <strong>of</strong> 2009.”<br />
The sum <strong>of</strong> $150,000 was reduced from <strong>the</strong><br />
Intra-District funds due to a reduction in a dedicated<br />
grant.
FY 2009 Approved <strong>Budget</strong> to FY 2010 Proposed <strong>Budget</strong>, by Revenue Type<br />
Table HA0-5 itemizes <strong>the</strong> changes by revenue type between <strong>the</strong> FY 2009 approved budget and <strong>the</strong> FY 2010 proposed<br />
budget. The four categories <strong>of</strong> changes reflected in this table are: (1) changes to <strong>the</strong> baseline budget (includes<br />
agency request), (2) changes representing cost savings or efficiencies, (3) changes related to policy initiatives, and (4)<br />
changes to specifically address <strong>the</strong> projected revenue shortfall.<br />
Table HA0-5<br />
(dollars in thousands)<br />
Program BUDGET FTE<br />
LOCAL FUND: FY 2009 Approved <strong>Budget</strong> and FTE 44,820 658.5<br />
Initial and Baseline Adjustments<br />
Reduction for nonrecurring costs - Renovate <strong>the</strong> Shoeshop Building, Grant to <strong>Agency</strong> Support -700 0.0<br />
Boys and Girls Club, and Grant to UNIFEST<br />
Net effect <strong>of</strong> fixed cost adjustments - Funding adjustments for OPM and OCTO Multiple Programs 2,017 0.0<br />
estimates<br />
Net effect <strong>of</strong> salary and benefits changes - Salary steps and o<strong>the</strong>r personal Multiple Programs 19 -91.8<br />
services funding adjustments<br />
Intra-<strong>Agency</strong> Changes - Funding redirected across multiple programs Multiple Programs -1,937 0.0<br />
Baseline Adjustments: Net effect <strong>of</strong> fixed cost adjustments - Funding Multiple Programs 159 0.0<br />
adjustments for revised OPM estimates<br />
Policy Initiatives and Cost Savings<br />
Eliminate - Align security budget with revised OPM estimates <strong>Agency</strong> Management Program -1,171 0.0<br />
Reduce - Reduce discretionary purchases, including facility rentals, out-<strong>of</strong>-city Multiple -676 0.0<br />
travel, conference fees, membership dues, equipment rentals, and contractual<br />
services<br />
Cost decrease - Align fleet budget with revised DPW estimates <strong>Agency</strong> Management Program -90 0.0<br />
Cost decrease - Align occupancy budget with revised OPM estimates <strong>Agency</strong> Management Program 0 0.0<br />
Cost decrease - Align procurement assessment budget with revised OCP <strong>Agency</strong> Management Program -42 0.0<br />
estimates<br />
Cost decrease - Align telecom budget with revised OCTO estimates <strong>Agency</strong> Management Program -388 0.0<br />
Cost increase - Align energy and waste/water budget with revised OPM <strong>Agency</strong> Management Program 24 0.0<br />
estimates<br />
Enhance - Partner with community-based providers to target programming for Recreational Programs 250 0.0<br />
at-risk youth<br />
Cost Increase - Restore recreation center mowing and athletic field maintenance Park & Facility Management 975 0.0<br />
and landscaping<br />
Enhance - Fund staff, supplies, and equipment needed to operate <strong>the</strong> Wilson Multiple 350 6.0<br />
Pool upon completion <strong>of</strong> <strong>the</strong> capital project<br />
Enhance - Fund <strong>the</strong> Recreation Volunteer Background Check & Screening Recreational Programs 27 0.0<br />
Act <strong>of</strong> 2000 - B13.303<br />
Gap-Closing Initiatives<br />
Decrease - Abolish position personnel, new position for Sports and Multiple -878 -9.5<br />
Fitness, Environmental Activities (Duplicative Effort DOE), Program<br />
Development, and CIP Program<br />
Reduce - Property Management increased over FY 2009 actual <strong>Agency</strong> Management Program -4,046 0.0<br />
(Continued on <strong>the</strong> next page)<br />
Department <strong>of</strong> Parks and Recreation<br />
E-85
Table HA0-5 (continued)<br />
(dollars in thousands)<br />
Gap-Closing Initiatives (cont)<br />
Program BUDGET FTE<br />
Reduce - Reduction <strong>of</strong> Information Technology <strong>Agency</strong> Management Program -314 0.0<br />
Enhance - Fund <strong>the</strong> recurring operating budget fiscal impact <strong>of</strong> Bill 18- Park & Facility Management 875 0.0<br />
338, <strong>the</strong> “Boys and Girls Club <strong>of</strong> Greater Washington Property<br />
Acquisition Emergency Act <strong>of</strong> 2009”<br />
Enhance - Fund <strong>the</strong> one-time operating budget fiscal impact <strong>of</strong> Bill 18- Park & Facility Management 350 0.0<br />
338, <strong>the</strong> “Boys and Girls Club <strong>of</strong> Greater Washington Property<br />
Acquisition Emergency Act <strong>of</strong> 2009”<br />
LOCAL FUND: FY 2010 Proposed <strong>Budget</strong> and FTE 39,625 563.3<br />
SPECIAL PURPOSE REVENUE FUNDS: FY 2009 Approved <strong>Budget</strong> and FTE 2,492 9.9<br />
Initial and Baseline Adjustments<br />
Net effect <strong>of</strong> fixed cost adjustments - Funding adjustments Recreational Programs -525 0.0<br />
for OPM estimates<br />
Net effect <strong>of</strong> salary and benefits changes - Salary step and o<strong>the</strong>r personal Park & Facility Management 275 2.6<br />
services funding adjustments<br />
Intra-<strong>Agency</strong> Changes - Adjustments in supplies, contractual services, Multiple Programs 242 0.0<br />
equipment, and o<strong>the</strong>r services and charges<br />
Policy Initiatives and Cost Savings<br />
Correct - Eliminate DPR as a direct provider <strong>of</strong> childcare; subsidized childcare -471 -4.0<br />
services will continue through community-based providers under contract with<br />
OSSE Early Care and Education Administration<br />
SPECIAL PURPOSE REVENUE FUNDS: FY 2010 Proposed <strong>Budget</strong> and FTE 2,014 8.5<br />
PRIVATE GRANT FUNDS: FY 2009 Approved <strong>Budget</strong> and FTE 1,000 22.0<br />
Initial and Baseline Adjustments<br />
Net effect <strong>of</strong> salary and benefits changes - Salary step and o<strong>the</strong>r Recreational Programs -49 -3.4<br />
personal services funding adjustments<br />
Policy Initiatives and Cost Savings<br />
Eliminate - Eliminate DPR as a direct provider <strong>of</strong> childcare; subsidized Speciality & Targeted Programs -951 -18.6<br />
childcare services will continue through community-based providers<br />
under contract with OSSE Early Care and Education Administration<br />
PRIVATE GRANT FUNDS: FY 2010 Proposed <strong>Budget</strong> and FTE 0 0.0<br />
INTRA-DISTRICT FUNDS: FY 2009 Approved <strong>Budget</strong> and FTE<br />
Initial and Baseline Adjustments<br />
9,326 121.0<br />
Net effect <strong>of</strong> fixed cost adjustments - Funding adjustments for<br />
OPM estimate<br />
Recreational Programs -387 0.0<br />
Net effect <strong>of</strong> salary and benefits changes - Salary step and o<strong>the</strong>r<br />
personal services funding adjustments<br />
Recreational Programs -1,165 -33.1<br />
Intra-<strong>Agency</strong> Changes - Funding adjustments in contractual services,<br />
supplies, equipment, and o<strong>the</strong>r services and charges<br />
(Continued on <strong>the</strong> next page)<br />
Recreational Programs 3,499 0.0<br />
FY 2010 Proposed <strong>Budget</strong> and <strong>Financial</strong> Plan<br />
E-86
Table HA0-5 (continued)<br />
(dollars in thousands)<br />
Program BUDGET FTE<br />
Policy Initiatives and Cost Savings<br />
Eliminate - Eliminate DPR as a direct provider <strong>of</strong> childcare; subsidized Recreational Programs -5,100 -84.9<br />
childcare services will continue through community-based providers<br />
under contract with OSSE Early Care and Education Administration<br />
Enhance - With NIF funds transferred from DMPED, improve playground Recreational Programs 600 0.0<br />
equipment and green space in Shepherd Park<br />
Correct - Align budget with programmatic operations Recreational Programs -167 0.0<br />
Gap-Closing Initiatives<br />
Reduce - Reduce dedicated grant Park & Facility Management -150 0.0<br />
INTRA-DISTRICT FUNDS: FY 2010 Proposed <strong>Budget</strong> and FTE 6,457 3.0<br />
Gross for HA0 - Department <strong>of</strong> Parks and Recreation 48,095 574.8<br />
<strong>Agency</strong> Performance Plan<br />
The agency’s Performance Plan has <strong>the</strong> following<br />
objectives for FY 2010:<br />
Objective 1: Increase <strong>the</strong> number and variety <strong>of</strong> program<br />
<strong>of</strong>ferings and increase <strong>the</strong> participation rates for<br />
all age groups.<br />
Objective 2: Increase <strong>the</strong> number <strong>of</strong> <strong>of</strong>ferings for <strong>the</strong><br />
District’s special needs and senior populations.<br />
Objective 3: Preserve and enhance <strong>the</strong> District’s natural<br />
resources including, urban forests, public open<br />
spaces, athletic fields, and landscaped parks.<br />
Objective 4: Plan, build, and maintain cost-effective<br />
quality recreational facilities.<br />
Department <strong>of</strong> Parks and Recreation<br />
E-87
<strong>Agency</strong> Performance Measures<br />
Table HA0-6<br />
FY 2007 FY 2008 FY 2008<br />
Year-End Original Year-End FY 2009 FY 2010 FY 2011<br />
Measure<br />
Objective 1:<br />
Actual* Target Actual Projection Projection Projection<br />
Percent <strong>of</strong> participants involved in on-going partner-led<br />
programs<br />
N/A 1,000 1,700 2,000 2,200 2,400<br />
Value <strong>of</strong> grant funding for after-school programs $0 $500,000 $750,000 $750,000 $1 mil. $1.25 mil.<br />
Value <strong>of</strong> funding received from corporate sponsors $942,805 $3 mil. $1,437,408 $4 mil. $5 mil. $5.5 mil.<br />
Percent <strong>of</strong> DPR youth sports & fitness enrollments female 36% 45% 46% 50% 50% 55%<br />
Percent <strong>of</strong> DPR youth sports & fitness enrollments 6,189 12,000 8,394 16,000 20,000 21,500<br />
Percent <strong>of</strong> adult sports & fitness enrollments 1,034 3,000 1,234 5,000 7,000 7,500<br />
Percent <strong>of</strong> Cooperative Play programs 10 10 10 14 16 18<br />
Percent <strong>of</strong> Little Explorer camps 13 25 25 28 31 31<br />
Combined numbers <strong>of</strong> Masters and Challengers Programs 0 0 0 8 12 16<br />
Percent <strong>of</strong> meals reimbursed 28% 50% 95% 95% 95% 95%<br />
Percent <strong>of</strong> meals served 845,565 900,000 1,126,682 1,147,138 1,160,482 1,164,345<br />
Percent <strong>of</strong> early/before- & after-care slots vacant 10% 0% 20% 0% 0% 0%<br />
Percent <strong>of</strong> early/before- & after-care slots<br />
Objective 2<br />
786 774 774 800 825 850<br />
Percent <strong>of</strong> Dog Exercise areas designed and constructed N/A 3 2 4 2 2<br />
Percent <strong>of</strong> ball fields serviced each 3-week cycle N/A 100% 100% 100% 100% 100%<br />
Percent <strong>of</strong> ball fields maintained N/A 78 80 82 83 83<br />
Percent <strong>of</strong> new “adopt-a-park” agreements N/A 15 1 15 15 15<br />
Objective 3<br />
Number <strong>of</strong> DPR recreation centers rated Good or<br />
Excellent on DPR’s Facility Condition Index<br />
(based on 62 recreation centers)<br />
Percent <strong>of</strong> corrective maintenance work orders closed<br />
13 15 13 19 26 28<br />
within 30 days 44% 50% 67% 60% 70% 72%<br />
Number <strong>of</strong> corrective maintenance work orders<br />
Percent <strong>of</strong> preventative maintenance tasks performed as<br />
1,966 2,000 2,862 1,900 1,800 1,600<br />
scheduled 57% 60% 43% 60% 70% 75%<br />
Number <strong>of</strong> preventive maintenance tasks scheduled<br />
Objective 4:<br />
Percent <strong>of</strong> reimbursable meals per month for <strong>the</strong> Child<br />
0 500 720 1,000 1,200 1000<br />
and Adult USDA Feeding Program<br />
Percent <strong>of</strong> <strong>the</strong>rapeutic recreation program participants<br />
N/A N/A N/A N/A TBD TBD<br />
who utilize facilities more than once a week. N/A N/A N/A N/A TBD TBD<br />
FY 2010 Proposed <strong>Budget</strong> and <strong>Financial</strong> Plan<br />
E-88
D.C. <strong>Office</strong> on Aging<br />
www.dcoa.dc.gov<br />
Telephone: 202-724-5622<br />
The mission <strong>of</strong> <strong>the</strong> District <strong>of</strong> Columbia <strong>Office</strong> on Aging (DCOA) is<br />
to promote longevity, independence, dignity and a choice for District<br />
<strong>of</strong> Columbia residents who are age 60 and older by <strong>of</strong>fering wellness<br />
programs that promote healthy lifestyles.<br />
Summary <strong>of</strong> Services<br />
DCOA is committed to <strong>the</strong> wellness <strong>of</strong> DC seniors<br />
and promotes healthy aging and self-care practices to<br />
support independent living. DCOA provides a broad<br />
range <strong>of</strong> supportive services and activities that prevents<br />
premature institutionalization, e.g., in-home<br />
services for <strong>the</strong> frail; daily nutrition program training<br />
and placement for those who are more than 55 years<br />
(BY0)<br />
% Change<br />
FY 2008 FY 2009 FY 2010 from<br />
Description Actual Approved Proposed FY 2009<br />
Operating <strong>Budget</strong> $24,827,611 $24,401,378 $23,003,914 -5.7<br />
FTEs 29.0 28.5 27.5 -3.5<br />
old and seeking employment; assistance in finding<br />
housing; transportation; and o<strong>the</strong>r supportive programs<br />
and services that keep <strong>the</strong> seniors in a community<br />
setting for as long as possible.<br />
The agency’s FY 2010 proposed budget is presented<br />
in <strong>the</strong> following tables:<br />
District <strong>of</strong> Columbia <strong>Office</strong> on Aging<br />
E-89
FY 2010 Proposed Gross Funds Operating <strong>Budget</strong>, by Revenue Type<br />
Table BY0-1 contains <strong>the</strong> proposed FY 2010 agency budget compared to <strong>the</strong> FY 2009 approved budget. It also<br />
provides FY 2007 and FY 2008 actual expenditures.<br />
Table BY0-1<br />
(dollars in thousands)<br />
Actual Actual Approved Proposed<br />
Change<br />
from Percent<br />
Appropriated Fund<br />
General Fund<br />
FY 2007 FY 2008 FY 2009 FY 2010 FY 2009 Change*<br />
Local Funds 16,460 17,198 17,525 16,218 -1,307 -7.5<br />
Total for General Fund 16,460 17,198 17,525 16,218 -1,307 -7.5<br />
Federal Resources<br />
Federal Grant Funds 6,672 6,678 6,601 6,786 184 2.8<br />
Total for Federal Resources 6,672 6,678 6,601 6,786 184 2.8<br />
Intra-District Funds<br />
Intra-District Funds 300 951 275 0 -275 -100.0<br />
Total for Intra-District Funds 300 951 275 0 -275 -100.0<br />
Gross Funds 23,432 24,828 24,401 23,004 -1,397 -5.7<br />
*Percent Change is based on whole dollars.<br />
Note: If applicable, for a breakdown <strong>of</strong> each Grant (Federal and Private), Special Purpose Revenue type and Intra-District agreement,<br />
please refer to Schedule 80 <strong>Agency</strong> Summary by Revenue Source in <strong>the</strong> Operating Appendices located on <strong>the</strong> <strong>Office</strong> <strong>of</strong> <strong>the</strong> <strong>Chief</strong><br />
<strong>Financial</strong> <strong>Office</strong>r’s website.<br />
FY 2010 Proposed Full-Time Equivalents, by Revenue Type<br />
Table BY0-2 contains <strong>the</strong> proposed FY 2010 FTE level compared to <strong>the</strong> FY 2009 approved FTE level by revenue<br />
type. It also provides FY 2007 and FY 2008 actual data.<br />
Table BY0-2<br />
Change<br />
Actual Actual Approved Proposed from Percent<br />
Appropriated Fund FY 2007 FY 2008 FY 2009 FY 2010 FY 2009 Change<br />
General Fund<br />
Local Funds 12.0 17.7 15.5 17.5 2.0 12.9<br />
Total for General Fund 12.0 17.7 15.5 17.5 2.0 12.9<br />
Federal Resources<br />
Federal Grant Funds 9.0 8.4 10.0 10.0 0.0 0.0<br />
Total for Federal Resources 9.0 8.4 10.0 10.0 0.0 0.0<br />
Intra-District Funds<br />
Intra-District Funds 3.0 3.0 3.0 0.0 -3.0 -100.0<br />
Total for Intra-District Funds 3.0 3.0 3.0 0.0 -3.0 -100.0<br />
Total Proposed FTEs 24.0 29.0 28.5 27.5 -1.0 -3.5<br />
FY 2010 Proposed <strong>Budget</strong> and <strong>Financial</strong> Plan<br />
E-90
FY 2010 Proposed Operating <strong>Budget</strong>, by Comptroller Source Group<br />
Table BY0-3 contains <strong>the</strong> proposed FY 2010 budget at <strong>the</strong> Comptroller Source Group (object class) level compared<br />
to <strong>the</strong> FY 2009 approved budget. It also provides FY 2007 and FY 2008 actual expenditures.<br />
Table BY0-3<br />
(dollars in thousands)<br />
Change<br />
Actual Actual Approved Proposed from Percent<br />
Comptroller Source Group FY 2007 FY 2008 FY 2009 FY 2010 FY 2009 Change*<br />
11 Regular Pay - Cont Full Time 1,703 1,429 2,058 1,737 -321 -15.6<br />
12 Regular Pay - O<strong>the</strong>r 109 578 164 393 229 140.3<br />
13 Additional Gross Pay 68 51 0 0 0 N/A<br />
14 Fringe Benefits - Curr Personnel 307 365 427 419 -8 -1.9<br />
15 Overtime Pay 9 0 0 0 0 N/A<br />
Subtotal Personal Services (PS) 2,195 2,424 2,648 2,549 -99 -3.8<br />
20 Supplies and Materials 76 166 113 178 66 58.2<br />
30 Energy, Comm. and Bldg Rentals 45 49 47 124 77 165.6<br />
31 Telephone, Telegraph, Telegram, Etc 17 28 21 41 20 98.0<br />
32 Rentals - Land and Structures 0 -3 0 159 159 N/A<br />
33 Janitorial Services 15 21 27 23 -4 -15.9<br />
34 Security Services 26 23 25 20 -5 -18.8<br />
35 Occupancy Fixed Costs 40 56 56 96 40 72.5<br />
40 O<strong>the</strong>r Services and Charges 96 358 281 299 18 6.4<br />
41 Contractual Services - O<strong>the</strong>r 4,683 5,660 5,720 5,215 -505 -8.8<br />
50 Subsidies and Transfers 16,048 15,813 15,232 14,210 -1,021 -6.7<br />
70 Equipment & Equipment Rental 193 134 233 90 -143 -61.3<br />
91 Expense Not <strong>Budget</strong>ed O<strong>the</strong>rs 0 98 0 0 0 N/A<br />
Subtotal Nonpersonal Services (NPS) 21,237 22,404 21,753 20,455 -1,298 -6.0<br />
Gross Funds 23,432 24,828 24,401 23,004 -1,397 -5.7<br />
*Percent Change is based on whole dollars.<br />
Program Description<br />
The District <strong>of</strong> Columbia <strong>Office</strong> on Aging operates<br />
through <strong>the</strong> following 4 programs:<br />
In-Home and Continuing Care – provides in-home<br />
and day care services and caregiver support to District<br />
residents 60 years and over and <strong>the</strong>ir caregivers so that<br />
seniors may remain in <strong>the</strong>ir homes. The In-Home<br />
and Continuing Care program provides day care,<br />
homemaker assistance, nutritional information, and<br />
case management to seniors while also providing education,<br />
respite, stipends, and transportation services to<br />
eligible caregivers so that <strong>the</strong>y can continue to provide<br />
care.<br />
This program contains <strong>the</strong> following 2 activities:<br />
■ In-Home & Daycare Services – provides day<br />
care, homemaker assistance, nutrition, and case<br />
management to frail District residents 60 years <strong>of</strong><br />
age and older so that <strong>the</strong>y may remain in <strong>the</strong>ir<br />
homes; and<br />
■ Caregivers Support – provides caregiver education,<br />
respite, stipends, and transportation services<br />
to eligible caregivers so that <strong>the</strong>y can continue to<br />
provide care.<br />
District <strong>of</strong> Columbia <strong>Office</strong> on Aging<br />
E-91
Consumer Information, Assistance & Outreach -<br />
provides information to seniors, caregivers and <strong>the</strong><br />
District’s community about available assistance, special<br />
events, training, educational opportunities, and<br />
employment services specifically targeted for seniors<br />
so that <strong>the</strong>y are informed about current aging issues<br />
and support senior independence.<br />
This program contains <strong>the</strong> following 3 activities:<br />
■ Employment Services – provides employment<br />
assistance services to District residents who are at<br />
least 55 and are seeking to gain and maintain<br />
employment;<br />
■ Special Events – provides socialization, information<br />
and recognition services to District residents<br />
60 and over that increase awareness <strong>of</strong> services<br />
provided, expand <strong>the</strong>ir social network, and project<br />
a positive image <strong>of</strong> aging; and<br />
■ Training and Education – provides training services<br />
to seniors, service providers, and <strong>the</strong> general<br />
public so that <strong>the</strong>y can enhance <strong>the</strong>ir knowledge<br />
and increase <strong>the</strong>ir skills about elderly issues.<br />
Community-Based Support - provides residential<br />
facilities, elder rights assistance, health promotion,<br />
congregate meals, transportation, and wellness and<br />
community services to senior District residents with<br />
<strong>the</strong> purpose <strong>of</strong> increasing independent living in <strong>the</strong><br />
community and maintaining minimal institutionalization.<br />
This program contains <strong>the</strong> following 4 activities:<br />
■ Health Promotion and Wellness – provides physical<br />
fitness, health screenings and wellness information<br />
services to District residents 60 and over<br />
so that <strong>the</strong>y can increase <strong>the</strong>ir awareness <strong>of</strong> and<br />
adopt health behaviors;<br />
■ Community Services – provides nutrition, transportation,<br />
socialization, legal services and counseling<br />
support services to District residents 60 or<br />
older so that <strong>the</strong>y can maintain an active and<br />
independent lifestyle;<br />
■ Supportive Residential Facilities – provides housing,<br />
advocacy, and supportive service to District<br />
residents 60 and older who cannot live independently<br />
and/or have limited housing options so<br />
that <strong>the</strong>y can be safe and receive care that meets<br />
<strong>the</strong>ir needs; and<br />
FY 2010 Proposed <strong>Budget</strong> and <strong>Financial</strong> Plan<br />
E-92<br />
■ Advocacy/Elder Rights – supports elder rights<br />
protection and adult protective service activities<br />
that concur with relevant state laws; also provides<br />
public education regarding elder abuse and assists<br />
in resolving complaints between residents/families<br />
and nursing homes and o<strong>the</strong>r community residential<br />
facilities for seniors.<br />
<strong>Agency</strong> Management - provides for administrative<br />
support and <strong>the</strong> required tools to achieve operational<br />
and programmatic results. This program is standard<br />
for all agencies using performance-based budgeting.<br />
Program Structure Change<br />
The District <strong>of</strong> Columbia <strong>Office</strong> on Aging had no<br />
program structure changes in <strong>the</strong> FY 2010 Proposed<br />
<strong>Budget</strong>.
FY 2010 Proposed Operating <strong>Budget</strong> and FTEs, by Program and Activity<br />
Table BY0-4 contains <strong>the</strong> proposed FY 2010 budget by program and activity compared to <strong>the</strong> FY 2009 approved budget.<br />
It also provides FY 2008 actual data.<br />
Table BY0-4<br />
(dollars in thousands)<br />
Dollars in Thousands Full-Time Equivalents<br />
Change Change<br />
Actual Approved Proposed from Actual Approved Proposed from<br />
Program/Activity<br />
(1000) <strong>Agency</strong> Management Services<br />
FY 2008 FY 2009 FY 2010 FY 2009 FY 2008 FY 2009 FY 2010 FY 2009<br />
(1010) AMP-Personnel Costs Activity 2,035 2,929 2,695 -234 29.0 28.5 27.5 -1.0<br />
(1020) AMP-Contract & Procurement Activity 33 40 77 37 0.0 0.0 0.0 0.0<br />
(1030) AMP-Property Management 190 189 530 342 0.0 0.0 0.0 0.0<br />
(1040) AMP-Contract & Procurement Activity 435 836 820 -16 0.0 0.0 0.0 0.0<br />
(1087) AMP-Language Access 5 10 10 0 0.0 0.0 0.0 0.0<br />
Subtotal (1000) <strong>Agency</strong> Management Services 2,698 4,003 4,132 129 29.0 28.5 27.5 -1.0<br />
(9200) Consumer Information, Assistance & Outreach<br />
(9205) Activity: Employment Services 528 340 315 -25 0.0 0.0 0.0 0.0<br />
(9215) Activity: Special Events 263 263 223 -40 0.0 0.0 0.0 0.0<br />
(9220) Activity: Training & Education 1,273 474 508 34 0.0 0.0 0.0 0.0<br />
Subtotal (9200) Consumer Info., Assistance & Outreach<br />
(9300) In-Home & Continuing Care Program<br />
2,063 1,076 1,046 -31 0.0 0.0 0.0 0.0<br />
(9325) Activity: In-Home & Daycare Services 7,143 7,117 5,984 -1,133 0.0 0.0 0.0 0.0<br />
(9330) Activity: Caregivers Support 755 847 787 -60 0.0 0.0 0.0 0.0<br />
Subtotal (9300) In-Home & Continuing Care Program<br />
(9400) Community-Based Support Program<br />
7,898 7,963 6,770 -1,193 0.0 0.0 0.0 0.0<br />
(9440) Activity: Health Prom. & Wellness 3,122 2,291 2,266 -25 0.0 0.0 0.0 0.0<br />
(9450) Activity: Community Services 7,768 7,765 7,582 -182 0.0 0.0 0.0 0.0<br />
(9470) Activity: Supportive Resid. facility 681 729 729 0 0.0 0.0 0.0 0.0<br />
(9480) Activity: Advocacy/Elder Rights 598 574 478 -96 0.0 0.0 0.0 0.0<br />
Subtotal (9400) Community-Based Support Program 12,169 11,358 11,055 -303 0.0 0.0 0.0 0.0<br />
Total Proposed Operating <strong>Budget</strong> 24,828 24,401 23,004 -1,397 29.0 28.5 27.5 -1.0<br />
(Change is calculated by whole numbers and numbers may not add up due to rounding)<br />
Note: For more detailed information regarding <strong>the</strong> proposed funding for <strong>the</strong> activities within this agency’s programs, please see Schedule 30-PBB<br />
Program Summary by Activity in <strong>the</strong> FY 2010 Operating Appendices located on <strong>the</strong> <strong>Office</strong> <strong>of</strong> <strong>the</strong> <strong>Chief</strong> <strong>Financial</strong> <strong>Office</strong>r’s website.<br />
District <strong>of</strong> Columbia <strong>Office</strong> on Aging<br />
E-93
Major Baseline Adjustments, Cost Savings<br />
and Policy Initiatives<br />
Initial Adjustments: DCOA faced an overall increase<br />
<strong>of</strong> 173.6 percent in fixed costs and had to adjust its<br />
sub-grantee agreements in order to support <strong>the</strong><br />
increase.<br />
Cost Savings: In FY 2010, DCOA will implement an<br />
initiative to provide transportation more efficiently<br />
that will result in cost savings. First, through obtaining<br />
Medicaid certification for eligible Washington<br />
Elderly Handicapped Transportation Service<br />
(WEHTS) trips, DCOA will save approximately<br />
$50,000 through Federal Medicaid reimbursements.<br />
Second, DCOA will bring <strong>the</strong> remainder <strong>of</strong> its vehicles<br />
currently operated by grantees under <strong>the</strong><br />
Department <strong>of</strong> Public Works fleet management, this<br />
change will reduce fuel, maintenance and insurance<br />
costs and save approximately $85,000. Third,<br />
improved coordination <strong>of</strong> transportation services<br />
funded by DCOA and previously provided by <strong>the</strong><br />
Department <strong>of</strong> Parks and Recreation (DPR) will also<br />
generate efficiencies, <strong>the</strong> cost for this service will be<br />
cut in half by using DCOA vehicles and contracting<br />
with DPR or private providers as necessary, saving<br />
$50,000 annually.<br />
By aligning <strong>the</strong> budgets for congregate and homedelivered<br />
meals for homebound seniors with current<br />
utilization, DCOA will achieve savings <strong>of</strong> $530,000<br />
annually. Nei<strong>the</strong>r program currently has a waiting list<br />
for participation and any additional recession-driven<br />
demand will be supported by federal stimulus funds.<br />
Similarly, <strong>the</strong> budget for senior day care services at <strong>the</strong><br />
Washington Center for Aging Services (for seniors<br />
without o<strong>the</strong>r sources <strong>of</strong> insurance coverage) will be<br />
aligned with utilization. Matching funding with historic<br />
and projected spending on this service will save<br />
$325,000 annually.<br />
Fur<strong>the</strong>r savings will be achieved as part <strong>of</strong><br />
District-wide consolidation <strong>of</strong> public affairs staff<br />
duties within DCOA, saving $68,213. Finally, aligning<br />
DCOA’s electricity, telecom, occupancy, fleet and<br />
procurement assessment budgets with revised estimates<br />
will save $47,993.<br />
Protected Programs: The FY 2010 budget retains<br />
funding to support <strong>the</strong> essential and life-sustaining<br />
services for District seniors provided by DCOA and<br />
its grantees. This budget proposes constant funding<br />
levels for services including: transportation to medical<br />
treatments and o<strong>the</strong>r appointments; case manage-<br />
FY 2010 Proposed <strong>Budget</strong> and <strong>Financial</strong> Plan<br />
E-94<br />
ment; senior centers; operation and management <strong>of</strong><br />
<strong>the</strong> Aging and Disability Resource Center; homemaker<br />
and health aides; monitoring and oversight <strong>of</strong> <strong>the</strong><br />
two District-owned nursing homes; and wellness/health<br />
promotion programs.<br />
This budget also supports <strong>the</strong> continuation <strong>of</strong> citywide<br />
social events for seniors and advertising in <strong>the</strong><br />
local newspaper publication that focuses on area<br />
seniors. The city-wide events have proven to be successful,<br />
positive and a valuable way for <strong>the</strong> District’s<br />
seniors to interact; while <strong>the</strong> advertisements are a useful<br />
and effective method <strong>of</strong> disseminating information<br />
to <strong>the</strong> senior population. The majority <strong>of</strong> this funding<br />
was supported by a transfer in <strong>of</strong> $700,000 from <strong>the</strong><br />
Department <strong>of</strong> Public Works; <strong>the</strong>se funds have been<br />
designated as one-time funding.<br />
Policy Initiatives: A proposed Local Funds enhancement<br />
<strong>of</strong> $142,000 will ensure continued operation <strong>of</strong><br />
DCOA’s senior employment services program, which<br />
provides job search assistance and vocational skills<br />
training to District seniors. This enhancement, along<br />
with reprogrammed DCOA funds, will retain three<br />
staff who serve more than 500 seniors annually.<br />
In an effort to intensify outreach and encourage<br />
improved elder rights advocacy, a one-time increase <strong>of</strong><br />
$377,000, which is incorporated in <strong>the</strong> previously<br />
mentioned $700,000 <strong>of</strong> one-time funding, has been<br />
focused in <strong>the</strong>se areas. An additional $25,000 is designated<br />
as one-time funding dedicated to <strong>the</strong> seniors <strong>of</strong><br />
Ward 2. All grantees and amounts listed in this budget<br />
are subject to final approval in <strong>the</strong> Fiscal Year 2010<br />
<strong>Budget</strong> Support Act <strong>of</strong> 2009, Bill Number 18-203,<br />
which supersedes this listing upon its effective date.<br />
Stimulus: DCOA will use approximately $250,000 in<br />
federal funds from <strong>the</strong> American Recovery and<br />
Reinvestment Act <strong>of</strong> 2009 for its congregate and<br />
home-delivered meal services to accommodate any<br />
increase in demand resulting from worsening economic<br />
conditions. Special outreach and in-home assessments<br />
will be conducted by DCOA grantees to identify<br />
new eligible homebound customers.<br />
Gap-Closing Initiatives: The proposed FY 2010 gapclosing<br />
budget reduces Local funding for non-competitive<br />
grant appropriations to DCOA, saving $25,000.<br />
Reductions in activities supporting senior day care,<br />
outreach events, and elder rights advocacy have been<br />
contracted, saving $688,338. A reduction in <strong>the</strong><br />
agency’s supply budget will yield an additional savings<br />
<strong>of</strong> $60,000.
FY 2009 Approved <strong>Budget</strong> to FY 2010 Proposed <strong>Budget</strong>, by Revenue Type<br />
Table BY0-5 itemizes <strong>the</strong> changes by revenue type between <strong>the</strong> FY 2009 approved budget and <strong>the</strong> FY 2010 proposed<br />
budget. The four categories <strong>of</strong> changes reflected in this table are: (1) changes to <strong>the</strong> baseline budget (includes<br />
agency request), (2) changes representing cost savings or efficiencies, (3) changes related to policy initiatives, and (4)<br />
changes to specifically address <strong>the</strong> projected revenue shortfall.<br />
Table BY0-5<br />
(dollars in thousands)<br />
PROGRAM BUDGET FTE<br />
LOCAL FUND: FY 2009 Approved <strong>Budget</strong> and FTE 17,525 15.5<br />
Initial and Baseline Adjustments<br />
Net effect <strong>of</strong> fixed cost adjustments - Changes in commodities for <strong>Agency</strong> Management Services 573 0.0<br />
Energy, Telecom, Rentals, Janitorial, Security and Occupancy<br />
Net effect <strong>of</strong> salary and benefits changes - Increases in Personal <strong>Agency</strong> Management Services 26 0.0<br />
Services<br />
Intra-<strong>Agency</strong> Changes - Changes in Supplies, Equipment, Subsidies Multiple -899 0.0<br />
and Transfers and O<strong>the</strong>r Services and Charges<br />
Baseline Adjustments: Net effect <strong>of</strong> fixed cost adjustments - Decrease in <strong>Agency</strong> Management Services -235 0.0<br />
Energy, Janitorial, Security, and Occupancy Commodities<br />
Baseline Adjustments: Net effect <strong>of</strong> fixed cost adjustments - Increases in Multiple 235 0.0<br />
Subsidies and Transfers and O<strong>the</strong>r Services and Charges<br />
Policy Initiatives and Cost Savings<br />
Cost Decrease - Align Electricity budget with revised OPM estimates <strong>Agency</strong> Management Services -2 0.0<br />
Cost Decrease - Align Occupancy budget with revised OPM estimates <strong>Agency</strong> Management Services -9 0.0<br />
Cost Decrease - Align procurement assessment with revised OCP<br />
estimates<br />
<strong>Agency</strong> Management Services -2 0.0<br />
Cost Increase - Assign costs <strong>of</strong> senior employment program transitioning<br />
from DOES to DCOA<br />
<strong>Agency</strong> Management Services 142 3.0<br />
Reduce - Reduce communications support for DCOA, shift<br />
responsibilities to remaining staff<br />
<strong>Agency</strong> Management Services -68 -1.0<br />
Cost Increase - Implement city-wide senior events (one-time) Consumer Information,<br />
Assistance and Outreach<br />
48 0.0<br />
Cost Increase - Retain current level <strong>of</strong> local advertising Consumer Information,<br />
Assistance and Outreach<br />
14 0.0<br />
Cost Decrease - Align home-delivered meal funding with utilization In-Home & Continuing<br />
Care Program<br />
-365 0.0<br />
Cost Decrease - Consolidate DCOA-owned, grantee-operated vehicles In-Home & Continuing -60 0.0<br />
under DPW fleet management Care Program<br />
Enhance - Supplement In-Home services provided to seniors (one-time) In-Home & Continuing<br />
Care Program<br />
175 0.0<br />
Enhance - Intensify outreach and elder rights advocacy (one-time) Community-Based Support<br />
Program<br />
502 0.0<br />
Cost Increase - Align Telecom budget with revised OCTO estimates <strong>Agency</strong> Management Services 7 0.0<br />
Cost Decrease - Align congregate meal funding with utilization<br />
(Continued on next page)<br />
In-Home & Continuing Care<br />
Program<br />
-165 0.0<br />
District <strong>of</strong> Columbia <strong>Office</strong> on Aging<br />
E-95
Table BY0-5 (continued)<br />
(dollars in thousands)<br />
PROGRAM BUDGET FTE<br />
Policy Initiatives and Cost Savings (continued)<br />
Cost Decrease - Align senior day care service funding with utilization In-Home & Continuing Care -325 0.0<br />
Program<br />
Cost Decrease - Align Fleet budget with revised DPW estimates Community-Based Support -25 0.0<br />
Program<br />
Cost Decrease - Obtain federal Medicaid reimbursement for eligible Community-Based -50 0.0<br />
WEHTS transportation services Support Program<br />
Cost Decrease - Reduce transportation costs by Community-Based -50 0.0<br />
improved DCOA coordination <strong>of</strong> senior transportation Support Program<br />
services previously provided by DPR<br />
Correct - Assign costs <strong>of</strong> senior employment services to <strong>the</strong> correct In-Home & Continuing -174 0.0<br />
program and activity Care Program<br />
Correct - Assign costs <strong>of</strong> senior employment services to <strong>the</strong> correct Consumer Information, 174 0.0<br />
program and activity Assistance and Outreach<br />
Gap-Closing Initiatives<br />
Reduce - Reduce Non-Competitive grants Community-Based Support -25 0.0<br />
Program<br />
Reduce - Reduce funding for senior outreach and advertisements Consumer Info.,Assistance -111 0.0<br />
senior day care services & Outreach<br />
Reduce - Reduce one-time funding for activities related to Inhome & Continuing Care -100 0.0<br />
senior day care Program<br />
Reduce - Reduce one-time funding for outreach events Community-Based Support -477 0.0<br />
and elder rights advocacy Program<br />
Reduce - Reduce funding for agency supplies <strong>Agency</strong> Management Services -60 0.0<br />
LOCAL FUND: FY 2010 Proposed <strong>Budget</strong> and FTE 16,218 17.5<br />
FEDERAL GRANT FUNDS: FY 2009 Approved <strong>Budget</strong> and FTE 6,601 10.0<br />
Initial and Baseline Adjustments<br />
Net effect <strong>of</strong> salary and benefits changes - Decrease in Personnal Services <strong>Agency</strong> Management Services -66 0.0<br />
Policy Initiatives and Cost Savings<br />
Enhance - Add Recovery Act funds for congregate and home- In-Home & Continuing 250 0.0<br />
delivered meals Care Program<br />
FEDERAL GRANT FUNDS: FY 2010 Proposed <strong>Budget</strong> and FTE 6,786 10.0<br />
INTRA-DISTRICT FUNDS: FY 2009 Approved <strong>Budget</strong> and FTE 275 3.0<br />
Initial and Baseline Adjustments<br />
Net effect <strong>of</strong> salary and benefits changes - Increase in Personal <strong>Agency</strong> Management Services 9 0.0<br />
Services<br />
Policy Initiatives and Cost Savings<br />
Transfer Out - Reduce 3 Intra-District-funded FTEs to reflect transfer <strong>of</strong> Consumer Information, -284 -3.0<br />
funding for senior employment services from DOES Intra-District to Assistance and Outreach<br />
DCOA funding<br />
INTRA-DISTRICT FUNDS: FY 2010 Proposed <strong>Budget</strong> and FTE 0 0.0<br />
Gross for BY0 - D. C. <strong>Office</strong> on Aging 23,004 27.5<br />
FY 2010 Proposed <strong>Budget</strong> and <strong>Financial</strong> Plan<br />
E-96
<strong>Agency</strong> Performance Plan<br />
The agency’s Performance Plan has <strong>the</strong> following<br />
objectives for FY 2010:<br />
Objective 1: To establish “Wellness”, healthy aging<br />
and self-care practices as community-wide goals for<br />
elderly individuals, to help seniors stay well and help<br />
those who have become ill or disabled to keep physical<br />
and mental limitations from becoming insurmountable<br />
impediments to independent living.<br />
Objective 2: Ensure that older adults, who want to<br />
work, or for economic reasons need to return to <strong>the</strong><br />
workforce, are trained, placed, and employed.<br />
Objective 3: Provide consumer information, assistance<br />
and outreach for older persons and persons with<br />
disabilities to improve access to, and make more<br />
informed decisions about <strong>the</strong>ir health, housing, transportation<br />
and long-term care services and needs.<br />
Objective 4: Develop, implement, and evaluate new<br />
opportunities and initiatives to improve access to services;<br />
expand resources that are available for seniors;<br />
and develop alternatives to institutional care.<br />
District <strong>of</strong> Columbia <strong>Office</strong> on Aging<br />
E-97
<strong>Agency</strong> Performance Measures<br />
Table BY0-6<br />
FY 2007 FY 2008 FY 2008<br />
Year-End Original Year-End FY 2009 FY 2010 FY 2011<br />
Measure<br />
Objective 1:<br />
Number <strong>of</strong> seniors receiving health promotion,<br />
nutrition education and counseling programs at<br />
Actual Target Actual Projection Projection Projection<br />
centers and network sites<br />
Percentage <strong>of</strong> persons requesting and receiving<br />
4,137 4,500 11,512 12,000 13,000 14,000<br />
nutritious meals<br />
Percentage <strong>of</strong> wellness center participants who<br />
increase <strong>the</strong>ir awareness and adopt healthy behaviors<br />
as identified by improvements in <strong>the</strong>ir overall health<br />
99% 90% 99% 98% 98% 98%<br />
(measure changed in FY 2008) 85% 40% N/A 60% 62% 65%<br />
Objective 2:<br />
Percentage <strong>of</strong> seniors seeking employment and<br />
received job placements<br />
Objective 3:<br />
Number <strong>of</strong> elderly and disabled customers served<br />
53% 40% 54% 55% 56% 60%<br />
for all services<br />
Objective 4:<br />
Number <strong>of</strong> customers tracked and entered in<br />
NA NA 100+ 450 650 700<br />
database for all services<br />
Number <strong>of</strong> youths involved in inter-generational<br />
49,664 TBA 21,695 25,000 30,000 31,000<br />
programs<br />
Percentage <strong>of</strong> <strong>the</strong> elderly 60 & older who remain<br />
in <strong>the</strong>ir home and age in place as a result <strong>of</strong><br />
N/A N/A 3,187 3,300 3,600 4,000<br />
supportive services & community-based care<br />
Percentage <strong>of</strong> site plan completed for elderly<br />
N/A 95% 96% 95% 95% 96%<br />
housing at WCAS<br />
Number <strong>of</strong> organized aging in place programs and<br />
N/A N/A N/A 100% N/A N/A<br />
senior villages funded and operational N/A N/A N/A 5 10 15<br />
FY 2010 Proposed <strong>Budget</strong> and <strong>Financial</strong> Plan<br />
E-98
Unemployment<br />
Compensation Fund<br />
www.does.dc.gov<br />
Telephone: 202-724-7000<br />
(BH0)<br />
% Change<br />
FY 2008 FY 2009 FY 2010 from<br />
Description Actual Approved Proposed FY 2009<br />
Operating <strong>Budget</strong> $6,459,075 $5,500,000 $11,135,748 102.5<br />
The mission <strong>of</strong> <strong>the</strong> Unemployment Compensation Fund (UCF) is to<br />
provide unemployment compensation benefits to former District government<br />
employees who have been separated from employment<br />
through no fault <strong>of</strong> <strong>the</strong>ir own.<br />
The agency’s FY 2010 proposed budget is presented in <strong>the</strong> following tables:<br />
FY 2010 Proposed Gross Funds Operating <strong>Budget</strong>, by Revenue Type<br />
Table BH0-1 contains <strong>the</strong> proposed FY 2010 agency budget compared to <strong>the</strong> FY 2009 approved budget. It also<br />
provides <strong>the</strong> FY 2007 and FY 2008 actual expenditures.<br />
Table BH0-1<br />
(dollars in thousands)<br />
Actual Actual Approved Proposed<br />
Change<br />
from Percent<br />
Appropriated Fund<br />
General Fund<br />
FY 2007 FY 2008 FY 2009 FY 2010 FY 2009 Change*<br />
Local Funds 5,250 6,459 5,500 11,136 5,636 102.5<br />
Total for General Fund 5,250 6,459 5,500 11,136 5,636 102.5<br />
Gross Funds 5,250 6,459 5,500 11,136 5,636 102.5<br />
*Percent Change is based on whole dollars.<br />
Note: If applicable, for a breakdown <strong>of</strong> each Grant (Federal and Private), Special Purpose Revenue type and Intra-District agreement,<br />
please refer to Schedule 80, <strong>Agency</strong> Summary by Revenue Source, in <strong>the</strong> Operating Appendices located on <strong>the</strong> <strong>Office</strong> <strong>of</strong> <strong>the</strong> <strong>Chief</strong><br />
<strong>Financial</strong> <strong>Office</strong>r’s website.<br />
Unemployment Compensation Fund<br />
E-99
FY 2010 Proposed Operating <strong>Budget</strong>, by Comptroller Source Group<br />
Table BH0-2 contains <strong>the</strong> proposed FY 2010 budget at <strong>the</strong> Comptroller Source Group (object class) level compared<br />
to <strong>the</strong> FY 2009 approved budget. It also provides FY 2007 and FY 2008 actual expenditures.<br />
Table BH0-2<br />
(dollars in thousands)<br />
Actual Actual Approved Proposed<br />
Change<br />
from Percent<br />
Comptroller Source Group FY 2007 FY 2008 FY 2009 FY 2010 FY 2009 Change*<br />
50 Subsidies and Transfers 5,250 6,459 5,500 11,136 5,636 102.5<br />
Subtotal Nonpersonal Services (NPS) 5,250 6,459 5,500 11,136 5,636 102.5<br />
Gross Funds 5,250 6,459 5,500 11,136 5,636 102.5<br />
*Percent Change is based on whole dollars.<br />
Program Description<br />
The Unemployment Compensation Fund operates<br />
through <strong>the</strong> following program:<br />
Unemployment Compensation Fund - provides<br />
unemployment compensation to qualified former<br />
District government employees during periods <strong>of</strong><br />
unemployment.<br />
FY 2010 Proposed Operating <strong>Budget</strong> and FTEs, by Program and Activity<br />
Table BH0-3 contains <strong>the</strong> proposed FY 2010 budget by program and activity compared to <strong>the</strong> FY 2009 approved budget.<br />
It also provides <strong>the</strong> FY 2008 actual data.<br />
Table BH0-3<br />
(dollars in thousands)<br />
Dollars in Thousands Full-Time Equivalents<br />
Change Change<br />
Actual Approved Proposed from Actual Approved Proposed from<br />
Program/Activity<br />
(1000) Unemployment Compensation Fund<br />
FY 2008 FY 2009 FY 2010 FY 2009 FY 2008 FY 2009 FY 2010 FY 2009<br />
(1100) Unemployment Compensation Fund 6,459 5,500 11,136 5,636 0.0 0.0 0.0 0.0<br />
Subtotal (1000) Unemployment Compensation Fund 6,459 5,500 11,136 5,636 0.0 0.0 0.0 0.0<br />
Total Proposed Operating <strong>Budget</strong> 6,459 5,500 11,136 5,636 0.0 0.0 0.0 0.0<br />
(Change is calculated by whole numbers and numbers may not add up due to rounding)<br />
Note: For more detailed information regarding <strong>the</strong> proposed funding for <strong>the</strong> activities within this agency’s programs, please see Schedule 30-PBB<br />
Program Summary By Activity in <strong>the</strong> FY 2010 Operating Appendices located on <strong>the</strong> <strong>Office</strong> <strong>of</strong> <strong>the</strong> <strong>Chief</strong> <strong>Financial</strong> <strong>Office</strong>r’s website.<br />
FY 2010 Proposed <strong>Budget</strong> and <strong>Financial</strong> Plan<br />
E-100<br />
Program Structure Changes<br />
The Unemployment Compensation Fund had no<br />
program structure changes in <strong>the</strong> FY 2010 Proposed<br />
<strong>Budget</strong>.
Major Baseline Adjustments, Cost Savings<br />
and Policy Initiatives<br />
Initial Adjustments: The <strong>Office</strong> <strong>of</strong> <strong>Budget</strong> and<br />
Planning (OBP) approved a technical adjustment<br />
request as a baseline adjustment for $1,635,748 to<br />
cover increased outlay <strong>of</strong> unemployment benefits to<br />
former District employees. OBP approved this based<br />
on current trends in payments and <strong>the</strong> expected needs<br />
<strong>of</strong> <strong>the</strong> UCF in FY 2010.<br />
Policy Initiatives: As an employer, <strong>the</strong> District government<br />
makes reimbursements to <strong>the</strong> District <strong>of</strong><br />
Columbia Unemployment Insurance Trust Fund for<br />
unemployment benefits paid to former District<br />
employees. As a result <strong>of</strong> <strong>the</strong> projected number <strong>of</strong><br />
separations and an increase in <strong>the</strong> average duration <strong>of</strong><br />
unemployment, <strong>the</strong> District is required to increase its<br />
reimbursements, which are made through <strong>the</strong> UCF.<br />
The proposed budget supports an estimated<br />
$4,000,000 in additional contributions to <strong>the</strong> Fund.<br />
FY 2009 Approved <strong>Budget</strong> to FY 2010 Proposed <strong>Budget</strong>, by Revenue Type<br />
Table BH0-4 itemizes <strong>the</strong> changes by revenue type between <strong>the</strong> FY 2009 approved budget and <strong>the</strong> FY 2010 proposed<br />
budget. The four categories <strong>of</strong> changes reflected in this table are: (1) changes to <strong>the</strong> baseline budget (includes<br />
agency request), (2) changes representing cost savings or efficiencies, (3) changes related to policy initiatives, and (4)<br />
changes to specifically address <strong>the</strong> projected revenue shortfall.<br />
Table BH0-4<br />
(dollars in thousands)<br />
PROGRAM BUDGET FTE<br />
LOCAL FUND: FY 2009 Approved <strong>Budget</strong> and FTE 5,500 0.0<br />
Initial and Baseline Adjustments<br />
Baseline Adjustments: Technical Adjustment - Increase to cover outlay <strong>of</strong> UCF 1,636 0.0<br />
unemployment benefits to former District employees.<br />
Policy Initiatives and Cost Savings<br />
Cost Increase - Provide additional funding as necessary to cover UCF 4,000 0.0<br />
projected increases in <strong>the</strong> District's contributions to <strong>the</strong> Unemployment<br />
Insurance Trust Fund<br />
LOCAL FUND: FY 2010 Proposed <strong>Budget</strong> and FTE 11,136 0.0<br />
Gross for BH0 - Unemployment Compensation Fund 11,136 0.0<br />
Unemployment Compensation Fund<br />
E-101
Disability Compensation Fund<br />
http://orm.dc.gov<br />
202-724-2311<br />
(BG0)<br />
% Change<br />
FY 2008 FY 2009 FY 2010 from<br />
Description Actual Approved Proposed FY 2009<br />
Operating <strong>Budget</strong> $28,219,931 $15,030,000 $25,163,172 67.4<br />
The mission <strong>of</strong> <strong>the</strong> Disability Compensation Fund is to provide fiscal<br />
resources to administer <strong>the</strong> Workers’ Compensation program for public<br />
sector employees and pay <strong>the</strong> required claims costs <strong>of</strong> eligible<br />
claimants, according to applicable District laws.<br />
The agency’s FY 2010 proposed budget is presented in <strong>the</strong> following tables:<br />
FY 2010 Proposed Gross Funds Operating <strong>Budget</strong>, by Revenue Type<br />
Table BG0-1 contains <strong>the</strong> proposed FY 2010 agency budget compared to <strong>the</strong> FY 2009 approved budget. It also<br />
provides FY 2007 and FY 2008 actual expenditures.<br />
Table BG0-1<br />
(dollars in thousands)<br />
Actual Actual Approved Proposed<br />
Change<br />
from Percent<br />
Appropriated Fund<br />
General Fund<br />
FY 2007 FY 2008 FY 2009 FY 2010 FY 2009 Change*<br />
Local Funds 24,851 28,220 15,030 25,163 10,133 67.4<br />
Total for General Fund 24,851 28,220 15,030 25,163 10,133 67.4<br />
Gross Funds 24,851 28,220 15,030 25,163 10,133 67.4<br />
*Percent Change is based on whole dollars.<br />
Note: If applicable, for a breakdown <strong>of</strong> each Grant (Federal and Private), Special Purpose Revenue type and Intra-District agreement,<br />
please refer to Schedule 80 <strong>Agency</strong> Summary by Revenue Source in <strong>the</strong> Operating Appendices located on <strong>the</strong> <strong>Office</strong> <strong>of</strong> <strong>the</strong> <strong>Chief</strong><br />
<strong>Financial</strong> <strong>Office</strong>r’s website.<br />
Disability Compensation Fund<br />
E-103
FY 2010 Proposed Operating <strong>Budget</strong>, by Comptroller Source Group<br />
Table BG0-2 contains <strong>the</strong> proposed FY 2010 budget at <strong>the</strong> Comptroller Source Group (object class) level compared<br />
to <strong>the</strong> FY 2009 approved budget. It also provides FY 2007 and FY 2008 actual expenditures.<br />
Table BG0-2<br />
(dollars in thousands)<br />
Actual Actual Approved Proposed<br />
Change<br />
from Percent<br />
Comptroller Source Group FY 2007 FY 2008 FY 2009 FY 2010 FY 2009 Change*<br />
20 Supplies and Materials 196 890 500 890 390 78.0<br />
40 O<strong>the</strong>r Services and Charges 10,485 8,742 5,500 6,248 748 13.6<br />
41 Contractual Services - O<strong>the</strong>r -27 0 0 0 0 N/A<br />
50 Subsidies and Transfers 14,168 18,580 9,030 18,000 8,970 99.3<br />
70 Equipment & Equipment Rental 29 7 0 25 25 N/A<br />
Subtotal Nonpersonal Services (NPS) 24,851 28,220 15,030 25,163 10,133 67.4<br />
Gross Funds 24,851 28,220 15,030 25,163 10,133 67.4<br />
*Percent Change is based on whole dollars.<br />
Program Description<br />
The Disability Compensation Fund operates through<br />
<strong>the</strong> following program:<br />
Employees' Disability Fund - established by <strong>the</strong><br />
District <strong>of</strong> Columbia Merit Personnel Act (D.C. Law<br />
2-139, as amended). For District employees with eligible<br />
verified claims, payments are made from <strong>the</strong><br />
fund for compensation for lost wages, medical services<br />
related to workplace injuries, and services such as<br />
vocational rehabilitation. In FY 2004, <strong>the</strong> administrative<br />
functions <strong>of</strong> <strong>the</strong> Employees’ Disability Fund<br />
were transferred to <strong>the</strong> D.C. <strong>Office</strong> <strong>of</strong> Risk<br />
Management.<br />
FY 2010 Proposed <strong>Budget</strong> and <strong>Financial</strong> Plan<br />
E-104<br />
Program Structure Change<br />
The Disability Compensation Fund had no program<br />
structure changes in <strong>the</strong> FY 2010 Proposed <strong>Budget</strong>.
FY 2010 Proposed Operating <strong>Budget</strong> and FTEs, by Program and Activity<br />
Table BG0-3 contains <strong>the</strong> proposed FY 2010 budget by program and activity compared to <strong>the</strong> FY 2009 approved budget.<br />
It also provides FY 2008 actual data.<br />
Table BG0-3<br />
(dollars in thousands)<br />
Dollars in Thousands Full-Time Equivalents<br />
Change Change<br />
Actual Approved Proposed from Actual Approved Proposed from<br />
Program/Activity<br />
(0010) Disability Compensation Fund<br />
FY 2008 FY 2009 FY 2010 FY 2009 FY 2008 FY 2009 FY 2010 FY 2009<br />
(1000) Disability Compensation Fund 28,493 15,030 25,163 10,133 0.0 0.0 0.0 0.0<br />
No Activity Assigned -273 0 0 0 0.0 0.0 0.0 0.0<br />
Subtotal (0010) Disability Compensation Fund 28,220 15,030 25,163 10,133 0.0 0.0 0.0 0.0<br />
Total Proposed Operating <strong>Budget</strong> 28,220 15,030 25,163 10,133 0.0 0.0 0.0 0.0<br />
(Change is calculated by whole numbers and numbers may not add up due to rounding)<br />
Note: For more detailed information regarding <strong>the</strong> proposed funding for <strong>the</strong> activities within this agency’s programs, please see<br />
Schedule 30-PBB, Program Summary by Activity, in <strong>the</strong> FY 2010 Operating Appendices located on <strong>the</strong> <strong>Office</strong> <strong>of</strong> <strong>the</strong> <strong>Chief</strong><br />
<strong>Financial</strong> <strong>Office</strong>r’s website.<br />
Major Baseline Adjustments, Cost Savings<br />
and Policy Initiatives<br />
Initial Adjustments: An increase <strong>of</strong> $8,970,000 in<br />
subsidies and transfers to restore <strong>the</strong> budget to its historic<br />
level. The FY 2009 Approved <strong>Budget</strong> was lower<br />
than its historic level because <strong>of</strong> <strong>the</strong> availability <strong>of</strong> onetime<br />
resources from <strong>the</strong> fund balance in FY 2009.<br />
Cost Savings: The proposed budget reduces supplies<br />
and materials by $135,000, to align with actual<br />
spending.<br />
Protected Programs: The proposed budget fully<br />
funds projected benefit payments for eligible disability<br />
compensation claimants.<br />
Policy Initiatives: The proposed budget increase <strong>of</strong><br />
$18,171 is attributed to a revised procurement assessment<br />
estimate.<br />
Disability Compensation Fund<br />
E-105
FY 2009 Approved <strong>Budget</strong> to FY 2010 Proposed <strong>Budget</strong><br />
Table BG0-4 itemizes <strong>the</strong> changes by revenue type between <strong>the</strong> FY 2009 approved budget and <strong>the</strong> FY 2010 proposed<br />
budget. The four categories <strong>of</strong> changes reflected in this table are: (1) changes to <strong>the</strong> baseline budget (includes<br />
agency request), (2) changes representing cost savings or efficiencies, (3) changes related to policy initiatives, and (4)<br />
changes to specifically address <strong>the</strong> projected revenue shortfall.<br />
Table BG0-4<br />
(dollars in thousands)<br />
PROGRAM BUDGET FTE<br />
LOCAL FUND: FY 2009 Approved <strong>Budget</strong> and FTE 15,030 0.0<br />
Initial and Baseline Adjustments<br />
Intra-<strong>Agency</strong> Changes - Increase Supplies Disability Compensation Fund 525 0.0<br />
Intra-<strong>Agency</strong> Changes - Increase O<strong>the</strong>r services and charges Disability Compensation Fund 730 0.0<br />
Intra-<strong>Agency</strong> Changes - Increase Subsidies and Transfers Disability Compensation Fund 8,970 0.0<br />
Intra-<strong>Agency</strong> Changes - Increase Equipment Disability Compensation Fund 25 0.0<br />
Policy Initiatives and Cost Savings<br />
Cost Increase - Align procurement assessment budget with<br />
revised OCP estimates<br />
Disability Compensation Fund 18 0.0<br />
Cost Decrease - Align supplies budget with FY 2008<br />
actual spending<br />
Disability Compensation Fund -135 0.0<br />
LOCAL FUND: FY 2010 Proposed <strong>Budget</strong> and FTE 25,163 0.0<br />
Gross for BG0 - Disability Compensation Fund 25,163 0.0<br />
FY 2010 Proposed <strong>Budget</strong> and <strong>Financial</strong> Plan<br />
E-106
<strong>Office</strong> <strong>of</strong> Human Rights<br />
www.ohr.dc.gov<br />
Telephone: 202-727-4559<br />
Summary <strong>of</strong> Services<br />
The <strong>Office</strong> <strong>of</strong> Human Rights (OHR) investigates and<br />
resolves complaints <strong>of</strong> discrimination in employment,<br />
housing, places <strong>of</strong> public accommodation, and educational<br />
institutions, according to <strong>the</strong> D.C. Human<br />
Rights Act <strong>of</strong> 1977 and o<strong>the</strong>r numerous local and federal<br />
laws. OHR also prevents discrimination by providing<br />
training and educating D.C. government<br />
employees, private employers, workers, and <strong>the</strong> community<br />
at-large <strong>of</strong> <strong>the</strong>ir rights and responsibilities<br />
under <strong>the</strong> law. OHR monitors compliance to <strong>the</strong><br />
Language Access Act <strong>of</strong> 2004 and investigates allega-<br />
(HM0)<br />
% Change<br />
FY 2008 FY 2009 FY 2010 from<br />
Description Actual Approved Proposed FY 2009<br />
Operating <strong>Budget</strong> $3,246,556 $3,211,386 $2,934,813 -8.6<br />
FTEs 23.8 30.0 28.0 -6.7<br />
The mission <strong>of</strong> <strong>the</strong> <strong>Office</strong> <strong>of</strong> Human Rights (OHR) is to eradicate discrimination,<br />
increase equal opportunity, and protect human rights in<br />
<strong>the</strong> city.<br />
tions <strong>of</strong> non-compliance with this Act by D.C. government<br />
agencies. The agency also investigates complaints<br />
and conditions causing community tension<br />
and conflict that can lead to breaches <strong>of</strong> <strong>the</strong> peace.<br />
The Commission on Human Rights is <strong>the</strong> adjudicatory<br />
body that decides private sector cases after OHR<br />
has found “probable cause” <strong>of</strong> discrimination.<br />
The agency’s FY 2010 proposed budget is presented<br />
in <strong>the</strong> following tables:<br />
<strong>Office</strong> <strong>of</strong> Human Rights<br />
E-107
FY 2010 Proposed Gross Funds Operating <strong>Budget</strong>, by Revenue Type<br />
Table HM0-1 contains <strong>the</strong> proposed FY 2010 agency budget compared to <strong>the</strong> FY 2009 approved budget. It also<br />
provides <strong>the</strong> FY 2007 and FY 2008 actual expenditures.<br />
Table HM0-1<br />
(dollars in thousands)<br />
Actual Actual Approved Proposed<br />
Change<br />
from Percent<br />
Appropriated Fund<br />
General Fund<br />
FY 2007 FY 2008 FY 2009 FY 2010 FY 2009 Change*<br />
Local Funds 2,359 2,605 2,757 2,617 -140 -5.1<br />
Total for General Fund 2,359 2,605 2,757 2,617 -140 -5.1<br />
Federal Resources<br />
Federal Grant Funds 372 641 455 318 -137 -30.0<br />
Total for Federal Resources 372 641 455 318 -137 -30.0<br />
Gross Funds 2,731 3,247 3,211 2,935 -277 -8.6<br />
*Percent Change is based on whole dollars.<br />
Note: If applicable, for a breakdown <strong>of</strong> each Grant (Federal and Private), Special Purpose Revenue type and Intra-District agreement,<br />
please refer to Schedule 80 <strong>Agency</strong> Summary by Revenue Source in <strong>the</strong> Operating Appendices located on <strong>the</strong> <strong>Office</strong> <strong>of</strong> <strong>the</strong> <strong>Chief</strong><br />
<strong>Financial</strong> <strong>Office</strong>r’s website.<br />
FY 2010 Proposed Full-Time Equivalents, by Revenue Type<br />
Table HM0-2 contains <strong>the</strong> proposed FY 2010 FTE level compared to <strong>the</strong> FY 2009 approved FTE level by revenue<br />
type. It also provides FY 2007 and FY 2008 actual data.<br />
Table HM0-2<br />
Change<br />
Actual Actual Approved Proposed from Percent<br />
Appropriated Fund FY 2007 FY 2008 FY 2009 FY 2010 FY 2009 Change<br />
General Fund<br />
Local Funds 25.0 23.8 28.0 26.0 -2.0 -7.1<br />
Total for General Fund 25.0 23.8 28.0 26.0 -2.0 -7.1<br />
Federal Resources<br />
Federal Grant Funds 1.0 0.0 2.0 2.0 0.0 0.0<br />
Total for Federal Resources 1.0 0.0 2.0 2.0 0.0 0.0<br />
Total Proposed FTEs 26.0 23.8 30.0 28.0 -2.0 -6.7<br />
FY 2010 Proposed <strong>Budget</strong> and <strong>Financial</strong> Plan<br />
E-108
FY 2010 Proposed Operating <strong>Budget</strong>, by Comptroller Source Group<br />
Table HM0-3 contains <strong>the</strong> proposed FY 2010 budget at <strong>the</strong> Comptroller Source Group (object class) level compared<br />
to <strong>the</strong> FY 2009 approved budget. It also provides FY 2007 and FY 2008 actual expenditures.<br />
Table HM0-3<br />
(dollars in thousands)<br />
Actual Actual Approved Proposed<br />
Change<br />
from Percent<br />
Comptroller Source Group FY 2007 FY 2008 FY 2009 FY 2010 FY 2009 Change<br />
11 Regular Pay - Cont Full Time 1,132 1,335 1,515 1,307 -208 -13.7<br />
12 Regular Pay - O<strong>the</strong>r 583 531 439 746 307 70.0<br />
13 Additional Gross Pay 44 6 10 0 -10 -100.0<br />
14 Fringe Benefits - Curr Personnel 328 333 354 368 15 4.2<br />
15 Overtime Pay 19 1 0 0 0 N/A<br />
Subtotal Personal Services (PS) 2,106 2,206 2,317 2,421 104 4.5<br />
20 Supplies and Materials 15 47 41 19 -22 -54.3<br />
30 Energy, Comm. and Bldg Rentals 30 26 28 35 6 22.8<br />
31 Telephone, Telegraph, Telegram, Etc 35 25 29 25 -4 -14.3<br />
32 Rentals - Land and Structures 6 18 5 0 -5 -100.0<br />
33 Janitorial Services 12 17 20 19 0 -0.8<br />
34 Security Services 22 20 18 14 -4 -20.7<br />
35 Occupancy Fixed Costs 20 13 40 24 -16 -40.6<br />
40 O<strong>the</strong>r Services and Charges 335 458 485 260 -224 -46.3<br />
41 Contractual Services - O<strong>the</strong>r 134 364 213 96 -117 -55.0<br />
70 Equipment & Equipment Rental 17 53 17 22 5 32.2<br />
Subtotal Nonpersonal Services (NPS) 625 1,041 894 514 -380 -42.5<br />
Gross Funds 2,731 3,247 3,211 2,935 -277 -8.6<br />
*Percent Change is based on whole dollars.<br />
<strong>Office</strong> <strong>of</strong> Human Rights<br />
E-109
Program Description<br />
The <strong>Office</strong> <strong>of</strong> Human Rights operates through <strong>the</strong><br />
following 3 programs:<br />
Equal Justice - provides education and awareness,<br />
training, mediation, investigation, rulemaking, and<br />
compliance monitoring services to people who live,<br />
work, and/or conduct business in <strong>the</strong> District <strong>of</strong><br />
Columbia. The Equal Justice program seeks to<br />
inform people and businesses <strong>of</strong> <strong>the</strong>ir civil rights and<br />
legal obligations and provide timely resolution <strong>of</strong><br />
complaints filed with <strong>the</strong> <strong>Office</strong>.<br />
This program contains <strong>the</strong> following 7 activities:<br />
■ Intake - provides scheduling, intake appointments,<br />
case analysis, data processing, administrative<br />
dismissals, and docketing <strong>of</strong> civil rights complaints<br />
filed at <strong>the</strong> <strong>Office</strong>;<br />
■ Mediation - provides impartial and confidential<br />
mediation sessions seeking to expeditiously<br />
resolve civil rights complaints before full investigation;<br />
■ Investigations – provides timely and thorough<br />
investigations <strong>of</strong> complaints <strong>of</strong> discrimination in<br />
employment, housing, public accommodations,<br />
and educational institutions, as well as investigation<br />
<strong>of</strong> Language Access complaints;<br />
■ Fair Housing - provides awareness, education,<br />
testing, training, and public information projects<br />
to ensure a housing environment free <strong>of</strong> discrimination<br />
in <strong>the</strong> District and to inform limited<br />
English residents <strong>of</strong> <strong>the</strong>ir language access rights<br />
under DC law;<br />
■ Research and Compliance - provides research,<br />
data compilation, and reports and publications<br />
for <strong>the</strong> <strong>Office</strong>’s programs and activities.<br />
Additionally, provides compliance review and<br />
monitoring, technical assistance and reporting <strong>of</strong><br />
EEO enforcement activity for agencies and<br />
departments under Mayoral jurisdiction;<br />
■ Public Education – provides awareness, education,<br />
training, and public information to ensure a<br />
workforce environment free <strong>of</strong> discrimination in<br />
<strong>the</strong> District <strong>of</strong> Columbia; and<br />
■ Language Access Oversight - provides review<br />
and approval <strong>of</strong> language access plans, training,<br />
technical assistance, compliance monitoring, testing,<br />
and reporting <strong>of</strong> language access programs for<br />
FY 2010 Proposed <strong>Budget</strong> and <strong>Financial</strong> Plan<br />
E-110<br />
agencies and departments covered by <strong>the</strong><br />
Language Access Act.<br />
Commission on Human Rights – provides rulemaking<br />
and adjudication services through an<br />
administrative, trial-type hearing conducted<br />
before an Administrative Law Judge or a panel <strong>of</strong><br />
commissioners. The Commission awards injunctive<br />
relief and damages if discrimination is found<br />
for individuals who live, work, or do business in<br />
<strong>the</strong> District <strong>of</strong> Columbia.<br />
This program contains <strong>the</strong> following activity:<br />
■ Human Rights Commission - provides adjudication<br />
<strong>of</strong> discrimination complaints in employment,<br />
housing, public accommodations, and<br />
educational institutions that have been certified<br />
by <strong>the</strong> <strong>Office</strong> <strong>of</strong> Human Rights for a public hearing.<br />
<strong>Agency</strong> Management - provides for administrative<br />
support and <strong>the</strong> required tools to achieve operational<br />
and programmatic results. This program is standard<br />
for all agencies using performance-based budgeting.<br />
Program Structure Change<br />
The <strong>Office</strong> <strong>of</strong> Human Rights had no program structure<br />
changes in <strong>the</strong> FY 2010 Proposed <strong>Budget</strong>.
FY 2010 Proposed Operating <strong>Budget</strong> and FTEs, by Program and Activity<br />
Table HM0-4 contains <strong>the</strong> proposed FY 2010 budget by program and activity compared to <strong>the</strong> FY 2009 approved budget.<br />
It also provides FY 2008 actual data.<br />
Table HM0-4<br />
(dollars in thousands)<br />
Dollars in Thousands Full-Time Equivalents<br />
Change Change<br />
Actual Approved Proposed from Actual Approved Proposed from<br />
Program/Activity<br />
(1000) <strong>Office</strong> <strong>of</strong> Human Rights<br />
FY 2008 FY 2009 FY 2010 FY 2009 FY 2008 FY 2009 FY 2010 FY 2009<br />
(1010) Personnel 174 41 29 -12 0.2 0.0 0.1 0.1<br />
(1015) Training and Employee Development 9 15 14 -1 0.2 0.0 0.1 0.1<br />
(1020) Contracting and Procurement 9 117 36 -81 0.2 1.0 0.1 -0.9<br />
(1030) Property Management 171 181 139 -42 0.2 0.0 0.1 0.1<br />
(1040) Information Technology 25 19 24 5 0.2 0.0 0.1 0.1<br />
(1050) <strong>Financial</strong> Services 9 0 9 9 0.2 0.0 0.1 0.1<br />
(1055) Risk Management 9 4 9 5 0.2 0.0 0.1 0.1<br />
(1060) Legal Services 0 0 0 0 0.0 0.0 0.0 0.0<br />
(1080) Communications 9 91 105 13 0.2 1.0 1.1 0.1<br />
(1085) Customer Service 21 55 18 -37 0.2 1.0 0.2 -0.8<br />
(1087) Language Access 262 17 77 60 0.0 0.0 1.0 1.0<br />
(1090) Performance Management 0 65 169 104 0.0 1.0 1.0 0.0<br />
Subtotal (1000) <strong>Office</strong> <strong>of</strong> Human Rights<br />
(2000) Equal Justice Program<br />
697 604 628 24 1.8 4.0 4.0 0.0<br />
(2010) Intake 90 238 98 -139 1.0 3.0 1.5 -1.5<br />
(2020) Mediation 179 198 194 -4 2.0 2.0 2.0 0.0<br />
(2030) Investigations 933 870 1,097 227 13.0 10.0 11.5 1.5<br />
(2040) Adjudication 143 0 0 0 0.0 0.0 0.0 0.0<br />
(2050) Fair Housing Program 674 547 226 -322 1.0 4.0 3.0 -1.0<br />
(2060) Research and Compliance 232 141 132 -9 2.0 1.0 1.0 0.0<br />
(2070) Public Education 10 14 107 93 0.0 0.0 1.0 1.0<br />
(2080) Public Information 101 0 0 0 1.0 0.0 0.0 0.0<br />
(2090) Language Access Oversight 00 305 149 -156 0.0 3.0 1.0 -2.0<br />
Subtotal (2000) Equal Justice Program<br />
(3000) Commission on Human Rights<br />
2,362 2,312 2,003 -309 20.0 23.0 21.0 -2.0<br />
(3010) Human Rights Commission 188 295 304 9 2.0 3.0 3.0 0.0<br />
Subtotal (3000) Commission on Human Rights 188 295 304 9 2.0 3.0 3.0 0.0<br />
Total Proposed Operating <strong>Budget</strong> 3,247 3,211 2,935 -277 23.8 30.0 28.0 -2.0<br />
(Change is calculated by whole numbers and numbers may not add up due to rounding)<br />
Note: For more detailed information regarding <strong>the</strong> proposed funding for <strong>the</strong> activities within this agency’s programs, please see Schedule 30-PBB Program<br />
Summary By Activity in <strong>the</strong> FY 2010 Operating Appendices located on <strong>the</strong> <strong>Office</strong> <strong>of</strong> <strong>the</strong> <strong>Chief</strong> <strong>Financial</strong> <strong>Office</strong>r’s website.<br />
<strong>Office</strong> <strong>of</strong> Human Rights<br />
E-111
Major Baseline Adjustments, Cost Savings<br />
and Policy Initiatives<br />
Cost Savings: In FY 2010, <strong>the</strong> OHR will use existing<br />
Federal funds and current staff to fulfill temporary<br />
administrative, court reporting and legal personnel<br />
needs, reducing reliance on external contracts and saving<br />
$20,000. In addition, through eliminating nonessential<br />
administrative positions and consolidating<br />
public affairs staff as part <strong>of</strong> a District-wide initiative,<br />
OHR will save $177,003.<br />
The proposed budget also reduces expenditures<br />
on postage, conferences and travel, saving $16,956.<br />
Fur<strong>the</strong>r, OHR’s transfer <strong>of</strong> funds to <strong>the</strong> <strong>Office</strong> <strong>of</strong> <strong>the</strong><br />
<strong>Chief</strong> Technology <strong>Office</strong>r for technology-related services<br />
will be reduced to align with anticipated FY<br />
2010 expenditures, saving $10,000. Finally, OHR<br />
will save $10,192 by aligning its electricity, telecom,<br />
occupancy, and procurement assessment budgets<br />
with revised estimates.<br />
Policy Initiatives: To support a new telecom system<br />
that will provide better customer service and improve<br />
tracking <strong>of</strong> incoming public inquiries, this budget<br />
proposes a $7,000 enhancement in Local funds for<br />
OHR.<br />
In addition, OHR will receive $75,960 for 1 FTE<br />
from <strong>the</strong> <strong>Office</strong> <strong>of</strong> Community Affairs for an Equal<br />
Opportunity Specialist and $5,000 for one-time<br />
mandatory training.<br />
FY 2010 Proposed <strong>Budget</strong> and <strong>Financial</strong> Plan<br />
E-112
FY 2009 Approved <strong>Budget</strong> to FY 2010 Proposed <strong>Budget</strong>, Revenue Type<br />
Table HM0-5 itemizes <strong>the</strong> changes by revenue type between <strong>the</strong> FY 2009 approved budget and <strong>the</strong> FY 2010 proposed<br />
budget. The four categories <strong>of</strong> changes reflected in this table are: (1) changes to <strong>the</strong> baseline budget (includes<br />
agency request), (2) changes representing cost savings or efficiencies, (3) changes related to policy initiatives, and (4)<br />
changes to specifically address <strong>the</strong> projected revenue shortfall.<br />
Table HM0-5<br />
(dollars in thousands)<br />
Program BUDGET FTE<br />
LOCAL FUND: FY 2009 Approved <strong>Budget</strong> and FTE 2,757 28.0<br />
Initial and Baseline Adjustments<br />
Net effect <strong>of</strong> fixed cost adjustments - Revised fixed cost estimates for <strong>Office</strong> <strong>of</strong> Human Rights -16 0.0<br />
Energy, Telecom, Rent, Janitorial, Security, and Occupancy<br />
Net effect <strong>of</strong> salary and benefits changes - Increase in Personal Services Multiple 161 0.0<br />
Intra-<strong>Agency</strong> Changes - Reduction in O<strong>the</strong>r Services and Charges Multiple -87 0.0<br />
Intra-<strong>Agency</strong> Changes - Reduction in Supplies Equal Justice Program -20 0.0<br />
Intra-<strong>Agency</strong> Changes - Reduction in Contractual Services Multiple -48 0.0<br />
Intra-<strong>Agency</strong> Changes - Increase Equipment Equal Justice Program 10 0.0<br />
Baseline Adjustments: Net effect <strong>of</strong> fixed cost adjustments - Revised <strong>Office</strong> <strong>of</strong> Human Rights -4 0.0<br />
Fixed cost estimates for Security<br />
Baseline Adjustments: Net effect <strong>of</strong> fixed cost adjustments - Revised <strong>Office</strong> <strong>of</strong> Human Rights 6 0.0<br />
fixed cost estimates for Telecom to restore <strong>the</strong> FY 2010 telecom<br />
rescission applied as a duplicate entry<br />
Baseline Adjustments: Intra-<strong>Agency</strong> Changes - Increase Equipment due Equal Justice Program 4 0.0<br />
to January revised fixed cost estimate<br />
Policy Initiatives and Cost Savings<br />
Cost Decrease - Align electricity budget with revised OPM estimates <strong>Office</strong> <strong>of</strong> Human Rights -1 0.0<br />
Cost Decrease - Align occupancy budget with revised OPM estimates <strong>Office</strong> <strong>of</strong> Human Rights -2 0.0<br />
Cost Decrease - Align procurement assessment budget with revised OCP<br />
estimates<br />
<strong>Office</strong> <strong>of</strong> Human Rights -2 0.0<br />
Cost Decrease - Align telecom budget with revised OCTO estimates <strong>Office</strong> <strong>of</strong> Human Rights -5 0.0<br />
Cost Decrease - Align OCTO MOU with FY 2009 and anticipated FY<br />
2010 expenditures<br />
Equal Justice Program -10 0.0<br />
Cost Decrease - Eliminate non-essential travel and conference<br />
expenditures<br />
Equal Justice Program -10 0.0<br />
Cost Decrease - Use federal funding and existing staff to fill temporary<br />
staffing needs<br />
Equal Justice Program -10 0.0<br />
Cost Decrease - Use federal funding to support court reporting and legal<br />
services<br />
Equal Justice Program -10 0.0<br />
Cost Decrease - Align postage budget with projected costs, given<br />
reduced use <strong>of</strong> certified mail<br />
Equal Justice Program -7 0.0<br />
Cost Decrease - Reduce communications and administrative support for<br />
OHR, shift responsibilities to remaining staff<br />
Equal Justice Program -177 -3.0<br />
Enhance - Fund new phone system to enhance customer service and<br />
improve tracking <strong>of</strong> incoming public inquiries<br />
Equal Justice Program 7 0.0<br />
Net effect <strong>of</strong> salary and benefits changes - Transfer-in 1 FTE from <strong>the</strong><br />
<strong>Office</strong> <strong>of</strong> Community Affairs<br />
Equal Justice Program 76 1.0<br />
Council Initiative for Training - Mandatory Training <strong>Office</strong> <strong>of</strong> Human Rights 5 0.0<br />
LOCAL FUND: FY 2010 Proposed <strong>Budget</strong> and FTE<br />
(Continued on next page)<br />
2,617 26.0<br />
<strong>Office</strong> <strong>of</strong> Human Rights<br />
E-113
Table HM0-5 (continued)<br />
(dollars in thousands)<br />
FY 2010 Proposed <strong>Budget</strong> and <strong>Financial</strong> Plan<br />
E-114<br />
Program BUDGET FTE<br />
FEDERAL GRANT FUND: FY 2009 Approved <strong>Budget</strong> and FTE 455 2.0<br />
Initial and Baseline Adjustments<br />
Net effect <strong>of</strong> salary and benefits changes - Increase in Personal Services Multiple 44 0.0<br />
Intra-<strong>Agency</strong> Changes - Reduction in O<strong>the</strong>r Services and Charges Equal Justice Program -113 0.0<br />
Intra-<strong>Agency</strong> Changes - Reduction in Supplies Equal Justice Program -2 0.0<br />
Intra-<strong>Agency</strong> Changes - Reduction in Equipment Equal Justice Program -9 0.0<br />
Intra-<strong>Agency</strong> Changes - Reduction in Contractual Services Equal Justice Program -56 0.0<br />
FEDERAL GRANT FUND: FY 2010 Proposed <strong>Budget</strong> and FTE 318 2.0<br />
Gross for HM0 - <strong>Office</strong> <strong>of</strong> Human Rights 2,935 28.0<br />
<strong>Agency</strong> Performance Plan<br />
The agency’s Performance Plan has <strong>the</strong> following 3<br />
objectives for FY 2010:<br />
Objective 1: Improve <strong>the</strong> effectiveness <strong>of</strong> <strong>the</strong> agency’s<br />
enforcement functions by shortening response times<br />
and streng<strong>the</strong>ning quality controls.<br />
Objective 2: Promote awareness <strong>of</strong> local and federal<br />
antidiscrimination laws by educating employers,<br />
workers and residents <strong>of</strong> <strong>the</strong> District <strong>of</strong> Columbia in<br />
order to prevent discrimination.<br />
Objective 3: Effectively collaborate with D.C.<br />
Government agencies and <strong>the</strong> community to promote<br />
and enforce equal access to government services<br />
by Limited English Pr<strong>of</strong>icient/Non English<br />
(LEP/NEP) populations that live, work, and visit <strong>the</strong><br />
District.
<strong>Agency</strong> Performance Measures<br />
Table HM0-6<br />
FY 2007 FY 2008 FY 2008<br />
Year-End Original Year-End FY 2009 FY 2010 FY 2011<br />
Measure<br />
Objective 1:<br />
Percent <strong>of</strong> case reviews with “very good” or<br />
Actual Target Actual Projection Projection Projection<br />
higher score<br />
Number <strong>of</strong> backlogged cases by <strong>the</strong> end <strong>of</strong> <strong>the</strong> year.<br />
(Employment, education and public accommodation:<br />
N/A 80% 82% 85% 85% 85%<br />
210 days; housing: 90 days; language access: 6 months)<br />
Percent <strong>of</strong> District agencies trained by OHR on<br />
N/A 99 69 79 69 59<br />
EEO laws and policies<br />
Percent <strong>of</strong> newly filed cases processed within<br />
75% 90% --- 100% 100% 100%<br />
5 business days<br />
Percent <strong>of</strong> OHR complainants satisfied with <strong>the</strong><br />
100% 100% 100% 100% 100% 100%<br />
agency’s intake process<br />
Percent <strong>of</strong> mediations that lead to settlement<br />
N/A 75% 81.3% 80% 85% 90%<br />
agreements<br />
Percent <strong>of</strong> new Commission cases adjudicated<br />
N/A 15% 42% 25% 30% 35%<br />
within 18 months <strong>of</strong> certification<br />
Percent <strong>of</strong> cases adjudicated that are less than<br />
N/A 70% 55% 75% 80% 85%<br />
2 years old<br />
Objective 2:<br />
Number <strong>of</strong> D.C. government and private employers<br />
N/A N/A N/A 80% 85% 90%<br />
and workers trained on diversity and EEO policies<br />
Objective 3:<br />
Percent <strong>of</strong> LEP/NEP constituents that indicate<br />
“gained knowledge” <strong>of</strong> language access rights<br />
N/A 3,000 1,080 1,000 2,000 3,000<br />
through <strong>the</strong> Know Your Rights Campaign<br />
Percent <strong>of</strong> District agencies trained on <strong>the</strong><br />
requirements <strong>of</strong> <strong>the</strong> Language Access Act, submit<br />
a Language Access Plan, and report on language<br />
N/A 70% 70% 75% 75% 75%<br />
access progress<br />
Percent <strong>of</strong> “covered” agencies under <strong>the</strong> LAA that<br />
N/A 95% 93% 100% 100% 100%<br />
receive an overall rating <strong>of</strong> 3 or more during testing N/A 50% 54.6% 60% 70% 70%<br />
LEP/NEP: Limited English Pr<strong>of</strong>icient/Non-English Pr<strong>of</strong>icient<br />
<strong>Office</strong> <strong>of</strong> Human Rights<br />
E-115
<strong>Office</strong> on Latino Affairs<br />
www.ola.dc.gov<br />
Telephone: 202-671-2825<br />
% Change<br />
FY 2008 FY 2009 FY 2010 from<br />
Description Actual Approved Proposed FY 2009<br />
Operating <strong>Budget</strong> $5,701,808 $4,587,042 $4,020,649 -12.3<br />
FTEs 12.0 12.0 10.0 -16.7<br />
(BZ0)<br />
The mission <strong>of</strong> <strong>the</strong> <strong>Office</strong> on Latino Affairs (OLA) is to facilitate<br />
access to health, education and o<strong>the</strong>r social services for <strong>the</strong> District’s<br />
Latino population.<br />
Summary <strong>of</strong> Services<br />
OLA provides community-based grants, advocacy,<br />
community relations, and outreach services to DC<br />
Latinos, so that <strong>the</strong>y can have access to a full range <strong>of</strong><br />
human services, health, education, housing, economic<br />
development, and employment opportunities.<br />
The agency’s FY 2010 proposed budget is presented<br />
in <strong>the</strong> following tables:<br />
<strong>Office</strong> on Latino Affairs<br />
E-117
FY 2010 Proposed Gross Funds Operating <strong>Budget</strong>, by Revenue Type<br />
Table BZ0-1 contains <strong>the</strong> proposed FY 2010 agency budget compared to <strong>the</strong> FY 2009 approved budget. It also<br />
provides <strong>the</strong> FY 2007 and FY 2008 actual expenditures.<br />
Table BZ0-1<br />
(dollars in thousands)<br />
Change<br />
Actual Actual Approved Proposed from Percent<br />
Appropriated Fund FY 2007 FY 2008 FY 2009 FY 2010 FY 2009 Change*<br />
General Fund<br />
Local Funds 4,130 4,120 4,587 3,821 -766 -16.7<br />
Total for General Fund 4,130 4,120 4,587 3,821 -766 -16.7<br />
Intra-District Funds<br />
Intra-District Funds 1,590 1,582 0 200 200 N/A<br />
Total for Intra-District Funds 1,590 1,582 0 200 200 N/A<br />
Gross Funds 5,720 5,702 4,587 4,021 -566 -12.3<br />
*Percent Change is based on whole dollars.<br />
Note: If applicable, for a breakdown <strong>of</strong> each Grant (Federal and Private), Special Purpose Revenue type and Intra-District agreement, please refer to<br />
Schedule 80 <strong>Agency</strong> Summary by Revenue Source in <strong>the</strong> Operating Appendices located on <strong>the</strong> <strong>Office</strong> <strong>of</strong> <strong>the</strong> <strong>Chief</strong> <strong>Financial</strong> <strong>Office</strong>r’s website.<br />
FY 2010 Proposed Full-Time Equivalents, by Revenue Type<br />
Table BZ0-2 contains <strong>the</strong> proposed FY 2010 FTE level compared to <strong>the</strong> FY 2009 approved FTE level by revenue<br />
type. It also provides FY 2007 and FY 2008 actual data.<br />
Table BZ0-2<br />
Change<br />
Actual Actual Approved Proposed from Percent<br />
Appropriated Fund FY 2007 FY 2008 FY 2009 FY 2010 FY 2009 Change<br />
General Fund<br />
Local Funds 12.0 12.0 12.0 10.0 -2.0 -16.7<br />
Total for General Fund 12.0 12.0 12.0 10.0 -2.0 -16.7<br />
Total Proposed FTEs 12.0 12.0 12.0 10.0 -2.0 -16.7<br />
FY 2010 Proposed <strong>Budget</strong> and <strong>Financial</strong> Plan<br />
E-118
FY 2010 Proposed Operating <strong>Budget</strong>, by Comptroller Source Group<br />
Table BZ0-3 contains <strong>the</strong> proposed FY 2010 budget at <strong>the</strong> Comptroller Source group (object class) level compared<br />
to <strong>the</strong> FY 2009 approved budget. It also provides FY 2007 and FY 2008 actual expenditures.<br />
Table BZ0-3<br />
(dollars in thousands)<br />
Actual Actual Approved Proposed<br />
Change<br />
from Percent<br />
Comptroller Source Group FY 2007 FY 2008 FY 2009 FY 2010 FY 2009 Change*<br />
11 Regular Pay - Cont Full Time 363 323 292 360 68 23.3<br />
12 Regular Pay - O<strong>the</strong>r 340 375 412 270 -142 -34.5<br />
13 Additional Gross Pay 7 3 0 0 0 N/A<br />
14 Fringe Benefits - Curr Personnel 133 132 140 129 -10 -7.3<br />
Subtotal Personal Services (PS) 843 833 844 760 -84 -10.0<br />
20 Supplies and Materials 1 15 15 5 -10 -65.4<br />
30 Energy, Comm. and Bldg Rentals 25 27 24 33 8 34.4<br />
31 Telephone, Telegraph, Telegram, Etc 9 8 8 9 1 9.8<br />
32 Rentals - Land and Structures 0 0 1 0 -1 -100.0<br />
33 Janitorial Services 9 10 14 27 14 100.4<br />
34 Security Services 18 16 18 13 -5 -28.3<br />
35 Occupancy Fixed Costs 23 26 26 42 16 63.9<br />
40 O<strong>the</strong>r Services and Charges 110 121 159 124 -35 -22.0<br />
41 Contractual Services - O<strong>the</strong>r 30 0 0 0 0 N/A<br />
50 Subsidies and Transfers 4,636 4,634 3,462 2,997 -465 -13.4<br />
70 Equipment & Equipment Rental 17 12 16 11 -5 -30.4<br />
Subtotal Nonpersonal Services (NPS) 4,877 4,869 3,743 3,261 -482 -12.9<br />
Gross Funds 5,720 5,702 4,587 4,021 -566 -12.3<br />
*Percent Change is based on whole dollars.<br />
Program Description<br />
The <strong>Office</strong> on Latino Affairs operates through <strong>the</strong> following<br />
4 programs:<br />
Community-Based Grants - provides technical assistance<br />
and grants management services to DC Latino-serving<br />
non-pr<strong>of</strong>it organizations so that <strong>the</strong>y can provide<br />
linguistically and culturally appropriate services to <strong>the</strong><br />
District’s Latino population and complement existing<br />
services <strong>of</strong>fered by <strong>the</strong> District government.<br />
This program contains <strong>the</strong> following 2 activities:<br />
■ Technical Assistance – provides funding for<br />
development and capacity building support services<br />
to nonpr<strong>of</strong>it organizations; and<br />
■ Grants Management – provides grant selection,<br />
awarded funds, and monitoring services to nonpr<strong>of</strong>it<br />
organizations.<br />
Advocacy and Language Access - provides consultation,<br />
collaboration, and problem-solving services to <strong>the</strong><br />
Mayor, District government agencies, community<br />
groups, and o<strong>the</strong>r entities so that Latino residents are<br />
better informed, represented, and served.<br />
This program contains <strong>the</strong> following 2 activities:<br />
■ Language Access – provides consultation, technical<br />
assistance, and translation services to District<br />
government agencies so <strong>the</strong>y can provide<br />
<strong>Office</strong> on Latino Affairs<br />
E-119
culturally and linguistically competent programs<br />
and services to District Latino residents; and<br />
■ Intergovernmental/Private Sector Relations –<br />
provides liaison and collaborative services to<br />
Latino residents/groups and <strong>the</strong> Mayor, government<br />
agencies and <strong>the</strong> private sector so that<br />
Latino residents can be better informed, represented<br />
and served.<br />
Community Relations and Outreach - provides<br />
partnership and outreach services to District Latino<br />
residents so that <strong>the</strong>y can increase <strong>the</strong>ir knowledge<br />
and access to vital programs and services available to<br />
<strong>the</strong>m.<br />
This program contains <strong>the</strong> following 3 activities:<br />
■ Community Information Exchange – provides<br />
information dissemination and educational services<br />
to District Latino residents so that <strong>the</strong>y can<br />
better access District government and o<strong>the</strong>r vital<br />
services available to <strong>the</strong>m;<br />
FY 2010 Proposed Operating <strong>Budget</strong> and FTEs, by Program and Activity<br />
FY 2010 Proposed <strong>Budget</strong> and <strong>Financial</strong> Plan<br />
E-120<br />
■ Community Partnerships – provides information<br />
ga<strong>the</strong>ring services to District Latino residents<br />
so that OLA and District government agencies<br />
can better design and support systems to serve <strong>the</strong><br />
Latino community; and<br />
■ OLA and City sponsored events – provides<br />
preparation, assistance, facilitation, and follow-up<br />
services to District government and Latino groups<br />
so that <strong>the</strong>y can conduct effective events leading<br />
to better access to programs/services by Latino<br />
residents.<br />
<strong>Agency</strong> Management - provides for administrative<br />
support and <strong>the</strong> required tools to achieve operational<br />
and programmatic results. This program is standard<br />
for all agencies using performance-based budgeting.<br />
Program Structure Change<br />
The <strong>Office</strong> on Latino Affairs had no program structure<br />
changes in <strong>the</strong> FY 2010 Proposed <strong>Budget</strong>.<br />
Table BZ0-4 contains <strong>the</strong> proposed FY 2010 budget by program and activity compared to <strong>the</strong> FY 2009 approved budget.<br />
It also provides <strong>the</strong> FY 2008 actual data.<br />
Table BZ0-4<br />
(dollars in thousands)<br />
Dollars in Thousands Full-Time Equivalents<br />
Change Change<br />
Actual Approved Proposed from Actual Approved Proposed from<br />
Program/Activity<br />
(1000) <strong>Agency</strong> Management Program<br />
FY 2008 FY 2009 FY 2010 FY 2009 FY 2008 FY 2009 FY 2010 FY 2009<br />
(1010) Personnel 15 286 2 -284 0.0 3.0 0.0 -3.0<br />
(1015) Training and Development 5 0 0 0 0.0 0.0 0.0 0.0<br />
(1020) Contracting and Procurement 0 9 5 -4 0.0 0.0 0.0 0.0<br />
(1050) <strong>Financial</strong> Management 19 45 15 -30 0.0 0.0 0.0 0.0<br />
(1080) Communication 5 0 0 0 0.0 0.0 0.0 0.0<br />
(1085) Customer Service 5 0 0 0 0.0 0.0 0.0 0.0<br />
(1090) Performance Mgmt 5 0 236 236 0.0 0.0 2.0 2.0<br />
Subtotal (1000) <strong>Agency</strong> Mgmt Program<br />
(1001) Comm. Based Programs<br />
56 340 258 -83 0.0 3.0 2.0 -1.0<br />
(1011) Tech. Assistance Activity 157 91 7 -84 1.0 1.0 0.0 -1.0<br />
(1012) Grants Mgmt. Activity 4,609 3,471 3,006 -465 0.0 0.0 0.0 0.0<br />
Subtotal (1001) Comm. Based Programs 4,766 3,562 3,013 -549 1.0 1.0 0.0 -1.0<br />
(Continued on next page)
Table BZ0-4 (Continued)<br />
(dollars in thousands)<br />
Dollars in Thousands Full-Time Equivalents<br />
Change Change<br />
Actual Approved Proposed from Actual Approved Proposed from<br />
Program/Activity<br />
(2001) Advocacy Program<br />
FY 2008 FY 2009 FY 2010 FY 2009 FY 2008 FY 2009 FY 2010 FY 2009<br />
(2011) Language Access Activity 114 75 80 5 2.0 1.0 1.0 0.0<br />
(2012) Inter./Private Sector Rel. Activity 4 4 3 -1 0.0 0.0 0.0 0.0<br />
Subtotal (2001) Advocacy Program<br />
(3001) Community Relations & Outreach<br />
118 79 83 4 2.0 1.0 1.0 0.0<br />
(3011) Comm. Info. Exchange Activity 731 574 640 65 9.0 7.0 7.0 0.0<br />
(3012) Community Partner. Activity 7 7 5 -2 0.0 0.0 0.0 0.0<br />
(3013) Ola & City Spons. Events Activity 24 24 22 -2 0.0 0.0 0.0 0.0<br />
Subtotal (3001) Community Relations & Outreach 762 605 667 61 9.0 7.0 7.0 0.0<br />
Total Proposed Operating <strong>Budget</strong> 5,702 4,587 4,021 -566 12.0 12.0 10.0 -2.0<br />
(Change is calculated by whole numbers and numbers may not add up due to rounding)<br />
Note: For more detailed information regarding <strong>the</strong> proposed funding for <strong>the</strong> activities within this agency’s programs, please see to Schedule 30-PBB, Program<br />
Summary by Activity, in <strong>the</strong> FY 2010 Operating Appendices located on <strong>the</strong> <strong>Office</strong> <strong>of</strong> <strong>the</strong> <strong>Chief</strong> <strong>Financial</strong> <strong>Office</strong>r’s website.<br />
Major Baseline Adjustments, Cost Savings<br />
and Policy Initiatives<br />
Initial Adjustments: The <strong>Office</strong> on Latino Affairs<br />
increased $154,878 in Local funds and 2 FTEs for<br />
personal services in <strong>the</strong> Community Relations and<br />
Outreach program; increased $40,054 in Local funds<br />
for fixed costs in <strong>the</strong> Community Relations and<br />
Outreach program; reduced $196,318 in Local funds<br />
for subsidies and transfers in <strong>the</strong> Community Based<br />
programs; and increased $1,280,000 in Intra-District<br />
funds for subsidies and transfers in <strong>the</strong> Community<br />
Based programs to support services and outreach to<br />
<strong>the</strong> Latino population.<br />
Baseline Adjustments: The <strong>Office</strong> on Latino Affairs<br />
reduced $75,286 in Local funds and 1 FTE for personal<br />
services in Community Based programs;<br />
increased $70,222 in Local funds for subsidies and<br />
transfers in Community Based programs; and<br />
decreased $1,080,000 in Intra-District funds in<br />
Community Based programs.<br />
Transfer Out: The budget transfers a support services<br />
technician out <strong>of</strong> <strong>the</strong> <strong>Office</strong> on Latino Affairs,<br />
$67,715, into <strong>the</strong> <strong>Office</strong> <strong>of</strong> <strong>the</strong> Mayor.<br />
Cost Savings: The budget proposal will reduce equipment<br />
and equipment rental, supplies and materials,<br />
and o<strong>the</strong>r services and charges by a total net amount<br />
<strong>of</strong> $55,000, to align with average actual spending.<br />
Additionally, <strong>the</strong> supplies and materials budget will be<br />
reduced by $10,000. The budget proposal will also<br />
reduce electrical, occupancy, and procurement assessment<br />
costs while increasing telecommunications<br />
expenditures.<br />
Policy Initiatives: The proposed budget includes onetime<br />
grants <strong>of</strong> $125,000, which will provide $50,000<br />
to <strong>the</strong> District <strong>of</strong> Columbia Latino Federation and<br />
$75,000 to <strong>the</strong> Educational Organization for United<br />
Latin Americans for Operational Support.<br />
All grantees and amounts listed in this budget are<br />
subject to final approval in <strong>the</strong> Fiscal Year 2010<br />
<strong>Budget</strong> Support Act <strong>of</strong> 2009, Bill Number 18-203,<br />
which supersedes this listing upon its effective date.<br />
Gap-Closing Initiatives: The proposed FY 2010 gapclosing<br />
budget fur<strong>the</strong>r reduces <strong>the</strong> Local funds budget<br />
by $664,000, through reductions in funding for onetime<br />
noncompetitive grants.<br />
<strong>Office</strong> on Latino Affairs<br />
E-121
FY 2009 Approved <strong>Budget</strong> to FY 2010 Proposed <strong>Budget</strong>, by Revenue Type<br />
Table BZ0-5 itemizes <strong>the</strong> changes by revenue type between <strong>the</strong> FY 2009 approved budget and <strong>the</strong> FY 2010 proposed<br />
budget. The four categories <strong>of</strong> changes reflected in this table are: (1) changes to <strong>the</strong> baseline budget (includes<br />
agency request), (2) changes representing cost savings or efficiencies, (3) changes related to policy initiatives, and<br />
(4) changes to specifically address <strong>the</strong> projected revenue shortfall.<br />
TableBZ0-5<br />
(dollars in thousands)<br />
PROGRAM BUDGET FTE<br />
LOCAL FUND: FY 2009 Approved <strong>Budget</strong> and FTE 4,587 12.0<br />
Initial and Baseline Adjustments<br />
Net effect <strong>of</strong> fixed cost adjustments - Revised fixed cost estimates for Community Relations & Outreach 40 0.0<br />
energy, comm, and bldg. rentals, telephone, rentals - land and<br />
structures, janitorial services, security services, and occupancy fixed costs<br />
Net effect <strong>of</strong> salary and benefits changes - Reduction in personal services <strong>Agency</strong> Mgmt Program -40 -1.0<br />
Net effect <strong>of</strong> salary and benefits changes - Reduction in personal services Comm. Based Programs -6 0.0<br />
Net effect <strong>of</strong> salary and benefits changes - Increase in personal services Advocacy Program 11 0.0<br />
Net effect <strong>of</strong> salary and benefits changes - Increase in personal services Community Relations & Outreach 155 2.0<br />
Intra-<strong>Agency</strong> Changes - Reduction in subsidies and transfers Comm. Based Programs -196 0.0<br />
Intra-<strong>Agency</strong> Changes - Reduction in o<strong>the</strong>r services and charges Community Relations & Outreach -1 0.0<br />
Baseline Adjustments: Net effect <strong>of</strong> fixed cost adjustments - Revised Community Relations & Outreach 3 0.0<br />
telecom to restore FY 2010 telecom rescission applied as a duplicate entry<br />
Baseline Adjustments: Net effect <strong>of</strong> fixed cost adjustments - Community Relations & Outreach -5 0.0<br />
Reduction in security services<br />
Baseline Adjustments: Net effect <strong>of</strong> salary and benefits changes - Comm. Based Programs -75 -1.0<br />
Reduction in personal services<br />
Baseline Adjustments: Intra-<strong>Agency</strong> Changes - Community Relations & Outreach 10 0.0<br />
Increase in o<strong>the</strong>r services and charges<br />
Baseline Adjustments: Intra-<strong>Agency</strong> Changes - Comm. Based Programs 70 0.0<br />
Increase in subsidies and transfers<br />
Policy Initiatives and Cost Savings<br />
Cost Decrease - Align electricity budget with revised OPM estimates <strong>Agency</strong> Mgmt Program -1 0.0<br />
Cost Decrease - Align procurement assessment budget with revised<br />
OCP estimates <strong>Agency</strong> Mgmt Program -4 0.0<br />
Cost Increase - Align telecom budget with revised OCTO estimates. <strong>Agency</strong> Mgmt Program 1 0.0<br />
Cost Decrease - Reduction in equipment and equipment rental to align Multiple -5 0.0<br />
with actuals<br />
Cost Decrease - Reduction <strong>of</strong> o<strong>the</strong>r services and charges to align Multiple -40 0.0<br />
with actual spending<br />
Cost Decrease - Align occupancy budget with revised OPM estimates <strong>Agency</strong> Mgmt Program -4 0.0<br />
Cost increase in Grants and Gratuities - One-time grant to DC Latino Federation Comm. Based Programs 50 0.0<br />
Eliminate - Reduction <strong>of</strong> one community outreach specialist Community Relations & Outreach -61 -1.0<br />
Transfer Out - Transfer out a support services specialist position to <strong>the</strong> Community Relations & Outreach -68 -1.0<br />
<strong>Office</strong> <strong>of</strong> <strong>the</strong> Mayor from <strong>the</strong> Latino Affairs budget<br />
Cost Decrease - Align supplies budget with historical spending Multiple -10 0.0<br />
Cost increase in Grants and Gratuities - One-time grant to <strong>the</strong> Educational Comm. Based Programs 75 0.0<br />
Organization for United Latin Americans for Operational support<br />
(Continued on next page)<br />
FY 2010 Proposed <strong>Budget</strong> and <strong>Financial</strong> Plan<br />
E-122
Table BZ0-5 (Continued)<br />
(dollars in thousands)<br />
PROGRAM BUDGET FTE<br />
Gap-Closing Initiatives<br />
Reduce - Reduce non-competitive grants Comm. Based Grants -664 0.0<br />
LOCAL FUND: FY 2010 Proposed <strong>Budget</strong> and FTE 3,821 10.0<br />
INTRA-DISTRICT FUNDS: FY 2009 Approved <strong>Budget</strong> and FTE 0 0.0<br />
Initial and Baseline Adjustments<br />
Intra-<strong>Agency</strong> Changes - Increase in subsidies and transfers Comm. Based Programs 1,280 0.0<br />
Baseline Adjustments:Intra-<strong>Agency</strong> Changes - Reduction in subsidies<br />
and transfers<br />
Comm. Based Programs -1,080 0.0<br />
INTRA-DISTRICT FUNDS: FY 2010 Proposed <strong>Budget</strong> and FTE 200 0.0<br />
Gross for BZ0 - <strong>Office</strong> on Latino Affairs 4,021 10.0<br />
<strong>Agency</strong> Performance Plan<br />
The agency’s Performance Plan has <strong>the</strong> following<br />
objectives for FY 2010:<br />
Objective 1: Improve institutional knowledge and<br />
skills, as well as <strong>the</strong> quality <strong>of</strong> programs and/or services<br />
<strong>of</strong>fered to DC Latinos by Latino-serving nonpr<strong>of</strong>it<br />
organizations.<br />
Objective 2: Provide consultation, collaboration, and<br />
problem-solving services to <strong>the</strong> Mayor, District government<br />
agencies, community-based groups, and<br />
o<strong>the</strong>r entities, so that DC Latinos are better informed,<br />
represented, and served.<br />
Objective 3: Provide community outreach services<br />
and generate non-pr<strong>of</strong>it/public/private sector partnerships,<br />
in order to augment DC Latinos’ knowledge <strong>of</strong>,<br />
and access to, vital programs, services, and information.<br />
<strong>Office</strong> on Latino Affairs<br />
E-123
<strong>Agency</strong> Performance Measures<br />
Table BZ0-6<br />
FY 2007 FY 2008 FY 2008<br />
Year-End Original Year-End FY 2009 FY 2010 FY 2011<br />
Measure<br />
Objective 1:<br />
Percent <strong>of</strong> clients at non-pr<strong>of</strong>its funded by OLA that<br />
report satisfactory experiences with programs<br />
Actual Target Actual Projection Projection Projection<br />
and personnel 1<br />
Number served by organizations receiving funding<br />
N/A N/A N/A 70% 75% 80%<br />
from OLA<br />
Objective 2:<br />
Number <strong>of</strong> Language Access Act covered agencies<br />
N/A 5,000 6,273 5,500 6,000 6,500<br />
receiving technical assistance 1<br />
Objective 3:<br />
Number <strong>of</strong> partnerships formed with Latino-serving<br />
organizations and government agencies (communitybased/public/private)<br />
to increase knowledge and<br />
N/A N/A N/A 10 13 16<br />
access to services for <strong>the</strong> Latino community 24 35 55 40 45 50<br />
1 New performance measure for FY 2009.<br />
FY 2010 Proposed <strong>Budget</strong> and <strong>Financial</strong> Plan<br />
E-124
Children and Youth Investment<br />
Collaborative<br />
www.cyitc.org<br />
Telephone: 202-347-4441<br />
% Change<br />
FY 2008 FY 2009 FY 2010 from<br />
Description Actual Approved Proposed FY 2009<br />
Operating <strong>Budget</strong> $20,811,000 $18,460,000 $10,602,000 -42.6<br />
(JY0)<br />
The mission <strong>of</strong> <strong>the</strong> Children and Youth Investment Collaborative is to<br />
provide funds to <strong>the</strong> D.C. Children and Youth Investment Trust<br />
Corporation, a not-for-pr<strong>of</strong>it organization that disburses grants to<br />
community-based providers, with <strong>the</strong> purpose <strong>of</strong> creating a seamless<br />
approach to <strong>the</strong> development <strong>of</strong> policy, planning, and services for children,<br />
youth, and <strong>the</strong>ir families.<br />
The fund, administered by <strong>the</strong> D.C. Children and<br />
Youth Investment Trust Corporation, was established in<br />
1999 as part <strong>of</strong> <strong>the</strong> FY 2000 budget. The corporation<br />
was created to receive funding designated under <strong>the</strong><br />
Children and Youth Initiative Establishment Act <strong>of</strong><br />
1999. The Board <strong>of</strong> Directors, made up <strong>of</strong> seven members<br />
appointed by <strong>the</strong> Mayor and District Council and<br />
four advisory members from District government, govern<br />
<strong>the</strong> corporation. The corporation does not provide<br />
direct services to families; however, it grants funds to<br />
nonpr<strong>of</strong>it organizations that provide direct services to<br />
families and <strong>the</strong>reby increases <strong>the</strong> quality and availability<br />
<strong>of</strong> services in areas <strong>of</strong> greatest need.<br />
The Corporation plans to fulfill its mission by achieving<br />
<strong>the</strong> following strategic result goals:<br />
■ Increase <strong>the</strong> efforts <strong>of</strong> children and youth programs;<br />
and<br />
■ Ensure high quality programs and services for<br />
every child in <strong>the</strong> District.<br />
Children and Youth Investment Collaborative<br />
E-125
These goals are funded through <strong>the</strong> following agency<br />
programs. Note that <strong>the</strong> corporation has two funding<br />
cycles: Year-round and Summer.<br />
Year Round Programs<br />
■ Parent Centers - provides support services to parents<br />
<strong>of</strong> young children and ensures that <strong>the</strong>y are<br />
prepared to embark on <strong>the</strong>ir education.<br />
■ Out-<strong>of</strong>-School Time - provides services to schoolage<br />
children during after-school hours, on weekends,<br />
and during <strong>the</strong> summer to promote academic<br />
achievement and to reduce negative behavior<br />
that correlates with unsupervised, unstructured<br />
time outside <strong>of</strong> school.<br />
■ Older Youth Program - supports youth between<br />
<strong>the</strong> ages <strong>of</strong> 14 and 24, both those enrolled in<br />
school and those no longer connected to school.<br />
FY 2010 Proposed Gross Funds Operating <strong>Budget</strong>, by Revenue Type<br />
Table JY0-1 contains <strong>the</strong> proposed FY 2010 agency budget compared to <strong>the</strong> FY 2009 approved budget. It also<br />
provides FY 2007 and FY 2008 actual expenditures.<br />
Table JY0-1<br />
(dollars in thousands)<br />
Actual Actual Approved Proposed<br />
Change<br />
from Percent<br />
Appropriated Fund<br />
General Fund<br />
FY 2007 FY 2008 FY 2009 FY 2010 FY 2009 Change*<br />
Local Funds 13,092 20,811 18,460 10,602 -7,858 -42.6<br />
Total for General Fund 13,092 20,811 18,460 10,602 -7,858 -42.6<br />
Gross Funds 13,092 20,811 18,460 10,602 -7,858 -42.6<br />
*Percent Change is based on whole dollars.<br />
Note: If applicable, for a breakdown <strong>of</strong> each Grant (Federal and Private), Special Purpose Revenue type and Intra-District agreement,<br />
please refer to Schedule 80, <strong>Agency</strong> Summary by Revenue Source, in <strong>the</strong> Operating Appendices located on <strong>the</strong> <strong>Office</strong> <strong>of</strong> <strong>the</strong> <strong>Chief</strong><br />
<strong>Financial</strong> <strong>Office</strong>r’s website.<br />
FY 2010 Proposed <strong>Budget</strong> and <strong>Financial</strong> Plan<br />
E-126<br />
Summer Programs<br />
■ Summer Program - provides enriching opportunities<br />
to ensure that children and youth ages 5-24<br />
are safe and have opportunities to enhance <strong>the</strong>ir<br />
learning over <strong>the</strong> summer months. These funds<br />
include providing alternative services during <strong>the</strong><br />
late night hours.<br />
The agency’s FY 2010 proposed budget is presented<br />
in <strong>the</strong> following tables:
FY 2010 Proposed Operating <strong>Budget</strong>, by Comptroller Source Group<br />
Table JY0-2 contains <strong>the</strong> proposed FY 2010 budget at <strong>the</strong> Comptroller Source Group (object class) level compared<br />
to <strong>the</strong> FY 2009 approved budget. It also provides FY 2007 and FY 2008 actual expenditures.<br />
Table JY0-2<br />
(dollars in thousands)<br />
Actual Actual Approved Proposed<br />
Change<br />
from Percent<br />
Comptroller Source Group FY 2007 FY 2008 FY 2009 FY 2010 FY 2009 Change*<br />
50 Subsidies and Transfers 13,092 20,811 18,460 10,602 -7,858 -42.6<br />
Subtotal Nonpersonal Services (NPS) 13,092 20,811 18,460 10,602 -7,858 -42.6<br />
Gross Funds 13,092 20,811 18,460 10,602 -7,858 -42.6<br />
*Percent Change is based on whole dollars.<br />
Program Structure Change<br />
The Children and Youth Investment Collaborative had no program structure changes in <strong>the</strong> FY 2010 Proposed<br />
<strong>Budget</strong>.<br />
FY 2010 Proposed Operating <strong>Budget</strong> and FTEs, by Program and Activity<br />
Table JY0-3 contains <strong>the</strong> proposed FY 2010 budget by program and activity compared to <strong>the</strong> FY 2009 approved budget.<br />
It also provides FY 2008 actual data.<br />
Table JY0-3<br />
(dollars in thousands)<br />
Dollars in Thousands Full-Time Equivalents<br />
Change Change<br />
Actual Approved Proposed from Actual Approved Proposed from<br />
Program/Activity<br />
(1000) Children Investment Trust<br />
FY 2008 FY 2009 FY 2010 FY 2009 FY 2008 FY 2009 FY 2010 FY 2009<br />
(1100) Children Investment Trust 20,811 18,460 10,602 -7,858 0.0 0.0 0.0 0.0<br />
Subtotal (1000) Children Investment Trust 20,811 18,460 10,602 -7,858 0.0 0.0 0.0 0.0<br />
Total Proposed Operating <strong>Budget</strong> 20,811 18,460 10,602 -7,858 0.0 0.0 0.0 0.0<br />
(Change is calculated by whole numbers and numbers may not add up due to rounding)<br />
Note: For more detailed information regarding <strong>the</strong> proposed funding for <strong>the</strong> activities within this agency’s programs, please see Schedule 30-PBB Program<br />
Summary By Activity in <strong>the</strong> FY 2010 Operating Appendices located on <strong>the</strong> <strong>Office</strong> <strong>of</strong> <strong>the</strong> <strong>Chief</strong> <strong>Financial</strong> <strong>Office</strong>r’s website.<br />
Children and Youth Investment Collaborative<br />
E-127
Major Baseline Adjustments, Cost Savings<br />
and Policy Initiatives<br />
Initial Adjustment: One-time FY 2009 Local funding<br />
in <strong>the</strong> amount <strong>of</strong> $14,060,000 for grants to community-based<br />
providers was reduced.<br />
Cost Savings: A $480,000 reduction represents a<br />
50 percent decrease in support for administrative<br />
expenses.<br />
Protected Programs: Community-based programs<br />
that engage youth in meaningful activities are essential<br />
to positive youth development. The FY 2010<br />
proposed budget restores $5,200,000 in program<br />
funds. As a result, <strong>the</strong> budget maintains <strong>the</strong> 2009<br />
level <strong>of</strong> funding for competitive grants to out-<strong>of</strong>school<br />
time programs.<br />
All grantees and amounts listed in this budget are<br />
subject to final approval in <strong>the</strong> Fiscal Year 2010<br />
<strong>Budget</strong> Support Act <strong>of</strong> 2009, Bill Number 18-203,<br />
which supersedes this listing upon its effective date.<br />
Policy Initiatives: The proposed budget allocates an<br />
additional $4,495,000 to specific youth-serving programs.<br />
For <strong>the</strong> purposes <strong>of</strong> <strong>the</strong> District’s multi-year financial<br />
plan, <strong>the</strong> FY 2010 budget recognizes <strong>the</strong> entire<br />
Children and Youth Investment Collaborative<br />
Subsidy <strong>of</strong> $13,615,000 as a “one-time” expenditure.<br />
Gap-Closing Initiatives: A $456,000 reduction represents<br />
capping <strong>the</strong> rate for indirect costs allocation at<br />
5 percent in sub-grantee budgets from <strong>the</strong> competitive<br />
grant pool. Competitive grant funds to support<br />
direct services are maintained. Additionally, a<br />
$342,138 reduction in <strong>the</strong> Local budget subsidy<br />
accounts for a shift <strong>of</strong> tax check-<strong>of</strong>f funds from <strong>the</strong><br />
Department <strong>of</strong> Parks and Recreation to <strong>the</strong> Children<br />
Youth Investment Fund. Finally, $3,534,862 cost<br />
savings reflects a reduction in designated grants to<br />
specific youth-serving programs.<br />
FY 2010 Proposed <strong>Budget</strong> and <strong>Financial</strong> Plan<br />
E-128<br />
The budget provides $1,320,000 <strong>of</strong> designated<br />
grants, which includes $1,000,000 for competitive<br />
grants to support community-based targeted gang<br />
street intervention and outreach and $320,000 for <strong>the</strong><br />
Children and Youth Investment Trust Corp for Ward<br />
5 anti-crime youth violence initiative.
FY 2009 Approved <strong>Budget</strong> to FY 2010 Proposed <strong>Budget</strong>, by Revenue Type<br />
Table JY0-4 itemizes <strong>the</strong> changes by revenue type between <strong>the</strong> FY 2009 approved budget and <strong>the</strong> FY 2010 proposed<br />
budget. The four categories <strong>of</strong> changes reflected in this table are: (1) changes to <strong>the</strong> baseline budget (includes<br />
agency request), (2) changes representing cost savings or efficiencies, (3) changes related to policy initiatives, and (4)<br />
changes to specifically address <strong>the</strong> projected revenue shortfall.<br />
Table JY0-4<br />
(dollars in thousands)<br />
PROGRAM BUDGET FTE<br />
LOCAL FUND: FY 2009 Approved <strong>Budget</strong> and FTE 18,460 0.0<br />
Initial and Baseline Adjustments<br />
Reduction for nonrecurring costs - Reduction <strong>of</strong> one-time grants to community- Children Investment Trust -14,060 0.0<br />
based providers<br />
Policy Initiatives and Cost Savings<br />
Enhance - Restore subsidy to FY 2009 approved funding level allocated for Children Investment Trust 5,200 0.0<br />
competitive grants (one-time)<br />
Cost Decrease - Reduce support for administrative expenses Children Investment Trust -480 0.0<br />
Enhance - Add one-time funds for a grant to Earth Conservation Corps Children Investment Trust 250 0.0<br />
to empower youth to reclaim <strong>the</strong> environmental, social, and economic<br />
health <strong>of</strong> <strong>the</strong>ir communities<br />
Enhance - Add funds for a grant to Positive Choices provide Children Investment Trust 150 0.0<br />
educational, athletic, emotional and socially enriched choices for youth<br />
(one-time)<br />
Cost Decrease - Recognize CYIC subsidy payment as one-time funding Children Investment Trust 0 0.0<br />
Designated Grant - To be subgranted to Mentoring Children Investment Trust 75 0.0<br />
Works with Columbia Heights/Shaw Family Streng<strong>the</strong>ning Collaborative<br />
serving as a fiscal agent (one-time costs)<br />
Designated Grant -To be subgranted to Keely's Children Investment Trust 70 0.0<br />
Boxing Gym with Columbia Heights/Shaw Family Streng<strong>the</strong>ning<br />
Collaborative serving as a fiscal agent (one-time costs)<br />
Designated Grant - To be subgranted to <strong>the</strong> Children Investment Trust 50 0.0<br />
Columbia Heights Youth Club with Columbia Heights/Shaw Family<br />
Streng<strong>the</strong>ning Collaborative serving as a fiscal agent (one-time costs).<br />
Designated Grant - To be subgranted to <strong>the</strong> Ward 4 Children Investment Trust 250 0.0<br />
Georgia Avenue Collaborative with Columbia Heights/Shaw Family<br />
Streng<strong>the</strong>ning Collaborative serving as a fiscal agent (one-time costs)<br />
Designated Grant - To be subgranted to Mt. Children Investment Trust 25 0.0<br />
Pleasant Neighborhood Alliance PSA 301 Operation Live-Link pilot<br />
program with Columbia Heights/Shaw Family Streng<strong>the</strong>ning<br />
Collaborative serving as a fiscal agent (one-time costs)<br />
Designated Grant - To be subgranted to NW Children Investment Trust 25 0.0<br />
Columbia Heights Community Association for PSA 302 Operation Live-<br />
Link pilot program with Columbia Heights/Shaw Family Streng<strong>the</strong>ning<br />
Collaborative serving as a fiscal agent (one-time costs)<br />
Designated Grant - For competitive RFP for youth Children Investment Trust 700 0.0<br />
programs in Ward 6 to be distributed evenly between <strong>the</strong><br />
Southwest/Waterfront neighborhood and <strong>the</strong> Near Sou<strong>the</strong>ast /Hill East<br />
neighborhood (one-time costs)<br />
(Continued on <strong>the</strong> next page)<br />
Children and Youth Investment Collaborative<br />
E-129
Table JY0-4 (continued)<br />
(dollars in thousands)<br />
FY 2010 Proposed <strong>Budget</strong> and <strong>Financial</strong> Plan<br />
E-130<br />
PROGRAM BUDGET FTE<br />
Policy Initiatives and Cost Savings (cont.)<br />
Designated Grant - To be subgranted to In-Da-Streets with Columbia<br />
Heights/Shaw Family Streng<strong>the</strong>ning Collaborative serving as a fiscal<br />
agent (one-time costs)<br />
Children Investment Trust 50 0.0<br />
Designated Grant - For Wilderness Leadership and<br />
Learning Organization (one-time costs)<br />
Children Investment Trust 50 0.0<br />
Designated Grant - For Barbara Chambers Childcare<br />
(one-time costs)<br />
Children Investment Trust 75 0.0<br />
Designated Grant - For New Futures to support<br />
scholarship fund for young people living in poverty to attend vocational<br />
training (one-time costs)<br />
Children Investment Trust 50 0.0<br />
Designated Grant - To be subgranted in<br />
collaboration with <strong>the</strong> Coordinating Council (one-time costs)<br />
Children Investment Trust 675 0.0<br />
Designated Grant - For Ward 5 anti-crime youth violence<br />
initiative (one-time costs)<br />
Children Investment Trust 1,700 0.0<br />
Designated Grant - For a Court Appointed Special<br />
Advocate (one-time costs)<br />
Designated Grant - For Fields <strong>of</strong> Dreams<br />
Children Investment Trust 100 0.0<br />
(one-time costs) Children Investment Trust 50 0.0<br />
Designated Grant - For Language Education and<br />
Technology Center (one-time costs)<br />
Children Investment Trust 150 0.0<br />
Gap-Closing Initiatives<br />
Designated Grant - For competitive grants for community-based<br />
targeted gang street intervention and outreach, as recommended in "A<br />
Blueprint for Action: Responding to Gang, Crew, and Youth Violence in<br />
<strong>the</strong> District <strong>of</strong> Columbia".<br />
Children Investment Trust 1,000 0.0<br />
Cost Decrease - Cap rate at 5 percent for indirect costs allocation<br />
in grant awards<br />
Children Investment Trust -456 0.0<br />
Cost Decrease - Reduce Local funds to account for <strong>of</strong>fset by tax<br />
check-<strong>of</strong>f to prevention program for at-risk youth<br />
Children Investment Trust -342 0.0<br />
Cost Decrease - Eliminate designated grants Children Investment Trust -2,457 0.0<br />
Designated Grant - NPS to <strong>the</strong> Children and Youth Investment Trust<br />
Corp for Ward 5 anti-crime youth violence initiative. (One-Time)<br />
Children Investment Trust 320 0.0<br />
Decrease - Reduce one-time funding for Keely Boxing Children Investment Trust -70 0.0<br />
Decrease - Designated Grant: $250,000 to Earth Conservation Corps Children Investment Trust -250 0.0<br />
Decrease - Designated Grant: $150,000 to Positive Choices Children Investment Trust -150 0.0<br />
Decrease - One-time NPS to be granted to CYITC to be subgranted to<br />
Mentoring Works<br />
Children Investment Trust -30 0.0<br />
Decrease - One-time NPS to be granted to CYITC to be subgranted to<br />
<strong>the</strong> Columbia Heights Youth Club<br />
Children Investment Trust -20 0.0<br />
(Continued on <strong>the</strong> next page)
Table JY0-4 (continued)<br />
(dollars in thousands)<br />
Program BUDGET FTE<br />
Gap-Closing Initiatives (cont.)<br />
Decrease - One-time NPS to be granted to CYITC to be subgranted to<br />
<strong>the</strong> Ward 4 Georgia Avenue Collaborative )<br />
Children Investment Trust -100 0.0<br />
Decrease - One-time NPS to be granted to CYITC to be subgranted to<br />
Mt. Pleasant Neighborhood Alliance PSA 301 Operation Live-Link pilot<br />
Children Investment Trust -10 0.0<br />
Decrease - One-time NPS to be granted to CYITC to be subgranted to<br />
NW Columbia Heights Community Association for PSA 302 Operation<br />
Live-Link pilot program )<br />
Children Investment Trust -10 0.0<br />
Decrease - One-time NPS to be granted to CYITC to be subgranted to<br />
In-Da-Streets )<br />
Children Investment Trust -20 0.0<br />
Decrease - One-time NPS to be granted to CYITC to<br />
be subgranted in collaboration with <strong>the</strong> Coordinating Council<br />
Children Investment Trust -228 0.0<br />
Decrease - One-time NPS to be granted to CYITC for Wilderness<br />
Leadership and Learning organization)<br />
Children Investment Trust -20 0.0<br />
Decrease - One-time grant increase in NPS to CYITC for a Court Appointed<br />
Special Advocate<br />
Children Investment Trust -40 0.0<br />
Decrease - One-time grant increase in NPS to CYITC for Language<br />
Education and Technology Center<br />
Children Investment Trust -60 0.0<br />
Decrease - One-time NPS to be granted to CYITC for Barbara Chambers<br />
Childcare<br />
Children Investment Trust -30 0.0<br />
Decrease - One-time grant increase in NPS to CYITC for Fields <strong>of</strong> Dreams Children Investment Trust -20 0.0<br />
Decrease - One-time grant increase in NPS for New Futures to support<br />
scholarship fund for young people living in poverty to attend<br />
vocational training<br />
Children Investment Trust -20 0.0<br />
LOCAL FUND: FY 2010 Proposed <strong>Budget</strong> and FTE 10,602 0.0<br />
Gross for JY0 - Children and Youth Investment Collaborative 10,602 0.0<br />
Children and Youth Investment Collaborative<br />
E-131
<strong>Office</strong> on Asian and<br />
Pacific Islander Affairs<br />
www.apia.dc.gov<br />
Telephone: 202-727-3120<br />
(AP0)<br />
% Change<br />
FY 2008 FY 2009 FY 2010 from<br />
Description Actual Approved Proposed FY 2009<br />
Operating <strong>Budget</strong> $949,076 $964,841 $964,841 0.0<br />
FTEs 6.0 7.0 7.0 0.0<br />
The mission <strong>of</strong> <strong>the</strong> <strong>Office</strong> on Asian & Pacific Islander Affairs (OAPIA)<br />
is to ensure delivery <strong>of</strong> a full range <strong>of</strong> health, education, employment,<br />
business, and social services opportunities to <strong>the</strong> Asian and Pacific<br />
Islander (API) community in <strong>the</strong> District <strong>of</strong> Columbia.<br />
Summary <strong>of</strong> Services<br />
OAPIA provides three core services: (1) assist DC<br />
APIs in accessing equitable services from <strong>the</strong> District<br />
agencies as well as advocate on behalf <strong>of</strong> DC APIs on<br />
issues affecting <strong>the</strong>ir quality <strong>of</strong> life; (2) assist District<br />
agencies to build <strong>the</strong>ir capacity to provide culturally<br />
and linguistically competent services to DC APIs; and<br />
(3) provide API community-focused grants and support<br />
API community organizations’ capacity building<br />
efforts.<br />
The agency’s FY 2010 proposed budget is presented<br />
in <strong>the</strong> following tables:<br />
<strong>Office</strong> on Asian and Pacific Islander Affairs<br />
E-131
FY 2010 Proposed Gross Funds Operating <strong>Budget</strong>, by Revenue Type<br />
Table AP0-1 contains <strong>the</strong> proposed FY 2010 agency budget compared to <strong>the</strong> FY 2009 approved budget. It also<br />
provides <strong>the</strong> FY 2007 and FY 2008 actual expenditures.<br />
Table AP0-1<br />
(dollars in thousands)<br />
Actual Actual Approved Proposed<br />
Change<br />
from Percent<br />
Appropriated Fund<br />
General Fund<br />
FY 2007 FY 2008 FY 2009 FY 2010 FY 2009 Change*<br />
Local Funds 814 930 965 965 0 0.0<br />
Total for General Fund 814 930 965 965 0 0.0<br />
Private Funds<br />
Private Donations 1 10 0 0 0 N/A<br />
Total for Private Funds 1 10 0 0 0 N/A<br />
Intra-District Funds<br />
Intra-District Funds 72 10 0 0 0 N/A<br />
Total for Intra-District Funds 72 10 0 0 0 N/A<br />
Gross Funds 888 949 965 965 0 0.0<br />
*Percent Change is based on whole dollars.<br />
Note: If applicable, for a breakdown <strong>of</strong> each Grant (Federal and Private), Special Purpose Revenue type and Intra-District agreement,<br />
please refer to Schedule 80 <strong>Agency</strong> Summary by Revenue Source in <strong>the</strong> Operating Appendices located on <strong>the</strong> <strong>Office</strong> <strong>of</strong> <strong>the</strong> <strong>Chief</strong><br />
<strong>Financial</strong> <strong>Office</strong>r’s website.<br />
FY 2010 Proposed Full-Time Equivalents, by Revenue Type<br />
Table AP0-2 contains <strong>the</strong> proposed FY 2010 FTE level compared to <strong>the</strong> FY 2009 approved FTE level by revenue<br />
type. It also provides FY 2007 and FY 2008 actual data.<br />
Table AP0-2<br />
Change<br />
Actual Actual Approved Proposed from Percent<br />
Appropriated Fund FY 2007 FY 2008 FY 2009 FY 2010 FY 2009 Change<br />
General Fund<br />
Local Funds 5.0 6.0 7.0 7.0 0.0 0.0<br />
Total for General Fund 5.0 6.0 7.0 7.0 0.0 0.0<br />
Total Proposed FTEs 5.0 6.0 7.0 7.0 0.0 0.0<br />
FY 2010 Proposed <strong>Budget</strong> and <strong>Financial</strong> Plan<br />
E-132
FY 2010 Proposed Operating <strong>Budget</strong>, by Comptroller Source Group<br />
Table AP0-3 contains <strong>the</strong> proposed FY 2010 budget at <strong>the</strong> Comptroller Source group (object class) level compared<br />
to <strong>the</strong> FY 2009 approved budget. It also provides FY 2007 and FY 2008 actual expenditures.<br />
Table AP0-3<br />
(dollars in thousands)<br />
Actual Actual Approved Proposed<br />
Change<br />
from Percent<br />
Comptroller Source Group FY 2007 FY 2008 FY 2009 FY 2010 FY 2009 Change*<br />
11 Regular Pay - Cont Full Time 107 113 175 163 -12 -7.0<br />
12 Regular Pay - O<strong>the</strong>r 287 299 313 326 13 4.2<br />
13 Additional Gross Pay 20 0 0 0 0 N/A<br />
14 Fringe Benefits - Curr Personnel 80 96 91 101 11 11.8<br />
Subtotal Personal Services (PS) 494 508 578 590 12 2.0<br />
20 Supplies and Materials 7 15 6 5 -1 -9.1<br />
30 Energy, Comm. and Bldg Rentals 11 10 6 13 7 118.5<br />
31 Telephone, Telegraph, Telegram, Etc 4 -1 6 8 2 38.9<br />
32 Rentals - Land and Structures 0 0 0 0 0 -100.0<br />
33 Janitorial Services 2 4 4 7 3 63.0<br />
34 Security Services 6 6 4 3 -1 -20.6<br />
35 Occupancy Fixed Costs 10 14 8 5 -3 -40.6<br />
40 O<strong>the</strong>r Services and Charges 31 89 66 49 -17 -25.7<br />
41 Contractual Services - O<strong>the</strong>r 16 15 4 4 0 0.0<br />
50 Subsidies and Transfers 297 255 276 276 0 0.0<br />
70 Equipment & Equipment Rental 8 35 7 5 -2 -28.6<br />
Subtotal Nonpersonal Services (NPS) 393 441 386 375 -12 -3.0<br />
Gross Funds 888 949 965 965 0 0.0<br />
*Percent Change is based on whole dollars.<br />
Program Description<br />
The <strong>Office</strong> on Asian and Pacific Islander Affairs operates<br />
through <strong>the</strong> following 2 programs:<br />
APIA Program – provides outreach, education, and<br />
funding to Asian and Pacific Islander (API) community<br />
members and guidance to District agencies to<br />
help ensure equitable access to government services<br />
and programs for API community members.<br />
The program contains <strong>the</strong> following 3 activities:<br />
■ Advocacy - provides capacity and funding support<br />
to community-based organizations (CBOs)<br />
providing grassroots services to <strong>the</strong> API commu-<br />
nity;<br />
■ Outreach/Education - conducts outreach, case<br />
assistance and educational workshops and cultural<br />
events to API residents and merchants; and<br />
■ Interagency Coordination - provides technical<br />
assistance and guidance to District agencies on<br />
providing appropriate services to Asian limitedand<br />
non-English pr<strong>of</strong>icient constituents and<br />
monitors <strong>the</strong> performance <strong>of</strong> <strong>the</strong>se agencies in<br />
providing language access.<br />
<strong>Agency</strong> Management - provides for administrative<br />
support and <strong>the</strong> required tools to achieve operational<br />
and programmatic results. This program is standard<br />
<strong>Office</strong> on Asian and Pacific Islander Affairs<br />
E-133
for all agencies using performance-based budgeting.<br />
Program Structure Change<br />
The <strong>Office</strong> on Asian and Pacific Islander Affairs had no program structure changes in <strong>the</strong> FY 2010 Proposed <strong>Budget</strong>.<br />
FY 2010 Proposed Operating <strong>Budget</strong> and FTEs, by Program and Activity<br />
Table AP0-4 contains <strong>the</strong> proposed FY 2010 budget by program and activity compared to <strong>the</strong> FY 2009 approved budget.<br />
It also provides <strong>the</strong> FY 2008 actual data.<br />
Table AP0-4<br />
(dollars in thousands)<br />
Dollars in Thousands Full-Time Equivalents<br />
Change Change<br />
Actual Approved Proposed from Actual Approved Proposed from<br />
Program/Activity<br />
(1000) <strong>Agency</strong> Management Program<br />
FY 2008 FY 2009 FY 2010 FY 2009 FY 2008 FY 2009 FY 2010 FY 2009<br />
(1010) Personnel 217 12 54 42 2.1 0.1 1.0 0.9<br />
(1015) Training and Employee Development 1 12 0 -12 0.1 0.1 0.0 -0.1<br />
(1017) Labor Relations 0 12 0 -12 0.0 0.1 0.0 -0.1<br />
(1020) Contracting and Procurement 0 24 12 -12 0.1 0.1 0.0 -0.1<br />
(1030) Property Management 35 40 35 -5 0.1 0.1 0.0 -0.1<br />
(1040) Information Technology 0 12 0 -12 0.1 0.1 0.0 -0.1<br />
(1050) <strong>Financial</strong> Management 0 12 0 -12 0.1 0.1 0.0 -0.1<br />
(1055) Risk Management -2 12 0 -12 0.1 0.1 0.0 -0.1<br />
(1060) Legal 2 12 0 -12 0.1 0.1 0.0 -0.1<br />
(1080) Communications 61 0 0 0 0.1 0.0 0.0 0.0<br />
(1085) Customer Service 2 0 0 0 0.1 0.0 0.0 0.0<br />
(1090) Performance Management 2 12 143 131 0.1 0.1 1.0 0.9<br />
Subtotal (1000) <strong>Agency</strong> Management Program 318<br />
(2000) APIA Programs<br />
162 244 82 3.0 1.0 2.0 1.0<br />
(2100) Advocacy 148 94 99 5 1.0 1.0 1.0 0.0<br />
(2200) Outreach/Education 413 633 510 -123 2.0 4.0 3.0 -1.0<br />
(2300) Interagency Coordination 71 76 112 37 0.0 1.0 1.0 0.0<br />
Subtotal (2000) APIA Programs 632 803 721 -82 3.0 6.0 5.0 -1.0<br />
Total Proposed Operating <strong>Budget</strong> 949 965 965 0 6.0 7.0 7.0 0.0<br />
(Change is calculated by whole numbers and numbers may not add up due to rounding)<br />
Note: For more detailed information regarding <strong>the</strong> proposed funding for <strong>the</strong> activities within this agency’s programs, please see Schedule 30-PBB Program<br />
Summary By Activity in <strong>the</strong> FY 2010 Operating Appendices located on <strong>the</strong> <strong>Office</strong> <strong>of</strong> <strong>the</strong> <strong>Chief</strong> <strong>Financial</strong> <strong>Office</strong>r’s website.<br />
FY 2010 Proposed <strong>Budget</strong> and <strong>Financial</strong> Plan<br />
E-134
Major Baseline Adjustments, Cost Savings and<br />
Policy Initiatives<br />
Initial Adjustments: The <strong>Office</strong> on Asian and Pacific<br />
Islander Affairs transferred $74,435 and 1.0 FTE<br />
from <strong>the</strong> APIA program to <strong>the</strong> <strong>Agency</strong> Management<br />
program to reallocate personal services cost; and<br />
$15,870 from <strong>the</strong> APIA program to <strong>the</strong> <strong>Agency</strong><br />
Management program to cover adjustments to fixed<br />
costs.<br />
FY 2009 Approved <strong>Budget</strong> to FY 2010 Proposed <strong>Budget</strong>, by Revenue Type<br />
Table AP0-5 itemizes <strong>the</strong> changes by revenue type between <strong>the</strong> FY 2009 approved budget and <strong>the</strong> FY 2010 proposed<br />
budget. The four categories <strong>of</strong> changes reflected in this table are: (1) changes to <strong>the</strong> baseline budget (includes<br />
agency request), (2) changes representing cost savings or efficiencies, (3) changes related to policy initiatives, and (4)<br />
changes to specifically address <strong>the</strong> projected revenue shortfall.<br />
Table AP0-5<br />
(dollars in thousands)<br />
Policy Initiatives: The proposed budget includes<br />
$100,159 to increase outreach and related services to<br />
enhance <strong>the</strong> agency’s ability to reach targeted communities.<br />
Gap Closing Initiative: Eliminate <strong>the</strong> $100,159<br />
increase to outreach and related services.<br />
PROGRAM BUDGET FTE<br />
LOCAL FUND: FY 2009 Approved <strong>Budget</strong> and FTE 965 7.0<br />
Initial and Baseline Adjustments<br />
Net effect <strong>of</strong> salary and benefits changes - Reduction in Personal Services APIA Programs -74 -1.0<br />
Net effect <strong>of</strong> salary and benefits changes - Increase in Personal Services <strong>Agency</strong> Management Program 74 1.0<br />
Intra-<strong>Agency</strong> Changes - Reduction in O<strong>the</strong>r Services and Charges APIA Programs -16 0.0<br />
Intra-<strong>Agency</strong> Changes - Increase in fixed costs <strong>Agency</strong> Management Program 16 0.0<br />
Baseline Adjustments: Net effect <strong>of</strong> fixed cost adjustments - Revised fixed cost<br />
estimates for security services<br />
<strong>Agency</strong> Management Program -3 0.0<br />
Baseline Adjustments: Intra-<strong>Agency</strong> Changes - Increase in O<strong>the</strong>r Services and<br />
Charges<br />
Policy Initiatives and Cost Savings<br />
APIA Programs 3 0.0<br />
Net effect <strong>of</strong> fixed cost adjustments - Revised fixed cost estimates for<br />
energy, comm and bldg rent, occupancy fixed, and telecom<br />
<strong>Agency</strong> Management Program -5 0.0<br />
Intra-<strong>Agency</strong> Changes - Increase in O<strong>the</strong>r Services and Charges APIA Programs 5 0.0<br />
Transfer In - Enhancement to increase Outreach and Education efforts APIA Programs 100 0.0<br />
Gap-Closing Initiatives<br />
Decrease - Eliminate enhancements to outreach and related services APIA Programs -100 0.0<br />
LOCAL FUND: FY 2010 Proposed <strong>Budget</strong> and FTE 965 7.0<br />
Gross for AP0 - <strong>Office</strong> on Asian and Pacific Islander Affairs 965 7.0<br />
<strong>Office</strong> on Asian and Pacific Islander Affairs<br />
E-135
<strong>Agency</strong> Performance Plan<br />
The agency’s Performance Plan has <strong>the</strong> following<br />
objectives for FY 2010:<br />
Objective 1: Increase community understanding and<br />
utilization <strong>of</strong> OAPIA through expanded outreach<br />
efforts.<br />
<strong>Agency</strong> Performance Measures<br />
Table AP0-6<br />
FY 2007 FY 2008 FY 2008<br />
Year-End Original Year-End FY 2009 FY 2010 FY 2011<br />
Metric<br />
Objective 1<br />
Actual Target Actual Projection Projection Projection<br />
Number <strong>of</strong> DC API residents, business owners and 500<br />
organizations in OAPIA Community Database 1 .<br />
Objective 2<br />
Percentage <strong>of</strong> DC agencies giving a satisfactory<br />
N/A N/A (baseline) 800 1100 1400<br />
or above rating on OAPIA’s technical assistance efforts 2 .<br />
Objective 3<br />
N/A N/A N/A 85% 90% 95%<br />
Number <strong>of</strong> capacity building efforts provided N/A 100 100 110 121 135<br />
to API community organizations and individuals3. 10% 10% 10%<br />
increase increase increase<br />
1 As <strong>of</strong> FY 2009, OAPIA will create a DC only database to build its contact <strong>of</strong> DC API residents, merchants, and organizations.<br />
2 Technical assistance includes: Providing information on API community from U.S. Census and assisting in data collection design; providing information on API community<br />
through reports; articles and o<strong>the</strong>r informational sources; providing information on resources to receive cultural competency training; providing guidance and/or support from<br />
OAPIA in recruitment <strong>of</strong> bilingual personnel; and reviewing <strong>of</strong> BLAP/Baseline Assessments/Reports.<br />
3 Capacity building efforts include: training sessions, consultation sessions, information dissemination, resource sharing, and CBO visit.<br />
FY 2010 Proposed <strong>Budget</strong> and <strong>Financial</strong> Plan<br />
E-136<br />
Objective 2: Increase capacity <strong>of</strong> District agencies to<br />
provide culturally and linguistically competent services<br />
to <strong>the</strong> API community through useful technical<br />
assistance.<br />
Objective 3: Support community organizations/entities<br />
to provide supplemental services to <strong>the</strong><br />
District’s API community.
<strong>Office</strong> <strong>of</strong> Veterans Affairs<br />
http://ova.dc.gov<br />
Telephone: 202-724-5454<br />
% Change<br />
FY 2008 FY 2009 FY 2010 from<br />
Description Actual Approved Proposed FY 2009<br />
Operating <strong>Budget</strong> $294,723 $462,254 $462,746 0.1<br />
FTEs 2.3 4.0 4.0 0.0<br />
(VA0)<br />
The mission <strong>of</strong> <strong>the</strong> District <strong>of</strong> Columbia <strong>Office</strong> <strong>of</strong> Veterans Affairs<br />
(OVA) is to assist, recognize and effectively advocate on behalf <strong>of</strong><br />
District <strong>of</strong> Columbia veterans and <strong>the</strong>ir families.<br />
Summary <strong>of</strong> Services<br />
The District <strong>of</strong> Columbia <strong>Office</strong> <strong>of</strong> Veterans Affairs<br />
assists District veterans and <strong>the</strong>ir dependents and survivors<br />
in applying for and using Federal Department<br />
<strong>of</strong> Veterans Affairs benefits and in service record<br />
acquisition and correction. OVA also supports veterans<br />
recently released from active duty with transition<br />
assistance from military life to civilian life. Finally,<br />
FY 2010 Proposed Gross Funds Operating <strong>Budget</strong>, by Revenue Type<br />
Table VA0-1 contains <strong>the</strong> proposed FY 2010 agency budget compared to <strong>the</strong> FY 2009 approved budget. It also<br />
provides <strong>the</strong> FY 2007 and FY 2008 actual expenditures.<br />
Table VA0-1<br />
(dollars in thousands)<br />
OVA connects veterans with wrap-around District<br />
and Federal services that address homelessness,<br />
employment, ex-<strong>of</strong>fender reentry and quality <strong>of</strong> life.<br />
The agency’s FY 2010 proposed budget is presented<br />
in <strong>the</strong> following tables:<br />
Actual Actual Approved Proposed<br />
Change<br />
from Percent<br />
Appropriated Fund<br />
General Fund<br />
FY 2007 FY 2008 FY 2009 FY 2010 FY 2009 Change*<br />
Local Funds 306 295 462 463 0 0.1<br />
Total for General Fund 306 295 462 463 0 0.1<br />
Gross Funds 306 295 462 463 0 0.1<br />
*Percent Change is based on whole dollars.<br />
Note: If applicable, for a breakdown <strong>of</strong> each Grant (Federal and Private), Special Purpose Revenue type and Intra-District agreement,<br />
please refer to Schedule 80 <strong>Agency</strong> Summary by Revenue Source in <strong>the</strong> Operating Appendices located on <strong>the</strong> <strong>Office</strong> <strong>of</strong> <strong>the</strong> <strong>Chief</strong><br />
<strong>Financial</strong> <strong>Office</strong>r’s website.<br />
<strong>Office</strong> <strong>of</strong> Veterans Affairs<br />
E-137
FY 2010 Proposed Full-Time Equivalents, by Revenue Type<br />
Table VA0-2 contains <strong>the</strong> proposed FY 2010 FTE level compared to <strong>the</strong> FY 2009 approved FTE level by revenue<br />
type. It also provides FY 2007 and FY 2008 actual data.<br />
Table VA0-2<br />
Change<br />
Actual Actual Approved Proposed from Percent<br />
Appropriated Fund FY 2007 FY 2008 FY 2009 FY 2010 FY 2009 Change<br />
General Fund<br />
Local Funds 2.0 2.3 4.0 4.0 0.0 0.0<br />
Total for General Fund 2.0 2.3 4.0 4.0 0.0 0.0<br />
Total Proposed FTEs 2.0 2.3 4.0 4.0 0.0 0.0<br />
FY 2010 Proposed Operating <strong>Budget</strong>, by Comptroller Source Group<br />
Table VA0-3 contains <strong>the</strong> proposed FY 2010 budget at <strong>the</strong> Comptroller Source Group (object class) level compared<br />
to <strong>the</strong> FY 2009 approved budget. It also provides FY 2007 and FY 2008 actual expenditures.<br />
Table VA0-3<br />
(dollars in thousands)<br />
Actual Actual Approved Proposed<br />
Change<br />
from Percent<br />
Comptroller Source Group FY 2007 FY 2008 FY 2009 FY 2010 FY 2009 Change*<br />
11 Regular Pay - Cont Full Time 113 104 115 165 51 44.0<br />
12 Regular Pay - O<strong>the</strong>r 94 103 171 105 -65 -38.3<br />
13 Additional Gross Pay 5 0 0 0 0 N/A<br />
14 Fringe Benefits - Curr Personnel 34 34 47 44 -3 -6.0<br />
Subtotal Personal Services (PS) 246 241 333 315 -18 -5.3<br />
20 Supplies and Materials 9 7 7 7 0 0.0<br />
30 Energy, Comm. and Bldg Rentals 8 7 3 5 2 78.6<br />
31 Telephone, Telegraph, Telegram, Etc 7 7 6 6 0 -7.8<br />
32 Rentals - Land and Structures 0 0 0 0 0 N/A<br />
33 Janitorial Services 1 2 2 2 1 47.0<br />
34 Security Services 4 1 2 2 0 5.8<br />
35 Occupancy Fixed Costs 3 0 4 3 -1 -20.5<br />
40 O<strong>the</strong>r Services and Charges 25 24 97 123 26 27.4<br />
70 Equipment & Equipment Rental 4 4 10 0 -10 -100.0<br />
Subtotal Nonpersonal Services (NPS) 61 54 130 148 18 14.0<br />
Gross Funds 306 295 462 463 0 0.1<br />
*Percent Change is based on whole dollars.<br />
FY 2010 Proposed <strong>Budget</strong> and <strong>Financial</strong> Plan<br />
E-138
Program Description<br />
The <strong>Office</strong> <strong>of</strong> Veterans Affairs operates through <strong>the</strong><br />
following 2 programs:<br />
Veterans - provides efficient veteran benefits and<br />
claims assistance, effective advocacy and outreach,<br />
recognition assistance, and services to D.C. veterans<br />
and <strong>the</strong>ir families so that <strong>the</strong>y may receive timely veterans<br />
benefit assistance and services from <strong>the</strong><br />
Department <strong>of</strong> Veterans Affairs and o<strong>the</strong>r governmental<br />
agencies.<br />
The program contains <strong>the</strong> following 2 activities:<br />
■ Recognition – ensures District veterans are recognized<br />
by <strong>the</strong> Mayor’s <strong>of</strong>fice during recognition<br />
events. To ensure involvement in recognition<br />
programs, <strong>the</strong> agency actively participates and<br />
supports recognition efforts <strong>of</strong> veteran and military<br />
organizations, and non-affiliated organizations.<br />
All efforts are targeted to ensure District<br />
veterans receive proper respect and recognition for<br />
<strong>the</strong>ir service to this country; and<br />
■ Outreach – ensures agency contact with District<br />
veterans, for purposes <strong>of</strong> recognition, connection<br />
to <strong>the</strong> Federal Department <strong>of</strong> Veterans Affairs for<br />
benefit claims and health services, connection to<br />
District services and connection to community<br />
services. All efforts are targeted to ensure District<br />
veterans are provided <strong>the</strong> opportunity to improve<br />
<strong>the</strong>ir quality <strong>of</strong> life.<br />
<strong>Agency</strong> Management – provides for administrative<br />
support and <strong>the</strong> required tools to achieve operational<br />
and programmatic results. This program is standard<br />
for all agencies using performance-based budgeting.<br />
Program Structure Change<br />
The <strong>Office</strong> <strong>of</strong> Veterans Affairs had no program structure<br />
changes in <strong>the</strong> FY 2010 Proposed <strong>Budget</strong>.<br />
<strong>Office</strong> <strong>of</strong> Veterans Affairs<br />
E-139
FY 2010 Proposed Operating <strong>Budget</strong> and FTEs, by Program and Activity<br />
Table VA0-4 contains <strong>the</strong> proposed FY 2010 budget by program and activity compared to <strong>the</strong> FY 2009 approved budget.<br />
It also provides FY 2008 actual data.<br />
Table VA0-4<br />
(dollars in thousands)<br />
Dollars in Thousands Full-Time Equivalents<br />
Change Change<br />
Actual Approved Proposed from Actual Approved Proposed from<br />
Program/Activity<br />
(1000) <strong>Agency</strong> Management Program<br />
FY 2008 FY 2009 FY 2010 FY 2009 FY 2008 FY 2009 FY 2010 FY 2009<br />
(1010) Personnel 15 14 0 -14 0.1 0.1 0.0 -0.1<br />
(1015) Training and Employee Development 12 44 5 -40 0.1 0.1 0.0 -0.1<br />
(1020) Contracting and Procurement 12 22 9 -13 0.1 0.1 0.0 -0.1<br />
(1030) Property Management 30 29 17 -12 0.1 0.1 0.0 -0.1<br />
(1040) Information Technology 15 23 4 -19 0.1 0.1 0.0 -0.1<br />
(1050) <strong>Financial</strong> Management 76 87 61 -26 1.2 1.4 1.1 -0.3<br />
(1060) Legal 12 13 0 -13 0.1 0.1 0.0 -0.1<br />
(1080) Communications 17 21 16 -6 0.1 0.1 0.0 -0.1<br />
(1085) Customer Service 12 13 4 -9 0.1 0.1 0.0 -0.1<br />
(1090) Performance Management 12 13 120 106 0.1 0.1 1.0 0.9<br />
Subtotal (1000) <strong>Agency</strong> Management Program 212<br />
(2000) Veterans Programs<br />
281 235 -46 2.1 2.3 2.1 -0.2<br />
(2100) Recognition 42 84 121 37 0.1 1.0 1.1 0.1<br />
(2200) Outreach 41 97 106 9 0.1 0.7 0.8 0.1<br />
Subtotal (2000) Veterans Programs 83 181 227 46 0.2 1.7 1.9 0.2<br />
Total Proposed Operating <strong>Budget</strong> 295 462 463 0 2.3 4.0 4.0 0.0<br />
(Change is calculated by whole numbers and numbers may not add up due to rounding)<br />
Note: For more detailed information regarding <strong>the</strong> proposed funding for <strong>the</strong> activities within this agency’s programs, please see Schedule 30-PBB<br />
Program Summary By Activity in <strong>the</strong> FY 2010 Operating Appendices located on <strong>the</strong> <strong>Office</strong> <strong>of</strong> <strong>the</strong> <strong>Chief</strong> <strong>Financial</strong> <strong>Office</strong>r’s website.<br />
FY 2010 Proposed <strong>Budget</strong> and <strong>Financial</strong> Plan<br />
E-140
Major Baseline Adjustments, Cost Savings<br />
and Policy Initiatives<br />
Initial Adjustments: The <strong>Office</strong> <strong>of</strong> Veterans Affairs<br />
transferred $8,506 and 0.2 FTE from <strong>the</strong> <strong>Agency</strong><br />
Management program to <strong>the</strong> Veterans program to<br />
reallocate personal services costs; and $28,681 from<br />
<strong>the</strong> <strong>Agency</strong> Management program to <strong>the</strong> Veterans<br />
program to cover adjustments to o<strong>the</strong>r services and<br />
charges.<br />
Policy Initiatives: To enhance <strong>the</strong> agency’s ability to<br />
serve District veterans, <strong>the</strong> proposed budget includes<br />
$492 to provide certification training for <strong>the</strong> Veterans<br />
Benefits Claim Manager to assist <strong>the</strong> agency in<br />
becoming recognized as a certified state <strong>Office</strong> <strong>of</strong><br />
Veterans Affairs.<br />
FY 2009 Approved <strong>Budget</strong> to FY 2010 Proposed <strong>Budget</strong>, by Revenue Type<br />
Table VA0-5 itemizes <strong>the</strong> changes by revenue type between <strong>the</strong> FY 2009 approved budget and <strong>the</strong> FY 2010 proposed<br />
budget. The four categories <strong>of</strong> changes reflected in this table are: (1) changes to <strong>the</strong> baseline budget (includes<br />
agency request), (2) changes representing cost savings or efficiencies, (3) changes related to policy initiatives, and (4)<br />
changes to specifically address <strong>the</strong> projected revenue shortfall.<br />
Table VA0-5<br />
(dollars in thousands)<br />
PROGRAM BUDGET FTE<br />
LOCAL FUND: FY 2009 Approved <strong>Budget</strong> and FTE 462 4.0<br />
Initial and Baseline Adjustments<br />
Net effect <strong>of</strong> salary and benefits changes - Reduction in Personal Services <strong>Agency</strong> Management Program -9 -0.2<br />
Net effect <strong>of</strong> salary and benefits changes - Increase in Personal Services Veterans Programs 9 0.2<br />
Intra-<strong>Agency</strong> Changes - Reduction in O<strong>the</strong>r Services and Charges <strong>Agency</strong> Management Program -29 0.0<br />
Intra-<strong>Agency</strong> Changes - Increase in O<strong>the</strong>r Services and Charges Veterans Programs 29 0.0<br />
Baseline Adjustments: Net effect <strong>of</strong> fixed cost adjustments - Revised<br />
fixed cost estimates for energy comm. and bldg rent., janitorial services,<br />
security services, and occupancy fixed costs<br />
<strong>Agency</strong> Management Program -7 0.0<br />
Baseline Adjustments: Intra-<strong>Agency</strong> Changes - Increase in O<strong>the</strong>r Services<br />
and Charges<br />
Veterans Programs 7 0.0<br />
Policy Initiatives and Cost Savings<br />
Transfer In - Enhancement to fund certification <strong>of</strong> Veteran's Benefit Specialist Veterans Programs 0 0.0<br />
Net effect <strong>of</strong> fixed cost adjustments - Revised fixed cost estimates for<br />
energy, comm, and bldg rentals, telecom, and occupancy fixed cost<br />
<strong>Agency</strong> Management Program -2 0.0<br />
Intra-<strong>Agency</strong> Changes - Increase in O<strong>the</strong>r Services and Charges Veterans Programs 2 0.0<br />
LOCAL FUND: FY 2010 Proposed <strong>Budget</strong> and FTE 463 4.0<br />
Gross for VA0 - <strong>Office</strong> <strong>of</strong> Veterans Affairs 463 4.0<br />
<strong>Office</strong> <strong>of</strong> Veterans Affairs<br />
E-141
<strong>Agency</strong> Performance Plan<br />
The agency’s Performance Plan has <strong>the</strong> following<br />
objectives for FY 2010:<br />
Objective 1: Expand recognition <strong>of</strong> <strong>the</strong> military service<br />
<strong>of</strong> District <strong>of</strong> Columbia veterans.<br />
<strong>Agency</strong> Performance Measures<br />
Table VA0-6<br />
FY 2010 Proposed <strong>Budget</strong> and <strong>Financial</strong> Plan<br />
E-142<br />
Objective 2: Connect more District <strong>of</strong> Columbia veterans<br />
to <strong>the</strong> full benefits and support made available<br />
by local and Federal government.<br />
Objective 3: Create <strong>the</strong> first network <strong>of</strong> service directed<br />
toward District veteran welfare.<br />
FY 2007 FY 2008 FY 2008<br />
Year-End Original Year-End FY 2009 FY 2010 FY 2011<br />
Measure<br />
Percent <strong>of</strong> veterans who rate OVA services as<br />
Actual Target Actual Projection Projection Projection<br />
satisfactory or better 100 96 99.5 96 96 96<br />
Number <strong>of</strong> DC veterans contacted<br />
Number <strong>of</strong> veteran events and programs<br />
629 650 650 675 700 725<br />
coordinated in partnership with o<strong>the</strong>r organizations<br />
Number <strong>of</strong> veteran events produced by OVA<br />
16 9 27 22 25 30<br />
as <strong>the</strong> lead organization N/A N/A N/A 1 2 3
Department <strong>of</strong> Youth Rehabilitation<br />
Services<br />
www.dyrs.dc.gov<br />
Telephone: 202-576-8175<br />
% Change<br />
FY 2008 FY 2009 FY 2010 from<br />
Description Actual Approved Proposed FY 2009<br />
Operating <strong>Budget</strong> $86,399,088 $81,565,582 $90,355,865 10.8<br />
FTEs 522.7 656.0 602.5 -8.2<br />
(JZ0)<br />
The mission <strong>of</strong> <strong>the</strong> Department <strong>of</strong> Youth Rehabilitation Services<br />
(DYRS) is to improve public safety and give court-involved youth <strong>the</strong><br />
opportunity to become more productive citizens by building on <strong>the</strong><br />
strengths <strong>of</strong> youth and <strong>the</strong>ir families in <strong>the</strong> least restrictive, most<br />
home-like environment consistent with public safety.<br />
Summary <strong>of</strong> Services<br />
DYRS is <strong>the</strong> local juvenile justice agency responsible<br />
for providing safe and stable secure residential and<br />
community-based programs to youth who have been<br />
committed to its care. Programming targeting committed<br />
youth is designed to expand opportunities to<br />
youth so that <strong>the</strong>y can become more productive citizens<br />
and to reduce delinquent behavior. In addition,<br />
DYRS provides secure detention and effective detention<br />
alternative programs to detained youth who are<br />
placed under custody <strong>of</strong> <strong>the</strong> D.C. Superior Court’s<br />
Division <strong>of</strong> Social Services. The program goal for<br />
youth in <strong>the</strong> detention alternatives is to ensure that<br />
youth appear for scheduled court hearings without<br />
being re-arrested.<br />
The agency’s FY 2010 proposed budget is presented<br />
in <strong>the</strong> following tables:<br />
Department <strong>of</strong> Youth Rehabilitation Services<br />
E-143
FY 2010 Proposed Gross Funds Operating <strong>Budget</strong>, by Revenue Type<br />
Table JZ0-1 contains <strong>the</strong> proposed FY 2010 agency budget compared to <strong>the</strong> FY 2009 approved budget. It also<br />
provides FY 2007 and FY 2008 actual expenditures.<br />
Table JZ0-1<br />
(dollars in thousands)<br />
Actual Actual Approved Proposed<br />
Change<br />
from Percent<br />
Appropriated Fund<br />
General Fund<br />
FY 2007 FY 2008 FY 2009 FY 2010 FY 2009 Change*<br />
Local Funds 73,936 84,463 81,143 85,016 3,873 4.8<br />
Total for General Fund 73,936 84,463 81,143 85,016 3,873 4.8<br />
Federal Resources<br />
Federal Payments 0 0 0 5,000 5,000 N/A<br />
Total for Federal Resources 0 0 0 5,000 5,000 N/A<br />
Intra-District Funds<br />
Intra-District Funds 3,694 1,936 423 339 -83 -19.7<br />
Total for Intra-District Funds 3,694 1,936 423 339 -83 -19.7<br />
Gross Funds 77,630 86,399 81,566 90,356 8,790 10.8<br />
*Percent Change is based on whole dollars.<br />
Note: If applicable, for a breakdown <strong>of</strong> each Grant (Federal and Private), Special Purpose Revenue type and Intra-District agreement,<br />
please refer to Schedule 80, <strong>Agency</strong> Summary by Revenue Source, in <strong>the</strong> Operating Appendices located on <strong>the</strong> <strong>Office</strong> <strong>of</strong> <strong>the</strong> <strong>Chief</strong><br />
<strong>Financial</strong> <strong>Office</strong>r’s website.<br />
FY 2010 Proposed Full-Time Equivalents, by Revenue Type<br />
Table JZ0-2 contains <strong>the</strong> proposed FY 2010 FTE level compared to <strong>the</strong> FY 2009 approved FTE level by revenue<br />
type. It also provides FY 2007 and FY 2008 actual data.<br />
Table JZ0-2<br />
Change<br />
Actual Actual Approved Proposed from Percent<br />
Appropriated Fund FY 2007 FY 2008 FY 2009 FY 2010 FY 2009 Change<br />
General Fund<br />
Local Funds 558.3 522.7 656.0 602.5 -53.5 -8.2<br />
Total for General Fund 558.3 522.7 656.0 602.5 -53.5 -8.2<br />
Total Proposed FTEs 558.3 522.7 656.0 602.5 -53.5 -8.2<br />
FY 2010 Proposed <strong>Budget</strong> and <strong>Financial</strong> Plan<br />
E-144
FY 2010 Proposed Operating <strong>Budget</strong>, by Comptroller Source Group<br />
Table JZ0-3 contains <strong>the</strong> proposed FY 2010 budget at <strong>the</strong> Comptroller Source Group (object class) level compared<br />
to <strong>the</strong> FY 2009 approved budget. It also provides FY 2007 and FY 2008 actual expenditures.<br />
Table JZ0-3<br />
(dollars in thousands)<br />
Actual Actual Approved Proposed<br />
Change<br />
from Percent<br />
Comptroller Source Group FY 2007 FY 2008 FY 2009 FY 2010 FY 2009 Change*<br />
11 Regular Pay - Cont Full Time 24,405 26,970 28,373 28,101 -271 -1.0<br />
12 Regular Pay - O<strong>the</strong>r 2,814 3,448 3,077 3,956 879 28.6<br />
13 Additional Gross Pay 1,871 2,072 1,917 1,917 0 0.0<br />
14 Fringe Benefits - Curr Personnel 6,278 6,822 6,133 6,408 275 4.5<br />
15 Overtime Pay 3,312 3,557 2,099 2,099 0 0.0<br />
Subtotal Personal Services (PS) 38,681 42,869 41,598 42,481 883 2.1<br />
20 Supplies and Materials 1,499 1,637 1,763 1,534 -229 -13.0<br />
30 Energy, Comm. and Bldg Rentals 1,347 1,308 2,038 1,176 -863 -42.3<br />
31 Telephone, Telegraph, Telegram, Etc 638 575 500 404 -97 -19.3<br />
32 Rentals - Land and Structures 1,204 1,192 1,262 1,339 77 6.1<br />
33 Janitorial Services 0 0 296 28 -268 -90.5<br />
34 Security Services 143 155 165 0 -165 -100.0<br />
35 Occupancy Fixed Costs 381 483 487 384 -103 -21.2<br />
40 O<strong>the</strong>r Services and Charges 1,084 1,091 1,934 1,727 -208 -10.7<br />
41 Contractual Services - O<strong>the</strong>r 9,579 8,911 9,619 7,431 -2,188 -22.7<br />
50 Subsidies and Transfers 22,601 27,752 21,404 33,189 11,785 55.1<br />
70 Equipment & Equipment Rental 473 424 497 663 167 33.6<br />
Subtotal Nonpersonal Services (NPS) 38,949 43,530 39,967 47,875 7,908 19.8<br />
Gross Funds 77,630 86,399 81,566 90,356 8,790 10.8<br />
*Percent Change is based on whole dollars.<br />
Program Description<br />
The Department <strong>of</strong> Youth Rehabilitation Services<br />
operates through <strong>the</strong> following 5 programs:<br />
Committed Youth Services Administration - provides<br />
custodial care, supervision, services, supports,<br />
and opportunities to youth committed to <strong>the</strong> care<br />
and custody <strong>of</strong> DYRS. The array <strong>of</strong> placement<br />
options ranges from secure confinement, to residential<br />
and community placements, to home-based care.<br />
The Administration assures that <strong>the</strong>re is a case manager<br />
assigned to each committed young person. The<br />
administration also manages <strong>the</strong> operation <strong>of</strong> a secure<br />
facility for committed youth and non-secure, community–based<br />
facilities and programs.<br />
This program contains <strong>the</strong> following 6 activities:<br />
■ Community-Based Programs - provides <strong>the</strong><br />
youth with safe and secure services support and<br />
opportunities in <strong>the</strong>ir home and/or home-like<br />
community residences that <strong>of</strong>fers <strong>the</strong>m expanded<br />
opportunities for growth and rehabilitation while<br />
assuring public safety;<br />
Department <strong>of</strong> Youth Rehabilitation Services<br />
E-145
■ Secure Programs Services - provides a safe and<br />
secure environment that provides for timely, effective<br />
programs for committed youth and effective<br />
planning with family, service providers and legal<br />
representatives so that youth can make appropriate<br />
use <strong>of</strong> available opportunities. The Secure<br />
Programs Services hold youth accountable for<br />
<strong>the</strong>ir behavior, provides for <strong>the</strong> public safety, and<br />
<strong>of</strong>fers rehabilitative services for youth committed<br />
to DYRS;<br />
■ Food Services – ensures that youth and staff at<br />
<strong>the</strong> secure facility in Laurel, Maryland are provided<br />
meals that are nutritionally adequate, palatable,<br />
attractive, properly prepared, and served in a<br />
pleasant surrounding. Meals are prepared and<br />
served daily and may include special diets.<br />
Culinary staff is responsible for menu planning,<br />
food and related supply inventory, maintaining a<br />
clean and sanitary work environment, and complying<br />
with <strong>the</strong> Federal Child Nutrition<br />
Breakfast/Lunch Reimbursement Program;<br />
■ Committed Services – Community Residential<br />
– manages and operates small, community-based,<br />
residential facilities for committed youth in <strong>the</strong><br />
District. These programs include <strong>the</strong> Renaissance<br />
House, a non-secure community-based transitional<br />
living program serving up to six committed<br />
youth. The Renaissance House prepares committed<br />
youth for reintegration into <strong>the</strong> community<br />
and <strong>the</strong>ir transition to independent living. O<strong>the</strong>r<br />
residences being planned include a home for<br />
newly committed boys awaiting placement in<br />
non-secure settings;<br />
■ Care Management – provides individualized case<br />
and care planning, management and monitoring<br />
for DYRS youth and families so that <strong>the</strong>y can<br />
make appropriate use <strong>of</strong> available opportunities<br />
and avoid destructive behavior and re-arrest; and<br />
■ Program Management – provides appropriate<br />
management, supervision and administrative support<br />
to assure DYRS goals are met as related to<br />
committed population.<br />
Detained Youth Services Administration - provides<br />
for <strong>the</strong> care and custody <strong>of</strong> youth awaiting court processing<br />
who are placed in <strong>the</strong> secure detention facility<br />
(Youth Services Center) or shelter care by <strong>the</strong> D.C.<br />
Superior Court. The Administration also advocates<br />
FY 2010 Proposed <strong>Budget</strong> and <strong>Financial</strong> Plan<br />
E-146<br />
for alternatives to secure confinement for youth who<br />
can be supervised in a non-residential setting. The<br />
Administration also contracts for Intensive Third<br />
Party Monitoring Services and an Evening Reporting<br />
Center as alternatives to detention.<br />
This program contains <strong>the</strong> following 4 activities:<br />
■ Community-Based Programs - provides <strong>the</strong><br />
youth with safe and secure programming in <strong>the</strong>ir<br />
home and/or home-like community residence<br />
while <strong>the</strong>y are waiting court processing. The<br />
Detention Review unit, within <strong>the</strong> Community -<br />
Based programs, (1) advocates before <strong>the</strong> Superior<br />
Court and Court Social Services a less restrictive<br />
community alternative for mid-range (court risk<br />
scores <strong>of</strong> 10-15) youth awaiting adjudication or<br />
disposition in a DYRS secure facility or shelter<br />
care (2) “diverts” low risk (court risk scores <strong>of</strong><br />
youth on <strong>the</strong> front-end <strong>of</strong> <strong>the</strong> juvenile justice system,<br />
and (3) provides after hours “emergency<br />
intervention” for <strong>the</strong> U.S. Marshals Service and<br />
Youth Shelter Homes;<br />
■ Secure Detention Division - provides temporary<br />
secure custody for juveniles awaiting adjudication,<br />
disposition, or awaiting transfer to ano<strong>the</strong>r facility.<br />
The Division provides 24-hour custody, care<br />
and supervision; prevents <strong>the</strong> abridgement <strong>of</strong><br />
juvenile’s legal rights while in detainment; and<br />
provides for <strong>the</strong> basic physical, emotional, religious,<br />
educational, and social needs <strong>of</strong> juveniles<br />
while in secure custody. The Division also conducts<br />
diagnostic assessments to inform court processing<br />
and dispositional planning, coordinates<br />
Youth/Family Team Meetings for detained juveniles,<br />
and maintains a safe and humane environment,<br />
ensuring <strong>the</strong> level <strong>of</strong> security necessary to<br />
prevent escape, assault and intimidation;<br />
■ Food Services - ensures that youth and staff at<br />
Youth Services Center are provided meals that are<br />
nutritionally adequate, palatable, attractive, properly<br />
prepared, and served in a pleasant surrounding.<br />
Meals are prepared and served daily and may<br />
include special diets. Culinary staff is responsible<br />
for menu planning, food and related supply<br />
inventory, maintaining a clean and sanitary work<br />
environment and complying with <strong>the</strong> Federal<br />
Child Nutrition Breakfast/Lunch Reimbursement<br />
Program; and
■ Program Management - provides appropriate<br />
management, supervision and administrative support<br />
to assure DYRS goals are met as related to<br />
detained population.<br />
Health Services Administration - provides for <strong>the</strong><br />
design, development, coordination, delivery, and evaluation<br />
<strong>of</strong> a 24-hour comprehensive continuum <strong>of</strong><br />
quality adolescent medical and behavioral health care<br />
services and supports to DYRS in <strong>the</strong> two secure facilities<br />
and in <strong>the</strong> community-based shelters, group<br />
homes, and transition centers. Upon release from<br />
secure care facilities, DYRS Health Services—both<br />
medical and behavioral health—work to ensure<br />
appropriate community-based linkages for continuing<br />
care are established.<br />
This program contains <strong>the</strong> following 4 activities:<br />
■ Medical Care - provides acute care services,<br />
immunizations, and health education, preventive<br />
and comprehensive medical services to all DYRS<br />
youth;<br />
■ Community Services - provides acute care services,<br />
health education, and preventive health and<br />
comprehensive medical services to DYRS youth<br />
in community placements to support a quality<br />
continuum <strong>of</strong> care;<br />
■ Program Management - provides appropriate<br />
management, supervision, and administrative<br />
support to assure DYRS medical service; and<br />
■ Behavioral Health - oversees both mental health<br />
and substance abuse services and supports (i.e.,<br />
co-occurring disorders). The behavioral health<br />
services program provides initial screening, comprehensive<br />
assessments, and evaluations (including<br />
both clinical interviews and standardized<br />
instruments). While individual, group and family<br />
counseling are mainstays <strong>of</strong> <strong>the</strong> program, <strong>the</strong> program<br />
is heavily focused on a trauma-informed<br />
agenda.<br />
<strong>Agency</strong> Management - provides for administrative<br />
support and <strong>the</strong> required tools to achieve operational<br />
and programmatic results. This program is standard<br />
for all agencies using performance-based budgeting.<br />
<strong>Agency</strong> <strong>Financial</strong> Operations - provides comprehensive<br />
and efficient financial management services to,<br />
and on behalf <strong>of</strong>, District agencies so that <strong>the</strong> financial<br />
integrity <strong>of</strong> <strong>the</strong> District <strong>of</strong> Columbia is maintained.<br />
This program is standard for all agencies using<br />
performance-based budgeting.<br />
Program Structure Change<br />
The Department <strong>of</strong> Youth Rehabilitation Services<br />
had no program structure changes in <strong>the</strong> FY 2010<br />
budget.<br />
Department <strong>of</strong> Youth Rehabilitation Services<br />
E-147
FY 2010 Proposed Operating <strong>Budget</strong> and FTEs, by Program and Activity<br />
Table JZ0-4 contains <strong>the</strong> proposed FY 2010 budget by program and activity compared to <strong>the</strong> FY 2009 approved budget.<br />
It also provides FY 2008 actual data.<br />
Table JZ0-4<br />
(dollars in thousands)<br />
Dollars in Thousands Full-Time Equivalents<br />
Change Change<br />
Actual Approved Proposed from Actual Approved Proposed from<br />
Program/Activity<br />
(1000) <strong>Agency</strong> Management Program<br />
FY 2008 FY 2009 FY 2010 FY 2009 FY 2008 FY 2009 FY 2010 FY 2009<br />
(1010) <strong>Agency</strong> Management/personnel 659 1,410 1,187 -223 9.1 11.0 11.0 0.0<br />
(1015) <strong>Agency</strong> Management/training 492 541 575 35 4.0 4.0 5.0 1.0<br />
(1020) Contracts & Procurement 834 1,452 834 -618 7.0 9.0 8.0 -1.0<br />
(1030) Property Management 6,837 8,032 5,974 -2,057 23.4 22.0 13.5 -8.5<br />
(1040) Information Technology 1,042 1,438 2,154 717 3.0 3.0 4.0 1.0<br />
(1055) Risk Management 189 199 202 3 2.0 3.0 2.0 -1.0<br />
(1070) Fleet Management 474 515 754 239 5.0 5.0 5.0 0.0<br />
(1080) Communications 168 700 93 -608 2.0 2.0 2.0 0.0<br />
(1085) Customer Service 24 35 46 12 1.0 1.0 1.0 0.0<br />
(1090) Performance Management 2,723 2,903 3,177 273 21.2 32.0 35.0 3.0<br />
(1095) Licensing & Certifictin 115 84 0 -84 2.0 1.0 0.0 -1.0<br />
(1099) Court Supervision 0 0 553 553 0.0 0.0 0.0 0.0<br />
Subtotal (1000) <strong>Agency</strong> Management Program<br />
(100F) <strong>Agency</strong> <strong>Financial</strong> Operations<br />
13,557 17,309 15,550 -1,760 79.6 93.0 86.5 -6.5<br />
(110F) <strong>Budget</strong> Operations 451 526 313 -212 5.0 6.0 3.0 -3.0<br />
(120F) AFO Accounting Operations 0 0 209 209 0.0 0.0 3.0 3 . 0<br />
(130F) ACFO Operations 0 0 5 5 0.0 0.0 0.0 0.0<br />
Subtotal (100F) <strong>Agency</strong> <strong>Financial</strong> Operations<br />
(2000) Committed Youth Services<br />
451 526 528 2 5.0 6.0 6.0 0.0<br />
(2010) Community Services 20,380 12,288 16,230 3,942 21.0 32.0 14.0 -18.0<br />
(2020) Committed Services-Secured 17,757 16,957 16,115 -842 176.1 215.5 185.5 -30.0<br />
(2030) Food Services 1,203 912 1,133 220 14.2 14.0 12.0 -2.0<br />
(2040) Committed Services - Pre-release 1,689 1,818 1,474 -344 11.3 16.0 12.0 -4.0<br />
(2050) Care Management 2,098 2,095 9,379 7,284 26.1 28.0 26.0 -2.0<br />
(2060) Program Management 212 150 2,307 2,157 0.0 0.0 27.0 27.0<br />
Subtotal (2000) Committed Youth Services<br />
(Continued on next page)<br />
43,340 34,219 46,638 12,418 248.7 305.5 276.5 -29.0<br />
FY 2010 Proposed <strong>Budget</strong> and <strong>Financial</strong> Plan<br />
E-148
FY 2010 Proposed Operating <strong>Budget</strong> and FTEs, by Program and Activity<br />
Table JZ0-4 contains <strong>the</strong> proposed FY 2010 budget by program and activity compared to <strong>the</strong> FY 2009 approved budget.<br />
It also provides FY 2008 actual data.<br />
Table JZ0-4 (continued)<br />
(dollars in thousands)<br />
Dollars in Thousands Full-Time Equivalents<br />
Actual Change Change<br />
FY 2008 Approved Proposed from Actual Approved Proposed from<br />
Program/Activity<br />
(3000) Detained Youth Services<br />
(Unaudited) FY 2009 FY 2010 FY 2009 FY 2008 FY 2009 FY 2010 FY 2009<br />
(3010) Community Services 2,001 2,419 9,941 7,522 24.5 34.0 40.0 6.0<br />
(3020) Detained Serivices - Secured 8,888 9,295 11,782 2,487 113.6 146.5 139.5 -7.0<br />
(3030) Food Services 876 757 827 71 6.0 8.0 7.0 -1.0<br />
(3050) Care Management 11,560 10,815 0 -10,815 22.5 30.0 0.0 -30.0<br />
(3060) Program Management 255 247 762 516 2.0 3.0 9.0 6.0<br />
Subtotal (3000) Detained Youth Services<br />
(4000) Medical Services<br />
23,580 23,532 23,313 -219 168.6 221.5 195.5 -26.0<br />
(4010) Medical Services 2,064 1,578 0 -1,578 4.0 13.0 0.0 -13.0<br />
(4020) Primary Care 1,463 3,028 2,407 -621 2.0 4.0 19.0 15.0<br />
(4030) Community Services 0 1,374 5 -1,369 0.0 13.0 0.0 -13.0<br />
(4040) Program Management 724 0 528 528 5.9 0.0 5.0 5.0<br />
(4050) Behavioral Health 0 0 1,388 1,388 0.0 0.0 14.0 14.0<br />
Subtotal (4000) Medical Services<br />
(5000) Behavioral Health<br />
4,251 5,980 4,328 -1,652 11.9 30.0 38.0 8.0<br />
(5010) Behavioral Health 1,220 0 0 0 8.9 0.0 0.0 0.0<br />
Subtotal (5000) Behavioral Health 1,220 0 0 0 8.9 0.0 0.0 0.0<br />
Total Proposed Operating <strong>Budget</strong> 86,399 81,566 90,356 8,790 522.7 656.0 602.5 -53.5<br />
(Change is calculated by whole numbers and numbers may not add up due to rounding)<br />
Note: For more detailed information regarding <strong>the</strong> proposed funding for <strong>the</strong> activities within this agency’s programs, please see Schedule 30-PBB<br />
Program Summary By Activity in <strong>the</strong> FY 2010 Operating Appendices located on <strong>the</strong> <strong>Office</strong> <strong>of</strong> <strong>the</strong> <strong>Chief</strong> <strong>Financial</strong> <strong>Office</strong>r’s website.<br />
Major Baseline Adjustments, Cost Savings<br />
and Policy Initiatives<br />
Initial Adjustments: The following adjustments were<br />
made in Local funds: a net reduction <strong>of</strong> $836,744 in<br />
fixed cost in energy, telephones, rent, security janitorial<br />
and occupancy; a net increase <strong>of</strong> $4,655,492 in<br />
multiple programs for salary and benefits; and a<br />
reduction <strong>of</strong> $3,818,748 in multiple programs for<br />
supplies and materials, o<strong>the</strong>r services and charges,<br />
and equipment and equipment rental.<br />
Baseline Adjustments: The Department <strong>of</strong> Youth<br />
Rehabilitation Services had <strong>the</strong> following adjustments<br />
made in Local funds: technical adjustments<br />
<strong>of</strong> $9,300,000 for Committed Youth Services and<br />
$700,000 for Detained Youth Services to support<br />
increases in subsidies and transfers.<br />
Department <strong>of</strong> Youth Rehabilitation Services<br />
E-149
Transfers Out: District youth with special education<br />
needs are eligible for private school instruction when<br />
<strong>the</strong>ir needs cannot be met in public school settings.<br />
For <strong>the</strong> first time, non-public tuition expenses will<br />
not be a cost in <strong>the</strong> Local budget. An amount <strong>of</strong><br />
$400,000 in Local funds will transfer from <strong>the</strong> DYRS<br />
budget to <strong>the</strong> Non-Public Tuition agency.<br />
Cost Savings: The cost savings projected for DYRS in<br />
FY 2010 represent efficiencies in <strong>the</strong> agency’s operations.<br />
These decreases will not have an adverse impact<br />
on services to youth under <strong>the</strong> supervision <strong>of</strong> <strong>the</strong><br />
agency.<br />
First, <strong>the</strong> elimination (in November 2008) <strong>of</strong> 13<br />
positions in <strong>the</strong> Detained Youth Services program<br />
results in a cost savings <strong>of</strong> $806,902 from <strong>the</strong> baseline<br />
budget. The personal services budget also decreases by<br />
$213,028 from <strong>the</strong> elimination <strong>of</strong> 3 vacant positions<br />
in <strong>the</strong> <strong>Agency</strong> Management program. Next, a net<br />
savings <strong>of</strong> $135,201 results from <strong>the</strong> transition <strong>of</strong><br />
facility maintenance from 13.5 FTEs to a contracted<br />
provider. For <strong>the</strong> Committed Services program, 10<br />
vacant positions and 3 filled positions will be eliminated<br />
resulting in a $795,681 cost reduction. This<br />
realignment <strong>of</strong> staffing reflects <strong>the</strong> operation <strong>of</strong> <strong>the</strong><br />
new secure treatment facility. There is a personal services<br />
cost decrease <strong>of</strong> $510,853 in <strong>the</strong> Medical<br />
Services program from <strong>the</strong> realignment <strong>of</strong> 3 vacant<br />
positions and 2 filled positions. The same level <strong>of</strong><br />
medical care will be provided to <strong>the</strong> youth. Under a<br />
new payment rate structure for Psychiatric Residential<br />
Treatment Facilities, <strong>the</strong>re will be a $993,713 Local<br />
budget cost savings from projected federal reimbursement<br />
for DYRS placements.<br />
To align <strong>the</strong> FY 2010 budget with past expenditures<br />
and projected utilization, DYRS will reduce out<strong>of</strong>-town<br />
travel by $20,000; reduce purchases in supplies<br />
by $30,000; reduce local travel by $13,700;<br />
reduce out-<strong>of</strong>-town conference fees by $20,000;<br />
reduce payment for membership dues by $5,500;<br />
reduce IT contractual services by $30,000; and<br />
reduce new furniture purchases by $90,000. Also,<br />
revised fixed costs estimates from OPM, DPW, and<br />
OCTO result in savings <strong>of</strong> $152,490 for occupancy,<br />
fleet management, and telecommunications.<br />
The budget includes an <strong>of</strong>fset <strong>of</strong> $21,600 for<br />
OCP procurement assessments to align with revised<br />
estimates. There is also an <strong>of</strong>fset <strong>of</strong> $200,000 to cover<br />
<strong>the</strong> cost <strong>of</strong> medication for both <strong>the</strong> detained and<br />
FY 2010 Proposed <strong>Budget</strong> and <strong>Financial</strong> Plan<br />
E-150<br />
committed youth populations. These costs were previously<br />
incurred by <strong>the</strong> Department <strong>of</strong> Mental<br />
Health.<br />
Protected Programs: This budget fully supports<br />
DYRS’s commitment to quality supervision <strong>of</strong> <strong>the</strong><br />
approximately 740 youth in its care. Foremost, <strong>the</strong><br />
staffing <strong>of</strong> case managers will support manageable<br />
caseloads and improved performance. <strong>Agency</strong> staff<br />
will continue to be trained in positive youth development<br />
approaches that build on <strong>the</strong> assets <strong>of</strong> each<br />
youth. In addition, youth placed at home will receive<br />
a range <strong>of</strong> services through community-based programs:<br />
(1) intensive third-party monitoring; (2)<br />
multi-systemic <strong>the</strong>rapy; (3) transformative mentoring<br />
for groups and individual; (4) outpatient drug treatment;<br />
(5) education and employment services; and<br />
(6) mental health counseling and cognitive behavioral<br />
<strong>the</strong>rapy as well as o<strong>the</strong>r necessary interventions. Local<br />
residential settings such as group homes, <strong>the</strong>rapeutic<br />
foster homes, and independent living programs will<br />
prepare youth for a full transition into <strong>the</strong> community.<br />
In addition, Residential Treatment Centers will<br />
provide youth with behavior modification, psychiatric<br />
treatment, and substance abuse treatment in a<br />
secure <strong>the</strong>rapeutic setting.<br />
A long-term secure treatment center will provide<br />
rehabilitation services to <strong>the</strong> most in need <strong>of</strong> rehabilitation.<br />
The Oak Hill Youth Center is being replaced<br />
with a state-<strong>of</strong>-<strong>the</strong>-art secured juvenile rehabilitation<br />
facility. The new facility has a 60-bed capacity and<br />
will support secure placements for youth charged<br />
with <strong>the</strong> most serious <strong>of</strong>fenses for longer average periods<br />
<strong>of</strong> stay. Through a Positive Youth Development<br />
approach, <strong>the</strong> center’s curriculum provides academic<br />
and vocational classes, recreational activities, social<br />
skills development, and group and individual counseling.<br />
Eventually, all youth end <strong>the</strong>ir confinement in<br />
secure facilities; prior to release from any confinement,<br />
DYRS will engage <strong>the</strong> youth’s family and community-based<br />
providers to make certain <strong>the</strong> necessary<br />
services are in place to ensure a successful transition<br />
back to <strong>the</strong>ir community.<br />
A continued reduction in recidivism is <strong>the</strong> measure<br />
<strong>of</strong> success for DYRS programs. DYRS will<br />
increasingly work in partnership with <strong>the</strong> Metropolitan<br />
Police Department and community-based<br />
providers to improve case planning and assure <strong>the</strong><br />
safety <strong>of</strong> <strong>the</strong> youth and <strong>the</strong>ir communities. More
importantly, two Lead Entities <strong>of</strong> Service Coalitions<br />
will actively engage and serve youth in <strong>the</strong> community.<br />
The Service Coalition concept reforms <strong>the</strong> service<br />
delivery approach to committed youth with moderate<br />
and low levels <strong>of</strong> restrictiveness.<br />
Policy Initiatives: To enhance its continuum <strong>of</strong> community-based<br />
care for youth under its supervision,<br />
DYRS will increase services for youth transitioning<br />
from secure confinement back into <strong>the</strong> community.<br />
The additional $980,000 in one-time funds will provide<br />
pre-release mentoring and life skills services to<br />
youth and upon <strong>the</strong>ir release additional supervision<br />
through daily in-home contacts. The funding for<br />
<strong>the</strong>se services must be competitively awarded through<br />
<strong>the</strong> District’s Request For Proposal (RFP) process.<br />
A $5,000,000 Federal Payment increase will support<br />
reconnecting disconnected committed youth<br />
back into <strong>the</strong> community. The funds will provide<br />
educational and life skills components that will assist<br />
youth in <strong>the</strong> assimilation into mainstream society.<br />
Gap-Closing Initiatives: DYRS will manage agency<br />
operations through additional cost savings and efficiencies.<br />
While operating within a reduced budget,<br />
<strong>the</strong> agency will continue to hasten reform efforts that<br />
ensure that youth receive <strong>the</strong> quality services, supports<br />
and opportunities to achieve <strong>the</strong>ir full potential.<br />
In FY 2009, <strong>the</strong> Oak Hill Youth Center was<br />
replaced with a new long-term secure rehabilitation<br />
facility. The Oak Hill Youth Center in Laurel, MD is<br />
no longer in operation resulting in a substantial<br />
decrease in fixed costs. Reduced fixed costs related to<br />
<strong>the</strong> Laurel campus will result in $700,000 in cost savings.<br />
DYRS continues to focus on more thoughtful<br />
and thorough case planning to ensure a seamless transition<br />
for youth from post-adjudication to post-disposition<br />
placement. Detention review unit staff will<br />
be realigned and redeployed to optimize agency case<br />
planning operations through <strong>the</strong> elimination <strong>of</strong> 2<br />
positions and costs savings <strong>of</strong> $127,943. Ultimately,<br />
by reducing lengths <strong>of</strong> stay awaiting placement youth<br />
will be connected to <strong>the</strong> services necessary for rehabilitation.<br />
Moreover, DYRS will eliminate <strong>the</strong> superintendent<br />
<strong>of</strong> Youth Services Center (YSC) position and 2<br />
unit manager positions by assigning those duties to<br />
<strong>the</strong> <strong>Chief</strong> <strong>of</strong> Detained Services. This realignment <strong>of</strong> 3<br />
staff will lead to $280,867 in cost savings and ultimately<br />
result in increased management and supervision<br />
<strong>of</strong> detained services staff. Separately, 1 position<br />
will be eliminated due to employee early retirement<br />
yielding a cost savings <strong>of</strong> $102,453.<br />
DYRS continues to re-evaluate prices charged for<br />
contracted services. The evaluation process includes<br />
an assessment <strong>of</strong> <strong>the</strong> range <strong>of</strong> prices charged for comparable<br />
contracted services and staffing. DYRS will<br />
make adjustments to rates for Therapeutic Family<br />
Home services to align with actual utilization <strong>of</strong> services.<br />
Standardizing rates will result in $798,255 in<br />
cost savings.<br />
There is a dedicated unit <strong>of</strong> medical pr<strong>of</strong>essionals<br />
at <strong>the</strong> Youth Services Center to attend to youth whose<br />
placement is temporary. Beginning in <strong>the</strong> third quarter<br />
<strong>of</strong> FY 2010, DYRS will begin making claims to<br />
Medicaid for medical services provided at YSC.<br />
These claims will lead to a $195,133 Local budget<br />
costs savings from projected federal reimbursement.<br />
DYRS will reduce telecommunication cost by<br />
eliminating non-essential desk phones for staff<br />
assigned cell phones and/or personal digital assistants.<br />
The agency has identified positions whose primary<br />
duties require staff to be in <strong>the</strong> community to fulfill<br />
<strong>the</strong> agency's mission. This reduction in <strong>the</strong> <strong>Agency</strong><br />
Management Program budget will result in a $28,800<br />
cost savings. An additional $50,000 in cost savings<br />
will be realized from an additional reduction in costs<br />
for employee registration and tuition for conferences.<br />
The amount budgeted for court supervision will<br />
reduced by 15 percent leading to a cost savings <strong>of</strong><br />
$97,500.<br />
Finally, DYRS will eliminate $980,000 in onetime<br />
costs associated with <strong>the</strong> pre-release monitoring<br />
and life skills program.<br />
Department <strong>of</strong> Youth Rehabilitation Services<br />
E-151
FY 2009 Approved <strong>Budget</strong> to FY 2010 Proposed <strong>Budget</strong><br />
Table JZ0-5 itemizes <strong>the</strong> changes by revenue type between <strong>the</strong> FY 2009 approved budget and <strong>the</strong> FY 2010 proposed<br />
budget. The four categories <strong>of</strong> changes reflected in this table are: (1) changes to <strong>the</strong> baseline budget (includes<br />
agency request), (2) changes representing cost savings or efficiencies, (3) changes related to policy initiatives, and (4)<br />
changes to specifically address <strong>the</strong> projected revenue shortfall.<br />
Table JZ0-5<br />
(dollars in thousands)<br />
Program BUDGET FTE<br />
LOCAL FUND: FY 2009 Approved <strong>Budget</strong> and FTE<br />
Initial and Baseline Adjustments<br />
81,143 656.0<br />
Net effect <strong>of</strong> fixed cost adjustments - Decrease in energy, telephones<br />
rent, security, janitorial and occupancy<br />
<strong>Agency</strong> Managment Program -837 0.0<br />
Net effect <strong>of</strong> salary and benefits changes - Increase in salary AFO 11 0.0<br />
Net effect <strong>of</strong> salary and benefits changes - Increase in salary <strong>Agency</strong> Managment Program 757 0.0<br />
Net effect <strong>of</strong> salary and benefits changes - Increase in salary Committed Youth Svcs 2,821 0.0<br />
Net effect <strong>of</strong> salary and benefits changes - Increase in salary Detained Youth Svcs 791 0.0<br />
Net effect <strong>of</strong> salary and benefits changes - Increase in salary Medical Services 274 0.0<br />
Intra-<strong>Agency</strong> Changes - Decrease in o<strong>the</strong>r services and charges,<br />
equipment & equipment rental and contractual services<br />
<strong>Agency</strong> Managment Program -331 0.0<br />
Inra-<strong>Agency</strong> Changes - Decrease in equipment and equipment rental AFO -9 0.0<br />
Intra-<strong>Agency</strong> Changes - Decrease in supplies and materials, contractual<br />
services, subsidies and transfers, and equipment and equipment rental<br />
Committed Youth Svcs -1,490 0.0<br />
Intra-<strong>Agency</strong> Changes - Decrease in supplies and materials, o<strong>the</strong>r<br />
services and charges, contractual services, subsidies and<br />
transfers; and equipment & equipment rental<br />
Detained Youth Svcs -714 0.0<br />
Intra-<strong>Agency</strong> Changes - Decrease in supplies and materials; o<strong>the</strong>r<br />
services and charges, contractual services, subsidies and<br />
transfers, and equipment & equipment rental<br />
Medical Services -1,275 0.0<br />
Baseline Adjustments: Net effect <strong>of</strong> fixed cost adjustments - Decrease in<br />
security services<br />
<strong>Agency</strong> Managment Program -205 0.0<br />
Baseline Adjustments: Intra-<strong>Agency</strong> Changes - Offset <strong>of</strong> fixed cost<br />
increase to restore telecom rescission applied as duplicate entry<br />
<strong>Agency</strong> Managment Program 249 0.0<br />
Baseline Adjustments: Intra-<strong>Agency</strong> Changes - Net effect <strong>of</strong> fixed cost<br />
adjustment<br />
<strong>Agency</strong> Managment Program -26 0.0<br />
Baseline Adjustments: Technical Adjustments - Increase in subsidies and<br />
transfers<br />
Committed Youth Svcs 9,300 0.0<br />
Baseline Adjustments: Technical Adjustments - Increase in subsidies and<br />
transfers<br />
Detained Youth Svcs 700 0.0<br />
Baseline Adjustments: - Net effect <strong>of</strong> fixed cost adjustment <strong>Agency</strong> Managment Program 26 0.0<br />
Baseline Adjustments: - Increase in subsidies and transfers to <strong>of</strong>fset <strong>the</strong><br />
January fixed cost revised estimates<br />
Committed Youth Svcs 205 0.0<br />
Policy Initiatives and Cost Savings<br />
Cost Decrease - Reduction in out-<strong>of</strong>-town travel All Programs -20 0.0<br />
Enhance - Expand services for youth re-entering <strong>the</strong> community Committed Youth Services 980 0.0<br />
(one-time)<br />
Cost Decrease - Reduction in out-<strong>of</strong>-town conference fees All Programs -20 0.0<br />
Cost Decrease - Reduction in <strong>of</strong>fice supplies All Programs -30 0.0<br />
Cost Increase - Fund cost <strong>of</strong> medication for youth due to Multiple Programs 200 0.0<br />
cost previously not incurred by agency<br />
Cost Increase - Align procurement assessment with revised <strong>Agency</strong> Managment Program 22 0.0<br />
OCP estimates<br />
Cost Decrease - Reduction in local travel All Programs -14 0.0<br />
Optimize - Cost savings from utilization <strong>of</strong> Medicaid Committed Youth Services -994 0.0<br />
Psychiatric Residential Treatment Facilities under new rate structure<br />
Continued on next page)<br />
FY 2010 Proposed <strong>Budget</strong> and <strong>Financial</strong> Plan<br />
E-152
Table JZ0-5 (continued)<br />
(dollars in thousands)<br />
Program BUDGET FTE<br />
Policy Initiatives and Cost Savings (cont)<br />
Transfer Out - Transfer education cost for youth to non-public Committed Youth Services -400 0.0<br />
tuition agency<br />
Cost Decrease - Align electricity budget with revised OPM estimates All Programs -32 0.0<br />
Cost Decrease - Align fleet budget with revised DPW estimates All Programs -32 0.0<br />
Cost Decrease - Align occupancy budget with revised OPM estimates <strong>Agency</strong> Managment Program -37 0.0<br />
Cost Decrease - Align telecom budget with revised OCTO estimates All Programs -51 0.0<br />
Cost Decrease - Reduction in payment <strong>of</strong> membership dues <strong>Agency</strong> Managment Program -6 0.0<br />
Cost Decrease - Reduction in IT contractual services <strong>Agency</strong> Managment Program -30 0.0<br />
Cost Decrease - Reduction in new furniture purchases Committed Youth Services -90 0.0<br />
Optimize - Transition facility maintenance from agency <strong>Agency</strong> Managment Program -135 -13.5<br />
to contracted provider<br />
Cost Decrease - Cost savings from vacant position eliminations <strong>Agency</strong> Managment Program -213 -3.0<br />
Cost Decrease - Cost savings from vacant position eliminations and Committed Youth Services -796 -13.0<br />
realignment <strong>of</strong> staffing as a result <strong>of</strong> new facility<br />
Cost Decrease - Cost savings from vacant position eliminations Detained Youth Services -807 -13.0<br />
Cost Decrease - Cost savings from vacant position eliminations and Medical Services -511 -5.0<br />
realignment <strong>of</strong> staffing due to changes in program structure<br />
Gap-Closing Initiatives<br />
Cost decrease - Reduce budget for Court Supervision <strong>Agency</strong> Managment Program -98 0.0<br />
Cost decrease - Reduce fixed cost for Laurel Campus due to closure <strong>of</strong> old<br />
detention facility<br />
<strong>Agency</strong> Managment Program -450 0.0<br />
Cost decrease - Reduce telecommunication cost by eliminating<br />
non-essential desk phones for cell phone users<br />
<strong>Agency</strong> Managment Program -29 0.0<br />
Reduction for nonrecurring costs - Reduce scope <strong>of</strong> work<br />
to maintain smaller facility<br />
<strong>Agency</strong> Managment Program -250 0.0<br />
Cost decrease - Eliminate expanded services for youth re-entering <strong>the</strong><br />
community (one-time)<br />
Committed Youth Services -980 0.0<br />
Optimize - Align duties <strong>of</strong> superintendent YSC with chief <strong>of</strong><br />
detained services<br />
Committed Youth Services -281 -3.0<br />
Reduction for nonrecurring costs - Standardize Therapeutic<br />
Family Home rates to align with actual<br />
Committed Youth Services -798 0.0<br />
Optimize - Realign and redeploy detention review unit staff to hasten<br />
connections to services for youth.<br />
Detained Youth Services -128 -2.0<br />
Transfer out - Cost savings from Medicaid claims for Medical<br />
services at Youth Services Center beginning in 3rd quarter FY 2010<br />
Medical Services -195 0.0<br />
Cost decrease - Eliminate position for employee eligible<br />
for early retirement<br />
Multiple -102 -1.0<br />
Cost decrease - Reduce cost <strong>of</strong> employee registration and tuition for<br />
conferences<br />
Multiple -50 0.0<br />
LOCAL FUND: FY 2010 Proposed <strong>Budget</strong> and FTE 85,016 602.5<br />
FEDERAL PAYMENT: FY 2009 Approved <strong>Budget</strong> and FTE<br />
Policy Initiatives and Cost Savings<br />
0 0.0<br />
Cost Increase - Increase due to Federal Payment Committed Youth Services 5,000 0.0<br />
FEDERAL PAYMENT: FY 2010 Proposed <strong>Budget</strong> and FTE 5,000 0.0<br />
INTRA-DISTRICT FUNDS: FY 2009 Approved <strong>Budget</strong> and FTE 423 0.0<br />
Initial and Baseline Adjustments<br />
Intra-<strong>Agency</strong> Changes - Decrease in supplies and materials; and contractual Committed Youth Services -40 0.0<br />
services<br />
Intra-<strong>Agency</strong> Changes - Decrease in supplies and materials Detained Youth Services -43 0.0<br />
INTRA-DISTRICT FUNDS: FY 2010 Proposed <strong>Budget</strong> and FTE 339 0.0<br />
Gross for JZ0 - Department <strong>of</strong> Youth Rehabilitation Services 90,356 602.5<br />
Department <strong>of</strong> Youth Rehabilitation Services<br />
E-153
<strong>Agency</strong> Performance Plan<br />
The agency’s Performance Plan has <strong>the</strong> following<br />
objectives for FY 2010:<br />
Objective 1: Provide proven community-based programs,<br />
services, supports and opportunities that help<br />
young people to turn <strong>the</strong>ir lives around, achieve and<br />
flourish.<br />
Objective 2: Operate secure facilities that are safe,<br />
humane and address youths’ needs by building on<br />
<strong>the</strong>ir strengths.<br />
<strong>Agency</strong> Performance Measures<br />
Table JZ0-6<br />
FY 2007 FY 2008 FY 2008<br />
Year-End Original Year-End FY 2009 FY 2010 FY 2011<br />
Measure<br />
Objective 1:<br />
Percent <strong>of</strong> committed youth in out-<strong>of</strong>-state residential<br />
Actual* Target Actual Projection Projection Projection<br />
placements<br />
Percent <strong>of</strong> committed youth connected to school,<br />
14% 12.5% 9% 12.5% 10 TBD<br />
work and positive adult at six-month intervals from<br />
<strong>the</strong> date <strong>of</strong> <strong>the</strong>ir release from <strong>the</strong> DC Model program<br />
Average length <strong>of</strong> stay in secure detention awaiting<br />
New<br />
Measure Baseline 33% 90% 92% TBD<br />
placement in shelter home 11 days 7 days 4 days 6 days 5 days TBD<br />
Average length <strong>of</strong> stay in secure detention<br />
Objective 2:<br />
26 days 25 days 21 days 25 days 23 days TBD<br />
Average daily population at Youth Services Center (YSC) 89 80 86 75 75 TBD<br />
Rate <strong>of</strong> injuries to youth as a result <strong>of</strong> assaults at New<br />
YSC and Oak Hill Youth Center (OHYC) measure Baseline 133 0 0 TBD<br />
Rate <strong>of</strong> youth on youth assaults at YSC and New<br />
OHYC<br />
Objective 3:<br />
Average caseload - case manager to committed<br />
measure Baseline --- 0 0 TBD<br />
youth ratio<br />
Percent <strong>of</strong> newly committed youth that undergo a<br />
complete case planning process and are in<br />
30 25 28 25 23 TBD<br />
placements and receiving services consistent with<br />
<strong>the</strong>ir YFTM action plan<br />
Objective 4:<br />
Recidivism rate for all committed youth at six<br />
month intervals from <strong>the</strong> date <strong>of</strong> <strong>the</strong>ir<br />
New<br />
Measure 35% 56% 50% 85% TBD<br />
commitment or release to community Data<br />
Measured as a finding <strong>of</strong> involvement Analysis<br />
in a new <strong>of</strong>fense)<br />
Percent <strong>of</strong> youth completing detention<br />
alternatives without re-arrest and failure to<br />
Pending Baseline 24% 16% 14% TBD<br />
appear in court 93% 92% 92% 94% 95% TBD<br />
FY 2010 Proposed <strong>Budget</strong> and <strong>Financial</strong> Plan<br />
E-154<br />
Objective 3: Develop a performance-driven culture<br />
and infrastructure focusing on improved outcomes<br />
for youth in our care and supported by a qualified and<br />
well-trained pr<strong>of</strong>essional staff.<br />
Objective 4: Provide services, supports and opportunities<br />
to young people that will reduce <strong>the</strong>ir delinquent<br />
behavior and promote public safety.
Department on Disability Services<br />
www.dds.dc.gov<br />
Telephone: 202-730-1700<br />
The mission <strong>of</strong> <strong>the</strong> Department on Disability Services (DDS) is<br />
to provide innovative high-quality services that enable people<br />
with disabilities to lead meaningful and productive lives as vital<br />
members <strong>of</strong> <strong>the</strong>ir families, schools, workplaces, and communities<br />
in every neighborhood in <strong>the</strong> District <strong>of</strong> Columbia.<br />
Summary <strong>of</strong> Services<br />
The Department on Disability Services (DDS) is<br />
composed <strong>of</strong> two Administrations that oversee and<br />
coordinate services for residents with disabilities<br />
through a network <strong>of</strong> private and non-pr<strong>of</strong>it<br />
providers. The Developmental Disabilities<br />
Administration (DDA) ensures that residents with<br />
developmental disabilities receive <strong>the</strong> services and<br />
supports <strong>the</strong>y need to lead self-determined and valued<br />
lives in <strong>the</strong> community. These services include needs<br />
assessment and evaluation, care coordination, transportation<br />
planning, community living services, quality<br />
assurance reviews, medical consultation and training,<br />
health monitoring and employment assistance.<br />
(JM0)<br />
% Change<br />
FY 2008 FY 2009 FY 2010 from<br />
Description Actual Approved Proposed FY 2009<br />
Operating <strong>Budget</strong> $108,343,762 $120,954,826 $95,129,832 -21.4<br />
FTEs 451.8 466.6 409.8 -12.2<br />
The Rehabilitation Services Administration (RSA)<br />
focuses on employment, ensuring that persons with<br />
disabilities achieve a greater quality <strong>of</strong> life by obtaining<br />
and sustaining employment, economic self-sufficiency<br />
and independence. RSA achieves this through<br />
employment marketing and placement services,<br />
Social Security Disability Insurance determinations,<br />
vocational rehabilitation, inclusive business enterprises,<br />
and support for <strong>the</strong> D.C. Center for Independent<br />
Living.<br />
The agency’s FY 2010 proposed budget is presented<br />
in <strong>the</strong> following tables:<br />
Department on Disability Services<br />
E-155
FY 2010 Proposed Gross Funds Operating <strong>Budget</strong>, by Revenue Type<br />
Table JM0-1 contains <strong>the</strong> proposed FY 2010 agency budget compared to <strong>the</strong> FY 2009 approved budget. It also<br />
provides FY 2007 and FY 2008 actual expenditures.<br />
Table JM0-1<br />
(dollars in thousands)<br />
Actual Actual Approved Proposed<br />
Change<br />
from Percent<br />
Appropriated Fund<br />
General Fund<br />
FY 2007 FY 2008 FY 2009 FY 2010 FY 2009 Change*<br />
Local Funds 0 81,911 89,071 62,007 -27,064 -30.4<br />
Special Purpose Revenue Funds 0 4,099 5,800 6,200 400 6.9<br />
Total for General Fund<br />
Federal Resources<br />
0 86,010 94,871 68,207 -26,664 -28.1<br />
Federal Grant Funds 0 19,256 23,211 24,158 947 4.1<br />
Federal Medicaid Payments 0 2,678 2,873 2,765 -108 -3.7<br />
Total for Federal Resources<br />
Intra-District Funds<br />
0 21,934 26,083 26,923 839 3.2<br />
Intra-District Funds 0 400 0 0 0 N/A<br />
Total for Intra-District Funds 0 400 0 0 0 N/A<br />
Gross Funds 0 108,344 120,955 95,130 -25,825 -21.4<br />
*Percent Change is based on whole dollars.<br />
Note: If applicable, for a breakdown <strong>of</strong> each Grant (Federal and Private), Special Purpose Revenue type and Intra-District agreement,<br />
please refer to Schedule 80, <strong>Agency</strong> Summary by Revenue Source, in <strong>the</strong> Operating Appendices located on <strong>the</strong> <strong>Office</strong> <strong>of</strong> <strong>the</strong> <strong>Chief</strong><br />
<strong>Financial</strong> <strong>Office</strong>r’s website.<br />
FY 2010 Proposed Full-Time Equivalents, by Revenue Type<br />
Table JM0-2 contains <strong>the</strong> proposed FY 2010 FTE level compared to <strong>the</strong> FY 2009 approved FTE level by revenue<br />
type. It also provides FY 2007 and FY 2008 actual data.<br />
Table JM0-2<br />
Change<br />
Actual Actual Approved Proposed from Percent<br />
Appropriated Fund FY 2007 FY 2008 FY 2009 FY 2010 FY 2009 Change<br />
General Fund<br />
Local Funds 0.0 304.2 257.2 206.2 -51.0 -19.8<br />
Total for General Fund 0.0 304.2 257.2 206.2 -51.0 -19.8<br />
Federal Resources<br />
Federal Grant Funds 0.0 124.8 182.4 176.6 -5.8 -3.2<br />
Federal Medicaid Payments 0.0 22.8 27.0 27.0 0.0 0.0<br />
Total for Federal Resources 0.0 147.6 209.4 203.6 -5.8 -2.8<br />
Total Proposed FTEs 0.0 451.8 466.6 409.8 -56.8 -12.2<br />
FY 2010 Proposed <strong>Budget</strong> and <strong>Financial</strong> Plan<br />
E-156
FY 2010 Proposed Operating <strong>Budget</strong>, by Comptroller Source Group<br />
Table JM0-3 contains <strong>the</strong> proposed FY 2010 budget at <strong>the</strong> Comptroller Source Group (object class) level compared<br />
to <strong>the</strong> FY 2009 approved budget. It also provides FY 2007 and FY 2008 actual expenditures.<br />
Table JM0-3<br />
(dollars in thousands)<br />
Actual Actual Approved Proposed<br />
Change<br />
from Percent<br />
Comptroller Source Group FY 2007 FY 2008 FY 2009 FY 2010 FY 2009 Change*<br />
11 Regular Pay - Cont Full Time 0 23,354 27,414 25,625 -1,789 -6.5<br />
12 Regular Pay - O<strong>the</strong>r 0 1,128 1,097 1,056 -40 -3.7<br />
13 Additional Gross Pay 0 1,407 0 0 0 N/A<br />
14 Fringe Benefits - Curr Personnel 0 4,590 5,373 4,801 -572 -10.6<br />
15 Overtime Pay 0 140 177 63 -114 -64.4<br />
Subtotal Personal Services (PS) 0 30,619 34,061 31,545 -2,515 -7.4<br />
20 Supplies and Materials 0 253 440 291 -149 -33.9<br />
30 Energy, Comm. and Bldg Rentals 0 11 23 5 -17 -76.6<br />
31 Telephone, Telegraph, Telegram, Etc 0 207 236 206 -30 -12.6<br />
32 Rentals - Land and Structures 0 6,448 8,434 5,334 -3,099 -36.8<br />
34 Security Services 0 636 293 25 -269 -91.6<br />
35 Occupancy Fixed Costs 0 0 0 29 29 N/A<br />
40 O<strong>the</strong>r Services and Charges 0 2,065 2,397 2,345 -52 -2.2<br />
41 Contractual Services - O<strong>the</strong>r 0 4,956 4,981 4,565 -416 -8.4<br />
50 Subsidies and Transfers 0 62,432 69,521 50,321 -19,201 -27.6<br />
70 Equipment & Equipment Rental 0 717 569 464 -105 -18.4<br />
Subtotal Nonpersonal Services (NPS) 0 77,725 86,894 63,585 -23,310 -26.8<br />
Gross Funds<br />
*Percent Change is based on whole dollars.<br />
0 108,344 120,955 95,130 -25,825 -21.4<br />
Department on Disability Services<br />
E-157
Program Description<br />
The Department on Disability Services operates<br />
through <strong>the</strong> following 4 programs:<br />
Developmental Disabilities Administration (DDA)<br />
- provides individualized services, supports, and life<br />
planning to eligible persons so that <strong>the</strong>y can fully participate<br />
in <strong>the</strong> community.<br />
This program contains <strong>the</strong> following 4 activities:<br />
■ DDA Service Planning & Coordination<br />
Division - assists individuals qualified for DDA<br />
services and <strong>the</strong>ir families through person-centered<br />
planning, self determination and informed<br />
choice, to find, utilize, and coordinate available<br />
resources and opportunities in <strong>the</strong> community on<br />
<strong>the</strong> basis <strong>of</strong> individual needs and preferences. It<br />
assists <strong>the</strong> individual to develop an Individualized<br />
Service Plan (ISP) that identifies <strong>the</strong> supports<br />
needed to maximize capabilities and achieve goals.<br />
This activity also plays an active role in advocating<br />
for quality services and promotes healthy lifestyles<br />
and wellness for each individual;<br />
■ Quality Management Division - plays a pivotal<br />
role in carrying out <strong>the</strong> department’s mission,<br />
through examining and improving internal and<br />
external service delivery systems. It develops an<br />
understanding <strong>of</strong> <strong>the</strong> system’s strengths and weaknesses<br />
and its impact on <strong>the</strong> people receiving services.<br />
The activity’s purpose is to foster and support<br />
a dynamic service delivery system that is constantly<br />
being examined and improved. To achieve<br />
this goal, it is functionally divided into 2 units:<br />
- Quality Enhancement & Improvement Unit.<br />
The unit conducts methodical inquiries into<br />
<strong>the</strong> service delivery system to assess its<br />
strengths and weaknesses at <strong>the</strong> external service<br />
provider level. It is responsible for <strong>the</strong><br />
annual provider review process, which establishes<br />
minimum performance standards for<br />
service delivery. The unit is also responsible<br />
for: (1) assuring that providers are qualified,<br />
(2) facilitating remediation, technical assistance,<br />
and follow-up activities, and (3) presenting<br />
data analysis and follow-up on<br />
improvement initiatives.<br />
- Health & Wellness Unit. The unit provides<br />
clinical technical assistance and follow-up for<br />
DDA internal divisions, works directly with<br />
<strong>the</strong> provider community to improve health<br />
FY 2010 Proposed <strong>Budget</strong> and <strong>Financial</strong> Plan<br />
E-158<br />
care delivery and coordination, collaborates<br />
with <strong>the</strong> DCHRP for systemic improvements,<br />
and advocates for people to have <strong>the</strong><br />
best possible health in <strong>the</strong> least restrictive setting;<br />
■ DDA Operations Division -This activity is functionally<br />
divided into 3 units:<br />
- Intake Unit. The unit conducts outreach,<br />
makes eligibility determinations for admission<br />
to DDA, and provides case management<br />
activities to new applicants and those who are<br />
not eligible for DDA services to ensure each<br />
applicant is referred to o<strong>the</strong>r District and/or<br />
generic social service agencies and benefits he<br />
or she may be eligible for.<br />
- Provider and Resource Management Unit.<br />
The unit is primarily responsible for <strong>the</strong> overall<br />
management and support for providers<br />
deemed qualified by DDA. It is committed<br />
to ensuring health and safety <strong>of</strong> individuals<br />
supported by <strong>the</strong> DDA provider community,<br />
advancing <strong>the</strong> overall quality <strong>of</strong> services provided,<br />
and that individuals and families have<br />
<strong>the</strong> opportunity to choose <strong>the</strong>ir own providers<br />
from an array <strong>of</strong> qualified providers. The unit<br />
works collaboratively with providers to ensure<br />
<strong>the</strong>y meet <strong>the</strong> standards set forth by <strong>the</strong><br />
department, and is <strong>the</strong> primary point <strong>of</strong> contact<br />
for provider agencies to DDA for technical<br />
assistance, invoicing, prior approvals for<br />
establishing or changing residential or vocational<br />
services supported by local funding, and<br />
coordination <strong>of</strong> referrals to funded vacancies<br />
in such services.<br />
- Waiver and Benefits Unit. The unit manages<br />
enrollment, prior authorization, utilization<br />
review and audit functions for <strong>the</strong> DD Home<br />
and Community Based Services (HCBS)<br />
waiver; provides technical assistance to DDA<br />
staff and provider agencies regarding HCBS<br />
waiver requirements, service authorization<br />
and billing matters; coordinates benefits<br />
and/or provides technical assistance to individuals,<br />
DDA staff and provider agencies<br />
regarding individual consumer benefits such<br />
as SSI, SSDI, Medicare and Medicaid; and<br />
conducts audits <strong>of</strong> provider agencies in <strong>the</strong><br />
management <strong>of</strong> consumer benefits and funds;<br />
and
■ Incident Management and Enforcement - is<br />
responsible for planning and administering a variety<br />
<strong>of</strong> investigative and compliance activities to<br />
assure that people are kept safe from abuse and<br />
neglect. It conducts quality assurance activities<br />
and collaborates with providers and o<strong>the</strong>r protective<br />
authorities to institute best practices into <strong>the</strong><br />
investigation process.<br />
Rehabilitation Services Administration (RSA)assists<br />
disabled persons with employment and independent<br />
living in <strong>the</strong> home and <strong>the</strong> community. The<br />
program provides an array <strong>of</strong> vocational preparation<br />
services for entry into <strong>the</strong> labor market, including<br />
counseling and guidance, assessment services, physical<br />
restoration, vocational training, job search and<br />
placements, as well as job retention services.<br />
This program contains <strong>the</strong> following 4 activities:<br />
■ Vocational Rehabilitation Services - is designed<br />
to assess, plan, develop and provide vocational<br />
rehabilitation services to eligible individuals that<br />
are consistent with <strong>the</strong>ir strengths, resources, priorities,<br />
concerns, abilities, capabilities, interests<br />
and informed choice to enable individuals with<br />
disabilities to prepare for and engage in gainful<br />
and competitive employment;<br />
■ Blind & Visual Impairment Services - works in<br />
partnership with blind and visually impaired DC<br />
residents by assisting <strong>the</strong>m in obtaining <strong>the</strong> information<br />
<strong>the</strong>y need to make informed choices and<br />
by providing <strong>the</strong>m with access to services that<br />
increase <strong>the</strong>ir opportunities to live as <strong>the</strong>y choose.<br />
Within <strong>the</strong> constraints <strong>of</strong> state and federal laws<br />
and based on available funds, <strong>the</strong> DC RSA-OBVI<br />
fulfils its mission by providing specialized services<br />
in <strong>the</strong> areas <strong>of</strong> Vocational rehabilitation and independent<br />
living services to blind consumers across<br />
<strong>the</strong> lifespan;<br />
■ Disability Determination Services - administers<br />
2 services that provide benefits based on disability:<br />
- Social Security Disability Insurance - provides<br />
for payment <strong>of</strong> disability benefits to individuals<br />
who are insured under <strong>the</strong> Act by virtue <strong>of</strong><br />
<strong>the</strong>ir contributions to <strong>the</strong> Social Security trust<br />
fund through <strong>the</strong> Social Security tax on <strong>the</strong>ir<br />
earnings, as well as to certain dependents<br />
(with disabilities) <strong>of</strong> <strong>the</strong> insured individuals.<br />
- Supplemental Security Income - provides for<br />
payment to individuals (including children<br />
under <strong>the</strong> age <strong>of</strong> 18) with disabilities who have<br />
limited income and resources; and<br />
■ Quality Assurance & Federal Compliance - provides<br />
monitoring, compliance reviews and evaluation<br />
<strong>of</strong> local and Federal agencies ensuring that<br />
RSA customers receive quality services.<br />
<strong>Agency</strong> Management - provides for administrative<br />
support and <strong>the</strong> required tools to achieve operational<br />
and programmatic results. This program is standard<br />
for all agencies using performance-based budgeting.<br />
<strong>Agency</strong> <strong>Financial</strong> Operations - provides comprehensive<br />
and efficient financial management services to,<br />
and on behalf <strong>of</strong>, District agencies so that <strong>the</strong> financial<br />
integrity <strong>of</strong> <strong>the</strong> District <strong>of</strong> Columbia is maintained.<br />
This program is standard for all agencies using<br />
performance-based budgeting.<br />
Program Structure Change<br />
The Department on Disability Services had no program<br />
structure changes in <strong>the</strong> FY 2010 Proposed<br />
<strong>Budget</strong>.<br />
Department on Disability Services<br />
E-159
FY 2010 Proposed Operating <strong>Budget</strong> and FTEs, by Program and Activity<br />
Table JM0-4 contains <strong>the</strong> proposed FY 2010 budget by program and activity compared to <strong>the</strong> FY 2009 approved budget.<br />
It also provides FY 2008 actual data.<br />
Table JM0-4<br />
(dollars in thousands)<br />
Dollars in Thousands Full-Time Equivalents<br />
Change Change<br />
Actual Approved Proposed from Actual Approved Proposed from<br />
Program/Activity FY 2008 FY 2009 FY 2010 FY 2009 FY 2008 FY 2009 FY 2010 FY 2009<br />
(1000) <strong>Agency</strong> Management Program<br />
(1010) Personnel 531 564 690 125 5.0 6.0 7.0 1.0<br />
(1015) Training and Employee Development 555 1,019 439 -580 7.0 7.0 3.0 -4.0<br />
(1020) Contracts and Procurement 736 1,042 784 -258 10.0 13.0 8.0 -5.0<br />
(1030) Property Management 6,343 10,114 5,626 -4,488 8.0 11.0 8.0 -3.0<br />
(1040) Information Technology 872 1,713 1,518 -195 6.9 9.8 9.0 -0.8<br />
(1055) Risk Management 31 0 0 0 0.0 0.0 0.0 0.0<br />
(1060) Legal Services 820 659 890 231 2.0 2.0 2.0 0.0<br />
(1080) Communications 427 352 42 -310 4.0 4.0 0.0 -4.0<br />
(1090) Performance Mangement 2,270 1,316 867 -449 10.8 13.0 9.0 -4.0<br />
(1099) Court Supervision 0 0 3,348 3,348 0.0 0.0 0.0 0.0<br />
(1110) Consumer Affairs 67 0 0 0 1.0 0.0 0.0 0.0<br />
(1120) Consumer Rights and Protection 325 227 132 -95 2.9 4.0 2.0 -2.0<br />
Subtotal (1000) <strong>Agency</strong> Management Program 12,976 17,006 14,337 -2,669 57.6 69.8 48.0 -21.8<br />
(100F) <strong>Agency</strong> <strong>Financial</strong> Operations Program<br />
(110F) <strong>Budget</strong> Operations 199 296 290 -6 2.0 3.0 3.0 0.0<br />
(120F) Accounting Operations 317 379 558 178 0.0 6.8 5.8 -1.0<br />
(130F) Associate <strong>Chief</strong> <strong>Financial</strong> <strong>Office</strong>r 306 174 143 -30 0.0 2.0 2.0 0.0<br />
(140F) <strong>Agency</strong> Fiscal <strong>Office</strong>r 274 539 415 -125 0.0 2.0 2.0 0.0<br />
Subtotal (100F) <strong>Agency</strong> <strong>Financial</strong> Operations Program 1,096 1,388 1,406 17 2.0 13.8 12.8 -1.0<br />
(6000) Developmental Disabilities Administration<br />
(6010) Health, Medical and Habilitation 2,476 0 0 0 4.0 0.0 0.0 0.0<br />
(6020) Disability Services 3,367 0 0 0 15.0 0.0 0.0 0.0<br />
(6030) Case Management 7,326 0 0 0 115.7 0.0 0.0 0.0<br />
(6035) DDA Service Planning & Coordination 0 67,446 39,946 -27,500 0.0 112.0 101.0 -11.0<br />
(6040) Residential Services 49,321 0 0 0 2.0 0.0 0.0 0.0<br />
(6050) Eligibility Services 609 0 0 0 9.8 0.0 0.0 0.0<br />
(6060) Quality Assurance 6,717 4,564 6,694 2,130 35.0 33.0 33.0 0.0<br />
(6070) Service Management 679 0 0 0 9.0 0.0 0.0 0.0<br />
(6080) DDA Consumer Resource Opns 0 3,055 3,197 142 0.0 42.0 42.0 0.0<br />
(6090) DDA Incident Management & Enforcement 0 1,227 849 -378 0.0 18.0 11.0 -7.0<br />
Subtotal (6000) Developmental Disabilities Admin 70,496 76,292 50,685 -25,607 190.4 205.0 187.0 -18.0<br />
(7000) Rehabilitation Services<br />
(7010) Health Medical & Rehabilitation Services 591 0 0 0 6.6 0.0 0.0 0.0<br />
(7020) Disability Services 12,338 0 0 0 82.5 0.0 0.0 0.0<br />
(7025) RSA Client Services 0 10,518 16,330 5,812 0.0 64.3 94.0 29.7<br />
(7030) Employment Readiness & Placement Svcs 3,208 6,878 5,485 -1,394 25.6 31.8 16.0 -15.8<br />
(7035) RSA Transition & Supported Employment 0 1,401 0 -1,401 0.0 16.6 0.0 -16.6<br />
(7040) Case Management 2,326 0 0 0 48.7 0.0 0.0 0.0<br />
(Continued on next page)<br />
FY 2010 Proposed <strong>Budget</strong> and <strong>Financial</strong> Plan<br />
E-160
FY 2010 Proposed Operating <strong>Budget</strong> and FTEs, by Program and Activity<br />
Table JM0-4 contains <strong>the</strong> proposed FY 2010 budget by program and activity compared to <strong>the</strong> FY 2009 approved budget.<br />
It also provides FY 2008 actual data.<br />
Table JM0-4 (Continued)<br />
(dollars in thousands)<br />
Dollars in Thousands Full-Time Equivalents<br />
Change Change<br />
Actual Approved Proposed from Actual Approved Proposed from<br />
Program/Activity FY 2008 FY 2009 FY 2010 FY 2009 FY 2008 FY 2009 FY 2010 FY 2009<br />
(7050) Eligibility Determination Services 4,875 0 0 0 28.8 0.0 0.0 0.0<br />
(7055) RSA Disability Determination Services 0 5,860 6,400 540 0.0 44.5 46.0 1.5<br />
(7060) Quality Assurance 439 1,611 487 -1,124 9.6 20.8 6.0 -14.8<br />
Subtotal (7000) Rehabilitation Services 23,776 26,269 28,702 2,433 201.8 178.0 162.0 -16.0<br />
Total Proposed Operating <strong>Budget</strong> 108,344 120,955 95,130 -25,825 451.8 466.6 409.8 -56.8<br />
(Change is calculated by whole numbers and numbers may not add up due to rounding)<br />
Note: For more detailed information regarding <strong>the</strong> proposed funding for <strong>the</strong> activities within this agency’s programs, please see<br />
Schedule 30-PBB, Program Summary by Activity, in <strong>the</strong> FY 2010 Operating Appendices volume located on <strong>the</strong> <strong>Office</strong> <strong>of</strong> <strong>the</strong><br />
<strong>Chief</strong> <strong>Financial</strong> <strong>Office</strong>r’s website.<br />
Department on Disability Services<br />
E-161
Major Baseline Adjustments, Cost Savings<br />
and Policy Initiatives<br />
Initial Adjustments: An increase <strong>of</strong> $146,585 in<br />
Local funds for personal services in <strong>the</strong> <strong>Agency</strong><br />
Management program; a reduction <strong>of</strong> $10,085 in<br />
Local funds for personal services in <strong>the</strong> <strong>Agency</strong><br />
<strong>Financial</strong> Operations program; increase <strong>of</strong> $393,999<br />
in Local funds for personal services in <strong>the</strong><br />
Developmental Disability program; a reduction<br />
$116,425 in Local funds for personal services in <strong>the</strong><br />
Rehabilitation Services program; and increase <strong>of</strong><br />
$3,443,636 in Local funds for Intra-<strong>Agency</strong> changes<br />
in <strong>the</strong> <strong>Agency</strong> Management program; an increase <strong>of</strong><br />
$78,749 in Local funds for Intra-<strong>Agency</strong> changes in<br />
<strong>the</strong> <strong>Agency</strong> <strong>Financial</strong> Operations program; a reduction<br />
$4,052,750 in Local funds for Intra-<strong>Agency</strong><br />
changes in <strong>the</strong> Developmental Disability program;<br />
and an increase <strong>of</strong> $116,290 in Local funds for <strong>the</strong><br />
Intra-<strong>Agency</strong> changes in <strong>the</strong> Rehabilitation Services<br />
program.<br />
Baseline Adjustments: A reduction <strong>of</strong> $3,531,918 in<br />
Local funds for fixed costs, which includes a decrease<br />
in rentals, security services and occupancy for <strong>the</strong><br />
<strong>Agency</strong> Management program; an increase <strong>of</strong><br />
$576,891 in Local funds for Intra-<strong>Agency</strong> changes<br />
resulting in an increased in subsidies and transfers to<br />
<strong>of</strong>fset a reduction in fixed costs in <strong>the</strong> Developmental<br />
Disabilities Administration (DDA); an increase <strong>of</strong><br />
$2,957,780 in Local funds for Intra-<strong>Agency</strong> changes<br />
to support an increase in subsidies and transfers to <strong>of</strong>fset<br />
a reduction in fixed costs in <strong>the</strong> Rehabilitation<br />
Services Administration (RSA); and an increase <strong>of</strong><br />
$2,500,000 in Local funds for technical adjustments<br />
to support <strong>the</strong> contractual rate increase in Human<br />
Care Agreements in <strong>the</strong> Developmental Disabilities<br />
Administration.<br />
Transfers In/Out: Beginning in FY 2010, <strong>the</strong> local<br />
portion <strong>of</strong> <strong>the</strong> federally matched Medicaid Home and<br />
Community-Based Waiver, $19,967,585, will transfer<br />
from DDS to <strong>the</strong> Department <strong>of</strong> Health Care<br />
Finance (DHCF). This transition ensures that all<br />
funds used to support <strong>the</strong> waiver program reside in<br />
<strong>the</strong> same department, allowing improved oversight<br />
and expenditure tracking.<br />
FY 2010 Proposed <strong>Budget</strong> and <strong>Financial</strong> Plan<br />
E-162<br />
Cost Savings: DDS will realize cost savings by operating<br />
a lean and focused organization that reduces<br />
non-essential administrative and fixed costs. While<br />
few administrative positions will be realigned, client<br />
facing and direct care positions will be protected.<br />
DDS savings in nonpersonal costs reflect a reduction<br />
<strong>of</strong> non-essential activities and a focus on client service.<br />
To realize Local savings, multiple positions and nonpersonal<br />
services have shifted between Local and<br />
Federal funds, resulting in a net Local savings to <strong>the</strong><br />
District.<br />
Administrative charges such as furniture and<br />
equipment, maintenance and repair <strong>of</strong> machinery,<br />
agency supplies, and brochure production will be<br />
right-sized for a total savings <strong>of</strong> $211,996. Travel<br />
costs, out <strong>of</strong> town travel, and garage parking will be<br />
reduced for a savings <strong>of</strong> $282,932. Support activities<br />
including consulting, <strong>of</strong>fice temp assistants, and fairs<br />
will be downsized by $157,114. Additionally, <strong>the</strong><br />
budgets for conference and membership fees will be<br />
right-sized by $54,053, and $56,979 will be reduced<br />
from <strong>the</strong> provider training budget.<br />
Revised estimates in electricity, telecom, fleet and<br />
occupancy charges reduced fixed costs by $36,739.<br />
At <strong>the</strong> same time <strong>the</strong> procurement assessment will be<br />
increased by $60,061 to align with revised estimates<br />
by <strong>the</strong> <strong>Office</strong> <strong>of</strong> Contracting and Procurement.<br />
DDS will realize $1,850,325 in rent savings from<br />
relocating <strong>the</strong> Rehabilitation Services Administration<br />
RSA from 810 1st Street to 1125 15th Street – allowing<br />
co-location and increased collaboration throughout<br />
<strong>the</strong> agency. In previous years, <strong>the</strong> rent payment<br />
for <strong>the</strong> 810 1st Street property came from Local funds<br />
and thus counted towards RSA’s Maintenance <strong>of</strong><br />
Effort (MOE) requirements. To maintain <strong>the</strong> MOE<br />
requirements, <strong>the</strong> initial adjustments to DDS’ budget<br />
placed <strong>the</strong>se funds back into RSA and DDA programs.<br />
The budget reflects calculations that meet a<br />
portion <strong>of</strong> RSA’s MOE obligations with its revised<br />
rent, saving <strong>the</strong> District $1,850,325.<br />
DDS will become a more lean organization,<br />
through realignments in non-direct service staff and<br />
vacancy eliminations. <strong>Agency</strong> management and<br />
agency fiscal management positions, including<br />
administrative, staff supports, policy, communications,<br />
and training roles will be reduced by 8 filled and<br />
7 vacant FTEs, for a total savings <strong>of</strong> $1,322,101. A<br />
realignment within RSA will eliminate 8 vacant sup-
port and medical staff positions and 1 filled position,<br />
for a total <strong>of</strong> $641,096 in savings. DDA will reduce<br />
6 vacant positions (which will not impact best-practice<br />
client-case manager ratios) and 3 filled positions,<br />
which will allow maximum management efficiency,<br />
for a savings <strong>of</strong> $811,361. Finally, 11 unfunded<br />
vacant positions will be eliminated.<br />
Protected Programs: DDS is committed to maximizing<br />
all available resources towards exceptional client<br />
service. As <strong>the</strong>y remain eligible, all individuals served<br />
by DDS in FY 2009 will continue to be served in FY<br />
2010.<br />
On <strong>the</strong> DDA side, <strong>the</strong> budget protects and annualizes<br />
<strong>the</strong> cost <strong>of</strong> individuals served in FY 2009 –<br />
including transitioning 83 individuals from<br />
Intermediate Care Facilities (ICF/MR’s) into <strong>the</strong><br />
Home and Community-Based Waiver, serving 25<br />
new clients from <strong>the</strong> Child and Family Services<br />
<strong>Agency</strong> (CFSA), adding 13 new clients from St.<br />
Elizabeths Hospital, bringing in 10 new individuals,<br />
and adding ano<strong>the</strong>r 30 individuals as a result <strong>of</strong> natural<br />
changes in client status. Within RSA, all direct<br />
client services will remain protected. RSA will move<br />
aggressively to serve, place and retain more individuals<br />
within appropriate jobs. It will significantly<br />
increase <strong>the</strong> creation <strong>of</strong> employment plans to smoothly<br />
transition graduating students with disabilities from<br />
schools into work/education settings and provide<br />
additional supported employment services.<br />
Policy Initiatives: DDS will judiciously use Local<br />
funds, maximize Federal funding, and extend services<br />
to <strong>the</strong> most vulnerable District residents. In FY 2010,<br />
<strong>the</strong> District will save $633,356 in Local funds as a<br />
result <strong>of</strong> a DHCF reprogramming affecting 34 individuals<br />
in ICF/MR’s, whose day program costs will<br />
now be funded through Medicaid. DDS will continue<br />
to work with Medicaid-eligible clients to ensure<br />
that <strong>the</strong>y transition onto Medicaid, <strong>the</strong>reby allowing<br />
a portion <strong>of</strong> <strong>the</strong>ir services to be covered by <strong>the</strong> Home<br />
and Community-Based Waiver and saving $612,637<br />
in Local funds. Fur<strong>the</strong>r, DDS will increase its<br />
momentum in moving individuals, paid for with 100<br />
percent Local funds, from out-<strong>of</strong>-state placements<br />
into enrolled Medicaid providers. Savings from <strong>the</strong>se<br />
moves will amount to $731,443, which is on top <strong>of</strong><br />
$1,100,000 in savings accounted for in <strong>the</strong> baseline<br />
budget.<br />
In addition to cost saving measures, DDS’ FY<br />
2010 budget will ensure that it serves vulnerable residents.<br />
An enhancement <strong>of</strong> $1,977,436 will allow<br />
DDS to serve 25 new CFSA clients in FY 2010 and<br />
account for client cost increases. An increase <strong>of</strong><br />
$300,000 in Local funding will support <strong>the</strong> housing<br />
costs <strong>of</strong> 10 individuals transitioning into <strong>the</strong><br />
Medicaid Home and Community-Based Waiver<br />
from St. Elizabeths Hospital in FY 2010. This<br />
increase is <strong>of</strong>fset by an equivalent decrease in Local<br />
funds at <strong>the</strong> Department <strong>of</strong> Mental Health (DMH)<br />
for <strong>the</strong> same purpose.<br />
DDS will receive a transfer <strong>of</strong> $100,000 from <strong>the</strong><br />
Child and Family Services <strong>Agency</strong> for <strong>the</strong><br />
Developmental Disabilities Administration, to develop<br />
and implement Facilitated Family Team Meetings<br />
(FFTM) for youth transitioning from CFSA and<br />
District <strong>of</strong> Columbia Public Schools. These funds<br />
shall be used to support one (1) additional FTE who<br />
shall be a person qualified in <strong>the</strong> practice <strong>of</strong> FFTM.<br />
Stimulus: The American Recovery and Reinvestment<br />
Act (ARRP) will benefit <strong>the</strong> DDS clients in three primary<br />
ways: (1) <strong>the</strong> Vocational Rehabilitation State<br />
Grant will go to enhance rehabilitation programs; (2)<br />
an Independent Living State Grant will improve independent<br />
living services, and (3) <strong>the</strong>re will be a small<br />
enhancement to services for older individuals who are<br />
blind. Through <strong>the</strong> Vocational Rehabilitation State<br />
Grants, Title 1 <strong>of</strong> <strong>the</strong> Rehab Act, RSA will receive<br />
$1,879,421 between FY 2009 and FY 2010.<br />
Approximately $939,711 in FY 2010 funding will go<br />
towards fur<strong>the</strong>r improving supported employment<br />
and school transition programs. The Independent<br />
Living State Grants, totaling $242,913 – approximately<br />
$121,457 in FY 2010 – will go directly into<br />
expansion and enhancement <strong>of</strong> independent living<br />
services to eligible District residents. Finally, $3,170<br />
will go towards services for older individuals who are<br />
blind.<br />
Gap-Closing Initiatives: To realize cost savings, DDS<br />
will continue to operate a lean organization that vigilantly<br />
manages costs while improving <strong>the</strong> quality <strong>of</strong><br />
services provided. Additional savings will come from<br />
re-evaluating prices prior to exercising options to<br />
extend contracts, assessing cost <strong>of</strong> services and<br />
staffing to adjust for projected utilization rates, and<br />
increased competitive negotiations.<br />
Department on Disability Services<br />
E-163
DDA will realize $1,830,000 in savings from significant<br />
cost management efforts in <strong>the</strong> Human Care<br />
Agreements for Residential Services. Cost-saving initiatives<br />
focus on bringing room and board costs more<br />
in line with D.C. Housing Authority and HUD standards,<br />
while allowing DDA to reduce local expenditures<br />
in this area by an average <strong>of</strong> $1,960 annually per<br />
consumer for <strong>the</strong> 933 consumers covered by Human<br />
Care Agreements. Fur<strong>the</strong>r cost management <strong>of</strong> transportation<br />
costs and <strong>the</strong> ability to bring transport costs<br />
into <strong>the</strong> DDA Waiver through increasing enrollment<br />
will lead to a savings <strong>of</strong> $60,000. Similar management<br />
<strong>of</strong> consumer medical bill costs, such as ensuring that<br />
providers only bill for costs over those allocated in <strong>the</strong><br />
Human Care Agreements and continuing to assist<br />
individuals to acquire Medicaid or o<strong>the</strong>r health insurance,<br />
will save $60,033.<br />
Moreover, increasing contract management will<br />
generate significant savings. DDA will institute a 3<br />
percent decrease in administrative fees in <strong>the</strong> Human<br />
Care Agreements, to bring general and administrative<br />
expenses down. Administrative fees need to be adjusted<br />
to reflect <strong>the</strong> appropriate level and proper allocation<br />
<strong>of</strong> administrative costs, and will save $700,000 in<br />
Local funds. Similar contract and spending management<br />
will allow DDA to reduce both service coordination<br />
and death investigation contractual costs, for a<br />
savings <strong>of</strong> $100,000 and $150,000 respectively. DDA<br />
will competitively solicit proposals for death investigations<br />
and align <strong>the</strong> contract budget with demand.<br />
Fur<strong>the</strong>r, contracted service coordination will not be<br />
required as DDA will not exceed maximum case size<br />
ratios <strong>of</strong> 30 or less consumers per service coordinator.<br />
Similarly as DDS incurs budget reductions, it will<br />
reduce by 10 percent <strong>the</strong> amount budgeted for <strong>the</strong><br />
Special Master and Court Monitor in <strong>the</strong> Evans case,<br />
leading to a savings <strong>of</strong> $25,000 and $88,000 respectively.<br />
FY 2010 Proposed <strong>Budget</strong> and <strong>Financial</strong> Plan<br />
E-164<br />
Continuing its vigorous efforts, DDA will aggressively<br />
relocate consumers from out-<strong>of</strong>-state residential<br />
placements to local placements, or assist providers to<br />
convert out-<strong>of</strong>-state placements to <strong>the</strong> D.C. Medicaid<br />
Waiver. These efforts, toge<strong>the</strong>r with higher than<br />
expected conversions to date to <strong>the</strong> Medicaid Waiver,<br />
will generate $1,100,000 in additional local savings.<br />
Finally, DDS will reduce personnel across <strong>the</strong><br />
agency. An additional FY 2010 Local savings <strong>of</strong><br />
$520,148 will come from <strong>the</strong> elimination <strong>of</strong> 13 staff<br />
composed <strong>of</strong> 12 filled and one vacant position. Eleven<br />
<strong>of</strong> <strong>the</strong> eliminated positions are non-direct services and<br />
<strong>the</strong> duties <strong>of</strong> <strong>the</strong> remaining two positions are able to<br />
be absorbed with existing staff.<br />
The 13 positions represent 7.4 Local funds FTEs and<br />
5.6 Federal funds FTEs.
FY 2009 Approved <strong>Budget</strong> to FY 2010 Proposed <strong>Budget</strong>, by Revenue Type<br />
Table JM0-5 itemizes <strong>the</strong> changes by revenue type between <strong>the</strong> FY 2009 approved budget and <strong>the</strong> FY 2010 proposed<br />
budget. The four categories <strong>of</strong> changes reflected in this table are: (1) changes to <strong>the</strong> baseline budget (includes<br />
agency request), (2) changes representing cost savings or efficiencies, (3) changes related to policy initiatives, and (4)<br />
changes to specifically address <strong>the</strong> projected revenue shortfall<br />
Table JM0-5<br />
(dollars in thousands)<br />
PROGRAM BUDGET FTE<br />
LOCAL FUND: FY 2009 Approved <strong>Budget</strong> and FTE 89,071 257.2<br />
Initial and Baseline Adjustments<br />
Net effect <strong>of</strong> salary and benefits changes - Increase in salary <strong>Agency</strong> Management Program 147 0.0<br />
Net effect <strong>of</strong> salary and benefits changes - Decrease in salary <strong>Agency</strong> <strong>Financial</strong> Operations Program -10 0.0<br />
Net effect <strong>of</strong> salary and benefits changes - Changes in net salary Developmental Disabilities Admin 394 0.0<br />
Net effect <strong>of</strong> salary and benefits changes - Decrease in salary Rehabilitation Services -116 0.0<br />
Intra-<strong>Agency</strong> Changes - Increase in Supplies and Materials;<br />
O<strong>the</strong>r Services and Charges; and Contractual services<br />
<strong>Agency</strong> Management Program 3,444 0.0<br />
Intra-<strong>Agency</strong> Changes - Increase in Contractual Services <strong>Agency</strong> <strong>Financial</strong> Operations Program 79 0.0<br />
Intra-<strong>Agency</strong> Changes - Decreases in Supplies and Materials;<br />
O<strong>the</strong>r Services and Charges, Contractual Services; and Subsidies<br />
and Transfers<br />
Developmental Disabilities Admin -4,053 0.0<br />
Intra-<strong>Agency</strong> Changes - Increase in Supplies and Materials;<br />
O<strong>the</strong>r Services and Charges, Subsidies and Transfers; and<br />
Equipment and Equipment Rental<br />
Rehabilitation Services 116 0.0<br />
Baseline Adjustments: Net effect <strong>of</strong> fixed cost adjustments -<br />
Decrease in Rentals, Security services and Occupancy<br />
<strong>Agency</strong> Management Program -3,532 0.0<br />
Baseline Adjustments: Intra-<strong>Agency</strong> Changes - Changes in<br />
Contractual Services<br />
<strong>Agency</strong> Management Program -2 0.0<br />
Baseline Adjustments: Intra-<strong>Agency</strong> Changes - An increase<br />
in Subsidies and Transfers, to <strong>of</strong>fset a reduction in fixed costs<br />
Developmental Disabilities Admin 577 0.0<br />
Baseline Adjustments: Intra-<strong>Agency</strong> Changes - Increase<br />
in Subsidies and Transfers to <strong>of</strong>fset a reduction in fixed costs<br />
Rehabilitation Services 2,958 0.0<br />
Baseline Adjustments: Technical Adjustment - Contractual<br />
rate increase for human care agreements<br />
Developmental Disabilities Admin 2,500 0.0<br />
Policy Initiatives and Cost Savings<br />
Cost Increase - Align procurement assessment with revised<br />
OCP estimates<br />
<strong>Agency</strong> Management Program 60 0.0<br />
Reduce - Net local savings from realigning staff <strong>Agency</strong> Management Program -435 -5.0<br />
Cost Decrease - Eliminate vacant positions <strong>Agency</strong> Management Program -558 -6.0<br />
Cost Decrease - Reduce expenditures on brochure production <strong>Agency</strong> Management Program -10 0.0<br />
Reduce - Realign training and employee development staff <strong>Agency</strong> Management Program -278 -3.0<br />
Cost Decrease - Eliminate vacant position <strong>Agency</strong> <strong>Financial</strong> Operations Program -51 -1.0<br />
Cost Decrease - Eliminate vacant positions Developmental Disabilities Admin -495 -6.0<br />
Cost Decrease - Savings from assisting 16 current DDA clients<br />
transitioning into Medicaid eligibility<br />
Developmental Disabilities Admin -613 0.0<br />
Cost Decrease - Savings in ICFMR day program costs due to expanded<br />
coverage under new rate methodology<br />
(Continued on next page)<br />
Developmental Disabilities Admin -633 0.0<br />
Department <strong>of</strong> Disability Services<br />
E-165
Table JM0-5<br />
(dollars in thousands)<br />
FY 2010 Proposed <strong>Budget</strong> and <strong>Financial</strong> Plan<br />
E-166<br />
PROGRAM BUDGET FTE<br />
Policy Initiatives and Cost Savings (cont)<br />
Enhance - Serve 25 new clients transitioning from CFSA to DDS in<br />
FY 2010 and annualize cost <strong>of</strong> new clients served in FY 2009<br />
Developmental Disabilities Admin 1,977 0.0<br />
Enhance - Support housing costs for 10 individuals transitioning.<br />
from St Elizabeths Hospital in <strong>the</strong> Medicaid Home and Community-<br />
Based Waiver in FY 2010<br />
Developmental Disabilities Admin 300 0.0<br />
Optimize - Generate savings from moving 28 DDA clients from<br />
out-<strong>of</strong>-state into <strong>the</strong> District or into facilities that provide<br />
Medicaid-reimbursable services<br />
Developmental Disabilities Admin -731 0.0<br />
Reduce - Realign staff to achieve management efficiency Developmental Disabilities Admin -316 -3.0<br />
Transfer Out - Permanently transfer <strong>the</strong> local portion <strong>of</strong> <strong>the</strong><br />
federally matched Medicaid Home and Community-Based Waiver<br />
Program to DHCF<br />
Developmental Disabilities Admin -19,968 0.0<br />
Cost Decrease - Eliminate vacant positions within RSA Rehabilitation Services -451 -7.0<br />
Cost Decrease - Realign staffing within RSA Rehabilitation Services -190 -2.0<br />
Cost Decrease - Reduce budget for maintenance and machinery repairs Rehabilitation Services -8 0.0<br />
Cost Decrease - Rent savings from consolidation <strong>of</strong> RSA staff<br />
with DDS at 1125 15th St. NW<br />
Rehabilitation Services -1,850 0.0<br />
Correct - Remove unfunded local positions Multiple Programs 0 -11.6<br />
Cost Decrease - Align fleet budget with revised DPW estimates Multiple Programs -4 0.0<br />
Cost Decrease - Align occupancy budget with revised DRES estimates Multiple Programs -3 0.0<br />
Cost Decrease - Align telecom budget with revised OCTO estimates Multiple Programs -30 0.0<br />
Cost Decrease - Elimination <strong>of</strong> garage parking for employees Multiple Programs -246 0.0<br />
Cost Decrease - Reduce expenditures on conferences and<br />
membership fees<br />
Multiple Programs -54 0.0<br />
Cost Decrease - Reduce expenditures on consulting and support services Multiple Programs -78 0.0<br />
Cost Decrease - Reduce expenditures on provider training Multiple Programs -57 0.0<br />
Cost Decrease - Reduce travel cards and out <strong>of</strong> town travel Multiple Programs -37 0.0<br />
Cost Decrease - Right-size agency supply budget Multiple Programs -159 0.0<br />
Cost Decrease - Right-size budget for external <strong>of</strong>fice support<br />
and temporary assistant services<br />
Multiple Programs -80 0.0<br />
Cost Decrease - Right-sizing furniture and equipment budget Multiple Programs -35 0.0<br />
Transfer In - Transfer from CFSA for <strong>the</strong> implementation <strong>of</strong> <strong>the</strong><br />
Facilitated Family Group Decision Making<br />
Developmental Disabilities Admin 100 1.0<br />
Gap-Closing Initiatives<br />
Cost decrease - Human Care Agreement Developmental Disabilities Admin -700 0.0<br />
Cost decrease - Out <strong>of</strong> State residential costs Developmental Disabilities Admin -1,100 0.0<br />
Cost decrease - Transportation Developmental Disabilities Admin -60 0.0<br />
Cost decrease - Medical bills Developmental Disabilities Admin -60 0.0<br />
Reduce - Personal Services Multiple -520 -7.4<br />
Cost decrease - Case management contractual costs Developmental Disabilities Admin -150 0.0<br />
Reduce - Special Master fees<br />
(Continued on next page)<br />
Developmental Disabilities Admin -25 0.0
Table JM0-5 (continued)<br />
(dollars in thousands)<br />
PROGRAM BUDGET FTE<br />
Gap-Closing Initiatives (cont)<br />
Reduction - Court Monitor fees Developmental Disabilities Admin -88 0.0<br />
Cost decrease - Death investigation contract Developmental Disabilities Admin -100 0.0<br />
Cost decrease - Human Care Agreement Developmental Disabilities Admin -1,830 0.0<br />
LOCAL FUND: FY 2010 Proposed <strong>Budget</strong> and FTE 62,007 206.2<br />
SPECIAL PURPOSE REVENUE FUNDS: FY 2009 Approved <strong>Budget</strong> and FTE 5,800 0.0<br />
Initial and Baseline Adjustments<br />
Intra-<strong>Agency</strong> Changes - Changes in Equipment and Equipment Rental <strong>Agency</strong> Management Program -30 0.0<br />
Intra-<strong>Agency</strong> Changes - Changes in Subsidies and Transfers Developmental Disabilities Admin 400 0.0<br />
Intra-<strong>Agency</strong> Changes - Increase in Equipment and Equipment Rental Rehabilitation Services 30 0.0<br />
SPECIAL PURPOSE REVENUE FUNDS: FY 2010 Proposed <strong>Budget</strong> and FTE 6,200 0.0<br />
FEDERAL GRANT FUND: FY 2009 Approved <strong>Budget</strong> and FTE 23,211 182.4<br />
Initial and Baseline Adjustments<br />
Net effect <strong>of</strong> fixed cost adjustments - Changes in fixed cost <strong>Agency</strong> Management Program -613 0.0<br />
Net effect <strong>of</strong> fixed cost adjustments - Increase in energy, rentals, and Rehabilitation Services 605 0.0<br />
occupancy. Decrease in security service<br />
Net effect <strong>of</strong> salary and benefits changes - Decrease in salary <strong>Agency</strong> Management Program -217 0.0<br />
Net effect <strong>of</strong> salary and benefits changes - Increase in salary <strong>Agency</strong> <strong>Financial</strong> Operations Program 103 0.0<br />
Net effect <strong>of</strong> salary and benefits changes - Increase in salary Rehabilitation Services 563 0.0<br />
Intra-<strong>Agency</strong> Changes - Changes in supplies; O<strong>the</strong>r Services and <strong>Agency</strong> Management Program 342 0.0<br />
Charges; Contractual Services; Subsidies and Transfers; and<br />
Equipment & Equipment Rental<br />
Intra-<strong>Agency</strong> Changes - Increase in Supplies and Materials; Contractual <strong>Agency</strong> <strong>Financial</strong> Operations Program 3 0.0<br />
Services. Decrease in Equipment and Equipment Rental<br />
Intra-<strong>Agency</strong> Changes - Decrease in O<strong>the</strong>r Services and Charges; Rehabilitation Services -643 0.0<br />
Subsidies and Transfers; and Equipment and Equipment Rental<br />
Intra-<strong>Agency</strong> Changes - Changes in Subsidies and Transfers Developmental Disabilities Admin -255 0.0<br />
Baseline Adjustments: Net effect <strong>of</strong> fixed cost adjustments - Decrease <strong>of</strong> Rehabilitation Services -1 0.0<br />
energy and security services,<br />
Policy Initiatives and Cost Savings<br />
Enhance - Increase in <strong>the</strong> Independent Living State Grant from Rehabilitation Services 121 0.0<br />
<strong>the</strong> American Recovery and Reinvestment Act.<br />
Enhance - Increase in RSA Part B Title I funding for vocational Rehabilitation Services 939 -0.2<br />
rehabilitation from <strong>the</strong> American Recovery and Reinvestment Act.<br />
Gap-Closing Initiatives<br />
Reduce - Personal Services Rehabilitation Services -284 -5.6<br />
Enhance - RSA Services Rehabilitation Services 284 0.0<br />
FEDERAL GRANT FUND: FY 2010 Proposed <strong>Budget</strong> and FTE 24,158 176.6<br />
(Continued on next page)<br />
Department <strong>of</strong> Disability Services<br />
E-167
Table JM0-5 (continued)<br />
(dollars in thousands)<br />
FY 2010 Proposed <strong>Budget</strong> and <strong>Financial</strong> Plan<br />
E-168<br />
PROGRAM BUDGET FTE<br />
FEDERAL MEDICAID PAYMENTS: FY 2009 Approved <strong>Budget</strong> and FTE 2,873 27.0<br />
Initial and Baseline Adjustments<br />
Net effect <strong>of</strong> salary and benefits changes - Decrease in salary <strong>Agency</strong> Management Program -181 0.0<br />
Net effect <strong>of</strong> salary and benefits changes - Decrease in salary <strong>Agency</strong> <strong>Financial</strong> Operations Program -35 0.0<br />
Net effect <strong>of</strong> salary and benefits changes - Increase in salary Developmental Disabilities Admin 316 0.0<br />
Intra-<strong>Agency</strong> changes - Decrease in Contractual Services and <strong>Agency</strong> <strong>Financial</strong> Operations Program -70 0.0<br />
Equipment and Equipment Rentals<br />
Intra-<strong>Agency</strong> Changes - Decrease in Subsidies and Transfers Developmental Disabilities Admin -138 0.0<br />
FEDERAL MEDICAID PAYMENTS: FY 2010 Proposed <strong>Budget</strong> and FTE 2,765 27.0<br />
Gross for JM0 - Department on Disabilities Services 95,130 409.8
<strong>Agency</strong> Performance Plan<br />
The agency’s Performance Plan has <strong>the</strong> following<br />
objectives for FY 2010:<br />
Objective 1: Enable individuals with developmental<br />
disabilities to maximize <strong>the</strong>ir independence and exercise<br />
meaningful choice and control over <strong>the</strong>ir own<br />
lives.<br />
<strong>Agency</strong> Performance Measures<br />
Table JM0-6<br />
Objective 2: Promote health and wellness <strong>of</strong> people<br />
with developmental disabilities.<br />
Objective 3: Increase <strong>the</strong> employment and economic<br />
independence <strong>of</strong> individuals with disabilities.<br />
FY 2007 FY 2008 FY 2008<br />
Year-End Original Year-End FY 2009 FY 2010 FY 2011<br />
Measure<br />
Objective 1:<br />
Actual* Target Actual Projection Projection Projection<br />
Number <strong>of</strong> persons eligible for DDA services who<br />
receive services in <strong>the</strong> Medicaid Home and<br />
Community Based Program (Residential /<br />
Non-Residential)<br />
Percent <strong>of</strong> providers passing <strong>the</strong> new Service Quality<br />
Review certification (formerly BASA) on <strong>the</strong><br />
1,044 1,455 1,232 1,450 1,600 1,750<br />
first review.<br />
Number <strong>of</strong> new and quality providers recruited to<br />
30% 70% 25% 60% 80% 90%<br />
<strong>the</strong> District. 9 10 11 10 10 10<br />
Number <strong>of</strong> eligible HCBS waiver individuals who<br />
receive in home supports (percent <strong>of</strong> total)<br />
Objective 2:<br />
N/A N/A 363 (29%) 383 (26%) 403 (25%) 423 (25%)<br />
Percent <strong>of</strong> people who report that providers and service<br />
coordinators help <strong>the</strong>m get what <strong>the</strong>y need.<br />
N/A 75% 79% 85% 90% 95%<br />
Percent <strong>of</strong> persons served who have annual medical<br />
exams.<br />
96% 100% 98% 100% 100% 100%<br />
Number <strong>of</strong> days between date <strong>the</strong> service<br />
coordinator is notified <strong>of</strong> need for a guardian and<br />
<strong>the</strong> date request package is submitted to <strong>the</strong> OAG.*<br />
105 N/A 142 90 75 60<br />
Objective 3:<br />
Number <strong>of</strong> persons served by RSA in supported<br />
employment 150 175 225 425 500 550<br />
Number <strong>of</strong> qualified RSA individuals employed for<br />
90 days (percent <strong>of</strong> total)<br />
575 (39%) 576 (41%) 576 (40%) 625 (42%) 675 (44%) 725 (45%)<br />
Number <strong>of</strong> children referred from DCPS and charter<br />
schools to DCRSA to establish eligibility<br />
561 700 897 1,000 1,200 1400<br />
Number <strong>of</strong> vocational rehabilitation eligibility<br />
determinations<br />
1493 1,395 1,453 1,500 1,550 1600<br />
* Permanent, emergency and urgent guardian requests are tracked<br />
Department <strong>of</strong> Disability Services<br />
E-169
Department <strong>of</strong> Health Care<br />
Finance<br />
http://dhcf.dc.gov<br />
Telephone: 202-442-5988<br />
(HT0)<br />
% Change<br />
FY 2008 FY 2009 FY 2010 from<br />
Description Actual Approved Proposed FY 2009<br />
Operating <strong>Budget</strong> $0 $1,834,134,462 $2,075,214,343 13.1<br />
FTEs 0.0 166.3 155.3 -6.6<br />
The mission <strong>of</strong> <strong>the</strong> Department <strong>of</strong> Health Care Finance is to<br />
improve health outcomes by providing access to comprehensive,<br />
cost-effective and quality healthcare services for residents <strong>of</strong> <strong>the</strong><br />
District <strong>of</strong> Columbia.<br />
Summary <strong>of</strong> Services<br />
The Department <strong>of</strong> Health Care Finance (DHCF), a<br />
newly created agency in FY 2009, provides health care<br />
services to low-income children, adults, <strong>the</strong> elderly<br />
and persons with disabilities. Over 200,000 District<br />
<strong>of</strong> Columbia residents (nearly one third <strong>of</strong> all residents)<br />
receive healthcare services through DHCF’s<br />
Medicaid and Alliance programs. DHCF strives to<br />
provide <strong>the</strong>se services in <strong>the</strong> most appropriate and<br />
cost-effective settings possible.<br />
The agency’s FY 2010 proposed budget is presented<br />
in <strong>the</strong> following tables:<br />
Department <strong>of</strong> Health Care Finance<br />
E-171
FY 2010 Proposed Gross Funds Operating <strong>Budget</strong>, by Revenue Type<br />
Table HT0-1 contains <strong>the</strong> proposed FY 2010 agency budget compared to <strong>the</strong> FY 2009 approved budget. It also<br />
provides FY 2007 and FY 2008 actual expenditures.<br />
Table HT0-1<br />
(dollars in thousands)<br />
Actual Actual Approved Proposed<br />
Change<br />
from Percent<br />
Appropriated Fund<br />
General Fund<br />
FY 2007 FY 2008 FY 2009 FY 2010 FY 2009 Change*<br />
Local Funds 0 0 588,308 486,691 -101,617 -17.3<br />
Dedicated Taxes 0 0 16,449 25,764 9,315 56.6<br />
Special Purpose Revenue Funds 0 0 1,977 1,823 -154 -7.8<br />
Total for General Fund 0 0 606,734 514,278 -92,456 -15.2<br />
Federal Resources<br />
Federal Grant Funds 0 0 6,549 1,028 -5,521 -84.3<br />
Federal Medicaid Payments 0 0 1,209,336 1,533,208 323,872 26.8<br />
Total for Federal Resources 0 0 1,215,885 1,534,236 318,351 26.2<br />
Intra-District Funds<br />
Intra-District Funds 0 0 11,515 26,700 15,185 131.9<br />
Total for Intra-District Funds 0 0 11,515 26,700 15,185 131.9<br />
Gross Funds 0 0 1,834,134 2,075,214 241,080 13.1<br />
*Percent Change is based on whole dollars.<br />
Note: If applicable, for a breakdown <strong>of</strong> each Grant (Federal and Private), Special Purpose Revenue type and Intra-District agreement, please refer to<br />
Schedule 80, <strong>Agency</strong> Summary by Revenue Source, in <strong>the</strong> Operating Appendices located on <strong>the</strong> <strong>Office</strong> <strong>of</strong> <strong>the</strong> <strong>Chief</strong> <strong>Financial</strong> <strong>Office</strong>r’s website<br />
FY 2010 Proposed <strong>Budget</strong> and <strong>Financial</strong> Plan<br />
E-172
FY 2010 Proposed Full-Time Equivalents, by Revenue Type<br />
Table HT0-2 contains <strong>the</strong> proposed FY 2010 FTE level compared to <strong>the</strong> FY 2009 approved FTE level by revenue<br />
type. It also provides FY 2007 and FY 2008 actual data.<br />
Table HT0-2<br />
Change<br />
Actual Actual Approved Proposed from Percent<br />
Appropriated Fund FY 2007 FY 2008 FY 2009 FY 2010 FY 2009 Change<br />
General Fund<br />
Local Funds 0.0 0.0 74.1 68.6 -5.5 -7.4<br />
Special Purpose Revenue Funds 0.0 0.0 3.0 4.0 1.0 33.3<br />
Total for General Fund 0.0 0.0 77.1 72.6 -4.5 -5.8<br />
Federal Resources<br />
Federal Grant Funds 0.0 0.0 19.0 10.0 -9.0 -47.4<br />
Federal Medicaid Payments 0.0 0.0 70.3 72.8 2.5 3.5<br />
Total for Federal Resources 0.0 0.0 89.3 82.8 -6.5 -7.3<br />
Total Proposed FTEs 0.0 0.0 166.3 155.3 -11.0 -6.6<br />
Department <strong>of</strong> Health Care Finance<br />
E-173
FY 2010 Proposed Operating <strong>Budget</strong>, by Comptroller Source Group<br />
Table HT0-3 contains <strong>the</strong> proposed FY 2010 budget at <strong>the</strong> Comptroller Source Group (object class) level compared<br />
to <strong>the</strong> FY 2009 approved budget. It also provides FY 2007 and FY 2008 actual expenditures.<br />
Table HT0-3<br />
(dollars in thousands)<br />
Actual Actual Approved Proposed<br />
Change<br />
from Percent<br />
Comptroller Source Group FY 2007 FY 2008 FY 2009 FY 2010 FY 2009 Change*<br />
11 Regular Pay - Cont Full Time 0 0 11,955 12,545 589 4.9<br />
12 Regular Pay - O<strong>the</strong>r 0 0 456 0 -456 -100.0<br />
14 Fringe Benefits - Curr Personnel 0 0 2,081 2,274 193 9.3<br />
Subtotal Personal Services (PS) 0 0 14,492 14,819 327 2.3<br />
20 Supplies and Materials 0 0 186 151 -35 -18.8<br />
30 Energy, Comm. and Bldg Rentals 0 0 0 192 192 N/A<br />
31 Telephone, Telegraph, Telegram, Etc 0 0 3 0 -3 -100.0<br />
32 Rentals - Land and Structures 0 0 1,834 1,060 -774 -42.2<br />
34 Security Services 0 0 324 204 -120 -36.9<br />
35 Occupancy Fixed Costs 0 0 0 200 200 N/A<br />
40 O<strong>the</strong>r Services and Charges 0 0 254 257 3 1.2<br />
41 Contractual Services - O<strong>the</strong>r 0 0 41,892 36,075 -5,817 -13.9<br />
50 Subsidies and Transfers 0 0 1,774,615 2,022,175 247,561 14.0<br />
70 Equipment & Equipment Rental 0 0 535 81 -454 -84.8<br />
Subtotal Nonpersonal Services (NPS) 0 0 1,819,643 2,060,395 240,753 13.2<br />
Gross Funds 0 0 1,834,134 2,075,214 241,080 13.1<br />
*Percent Change is based on whole dollars.<br />
FY 2010 Proposed <strong>Budget</strong> and <strong>Financial</strong> Plan<br />
E-174
Program Description<br />
The Department <strong>of</strong> Health Care Finance operates<br />
through <strong>the</strong> following 7 programs:<br />
Health Care Delivery Management Administration -<br />
is responsible for chronic and long-term care, and<br />
home and community-based services to adults enrolled<br />
in <strong>the</strong> Medicaid program and 1115 Waiver for<br />
Childless Adults ages 50-64; <strong>the</strong> Managed Care<br />
Contracts; <strong>the</strong> Ombudsman and <strong>the</strong> Health Care Bill<br />
<strong>of</strong> Rights <strong>Office</strong>; and oversight <strong>of</strong> preventive and acute<br />
care, including <strong>the</strong> SCHIP program, Health Check<br />
(formerly Early and Periodic, Screening, Diagnosis<br />
and Treatment (EPSDT)) and <strong>the</strong> Immigrant<br />
Children’s program, as well as all institutional and<br />
ambulatory services.<br />
This program contains <strong>the</strong> following 6 activities:<br />
■ <strong>Office</strong> <strong>of</strong> Chronic and Long Term Care – ensures<br />
that beneficiaries who are receiving long-term care<br />
or home and community-based services are provided<br />
with adequate and appropriate services <strong>of</strong><br />
<strong>the</strong> highest quality;<br />
■ <strong>Office</strong> <strong>of</strong> Managed Care Management – directs<br />
<strong>the</strong> Managed Care Contracts, including but not<br />
limited to planning, managing and evaluating <strong>the</strong><br />
District’s Managed Care Program;<br />
■ <strong>Office</strong> <strong>of</strong> Preventive and Acute Care – oversees<br />
<strong>the</strong> State Children's Health Insurance Program<br />
(SCHIP), Waiver for Childless Adults ages 50-64,<br />
Health Check (formerly EPSDT), Immigrant<br />
Children's program, and <strong>the</strong> Medicaid program’s<br />
acute and preventive care services;<br />
■ <strong>Office</strong> <strong>of</strong> <strong>the</strong> Ombudsman and Health Care Bill<br />
<strong>of</strong> Rights – counsels and assists uninsured<br />
District residents and individuals insured by<br />
health benefits plans in <strong>the</strong> District regarding<br />
matters pertaining to <strong>the</strong>ir health care coverage;<br />
■ Healthy DC Management – oversees <strong>the</strong> newly<br />
established health insurance program which provides<br />
health insurance coverage to previously<br />
uninsured District residents living between 200<br />
and 400 percent <strong>of</strong> <strong>the</strong> Federal poverty level; and<br />
■ Health Care Delivery Management Support<br />
Services – provides administrative support functions<br />
to <strong>the</strong> Health Care Delivery Management<br />
program.<br />
Health Care Policy and Planning Administration -<br />
provides for maintenance <strong>of</strong> <strong>the</strong> Medicaid and<br />
SCHIP state plans, which govern eligibility, scope <strong>of</strong><br />
benefits, and reimbursement policies for <strong>the</strong> District's<br />
Medicaid and SCHIP Programs; develops policy for<br />
<strong>the</strong> administration <strong>of</strong> <strong>the</strong> Alliance and o<strong>the</strong>r health<br />
care programs for publicly funded enrollees that are<br />
administered or monitored by DHCF based on<br />
sound analysis <strong>of</strong> local and national healthcare and<br />
reimbursement policies and strategies; and ensures<br />
coordination and consistency among healthcare and<br />
reimbursement policies developed by <strong>the</strong> various<br />
Administrations within DHCF.<br />
This program contains <strong>the</strong> following 5 activities:<br />
■ <strong>Office</strong> <strong>of</strong> Policy Management – maintains <strong>the</strong><br />
Medicaid State Plan, which governs eligibility,<br />
scope <strong>of</strong> benefits, and reimbursement policies <strong>of</strong><br />
<strong>the</strong> Medicaid and SCHIP program, and manages<br />
Federal waivers; develops policy for <strong>the</strong> administration<br />
<strong>of</strong> Medical assistance programs administered<br />
or monitored by DHCF; and ensures coordination<br />
and consistency among health care and<br />
reimbursement policies developed by various<br />
Administrations within DHCF;<br />
■ <strong>Office</strong> <strong>of</strong> Public Provider Liaison Management –<br />
maintains positive ongoing coordination and<br />
continuity with all public provider agencies <strong>of</strong> <strong>the</strong><br />
District <strong>of</strong> Columbia Government to enhance<br />
each agency’s understanding <strong>of</strong> Medicaid reimbursement<br />
policies; ensures accountability within<br />
DHCF for policy that directly impacts o<strong>the</strong>r<br />
District agencies; identifies opportunities to<br />
improve <strong>the</strong> reimbursement procedures <strong>of</strong> each<br />
agency; and works closely with <strong>the</strong>se agencies to<br />
review Federal policy to ensure that Federal reimbursement<br />
is being maximized and compliance<br />
assured through claims processing and program<br />
development;<br />
■ <strong>Office</strong> <strong>of</strong> Data Analysis – ga<strong>the</strong>rs information,<br />
analyzes data, and evaluates all activities relative to<br />
multiple District-wide components <strong>of</strong> Medicaid,<br />
SCHIP, <strong>the</strong> Alliance, and future locally funded<br />
healthcare delivery systems, including data collection<br />
systems;<br />
■ <strong>Office</strong> <strong>of</strong> Member Management – monitors eligibility<br />
and member management policies for <strong>the</strong><br />
District’s publicly-funded health care enrollees to<br />
ensure eligibility and that member management<br />
Department <strong>of</strong> Health Care Finance<br />
E-175
equirements are correctly established and followed,<br />
as well as serving as a liaison with <strong>the</strong><br />
Income Maintenance Administration (IMA) to<br />
ensure collaboration and coordination in eligibility<br />
and member management policy implementation;<br />
and<br />
■ Health Care Policy and Planning Support<br />
Services – provides administrative support functions<br />
to <strong>the</strong> Health Care Policy and Planning program.<br />
Health Care Accountability Administration - develops,<br />
in collaboration with <strong>the</strong> Federal and District<br />
governments and <strong>the</strong> healthcare provider community,<br />
a health care accountability program that ensures <strong>the</strong><br />
delivery <strong>of</strong> quality and clinically appropriate health<br />
care.<br />
This program contains <strong>the</strong> following 6 activities:<br />
■ <strong>Office</strong> <strong>of</strong> Quality Management – ensures that<br />
quality and performance improvement principles<br />
and practices pervade all <strong>the</strong> components and<br />
activities that impact on <strong>the</strong> delivery and outcomes<br />
<strong>of</strong> healthcare services to patients served by<br />
<strong>the</strong> District’s Medicaid, SCHIP and Alliance programs;<br />
■ <strong>Office</strong> <strong>of</strong> Utilization Management – monitors<br />
utilization, including appropriateness <strong>of</strong> medical<br />
services, to ensure that <strong>the</strong> highest quality medical<br />
care is provided to publicly funded beneficiaries;<br />
and identifies <strong>the</strong> utilization <strong>of</strong> third-party<br />
resources available for <strong>the</strong> cost <strong>of</strong> medical care rendered<br />
publicly funded beneficiaries to ensure that<br />
<strong>the</strong> publicly funded programs are <strong>the</strong> payers <strong>of</strong> last<br />
resort;<br />
■ <strong>Office</strong> <strong>of</strong> Program Integrity – monitors <strong>the</strong> prevention,<br />
detection and elimination <strong>of</strong> fraud, abuse<br />
and waste by persons who provide and receive services<br />
financed by DHCF;<br />
■ <strong>Office</strong> <strong>of</strong> Grievance and Appeals – reviews beneficiary<br />
grievance and appeals and risk management<br />
concerns;<br />
■ <strong>Office</strong> <strong>of</strong> Pharmacy Management – administers<br />
<strong>the</strong> pharmaceutical and durable medical equipment<br />
programs under <strong>the</strong> D.C. Medicaid program<br />
and provides consultation and guidance in<br />
all pharmaceutical and durable medical equipment<br />
services; and<br />
FY 2010 Proposed <strong>Budget</strong> and <strong>Financial</strong> Plan<br />
E-176<br />
■ Health Care Accountability Support Services –<br />
provides administrative support functions to <strong>the</strong><br />
Health Care Accountability program.<br />
Health Care Finance - provides provider payments<br />
for <strong>the</strong> following provider types: Medicaid provider<br />
payments, public provider payments, and Health<br />
Care Alliance provider payments.<br />
Health Care Operations Administration - administers<br />
programs that pertain to <strong>the</strong> payment <strong>of</strong> claims;<br />
manages fiscal agent and administrative contracts;<br />
manages <strong>the</strong> systems; and maintains provider enrollment<br />
and requirements.<br />
This program contains <strong>the</strong> following 5 activities:<br />
■ <strong>Office</strong> <strong>of</strong> Medicaid Information Systems – oversees<br />
<strong>the</strong> fiscal agent contract, including <strong>the</strong><br />
Medicaid Management Information System and<br />
Drug Rebate program, as well as handling<br />
provider relations and education;<br />
■ <strong>Office</strong> <strong>of</strong> Technical Systems Management – provides<br />
technical expertise regarding Medicaid and<br />
o<strong>the</strong>r publicly-funded health care program system<br />
development, administration and management;<br />
■ <strong>Office</strong> <strong>of</strong> Systems Operations – manages payment<br />
<strong>of</strong> claims, provider enrollment and recruitment,<br />
and <strong>the</strong> pricing/reference files;<br />
■ <strong>Office</strong> <strong>of</strong> Administrative Contract Management<br />
– provides contract management <strong>of</strong> <strong>the</strong> Administrative<br />
Services Organization contract, <strong>the</strong> Non-<br />
Emergency Transportation contract, as well as<br />
additional administrative contracts; and<br />
■ Health Care Operations Support Services – provides<br />
administrative support functions to <strong>the</strong><br />
Health Care Operations program.<br />
<strong>Agency</strong> Management - provides for administrative<br />
support and <strong>the</strong> required tools to achieve operational<br />
and programmatic results. This program is standard<br />
for all agencies using performance-based budgeting.<br />
<strong>Agency</strong> <strong>Financial</strong> Operations - provides comprehensive<br />
and efficient financial management services to,<br />
and on behalf <strong>of</strong>, District agencies so that <strong>the</strong> financial<br />
integrity <strong>of</strong> <strong>the</strong> District <strong>of</strong> Columbia is maintained.<br />
This program is standard for all agencies using<br />
performance-based budgeting.
Program Structure Change<br />
The agency’s FY 2009 five-program structure is being<br />
realigned into six programs in FY 2010 as DHCF is<br />
adding a new program, Health Care Operations. The<br />
existing programs are being identified with new titles<br />
with <strong>the</strong> exception <strong>of</strong> <strong>the</strong> Health Care Finance pro-<br />
FY 2010 Proposed Operating <strong>Budget</strong> and FTEs, by Program and Activity<br />
Table HT0-4 contains <strong>the</strong> proposed FY 2010 budget by program and activity compared to <strong>the</strong> FY 2009 approved budget.<br />
It also provides FY 2008 actual data.<br />
Table HT0-4<br />
(dollars in thousands)<br />
gram. The service codes in <strong>the</strong> Medicaid Provider<br />
Payment activity <strong>of</strong> <strong>the</strong> Health Care Finance program<br />
are being changed to reflect a more intuitive programmatic<br />
reporting <strong>of</strong> financial data in FY 2010.<br />
Dollars in Thousands Full-Time Equivalents<br />
Change Change<br />
Actual Approved Proposed from Actual Approved Proposed from<br />
Program/Activity<br />
(1000) <strong>Agency</strong> Management Program<br />
FY 2008 FY 2009 FY 2010 FY 2009 FY 2008 FY 2009 FY 2010 FY 2009<br />
(1010) Personnel 0 142 0 -142 0.0 1.0 0.0 -1.0<br />
(1020) Contracting & Procurement 0 2,071 266 -1,805 0.0 2.0 3.3 1.3<br />
(1030) Property Management 0 2,217 1,475 -742 0.0 1.0 0.0 -1.0<br />
(1040) Information Technology 0 320 232 -88 0.0 2.0 1.0 -1.0<br />
(1055) Risk Management 0 99 181 82 0.0 1.0 0.0 -1.0<br />
(1060) Legal 0 709 612 -97 0.0 3.0 1.0 -2.0<br />
(1070) Fleet Management 0 7 60 53 0.0 0.0 1.0 1.0<br />
(1080) Communications 0 99 0 -99 0.0 1.0 0.0 -1.0<br />
(1085) Customer Service 0 0 60 60 0.0 0.0 0.0 0.0<br />
(1087) Language Access 0 30 59 29 0.0 0.0 0.0 0.0<br />
(1090) Performance Management 0 1,493 2,939 1,445 0.0 12.0 18.0 6.0<br />
(1099) Alliance Program - AMP 0 58 0 -58 0.0 1.0 0.0 -1.0<br />
Subtotal (1000) <strong>Agency</strong> Management Program<br />
(100F) <strong>Agency</strong> <strong>Financial</strong> Operations<br />
0 7,246 5,884 -1,361 0.0 24.0 24.3 0.3<br />
(110F) <strong>Budget</strong>ing Operations 0 179 249 70 0.0 2.0 2.5 0.5<br />
(120F) Accounting Operations 0 1,110 1,005 -105 0.0 11.0 9.0 -2.0<br />
(140F) <strong>Agency</strong> Fiscal <strong>Office</strong>r 0 170 268 97 0.0 1.0 2.0 1.0<br />
Subtotal (100F) <strong>Agency</strong> <strong>Financial</strong> Operations<br />
(Continued on <strong>the</strong> next page)<br />
0 1,459 1,521 62 0.0 14.0 13.5 -0.5<br />
Department <strong>of</strong> Health Care Finance<br />
E-177
Table HT0-4 (Continued)<br />
(dollars in thousands)<br />
Dollars in Thousands Full-Time Equivalents<br />
Change Change<br />
Actual Approved Proposed from Actual Approved Proposed from<br />
Program/Activity<br />
(2000) Healthcare Delivery Management<br />
FY 2008 FY 2009 FY 2010 FY 2009 FY 2008 FY 2009 FY 2010 FY 2009<br />
(2001) Chronic & Long Term Care 0 5,263 2,341 -2,922 0.0 21.5 17.0 -4.5<br />
(2002) Managed Care Mgt 0 5,893 7,753 1,860 0.0 9.5 7.0 -2.5<br />
(2003) Preventive and Acute Care 0 4,894 1,860 -3,035 0.0 11.0 8.0 -3.0<br />
(2004) Healthcare Alliance 0 2,113 0 -2,113 0.0 3.3 0.0 -3.3<br />
(2005) Health Care Bill <strong>of</strong> Rights Ombudsman 0 0 525 525 0.0 0.0 5.0 5.0<br />
(2010) Health Care Delivery Mgt Support Svcs 0 0 1,666 1,666 0.0 0.0 2.8 2.8<br />
Subtotal (2000) Healthcare Delivery Management<br />
(3000) Healthcare Policy/LEG<br />
0 18,164 14,145 -4,019 0.0 45.3 39.8 -5.6<br />
(3001) Policy Unit Management 0 4,605 1,384 -3,221 0.0 13.0 9.0 -4.0<br />
(3002) Public Provider Liaison Mgmt 0 518 573 55 0.0 7.0 6.0 -1.0<br />
(3003) Data Analysis 0 0 294 294 0.0 0.0 3.0 3.0<br />
(3004) Member Management 0 0 252 252 0.0 0.0 3.0 3.0<br />
(3010) Health Care Policy & Planning Support 0 0 1,441 1,441 0.0 0.0 3.0 3.0<br />
Subtotal (3000) Healthcare Policy And Planning<br />
(4000) Healthcare Accountability<br />
0 5,123 3,945 -1,178 0.0 20.0 24.0 4.0<br />
(4001) Program Operations 0 13,475 0 -13,475 0.0 22.0 1.0 -21.0<br />
(4002) Quality Management 0 13,827 5,612 -8,215 0.0 41.0 7.0 -34.0<br />
(4003) Utilization Management 0 0 1,083 1,083 0.0 0.0 12.0 12.0<br />
(4004) Program Integrity 0 0 1,003 1,003 0.0 0.0 12.0 12.0<br />
(4006) Pharmacy Management 0 0 185 185 0.0 0.0 1.5 1.5<br />
(4010) Health Care Accountability Support Svcs 0 0 1,529 1,529 0.0 0.0 3.0 3.0<br />
Subtotal (4000) Healthcare Accountability<br />
(4500) <strong>Office</strong> Of Children & Families Services<br />
0 27,303 9,411 -17,892 0.0 63.0 36.5 -26.5<br />
(4520) SCHIP Administration 0 0 0 0 0.0 0.0 0.0 0.0<br />
Subtotal (4500) <strong>Office</strong> <strong>of</strong> Children & Families Services<br />
(5000) Health Care Finance<br />
0 0 0 0 0.0 0.0 0.0 0.0<br />
(5001) Medicaid Provider Payment 0 1,550,634 1,775,932 225,298 0.0 0.0 0.0 0.0<br />
(5002) Medicaid Public Provider Payments 0 108,955 143,993 35,038 0.0 0.0 0.0 0.0<br />
(5003) Alliance Provider Payments 0 115,251 102,251 -13,001 0.0 0.0 0.0 0.0<br />
Subtotal (5000) Health Care Finance 0 1,774,840 2,022,175 247,335 0.0 0.0 0.0 0.0<br />
(Continued on <strong>the</strong> next page)<br />
FY 2010 Proposed <strong>Budget</strong> and <strong>Financial</strong> Plan<br />
E-178
Table HT0-4 (Continued)<br />
(dollars in thousands)<br />
Dollars in Thousands Full-Time Equivalents<br />
Change Change<br />
Actual Approved Proposed from Actual Approved Proposed from<br />
Program/Activity<br />
(6000) Health Care Operations<br />
FY 2008 FY 2009 FY 2010 FY 2009 FY 2008 FY 2009 FY 2010 FY 2009<br />
(6001) Medicaid Information Systems 0 0 15,129 15,129 0.0 0.0 5.0 5.0<br />
(6002) Technical Systems Management 0 0 544 544 0.0 0.0 0.0 0.0<br />
(6003) Systems Operations 0 0 846 846 0.0 0.0 6.0 6.0<br />
(6004) Administrative Contract Management 0 0 109 109 0.0 0.0 1.0 1.0<br />
(6010) Health Care Operations Support 0 0 1,505 1,505 0.0 0.0 5.3 5.3<br />
Subtotal (6000) Health Care Operations 0 0 18,133 18,133 0.0 0.0 17.3 17.3<br />
Total Proposed Operating <strong>Budget</strong> 0 1,834,134 2,075,214 241,080 0.0 166.3 155.3 -11.0<br />
(Change is calculated by whole numbers and numbers may not add up due to rounding)<br />
Note: For more detailed information regarding <strong>the</strong> proposed funding for <strong>the</strong> activities within this agency’s programs, please see<br />
Schedule 30-PBB Program Summary by Activity in <strong>the</strong> FY 2010 Operating Appendices located on <strong>the</strong> <strong>Office</strong> <strong>of</strong> <strong>the</strong> <strong>Chief</strong><br />
<strong>Financial</strong> <strong>Office</strong>r’s website.<br />
Major Baseline Adjustments, Cost Savings<br />
and Policy Initiatives<br />
Initial Adjustments: The following adjustments were<br />
made in Local funds: an increase <strong>of</strong> $510,000 and<br />
0.3 FTEs, which accounts for salary step and o<strong>the</strong>r<br />
personal services adjustments impacting multiple programs<br />
within <strong>the</strong> agency, and an increase <strong>of</strong><br />
$5,219,000 in <strong>the</strong> Health Care Finance Program. In<br />
<strong>the</strong> Dedicated Taxes funds, an increase <strong>of</strong><br />
$12,315,000 is for <strong>the</strong> Nursing Homes Quality <strong>of</strong><br />
Care Fund and <strong>the</strong> Healthy D.C. Fund. In Federal<br />
Grant funds, a reduction <strong>of</strong> $555,000 and 9 FTEs<br />
accounts for salary step and o<strong>the</strong>r across multiple programs<br />
within <strong>the</strong> agency; and a decrease <strong>of</strong><br />
$4,966,000 in intra-agency personal services adjustments<br />
impacting multiple programs within <strong>the</strong><br />
agency. An increase <strong>of</strong> $1,197,000 and 8.7 FTEs in<br />
<strong>the</strong> Federal Medicaid Payments accounts for salary<br />
step and o<strong>the</strong>r personal services adjustments in multiple<br />
programs within <strong>the</strong> agency; and an increase <strong>of</strong><br />
$93,343,000 is due to projected Federal match for<br />
Medicaid related services in <strong>the</strong> Health Care Finance<br />
program. In Intra-District Funds, an increase <strong>of</strong><br />
$15,185,000 is due to MOUs with <strong>the</strong> Department<br />
on Disability Services and Department <strong>of</strong> Mental<br />
Health.<br />
Baseline Adjustments: The following baseline adjustment<br />
was made in Local funds: an increase <strong>of</strong><br />
$9,886,000 to fund projected increases in MCO payments<br />
for <strong>the</strong> D.C. Healthcare Alliance membership<br />
enrollment.<br />
Transfers In/Out: In FY 2010, DHCF will continue<br />
to work with public provider agencies to maximize<br />
Federal funds and to provide services for individuals<br />
in <strong>the</strong> most appropriate setting. Beginning in FY<br />
2010, <strong>the</strong> local portion <strong>of</strong> <strong>the</strong> Federally matched<br />
Medicaid Home and Community-Based Waiver,<br />
$19,967,585, will transfer from <strong>the</strong> Department on<br />
Disability Services to DHCF. This transition ensures<br />
that all Local funds and Federal funds used to support<br />
<strong>the</strong> waiver program reside in <strong>the</strong> same department for<br />
improved oversight and tracking <strong>of</strong> expenditures.<br />
The proposed budget also includes additional<br />
Local funds and Medicaid Federal funds under a new<br />
payment rate structure for Psychiatric Residential<br />
Treatment Facilities. An addition <strong>of</strong> $715,946 in<br />
Local funds and $1,670,540 in Federal funds is <strong>of</strong>fset<br />
by reductions in Local funds at CFSA ($793,875)<br />
and DYRS ($993,713). Federal funds <strong>of</strong> $491,589<br />
are also added to match Local funds (remaining at<br />
CFSA) for medical screenings to be covered under<br />
Medicaid personal services contracts, ra<strong>the</strong>r than <strong>the</strong><br />
Department <strong>of</strong> Health Care Finance<br />
E-179
current hospital-based contract funded with 100 percent<br />
Local dollars.<br />
A transfer <strong>of</strong> $600,000 in Local funds into<br />
DHCF’s budget is <strong>of</strong>fset by a $200,000 decrease in<br />
funding at <strong>the</strong> Department <strong>of</strong> Mental Health to help<br />
support <strong>the</strong> transition <strong>of</strong> 10 individuals from Saint<br />
Elizabeths Hospital to <strong>the</strong> Medicaid Home and<br />
Community-Based Waiver. Federal Medicaid matching<br />
funds <strong>of</strong> $1,400,000 will support this transition.<br />
Cost Savings: In FY 2010, <strong>the</strong> department will ensure<br />
<strong>the</strong> District maximizes its opportunities for sustainable<br />
federal funding. First, DHCF will assist eligible<br />
Medicaid beneficiaries to apply for <strong>the</strong> Medicare program.<br />
Second, DHCF will secure SCHIP funding<br />
for legal immigrant children and pregnant women<br />
currently in <strong>the</strong> waiting period for eligibility as<br />
allowed by SCHIP reauthorization. Third, <strong>the</strong> costs<br />
<strong>of</strong> prenatal care services for certain immigrants will be<br />
transitioned from <strong>the</strong> locally-funded Alliance program<br />
to Medicaid. These three changes will generate<br />
more than $1.6 million in Local fund savings.<br />
Sustainable federal resources will be maximized to<br />
ensure all eligible and potentially eligible District residents<br />
are covered by Medicaid and o<strong>the</strong>r federally<br />
funded programs. This includes leveraging<br />
Disproportionate Share Hospital (DSH) funding to<br />
expand <strong>the</strong> District’s Medicaid waiver for childless<br />
adults. Approximately $28 million in current and<br />
new DSH funds will be used to transition current<br />
Alliance beneficiaries to Medicaid, saving <strong>the</strong> District<br />
$14,818,724 in Local health insurance costs.<br />
Several initiatives will preserve <strong>the</strong> Alliance program’s<br />
long-term fiscal sustainability. Limiting <strong>the</strong><br />
Alliance program to District residents without o<strong>the</strong>r<br />
sources <strong>of</strong> health insurance will save $2,026,564. In<br />
addition, DHCF will generate $13,562,965 in savings<br />
by enforcing residency requirements to ensure<br />
<strong>the</strong> Alliance program is only available to District residents.<br />
Finally, aligning <strong>the</strong> Alliance budget with new<br />
MCO contract rates will generate fur<strong>the</strong>r savings <strong>of</strong><br />
$2,842,853.<br />
The department has also identified key programmatic<br />
areas that are experiencing significant growth<br />
and will launch initiatives to increase utilization management<br />
and program integrity in <strong>the</strong>se areas.<br />
Implementing closer review <strong>of</strong> personal care aide service<br />
utilization will save $1,287,400. DHCF will also<br />
improve management <strong>of</strong> its prescription drug benefit<br />
FY 2010 Proposed <strong>Budget</strong> and <strong>Financial</strong> Plan<br />
E-180<br />
and align its pharmaceutical payment policy with<br />
national trends, saving $1,709,600 through <strong>the</strong>se two<br />
efforts. Greater focus on recoupment <strong>of</strong> funds<br />
improperly paid to Medicaid providers will generate<br />
$4,833,588 in Local savings through both changing<br />
<strong>the</strong> methodology for recovering payments and<br />
improving DHCF’s utilization management function.<br />
As DHCF finalizes its personnel restructuring,<br />
greater internal capacity will allow <strong>the</strong> department to<br />
take on additional analytic, operational and monitoring<br />
tasks, enabling significant savings by reducing<br />
reliance on external contracts. In FY 2010, DHCF<br />
will save $2,348,291 in Local funds by reducing or<br />
eliminating six current contracts. On a smaller scale,<br />
DHCF’s travel, supplies and equipment budgets are<br />
reduced to align with projected utilization, saving<br />
$52,292. In fixed costs, DHCF’s assessment for rent<br />
is adjusted for a reduction <strong>of</strong> $196,000 in <strong>the</strong> <strong>Agency</strong><br />
Management program (AMP) to account for <strong>the</strong><br />
transfer <strong>of</strong> two properties to <strong>the</strong> Department <strong>of</strong><br />
Health. Fur<strong>the</strong>rmore, electricity, telecom, and occupancy,<br />
as well as DHCF’s procurement assessment,<br />
are also adjusted to align with revised estimates for<br />
savings <strong>of</strong> $14,785.<br />
Personnel realignment will result in <strong>the</strong> elimination<br />
<strong>of</strong> seven administrative and non-essential programmatic<br />
positions that are duplicative across<br />
DHCF or can be eliminated with technology and<br />
process improvements. In addition, five vacant positions<br />
have been determined unnecessary, as responsibilities<br />
can be shifted to current staff. This reduction<br />
in FTEs will save $458,033 in Local funds and<br />
$524,984 in Federal funds.<br />
Protected Programs: Despite a challenging economic<br />
climate, this budget protects residents’ access to<br />
health care services by maintaining Medicaid eligibility<br />
levels, supporting <strong>the</strong> Alliance program for residents<br />
without access to o<strong>the</strong>r insurance options, and<br />
preserving beneficiaries’ access to care. The DHCF<br />
budget fully funds <strong>the</strong> anticipated enrollment increases<br />
in <strong>the</strong> Medicaid and Alliance programs as a result<br />
<strong>of</strong> <strong>the</strong> deteriorating national economy. These enrollment<br />
assumptions are modeled in part using national<br />
studies that project <strong>the</strong> impact <strong>of</strong> unemployment<br />
increases on individuals’ health care coverage options.<br />
In addition, <strong>the</strong>re are no proposals to increase cost<br />
sharing for beneficiaries. The Healthy DC initiative
to expand coverage for uninsured residents with<br />
incomes too high to qualify for Medicaid or <strong>the</strong><br />
Alliance remains funded. This budget also preserves<br />
<strong>the</strong> Nursing Home Quality <strong>of</strong> Care Fund to continue<br />
funding projects that will improve quality and<br />
maintain appropriate reimbursement rates. Finally,<br />
this budget maintains access to care by retaining<br />
planned rate increases for physicians, residential treatment<br />
facilities, and o<strong>the</strong>r providers.<br />
Policy Initiatives: This budget proposes an enhancement<br />
<strong>of</strong> $46,826,087 for <strong>the</strong> Medicaid program,<br />
matched by $109,260,870 in Federal funds. This<br />
enhancement ensures <strong>the</strong> Medicaid program is fully<br />
funded to meet enrollment growth, planned rate<br />
increases and medical cost inflation. This enhancement<br />
is funded with savings generated from increased<br />
operational and programmatic efficiencies within<br />
DHCF. An additional $11,600,506 in Local funds<br />
will support anticipated recession-driven Alliance<br />
growth, balanced by savings initiatives to enhance <strong>the</strong><br />
integrity <strong>of</strong> <strong>the</strong> enrollment process and preserve <strong>the</strong><br />
program’s long-term viability.<br />
Stimulus: The District will receive a projected<br />
$147,680,865 in additional Federal Medicaid funds<br />
under a revised Federal Medical Assistance Percentage<br />
(FMAP) generated by <strong>the</strong> American Recovery and<br />
Reinvestment Act <strong>of</strong> 2009. The District will also<br />
receive an estimated $1,478,873 in additional<br />
Disproportionate Share Hospital (DSH) funds in FY<br />
2010 as a result <strong>of</strong> <strong>the</strong> Recovery Act. These funds,<br />
matched by $633,588 in enhanced Local funds and<br />
combined with additional DSH funds, will assist in<br />
transitioning Alliance members to Medicaid.<br />
Through Stimulus support for health information<br />
technology, savings <strong>of</strong> $2,700,000 will be achieved<br />
through accelerated adoption <strong>of</strong> health IT by<br />
providers, resulting in reductions in duplication <strong>of</strong><br />
services, medical errors and inappropriate utilization.<br />
These additional Federal funds to DHCF will be partially<br />
<strong>of</strong>fset by a comparable reduction in Local<br />
Funds.<br />
Intra-<strong>Agency</strong> Changes: The proposed budget ensures<br />
that <strong>the</strong> District’s Medicaid DSH funds are not mingled<br />
with <strong>the</strong> D.C. Healthcare Alliance funds. To this<br />
end, $5,000,000 <strong>of</strong> DSH funds is reallocated from<br />
<strong>the</strong> Healthcare Alliance to Medicaid. This budget<br />
also provides an additional $143,000 to DHCF’s<br />
Health Care Policy and Planning Administration to<br />
support improved federal reimbursement procedures<br />
District-wide. This action is achieved by redirection <strong>of</strong><br />
funds through adjustment <strong>of</strong> fixed costs in <strong>the</strong> AMP<br />
for a reduction <strong>of</strong> $143,000 in security services.<br />
Gap-Closing Initiatives: In FY 2010, <strong>the</strong><br />
Department <strong>of</strong> Health Care Finance will save $3 million<br />
by reallocating unobligated Healthy DC Funds<br />
to <strong>the</strong> Local funds, to support a portion <strong>of</strong> <strong>the</strong> cost <strong>of</strong><br />
projected Alliance enrollment growth. This transfer<br />
ensures <strong>the</strong> Alliance program is able to serve its projected<br />
FY 2010 enrollment levels and that an<br />
enhancement <strong>of</strong> $11,600,506 to support recessiondriven<br />
enrollment growth in <strong>the</strong> program remains<br />
intact. This transfer will not impact <strong>the</strong> timing or<br />
scope <strong>of</strong> <strong>the</strong> planned Healthy DC coverage expansion<br />
in FY 2010.<br />
DHCF will postpone until FY 2011 implementation<br />
<strong>of</strong> proposed incentive payments for ICF/MR<br />
providers, resulting in savings <strong>of</strong> $1,035,500 in Local<br />
Funds and $3,964,500 in Federal Medicaid payments.<br />
A new payment methodology for ICF/MR<br />
providers will be implemented, pending federal<br />
approval.<br />
Department <strong>of</strong> Health Care Finance<br />
E-181
FY 2009 Approved <strong>Budget</strong> to FY 2010 Proposed <strong>Budget</strong>, by Revenue Type<br />
Table HT0-5 itemizes <strong>the</strong> changes by revenue type between <strong>the</strong> FY 2009 approved budget and <strong>the</strong> FY 2010 proposed<br />
budget. The four categories <strong>of</strong> changes reflected in this table are: (1) changes to <strong>the</strong> baseline budget (includes<br />
agency request), (2) changes representing cost savings or efficiencies, (3) changes related to policy initiatives, and (4)<br />
changes to specifically address <strong>the</strong> projected revenue shortfall.<br />
Table HT0-5<br />
(dollars in thousands)<br />
Program BUDGET FTE<br />
LOCAL FUND: FY 2009 Approved <strong>Budget</strong> and FTE 588,308 74.1<br />
Initial and Baseline Adjustments<br />
Reduction for nonrecurring costs - Reduction due to <strong>the</strong> upgrade <strong>of</strong> Health Care Operations -100 0.0<br />
Medicaid data system to accommodate Alliance enrollees<br />
Net effect <strong>of</strong> fixed cost adjustments - Funding adjustments for OPM estimates <strong>Agency</strong> Management Program -296 0.0<br />
Net effect <strong>of</strong> salary and benefits changes - Salary step and o<strong>the</strong>r personal Multiple Programs 510 0.3<br />
services funding adjustments<br />
Intra-<strong>Agency</strong> Changes - Funding is associated with FY 2009 one-time Health Care Finance 5,219 0.0<br />
rescission items<br />
Baseline Adjustments: Technical Adjustment - Additional funding for MCO Health Care Finance 9,886 0.0<br />
payments for <strong>the</strong> DC Healthcare Alliance membership enrollment<br />
Baseline Adjustments: Net effect <strong>of</strong> fixed cost adjustments - Reduction in Health Care Finance -43 0.0<br />
subsidies and transfers to <strong>of</strong>fset additional fixed costs estimate<br />
Baseline Adjustments: Net effect <strong>of</strong> fixed cost adjustments - Adjustment for <strong>Agency</strong> Management Program 43 0.0<br />
additional fixed costs estimate<br />
Policy Initiatives and Cost Savings<br />
Enhance - Match additional Federal Recovery Act funds for<br />
temporary increase in Disproportionate Share Hospital (DSH) Payments<br />
Health Care Finance 634 0.0<br />
Cost Increase - Fund projected Medicaid enrollment growth, utilization and rate<br />
increases (matched by Federal funds)<br />
Health Care Finance 46,826 0.0<br />
Cost Increase - Partially fund projected Alliance enrollment growth Health Care Finance 11,601 0.0<br />
Cost Decrease - Align Alliance budget with new MCO contract Health Care Finance -2,843 0.0<br />
Cost Decrease - Ensure Alliance program limited to District residents by<br />
enforcing residency requirements and program controls<br />
Health Care Finance -13,563 0.0<br />
Cost Decrease - Limit Alliance coverage to District residents not eligible for<br />
o<strong>the</strong>r health insurance (Medicare, private insurance)<br />
Health Care Finance -2,027 0.0<br />
Optimize - Reallocate $25 million in DSH funds to transition coverage <strong>of</strong> Alliance<br />
members to Medicaid<br />
Health Care Finance -13,694 0.0<br />
Optimize - Use $3 million in additional DSH funds, in part due to Recovery Act<br />
funds, to transition coverage <strong>of</strong> Alliance members to Medicaid<br />
Health Care Finance -1,125 0.0<br />
Optimize - Assist eligible Medicaid beneficiaries as <strong>the</strong>y apply for and transition<br />
to Medicare<br />
Health Care Finance -900 0.0<br />
Optimize - Obtain SCHIP funding for immigrant children and pregnant<br />
women in 0 to 5 year waiting period for eligibility, as allowed by<br />
SCHIP reauthorization (matched by Federal funds)<br />
(Continued on next page)<br />
Health Care Finance -354 0.0<br />
FY 2010 Proposed <strong>Budget</strong> and <strong>Financial</strong> Plan<br />
E-182
Table HT0-5 (continued)<br />
(dollars in thousands)<br />
Program BUDGET FTE<br />
Policy Initiatives and Cost Savings (cont)<br />
Optimize - Transition coverage for unborn children <strong>of</strong> undocumented immigrants Health Care Finance -358 0.0<br />
from <strong>the</strong> Alliance to Medicaid<br />
Cost Decrease - Implement approved methodology for reviewing personal care Health Care Finance -1,287 0.0<br />
aide service utilization<br />
Cost Decrease - Enhance prescription drug utilization and review activities Health Care Finance -1,110 0.0<br />
Cost Decrease - Change methodology for recovering improper payments Health Care Finance -2,250 0.0<br />
Cost Decrease - Improve utilization management function resulting in better Health Care Finance -2,584 0.0<br />
recovery <strong>of</strong> improper payments<br />
Cost Decrease - Reduce reimbursement rate for prescription drugs to align Health Care Finance -600 0.0<br />
pharmaceutical spending with national payment trends<br />
Shift - Accelerate adoption <strong>of</strong> health IT for physicians, clinics and o<strong>the</strong>r Health Care Finance -2,700 0.0<br />
providers to reduce duplication <strong>of</strong> services, medical errors and<br />
inappropriate utilization<br />
Cost Decrease - Reduce contract for operational, analytic, legal and strategic Multiple -1,700 0.0<br />
planning support, given DHCF internal personnel capacity growth<br />
Cost Decrease - Roll EPSDT functions into Medicaid Transformation Grant, Healthcare Delivery Management -297 0.0<br />
eliminate external contract<br />
Cost Decrease - Bring responsibility for Child and Adolescent Health Healthcare Delivery Management -170 0.0<br />
Management Initiative into DHCF, eliminate external contract<br />
Cost Decrease - Enhance internal monitoring and oversight <strong>of</strong> SCHIP outreach Healthcare Delivery Management -75 0.0<br />
contract, resulting in contract savings<br />
Cost Decrease - Eliminate external health IT contract by absorbing functions Health Care Operations -31 0.0<br />
under new <strong>Chief</strong> Information <strong>Office</strong>r and Federally-funded health IT projects<br />
Cost Decrease - Align MOU with <strong>the</strong> <strong>Office</strong> <strong>of</strong> <strong>the</strong> Attorney General <strong>Agency</strong> Management Program -75 0.0<br />
with revised staffing cost projections<br />
Cost Decrease - Realign administrative and programmatic functions as part <strong>of</strong> Multiple -262 -3.4<br />
DHCF agency-wide restructuring, resulting in position eliminations<br />
Cost Decrease - Eliminate non-essential vacancies, shift responsibilities to Multiple -196 -2.4<br />
current staff<br />
Cost Decrease - Align travel, supplies and equipment budgets with projected Multiple -52 0.0<br />
utilization<br />
Cost Decrease - Align electricity budget with revised OPM estimates <strong>Agency</strong> Management Program -2 0.0<br />
Cost Decrease - Align telecom budget with revised OCTO estimates <strong>Agency</strong> Management Program -3 0.0<br />
Cost Increase - Align procurement assessment with revised OCP estimates <strong>Agency</strong> Management Program 10 0.0<br />
Cost Decrease - Align occupancy budget with revised OPM estimates <strong>Agency</strong> Management Program -19 0.0<br />
Transfer-Out - Transfer two properties to <strong>the</strong> Department <strong>of</strong> Health to correct <strong>Agency</strong> Management Program -196 0.0<br />
error in DHCF's assessment in fixed costs for rent<br />
Transfer In - Transfer local portion <strong>of</strong> federally-matched Medicaid DD Waiver Health Care Finance 19,968 0.0<br />
from DDS to DHCF<br />
Transfer In - Transfer local funding from DMH to DHCF to help support Health Care Finance 600 0.0<br />
transition <strong>of</strong> 10 individuals from St. Elizabeths Hospital to <strong>the</strong> Medicaid<br />
Home and Community-Based Waiver (matched by Federal funds)<br />
Optimize - Adjust fixed costs in AMP for a reduction in security services and <strong>Agency</strong> Management Program -143 0.0<br />
redirect funds to <strong>the</strong> Health Policy and Planning Program<br />
(Continued on next page)<br />
Department <strong>of</strong> Health Care Finance<br />
E-183
Table HT0-5 (continued)<br />
(dollars in thousands)<br />
Program BUDGET FTE<br />
Policy Initiatives and Cost Savings (cont)<br />
Transfer In - Transfer DYRS and CFSA budgets for utilization <strong>of</strong> Medicaid Health Care Finance 716 0.0<br />
Psychiatric Residential Treatment Facilities to DHCF under new rate<br />
structure<br />
Shift - Transfer to reflect additional Federal Medicaid payments generated Health Care Finance -147,681 0.0<br />
by <strong>the</strong> Recovery Act<br />
Optimize - Transfer funds from AMP fixed costs to support improved Healthcare Policy and Planning 143 0.0<br />
federal reimbursement procedures District-wide<br />
Gap-Closing Initiatives<br />
Reduce - Delay implementation <strong>of</strong> incentive payments to ICF/MR Health Care Finance -1,036 0.0<br />
providers until FY 2011<br />
LOCAL FUND: FY 2010 Proposed <strong>Budget</strong> and FTE 486,691 68.6<br />
DEDICATED TAXES: FY 2009 Approved <strong>Budget</strong> and FTE 16,449 0.0<br />
Initial and Baseline Adjustments<br />
Intra-agency Changes - Funding for <strong>the</strong> Nursing Home Quality <strong>of</strong> Care Fund 12,315 0.0<br />
and <strong>the</strong> Healthy DC Fund<br />
Gap-Closing Initiatives<br />
Shift - Reallocate unobligated Healthy DC Funds to support Alliance Health Care Finance -3,000 0.0<br />
enrollment growth<br />
DEDICATED TAXES: FY 2010 Proposed <strong>Budget</strong> and FTE 25,764 0.0<br />
SPECIAL PURPOSE REVENUE FUNDS: FY 2009 Approved <strong>Budget</strong> and FTE 1,977 3.0<br />
Initial and Baseline Adjustments<br />
Net effect <strong>of</strong> fixed cost adjustments - Funding adjustments for <strong>Agency</strong> Management Program -31 0.0<br />
OPM estimates<br />
Net effect <strong>of</strong> salary and benefits changes - Salary step and o<strong>the</strong>r Multiple Programs 60 1.0<br />
personal services funding adjustments<br />
Intra-<strong>Agency</strong> Changes - Adjustment in contractual services Multiple Programs -183 0.0<br />
SPECIAL PURPOSE REVENUE FUNDS: FY 2010 Proposed <strong>Budget</strong> and FTE 1,823 4.0<br />
FEDERAL GRANT FUND: FY 2009 Approved <strong>Budget</strong> and FTE 6,549 19.0<br />
Initial and Baseline Adjustments<br />
Net effect <strong>of</strong> salary and benefits changes - Salary step and o<strong>the</strong>r Multiple Programs -555 -9.0<br />
personal services funding adjustments<br />
Intra-agency Changes - Projected changes in various grants awards Multiple Programs -4,966 0.0<br />
FEDERAL GRANT FUND: FY 2010 Proposed <strong>Budget</strong> and FTE 1,028 10.0<br />
FEDERAL MEDICAID PAYMENTS: FY 2009 Approved <strong>Budget</strong> and FTE 1,209,336 70.3<br />
Initial and Baseline Adjustments<br />
Net effect <strong>of</strong> salary and benefits changes - Salary step and o<strong>the</strong>r personal Multiple Programs 1,197 8.7<br />
services funding adjustments<br />
Intra-<strong>Agency</strong> Changes - Projected changes in various grants awards Multiple Programs 93,343 0.0<br />
(Continued on next page)<br />
FY 2010 Proposed <strong>Budget</strong> and <strong>Financial</strong> Plan<br />
E-184
Table HT0-5 (continued)<br />
(dollars in thousands)<br />
Program BUDGET FTE<br />
Policy Initiatives and Cost Savings<br />
Cost Decrease - Align travel, supplies and equipment budgets<br />
with utilization<br />
Multiple -52 0.0<br />
Cost Increase - Fund projected Medicaid enrollment growth,<br />
utilization and rate increases<br />
Health Care Finance 109,261 0.0<br />
Enhance - Add Recovery Act funds for temporary increase in<br />
Disproportionate Share Hospital (DSH) payments<br />
Health Care Finance 1,478 0.0<br />
Optimize - Assist eligible Medicaid beneficiaries as <strong>the</strong>y apply for and transition<br />
to Medicare<br />
Health Care Finance -2,100 0.0<br />
Optimize - Obtain SCHIP funding for immigrant children and pregnant women in<br />
0 to 5 year waiting period for eligibility, as allowed by SCHIP reauthorization<br />
Health Care Finance 354 0.0<br />
Optimize - Transition coverage for unborn children <strong>of</strong> undocumented immigrants<br />
from <strong>the</strong> Alliance to Medicaid<br />
Health Care Finance 1,005 0.0<br />
Cost Decrease - Implement approved methodology for reviewing personal care<br />
aide service utilization<br />
Health Care Finance -3,004 0.0<br />
Cost Decrease - Enhance prescription drug utilization and review activities Health Care Finance -2,589 0.0<br />
Cost Decrease - Change methodology for recovering improper payments Health Care Finance -5,250 0.0<br />
Cost Decrease - Improve utilization management function resulting in better<br />
recovery <strong>of</strong> improper payments<br />
Health Care Finance -6,028 0.0<br />
Cost Decrease - Reduce reimbursement rate for prescription drugs to align<br />
pharmaceutical spending with national payment trends<br />
Health Care Finance -1,400 0.0<br />
Shift - Accelerate adoption <strong>of</strong> health IT for physicians, clinics and o<strong>the</strong>r<br />
providers to reduce duplication <strong>of</strong> services, medical errors and inappropriate<br />
utilization<br />
Health Care Finance -6,300 0.0<br />
Cost Decrease - Reduce contract for operational, analytic, legal and strategic<br />
planning support, given DHCF internal personnel capacity growth<br />
Multiple -1,700 0.0<br />
Cost Decrease - Roll EPSDT functions into Medicaid Transformation Grant,<br />
eliminate external contract<br />
Healthcare Delivery Management -297 0.0<br />
Cost Decrease - Bring responsibility for Child and Adolescent Health<br />
Management Initiative into DHCF, eliminate external contract<br />
Healthcare Delivery Management -170 0.0<br />
Cost Decrease - Enhance internal monitoring and oversight <strong>of</strong> SCHIP outreach<br />
contract, resulting in contract savings<br />
Healthcare Delivery Management -282 0.0<br />
Cost Decrease - Eliminate external health IT contract by absorbing functions<br />
under new <strong>Chief</strong> Information <strong>Office</strong>r and Federally-funded health IT projects<br />
Health Care Operations -271 0.0<br />
Cost Decrease - Align MOU with <strong>the</strong> <strong>Office</strong> <strong>of</strong> <strong>the</strong> Attorney General with revised<br />
staffing cost projections<br />
<strong>Agency</strong> Management Program -75 0.0<br />
Cost Decrease - Realign administrative and programmatic functions as part <strong>of</strong><br />
DHCF agency-wide restructuring, resulting in position eliminations<br />
Multiple -305 -3.6<br />
Cost Decrease - Eliminate non-essential vacancies, shift responsibilities to<br />
current staff<br />
Multiple -220 -2.7<br />
Enhance - Align federal Medicaid funding to match additional local funds<br />
transferred from DMH to DHCF to help support transition <strong>of</strong> 10 individuals from<br />
St. Elizabeths Hospital to <strong>the</strong> Medicaid Home and Community-Based Waiver<br />
Health Care Finance 1,400 0.0<br />
Enhance - Align Federal Medicaid funding to match additional local funds<br />
transferred from DYRS and CFSA to DHCF for utilization <strong>of</strong> Medicaid<br />
Psychiatric Residential Treatment Facilities under new rate structure<br />
Health Care Finance 1,671 0.0<br />
(Continued on next page)<br />
Department <strong>of</strong> Health Care Finance<br />
E-185
Table HT0-5 (continued)<br />
(dollars in thousands)<br />
<strong>Agency</strong> Performance Plan<br />
The agency’s Performance Plan has <strong>the</strong> following<br />
objectives for FY 2010:<br />
Objective 1: Provide access to a broad range <strong>of</strong> highquality<br />
healthcare services through a network <strong>of</strong><br />
providers to meet <strong>the</strong> needs <strong>of</strong> eligible beneficiaries.<br />
Objective 2: Maximize healthcare coverage to reduce<br />
<strong>the</strong> number <strong>of</strong> uninsured and underinsured in <strong>the</strong><br />
District <strong>of</strong> Columbia.<br />
Program BUDGET FTE<br />
Policy Initiatives and Cost Savings (cont)<br />
Shift - Add Recovery Act funds generated by additional federal Medicaid Health Care Finance 147,681 0.0<br />
payments<br />
Enhance - Add federal funds to match local funds (remaining at CFSA) for Health Care Finance 492 0.0<br />
medical screenings to be covered under Medicaid personal services<br />
contracts, ra<strong>the</strong>r than hospital-based contract<br />
Gap-Closing Initiatives<br />
Reduce - Delay implementation <strong>of</strong> incentive payments to ICF/MR Health Care Finance -3,965 0.0<br />
providers until FY 2011<br />
FEDERAL MEDICAID PAYMENTS: FY 2010 Proposed <strong>Budget</strong> and FTE 1,533,208 72.8<br />
INTRA-DISTRICT FUNDS: FY 2009 Approved <strong>Budget</strong> and FTE 11,515 0.0<br />
Initial and Baseline Adjustments<br />
Intra-<strong>Agency</strong> Changes - MOUs with <strong>the</strong> Department on Disability Services Health Care Finance 15,185 0.0<br />
for <strong>the</strong> Developmental Disability Waiver and <strong>the</strong> Department <strong>of</strong> Mental<br />
Health for <strong>the</strong> Mental Health Rehabilitation<br />
INTRA-DISTRICT FUNDS: FY 2010 Proposed <strong>Budget</strong> and FTE 26,700 0.0<br />
Gross for HT0 - Department <strong>of</strong> Health Care Finance 2,075,214 155.3<br />
FY 2010 Proposed <strong>Budget</strong> and <strong>Financial</strong> Plan<br />
E-186<br />
Objective 3: Provide care more efficiently, through<br />
ensuring program and fiscal integrity, while maximizing<br />
Federal resources.<br />
Objective 4: Streng<strong>the</strong>n <strong>the</strong> partnership between<br />
DHCF and a broad network <strong>of</strong> quality providers, as<br />
well as with o<strong>the</strong>r government agencies, to expand<br />
healthcare services.
<strong>Agency</strong> Performance Measures<br />
Table HT0-6<br />
FY 2007 FY 2008 FY 2008<br />
Year-End Original Year-End FY 2009 FY 2010 FY 2011<br />
Measure<br />
Objective 1:<br />
Actual Target Actual Projection Projection Projection<br />
Number <strong>of</strong> participants in <strong>the</strong> Elderly and Physically<br />
(EFD) Home and Community Based services<br />
waiver<br />
1,603 1,700 1,953 2,050 2,150 2,250<br />
Average wait time between receipt <strong>of</strong> complete Greater<br />
EPD waiver application and approval/denial <strong>of</strong> than<br />
application N/A N/A 60 days 45 days 30 days 30 days<br />
Reported complaints (including missed/late trips) 4.5 trips 3 trips per 2.5 trips 2.5 trips<br />
on transportation broker services, per 1,000 trips<br />
Number <strong>of</strong> dental visits for children in Medicaid<br />
N/A N/A per 1,000 per 1,000 per 1,000 per 1,000<br />
(unduplicated count)<br />
Number <strong>of</strong> dental visits for adults in Medicaid<br />
TBD TBD TBD TBD TBD TBD<br />
(unduplicated count) TBD TBD TBD TBD TBD TBD<br />
Immunization rates for two-year old children 78% N/A TBD 80% 83% 85%<br />
Timeliness <strong>of</strong> prenatal care<br />
Adults’ use <strong>of</strong> preventive/ambulatory care<br />
70% N/A TBD 75% 78% 80%<br />
services (ages 20-44)<br />
Objective 2:<br />
76% N/A TBD 80% 83% 85%<br />
Percent <strong>of</strong> Medicaid applications processed within 45 90% (August<br />
days (average <strong>of</strong> monthly data)<br />
Percent <strong>of</strong> Alliance applications processed within 45<br />
N/A N/A 2008) 91% 93% 95%<br />
days (average <strong>of</strong> monthly data) TBD TBD TBD TBD TBD TBD<br />
Percent <strong>of</strong> DC residents uninsured 6%<br />
Percent <strong>of</strong> DC residents insured through Medicaid<br />
N/A N/A (estimate) 6% 5% 4%<br />
& Alliance TBD TBD TBD TBD TBD TBD<br />
Number <strong>of</strong> grievances and appeals filed<br />
Objective 3:<br />
TBD TBD TBD TBD TBD TBD<br />
Total recovered from provider audits N/A N/A $1.1 million $1.5 million $1.75 million $2 million<br />
Percent <strong>of</strong> generic drug utilization in Medicaid (FFS only)<br />
Number <strong>of</strong> providers trained annually in Fraud and Abuse<br />
N/A N/A 56% 58% 60% 62%<br />
training program N/A N/A N/A 75 100 100<br />
Objective 4:<br />
Quality Improvement Initiative 1: Adverse Perinatal<br />
Outcomes<br />
Quality Improvement Initiative 2: Adverse Chronic<br />
N/A N/A N/A TBD TBD TBD<br />
Disease Outcomes N/A N/A N/A TBD TBD TBD<br />
Department <strong>of</strong> Health Care Finance<br />
E-187
F<br />
Public Works<br />
Department <strong>of</strong> Public Works (KT)..........................................................................F-1<br />
Department <strong>of</strong> Transportation (KA)......................................................................F-13<br />
Department <strong>of</strong> Motor Vehicles (KV)....................................................................F-29<br />
District Department <strong>of</strong> <strong>the</strong> Environment (KG) ...................................................F-41<br />
D.C. Taxicab Commission (TC)............................................................................F-55<br />
Washington Metropolitan Area Transit Commission (KC)................................F-63<br />
Washington Metropolitan Area Transit Authority (KE).....................................F-67<br />
School Transit Subsidy (KD)..................................................................................F-73
Department <strong>of</strong> Public Works<br />
www.dpw.dc.gov<br />
Telephone: 202-673-6833<br />
(KT0)<br />
% Change<br />
FY 2008 FY 2009 FY 2010 from<br />
Description Actual Approved Proposed FY 2009<br />
Operating <strong>Budget</strong> $162,640,823 $165,569,286 $160,797,126 -2.9<br />
FTEs 2,558.2 1,498.7 1,490.8 -0.5<br />
The mission <strong>of</strong> <strong>the</strong> Department <strong>of</strong> Public Works (DPW) is to provide<br />
<strong>the</strong> highest quality sanitation, parking enforcement and fleet management<br />
services that are both ecologically sound and cost-effective.<br />
Summary <strong>of</strong> Services<br />
The Department <strong>of</strong> Public Works (DPW) provides<br />
municipal services to District residents and businesses<br />
in two distinct program areas: solid waste management<br />
and parking enforcement. Behind <strong>the</strong> scenes,<br />
DPW’s Fleet Management operation supports all city<br />
services by procuring, fueling and maintaining thousand<br />
<strong>of</strong> District government vehicles from sedans to<br />
heavy equipment.<br />
The agency’s FY 2010 proposed budget is presented<br />
in <strong>the</strong> following tables:<br />
Department <strong>of</strong> Public Works<br />
F-1
FY 2010 Proposed Gross Funds Operating <strong>Budget</strong>, by Revenue Type<br />
Table KT0-1 contains <strong>the</strong> proposed FY 2010 agency budget compared to <strong>the</strong> FY 2009 approved budget. It also<br />
provides FY 2007 and FY 2008 actual expenditures.<br />
Table KT0-1<br />
(dollars in thousands)<br />
Actual Actual Approved Proposed<br />
Change<br />
from Percent<br />
Appropriated Fund<br />
General Fund<br />
FY 2007 FY 2008 FY 2009 FY 2010 FY 2009 Change*<br />
Local Funds 106,156 119,618 123,734 116,021 -7,713 -6.2<br />
Special Purpose Revenue Funds 7,503 9,675 13,395 9,101 -4,294 -32.1<br />
Total for General Fund 113,659 129,293 137,128 125,121 -12,007 -8.8<br />
Intra-District Funds<br />
Intra-District Funds 25,590 33,348 28,441 35,676 7,235 25.4<br />
Total for Intra-District Funds 25,590 33,348 28,441 35,676 7,235 25.4<br />
Gross Funds 139,248 162,641 165,569 160,797 -4,772 -2.9<br />
*Percent Change is based on whole dollars.<br />
Note: If applicable, for a breakdown <strong>of</strong> each Grant (Federal and Private), Special Purpose Revenue type and Intra-District agreement,<br />
please refer to Schedule 80, <strong>Agency</strong> Summary by Revenue Source, in <strong>the</strong> Operating Appendices located on <strong>the</strong> <strong>Office</strong> <strong>of</strong> <strong>the</strong> <strong>Chief</strong><br />
<strong>Financial</strong> <strong>Office</strong>r’s website.<br />
FY 2010 Proposed Full-Time Equivalents, by Revenue Type<br />
Table KT0-2 contains <strong>the</strong> proposed FY 2010 FTE level compared to <strong>the</strong> FY 2009 approved FTE level by revenue<br />
type. It also provides FY 2007 and FY 2008 actual data.<br />
Table KT0-2<br />
Change<br />
Actual Actual Approved Proposed from Percent<br />
Appropriated Fund FY 2007 FY 2008 FY 2009 FY 2010 FY 2009 Change*<br />
General Fund<br />
Local Funds 1,247.4 2,359.1 1,315.7 1,307.8 -7.9 -0.6<br />
Special Purpose Revenue Funds 1.0 2.0 21.0 21.0 0.0 0.0<br />
Total for General Fund 1,248.4 2,361.1 1,336.7 1,328.8 -7.9 -0.6<br />
Intra-District Funds<br />
Intra-District Funds 117.0 197.1 162.0 162.0 0.0 0.0<br />
Total for Intra-District Funds 117.0 197.1 162.0 162.0 0.0 0.0<br />
Total Proposed FTEs 1,365.3 2,558.2 1,498.7 1,490.8 -7.9 -0.5<br />
FY 2010 Proposed <strong>Budget</strong> and <strong>Financial</strong> Plan<br />
F-2
FY 2010 Proposed Operating <strong>Budget</strong>, by Comptroller Source Group<br />
Table KT0-3 contains <strong>the</strong> proposed FY 2010 budget at <strong>the</strong> Comptroller Source Group (object class) level compared<br />
to <strong>the</strong> FY 2009 approved budget. It also provides FY 2007 and FY 2008 actual expenditures.<br />
Table KT0-3<br />
(dollars in thousands)<br />
Actual Actual Approved Proposed<br />
Change<br />
from Percent<br />
Comptroller Source Group FY 2007 FY 2008 FY 2009 FY 2010 FY 2009 Change*<br />
11 Regular Pay - Cont Full Time 52,744 57,535 62,224 65,729 3,504 5.6<br />
12 Regular Pay - O<strong>the</strong>r 7,294 10,127 7,295 9,992 2,698 37.0<br />
13 Additional Gross Pay 1,606 1,837 1,713 732 -982 -57.3<br />
14 Fringe Benefits - Curr Personnel 13,456 14,587 14,432 15,521 1,089 7.5<br />
15 Overtime Pay 5,185 5,435 5,376 3,708 -1,668 -31.0<br />
Subtotal Personal Services (PS) 80,286 89,521 91,041 95,682 4,641 5.1<br />
20 Supplies and Materials 3,586 2,489 5,164 5,739 575 11.1<br />
30 Energy, Comm. and Bldg Rentals 12,355 18,361 12,406 18,911 6,505 52.4<br />
31 Telephone, Telegraph, Telegram, Etc 1,342 1,202 1,415 1,132 -283 -20.0<br />
32 Rentals - Land and Structures 322 354 556 1,532 975 175.3<br />
33 Janitorial Services 211 239 408 796 388 95.3<br />
34 Security Services 2,915 3,945 3,812 1,963 -1,849 -48.5<br />
35 Occupancy Fixed Costs 277 200 276 765 489 177.1<br />
40 O<strong>the</strong>r Services and Charges 16,231 20,057 18,355 15,108 -3,247 -17.7<br />
41 Contractual Services - O<strong>the</strong>r 18,774 22,919 26,441 13,543 -12,898 -48.8<br />
50 Subsidies and Transfers 0 93 600 1,700 1,100 183.3<br />
70 Equipment & Equipment Rental 2,947 3,260 5,095 3,926 -1,169 -22.9<br />
91 Expense Not <strong>Budget</strong>ed O<strong>the</strong>rs 0 1 0 0 0 N/A<br />
Subtotal Nonpersonal Services (NPS) 58,962 73,120 74,528 65,115 -9,413 -12.6<br />
Gross Funds 139,248 162,641 165,569 160,797 -4,772 -2.9<br />
*Percent Change is based on whole dollars.<br />
Program Description<br />
The Department <strong>of</strong> Public Works operates through<br />
<strong>the</strong> following 5 programs:<br />
Sanitation Services - performs a number <strong>of</strong> daily<br />
operations associated with waste management and a<br />
clean, healthy environment in <strong>the</strong> District.<br />
This program contains <strong>the</strong> following 4 activities:<br />
■ Enforcement <strong>of</strong> Sanitation Regulations - inspects<br />
properties for sanitation violations, enforces sanitation<br />
regulations, including commercial recycling,<br />
educates residents and businesses about sanitation<br />
regulations, collects household hazardous<br />
waste and electronic materials, and shreds residents’<br />
personal documents;<br />
■ Public Space Cleaning - provides comprehensive<br />
street and alley cleaning services to residents, visitors<br />
and businesses so that <strong>the</strong>y can live, work and<br />
Department <strong>of</strong> Public Works<br />
F-3
play in clean neighborhoods. Specific services<br />
include mechanical street sweeping, litter can collections,<br />
rights-<strong>of</strong>-way mowing, nuisance and<br />
graffiti abatement, seasonal leaf collection and<br />
snow and ice removal;<br />
■ Sanitation Collection and Removals - provides<br />
solid waste (trash, recycling and bulk) collection<br />
services to residents <strong>of</strong> single-family homes so <strong>the</strong>y<br />
can have <strong>the</strong>ir trash, recyclables and bulk items<br />
removed conveniently and regularly; and<br />
■ Sanitation Disposal - provides municipal waste<br />
disposal services to DPW, o<strong>the</strong>r DC agencies, private<br />
haulers and residents so that <strong>the</strong>y can unload<br />
collected waste safely, conveniently and legally.<br />
Parking Services - program provides for enforcing <strong>the</strong><br />
District's on-street parking laws.<br />
This program contains <strong>the</strong> following 3 activities:<br />
■ Parking Regulations Enforcement - provides<br />
parking enforcement <strong>of</strong> District parking regulations<br />
to promote vehicular safety, provide smooth<br />
traffic flow and increased access to short-term<br />
parking at meters and long-term parking on residential<br />
streets. Approximately 200 parking <strong>of</strong>ficers<br />
monitor 16,000 meters and 4,100 blocks <strong>of</strong><br />
residential zoned parking through routine deployment<br />
strategies;<br />
■ Towing - provides reduced parking congestion in<br />
<strong>the</strong> District by facilitating <strong>the</strong> timely relocation<br />
and/or impoundment <strong>of</strong> illegally parked vehicles<br />
from public space; and<br />
■ Abandoned and Junk Vehicles - provides <strong>the</strong><br />
oversight <strong>of</strong> safe streets through <strong>the</strong> efficient<br />
removal <strong>of</strong> abandoned and dangerous vehicles<br />
from public space and nuisance properties within<br />
<strong>the</strong> District.<br />
Fleet Management Program – provides support to<br />
municipal operations by procuring, fueling, and<br />
maintaining thousands <strong>of</strong> District government vehicles,<br />
from sedans to heavy equipment.<br />
This program contains <strong>the</strong> following 4 activities:<br />
■ Fleet Consumables - provides most District agencies<br />
with operational fueling stations; procures<br />
fuel, oil, and o<strong>the</strong>r lubricants; and installs fuel<br />
rings;<br />
FY 2010 Proposed <strong>Budget</strong> and <strong>Financial</strong> Plan<br />
F-4<br />
■ Scheduled Fleet Maintenance - performs preventive<br />
maintenance actions, including changing oil<br />
and filters; checks tires, engines, batteries, and<br />
transmissions; and prepares vehicles for <strong>the</strong>ir seasonal<br />
and year-round duties (alley cleaning, snow<br />
removal, leaf collection, pothole repair, etc);<br />
■ Unscheduled Vehicle and Equipment Repairs -<br />
tows inoperable vehicles, diagnoses why vehicles<br />
are not operating properly, and makes <strong>the</strong> necessary<br />
repairs or transfers vehicles to vendor for<br />
return to service; and<br />
■ Vehicle and Equipment Acquisitions - consults<br />
with District government agencies about vehicle<br />
needs, ensures <strong>the</strong>se agencies have sufficient budget<br />
authority to meet <strong>the</strong>ir needs, procure vehicles,<br />
and reduces unnecessary vehicles from <strong>the</strong><br />
fleet.<br />
<strong>Agency</strong> Management - provides for administrative<br />
support and <strong>the</strong> required tools to achieve operational<br />
and programmatic results. This program is standard<br />
for all agencies using performance-based budgeting.<br />
<strong>Agency</strong> <strong>Financial</strong> Operations - provides comprehensive<br />
and efficient financial management services to,<br />
and on behalf <strong>of</strong>, District agencies so that <strong>the</strong> financial<br />
integrity <strong>of</strong> <strong>the</strong> District <strong>of</strong> Columbia is maintained.<br />
This program is standard for all agencies using<br />
performance-based budgeting.<br />
Program Structure Changes<br />
The Department <strong>of</strong> Public Works had no program<br />
structure changes in <strong>the</strong> FY 2010 Proposed <strong>Budget</strong>.
FY 2010 Proposed Operating <strong>Budget</strong> and FTEs, by Program and Activity<br />
Table KT0-4 contains <strong>the</strong> proposed FY 2010 budget by program and activity compared to <strong>the</strong> FY 2009 approved budget.<br />
It also provides FY 2008 actual data.<br />
Table KT0-4<br />
(dollars in thousands)<br />
Dollars in Thousands Full-Time Equivalents<br />
Change Change<br />
Actual Approved Proposed from Actual Approved Proposed from<br />
Program/Activity<br />
(1000) <strong>Agency</strong> Management<br />
FY 2008 FY 2009 FY 2010 FY 2009 FY 2008 FY 2009 FY 2010 FY 2009<br />
(1010) Personnel 738 1,886 1,215 -670 8.1 9.5 5.4 -4.2<br />
(1015) Training and Employee Development 547 611 553 -57 3.4 3.5 3.5 0.0<br />
(1017) Labor Management Partnerships 55 48 157 109 0.4 0.5 1.5 1.0<br />
(1020) Contracting and Procurement 919 932 1,040 108 9.4 8.5 9.5 1.0<br />
(1030) Property Management 11,250 12,351 13,728 1,377 5.4 6.5 6.5 0.0<br />
(1040) Information Technology 3,473 3,306 2,669 -637 12.4 13.5 13.5 0.0<br />
(1055) Risk Management 470 519 386 -133 4.4 4.5 3.5 -1.0<br />
(1060) Legal 46 48 50 2 0.4 0.5 0.5 0.0<br />
(1070) Fleet Management 14 15 15 0 0.0 0.0 0.0 0.0<br />
(1080) Communications 349 370 440 71 3.9 3.9 4.9 1.0<br />
(1085) Customer Service 75 82 84 2 1.0 1.0 1.0 0.0<br />
(1090) Performance Management 241 520 319 -201 4.4 4.5 2.5 -2.0<br />
(1095) Clean City Mgt 230 0 0 0 0.0 0.0 0.0 0.0<br />
Subtotal (1000) <strong>Agency</strong> Management<br />
(100F) <strong>Agency</strong> <strong>Financial</strong> Operations<br />
18,407 20,687 20,657 -31 53.4 56.0 51.9 -4.2<br />
(110F) <strong>Budget</strong> Operations 487 416 2,248 1,833 4.0 4.0 5.0 1.0<br />
(120F) Accounting Operations 3,856 2,121 1,900 -221 23.0 25.0 21.0 -4.0<br />
(130F) ACFO 1,391 1,565 1,378 -187 8.6 9.0 11.0 2.0<br />
Subtotal (100F) <strong>Agency</strong> <strong>Financial</strong> Operations 5,734<br />
(4000) Fleet Management<br />
4,102 5,527 1,425 35.6 38.0 37.0 -1.0<br />
(4010) Fleet Consumables 18,011 12,495 16,810 4,315 26.4 18.0 21.0 3.0<br />
(4020) Scheduled Fleet Maintenance 7,465 7,837 7,689 -148 108.6 76.0 77.0 1.0<br />
(4030) Unscheduled Vehicle & Equipment Repairs 609 4,726 5,123 396 53.9 37.0 37.0 0.0<br />
(4040) Vehicle & Equipment Acquisitions 2,020 2,079 1,848 -230 8.2 11.0 7.0 -4.0<br />
Subtotal (4000) Fleet Management<br />
(5000) Parking Services<br />
28,105 27,137 31,470 4,332 197.1 142.0 142.0 0.0<br />
(5010) Parking Regulations Enforcement 18,001 21,831 20,262 -1,569 297.4 324.0 323.0 -1.0<br />
(5020) Towing 3,958 4,424 3,798 -626 81.5 64.0 52.0 -12.0<br />
(5030) Abandoned & Junk Vehicles 2,606 2,419 1,879 -540 26.2 30.0 25.2 -4.8<br />
Subtotal (5000) Parking Services<br />
(Continued on next page)<br />
24,566 28,674 25,939 -2,735 405.2 418.0 400.2 -17.8<br />
Department <strong>of</strong> Public Works<br />
F-5
FY 2010 Proposed Operating <strong>Budget</strong> and FTEs, by Program and Activity<br />
Table KT0-4 contains <strong>the</strong> proposed FY 2010 budget by program and activity compared to <strong>the</strong> FY 2009 approved budget.<br />
It also provides FY 2008 actual data.<br />
Table KT0-4 (Continued)<br />
(dollars in thousands)<br />
Dollars in Thousands Full-Time Equivalents<br />
Change Change<br />
Actual Approved Proposed from Actual Approved Proposed from<br />
Program/Activity<br />
(6000) Sanitation Services<br />
FY 2008 FY 2009 FY 2010 FY 2009 FY 2008 FY 2009 FY 2010 FY 2009<br />
(6010) Enforcement <strong>of</strong> Sanitation Regulations 5,861 6,412 7,292 880 69.4 79.0 85.0 6.0<br />
(6020) Public Space Cleaning 30,954 32,330 32,076 -255 1,093.2 416.2 419.3 3.1<br />
(6030) Sanitation Collections & Removals 24,846 21,752 21,559 -193 584.2 292.5 289.4 -3.1<br />
(6040) Sanitation Disposal 24,168 24,475 16,278 -8,197 119.2 57.0 66.0 9.0<br />
Subtotal (6000) Sanitation Services<br />
(9980) Payroll Default Program<br />
85,829 84,969 77,204 -7,764 1,865.9 844.7 859.7 15.0<br />
No Activity Assigned 0 0 0 0 1.0 0.0 0.0 N/A<br />
Subtotal (9980) Payroll Default Program 0 0 0 0 1.0 0.0 0.0 N/A<br />
Total Proposed Operating <strong>Budget</strong> 162,641 165,569 160,797 -4,772 2,558.2 1,498.7 1,490.8 -7.9<br />
(Change is calculated by whole numbers and numbers may not add up due to rounding)<br />
Note: For more detailed information regarding <strong>the</strong> proposed funding for <strong>the</strong> activities within this agency’s programs, please see Schedule 30-<br />
PBB Program Summary by Activity in <strong>the</strong> FY 2010 Operating Appendices located on <strong>the</strong> <strong>Office</strong> <strong>of</strong> <strong>the</strong> <strong>Chief</strong> <strong>Financial</strong> <strong>Office</strong>r’s website.<br />
Major Baseline Adjustments, Cost Savings<br />
and Policy Initiatives<br />
Initial Adjustments: The following adjustments were<br />
made in <strong>the</strong> Local funds: a reduction <strong>of</strong> $2,911,545<br />
and 101 FTEs in multiple programs for personal services;<br />
an increase <strong>of</strong> $1,816,556 in multiple programs<br />
for supplies; a net increase <strong>of</strong> $4,254,913 in multiple<br />
programs for fixed costs; a reduction <strong>of</strong> $3,031,808 in<br />
multiple programs for o<strong>the</strong>r services and charges; and<br />
an increase <strong>of</strong> $1,128,174 in multiple programs for<br />
contractual services. In Special Purpose Revenue<br />
funds, a reduction <strong>of</strong> $814,725 in supplies. In Intra-<br />
District funds, an increase <strong>of</strong> $1,895,613 in multiple<br />
programs for personal services and an increase <strong>of</strong><br />
$1,646,944 in supplies.<br />
Baseline Adjustments: The following adjustments<br />
were made in <strong>the</strong> Local funds: an increase <strong>of</strong><br />
$1,500,000 in overtime to reflect historical actual<br />
FY 2010 Proposed <strong>Budget</strong> and <strong>Financial</strong> Plan<br />
F-6<br />
expenditures; a reduction <strong>of</strong> $3,662,298 in <strong>the</strong><br />
<strong>Agency</strong> Management program for fixed costs; a<br />
reduction <strong>of</strong> $954,451 in multiple programs for supplies;<br />
and an increase <strong>of</strong> $3,277,064 in multiple programs<br />
for o<strong>the</strong>r services and charges.<br />
Cost Savings: DPW reduced 61 parking enforcement<br />
<strong>of</strong>ficers and 40 solid waste management staff in<br />
<strong>the</strong> FY 2010 Local funds baseline. While <strong>the</strong> budget<br />
proposes an elimination <strong>of</strong> 61 parking enforcement<br />
<strong>of</strong>ficers, DPW will substantially increase parking<br />
enforcement coverage per person through <strong>the</strong> use <strong>of</strong><br />
License Plate Recognition System (LPRS) camera<br />
technology. Preliminary results from implementing<br />
<strong>the</strong> cameras in <strong>the</strong> enforcement <strong>of</strong> <strong>the</strong> Registered<br />
Out-<strong>of</strong>-State Automobiles program show a significant<br />
increase in <strong>the</strong> area covered and tickets issued. Similar<br />
productivity gains are anticipated with <strong>the</strong> use <strong>of</strong><br />
LPRS in Timed Enforcement and <strong>the</strong> Sweepercam<br />
programs. The 40 Solid Waste Management employ-
ees, added in FY 2009, currently perform additional<br />
work in street and alley cleaning. This reduction will<br />
return <strong>the</strong> District to <strong>the</strong> street and alley cleaning service<br />
level provided in September 2008.<br />
Upon fur<strong>the</strong>r evaluation, DPW found an additional<br />
37 positions could be eliminated through better<br />
distribution <strong>of</strong> staff assignments and a strategic<br />
reduction to bulk collection services. DPW anticipates<br />
bulk collections will be collected within 14 days<br />
<strong>of</strong> a request, as opposed to 10 days. O<strong>the</strong>r eliminated<br />
positions are primarily administrative and management<br />
positions which do not directly affect field<br />
work. Savings from this realignment total<br />
$2,151,000, and DPW believes most will be achieved<br />
through attrition and vacancy savings.<br />
A reassessment <strong>of</strong> overtime needs in <strong>the</strong> Fleet<br />
Administration resulted in a $515,687 reduction in<br />
its intra-District funds. In addition, total fuel costs are<br />
reduced by about $7,000,000 District-wide by basing<br />
estimates on <strong>the</strong> per-gallon cost. These reductions are<br />
reflected across each fleet-using agency’s Local fund<br />
budget as a cost decrease. DPW’s fleet budget for its<br />
own vehicles was reduced by $1,847,000 in FY 2010.<br />
The Household Hazardous Waste and Shred-It<br />
program will decrease from two sites to one each<br />
Saturday for a savings <strong>of</strong> $668,000. Past demand<br />
indicates <strong>the</strong> number <strong>of</strong> weekly customers will not<br />
overwhelm one location. Also, a close examination <strong>of</strong><br />
DPW’s essential nonpersonal services needs resulted<br />
in reduced supply, material, printing, and outside<br />
contract expenses ($2,133,000), tightened spending<br />
on machinery and building repairs ($262,000),<br />
delayed replacement <strong>of</strong> IT hardware ($460,000), and<br />
elimination <strong>of</strong> <strong>the</strong> travel and out-<strong>of</strong>-city conference<br />
fees budget ($347,000). O<strong>the</strong>r assessments for telecom,<br />
occupancy, electricity, holiday pay, and <strong>the</strong> disposal<br />
contract fee have been reduced in accordance<br />
with <strong>the</strong>ir revised estimates.<br />
Protected Programs: A clean city with a superior public<br />
works program is one <strong>of</strong> <strong>the</strong> District’s highest priorities,<br />
and <strong>the</strong> proposed cost savings will not affect<br />
DPW’s ability to perform its core services. The trash<br />
and recycling collection, nuisance abatement, street<br />
sweeping, and leaf removal programs will remain at<br />
<strong>the</strong> same exceptional level as FY 2009. Focused litter<br />
control programs in Adams Morgan, <strong>the</strong> U Street<br />
Neighborhood, and <strong>the</strong> H Street Corridor will con-<br />
tinue, and <strong>the</strong> graffiti removal program remains<br />
strong.<br />
The efficiencies gained from <strong>the</strong> License Plate<br />
Recognition cameras will <strong>of</strong>fset <strong>the</strong> reduction in parking<br />
enforcement <strong>of</strong>ficers. Parking services will not be<br />
disrupted, and <strong>the</strong> District will see an increase in<br />
enforcement coverage per <strong>of</strong>ficer in FY 2010.<br />
Fleet Administration will continue to operate at<br />
full capacity, providing preventative and unscheduled<br />
maintenance, fuel management, and vehicle acquisition.<br />
The fleet share program, which allows District<br />
agencies to share vehicles for work activities, will<br />
expand in FY 2010.<br />
Policy Initiatives: The Department <strong>of</strong> Public Works<br />
will implement <strong>the</strong> following policy initiatives, by<br />
program, during FY 2010:<br />
■ Parking Services - An increase <strong>of</strong> $3,384,371 and<br />
65.0 FTEs in personal services and $740,000 for<br />
nonpersonal services for an enhancement <strong>of</strong><br />
neighborhood parking enforcement activities.<br />
■ Solid Waste Management - The Solid Waste<br />
Management program will implement <strong>the</strong> following<br />
3 policy initiatives:<br />
(1) An increase <strong>of</strong> $2,500,000 and 50.0 FTEs<br />
for <strong>the</strong> employment <strong>of</strong> ex-<strong>of</strong>fenders in maintaining<br />
public spaces;<br />
(2) An increase <strong>of</strong> $1,286,522 and 21.0 FTEs<br />
and $135,200 for nonpersonal services for inspectors<br />
to monitor <strong>the</strong> cleanliness <strong>of</strong> sidewalks, streets<br />
and alleys; and<br />
(3) an increase <strong>of</strong> $100,000 for <strong>the</strong> DC Murals<br />
program that creates art on District public spaces.<br />
Gap-Closing Initiatives: DPW will realign 6 administrative<br />
positions in multiple programs, for a total<br />
savings <strong>of</strong> $433,070. DPW will also reduce discretionary<br />
purchases across <strong>the</strong> agency, including supplies,<br />
o<strong>the</strong>r services and charges and equipment,<br />
yielding $4,923,908 in Local Fund savings.<br />
Additionally, <strong>the</strong> budget includes $1,000,000 in onetime<br />
funding in <strong>the</strong> Sanitation Services program for<br />
<strong>the</strong> green team initiative in Ward 1.<br />
Department <strong>of</strong> Public Works<br />
F-7
FY 2009 Approved <strong>Budget</strong> to FY 2010 Proposed <strong>Budget</strong>, by Revenue Type<br />
This table KT0-5 itemizes <strong>the</strong> changes by revenue type between <strong>the</strong> FY 2009 approved budget and <strong>the</strong> FY 2010<br />
proposed budget. The four categories <strong>of</strong> changes reflected in this table are: (1) changes to <strong>the</strong> baseline budget<br />
(includes agency request), (2) changes representing cost savings or efficiencies, (3) changes related to policy initiatives,<br />
and (4) changes to specifically address <strong>the</strong> projected revenue shortfall.<br />
Table KT0-5<br />
(dollars in thousands)<br />
PROGRAM BUDGET FTE<br />
LOCAL FUNDS: FY 2009 Approved <strong>Budget</strong> and FTE 123,734 1,315.7<br />
Initial and Baseline Adjustments<br />
Net effect <strong>of</strong> fixed cost adjustments - Revise Fixed Cost estimated for<br />
Energy, Telecom, Rent, Janitorial, Security and Occupancy<br />
<strong>Agency</strong> Management 4,255 0.0<br />
Net effect <strong>of</strong> salary and benefits changes - A net decrease <strong>of</strong> $2,911,545 Multiple -2,912 -101.0<br />
Intra-<strong>Agency</strong> Changes - Revise Supplies Multiple 1,817 0.0<br />
Intra-<strong>Agency</strong> Changes - Reduction in O<strong>the</strong>r Services & Charges Multiple -3,032 0.0<br />
Intra-<strong>Agency</strong> Changes - Revise Contractual Services Multiple 1,128 0.0<br />
Intra-<strong>Agency</strong> Changes - Reduction in Equipment Multiple -1,256 0.0<br />
Baseline Adjustments: Net effect <strong>of</strong> fixed cost adjustments - Revise Fixed<br />
Cost estimates for Telecom, Janitorial, Security and Occupancy<br />
Multiple -3,662 0.0<br />
Baseline Adjustments: Net effect <strong>of</strong> salary and benefits changes - Revise<br />
Personal Services<br />
Multiple 1,500 0.0<br />
Baseline Adjustments: Intra-<strong>Agency</strong> Changes - Revise O<strong>the</strong>r Services &<br />
Charges<br />
Multiple 3,277 0.0<br />
Baseline Adjustments: Intra-<strong>Agency</strong> Changes - Reduction in Supplies Multiple -954 0.0<br />
Baseline Adjustments: Intra-<strong>Agency</strong> Changes - Reduction in Contractual<br />
Services<br />
Multiple -160 0.0<br />
Policy Initiatives and Cost Savings<br />
Cost Increase - Align procurement assessment budget with revised OCP <strong>Agency</strong> Management 104 0.0<br />
estimates.<br />
Nonpersonal services - Support costs for <strong>the</strong> enhanced parking Parking Services 740 0.0<br />
enforcement efforts<br />
Salary and Benefits - Enhance parking enforcement efforts Parking Services 3,384 65.0<br />
Holiday Pay - Emancipation Day Sanitation Services 33 0.0<br />
Nonpersonal services - DC mural program Sanitation Services 100 0.0<br />
Nonpersonal services - Support costs for <strong>the</strong> SWEEP Sanitation Services 135 0.0<br />
O<strong>the</strong>r services and charges - Sweeper camera maintenance expense Sanitation Services 300 0.0<br />
Salary and Benefits - Salary and benefits for ex-<strong>of</strong>fender activity Sanitation Services 2,500 50.0<br />
Salary and benefits - SWEEP inspectors Sanitation Services 1,287 21.0<br />
Reduce - Realign staffing in administration, solid waste management, Multiple -2,151 -37.0<br />
and parking enforcement programs for greater efficiency<br />
Reduce - Reduce spending on supplies, materials, printing, and All Programs -2,133 0.0<br />
contracts for outside pr<strong>of</strong>essional services<br />
Eliminate - Eliminate travel and out-<strong>of</strong>-city conference fees Multiple -347 0.0<br />
Reduce - Reduce Household Hazardous Waste and Shred-It program to Sanitation Services -668 0.0<br />
52 collections a year<br />
Reduce - Reduce IT hardware purchases by extending <strong>the</strong> life <strong>of</strong> current Multiple -460 0.0<br />
hardware<br />
Reduce - Reduce machinery and building repair funds Sanitation Services -262 0.0<br />
(Continued on next page)<br />
FY 2010 Proposed <strong>Budget</strong> and <strong>Financial</strong> Plan<br />
F-8
Table KT0-5 (continued)<br />
(dollars in thousands)<br />
PROGRAM BUDGET FTE<br />
LOCAL FUNDS - Policy Initiatives and Cost Savings (cont)<br />
Cost Decrease - Align disposal contract fee for service with revised<br />
agency estimate<br />
Sanitation Services -3,500 0.0<br />
Cost Decrease - Align telecom budget with revised OPM estimates All -412 0.0<br />
Cost Decrease - Align occupancy budget with revised OPM estimates All -73 0.0<br />
Cost Decrease - Align fleet budget with revised DPW estimates All -1,847 0.0<br />
Cost Decrease - Align electricity budget with revised OPM estimates All -54 0.0<br />
Cost Decrease - Reduce projected holiday premium payouts Multiple -33 0.0<br />
Gap-Closing Initiatives<br />
Nonpersonal Services - Ward 1 Green Team initiative (one-time) Sanitation Services 1,000 0.0<br />
Cost Reduction - Realign administrative positions Multiple -433 -6.0<br />
Cost Reduction - Reduce discretionary purchases, including supplies, o<strong>the</strong>r<br />
services and charges, and equipment<br />
Multiple -4,924 0.0<br />
LOCAL FUNDS: FY 2010 Proposed <strong>Budget</strong> and FTE 116,021 1,307.8<br />
SPECIAL PURPOSE REVENUE FUNDS: FY 2009 Approved <strong>Budget</strong> and FTE<br />
Initial and Baseline Adjustments<br />
13,395 21.0<br />
Net effect <strong>of</strong> salary and benefits changes - Reduction in Personal Services Multiple -67 0.0<br />
Intra-<strong>Agency</strong> Changes - Reduction in Supplies Multiple -815 0.0<br />
Intra-<strong>Agency</strong> Changes - Revise O<strong>the</strong>r Services & Charges Multiple 525 0.0<br />
Intra-<strong>Agency</strong> Changes - Reduction in Subsidies & Transfers Multiple -1,823 0.0<br />
Intra-<strong>Agency</strong> Changes - Revise Equipment Multiple 617 0.0<br />
Policy Initiatives and Cost Savings<br />
Cost Decrease - Align District Recycle Program, Solid Waste Disposal<br />
Fund, and Clean City Fund with revised revenue estimates<br />
Sanitation Services -2,731 0.0<br />
SPECIAL PURPOSE REVENUE FUNDS: FY 2010 Proposed <strong>Budget</strong> and FTE 9,101 21.0<br />
INTRA-DISTRICT FUNDS: FY 2009 Approved <strong>Budget</strong> and FTE<br />
Initial and Baseline Adjustments<br />
28,441 162.0<br />
Net effect <strong>of</strong> salary and benefits changes - Revise Personal Services Multiple 1,896 0.0<br />
Intra-<strong>Agency</strong> Changes - Revise Supplies Multiple 1,647 0.0<br />
Intra-<strong>Agency</strong> Changes - Reduction in O<strong>the</strong>r Services & Charges Multiple -26 0.0<br />
Intra-<strong>Agency</strong> Changes - Revise Contractual Services Multiple 109 0.0<br />
Intra-<strong>Agency</strong> Changes - Reduction in Equipment Multiple -371 0.0<br />
Policy Initiatives and Cost Savings<br />
Cost Decrease - Reduce overtime based on revised estimate Multiple -434 0.0<br />
Net effect <strong>of</strong> fixed cost adjustments - Increase in Intra-District <strong>Budget</strong> authority<br />
for fleet services<br />
Fleet Management 4,415 0.0<br />
INTRA-DISTRICT FUNDS: FY 2010 Proposed <strong>Budget</strong> and FTE 35,676 162.0<br />
Gross for KT0 - Department <strong>of</strong> Public Works 160,797 1,490.8<br />
Department <strong>of</strong> Public Works<br />
F-9
<strong>Agency</strong> Performance Plan<br />
The agency’s performance plan has <strong>the</strong> following<br />
objectives for FY 2010:<br />
Objective 1: Increase <strong>the</strong> cleanliness <strong>of</strong> <strong>the</strong> District’s<br />
residential neighborhoods, high-visibility commercial<br />
areas, gateway corridors and industrial zones;<br />
<strong>Agency</strong> Performance Measures<br />
Table KT0-6<br />
FY 2007 FY 2008 FY 2008<br />
Year-End Original Year-End FY 2009 FY 2010 FY 2011<br />
Measure<br />
Objective 1:<br />
Percent <strong>of</strong> <strong>the</strong> District’s Gateways, commercial and<br />
Actual* Target Actual Projection Projection Projection<br />
residential areas rated “clean” or “moderately clean”<br />
Percent <strong>of</strong> trash collection routes completed on <strong>the</strong><br />
N/A 90.0 90.7 90.0 95.0 95.0<br />
scheduled day<br />
Complaint rate for missed trash and yard waste<br />
99.6 99.8 99.5 99.8 99.8 99.8<br />
collections per 10,000 collections (standard is 6) 1 2 13 6 14 15 10 6<br />
Cost per ton to collect trash and yard waste3 Percent <strong>of</strong> recycling collection routes completed on <strong>the</strong><br />
N/A N/A N/A Baseline Year TBD TBD<br />
scheduled day<br />
Complaint rate for missed recycling collections<br />
99.5 99.8 99.9 99.8 99.8 99.8<br />
per 10,000 collections 6 6 5 6 6 6<br />
Cost per ton to collect recyclables3 Pounds <strong>of</strong> household and bulk trash generated per<br />
N/A N/A N/A Baseline Year TBD TBD<br />
residence served 2,208 2,000 N/A 1,960 1,921 1,921<br />
Residential recycling diversion rate 17.6% 20.0 20.1 22.0 25.0 30.0<br />
Number <strong>of</strong> graffiti abatements<br />
Objective 2:<br />
2,500 3,000 1,444 2,000 2,000 2,000<br />
Number <strong>of</strong> parking tickets issued 1,382,725 1,400,000 1,102,648 1,500,000 1,500,000 1,500,000<br />
Cost per ticket issued (measured by PS/# <strong>of</strong> tickets) N/A Baseline Year N/A TBD TBD TBD<br />
Number <strong>of</strong> vehicles immobilized 18,229 19,000 13,344 19,000 20,000 20,000<br />
Percent <strong>of</strong> RPP blocks covered by daily enforcement<br />
Percent <strong>of</strong> service requests for abandoned vehicles on<br />
21.8 30.0 24.6 35.0 60.0 75.0<br />
public space resolved within 5 business days<br />
(Continued on next page)<br />
78.5 85.0 91.3 90.0 92.0 94.0<br />
FY 2010 Proposed <strong>Budget</strong> and <strong>Financial</strong> Plan<br />
F-10<br />
Objective 2: Ensure parking opportunities for<br />
District residents, businesses and visitors by enforcing<br />
parking regulations; and<br />
Objective 3: Ensure that at least 95 percent <strong>of</strong> mission<br />
critical equipment will be available to all agencies,<br />
while reducing <strong>the</strong> environmental impact <strong>of</strong> <strong>the</strong><br />
District’s fleet.
<strong>Agency</strong> Performance Measures (cont)<br />
Table KT0-6<br />
FY 2007 FY 2008 FY 2008<br />
Year-End Original Year-End FY 2009 FY 2010 FY 2011<br />
Measure Actual* Target Actual Projection Projection Projection<br />
Objective 3:<br />
Percent <strong>of</strong> mission critical fleet maintained by DPW<br />
available for daily operations 100.0 95.0 100.0 95.0 95.0 95.0<br />
Percent compliance with preventive maintenance<br />
appointments 76.6 90.0 77.1 85.0 90.0 95.0<br />
Percent <strong>of</strong> mechanics with at least one ASE certification 28.0 80.0 15.1 20.0 20.0 20.0<br />
Percent mechanics with at least one pr<strong>of</strong>essional<br />
certification N/A N/A N/A 70.0 80.0 90.0<br />
Percent light vehicle maintenance (excluding engine,<br />
transmission and body work) completed<br />
within 24 hours 36.6 95.0 81.3 85.0 90.0 95.0<br />
1 Standard set by Municipal Waste Management Association<br />
2 DPW will be rerouting its trucks in FY 2009. DPW expects to see an increase in complaints during this transition as residents and workers become<br />
accustomed to <strong>the</strong> new schedule.<br />
3 New Performance Measure in FY 2009. Will establish a baseline in FY 2009.<br />
Department <strong>of</strong> Public Works<br />
F-11
Department <strong>of</strong> Transportation<br />
www.ddot.dc.gov<br />
Telephone: 202-673-6813<br />
The mission <strong>of</strong> <strong>the</strong> District Department <strong>of</strong> Transportation (DDOT)<br />
is to enhance <strong>the</strong> quality <strong>of</strong> life for District residents and visitors by<br />
ensuring that people and goods move safely with minimal adverse<br />
impact on residents and <strong>the</strong> environment.<br />
Summary <strong>of</strong> Services<br />
DDOT executes its mission through <strong>the</strong> work <strong>of</strong> five<br />
Administrations:<br />
■ Infrastructure Project Management Administration -<br />
designs and builds roads and bridges, trails, and<br />
o<strong>the</strong>r transportation projects;<br />
■ Mass Transit Administration - provides public<br />
transportation service through Metro and <strong>the</strong><br />
Circulator bus system;<br />
■ Traffic Operations Administration - ensures a safe<br />
and user-friendly transportation environment;<br />
■ Transportation Policy and Planning<br />
Administration - develops strategic goals for <strong>the</strong><br />
agency; and<br />
(KA0)<br />
% Change<br />
FY 2008 FY 2009 FY 2010 from<br />
Description Actual Approved Proposed FY 2009<br />
Operating <strong>Budget</strong> $144,083,778 $127,837,577 $107,679,561 -15.8<br />
FTEs 160.8 365.6 319.2 -12.7<br />
*The FY 2009 Special Purpose Revenue funded FTE total is understated by 2.0 and <strong>the</strong> total FY 2009 FTEs are 367.6.<br />
■ Urban Forestry Administration - maintains <strong>the</strong><br />
District’s street trees, providing our community<br />
with improved air quality, increased ground water<br />
retention that minimizes run<strong>of</strong>f and flooding,<br />
temperature moderation, and aes<strong>the</strong>tics.<br />
The agency’s FY 2010 proposed budget is presented<br />
in <strong>the</strong> following tables:<br />
Department <strong>of</strong> Transportation<br />
F-13
FY 2010 Proposed Gross Funds Operating <strong>Budget</strong>, by Revenue Type<br />
Table KA0-1 contains <strong>the</strong> proposed FY 2010 agency budget compared to <strong>the</strong> FY 2009 approved budget. It also<br />
provides FY 2007 and FY 2008 actual expenditures.<br />
Table KA0-1<br />
(dollars in thousands)<br />
Actual Actual Approved Proposed<br />
Change<br />
from Percent<br />
Appropriated Fund<br />
General Fund<br />
FY 2007 FY 2008 FY 2009 FY 2010 FY 2009 Change*<br />
Local Funds -6 18,450 3,386 43 -3,343 -98.7<br />
Dedicated Taxes 0 0 11,420 13,000 1,580 13.8<br />
Special Purpose Revenue Funds 46,824 117,842 109,261 89,889 -19,372 -17.7<br />
Total for General Fund 46,818 136,292 124,067 102,932 -21,135 -17.0<br />
Federal Resources<br />
Federal Payments 10,703 572 0 0 0 N/A<br />
Federal Grant Funds 2,574 3,394 3,200 4,200 1,000 31.3<br />
Total for Federal Resources 13,277 3,966 3,200 4,200 1,000 31.3<br />
Private Funds<br />
Private Grant Funds 0 758 0 0 0 N/A<br />
Total for Private Funds 0 758 0 0 0 N/A<br />
Intra-District Funds<br />
Intra-District Funds 381 3,068 571 548 -23 -4.1<br />
Total for Intra-District Funds 381 3,068 571 548 -23 -4.1<br />
Gross Funds 60,475 144,084 127,838 107,680 -20,158 -15.8<br />
*Percent Change is based on whole dollars.<br />
Note: If applicable, for a breakdown <strong>of</strong> each Grant (Federal and Private), Special Purpose Revenue type and Intra-District agreement,<br />
please refer to Schedule 80, <strong>Agency</strong> Summary by Revenue Source, in <strong>the</strong> Operating Appendices located on <strong>the</strong> <strong>Office</strong> <strong>of</strong> <strong>the</strong> <strong>Chief</strong><br />
<strong>Financial</strong> <strong>Office</strong>r’s website.<br />
FY 2010 Proposed <strong>Budget</strong> and <strong>Financial</strong> Plan<br />
F-14
FY 2010 Proposed Full-Time Equivalents, by Revenue Type<br />
Table KA0-2 contains <strong>the</strong> proposed FY 2010 FTE level compared to <strong>the</strong> FY 2009 approved FTE level by revenue<br />
type. It also provides FY 2007 and FY 2008 actual data.<br />
Table KA0-2<br />
Change<br />
Actual Actual Approved Proposed from Percent<br />
Appropriated Fund FY 2007 FY 2008 FY 2009 FY 2010 FY 2009 Change<br />
General Fund<br />
Local Funds 0.0 79.4 66.4 0.0 -66.4 -100.0<br />
Special Purpose Revenue Funds 73.9 77.6 296.2 316.2 20.0 6.7<br />
Total for General Fund 73.9 157.0 362.6 316.2 -46.4 -12.8<br />
Intra-District Funds<br />
Intra-District Funds 4.0 3.9 3.0 3.0 0.0 0.0<br />
Total for Intra-District Funds 4.0 3.9 3.0 3.0 0.0 0.0<br />
Total Proposed FTEs 77.9 160.8 365.6 319.2 -46.4 -12.7<br />
Department <strong>of</strong> Transportation<br />
F-15
FY 2010 Proposed Operating <strong>Budget</strong>, by Comptroller Source Group<br />
Table KA0-3 contains <strong>the</strong> proposed FY 2010 budget at <strong>the</strong> Comptroller Source Group (object class) level compared<br />
to <strong>the</strong> FY 2009 approved budget. It also provides FY 2007 and FY 2008 actual expenditures.<br />
Table KA0-3<br />
(dollars in thousands)<br />
Actual Actual Approved Proposed<br />
Change<br />
from Percent<br />
Comptroller Source Group FY 2007 FY 2008 FY 2009 FY 2010 FY 2009 Change*<br />
11 Regular Pay - Cont Full Time 5,647 7,805 15,660 12,356 -3,303 -21.1<br />
12 Regular Pay - O<strong>the</strong>r 147 2,360 928 2,632 1,704 183.6<br />
13 Additional Gross Pay 179 320 166 186 20 11.8<br />
14 Fringe Benefits - Curr Personnel 1,270 2,182 2,937 2,713 -224 -7.6<br />
15 Overtime Pay 3,510 609 1,577 1,035 -542 -34.4<br />
Subtotal Personal Services (PS) 10,753 13,276 21,268 18,922 -2,345 -11.0<br />
20 Supplies and Materials 861 1,043 1,652 1,588 -63 -3.8<br />
30 Energy, Comm. and Bldg Rentals 6,987 10,982 10,085 14,157 4,073 40.4<br />
31 Telephone, Telegraph, Telegram, Etc 1,404 1,702 1,506 1,635 129 8.6<br />
32 Rentals - Land and Structures 2,705 2,674 3,677 1,840 -1,837 -50.0<br />
33 Janitorial Services 232 233 307 574 267 87.0<br />
34 Security Services 1,172 1,287 1,390 781 -609 -43.8<br />
35 Occupancy Fixed Costs 421 425 528 755 227 43.0<br />
40 O<strong>the</strong>r Services and Charges 837 1,798 6,048 6,217 170 2.8<br />
41 Contractual Services - O<strong>the</strong>r 25,150 24,153 16,520 15,787 -733 -4.4<br />
50 Subsidies and Transfers 9,135 85,094 63,441 44,527 -18,914 -29.8<br />
70 Equipment & Equipment Rental 817 1,416 1,417 895 -522 -36.8<br />
Subtotal Nonpersonal Services (NPS) 49,722 130,807 106,570 88,757 -17,813 -16.7<br />
Gross Funds 60,475 144,084 127,838 107,680 -20,158 -15.8<br />
*Percent Change is based on whole dollars.<br />
FY 2010 Proposed <strong>Budget</strong> and <strong>Financial</strong> Plan<br />
F-16
Program Description<br />
The Department <strong>of</strong> Transportation operates through<br />
<strong>the</strong> following 7 programs:<br />
Alternative Transportation - coordinates with <strong>the</strong><br />
Washington Metropolitan Area Transit Authority<br />
(WMATA) in providing transportation services to <strong>the</strong><br />
traveling public and manages <strong>the</strong> transportation services<br />
provided to <strong>the</strong> public by <strong>the</strong> District (i.e., D.C.<br />
Circulator).<br />
This program contains <strong>the</strong> following activity:<br />
■ Alternative Transportation - plans, designs,<br />
builds, coordinates, funds and/or operates transit<br />
policy and services in collaboration with <strong>the</strong><br />
Washington Metropolitan Area Transit Authority<br />
(WMATA) and/or within DDOT; it provides<br />
educational services to <strong>the</strong> traveling public, which<br />
will fur<strong>the</strong>r increase <strong>the</strong> use <strong>of</strong> <strong>the</strong> many efficient,<br />
affordable, and diverse means <strong>of</strong> transportation<br />
services in <strong>the</strong> District <strong>of</strong> Columbia.<br />
Greenspace Management - provides mowing and<br />
tree management services in <strong>the</strong> public rights-<strong>of</strong>-way<br />
and also for <strong>the</strong> District’s Department <strong>of</strong> Parks and<br />
Recreation.<br />
This program contains <strong>the</strong> following 2 activities:<br />
■ Mowing – ensure that <strong>the</strong> transportation right-<strong>of</strong>way<br />
is maintained; and<br />
■ Tree Management – provides tree care services to<br />
District residents and businesses so that <strong>the</strong>y can<br />
enjoy <strong>the</strong> environmental benefits <strong>of</strong> trees with<br />
minimal unsafe conditions.<br />
Infrastructure Development and Management -<br />
provides a high-quality transportation infrastructure<br />
for District residents, businesses, and commuters so<br />
that <strong>the</strong>y can travel safely within <strong>the</strong> District <strong>of</strong><br />
Columbia.<br />
This program contains <strong>the</strong> following 2 activities:<br />
■ Preventive and Routine Roadway Maintenance<br />
– evaluates DDOT’s infrastructure assets, including<br />
roads, alleys, and sidewalks, and programs<br />
<strong>the</strong>m for repair and reconstruction; and is<br />
responsible for implementing solutions that<br />
improve <strong>the</strong> quality <strong>of</strong> stormwater that flows to<br />
area waterways; and<br />
■ Project Development and Management – provides<br />
project development, construction design,<br />
and roadway/bridge construction management<br />
services to design and implement projects aligned<br />
with <strong>the</strong> needs and preferences <strong>of</strong> <strong>the</strong> public.<br />
Planning and Research - provides public space review<br />
and project development services to DDOT Project<br />
Management Teams, citizens, and visitors to <strong>the</strong><br />
District so that DDOT Project Management Teams<br />
can design and implement projects that are aligned<br />
with <strong>the</strong> needs and preferences <strong>of</strong> <strong>the</strong> public, in conjunction<br />
with District public policy.<br />
This program contains <strong>the</strong> following 3 activities:<br />
■ Planning – develops vehicular and non-vehicular<br />
transportation projects and activities, includingplanning<br />
and designing bicycle and pedestrian<br />
transportation facilities, and explores new transportation<br />
projects and initiatives;<br />
■ Policy Development – formulates transportation<br />
policies and policy initiatives for consideration<br />
and adoption by <strong>the</strong> Director, <strong>the</strong> Mayor, and <strong>the</strong><br />
Council; and<br />
■ Public Space Management – is responsible for<br />
managing <strong>the</strong> use <strong>of</strong> public space, ensuring that<br />
work in public space is regulated through an<br />
approved permit, and managing <strong>the</strong> acquisition<br />
and disposition <strong>of</strong> property related to transportation<br />
projects.<br />
Transportation Operations - maintains and operates<br />
an efficient and diverse transportation system for<br />
District residents, commuters and businesses so that<br />
<strong>the</strong>y can travel efficiently within <strong>the</strong> District <strong>of</strong><br />
Columbia.<br />
This program contains <strong>the</strong> following 3 activities:<br />
■ Traffic Flow – provides traffic flow, curbside and<br />
rights-<strong>of</strong>-way management services to District residents,<br />
businesses, visitors, and users <strong>of</strong> <strong>the</strong> right<strong>of</strong>-way<br />
so that <strong>the</strong>y can move efficiently on <strong>the</strong><br />
District’s transportation network and access<br />
homes, workplaces, and desired destinations;<br />
Department <strong>of</strong> Transportation<br />
F-17
■ Transportation Safety – provides traffic regulation<br />
and safety services to pedestrians, cyclists and<br />
motorists in <strong>the</strong> District <strong>of</strong> Columbia so that <strong>the</strong>y<br />
can move about safely in <strong>the</strong> city and avoid personal<br />
injury and property damage; also manages<br />
street and alley lighting and bike and pedestrian<br />
safety regulations; and<br />
■ Snow Operations – provides passable streets and<br />
designated public space for District residents,<br />
commuters, visitors and businesses so that <strong>the</strong>y<br />
can safely use roadways and bridges during and<br />
after a snow event.<br />
<strong>Agency</strong> Management - provides for administrative<br />
support and <strong>the</strong> required tools to achieve operational<br />
and programmatic results. This program is standard<br />
for all agencies using performance-based budgeting.<br />
<strong>Agency</strong> <strong>Financial</strong> Operations - provides comprehensive<br />
and efficient financial management services to,<br />
and on behalf <strong>of</strong>, District agencies so that <strong>the</strong> financial<br />
integrity <strong>of</strong> <strong>the</strong> District <strong>of</strong> Columbia is maintained.<br />
This program is standard for all agencies using<br />
performance-based budgeting.<br />
Program Structure Change<br />
The Department <strong>of</strong> Transportation had no program<br />
structure changes in <strong>the</strong> FY 2010 Proposed <strong>Budget</strong>.<br />
FY 2010 Proposed <strong>Budget</strong> and <strong>Financial</strong> Plan<br />
F-18
FY 2010 Proposed Operating <strong>Budget</strong> and FTEs, by Program and Activity<br />
Table KA0-4 contains <strong>the</strong> proposed FY 2010 budget by program and activity compared to <strong>the</strong> FY 2009 approved budget.<br />
It also provides FY 2008 actual data.<br />
Table KA0-4<br />
(dollars in thousands)<br />
Dollars in Thousands Full-Time Equivalents<br />
Change Change<br />
Actual Approved Proposed from Actual Approved Proposed from<br />
Program/Activity<br />
(1000) <strong>Agency</strong> Management<br />
FY 2008 FY 2009 FY 2010 FY 2009 FY 2008 FY 2009 FY 2010 FY 2009<br />
(1010) Personnel 1,205 1,066 1,005 -61 2.4 10.0 8.0 -2.0<br />
(1015) Training & Employment Development 10 13 13 0 0.0 0.0 0.0 0.0<br />
(1020) Contracting and Procurement 0 589 866 277 0.0 0.0 0.0 0.0<br />
(1030) Property Management 8,613 10,062 7,973 -2,089 3.9 1.0 0.0 -1.0<br />
(1040) Information Technology 1,629 1,919 1,037 -882 0.0 1.0 1.0 0.0<br />
(1050) <strong>Financial</strong> Management 606 636 850 214 0.0 0.0 0.0 0.0<br />
(1055) Risk Management 399 962 812 -150 4.0 7.0 3.0 -4.0<br />
(1060) Legal 2,015 665 84 -581 1.0 0.0 0.0 0.0<br />
(1070) Fleet Management 85 2,818 3,862 1,044 0.0 0.0 0.0 0.0<br />
(1080) Communications 142 124 127 3 1.4 1.0 1.0 0.0<br />
(1085) Customer Service 149 179 10 -169 1.3 2.0 0.0 -2.0<br />
(1090) Performance Management 859 1,673 795 -877 12.1 14.0 7.0 -7.0<br />
Subtotal (1000) <strong>Agency</strong> Management<br />
(100F) <strong>Agency</strong> <strong>Financial</strong> Operations<br />
15,711 20,706 17,434 -3,272 26.1 36.0 20.0 -16.0<br />
(110F) <strong>Budget</strong> Operations 992 1,083 855 -228 7.2 9.0 6.0 -3.0<br />
Subtotal (100F) <strong>Agency</strong> <strong>Financial</strong> Operations<br />
(9960) Yr End Close<br />
992 1,083 855 -228 7.2 9.0 6.0 -3.0<br />
No Activty Assigned -2 0 0 0 0.0 0.0 0.0 0.0<br />
Subtotal (9960) Yr End Close<br />
(AT00) Alternative Transportation<br />
-2 0 0 0 0.0 0.0 0.0 0.0<br />
(ALTP) Alternative Transportation 0 3,287 2,769 -517 0.0 8.0 5.0 -3.0<br />
Subtotal (AT00) Alternative Transportation<br />
(GM00) Greenspace Management<br />
0 3,287 2,769 -517 0.0 8.0 5.0 -3.0<br />
(TMOW) Mowing 0 1,400 1,400 0 0.0 0.0 0.0 0.0<br />
(TRMT) Tree Management 751 1,066 1,066 0 0.0 0.0 0.0 0.0<br />
Subtotal (GM00) Greenspace Management 751<br />
(IN00) Infra-Development and Maint<br />
2,466 2,466 0 0.0 0.0 0.0 0.0<br />
(PROJ) Project Development & Management 1,945 1,979 1,163 -816 3.2 27.0 16.0 -11.0<br />
(PRRM) Preventive & Routine Roadway Maintenance 87,637 62,265 42,531 -19,734 0.0 0.0 5.0 5.0<br />
(SNOW) Snow 5,203 0 0 0 3.2 0.0 0.0 0.0<br />
(TREE) Trees 874 0 0 0 0.0 0.0 0.0 0.0<br />
Subtotal (IN00) Infra-Development and Maint 95,659<br />
(Continued on next page)<br />
64,244 43,693 -20,551 6.4 27.0 21.0 -6.0<br />
Department <strong>of</strong> Transportation<br />
F-19
Table KA0-4 (Continued)<br />
(dollars in thousands)<br />
Dollars in Thousands Full-Time Equivalents<br />
Change Change<br />
Actual Approved Proposed from Actual Approved Proposed from<br />
Program/Activity<br />
(PR00) Planning and Research<br />
FY 2008 FY 2009 FY 2010 FY 2009 FY 2008 FY 2009 FY 2010 FY 2009<br />
(PLNN) Planning 15 60 60 0 0.0 0.0 0.0 0.0<br />
(PODV) Policy Development 0 1,064 787 -277 0.0 6.0 4.0 -2.0<br />
(PUSM) Public Space Management 0 4,804 4,606 -198 0.0 80.0 64.0 -16.0<br />
Subtotal (PR00) Planning and Research<br />
(TR00) Transportation Operations<br />
15 5,929 5,453 -475 0.0 86.0 68.0 -18.0<br />
(ALTT) Alternative Transportation 4,920 5 5 0 6.8 0.0 0.0 0.0<br />
(TFLM) Traffic Flow -13 0 0 0 0.8 0.0 0.0 0.0<br />
(TFLO) Traffic Flow 12,949 15,707 14,297 -1,410 110.0 189.6 197.2 7.6<br />
(TSFY) Transportation Safety 13,101 8,229 14,524 6,295 3.6 10.0 2.0 -8.0<br />
(TSNW) Snow 0 6,184 6,184 0 0.0 0.0 0.0 0.0<br />
Subtotal (TR00) Transportation Operations 30,957 30,124 35,009 4,885 121.2 199.6 199.2 -0.4<br />
Total Proposed Operating <strong>Budget</strong> 144,084 127,838 107,680 -20,158 160.8 365.6 319.2 -46.4<br />
(Change is calculated by whole numbers and numbers may not add up due to rounding)<br />
Note: For more detailed information regarding <strong>the</strong> proposed funding for <strong>the</strong> activities within this agency’s programs, please see Schedule 30-PBB<br />
Program Summary By Activity in <strong>the</strong> FY 2010 Operating Appendices located on <strong>the</strong> <strong>Office</strong> <strong>of</strong> <strong>the</strong> <strong>Chief</strong> <strong>Financial</strong> <strong>Office</strong>r’s website.<br />
FY 2010 Proposed <strong>Budget</strong> and <strong>Financial</strong> Plan<br />
F-20
Major Baseline Adjustments, Cost Savings<br />
and Policy Initiatives<br />
Initial Adjustments: The following adjustments were<br />
made to <strong>the</strong> Dedicated Taxes: a requested increase <strong>of</strong><br />
$12,700,000 to restore funding reduced during <strong>the</strong><br />
FY 2009 rescission.<br />
The following adjustments were made in <strong>the</strong><br />
Special Purpose Revenue funds: an increase <strong>of</strong><br />
$3,229,536 and a reduction <strong>of</strong> 3.8 FTEs in multiple<br />
programs for <strong>the</strong> net effect <strong>of</strong> salary and benefits; an<br />
increase <strong>of</strong> $4,136,120 in multiple programs to support<br />
<strong>the</strong> agency fixed costs; a net increase <strong>of</strong> $108,861<br />
in multiple programs for supplies; an increase <strong>of</strong><br />
$1,914,800 in multiple programs in o<strong>the</strong>r services<br />
and charges; a net increase <strong>of</strong> $148,222 in multiple<br />
programs contracts; an increase <strong>of</strong> $7,631,548 in<br />
Infra-Development and Maintenance program in<br />
subsidies and transfers for <strong>the</strong> additional revenue to be<br />
generated; and a net reduction <strong>of</strong> $467,091 in multiple<br />
programs for equipment.<br />
In Federal Grant funds, <strong>the</strong> following adjustment<br />
was made: an increase <strong>of</strong> $1,000,000 in <strong>the</strong> transportation<br />
operations program for a grant from <strong>the</strong><br />
National Highway Transportation Safety.<br />
Baseline Adjustments: A reduction <strong>of</strong> $1,531,000 in<br />
Dedicated Taxes to correctly reflect <strong>the</strong> planned transfer<br />
<strong>of</strong> parking tax revenue to DDOT. This is <strong>the</strong> net<br />
<strong>of</strong> a $12.2 million reduction approved in FY 2009 for<br />
FY 2010, a $9.6 million increase to provide budget<br />
authority to transfer excess parking tax revenue to <strong>the</strong><br />
Highway Trust Fund, and a $1.1 million increase for<br />
o<strong>the</strong>r purposes. In Special Purpose Revenue funds: an<br />
increase <strong>of</strong> $1,709,765 was made in <strong>the</strong> Infra-<br />
Development and Maintenance program due to a<br />
reduction in fixed costs. This was <strong>of</strong>fset with a net<br />
decrease <strong>of</strong> $1,709,756 in multiple programs.<br />
Cost Savings: The District Department <strong>of</strong><br />
Transportation (DDOT) received revised Special<br />
Purpose Revenue estimates since its FY 2010 baseline<br />
was established. These estimates resulted in a reduction<br />
in its Local Rights-<strong>of</strong>-Way funding which was<br />
not tied to existing projects. No planned capital projects<br />
in <strong>the</strong> Local Rights-<strong>of</strong>-Way are affected by this<br />
reduction. The revision adjusts DDOT’s Special<br />
Purpose Revenue budget to its correct baseline. The<br />
$2,975,000 budget for Traffic Control <strong>Office</strong>rs and<br />
School Crossing Guards will be moved from Local<br />
funds to <strong>the</strong> Unified Fund, and no traffic control <strong>of</strong>ficers<br />
or school crossing guards will be eliminated.<br />
In preparation for <strong>the</strong> FY 2010 budget submission,<br />
DDOT carefully evaluated its current expenditures<br />
and strategically restructured its operations. As<br />
a result, DDOT will eliminate 33.4 FTEs in <strong>the</strong><br />
Unified Fund, many <strong>of</strong> which are currently vacant.<br />
Additional savings in salary and fringe benefits will<br />
also be realized in <strong>the</strong> Unified Fund. Because <strong>the</strong>se<br />
positions are billed to <strong>the</strong> Local Rights-<strong>of</strong>-Way projects,<br />
<strong>the</strong> FTEs associated with <strong>the</strong>se savings do not<br />
appear in <strong>the</strong> operating budget. DDOT will decrease<br />
supplies, materials, and contract expenses, while procurement<br />
and telecom assessments each increased in<br />
FY 2010.<br />
Finally, DDOT will shift $9,589,000 in<br />
Dedicated Parking Taxes to <strong>the</strong> Highway Trust Fund<br />
to fund its federal capital projects as required by<br />
District law (see agency KZ0 in this budget volume).<br />
Policy Initiatives: The FY 2010 budget restores dollars<br />
collected from <strong>the</strong> new parking meter rate<br />
increase to <strong>the</strong> DDOT Unified Fund and lifts <strong>the</strong><br />
moratorium on Saturday enforcement that will generate<br />
additional revenue for DDOT.<br />
Stimulus: The American Recovery and Reinvestment<br />
Act (ARRA) <strong>of</strong> 2009 will provide infrastructure<br />
investment funding to DDOT through <strong>the</strong> U.S.<br />
Department <strong>of</strong> Transportation’s Federal Highway<br />
Administration (FHWA). These funds require no<br />
local match and were distributed to states based upon<br />
a formula determined in <strong>the</strong> ARRA. The District’s<br />
total allocation is $123,507,842.<br />
The ARRA mandates that <strong>the</strong> District obligate<br />
$43,227,745 by July 1, 2009 (120 days from <strong>the</strong> date<br />
<strong>of</strong> allocation by FHWA). If <strong>the</strong> funds are not obligated<br />
by this deadline, <strong>the</strong>y are subject to redistribution<br />
among o<strong>the</strong>r states that have obligated <strong>the</strong>ir mandated<br />
amount. The remaining funds must be obligated<br />
by February 17, 2010, one year from <strong>the</strong> date <strong>the</strong><br />
ARRA became law.<br />
Fur<strong>the</strong>r, <strong>the</strong> ARRA mandates that 3 percent <strong>of</strong> <strong>the</strong><br />
funds must be used for Transportation Enhancement<br />
activities. These projects must help expand transportation<br />
choices and enhance <strong>the</strong> transportation<br />
experience through eligible activities related to surface<br />
transportation, including pedestrian and bicycle infra-<br />
Department <strong>of</strong> Transportation<br />
F-21
structure and safety programs, scenic and historic<br />
highway programs, landscaping and scenic beautification,<br />
historic preservation, and environmental mitigation.<br />
The following projects were selected by <strong>the</strong> Mayor<br />
after a thorough consideration <strong>of</strong> <strong>the</strong>ir ability to comply<br />
with <strong>the</strong> numerous restrictions outlined in <strong>the</strong><br />
ARRA and in consultation with FHWA to ensure eligibility:<br />
■ Great Streets Pennsylvania Avenue, SE - Funds<br />
will be used to construct streetscape improvements<br />
from 27th Street, SE to Sou<strong>the</strong>rn Avenue,<br />
SE. Streetscape improvements include sidewalk,<br />
lighting, roadway, materials, street furniture and<br />
finishes.<br />
■ Downtown Business District Streetscape -<br />
ARRA funds will be put toward upgrading 25<br />
block faces within <strong>the</strong> Downtown Business<br />
Improvement District area to comply with <strong>the</strong><br />
Downtown Streetscape regulations.<br />
■ 17th Street, NW from New Hampshire to<br />
Massachusetts, NW Streetscape - Funds will be<br />
used for pedestrian enhancements in this mixed<br />
use corridor.<br />
■ Construction <strong>of</strong> Missing Sidewalks - ARRA<br />
funding will help complete missing connections<br />
in <strong>the</strong> District’s pedestrian network along federally<br />
eligible streets. The project will enhance safety,<br />
connectivity, and multi-modal mobility.<br />
■ Western Ave NW, from Chestnut Street, NW to<br />
Oregon Avenue, NW - Funds will be used for<br />
work to include <strong>the</strong> removal and reconstruction <strong>of</strong><br />
existing pavement, curbs, gutters, sidewalks and<br />
improve compliance with <strong>the</strong> Americans with<br />
Disability Act (ADA).<br />
■ 18th Street NW, from Florida Avenue, NW to<br />
Massachusetts Avenue, NW - ARRA funds will<br />
be leveraged in this corridor to maximize circulation<br />
and efficiency, and to improve safety and<br />
attractiveness by reconstructing and resurfacing<br />
<strong>the</strong> roadway, sidewalk, curb, gutter and wheelchair<br />
ramps. Additionally, <strong>the</strong> project includes <strong>the</strong><br />
upgrade <strong>of</strong> streetlight and traffic signals, and <strong>the</strong><br />
replacement <strong>of</strong> water mains, trees, and street fixtures.<br />
■ Uninterruptible Power Supply for Critical<br />
Intersections - Funds will be used to create a pilot<br />
project to deploy uninterruptible power supply<br />
FY 2010 Proposed <strong>Budget</strong> and <strong>Financial</strong> Plan<br />
F-22<br />
for critical intersections. This system would automatically<br />
transfer from electrical power to battery<br />
back-up power in <strong>the</strong> event <strong>of</strong> power loss. This<br />
system would eliminate <strong>the</strong> need and costs for<br />
mobilization <strong>of</strong> generators and personnel to manage<br />
intersections during power outages.<br />
■ Replacement <strong>of</strong> <strong>the</strong> New York Avenue Bridge,<br />
NE - This project, supported by ARRA funding,<br />
includes <strong>the</strong> demolition and reconstruction <strong>of</strong> <strong>the</strong><br />
existing New York Avenue Bridge over <strong>the</strong> railroad.<br />
The existing bridge is on a fractured critical<br />
list. A new bridge deck with wider sidewalk,<br />
lighting, and new piers will be installed.<br />
■ SmartBikeDC Expansion - ARRA funds will<br />
expand <strong>the</strong> ground-breaking shared bike program<br />
by adding 40 more stations and hundreds <strong>of</strong> additional<br />
bicycles to <strong>the</strong> system. The project would<br />
enhance mobility options across <strong>the</strong> city and promote<br />
cycling as a viable mode <strong>of</strong> transport for<br />
local errands and o<strong>the</strong>r trips with zero emissions.<br />
■ Reconstruction <strong>of</strong> <strong>the</strong> Eastern Avenue Bridge<br />
over Kenilworth Avenue - Due to <strong>the</strong> current<br />
clearance <strong>of</strong> <strong>the</strong> bridge (14 feet), numerous accidents<br />
occur every year. The reconstruction <strong>of</strong> <strong>the</strong><br />
bridge will increase <strong>the</strong> clearance to 16 feet, significantly<br />
reducing <strong>the</strong> number <strong>of</strong> clearance accidents.<br />
The construction <strong>of</strong> this bridge will involve<br />
innovative construction measures such as precasting<br />
several large elements <strong>of</strong> <strong>the</strong> bridge to decrease<br />
<strong>the</strong> overall schedule as well as decreasing <strong>the</strong> duration<br />
<strong>of</strong> lane closures during <strong>the</strong> construction.<br />
■ Mount Vernon Triangle Streetscape<br />
Improvements along 4th St NW from L St to<br />
New Jersey Avenue NW - The Mount Vernon<br />
Triangle area is experiencing significant development<br />
with proposed projects at several sites. The<br />
large number <strong>of</strong> new residences and businesses<br />
will affect pedestrian, bicycle, and vehicle conditions.<br />
This project will implement transportation<br />
and streetscape improvements along 4th Street,<br />
NW and will be consistent with future improvements<br />
planned for this area.<br />
■ Safe Routes to School Enhancement - ARRA<br />
funds will assist in <strong>the</strong> implementation <strong>of</strong> safety<br />
improvements designed in Safe Routes to Schools<br />
plans. Improvements include signals, signage,<br />
crosswalks, sidewalks, and o<strong>the</strong>r enhancements to<br />
allow safe access for students, parents and residents.
■ Citywide Streetlight Construction - This ARRA<br />
project will remove and replace archaic and energy<br />
inefficient streetlight infrastructure to meet<br />
21st century standards.<br />
■ Federal Aid Pavement Restoration -The project<br />
involves citywide pavement restoration and resurfacing<br />
work for all federal roadways (major arteries)<br />
including repair and replacement work for<br />
sidewalks, curbs and gutters, catch-basins, and<br />
wheelchair-ramps throughout <strong>the</strong> District.<br />
■ Sherman Avenue Streetscape - This project consists<br />
<strong>of</strong> <strong>the</strong> redesign and reconstruction <strong>of</strong><br />
Sherman Avenue including <strong>the</strong> installation <strong>of</strong> a<br />
tree-lined median and o<strong>the</strong>r streetscape improvements.<br />
■ Bike Sharing - This project will greatly increase<br />
<strong>the</strong> number and location <strong>of</strong> bikes available<br />
throughout <strong>the</strong> District<br />
Gap-Closing Initiatives: The District Department <strong>of</strong><br />
Transportation (DDOT) will find cost savings<br />
through efficiencies in contract services, a correction<br />
in <strong>the</strong> budget for streetlight repair to reflect true costs,<br />
and reductions in association fees and dues, travel,<br />
training, and parking meter studies. Savings from<br />
<strong>the</strong>se efficiencies total $1,188,000. In addition,<br />
DDOT will consolidate <strong>of</strong>fices into <strong>the</strong> Reeves<br />
Center in May 2010 saving $364,000.<br />
After careful analysis, <strong>the</strong> school crossing guard<br />
hours have been optimized from four-hour to threehour<br />
days to better align with school start and end<br />
times. Crossing guards will now work from 8:00-<br />
9:30AM and 3:00-4:30PM, saving <strong>the</strong> District<br />
$800,000. The DC public school day starts at<br />
8:45AM and ends at 3:15PM. DDOT will also eliminate<br />
13 FTEs for a savings <strong>of</strong> $1,490,000. These<br />
positions will come from programs which have been<br />
determined to be noncritical to <strong>the</strong> operations <strong>of</strong> <strong>the</strong><br />
agency.<br />
DDOT will reduce current expenditures by<br />
$16,670,749 in FY 2010 to align <strong>the</strong> expenses with<br />
reduced revenue estimates.<br />
FY 2009 Approved <strong>Budget</strong> to FY 2010 Proposed <strong>Budget</strong>, by Revenue Type<br />
Table KA0-5 itemizes <strong>the</strong> changes by revenue type between <strong>the</strong> FY 2009 approved budget and <strong>the</strong> FY 2010 proposed<br />
budget. The four categories <strong>of</strong> changes reflected in this table are: (1) changes to <strong>the</strong> baseline budget (includes<br />
agency request), (2) changes representing cost savings or efficiencies, (3) changes related to policy initiatives, and (4)<br />
changes to specifically address <strong>the</strong> projected revenue shortfall.<br />
Table KA0-5<br />
(dollars in thousands)<br />
Program BUDGET FTE<br />
LOCAL FUND: FY 2009 Approved <strong>Budget</strong> and FTE 3,386 66.4<br />
Initial and Baseline Adjustments<br />
Net effect <strong>of</strong> salary and benefits changes - Effect <strong>of</strong> FTE shift Multiple Programs -1 6.0<br />
Intra-<strong>Agency</strong> Changes - Reduction in contract Trans Operations -78 0.0<br />
Policy Initiatives and Cost Savings<br />
Cost Increase - Shifted from Special Purpose Revenue funds Infra-Development 15 0.0<br />
for certain PS costs<br />
Increase - For “Taxation Without Representation” sign Infra-Development 28 0.0<br />
and Maintenance<br />
Eliminate - Eliminate Local funds that duplicate funds already Alternative -332 0.0<br />
provided by <strong>the</strong> WMATA subsidy Transportation<br />
Shift - Shift costs <strong>of</strong> Traffic Control <strong>Office</strong>rs and School Crossing Guards Transportation -2,975 -72.4<br />
from Local funds to DDOT Unified Fund Operations<br />
LOCAL FUND: FY 2010 Proposed <strong>Budget</strong> and FTE 43 0.0<br />
(Continued on <strong>the</strong> next page)<br />
Department <strong>of</strong> Transportation<br />
F-23
Table KA0-5 (continued)<br />
(dollars in thousands)<br />
FY 2010 Proposed <strong>Budget</strong> and <strong>Financial</strong> Plan<br />
F-24<br />
Program BUDGET FTE<br />
DEDICATED TAXES: FY 2009 Approved <strong>Budget</strong> and FTE 11,420 0.0<br />
Initial and Baseline Adjustments<br />
Intra <strong>Agency</strong> Changes - Increase to restore funding reduced in <strong>the</strong> FY Infra Development 12,700 0.0<br />
2009 rescission and Maint<br />
Baseline Adjustments: Intra-<strong>Agency</strong> changes - A net reduction in Infra Development -1,531 0.0<br />
subsidies from <strong>the</strong> agency request to correctly reflect and Maint<br />
<strong>the</strong> planned transfer <strong>of</strong> parking tax revenue to DDOT<br />
Policy Initiatives and Cost Savings<br />
Transfer Out - As required by District law, transfer a portion <strong>of</strong> parking Infra Development -9,589 0.0<br />
tax revenues to <strong>the</strong> Highway Trust Fund Subsidy to fully fund Federal and Maint<br />
Highway projects<br />
DEDICATED TAXES: FY 2010 Proposed <strong>Budget</strong> and FTE 13,000 0.0<br />
SPECIAL PURPOSE REVENUE FUNDS: FY 2009 Approved <strong>Budget</strong> and FTE 109,261 296.2<br />
Initial and Baseline Adjustments<br />
Net effect <strong>of</strong> salary and benefits changes - Personal services changes Multiple Programs 3,230 -3.8<br />
Net effect <strong>of</strong> fixed cost adjustments - Fixed costs increase Multiple Programs 4,136 0.0<br />
Intra-<strong>Agency</strong> changes - Decrease in supplies <strong>Agency</strong> Management -6 0.0<br />
Intra-<strong>Agency</strong> changes - Decrease in Supplies Infra-Development -55 0.0<br />
and Maintenance<br />
Intra-agency changes - Increase in supplies Transportation 169 0.0<br />
Operations<br />
Intra-<strong>Agency</strong> changes - Increase in o<strong>the</strong>r services <strong>Agency</strong> Management 1,915 0.0<br />
Intra-<strong>Agency</strong> changes - Increase in contracts <strong>Agency</strong> Management 653 0.0<br />
Intra-<strong>Agency</strong> Changes - Decrease in contracts Infra-Development -505 0.0<br />
and Maintenance<br />
Intra-<strong>Agency</strong> Changes - Increase in subsidies and transfers for additional Infra-Development 7,632 0.0<br />
revenues <strong>the</strong> agency anticipates collecting in FY 2010 and Maintenance<br />
Intra-<strong>Agency</strong> Changes - Decrease in equipment <strong>Agency</strong> Management -198 0.0<br />
Intra-<strong>Agency</strong> changes - Decrease in equipment Planning and Research -270 0.0<br />
Baseline Adjustments: Increase in contracts Infra-Development 431 0.0<br />
and Maintenance<br />
Baseline Adjustments: Net effect <strong>of</strong> fixed cost adjustments - to reflect <strong>Agency</strong> Management -1,710 0.0<br />
<strong>the</strong> most current fixed costs projections<br />
Policy Initiatives and Cost Savings<br />
Reduction - To reflect a technical correction to Unified Fund Multiple -5,762 0.0<br />
Increase - PS increase for school crossing guards<br />
(Continued on <strong>the</strong> next page)<br />
Transportation<br />
Operations<br />
664 21.6
Table KA0-5 (continued)<br />
(dollars in thousands)<br />
Program BUDGET FTE<br />
Increase - Increase in contractual agreements for ROWS Infra-Development<br />
and Maintenance<br />
88 0.0<br />
Reduce - Reduce funding for rights-<strong>of</strong>-way projects (local roads paving) Infra-Development -17,500 0.0<br />
as necessary to remain within certified OCFO revenue estimates and Maintenance<br />
Enhance - Partially restore reductions to rights-<strong>of</strong>-way program by<br />
allocating revenues from parking meter rate adjustments and restoring<br />
metered parking on Saturdays<br />
Multiple 15,500 0.0<br />
Transfer Out - Transfer a portion <strong>of</strong> Unified Fund from DDOT to Infra-Development -12,000 0.0<br />
WMATA Subsidy and Maintenance<br />
Reduce - Realign staffing for non-capital programs Multiple Programs -4,617 -57.0<br />
Shift - Transfer FTE authority for crossing guards and traffic control Transportation 2,975 72.4<br />
<strong>of</strong>ficers from Local Funds to DDOT Unified Fund Operations<br />
Reduce - Realignment <strong>of</strong> Local Rights-<strong>of</strong>-Way positions Infra-Development<br />
and Maintenance<br />
-1,453 0.0<br />
Reduce - Reduce material, supply, and contract expenses All Programs -1,482 0.0<br />
Cost Decrease - Shift certain PS costs to Local funds<br />
Cost Increase - Align procurement assessment with revised OCP<br />
Multiple -15 0.0<br />
estimates Multiple 277 0.0<br />
Cost Increase - Align telecom budget with revised OCTO estimates Multiple 121 0.0<br />
Enhance - Purchase and install multi-space meters Infra-Development<br />
and Maintenance<br />
5,948 0.0<br />
Enhance - Provide additional funds for paving in all eight wards Infra-Development<br />
and Maintenance<br />
2,483 0.0<br />
Enhance - Provide additional funds for alley work in <strong>the</strong> local rights-<strong>of</strong>- Infra-Development 500 0.0<br />
way fund and Maintenance<br />
Gap-Closing Initiatives<br />
Cost Decrease - Achieve fixed cost savings from lease expiration <strong>Agency</strong> Management -364 0.0<br />
Cost Decrease - Reduce travel & training by 85 percent <strong>Agency</strong> Management -500 0.0<br />
Cost Decrease - Reduce contractual services Infra-Development<br />
and Maintenance<br />
-88 0.0<br />
Reduce - Realign personnel in Various Activities Multiple -1,490 -13.0<br />
Reduce - Reduce noncompetitive grants Multiple -10 0.0<br />
Cost Decrease - Reduce association fees and dues Planning and Research -100 0.0<br />
Correct - Align funds for streetlight contract to reduce<br />
repair response closer to actual costs<br />
Transportation Operations -400 0.0<br />
Cost Decrease - Reduce studies on parking meters Transportation Operations -100 0.0<br />
Optimize - Reduce school crossing guard hours from 4 to 3 hours to<br />
align with school schedule<br />
Transportation Operations -800 0.0<br />
Reduce - To realign with revenues Infra-Development -16,671<br />
and Maintenance<br />
0.0<br />
SPECIAL PURPOSE REVENUE FUNDS: FY 2010 Proposed <strong>Budget</strong> and FTE<br />
(Continued on next page)<br />
89,889 316.4<br />
Department <strong>of</strong> Transportation<br />
F-25
Table KA0-5 (continued)<br />
(dollars in thousands)<br />
FY 2010 Proposed <strong>Budget</strong> and <strong>Financial</strong> Plan<br />
F-26<br />
Program BUDGET FTE<br />
FEDERAL GRANT FUND: FY 2009 Approved <strong>Budget</strong> and FTE 3,200 0.0<br />
Initial and Baseline Adjustments<br />
Intra-agency Changes - Increase based on <strong>the</strong> National Highway Transportation Operations 1,000 0.0<br />
Transportation Safety grant.<br />
FEDERAL GRANT FUND: FY 2010 Proposed <strong>Budget</strong> and FTE 4,200 0.0<br />
INTRA-DISTRICT FUNDS: FY 2009 Approved <strong>Budget</strong> and FTE 571 3.0<br />
Initial and Baseline Adjustments<br />
Net effect <strong>of</strong> salary and benefits changes - Decrease in regular pay and<br />
fringe<br />
Multiple Programs -8 0.0<br />
Net effect <strong>of</strong> salary and benefits changes - Increase in additional gross pay 8 0.0<br />
Policy Initiatives and Cost Savings<br />
Reduce - Eliminate use <strong>of</strong> School Transit Subsidy funds for supplies<br />
and miscellaneous contracts.<br />
Alternative Transportation -23 0.0<br />
INTRA-DISTRICT FUNDS: FY 2010 Proposed <strong>Budget</strong> and FTE 548 3.0<br />
Gross for KA0 - Department <strong>of</strong> Transportation 107,680 319.4
<strong>Agency</strong> Performance Plan<br />
The agency’s Performance Plan has <strong>the</strong> following<br />
objectives for FY 2010:<br />
Objective 1: Ensure that <strong>the</strong> District’s current transportation<br />
infrastructure and streetscape (roads,<br />
bridges, transit system, signage and sidewalks) are in<br />
good condition and utilized at <strong>the</strong>ir optimal capacity.<br />
<strong>Agency</strong> Performance Measures<br />
Table KA0-6<br />
Objective 2: Increase non-vehicular transportation<br />
modes to meet <strong>the</strong> mobility and economic development<br />
needs <strong>of</strong> <strong>the</strong> District.<br />
Objective 3: Increase <strong>the</strong> safety <strong>of</strong> pedestrians, cyclists<br />
and vehicles throughout <strong>the</strong> District.<br />
FY 2007 FY 2008 FY 2008<br />
Year-End Original Year-End FY 2009 FY 2010 FY 2011<br />
Measure<br />
Objective 1:<br />
Actual* Target Actual Projection Projection Projection<br />
Percent <strong>of</strong> parking meters working N/A 95% 95% 97% 97% 97%<br />
Percent <strong>of</strong> public space permits issued within 45 days 90.5% 90% 95.9% 93% 95% 95%<br />
Percent <strong>of</strong> potholes filled within 48 hours<br />
Number <strong>of</strong> public space violation citations per<br />
99% 95% 97.83% 95% 95% 95%<br />
inspector labor hour<br />
Percent <strong>of</strong> current year projects completed within<br />
.025 .025 .027 .028 .031 .034<br />
10% budget (except for those with scope <strong>of</strong> change)<br />
Percent <strong>of</strong> current year projects completed within<br />
60 days <strong>of</strong> planned end date (except for those with<br />
91.7% 90% 95.83% 92% 94% 94%<br />
scope change) 91.7% 90% 95.83% 92% 94% 94%<br />
Percent <strong>of</strong> blocks in paving plan completed 20% 100% TBD 100% 100% 100%<br />
Cost per mile <strong>of</strong> street repaving (contract) N/A N/A TBD TBD TBD TBD<br />
Percent <strong>of</strong> streets in “Good” or “Excellent” condition* 63% 64% 64% 64% 63% 63%<br />
Number <strong>of</strong> Structurally Deficient Bridges<br />
Percent <strong>of</strong> sidewalks in “Good” or “Excellent”<br />
N/A 20 20 19 18 17<br />
condition* N/A 46% 48% 47% 46% 46%<br />
Percent <strong>of</strong> tree population tended per year<br />
Objective 2:<br />
Percent change in DC transit ridership (WMATA<br />
26.4% 24.5% 30.1% 24.5% 24.5% 24.5%<br />
and Circulator) 1% 1.5% 5.65% 3.5% 2.5% 2.5%<br />
Miles <strong>of</strong> dedicated bike lanes 5 N/A 39 47 50 53<br />
Miles <strong>of</strong> dedicated bike trails<br />
(Continued on next page)<br />
1.5 N/A 55 56 59 62<br />
Department <strong>of</strong> Transportation<br />
F-27
<strong>Agency</strong> Performance Measures (cont)<br />
Table KA0-6<br />
FY 2007 FY 2008 FY 2008<br />
Year-End Original Year-End FY 2009 FY 2010 FY 2011<br />
Measure<br />
Objective 3:**<br />
Percent <strong>of</strong> snow events where cleaning standards<br />
Actual* Target Actual Projection Projection Projection<br />
are met*** N/A 94% 75% 85% 90% 90%<br />
Number <strong>of</strong> traffic crashes a year<br />
Number <strong>of</strong> injuries and fatalities at high hazard<br />
15,100 16,000 16,000 16,000 15,200 15,200<br />
intersections TBD TBD TBD TBD TBD TBD<br />
Number <strong>of</strong> traffic fatalities a year 54 50 TBD 50 49 48<br />
Number <strong>of</strong> pedestrian fatalities and injuries 25 20 TBD 20 19 18<br />
Number <strong>of</strong> bicyclist fatalities and injuries 2 2 TBD 2 2 2<br />
*Streets and sidewalks are evaluated on a 100 point rating scale and <strong>the</strong>n converted to six classifications: failed, very poor, poor, fair, good or excellent – using imaging technology.<br />
**Due to reporting time lags, traffic safety data is changing. Data is reported on a calendar year.<br />
***The snow removal performance targets set a maximum number <strong>of</strong> hours allowed to clean streets based on <strong>the</strong> amount <strong>of</strong> snowfall. The time begins at <strong>the</strong> end <strong>of</strong> <strong>the</strong> snow storm.<br />
FY 2010 Proposed <strong>Budget</strong> and <strong>Financial</strong> Plan<br />
F-28
Department <strong>of</strong> Motor Vehicles<br />
http://dmv.dc.gov<br />
Telephone: 202-737-4404<br />
% Change<br />
FY 2008 FY 2009 FY 2010 from<br />
Description Actual Approved Proposed FY 2009<br />
Operating <strong>Budget</strong> $41,238,747 $45,792,202 $42,953,448 -6.2<br />
FTEs 296.3 294.5 252.0 -14.4<br />
The mission <strong>of</strong> <strong>the</strong> Department <strong>of</strong> Motor Vehicles (DMV) is to<br />
provide excellent customer service and to promote public safety by<br />
ensuring <strong>the</strong> safe operation <strong>of</strong> motor vehicles.<br />
Summary <strong>of</strong> Services<br />
The DMV provides service to approximately<br />
440,000 licensed drivers and identification card holders<br />
(out <strong>of</strong> a population <strong>of</strong> 590,000) and 257,000 registered<br />
vehicles at four service centers. DMV conducts<br />
adjudication services and collects ticket pay-<br />
(KV0)<br />
ments for more than 2.4 million tickets each year and<br />
also conducts over 219,000 annual vehicle inspections.<br />
The agency’s FY 2010 proposed budget is presented<br />
in <strong>the</strong> following tables:<br />
Department <strong>of</strong> Motor Vehicles<br />
F-29
FY 2010 Proposed Gross Funds Operating <strong>Budget</strong>, by Revenue Type<br />
Table KV0-1 contains <strong>the</strong> proposed FY 2010 agency budget compared to <strong>the</strong> FY 2009 approved budget. It also<br />
provides <strong>the</strong> FY 2007 and FY 2008 actual expenditures.<br />
Table KV0-1<br />
(dollars in thousands)<br />
Actual Actual Approved Proposed<br />
Change<br />
from Percent<br />
Appropriated Fund<br />
General Fund<br />
FY 2007 FY 2008 FY 2009 FY 2010 FY 2009 Change*<br />
Local Funds 31,528 28,427 29,628 26,524 -3,104 -10.5<br />
Special Purpose Revenue Funds 6,022 10,241 13,324 13,762 438 3.3<br />
Total for General Fund 37,550 38,668 42,952 40,286 -2,666 -6.2<br />
Federal Resources<br />
Federal Grant Funds 465 0 0 0 0 N/A<br />
Total for Federal Resources 465 0 0 0 0 N/A<br />
Intra-District Funds<br />
Intra-District Funds 1,378 2,571 2,840 2,668 -172 -6.1<br />
Total for Intra-District Funds 1,378 2,571 2,840 2,668 -172 -6.1<br />
Gross Funds 39,393 41,239 45,792 42,953 -2,839 -6.2<br />
*Percent Change is based on whole dollars.<br />
Note: If applicable, for a breakdown <strong>of</strong> each Grant (Federal and Private), Special Purpose Revenue type and Intra-District agreement, please refer to<br />
Schedule 80 <strong>Agency</strong> Summary by Revenue Source in <strong>the</strong> Operating Appendices located on <strong>the</strong> <strong>Office</strong> <strong>of</strong> <strong>the</strong> <strong>Chief</strong> <strong>Financial</strong> <strong>Office</strong>r’s website.<br />
FY 2010 Proposed Full-Time Equivalents, by Revenue Type<br />
Table KV0-2 contains <strong>the</strong> proposed FY 2010 FTE level compared to <strong>the</strong> FY 2009 approved FTE level by revenue<br />
type. It also provides FY 2007 and FY 2008 actual data.<br />
Table KV0-2<br />
Change<br />
Actual Actual Approved Proposed from Percent<br />
Appropriated Fund FY 2007 FY 2008 FY 2009 FY 2010 FY 2009 Change<br />
General Fund<br />
Local Funds 207.3 224.8 226.0 201.0 -25.0 -11.1<br />
Special Purpose Revenue Funds 73.0 71.5 68.5 51.0 -17.5 -25.5<br />
Total for General Fund 280.3 296.3 294.5 252.0 -42.5 -14.4<br />
Total Proposed FTEs 280.3 296.3 294.5 252.0 -42.5 -14.4<br />
FY 2010 Proposed <strong>Budget</strong> and <strong>Financial</strong> Plan<br />
F-30
FY 2010 Proposed Operating <strong>Budget</strong>, by Comptroller Source Group<br />
Table KV0-3 contains <strong>the</strong> proposed FY 2010 budget at <strong>the</strong> Comptroller Source group (object class) level compared<br />
to <strong>the</strong> FY 2009 approved budget. It also provides FY 2007 and FY 2008 actual expenditures.<br />
Table KV0-3<br />
(dollars in thousands)<br />
Actual Actual Approved Proposed<br />
Change<br />
from Percent<br />
Comptroller Source Group FY 2007 FY 2008 FY 2009 FY 2010 FY 2009 Change*<br />
11 Regular Pay - Cont Full Time 12,566 13,223 14,050 12,668 -1,383 -9.8<br />
12 Regular Pay - O<strong>the</strong>r 477 878 857 868 11 1.3<br />
13 Additional Gross Pay 54 385 58 395 337 586.4<br />
14 Fringe Benefits - Curr Personnel 2,800 2,914 2,925 2,689 -236 -8.1<br />
15 Overtime Pay 576 751 400 500 100 25.0<br />
99 Unknown Payroll Postings 0 1 0 0 0 N/A<br />
Subtotal Personal Services (PS) 16,474 18,152 18,290 17,119 -1,170 -6.4<br />
20 Supplies and Materials 577 608 670 468 -202 -30.2<br />
30 Energy, Comm. and Bldg Rentals 573 586 555 760 205 37.0<br />
31 Telephone, Telegraph, Telegram, Etc 803 470 701 676 -24 -3.5<br />
32 Rentals - Land and Structures 513 591 636 438 -198 -31.2<br />
33 Janitorial Services 158 169 275 198 -76 -27.8<br />
34 Security Services 1,946 1,960 1,713 1,577 -136 -7.9<br />
35 Occupancy Fixed Costs 285 462 462 98 -364 -78.7<br />
40 O<strong>the</strong>r Services and Charges 2,434 2,786 3,693 3,575 -118 -3.2<br />
41 Contractual Services - O<strong>the</strong>r 15,476 15,080 18,157 17,450 -707 -3.9<br />
70 Equipment & Equipment Rental 153 375 641 594 -47 -7.4<br />
Subtotal Nonpersonal Services (NPS) 22,919 23,086 27,502 25,834 -1,668 -6.1<br />
Gross Funds 39,393 41,239 45,792 42,953 -2,839 -6.2<br />
*Percent Change is based on whole dollars.<br />
Program Description<br />
The Department <strong>of</strong> Motor Vehicles operates through<br />
<strong>the</strong> following 8 programs:<br />
Adjudication Services - provides ticket processing,<br />
noticing, hearing and hearing support services to residents<br />
and non-residents, in order to render legally<br />
sound decisions on parking and moving violations,<br />
and to ensure proper processing <strong>of</strong> violation and<br />
penalty payments for those infractions.<br />
This program contains <strong>the</strong> following 3 activities:<br />
■ Hearings – provides fair and equitable reviews <strong>of</strong><br />
ticket and permit violations for respondents to<br />
resolve outstanding issues <strong>of</strong> liability;<br />
■ Hearing Support – provides intake, data review,<br />
records management, and administrative support<br />
functions to ensure accurate records and information<br />
to support adjudication hearings; and<br />
■ Ticket Processing – provides and maintains<br />
processed ticket information in DMV’s database,<br />
provides scheduled notification and information<br />
Department <strong>of</strong> Motor Vehicles<br />
F-31
to residents and non-residents <strong>of</strong> <strong>the</strong> District <strong>of</strong><br />
Columbia, and processes and tracks fines, penalties,<br />
and payments for tickets.<br />
Vehicle Services - provides certification and inspection<br />
services to residents, businesses, and government<br />
entities so that <strong>the</strong>y may legally park, drive, and sell<br />
<strong>the</strong>ir vehicles in <strong>the</strong> District <strong>of</strong> Columbia.<br />
This program contains <strong>the</strong> following 4 activities:<br />
■ Inspections – provides emission testing services<br />
for residents and for taxis to facilitate reduced auto<br />
emissions and safer vehicles, and to meet <strong>the</strong><br />
requirements <strong>of</strong> <strong>the</strong> District’s Air Quality<br />
Attainment State Implementation Plan;<br />
■ Registrations – provides legal certification services<br />
and documentation <strong>of</strong> vehicle ownership and<br />
authority to operate;<br />
■ Out-<strong>of</strong>-State Vehicles – provides registration and<br />
support services for out-<strong>of</strong>-state for-hire vehicle<br />
operators (taxis and limousines) to do business in<br />
<strong>the</strong> District <strong>of</strong> Columbia; and<br />
■ International Registration Program – provides<br />
for administration <strong>of</strong> <strong>the</strong> District <strong>of</strong> Columbia’s<br />
participation in <strong>the</strong> U.S. based plan, which allows<br />
for <strong>the</strong> distribution <strong>of</strong> registration fees for commercial<br />
motor vehicles traveling inter-jurisdictionally<br />
through member states and provinces.<br />
Registered fleets include vehicles greater than<br />
26,000 pounds, traveling in more than one jurisdiction.<br />
Driver Services - provides driver certification and<br />
identification services to residents to ensure that <strong>the</strong>y<br />
have proper credentials to reflect identity, residence,<br />
and driving qualifications so that <strong>the</strong>y may legally<br />
operate <strong>the</strong>ir vehicles.<br />
This program contains <strong>the</strong> following 4 activities:<br />
■ Licensing – provides driver certification and<br />
identification services to residents to ensure that<br />
<strong>the</strong>y have <strong>the</strong> proper credentials to reflect identity,<br />
residence, and driving qualifications;<br />
■ Driver Support Services – ensures documentation<br />
and processing <strong>of</strong> <strong>the</strong> various special qualifications<br />
for driver privileges, including medical review,<br />
insurance compliance, and traffic citation<br />
enforcement;<br />
FY 2010 Proposed <strong>Budget</strong> and <strong>Financial</strong> Plan<br />
F-32<br />
■ Driver’s Education – provides information and<br />
outreach to ensure citizens are aware <strong>of</strong> District <strong>of</strong><br />
Columbia requirements for <strong>the</strong> operation <strong>of</strong><br />
motor vehicles, and supports programs that<br />
enhance operator skills and public safety; and<br />
■ Commercial Driver’s License - provides eligibility<br />
testing and driver certification and licensing services<br />
to commercial drivers to ensure that <strong>the</strong>y<br />
have driving qualifications to legally operate commercial<br />
vehicles.<br />
Customer Contact Services - provides advocacy for<br />
customers, promptly responding to <strong>the</strong>ir requests for<br />
information and services in a knowledgeable, accessible<br />
and friendly manner.<br />
This program contains <strong>the</strong> following 2 activities:<br />
■ Communications - provides information about<br />
DMV programs and services so that internal and<br />
external customers can be informed and properly<br />
prepared to interact with DMV staff; and<br />
■ Customer Contact Services – provides support<br />
for customer concerns by providing mail access<br />
and responses to inquiries, requests, and complaints<br />
from citizens.<br />
Service Integrity - ensures <strong>the</strong> security and integrity <strong>of</strong><br />
all DMV transactions, employees, and products.<br />
This program contains <strong>the</strong> following 2 activities:<br />
■ Risk Management – provides reviews and audits<br />
procedures and controls to minimize <strong>the</strong> risk <strong>of</strong><br />
financial loss related to <strong>the</strong> execution <strong>of</strong> departmental<br />
functions; and<br />
■ Integrity – provides reviews and audits procedures<br />
and controls to minimize fraud, abuse, or corruption<br />
and <strong>the</strong> loss <strong>of</strong> public trust related to <strong>the</strong> execution<br />
<strong>of</strong> departmental operations.<br />
Technology Services -provides integrated and reliable<br />
information systems for all DMV<br />
services and complies with District-wide technology<br />
standards and requirements.<br />
This program contains <strong>the</strong> following 3 activities:<br />
■ Information Technology – provides for <strong>the</strong><br />
operation and maintenance <strong>of</strong> <strong>the</strong> automated systems<br />
specific to DMV operations support,<br />
including wait-queuing, digital photos, and hearing<br />
recordings;
■ Driver and Vehicle Systems - provides for <strong>the</strong><br />
operation and maintenance <strong>of</strong> <strong>the</strong> automated systems<br />
providing support for driver and vehicle<br />
databases and service functions; and<br />
■ Ticket Information Systems – provides for <strong>the</strong><br />
operation and maintenance <strong>of</strong> <strong>the</strong> automated systems<br />
providing support for ticket and adjudication<br />
related databases and service functions.<br />
<strong>Agency</strong> Management - provides for administrative<br />
support and <strong>the</strong> required tools to achieve operational<br />
and programmatic results. This program is standard<br />
for all agencies using performance-based budgeting.<br />
FY 2010 Proposed Operating <strong>Budget</strong> and FTEs, by Program and Activity<br />
<strong>Agency</strong> <strong>Financial</strong> Operations – provides comprehensive<br />
and efficient financial management services to<br />
and on behalf <strong>of</strong> District agencies so that <strong>the</strong> financial<br />
integrity <strong>of</strong> <strong>the</strong> District <strong>of</strong> Columbia is maintained.<br />
This program is standard for all agencies using<br />
performance-based budgeting.<br />
Program Structure Change<br />
The Department <strong>of</strong> Motor Vehicles eliminated its<br />
Business Services program for operational efficacy and<br />
distributed its activities to both Driver and Vehicle<br />
Services.<br />
Table KV0-4 contains <strong>the</strong> proposed FY 2010 budget by program and activity compared to <strong>the</strong> FY 2009 approved budget.<br />
It also provides <strong>the</strong> FY 2008 actual data.<br />
Table KV0-4<br />
(dollars in thousands)<br />
Dollars in Thousands Full-Time Equivalents<br />
Change Change<br />
Actual Approved Proposed from Actual Approved Proposed from<br />
Program/Activity<br />
(1000) <strong>Agency</strong> Management<br />
FY 2008 FY 2009 FY 2010 FY 2009 FY 2008 FY 2009 FY 2010 FY 2009<br />
(1010) Personnel 150 382 233 -149 2.0 2.0 3.0 1.0<br />
(1015) Training 212 245 229 -15 2.0 4.0 2.0 -2.0<br />
(1020) Contracting and Procurement 0 91 0 -91 0.0 0.0 0.0 0.0<br />
(1030) Property Management 4,225 4,341 2,393 -1,949 0.0 0.0 0.0 0.0<br />
(1060) Legal Services 0 0 0 0 1.0 0.0 0.0 0.0<br />
(1070) Fleet Management 57 79 47 -33 0.0 0.0 0.0 0.0<br />
(1087) Language Access Act 53 0 80 80 0.0 0.0 0.0 0.0<br />
(1090) Performance Management 2,373 2,381 2,231 -150 9.0 13.0 12.0 -1.0<br />
Subtotal (1000) <strong>Agency</strong> Management<br />
(100F) <strong>Agency</strong> <strong>Financial</strong> Operations<br />
7,070 7,519 5,213 -2,306 14.0 19.0 17.0 -2.0<br />
(110F) <strong>Budget</strong> Operations 218 278 227 -51 4.8 3.0 2.0 -1.0<br />
(120F) Accounting Operations 168 200 224 25 0.0 4.0 4.0 0.0<br />
Subtotal (100F) <strong>Agency</strong> <strong>Financial</strong> Operations<br />
(2000) Adjudication Services Program<br />
386 477 451 -26 4.8 7.0 6.0 -1.0<br />
(2010) Hearings 2,070 2,085 2,181 96 9.8 26.0 20.5 -5.5<br />
(2020) Hearing Support 2,015 2,107 1,847 -260 29.4 35.0 32.5 -2.5<br />
(2030) Ticket Processing 8,444 10,854 10,815 -39 1.0 1.0 1.0 0.0<br />
Subtotal (2000) Adjudication Services Program 12,528 15,045 14,843 -202 40.1 62.0 54.0 -8.0<br />
(Continued on next page)<br />
Department <strong>of</strong> Motor Vehicles<br />
F-33
Table KV0-4 (Continued)<br />
(dollars in thousands)<br />
Dollars in Thousands Full-Time Equivalents<br />
Change Change<br />
Actual Approved Proposed from Actual Approved Proposed from<br />
Program/Activity<br />
(3000) Vehicle Services Program<br />
FY 2008 FY 2009 FY 2010 FY 2009 FY 2008 FY 2009 FY 2010 FY 2009<br />
(3010) Inspections 4,071 5,614 8,283 2,669 69.5 66.0 49.0 -17.0<br />
(3020) Registrations 2,356 1,525 2,261 735 16.7 29.0 35.0 6.0<br />
(3030) Registrations - Out Of State Vehicle 157 379 379 0 0.0 0.0 0.0 0.0<br />
(3040) International Registration Plan 0 0 1,292 1,292 0.0 0.0 2.0 2.0<br />
Subtotal (3000) Vehicle Services Program<br />
(4000) Driver Services Program<br />
6,583 7,518 12,215 4,697 86.2 95.0 86.0 -9.0<br />
(4010) Licensing 2,316 1,878 3,722 1,844 72.8 36.0 68.0 32.0<br />
(4020) Driver Support Services 1,584 1,558 -32 -1,589 27.0 30.0 -1.0 -31.0<br />
(4030) Drivers Education 21 600 1,877 1,277 0.0 0.0 0.0 0.0<br />
(4040) Commercial Driver's Licensce (CDL) 0 0 118 118 0.0 0.0 0.0 0.0<br />
Subtotal (4000) Driver Services Program<br />
(5000) Business Services Program<br />
3,922 4,036 5,686 1,650 99.8 66.0 67.0 1.0<br />
(5010) International Registration Program 2,553 3,340 0 -3,340 1.0 2.5 0.0 -2.5<br />
(5020) Commercial Driver's License 142 118 0 -118 1.0 0.0 0.0 0.0<br />
(5030) Business Services 1,081 861 0 -861 18.5 15.0 0.0 -15.0<br />
Subtotal (5000) Business Services Program 3,776<br />
(6000) Customer Contact Services Program<br />
4,318 0 -4,318 20.5 17.5 0.0 -17.5<br />
(1080) Communications 297 376 266 -110 2.0 3.0 2.0 -1.0<br />
(1085) Customer Service -28 0 0 0 0.9 0.0 0.0 0.0<br />
(6010) Customer Contact Services Program 990 0 0 0 14.5 0.0 0.0 0.0<br />
Subtotal (6000) Customer Contact Services Program 1,258<br />
(7000) Service Integrity Program<br />
376 266 -110 17.4 3.0 2.0 -1.0<br />
(1055) Risk Management 20 10 20 10 0.0 0.0 0.0 0.0<br />
(7010) Integrity 296 301 285 -17 2.0 2.0 5.0 3.0<br />
Subtotal (7000) Service Integrity Program<br />
(8000) Technology Services Program<br />
316 311 305 -7 2.0 2.0 5.0 3.0<br />
(1040) Information Technology 4,394 4,906 3,563 -1,343 10.0 22.0 14.0 -8.0<br />
(8010) Driver and Vehicle Systems 983 1,259 383 -876 1.0 1.0 1.0 0.0<br />
(8020) Ticket Information Systems 22 27 30 3 0.4 0.0 0.0 0.0<br />
Subtotal (8000) Technology Services Program 5,399 6,192 3,976 -2,216 11.4 23.0 15.0 -8.0<br />
Total Proposed Operating <strong>Budget</strong> 41,239 45,792 42,953 -2,839 296.3 294.5 252.0 -42.5<br />
(Change is calculated by whole numbers and numbers may not add up due to rounding)<br />
Note: For more detailed information regarding <strong>the</strong> proposed funding for <strong>the</strong> activities within this agency’s programs, please see Schedule 30-PBB Program<br />
Summary By Activity in <strong>the</strong> FY 2010 Operating Appendices located on <strong>the</strong> <strong>Office</strong> <strong>of</strong> <strong>the</strong> <strong>Chief</strong> <strong>Financial</strong> <strong>Office</strong>r’s website.<br />
FY 2010 Proposed <strong>Budget</strong> and <strong>Financial</strong> Plan<br />
F-34
Major Baseline Adjustments, Cost Savings<br />
and Policy Initiatives<br />
Initial Adjustments: In Local Funds <strong>the</strong>re was a net<br />
increase <strong>of</strong> $979,000 in personal services across multiple<br />
programs, due to increase in regular pay and overtime.<br />
In special purpose revenue, <strong>the</strong>re was a decrease<br />
<strong>of</strong> $1,034,000 in supplies and o<strong>the</strong>r services and<br />
charges due to reduction in available fund balance.<br />
Cost Savings: By FY 2010, DMV will transition to<br />
an online and mail-in only system for vehicle registration<br />
renewals, similar to <strong>the</strong> system currently used in<br />
Rhode Island. This transition, along with increasing<br />
customer use <strong>of</strong> DMV’s online and mail-in services,<br />
eliminates <strong>the</strong> need for <strong>the</strong> Brentwood Service Center,<br />
<strong>the</strong> smallest <strong>of</strong> DMV’s four service centers. Closing<br />
<strong>the</strong> Brentwood Service Center saves $1,648,000 and<br />
eliminates 12 FTE positions. DMV projects that it<br />
will be able to serve customers at o<strong>the</strong>r service stations,<br />
without an increase in customer wait-time.<br />
Similarly, DMV inspection station operations are<br />
optimized by <strong>the</strong> elimination <strong>of</strong> unnecessary inspection<br />
testing. The FY 2010 <strong>Budget</strong> Support Act proposes<br />
<strong>the</strong> exemption <strong>of</strong> safety inspections for passenger<br />
vehicles, motorcycles, motorized bicycles, historic<br />
vehicles, and Washington Metropolitan Area Transit<br />
Authority (WMATA) buses. (WMATA buses have<br />
<strong>the</strong>ir own preventative maintenance program, which<br />
addresses safety.) Only 14 states mandate safety<br />
inspections for all vehicles, and <strong>the</strong>re is a lack <strong>of</strong> evidence<br />
that mandated safety inspections for <strong>the</strong>se types<br />
<strong>of</strong> vehicles has a positive effect on traffic safety. This<br />
exemption will reduce <strong>the</strong> number <strong>of</strong> trips residents<br />
must take to DMV locations, and it will shorten waittimes<br />
for all customers, because <strong>the</strong> inspection process<br />
will be faster. As a result, DMV can downsize its<br />
inspection operation by 8 FTEs and save $400,000.<br />
DMV will realign its staffing in its o<strong>the</strong>r programs,<br />
including <strong>the</strong> reduction <strong>of</strong> temporary staffing,<br />
for a savings <strong>of</strong> $634,000. Fur<strong>the</strong>r savings come from<br />
a reduction in <strong>the</strong> travel budget <strong>of</strong> $65,000 and <strong>the</strong><br />
elimination <strong>of</strong> an audit contract <strong>of</strong> $25,000, which<br />
will now be performed in-house. In accordance with<br />
a subtitle <strong>of</strong> <strong>the</strong> proposed <strong>Budget</strong> Support Act, DMV<br />
will shift $1,464,000 in expenses from Local Funds to<br />
<strong>the</strong> Driver Education Program Fund. This action<br />
maximizes <strong>the</strong> use <strong>of</strong> existing resources. O<strong>the</strong>r assessments<br />
for telecom, fleet, and occupancy have been<br />
reduced in accordance with <strong>the</strong>ir revised estimates.<br />
The <strong>Office</strong> <strong>of</strong> Contracting and Procurement assessment<br />
has increased in FY 2010. A reduction <strong>of</strong><br />
$626,961 was made to Special Purpose Revenue to<br />
align <strong>the</strong> proposed budget with expected revenue in<br />
<strong>the</strong> Driver’s Education Fund.<br />
Protected Programs: Customer service is a high priority.<br />
Careful consideration was given to customer<br />
wait-time when evaluating DMV’s budget, and <strong>the</strong><br />
customer experience will not be adversely affected by<br />
<strong>the</strong> proposed reductions—ra<strong>the</strong>r, it is likely to<br />
improve.<br />
Policy Initiatives: Funds have been added to DMV’s<br />
budget to support <strong>the</strong> Destiny system operations,<br />
staff, and mainframe server costs. Through an Intra-<br />
District agreement, DMV will send funds to OCTO<br />
to cover <strong>the</strong>se operations. However, <strong>the</strong> costs are budgeted<br />
in DMV to accurately reflect <strong>the</strong> costs <strong>of</strong> DMV<br />
functions. Funding for <strong>the</strong>se operations was omitted<br />
from <strong>the</strong> approved FY 2009 budget; this omission is<br />
not sustainable in <strong>the</strong> long run. In addition, $43,000<br />
and 0.5 FTE was added to DMV’s budget to fund a<br />
second traffic adjudication appeals board member.<br />
Gap-Closing Initiatives: In accordance with a subtitle<br />
<strong>of</strong> <strong>the</strong> proposed <strong>Budget</strong> Support Act, <strong>the</strong><br />
Department <strong>of</strong> Motor Vehicles (DMV) will shift<br />
$600,000 in local fund expenditures to <strong>the</strong> Driver’s<br />
Education Fund. In additional $825,000 in local<br />
fund expenditures will also be shifted to special purpose<br />
funds due to a reductions in costs in <strong>the</strong> special<br />
a purpose revenue fund budget.<br />
Part <strong>of</strong> <strong>the</strong>se reductions comes from increasing <strong>the</strong><br />
efficiency <strong>of</strong> <strong>the</strong> DMV’s Inspection Station operations.<br />
DMV’s shift schedule overlaps, which was necessary<br />
to accommodate a 12-hour-a-day schedule. In<br />
FY 2010, DMV will operate 5 days a week for a total<br />
<strong>of</strong> 40 hours weekly, including Saturdays. DMV will<br />
eliminate hours in which <strong>the</strong> stations are historically<br />
not used to full capacity. Residents may schedule an<br />
appointment for vehicle inspection on DMV’s website.<br />
Savings total $581,000 and 10 FTEs.<br />
In addition to <strong>the</strong> 10 FTEs eliminated through<br />
<strong>the</strong> reduction in inspection station operating hours,<br />
DMV will eliminate 2 additional FTEs and freeze 5<br />
vacant positions for a total savings <strong>of</strong> $393,000.<br />
Department <strong>of</strong> Motor Vehicles<br />
F-35
FY 2009 Approved <strong>Budget</strong> to FY 2010 Proposed <strong>Budget</strong>, by Revenue Type<br />
Table KV0-5 itemizes <strong>the</strong> changes by revenue type between <strong>the</strong> FY 2009 approved budget and <strong>the</strong> FY 2010 proposed<br />
budget. The four categories <strong>of</strong> changes reflected in this table are: (1) changes to <strong>the</strong> baseline budget (includes<br />
agency request), (2) changes representing cost savings or efficiencies, (3) changes related to policy initiatives, and<br />
(4) changes to specifically address <strong>the</strong> projected revenue shortfall.<br />
Table KV0-5<br />
(dollars in thousands)<br />
PROGRAM BUDGET FTE<br />
LOCAL FUND: FY 2009 Approved <strong>Budget</strong> and FTE<br />
Initial and Baseline Adjustments<br />
29,628 226.0<br />
Net effect <strong>of</strong> fixed cost adjustments - Changes in energy, telephone,<br />
security and occupancy<br />
<strong>Agency</strong> Management -424 0.0<br />
Baseline Adjustments: Net effect <strong>of</strong> fixed cost adjustments -<br />
Change in telephones<br />
<strong>Agency</strong> Management 197 0.0<br />
Net effect <strong>of</strong> salary and benefits changes - Changes in personal services <strong>Agency</strong> Management 531 -1.0<br />
Net effect <strong>of</strong> salary and benefits changes - Changes in personal services Adjudication Services Program 79 -4.5<br />
Net effect <strong>of</strong> salary and benefits changes - Changes in personal services Vehicle Services Program 986 10.0<br />
Net effect <strong>of</strong> salary and benefits changes - Changes in personal services Driver Services Program 913 9.0<br />
Net effect <strong>of</strong> salary and benefits changes - Changes in personal services Business Services Program -778 -15.0<br />
Net effect <strong>of</strong> salary and benefits changes - Changes in personal services Customer Contact Services Program 10 0.0<br />
Net effect <strong>of</strong> salary and benefits changes - Changes in personal services Service Integrity Program 196 3.0<br />
Net effect <strong>of</strong> salary and benefits changes - Changes in personal services Technology Services Program -958 -7.0<br />
Intra-<strong>Agency</strong> Changes - Changes in supplies, o<strong>the</strong>r services and<br />
charges, contractual services, and equipment<br />
<strong>Agency</strong> Management 192 0.0<br />
Intra-<strong>Agency</strong> Changes - Changes in o<strong>the</strong>r services and charges and<br />
contractual services<br />
Adjudication Services Program -66 0.0<br />
Intra-<strong>Agency</strong> Changes - Changes in o<strong>the</strong>r services and charges Vehicle Services Program 293 0.0<br />
Intra-<strong>Agency</strong> Changes - Changes in o<strong>the</strong>r services and charges and<br />
contractual services<br />
Driver Services Program 73 0.0<br />
Intra-<strong>Agency</strong> Changes - Changes in o<strong>the</strong>r services and charges Business Services Program -83 0.0<br />
Intra-<strong>Agency</strong> Changes - Changes in o<strong>the</strong>r services and charges and<br />
contractual services<br />
Customer Contact Services Program -5 0.0<br />
Intra-<strong>Agency</strong> Changes - Changes in supplies, o<strong>the</strong>r services and charges<br />
and contractual services<br />
Service Integrity Program -48 0.0<br />
Intra-<strong>Agency</strong> Changes - Changes in personal services <strong>Agency</strong> <strong>Financial</strong> Operations 51 0.0<br />
Intra-<strong>Agency</strong> Changes - Decrease in supplies, o<strong>the</strong>r services and<br />
charges, contractual services, and equipment<br />
Technology Services Program -963 0.0<br />
Policy Initiatives and Cost Savings<br />
Enhancement - To fund 0.5 FTE for a second traffic adjudication<br />
appeals board<br />
Adjudication Services Program 43 0.5<br />
Shift - Shift Local Fund expenses to Vehicle Inspection Special Purpose Fund <strong>Agency</strong> Management -400 0.0<br />
Cost Increase - Fund costs <strong>of</strong> mainframe computer supporting DMV IT systems Technology Services Program 1,157 0.0<br />
Cost Increase - Provide funds to manage Apex technology Technology Services Program 1,600 0.0<br />
Shift - Shift camera system and DCHR assessment expenses from Local<br />
Funds to O-Type (Drivers Education Fund)<br />
Multiple -939 0.0<br />
Shift - Shift license tag expenses from Local Funds to O-Type (Driver’s<br />
Education Fund)<br />
Vehicle Services Program -525 0.0<br />
Reduce - Realign administrative and adjudication positions Multiple -484 -6.0<br />
Reduce - Close Brentwood Service Center and provide services at three<br />
existing locations and internet<br />
Multiple -1,648 -12.0<br />
Reduce - Reduce temporary contract staff<br />
(Continued on next page)<br />
<strong>Agency</strong> Management -150 0.0<br />
FY 2010 Proposed <strong>Budget</strong> and <strong>Financial</strong> Plan<br />
F-36
Table KV0-5 (Continued)<br />
(dollars in thousands)<br />
PROGRAM BUDGET FTE<br />
Policy Initiatives and Cost Savings<br />
Reduce - Reduce out-<strong>of</strong>-city travel <strong>Agency</strong> Management -65 0.0<br />
Cost Decrease - Eliminate audit service contract and bring function Service Integrity Program -25 0.0<br />
in-house<br />
Cost Decrease - Align fleet budget with revised DPW estimates <strong>Agency</strong> Management -8 0.0<br />
Cost Decrease - Align telecom budget with revised OCTO estimates <strong>Agency</strong> Management -31 0.0<br />
Cost Decrease - Align occupancy budget with revised OPM estimates <strong>Agency</strong> Management -9 0.0<br />
Gap-Closing Initiatives<br />
Shift Cost - Transfer Destiny Operations expenditures to special purpose revenue fund Technology Services Program -1,425 0.0<br />
Cost Reduction - Eliminate 2 positions Multiple -63 -2.0<br />
Cost Reduction - Freeze 5 vacant positions Multiple -330 0.0<br />
LOCAL FUND: FY 2010 Proposed <strong>Budget</strong> and FTE 26,524 201.0<br />
SPECIAL PURPOSE REVENUE FUNDS: FY 2009 Approved <strong>Budget</strong> and FTE 13,324 68.5<br />
Initial and Baseline Adjustments<br />
Net effect <strong>of</strong> fixed cost adjustments - Changes in energy, telephone, rent, <strong>Agency</strong> Management 130 0.0<br />
janitorial services and security<br />
Baseline Adjustments: Net effect <strong>of</strong> fixed cost adjustments - Change in security Vehicle Services Program 1,470 0.0<br />
Baseline Adjustments: Net effect <strong>of</strong> fixed cost adjustments - Change in security <strong>Agency</strong> Management -1,325 0.0<br />
Net effect <strong>of</strong> salary and benefits changes - Changes in personal services Vehicle Services Program 789 3.0<br />
Net effect <strong>of</strong> salary and benefits changes - Change in Special Purpose Business Services Program -689 -2.5<br />
Revenue Certification affecting personal services<br />
Intra-<strong>Agency</strong> Changes - Change in Special Purpose Revenue Certification Driver Services Program 43 0.0<br />
affecting contractual services<br />
Intra-<strong>Agency</strong> Changes - Reallocation to fund increase in fixed costs <strong>Agency</strong> Management -91 0.0<br />
Intra-<strong>Agency</strong> Changes - Change in Special Purpose Revenue Certification Vehicle Services Program 1,735 0.0<br />
affecting supplies, o<strong>the</strong>r services and charges, contractual services and<br />
equipment<br />
Intra-<strong>Agency</strong> Changes - Change in Special Purpose Revenue Certification Business Services Program -2,769 0.0<br />
affecting supplies, o<strong>the</strong>r services and charges, and contractual services<br />
Baseline Adjustments: Intra-<strong>Agency</strong> Changes - Changes in o<strong>the</strong>r services and Vehicle Services Program -144 0.0<br />
charges and contractual services<br />
Policy Initiatives and Cost Savings<br />
Cost Reduction - Reduced cost to match expected revenue Driver Services Program -627 0.0<br />
Shift - Shift Local Fund Expenses to Vehicle Inspection Special Purpose Revenue Fund <strong>Agency</strong> Management 400 0.0<br />
Shift - Shift camera system and DCHR assessment expenses from Local Multiple 939 0.0<br />
Funds to O-Type (Driver’s Education Fund)<br />
Shift - Shift license tag expenses from Local Funds to O-Type (Driver’s Vehicle Services Program 525 0.0<br />
Education Fund)<br />
Reduce - Reduce inspection station staff through elimination in safety Multiple -400 -8.0<br />
inspections. Shift local fund expenses over to inspection station special<br />
purpose revenue fund<br />
Cost Increase - Align procurement assessment budget with revised OCP Vehicle Services Program 22 0.0<br />
estimates<br />
Gap-Closing Initiatives<br />
Optimize Cost - Reduce fixed costs by converting to 8 hr/5 day a week<br />
Inspection Station operation<br />
(Continued on next page)<br />
<strong>Agency</strong> Management -117 0.0<br />
Department <strong>of</strong> Motor Vehicles<br />
F-37
Table KV0-5 (Continued)<br />
(dollars in thousands)<br />
PROGRAM BUDGET FTE<br />
SPECIAL PURPOSE REVENUE FUNDS: FY 2010 Proposed <strong>Budget</strong> and FTE 13,324 68.5<br />
Gap-Closing Initiatives<br />
Cost Reduction - Reduce registration sticker cost through renegotiated price Vehicle Services Program -100 0.0<br />
Cost reduction - Reduce inspection station parts purchase Vehicle Services Program -170 0.0<br />
Optimize Cost - Consolidate cashier functions with DMV employees and Vehicle Services Program -144 0.0<br />
eliminate OCFO cashier functions at Adjudication Services<br />
Optimize Cost - Enhance efficiency in shift schedules at inspection stations by Vehicle Services Program -464 -10.0<br />
converting to an 8 hr/ 5 day a week operation<br />
Cost Shift - Shift Destiny Operation expenditures from local fund Technology Services Program 1,425 0.0<br />
SPECIAL PURPOSE REVENUE FUNDS: FY 2010 Proposed <strong>Budget</strong> and FTE 13,762 51.0<br />
INTRA-DISTRICT FUNDS: FY 2009 Approved <strong>Budget</strong> and FTE 2,840 0.0<br />
Initial and Baseline Adjustments<br />
Intra-<strong>Agency</strong> Changes - Reduction in contractual services Adjudication Services Program -26 0.0<br />
Baseline Adjustments: - Decrease due to Intra-District between Board <strong>of</strong> Vehicle Services Program -146 0.0<br />
Elections and Ethics and DMV is under negotiation<br />
INTRA-DISTRICT FUNDS: FY 2010 Proposed <strong>Budget</strong> and FTE 2,668 0.0<br />
Gross for KV0 - Department <strong>of</strong> Motor Vehicles 42,953 252.0<br />
FY 2010 Proposed <strong>Budget</strong> and <strong>Financial</strong> Plan<br />
F-38
<strong>Agency</strong> Performance Plan<br />
The agency’s Performance Plan has <strong>the</strong> following<br />
objectives for FY 2010:<br />
Objective 1: Making it easier, faster, and friendlier to<br />
do business with <strong>the</strong> DMV.<br />
<strong>Agency</strong> Performance Measures<br />
Table KV0-6<br />
Objective 2: Ensuring a skilled and diverse workforce<br />
for quality customer service.<br />
Objective 3: Ensuring <strong>the</strong> integrity, security and safety<br />
<strong>of</strong> DMV’s registration, licensing, and adjudication<br />
services and facilities.<br />
FY 2007 FY 2008 FY 2008<br />
Year-End Original Year-End FY 2009 FY 2010 FY 2011<br />
Measure<br />
Objective 1<br />
Actual* Target Actual Projection Projection Projection<br />
1<br />
:<br />
Percent <strong>of</strong> mail adjudication hearings completed within<br />
150 days <strong>of</strong> request 2 Median number <strong>of</strong> days from mail adjudication<br />
N/A 80% 74% 82% 84% 86%<br />
request to hearing completion3 Percent <strong>of</strong> service center customers whose wait times<br />
N/A N/A 168 150 130 110<br />
are 40 minutes or less 4<br />
Average service center customer wait time in<br />
N/A 80% 83% 85% 87% 89%<br />
3 & 5<br />
minutes N/A N/A 25 20 25 30<br />
Percent increase in online services use3 N/A N/A N/A 5% 5% 5%<br />
Number <strong>of</strong> vehicle inspections per staff hour 3<br />
Objective 2:<br />
Percent <strong>of</strong> customers rating DMV service, as performed<br />
N/A N/A 3.43 3.40 3.20 3.0<br />
by <strong>the</strong> workforce, as satisfactory or better<br />
Percent <strong>of</strong> employees completing customer service<br />
N/A 80% 86% 88% 90% 92%<br />
training 3<br />
N/A N/A N/A 98% 99% 99%<br />
1 FY 2008 performance indicators related to DMV Call Center no longer applicable since Call Center transferred to <strong>Office</strong> <strong>of</strong> Unified Communication on Jan 2, 2008.<br />
2 FY 2007 data not available.<br />
3 New performance indicator in FY 2009.<br />
4 FY 2007 data not available; Wait time based on Q-matic ticket issued at information desk.<br />
5<br />
Wait time based on Q-matic ticket issued at information desk. FY 2010 and FY 2011 projections based on additional requirements for secure credentials.<br />
Department <strong>of</strong> Motor Vehicles<br />
F-39
District Department <strong>of</strong> <strong>the</strong><br />
Environment<br />
www.ddoe.dc.gov<br />
Telephone: 202-535-2600<br />
(KG0)<br />
% Change<br />
FY 2008 FY 2009 FY 2010 from<br />
Description Actual Approved Proposed FY 2009<br />
Operating <strong>Budget</strong> $59,912,118 $78,146,705 $111,804,389 43.1<br />
FTEs 209.3 301.0 315.5 4.8<br />
The mission <strong>of</strong> <strong>the</strong> District Department <strong>of</strong> <strong>the</strong> Environment<br />
(DDOE) is to protect and enhance human health and <strong>the</strong> environment<br />
through preservation, conservation, restoration, education,<br />
enforcement, and energy efficient practices to improve <strong>the</strong> quality <strong>of</strong><br />
life in <strong>the</strong> District <strong>of</strong> Columbia and build a world-class green city.<br />
Summary <strong>of</strong> Services<br />
The District Department <strong>of</strong> <strong>the</strong> Environment is <strong>the</strong><br />
lead agency for creating, promulgating and enforcing<br />
District <strong>of</strong> Columbia environmental standards. The<br />
Department also provides certification, review and<br />
technical analysis services to both <strong>the</strong> District govern-<br />
ment and District residents through inspections,<br />
training programs, and permitting processes.<br />
The agency’s FY 2010 proposed budget is presented<br />
in <strong>the</strong> following tables:<br />
District Department <strong>of</strong> <strong>the</strong> Environment<br />
F-41
FY 2010 Proposed Gross Funds Operating <strong>Budget</strong>, by Revenue Type<br />
Table KG0-1 contains <strong>the</strong> proposed FY 2010 agency budget compared to <strong>the</strong> FY 2009 approved budget. It also<br />
provides FY 2007 and FY 2008 actual expenditures.<br />
Table KG0-1<br />
(dollars in thousands)<br />
Actual Actual Approved Proposed<br />
Change<br />
from Percent<br />
Appropriated Fund<br />
General Fund<br />
FY 2007 FY 2008 FY 2009 FY 2010 FY 2009 Change*<br />
Local Funds 11,421 20,716 22,863 17,343 -5,520 -24.1<br />
Special Purpose Revenue Funds 15,571 16,750 34,869 40,205 5,335 15.3<br />
Total for General Fund 26,993 37,466 57,732 57,548 -184 -0.3<br />
Federal Resources<br />
Federal Payments 0 670 0 0 0 N/A<br />
Federal Grant Fund 13,911 16,805 19,732 51,762 32,030 162.3<br />
Total for Federal Resources 13,911 17,475 19,732 51,762 32,030 162.3<br />
Private Funds<br />
Private Grant Fund 0 454 300 130 -170 -56.7<br />
Total for Private Funds 0 454 300 130 -170 -56.7<br />
Intra-District Funds<br />
Intra-District Funds 3,271 4,517 382 2,364 1,982 518.6<br />
Total for Intra-District Funds 3,271 4,517 382 2,364 1,982 518.6<br />
Gross Funds 44,175 59,912 78,147 111,804 33,658 43.1<br />
*Percent Change is based on whole dollars.<br />
Note: If applicable, for a breakdown <strong>of</strong> each Grant (Federal and Private), Special Purpose Revenue type and Intra-District agreement,<br />
please refer to Schedule 80, <strong>Agency</strong> Summary by Revenue Source, in <strong>the</strong> Operating Appendices located on <strong>the</strong> <strong>Office</strong> <strong>of</strong> <strong>the</strong> <strong>Chief</strong><br />
<strong>Financial</strong> <strong>Office</strong>r’s website.<br />
FY 2010 Proposed <strong>Budget</strong> and <strong>Financial</strong> Plan<br />
F-42
FY 2010 Proposed Full-Time Equivalents, by Revenue Type<br />
Table KG0-2 contains <strong>the</strong> proposed FY 2010 FTE level compared to <strong>the</strong> FY 2009 approved FTE level by revenue<br />
type. It also provides FY 2007 and FY 2008 actual data.<br />
Table KG0-2<br />
Change<br />
Actual Actual Approved Proposed from Percent<br />
Appropriated Fund FY 2007 FY 2008 FY 2009 FY 2010 FY 2009 Change<br />
General Fund<br />
Local Funds 114.9 83.4 118.5 85.5 -33.0 -27.9<br />
Special Purpose Revenue Funds 17.5 30.8 66.6 100.9 34.4 51.6<br />
Total for General Fund 132.4 114.1 185.1 186.4 1.4 0.7<br />
Federal Resources<br />
Federal Grant Fund 54.0 92.8 111.9 126.1 14.2 12.7<br />
Total for Federal Resources 54.0 92.8 111.9 126.1 14.2 12.7<br />
Intra-District Funds<br />
Intra-District Funds 5.8 2.4 4.0 3.0 -1.0 -25.0<br />
Total for Intra-District Funds 5.8 2.4 4.0 3.0 -1.0 -25.0<br />
Total Proposed FTEs 192.2 209.3 301.0 315.5 14.5 4.8<br />
District Department <strong>of</strong> <strong>the</strong> Environment<br />
F-43
FY 2010 Proposed Operating <strong>Budget</strong>, by Comptroller Source Group<br />
Table KG0-3 contains <strong>the</strong> proposed FY 2010 budget at <strong>the</strong> Comptroller Source Group (object class) level compared<br />
to <strong>the</strong> FY 2009 approved budget. It also provides FY 2007 and FY 2008 actual expenditures.<br />
Table KG0-3<br />
(dollars in thousands)<br />
Actual Actual Approved Proposed<br />
Change<br />
from Percent<br />
Comptroller Source Group FY 2007 FY 2008 FY 2009 FY 2010 FY 2009 Change*<br />
11 Regular Pay - Cont Full Time 7,642 7,257 3,759 3,073 -686 -18.2<br />
12 Regular Pay - O<strong>the</strong>r 5,264 6,544 14,612 17,569 2,957 20.2<br />
13 Additional Gross Pay 217 525 61 90 29 47.4<br />
14 Fringe Benefits - Curr Personnel 2,179 2,056 3,500 3,862 362 10.3<br />
15 Overtime Pay 41 7 38 29 -10 -25.0<br />
99 Unknown Payroll Postings 0 2 0 0 0 N/A<br />
Subtotal Personal Services (PS) 15,344 16,390 21,971 24,624 2,653 12.1<br />
20 Supplies and Materials 290 433 703 719 16 2.3<br />
30 Energy, Comm. and Bldg Rentals 40 67 116 136 20 17.5<br />
31 Telephone, Telegraph, Telegram, Etc 104 195 264 243 -21 -7.8<br />
32 Rentals - Land and Structures 1,090 0 1,805 1,215 -590 -32.7<br />
33 Janitorial Services 8 17 22 68 47 213.1<br />
34 Security Services 194 60 55 32 -23 -41.8<br />
35 Occupancy Fixed Costs 0 39 65 100 36 55.5<br />
40 O<strong>the</strong>r Services and Charges 1,721 2,182 9,304 15,021 5,717 61.4<br />
41 Contractual Services - O<strong>the</strong>r 4,635 5,543 4,911 10,986 6,075 123.7<br />
50 Subsidies and Transfers 19,714 33,826 37,919 57,615 19,696 51.9<br />
70 Equipment & Equipment Rental 1,033 1,160 1,013 1,045 32 3.2<br />
Subtotal Nonpersonal Services (NPS) 28,830 43,522 56,176 87,180 31,005 55.2<br />
Gross Funds 44,175 59,912 78,147 111,804 33,658 43.1<br />
*Percent Change is based on whole dollars.<br />
FY 2010 Proposed <strong>Budget</strong> and <strong>Financial</strong> Plan<br />
F-44
Program Description<br />
The Department <strong>of</strong> Environment operates through<br />
<strong>the</strong> following 7 programs:<br />
Natural Resources - provides services to conserve,<br />
protect, and improve <strong>the</strong> soil, water, and living<br />
resources <strong>of</strong> <strong>the</strong> District <strong>of</strong> Columbia, and to protect<br />
its aquatic resources from pollution and degradation.<br />
This program contains <strong>the</strong> following 4 activities:<br />
■ Fisheries and Wildlife - supports and implements<br />
programs for urban fish and wildlife conservation,<br />
protection, recreation, and sustainability;<br />
■ Water Quality - restores and protects <strong>the</strong> surface<br />
and ground waters <strong>of</strong> <strong>the</strong> District by setting and<br />
enforcing water quality standards and monitoring,<br />
assessing, protecting and restoring water quality<br />
and aquatic resources;<br />
■ Watershed Protection - conserves <strong>the</strong> soil and<br />
water resources <strong>of</strong> <strong>the</strong> District and protects its<br />
watersheds from nonpoint source pollution; and<br />
■ Storm Water Administration - reduces storm<br />
water run<strong>of</strong>f pollution through <strong>the</strong> implementation<br />
<strong>of</strong> activities that go beyond <strong>the</strong> activities<br />
required in <strong>the</strong> District’s National Pollution<br />
Discharge Elimination System (NPDES) Permit.<br />
Administers <strong>the</strong> Municipal Separate Storm Sewer<br />
System (MS4) NPDES permit issued to <strong>the</strong><br />
District by <strong>the</strong> United States Environmental<br />
Protection <strong>Agency</strong>.<br />
Environmental Protection - provides for <strong>the</strong> protection<br />
<strong>of</strong> public health and <strong>the</strong> environment by regulating<br />
and ensuring compliance with applicable laws<br />
related to air quality, hazardous waste, underground<br />
storage <strong>of</strong> petroleum products, lead, and pesticides.<br />
This program contains <strong>the</strong> following 3 activities:<br />
■ Toxic Substances - protects human health and <strong>the</strong><br />
environment from <strong>the</strong> potential hazards associated<br />
with toxic substances (pesticides), hazardous<br />
waste, underground storage <strong>of</strong> petroleum products,<br />
and <strong>the</strong> redevelopment <strong>of</strong> environmentally<br />
contaminated properties;<br />
■ Air Quality - protects human health from <strong>the</strong><br />
effects <strong>of</strong> air pollution in <strong>the</strong> District, and ensures<br />
<strong>the</strong> implementation <strong>of</strong>, and compliance with, <strong>the</strong><br />
District’s air quality program; and<br />
■ Lead Management - ensures that <strong>the</strong> District’s<br />
housing does not pose a health threat to its occupants<br />
by identifying existing environmental and<br />
safety hazards and arranging for <strong>the</strong>ir mitigation.<br />
Policy and Planning - develops environmental policies<br />
and coordinates environmental policy implementation<br />
in conjunction with o<strong>the</strong>r programs and<br />
District agencies.<br />
This program contains <strong>the</strong> following 4 activities:<br />
■ Regulatory and Legislative Affairs - administers<br />
and reports on energy efficiency and conservation<br />
programs, and monitors and participates in hearings<br />
and cases before <strong>the</strong> D.C. Public Service<br />
Commission;<br />
■ Environmental Coordination - coordinates<br />
unique environmental programs within <strong>the</strong><br />
agency and with o<strong>the</strong>r District agencies whose<br />
activities directly or indirectly affect <strong>the</strong> quality <strong>of</strong><br />
<strong>the</strong> environment;<br />
■ Planning and Emergency Response - prepares for<br />
emergency response situations and maintains routine<br />
screening requirements for emergency<br />
response staff; and<br />
■ Sustainability and Green Buildings - plans<br />
agency and District-wide sustainability efforts;<br />
facilitates program implementation for green<br />
building, climate change, and o<strong>the</strong>r urban sustainability<br />
initiatives; develops policy for new and<br />
emerging environmental sites and conducts press<br />
outreach on behalf <strong>of</strong> <strong>the</strong> agency.<br />
Education and Enforcement - informs <strong>the</strong> public<br />
about DDOE’s work and ensures that residents and<br />
businesses in <strong>the</strong> District follow all local environmental<br />
laws and regulations.<br />
This program contains <strong>the</strong> following 2 activities:<br />
■ Education - coordinates educational outreach<br />
activities, including promotional events, educational<br />
workshops, and seminars, to engage <strong>the</strong><br />
regulated community, businesses, and residents <strong>of</strong><br />
<strong>the</strong> District on DDOE programs and services.<br />
Develops printed materials and <strong>the</strong> green.dc.gov<br />
website and conducts press outreach on behalf <strong>of</strong><br />
<strong>the</strong> agency; and<br />
■ Enforcement and Environmental Justice -<br />
District Department <strong>of</strong> <strong>the</strong> Environment<br />
F-45
ensures that <strong>the</strong> DDOE maintains a highly<br />
trained inspection and enforcement staff among<br />
all programs to implement various environmental<br />
mandates. Ensures <strong>the</strong> fair treatment and meaningful<br />
involvement <strong>of</strong> people <strong>of</strong> all races, cultures<br />
and incomes in environmental laws, regulations<br />
and policies.<br />
Energy - provides energy-related policy, planning and<br />
direct services to residents, businesses, institutions,<br />
government and visitors; and coordinates and facilitates<br />
<strong>the</strong> overall effort <strong>of</strong> <strong>the</strong> District Government to<br />
achieve energy efficiency and <strong>the</strong> use <strong>of</strong> renewable<br />
energy.<br />
This program contains <strong>the</strong> following 3 activities:<br />
■ Energy Conservation - provides conservation<br />
and energy efficiency services to residential, commercial,<br />
institutional, governmental, and transportation<br />
sectors;<br />
■ Energy Assistance - assists low-income residents<br />
with <strong>the</strong>ir energy and utility bills, including emergency<br />
and non-emergency financial assistance,<br />
utility discounts, and bill forgiveness; and<br />
■ Energy Assistance Benefit Payments - identifies<br />
funding available for Low-Income Home Energy<br />
Assistance Program (LIHEAP) payments.<br />
<strong>Agency</strong> Management - provides administrative support<br />
and <strong>the</strong> required tools to achieve operational and<br />
programmatic results. This program is standard for all<br />
agencies using performance-based budgeting.<br />
<strong>Agency</strong> <strong>Financial</strong> Operations - provides comprehensive<br />
and efficient financial management services to,<br />
and on behalf <strong>of</strong>, District agencies so that <strong>the</strong> financial<br />
integrity <strong>of</strong> <strong>the</strong> District <strong>of</strong> Columbia is maintained.<br />
This program is standard for all agencies using<br />
performance-based budgeting.<br />
FY 2010 Proposed <strong>Budget</strong> and <strong>Financial</strong> Plan<br />
F-46<br />
Program Structure Change<br />
The Department <strong>of</strong> Environment created a new<br />
activity in <strong>the</strong> Energy program called Energy<br />
Assistance benefit payments.
FY 2010 Proposed Operating <strong>Budget</strong> and FTEs, by Program and Activity<br />
Table KG0-4 contains <strong>the</strong> proposed FY 2010 budget by program and activity compared to <strong>the</strong> FY 2009 approved budget.<br />
It also provides FY 2008 actual data.<br />
Table KG0-4<br />
(dollars in thousands)<br />
Dollars in Thousands Full-Time Equivalents<br />
Change Change<br />
Actual Approved Proposed from Actual Approved Proposed from<br />
Program/Activity<br />
(1000) <strong>Agency</strong> Management Program<br />
FY 2008 FY 2009 FY 2010 FY 2009 FY 2008 FY 2009 FY 2010 FY 2009<br />
(1010) Personnel 75 631 550 -80 4.0 4.0 4.0 0.0<br />
(1015) Training & Employment Development 0 93 18 -75 0.0 1.0 0.0 -1.0<br />
(1020) Contracting And Procurement 0 357 254 -103 0.0 1.0 1.0 0.0<br />
(1030) Property Management 368 2,553 2,041 -512 3.0 3.0 3.0 0.0<br />
(1040) Information Technology 521 719 656 -62 3.0 4.0 4.0 0.0<br />
(1055) Risk Management 108 139 160 21 0.0 1.0 1.0 0.0<br />
(1060) Legal 174 751 1,236 486 0.0 0.0 0.0 0.0<br />
(1070) Fleet Management 325 89 97 8 0.0 0.0 0.0 0.0<br />
(1080) Communications 468 0 0 0 3.0 0.0 0.0 0.0<br />
(1085) Customer Service 0 133 100 -33 0.0 2.0 1.0 -1.0<br />
(1090) Performance Management 2,142 957 984 27 11.3 7.0 8.0 1.0<br />
Subtotal (1000) <strong>Agency</strong> Management Program 4,182 6,422 6,097 -325 24.3 23.0 22.0 -1.0<br />
(100F) <strong>Agency</strong> <strong>Financial</strong> Operations<br />
(110F) <strong>Budget</strong> Operations 136 368 657 289 4.0 4.0 6.0 2.0<br />
(120F) Accounting Operations 59 361 504 143 3.0 5.0 4.0 -1.0<br />
Subtotal (100F) <strong>Agency</strong> <strong>Financial</strong> Operations 195 729 1,161 432 7.0 9.0 10.0 1.0<br />
(2000) Natural Resources<br />
(2010) Air Quality 2,967 0 0 0 24.2 0.0 0.0 0.0<br />
(2020) Water Resources 12,576 0 0 0 55.3 0.0 0.0 0.0<br />
(2030) Fisheries And Wildlife 1,527 1,929 2,189 260 15.5 21.3 20.8 -0.5<br />
(2040) Trees 1 0 0 0 0.0 0.0 0.0 0.0<br />
(2050) Conservation 6,357 0 0 0 10.0 0.0 0.0 0.0<br />
(2060) Energy Assistance 21,074 0 0 0 22.5 0.0 0.0 0.0<br />
(2070) Water Quality 0 2,879 3,954 1,074 0.0 28.8 33.8 5.0<br />
(2080) Watershed Protection 0 9,646 10,436 790 0.0 42.3 45.3 3.0<br />
(2090) Storm Water Administration 0 6,728 6,055 -673 0.0 9.8 10.8 1.0<br />
Subtotal (2000) Natural Resources<br />
(Continued on next page)<br />
44,502 21,181 22,633 1,452 127.5 102.0 110.5 8.5<br />
District Department <strong>of</strong> <strong>the</strong> Environment<br />
F-47
Table KG0-4 (Continued)<br />
(dollars in thousands)<br />
Dollars in Thousands Full-Time Equivalents<br />
Change Change<br />
Actual Approved Proposed from Actual Approved Proposed from<br />
Program/Activity<br />
(3000) Environmental Protection<br />
FY 2008 FY 2009 FY 2010 FY 2009 FY 2008 FY 2009 FY 2010 FY 2009<br />
(3010) Hazardous Materials 2,896 0 0 0 24.0 0.0 0.0 0.0<br />
(3020) Land Devellopment And Remediation 1,390 0 0 0 10.0 0.0 0.0 0.0<br />
(3030) Recycling and Waste Management 13 0 0 0 0.0 0.0 0.0 0.0<br />
(3040) Sustainable Solutions 317 0 0 0 1.5 0.0 0.0 0.0<br />
(3050) Toxic Substances 0 4,623 5,035 412 0.0 42.0 36.0 -6.0<br />
(3080) Air Quality 0 2,606 4,420 1,814 0.0 31.0 32.0 1.0<br />
(3090) Lead Management 0 1,928 2,495 567 0.0 22.0 22.0 0.0<br />
Subtotal (3000) Environmental Protection 4,615 9,156 11,950 2,793 35.5 95.0 90.0 -5.0<br />
(4000) Policy and Planning<br />
(4010) Regulatory and Legislative Affairs 5,314 1,486 13,440 11,954 5.7 8.0 13.0 5.0<br />
(4020) Environmental Coordination 48 192 305 113 0.0 2.0 4.0 2.0<br />
(4030) Planning and Emergency Response 166 207 272 65 3.8 1.0 1.0 0.0<br />
(4040) Sustainability and Green Buildings 0 507 562 55 0.0 4.0 4.0 0.0<br />
Subtotal (4000) Policy and Planning 5,528 2,392 14,579 12,187 9.5 15.0 22.0 7.0<br />
(5000) Education and Enforcement<br />
(5010) Education 459 3,268 12,530 9,261 3.5 10.0 14.0 4.0<br />
(5020) Enforcement & Environmental Justice 430 540 559 19 2.0 4.0 5.0 1.0<br />
Subtotal (5000) Education And Enforcement 889 3,808 13,089 9,281 5.5 14.0 19.0 5.0<br />
(6000) Energy Program<br />
(6010) Energy Conservation<br />
(6010) Energy Conservation 0 15,400 21,394 5,994 0.0 18.0 13.0 -5.0<br />
(6020) Energy Assistance 0 19,058 4,190 -14,868 0.0 25.0 29.0 4.0<br />
(6030) Energy Assistance Benefit Payments 0 0 16,712 16,712 0.0 0.0 0.0 0.0<br />
Subtotal (6000) Energy Program 0 34,458 42,296 7,838 0.0 43.0 42.0 -1.0<br />
(9000) Payroll Clearing<br />
(9999) Payroll Clearing -Pgm Lvl 2 0 0 0 0 0.0 0.0 0.0 0.0<br />
Subtotal (9000) Payroll Clearing 0 0 0 0 0.0 0.0 0.0 0.0<br />
Total Proposed Operating <strong>Budget</strong> 59,912 78,147 111,804 33,658 209.3 301.0 315.5 14.5<br />
Note: For more detailed information regarding <strong>the</strong> proposed funding for <strong>the</strong> activities within this agency’s programs, please see Schedule 30-PBB<br />
Program Summary By Activity in <strong>the</strong> FY 2010 Operating Appendices located on <strong>the</strong> <strong>Office</strong> <strong>of</strong> <strong>the</strong> <strong>Chief</strong> <strong>Financial</strong> <strong>Office</strong>r’s website.<br />
FY 2010 Proposed <strong>Budget</strong> and <strong>Financial</strong> Plan<br />
F-48
Major Baseline Adjustments, Cost Savings<br />
and Policy Initiatives<br />
Initial Adjustments: The following adjustment was<br />
made in Local funds: a net reduction <strong>of</strong> $1,804,691<br />
in <strong>the</strong> <strong>Agency</strong> Management program for fixed costs<br />
rent due to <strong>the</strong> proposed relocation <strong>of</strong> <strong>the</strong> agency. In<br />
Special Purpose Revenue funds, <strong>the</strong> agency increased<br />
$1,764,000 in salaries and benefits due to an increase<br />
<strong>of</strong> 21.3 FTEs; reduced $2,874,588 in o<strong>the</strong>r services<br />
and charges and increased $7,928,005 in subsidies<br />
and transfers, all in multiple programs. In Federal<br />
Grant funds, <strong>the</strong> agency increased $10,132,465 in<br />
multiple programs for subsidies and transfers due to<br />
increased energy assistance payments for FY 2010.<br />
Cost Savings: The proposed FY 2010 budget for<br />
DDOE includes <strong>the</strong> reduction <strong>of</strong> ten positions in various<br />
programs from <strong>the</strong> Local <strong>Budget</strong>, for a total savings<br />
<strong>of</strong> $820,846. DDOE will continue to fund<br />
<strong>the</strong>se positions in FY 2010 by shifting <strong>the</strong> funding to<br />
EPA Federal Grants and to <strong>the</strong> following Special<br />
Purpose Funds: Pesticide Product Registration Fund;<br />
Storm Water Permit Review Fund; Energy Assistance<br />
Trust Fund; Soil Erosion/Sediment Control Fund;<br />
Fishing License Fund; and Lead Based Certification<br />
Fees Fund. The proposed budget reduces discretionary<br />
purchases for DDOE by $1,042,378, including<br />
reductions to supplies, equipment, advertising,<br />
training, IT acquisitions, contractual services, and<br />
out-<strong>of</strong>-city travel. The proposed budget also reduces<br />
Federal Grant Funds for <strong>the</strong> Low Income Home<br />
Energy Assistance Program (LIHEAP) by<br />
$6,248,702, to align with a reduction in funding in<br />
pending federal appropriations. Additionally,<br />
$2,984,000 for a project to reduce stormwater run<strong>of</strong>f<br />
in <strong>the</strong> Right <strong>of</strong> Way will shift from <strong>the</strong> Storm Water<br />
Permit Review Fund to PAYGO capital. The agency’s<br />
electricity, fleet, occupancy, telecom, and janitorial<br />
budget and procurement assessment also were<br />
reduced in accordance with revised estimates.<br />
Protected Programs: The District is committed to<br />
protecting and restoring <strong>the</strong> environment and<br />
improving <strong>the</strong> quality <strong>of</strong> life for its residents. This<br />
proposed budget provides DDOE with <strong>the</strong> resources<br />
needed to carry out <strong>the</strong> agency’s environmental services<br />
and programs. In FY 2010, DDOE will be<br />
well-equipped to help <strong>the</strong> District become <strong>the</strong> model<br />
<strong>of</strong> environmental protection and sustainable environmental<br />
practices.<br />
Policy Initiatives: The proposed budget shifts<br />
$2,000,000 in funding for LIHEAP from Local<br />
Funds to intra-district funding from <strong>the</strong> District<br />
Department <strong>of</strong> Human Services, in <strong>the</strong> form <strong>of</strong><br />
TANF (Temporary Assistance to Needy Families)<br />
funds. This initiative allocates resources to help lowincome<br />
District residents pay <strong>the</strong>ir utility bills, while<br />
reducing <strong>the</strong> projected budget gap. For <strong>the</strong> purposes<br />
<strong>of</strong> <strong>the</strong> multiyear financial plan, <strong>the</strong> proposed budget<br />
designates $7,106,617 for LIHEAP subsidies as “onetime”<br />
Local funding. The proposed budget also<br />
enhances <strong>the</strong> agency’s budget by $1,214,840 to pay<br />
for <strong>the</strong> revised rent estimate; $200,000 <strong>of</strong> <strong>the</strong> rent cost<br />
will be charged to <strong>the</strong> EPA Federal Grant as Indirect<br />
Cost Recovery.<br />
Stimulus: The American Recovery and Reinvestment<br />
Act <strong>of</strong> 2009 (ARRA) provides federal funding for a<br />
variety <strong>of</strong> energy and natural resource programs.<br />
DDOE will manage <strong>the</strong> District’s proposal process<br />
for <strong>the</strong> ARRA stimulus programs outlined below, in<br />
collaboration with o<strong>the</strong>r District agencies.<br />
■ Wea<strong>the</strong>rization Assistance Program: $4,150,000<br />
has been added to DDOE’s federal grants budget<br />
in FY 2010 to install energy efficiency improvements<br />
in <strong>the</strong> homes <strong>of</strong> low-income families. The<br />
total estimated District grant allocation is<br />
$8,300,000 split between FY 2009 and FY 2010;<br />
■ State Energy Program: $9,950,000 has been<br />
added to DDOE’s federal grants budget in FY<br />
2010. The purpose <strong>of</strong> <strong>the</strong>se funds is to promote<br />
energy conservation and reduce <strong>the</strong> rate <strong>of</strong> energy<br />
demand. The total estimated District grant allocation<br />
is $22,022,000 split between FY 2009 and<br />
FY 2010;<br />
■ Diesel Emissions Reduction Act: $1,100,000 has<br />
been added to DDOE’s federal grants budget in<br />
FY 2010 for diesel emissions reduction projects.<br />
The total estimated District funding for FY 2009<br />
and FY 2010 is $1,700,000; and<br />
■ Energy Efficiency and Conservation Block<br />
Grants - Competitive: $9,593,500 has been<br />
added to DDOE’s federal grant budget in FY<br />
2010 for projects to reduce fossil fuel emissions<br />
and total energy use and improve energy<br />
efficiency.<br />
District Department <strong>of</strong> <strong>the</strong> Environment<br />
F-49
DDOE also anticipates receiving funding from <strong>the</strong><br />
following ARRA programs, although <strong>the</strong>y are in <strong>the</strong><br />
proposed budget because in many cases <strong>the</strong> exact<br />
amounts are still to be determined.<br />
■ Leaking Underground Storage Tanks: Funding<br />
in <strong>the</strong> amount <strong>of</strong> $600,000,000 will be allocated<br />
for cleanup activities <strong>of</strong> abandoned, leaking<br />
underground petroleum storage tanks and sites;<br />
■ Clean Water State Revolving Fund: The District<br />
grant allocation is $19,500,000 split between FY<br />
2009 and FY 2010. District projects will be<br />
drawn from <strong>the</strong> project priority lists for <strong>the</strong><br />
District’s Construction Grants Program including<br />
at least 20% for green infrastructure projects; and<br />
■ Drinking Water State Revolving Fund: The<br />
District grant allocation is $19,700,000 split<br />
between FY 2009 and FY 2010. District projects<br />
will be drawn from <strong>the</strong> project priority lists for <strong>the</strong><br />
District’s Construction Grants Program.<br />
Gap-Closing Initiatives: DDOE will realign 7.9<br />
positions, utilizing EPA, CDC and ARRA stimulus<br />
grant funds along with Special Purpose Revenue<br />
funds; this multi-programmatic realignment will generate<br />
a savings <strong>of</strong> $493,686 in Local funds. With <strong>the</strong><br />
increased support <strong>of</strong> <strong>the</strong> Department <strong>of</strong> Employment<br />
Services, additional efficiencies will be attained in <strong>the</strong><br />
Green Summer Program, yielding a savings <strong>of</strong><br />
$173,397.<br />
By transferring $600,000 <strong>of</strong> Local funds from <strong>the</strong><br />
Low Income Home Energy program to <strong>the</strong> Energy<br />
Assistance Trust fund, DDOE can achieve service levels<br />
comparable to that <strong>of</strong> previous years. Additionally<br />
by shifting discretionary spending in supplies, contractual<br />
services, o<strong>the</strong>r services and charges and equipment<br />
to <strong>the</strong> Storm Water fees fund and <strong>the</strong> Energy<br />
Assistance Trust fund, a Local funds savings <strong>of</strong><br />
$659,935 can be realized.<br />
FY 2010 Proposed <strong>Budget</strong> and <strong>Financial</strong> Plan<br />
F-50
FY 2009 Approved <strong>Budget</strong> to FY 2010 Proposed <strong>Budget</strong><br />
Table KG0-5 itemizes <strong>the</strong> changes by revenue type between <strong>the</strong> FY 2009 approved budget and <strong>the</strong> FY 2010 proposed<br />
budget. The four categories <strong>of</strong> changes reflected in this table are: (1) changes to <strong>the</strong> baseline budget (includes<br />
agency request), (2) changes representing cost savings or efficiencies, (3) changes related to policy initiatives, and (4)<br />
changes to specifically address <strong>the</strong> projected revenue shortfall.<br />
Table KG0-5<br />
(dollars in thousands)<br />
Program BUDGET FTE<br />
LOCAL FUND: FY 2009 Approved <strong>Budget</strong> and FTE 22,863 118.5<br />
Initial and Baseline Adjustments<br />
Net effect <strong>of</strong> salary and benefits changes - Reduction in PS costs Multiple Programs -460 -13.8<br />
Intra-<strong>Agency</strong> Changes - Reduction in supplies Multiple Programs -22 0.0<br />
Net effect <strong>of</strong> fixed cost adjustments - Increase in energy cost AMP 223 0.0<br />
Net effect <strong>of</strong> fixed cost adjustments - Decrease in telecom cost AMP -46 0.0<br />
Net effect <strong>of</strong> fixed cost adjustments - Decrease in rentals cost AMP -1,805 0.0<br />
Net effect <strong>of</strong> fixed cost adjustments - Increase in janitorial services cost AMP 243 0.0<br />
Net effect <strong>of</strong> fixed cost adjustments - Increase in security services cost AMP 443 0.0<br />
Net effect <strong>of</strong> fixed cost adjustments - Increase in occupancy cost AMP 221 0.0<br />
Intra-<strong>Agency</strong> Changes - Increase in o<strong>the</strong>r services and charges cost Multiple Programs 486 0.0<br />
Intra-<strong>Agency</strong> Changes - Increase in contractual services cost Multiple Programs 165 0.0<br />
Intra-<strong>Agency</strong> Changes - Increase in subsidies and transfers Multiple Programs 622 0.0<br />
Intra-<strong>Agency</strong> Changes - Decrease in equipment and equipment rentals Multiple Programs -72 0.0<br />
Baseline Adjustments: Net effect <strong>of</strong> salary and benefits changes - Multiple Programs 0 -1.3<br />
Reduction in FTEs<br />
Baseline Adjustments: Net effect <strong>of</strong> fixed cost adjustments - Increase in AMP 28 0.0<br />
telecom services cost<br />
Baseline Adjustments: Net effect <strong>of</strong> fixed cost adjustments - Decrease in AMP -498 0.0<br />
security services cost<br />
Baseline Adjustments: Intra-<strong>Agency</strong> Changes - increase in o<strong>the</strong>r services Multiple Programs 346 0.0<br />
and charges<br />
Baseline Adjustments: Intra-<strong>Agency</strong> Changes - decrease in contractual Multiple Programs -150 0.0<br />
services<br />
Baseline Adjustments: Increase in equipment and equipment rentals Multiple Programs 2 0.0<br />
to <strong>of</strong>fset fixed cost reduction<br />
Policy Initiatives and Cost Savings<br />
Cost Increase - Align rental budget with revised OPM estimates AMP 1,015 0.0<br />
Cost Decrease - Align electricity budget with revised OPM estimates AMP -250 0.0<br />
Cost Decrease - Align fleet budget with revised DPW estimates AMP -26 0.0<br />
Cost Decrease - Align janitorial budget with revised OPM estimates AMP -234 0.0<br />
Cost Decrease - Align occupancy budget with revised OPM estimates AMP -179 0.0<br />
Cost Decrease - Align procurement assessment budget with revised AMP -52 0.0<br />
OCP estimates<br />
Cost Decrease - Align telecom budget with revised OCTO estimates AMP -30 0.0<br />
Shift - a portion <strong>of</strong> <strong>the</strong> Low Income Home Energy Assistance Energy Program -2,000 0.0<br />
Program from Local Funds to TANF Funds<br />
Reduce - discretionary purchases, including supplies, travel, Multiple -1,042 0.0<br />
equipment, advertising, training, IT acquisitions, contractual services,<br />
Shift - positions in various programs from Local Funds to various Multiple -821 -10.0<br />
special purpose revenues and Federal grants<br />
(Continued on <strong>the</strong> next page)<br />
District Department <strong>of</strong> <strong>the</strong> Environment<br />
F-51
Table KG0-5 (continued)<br />
(dollars in thousands)<br />
FY 2010 Proposed <strong>Budget</strong> and <strong>Financial</strong> Plan<br />
F-52<br />
Program BUDGET FTE<br />
Gap-Closing Initiatives<br />
Reduce Cost - Identify efficiencies within Green Summer Program Policy And Planning -173 0.0<br />
Cost Decrease - Transfer a portion <strong>of</strong> <strong>the</strong> Low Income Home Energy Energy Program -600 0.0<br />
Assistance Program from Local Funds to <strong>the</strong> Energy Assistance Trust<br />
Cost Decrease - Reduce discretionary purchases, including supplies, Multiple Programs -660 0.0<br />
contractual services, o<strong>the</strong>r services and charges, and equipment<br />
Shift Cost - Transfer positions from Local funds to special purpose Multiple Programs -494 -7.9<br />
revenues and federal grants<br />
LOCAL FUND: FY 2010 Proposed <strong>Budget</strong> and FTE 17,343 85.5<br />
SPECIAL PURPOSE REVENUE FUNDS: FY 2009 Approved <strong>Budget</strong> and FTE<br />
Initial and Baseline Adjustments<br />
34,869 66.6<br />
Net effect <strong>of</strong> salary and benefits changes - Salaries and Benefits Multiple 1,764 21.3<br />
Intra-<strong>Agency</strong> Change - Decrease in O<strong>the</strong>r Services and Charges Multiple -2,875 0.0<br />
Intra-<strong>Agency</strong> Change - Increase in Contractual Services Multiple Programs 7,928 0.0<br />
Intra-<strong>Agency</strong> Change - Decrease in Subsidies and Transfers Multiple Programs -487 0.0<br />
Intra-<strong>Agency</strong> Change - Increase in Equipment Multiple Programs 79 0.0<br />
Baseline Adjustments: Net effect <strong>of</strong> salary and benefits changes -<br />
Increase in Salaries and Benefits<br />
Multiple Programs 296 1.3<br />
Intra-<strong>Agency</strong> Change - Increase in Supplies and Materials Multiple Programs 37 0.0<br />
Policy Initiatives and Cost Savings<br />
Shift - position from Local Fund to Fishing License Fund Natural Resources 27 0.5<br />
Shift - positions from Local Fund to Soil Erosion/Sediment Control Natural Resources 125 1.3<br />
Shift - positions from Local Fund to Storm Water Permit Review fund Natural Resources 241 2.2<br />
Transfer Out - Transfer Stormwater project funding (supported with Natural Resources -2,984 0.0<br />
Storm Water Permit Review Fund) from DDOE to PAYGO capital<br />
Shift - position from Local Fund to Lead Based Certification Fees Environmental Protection 56 1.0<br />
Shift - positions from Local Fund to Pesticide Product Registration Fund Environmental Protection 169 2.0<br />
Shift - position from Local Fund to Energy Assistance Trust Fund Energy Program 22 0.2<br />
Gap-Closing Initiatives<br />
Shift Cost - Shift o<strong>the</strong>r services and charges to <strong>the</strong> Storm Water Fees Natural Resources 18 0.0<br />
Shift Cost - Transfer positions from Local funds to special purpose Environmental Protection 252 4.6<br />
revenue funds<br />
Shift Cost - Shift discretionary purchases and a portion <strong>of</strong> <strong>the</strong> Low Energy Program 667 0.0<br />
Income Home Energy Assistance Program from Local Funds to <strong>the</strong><br />
Energy Assistance Trust Fund<br />
SPECIAL PURPOSE REVENUE FUNDS: FY 2010 Proposed <strong>Budget</strong> and FTE 40,205 100.9<br />
FEDERAL GRANT FUND: FY 2009 Approved <strong>Budget</strong> and FTE<br />
Initial and Baseline Adjustments<br />
19,732 111.9<br />
Net effect <strong>of</strong> fixed cost adjustments - Increase in energy Multiple Programs 48 0.0<br />
Net effect <strong>of</strong> fixed cost adjustments - Increase in telecom Multiple Programs 27 0.0<br />
Net effect <strong>of</strong> fixed cost adjustments - Increase in janitorial services Multiple Programs 37 0.0<br />
Net effect <strong>of</strong> fixed cost adjustments - Increase in occupancy cost Multiple Programs 55 0.0<br />
Net effect <strong>of</strong> salary and benefits changes - Increase in personnel Multiple Programs 1,099 8.0<br />
Intra-<strong>Agency</strong> Changes - Increase in supplies Multiple Programs 84 0.0<br />
Intra-<strong>Agency</strong> changes - Increase in o<strong>the</strong>r services and charges<br />
(Continued on <strong>the</strong> next page)<br />
Multiple Programs 675 0.0
Table KG0-5 (continued)<br />
(dollars in thousands)<br />
Initial and Baseline Adjustments (continued)<br />
Program BUDGET FTE<br />
Intra-<strong>Agency</strong> Changes - Increase in contractual services Multiple Programs 487 0.0<br />
Intra-<strong>Agency</strong> Changes - Increase in subsidies and transfers Multiple Programs 10,132 0.0<br />
Intra-<strong>Agency</strong> Changes - Increase in equipment and equipment rentals Multiple Programs 198 0.0<br />
Baseline Adjustments:Net effect <strong>of</strong> salary and benefits changes -<br />
Salaries and Fringe<br />
Environmental Protection 20 0.0<br />
Baseline Adjustments:Net effect <strong>of</strong> fixed cost adjustments - Security Environmental Protection -23 0.0<br />
Baseline Adjustments: - Equipment <strong>of</strong>fset <strong>of</strong> revised fixed cost estimates Policy And Planning 23 0.0<br />
Policy Initiatives and Cost Savings<br />
Shift - a portion <strong>of</strong> rent expenses from Local Fund to Indirect Cost AMP 200 0.0<br />
Recovery funds<br />
Enhance - Add Recovery Act funds for Diesel Emissions Reductions Environmental Protection 1,100 0.0<br />
Enhance - Add Recovery Act funds for <strong>the</strong> State Energy Program Education and Enforcement 9,950 0.0<br />
Enhance - Add Recovery Act funds for Wea<strong>the</strong>rization Assistance Energy Program 4,150 0.0<br />
Enhancement - Add Recovery Act funds for Energy Efficiency - Enhancement - Energy Program 9,594 0.0<br />
Add Recovery Act funds for Energy Efficiency Block Grant<br />
Reduce - Align Federal Low Income Home Energy Assistance Program Energy Program -6,249 0.0<br />
grant with revised estimate <strong>of</strong> available Federal grant funding<br />
Shift - Shift positions from Local Fund to EPA Federal Grants Multiple 181 2.8<br />
Gap-Closing Initiatives<br />
Shift Cost - Shift positions from Local Fund to EPA Federal Grants <strong>Agency</strong> Management Program 109 1.2<br />
Shift Cost - Shift position from Local Fund to Centers for Disease Control Environmental Protection 70 1.0<br />
and Prevention Grant<br />
Shift Cost - Shift positions from Local Fund to ARRA Stimulus Grants Environmental Protection 62 1.2<br />
FEDERAL GRANT FUND: FY 2010 Proposed <strong>Budget</strong> and FTE 51,762 126.2<br />
PRIVATE GRANT FUND: FY 2009 Approved <strong>Budget</strong> and FTE 300 0.0<br />
Initial and Baseline Adjustments<br />
Intra-<strong>Agency</strong> Change - Contractual Services Natural Resources -150 0.0<br />
Intra-<strong>Agency</strong> Change - subsidies and Transfers Natural Resources -20 0.0<br />
PRIVATE GRANT FUND: FY 2010 Proposed <strong>Budget</strong> and FTE 130 0.0<br />
INTRA-DISTRICT FUNDS: FY 2009 Approved <strong>Budget</strong> and FTE 382 4.0<br />
Initial and Baseline Adjustments<br />
Net effect <strong>of</strong> salary and benefits changes - Salaries and Benefits Multiple Programs -75 -1.0<br />
Intra-<strong>Agency</strong> Change - Supplies and Materials Multiple Programs -1 0.0<br />
Intra-<strong>Agency</strong> Change - O<strong>the</strong>r Services and Charges Multiple Programs 2 0.0<br />
Intra-<strong>Agency</strong> Change - Contractual Services Multiple Programs 46 0.0<br />
Intra-<strong>Agency</strong> Change - Equipment Multiple Programs 10 0.0<br />
Policy Initiatives and Cost Savings<br />
Shift - Shift a portion <strong>of</strong> <strong>the</strong> Low Income Home Energy Assistance Energy Program 2,000 0.0<br />
Program from Local Funds to TANF Funds from DHS<br />
INTRA-DISTRICT FUNDS: FY 2010 Proposed <strong>Budget</strong> and FTE 2,364 3.0<br />
Gross for KG0 - District Department <strong>of</strong> <strong>the</strong> Environment 111,804 315.6<br />
District Department <strong>of</strong> <strong>the</strong> Environment<br />
F-53
<strong>Agency</strong> Performance Plan<br />
The agency’s Performance Plan has <strong>the</strong> following<br />
objectives for FY 2010:<br />
Objective 1: Establish and continuously maintain<br />
regulations that protect and improve <strong>the</strong><br />
environment for District residents.<br />
Objective 2: Educate District residents and businesses<br />
about environmentally friendly and energy<br />
efficient practices and requirements and encourage<br />
District-wide environmental and sustainability<br />
goals.<br />
<strong>Agency</strong> Performance Measures<br />
Table KG0-6<br />
FY 2007 FY 2008 FY 2008<br />
Year-End Original Year-End FY 2009 FY 2010 FY 2011<br />
Measure Actual Target Actual Projection Projection Projection<br />
Percent <strong>of</strong> needed regulatory revisions completed<br />
Number <strong>of</strong> applicable development projects conducting<br />
N/A N/A N/A Baseline TBD TBD<br />
pre-plan meetings with DDOE<br />
Number <strong>of</strong> students receiving a “Meaningful Watershed<br />
Baseline 142 140 145 150<br />
Education Experience”<br />
Percent <strong>of</strong> construction plans approved that contain low<br />
5,865 5,000 3,006 5,000 6,000 7,500<br />
impact designs<br />
Service Awards for Innovative LID Demonstration<br />
25% (est.) 50% 15% 20% 30% 40%<br />
Program (Public & Private Properties) N/A N/A 0 3 sites 3 sites 5 sites<br />
Percent <strong>of</strong> District residents reached by DDOE Outreach Baseline<br />
and Education Programs N/A N/A NA Year Target<br />
50%<br />
TBD TBD<br />
Participants in <strong>the</strong> RiverSmart Homes program N/A 8 homes 8 80 homes 120 homes 200<br />
Number <strong>of</strong> trash reducing technologies installed in <strong>the</strong><br />
(pilot phase) (pilot phase) (pilot phase)<br />
Anacostia River Watershed<br />
Linear feet <strong>of</strong> improved stream habitat or restored<br />
N/A N/A N/A 40 60* 60*<br />
stream<br />
Additional Measures for FY 2010<br />
N/A 0 N/A 14,784 3,960 TBD<br />
Percent <strong>of</strong> adjudicated fines and penalties collected<br />
Percent <strong>of</strong> EBL-case and o<strong>the</strong>r properties with identified<br />
hazards that receive an Order to Abate within 15<br />
N/A N/A N/A Baseline TBD TBD<br />
days <strong>of</strong> being assessed N/A N/A N/A Baseline TBD TBD<br />
*Dependent upon grant funding<br />
FY 2010 Proposed <strong>Budget</strong> and <strong>Financial</strong> Plan<br />
F-54<br />
Objective 3: Enrich, Restore and Protect <strong>the</strong><br />
Environmental Quality <strong>of</strong> <strong>the</strong> District’s Natural<br />
Resources.<br />
Objective 4: Enforce <strong>the</strong> District’s environmental<br />
regulations by increasing <strong>the</strong> use <strong>of</strong> enforcement<br />
mechanisms and creating incentives for compliance.
DC Taxicab Commission<br />
www.dctaxi.dc.gov<br />
Telephone: 202-645-6018<br />
(TC0)<br />
% Change<br />
FY 2008 FY 2009 FY 2010 from<br />
Description Actual Approved Proposed FY 2009<br />
Operating <strong>Budget</strong> $1,776,814 $1,927,161 $2,152,670 11.7<br />
FTEs 14.9 19.0 24.0 26.3<br />
The mission <strong>of</strong> <strong>the</strong> District <strong>of</strong> Columbia Taxicab Commission<br />
(DCTC) is to provide <strong>the</strong> citizens and visitors <strong>of</strong> <strong>the</strong> District <strong>of</strong><br />
Columbia a safe, comfortable, efficient, and affordable taxicab experience<br />
in well-equipped vehicles operated by highly qualified individuals<br />
who have knowledge <strong>of</strong> <strong>the</strong> District’s streets, boundaries, and<br />
tourist destinations.<br />
Summary <strong>of</strong> Services<br />
The DCTC provides services to approximately 6,700<br />
independent taxicab drivers and 116 taxicab companies,<br />
1,056 independent limousine drivers, and 269<br />
limousine companies. DCTC also attends and/or<br />
conducts adjudication services and collects fees from<br />
complaints that are filed against taxicab drivers.<br />
DCTC Hack Inspectors conduct daily random taxi-<br />
cab inspections. Additionally, DCTC provides services<br />
to 1,150 customers at its counter, answers 1,000<br />
customer service calls, and receives 125 pieces <strong>of</strong> correspondence<br />
every month.<br />
The agency’s FY 2010 proposed budget is presented<br />
in <strong>the</strong> following tables:<br />
District <strong>of</strong> Columbia Taxicab Commission<br />
F-55
FY 2010 Proposed Gross Funds Operating <strong>Budget</strong>, by Revenue Type<br />
Table TC0-1 contains <strong>the</strong> proposed FY 2010 agency budget compared to <strong>the</strong> FY 2009 approved budget. It also<br />
provides FY 2007 and FY 2008 actual expenditures.<br />
Table TC0-1<br />
(dollars in thousands)<br />
Actual Actual Approved Proposed<br />
Change<br />
from Percent<br />
Appropriated Fund<br />
General Fund<br />
FY 2007 FY 2008 FY 2009 FY 2010 FY 2009 Change*<br />
Local Funds 805 1,335 1,304 1,213 -91 -7.0<br />
Special Purpose Revenue Funds 461 285 623 656 33 5.4<br />
Total for General Fund 1,266 1,620 1,927 1,869 -58 -3.0<br />
Intra-District Funds<br />
Intra-District Funds 0 157 0 284 284 N/A<br />
Total for Intra-District Funds 0 157 0 284 284 N/A<br />
Gross Funds 1,266 1,777 1,927 2,153 226 11.7<br />
*Percent Change is based on whole dollars.<br />
Note: If applicable, for a breakdown <strong>of</strong> each Grant (Federal and Private), Special Purpose Revenue type and Intra-District agreement,<br />
please refer to Schedule 80, <strong>Agency</strong> Summary by Revenue Source, in <strong>the</strong> Operating Appendices located on <strong>the</strong> <strong>Office</strong> <strong>of</strong> <strong>the</strong> <strong>Chief</strong><br />
<strong>Financial</strong> <strong>Office</strong>r’s website.<br />
FY 2010 Proposed Full-Time Equivalents, by Revenue Type<br />
Table TC0-2 contains <strong>the</strong> proposed FY 2010 FTE level compared to <strong>the</strong> FY 2009 approved FTE level by revenue<br />
type. It also provides FY 2007 and FY 2008 actual data.<br />
Table TC0-2<br />
Change<br />
Actual Actual Approved Proposed from Percent<br />
Appropriated Fund FY 2007 FY 2008 FY 2009 FY 2010 FY 2009 Change<br />
General Fund<br />
Local Funds 9.0 11.1 16.0 19.0 3.0 18.8<br />
Special Purpose Revenue Funds 3.0 3.8 3.0 4.0 1.0 33.3<br />
Total for General Fund 12.0 14.9 19.0 23.0 4.0 21.1<br />
Intra-District Funds<br />
Intra-D istrict Funds 0.0 0.0 0.0 1.0 1.0 N/A<br />
Total for Intra-District Funds 0.0 0.0 0.0 1.0 1.0 N/A<br />
Total Proposed FTEs 12.0 14.9 19.0 24.0 5.0 26.3<br />
FY 2010 Proposed <strong>Budget</strong> and <strong>Financial</strong> Plan<br />
F-56
FY 2010 Proposed Operating <strong>Budget</strong>, by Comptroller Source Group<br />
Table TC0-3 contains <strong>the</strong> proposed FY 2010 budget at <strong>the</strong> Comptroller Source Group (object class) level compared<br />
to <strong>the</strong> FY 2009 approved budget. It also provides FY 2007 and FY 2008 actual expenditures.<br />
Table TC0-3<br />
(dollars in thousands)<br />
Actual Actual Approved Proposed<br />
Change<br />
from Percent<br />
Comptroller Source Group FY 2007 FY 2008 FY 2009 FY 2010 FY 2009 Change*<br />
11 Regular Pay - Cont Full Time 761 845 1,039 1,245 206 19.8<br />
12 Regular Pay - O<strong>the</strong>r 0 68 0 64 64 N/A<br />
13 Additional Gross Pay 36 18 15 15 0 0.0<br />
14 Fringe Benefits - Curr Personnel 152 142 220 264 44 19.9<br />
15 Overtime Pay 0 6 0 5 5 N/A<br />
Subtotal Personal Services (PS) 950 1,079 1,274 1,593 319 25.0<br />
20 Supplies And Materials 6 7 12 9 -3 -26.8<br />
30 Energy, Comm. And Bldg Rentals 8 8 20 46 26 128.6<br />
31 Telephone, Telegraph, Telegram, Etc 32 30 26 21 -5 -18.2<br />
32 Rentals - Land And Structures 127 143 169 0 -169 -100.0<br />
35 Occupancy Fixed Costs 0 0 0 1 1 N/A<br />
40 O<strong>the</strong>r Services And Charges 143 427 350 240 -111 -31.6<br />
41 Contractual Services - O<strong>the</strong>r 8 8 0 62 62 N/A<br />
70 Equipment & Equipment Rental -7 75 75 181 106 141.1<br />
Subtotal Nonpersonal Services (NPS) 316 698 653 560 -93 -14.3<br />
Gross Funds 1,266 1,777 1,927 2,153 226 11.7<br />
*Percent Change is based on whole dollars.<br />
Program Description<br />
D.C. Taxicab Commission operates through <strong>the</strong> following<br />
3 programs:<br />
Licensing and Dispute Resolution - provides licensing<br />
and complaint resolution regarding public vehicle-for-hire<br />
owners and operators so that passengers<br />
are ensured ubiquitous, safe, and non-discriminatory<br />
transportation services.<br />
Passenger and Driver Protection – provides enforcement,<br />
compliance and legal oversight to ensure that<br />
public vehicle-for-hire owners and operators are in<br />
compliance with District law and <strong>the</strong> regulations <strong>of</strong><br />
<strong>the</strong> District <strong>of</strong> Columbia.<br />
<strong>Agency</strong> Management - provides for administrative<br />
support and <strong>the</strong> required tools to achieve operational<br />
and programmatic results. This program is standard<br />
for all performance-based budgeting agencies.<br />
Program Structure Change<br />
The D.C. Taxicab Commission had no program<br />
structure changes in <strong>the</strong> FY 2010 Proposed <strong>Budget</strong>.<br />
District <strong>of</strong> Columbia Taxicab Commission<br />
F-57
FY 2010 Proposed Operating <strong>Budget</strong> and FTEs, by Program and Activity<br />
Table TC0-4 contains <strong>the</strong> proposed FY 2010 budget by program and activity compared to <strong>the</strong> FY 2009 approved budget.<br />
It also provides FY 2008 actual data.<br />
Table TC0-4<br />
(dollars in thousands)<br />
Dollars in Thousands Full-Time Equivalents<br />
Change Change<br />
Actual Approved Proposed from Actual Approved Proposed from<br />
Program/Activity<br />
(1000) <strong>Agency</strong> Management Program<br />
FY 2008 FY 2009 FY 2010 FY 2009 FY 2008 FY 2009 FY 2010 FY 2009<br />
(1010) Personnel 10 15 18 3 0.4 0.2 0.2 0.0<br />
(1015) Training and Education 18 41 41 0 0.2 0.1 0.1 0.0<br />
(1020) Contracting and Procurement 10 24 36 11 0.4 0.2 0.2 0.0<br />
(1030) Property Management 149 189 49 -141 0.2 0.1 0.1 0.0<br />
(1040) Information Technology 144 143 43 -101 1.0 1.0 0.0 -1.0<br />
(1050) <strong>Financial</strong> Management 10 15 18 3 0.4 0.2 0.2 0.0<br />
(1055) Risk Management 0 0 0 0 0.0 0.0 0.0 0.0<br />
(1060) Legal 2 0 0 0 0.0 0.0 0.0 0.0<br />
(1070) Fleet Management 46 38 52 14 0.5 0.1 0.1 0.0<br />
(1080) Communications 44 151 66 -85 0.2 0.1 0.1 0.0<br />
(1085) Customer Service 18 29 30 1 0.2 0.2 0.2 0.0<br />
(1090) Performance Management 10 15 18 3 0.4 0.2 0.2 0.0<br />
Subtotal (1000) <strong>Agency</strong> Management Program 460<br />
(2000) Licensing and Dispute Resolution<br />
662 371 -291 3.9 2.0 1.0 -1.0<br />
(2010) Business and Operator Licensing 401 312 563 251 2.9 3.9 4.9 1.0<br />
(2020) Taxicab Dispute Resolution 32 166 136 -30 0.4 2.3 1.3 -1.0<br />
Subtotal (2000) Licensing and Dispute Resolution 433<br />
(3000) Passenger and Driver Protection<br />
478 700 221 3.3 6.2 6.2 0.0<br />
(3010) Enforcement and Compliance 882 787 1,081 295 7.8 10.9 16.9 6.0<br />
(3020) Legal Counsel 2 0 0 0 0.0 0.0 0.0 0.0<br />
Subtotal (3000) Passenger and Driver Protection 884 787 1,081 295 7.8 10.9 16.9 6.0<br />
Total Proposed Operating <strong>Budget</strong> 1,777 1,927 2,153 226 14.9 19.0 24.0 5.0<br />
(Change is calculated by whole numbers and numbers may not add up due to rounding)<br />
Note: For more detailed information regarding <strong>the</strong> proposed funding for <strong>the</strong> activities within this agency’s programs, please see<br />
Schedule 30-PBB, Program Summary by Activity, in <strong>the</strong> FY 2010 Operating Appendices located on <strong>the</strong> <strong>Office</strong> <strong>of</strong> <strong>the</strong> <strong>Chief</strong><br />
<strong>Financial</strong> <strong>Office</strong>r’s website.<br />
FY 2010 Proposed <strong>Budget</strong> and <strong>Financial</strong> Plan<br />
F-58
Major Baseline Adjustments, Cost Savings<br />
and Policy Initiatives<br />
Baseline Adjustments: A decrease <strong>of</strong> $61,000 related<br />
to one-time costs in <strong>the</strong> FY 2009 budget, and an<br />
increase <strong>of</strong> $22,000 in <strong>the</strong> <strong>Agency</strong> Management program<br />
as <strong>the</strong> net effect <strong>of</strong> fixed cost adjustments.<br />
Cost Savings: A projected revenue increase in <strong>the</strong><br />
Licensing and Dispute Resolution Intra-District<br />
Fund and savings in <strong>the</strong> Assessment Special Purpose<br />
Fund allow <strong>the</strong> DC Taxicab Commission (DCTC) to<br />
save Local fund dollars without reducing services.<br />
DCTC will shift supply and contract costs from <strong>the</strong><br />
Local to Intra-District fund, saving <strong>the</strong> District<br />
$64,000. In addition, one position, paid out <strong>of</strong> <strong>the</strong><br />
Assessment Special Purpose Fund, will be eliminated<br />
due to a redundancy in services, allowing $107,000 in<br />
fuel, electricity, auto maintenance and IT consultant<br />
expenses to shift from <strong>the</strong> Local fund to <strong>the</strong><br />
Assessment Fund. This shift is made possible through<br />
an amendment to <strong>the</strong> Assessment Fund legislation,<br />
which expands <strong>the</strong> use <strong>of</strong> <strong>the</strong>se funds to include all<br />
operation and administration costs in DCTC’s programs.<br />
Additional reductions were made for fleet, occupancy,<br />
and electricity in accordance with <strong>the</strong>ir revised<br />
estimates. The <strong>Office</strong> <strong>of</strong> Contracting and<br />
Procurement assessment increased in FY 2010.<br />
Policy Initiatives: The FY 2010 budget includes<br />
$253,597 in recurring funding and 5.0 FTEs, to add<br />
a third hack inspector shift, plus $5,000 for nonrecurring<br />
nonpersonal services.<br />
The proposed budget also includes additional<br />
projected revenues from increases in certain license<br />
fees, including those for taxi business, hacker, limousine<br />
business, limousine driver fees, independent limousine<br />
business license, inter-jurisdictional limousine<br />
company, inter-jurisdictional limousine independent,<br />
and not-for-hire licenses. These fees have not been<br />
increased since 1988, with <strong>the</strong> exception <strong>of</strong> hacker<br />
license which was last adjusted in 1999. The fee<br />
adjustments will bring a projected $382,000 to Local<br />
funds.<br />
Gap-Closing Initiatives: The Taxicab Commission<br />
(DCTC) will shift two positions from Local funds to<br />
<strong>the</strong> assessment fund for a Local fund savings <strong>of</strong><br />
$140,000. No positions are eliminated in this transfer.<br />
To accommodate <strong>the</strong> transfer <strong>of</strong> positions to <strong>the</strong><br />
assessment fund, DCTC will reduce its expenditures<br />
on pr<strong>of</strong>essional services in its assessment fund. These<br />
reductions will have no impact on core services.<br />
District <strong>of</strong> Columbia Taxicab Commission<br />
F-59
FY 2009 Approved <strong>Budget</strong> to FY 2010 Proposed <strong>Budget</strong>, by Revenue Type<br />
Table TC0-5 itemizes <strong>the</strong> changes by revenue type between <strong>the</strong> FY 2009 approved budget and <strong>the</strong> FY 2010 proposed<br />
budget. The four categories <strong>of</strong> changes reflected in this table are: (1) changes to <strong>the</strong> baseline budget (includes<br />
agency request), (2) changes representing cost savings or efficiencies, (3) changes related to policy initiatives, and (4)<br />
changes to specifically address <strong>the</strong> projected revenue shortfall.<br />
Table TC0-5<br />
(dollars in thousands)<br />
PROGRAM BUDGET FTE<br />
LOCAL FUND: FY 2009 Approved <strong>Budget</strong> and FTE 1,304 16.0<br />
Initial and Baseline Adjustments<br />
Reduction for nonrecurring costs - The effect <strong>of</strong> one-time cost in FY 2009 budget PDP -61 0.0<br />
Baseline Adjustments: Net effect <strong>of</strong> fixed cost adjustments -<br />
Policy Initiatives and Cost Savings<br />
AMP 22 0.0<br />
Net effect <strong>of</strong> salary and benefits changes - A one-time cost Passenger and Driver 5 0.0<br />
<strong>of</strong> $5,000 for uniforms and supplies is needed to support<br />
5 new hack inspectors<br />
Protection<br />
Net effect <strong>of</strong> salary and benefits changes - Increase in Local <strong>of</strong> Passenger and Driver 254 5.0<br />
$259,000 to support 5 additional hack inspectors and a third shift Protection<br />
Shift - Shift fuel, electricity, auto maintenance, and IT consultant <strong>Agency</strong> Management -107 0.0<br />
expenses from <strong>the</strong> Local fund to <strong>the</strong> Assessment Special Purpose fund Program<br />
Shift - Shift supplies and contractual services expenses to intra-District Multiple -64 0.0<br />
Cost Decrease - Align electricity budget with revised OPM estimates <strong>Agency</strong> Management<br />
Program<br />
-2 0.0<br />
Cost Decrease - Align fleet budget with revised DPW estimates <strong>Agency</strong> Management<br />
Program<br />
-5 0.0<br />
Cost Decrease - Align occupancy budget with revised OPM estimates <strong>Agency</strong> Management<br />
Program<br />
0 0.0<br />
Cost Decrease - Align telecom budget with revised OCTO estimates <strong>Agency</strong> Management -2<br />
Program<br />
0.0<br />
Cost Increase - Align procurement assessment budget with <strong>Agency</strong> Management 8 0.0<br />
revised OCP estimates Program<br />
Gap-Closing Initiatives<br />
Shift two FTEs to Assessment Fund - Licensing and<br />
Dispute Resolution<br />
-140 -2.0<br />
LOCAL FUND: FY 2010 Proposed <strong>Budget</strong> and FTE<br />
(Continued on next page)<br />
1,213 19.0<br />
FY 2010 Proposed <strong>Budget</strong> and <strong>Financial</strong> Plan<br />
F-60
Table TC0-5 (continued)<br />
(dollars in thousands)<br />
Program BUDGET FTE<br />
SPECIAL PURPOSE REVENUE FUNDS: FY 2009 Approved <strong>Budget</strong> and FTE 623 3.0<br />
Initial and Baseline Adjustments<br />
Net effect <strong>of</strong> salary and benefits changes - Net effect <strong>of</strong> salary and step Multiple Programs 44 0.0<br />
increase<br />
Intra-<strong>Agency</strong> changes - Reduction in equipment Passenger and Driver Protection -4 0.0<br />
Policy Initiatives and Cost Savings<br />
Shift - Shift fuel, electricity, auto maintenance, and IT consultant costs <strong>Agency</strong> Management Program 107 0.0<br />
from Local fund to <strong>the</strong> Assessment Special Purpose fund<br />
Reduce - Realign one position in <strong>the</strong> Assessment fund <strong>Agency</strong> Management Program -114 -1.0<br />
Gap-Closing Initiatives<br />
Shift - Shift from Local funds Licensing and Dispute 0 2.0<br />
Resolution<br />
SPECIAL PURPOSE REVENUE FUNDS: FY 2010 Proposed <strong>Budget</strong> and FTE 656 4.0<br />
INTRA-DISTRICT FUNDS: FY 2009 Approved <strong>Budget</strong> and FTE 0 0.0<br />
Initial and Baseline Adjustments<br />
Net effect <strong>of</strong> salary and benefits changes - To fund 1 FTE Multiple Programs 77 1.0<br />
Intra-<strong>Agency</strong> Changes - Increase in o<strong>the</strong>r services and charges Licensing and Dispute 16 0.0<br />
Resolution<br />
Intra-<strong>Agency</strong> Changes - Increase in Contracts Licensing and Dispute 40 0.0<br />
Resolution<br />
Intra-<strong>Agency</strong> Changes - Increase in equipment Passenger and Driver 150 0.0<br />
Protection<br />
INTRA-DISTRICT FUNDS: FY 2010 Proposed <strong>Budget</strong> and FTE 284 1.0<br />
Gross for TC0 - D.C. Taxicab Commission 2,153 24.0<br />
District <strong>of</strong> Columbia Taxicab Commission<br />
F-61
<strong>Agency</strong> Performance Plan<br />
The agency’s Performance Plan has <strong>the</strong> following<br />
objectives for FY 2010.<br />
Objective 1: Improve customer and taxicab service<br />
provided to <strong>the</strong> citizens and visitors <strong>of</strong> <strong>the</strong> District <strong>of</strong><br />
Columbia.<br />
<strong>Agency</strong> Performance Measures<br />
Table TC0-6<br />
FY 2010 Proposed <strong>Budget</strong> and <strong>Financial</strong> Plan<br />
F-62<br />
Objective 2: Improve <strong>the</strong> efficiency and quality <strong>of</strong><br />
services that support and regulate taxicabs in <strong>the</strong><br />
District <strong>of</strong> Columbia.<br />
FY 2007 FY 2008 FY 2008<br />
Year-End Original Year-End FY 2009 FY 2010 FY 2011<br />
Measure<br />
Percent <strong>of</strong> complaints which are acknowledged within<br />
Actual Target Actual Projection Projection Projection<br />
2 days <strong>of</strong> receipt <strong>of</strong> <strong>the</strong> complaint 95% 85% 89% 91% 92% 93%<br />
Percent <strong>of</strong> lost items returned to customers<br />
Percent <strong>of</strong> public vehicles-for-hire licenses proposed<br />
85% 88% 89% 90% 90% 91%<br />
within 1 business day <strong>of</strong> criminal background check<br />
Percent <strong>of</strong> taxicabs and limousines inspected that have<br />
N/A 90% 90% 91% 91% 92%<br />
valid licenses, insurance and safety 90% 80% 92% 88% 91% 91%
Washington Metropolitan Area<br />
Transit Commission<br />
www.wmatc.gov<br />
Telephone: 301-588-5260<br />
(KC0)<br />
% Change<br />
FY 2008 FY 2009 FY 2010 from<br />
Description Actual Approved Proposed FY 2009<br />
Operating <strong>Budget</strong> $113,000 $113,000 $123,000 8.8<br />
The mission <strong>of</strong> <strong>the</strong> Washington Metropolitan Area Transit<br />
Commission (WMATC) is to help assure that <strong>the</strong> public is provided<br />
passenger transportation services by licensing fit and responsible, privately-owned,<br />
for-hire carriers to service <strong>the</strong> metropolitan region.<br />
The WMATC assumed jurisdiction in March 1961.<br />
The commission administers <strong>the</strong> delegated powers <strong>of</strong><br />
<strong>the</strong> Washington Metropolitan Area Transit<br />
Regulation Compact (Public Law 87-767, 76 Stat.<br />
764; and amended in 1991 by Public Law 101-505,<br />
104 Stat. 1300). The latest amended compact is codified<br />
at D.C. Official Code § 9-1103.01.<br />
A Board <strong>of</strong> Commissioners directs <strong>the</strong> WMATC.<br />
One commissioner is appointed from <strong>the</strong> District <strong>of</strong><br />
Columbia Public Service Commission by <strong>the</strong> Mayor<br />
<strong>of</strong> <strong>the</strong> District <strong>of</strong> Columbia; one commissioner is<br />
appointed from <strong>the</strong> Maryland Public Service<br />
Commission by <strong>the</strong> Governor <strong>of</strong> Maryland; and one<br />
commissioner is appointed from <strong>the</strong> Virginia State<br />
Corporation Commission by <strong>the</strong> Governor <strong>of</strong><br />
Virginia. Daily operations are directed by <strong>the</strong><br />
Executive Director and carried out by WMATC staff.<br />
The Washington Metropolitan Area Transit<br />
District (Metropolitan District) consists <strong>of</strong> <strong>the</strong><br />
District <strong>of</strong> Columbia; Alexandria, Falls Church,<br />
Arlington County and Fairfax County, Virginia, and<br />
<strong>the</strong> political subdivisions located <strong>the</strong>rein;<br />
Montgomery County and Prince George’s County,<br />
Maryland, and <strong>the</strong> political subdivisions located<br />
<strong>the</strong>rein; and <strong>the</strong> Washington Dulles International<br />
Airport, located in Loudoun County, Virginia.<br />
Washington Metropolitan Area Transit Commission<br />
F-63
The agency’s FY 2010 proposed budget is presented in <strong>the</strong> following tables:<br />
FY 2010 Proposed Gross Funds Operating <strong>Budget</strong>, by Revenue Type<br />
Table KC0-1 contains <strong>the</strong> proposed FY 2010 agency budget compared to <strong>the</strong> FY 2009 approved budget. It also<br />
provides FY 2007 and FY 2008 actual expenditures.<br />
Table KC0-1<br />
(dollars in thousands)<br />
Actual Actual Approved Proposed<br />
Change<br />
from Percent<br />
Appropriated Fund<br />
General Fund<br />
FY 2007 FY 2008 FY 2009 FY 2010 FY 2009 Change*<br />
Local Funds 110 113 113 123 10 8.8<br />
Total for General Fund 110 113 113 123 10 8.8<br />
Gross Funds 110 113 113 123 10 8.8<br />
*Percent Change is based on whole dollars.<br />
Note: If applicable, for a breakdown <strong>of</strong> each Grant (Federal and Private), Special Purpose Revenue type and Intra-District agreement, please refer to<br />
Schedule 80 <strong>Agency</strong> Summary by Revenue Source in <strong>the</strong> Operating Appendices located on <strong>the</strong> <strong>Office</strong> <strong>of</strong> <strong>the</strong> <strong>Chief</strong> <strong>Financial</strong> <strong>Office</strong>r’s website.<br />
FY 2010 Proposed Operating <strong>Budget</strong>, by Comptroller Source Group<br />
Table KC0-2 contains <strong>the</strong> proposed FY 2010 budget at <strong>the</strong> Comptroller Source Group (object class) level compared<br />
to <strong>the</strong> FY 2009 approved budget. It also provides FY 2007 and FY 2008 actual expenditures.<br />
Table KC0-2<br />
(dollars in thousands)<br />
Actual Actual Approved Proposed<br />
Change<br />
from Percent<br />
Comptroller Source Group FY 2007 FY 2008 FY 2009 FY 2010 FY 2009 Change*<br />
50 Subsidies and Transfers 110 113 113 123 10 8.8<br />
Subtotal Nonpersonal Services (NPS) 110 113 113 123 10 8.8<br />
Gross Funds 110 113 113 123 10 8.8<br />
*Percent Change is based on whole dollars.<br />
FY 2010 Proposed <strong>Budget</strong> and <strong>Financial</strong> Plan<br />
F-64
Program Description<br />
The Washington Metropolitan Area Transit<br />
Commission (WMATC) budget represents <strong>the</strong><br />
District’s subsidy payment to <strong>the</strong> multi-jurisdictional<br />
agency. The subsidy budget is shown in this program<br />
format for comparison purposes only. The WMATC<br />
operates through <strong>the</strong> following program:<br />
Regulatory - WMATC's Regulatory program governs<br />
<strong>the</strong> operating authority, rates, and insurance <strong>of</strong><br />
privately-owned, for-hire passenger carriers in <strong>the</strong><br />
metropolitan region. Specifically, <strong>the</strong> program grants<br />
operating authority to private carriers such as airport<br />
shuttles, charter group buses, tour buses, handicapped<br />
transport vehicles, those businesses with private and<br />
government contract shuttles, carriers for conventions,<br />
and o<strong>the</strong>r privately-owned vehicles.<br />
FY 2010 Proposed Operating <strong>Budget</strong> and FTEs, by Program and Activity<br />
Table KC0-3 contains <strong>the</strong> proposed FY 2010 budget by program and activity compared to <strong>the</strong> FY 2009 approved budget.<br />
It also provides FY 2008 actual data.<br />
Table KC0-3<br />
(dollars in thousands)<br />
Dollars in Thousands Full-Time Equivalents<br />
Change Change<br />
Actual Approved Proposed from Actual Approved Proposed from<br />
Program/Activity<br />
(1000) Washington Metro Transit Commission (CC)<br />
FY 2008 FY 2009 FY 2010 FY 2009 FY 2008 FY 2009 FY 2010 FY 2009<br />
(1100) Washington Metro Transit Commission (CC) 113 113 123 10 0.0 0.0 0.0 0.0<br />
Subtotal (1000) WMATC (CC) 113 113 123 10 0.0 0.0 0.0 0.0<br />
Total Proposed Operating <strong>Budget</strong> 113 113 123 10 0.0 0.0 0.0 0.0<br />
(Change is calculated by whole numbers and numbers may not add up due to rounding)<br />
As part <strong>of</strong> its regulatory program, WMATC also<br />
establishes interstate taxicab rates. These rates are<br />
used when taxicabs cross from one signatory jurisdiction<br />
to ano<strong>the</strong>r. The commission staff is a source for<br />
determination <strong>of</strong> fares for taxicab trips between <strong>the</strong><br />
District <strong>of</strong> Columbia and area airports or o<strong>the</strong>r points<br />
in Maryland or Virginia that are in <strong>the</strong> metropolitan<br />
region. Staff is also available to mediate taxicab overcharge<br />
complaints that are interstate in nature.<br />
Program Structure Change<br />
The Washington Metropolitan Area Transit<br />
Commission had no program structure changes in<br />
<strong>the</strong> FY 2010 Proposed <strong>Budget</strong>.<br />
Note: For more detailed information regarding <strong>the</strong> proposed funding for <strong>the</strong> activities within this agency’s programs, please see Schedule 30-PBB Program<br />
Summary By Activity in <strong>the</strong> FY 2010 Operating Appendices located on <strong>the</strong> <strong>Office</strong> <strong>of</strong> <strong>the</strong> <strong>Chief</strong> <strong>Financial</strong> <strong>Office</strong>r’s website.<br />
Washington Metropolitan Area Transit Commission<br />
F-65
Major Baseline Adjustments, Cost Savings and Policy Initiatives<br />
Baseline Adjustment - a technical adjustment for $10,000 to fund shortfalls in <strong>the</strong> pension plan was approved. The<br />
additional $10,000 from <strong>the</strong> District will be matched by Maryland and Virginia.<br />
FY 2009 Approved <strong>Budget</strong> to FY 2010 Proposed <strong>Budget</strong>, by Revenue Type<br />
Table KC0-4 itemizes <strong>the</strong> changes by revenue type between <strong>the</strong> FY 2009 approved budget and <strong>the</strong> FY 2010 proposed<br />
budget. The four categories <strong>of</strong> changes reflected in this table are: (1) changes to <strong>the</strong> baseline budget (includes<br />
agency request), (2) changes representing cost savings or efficiencies, (3) changes related to policy initiatives, and (4)<br />
changes to specifically address <strong>the</strong> projected revenue shortfall.<br />
Table KC0-4<br />
(dollars in thousands)<br />
PROGRAM BUDGET FTE<br />
LOCAL FUND: FY 2009 Approved <strong>Budget</strong> and FTE 113 0.0<br />
Initial and Baseline Adjustments<br />
Baseline Adjustments: Technical Adjustment - increase in subsidies and WMTC (CC) 10 0.0<br />
transfers to fund shortfalls in <strong>the</strong> pension plan<br />
LOCAL FUND: FY 2010 Proposed <strong>Budget</strong> and FTE 123 0.0<br />
Gross for KC0 - Washington Metropolitan Area Transit Commission 123 0.0<br />
FY 2010 Proposed <strong>Budget</strong> and <strong>Financial</strong> Plan<br />
F-66
Washington Metropolitan Area<br />
Transit Authority<br />
www.wmata.com<br />
Telephone: 202-962-1488<br />
% Change<br />
FY 2008 FY 2009 FY 2010 from<br />
Description Actual Approved Proposed FY 2009<br />
Operating <strong>Budget</strong> $214,904,931 $230,499,034 $243,718,034 5.7<br />
The mission <strong>of</strong> <strong>the</strong> Washington Metropolitan Area Transit Authority<br />
(WMATA) is to provide <strong>the</strong> public with an efficient, affordable and<br />
diverse means <strong>of</strong> travel, under <strong>the</strong> direction <strong>of</strong> <strong>the</strong> District’s<br />
Department <strong>of</strong> Transportation (Mass Transit Administration), which<br />
provides funding, policy recommendations, and coordination services<br />
to <strong>the</strong> agency.<br />
WMATA was created February 20, 1967. It is an<br />
interstate compact agency and, by <strong>the</strong> terms <strong>of</strong> its<br />
enabling legislation, an agency and instrumentality <strong>of</strong><br />
<strong>the</strong> District <strong>of</strong> Columbia, State <strong>of</strong> Maryland, and<br />
Commonwealth <strong>of</strong> Virginia. This compact agency<br />
was created by <strong>the</strong> aforementioned states and <strong>the</strong><br />
District <strong>of</strong> Columbia to plan, finance, construct, and<br />
operate a comprehensive public transit system for <strong>the</strong><br />
Washington Metropolitan Area. A Board <strong>of</strong><br />
Directors, with representatives from each <strong>of</strong> <strong>the</strong> three<br />
jurisdictions, governs WMATA. The District has two<br />
voting members and two non-voting members on<br />
WMATA’s nine-person Board.<br />
(KE0)<br />
The Mass Transit Administration <strong>of</strong> <strong>the</strong> District’s<br />
Department <strong>of</strong> Transportation (DDOT) oversees <strong>the</strong><br />
District’s funding <strong>of</strong> WMATA and recommends policy<br />
direction, develops service initiatives, and monitors<br />
service quality. DDOT’s role is inclusive <strong>of</strong> all<br />
transit modes including Metrobus, Metrorail, and<br />
Metro-Access Paratransit service.<br />
The agency’s FY 2010 proposed budget is presented<br />
in <strong>the</strong> following tables:<br />
Washington Metropolitan Area Transit Authority<br />
F-67
FY 2010 Proposed Gross Funds Operating <strong>Budget</strong>, by Revenue Type<br />
Table KE0-1 contains <strong>the</strong> proposed FY 2010 agency budget compared to <strong>the</strong> FY 2009 approved budget. It also<br />
provides FY 2007 and FY 2008 actual expenditures.<br />
Table KE0-1<br />
(dollars in thousands)<br />
Actual Actual Approved Proposed<br />
Change<br />
from Percent<br />
Appropriated Fund<br />
General Fund<br />
FY 2007 FY 2008 FY 2009 FY 2010 FY 2009 Change*<br />
Local Funds 198,484 214,905 230,499 231,668 1,169 0.5<br />
Special Purpose Revenue Funds 0 0 0 12,000 12,000 N/A<br />
Total for General Fund 198,484 214,905 230,499 243,668 13,169 5.7<br />
Intra-District Funds<br />
Intra-District Funds 0 0 0 50 50 N/A<br />
Total for Intra-District Funds 0 0 0 50 50 N/A<br />
Gross Funds 198,484 214,905 230,499 243,718 13,219 5.7<br />
*Percent Change is based on whole dollars.<br />
Note: If applicable, for a breakdown <strong>of</strong> each Grant (Federal and Private), Special Purpose Revenue type and Intra-District agreement,<br />
please refer to Schedule 80 <strong>Agency</strong> Summary by Revenue Source in <strong>the</strong> Operating Appendices located on <strong>the</strong> <strong>Office</strong> <strong>of</strong> <strong>the</strong> <strong>Chief</strong><br />
<strong>Financial</strong> <strong>Office</strong>r’s website.<br />
FY 2010 Proposed Operating <strong>Budget</strong>, by Comptroller Source Group<br />
Table KE0-2 contains <strong>the</strong> proposed FY 2010 budget at <strong>the</strong> Comptroller Source Group (object class) level compared<br />
to <strong>the</strong> FY 2009 approved budget. It also provides FY 2007 and FY 2008 actual expenditures.<br />
Table KE0-2<br />
(dollars in thousands)<br />
Actual Actual Approved Proposed<br />
Change<br />
from Percent<br />
Comptroller Source Group FY 2007 FY 2008 FY 2009 FY 2010 FY 2009 Change*<br />
50 Subsidies and Transfers 198,484 214,905 230,499 243,718 13,219 5.7<br />
Subtotal Nonpersonal Services (NPS) 198,484 214,905 230,499 243,718 13,219 5.7<br />
Gross Funds 198,484 214,905 230,499 243,718 13,219 5.7<br />
*Percent Change is based on whole dollars.<br />
FY 2010 Proposed <strong>Budget</strong> and <strong>Financial</strong> Plan<br />
F-68
Program Description<br />
Although <strong>the</strong> District’s payment to WMATA is<br />
shown as a single program in <strong>the</strong> District’s financial<br />
system, WMATA operates through <strong>the</strong> following 5<br />
programs:<br />
Metrorail Operations -WMATA manages approximately<br />
38 miles <strong>of</strong> <strong>the</strong> Metrorail system and 40 stations<br />
in <strong>the</strong> District. It provides approximately 210<br />
million trips per year. WMATA manages a total <strong>of</strong><br />
106 miles <strong>of</strong> track in <strong>the</strong> metropolitan area with 86<br />
stations.<br />
Metrobus Operations - WMATA provides service 24<br />
hours a day, 7 days a week on many <strong>of</strong> its approximately<br />
350 bus routes on 182 lines throughout <strong>the</strong><br />
metropolitan area, serving an average yearly ridership<br />
<strong>of</strong> 132.8 million. The District has <strong>the</strong> largest<br />
Metrobus ridership in <strong>the</strong> region, at 53.95 percent.<br />
MetroAccess - Metro Access provides curb-to-curb<br />
wheelchair lift-equipped van service for persons<br />
unable to use accessible conventional bus or rail services.<br />
In <strong>the</strong> District, <strong>the</strong> service has 4,300 certified<br />
riders, who make 23,500 trips per month. WMATA<br />
contracts with private carriers for <strong>the</strong> Paratransit service.<br />
DC Specific (Reimbursable to WMATA) Projects -<br />
DC Specific projects are not part <strong>of</strong> <strong>the</strong> regular jurisdictional<br />
share <strong>of</strong> <strong>the</strong> WMATA subsidy. Examples <strong>of</strong><br />
DC Specific projects include:<br />
■ Bus Rapid Transit along several corridors;<br />
■ Electro-Mechanical Technology Training Program<br />
at Cardozo Senior High School; and<br />
■ Streetcar services in Anacostia.<br />
Debt Service - The debt service payment covers <strong>the</strong><br />
District's annual share <strong>of</strong> financing costs for bonds<br />
sold by WMATA for <strong>the</strong> construction <strong>of</strong> <strong>the</strong> originally<br />
planned 103-mile Metrorail system. This payment<br />
is consistent with <strong>the</strong> Ancillary Bond Repayment<br />
Participation Agreement entered between <strong>the</strong> District<br />
<strong>of</strong> Columbia, <strong>the</strong> State <strong>of</strong> Maryland, <strong>the</strong><br />
Commonwealth <strong>of</strong> Virginia, and <strong>the</strong> United States<br />
Secretary <strong>of</strong> Transportation. The FY 2009 debt service<br />
payment remains unchanged from FY 2008.<br />
Program Structure Change<br />
Washington Metropolitan Area Transit Authority<br />
(WMATA) had no program structure changes in <strong>the</strong><br />
FY 2010 Proposed <strong>Budget</strong>.<br />
Washington Metropolitan Area Transit Authority<br />
F-69
FY 2010 Proposed Operating <strong>Budget</strong> and FTEs, by Program and Activity<br />
Table KE0-3 contains <strong>the</strong> proposed FY 2010 budget by program and activity compared to <strong>the</strong> FY 2009 approved budget.<br />
It also provides FY 2008 actual data.<br />
Table KE0-3<br />
(dollars in thousands)<br />
Dollars in Thousands Full-Time Equivalents<br />
Change Change<br />
Actual Approved Proposed from Actual Approved Proposed from<br />
Program/Activity FY 2008 FY 2009 FY 2010 FY 2009 FY 2008 FY 2009 FY 2010 FY 2009<br />
(1000) Washington Metropolitan Area Transit Authority<br />
(1100) Washington Metropolitan Area Transit Authority 214,905 230,499 243,718 13,219 0.0 0.0 0.0 0.0<br />
Subtotal (1000) WMATA 214,905 230,499 243,718 13,219 0.0 0.0 0.0 0.0<br />
Total Proposed Operating <strong>Budget</strong> 214,905 230,499 243,718 13,219 0.0 0.0 0.0 0.0<br />
(Change is calculated by whole numbers and numbers may not add up due to rounding)<br />
Note: For more detailed information regarding <strong>the</strong> proposed funding for <strong>the</strong> activities within this agency’s programs, please see Schedule 30-PBB<br />
Program Summary By Activity in <strong>the</strong> FY 2010 Operating Appendices located on <strong>the</strong> <strong>Office</strong> <strong>of</strong> <strong>the</strong> <strong>Chief</strong> <strong>Financial</strong> <strong>Office</strong>r’s website.<br />
Major Baseline Adjustments, Cost Savings<br />
and Policy Initiatives<br />
Initial Adjustments: Increases <strong>of</strong> $14,460,000 in<br />
annual proportionate contribution <strong>of</strong> <strong>the</strong> District <strong>of</strong><br />
Columbia to WMATA’s operating expenses and<br />
$15,000,000 for Metro Matters.<br />
Cost Savings: The District <strong>of</strong> Columbia provides an<br />
operating subsidy to <strong>the</strong> Washington Metropolitan<br />
Area Transit Authority (WMATA) annually. After <strong>the</strong><br />
FY 2010 baseline was published, WMATA revised its<br />
subsidy and debt service request from <strong>the</strong> District,<br />
resulting in $20,854,000 in savings to <strong>the</strong> Local fund.<br />
A portion <strong>of</strong> <strong>the</strong>se savings, $2,171,000, was added<br />
back to align <strong>the</strong> District’s budget with <strong>the</strong> difference<br />
in WMATA’s fiscal year period.<br />
Policy Initiatives: An additional $3,177,000 will also<br />
be added to <strong>the</strong> budget to pay for District-specific services,<br />
including <strong>the</strong> operating costs <strong>of</strong> <strong>the</strong> new<br />
Circulator routes. To reduce Local fund spending in<br />
WMATA, $12,000,000 from <strong>the</strong> District Department<br />
<strong>of</strong> Transportation’s Unified Fund (Special Purpose<br />
Revenue) will replace Local funds in <strong>the</strong> WMATA<br />
subsidy account.<br />
FY 2010 Proposed <strong>Budget</strong> and <strong>Financial</strong> Plan<br />
F-70<br />
An additional $300,000 was set aside in <strong>the</strong> budget<br />
to fund real-time signs for 60 bus stops. Also,<br />
$100,000 was added to <strong>the</strong> budget, $50,000 in Local<br />
funds and $50,000 in Intra-District, to fund <strong>the</strong><br />
Safety and Ambassador program.<br />
Gap-Closing Initiatives: In FY 2010, <strong>the</strong> District will<br />
eliminate <strong>the</strong> Circulator’s National Mall Loop weekend<br />
service during <strong>the</strong> months <strong>of</strong> October through<br />
March. Average daily ridership during those months<br />
is 50 passengers. The Circulator will continue to provide<br />
its April through September weekend National<br />
Mall Loop services. Savings for <strong>the</strong> Loop reduction<br />
total $155,000.<br />
Finally, this budget modification provides savings<br />
<strong>of</strong> $680,000 through <strong>the</strong> reduction <strong>of</strong> extended hours<br />
<strong>of</strong> operation for <strong>the</strong> Navy Yard Circulator route on<br />
non-Nationals game days. This reduction does not<br />
affect current services.
FY 2009 Approved <strong>Budget</strong> to FY 2010 Proposed <strong>Budget</strong>, by Revenue Type<br />
Table KE0-4 itemizes <strong>the</strong> changes by revenue type between <strong>the</strong> FY 2009 approved budget and <strong>the</strong> FY 2010 proposed<br />
budget. The four categories <strong>of</strong> changes reflected in this table are: (1) changes to <strong>the</strong> baseline budget (includes agency<br />
request), (2) changes representing cost savings or efficiencies, (3) changes related to policy initiatives, and (4) changes to<br />
specifically address <strong>the</strong> projected revenue shortfall.<br />
Table KE0-4<br />
(dollars in thousands)<br />
PROGRAM BUDGET FTE<br />
LOCAL FUND: FY 2009 Approved <strong>Budget</strong> and FTE 230,499 0.0<br />
Initial and Baseline Adjustments<br />
Intra-<strong>Agency</strong> Changes - Increase in subsidies and transfers to support Washington Metropolitan 14,460 0.0<br />
WMATA's operating expenses Area Transit Authority<br />
Baseline Adjustments: Intra-<strong>Agency</strong> Changes - Increase in subsidies and Washington Metropolitan 15,000 0.0<br />
transfers to fund Metro Matters Area Transit Authority<br />
Policy Initiatives and Cost Savings<br />
Cost Decrease - Align Metro Matters debt service to revised Washington Metropolitan -2,219 0.0<br />
WMATA estimate Area Transit Authority<br />
Cost Decrease - Align subsidy cost with revised WMATA Washington Metropolitan -18,635 0.0<br />
estimate Area Transit Authority<br />
Cost Increase - Align subsidy with fiscal year difference Washington Metropolitan 2,171 0.0<br />
between WMATA and <strong>the</strong> District Area Transit Authority<br />
Enhance - Additional funding for District-specific services. Washington Metropolitan 3,177 0.0<br />
WMATA and <strong>the</strong> District Area Transit Authority<br />
Cost Increase - Increase in NPS funds for <strong>the</strong> Safety Washington Metropolitan 50 0.0<br />
Ambassador program Area Transit Authority<br />
Shift - Replace Local funds with Unified Fund revenue Washington Metropolitan -12,000 0.0<br />
transferred from <strong>the</strong> Department <strong>of</strong> Transportation (DDOT) Area Transit Authority<br />
Gap-Closing Initiatives<br />
Cost Decrease - Eliminate Circulator National Mall loop service Washington Metropolitan -155 0.0<br />
between October and March Area Transit Authority<br />
Cost Decrease - Achieve savings by canceling proposed Washington Metropolitan -680 0.0<br />
extended operating hours for Navy Yard Circulator Area Transit Authority<br />
LOCAL FUND: FY 2010 Proposed <strong>Budget</strong> and FTE 231,668 0.0<br />
SPECIAL PURPOSE REVENUE FUNDS: FY 2009 Approved <strong>Budget</strong> and FTE 0 0.0<br />
Policy Initiatives and Cost Savings<br />
Shift - Replace Local funds with Unified Fund revenue transferred from DDOT Washington Metropolitan 12,000 0.0<br />
Area Transit Authority<br />
SPECIAL PURPOSE REVENUE FUNDS: FY 2010 Proposed <strong>Budget</strong> and FTE 12,000 0.0<br />
INTRA-DISTRICT FUNDS: FY 2009 Approved <strong>Budget</strong> and FTE 0 0.0<br />
Policy Initiatives and Cost Savings<br />
Cost Increase - Increase in NPS in recurring Intra-District DDOT funds to Washington Metropolitan 50 0.0<br />
WMATA for <strong>the</strong> Safety and Ambassador program Area Transit Authority<br />
INTRA-DISTRICT FUNDS: FY 2010 Proposed <strong>Budget</strong> and FTE 50 0.0<br />
Gross for KE0 - Washington Metropolitan Area Transit Authority 243,718 0.0<br />
Washington Metropolitan Area Transit Authority<br />
F-71
School Transit Subsidy<br />
www.ddot.dc.gov<br />
Telephone: 202-673-6813<br />
The mission <strong>of</strong> <strong>the</strong> School Transit Subsidy is to provide funds to support<br />
<strong>the</strong> District <strong>of</strong> Columbia's student population with an efficient,<br />
affordable, and reliable means <strong>of</strong> travel.<br />
The agency’s FY 2010 proposed budget is presented in <strong>the</strong> following tables:<br />
(KD0)<br />
% Change<br />
FY 2008 FY 2009 FY 2010 from<br />
Description Actual Approved Proposed FY 2009<br />
Operating <strong>Budget</strong> $5,420,000 $7,865,974 $7,667,846 -2.5<br />
FY 2010 Proposed Gross Funds Operating <strong>Budget</strong>, by Revenue Type<br />
Table KD0-1 contains <strong>the</strong> proposed FY 2010 agency budget compared to <strong>the</strong> FY 2009 approved budget. It also<br />
provides FY 2007 and FY 2008 actual expenditures.<br />
Table KD0-1<br />
(dollars in thousands)<br />
Actual Actual Approved Proposed<br />
Change<br />
from Percent<br />
Appropriated Fund<br />
General Fund<br />
FY 2007 FY 2008 FY 2009 FY 2010 FY 2009 Change*<br />
Local Funds 5,092 5,420 7,866 7,668 -198 -2.5<br />
Total for General Fund 5,092 5,420 7,866 7,668 -198 -2.5<br />
Gross Funds 5,092 5,420 7,866 7,668 -198 -2.5<br />
*Percent Change is based on whole dollars.<br />
Note: If applicable, for a breakdown <strong>of</strong> each Grant (Federal and Private), Special Purpose Revenue type and Intra-District agreement, please refer to<br />
Schedule 80 <strong>Agency</strong> Summary by Revenue Source in <strong>the</strong> Operating Appendices located on <strong>the</strong> <strong>Office</strong> <strong>of</strong> <strong>the</strong> <strong>Chief</strong> <strong>Financial</strong> <strong>Office</strong>r’s website.<br />
School Transit Subsidy<br />
F-73
FY 2010 Proposed Operating <strong>Budget</strong>, by Comptroller Source Group<br />
Table KD0-2 contains <strong>the</strong> proposed FY 2010 budget at <strong>the</strong> Comptroller Source Group (object class) level compared<br />
to <strong>the</strong> FY 2009 approved budget. It also provides FY 2007 and FY 2008 actual expenditures.<br />
Table KD0-2<br />
(dollars in thousands)<br />
Actual Actual Approved Proposed<br />
Change<br />
from Percent<br />
Comptroller Source Group FY 2007 FY 2008 FY 2009 FY 2010 FY 2009 Change*<br />
20 Supplies and Materials 5 80 95 0 -95 -100.0<br />
40 O<strong>the</strong>r Services and Charges 0 20 36 0 -36 -100.0<br />
41 Contractual Services - O<strong>the</strong>r 83 191 2,593 2,658 66 2.5<br />
50 Subsidies and Transfers 4,954 4,954 5,142 5,009 -133 -2.6<br />
70 Equipment & Equipment Rental 50 175 0 0 0 N/A<br />
Subtotal Nonpersonal Services (NPS) 5,092 5,420 7,866 7,668 -198 -2.5<br />
Gross Funds 5,092 5,420 7,866 7,668 -198 -2.5<br />
*Percent Change is based on whole dollars.<br />
Program Description<br />
The School Transit Subsidy operates through <strong>the</strong> following<br />
program:<br />
School Transit Subsidy – provides <strong>the</strong> District <strong>of</strong><br />
Columbia’s student population with efficient, affordable<br />
and reliable means <strong>of</strong> travel. The Mass Transit<br />
Administration, within <strong>the</strong> District’s Department <strong>of</strong><br />
FY 2010 Proposed Operating <strong>Budget</strong> and FTEs, by Program and Activity<br />
Table KD0-3 contains <strong>the</strong> proposed FY 2010 budget by program and activity compared to <strong>the</strong> FY 2009 approved budget.<br />
It also provides FY 2008 actual data.<br />
Table KD0-3<br />
(dollars in thousands)<br />
Dollars in Thousands Full-Time Equivalents<br />
Change Change<br />
Actual Approved Proposed from Actual Approved Proposed from<br />
Program/Activity<br />
(1000) School Transit<br />
FY 2008 FY 2009 FY 2010 FY 2009 FY 2008 FY 2009 FY 2010 FY 2009<br />
(1100) School Transit 5,420 7,866 7,668 -198 0.0 0.0 0.0 0.0<br />
Subtotal (1000) School Transit 5,420 7,866 7,668 -198 0.0 0.0 0.0 0.0<br />
Total Proposed Operating <strong>Budget</strong> 5,420 7,866 7,668 -198 0.0 0.0 0.0 0.0<br />
(Change is calculated by whole numbers and numbers may not add up due to rounding)<br />
FY 2010 Proposed <strong>Budget</strong> and <strong>Financial</strong> Plan<br />
F-74<br />
Transportation (DDOT), manages <strong>the</strong> program in<br />
conjunction with WMATA and <strong>the</strong> D.C. Public<br />
Schools.<br />
Program Structure Change<br />
The School Transit Subsidy had no program structure<br />
changes in <strong>the</strong> FY 2010 Proposed <strong>Budget</strong>.<br />
Note: For more detailed information regarding <strong>the</strong> proposed funding for <strong>the</strong> activities within this agency’s programs, please see Schedule 30-PBB Program<br />
Summary by Activity in <strong>the</strong> FY 2010 Operating Appendices located on <strong>the</strong> <strong>Office</strong> <strong>of</strong> <strong>the</strong> <strong>Chief</strong> <strong>Financial</strong> <strong>Office</strong>r’s website.
Major Baseline Adjustments, Cost Savings<br />
and Policy Initiatives<br />
Cost Savings: The proposed budget eliminates <strong>the</strong><br />
use <strong>of</strong> School Transit Subsidies to pay for DDOT<br />
supplies and miscellaneous contracts, saving $23,128<br />
with no anticipated effect on service provision.<br />
Protected Programs: The proposed budget preserves<br />
<strong>the</strong> provision <strong>of</strong> transit subsidies for students <strong>of</strong> public<br />
schools and public charter schools. The budget also<br />
FY 2009 Approved <strong>Budget</strong> to FY 2010 Proposed <strong>Budget</strong>, by Revenue Type<br />
Table KD0-4 itemizes <strong>the</strong> changes by revenue type between <strong>the</strong> FY 2009 approved budget and <strong>the</strong> FY 2010 proposed<br />
budget. The four categories <strong>of</strong> changes reflected in this table are: (1) changes to <strong>the</strong> baseline budget (includes<br />
agency request), (2) changes representing cost savings or efficiencies, (3) changes related to policy initiatives, and (4)<br />
changes to specifically address <strong>the</strong> projected revenue shortfall.<br />
Table KD0-4<br />
(dollars in thousands)<br />
preserves funding for “swing space” transportation for<br />
students attending public schools that are closed for<br />
renovation.<br />
Gap-Closing Initiatives: Based on historic expenditures<br />
and projected school enrollment, <strong>the</strong> school<br />
transit subsidy can be reduced by $175,000 without<br />
an impact on current services.<br />
PROGRAM BUDGET FTE<br />
LOCAL FUND: FY 2009 Approved <strong>Budget</strong> and FTE<br />
Initial and Baseline Adjustments<br />
7,866 0.0<br />
Intra-<strong>Agency</strong> Changes - Reallocated from supplies to contractual services and<br />
subsidies and transfers<br />
School Transit -95 0.0<br />
Intra-<strong>Agency</strong> Changes - Reallocated from o<strong>the</strong>r services to contractual services and<br />
subsidies and transfers<br />
School Transit -36 0.0<br />
Intra-<strong>Agency</strong> Changes - Reallocated to contractual services School Transit 66 0.0<br />
Intra-<strong>Agency</strong> Changes - Reallocated to subsidies and transfers School Transit 66 0.0<br />
Policy Initiatives and Cost Savings<br />
Reduce - Eliminate use <strong>of</strong> School Transit Subsidies for DDOT supplies<br />
and miscellaneous contracts<br />
Gap-Closing Initiatives<br />
School Transit -23 0.0<br />
Cost Decrease - Align school transit subsidy with historic expenditures and<br />
anticipated enrollment<br />
School Transit -175 0.0<br />
LOCAL FUND: FY 2010 Proposed <strong>Budget</strong> and FTE 7,668 0.0<br />
Gross for KD0 - School Transit Subsidy 7,668 0.0<br />
School Transit Subsidy<br />
F-75
G<br />
Financing and O<strong>the</strong>r<br />
Debt Service (DS, ZA, CP, ZB, SM, DT)..............................................................G-1<br />
Settlements and Judgments (ZH) ..........................................................................G-15<br />
John A. Wilson Building Fund (ZZ).....................................................................G-19<br />
Workforce Investments (UP)..................................................................................G-23<br />
Non-Departmental (DO) .......................................................................................G-27<br />
Emergency Planning and Security Fund (EP)......................................................G-31<br />
Cash Reserve (CS)...................................................................................................G-35<br />
Master Equipment Lease/Purchase Program (EL) ..............................................G-39<br />
Pay-As-You-Go Capital Fund (PA).......................................................................G-43<br />
District Retiree Health Contribution (RH) ..........................................................G-47<br />
Baseball Transfer - Dedicated Taxes (BO).............................................................G-51<br />
Inaugural Expenses (SB) .........................................................................................G-55<br />
Highway Trust Fund Transfer - Dedicated Taxes (KZ) .......................................G-59<br />
Convention Center Transfer - Dedicated Taxes (EZ)...........................................G-63<br />
TIF and PILOT Transfer - Dedicated Taxes (TZ)..............................................G-67<br />
Financing and O<strong>the</strong>r
Debt Service<br />
Repayment <strong>of</strong> Loans and Interest (DS0)<br />
Short-Term Borrowings (ZA0)<br />
Certificates <strong>of</strong> Participation (CP0)<br />
Debt Service - Issuance Costs (ZB0)<br />
Schools Modernization Fund (SM0)<br />
Repayment <strong>of</strong> Revenue Bonds (DT0)<br />
(DS0, ZA0, CP0, ZB0, SM0, DT0)<br />
% Change<br />
FY 2008 FY 2009 FY 2010 from<br />
Description Actual Approved Proposed FY 2009<br />
Repayment <strong>of</strong> Loans and Interest (DS) $420,827,388 $459,726,789 $472,061,471 2.7<br />
Short-Term Borrowings (ZA) $7,848,886 $9,000,000 $9,000,000 N/A<br />
Certificates <strong>of</strong> Participation (CP) $30,664,137 $32,790,850 $32,284,610 -1.5<br />
Debt Service - Issuance Costs (ZB) $16,216,317 $15,000,000 $15,000,000 N/A<br />
Schools Modernization Fund (SM) $4,715,957 $8,613,163 $8,611,763 N/A<br />
Repayment <strong>of</strong> Revenue Bonds (DT) $2,512,402 $6,000,000 $4,861,200 -19.0<br />
Total Operating <strong>Budget</strong> $482,785,087 $531,130,802 $541,819,044 2.0<br />
The mission <strong>of</strong> <strong>the</strong> Debt Service administration is to finance <strong>the</strong> District's<br />
capital and cash flow needs as well as minimize costs associated with such<br />
financing, exercise fiscally responsible debt management practices, and make<br />
timely payment <strong>of</strong> all principal and interest.<br />
Timely debt service payments are necessary to satisfy<br />
<strong>the</strong> District's commitments to its investors (bondholders<br />
and financial institutions) and maintain a<br />
good credit standing in <strong>the</strong> financial markets. Under<br />
<strong>the</strong> District <strong>of</strong> Columbia Home Rule Act, <strong>the</strong> District<br />
may issue debt to finance capital projects or seasonal<br />
cash needs, subject to certain limitations. Specifically,<br />
no long-term (general obligation) debt may be issued<br />
that would cause <strong>the</strong> highest future year debt service<br />
cost to exceed 17 percent <strong>of</strong> <strong>the</strong> projected general<br />
fund revenue <strong>of</strong> <strong>the</strong> fiscal year in which <strong>the</strong> debt is<br />
issued, and recent legislation has restricted total debt<br />
service expenditures to 12 percent <strong>of</strong> total general<br />
fund expenditures annually. No short-term (general<br />
obligation) debt may be issued in an amount that<br />
would cause total outstanding short-term debt to<br />
exceed 20 percent <strong>of</strong> <strong>the</strong> projected revenue <strong>of</strong> <strong>the</strong> fiscal<br />
year in which <strong>the</strong> debt is issued. Short-term debt<br />
must be repaid by <strong>the</strong> end <strong>of</strong> <strong>the</strong> fiscal year in which<br />
it is issued. The District’s total outstanding long-term<br />
debt for General Obligation bonds and o<strong>the</strong>r tax-supported<br />
debt as <strong>of</strong> September 30, 2008, was approximately<br />
$6.2 billion. The District issued $400 million<br />
<strong>of</strong> short-term debt in FY 2009, which will be repaid<br />
by September 30, 2009. Appropriations are budgeted<br />
in amounts sufficient to meet <strong>the</strong> required payments<br />
for <strong>the</strong> various types <strong>of</strong> debt service.<br />
Debt Service<br />
G-1
The agency’s FY 2010 proposed budget is presented in <strong>the</strong> following tables:<br />
FY 2010 Proposed Gross Funds Operating <strong>Budget</strong>, by Revenue Type<br />
Table DS0-1 contains <strong>the</strong> proposed FY 2010 agency budget compared to <strong>the</strong> FY 2009 approved budget. It also<br />
provides FY 2007 and FY 2008 actual expenditures.<br />
Table DS0-1<br />
(dollars in thousands)<br />
Repayment <strong>of</strong> Loans and Interest<br />
Actual Actual Approved Proposed<br />
Change<br />
from Percent<br />
Appropriated Fund<br />
General Fund<br />
FY 2007 FY 2008 FY 2009 FY 2010 FY 2009 Change*<br />
Local Funds 386,245 420,827 453,050 463,796 10,747 2.4<br />
Dedicated Taxes 0 0 3,580 4,800 1,220 34.1<br />
Special Purpose Revenue Funds 0 0 3,097 3,465 368 11.9<br />
Total for General Fund 386,245 420,827 459,727 472,061 12,335 2.7<br />
Gross Funds 386,245 420,827 459,727 472,061 12,335 2.7<br />
*Percent Change is based on whole dollars.<br />
FY 2010 Proposed Gross Funds Operating <strong>Budget</strong>, by Revenue Type<br />
Table ZA0-1 contains <strong>the</strong> proposed FY 2010 agency budget compared to <strong>the</strong> FY 2009 approved budget. It also<br />
provides FY 2007 and FY 2008 actual expenditures.<br />
Table ZA0-1<br />
(dollars in thousands)<br />
Repayment <strong>of</strong> Interest on Short-Term Borrowing<br />
Actual Actual Approved Proposed<br />
Change<br />
from Percent<br />
Appropriated Fund<br />
General Fund<br />
FY 2007 FY 2008 FY 2009 FY 2010 FY 2009 Change*<br />
Local Funds 8,455 7,849 9,000 9,000 0 N/A<br />
Total for General Fund 8,455 7,849 9,000 9,000 0 N/A<br />
Gross Funds 8,455 7,849 9,000 9,000 0 N/A<br />
*Percent Change is based on whole dollars.<br />
FY 2010 Proposed <strong>Budget</strong> and <strong>Financial</strong> Plan<br />
G-2
FY 2010 Proposed Gross Funds Operating <strong>Budget</strong>, by Revenue Type<br />
Table CP0-1 contains <strong>the</strong> proposed FY 2010 agency budget compared to <strong>the</strong> FY 2009 approved budget. It also<br />
provides FY 2007 and FY 2008 actual expenditures.<br />
Table CP0-1<br />
(dollars in thousands)<br />
Certificates <strong>of</strong> Participation<br />
Actual Actual Approved Proposed<br />
Change<br />
from Percent<br />
Appropriated Fund<br />
General Fund<br />
FY 2007 FY 2008 FY 2009 FY 2010 FY 2009 Change*<br />
Local Funds 30,448 30,664 32,791 32,285 -506 -1.5<br />
Total for General Fund 30,448 30,664 32,791 32,285 -506 -1.5<br />
Gross Funds 30,448 30,664 32,791 32,285 -506 -1.5<br />
*Percent Change is based on whole dollars.<br />
FY 2010 Proposed Gross Funds Operating <strong>Budget</strong>, by Revenue Type<br />
Table ZB0-1 contains <strong>the</strong> proposed FY 2010 agency budget compared to <strong>the</strong> FY 2009 approved budget. It also<br />
provides FY 2007 and FY 2008 actual expenditures.<br />
Table ZB0-1<br />
(dollars in thousands)<br />
Debt Service - Issuance Costs<br />
Actual Actual Approved Proposed<br />
Change<br />
from Percent<br />
Appropriated Fund<br />
General Fund<br />
FY 2007 FY 2008 FY 2009 FY 2010 FY 2009 Change*<br />
Local Funds 6,406 16,216 15,000 15,000 0 N/A<br />
Total for General Fund 6,406 16,216 15,000 15,000 0 N/A<br />
Gross Funds 6,406 16,216 15,000 15,000 0 N/A<br />
*Percent Change is based on whole dollars.<br />
Debt Service<br />
G-3
FY 2010 Proposed Gross Funds Operating <strong>Budget</strong>, by Revenue Type<br />
Table SM0-1 contains <strong>the</strong> proposed FY 2010 agency budget compared to <strong>the</strong> FY 2009 approved budget. It also<br />
provides FY 2007 and FY 2008 actual expenditures.<br />
Table SM0-1<br />
(dollars in thousands)<br />
Schools Modernization Fund<br />
Actual Actual Approved Proposed<br />
Change<br />
from Percent<br />
Appropriated Fund<br />
General Fund<br />
FY 2007 FY 2008 FY 2009 FY 2010 FY 2009 Change*<br />
Local Funds 0 4,716 8,613 8,612 -1 0.0<br />
Total for General Fund 0 4,716 8,613 8,612 -1 0.0<br />
Gross Funds 0 4,716 8,613 8,612 -1 0.0<br />
*Percent Change is based on whole dollars.<br />
FY 2010 Proposed Gross Funds Operating <strong>Budget</strong>, by Revenue Type<br />
Table DT0-1 contains <strong>the</strong> proposed FY 2010 agency budget compared to <strong>the</strong> FY 2009 approved budget. It also<br />
provides FY 2007 and FY 2008 actual expenditures.<br />
Table DT0-1<br />
(dollars in thousands)<br />
Repayment <strong>of</strong> Revenue Bonds<br />
Actual Actual Approved Proposed<br />
Change<br />
from Percent<br />
Appropriated Fund<br />
General Fund<br />
FY 2007 FY 2008 FY 2009 FY 2010 FY 2009 Change*<br />
Local Funds 0 2,512 0 0 0 N/A<br />
Dedicated Taxes 0 0 6,000 4,861 -1,139 -19.0<br />
Total for General Fund 0 2,512 6,000 4,861 -1,139 -19.0<br />
Gross Funds 0 2,512 6,000 4,861 -1,139 -19.0<br />
*Percent Change is based on whole dollars.<br />
Note: If applicable, for a breakdown <strong>of</strong> each Grant (Federal and Private), Special Purpose Revenue type and Intra-District agreement, please<br />
refer to Schedule 80, <strong>Agency</strong> Summary by Revenue Source, in <strong>the</strong> Operating Appendices located on <strong>the</strong> <strong>Office</strong> <strong>of</strong> <strong>the</strong> <strong>Chief</strong> <strong>Financial</strong><br />
<strong>Office</strong>r’s website.<br />
FY 2010 Proposed <strong>Budget</strong> and <strong>Financial</strong> Plan<br />
G-4
FY 2010 Proposed Operating <strong>Budget</strong>, by Comptroller Source Group<br />
Table DS0-2 contains <strong>the</strong> proposed FY 2010 budget at <strong>the</strong> Comptroller Source Group (object class) level compared<br />
to <strong>the</strong> FY 2009 approved budget. It also provides FY 2007 and FY 2008 actual expenditures.<br />
Table DS0-2<br />
(dollars in thousands)<br />
Repayment <strong>of</strong> Loans and Interest Change<br />
Actual Actual Approved Proposed from Percent<br />
Comptroller Source Group FY 2007 FY 2008 FY 2009 FY 2010 FY 2009 Change*<br />
80 Debt Service 386,245 420,827 459,727 472,061 12,335 2.7<br />
Subtotal Nonpersonal Services (NPS) 386,245 420,827 459,727 472,061 12,335 2.7<br />
Gross Funds 386,245 420,827 459,727 472,061 12,335 2.7<br />
*Percent Change is based on whole dollars.<br />
FY 2010 Proposed Operating <strong>Budget</strong>, by Comptroller Source Group<br />
Table ZA0-2 contains <strong>the</strong> proposed FY 2010 budget at <strong>the</strong> Comptroller Source Group (object class) level compared<br />
to <strong>the</strong> FY 2009 approved budget. It also provides FY 2007 and FY 2008 actual expenditures.<br />
Table ZA0-2<br />
(dollars in thousands)<br />
Repayment <strong>of</strong> Interest on Short-Term Borrowing Change<br />
Actual Actual Approved Proposed from Percent<br />
Comptroller Source Group FY 2007 FY 2008 FY 2009 FY 2010 FY 2009 Change*<br />
80 Debt Service 8,455 7,849 9,000 9,000 0 N/A<br />
Subtotal Nonpersonal Services (NPS) 8,455 7,849 9,000 9,000 0 N/A<br />
Gross Funds 8,455 7,849 9,000 9,000 0 N/A<br />
*Percent Change is based on whole dollars.<br />
Debt Service<br />
G-5
FY 2010 Proposed Operating <strong>Budget</strong>, by Comptroller Source Group<br />
Table CP0-2 contains <strong>the</strong> proposed FY 2010 budget at <strong>the</strong> Comptroller Source Group (object class) level compared<br />
to <strong>the</strong> FY 2009 approved budget. It also provides FY 2007 and FY 2008 actual expenditures.<br />
Table CP0-2<br />
(dollars in thousands)<br />
Certificates <strong>of</strong> Participation Change<br />
Actual Actual Approved Proposed from Percent<br />
Comptroller Source Group FY 2007 FY 2008 FY 2009 FY 2010 FY 2009 Change*<br />
80 Debt Service 30,448 30,664 32,791 32,285 -506 -1.5<br />
Subtotal Nonpersonal Services (NPS) 30,448 30,664 32,791 32,285 -506 -1.5<br />
Gross Funds 30,448 30,664 32,791 32,285 -506 -1.5<br />
*Percent Change is based on whole dollars.<br />
FY 2010 Proposed Operating <strong>Budget</strong>, by Comptroller Source Group<br />
Table ZB0-2 contains <strong>the</strong> proposed FY 2010 budget at <strong>the</strong> Comptroller Source Group (object class) level compared<br />
to <strong>the</strong> FY 2009 approved budget. It also provides FY 2007 and FY 2008 actual expenditures.<br />
Table ZB0-2<br />
(dollars in thousands)<br />
Debt Service - Issuance Costs Change<br />
Actual Actual Approved Proposed from Percent<br />
Comptroller Source Group FY 2007 FY 2008 FY 2009 FY 2010 FY 2009 Change*<br />
80 Debt Service 1,169 16,397 15,000 15,000 0 N/A<br />
83 Debt Svc Princ Refunded-Gaap 5,237 -181 0 0 0 N/A<br />
Subtotal Nonpersonal Services (NPS) 6,406 16,216 15,000 15,000 0 N/A<br />
Gross Funds 6,406 16,216 15,000 15,000 0 N/A<br />
*Percent Change is based on whole dollars.<br />
FY 2010 Proposed <strong>Budget</strong> and <strong>Financial</strong> Plan<br />
G-6
FY 2010 Proposed Operating <strong>Budget</strong>, by Comptroller Source Group<br />
Table SM0-2 contains <strong>the</strong> proposed FY 2010 budget at <strong>the</strong> Comptroller Source Group (object class) level compared<br />
to <strong>the</strong> FY 2009 approved budget. It also provides FY 2007 and FY 2008 actual expenditures.<br />
Table SM0-2<br />
(dollars in thousands)<br />
Schools Modernization Fund Change<br />
Actual Actual Approved Proposed from Percent<br />
Comptroller Source Group FY 2007 FY 2008 FY 2009 FY 2010 FY 2009 Change*<br />
80 Debt Service 0 4,716 8,613 8,612 -1 0.0<br />
Subtotal Nonpersonal Services (NPS) 0 4,716 8,613 8,612 -1 0.0<br />
Gross Funds 0 4,716 8,613 8,612 -1 0.0<br />
*Percent Change is based on whole dollars.<br />
FY 2010 Proposed Operating <strong>Budget</strong>, by Comptroller Source Group<br />
Table DT0-2 contains <strong>the</strong> proposed FY 2010 budget at <strong>the</strong> Comptroller Source Group (object class) level compared<br />
to <strong>the</strong> FY 2009 approved budget. It also provides FY 2007 and FY 2008 actual expenditures.<br />
Table DT0-2<br />
(dollars in thousands)<br />
Repayment <strong>of</strong> Revenue Bonds<br />
Actual Actual Approved Proposed<br />
Change<br />
from Percent<br />
Comptroller Source Group FY 2007 FY 2008 FY 2009 FY 2010 FY 2009 Change*<br />
80 Debt Service 0 2,512 6,000 4,861 -1,139 -19.0<br />
Subtotal Nonpersonal Services (NPS) 0 2,512 6,000 4,861 -1,139 -19.0<br />
Gross Funds 0 2,512 6,000 4,861 -1,139 -19.0<br />
*Percent Change is based on whole dollars.<br />
Debt Service<br />
G-7
FY 2010 Proposed Operating <strong>Budget</strong> and FTEs, by Program and Activity<br />
Table DS0-3 contains <strong>the</strong> proposed FY 2010 budget by program and activity compared to <strong>the</strong> FY 2009 approved budget.<br />
It also provides FY 2008 actual data.<br />
Table DS0-3 Repayment <strong>of</strong> Loans and Interest<br />
(dollars in thousands)<br />
Dollars in Thousands Full-Time Equivalents<br />
Change Change<br />
Actual Approved Proposed from Actual Approved Proposed from<br />
Program/Activity<br />
(1000) Repayment <strong>of</strong> Loans and Interest<br />
FY 2008 FY 2009 FY 2010 FY 2009 FY 2008 FY 2009 FY 2010 FY 2009<br />
(1100) Repayment <strong>of</strong> Loans and Interest 420,827 459,727 472,061 12,335 0.0 0.0 0.0 0.0<br />
Subtotal (1000) Repayment <strong>of</strong> Loans and Interest 420,827 459,727 472,061 12,335 0.0 0.0 0.0 0.0<br />
Total Proposed Operating <strong>Budget</strong> 420,827 459,727 472,061 12,335 0.0 0.0 0.0 0.0<br />
(Change is calculated by whole numbers and numbers may not add up due to rounding)<br />
FY 2010 Proposed Operating <strong>Budget</strong> and FTEs, by Program and Activity<br />
Table ZA0-3 contains <strong>the</strong> proposed FY 2010 budget by program and activity compared to <strong>the</strong> FY 2009 approved budget.<br />
It also provides FY 2008 actual data.<br />
Table ZA0-3 Repayment <strong>of</strong> Interest on Short-Term Borrowing<br />
(dollars in thousands)<br />
Dollars in Thousands Full-Time Equivalents<br />
Change Change<br />
Actual Approved Proposed from Actual Approved Proposed from<br />
Program/Activity FY 2008 FY 2009 FY 2010 FY 2009 FY 2008 FY 2009 FY 2010 FY 2009<br />
(1000) Short-Term Borrowings<br />
(1100) Short-Term Borrowings 7,849 9,000 9,000 0 0.0 0.0 0.0 0.0<br />
Subtotal (1000) Short-Term Borrowings 7,849 9,000 9,000 0 0.0 0.0 0.0 0.0<br />
Total Proposed Operating <strong>Budget</strong> 7,849 9,000 9,000 0 0.0 0.0 0.0 0.0<br />
(Change is calculated by whole numbers and numbers may not add up due to rounding)<br />
FY 2010 Proposed <strong>Budget</strong> and <strong>Financial</strong> Plan<br />
G-8
FY 2010 Proposed Operating <strong>Budget</strong> and FTEs, by Program and Activity<br />
Table CP0-3 contains <strong>the</strong> proposed FY 2010 budget by program and activity compared to <strong>the</strong> FY 2009 approved budget.<br />
It also provides FY 2008 actual data.<br />
Table CP0-3 Certificates <strong>of</strong> Participation<br />
(dollars in thousands)<br />
Dollars in Thousands Full-Time Equivalents<br />
Change Change<br />
Actual Approved Proposed from Actual Approved Proposed from<br />
Program/Activity FY 2008 FY 2009 FY 2010 FY 2009 FY 2008 FY 2009 FY 2010 FY 2009<br />
(1000) Certificate <strong>of</strong> Participation<br />
(1100) Certificate <strong>of</strong> Participation 30,664 32,791 32,285 -506 0.0 0.0 0.0 0.0<br />
Subtotal (1000) Certificate <strong>of</strong> Participation 30,664 32,791 32,285 -506 0.0 0.0 0.0 0.0<br />
Total Proposed Operating <strong>Budget</strong> 30,664 32,791 32,285 -506 0.0 0.0 0.0 0.0<br />
(Change is calculated by whole numbers and numbers may not add up due to rounding)<br />
FY 2010 Proposed Operating <strong>Budget</strong> and FTEs, by Program and Activity<br />
Table ZB0-3 contains <strong>the</strong> proposed FY 2010 budget by program and activity compared to <strong>the</strong> FY 2009 approved budget.<br />
It also provides FY 2008 actual data.<br />
Table ZB0-3 Debt Service - Issuance Costs<br />
(dollars in thousands)<br />
Dollars in Thousands Full-Time Equivalents<br />
Change Change<br />
Actual Approved Proposed from Actual Approved Proposed from<br />
Program/Activity<br />
(1000) Debt Service - Issuance Costs<br />
FY 2008 FY 2009 FY 2010 FY 2009 FY 2008 FY 2009 FY 2010 FY 2009<br />
(1100) Debt Service - Issuance Costs 16,216 15,000 15,000 0 0.0 0.0 0.0 0.0<br />
Subtotal (1000) Debt Service - Issuance Costs 16,216 15,000 15,000 0 0.0 0.0 0.0 0.0<br />
Total Proposed Operating <strong>Budget</strong> 16,216 15,000 15,000 0 0.0 0.0 0.0 0.0<br />
(Change is calculated by whole numbers and numbers may not add up due to rounding)<br />
Debt Service<br />
G-9
FY 2010 Proposed Operating <strong>Budget</strong> and FTEs, by Program and Activity<br />
Table SM0-3 contains <strong>the</strong> proposed FY 2010 budget by program and activity compared to <strong>the</strong> FY 2009 approved budget.<br />
It also provides FY 2008 actual data.<br />
Table SM0-3 Schools Modernization Fund<br />
(dollars in thousands)<br />
Dollars in Thousands Full-Time Equivalents<br />
Change Change<br />
Actual Approved Proposed from Actual Approved Proposed from<br />
Program/Activity FY 2008 FY 2009 FY 2010 FY 2009 FY 2008 FY 2009 FY 2010 FY 2009<br />
(1000) Schools Modernization Fund<br />
(1100) Schools Modernization Fund 4,716 8,613 0 -8,613 0.0 0.0 0.0 0.0<br />
No Activity Assigned 0 0 8,612 8,612 0.0 0.0 0.0 0.0<br />
Subtotal (1000) Schools Modernization Fund 4,716 8,613 8,612 -1 0.0 0.0 0.0 0.0<br />
Total Proposed Operating <strong>Budget</strong> 4,716 8,613 8,612 -1 0.0 0.0 0.0 0.0<br />
(Change is calculated by whole numbers and numbers may not add up due to rounding)<br />
FY 2010 Proposed Operating <strong>Budget</strong> and FTEs, by Program and Activity<br />
Table DT0-3 contains <strong>the</strong> proposed FY 2010 budget by program and activity compared to <strong>the</strong> FY 2009 approved budget.<br />
It also provides FY 2008 actual data.<br />
Table DT0-3 Repayment <strong>of</strong> Revenue Bonds<br />
(dollars in thousands)<br />
Dollars in Thousands Full-Time Equivalents<br />
Actual Approved Proposed<br />
Change<br />
from Actual Approved Proposed<br />
Change<br />
from<br />
Program/Activity<br />
(1000) Repayment <strong>of</strong> Revenue Bonds<br />
FY 2008 FY 2009 FY 2010 FY 2009 FY 2008 FY 2009 FY 2010 FY 2009<br />
(1100) Repayment <strong>of</strong> Revenue Bonds 2,512 6,000 4,861 -1,139 0.0 0.0 0.0 0.0<br />
Subtotal (1000) Repayment <strong>of</strong> Revenue Bonds 2,512 6,000 4,861 -1,139 0.0 0.0 0.0 0.0<br />
Total Proposed Operating <strong>Budget</strong> 2,512 6,000 4,861 -1,139 0.0 0.0 0.0 0.0<br />
(Change is calculated by whole numbers and numbers may not add up due to rounding)<br />
Note: For more detailed information regarding <strong>the</strong> proposed funding for <strong>the</strong> activities within this agency’s programs, please see Schedule 30-PBB<br />
Program Summary By Activity in <strong>the</strong> FY 2010 Operating Appendices located on <strong>the</strong> <strong>Office</strong> <strong>of</strong> <strong>the</strong> <strong>Chief</strong> <strong>Financial</strong> <strong>Office</strong>r’s website.<br />
FY 2010 Proposed <strong>Budget</strong> and <strong>Financial</strong> Plan<br />
G-10
Major Baseline Adjustments, Cost Savings<br />
and Policy Initiatives<br />
Initial Adjustments: Repayment <strong>of</strong> Loans and Interest:<br />
Local funds were increased by $46,401,000 to reflect<br />
<strong>the</strong> increased cost <strong>of</strong> debt service because <strong>of</strong> planned<br />
borrowings in FY 2010.<br />
Cost Savings: Repayment <strong>of</strong> Loans and Interest: The<br />
proposed budget reduces budget lines for long-term<br />
debt service by $37,567,000 from <strong>the</strong> baseline budget<br />
published in February 2009. This action anticipates<br />
favorable interest rates in FY 2010, as well as <strong>the</strong> likely<br />
timing <strong>of</strong> District bond issuances. The District’s<br />
Income Tax Secured Revenue Bonds’ ratings <strong>of</strong> AAA,<br />
AA2, and AA from Standard and Poor’s, Moody’s,<br />
and Fitch, respectively, resulted in a low interest rate<br />
<strong>of</strong> 4.8 percent on long-term debt issued in March<br />
2009. The security features <strong>of</strong> <strong>the</strong>se highly rated<br />
municipal bonds attracted significantly more<br />
investors than anticipated. This favorable interest rate<br />
translates directly into more favorable borrowing costs<br />
for <strong>the</strong> District. Additionally, <strong>the</strong> District plans to<br />
issue a portion <strong>of</strong> <strong>the</strong> bonds later in <strong>the</strong> fiscal year than<br />
initially planned, which reduces <strong>the</strong> amount <strong>of</strong> FY<br />
2010 debt service costs.<br />
Certificates <strong>of</strong> Participation: The proposed budget<br />
reduces appropriations for payments on Certificates<br />
<strong>of</strong> Participation (COPs) by $755,221, to reflect <strong>the</strong><br />
schedule <strong>of</strong> debt service for <strong>the</strong> three series <strong>of</strong> COPs.<br />
Gap-Closing Initiatives: Repayment <strong>of</strong> Loans and<br />
Interest: The proposed FY 2010 gap closing budget<br />
increases Local funds appropriations by $1,913,000,<br />
as follows: The agency will align <strong>the</strong> debt service budget<br />
with new OCFO estimates as a result <strong>of</strong> increased<br />
borrowing to fund <strong>the</strong> capital project established for<br />
<strong>the</strong> purchase <strong>of</strong> 225 Virginia Avenue SE, a facility currently<br />
leased by <strong>the</strong> District.<br />
Repayment <strong>of</strong> Revenue Bonds: The proposed FY 2010<br />
gap closing budget decreases Dedicated Taxes appropriations<br />
by $1,138,800 to align <strong>the</strong> debt service budget<br />
with new OCFO estimates as a result <strong>of</strong> decreased<br />
costs for debt service on revenue bonds issued on<br />
behalf <strong>of</strong> <strong>the</strong> Housing Production Trust Fund (HP0).<br />
Debt Service<br />
G-11
FY 2009 Approved <strong>Budget</strong> to FY 2010 Proposed <strong>Budget</strong>, by Revenue Type<br />
Table DS0-4 itemizes <strong>the</strong> changes by revenue type between <strong>the</strong> FY 2009 approved budget and <strong>the</strong> FY 2010 proposed<br />
budget. The four categories <strong>of</strong> changes reflected in this table are: (1) changes to <strong>the</strong> baseline budget (includes<br />
agency request), (2) changes representing cost savings or efficiencies, (3) changes related to policy initiatives, and (4)<br />
changes to specifically address <strong>the</strong> projected revenue shortfall.<br />
Table DS0-4<br />
(dollars in thousands)<br />
PROGRAM BUDGET FTE<br />
LOCAL FUND: FY 2009 Approved <strong>Budget</strong> and FTE 453,050 0.0<br />
Initial and Baseline Adjustments<br />
To reflect increased cost <strong>of</strong> debt service because <strong>of</strong> planned borrowings in Repayment <strong>of</strong> Loans 46,401 0.0<br />
in FY 2010<br />
Policy Initiatives and Cost Savings<br />
and Interest<br />
Cost Decrease - Align debt service budget with revised estimate Repayment <strong>of</strong> Loans<br />
and Interest<br />
-37,567 0.0<br />
Gap-Closing Initiative<br />
Increase - Align debt service budget with OCFO estimate Repayment <strong>of</strong> Loans and 1,913<br />
and Interest<br />
0.0<br />
LOCAL FUND: FY 2010 Proposed <strong>Budget</strong> and FTE 463,796 0.0<br />
DEDICATED TAXES: FY 2009 Approved <strong>Budget</strong> and FTE<br />
Initial and Baseline Adjustments<br />
3,580 0.0<br />
To reflect increase in parking tax revenues dedicated to pay debt service on Repayment <strong>of</strong> Loans 1,220 0.0<br />
borrowing for 11th St. Bridge capital project and Interest<br />
DEDICATED TAXES: FY 2010 Proposed <strong>Budget</strong> and FTE 4,800 0.0<br />
SPECIAL PURPOSE REVENUE FUNDS: FY 2009 Approved <strong>Budget</strong> and FTE<br />
Initial and Baseline Adjustments<br />
3,097 0.0<br />
To reflect increase in bus shelter revenues dedicated to paying debt service Repayment <strong>of</strong> Loans 368 0.0<br />
on borrowing for Great Streets capital projects and Interest<br />
SPECIAL PURPOSE REVENUE FUNDS: FY 2010 Proposed <strong>Budget</strong> and FTE 3,465 0.0<br />
Gross for DS0 - Repayment <strong>of</strong> Loans and Interest 472,061 0.0<br />
FY 2010 Proposed <strong>Budget</strong> and <strong>Financial</strong> Plan<br />
G-12
FY 2009 Approved <strong>Budget</strong> to FY 2010 Proposed <strong>Budget</strong>, by Revenue Type<br />
Table ZA0-4 itemizes <strong>the</strong> changes by revenue type between <strong>the</strong> FY 2009 approved budget and <strong>the</strong> FY 2010 proposed<br />
budget. The four categories <strong>of</strong> changes reflected in this table are: (1) changes to <strong>the</strong> baseline budget (includes<br />
agency request), (2) changes representing cost savings or efficiencies, (3) changes related to policy initiatives, and (4)<br />
changes to specifically address <strong>the</strong> projected revenue shortfall.<br />
Table ZA0-4<br />
(dollars in thousands)<br />
PROGRAM BUDGET FTE<br />
LOCAL FUND: FY 2009 Approved <strong>Budget</strong> and FTE 9,000 0.0<br />
LOCAL FUND: FY 2010 Proposed <strong>Budget</strong> and FTE 9,000 0.0<br />
Gross for ZA0 - Repayment <strong>of</strong> Interest on Short-Term Borrowings 9,000 0.0<br />
FY 2009 Approved <strong>Budget</strong> to FY 2010 Proposed <strong>Budget</strong>, by Revenue Type<br />
Table CP0-4 itemizes <strong>the</strong> changes by revenue type between <strong>the</strong> FY 2009 approved budget and <strong>the</strong> FY 2010 proposed<br />
budget. The four categories <strong>of</strong> changes reflected in this table are: (1) changes to <strong>the</strong> baseline budget (includes<br />
agency request), (2) changes representing cost savings or efficiencies, (3) changes related to policy initiatives, and (4)<br />
changes to specifically address <strong>the</strong> projected revenue shortfall.<br />
Table CP0-4<br />
(dollars in thousands)<br />
PROGRAM BUDGET FTE<br />
LOCAL FUND: FY 2009 Approved <strong>Budget</strong> and FTE<br />
Initial and Baseline Adjustments<br />
32,791 0.0<br />
To reflect increased cost <strong>of</strong> debt service<br />
Policy Initiatives and Cost Savings<br />
Certificate <strong>of</strong> Participation 249 0.0<br />
Cost Decrease - Align budget with debt service schedule, tax assessment and<br />
fees<br />
Certificate <strong>of</strong> Participation -755 0.0<br />
LOCAL FUND: FY 2010 Proposed <strong>Budget</strong> and FTE 32,285 0.0<br />
Gross for CP0 - Certificates <strong>of</strong> Participation 32,285 0.0<br />
Debt Service<br />
G-13
FY 2009 Approved <strong>Budget</strong> to FY 2010 Proposed <strong>Budget</strong>, by Revenue Type<br />
Table ZB0-4 itemizes <strong>the</strong> changes by revenue type between <strong>the</strong> FY 2009 approved budget and <strong>the</strong> FY 2010 proposed<br />
budget. The four categories <strong>of</strong> changes reflected in this table are: (1) changes to <strong>the</strong> baseline budget (includes<br />
agency request), (2) changes representing cost savings or efficiencies, (3) changes related to policy initiatives, and (4)<br />
changes to specifically address <strong>the</strong> projected revenue shortfall.<br />
Table ZB0-4<br />
(dollars in thousands)<br />
PROGRAM BUDGET FTE<br />
LOCAL FUND: FY 2009 Approved <strong>Budget</strong> and FTE 15,000 0.0<br />
LOCAL FUND: FY 2010 Proposed <strong>Budget</strong> and FTE 15,000 0.0<br />
Gross for ZB0 - Debt Service - Issuance Costs 15,000 0.0<br />
FY 2009 Approved <strong>Budget</strong> to FY 2010 Proposed <strong>Budget</strong>, by Revenue Type<br />
Table SM0-4 itemizes <strong>the</strong> changes by revenue type between <strong>the</strong> FY 2009 approved budget and <strong>the</strong> FY 2010 proposed<br />
budget. The four categories <strong>of</strong> changes reflected in this table are: (1) changes to <strong>the</strong> baseline budget (includes<br />
agency request), (2) changes representing cost savings or efficiencies, (3) changes related to policy initiatives, and (4)<br />
changes to specifically address <strong>the</strong> projected revenue shortfall.<br />
Table SM0-4<br />
(dollars in thousands)<br />
PROGRAM BUDGET FTE<br />
LOCAL FUND: FY 2009 Approved <strong>Budget</strong> and FTE<br />
Initial and Baseline Adjustments<br />
8,613 0.0<br />
To reflect lower cost <strong>of</strong> debt service School Modernization Fund -1 0.0<br />
LOCAL FUND: FY 2010 Proposed <strong>Budget</strong> and FTE 8,612 0.0<br />
Gross for SM0 - Schools Modernization Fund 8,612 0.0<br />
FY 2009 Approved <strong>Budget</strong> to FY 2010 Proposed <strong>Budget</strong>, by Revenue Type<br />
Table DT0-4 itemizes <strong>the</strong> changes by revenue type between <strong>the</strong> FY 2009 approved budget and <strong>the</strong> FY 2010 proposed<br />
budget. The four categories <strong>of</strong> changes reflected in this table are: (1) changes to <strong>the</strong> baseline budget (includes<br />
agency request), (2) changes representing cost savings or efficiencies, (3) changes related to policy initiatives, and (4)<br />
changes to specifically address <strong>the</strong> projected revenue shortfall.<br />
Table DT0-4<br />
(dollars in thousands)<br />
PROGRAM BUDGET FTE<br />
DEDICATED TAXES: FY 2009 Approved <strong>Budget</strong> and FTE 6,000 0.0<br />
Gap-Closing Initiative<br />
Reduction - decrease is <strong>the</strong> result <strong>of</strong> lower Repayment <strong>of</strong> Revenue -1,139 0.0<br />
estimate <strong>of</strong> debt service cost Bonds<br />
DEDICATED TAXES: FY 2010 Proposed <strong>Budget</strong> and FTE 4,861 0.0<br />
Gross for DT0 - Repayment <strong>of</strong> Revenue Bonds 4,861 0.0<br />
FY 2010 Proposed <strong>Budget</strong> and <strong>Financial</strong> Plan<br />
G-14
Settlements and Judgments<br />
(ZH0)<br />
% Change<br />
FY 2008 FY 2009 FY 2010 from<br />
Description Actual Approved Proposed FY 2009<br />
Operating <strong>Budget</strong> $21,014,528 $21,477,000 $21,477,000 0.0<br />
The Settlements and Judgments (S&J) fund provides fiscal resources<br />
to settle claims and lawsuits and pay judgments in most types <strong>of</strong> civil<br />
cases filed against <strong>the</strong> District <strong>of</strong> Columbia.<br />
The agency’s FY 2010 proposed budget is presented in <strong>the</strong> following tables:<br />
FY 2010 Proposed Gross Funds Operating <strong>Budget</strong>, by Revenue Type<br />
Table ZH0-1 contains <strong>the</strong> proposed FY 2010 agency budget compared to <strong>the</strong> FY 2009 approved budget. It also<br />
provides <strong>the</strong> FY 2007 and FY 2008 actual expenditures.<br />
Table ZH0-1<br />
(dollars in thousands)<br />
Actual Actual Approved Proposed<br />
Change<br />
from Percent<br />
Appropriated Fund<br />
General Fund<br />
FY 2007 FY 2008 FY 2009 FY 2010 FY 2009 Change*<br />
Local Funds 25,029 21,015 21,477 21,477 0 0.0<br />
Total for General Fund 25,029 21,015 21,477 21,477 0 0.0<br />
Gross Funds 25,029 21,015 21,477 21,477 0 0.0<br />
*Percent Change is based on whole dollars.<br />
Note: If applicable, for a breakdown <strong>of</strong> each Grant (Federal and Private), Special Purpose Revenue type and Intra-District agreement, please refer to<br />
Schedule 80 <strong>Agency</strong> Summary by Revenue Source in <strong>the</strong> Operating Appendices located on <strong>the</strong> <strong>Office</strong> <strong>of</strong> <strong>the</strong> <strong>Chief</strong> <strong>Financial</strong> <strong>Office</strong>r’s website.<br />
Settlements and Judgments<br />
G-15
FY 2010 Proposed Operating <strong>Budget</strong>, by Comptroller Source Group<br />
Table ZH0-2 contains <strong>the</strong> proposed FY 2010 budget at <strong>the</strong> Comptroller Source Group (object class) level compared<br />
to <strong>the</strong> FY 2009 approved budget. It also provides FY 2007 and FY 2008 actual expenditures.<br />
Table ZH0-2<br />
(dollars in thousands)<br />
Actual Actual Approved Proposed<br />
Change<br />
from Percent<br />
Comptroller Source Group FY 2007 FY 2008 FY 2009 FY 2010 FY 2009 Change*<br />
40 O<strong>the</strong>r Services and Charges 25,029 21,015 21,477 21,477 0 0.0<br />
Subtotal Nonpersonal Services (NPS) 25,029 21,015 21,477 21,477 0 0.0<br />
Gross Funds 25,029 21,015 21,477 21,477 0 0.0<br />
*Percent Change is based on whole dollars.<br />
Program Description<br />
The Settlements and Judgments fund operates<br />
through <strong>the</strong> following program:<br />
Settlements and Judgments - addresses litigations<br />
against <strong>the</strong> District government. The fund is currently<br />
managed and administered by <strong>the</strong> District <strong>of</strong><br />
Columbia <strong>Office</strong> <strong>of</strong> Risk Management. The authority<br />
to settle a case is limited to $500,000; for amounts<br />
greater than $500,000, <strong>the</strong> settlement decision rests<br />
with <strong>the</strong> Mayor.<br />
FY 2010 Proposed <strong>Budget</strong> and <strong>Financial</strong> Plan<br />
G-16<br />
Program Structure Change<br />
The Settlements and Judgments fund has no program<br />
structure changes in <strong>the</strong> FY 2010 Proposed <strong>Budget</strong>.
FY 2010 Proposed Operating <strong>Budget</strong> and FTEs, by Program and Activity<br />
Table ZH0-3 contains <strong>the</strong> proposed FY 2010 budget by program and activity compared to <strong>the</strong> FY 2009 approved budget.<br />
It also provides FY 2008 actual data.<br />
Table ZH0-3<br />
(dollars in thousands)<br />
Dollars in Thousands Full-Time Equivalents<br />
Change Change<br />
Actual Approved Proposed from Actual Approved Proposed from<br />
Program/Activity FY 2008 FY 2009 FY 2010 FY 2009 FY 2008 FY 2009 FY 2010 FY 2009<br />
(1000) Settlement and Judgments<br />
(1100) Settlement and Judgments 21,015 21,477 21,477 0 0.0 0.0 0.0 0.0<br />
Subtotal (1000) Settlement and Judgments 21,015 21,477 21,477 0 0.0 0.0 0.0 0.0<br />
Total Proposed Operating <strong>Budget</strong> 21,015 21,477 21,477 0 0.0 0.0 0.0 0.0<br />
(Change is calculated by whole numbers and numbers may not add up due to rounding)<br />
Note: For more detailed information regarding <strong>the</strong> proposed funding for <strong>the</strong> activities within this agency’s programs, please see<br />
Schedule 30-PBB Program Summary By Activity in <strong>the</strong> FY 2010 Operating Appendices located on <strong>the</strong> <strong>Office</strong> <strong>of</strong> <strong>the</strong> <strong>Chief</strong><br />
<strong>Financial</strong> <strong>Office</strong>r’s website.<br />
Major Baseline Adjustments, Cost Savings<br />
and Policy Initiatives<br />
Initial Adjustment: In anticipation <strong>of</strong> additional<br />
claims, <strong>the</strong> agency had an increase <strong>of</strong> $15,000,000 in<br />
<strong>the</strong> Settlements and Judgments program.<br />
FY 2009 Approved <strong>Budget</strong> to FY 2010 Proposed <strong>Budget</strong>, by Revenue Type<br />
Table ZH0-4 itemizes <strong>the</strong> changes by revenue type between <strong>the</strong> FY 2009 approved budget and <strong>the</strong> FY 2010 proposed<br />
budget. The four categories <strong>of</strong> changes reflected in this table are: (1) changes to <strong>the</strong> baseline budget (includes<br />
agency request), (2) changes representing cost savings or efficiencies, (3) changes related to policy initiatives, and (4)<br />
changes to specifically address <strong>the</strong> projected revenue shortfall.<br />
Table ZH0-4<br />
(dollars in thousands)<br />
Baseline Adjustments: A baseline decision to restore<br />
<strong>the</strong> Settlements and Judgments program back to <strong>the</strong><br />
FY 2009 funding level resulted in a reduction <strong>of</strong><br />
$15,000,000.<br />
PROGRAM BUDGET FTE<br />
LOCAL FUND: FY 2009 Approved <strong>Budget</strong> and FTE 21,477 0.0<br />
Initial and Baseline Adjustments<br />
Intra-<strong>Agency</strong> Changes - Increase in o<strong>the</strong>r services and charges S&J 15,000 0.0<br />
Baseline Adjustments: Intra-<strong>Agency</strong> Changes - Decrease in o<strong>the</strong>r services S&J -15,000 0.0<br />
and charges<br />
LOCAL FUND: FY 2010 Proposed <strong>Budget</strong> and FTE 21,477 0.0<br />
Gross for ZH0 - Settlements and Judgments 21,477 0.0<br />
Settlements and Judgments<br />
G-17
John A. Wilson Building Fund<br />
(ZZ0)<br />
% Change<br />
FY 2008 FY 2009 FY 2010 from<br />
Description Actual Approved Proposed FY 2009<br />
Operating <strong>Budget</strong> $4,147,236 $4,058,067 $3,625,136 -10.7<br />
The mission <strong>of</strong> <strong>the</strong> John A. Wilson Building Fund is to provide an efficient,<br />
clean and safe working environment for District employees in a<br />
modernized century-old historic building. Easily accessible to <strong>the</strong> public,<br />
<strong>the</strong> Wilson Building is an emblem <strong>of</strong> District pride showcased on<br />
<strong>the</strong> elegant Pennsylvania Avenue corridor within <strong>the</strong> Federal Triangle,<br />
just blocks from <strong>the</strong> White House.<br />
Culminating a five-year renovation, expansion, and<br />
restoration, <strong>the</strong> Wilson Building reopened to acclaim<br />
in late 2001. Built in 1904 and later named after <strong>the</strong><br />
long-term District Council member and Chairman,<br />
<strong>the</strong> building had suffered from neglect and had to be<br />
closed in 1996. But preservation-minded District<br />
<strong>of</strong>ficials emerged with a redevelopment plan, and<br />
starting in 1996, <strong>the</strong> Wilson Building underwent renovation<br />
based on plans from architect Shalom<br />
Baranes. The result is a modern workplace for District<br />
government that retains much <strong>of</strong> its historic flavor<br />
and texture.<br />
Housed in <strong>the</strong> building are <strong>the</strong> Executive <strong>Office</strong><br />
<strong>of</strong> <strong>the</strong> Mayor, <strong>the</strong> D.C. Council, <strong>the</strong> <strong>Office</strong> <strong>of</strong> <strong>the</strong><br />
<strong>Chief</strong> <strong>Financial</strong> <strong>Office</strong>r, and a number <strong>of</strong> o<strong>the</strong>r<br />
District agencies. The Wilson Building will serve <strong>the</strong><br />
District for many years, while preserving a link to <strong>the</strong><br />
past.<br />
The agency’s FY 2010 proposed budget is presented<br />
in <strong>the</strong> following tables:<br />
John A. Wilson Building Fund<br />
G-19
FY 2010 Proposed Gross Funds Operating <strong>Budget</strong>, by Revenue Type<br />
Table ZZ0-1 contains <strong>the</strong> proposed FY 2010 agency budget compared to <strong>the</strong> FY 2009 approved budget. It also<br />
provides FY 2007 and FY 2008 actual expenditures.<br />
Table ZZ0-1<br />
(dollars in thousands)<br />
Actual Actual Approved Proposed<br />
Change<br />
from Percent<br />
Appropriated Fund<br />
General Fund<br />
FY 2007 FY 2008 FY 2009 FY 2010 FY 2009 Change*<br />
Local Funds 3,763 4,147 4,058 3,625 -433 -10.7<br />
Total for General Fund 3,763 4,147 4,058 3,625 -433 -10.7<br />
Gross Funds 3,763 4,147 4,058 3,625 -433 -10.7<br />
*Percent Change is based on whole dollars.<br />
Note: If applicable, for a breakdown <strong>of</strong> each Grant (Federal and Private), Special Purpose Revenue type and Intra-District agreement,<br />
please refer to Schedule 80, <strong>Agency</strong> Summary by Revenue Source, in <strong>the</strong> Operating Appendices located on <strong>the</strong> <strong>Office</strong> <strong>of</strong> <strong>the</strong> <strong>Chief</strong><br />
<strong>Financial</strong> <strong>Office</strong>r’s website.<br />
FY 2010 Proposed Operating <strong>Budget</strong>, by Comptroller Source Group<br />
Table ZZ0-2 contains <strong>the</strong> proposed FY 2010 budget at <strong>the</strong> Comptroller Source Group (object class) level compared<br />
to <strong>the</strong> FY 2009 approved budget. It also provides FY 2007 and FY 2008 actual expenditures.<br />
Table ZZ0-2<br />
(dollars in thousands)<br />
Actual Actual Approved Proposed<br />
Change<br />
from Percent<br />
Comptroller Source Group FY 2007 FY 2008 FY 2009 FY 2010 FY 2009 Change*<br />
30 Energy, Comm. and Bldg Rentals 651 690 581 939 358 61.7<br />
32 Rentals - Land and Structures 1,346 1,472 1,500 1,545 45 3.0<br />
33 Janitorial Services 0 0 0 6 6 N/A<br />
34 Security Services 1,767 1,945 1,978 1,135 -842 -42.6<br />
35 Occupancy Fixed Costs 0 0 0 0 0 N/A<br />
40 O<strong>the</strong>r Services and Charges 0 39 0 0 0 N/A<br />
Subtotal Nonpersonal Services (NPS) 3,763 4,147 4,058 3,625 -433 -10.7<br />
Gross Funds 3,763 4,147 4,058 3,625 -433 -10.7<br />
*Percent Change is based on whole dollars.<br />
FY 2010 Proposed <strong>Budget</strong> and <strong>Financial</strong> Plan<br />
G-20
Program Description<br />
The John A. Wilson Building Fund operates through<br />
<strong>the</strong> following program:<br />
John A. Wilson Building - provides <strong>of</strong>fice space for<br />
<strong>the</strong> Executive <strong>Office</strong> <strong>of</strong> <strong>the</strong> Mayor, <strong>the</strong> D.C. Council,<br />
<strong>the</strong> <strong>Office</strong> <strong>of</strong> <strong>the</strong> <strong>Chief</strong> <strong>Financial</strong> <strong>Office</strong>r, and a number<br />
<strong>of</strong> o<strong>the</strong>r District agencies.<br />
FY 2010 Proposed Operating <strong>Budget</strong> and FTEs, by Program and Activity<br />
Table ZZ0-3 contains <strong>the</strong> proposed FY 2010 budget by program and activity compared to <strong>the</strong> FY 2009 approved budget.<br />
It also provides FY 2008 actual data.<br />
Table ZZ0-3<br />
(dollars in thousands)<br />
Dollars in Thousands Full-Time Equivalents<br />
Change Change<br />
Actual Approved Proposed from Actual Approved Proposed from<br />
Program/Activity FY 2008 FY 2009 FY 2010 FY 2009 FY 2008 FY 2009 FY 2010 FY 2009<br />
(1000) Wilson Building<br />
(1100) Wilson Building 4,147 4,058 3,625 -433 0.0 0.0 0.0 0.0<br />
Subtotal (1000) Wilson Building 4,147 4,058 3,625 -433 0.0 0.0 0.0 0.0<br />
Total Proposed Operating <strong>Budget</strong> 4,147 4,058 3,625 -433 0.0 0.0 0.0 0.0<br />
(Change is calculated by whole numbers and numbers may not add up due to rounding)<br />
Program Structure Change<br />
The John A. Wilson Building Fund had no program<br />
structure changes in <strong>the</strong> FY 2010 Proposed <strong>Budget</strong>.<br />
Note: For more detailed information regarding <strong>the</strong> proposed funding for <strong>the</strong> activities within this agency’s programs, please see Schedule 30-PBB<br />
Program Summary By Activity in <strong>the</strong> FY 2010 Operating Appendices located on <strong>the</strong> <strong>Office</strong> <strong>of</strong> <strong>the</strong> <strong>Chief</strong> <strong>Financial</strong> <strong>Office</strong>r’s website.<br />
John A. Wilson Building Fund<br />
G-21
Major Baseline Adjustments, Cost Savings<br />
and Policy Initiatives<br />
Initial Adjustment: The Wilson Building Fund<br />
increased fixed costs by $511,209 due to revised estimates<br />
for energy and security in <strong>the</strong> Wilson Building<br />
program.<br />
FY 2010 Proposed <strong>Budget</strong> and <strong>Financial</strong> Plan<br />
G-22<br />
Baseline Adjustments: The Wilson Building Fund<br />
reduced fixed costs by $914,778, primarily due to<br />
revised estimates for security in <strong>the</strong> Wilson Building<br />
program<br />
FY 2009 Approved <strong>Budget</strong> to FY 2010 Proposed <strong>Budget</strong>, by Revenue Type<br />
Table ZZ0-4 itemizes <strong>the</strong> changes by revenue type between <strong>the</strong> FY 2009 approved budget and <strong>the</strong> FY 2010 proposed<br />
budget. The four categories <strong>of</strong> changes reflected in this table are: (1) changes to <strong>the</strong> baseline budget (includes<br />
agency request), (2) changes representing cost savings or efficiencies, (3) changes related to policy initiatives, and (4)<br />
changes to specifically address <strong>the</strong> projected revenue shortfall.<br />
Table ZZ0-4<br />
(dollars in thousands)<br />
Program BUDGET FTE<br />
LOCAL FUND: FY 2009 Approved <strong>Budget</strong> and FTE 4,058 0.0<br />
Initial and Baseline Adjustments<br />
Net effect <strong>of</strong> fixed cost adjustments - A net increase in energy and security Wilson Building 511 0.0<br />
fixed costs.<br />
Baseline Adjustments: Net effect <strong>of</strong> fixed cost adjustments - A net decrease Wilson Building -915 0.0<br />
across multiple fixed cost commodities.<br />
Policy Initiatives and Cost Savings<br />
Cost Decrease - Align electricity budget with OPM estimates Wilson Building -29 0.0<br />
Cost Decrease - Align occupancy budget with revised OPM estimates Wilson Building 0 0.0<br />
LOCAL FUND: FY 2010 Proposed <strong>Budget</strong> and FTE 3,625 0.0<br />
Gross for ZZ0 - John A. Wilson Building Fund 3,625 0.0
Workforce Investments<br />
(UP0)<br />
% Change<br />
FY 2008 FY 2009 FY 2010 from<br />
Description Actual Approved Proposed FY 2009<br />
Operating <strong>Budget</strong> $0 $26,691,000 $0 -100.0<br />
The mission <strong>of</strong> Workforce Investments is to provide for anticipated<br />
compensation increases for nonunion and union District employees.<br />
Each year, <strong>the</strong> District budgets an amount for<br />
Workforce Investments for pay increases and<br />
reforms that are expected in <strong>the</strong> budgeted year<br />
but are not finalized. Employees covered and dollar<br />
amounts vary from year to year, depending on<br />
what compensation changes are final or still outstanding.<br />
The <strong>Office</strong> <strong>of</strong> <strong>Budget</strong> and Planning<br />
develops estimates for <strong>the</strong> Workforce Investments<br />
FY 2010 Proposed Gross Funds Operating <strong>Budget</strong>, by Revenue Type<br />
Table UP0-1 contains <strong>the</strong> proposed FY 2010 agency budget compared to <strong>the</strong> FY 2009 approved budget. It also<br />
provides FY 2007 and FY 2008 actual expenditures.<br />
Table UP0-1<br />
(dollars in thousands)<br />
Actual Actual Approved Proposed<br />
Change<br />
from Percent<br />
Appropriated Fund<br />
General Fund<br />
FY 2007 FY 2008 FY 2009 FY 2010 FY 2009 Change*<br />
Local Funds 0 0 26,691 0 -26,691 -100.0<br />
Total for General Fund 0 0 26,691 0 -26,691 -100.0<br />
Gross Funds 0 0 26,691 0 -26,691 -100.0<br />
*Percent Change is based on whole dollars.<br />
budget in consultation with <strong>the</strong> D.C.<br />
Department <strong>of</strong> Human Resources, <strong>the</strong> <strong>Office</strong> <strong>of</strong><br />
Labor Relations and Collective Bargaining, and<br />
<strong>the</strong> <strong>Office</strong> <strong>of</strong> <strong>the</strong> City Administrator.<br />
The agency’s FY 2010 proposed budget is presented<br />
in <strong>the</strong> following tables:<br />
Note: If applicable, for a breakdown <strong>of</strong> each Grant (Federal and Private), Special Purpose Revenue type and Intra-District agreement, please refer to<br />
Schedule 80 <strong>Agency</strong> Summary by Revenue Source in <strong>the</strong> Operating Appendices located on <strong>the</strong> <strong>Office</strong> <strong>of</strong> <strong>the</strong> <strong>Chief</strong> <strong>Financial</strong> <strong>Office</strong>r’s website.<br />
Workforce Investments<br />
G-23
FY 2010 Proposed Operating <strong>Budget</strong>, by Comptroller Source Group<br />
Table UP0-2 contains <strong>the</strong> proposed FY 2010 budget at <strong>the</strong> Comptroller Source Group (object class) level compared<br />
to <strong>the</strong> FY 2009 approved budget. It also provides FY 2007 and FY 2008 actual expenditures.<br />
Table UP0-2<br />
(dollars in thousands)<br />
Actual Actual Approved Proposed<br />
Change<br />
from Percent<br />
Comptroller Source Group FY 2007 FY 2008 FY 2009 FY 2010 FY 2009 Change*<br />
11 Regular Pay - Cont. Full Time 0 0 23,395 0 -23,395 -100.0<br />
14 Fringe Benefits - Curr. Personnel 0 0 3,296 0 -3,296 -100.0<br />
Subtotal Personal Services (PS) 0 0 26,691 0 -26,691 -100.0<br />
Gross Funds 0 0 26,691 0 -26,691 -100.0<br />
*Percent Change is based on whole dollars.<br />
Program Description<br />
Workforce Investments operates through <strong>the</strong> following<br />
program:<br />
Workforce Investments - Includes salary and benefits<br />
related to pay raises that are expected in <strong>the</strong> budgeted<br />
year but are not finalized.<br />
FY 2010 Proposed Operating <strong>Budget</strong> and FTEs, by Program and Activity<br />
Table UP0-3 contains <strong>the</strong> proposed FY 2010 budget by program and activity compared to <strong>the</strong> FY 2009 approved budget.<br />
It also provides FY 2008 actual data.<br />
Table UP0-3<br />
(dollars in thousands)<br />
Dollars in Thousands Full-Time Equivalents<br />
Change Change<br />
Actual Approved Proposed from Actual Approved Proposed from<br />
Program/Activity FY 2008 FY 2009 FY 2010 FY 2009 FY 2008 FY 2009 FY 2010 FY 2009<br />
(1000) Workforce Investments<br />
(1100) Workforce Investments 0 26,691 0 -26,691 0.0 0.0 0.0 0.0<br />
Subtotal (1000) Workforce Investments 0 26,691 0 -26,691 0.0 0.0 0.0 0.0<br />
Total Proposed Operating <strong>Budget</strong> 0 26,691 0 -26,691 0.0 0.0 0.0 0.0<br />
(Change is calculated by whole numbers and numbers may not add up due to rounding)<br />
FY 2010 Proposed <strong>Budget</strong> and <strong>Financial</strong> Plan<br />
G-24<br />
Program Structure Change<br />
Workforce Investments had no program structure<br />
changes in <strong>the</strong> FY 2010 Proposed <strong>Budget</strong>.<br />
Note: For more detailed information regarding <strong>the</strong> proposed funding for <strong>the</strong> activities within this agency’s programs, please see Schedule 30-PBB<br />
Program Summary by Activity in <strong>the</strong> FY 2010 Operating Appendices located on <strong>the</strong> <strong>Office</strong> <strong>of</strong> <strong>the</strong> <strong>Chief</strong> <strong>Financial</strong> <strong>Office</strong>r’s website.
Major Baseline Adjustments, Cost Savings<br />
and Policy Initiatives<br />
Baseline adjustment: Workforce Investments had<br />
a baseline increase <strong>of</strong> $10,155,590 in local funds<br />
for regular pay and fringe benefits for anticipated<br />
raises and contract negotiations.<br />
Transfers: The terms <strong>of</strong> <strong>the</strong> District’s collective bargaining<br />
agreement with Compensation Units 1 & 2<br />
require <strong>the</strong> District to set aside $893,000 for affordable<br />
housing opportunities available to members <strong>of</strong><br />
that union. The proposed budget transfers <strong>the</strong>se<br />
funds to <strong>the</strong> Department <strong>of</strong> Housing and<br />
Community Development to support <strong>the</strong> Employer<br />
Assisted Housing Program (EAHP). The funds<br />
transferred to EAHP will support housing opportunities<br />
provided only to members <strong>of</strong> Compensation<br />
Units 1 & 2.<br />
FY 2009 Approved <strong>Budget</strong> to FY 2010 Proposed <strong>Budget</strong><br />
By enacting Resolution 18-31, effective March 3,<br />
2009, <strong>the</strong> Council approved a collective bargaining<br />
agreement between <strong>the</strong> District and certain metal<br />
trades workers <strong>of</strong> <strong>the</strong> Department <strong>of</strong> Mental Health.<br />
The proposed budget transfers $242,562 from <strong>the</strong><br />
Workforce Investment Fund to <strong>the</strong> Department <strong>of</strong><br />
Mental Health to cover <strong>the</strong> agreement’s effect on<br />
compensation.<br />
Cost Savings: After <strong>the</strong> transfers described above, <strong>the</strong><br />
proposed budget reduces <strong>the</strong> Workforce Investments<br />
fund by $35,711,028 from <strong>the</strong> baseline budget. The<br />
proposed budget contains no provisions for additional<br />
compensation through collective bargaining in FY<br />
2010. This proposal is consistent with <strong>the</strong> District’s<br />
balanced budget policy and <strong>the</strong> financial management<br />
requirements <strong>of</strong> <strong>the</strong> Home Rule Act.<br />
Table UP0-4 itemizes <strong>the</strong> changes by revenue type between <strong>the</strong> FY 2009 approved budget and <strong>the</strong> FY 2010 proposed<br />
budget. The four categories <strong>of</strong> changes reflected in this table are: (1) changes to <strong>the</strong> baseline budget (includes<br />
agency request), (2) changes representing cost savings or efficiencies, (3) changes related to policy initiatives, and (4)<br />
changes to specifically address <strong>the</strong> projected revenue shortfall.<br />
Table UP0-4<br />
(dollars in thousands)<br />
PROGRAM BUDGET FTE<br />
LOCAL FUND: FY 2009 Approved <strong>Budget</strong> and FTE 26,691 0.0<br />
Initial and Baseline Adjustments<br />
Baseline Adjustments: Net effect <strong>of</strong> salary and benefits changes - Workforce Investments 10,156 0.0<br />
Increase in regular pay for anticipated raises and contract negotiations<br />
Policy Initiatives and Cost Savings<br />
Transfer Out - Allocate affordable housing assistance funds set aside Workforce Investments -893 0.0<br />
pursuant to CU1&2 agreement to <strong>the</strong> DHCD Employer Assisted<br />
Housing program<br />
Transfer Out - Allocate funds to DMH to implement an approved Workforce Investments -243 0.0<br />
agreement with Metal Trades bargaining unit.<br />
Cost Savings - Align Workforce Investments appropriations with <strong>the</strong> Workforce Investments -35,711 0.0<br />
District's bargaining position.<br />
LOCAL FUND: FY 2010 Proposed <strong>Budget</strong> and FTE 0 0.0<br />
Gross for UP0 - Workforce Investments 0 0.0<br />
Workforce Investments<br />
G-25
Non-Departmental<br />
Use <strong>of</strong> a non-departmental account is a common<br />
practice to include specific costs, while providing <strong>the</strong><br />
flexibility to project, budget, and allocate <strong>the</strong>se costs.<br />
Non-Departmental budget is allocated to specific<br />
agencies after certain conditions are met.<br />
(DO0)<br />
% Change<br />
FY 2008 FY 2009 FY 2010 from<br />
Description Actual Approved Proposed FY 2009<br />
Operating <strong>Budget</strong> $0 $39,278,959 $3,603,410 -90.8<br />
The mission <strong>of</strong> Non-Departmental is to budget for anticipated costs<br />
that were not allocated to specific agencies during <strong>the</strong> development <strong>of</strong><br />
<strong>the</strong> proposed budget to ensure that specific use requirements are met.<br />
The agency’s FY 2010 proposed budget is presented<br />
in <strong>the</strong> following tables:<br />
FY 2010 Proposed Gross Funds Operating <strong>Budget</strong>, by Revenue Type<br />
Table DO0-1 contains <strong>the</strong> proposed FY 2010 agency budget compared to <strong>the</strong> FY 2009 approved budget. It also<br />
provides <strong>the</strong> FY 2007 and FY 2008 actual expenditures.<br />
Table DO-1<br />
(dollars in thousands)<br />
Actual Actual Approved Proposed<br />
Change<br />
from Percent<br />
Appropriated Fund<br />
General Fund<br />
FY 2007 FY 2008 FY 2009 FY 2010 FY 2009 Change*<br />
Local Funds 0 0 10,438 3,603 -6,835 -65.5<br />
Special Purpose Revenue Funds 0 0 28,841 0 -28,841 -100.0<br />
Total for General Fund 0 0 39,279 3,603 -35,676 -90.8<br />
Gross Funds 0 0 39,279 3,603 -35,676 -90.8<br />
*Percent Change is based on whole dollars.<br />
Note: If applicable, for a breakdown <strong>of</strong> each Grant (Federal and Private), Special Purpose Revenue type and Intra-District agreement, please refer to<br />
Schedule 80 <strong>Agency</strong> Summary by Revenue Source in <strong>the</strong> Operating Appendices located on <strong>the</strong> <strong>Office</strong> <strong>of</strong> <strong>the</strong> <strong>Chief</strong> <strong>Financial</strong> <strong>Office</strong>r’s website.<br />
Non-Departmental<br />
G-27
FY 2010 Proposed Operating <strong>Budget</strong>, by Comptroller Source Group<br />
Table DO0-2 contains <strong>the</strong> proposed FY 2010 budget at <strong>the</strong> Comptroller Source group (object class) level compared<br />
to <strong>the</strong> FY 2009 approved budget. It also provides FY 2007 and FY 2008 actual expenditures.<br />
Table DO0-2<br />
(dollars in thousands)<br />
Actual Actual Approved Proposed<br />
Change<br />
from Percent<br />
Comptroller Source Group FY 2007 FY 2008 FY 2009 FY 2010 FY 2009 Change*<br />
30 Energy, Comm. and Bldg Rentals 0 0 0 2,439 2,439 N/A<br />
32 Rentals - Land and Structures 0 0 10,438 0 -10,438 -100.0<br />
34 Security Services 0 0 0 360 360 N/A<br />
35 Occupancy Fixed Costs 0 0 0 668 668 N/A<br />
50 Subsidies and Transfers 0 0 28,841 136 -28,704 -99.5<br />
Subtotal Nonpersonal Services (NPS) 0 0 39,279 3,603 -35,676 -90.8<br />
Gross Funds 0 0 39,279 3,603 -35,676 -90.8<br />
*Percent Change is based on whole dollars.<br />
Program Description<br />
Non-Departmental operates through 1 program:<br />
Non-Departmental - budgets for anticipated costs<br />
not allocated to agencies.<br />
FY 2010 Proposed Operating <strong>Budget</strong> and FTEs, by Program and Activity<br />
Table DO0-3 contains <strong>the</strong> proposed FY 2010 budget by program and activity compared to <strong>the</strong> FY 2009 approved budget.<br />
It also provides <strong>the</strong> FY 2008 actual data.<br />
Table DO0-3<br />
(dollars in thousands)<br />
Dollars in Thousands Full-Time Equivalents<br />
Change Change<br />
Actual Approved Proposed from Actual Approved Proposed from<br />
Program/Activity<br />
(1000) Non-Departmental<br />
FY 2008 FY 2009 FY 2010 FY 2009 FY 2008 FY 2009 FY 2010 FY 2009<br />
(1100) Non-Departmental 0 39,279 3,603 -35,676 0.0 0.0 0.0 0.0<br />
Subtotal (1000) Non-Departmental 0 39,279 3,603 -35,676 0.0 0.0 0.0 0.0<br />
Total Proposed Operating <strong>Budget</strong> 0 39,279 3,603 -35,676 0.0 0.0 0.0 0.0<br />
(Change is calculated by whole numbers and numbers may not add up due to rounding)<br />
Note: For more detailed information regarding <strong>the</strong> proposed funding for <strong>the</strong> activities within this agency’s programs, please see Schedule 30-PBB Program<br />
Summary by Activity in <strong>the</strong> FY 2010 Operating Appendices located on <strong>the</strong> <strong>Office</strong> <strong>of</strong> <strong>the</strong> <strong>Chief</strong> <strong>Financial</strong> <strong>Office</strong>r’s website.<br />
FY 2010 Proposed <strong>Budget</strong> and <strong>Financial</strong> Plan<br />
G-28<br />
Program Structure Change<br />
Non-Departmental had no program structure<br />
changes in <strong>the</strong> FY 2010 Proposed <strong>Budget</strong>.
Major Baseline Adjustments, Cost Savings<br />
and Policy Initiatives<br />
Initial Adjustments: Non-Departmental had a net<br />
increase <strong>of</strong> $2,309,586 in Local funds for agency<br />
managed fixed costs and a net decrease <strong>of</strong><br />
$28,840,959 in Special Purpose Revenue (SPR)<br />
funds due to <strong>the</strong> elimination <strong>of</strong> <strong>the</strong> FY 2009 budget.<br />
The FY 2009 SPR budget was based on <strong>the</strong> excess<br />
certified revenue over budget and is unrelated to any<br />
potential budget for FY 2010.<br />
Cost Increase: In FY 2010, <strong>the</strong> Non-Departmental<br />
account includes fixed costs for 20 vacant buildings<br />
owned by <strong>the</strong> District. The <strong>Office</strong> <strong>of</strong> Property<br />
Management developed <strong>the</strong> fixed cost budget for<br />
unoccupied property, including former public schools<br />
and shelters, by determining <strong>the</strong> minimum level <strong>of</strong><br />
utilities, security and facility maintenance needed to<br />
keep <strong>the</strong> facilities operating. The estimates are based<br />
on reducing <strong>the</strong> historical facility costs by 75 percent<br />
when <strong>the</strong> buildings were in operation. This budget<br />
assumes <strong>the</strong> bare minimum to keep <strong>the</strong> buildings systems<br />
functional, leaving some lights on to keep out<br />
trespassers and providing heat to prevent pipes from<br />
bursting. The security budget enables <strong>the</strong> OPM<br />
Protective Services division to monitor <strong>the</strong> buildings<br />
to ensure that <strong>the</strong>y have not been damaged or occupied<br />
by trespassers. The occupancy budget funds <strong>the</strong><br />
basic maintenance <strong>of</strong> <strong>the</strong> buildings, such as cutting<br />
<strong>the</strong> grass, removing snow, and boarding up or replacing<br />
broken windows. These repairs prevent <strong>the</strong><br />
District government from contributing to blight in<br />
neighborhoods; ensure that facility start-up costs will<br />
not be prohibitive when <strong>the</strong> facilities are returned to<br />
productive use; and ensure that <strong>the</strong>se District-owned<br />
facilities do not become liabilities for <strong>the</strong>ir neighborhoods.<br />
In large part, due to <strong>the</strong> dramatic slowdown in<br />
real estate markets and, particularly, <strong>the</strong> scarcity <strong>of</strong><br />
affordable credit for real estate transactions, <strong>the</strong> tentative<br />
agreements failed to result in <strong>the</strong> transfer <strong>of</strong> <strong>the</strong><br />
District’s lease for this building. The District now<br />
plans to prepare <strong>the</strong> building for a public purpose.<br />
Fixed costs for 20 facilities are included in <strong>the</strong> Non-<br />
Departmental account:<br />
Vacant Property, 225 Virginia Avenue, SE<br />
Bunker Hill, 1401 Michigan Avenue, NE<br />
Green, 1500 Minnesota Avenue, SE<br />
Wilkinson, 2350 Pomeroy Road, SE<br />
M.M. Washington, 27 O Street, NW<br />
Bruce Monroe, 3012 Georgia Avenue, NW<br />
Gibbs, 500 19th Street, NE<br />
Backus, 5171 South Dakota Avenue, NE<br />
Rudolph, 5200 2nd Street, NW<br />
Brown-Young, 820 26th Street, NE<br />
801 East, 2700 MLK Avenue, SE<br />
Franklin Shelter, 925 13th Street, NW<br />
Gales Housing for Women, 65 Massachusetts<br />
Avenue, NW<br />
Benning, 100 41st Street, NE<br />
Slowe, 1404 Jackston Street, NE<br />
Douglass, 2600 Douglass Road, SE<br />
Taft, 1800 Perry Street, NE<br />
J.F. Cook, 30 P Street, NW<br />
Clark, 4501 7th Street, NW<br />
Gage-Eckington, 2025 3rd Street, NW<br />
In addition, $27,500,000 is transferred in from<br />
<strong>the</strong> District <strong>of</strong> Columbia Public Schools budget,<br />
pending verification <strong>of</strong> enrollment levels in <strong>the</strong> school<br />
system.<br />
Gap-Closing Initiatives: The Non-Departmental<br />
budget included one-time funding for fixed costs<br />
associated with 20 vacant buildings owned by <strong>the</strong><br />
District government, <strong>of</strong> which $9,230,329 was for<br />
<strong>the</strong> cost <strong>of</strong> leasing <strong>the</strong> property at Virginia Avenue,<br />
SE. Since <strong>the</strong> District has decided to purchase <strong>the</strong><br />
property, <strong>the</strong> Non-Departmental budget is being<br />
reduced by <strong>the</strong> $9,230,329. Additionally,<br />
$24,163,515 is being reallocated to <strong>the</strong> District <strong>of</strong><br />
Columbia Public Schools, and $3,200,000 that had<br />
been reserved in <strong>the</strong> event <strong>of</strong> higher-than-budgeted<br />
enrollment has been eliminated.<br />
Non-Departmental<br />
G-29
FY 2009 Approved <strong>Budget</strong> to FY 2010 Proposed <strong>Budget</strong>, by Revenue Type<br />
Table DO0-4 itemizes <strong>the</strong> changes by revenue type between <strong>the</strong> FY 2009 approved budget and <strong>the</strong> FY 2010 proposed<br />
budget. The four categories <strong>of</strong> changes reflected in this table are: (1) changes to <strong>the</strong> baseline budget (includes<br />
agency request), (2) changes representing cost savings or efficiencies, (3) changes related to policy initiatives, and<br />
(4) changes to specifically address <strong>the</strong> projected revenue shortfall.<br />
Table DO0-4<br />
(dollars in thousands)<br />
PROGRAM BUDGET FTE<br />
LOCAL FUND: FY 2009 Approved <strong>Budget</strong> and FTE 10,438 0.0<br />
Initial and Baseline Adjustments<br />
Baseline Adjustments: Net effect <strong>of</strong> fixed cost adjustments -<br />
An increase in agency managed fixed costs Non-Departmental 2,310 0.0<br />
Policy Initiatives and Cost Savings<br />
Cost Decrease - Align occupancy budget with revised OPM estimates Non-Departmental -64 0.0<br />
Cost Increase - Align heating fuel budget with OPM estimates Non-Departmental 16 0.0<br />
Cost Decrease - Align electricity budget with revised OPM estimates Non-Departmental -5 0.0<br />
Cost Increase - Align natural gas budget with revised OPM estimates Non-Departmental 1 0.0<br />
Cost Increase - Align water and sewer budget with revised OPM estimates Non-Departmental 2 0.0<br />
Cost Increase - Transfer <strong>of</strong> funding from DCPS to Non-Departmental until an Non-Departmental 27,500 0.0<br />
updated preliminary audited student enrollment is provided<br />
Gap-Closing Initiatives<br />
Reduction - Savings resulting from estimated decrease in student enrollment Non-Departmental -3,200 0.0<br />
Reduction - Funding for Virginia Avenue Non-Departmental -9,230 0.0<br />
Transfer - allocate funding to DCPS Non-Departmental -24,164 0.0<br />
LOCAL FUND: FY 2010 Proposed <strong>Budget</strong> and FTE 3,603 0.0<br />
SPECIAL PURPOSE REVENUE FUNDS: FY 2009 Approved <strong>Budget</strong> and FTE 28,841 0.0<br />
Initial and Baseline Adjustments<br />
Baseline Adjustments: - A decrease in subsidies and transfers due to <strong>the</strong><br />
elimination <strong>of</strong> <strong>the</strong> FY 2009 budget for unbudgeted Special Purpose Revenue Non-Departmental -28,841 0.0<br />
SPECIAL PURPOSE REVENUE FUNDS: FY 2010 Proposed <strong>Budget</strong> and FTE 0 0.0<br />
Gross for DO0 - Non-Departmental 3,603 0.0<br />
FY 2010 Proposed <strong>Budget</strong> and <strong>Financial</strong> Plan<br />
G-30
Emergency Planning and Security<br />
Fund<br />
(EP0)<br />
% Change<br />
FY 2008 FY 2009 FY 2010 from<br />
Description Actual Approved Proposed FY 2009<br />
Operating <strong>Budget</strong> $11,214,704 $0 $0 N/A<br />
Note: The total FY 2008 expenditures reflected under <strong>the</strong> Federal Payment authority in <strong>the</strong> System <strong>of</strong> Accounting and Reporting (SOAR) ($ 1,214,704) will<br />
not tie to <strong>the</strong> approved expenditures ($ 1,237,619) listed below. This discrepancy is a result <strong>of</strong> <strong>the</strong> FY 2008 4th quarter reimbursement being received after<br />
<strong>the</strong> close <strong>of</strong> FY 2008.<br />
The mission <strong>of</strong> <strong>the</strong> Emergency Planning and Security Fund is to<br />
record expenses for which federal funding has been approved under<br />
<strong>the</strong> authority found in <strong>the</strong> federal payment for Emergency Planning<br />
and Security Costs section <strong>of</strong> <strong>the</strong> District’s annual Appropriations Act.<br />
The costs shown below are generally related to:<br />
■ Providing public safety at events related to <strong>the</strong><br />
presence <strong>of</strong> <strong>the</strong> nation's capital in <strong>the</strong> District; and<br />
■ Providing response support to immediate and<br />
specific terrorist threats or attacks in <strong>the</strong> District<br />
and surrounding jurisdictions.<br />
Prior to FY 2009, this payment operated on a<br />
reimbursable basis and Federal apportionment restrictions<br />
required potentially eligible expenditures to<br />
remain under District Local funds budget authority<br />
until approved for reimbursement by <strong>the</strong> Director,<br />
<strong>Office</strong> <strong>of</strong> Management and <strong>Budget</strong>. Upon approval,<br />
expenditures would be transferred to federal payment<br />
budget authority. However, Public Law 111-8,<br />
signed by <strong>the</strong> President on March 11, 2009, changed<br />
this reimbursable program to a direct federal payment<br />
in FY 2009.<br />
Emergency Planning and Security Fund<br />
G-31
FY 2010 Proposed <strong>Budget</strong> and <strong>Financial</strong> Plan<br />
G-32<br />
The FY 2008 federal payment activity within <strong>the</strong> EPSF was as follows:<br />
Unexpended balance carried forward from FY 2007: $15,240,239<br />
FY 2008 approved budget: $3,000,000<br />
Total Available in FY 2008: $18,240,239<br />
FY 2008 approved expenditures by agency are:<br />
Metropolitan Police Department $9,593,267<br />
Fire and Emergency Medical Services 1,520,600<br />
District Department <strong>of</strong> Transportation 58,043<br />
Department <strong>of</strong> Public Works 49,312<br />
DC Homeland Security and Emergency Management <strong>Agency</strong> 16,397<br />
Total $11,237,619<br />
FY 2008 expenditures by event are:<br />
International Monetary Fund protest $7,114,671<br />
FEMS response to federal property 1,324,580<br />
Foreign dignitary protection 1,110,090<br />
MPD demonstration/event support 627,010<br />
MPD vehicular costs 452,582<br />
4th <strong>of</strong> July celebration 381,617<br />
Critical infrastructure surveillance 145,911<br />
State <strong>of</strong> <strong>the</strong> Union Address 51,473<br />
Law enforcement memorial support 7,800<br />
Right to Life March 5,620<br />
Immigration demonstration 5,180<br />
March for Justice 4,574<br />
White House Easter Egg Roll 3,200<br />
Cherry Blossom Parade 1,909<br />
Memorial Day events 1,122<br />
9/11 Memorial Ceremony 280<br />
Total $11,237,619<br />
FY 2008 approved expenditures by quarter are:<br />
1st Quarter $8,069,503<br />
2nd Quarter 881,354<br />
3rd Quarter 1,413,859<br />
4th Quarter 872,903<br />
Total $11,237,619<br />
FY 2008 disallowed costs by event are:<br />
POTUS/VPOTUS support $1,857,778<br />
MPD Harbor Unit 464,701<br />
IMF jersey barriers and parking revenue 72,029<br />
Papal visit 32,774<br />
Domestic dignitary protection 31,990<br />
4th <strong>of</strong> July 21,048<br />
First Lady Support 20,889<br />
Federal Law Enforcement support 3,253<br />
Cherry Blossom Parade 1,909<br />
Total $2,506,371
FY 2008 budget $18,240,239<br />
Less FY 2008 authorized expenses ($11,237,619)<br />
Carry forward into FY 2009 $7,002,620<br />
FY 2009 Approved <strong>Budget</strong> $38,825,000<br />
Total available in FY 2009 (see note) $45,827,620<br />
Note: The District <strong>of</strong> Columbia Appropriations Act, 2009, Public Law 111-8, authorized a direct payment <strong>of</strong><br />
$38,825,000. This payment, pursuant to a Congressional explanatory statement, has been provided to <strong>the</strong><br />
Inaugural Expenses agency (agency code SB0) to <strong>of</strong>fset costs for <strong>the</strong> Presidential inauguration. The carry forward<br />
balance <strong>of</strong> $7,002,620 will be provided to <strong>the</strong> Emergency Planning and Security Fund agency to <strong>of</strong>fset normal costs<br />
<strong>of</strong> support for <strong>the</strong> federal presence. As this carry forward funding had been authorized in earlier legislation, it will<br />
be provided to <strong>the</strong> agency as revised budget and will not appear as FY 2009 approved budget. The level <strong>of</strong> federal<br />
support to <strong>the</strong> Emergency Planning and Security Fund for FY 2010 is expected to be $15,000,000. The proposed<br />
legislation in FY 2010 reverts <strong>the</strong> program back to a reimbursable account; thus, <strong>the</strong> proposed FY 2010 budget for<br />
<strong>the</strong> agency is displayed as $0.<br />
The agency’s FY 2010 proposed budget is presented in <strong>the</strong> following tables:<br />
FY 2010 Proposed Gross Funds Operating <strong>Budget</strong>, by Revenue Type<br />
Table EP0-1 contains <strong>the</strong> proposed FY 2010 agency budget compared to <strong>the</strong> FY 2009 approved budget. It also<br />
provides FY 2007 and FY 2008 actual expenditures.<br />
Table EP0-1<br />
(dollars in thousands)<br />
Actual Actual Approved Proposed<br />
Change<br />
from Percent<br />
Appropriated Fund<br />
Federal Resources<br />
FY 2007 FY 2008 FY 2009 FY 2010 FY 2009 Change*<br />
Federal Payments 4,691 11,215 0 0 0 N/A<br />
Total for Federal Resources 4,691 11,215 0 0 0 N/A<br />
Gross Funds 4,691 11,215 0 0 0 N/A<br />
*Percent Change is based on whole dollars.<br />
Note: If applicable, for a breakdown <strong>of</strong> each Grant (Federal and Private), Special Purpose Revenue type and Intra-District agreement,<br />
please refer to Schedule 80, <strong>Agency</strong> Summary by Revenue Source, in <strong>the</strong> Operating Appendices located on <strong>the</strong> <strong>Office</strong> <strong>of</strong> <strong>the</strong> <strong>Chief</strong><br />
<strong>Financial</strong> <strong>Office</strong>r’s website.<br />
Emergency Planning and Security Fund<br />
G-33
FY 2010 Proposed Operating <strong>Budget</strong>, by Comptroller Source Group<br />
Table EP0-2 contains <strong>the</strong> proposed FY 2010 budget at <strong>the</strong> Comptroller Source Group (object class) level compared<br />
to <strong>the</strong> FY 2009 approved budget. It also provides FY 2007 and FY 2008 actual expenditures.<br />
Table EP0-2<br />
(dollars in thousands)<br />
Actual Actual Approved Proposed<br />
Change<br />
from Percent<br />
Comptroller Source Group FY 2007 FY 2008 FY 2009 FY 2010 FY 2009 Change*<br />
50 Subsidies and Transfers 4,691 11,215 0 0 0 N/A<br />
Subtotal Nonpersonal Services (NPS) 4,691 11,215 0 0 0 N/A<br />
Gross Funds 4,691 11,215 0 0 0 N/A<br />
*Percent Change is based on whole dollars.<br />
Program Description<br />
The Emergency Planning and Security Fund operates<br />
through <strong>the</strong> following program:<br />
Emergency Planning and Security Cost - provides<br />
recordation <strong>of</strong> expenses for which federal reimbursement/payment<br />
has been approved under <strong>the</strong> authority<br />
found in <strong>the</strong> federal payment for Emergency<br />
FY 2010 Proposed Operating <strong>Budget</strong> and FTEs, by Program and Activity<br />
Table EP0-3 contains <strong>the</strong> proposed FY 2010 budget by program and activity compared to <strong>the</strong> FY 2009 approved budget.<br />
It also provides FY 2008 actual data.<br />
Table EP0-3<br />
(dollars in thousands)<br />
Dollars in Thousands Full-Time Equivalents<br />
Change Change<br />
Actual Approved Proposed from Actual Approved Proposed from<br />
Program/Activity<br />
(1000) Emergency Planning and Security Cost<br />
FY 2008 FY 2009 FY 2010 FY 2009 FY 2008 FY 2009 FY 2010 FY 2009<br />
(1100) Emergency Planning and Security Cost 11,215 0 0 0 0.0 0.0 0.0 0.0<br />
Subtotal (1000) Emergency Planning and Security Cost 11,215 0 0 0 0.0 0.0 0.0 0.0<br />
Total Proposed Operating <strong>Budget</strong> 11,215 0 0 0 0.0 0.0 0.0 0.0<br />
(Change is calculated by whole numbers and numbers may not add up due to rounding)<br />
Note: For more detailed information regarding <strong>the</strong> proposed funding for <strong>the</strong> activities within this agency’s programs, please see Schedule 30-PBB<br />
Program Summary By Activity in <strong>the</strong> FY 2010 Operating Appendices located on <strong>the</strong> <strong>Office</strong> <strong>of</strong> <strong>the</strong> <strong>Chief</strong> <strong>Financial</strong> <strong>Office</strong>r’s website.<br />
FY 2010 Proposed <strong>Budget</strong> and <strong>Financial</strong> Plan<br />
G-34<br />
Planning and Security Costs in <strong>the</strong> District’s<br />
Appropriations Act.<br />
Program Structure Change<br />
The Emergency Planning and Security Fund had no<br />
program structure changes in <strong>the</strong> FY 2010 Proposed<br />
<strong>Budget</strong>.
Cash Reserve<br />
(CS0)<br />
% Change<br />
FY 2008 FY 2009 FY 2010 from<br />
Description Actual Approved Proposed FY 2009<br />
Operating <strong>Budget</strong> $0 $46,000,000 $0 -100.0<br />
The mission <strong>of</strong> Cash Reserve is to protect <strong>the</strong> District’s financial stability<br />
against unforeseen expenditure needs and revenue shortfalls.<br />
This account replaced <strong>the</strong> budgeted reserve (RD0) in<br />
FY 2004, which was phased out because <strong>of</strong> <strong>the</strong> accumulation,<br />
by <strong>the</strong> District, <strong>of</strong> a cash reserve that<br />
exceeded a federally mandated target <strong>of</strong> 7 percent <strong>of</strong><br />
Local fund expenditures. The Cash Reserve (CS0)<br />
dollars were to be expended and obligated in accordance<br />
with <strong>the</strong> directives <strong>of</strong> <strong>the</strong> <strong>Chief</strong> <strong>Financial</strong><br />
<strong>Office</strong>r, <strong>the</strong> D.C. Council, <strong>the</strong> Mayor, and Congress.<br />
Funds that were expended from <strong>the</strong> cash reserve were<br />
replaced entirely <strong>the</strong> following fiscal year.<br />
The agency’s FY 2010 proposed budget is presented<br />
in <strong>the</strong> following tables:<br />
Cash Reserve<br />
G-35
FY 2010 Proposed Gross Funds Operating <strong>Budget</strong>, by Revenue Type<br />
Table CS0-1 contains <strong>the</strong> proposed FY 2010 agency budget compared to <strong>the</strong> FY 2009 approved budget. It also<br />
provides FY 2007 and FY 2008 actual expenditures.<br />
Table CS0-1<br />
(dollars in thousands)<br />
Actual Actual Approved Proposed<br />
Change<br />
from Percent<br />
Appropriated Fund<br />
General Fund<br />
FY 2007 FY 2008 FY 2009 FY 2010 FY 2009 Change*<br />
Local Funds 0 0 46,000 0 -46,000 -100.0<br />
Total for General Fund 0 0 46,000 0 -46,000 -100.0<br />
Gross Funds 0 0 46,000 0 -46,000 -100.0<br />
*Percent Change is based on whole dollars.<br />
Note: If applicable, for a breakdown <strong>of</strong> each Grant (Federal and Private), Special Purpose Revenue type and Intra-District agreement, please refer to<br />
Schedule 80, <strong>Agency</strong> Summary by Revenue Source, in <strong>the</strong> Operating Appendices located on <strong>the</strong> <strong>Office</strong> <strong>of</strong> <strong>the</strong> <strong>Chief</strong> <strong>Financial</strong> <strong>Office</strong>r’s website.<br />
FY 2010 Proposed Operating <strong>Budget</strong>, by Comptroller Source Group<br />
Table CS0-2 contains <strong>the</strong> proposed FY 2010 budget at <strong>the</strong> Comptroller Source Group (object class) level compared<br />
to <strong>the</strong> FY 2009 approved budget. It also provides FY 2007 and FY 2008 actual expenditures.<br />
Table CS0-2<br />
(dollars in thousands)<br />
Actual Actual Approved Proposed<br />
Change<br />
from Percent<br />
Comptroller Source Group FY 2007 FY 2008 FY 2009 FY 2010 FY 2009 Change*<br />
50 Subsidies and Transfers 0 0 46,000 0 -46,000 -100.0<br />
Subtotal Nonpersonal Services (NPS) 0 0 46,000 0 -46,000 -100.0<br />
Gross Funds 0 0 46,000 0 -46,000 -100.0<br />
*Percent Change is based on whole dollars.<br />
Program Description<br />
Cash Reserve operates under <strong>the</strong> following program:<br />
Cash Reserve - budgets for unforeseen costs and revenue<br />
shortfalls.<br />
FY 2010 Proposed <strong>Budget</strong> and <strong>Financial</strong> Plan<br />
G-36<br />
Program Structure Change<br />
Cash Reserve had no program structure changes in<br />
<strong>the</strong> FY 2010 Proposed <strong>Budget</strong>.
FY 2010 Proposed Operating <strong>Budget</strong> and FTEs, by Program and Activity<br />
Table CS0-3 contains <strong>the</strong> proposed FY 2010 budget by program and activity compared to <strong>the</strong> FY 2009 approved budget.<br />
It also provides FY 2008 actual data.<br />
Table CS0-3<br />
(dollars in thousands)<br />
Dollars in Thousands Full-Time Equivalents<br />
Change Change<br />
Actual Approved Proposed from Actual Approved Proposed from<br />
Program/Activity<br />
(1000) Cash Reserve<br />
FY 2008 FY 2009 FY 2010 FY 2009 FY 2008 FY 2009 FY 2010 FY 2009<br />
(1100) Cash Reserve 0 46,000 0 -46,000 0.0 0.0 0.0 0.0<br />
Subtotal (1000) Cash Reserve 0 46,000 0 -46,000 0.0 0.0 0.0 0.0<br />
Total Proposed Operating <strong>Budget</strong> 0 46,000 0 -46,000 0.0 0.0 0.0 0.0<br />
(Change is calculated by whole numbers and numbers may not add up due to rounding)<br />
Note: For more detailed information regarding <strong>the</strong> proposed funding for <strong>the</strong> activities within this agency’s programs, please see Schedule 30-PBB, Program<br />
Summary by Activity, in <strong>the</strong> FY 2010 Operating Appendices located on <strong>the</strong> <strong>Office</strong> <strong>of</strong> <strong>the</strong> <strong>Chief</strong> <strong>Financial</strong> <strong>Office</strong>r’s website.<br />
Major Baseline Adjustments, Cost Savings<br />
and Policy Initiatives<br />
Cost Savings: Given <strong>the</strong> decline in District revenue<br />
forecasts as a result <strong>of</strong> <strong>the</strong> slowdown in <strong>the</strong> U.S. economy,<br />
<strong>the</strong> maintenance <strong>of</strong> an operating cash reserve is<br />
not sustainable for <strong>the</strong> FY 2010 proposed budget.<br />
FY 2009 Approved <strong>Budget</strong> to FY 2010 Proposed <strong>Budget</strong>, by Revenue Type<br />
Table CS0-4 itemizes <strong>the</strong> changes by revenue type between <strong>the</strong> FY 2009 approved budget and <strong>the</strong> FY 2010 proposed<br />
budget. The four categories <strong>of</strong> changes reflected in this table are: (1) changes to <strong>the</strong> baseline budget (includes<br />
agency request), (2) changes representing cost savings or efficiencies, (3) changes related to policy initiatives, and (4)<br />
changes to specifically address <strong>the</strong> projected revenue shortfall.<br />
Table CS0-4<br />
(dollars in thousands)<br />
The District will continue to fully fund <strong>the</strong><br />
Emergency Reserve Fund and <strong>the</strong> Contingency<br />
Reserve Fund at <strong>the</strong> level <strong>of</strong> 2 percent and 4 percent,<br />
respectively, <strong>of</strong> prior year operating expenditures.<br />
Program BUDGET FTE<br />
LOCAL FUND: FY 2009 Approved <strong>Budget</strong> and FTE 46,000 0.0<br />
Policy Initiatives and Cost Savings<br />
Eliminate - Eliminate appropriations for Operating Cash Reserve Cash Reserve -46,000 0.0<br />
LOCAL FUND: FY 2010 Proposed <strong>Budget</strong> and FTE 0 0.0<br />
Gross for CS0 - Cash Reserve 0 0.0<br />
Cash Reserve<br />
G-37
Master Equipment Lease/Purchase<br />
Program<br />
www.cfo.dc.gov<br />
Telephone: 202-727-6055<br />
The mission <strong>of</strong> <strong>the</strong> Master Equipment Lease/Purchase Program (<strong>the</strong> program)<br />
is to provide District agencies with access to low-cost, tax-exempt<br />
financing for medium-term capital equipment needs. The program also<br />
enables <strong>the</strong> District to improve its asset/liability management by matching<br />
<strong>the</strong> useful life <strong>of</strong> <strong>the</strong> asset being financed to <strong>the</strong> amortization <strong>of</strong> <strong>the</strong> liability.<br />
Equipment financed through <strong>the</strong> program must<br />
have a useful life <strong>of</strong> at least 5 years. The repayment<br />
(amortization) will not exceed <strong>the</strong> useful life<br />
<strong>of</strong> <strong>the</strong> equipment being financed. The maximum<br />
financing term that may be requested is 10 years.<br />
The program finances equipment such as rolling<br />
stock (e.g., automobiles, trucks, public safety<br />
vehicles) and computer hardware and s<strong>of</strong>tware.<br />
Under <strong>the</strong> District <strong>of</strong> Columbia Home Rule Act,<br />
<strong>the</strong> District may issue various obligations to finance<br />
its capital needs. Financing through <strong>the</strong> program<br />
begins with a financing company paying for <strong>the</strong> purchase<br />
<strong>of</strong> equipment for <strong>the</strong> District’s use. The District<br />
makes lease payments to <strong>the</strong> financing company for<br />
such equipment, which are in effect principal and<br />
interest payments on <strong>the</strong> amount financed, and <strong>the</strong><br />
District gains ownership <strong>of</strong> <strong>the</strong> equipment upon<br />
(ELO)<br />
% Change<br />
FY 2008 FY 2009 FY 2010 from<br />
Description Actual Approved Proposed FY 2009<br />
Operating <strong>Budget</strong> $29,896,184 $43,032,643 $46,157,000 7.3<br />
completion <strong>of</strong> <strong>the</strong> payments. As <strong>of</strong> September 30,<br />
2008, <strong>the</strong> District had financed approximately $237<br />
million <strong>of</strong> its capital equipment needs through <strong>the</strong><br />
program.<br />
Timely lease payments are necessary to satisfy <strong>the</strong><br />
District’s commitments to its investors and creditors,<br />
and to maintain a good credit standing in <strong>the</strong> financial<br />
markets. Appropriations for <strong>the</strong> program are<br />
budgeted from Local funds in amounts sufficient to<br />
meet <strong>the</strong> required lease payments.<br />
The agency’s FY 2010 proposed budget is presented<br />
in <strong>the</strong> following tables:<br />
Master Equipment Lease/Purchase Program<br />
G-39
FY 2010 Proposed Gross Funds Operating <strong>Budget</strong>, by Revenue Type<br />
Table EL0-1 contains <strong>the</strong> proposed FY 2010 agency budget compared to <strong>the</strong> FY 2009 approved budget. It also<br />
provides FY 2007 and FY 2008 actual expenditures.<br />
Table EL0-1<br />
(dollars in thousands)<br />
Actual Actual Approved Proposed<br />
Change<br />
from Percent<br />
Appropriated Fund<br />
General Fund<br />
FY 2007 FY 2008 FY 2009 FY 2010 FY 2009 Change*<br />
Local Funds 21,893 29,896 43,033 46,157 3,124 7.3<br />
Total for General Fund 21,893 29,896 43,033 46,157 3,124 7.3<br />
Intra-District Funds<br />
Intra-District Funds 4,637 0 0 0 0 N/A<br />
Total for Intra-District Funds 4,637 0 0 0 0 N/A<br />
Gross Funds 26,530 29,896 43,033 46,157 3,124 7.3<br />
*Percent Change is based on whole dollars.<br />
Note: If applicable, for a breakdown <strong>of</strong> each Grant (Federal and Private), Special Purpose Revenue type and Intra-District agreement,<br />
please refer to Schedule 80, <strong>Agency</strong> Summary by Revenue Source, in <strong>the</strong> Operating Appendices located on <strong>the</strong> <strong>Office</strong> <strong>of</strong> <strong>the</strong> <strong>Chief</strong><br />
<strong>Financial</strong> <strong>Office</strong>r’s website.<br />
FY 2010 Proposed Operating <strong>Budget</strong>, by Comptroller Source Group<br />
Table EL0-2 contains <strong>the</strong> proposed FY 2010 budget at <strong>the</strong> Comptroller Source Group (object class) level compared<br />
to <strong>the</strong> FY 2009 approved budget. It also provides FY 2007 and FY 2008 actual expenditures.<br />
Table EL0-2<br />
(dollars in thousands)<br />
Actual Actual Approved Proposed<br />
Change<br />
from Percent<br />
Comptroller Source Group FY 2007 FY 2008 FY 2009 FY 2010 FY 2009 Change*<br />
80 Debt Service 26,530 29,896 43,033 46,157 3,124 7.3<br />
Subtotal Nonpersonal Services (NPS) 26,530 29,896 43,033 46,157 3,124 7.3<br />
Gross Funds 26,530 29,896 43,033 46,157 3,124 7.3<br />
*Percent Change is based on whole dollars.<br />
FY 2010 Proposed <strong>Budget</strong> and <strong>Financial</strong> Plan<br />
G-40
Program Structure Change<br />
The Master Equipment Lease/Purchase Program had no program structure changes in <strong>the</strong> FY 2010 Proposed <strong>Budget</strong>.<br />
FY 2010 Proposed Operating <strong>Budget</strong> and FTEs, by Program and Activity<br />
Table EL0-3 contains <strong>the</strong> proposed FY 2010 budget by program and activity compared to <strong>the</strong> FY 2009 approved budget.<br />
It also provides FY 2008 actual data.<br />
Table EL0-3<br />
(dollars in thousands)<br />
Dollars in Thousands Full-Time Equivalents<br />
Change Change<br />
Actual Approved Proposed from Actual Approved Proposed from<br />
Program/Activity<br />
(1000) Equipment Lease<br />
FY 2008 FY 2009 FY 2010 FY 2009 FY 2008 FY 2009 FY 2010 FY 2009<br />
(1100) Equipment Lease 29,896 43,033 46,157 3,124 0.0 0.0 0.0 0.0<br />
Subtotal (1000) Equipment Lease 29,896 43,033 46,157 3,124 0.0 0.0 0.0 0.0<br />
Total Proposed Operating <strong>Budget</strong> 29,896 43,033 46,157 3,124 0.0 0.0 0.0 0.0<br />
(Change is calculated by whole numbers and numbers may not add up due to rounding)<br />
Note: For more detailed information regarding <strong>the</strong> proposed funding for <strong>the</strong> activities within this agency’s programs, please see Schedule 30-PBB<br />
Program Summary By Activity in <strong>the</strong> FY 2010 Operating Appendices located on <strong>the</strong> <strong>Office</strong> <strong>of</strong> <strong>the</strong> <strong>Chief</strong> <strong>Financial</strong> <strong>Office</strong>r’s website.<br />
Major Baseline Adjustments, Cost Savings<br />
and Policy Initiatives<br />
Initial Adjustments: A decrease to align debt service<br />
with required amounts based on initial capital spending<br />
plans.<br />
Baseline Adjustments: An increase to align debt<br />
service with required amounts based on updated<br />
capital spending plans.<br />
Master Equipment Lease/Purchase Program<br />
G-41
FY 2009 Approved <strong>Budget</strong> to FY 2010 Proposed <strong>Budget</strong>, by Revenue Type<br />
Table EL0-4 itemizes <strong>the</strong> changes by revenue type between <strong>the</strong> FY 2009 approved budget and <strong>the</strong> FY 2010 proposed<br />
budget. The four categories <strong>of</strong> changes reflected in this table are: (1) changes to <strong>the</strong> baseline budget (includes<br />
agency request), (2) changes representing cost savings or efficiencies, (3) changes related to policy initiatives, and (4)<br />
changes to specifically address <strong>the</strong> projected revenue shortfall.<br />
Table EL0-4<br />
(dollars in thousands)<br />
Program BUDGET FTE<br />
LOCAL FUND: FY 2009 Approved <strong>Budget</strong> and FTE 43,033 0.0<br />
Initial and Baseline Adjustments<br />
Intra-<strong>Agency</strong> Changes: - To decrease cost <strong>of</strong> debt service for initial estimate <strong>of</strong> Equipment Lease -1,897 0.0<br />
planned spending by agencies on capital projects financed with Master<br />
Lease/Purchase budget<br />
Baseline Adjustments: - To increase cost <strong>of</strong> debt service because <strong>of</strong> planned Equipment Lease 5,021 0.0<br />
spending by agencies on capital projects financed through <strong>the</strong> Master<br />
Lease/Purchase Program<br />
LOCAL FUND: FY 2010 Proposed <strong>Budget</strong> and FTE 46,157 0.0<br />
Gross for ELO - Master Equipment Lease/Purchase Program 46,157 0.0<br />
FY 2010 Proposed <strong>Budget</strong> and <strong>Financial</strong> Plan<br />
G-42
Pay-As-You-Go Capital Fund<br />
The Mayor and Council can request <strong>the</strong> use <strong>of</strong> Pay-<br />
As-You-Go Capital funds following <strong>the</strong> determination<br />
and certification by <strong>the</strong> <strong>Chief</strong> <strong>Financial</strong> <strong>Office</strong>r<br />
that <strong>the</strong> funds are available and necessary for <strong>the</strong> designated<br />
purpose.<br />
In addition, o<strong>the</strong>r operating funds may be transferred<br />
to <strong>the</strong> capital fund through a Pay-As-You-Go<br />
Capital transfer to support <strong>the</strong> Capital<br />
Improvements Plan, and <strong>the</strong> proposed FY 2010<br />
budget includes such a transfer.<br />
(PA0)<br />
% Change<br />
FY 2008 FY 2009 FY 2010 from<br />
Description Actual Approved Proposed FY 2009<br />
Operating <strong>Budget</strong> $140,737,054 $125,013,800 $2,984,000 -97.6<br />
The mission <strong>of</strong> <strong>the</strong> Pay-As-You-Go Capital Fund is to provide an additional<br />
funding source, and <strong>of</strong>fset General Obligation bond borrowing,<br />
for capital projects.<br />
The agency’s FY 2010 proposed budget is presented<br />
in <strong>the</strong> following tables:<br />
Pay-As-You-Go Capital Fund<br />
G-43
FY 2010 Proposed Gross Funds Operating <strong>Budget</strong>, by Revenue Type<br />
Table PA0-1 contains <strong>the</strong> proposed FY 2010 agency budget compared to <strong>the</strong> FY 2009 approved budget. It also<br />
provides FY 2007 and FY 2008 actual expenditures.<br />
Table PA0-1<br />
(dollars in thousands)<br />
Actual Actual Approved Proposed<br />
Change<br />
from Percent<br />
Appropriated Fund<br />
General Fund<br />
FY 2007 FY 2008 FY 2009 FY 2010 FY 2009 Change*<br />
Local Funds 118,861 139,488 14,714 0 -14,714 -100.0<br />
Dedicated Taxes 0 0 108,300 0 -108,300 -100.0<br />
Special Purpose Revenue Funds 0 1,249 2,000 2,984 984 49.2<br />
Total for General Fund 118,861 140,737 125,014 2,984 -122,030 -97.6<br />
Gross Funds 118,861 140,737 125,014 2,984 -122,030 -97.6<br />
*Percent Change is based on whole dollars.<br />
Note: If applicable, for a breakdown <strong>of</strong> each Grant (Federal and Private), Special Purpose Revenue type and Intra-District agreement,<br />
please refer to Schedule 80, <strong>Agency</strong> Summary by Revenue Source, in <strong>the</strong> Operating Appendices located on <strong>the</strong> <strong>Office</strong> <strong>of</strong> <strong>the</strong> <strong>Chief</strong><br />
<strong>Financial</strong> <strong>Office</strong>r’s website.<br />
FY 2010 Proposed Operating <strong>Budget</strong>, by Comptroller Source Group<br />
Table PA0-2 contains <strong>the</strong> proposed FY 2010 budget at <strong>the</strong> Comptroller Source Group (object class) level compared<br />
to <strong>the</strong> FY 2009 approved budget. It also provides FY 2007 and FY 2008 actual expenditures.<br />
Table PA0-2<br />
(dollars in thousands)<br />
Actual Actual Approved Proposed<br />
Change<br />
from Percent<br />
Comptroller Source Group FY 2007 FY 2008 FY 2009 FY 2010 FY 2009 Change*<br />
41 Contractual Services - O<strong>the</strong>r 0 79,000 0 0 0 N/A<br />
50 Subsidies and Transfers 118,861 61,737 125,014 2,984 -122,030 -97.6<br />
Subtotal Nonpersonal Services (NPS) 118,861 140,737 125,014 2,984 -122,030 -97.6<br />
Gross Funds 118,861 140,737 125,014 2,984 -122,030 -97.6<br />
*Percent Change is based on whole dollars.<br />
Program Structure Changes<br />
The Pay-As-You-Go Capital Fund had no program structure changes in <strong>the</strong> FY 2010 Proposed <strong>Budget</strong>.<br />
FY 2010 Proposed <strong>Budget</strong> and <strong>Financial</strong> Plan<br />
G-44
FY 2010 Proposed Operating <strong>Budget</strong> and FTEs, by Program and Activity<br />
Table PA0-3 contains <strong>the</strong> proposed FY 2010 budget by program and activity compared to <strong>the</strong> FY 2009 approved budget.<br />
It also provides FY 2008 actual data.<br />
Table PA0-3<br />
(dollars in thousands)<br />
Dollars in Thousands Full-Time Equivalents<br />
Change Change<br />
Actual Approved Proposed from Actual Approved Proposed from<br />
Program/Activity<br />
(1000) Pay-Go Capital<br />
FY 2008 FY 2009 FY 2010 FY 2009 FY 2008 FY 2009 FY 2010 FY 2009<br />
(1100) Pay-Go Capital 140,737 125,014 2,984 -122,030 0.0 0.0 0.0 0.0<br />
Subtotal (1000) Pay-Go Capital 140,737 125,014 2,984 -122,030 0.0 0.0 0.0 0.0<br />
Total Proposed Operating <strong>Budget</strong> 140,737 125,014 2,984 -122,030 0.0 0.0 0.0 0.0<br />
(Change is calculated by whole numbers and numbers may not add up due to rounding)<br />
Note: For more detailed information regarding <strong>the</strong> proposed funding for <strong>the</strong> activities within this agency’s programs, please see Schedule 30-PBB, Program Summary by Activity, in <strong>the</strong> FY 2010<br />
Operating Appendices located on <strong>the</strong> <strong>Office</strong> <strong>of</strong> <strong>the</strong> <strong>Chief</strong> <strong>Financial</strong> <strong>Office</strong>r’s website.<br />
Major Baseline Adjustments, Cost Savings<br />
and Policy Initiatives<br />
Initial adjustments: The Pay-As-You-Go Capital<br />
Fund budget was decreased as one-time additions in<br />
FY 2009 were backed out.<br />
Transfer In: The District Department <strong>of</strong> <strong>the</strong><br />
Environment (DDOE) will shift $2,984,000 <strong>of</strong><br />
Special Purpose Revenue funds from <strong>the</strong> Storm Water<br />
Permit Review Fund in DDOE to <strong>the</strong> Pay-As-You-<br />
Go Capital Fund to support a capital project to<br />
reduce stormwater run<strong>of</strong>f.<br />
Cost Savings: The School Modernization Financing<br />
Act <strong>of</strong> 2006 dedicated over $100 million in annual<br />
sales tax revenue to <strong>the</strong> District’s capital budget, to<br />
finance school modernization on a pay-as-you-go<br />
basis. The FY 2010 baseline budget included<br />
$112,360,000 in dedicated tax revenues for this purpose.<br />
Given <strong>the</strong> rapid and significant decline in<br />
District revenue forecasts as a result <strong>of</strong> <strong>the</strong> weakened<br />
U.S. economy, <strong>the</strong> transfer <strong>of</strong> current revenues to support<br />
school capital is no longer fiscally sustainable.<br />
The budget proposes to continue <strong>the</strong> landmark<br />
school modernization initiative, by fully funding it<br />
with General Obligation bond borrowing. (The<br />
District is also exploring opportunities afforded in <strong>the</strong><br />
Recovery Act to issue special tax-credit bonds for<br />
school modernization projects.) The dedicated taxes<br />
transferred to public school capital projects will be<br />
reduced to zero.<br />
This change in funding source is not expected to<br />
affect <strong>the</strong> ability <strong>of</strong> <strong>the</strong> <strong>Office</strong> <strong>of</strong> Public Education<br />
Facilities Modernization to modernize public school<br />
buildings as planned. In order to accommodate this<br />
large commitment within <strong>the</strong> resource constraints <strong>of</strong><br />
<strong>the</strong> six-year capital improvements plan, <strong>the</strong> proposed<br />
budget delays funding for a number <strong>of</strong> o<strong>the</strong>r capital<br />
projects. Project-by-project allocations <strong>of</strong> capital budget<br />
authority are detailed in <strong>the</strong> capital appendix to<br />
<strong>the</strong> proposed budget.<br />
Pay-As-You-Go Capital Fund<br />
G-45
FY 2009 Approved <strong>Budget</strong> to FY 2010 Proposed <strong>Budget</strong>, by Revenue Type<br />
Table PA0-4 itemizes <strong>the</strong> changes by revenue type between <strong>the</strong> FY 2009 approved budget and <strong>the</strong> FY 2010 proposed<br />
budget. The four categories <strong>of</strong> changes reflected in this table are: (1) changes to <strong>the</strong> baseline budget (includes<br />
agency request), (2) changes representing cost savings or efficiencies, (3) changes related to policy initiatives, and (4)<br />
changes to specifically address <strong>the</strong> projected revenue shortfall.<br />
Table PA0-4<br />
(dollars in thousands)<br />
Program BUDGET FTE<br />
LOCAL FUND: FY 2009 Approved <strong>Budget</strong> and FTE<br />
Initial and Baseline Adjustments<br />
14,714 0.0<br />
Reduction for nonrecurring costs Pay-Go Capital -14,714 0.0<br />
LOCAL FUND: FY 2010 Proposed <strong>Budget</strong> and FTE 0 0.0<br />
DEDICATED TAXES: FY 2009 Approved <strong>Budget</strong> and FTE 108,300 0.0<br />
Initial and Baseline Adjustments<br />
Reduction for nonrecurring costs - One-time transfer for DPR and DCPL Pay-Go Capital -2,300 0.0<br />
capital projects<br />
Legislative requirement - Transfer to OPEFM for school modernization Pay-Go Capital 6,360 0.0<br />
Policy Initiatives and Cost Savings<br />
Cost Decrease - Reduce dedicated taxes transfer to OPEFM Pay-Go Capital -112,360 0.0<br />
to align with District revenue estimates<br />
DEDICATED TAXES: FY 2010 Proposed <strong>Budget</strong> and FTE 0 0.0<br />
SPECIAL PURPOSE REVENUE FUNDS: FY 2009 Approved <strong>Budget</strong> and FTE 2,000 0.0<br />
Initial and Baseline Adjustments<br />
Reduction for nonrecurring costs - One-time transfer for DMPED capital Pay-Go Capital -2,000 0.0<br />
projects (funded with IRB funds)<br />
Policy Initiatives and Cost Savings<br />
Shift stormwater project funding from DDOE Storm Water Permit Pay-Go Capital 2,984 0.0<br />
Review Fund to PAYGO capital<br />
SPECIAL PURPOSE REVENUE FUNDS: FY 2010 Proposed <strong>Budget</strong> and FTE 2,984 0.0<br />
Gross for PA0 - Pay-As-You-Go Capital Fund 2,984 0.0<br />
FY 2010 Proposed <strong>Budget</strong> and <strong>Financial</strong> Plan<br />
G-46
District Retiree Health Contribution<br />
The mission <strong>of</strong> District Retiree Health Contribution is to contribute<br />
to <strong>the</strong> funding <strong>of</strong> <strong>the</strong> District’s o<strong>the</strong>r post-employment benefits<br />
(OPEB) liabilities.<br />
District government retirees who were first employed<br />
after September 30, 1987 ("post-87") may obtain<br />
health insurance (pursuant to D.C. Code 1-622) and<br />
life insurance (pursuant to D.C. Code 1-623) from<br />
<strong>the</strong> District. Currently, <strong>the</strong> District pays 75 percent<br />
<strong>of</strong> <strong>the</strong> cost <strong>of</strong> health, vision and dental insurance premiums<br />
for retirees and <strong>the</strong>ir dependents and onethird<br />
<strong>of</strong> <strong>the</strong> cost <strong>of</strong> retirees' life insurance premiums.<br />
The federal government is responsible for funding<br />
OPEB costs for District government retirees who<br />
were first employed prior to October 1, 1987 ("pre-<br />
87").<br />
In 1999, <strong>the</strong> Council <strong>of</strong> <strong>the</strong> District <strong>of</strong> Columbia<br />
established <strong>the</strong> Annuitants' Health and Life Insurance<br />
Employer Contribution Trust Fund (“Trust Fund”)<br />
to pay <strong>the</strong> District's portion <strong>of</strong> post-87 retirees' health<br />
(RH0)<br />
% Change<br />
FY 2008 FY 2009 FY 2010 from<br />
Description Actual Approved Proposed FY 2009<br />
Operating <strong>Budget</strong> $110,906,663 $81,100,000 $90,700,000 11.8<br />
and life insurance premiums. Through FY 2007, <strong>the</strong><br />
District contributed to <strong>the</strong> Trust Fund from available<br />
funds. Beginning in FY 2008, <strong>the</strong> Governmental<br />
Accounting Standards Board requires state and local<br />
governments, including <strong>the</strong> District, to recognize any<br />
OPEB liability in <strong>the</strong>ir financial statements. The<br />
District is budgeting an actuarially determined annual<br />
OPEB contribution to gradually reduce its unfunded<br />
accrued liability. The proposed budget <strong>of</strong> <strong>the</strong><br />
District Retiree Health Contribution represents <strong>the</strong><br />
District’s FY 2010 contribution to <strong>the</strong> funding <strong>of</strong> its<br />
OPEB liabilities.<br />
The agency’s FY 2010 proposed budget is presented<br />
in <strong>the</strong> following tables:<br />
District Retiree Health Contribution<br />
G-47
FY 2010 Proposed Gross Funds Operating <strong>Budget</strong>, by Revenue Type<br />
Table RH0-1 contains <strong>the</strong> proposed FY 2010 agency budget compared to <strong>the</strong> FY 2009 approved budget. It also<br />
provides FY 2007 and FY 2008 actual expenditures.<br />
Table RH0-1<br />
(dollars in thousands)<br />
Actual Actual Approved Proposed<br />
Change<br />
from Percent<br />
Appropriated Fund<br />
General Fund<br />
FY 2007 FY 2008 FY 2009 FY 2010 FY 2009 Change*<br />
Local Funds 4,700 110,907 81,100 90,700 9,600 11.8<br />
Total for General Fund 4,700 110,907 81,100 90,700 9,600 11.8<br />
Gross Funds 4,700 110,907 81,100 90,700 9,600 11.8<br />
*Percent Change is based on whole dollars.<br />
Note: If applicable, for a breakdown <strong>of</strong> each Grant (Federal and Private), Special Purpose Revenue type and Intra-District agreement,<br />
please refer to Schedule 80, <strong>Agency</strong> Summary by Revenue Source, in <strong>the</strong> Operating Appendices located on <strong>the</strong> <strong>Office</strong> <strong>of</strong> <strong>the</strong> <strong>Chief</strong><br />
<strong>Financial</strong> <strong>Office</strong>r’s website.<br />
FY 2010 Proposed Operating <strong>Budget</strong>, by Comptroller Source Group<br />
Table RH0-2 contains <strong>the</strong> proposed FY 2010 budget at <strong>the</strong> Comptroller Source Group (object class) level compared<br />
to <strong>the</strong> FY 2009 approved budget. It also provides FY 2007 and FY 2008 actual expenditures.<br />
Table RH0-2<br />
(dollars in thousands)<br />
Actual Actual Approved Proposed<br />
Change<br />
from Percent<br />
Comptroller Source Group FY 2007 FY 2008 FY 2009 FY 2010 FY 2009 Change*<br />
50 Subsidies and Transfers 4,700 110,907 81,100 90,700 9,600 11.8<br />
Subtotal Nonpersonal Services (NPS) 4,700 110,907 81,100 90,700 9,600 11.8<br />
Gross Funds 4,700 110,907 81,100 90,700 9,600 11.8<br />
*Percent Change is based on whole dollars.<br />
Program Description<br />
The District Retiree Health Contribution operates<br />
through <strong>the</strong> following program:<br />
District Retiree Health Contribution - provides<br />
<strong>the</strong> contribution to <strong>the</strong> funding <strong>of</strong> <strong>the</strong> District’s<br />
OPEB liabilities.<br />
FY 2010 Proposed <strong>Budget</strong> and <strong>Financial</strong> Plan<br />
G-48<br />
Program Structure Change<br />
The District Retiree Health Contribution had no<br />
program structure changes in <strong>the</strong> FY 2010 Proposed<br />
<strong>Budget</strong>.
FY 2010 Proposed Operating <strong>Budget</strong> and FTEs, by Program and Activity<br />
Table RH0-3 contains <strong>the</strong> proposed FY 2010 budget by program and activity compared to <strong>the</strong> FY 2009 approved budget.<br />
It also provides FY 2008 actual data.<br />
Table RH0-3<br />
(dollars in thousands)<br />
Dollars in Thousands Full-Time Equivalents<br />
Change Change<br />
Actual Approved Proposed from Actual Approved Proposed from<br />
Program/Activity<br />
(1000) District Retiree Health Contribution<br />
FY 2008 FY 2009 FY 2010 FY 2009 FY 2008 FY 2009 FY 2010 FY 2009<br />
(1100) District Retiree Health Contribution 110,907 81,100 90,700 9,600 0.0 0.0 0.0 0.0<br />
Subtotal (1000) District Retiree Health Contribution 110,907 81,100 90,700 9,600 0.0 0.0 0.0 0.0<br />
Total Proposed Operating <strong>Budget</strong> 110,907 81,100 90,700 9,600 0.0 0.0 0.0 0.0<br />
(Change is calculated by whole numbers and numbers may not add up due to rounding)<br />
Note: For more detailed information regarding <strong>the</strong> proposed funding for <strong>the</strong> activities within this agency’s programs, please see<br />
Schedule 30-PBB, Program Summary by Activity, in <strong>the</strong> FY 2010 Operating Appendices located on <strong>the</strong> <strong>Office</strong> <strong>of</strong> <strong>the</strong> <strong>Chief</strong><br />
<strong>Financial</strong> <strong>Office</strong>r’s website.<br />
Major Baseline Adjustments, Cost Savings and Policy Initiatives<br />
Baseline Adjustments -The District Retiree Health Contribution had an increase <strong>of</strong> $7,600,000 to meet <strong>the</strong> actuarially<br />
required contribution.<br />
Gap-Closing Initiative: To increase benefits by $2,000,000.<br />
FY 2009 Approved <strong>Budget</strong> to FY 2010 Proposed <strong>Budget</strong>, by Revenue Type<br />
Table RH0-4 itemizes <strong>the</strong> changes by revenue type between <strong>the</strong> FY 2009 approved budget and <strong>the</strong> FY 2010 proposed<br />
budget. The four categories <strong>of</strong> changes reflected in this table are: (1) changes to <strong>the</strong> baseline budget (includes<br />
agency request), (2) changes representing cost savings or efficiencies, (3) changes related to policy initiatives, and (4)<br />
changes to specifically address <strong>the</strong> projected revenue shortfall.<br />
Table RH0-4<br />
(dollars in thousands)<br />
PROGRAM BUDGET FTE<br />
LOCAL FUND: FY 2009 Approved <strong>Budget</strong> and FTE 81,100 0.0<br />
Initial and Baseline Adjustments<br />
Baseline Adjustment: - Increased to meet <strong>the</strong> actuarially required District Retiree 7,600 0.0<br />
contribution level Health Contribution<br />
Gap-Closing Initiatives<br />
Increase - Increase benefits District Retiree 2,000 0.0<br />
LOCAL FUND: FY 2010 Proposed <strong>Budget</strong> and FTE 90,700 0.0<br />
Gross for RH0 - District Retiree Health Contribution 90,700 0.0<br />
District Retiree Health Contribution<br />
G-49
Baseball Transfer - Dedicated Taxes<br />
(BO0)<br />
% Change<br />
FY 2008 FY 2009 FY 2010 from<br />
Description Actual Approved Proposed FY 2009<br />
Operating <strong>Budget</strong> $46,397,000 $50,044,000 $32,081,000 -35.9<br />
The mission <strong>of</strong> Baseball Transfer – Dedicated Taxes is to record <strong>the</strong><br />
transfer out <strong>of</strong> certain revenues from <strong>the</strong> General Fund to <strong>the</strong> Ballpark<br />
Revenue Fund as required by <strong>the</strong> Ballpark Omnibus Financing and<br />
Revenue Act <strong>of</strong> 2004, effective April 8, 2005 (D.C. Law 15-320; D.C.<br />
Official Code § 10-1601.01 et seq.).<br />
The agency’s FY 2010 proposed budget is presented in <strong>the</strong> following tables:<br />
FY 2010 Proposed Gross Funds Operating <strong>Budget</strong>, by Revenue Type<br />
Table BO0-1 contains <strong>the</strong> proposed FY 2010 agency budget compared to <strong>the</strong> FY 2009 approved budget. It also<br />
provides <strong>the</strong> FY 2007 and FY 2008 actual expenditures.<br />
Table BO0-1<br />
(dollars in thousands)<br />
Actual Actual Approved Proposed<br />
Change<br />
from Percent<br />
Appropriated Fund<br />
General Fund<br />
FY 2007 FY 2008 FY 2009 FY 2010 FY 2009 Change*<br />
Dedicated Taxes 0 46,397 50,044 32,081 -17,963 -35.9<br />
Total for General Fund 0 46,397 50,044 32,081 -17,963 -35.9<br />
Gross Funds 0 46,397 50,044 32,081 -17,963 -35.9<br />
*Percent Change is based on whole dollars.<br />
Note: If applicable, for a breakdown <strong>of</strong> each Grant (Federal and Private), Special Purpose Revenue type and Intra-District agreement, please refer to Schedule 80 <strong>Agency</strong> Summary by<br />
Revenue Source in <strong>the</strong> Operating Appendices located on <strong>the</strong> <strong>Office</strong> <strong>of</strong> <strong>the</strong> <strong>Chief</strong> <strong>Financial</strong> <strong>Office</strong>r’s website.<br />
Baseball Transfer - Dedicated Taxes<br />
G-51
FY 2010 Proposed Operating <strong>Budget</strong>, by Comptroller Source Group<br />
Table BO0-2 contains <strong>the</strong> proposed FY 2010 budget at <strong>the</strong> Comptroller Source Group (object class) level compared<br />
to <strong>the</strong> FY 2009 approved budget. It also provides FY 2007 and FY 2008 actual expenditures.<br />
Table BO0-2<br />
(dollars in thousands)<br />
Actual Actual Approved Proposed<br />
Change<br />
from Percent<br />
Comptroller Source Group FY 2007 FY 2008 FY 2009 FY 2010 FY 2009 Change*<br />
50 Subsidies and Transfers 0 46,397 50,044 32,081 -17,963 -35.9<br />
Subtotal Nonpersonal Services (NPS) 0 46,397 50,044 32,081 -17,963 -35.9<br />
Gross Funds 0 46,397 50,044 32,081 -17,963 -35.9<br />
*Percent Change is based on whole dollars.<br />
Program Description<br />
Baseball Transfer – Dedicated Taxes operates through<br />
<strong>the</strong> following program:<br />
Baseball Transfer – Dedicated Tax - provides budget<br />
authority pursuant to <strong>the</strong> Ballpark Omnibus<br />
Financing and Revenue Act <strong>of</strong> 2004, which authorized<br />
<strong>the</strong> imposition <strong>of</strong> taxes dedicated for baseball<br />
and <strong>the</strong>ir deposit into <strong>the</strong> Ballpark Revenue Fund.<br />
This fund shows <strong>the</strong> transfer <strong>of</strong> dedicated local taxes<br />
(sales, public utility, toll communications, and base-<br />
FY 2010 Proposed Operating <strong>Budget</strong> and FTEs, by Program and Activity<br />
Table BO0-3 contains <strong>the</strong> proposed FY 2010 budget by program and activity compared to <strong>the</strong> FY 2009 approved budget.<br />
It also provides FY 2008 actual data.<br />
Table BO0-3<br />
(dollars in thousands)<br />
Dollars in Thousands Full-Time Equivalents<br />
Change Change<br />
Actual Approved Proposed from Actual Approved Proposed from<br />
Program/Activity<br />
(1000) Baseball Transfer - Dedicated Tax<br />
FY 2008 FY 2009 FY 2010 FY 2009 FY 2008 FY 2009 FY 2010 FY 2009<br />
(1100) Baseball Transfer - Dedicated Tax 46,397 50,044 32,081 -17,963 0.0 0.0 0.0 0.0<br />
Subtotal (1000) Baseball Transfer - Dedicated Tax 46,397 50,044 32,081 -17,963 0.0 0.0 0.0 0.0<br />
Total Proposed Operating <strong>Budget</strong> 46,397 50,044 32,081 -17,963 0.0 0.0 0.0 0.0<br />
(Change is calculated by whole numbers and numbers may not add up due to rounding)<br />
Note: For more detailed information regarding <strong>the</strong> proposed funding for <strong>the</strong> activities within this agency’s programs, please see Schedule 30-PBB Program Summary by Activity in <strong>the</strong> FY 2010<br />
Operating Appendices located on <strong>the</strong> <strong>Office</strong> <strong>of</strong> <strong>the</strong> <strong>Chief</strong> <strong>Financial</strong> <strong>Office</strong>r’s website.<br />
FY 2010 Proposed <strong>Budget</strong> and <strong>Financial</strong> Plan<br />
G-52<br />
ball gross receipts) from <strong>the</strong> District’s General Fund to<br />
<strong>the</strong> Ballpark Revenue Fund, which is a special revenue<br />
fund. For additional information regarding <strong>the</strong><br />
establishment and purpose <strong>of</strong> <strong>the</strong> Ballpark Revenue<br />
Fund (BK0), please refer to that chapter in this volume.<br />
Program Structure Change<br />
Baseball Transfer – Dedicated Taxes had no program<br />
structure changes in <strong>the</strong> FY 2010 Proposed <strong>Budget</strong>.
Major Baseline Adjustments, Cost Savings<br />
and Policy Initiatives<br />
Initial adjustments: Baseball Transfer – Dedicated<br />
Taxes had a net reduction <strong>of</strong> $3,519,000 due to<br />
changes in <strong>the</strong> tax income earned, ballpark rent, and<br />
non-game day revenue.<br />
Cost Savings: Baseball Transfer – Dedicated Taxes<br />
reduction <strong>of</strong> $4,518,000 to align with anticipated certified<br />
revenues.<br />
FY 2009 Approved <strong>Budget</strong> to FY 2010 Proposed <strong>Budget</strong>, by Revenue Type<br />
Table BO0-4 itemizes <strong>the</strong> changes by revenue type between <strong>the</strong> FY 2009 approved budget and <strong>the</strong> FY 2010 proposed<br />
budget. The four categories <strong>of</strong> changes reflected in this table are: (1) changes to <strong>the</strong> baseline budget (includes<br />
agency request), (2) changes representing cost savings or efficiencies, (3) changes related to policy initiatives, and (4)<br />
changes to specifically address <strong>the</strong> projected revenue shortfall.<br />
Table BO0-4<br />
(dollars in thousands)<br />
Gap Closing Initiatives: To align with certified revenues,<br />
<strong>the</strong> proposed budget increased by $1,074,000.<br />
The proposed budget will transfer $11,000,000 in<br />
additional revenue from taxes related to baseball to<br />
<strong>the</strong> District’s General Fund.<br />
Program BUDGET FTE<br />
DEDICATED TAXES: FY 2009 Approved <strong>Budget</strong> and FTE 50,044 0.0<br />
Initial and Baseline Adjustments<br />
Reduction for nonrecurring costs - net reduction <strong>of</strong> tax income Baseball Transfer - Dedicated Tax -3,519 0.0<br />
earned, ballpark rent, and non-game day revenue<br />
Policy Initiatives and Cost Savings<br />
Cost Decrease - Reduction in Dedicated Tax to align with Baseball Transfer - Dedicated Tax -4,518 0.0<br />
certified revenues<br />
Gap Closing Initiatives<br />
Increase - Increase in Dedicated Tax to match certified revenues Baseball Transfer - Dedicated Tax 1,074 0.0<br />
Policy initiative - Transfer <strong>of</strong> additional revenue from taxes Baseball Transfer - Dedicated Tax -11,000 0.0<br />
related to baseball to <strong>the</strong> District’s General Fund<br />
DEDICATED TAXES: FY 2010 Proposed <strong>Budget</strong> and FTE 32,081 0.0<br />
Gross for BO0 - Baseball Transfer - Dedicated Taxes 32,081 0.0<br />
Baseball Transfer - Dedicated Taxes<br />
G-53
Inaugural Expenses<br />
On January 20, 2009, <strong>the</strong> inauguration <strong>of</strong> <strong>the</strong> nation’s<br />
44th President occurred in <strong>the</strong> District <strong>of</strong> Columbia.<br />
This event drew approximately 1.8 million people to<br />
<strong>the</strong> District. In support <strong>of</strong> <strong>the</strong> event, <strong>the</strong> District <strong>of</strong><br />
Columbia provided security, fire and emergency medical<br />
services, multi-agency coordination, reviewing<br />
stand construction services, and public works and<br />
infrastructure support.<br />
Reimbursement for <strong>the</strong> event will come from two<br />
federal sources. The first is <strong>the</strong> federal payment for<br />
Emergency Planning and Security Costs (agency EP0)<br />
found in <strong>the</strong> District <strong>of</strong> Columbia Appropriations Act.<br />
The second is reimbursement from <strong>the</strong> Federal<br />
(SB0)<br />
% Change<br />
FY 2008 FY 2009 FY 2010 from<br />
Description Actual Approved Proposed FY 2009<br />
Operating <strong>Budget</strong> $0 $38,825,000 $0 -100.0<br />
The mission <strong>of</strong> <strong>the</strong> Inaugural Expenses agency is to consolidate<br />
expenses associated with <strong>the</strong> Presidential Inauguration.<br />
Emergency Management <strong>Agency</strong> (FEMA). Once<br />
final expenses and reimbursements are determined,<br />
eligible expenses at each operating agency will be consolidated<br />
into <strong>the</strong> Inaugural Expenses agency. This<br />
process is expected to be completed by <strong>the</strong> end <strong>of</strong> FY<br />
2009, and details <strong>of</strong> reimbursement will be provided<br />
in <strong>the</strong> FY 2011 <strong>Budget</strong> and <strong>Financial</strong> Plan.<br />
The agency’s FY 2010 proposed budget is presented<br />
in <strong>the</strong> following tables:<br />
Inaugural Expenses<br />
G-55
FY 2010 Proposed Gross Funds Operating <strong>Budget</strong>, by Revenue Type<br />
Table SB0-1 contains <strong>the</strong> proposed FY 2010 agency budget compared to <strong>the</strong> FY 2009 approved budget. It also<br />
provides FY 2007 and FY 2008 actual expenditures.<br />
Table SB0-1<br />
(dollars in thousands)<br />
Actual Actual Approved Proposed<br />
Change<br />
from Percent<br />
Appropriated Fund<br />
Federal Resources<br />
FY 2007 FY 2008 FY 2009 FY 2010 FY 2009 Change<br />
Federal Payments 0 0 38,825 0 -38,825 -100.0<br />
Total for Federal Resources 0 0 38,825 0 -38,825 -100.0<br />
Gross Funds 0 0 38,825 0 -38,825 -100.0<br />
*Percent Change is based on whole dollars.<br />
Note: If applicable, for a breakdown <strong>of</strong> each Grant (Federal and Private), Special Purpose Revenue type and Intra-District agreement,<br />
please refer to Schedule 80 <strong>Agency</strong> Summary by Revenue Source in <strong>the</strong> Operating Appendices located on <strong>the</strong> <strong>Office</strong> <strong>of</strong> <strong>the</strong> <strong>Chief</strong><br />
<strong>Financial</strong> <strong>Office</strong>r’s website.<br />
FY 2010 Proposed Operating <strong>Budget</strong>, by Comptroller Source Group<br />
Table SB0-2 contains <strong>the</strong> proposed FY 2010 budget at <strong>the</strong> Comptroller Source Group (object class) level compared<br />
to <strong>the</strong> FY 2009 approved budget. It also provides FY 2007 and FY 2008 actual expenditures.<br />
Table SB0-2<br />
(dollars in thousands)<br />
Actual Actual Approved Proposed<br />
Change<br />
from Percent<br />
Comptroller Source Group FY 2007 FY 2008 FY 2009 FY 2010 FY 2009 Change*<br />
50 Subsidies and Transfers 0 0 38,825 0 -38,825 -100.0<br />
Subtotal Nonpersonal Services (NPS) 0 0 38,825 0 -38,825 -100.0<br />
Gross Funds 0 0 38,825 0 -38,825 -100.0<br />
*Percent Change is based on whole dollars.<br />
FY 2010 Proposed <strong>Budget</strong> and <strong>Financial</strong> Plan<br />
G-56
FY 2010 Proposed Operating <strong>Budget</strong> and FTEs, by Program and Activity<br />
Table SB0-3 contains <strong>the</strong> proposed FY 2010 budget by program and activity compared to <strong>the</strong> FY 2009 approved budget.<br />
It also provides FY 2008 actual data.<br />
Table SB0-3<br />
(dollars in thousands)<br />
Dollars in Thousands Full-Time Equivalents<br />
Change Change<br />
Actual Approved Proposed from Actual Approved Proposed from<br />
Program/Activity<br />
(1000) ) Inaugural Expenses<br />
FY 2008 FY 2009 FY 2010 FY 2009 FY 2008 FY 2009 FY 2010 FY 2009<br />
(1100) Inaugural Expenses 0 38,825 0 -38,825 0.0 0.0 0.0 0.0<br />
Subtotal (1000) Inaugural Expenses 0 38,825 0 -38,825 0.0 0.0 0.0 0.0<br />
Total Proposed Operating <strong>Budget</strong> 0 38,825 0 -38,825 0.0 0.0 0.0 0.0<br />
(Change is calculated by whole numbers and numbers may not add up due to rounding)<br />
Note: For more detailed information regarding <strong>the</strong> proposed funding for <strong>the</strong> activities within this agency’s programs, please see Schedule 30-<br />
PBB Program Summary By Activity in <strong>the</strong> FY 2010 Operating Appendices located on <strong>the</strong> <strong>Office</strong> <strong>of</strong> <strong>the</strong> <strong>Chief</strong> <strong>Financial</strong> <strong>Office</strong>r’s website.<br />
FY 2009 Approved <strong>Budget</strong> to FY 2010 Proposed <strong>Budget</strong><br />
Table SB0-4 itemizes <strong>the</strong> changes by revenue type between <strong>the</strong> FY 2009 approved budget and <strong>the</strong> FY 2010 proposed<br />
budget. The four categories <strong>of</strong> changes reflected in this table are: (1) changes to <strong>the</strong> baseline budget (includes<br />
agency request), (2) changes representing cost savings or efficiencies, (3) changes related to policy initiatives, and (4)<br />
changes to specifically address <strong>the</strong> projected revenue shortfall.<br />
Table SB0-4<br />
(dollars in thousands)<br />
PROGRAM BUDGET FTE<br />
FEDERAL PAYMENTS: FY 2009 Approved <strong>Budget</strong> and FTE 38,825 0.0<br />
Eliminate - No appropriation required until FY 2013 -38,825 0.0<br />
FEDERAL PAYMENTS: FY 2010 Proposed <strong>Budget</strong> and FTE 0 0.0<br />
Gross for SB0 - Inaugural Expenses 0 0.0<br />
Inaugural Expenses<br />
G-57
Highway Trust Fund Transfer-<br />
Dedicated Taxes<br />
(KZ0)<br />
% Change<br />
FY 2008 FY 2009 FY 2010 from<br />
Description Actual Approved Proposed FY 2009<br />
Operating <strong>Budget</strong> $0 $0 $29,762,000 N/A<br />
The Highway Trust Fund Transfer – Dedicated Taxes agency records<br />
<strong>the</strong> transfer <strong>of</strong> motor fuel tax and parking tax revenues from <strong>the</strong><br />
District’s General Fund to <strong>the</strong> Highway Trust Fund.<br />
This agency is new in <strong>the</strong> FY 2010 budget and makes visible <strong>the</strong> flow <strong>of</strong> <strong>the</strong> dedicated revenues through <strong>the</strong> General<br />
Fund. The FY 2008 actual amount <strong>of</strong> motor fuel tax transfer to <strong>the</strong> Highway Trust Fund was $23.2 million, and<br />
<strong>the</strong> parking tax transfer was $7.4 million. For more information on <strong>the</strong> Highway Trust Fund, please see volume 6<br />
<strong>of</strong> <strong>the</strong> budget, FY 2010 – FY 2015 Capital Appendices.<br />
The agency’s FY 2010 proposed budget is presented in <strong>the</strong> following tables:<br />
FY 2010 Proposed Gross Funds Operating <strong>Budget</strong>, by Revenue Type<br />
Table KZ0-1 contains <strong>the</strong> proposed FY 2010 agency budget compared to <strong>the</strong> FY 2009 approved budget. It also<br />
provides FY 2007 and FY 2008 actual expenditures.<br />
Table KZ0-1<br />
(dollars in thousands)<br />
Actual Actual Approved Proposed<br />
Change<br />
from Percent<br />
Appropriated Fund<br />
General Fund<br />
FY 2007 FY 2008 FY 2009 FY 2010 FY 2009 Change*<br />
Dedicated Taxes 0 0 0 29,762 29,762 N/A<br />
Total for General Fund 0 0 0 29,762 29,762 N/A<br />
Gross Funds 0 0 0 29,762 29,762 N/A<br />
*Percent Change is based on whole dollars.<br />
Note: If applicable, for a breakdown <strong>of</strong> each Grant (Federal and Private), Special Purpose Revenue type and Intra-District agreement,<br />
please refer to Schedule 80 <strong>Agency</strong> Summary by Revenue Source in <strong>the</strong> Operating Appendices located on <strong>the</strong> <strong>Office</strong> <strong>of</strong> <strong>the</strong> <strong>Chief</strong><br />
<strong>Financial</strong> <strong>Office</strong>r’s website.<br />
Highway Trust Fund Transfer - Dedicated Taxes<br />
G-59
FY 2010 Proposed Operating <strong>Budget</strong>, by Comptroller Source Group<br />
Table KZ0-2 contains <strong>the</strong> proposed FY 2010 budget at <strong>the</strong> Comptroller Source group (object class) level compared<br />
to <strong>the</strong> FY 2009 approved budget. It also provides FY 2007 and FY 2008 actual expenditures.<br />
Table KZ0-2<br />
(dollars in thousands)<br />
Actual Actual Approved Proposed<br />
Change<br />
from Percent<br />
Comptroller Source Group FY 2007 FY 2008 FY 2009 FY 2010 FY 2009 Change*<br />
50 Subsidies and Transfers 0 0 0 29,762 29,762 N/A<br />
Subtotal Nonpersonal Services (NPS) 0 0 0 29,762 29,762 N/A<br />
Gross Funds 0 0 0 29,762 29,762 N/A<br />
*Percent Change is based on whole dollars.<br />
Program Description<br />
The Highway Trust Fund Transfer – Dedicated<br />
Taxes agency operates through <strong>the</strong> following program:<br />
Transfer Tax to Highway Trust Fund – records <strong>the</strong><br />
transfer <strong>of</strong> revenue to <strong>the</strong> Highway Trust Fund.<br />
This program contains <strong>the</strong> following 2 activities:<br />
■ Transfer Motor Fuel Tax to Highway Trust<br />
FY 2010 Proposed Operating <strong>Budget</strong> and FTEs, by Program and Activity<br />
FY 2010 Proposed <strong>Budget</strong> and <strong>Financial</strong> Plan<br />
G-60<br />
Fund – records <strong>the</strong> transfer <strong>of</strong> motor fuel tax<br />
revenue to <strong>the</strong> Highway Trust Fund; and<br />
■ Transfer Parking Tax to Highway Trust Fund -<br />
records <strong>the</strong> transfer <strong>of</strong> parking tax revenue to<br />
<strong>the</strong> Highway Trust Fund.<br />
Program Structure Change<br />
This is a new agency established in <strong>the</strong> FY 2010<br />
<strong>Budget</strong>.<br />
Table KZ0-3 contains <strong>the</strong> proposed FY 2010 budget by program and activity compared to <strong>the</strong> FY 2009 approved budget.<br />
It also provides <strong>the</strong> FY 2008 actual data.<br />
Table KZ0-3<br />
(dollars in thousands)<br />
Dollars in Thousands Full-Time Equivalents<br />
Change Change<br />
Actual Approved Proposed from Actual Approved Proposed from<br />
Program/Activity<br />
(1000) Transfer Tax to Highway Trust Fund<br />
FY 2008 FY 2009 FY 2010 FY 2009 FY 2008 FY 2009 FY 2010 FY 2009<br />
(1100) Trans Motor Fuel Tax to Hywy Trust Fund 0 0 20,173 20,173 0.0 0.0 0.0 0.0<br />
(1200) Transfer Parking Tax to Hywy Trust Fund 0 0 9,589 9,589 0.0 0.0 0.0 0.0<br />
Subtotal (1000) Transfer Tax to Highway Trust Fund 0 0 29,762 29,762 0.0 0.0 0.0 0.0<br />
Total Proposed Operating <strong>Budget</strong> 0 0 29,762 29,762 0.0 0.0 0.0 0.0<br />
(Change is calculated by whole numbers and numbers may not add up due to rounding)<br />
Note: For more detailed information regarding <strong>the</strong> proposed funding for <strong>the</strong> activities within this agency’s programs, please see Schedule 30-PBB, Program Summary by<br />
Activity, in <strong>the</strong> FY 2010 Operating Appendices located on <strong>the</strong> <strong>Office</strong> <strong>of</strong> <strong>the</strong> <strong>Chief</strong> <strong>Financial</strong> <strong>Office</strong>r’s website.
Major Baseline Adjustments, Cost Savings and Policy Initiatives<br />
This is a new agency established in <strong>the</strong> FY 2010 <strong>Budget</strong>. The transfer was not part <strong>of</strong> <strong>the</strong> FY 2009 <strong>Budget</strong>.<br />
FY 2009 Approved <strong>Budget</strong> to FY 2010 Proposed <strong>Budget</strong>, by Revenue Type<br />
Table KZ0-4 itemizes <strong>the</strong> changes by revenue type between <strong>the</strong> FY 2009 approved budget and <strong>the</strong> FY 2010 proposed<br />
budget. The three categories <strong>of</strong> changes reflected in this table are (1) changes to <strong>the</strong> baseline budget (includes<br />
agency request), (2) changes representing cost savings or efficiencies, and (3) changes related to policy initiatives.<br />
Table KZ0-4<br />
(dollars in thousands)<br />
PROGRAM BUDGET FTE<br />
DEDICATED TAXES: FY 2009 Approved <strong>Budget</strong> and FTE 0 0.0<br />
Policy Initiatives and Cost Savings<br />
Transfer In - Transfer motor fuel tax revenue to <strong>the</strong> Highway Trust Fund Transfer Tax to Highway<br />
Trust Fund 20,173 0.0<br />
Transfer in - Transfer parking tax revenue to <strong>the</strong> Highway Trust Fund Transfer Tax to Highway<br />
Trust Fund 9,589 0.0<br />
DEDICATED TAXES: FY 2010 Proposed <strong>Budget</strong> and FTE 29,762 0.0<br />
Gross for KZ0 - Highway Trust Fund Transfer - Dedicated Taxes 29,762 0.0<br />
Highway Trust Fund Transfer - Dedicated Taxes<br />
G-61
Convention Center Transfer -<br />
Dedicated Taxes<br />
www.dc.gov<br />
Telephone: 202-724-4493<br />
(EZ0)<br />
% Change<br />
FY 2008 FY 2009 FY 2010 from<br />
Description Actual Approved Proposed FY 2009<br />
Operating <strong>Budget</strong> $0 $0 $93,054,000 N/A<br />
The Convention Center Transfer – Dedicated Taxes agency records<br />
<strong>the</strong> transfer <strong>of</strong> certain sales tax revenues from <strong>the</strong> District’s General<br />
Fund to <strong>the</strong> Walter E. Washington Convention Center.<br />
This agency is new in <strong>the</strong> FY 2010 budget and makes<br />
visible <strong>the</strong> flow <strong>of</strong> <strong>the</strong> dedicated revenues through <strong>the</strong><br />
General Fund. The FY 2008 actual amount <strong>of</strong> sales<br />
tax transfer to <strong>the</strong> Convention Center was $91.5 million.<br />
For more information, please see <strong>the</strong> chapter for<br />
FY 2010 Proposed Gross Funds Operating <strong>Budget</strong>, by Revenue Type<br />
Table EZ0-1 contains <strong>the</strong> proposed FY 2010 agency budget compared to <strong>the</strong> FY 2009 approved budget.<br />
Table EZ0-1<br />
(dollars in thousands)<br />
Actual Actual Approved Proposed<br />
Change<br />
from Percent<br />
Appropriated Fund<br />
General Fund<br />
FY 2007 FY 2008 FY 2009 FY 2010 FY 2009 Change*<br />
Dedicated Taxes 0 0 0 93,054 93,054 N/A<br />
Total for General Fund 0 0 0 93,054 93,054 N/A<br />
Gross Funds 0 0 0 93,054 93,054 N/A<br />
*Percent Change is based on whole dollars.<br />
<strong>the</strong> Washington Convention Center Authority in <strong>the</strong><br />
“Enterprise and O<strong>the</strong>r” funds section <strong>of</strong> <strong>the</strong> budget.<br />
The agency’s FY 2010 proposed budget is presented<br />
in <strong>the</strong> following tables:<br />
Note: If applicable, for a breakdown <strong>of</strong> each Grant (Federal and Private), Special Purpose Revenue type and Intra-District agreement,<br />
please refer to Schedule 80 <strong>Agency</strong> Summary by Revenue Source in <strong>the</strong> Operating Appendices located on <strong>the</strong> <strong>Office</strong> <strong>of</strong> <strong>the</strong> <strong>Chief</strong><br />
<strong>Financial</strong> <strong>Office</strong>r’s website.<br />
Convention Center Transfer - Dedicated Taxes<br />
G-63
FY 2010 Proposed Operating <strong>Budget</strong>, by Comptroller Source Group<br />
Table EZ0-2 contains <strong>the</strong> proposed FY 2010 budget at <strong>the</strong> Comptroller Source Group (object class) level.<br />
Table EZ0-2<br />
(dollars in thousands)<br />
Actual Actual Approved Proposed<br />
Change<br />
from Percent<br />
Comptroller Source Group FY 2007 FY 2008 FY 2009 FY 2010 FY 2009 Change*<br />
50 Subsidies and Transfers 0 0 0 93,054 93,054 N/A<br />
Subtotal Nonpersonal Services (NPS) 0 0 0 93,054 93,054 N/A<br />
Gross Funds 0 0 0 93,054 93,054 N/A<br />
*Percent Change is based on whole dollars.<br />
Program Description<br />
The Convention Center Transfer – Dedicated Taxes<br />
agency operates through <strong>the</strong> following program:<br />
Transfer Tax to Convention Center – records <strong>the</strong><br />
transfer <strong>of</strong> revenue to <strong>the</strong> Walter E. Washington<br />
Convention Center.<br />
FY 2010 Proposed Operating <strong>Budget</strong> and FTEs, by Program and Activity<br />
Table EZ0-3 contains <strong>the</strong> proposed FY 2010 budget by program and activity.<br />
Table EZ0-3<br />
(dollars in thousands)<br />
Dollars in Thousands Full-Time Equivalents<br />
Change Change<br />
Actual Approved Proposed from Actual Approved Proposed from<br />
Program/Activity<br />
(1000) Transfer Tax To Convention Center<br />
FY 2008 FY 2009 FY 2010 FY 2009 FY 2008 FY 2009 FY 2010 FY 2009<br />
(1100) Transfer Sales Tax To Convention Center 0 0 93,054 93,054 0.0 0.0 0.0 0.0<br />
Subtotal (1000) Transfer Tax To Convention Center 0 0 93,054 93,054 0.0 0.0 0.0 0.0<br />
Total Proposed Operating <strong>Budget</strong> 0 0 93,054 93,054 0.0 0.0 0.0 0.0<br />
(Change is calculated by whole numbers and numbers may not add up due to rounding)<br />
Note: For more detailed information regarding <strong>the</strong> proposed funding for <strong>the</strong> activities within this agency’s programs, please see Schedule 30-PBB<br />
Program Summary by Activity in <strong>the</strong> FY 2010 Operating Appendices located on <strong>the</strong> <strong>Office</strong> <strong>of</strong> <strong>the</strong> <strong>Chief</strong> <strong>Financial</strong> <strong>Office</strong>r’s website.<br />
FY 2010 Proposed <strong>Budget</strong> and <strong>Financial</strong> Plan<br />
G-64<br />
Program Structure Change<br />
This is a new agency established in <strong>the</strong> FY 2010<br />
Proposed <strong>Budget</strong>.
Major Baseline Adjustments, Cost Savings and Policy Initiatives<br />
This is a new agency established in <strong>the</strong> FY 2010 <strong>Budget</strong>.<br />
FY 2009 Approved <strong>Budget</strong> to FY 2010 Proposed <strong>Budget</strong>, by Revenue Type<br />
Table EZ0-4 itemizes <strong>the</strong> changes by revenue type between <strong>the</strong> FY 2009 approved budget and <strong>the</strong> FY 2010 proposed<br />
budget. The four categories <strong>of</strong> changes reflected in this table are: (1) changes to <strong>the</strong> baseline budget (includes<br />
agency request), (2) changes representing cost savings or efficiencies, (3) changes related to policy initiatives, and (4)<br />
changes to specifically address <strong>the</strong> projected revenue shortfall.<br />
Table EZ0-4<br />
(dollars in thousands)<br />
Program BUDGET FTE<br />
DEDICATED TAXES: FY 2009 Approved <strong>Budget</strong> and FTE 0 0.0<br />
Policy Initiatives and Cost Savings<br />
Transfer in - Transfer sales tax revenue to <strong>the</strong> Convention Center Transfer Tax To Convention Center 99,149 0.0<br />
Gap Closing Initiatives<br />
Revenue Reduction - Align budget to revised revenue estimate Transfer Tax To Convention Center -6,095 0.0<br />
DEDICATED TAXES: FY 2010 Proposed <strong>Budget</strong> and FTE 93,054 0.0<br />
Gross for EZ0 - Convention Center Transfer-Dedicated Taxes 93,054 0.0<br />
Convention Center Transfer - Dedicated Taxes<br />
G-65
TIF and PILOT Transfer -<br />
Dedicated Taxes<br />
(TZ0)<br />
% Change<br />
FY 2008 FY 2009 FY 2010 from<br />
Description Actual Approved Proposed FY 2009<br />
Operating <strong>Budget</strong> $0 $0 $45,992,000 N/A<br />
The TIF and PILOT Transfer – Dedicated Taxes agency records <strong>the</strong><br />
transfer <strong>of</strong> certain sales and property tax revenues from <strong>the</strong> District’s<br />
General Fund to <strong>the</strong> special revenue funds that pay debt service on Tax<br />
Increment Financing (TIF) and Payment-in-Lieu-<strong>of</strong>-Taxes (PILOT)<br />
transactions.<br />
This agency is new in <strong>the</strong> FY 2010 budget and makes visible <strong>the</strong> flow <strong>of</strong> <strong>the</strong> dedicated revenues through <strong>the</strong> General<br />
F u n d .<br />
The FY 2008 actual amount <strong>of</strong> sales and property tax transfers to <strong>the</strong> TIF and PILOT funds was $24.6 million.<br />
For more information, please see <strong>the</strong> chapters for Tax Increment Financing (TIF) Program and Repayment <strong>of</strong><br />
PILOT Financing in <strong>the</strong> “Enterprise and O<strong>the</strong>r” funds section <strong>of</strong> <strong>the</strong> budget.<br />
FY 2010 Proposed Gross Funds Operating <strong>Budget</strong>, by Revenue Type<br />
Table TZ0-1 contains <strong>the</strong> proposed FY 2010 agency budget compared to <strong>the</strong> FY 2009 approved budget. It also<br />
provides FY 2007 and FY 2008 actual expenditures.<br />
Table TZ0-1<br />
(dollars in thousands)<br />
Actual Actual Approved Proposed<br />
Change<br />
from Percent<br />
Appropriated Fund<br />
General Fund<br />
FY 2007 FY 2008 FY 2009 FY 2010 FY 2009 Change*<br />
Dedicated Taxes 0 0 0 45,992 45,992 N/A<br />
Total for General Fund 0 0 0 45,992 45,992 N/A<br />
Gross Funds 0 0 0 45,992 45,992 N/A<br />
*Percent Change is based on whole dollars.<br />
Note: If applicable, for a breakdown <strong>of</strong> each Grant (Federal and Private), Special Purpose Revenue type and Intra-District agreement, please refer to Schedule 80 <strong>Agency</strong> Summary by<br />
Revenue Source in <strong>the</strong> Operating Appendices located on <strong>the</strong> <strong>Office</strong> <strong>of</strong> <strong>the</strong> <strong>Chief</strong> <strong>Financial</strong> <strong>Office</strong>r’s website.<br />
TIF and PILOT Transfer - Dedicated Taxes<br />
G-67
FY 2010 Proposed Operating <strong>Budget</strong>, by Comptroller Source Group<br />
Table TZ0-2 contains <strong>the</strong> proposed FY 2010 budget at <strong>the</strong> Comptroller Source Group (object class) level compared<br />
to <strong>the</strong> FY 2009 approved budget. It also provides FY 2007 and FY 2008 actual expenditures.<br />
Table TZ0-2<br />
(dollars in thousands)<br />
Actual Actual Approved Proposed<br />
Change<br />
from Percent<br />
Comptroller Source Group FY 2007 FY 2008 FY 2009 FY 2010 FY 2009 Change*<br />
50 Subsidies and Transfers 0 0 0 45,992 45,992 N/A<br />
Subtotal Nonpersonal Services (NPS) 0 0 0 45,992 45,992 N/A<br />
Gross Funds 0 0 0 45,992 45,992 N/A<br />
*Percent Change is based on whole dollars.<br />
Program Description<br />
The TIF and PILOT Transfer – Dedicated Taxes<br />
agency operates through <strong>the</strong> following program:<br />
Transfer Tax to TIF and PILOT – records <strong>the</strong> transfer<br />
<strong>of</strong> revenue to <strong>the</strong> TIF and PILOT Funds.<br />
This program contains <strong>the</strong> following 2 activities:<br />
■ Transfer Sales Tax to TIF and PILOT – records<br />
<strong>the</strong> transfer <strong>of</strong> sales tax revenue to <strong>the</strong> TIF and<br />
PILOT Funds; and<br />
FY 2010 Proposed Operating <strong>Budget</strong> and FTEs, by Program and Activity<br />
Table TZ0-3 contains <strong>the</strong> proposed FY 2010 budget by program and activity compared to <strong>the</strong> FY 2009 approved budget.<br />
It also provides FY 2008 actual data.<br />
Table TZ0-3<br />
(dollars in thousands)<br />
Dollars in Thousands Full-Time Equivalents<br />
Change Change<br />
Actual Approved Proposed from Actual Approved Proposed from<br />
Program/Activity<br />
(1000) Transfer Tax to TIF and PILOT<br />
FY 2008 FY 2009 FY 2010 FY 2009 FY 2008 FY 2009 FY 2010 FY 2009<br />
(1100) Transfer Sales Tax to TIF and PILOT 0 0 16,403 16,403 0.0 0.0 0.0 0.0<br />
(1200) Transfer Property Tax to TIF and PILOT 0 0 29,589 29,589 0.0 0.0 0.0 0.0<br />
Subtotal (1000) Transfer Tax to TIF and PILOT 0 0 45,992 45,992 0.0 0.0 0.0 0.0<br />
Total Proposed Operating <strong>Budget</strong> 0 0 45,992 45,992 0.0 0.0 0.0 0.0<br />
(Change is calculated by whole numbers and numbers may not add up due to rounding)<br />
Note: For more detailed information regarding <strong>the</strong> proposed funding for <strong>the</strong> activities within this agency’s programs, please see Schedule 30-PBB Program Summary by Activity in <strong>the</strong> FY 2010<br />
Operating Appendices located on <strong>the</strong> <strong>Office</strong> <strong>of</strong> <strong>the</strong> <strong>Chief</strong> <strong>Financial</strong> <strong>Office</strong>r’s website.<br />
FY 2010 Proposed <strong>Budget</strong> and <strong>Financial</strong> Plan<br />
G-68<br />
■ Transfer Property Tax to TIF and PILOT –<br />
records <strong>the</strong> transfer <strong>of</strong> property tax revenue to <strong>the</strong><br />
TIF and PILOT Funds.<br />
Program Structure Change<br />
This is a new agency established in <strong>the</strong> FY 2010<br />
<strong>Budget</strong>.
Major Baseline Adjustments, Cost Savings<br />
and Policy Initiatives<br />
This is a new agency established in <strong>the</strong> FY 2010<br />
<strong>Budget</strong>.<br />
Gap-Closing Initiatives: To align with certified revenues,<br />
<strong>the</strong> proposed budget is increased by<br />
$5,569,000, and it is increased by an additional<br />
$13,271,000 to incorporate <strong>the</strong> Community Benefits<br />
Fund in <strong>the</strong> estimate. The proposed budget will<br />
transfer $9,800,000 <strong>of</strong> incremental revenues related<br />
to <strong>the</strong> Great Streets TIF to Local funds, because borrowing<br />
has not yet occurred. Sufficient funds remain<br />
to pay debt service on any borrowing that does occur<br />
before <strong>the</strong> end <strong>of</strong> FY 2010. Finally, <strong>the</strong> $13,271,000<br />
<strong>of</strong> Community Benefits Fund revenue is also proposed<br />
to be transferred to Local funds.<br />
FY 2009 Approved <strong>Budget</strong> to FY 2010 Proposed <strong>Budget</strong>, by Revenue Type<br />
Table TZ0-4 itemizes <strong>the</strong> changes by revenue type between <strong>the</strong> FY 2009 approved budget and <strong>the</strong> FY 2010 proposed<br />
budget. The four categories <strong>of</strong> changes reflected in this table are: (1) changes to <strong>the</strong> baseline budget (includes<br />
agency request), (2) changes representing cost savings or efficiencies, (3) changes related to policy initiatives, and (4)<br />
changes to specifically address <strong>the</strong> projected revenue shortfall.<br />
Table TZ0-4<br />
(dollars in thousands)<br />
Program BUDGET FTE<br />
DEDICATED TAXES: FY 2009 Approved <strong>Budget</strong> and FTE 0 0.0<br />
Policy Initiatives and Cost Savings<br />
Transfer in - Transfer property tax revenue to TIF and PILOT debt service Transfer Tax to TIF and PILOT 27,342 0.0<br />
agencies<br />
Transfer in - Transfer sales tax revenue to TIF and PILOT debt Transfer Tax to TIF and PILOT 22,881 0.0<br />
service agencies<br />
Gap-Closing Initiatives<br />
Policy initiative - To use a portion <strong>of</strong> TIF revenue as Local revenue Transfer Tax to TIF and PILOT -9,800 0.0<br />
Gap closing - Increase to align with certified revenue estimate and incorporate Transfer Tax to TIF and PILOT 18,840 0.0<br />
<strong>the</strong> Community Benefits Fund<br />
Policy initiative - To convert Community Benefit Fund to local revenue Transfer Tax to TIF and PILOT -13,271 0.0<br />
DEDICATED TAXES: FY 2010 Proposed <strong>Budget</strong> and FTE 45,992 0.0<br />
Gross for TZ0 - TIF and Pilot Transfer-Dedicated Taxes 45,992 0.0<br />
TIF and PILOT Transfer - Dedicated Taxes<br />
G-69
H<br />
Enterprise and O<strong>the</strong>r Funds<br />
Water and Sewer Authority (LA) ...........................................................................H-1<br />
Washington Aqueduct (LB) ....................................................................................H-7<br />
D.C. Lottery and Charitable Games Control Board (DC)................................H-11<br />
D.C. Sports and Entertainment Commission (SC) ............................................H-17<br />
District <strong>of</strong> Columbia Retirement Board (DY).....................................................H-23<br />
Washington Convention Center Authority (ES).................................................H-29<br />
Housing Finance <strong>Agency</strong> (HF).............................................................................H-35<br />
University <strong>of</strong> <strong>the</strong> District <strong>of</strong> Columbia (GF)........................................................H-41<br />
D.C. Department <strong>of</strong> Human Resources Trust Fund (UV).................................H-55<br />
D.C. Public Library Trust Fund (UW) ................................................................H-59<br />
Unemployment Insurance Trust Fund (UI)..........................................................H-63<br />
Housing Production Trust Fund (UZ)..................................................................H-67<br />
Tax Increment Financing (TIF) Program (TX)...................................................H-71<br />
Ballpark Revenue Fund (BK) ................................................................................H-75<br />
Repayment <strong>of</strong> PILOT Financing (TY) ...............................................................H-79<br />
Enterprise and O<strong>the</strong>r Funds
Water and Sewer Authority<br />
www.dcwasa.com<br />
Telephone: 202-787-2020<br />
The mission <strong>of</strong> DC Water and Sewer Authority (WASA) is to serve all<br />
<strong>of</strong> its customers with outstanding service by providing reliable and<br />
cost-effective water and wastewater services in accordance with best<br />
practices.<br />
In 1996, regional participants in WASA, including<br />
<strong>the</strong> District <strong>of</strong> Columbia, Montgomery and Prince<br />
George's counties in Maryland, and Fairfax County<br />
in Virginia, as well as <strong>the</strong> United States Congress,<br />
agreed to create an independent, multi-jurisdictional<br />
water and wastewater authority. In April 1996, <strong>the</strong><br />
Council <strong>of</strong> <strong>the</strong> District <strong>of</strong> Columbia enacted <strong>the</strong><br />
"Water and Sewer Authority Establishment and<br />
Department <strong>of</strong> Public Works Reorganization Act <strong>of</strong><br />
1996," a statute that provided <strong>the</strong> groundwork for<br />
(LA0)<br />
% Change<br />
FY 2008 FY 2009 FY 2010 from<br />
Description Actual Approved Proposed FY 2009<br />
Operating <strong>Budget</strong> $832,700 $363,234,000 $393,653,000 8.4<br />
Note: WASA does not use <strong>the</strong> District’s financial system for its transactions, and past year actuals in this table may not reflect WASA’s actual activity.<br />
The FY 2008 Comprehensive Annual <strong>Financial</strong> Report shows $338,258,000 <strong>of</strong> actual expenses.<br />
<strong>the</strong> authority to become operationally independent<br />
on October 1, 1996. WASA is governed by an 11member<br />
regional Board <strong>of</strong> Directors and provides<br />
essential water and wastewater services to more than 2<br />
million residents and businesses throughout <strong>the</strong> metropolitan<br />
region.<br />
The agency’s FY 2010 proposed budget is presented<br />
in <strong>the</strong> following tables:<br />
Water and Sewer Authority<br />
H-1
FY 2010 Proposed Gross Funds Operating <strong>Budget</strong>, by Revenue Type<br />
Table LA0-1 contains <strong>the</strong> proposed FY 2010 agency budget compared to <strong>the</strong> FY 2009 approved budget. It also<br />
provides FY 2007 and FY 2008 actual expenditures.<br />
Table LA0-1<br />
(dollars in thousands)<br />
Actual Actual Approved Proposed<br />
Change<br />
from Percent<br />
Appropriated Fund<br />
General Fund<br />
FY 2007 FY 2008 FY 2009 FY 2010 FY 2009 Change*<br />
Special Purpose Revenue Funds 274,613 833 363,234 393,653 30,419 8.4<br />
Total for General Fund 274,613 833 363,234 393,653 30,419 8.4<br />
Gross Funds 274,613 833 363,234 393,653 30,419 8.4<br />
*Percent Change is based on whole dollars.<br />
Note: WASA does not use <strong>the</strong> District’s financial system for its transactions, and past year actuals in this table may not reflect WASA’s<br />
actual activity. The FY 2008 Comprehensive Annual <strong>Financial</strong> Report shows $338,258,000 <strong>of</strong> actual expenses.<br />
Note: If applicable, for a breakdown <strong>of</strong> each Grant (Federal and Private), Special Purpose Revenue type and Intra-District agreement,<br />
please refer to Schedule 80, <strong>Agency</strong> Summary by Revenue Source, in <strong>the</strong> Operating Appendices located on <strong>the</strong> <strong>Office</strong> <strong>of</strong> <strong>the</strong> <strong>Chief</strong><br />
<strong>Financial</strong> <strong>Office</strong>r’s website.<br />
FY 2010 Proposed Operating <strong>Budget</strong>, by Comptroller Source Group<br />
Table LA0-2 contains <strong>the</strong> proposed FY 2010 budget at <strong>the</strong> Comptroller Source Group (object class) level compared<br />
to <strong>the</strong> FY 2009 approved budget. It also provides FY 2007 and FY 2008 actual expenditures.<br />
Table LA0-2<br />
(dollars in thousands)<br />
Change<br />
Actual Actual Approved Proposed from Percent<br />
Comptroller Source Group FY 2007 FY 2008 FY 2009 FY 2010 FY 2009 Change*<br />
11 Regular Pay - Cont Full Time 41,028 0 70,500 74,116 3,616 5.1<br />
13 Additional Gross Pay 12,019 0 0 0 0 N/A<br />
14 Fringe Benefits - Curr Personnel 12,524 0 16,920 17,430 510 3.0<br />
15 Overtime Pay 5,386 0 4,815 4,947 132 2.7<br />
Subtotal Personal Services (PS) 70,956 0 92,235 96,493 4,258 4.6<br />
20 Supplies and Materials 23,256 0 27,184 29,172 1,988 7.3<br />
30 Energy, Comm. and Bldg Rentals 29,387 0 37,821 41,842 4,021 10.6<br />
31 Telephone, Telegraph, Telegram, Etc 1,120 0 0 0 0 N/A<br />
32 Rentals - Land and Structures 1,731 0 0 0 0 N/A<br />
40 O<strong>the</strong>r Services and Charges 47,636 0 23,601 29,395 5,794 24.5<br />
41 Contractual Services - O<strong>the</strong>r 24,535 0 70,969 77,053 6,084 8.6<br />
50 Subsidies and Transfers 24,042 0 19,311 20,617 1,306 6.8<br />
60 Land and Buildings 1,911 0 0 0 0 N/A<br />
70 Equipment & Equipment Rental 471 0 873 791 -82 -9.4<br />
80 Debt Service 49,569 833 91,240 98,290 7,050 7.7<br />
Subtotal Nonpersonal Services (NPS) 203,657 833 270,999 297,160 26,161 9.7<br />
Gross Funds 274,613 833 363,234 393,653 30,419 8.4<br />
*Percent Change is based on whole dollars.<br />
Note: WASA does not use <strong>the</strong> District’s financial system for its transactions, and past year actuals in this table may not reflect WASA’s<br />
actual activity. The FY 2008 Comprehensive Annual <strong>Financial</strong> Report shows $338,258,000 <strong>of</strong> actual expenses.<br />
FY 2010 Proposed <strong>Budget</strong> and <strong>Financial</strong> Plan<br />
H-2
Program Description<br />
Although <strong>the</strong> District’s financial system displays all<br />
WASA activity under a single program line, WASA<br />
operates through <strong>the</strong> following 3 programs:<br />
Potable Water System - WASA’s priority is to provide<br />
clean, safe water to <strong>the</strong> residents, businesses, and visitors<br />
in <strong>the</strong> nation’s capital. The quality <strong>of</strong> <strong>the</strong> water<br />
WASA delivers meets or exceeds federal health and<br />
safety standards. The water distributed by WASA is<br />
closely monitored throughout <strong>the</strong> distribution system,<br />
and <strong>the</strong> Washington Aqueduct and WASA routinely<br />
monitor numerous water quality parameters<br />
outside <strong>of</strong> <strong>the</strong> regulated areas to optimize <strong>the</strong> quality<br />
<strong>of</strong> water delivered to customers. Hundreds <strong>of</strong> samples<br />
are collected and analyzed each month from various<br />
locations, including residences, commercial<br />
buildings, schools, and day care facilities. An annual<br />
Water Quality Report is published each year to freely<br />
communicate with <strong>the</strong> customers and explain where<br />
<strong>the</strong> water comes from, what is in <strong>the</strong> water, how <strong>the</strong><br />
water is treated, and how WASA distributes <strong>the</strong> water<br />
to each home or business.<br />
To support emergency services within <strong>the</strong> District<br />
<strong>of</strong> Columbia, <strong>the</strong> water distribution system ensures<br />
availability, functionality, and reliability <strong>of</strong> service for<br />
public fire hydrants for fire protection in <strong>the</strong> District.<br />
As part <strong>of</strong> a five-year capital program started in FY<br />
2006, from October 2005 through September 2008,<br />
WASA replaced or upgraded 2,539 hydrants, with<br />
800 replacements/upgrades planned for FY 2009. In<br />
addition, WASA operations crews repaired 8,849<br />
hydrants during <strong>the</strong> 4-year period <strong>of</strong> October 1, 2004<br />
through September 2008. Through a Memorandum<br />
<strong>of</strong> Understanding (MOU) established in FY 2007,<br />
WASA has reaffirmed its partnership with <strong>the</strong> District<br />
<strong>of</strong> Columbia Fire and Emergency Medical Services<br />
Department (FEMS), to work cohesively to improve<br />
<strong>the</strong> public fire hydrants in <strong>the</strong> District and to ensure<br />
firefighters have system maps, web available access to<br />
hydrant location and availability, and o<strong>the</strong>r pertinent<br />
information needed to easily access WASA’s water system<br />
and obtain adequate fire flows during emergencies.<br />
Under this MOU, <strong>the</strong> original five-year program<br />
has been accelerated and a phase II, which will<br />
replace/upgrade an additional 3,000 public hydrants,<br />
has been proposed. The cost <strong>of</strong> this program is costneutral<br />
to <strong>the</strong> District’s rate payers as all expenses are<br />
<strong>the</strong> responsibility <strong>of</strong> <strong>the</strong> District government.<br />
Sanitary Sewer and Stormwater System - Sewer service<br />
is ano<strong>the</strong>r core WASA program. This program<br />
provides for <strong>the</strong> operation and maintenance <strong>of</strong> <strong>the</strong><br />
combined sewer system in <strong>the</strong> District, which collects<br />
and transports wastewater and stormwater flows to<br />
treatment and authorized discharge points as well as<br />
<strong>the</strong> separated sanitary sewers in <strong>the</strong> District.<br />
Stormwater activities within <strong>the</strong> separated sanitary<br />
and storm sewer areas are managed under legislation<br />
and federal permit by <strong>the</strong> DC Department <strong>of</strong> <strong>the</strong><br />
Environment. The sewer program has several major<br />
capital improvement projects, including <strong>the</strong><br />
Combined Sewer Overflow Long Term Control<br />
Project (CSO LTCP).<br />
Wastewater Treatment System -Wastewater treatment<br />
service is ano<strong>the</strong>r core WASA program.<br />
Wastewater treatment services are provided at Blue<br />
Plains to over 1.7 million people in WASA’s service<br />
area, including residents <strong>of</strong> <strong>the</strong> District <strong>of</strong> Columbia<br />
and significant portions <strong>of</strong> Montgomery and Prince<br />
George’s Counties in Maryland, and Fairfax and<br />
Loudoun Counties in Virginia. Wastewater treatment<br />
includes liquid process facilities that provide treatment<br />
for both sanitary wastewater flows and peak<br />
storm flows originating in <strong>the</strong> sanitary and combined<br />
sewer systems, respectively, along with solids processing<br />
facilities that treat <strong>the</strong> residual solids removed by<br />
<strong>the</strong> liquid process facilities. Blue Plains is rated for an<br />
average flow <strong>of</strong> 370 million gallons per day (MGD),<br />
and it is required by its National Pollutant Discharge<br />
Elimination System (NPDES) permit to treat a peak<br />
flow rate <strong>of</strong> 740 MGD through <strong>the</strong> complete treatment<br />
process for up to four hours and continuous<br />
peak complete treatment flows <strong>of</strong> 511 MGD <strong>the</strong>reafter.<br />
The plant treats <strong>the</strong>se flows to a level that meets<br />
one <strong>of</strong> <strong>the</strong> most stringent NPDES discharge permits<br />
in <strong>the</strong> United States. Additionally, up to 336 MGD<br />
<strong>of</strong> storm water flow must receive partial treatment,<br />
resulting in a total plant capacity <strong>of</strong> 1,076 MGD.<br />
The District <strong>of</strong> Columbia was <strong>the</strong> first regional<br />
signatory <strong>of</strong> <strong>the</strong> 1987 Chesapeake Bay Agreement<br />
(reducing nitrogen by 40 percent) to meet its voluntary<br />
commitment due to significant improvements by<br />
WASA at Blue Plains. Blue Plains has been lauded on<br />
several occasions for its efficient wastewater treatment<br />
plant operations by <strong>the</strong> National Association <strong>of</strong> Clean<br />
Water Agencies due to its excellent record <strong>of</strong> compli-<br />
Water and Sewer Authority<br />
H-3
ance with federal regulations. WASA continues to<br />
implement its combined sewer overflow long term<br />
control plan which, when fully implemented, will significantly<br />
reduce sewer overflows, resulting in<br />
improved water quality and significant reduction in<br />
debris in <strong>the</strong> national capital’s waterways. Ongoing<br />
improvements have already led to almost 40 percent<br />
FY 2010 Proposed Operating <strong>Budget</strong> and FTEs, by Program and Activity<br />
FY 2010 Proposed <strong>Budget</strong> and <strong>Financial</strong> Plan<br />
H-4<br />
reduction in overflows discharged into <strong>the</strong> Anacostia<br />
and Potomac Rivers.<br />
Program Structure Change<br />
WASA had no program structure changes in <strong>the</strong> FY<br />
2010 Proposed <strong>Budget</strong>.<br />
Table LA0-3 contains <strong>the</strong> proposed FY 2010 budget by program and activity compared to <strong>the</strong> FY 2009 approved budget.<br />
It also provides FY 2008 actual data.<br />
Table LA0-3<br />
(dollars in thousands)<br />
Dollars in Thousands Full-Time Equivalents<br />
Change Change<br />
Actual Approved Proposed from Actual Approved Proposed from<br />
Program/Activity FY 2008 FY 2009 FY 2010 FY 2009 FY 2008 FY 2009 FY 2010 FY 2009<br />
(1000) WASA<br />
(1100) WASA 833 363,234 393,653 30,419 0.0 0.0 0.0 0.0<br />
Subtotal (1000) WASA 833 363,234 393,653 30,419 0.0 0.0 0.0 0.0<br />
Total Proposed Operating <strong>Budget</strong> 833 363,234 393,653 30,419 0.0 0.0 0.0 0.0<br />
(Change is calculated by whole numbers and numbers may not add up due to rounding)<br />
Note: WASA does not use <strong>the</strong> District’s financial system for its transactions, and past year actuals in this table may not reflect WASA’s actual activity.<br />
The FY 2008 Comprehensive Annual <strong>Financial</strong> Report shows $338,258,000 <strong>of</strong> actual expenses.<br />
Note: For more detailed information regarding <strong>the</strong> proposed funding for <strong>the</strong> activities within this agency’s programs, please see Schedule 30-PBB<br />
Program Summary By Activity in <strong>the</strong> FY 2010 Operating Appendices located on <strong>the</strong> <strong>Office</strong> <strong>of</strong> <strong>the</strong> <strong>Chief</strong> <strong>Financial</strong> <strong>Office</strong>r’s website.
Major Baseline Adjustments, Cost Savings<br />
and Policy Initiatives<br />
Initial Adjustments: WASA saw an increase <strong>of</strong><br />
$30,389,000 in its operating budget for FY 2010 due<br />
to increase in operating costs. These increases were<br />
$4,021,000 in energy costs, $4,258,000 in personal<br />
services, $1,988,000 in supplies, $5,794,000 in o<strong>the</strong>r<br />
services and charges, $1,276,000 in subsidies and<br />
transfers, $7,050,000 in debt service, and $6,084,000<br />
in contractual services. WASA also has a decrease <strong>of</strong><br />
$82,000 in equipment and equipment rental.<br />
FY 2009 Approved <strong>Budget</strong> to FY 2010 Proposed <strong>Budget</strong>, by Revenue Type<br />
Table LA0-4 itemizes <strong>the</strong> changes by revenue type between <strong>the</strong> FY 2009 approved budget and <strong>the</strong> FY 2010 proposed<br />
budget. The four categories <strong>of</strong> changes reflected in this table are: (1) changes to <strong>the</strong> baseline budget (includes<br />
agency request), (2) changes representing cost savings or efficiencies, (3) changes related to policy initiatives, and (4)<br />
changes to specifically address <strong>the</strong> projected revenue shortfall.<br />
Table LA0-4<br />
(dollars in thousands)<br />
Policy Initiatives - The budget includes $30,000<br />
transferred from <strong>the</strong> Deputy Mayor for Planning and<br />
Economic Development as a wire transfer to <strong>the</strong><br />
District <strong>of</strong> Columbia Water and Sewer Authority for<br />
capital improvements to mitigate operational challenges<br />
in insuring water supply for fire protection at<br />
Klingle Road location.<br />
PROGRAM BUDGET FTE<br />
SPECIAL PURPOSE REVENUE FUNDS: FY 2009 Approved <strong>Budget</strong> and FTE 363,234 0.0<br />
Initial and Baseline Adjustments<br />
Net effect <strong>of</strong> fixed cost adjustments - Increase in Energy cost WASA 4,021 0.0<br />
Net effect <strong>of</strong> salary and benefits changes - Increase in Personal Services cost WASA 4,258 0.0<br />
Intra-<strong>Agency</strong> Changes - Increase in Supply cost WASA 1,988 0.0<br />
Intra-<strong>Agency</strong> Changes - Increase in O<strong>the</strong>r Services and Charges WASA 5,794 0.0<br />
Intra-<strong>Agency</strong> Changes - Increase in Subsidies and Transfers WASA 1,276 0.0<br />
Intra-<strong>Agency</strong> Changes - Increase in Debt Service WASA 7,050 0.0<br />
Intra-<strong>Agency</strong> Changes - Decrease in Equipment and Equipment Rental WASA -82 0.0<br />
Intra-<strong>Agency</strong> Changes - Increase in Contractual Services WASA 6,084 0.0<br />
Policy Initiatives and Cost Savings<br />
Intra-<strong>Agency</strong> Changes - Transfer from <strong>the</strong> Deputy Mayor for Economic WASA 30 0.0<br />
Development as a wire transfer<br />
SPECIAL PURPOSE REVENUE FUNDS: FY 2010 Proposed <strong>Budget</strong> and FTE 393,653 0.0<br />
Gross for LA0 - Water and Sewer Authority 393,653 0.0<br />
Water and Sewer Authority<br />
H-5
Washington Aqueduct<br />
washingtonaqueduct.nab.usace.army.mil<br />
Telephone: 202-764-2753<br />
(LB0)<br />
% Change<br />
FY 2008 FY 2009 FY 2010 from<br />
Description Actual Approved Proposed FY 2009<br />
Operating <strong>Budget</strong> $0 $56,491,000 $54,356,000 -3.8<br />
The mission <strong>of</strong> <strong>the</strong> Washington Aqueduct is to collect, purify, and<br />
pump an adequate supply <strong>of</strong> potable water for <strong>the</strong> District <strong>of</strong><br />
Columbia, Arlington County, and <strong>the</strong> City <strong>of</strong> Falls Church, Virginia.<br />
The Washington Aqueduct is owned and operated by<br />
<strong>the</strong> U.S. Army Corps <strong>of</strong> Engineers and is governed by<br />
a Wholesale Customer Board. It sells water to three<br />
wholesale customers: <strong>the</strong> District <strong>of</strong> Columbia Water<br />
and Sewer Authority; Arlington County, Virginia;<br />
and <strong>the</strong> City <strong>of</strong> Falls Church, Virginia. In FY 2008,<br />
<strong>the</strong> Washington Aqueduct pumped 56.846 billion<br />
gallons <strong>of</strong> purified water to its customers. In FY 2010<br />
it is expected to produce and supply an estimated 60<br />
billion gallons <strong>of</strong> water to its customers.<br />
Washington Aqueduct is a division <strong>of</strong> <strong>the</strong> U.S.<br />
Army Corps <strong>of</strong> Engineers and does not receive appropriated<br />
funding from <strong>the</strong> District <strong>of</strong> Columbia or <strong>the</strong><br />
Federal Government.<br />
The District <strong>of</strong> Columbia Water and Sewer<br />
Authority (WASA) funds <strong>the</strong> District's portion <strong>of</strong> <strong>the</strong><br />
costs <strong>of</strong> <strong>the</strong> Washington Aqueduct. As a wholesale<br />
customer, WASA purchases potable water and makes<br />
payments to Washington Aqueduct based on <strong>the</strong><br />
number <strong>of</strong> gallons provided. Washington Aqueduct<br />
charges a rate based on water sale agreements with <strong>the</strong><br />
District <strong>of</strong> Columbia, Arlington County, and <strong>the</strong><br />
City <strong>of</strong> Falls Church. The individual jurisdictions are<br />
responsible for water distribution.<br />
The agency’s FY 2010 proposed budget is presented<br />
in <strong>the</strong> following tables:<br />
Washington Aqueduct<br />
H-7
FY 2010 Proposed Gross Funds Operating <strong>Budget</strong>, by Revenue Type<br />
Table LB0-1 contains <strong>the</strong> proposed FY 2010 agency budget compared to <strong>the</strong> FY 2009 approved budget.<br />
Table LB0-1<br />
(dollars in thousands)<br />
Actual Actual Approved Proposed<br />
Change<br />
from Percent<br />
Appropriated Fund<br />
General Fund<br />
FY 2007 FY 2008 FY 2009 FY 2010 FY 2009 Change*<br />
Special Purpose Revenue Funds 0 0 56,491 54,356 -2,135 -3.8<br />
Total for General Fund 0 0 56,491 54,356 -2,135 -3.8<br />
Gross Funds 0 0 56,491 54,356 -2,135 -3.8<br />
*Percent Change is based on whole dollars.<br />
Note: If applicable, for a breakdown <strong>of</strong> each Grant (Federal and Private), Special Purpose Revenue type and Intra-District<br />
agreement, please refer to Schedule 80, <strong>Agency</strong> Summary by Revenue Source, in <strong>the</strong> Operating Appendices located on <strong>the</strong><br />
<strong>Office</strong> <strong>of</strong> <strong>the</strong> <strong>Chief</strong> <strong>Financial</strong> <strong>Office</strong>r’s website.<br />
FY 2010 Proposed Operating <strong>Budget</strong>, by Comptroller Source Group<br />
Table LB0-2 contains <strong>the</strong> proposed FY 2010 budget at <strong>the</strong> Comptroller Source Group (object class) level compared<br />
to <strong>the</strong> FY 2009 approved budget.<br />
Table LB0-2<br />
(dollars in thousands)<br />
Actual Actual Approved Proposed<br />
Change<br />
from Percent<br />
Comptroller Source Group FY 2007 FY 2008 FY 2009 FY 2010 FY 2009 Change*<br />
50 Subsidies and Transfers 0 0 56,491 54,356 -2,135 -3.8<br />
Subtotal Nonpersonal Services (NPS) 0 0 56,491 54,356 -2,135 -3.8<br />
Gross Funds 0 0 56,491 54,356 -2,135 -3.8<br />
*Percent Change is based on whole dollars.<br />
FY 2010 Proposed <strong>Budget</strong> and <strong>Financial</strong> Plan<br />
H-8
Program Description<br />
The Washington Aqueduct operates through <strong>the</strong> following<br />
program:<br />
Washington Aqueduct – provides for <strong>the</strong> sale <strong>of</strong><br />
drinking water to <strong>the</strong>se three jurisdictions: DC<br />
WASA; Arlington County; and <strong>the</strong> City <strong>of</strong> Falls<br />
Church. A Wholesale Customer Board, represented<br />
by <strong>the</strong> three jurisdictions, approves <strong>the</strong> Washington<br />
Aqueduct's budget. During FY 2010, <strong>the</strong> agency will<br />
pump an estimated 60 billion gallons <strong>of</strong> purified<br />
water to its customers.<br />
FY 2010 Proposed Operating <strong>Budget</strong> and FTEs, by Program and Activity<br />
Table LB0-3 contains <strong>the</strong> proposed FY 2010 budget by program and activity compared to <strong>the</strong> FY 2009 approved budget.<br />
Table LB0-3<br />
(dollars in thousands)<br />
Dollars in Thousands Full-Time Equivalents<br />
Change Change<br />
Actual Approved Proposed from Actual Approved Proposed from<br />
Program/Activity<br />
(1000) Washington Aqueduct<br />
FY 2008 FY 2009 FY 2010 FY 2009 FY 2008 FY 2009 FY 2010 FY 2009<br />
(1100) Washington Aqueduct 0 56,491 54,356 -2,135 0.0 0.0 0.0 0.0<br />
Subtotal (1000) Washington Aqueduct 0 56,491 54,356 -2,135 0.0 0.0 0.0 0.0<br />
Total Proposed Operating <strong>Budget</strong> 0 56,491 54,356 -2,135 0.0 0.0 0.0 0.0<br />
(Change is calculated by whole numbers and numbers may not add up due to rounding)<br />
Program Structure Change<br />
The Washington Aqueduct had no program structure<br />
changes in <strong>the</strong> FY 2010 Proposed <strong>Budget</strong>.<br />
Note: For more detailed information regarding <strong>the</strong> proposed funding for <strong>the</strong> activities within this agency’s programs, please see<br />
Schedule 30-PBB Program Summary By Activity in <strong>the</strong> FY 2010 Operating Appendices located on <strong>the</strong> <strong>Office</strong> <strong>of</strong> <strong>the</strong> <strong>Chief</strong><br />
<strong>Financial</strong> <strong>Office</strong>r’s website.<br />
Washington Aqueduct<br />
H-9
Major Baseline Adjustments, Cost Savings and Policy Initiatives<br />
Initial Adjustments - The subsidies and transfers category was reduced by $2,135,000 in Baseline Adjustments to reflect<br />
reduced operating costs.<br />
FY 2009 Approved <strong>Budget</strong> to FY 2010 Proposed <strong>Budget</strong>, by Revenue Type<br />
Table LB0-4 itemizes <strong>the</strong> changes by revenue type between <strong>the</strong> FY 2009 approved budget and <strong>the</strong> FY 2010 proposed<br />
budget. The four categories <strong>of</strong> changes reflected in this table are: (1) changes to <strong>the</strong> baseline budget (includes agency<br />
request), (2) changes representing cost savings or efficiencies, (3) changes related to policy initiatives, and (4) changes to<br />
specifically address <strong>the</strong> projected revenue shortfall.<br />
Table LB0-4<br />
(dollars in thousands)<br />
PROGRAM BUDGET FTE<br />
SPECIAL PURPOSE REVENUE FUNDS: FY 2009 Approved <strong>Budget</strong> and FTE 56,491 0.0<br />
Initial and Baseline Adjustments<br />
Funding changes - reduction in subsidies and transfers Washington Aqueduct -2,135 0.0<br />
SPECIAL PURPOSE REVENUE FUNDS: FY 2010 Proposed <strong>Budget</strong> and FTE 54,356 0.0<br />
Gross for LB0 - Washington Aqueduct 54,356 0.0<br />
FY 2010 Proposed <strong>Budget</strong> and <strong>Financial</strong> Plan<br />
H-10
D.C. Lottery and Charitable Games<br />
Control Board<br />
www.lottery.dc.gov<br />
Telephone: 202-645-8000<br />
The mission <strong>of</strong> <strong>the</strong> D.C. Lottery and Charitable Games Control<br />
Board (DCLB) is to generate revenue for <strong>the</strong> District’s general fund<br />
through <strong>the</strong> sale <strong>of</strong> lottery games and to regulate charitable gaming.<br />
The agency’s FY 2010 proposed budget is presented in <strong>the</strong> following tables:<br />
(DC0)<br />
% Change<br />
FY 2008 FY 2009 FY 2010 from<br />
Description Actual Approved Proposed FY 2009<br />
Operating <strong>Budget</strong> $252,748,085 $265,000,000 $250,000,000 -5.7<br />
FTEs 63.4 77.0 77.0 0.0<br />
FY 2010 Proposed Gross Funds Operating <strong>Budget</strong>, by Revenue Type<br />
Table DC0-1 contains <strong>the</strong> proposed FY 2010 agency budget compared to <strong>the</strong> FY 2009 approved budget. It also<br />
provides FY 2007 and FY 2008 actual expenditures.<br />
Table DC0-1<br />
(dollars in thousands)<br />
Actual Actual Approved Proposed<br />
Change<br />
from Percent<br />
Appropriated Fund<br />
General Fund<br />
FY 2007 FY 2008 FY 2009 FY 2010 FY 2009 Change*<br />
Special Purpose Revenue Funds 257,738 252,748 265,000 250,000 -15,000 -5.7<br />
Total for General Fund 257,738 252,748 265,000 250,000 -15,000 -5.7<br />
Gross Funds 257,738 252,748 265,000 250,000 -15,000 -5.7<br />
*Percent Change is based on whole dollars.<br />
Note: If applicable, for a breakdown <strong>of</strong> each Grant (Federal and Private), Special Purpose Revenue type and Intra-District agreement,<br />
please refer to Schedule 80, <strong>Agency</strong> Summary by Revenue Source, in <strong>the</strong> Operating Appendices located on <strong>the</strong> <strong>Office</strong> <strong>of</strong> <strong>the</strong> <strong>Chief</strong><br />
<strong>Financial</strong> <strong>Office</strong>r’s website.<br />
D.C. Lottery and Charitable Games Control Board<br />
H-11
FY 2010 Proposed Full-Time Equivalents, by Revenue Type<br />
Table DC0-2 contains <strong>the</strong> proposed FY 2010 FTE level compared to <strong>the</strong> FY 2009 approved FTE level by revenue<br />
type. It also provides FY 2007 and FY 2008 actual data.<br />
Table DC0-2<br />
Change<br />
Actual Actual Approved Proposed from Percent<br />
Appropriated Fund FY 2007 FY 2008 FY 2009 FY 2010 FY 2009 Change*<br />
General Fund<br />
Special Purpose Revenue Funds 68.4 63.4 77.0 77.0 0.0 0.0<br />
Total for General Fund 68.4 63.4 77.0 77.0 0.0 0.0<br />
Total Proposed FTEs 68.4 63.4 77.0 77.0 0.0 0.0<br />
FY 2010 Proposed Operating <strong>Budget</strong>, by Comptroller Source Group<br />
Table DC0-3 contains <strong>the</strong> proposed FY 2010 budget at <strong>the</strong> Comptroller Source Group (object class) level compared<br />
to <strong>the</strong> FY 2009 approved budget. It also provides FY 2007 and FY 2008 actual expenditures.<br />
Table DC0-3<br />
(dollars in thousands)<br />
Change<br />
Actual Actual Approved Proposed from Percent<br />
Comptroller Source Group FY 2007 FY 2008 FY 2009 FY 2010 FY 2009 Change*<br />
11 Regular Pay - Cont Full Time 4,984 4,864 5,594 5,826 233 4.2<br />
12 Regular Pay - O<strong>the</strong>r 76 144 165 186 20 12.3<br />
13 Additional Gross Pay 118 109 0 0 0 N/A<br />
14 Fringe Benefits - Curr Personnel 862 887 906 980 74 8.1<br />
15 Overtime Pay 105 84 390 351 -38 -9.9<br />
Subtotal Personal Services (PS) 6,145 6,089 7,055 7,343 288 4.1<br />
20 Supplies and Materials 86 86 159 148 -11 -6.9<br />
30 Energy, Comm. and Bldg Rentals 57 49 46 77 31 68.1<br />
31 Telephone, Telegraph, Telegram, Etc. 288 281 377 252 -125 -33.2<br />
32 Rentals - Land and Structures 1,316 1,833 2,700 2,300 -400 -14.8<br />
33 Janitorial Services -1 5 6 12 6 100.4<br />
34 Security Services 0 10 0 12 12 N/A<br />
35 Occupancy Fixed Costs 0 11 0 40 40 N/A<br />
40 O<strong>the</strong>r Services and Charges 19,591 18,979 20,849 18,658 -2,191 -10.5<br />
41 Contractual Services - O<strong>the</strong>r 3,196 3,845 4,726 4,564 -162 -3.4<br />
50 Subsidies and Transfers 226,704 221,142 228,200 215,950 -12,250 -5.4<br />
70 Equipment & Equipment Rental 355 418 882 644 -238 -27.0<br />
Subtotal Nonpersonal Services (NPS) 251,593 246,659 257,945 242,657 -15,288 -5.9<br />
Gross Funds 257,738 252,748 265,000 250,000 -15,000 -5.7<br />
*Percent Change is based on whole dollars.<br />
FY 2010 Proposed <strong>Budget</strong> and <strong>Financial</strong> Plan<br />
H-12
Program Description<br />
The D.C. Lottery and Charitable Games Control<br />
Board operates through <strong>the</strong> following 5 programs:<br />
Gaming Administration - provides support services<br />
to lottery retail agents and <strong>the</strong> gaming public so that<br />
<strong>the</strong>y can benefit from <strong>the</strong> portfolio <strong>of</strong> games <strong>of</strong>fered<br />
by DCLB.<br />
This program contains <strong>the</strong> following 6 activities:<br />
■ Marketing – provides advertising and promotional<br />
information to eligible players. The goals<br />
are to attract eligible players to purchase lottery<br />
tickets so that <strong>the</strong>y may enjoy <strong>the</strong> entertainment<br />
value <strong>of</strong>fered by <strong>the</strong> D.C. Lottery and Charitable<br />
Games Control Board’s portfolio <strong>of</strong> games.<br />
■ Sales Department – provides sales goals and retail<br />
development services to lottery retail agents. The<br />
goals are to assist lottery retail agents in reaching<br />
established minimum sales volume levels and to<br />
achieve sustained growth.<br />
■ Draw Division – provides draw-related services<br />
to <strong>the</strong> gaming public. The goals are to maintain<br />
<strong>the</strong> public trust through ensuring unbiased and<br />
random draws.<br />
■ Licensing and Charitable Games – provides<br />
licensing and regulatory compliance services to<br />
existing and prospective lottery retail agents and<br />
non-pr<strong>of</strong>it charitable organizations. The goals are<br />
to ensure that lottery retail agents and non-pr<strong>of</strong>it<br />
charitable organizations receive appropriate<br />
licenses to sell lottery products and conduct charitable<br />
gaming activities in accordance with <strong>the</strong><br />
laws and regulations set forth by <strong>the</strong> District.<br />
■ Information Technology – provides technical<br />
coordination and oversight services to lottery<br />
retail agents, customers, and internal DCLB<br />
operations. The goals are for retail agents, customers<br />
and internal operations to deliver, play<br />
and provide an uncompromised portfolio <strong>of</strong> lottery<br />
products.<br />
■ Claim Center – provides claims processing and<br />
gaming information services to <strong>the</strong> gaming public.<br />
The goals are for <strong>the</strong> public to redeem prizes<br />
and enjoy a positive gaming experience.<br />
Instant Games - provides a portfolio <strong>of</strong> instant lottery<br />
games to <strong>the</strong> gaming public so that <strong>the</strong>y can experi-<br />
ence <strong>the</strong> entertainment value and potential reward <strong>of</strong><br />
playing and winning with scratch-<strong>of</strong>f style lottery<br />
tickets.<br />
This program contains <strong>the</strong> following activity:<br />
■ Instant Games – provides scratch-<strong>of</strong>f lottery-type<br />
tickets for purchase by eligible players. The goals<br />
are for eligible players to purchase <strong>the</strong> tickets and<br />
to avail <strong>the</strong>mselves <strong>of</strong> <strong>the</strong> entertainment value<br />
<strong>of</strong>fered by <strong>the</strong> DCLB’s portfolio <strong>of</strong> games and so<br />
that <strong>the</strong> District can experience a steady source <strong>of</strong><br />
revenue through <strong>the</strong> transfer <strong>of</strong> net proceeds from<br />
lottery sales.<br />
Online Games - provides online lottery-type games<br />
and services, which are lottery game tickets sold to <strong>the</strong><br />
gaming public by lottery retail agents and video gaming<br />
machines, played by <strong>the</strong> public at targeted social<br />
settings to <strong>the</strong> gaming public so that <strong>the</strong> District can<br />
experience a steady source <strong>of</strong> revenue through <strong>the</strong><br />
transfer <strong>of</strong> net proceeds from lottery sales.<br />
This program contains <strong>the</strong> following 9 activities:<br />
■ Lucky Numbers, DC Four, Rolling Cash Five,<br />
PowerBall, DC Daily Six, KENO, Hot Lotto,<br />
Raffle Games, and Miscellaneous – provide<br />
online (kiosk–based) lottery gaming experience<br />
for <strong>the</strong> gaming public so that <strong>the</strong>y can experience<br />
<strong>the</strong> entertainment value <strong>of</strong> <strong>the</strong> DCLB’s portfolio<br />
<strong>of</strong> games and potential rewards <strong>of</strong> playing and<br />
winning.<br />
<strong>Agency</strong> Management - provides for administrative<br />
support and <strong>the</strong> required tools to achieve operational<br />
and programmatic results. This program is standard<br />
for all agencies using performance-based budgeting.<br />
<strong>Agency</strong> <strong>Financial</strong> Operations - provides comprehensive<br />
and efficient financial management services to<br />
and on behalf <strong>of</strong> District agencies so that <strong>the</strong> financial<br />
integrity <strong>of</strong> <strong>the</strong> District <strong>of</strong> Columbia is maintained.<br />
This program is standard for all agencies using performance-based<br />
budgeting.<br />
Program Structure Change<br />
The D.C. Lottery and Charitable Games Control<br />
Board had no program structure changes in <strong>the</strong> FY<br />
2010 Proposed <strong>Budget</strong>.<br />
D.C. Lottery and Charitable Games Control Board<br />
H-13
FY 2010 Proposed Operating <strong>Budget</strong> and FTEs, by Program and Activity<br />
Table DC0-4 contains <strong>the</strong> proposed FY 2010 budget by program and activity compared to <strong>the</strong> FY 2009 approved budget.<br />
It also provides FY 2008 actual data.<br />
Table DC0-4<br />
(dollars in thousands)<br />
Dollars in Thousands Full-Time Equivalents<br />
Change Change<br />
Actual Approved Proposed from Actual Approved Proposed from<br />
Program/Activity<br />
(1000) <strong>Agency</strong> Management Program<br />
FY 2008 FY 2009 FY 2010 FY 2009 FY 2008 FY 2009 FY 2010 FY 2009<br />
(1010) Human Resources 442 362 496 134 3.0 4.0 6.0 2.0<br />
(1015) Executive Direction and Support 1,408 2,130 2,283 154 4.0 3.0 4.0 1.0<br />
(1030) Property and Fleet Management 399 687 599 -88 3.0 4.0 3.0 -1.0<br />
(1040) Information Technology 399 206 357 151 3.0 2.0 3.0 1.0<br />
(1050) <strong>Financial</strong> Services 0 2,819 2,421 -397 0.0 0.0 0.0 0.0<br />
(1075) Security 1,006 1,104 1,100 -4 4.9 5.0 5.0 0.0<br />
(1080) Communications 363 519 553 33 2.0 4.0 4.0 0.0<br />
Subtotal (1000) <strong>Agency</strong> Management Program<br />
(100F) <strong>Agency</strong> <strong>Financial</strong> Operations<br />
4,017 7,827 7,809 -18 19.9 22.0 25.0 3.0<br />
(110F) <strong>Budget</strong> Operations 91 174 170 -4 1.0 2.0 2.0 0.0<br />
(120F) Accounting Operations 403 511 557 45 6.0 6.0 6.0 0.0<br />
(130F) Fiscal <strong>Office</strong>r 2,051 374 372 -1 2.0 3.0 3.0 0.0<br />
Subtotal (100F) <strong>Agency</strong> <strong>Financial</strong> Operations<br />
(2000) Instant Games<br />
2,545 1,059 1,099 40 9.0 11.0 11.0 0.0<br />
(2100) Instant Games (Activity) 43,066 40,435 45,270 4,834 0.0 0.0 0.0 0.0<br />
Subtotal (2000) Instant Games<br />
(3000) On Line Games<br />
43,066 40,435 45,270 4,834 0.0 0.0 0.0 0.0<br />
(3100) Lucky Numbers 64,308 67,825 58,178 -9,647 0.0 0.0 0.0 0.0<br />
(3300) DC Four 80,641 83,725 77,348 -6,377 0.0 0.0 0.0 0.0<br />
(3400) DC Daily Six 4,100 4,281 3,701 -580 0.0 0.0 0.0 0.0<br />
(3500) DC Rolling Cash 5 2,986 3,330 2,847 -483 0.0 0.0 0.0 0.0<br />
(3600) Powerball 31,527 36,630 33,217 -3,413 0.0 0.0 0.0 0.0<br />
(3800) Keno 13,093 13,320 13,192 -128 0.0 0.0 0.0 0.0<br />
(4200) Hot Lotto 2,822 2,379 3,322 943 0.0 0.0 0.0 0.0<br />
(4300) Raffle Game -2 0 0 0 0.0 0.0 0.0 0.0<br />
(9800) Unclassified Revenue and Expenditures 170 275 250 -25 0.0 0.0 0.0 0.0<br />
Subtotal (3000) On Line Games 199,647 211,765 192,055 -19,709 0.0 0.0 0.0 0.0<br />
(Continued on next page)<br />
FY 2010 Proposed <strong>Budget</strong> and <strong>Financial</strong> Plan<br />
H-14
Table DC0-4 (Continued)<br />
(dollars in thousands)<br />
Dollars in Thousands Full-Time Equivalents<br />
Change Change<br />
Actual Approved Proposed from Actual Approved Proposed from<br />
Program/Activity<br />
(6000) Gaming Operations Program<br />
FY 2008 FY 2009 FY 2010 FY 2009 FY 2008 FY 2009 FY 2010 FY 2009<br />
(6200) Marketing 836 893 882 -11 8.0 9.0 9.0 0.0<br />
(6300) Trade Development 610 756 810 55 5.0 9.0 9.0 0.0<br />
(6400) Draw Division 390 381 438 57 5.0 5.0 5.5 0.5<br />
(6500) Licensing and Charitable Games 509 647 558 -89 5.0 7.0 5.0 -2.0<br />
(6600) Information Technology (Games) 1,002 1,025 933 -92 8.5 11.0 10.5 -0.5<br />
(6700) Claim Center 97 143 145 2 2.0 2.0 2.0 0.0<br />
(6800) Ticket Distribution 28 69 0 -69 1.0 1.0 0.0 -1.0<br />
Subtotal (6000) Gaming Operations Program 3,473 3,914 3,767 -147 34.5 44.0 41.0 -3.0<br />
Total Proposed Operating <strong>Budget</strong> 252,748 265,000 250,000 -15,000 63.4 77.0 77.0 0.0<br />
(Change is calculated by whole numbers and numbers may not add up due to rounding)<br />
Note: For more detailed information regarding <strong>the</strong> proposed funding for <strong>the</strong> activities within this agency’s programs, please see Schedule 30-PBB<br />
Program Summary by Activity in <strong>the</strong> FY 2010 Operating Appendices located on <strong>the</strong> <strong>Office</strong> <strong>of</strong> <strong>the</strong> <strong>Chief</strong> <strong>Financial</strong> <strong>Office</strong>r’s website.<br />
D.C. Lottery and Charitable Games Control Board<br />
H-15
Major Baseline Adjustments, Cost Savings<br />
and Policy Initiatives<br />
Initial adjustments: A net reduction <strong>of</strong> $15,000,000.<br />
This includes an increase <strong>of</strong> $4,834,462 in Instant<br />
Games, which reflects a projected increase in revenue<br />
due to programmatic changes in games and a pro-<br />
FY 2009 Approved <strong>Budget</strong> to FY 2010 Proposed <strong>Budget</strong>, by Revenue Type<br />
Table DC0-5 itemizes <strong>the</strong> changes by revenue type between <strong>the</strong> FY 2009 approved budget and <strong>the</strong> FY 2010 proposed<br />
budget. The four categories <strong>of</strong> changes reflected in this table are: (1) changes to <strong>the</strong> baseline budget (includes<br />
agency request), (2) changes representing cost savings or efficiencies, (3) changes related to policy initiatives, and (4)<br />
changes to specifically address <strong>the</strong> projected revenue shortfall.<br />
Table DC0-5<br />
(dollars in thousands)<br />
PROGRAM BUDGET FTE<br />
SPECIAL PURPOSE REVENUE FUNDS: FY 2009 Approved <strong>Budget</strong> and FTE 265,000 77.0<br />
Initial and Baseline Adjustments<br />
Net effect <strong>of</strong> fixed cost adjustments - Revised fixed cost estimates in<br />
multiple commodities<br />
Multiple -437 0.0<br />
Net effect <strong>of</strong> salary and benefits changes - A net increase across several<br />
programs in personal services<br />
Multiple 288 0.0<br />
Intra-<strong>Agency</strong> Changes - An increase in Subsidies and Transfers, O<strong>the</strong>r<br />
Services and Charges, and Contractual Services due to higher ticket<br />
sales and <strong>the</strong> elimination <strong>of</strong> certain under-performing games<br />
Instant Games 4,834 0.0<br />
Intra-<strong>Agency</strong> Changes - A net reduction in Equipment and Supplies Multiple -152 0.0<br />
Intra-<strong>Agency</strong> Changes - A reduction in Subsidies and Transfers, O<strong>the</strong>r On Line Games -19,534 0.0<br />
Services and Charges, and Contractual Services due to a decline in sales <strong>of</strong> core games<br />
SPECIAL PURPOSE REVENUE FUNDS: FY 2010 Proposed <strong>Budget</strong> and FTE 250,000 77.0<br />
Gross for DC0 - D.C. Lottery and Charitable Games Control Board 250,000 77.0<br />
FY 2010 Proposed <strong>Budget</strong> and <strong>Financial</strong> Plan<br />
H-16<br />
jected modest increase in games played; and a reduction<br />
<strong>of</strong> $19,834,462 in on-line games, which reflects<br />
a projected decline in ticket sales and a change in <strong>the</strong><br />
District’s demography for several core games, including<br />
Powerball.
D.C. Sports and Entertainment<br />
Commission<br />
www.dcconvention.com<br />
Telephone: 202-249-3000<br />
The mission <strong>of</strong> <strong>the</strong> D.C. Sports and Entertainment Commission is to<br />
improve quality <strong>of</strong> life and enhance economic development in <strong>the</strong><br />
District by operating Robert F. Kennedy Memorial Stadium (RFK),<br />
managing <strong>the</strong> non-military functions <strong>of</strong> <strong>the</strong> D.C. National Guard<br />
Armory, promoting <strong>the</strong> District as a venue for sports and entertainment<br />
activities, and supporting youth recreational activities.<br />
DCSEC will be absorbed as a program <strong>of</strong> <strong>the</strong><br />
Washington Convention Center Authority<br />
(WCCA). Its mission, responsibilities and assets will<br />
be transferred to WCCA and shall support <strong>the</strong> functions<br />
<strong>of</strong> DCSEC through revenues collected at events<br />
held at DCSEC venues and <strong>the</strong> Washington<br />
Convention Center Enterprise Fund. The total fund-<br />
(SC0)<br />
% Change<br />
FY 2008 FY 2009 FY 2010 from<br />
Description Actual Approved Proposed FY 2009<br />
Operating <strong>Budget</strong> $3,075,213 $7,603,350 $0 -100.0<br />
FTEs 42.9 0.0 0.0 N/A<br />
ing amount is $6,247,725. The program description,<br />
structure, and o<strong>the</strong>r information about DCSEC are<br />
presented in <strong>the</strong> WCCA chapter.<br />
The agency’s FY 2010 proposed budget is presented<br />
in <strong>the</strong> following tables:<br />
D.C. Sports and Entertainment Commission<br />
H-17
FY 2010 Proposed Gross Funds Operating <strong>Budget</strong>, by Revenue Type<br />
Table SC0-1 contains <strong>the</strong> proposed FY 2010 agency budget compared to <strong>the</strong> FY 2009 approved budget. It also<br />
provides FY 2007 and FY 2008 actual expenditures.<br />
Table SC0-1<br />
(dollars in thousands)<br />
Actual Actual Approved Proposed<br />
Change<br />
from Percent<br />
Appropriated Fund<br />
General Fund<br />
FY 2007 FY 2008 FY 2009 FY 2010 FY 2009 Change*<br />
Special Purpose Revenue Funds 3,582 3,075 7,603 0 -7,603 -100.0<br />
Total for General Fund 3,582 3,075 7,603 0 -7,603 -100.0<br />
Gross Funds 3,582 3,075 7,603 0 -7,603 -100.0<br />
*Percent Change is based on whole dollars.<br />
Note: If applicable, for a breakdown <strong>of</strong> each Grant (Federal and Private), Special Purpose Revenue type and Intra-District agreement, please<br />
refer to Schedule 80, <strong>Agency</strong> Summary by Revenue Source, in <strong>the</strong> Operating Appendices located on <strong>the</strong> <strong>Office</strong> <strong>of</strong> <strong>the</strong> <strong>Chief</strong> <strong>Financial</strong><br />
<strong>Office</strong>r’s website.<br />
FY 2010 Proposed Full-Time Equivalents, by Revenue Type<br />
Table SC0-2 contains <strong>the</strong> proposed FY 2010 FTE level compared to <strong>the</strong> FY 2009 approved FTE level by revenue<br />
type. It also provides FY 2007 and FY 2008 actual data.<br />
Table SC0-2<br />
Change<br />
Actual Actual Approved Proposed from Percent<br />
Appropriated Fund FY 2007 FY 2008 FY 2009 FY 2010 FY 2009 Change<br />
General Fund<br />
Special Purpose Revenue Funds 0.0 42.9 0.0 0.0 0.0 N/A<br />
Total for General Fund 0.0 42.9 0.0 0.0 0.0 N/A<br />
Total Proposed FTEs 0.0 42.9 0.0 0.0 0.0 N/A<br />
Note: The Commission does not contain positions that fall under <strong>the</strong> District’s personnel authority.<br />
FY 2010 Proposed <strong>Budget</strong> and <strong>Financial</strong> Plan<br />
H-18
FY 2010 Proposed Operating <strong>Budget</strong>, by Comptroller Source Group<br />
Table SC0-3 contains <strong>the</strong> proposed FY 2010 budget at <strong>the</strong> Comptroller Source Group (object class) level compared<br />
to <strong>the</strong> FY 2009 approved budget. It also provides FY 2007 and FY 2008 actual expenditures.<br />
Table SC0-3<br />
(dollars in thousands)<br />
Actual Actual Approved Proposed<br />
Change<br />
from Percent<br />
Comptroller Source Group FY 2007 FY 2008 FY 2009 FY 2010 FY 2009 Change*<br />
11 Regular Pay - Cont Full Time 2,556 2,360 2,428 0 -2,428 -100.0<br />
12 Regular Pay - O<strong>the</strong>r 107 30 263 0 -263 -100.0<br />
13 Additional Gross Pay 175 57 0 0 0 N/A<br />
14 Fringe Benefits - Curr Personnel 544 503 415 0 -415 -100.0<br />
15 Overtime Pay 201 126 100 0 -100 -100.0<br />
Subtotal Personal Services (PS) 3,582 3,075 3,206 0 -3,206 -100.0<br />
20 Supplies and Materials 0 0 196 0 -196 -100.0<br />
30 Energy, Comm. and Bldg Rentals 0 0 1,028 0 -1,028 -100.0<br />
31 Telephone, Telegraph, Telegram, Etc 0 0 91 0 -91 -100.0<br />
32 Rentals - Land and Structures 0 0 25 0 -25 -100.0<br />
33 Janitorial Services 0 0 57 0 -57 -100.0<br />
40 O<strong>the</strong>r Services and Charges 0 0 456 0 -456 -100.0<br />
41 Contractual Services - O<strong>the</strong>r 0 0 2,101 0 -2,101 -100.0<br />
50 Subsidies and Transfers 0 0 200 0 -200 -100.0<br />
70 Equipment & Equipment Rental 0 0 243 0 -243 -100.0<br />
Subtotal Nonpersonal Services (NPS) 0 0 4,397 0 -4,397 -100.0<br />
Gross Funds 3,582 3,075 7,603 0 -7,603 -100.0<br />
*Percent Change is based on whole dollars.<br />
Note: The agency presents its budgeted revenues and expenditures for <strong>the</strong> purpose <strong>of</strong> reporting. However, as an instrumentality <strong>of</strong> <strong>the</strong><br />
District, under <strong>the</strong> current financial accounting structure, certain actual revenues and expenditures are not tracked in <strong>the</strong> District’s System<br />
<strong>of</strong> Accounting and Reporting (SOAR) and may not be shown in this chart.<br />
Program Structure Change<br />
The DCSEC program, Sponsored Events, will be absorbed and become a program <strong>of</strong> WCCA in FY 2010. The<br />
proposed budget for <strong>the</strong> Sponsored Events program is $6,247,725 in Special Purpose Revenue funds.<br />
D.C. Sports and Entertainment Commission<br />
H-19
FY 2010 Proposed Operating <strong>Budget</strong> and FTEs, by Program and Activity<br />
Table SC0-4 contains <strong>the</strong> proposed FY 2010 budget by program and activity compared to <strong>the</strong> FY 2009 approved budget.<br />
It also provides FY 2008 actual data.<br />
Table SC0-4<br />
(dollars in thousands)<br />
Dollars in Thousands Full-Time Equivalents<br />
Change Change<br />
Actual Approved Proposed from Actual Approved Proposed from<br />
Program/Activity<br />
(1000) DC Sports Commission<br />
FY 2008 FY 2009 FY 2010 FY 2009 FY 2008 FY 2009 FY 2010 FY 2009<br />
(1100) DC Sports Commission 3,075 7,603 0 -7,603 42.9 0.0 0.0 0.0<br />
Subtotal (1000) DC Sports Commission 3,075 7,603 0 -7,603 42.9 0.0 0.0 0.0<br />
Total Proposed Operating <strong>Budget</strong> 3,075 7,603 0 -7,603 42.9 0.0 0.0 0.0<br />
(Change is calculated by whole numbers and numbers may not add up due to rounding)<br />
Note: For more detailed information regarding <strong>the</strong> proposed funding for <strong>the</strong> activities within this agency’s programs, please see Schedule 30-PBB,<br />
Program Summary by Activity, in <strong>the</strong> FY 2010 Operating Appendices located on <strong>the</strong> <strong>Office</strong> <strong>of</strong> <strong>the</strong> <strong>Chief</strong> <strong>Financial</strong> <strong>Office</strong>r’s website.<br />
Major Baseline Adjustments, Cost Savings<br />
and Policy Initiatives<br />
Initial Adjustments: Special Purpose Revenue Funds<br />
- The DCSEC budget reflects an increase <strong>of</strong><br />
$1,644,375 in personal services costs, electricity, contractual<br />
services, and equipment costs.<br />
Cost Savings: Special Purpose Revenue Funds – The<br />
DCSEC budget reflects a reduction <strong>of</strong> $8,747,725 as<br />
FY 2010 Proposed <strong>Budget</strong> and <strong>Financial</strong> Plan<br />
H-20<br />
a result <strong>of</strong> (1) <strong>the</strong> elimination <strong>of</strong> <strong>the</strong> District subsidy<br />
<strong>of</strong> $2,500,000, which supported operational functions<br />
including <strong>the</strong> maintenance <strong>of</strong> RFK stadium and<br />
certain costs associated with <strong>the</strong> non-military functions<br />
<strong>of</strong> <strong>the</strong> D.C. National Guard Armory and (2) <strong>the</strong><br />
absorption <strong>of</strong> DCSEC and its revenues, which total<br />
$6,247,725, by <strong>the</strong> WCCA.
FY 2009 Approved <strong>Budget</strong> to FY 2010 Proposed <strong>Budget</strong>, by Revenue Type<br />
Table SC0-5 itemizes <strong>the</strong> changes by revenue type between <strong>the</strong> FY 2009 approved budget and <strong>the</strong> FY 2010 proposed<br />
budget. The four categories <strong>of</strong> changes reflected in this table are: (1) changes to <strong>the</strong> baseline budget (includes<br />
agency request), (2) changes representing cost savings or efficiencies, (3) changes related to policy initiatives, and (4)<br />
changes to specifically address <strong>the</strong> projected revenue shortfall.<br />
Table SC0-5<br />
(dollars in thousands)<br />
PROGRAM BUDGET FTE<br />
SPECIAL PURPOSE REVENUE FUNDS: FY 2009 Approved <strong>Budget</strong> and FTE<br />
Initial and Baseline Adjustments<br />
7,603 0.0<br />
Net effect <strong>of</strong> fixed cost adjustments - A net increase in various fixed cost DC Sports Commission 217 0.0<br />
commodities<br />
Net effect <strong>of</strong> salary and benefits changes - A net increase in personal<br />
services costs<br />
DC Sports Commission 261 0.0<br />
An increase <strong>of</strong> $912,756 in Contractual Services, $301,000 in Equipment,<br />
$55,586 in O<strong>the</strong>r Services and Charges <strong>of</strong>fset by decreases <strong>of</strong><br />
$100,000 and $2,298 in Subsidies and Transfers and Supplies,<br />
respectively<br />
DC Sports Commission 1,167 0.0<br />
Baseline Adjustments: - A reduction <strong>of</strong> $500,000 to reflect <strong>the</strong><br />
difference between <strong>the</strong> agency request and <strong>the</strong> funds provided<br />
in <strong>the</strong> Sports Commission Subsidy<br />
Policy Initiatives and Cost Savings<br />
DC Sports Commission -500 0.0<br />
Eliminate - Eliminate <strong>the</strong> District subsidy to <strong>the</strong> DC Sports and<br />
Entertainment Commission<br />
DC Sports Commission -2,500 0.0<br />
Eliminate - Merge <strong>the</strong> functions, operations, and responsibilities<br />
<strong>of</strong> <strong>the</strong> DC Sports and Entertainment Commission<br />
with <strong>the</strong> Washington Convention Center Authority<br />
DC Sports Commission -6,248 0.0<br />
SPECIAL PURPOSE REVENUE FUNDS: FY 2010 Proposed <strong>Budget</strong> and FTE 0 0.0<br />
Gross for SC0 - D.C. Sports and Entertainment Commission 0 0.0<br />
D.C. Sports and Entertainment Commission<br />
H-21
District <strong>of</strong> Columbia<br />
Retirement Board<br />
www.dcrb.dc.gov<br />
Telephone: 202-343-3200<br />
The mission <strong>of</strong> <strong>the</strong> District <strong>of</strong> Columbia Retirement Board (DCRB)<br />
is to manage <strong>the</strong> assets <strong>of</strong> <strong>the</strong> Teachers’ Retirement Fund and <strong>the</strong><br />
Police <strong>Office</strong>rs and Firefighters’ Retirement Fund on an actuarially<br />
sound basis and to administer <strong>the</strong> retirement programs and postemployment<br />
benefits for retirees and <strong>the</strong>ir survivors.<br />
DCRB is an independent agency that has “exclusive<br />
authority and discretion to manage and control” <strong>the</strong><br />
District’s retirement funds for teachers, police <strong>of</strong>ficers,<br />
and firefighters (hereinafter referred to as <strong>the</strong> “Fund”)<br />
pursuant to Section 1-711 (a) <strong>of</strong> <strong>the</strong> District <strong>of</strong><br />
Columbia Official Code. In 2005, <strong>the</strong> authority to<br />
administer <strong>the</strong> teachers’, police <strong>of</strong>ficers’ and firefighters’<br />
retirement programs was transferred to DCRB.<br />
The federal government assumed <strong>the</strong> District’s<br />
unfunded liability for <strong>the</strong> retirement plans <strong>of</strong> teachers,<br />
police <strong>of</strong>ficers, firefighters and judges under provisions<br />
<strong>of</strong> <strong>the</strong> National Capital Revitalization and Self-<br />
Government Improvement Act <strong>of</strong> 1997. Under this<br />
law, <strong>the</strong> federal government pays <strong>the</strong> retirement benefits<br />
and death benefits, and a share <strong>of</strong> disability payments<br />
for members for years <strong>of</strong> service earned up to<br />
<strong>the</strong> freeze date <strong>of</strong> June 30, 1997. The Government <strong>of</strong><br />
(DY0)<br />
% Change<br />
FY 2008 FY 2009 FY 2010 from<br />
Description Actual Approved Proposed FY 2009<br />
Operating <strong>Budget</strong> $20,942,694 $32,624,168 $30,622,200 -6.1<br />
FTEs 44.3 47.6 47.6 0.0<br />
<strong>the</strong> District <strong>of</strong> Columbia is responsible for all subsequently<br />
earned benefits for <strong>the</strong> members <strong>of</strong> <strong>the</strong> retirement<br />
plans.<br />
The proposed budget relies entirely on Special<br />
Purpose Revenue funding. These funds are derived<br />
from <strong>the</strong> funds managed by DCRB and reimbursements<br />
received from <strong>the</strong> United States Treasury for<br />
DCRB’s administration <strong>of</strong> certain pension payments<br />
and o<strong>the</strong>r services for which <strong>the</strong> Treasury is responsible.<br />
The DCRB Board <strong>of</strong> Trustees is comprised <strong>of</strong> 12<br />
voting trustees: 3 appointed by <strong>the</strong> Mayor; 3<br />
appointed by <strong>the</strong> City Council; and 6 elected by <strong>the</strong><br />
employee participation groups. The District’s <strong>Chief</strong><br />
<strong>Financial</strong> <strong>Office</strong>r or his designee serves as a non-voting,<br />
ex-<strong>of</strong>ficio member <strong>of</strong> <strong>the</strong> Board.<br />
District <strong>of</strong> Columbia Retirement Board<br />
H-23
The agency’s FY 2010 proposed budget is presented in <strong>the</strong> following tables:<br />
FY 2010 Proposed Gross Funds Operating <strong>Budget</strong>, by Revenue Type<br />
Table DY0-1 contains <strong>the</strong> proposed FY 2010 agency budget compared to <strong>the</strong> FY 2009 approved budget. It also<br />
provides <strong>the</strong> FY 2007 and FY 2008 actual expenditures.<br />
Table DY0-1<br />
(dollars in thousands)<br />
Actual Actual Approved Proposed<br />
Change<br />
from Percent<br />
Appropriated Fund<br />
General Fund<br />
FY 2007 FY 2008 FY 2009 FY 2010 FY 2009 Change*<br />
Special Purpose Revenue Funds 22,960 20,943 32,624 30,622 -2,002 -6.1<br />
Total for General Fund 22,960 20,943 32,624 30,622 -2,002 -6.1<br />
Gross Funds 22,960 20,943 32,624 30,622 -2,002 -6.1<br />
*Percent Change is based on whole dollars.<br />
Note: If applicable, for a breakdown <strong>of</strong> each Grant (Federal and Private), Special Purpose Revenue type and Intra-District agreement,<br />
please refer to Schedule 80 <strong>Agency</strong> Summary by Revenue Source in <strong>the</strong> Operating Appendices located on <strong>the</strong> <strong>Office</strong> <strong>of</strong> <strong>the</strong> <strong>Chief</strong><br />
<strong>Financial</strong> <strong>Office</strong>r’s website.<br />
FY 2010 Proposed Full-Time Equivalents<br />
Table DY0-2 contains <strong>the</strong> proposed FY 2010 FTE level compared to <strong>the</strong> FY 2009 approved FTE level by revenue<br />
type. It also provides FY 2007 and FY 2008 actual data.<br />
Table DY0-2<br />
Change<br />
Actual Actual Approved Proposed from Percent<br />
Appropriated Fund FY 2007 FY 2008 FY 2009 FY 2010 FY 2009 Change<br />
General Fund<br />
Special Purpose Revenue Funds 32.3 44.3 47.6 47.6 0.0 0.0<br />
Total for General Fund 32.3 44.3 47.6 47.6 0.0 0.0<br />
Total Proposed FTEs 32.3 44.3 47.6 47.6 0.0 0.0<br />
FY 2010 Proposed <strong>Budget</strong> and <strong>Financial</strong> Plan<br />
H-24
FY 2010 Proposed Operating <strong>Budget</strong>, by Comptroller Source Group<br />
Table DY0-3 contains <strong>the</strong> proposed FY 2010 budget at <strong>the</strong> Comptroller Source group (object class) level compared<br />
to <strong>the</strong> FY 2009 approved budget. It also provides FY 2007 and FY 2008 actual expenditures.<br />
Table DY0-3<br />
(dollars in thousands)<br />
Actual Actual Approved Proposed<br />
Change<br />
from Percent<br />
Comptroller Source Group FY 2007 FY 2008 FY 2009 FY 2010 FY 2009 Change*<br />
11 Regular Pay - Cont Full Time 2,022 2,457 3,529 3,837 308 8.7<br />
12 Regular Pay - O<strong>the</strong>r 221 188 150 120 -30 -20.0<br />
13 Additional Gross Pay 69 111 559 524 -35 -6.2<br />
14 Fringe Benefits - Curr Personnel 376 458 1,031 766 -265 -25.7<br />
15 Overtime Pay 1 2 49 50 1 1.8<br />
Subtotal Personal Services (PS) 2,689 3,215 5,317 5,297 -21 -0.4<br />
20 Supplies and Materials 113 130 203 192 -11 -5.6<br />
31 Telephone, Telegraph, Telegram, Etc 21 33 46 26 -20 -43.5<br />
32 Rentals - Land and Structures 1,186 1,282 1,435 1,406 -29 -2.0<br />
34 Security Services 6 5 5 6 1 20.0<br />
40 O<strong>the</strong>r Services and Charges 13,784 13,753 21,212 22,268 1,056 5.0<br />
41 Contractual Services - O<strong>the</strong>r 3,087 2,393 3,701 1,127 -2,574 -69.5<br />
70 Equipment & Equipment Rental 42 130 704 301 -404 -57.3<br />
91 Expense Not <strong>Budget</strong>ed O<strong>the</strong>rs 2,033 0 0 0 0 N/A<br />
Subtotal Nonpersonal Services (NPS) 20,270 17,727 27,307 25,326 -1,981 -7.3<br />
Gross Funds<br />
*Percent Change is based on whole dollars.<br />
22,960 20,943 32,624 30,622 -2,002 -6.1<br />
Program Description<br />
The District <strong>of</strong> Columbia Retirement Board operates<br />
through <strong>the</strong> following three programs:<br />
Investments Management - manages all activities and<br />
resources dedicated to <strong>the</strong> investment <strong>of</strong> <strong>the</strong> assets <strong>of</strong><br />
<strong>the</strong> Fund. Under this program, <strong>the</strong> Board determines<br />
<strong>the</strong> overall investment strategy for <strong>the</strong> Fund and monitors<br />
staff implementation <strong>of</strong> <strong>the</strong> strategy. All expenses<br />
<strong>of</strong> <strong>the</strong> Investment Management program are paid<br />
from Special Purpose Revenue funds obtained from<br />
<strong>the</strong> Funds DCRB manages.<br />
Benefits Administration - provides for <strong>the</strong> timely and<br />
accurate payment <strong>of</strong> benefits to retirees and survivors.<br />
In <strong>the</strong> fall <strong>of</strong> 2007, <strong>the</strong> Board approved a Technology<br />
Road Map that will be implemented over <strong>the</strong> next<br />
five years, with <strong>the</strong> goal <strong>of</strong> enhancing services provided<br />
to plan members. Benefits Administration program<br />
expenses are budgeted using 2 sources: Special<br />
Purpose Revenue funds obtained from <strong>the</strong> Funds<br />
DCRB manages (26 percent) and reimbursements by<br />
<strong>the</strong> U.S. Treasury (74 percent) for services provided<br />
by DCRB to retirees and survivors for benefits for<br />
which <strong>the</strong> Federal Government is responsible.<br />
<strong>Agency</strong> Management - provides administrative support<br />
and <strong>the</strong> required tools to achieve operational and<br />
programmatic results. This program is standard for<br />
all agencies using performance-based budgeting.<br />
Program Structure Change<br />
The District <strong>of</strong> Columbia Retirement Board had no<br />
program structure changes in <strong>the</strong> FY 2010 Proposed<br />
<strong>Budget</strong>.<br />
District <strong>of</strong> Columbia Retirement Board<br />
H-25
FY 2010 Proposed Operating <strong>Budget</strong> and FTEs, by Program and Activity<br />
Table DY0-4 contains <strong>the</strong> proposed FY 2010 budget by program and activity compared to <strong>the</strong> FY 2009 approved budget.<br />
It also provides FY 2008 actual data.<br />
Table DY0-4<br />
(dollars in thousands)<br />
Dollars in Thousands Full-Time Equivalents<br />
Change Change<br />
Actual Approved Proposed from Actual Approved Proposed from<br />
Program/Activity<br />
(1000) DCRB Investments<br />
FY 2008 FY 2009 FY 2010 FY 2009 FY 2008 FY 2009 FY 2010 FY 2009<br />
(1100) DCRB 14,231 21,274 19,151 -2,124 8.8 9.0 9.0 0.0<br />
Subtotal (1000) DCRB Investments 14,231 21,274 19,151 -2,124 8.8 9.0 9.0 0.0<br />
(2000) DCRB Benefits Administration<br />
(2100) DCRB Benefits Administration 3,563 5,861 2,809 -3,053 24.0 20.0 18.0 -2.0<br />
Subtotal (2000) DCRB Benefits Administration 3,563 5,861 2,809 -3,053 24.0 20.0 18.0 -2.0<br />
(3000) DCRB <strong>Agency</strong> Management<br />
(3100) DCRB <strong>Agency</strong> Management 3,149 5,488 8,663 3,174 11.5 18.6 20.6 2.0<br />
Subtotal (3000) DCRB <strong>Agency</strong> Management 3,149 5,488 8,663 3,174 11.5 18.6 20.6 2.0<br />
Total Proposed Operating <strong>Budget</strong> 20,943 32,624 30,622 -2,002 44.3 47.6 47.6 0.0<br />
(Change is calculated by whole numbers and numbers may not add up due to rounding)<br />
Note: For more detailed information regarding <strong>the</strong> proposed funding for <strong>the</strong> activities within this agency’s programs, please see Schedule 30-PBB<br />
Program Summary by Activity in <strong>the</strong> FY 2010 Operating Appendices located on <strong>the</strong> <strong>Office</strong> <strong>of</strong> <strong>the</strong> <strong>Chief</strong> <strong>Financial</strong> <strong>Office</strong>r’s website.<br />
FY 2010 Proposed <strong>Budget</strong> and <strong>Financial</strong> Plan<br />
H-26
Major Baseline Adjustments, Cost Savings and Policy Initiatives<br />
Initial adjustment - Reduced $2,327,856 in <strong>the</strong> DCRB Investment program due to lower expected investment<br />
management fees.<br />
FY 2009 Approved <strong>Budget</strong> to FY 2010 Proposed <strong>Budget</strong><br />
Table DY0-5 itemizes <strong>the</strong> changes by revenue type between <strong>the</strong> FY 2009 approved budget and <strong>the</strong> FY 2010 proposed<br />
budget. The four categories <strong>of</strong> changes reflected in this table are: (1) changes to <strong>the</strong> baseline budget (includes agency<br />
request), (2) changes representing cost savings or efficiencies, (3) changes related to policy initiatives, and (4) changes to<br />
specifically address <strong>the</strong> projected revenue shortfall.<br />
Table DY0-5<br />
(dollars in thousands)<br />
Program BUDGET FTE<br />
SPECIAL PURPOSE REVENUE FUNDS: FY 2009 Approved <strong>Budget</strong> and FTE 32,624 47.6<br />
Initial and Baseline Adjustments<br />
Net effect <strong>of</strong> fixed cost adjustments - Revised fixed cost estimates for Multiple Programs -48 0.0<br />
telecom, rent and security<br />
Net effect <strong>of</strong> salary and benefits changes - Reduction in personal services Multiple Programs -21 0.0<br />
Intra-<strong>Agency</strong> changes - Reduction in o<strong>the</strong>r services and charges DCRB Investments -2,328 0.0<br />
Intra-<strong>Agency</strong> changes - Increase in o<strong>the</strong>r services and charges <strong>of</strong>fset by Multiple Programs 395 0.0<br />
reductions in equipment rental and supplies<br />
SPECIAL PURPOSE REVENUE FUNDS: FY 2010 Proposed <strong>Budget</strong> and FTE 30,622 47.6<br />
Gross for DY0 - District <strong>of</strong> Columbia Retirement Board 30,622 47.6<br />
District <strong>of</strong> Columbia Retirement Board<br />
H-27
Washington Convention<br />
Center Authority<br />
www.dcconvention.com<br />
Telephone: 202-249-3000<br />
% Change<br />
FY 2008 FY 2009 FY 2010 from<br />
Description Actual Approved Proposed FY 2009<br />
Operating <strong>Budget</strong> $0 $96,696,217 $91,974,400 -4.9<br />
The mission <strong>of</strong> <strong>the</strong> Washington Convention Center Authority<br />
(WCCA) is to provide superior convention services to customers and<br />
serve as an economic engine to <strong>the</strong> nation’s capital.<br />
WCCA, a corporate body and an independent<br />
authority <strong>of</strong> <strong>the</strong> District <strong>of</strong> Columbia government,<br />
was created pursuant to <strong>the</strong> “Washington<br />
Convention Center Authority Act <strong>of</strong> 1994,” D.C.<br />
Law 10-188, effective September 28, 1994.<br />
The WCCA is governed by a 11-member Board<br />
<strong>of</strong> Directors. Two members, one <strong>of</strong> whom is <strong>the</strong><br />
<strong>Chief</strong> <strong>Financial</strong> <strong>Office</strong>r <strong>of</strong> <strong>the</strong> District and <strong>the</strong> o<strong>the</strong>r<br />
<strong>of</strong> whom is designated by <strong>the</strong> Mayor, serve as voting<br />
ex-<strong>of</strong>ficio members. The remaining nine public<br />
members are appointed by <strong>the</strong> Mayor with advice<br />
and consent <strong>of</strong> <strong>the</strong> Council <strong>of</strong> <strong>the</strong> District <strong>of</strong><br />
Columbia and represent certain sectors <strong>of</strong> <strong>the</strong> community.<br />
The terms <strong>of</strong> <strong>the</strong> members are four years.<br />
No board member is permitted to serve more than<br />
two consecutive four-year terms. The Mayor<br />
appoints one public member as chair person with <strong>the</strong><br />
advice and consent <strong>of</strong> <strong>the</strong> Council.<br />
(ES0)<br />
The D.C. Sports and Entertainment<br />
Commission (DCSEC) will be absorbed and become<br />
a program within WCCA. WCCA will support general<br />
administrative functions <strong>of</strong> DCSEC through <strong>the</strong><br />
Washington Convention Center Enterprise Fund.<br />
The maintenance <strong>of</strong> <strong>the</strong> Robert F. Kennedy Stadium<br />
(RFK) and appropriate charges incurred through <strong>the</strong><br />
non-military use <strong>of</strong> <strong>the</strong> D.C. National Guard Armory<br />
will be administered by <strong>the</strong> <strong>Office</strong> <strong>of</strong> Property<br />
Management (OPM).<br />
The agency’s FY 2010 proposed budget is presented<br />
in <strong>the</strong> following tables:<br />
Washington Convention Center Authority<br />
H-29
FY 2010 Proposed Gross Funds Operating <strong>Budget</strong>, by Revenue Type<br />
Table ES0-1 contains <strong>the</strong> proposed FY 2010 agency budget compared to <strong>the</strong> FY 2009 approved budget. It also<br />
provides FY 2007 and FY 2008 actual expenditures.<br />
Table ES0-1<br />
(dollars in thousands)<br />
Actual Actual Approved Proposed<br />
Change<br />
from Percent<br />
Appropriated Fund<br />
General Fund<br />
FY 2007 FY 2008 FY 2009 FY 2010 FY 2009 Change*<br />
Special Purpose Revenue Funds 0 0 96,696 91,974 -4,722 -4.9<br />
Total for General Fund 0 0 96,696 91,974 -4,722 -4.9<br />
Gross Funds 0 0 96,696 91,974 -4,722 -4.9<br />
*Percent Change is based on whole dollars.<br />
Note: If applicable, for a breakdown <strong>of</strong> each Grant (Federal and Private), Special Purpose Revenue type and Intra-District agreement,<br />
please refer to Schedule 80, <strong>Agency</strong> Summary by Revenue Source, in <strong>the</strong> Operating Appendices located on <strong>the</strong> <strong>Office</strong> <strong>of</strong> <strong>the</strong> <strong>Chief</strong><br />
<strong>Financial</strong> <strong>Office</strong>r’s website.<br />
FY 2010 Proposed Operating <strong>Budget</strong>, by Comptroller Source Group<br />
Table ES0-2 contains <strong>the</strong> proposed FY 2010 budget at <strong>the</strong> Comptroller Source Group (object class) level compared<br />
to <strong>the</strong> FY 2009 approved budget. It also provides FY 2007 and FY 2008 actual expenditures.<br />
Table ES0-2<br />
(dollars in thousands)<br />
Actual Actual Approved Proposed<br />
Change<br />
from Percent<br />
Comptroller Source Group FY 2007 FY 2008 FY 2009 FY 2010 FY 2009 Change*<br />
11 Regular Pay - Cont Full Time 0 0 11,998 11,362 -636 -5.3<br />
12 Regular Pay - O<strong>the</strong>r 0 0 1,150 1,097 -52 -4.6<br />
14 Fringe Benefits - Curr Personnel 0 0 3,453 3,297 -156 -4.5<br />
15 Overtime Pay 0 0 492 395 -97 -19.7<br />
Subtotal Personal Services (PS) 0 0 17,092 16,151 -941 -5.5<br />
20 Supplies and Materials 0 0 770 549 -221 -28.7<br />
30 Energy, Comm. and Bldg Rentals 0 0 6,304 5,962 -342 -5.4<br />
31 Telephone, Telegraph, Telegram, Etc 0 0 123 106 -17 -14.0<br />
40 O<strong>the</strong>r Services and Charges 0 0 25,669 0 -25,669 -100.0<br />
41 Contractual Services - O<strong>the</strong>r 0 0 0 12,499 12,499 N/A<br />
50 Subsidies and Transfers 0 0 0 12,549 12,549 N/A<br />
60 Land and Buildings 0 0 10,284 7,864 -2,420 -23.5<br />
70 Equipment & Equipment Rental 0 0 479 320 -159 -33.2<br />
80 Debt Service 0 0 35,974 35,974 0 0.0<br />
Subtotal Nonpersonal Services (NPS) 0 0 79,604 75,823 -3,781 -4.7<br />
Gross Funds 0 0 96,696 91,974 -4,722 -4.9<br />
*Percent Change is based on whole dollars.<br />
Note: The agency presents its budgeted revenues and expenditures for <strong>the</strong> purpose <strong>of</strong> reporting. However, as a proprietary fund, under<br />
<strong>the</strong> current financial accounting structure, <strong>the</strong> agency’s actual revenues and expenditures are not tracked in <strong>the</strong> District System <strong>of</strong><br />
Accounting and Reporting (SOAR) and may not be shown in this chart or in <strong>the</strong> Comprehensive Annual <strong>Financial</strong> Report (CAFR).<br />
FY 2010 Proposed <strong>Budget</strong> and <strong>Financial</strong> Plan<br />
H-30
Program Description<br />
The District’s payment to WCCA is made through<br />
one program in <strong>the</strong> District’s financial system. The<br />
Washington Convention Center operates through<br />
<strong>the</strong> following 2 programs:<br />
Washington Convention Center Authority – provides<br />
for <strong>the</strong> operation <strong>of</strong> <strong>the</strong> Convention Center, in<br />
whole or in part, directly or under contract and<br />
engaging in such o<strong>the</strong>r activities as deemed appropriate<br />
to promote trade shows and conventions, or o<strong>the</strong>r<br />
events, closely related to <strong>the</strong> activities <strong>of</strong> <strong>the</strong><br />
Convention Center, which include acquiring, constructing,<br />
equipping, and maintaining <strong>the</strong> facility.<br />
Recently renamed <strong>the</strong> Walter E. Washington<br />
Convention Center, it opened in April 2003 and<br />
hosted 201 events in FY 2004, 185 events in FY<br />
2005, 106 events in FY 2006, 150 events in FY 2007<br />
and 185 events in FY 2008. A total <strong>of</strong> 5.2 million<br />
people attended <strong>the</strong> Convention Center during <strong>the</strong><br />
period <strong>of</strong> FY 2004 through FY 2008. Currently,<br />
WCCA has booked or tentatively booked approximately<br />
536 events from 2009-2011. These events are<br />
projected to attract 4.2 million attendees.<br />
The Center has 703,000 square feet <strong>of</strong> exhibit space;<br />
118,670 square feet <strong>of</strong> meeting space, which is divisible<br />
into 66 meeting rooms; 44,000 square feet <strong>of</strong><br />
retail space and street level restaurants; and 52,000<br />
square feet for a ballroom, which is one <strong>of</strong> <strong>the</strong> largest<br />
on <strong>the</strong> East Coast.<br />
Sports Commission – provides for <strong>the</strong> attraction and<br />
development <strong>of</strong> new events for RFK and non-military<br />
events at D.C. Armory. These events include <strong>the</strong><br />
D.C. United Major League Soccer, <strong>the</strong> EagleBank<br />
Bowl, local athletic games, various concerts, and<br />
o<strong>the</strong>r events. OPM will maintain RFK and <strong>the</strong><br />
Armory though revenue collected from events, rent,<br />
advertising or o<strong>the</strong>r sources <strong>of</strong> revenue derived from<br />
<strong>the</strong>se facilities.<br />
Program Structure Change<br />
DCSEC will be absorbed and become a program <strong>of</strong><br />
WCCA in FY 2010. The general operational functions<br />
<strong>of</strong> <strong>the</strong> program will be supported by WCCA;<br />
<strong>the</strong> maintenance <strong>of</strong> RFK and costs associated with<br />
certain non-military functions conducted at <strong>the</strong> D.C.<br />
National Guard Armory will be supported by OPM.<br />
Washington Convention Center Authority<br />
H-31
FY 2010 Proposed Operating <strong>Budget</strong> and FTEs, by Program and Activity<br />
Table ES0-3 contains <strong>the</strong> proposed FY 2010 budget by program and activity compared to <strong>the</strong> FY 2009 approved budget.<br />
It also provides FY 2008 actual data.<br />
Table ES0-3<br />
(dollars in thousands)<br />
Dollars in Thousands Full-Time Equivalents<br />
Change Change<br />
Actual Approved Proposed from Actual Approved Proposed from<br />
Program/Activity FY 2008 FY 2009 FY 2010 FY 2009 FY 2008 FY 2009 FY 2010 FY 2009<br />
(1000) Wash Convention Center<br />
(1100) Wash Convention Center 0 96,696 91,974 -4,722 0.0 0.0 0.0 0.0<br />
Subtotal (1000) Wash Convention Center 0 96,696 91,974 -4,722 0.0 0.0 0.0 0.0<br />
Total Proposed Operating <strong>Budget</strong> 0 96,696 91,974 -4,722 0.0 0.0 0.0 0.0<br />
(Change is calculated by whole numbers and numbers may not add up due to rounding)<br />
Note: For more detailed information regarding <strong>the</strong> proposed funding for <strong>the</strong> activities within this agency’s programs, please see Schedule 30-PBB<br />
Program Summary By Activity in <strong>the</strong> FY 2010 Operating Appendices located on <strong>the</strong> <strong>Office</strong> <strong>of</strong> <strong>the</strong> <strong>Chief</strong> <strong>Financial</strong> <strong>Office</strong>r’s website.<br />
Major Baseline Adjustments, Cost Savings<br />
and Policy Initiatives<br />
Initial Adjustments: Baseline costs decreased by<br />
$5,885,000 due to a decrease <strong>of</strong> $942,000 in Personal<br />
Services due to savings from 20 frozen positions; a<br />
decrease <strong>of</strong> $2,395,000 in Contractual Services due to<br />
a reduction in pr<strong>of</strong>essional services; a decrease <strong>of</strong><br />
$2,420,000 in Land and Buildings due to <strong>the</strong> deferring<br />
<strong>of</strong> certain capital improvements; and a decrease<br />
<strong>of</strong> $739,000 in Supplies, Telecom, Equipment, and<br />
Energy costs. The reductions are <strong>of</strong>fset by an increase<br />
<strong>of</strong> $611,000 due to a transfer from <strong>the</strong> WCCA marketing<br />
fund.<br />
FY 2010 Proposed <strong>Budget</strong> and <strong>Financial</strong> Plan<br />
H-32<br />
Policy Initiatives: Revenue from sponsored events at<br />
RFK and <strong>the</strong> Armory will be transferred from<br />
WCCA to OPM to cover certain maintenance costs<br />
at <strong>the</strong>se facilities. The total amount <strong>of</strong> $5,085,000<br />
reflects <strong>the</strong> projected revenue collected and anticipated<br />
expenditures from events or o<strong>the</strong>r sources derived<br />
from RFK and certain non-military functions conducted<br />
at <strong>the</strong> D.C. National Guard Armory. A contingency<br />
<strong>of</strong> $1,163,000 remains in <strong>the</strong> WCCA budget<br />
as a result <strong>of</strong> <strong>the</strong> transfer to OPM.
FY 2009 Approved <strong>Budget</strong> to FY 2010 Proposed <strong>Budget</strong>, by Revenue Type<br />
Table ES0-4 itemizes <strong>the</strong> changes by revenue type between <strong>the</strong> FY 2009 approved budget and <strong>the</strong> FY 2010 proposed<br />
budget. The four categories <strong>of</strong> changes reflected in this table are: (1) changes to <strong>the</strong> baseline budget (includes<br />
agency request), (2) changes representing cost savings or efficiencies, (3) changes related to policy initiatives, and (4)<br />
changes to specifically address <strong>the</strong> projected revenue shortfall.<br />
Table ES0-4<br />
(dollars in thousands)<br />
PROGRAM BUDGET FTE<br />
SPECIAL PURPOSE REVENUE FUNDS: FY 2009 Approved <strong>Budget</strong> and FTE 96,696 0.0<br />
Initial and Baseline Adjustments<br />
Funding Changes - Reduction in fixed costs for energy and telecom. Wash Convention Center -359 0.0<br />
Funding Changes - Reduction in Personal Services Wash Convention Center -941 0.0<br />
Funding Changes - Reduction in Supplies Wash Convention Center -221 0.0<br />
Funding Changes - Reduction in O<strong>the</strong>r Services and Charges Wash Convention Center -25,669 0.0<br />
Funding Changes - Reduction in Equipment Wash Convention Center -159 0.0<br />
Funding Changes - Net increase in Contract Wash Convention Center 12,499 0.0<br />
Funding Changes - Reduction in Capital Projects Wash Convention Center -2,420 0.0<br />
Funding Changes - Increase in Subsidies and Transfers Wash Convention Center 11,385 0.0<br />
Policy Initiatives and Cost Savings<br />
Enhance - Residual from <strong>the</strong> transfer <strong>of</strong> maintenance functions to OPM Wash Convention Center 1,163 0.0<br />
SPECIAL PURPOSE REVENUE FUNDS: FY 2010 Proposed <strong>Budget</strong> and FTE 91,974 0.0<br />
Gross for ES0 - Washington Convention Center Authority 91,974 0.0<br />
Washington Convention Center Authority<br />
H-33
Housing Finance <strong>Agency</strong><br />
www.dchfa.org<br />
Telephone: 202-777-1600<br />
The Housing Finance <strong>Agency</strong> (HFA) was established<br />
in 1979 as a corporate body with a legal existence separate<br />
from <strong>the</strong> government <strong>of</strong> <strong>the</strong> District <strong>of</strong><br />
Columbia to stimulate and expand homeownership<br />
and rental housing opportunities for low and moderate-income<br />
families in <strong>the</strong> District. HFA issues taxable<br />
and tax-exempt mortgage revenue bonds to<br />
lower <strong>the</strong> costs <strong>of</strong> financing single-family housing and<br />
<strong>the</strong> costs <strong>of</strong> acquiring, constructing, and rehabilitating<br />
rental housing. In addition, HFA administers <strong>the</strong><br />
(HF0)<br />
% Change<br />
FY 2008 FY 2009 FY 2010 from<br />
Description Actual Approved Proposed FY 2009<br />
Operating <strong>Budget</strong> $0 $7,919,000 $8,894,000 12.3<br />
issuance <strong>of</strong> 4 percent low-income housing tax credits<br />
to achieve its affordable housing preservation, rehabilitation,<br />
and development objectives on behalf <strong>of</strong> <strong>the</strong><br />
Department <strong>of</strong> Housing and Community<br />
Development (DHCD).<br />
The agency’s FY 2010 proposed budget is presented<br />
in <strong>the</strong> following tables:<br />
Housing Finance <strong>Agency</strong><br />
H-35
FY 2010 Proposed Gross Funds Operating <strong>Budget</strong>, by Revenue Type<br />
Table HF0-1 contains <strong>the</strong> proposed FY 2010 agency budget compared to <strong>the</strong> FY 2009 approved budget. It also<br />
provides FY 2007 and FY 2008 actual expenditures.<br />
Table HF0-1<br />
(dollars in thousands)<br />
Actual Actual Approved Proposed<br />
Change<br />
from Percent<br />
Appropriated Fund<br />
General Fund<br />
FY 2007 FY 2008 FY 2009 FY 2010 FY 2009 Change*<br />
Special Purpose Revenue Funds 0 0 7,919 8,894 975 12.3<br />
Total for General Fund 0 0 7,919 8,894 975 12.3<br />
Gross Funds 0 0 7,919 8,894 975 12.3<br />
*Percent Change is based on whole dollars.<br />
Note: If applicable, for a breakdown <strong>of</strong> each Grant (Federal and Private), Special Purpose Revenue type and Intra-District agreement,<br />
please refer to Schedule 80, <strong>Agency</strong> Summary by Revenue Source, in <strong>the</strong> Operating Appendices located on <strong>the</strong> <strong>Office</strong> <strong>of</strong> <strong>the</strong> <strong>Chief</strong><br />
<strong>Financial</strong> <strong>Office</strong>r’s website.<br />
FY 2010 Proposed Operating <strong>Budget</strong>, by Comptroller Source Group<br />
Table HF0-2 contains <strong>the</strong> proposed FY 2010 budget at <strong>the</strong> Comptroller Source Group (object class) level compared<br />
to <strong>the</strong> FY 2009 approved budget. It also provides FY 2007 and FY 2008 actual expenditures.<br />
Table HF0-2<br />
(dollars in thousands)<br />
Actual Actual Approved Proposed<br />
Change<br />
from Percent<br />
Comptroller Source Group FY 2007 FY 2008 FY 2009 FY 2010 FY 2009 Change*<br />
11 Regular Pay - Cont Full Time 0 0 4,057 4,219 162 4.0<br />
12 Regular Pay - O<strong>the</strong>r 0 0 98 75 -23 -23.5<br />
14 Fringe Benefits - Curr Personnel 0 0 929 1,026 97 10.4<br />
15 Overtime Pay 0 0 15 19 4 26.7<br />
Subtotal Personal Services (PS) 0 0 5,099 5,339 240 4.7<br />
20 Supplies and Materials 0 0 72 105 33 45.8<br />
30 Energy, Comm. and Bldg Rentals 0 0 109 125 16 14.7<br />
31 Telephone, Telegraph, Telegram, Etc 0 0 55 60 5 9.1<br />
33 Janitorial Services 0 0 43 47 4 9.3<br />
34 Security Services 0 0 7 9 2 28.6<br />
40 O<strong>the</strong>r Services and Charges 0 0 1,454 870 -584 -40.2<br />
41 Contractual Services - O<strong>the</strong>r 0 0 445 887 442 99.3<br />
70 Equipment & Equipment Rental 0 0 429 1,270 841 196.0<br />
80 Debt Service 0 0 206 182 -24 -11.7<br />
Subtotal Nonpersonal Services (NPS) 0 0 2,820 3,555 735 26.1<br />
Total Proposed Operating <strong>Budget</strong> 0 0 7,919 8,894 975 12.3<br />
*Percent Change is based on whole dollars.<br />
FY 2010 Proposed <strong>Budget</strong> and <strong>Financial</strong> Plan<br />
H-36
Program Description<br />
The Housing Finance <strong>Agency</strong> is funded through one<br />
program in <strong>the</strong> District’s financial system. However,<br />
The Housing Finance <strong>Agency</strong> operates through <strong>the</strong><br />
following 2 programs:<br />
Multi-Family Development - provides tax-exempt,<br />
taxable bonds, tax credits, and McKinney Act Savings<br />
and Loan funds as financial tools that are integral to<br />
development <strong>of</strong> <strong>the</strong> community’s ability to provide<br />
affordable, safe and decent housing to low-income<br />
and special needs populations. The multi-family<br />
mortgage revenue bond and tax credit products serve<br />
as vehicles for developers to access low-cost institutional<br />
debt and equity tools that enhance return on<br />
investment. When combined with 4 percent Low-<br />
Income Housing Tax Credits and o<strong>the</strong>r subsidies, <strong>the</strong><br />
HFA’s mortgage revenue bond product, which is<br />
<strong>of</strong>fered in enhanced structures, provides competitive<br />
below-market rate pricing and helps to preserve, rehabilitate<br />
or construct affordable and mixed-income<br />
housing in Washington.<br />
This program contains <strong>the</strong> following 2 activities:<br />
■ Technical Assistance - provides technical assistance<br />
on all aspects <strong>of</strong> underwriting to developers<br />
that produce affordable housing and act as facilitators<br />
with city and federal government agencies<br />
to help expedite <strong>the</strong> permitting process and o<strong>the</strong>r<br />
approvals. In addition, HFA’s staff provides ongoing<br />
construction monitoring to ensure construction<br />
is successfully completed and properly managed;<br />
and<br />
■ Financing Assistance - provides several financing<br />
programs, including <strong>the</strong> Multi-family Mortgage<br />
Revenue Bond Program, Low-Income Housing<br />
Tax Credit Program, and McKinney Act Savings<br />
Loan Fund. Depending on <strong>the</strong> project’s eligibility,<br />
tax-exempt bonds, taxable bonds or low-interest<br />
loans can be used for predevelopment activities<br />
as well as <strong>the</strong> acquisition, construction and renovation<br />
<strong>of</strong> multifamily buildings. Financing can be<br />
used for <strong>the</strong> rehabilitation or construction <strong>of</strong><br />
rental housing, cooperatives, assisted-living facilities,<br />
and transitional housing.<br />
Single Family Development - provides low interest<br />
mortgages for persons purchasing a home in <strong>the</strong><br />
District at or below <strong>the</strong> national and local conventional<br />
rates.<br />
This program contains <strong>the</strong> following 2 activities:<br />
■ Homebuyer Assistance - provides interest rates as<br />
low as 5.25 percent with 1 point. In an effort to<br />
assist homebuyers with much needed down payment<br />
and closing costs, <strong>the</strong> HFA also added an<br />
interest rate <strong>of</strong> 6.27 percent with 2 points which<br />
includes a 3.0 percent assistance grant. The HFA<br />
provided over $43 million to assist 218 homebuyers<br />
purchasing homes in <strong>the</strong> District and<br />
increased its pool <strong>of</strong> participating lenders by 50<br />
percent during fiscal year 2009; and<br />
■ Homeownership Education - provides regular<br />
seminars and community outreach in an effort to<br />
empower persons seeking to become homeowners<br />
in Washington, D.C. Through <strong>the</strong> HFA,<br />
information is made available to residents on <strong>the</strong><br />
Single Family Bond products, financing options,<br />
<strong>the</strong> city government’s employer assistance program,<br />
tax credits, tax abatements, and <strong>the</strong> Home<br />
Purchase Assistance program (HPAP), o<strong>the</strong>r programs<br />
to help with closing costs, and o<strong>the</strong>r incentives<br />
for <strong>the</strong> homebuyer.<br />
Program Structure Change<br />
The Housing Finance <strong>Agency</strong> had no program structure<br />
change in <strong>the</strong> FY 2010 Proposed <strong>Budget</strong>.<br />
Housing Finance <strong>Agency</strong><br />
H-37
FY 2010 Proposed Operating <strong>Budget</strong> and FTEs, by Program and Activity<br />
Table HF0-3 contains <strong>the</strong> proposed FY 2010 budget by program and activity compared to <strong>the</strong> FY 2009 approved budget.<br />
It also provides FY 2008 actual data.<br />
Table HF0-3<br />
(dollars in thousands)<br />
Dollars in Thousands Full-Time Equivalents<br />
Change Change<br />
Actual Approved Proposed from Actual Approved Proposed from<br />
Program/Activity<br />
(1000) Housing Finance <strong>Agency</strong><br />
FY 2008 FY 2009 FY 2010 FY 2009 FY 2008 FY 2009 FY 2010 FY 2009<br />
(1100) Housing Finance <strong>Agency</strong> 0 7,919 8,894 975 0.0 0.0 0.0 0.0<br />
Subtotal (1000) Housing Finance <strong>Agency</strong> 0 7,919 8,894 975 0.0 0.0 0.0 0.0<br />
Total Proposed Operating <strong>Budget</strong> 0 7,919 8,894 975 0.0 0.0 0.0 0.0<br />
(Change is calculated by whole numbers and numbers may not add up due to rounding)<br />
Note: For more detailed information regarding <strong>the</strong> proposed funding for <strong>the</strong> activities within this agency’s programs, please see<br />
Schedule 30-PBB Program Summary By Activity in <strong>the</strong> FY 2010 Operating Appendices located on <strong>the</strong> <strong>Office</strong> <strong>of</strong> <strong>the</strong> <strong>Chief</strong><br />
<strong>Financial</strong> <strong>Office</strong>r’s website.<br />
FY 2010 Proposed <strong>Budget</strong> and <strong>Financial</strong> Plan<br />
H-38
Major Baseline Adjustments, Cost Savings and Policy Initiatives<br />
Initial Adjustments: A net increase <strong>of</strong> $975,000 in special purpose revenue funds. The increase is primarily due<br />
to an increase <strong>of</strong> $240,000 for a cost-<strong>of</strong>-living adjustment and costs associated with building renovation, <strong>the</strong><br />
replacement <strong>of</strong> obsolete communication equipment, and o<strong>the</strong>r nonpersonal services changes.<br />
FY 2009 Approved <strong>Budget</strong> to FY 2010 Proposed <strong>Budget</strong>, by Revenue Type<br />
Table HF0-4 itemizes <strong>the</strong> changes by revenue type between <strong>the</strong> FY 2009 approved budget and <strong>the</strong> FY 2010 proposed budget.<br />
The four categories <strong>of</strong> changes reflected in this table are: (1) changes to <strong>the</strong> baseline budget (includes agency request),<br />
(2) changes representing cost savings or efficiencies, (3) changes related to policy initiatives, and (4) changes to specifically<br />
address <strong>the</strong> projected revenue shortfall.<br />
Table HF0-4<br />
(dollars in thousands)<br />
PROGRAM BUDGET FTE<br />
SPECIAL PURPOSE REVENUE FUNDS: FY 2009 Approved <strong>Budget</strong> and FTE 7,919 0.0<br />
Initial and Baseline Adjustments<br />
Net effect <strong>of</strong> fixed cost adjustments - Revised fixed costs estimates for<br />
multiple commodities<br />
Housing Finance <strong>Agency</strong> 27 0.0<br />
Net effect <strong>of</strong> salary and benefits changes - Increase in personal services costs Housing Finance <strong>Agency</strong> 240 0.0<br />
Intra-<strong>Agency</strong> changes - Increase in equipment Housing Finance <strong>Agency</strong> 841 0.0<br />
Intra-<strong>Agency</strong> changes - Increase in contractual services Housing Finance <strong>Agency</strong> 442 0.0<br />
Intra <strong>Agency</strong> changes - Increase in supplies Housing Finance <strong>Agency</strong> 33 0.0<br />
Intra-<strong>Agency</strong> changes - Decrease in o<strong>the</strong>r services and charges Housing Finance <strong>Agency</strong> -584 0.0<br />
Intra-<strong>Agency</strong> changes - Decrease in debt service Housing Finance <strong>Agency</strong> -24 0.0<br />
SPECIAL PURPOSE REVENUE FUNDS: FY 2010 Proposed <strong>Budget</strong> and FTE 8,894 0.0<br />
Gross for HF0 - Housing Finance <strong>Agency</strong> 8,894 0.0<br />
Housing Finance <strong>Agency</strong><br />
H-39
University <strong>of</strong> <strong>the</strong> District <strong>of</strong> Columbia<br />
www.udc.edu<br />
Telephone: 202-274-5000<br />
The University <strong>of</strong> <strong>the</strong> District <strong>of</strong> Columbia (UDC) is an urban landgrant<br />
institution <strong>of</strong> higher education with an open admissions policy.<br />
It is a comprehensive public institution <strong>of</strong>fering quality, affordable<br />
postsecondary education to District <strong>of</strong> Columbia residents at <strong>the</strong> certificate,<br />
associate, baccalaureate, and graduate levels. UDC’s programs<br />
prepare students for immediate entry into <strong>the</strong> workforce, <strong>the</strong> nextlevel<br />
<strong>of</strong> education, specialized employment opportunities, and lifelong<br />
learning.<br />
Summary <strong>of</strong> Services<br />
The University <strong>of</strong> <strong>the</strong> District <strong>of</strong> Columbia provides<br />
high quality learning, research and public service<br />
experiences, relevant to <strong>the</strong> needs and interests <strong>of</strong> students,<br />
employees, and research organizations. The<br />
University is governed by a Board <strong>of</strong> Trustees comprised<br />
as set forth in District <strong>of</strong> Columbia Official<br />
Code Section 38-1202.01, with duties as set forth in<br />
(GF0)<br />
% Change<br />
FY 2008 FY 2009 FY 2010 from<br />
Description Actual Approved Proposed FY 2009<br />
Operating <strong>Budget</strong> $107,968,397 $128,479,610 $140,288,460 9.2<br />
FTEs 1,655.5 1,086.6 1,103.9 1.6<br />
Code Section 38-1202.06. Provisions <strong>of</strong> law applicable<br />
to <strong>the</strong> University’s land-grant status are listed in<br />
Code Section 38-1202.09.<br />
The agency’s FY 2010 proposed budget is presented<br />
in <strong>the</strong> following tables:<br />
University <strong>of</strong> <strong>the</strong> District <strong>of</strong> Columbia<br />
H-41
FY 2010 Proposed Gross Funds Operating <strong>Budget</strong>, by Revenue Type<br />
Table GF0-1 contains <strong>the</strong> proposed FY 2010 agency budget compared to <strong>the</strong> FY 2009 approved budget. It also<br />
provides FY 2007 and FY 2008 actual expenditures.<br />
Table GF0-1<br />
(dollars in thousands)<br />
Actual Actual Approved Proposed<br />
Change<br />
from Percent<br />
Appropriated Fund<br />
General Fund<br />
FY 2007 FY 2008 FY 2009 FY 2010 FY 2009 Change*<br />
Local Funds 62,636 54,849 62,070 62,070 0 0.0<br />
Special Purpose Revenue Funds 23,710 28,406 36,819 47,419 10,600 28.8<br />
Total for General Fund 86,345 83,255 98,889 109,489 10,600 10.7<br />
Federal Resources<br />
Federal Grant Funds 15,468 15,896 18,487 19,839 1,352 7.3<br />
Total for Federal Resources 15,468 15,896 18,487 19,839 1,352 7.3<br />
Private Funds<br />
Private Grant Funds 649 820 891 527 -364 -40.8<br />
Total for Private Funds 649 820 891 527 -364 -40.8<br />
Intra-District Funds<br />
Intra-District Funds 10,695 7,998 10,212 10,433 221 2.2<br />
Total for Intra-District Funds 10,695 7,998 10,212 10,433 221 2.2<br />
Gross Funds 113,157 107,968 128,480 140,288 11,809 9.2<br />
*Percent Change is based on whole dollars.<br />
Note: If applicable, for a breakdown <strong>of</strong> each Grant (Federal and Private), Special Purpose Revenue type and Intra-District agreement,<br />
please refer to Schedule 80 <strong>Agency</strong> Summary by Revenue Source in <strong>the</strong> Operating Appendices located on <strong>the</strong> <strong>Office</strong> <strong>of</strong> <strong>the</strong> <strong>Chief</strong><br />
<strong>Financial</strong> <strong>Office</strong>r’s website.<br />
FY 2010 Proposed <strong>Budget</strong> and <strong>Financial</strong> Plan<br />
H-42
FY 2010 Proposed Full-Time Equivalents, by Revenue Type<br />
Table GF0-2 contains <strong>the</strong> proposed FY 2010 FTE level compared to <strong>the</strong> FY 2009 approved FTE level by revenue<br />
type. It also provides FY 2007 and FY 2008 actual data.<br />
Table GF0-2<br />
Actual Actual Approved Proposed<br />
Change<br />
from Percent<br />
Appropriated Fund<br />
General Fund<br />
FY 2007 FY 2008 FY 2009 FY 2010 FY 2009 Change<br />
Local Funds 685.2 1,106.2 660.0 660.0 0.0 0.0<br />
Special Purpose Revenue Funds 22.7 201.2 203.1 203.0 -0.1 0.0<br />
Total for General Fund 707.9 1,307.5 863.0 863.0 0.0 0.0<br />
Federal Resources<br />
Federal Grant Funds 38.2 169.9 152.2 167.4 15.2 10.0<br />
Total for Federal Resources 38.2 169.9 152.2 167.4 15.2 10.0<br />
Private Funds<br />
Private Grant Funds 0.0 16.0 9.8 9.8 -0.1 -0.6<br />
Total for Private Funds 0.0 16.0 9.8 9.8 -0.1 -0.6<br />
Intra-District Funds<br />
Intra-District Funds 1.0 162.1 61.5 63.7 2.2 3.6<br />
Total for Intra-District Funds 1.0 162.1 61.5 63.7 2.2 3.6<br />
Total Proposed FTEs 747.1 1,655.5 1,086.6 1,103.9 17.3 1.6<br />
University <strong>of</strong> <strong>the</strong> District <strong>of</strong> Columbia<br />
H-43
FY 2010 Proposed Operating <strong>Budget</strong>, by Comptroller Source Group<br />
Table GF0-3 contains <strong>the</strong> proposed FY 2010 budget at <strong>the</strong> Comptroller Source Group (object class) level compared<br />
to <strong>the</strong> FY 2009 approved budget. It also provides FY 2007 and FY 2008 actual expenditures.<br />
Table GF0-3<br />
(dollars in thousands)<br />
Actual Actual Approved Proposed<br />
Change<br />
from Percent<br />
Comptroller Source Group FY 2007 FY 2008 FY 2009 FY 2010 FY 2009 Change*<br />
11 Regular Pay - Cont Full Time 41,467 33,160 40,444 45,660 5,217 12.9<br />
12 Regular Pay - O<strong>the</strong>r 18,854 17,819 14,794 16,891 2,097 14.2<br />
13 Additional Gross Pay 1,665 2,886 6,771 3,688 -3,083 -45.5<br />
14 Fringe Benefits - Curr Personnel 12,117 12,711 12,865 13,836 971 7.5<br />
15 Overtime Pay 121 235 161 146 -15 -9.3<br />
99 Unknown Payroll Postings 0 462 0 0 0 N/A<br />
Subtotal Personal Services (PS) 74,224 67,273 75,036 80,222 5,186 6.9<br />
20 Supplies and Materials 1,525 1,715 3,096 2,561 -535 -17.3<br />
30 Energy, Comm. and Bldg Rentals 2,494 3,117 2,851 2,848 -3 -0.1<br />
31 Telephone, Telegraph, Telegram, Etc 1,172 1,091 1,648 1,632 -15 -0.9<br />
32 Rentals - Land and Structures 1,472 2,339 4,045 4,045 0 0.0<br />
33 Janitorial Services 805 613 896 812 -84 -9.4<br />
40 O<strong>the</strong>r Services and Charges 6,701 5,056 8,021 7,845 -176 -2.2<br />
41 Contractual Services - O<strong>the</strong>r 11,892 11,365 12,375 11,616 -759 -6.1<br />
50 Subsidies and Transfers 8,680 11,152 16,677 24,660 7,983 47.9<br />
70 Equipment & Equipment Rental 2,982 4,247 3,835 4,046 211 5.5<br />
91 Expense Not <strong>Budget</strong>ed O<strong>the</strong>rs 1,212 2 0 0 0 N/A<br />
Subtotal Nonpersonal Services (NPS) 38,933 40,696 53,444 60,066 6,623 12.4<br />
Gross Funds 113,157 107,968 128,480 140,288 11,809 9.2<br />
*Percent Change is based on whole dollars.<br />
FY 2010 Proposed <strong>Budget</strong> and <strong>Financial</strong> Plan<br />
H-44
Program Description<br />
The University <strong>of</strong> <strong>the</strong> District <strong>of</strong> Columbia operates<br />
through <strong>the</strong> following 6 programs:<br />
Academic Affairs - provides affordable post-secondary<br />
educational services to students to prepare<br />
<strong>the</strong>m for entry into <strong>the</strong> job market and allow <strong>the</strong>m to<br />
successfully achieve pr<strong>of</strong>essional and personal goals.<br />
This program <strong>of</strong>fers quality post-secondary education,<br />
research experiences, and public service opportunities<br />
to District <strong>of</strong> Columbia residents so that <strong>the</strong>y<br />
can prepare for immediate entry into <strong>the</strong> workforce,<br />
<strong>the</strong> next level <strong>of</strong> education, and specialized career<br />
opportunities; engage in lifelong learning; and contribute<br />
to <strong>the</strong> resolution <strong>of</strong> urgent urban problems.<br />
This program contains <strong>the</strong> following 13 activities:<br />
■ Learning Resources - provides access to books,<br />
multi-media materials and equipment, research<br />
and reference materials, and consultation and<br />
support services to students, faculty, District residents,<br />
and members <strong>of</strong> <strong>the</strong> Washington Research<br />
Consortium so that <strong>the</strong>y can use on-site and online<br />
information and resources to support teaching,<br />
learning, and research;<br />
■ College <strong>of</strong> Arts and Sciences - provides instructional,<br />
research, public service/outreach, and support<br />
services to UDC students and <strong>the</strong> community<br />
so that students can have employment/career<br />
opportunities; be prepared for graduate/pr<strong>of</strong>essional<br />
school; and acquire lifelong learning<br />
skills, so that <strong>the</strong>y can experience an improved<br />
quality <strong>of</strong> life;<br />
■ School <strong>of</strong> Business and Public Administration -<br />
provides instructional, research, public service/outreach,<br />
and support services to UDC students<br />
and <strong>the</strong> community so that students can<br />
have employment and career opportunities and<br />
acquire lifelong learning skills;<br />
■ Community Outreach and Extension Services -<br />
provides instruction, funded research, and public<br />
service and research services to residents <strong>of</strong> <strong>the</strong><br />
Washington metropolitan area so that <strong>the</strong>y can<br />
make healthier lifestyle choices and improve <strong>the</strong>ir<br />
literacy level and fully benefit from economic<br />
opportunities;<br />
■ Enrollment Management - provides communications<br />
for recruitment and admissions, admis-<br />
sions advisement, academic and enrollment verification<br />
and certification, and student information<br />
management services to prospective and<br />
returning students, current and former students,<br />
and university faculty and administrators so that<br />
students can be admitted to <strong>the</strong> university and<br />
subsequently experience <strong>the</strong> benefits associated<br />
with university enrollment so that faculty and<br />
administrators can have access to data to effectively<br />
plan and manage <strong>the</strong> overall instruction<br />
process;<br />
■ Adult Literacy - provides competitive grants, pr<strong>of</strong>essional<br />
leadership, literacy interventions, graduate<br />
certifications, and best practices services to<br />
community-based organizations so that adult<br />
learners can learn to read and write;<br />
■ Center for Applied Research and Urban<br />
Planning - provides research, training, and technical<br />
assistance services to District and federal<br />
funding agencies, programs and organizations so<br />
that <strong>the</strong>y can apply research results toward resolution<br />
<strong>of</strong> urgent urban problems and UDC students<br />
and faculty can gain experience and expertise<br />
in research;<br />
■ Engineering and Applied Science - provides instructional,<br />
research, public service/outreach, and support<br />
services to UDC students and <strong>the</strong> community so<br />
that students can have employment and career<br />
opportunities and be prepared for graduate/pr<strong>of</strong>essional<br />
school to acquire lifelong learning<br />
skills;<br />
■ Nursing and Allied Health Pr<strong>of</strong>essions - provides<br />
instructional, research, public service/outreach,<br />
and support services to UDC students and <strong>the</strong><br />
community so that students can have employment<br />
and career opportunities, be prepared for<br />
graduate/pr<strong>of</strong>essional school, and acquire lifelong<br />
learning skills;<br />
■ David A. Clarke School <strong>of</strong> Law - provides<br />
instructional, research, public service/outreach,<br />
and support services to UDC students and <strong>the</strong><br />
community so that students can have employment<br />
and career opportunities and acquire lifelong<br />
learning skills;<br />
■ Continuing Education - provides instruction,<br />
certifications, and research services to residents<br />
and employers in <strong>the</strong> Washington metropolitan<br />
University <strong>of</strong> <strong>the</strong> District <strong>of</strong> Columbia<br />
H-45
area so that employers can have access to workers<br />
whose skills are aligned with <strong>the</strong> needs <strong>of</strong> <strong>the</strong><br />
workforce, and residents can obtain employment<br />
or achieve pr<strong>of</strong>essional and career advancement;<br />
■ Academic Support - houses <strong>the</strong> <strong>Office</strong> <strong>of</strong> <strong>the</strong><br />
Provost and promotes educational quality and<br />
effectiveness. This activity provides oversight,<br />
leadership, and service to achieve <strong>the</strong> academic<br />
mission <strong>of</strong> <strong>the</strong> university. It also works to provide<br />
recommendations to <strong>the</strong> President on resource<br />
allocations for academic units, as well as articulates<br />
<strong>the</strong> academic values and functions <strong>of</strong> <strong>the</strong> university<br />
and represents <strong>the</strong> institution in various<br />
settings; and<br />
■ Institutional Research - provides quantitative and<br />
qualitative information for institutional planning,<br />
assessment, and executive decision-making<br />
through <strong>the</strong> identification <strong>of</strong> current issues on<br />
higher education; compiling and reporting information<br />
on <strong>the</strong> university’s internal and external<br />
environments; analyzing and reporting trends in<br />
institutional resources, admissions, student satisfaction,<br />
retention, and graduation rates; and conducting<br />
peer comparison studies.<br />
Student Affairs - provides enrichment opportunities<br />
and assistance to students in an out-<strong>of</strong>-classroom<br />
environment. These services are designed to prepare<br />
students to be successful in achieving <strong>the</strong>ir educational,<br />
career and life-long goals. The program <strong>of</strong>fers outreach,<br />
support, and leadership development services<br />
to UDC students and o<strong>the</strong>r members <strong>of</strong> <strong>the</strong> community<br />
so that <strong>the</strong>y can experience academic success, participate<br />
in university life, and develop leadership skills<br />
that will enable successful integration into <strong>the</strong> global<br />
community.<br />
This program contains <strong>the</strong> following 8 activities:<br />
■ Records Management - manages, protects, and<br />
converts inactive university records for UDC<br />
administrative <strong>of</strong>fices, academic <strong>of</strong>fices, <strong>the</strong> Board<br />
<strong>of</strong> Trustees, and <strong>the</strong> <strong>Office</strong> <strong>of</strong> <strong>the</strong> President so that<br />
<strong>the</strong>y can have continuous access to vital business<br />
information;<br />
■ Health Services - provides preventive health care<br />
and limited medical care services to <strong>the</strong> university<br />
and public health community so that <strong>the</strong>y can<br />
prevent <strong>the</strong> spread <strong>of</strong> communicable diseases and<br />
FY 2010 Proposed <strong>Budget</strong> and <strong>Financial</strong> Plan<br />
H-46<br />
respond to emerging health issues;<br />
■ Career Services - provides a centralized source for<br />
job and career information, preparation, and support<br />
services for UDC students, alumni, and<br />
o<strong>the</strong>r members <strong>of</strong> <strong>the</strong> university community so<br />
that <strong>the</strong>y can choose, find, and obtain employment<br />
and o<strong>the</strong>r post-graduate opportunities;<br />
■ Student Life and Services - provides outreach,<br />
intervention, and academic and non-academic<br />
support services to UDC students so that all students<br />
can experience academic success, participate<br />
in university life, and develop life and leadership<br />
skills that will enable successful integration into<br />
<strong>the</strong> global community;<br />
■ <strong>Financial</strong> Aid - provides financial assistance,<br />
resources, and services to eligible UDC students<br />
so that <strong>the</strong>y can receive funding assistance to<br />
attend <strong>the</strong> university;<br />
■ Student Services Administration - provides leadership<br />
development training, opportunities, and<br />
experiences and concerns processing services to<br />
UDC students so that <strong>the</strong>y can develop leadership<br />
skills and participate in <strong>the</strong> effective and timely<br />
resolution <strong>of</strong> student complaints;<br />
■ Athletics Department - provides intercollegiate<br />
participation, intramural games, and fitness and<br />
recreation services to students and o<strong>the</strong>r members<br />
<strong>of</strong> <strong>the</strong> university family and community so that<br />
athletically talented students can gain access to an<br />
education and stay in school, and all members <strong>of</strong><br />
<strong>the</strong> university family can experience an enhanced<br />
sense <strong>of</strong> community; and<br />
■ Community Outreach and Involvement - provides<br />
<strong>the</strong> community with programs which<br />
streng<strong>the</strong>n and diversify <strong>the</strong> rural economy. This<br />
activity fur<strong>the</strong>r strives to increase incomes,<br />
employment, and <strong>the</strong> local tax base by providing<br />
assistance to District communities and businesses.<br />
University Advancement - dedicated to advancing<br />
<strong>the</strong> University <strong>of</strong> <strong>the</strong> District <strong>of</strong> Columbia's mission<br />
by increasing awareness and goodwill, fostering financial<br />
support, and building a sense <strong>of</strong> community<br />
among <strong>the</strong> university's many and varied constituents.<br />
This program provides information, outreach, and<br />
promotional services to UDC students, faculty, staff,<br />
alumni (including alumni <strong>of</strong> predecessor institutions),<br />
o<strong>the</strong>r key university partners, and <strong>the</strong> public at<br />
large so that <strong>the</strong>y can meaningfully participate in and
e supportive <strong>of</strong> <strong>the</strong> teaching, research, and community<br />
service programs <strong>of</strong> <strong>the</strong> university and experience<br />
a sense <strong>of</strong> tradition and community from <strong>the</strong>ir relationship<br />
with <strong>the</strong> university.<br />
This program contains <strong>the</strong> following 5 activities:<br />
■ Alumni Relations - provides outreach services to<br />
UDC alumni and alumni <strong>of</strong> UDC's predecessor<br />
institutions so that <strong>the</strong>y can participate in and be<br />
supportive <strong>of</strong> <strong>the</strong> academic, research, and community<br />
service programs <strong>of</strong> <strong>the</strong> university;<br />
■ Development - build relationships with corporations,<br />
foundations, individual estates, and o<strong>the</strong>r<br />
potential donors so that <strong>the</strong>y can consistently support<br />
<strong>the</strong> programs and activities <strong>of</strong> <strong>the</strong> university<br />
and contribute to its financial security and stability;<br />
■ Communications and Branding - provides publicity<br />
and media services to <strong>the</strong> District community<br />
so that <strong>the</strong>y can be accurately informed<br />
about, form a positive image <strong>of</strong>, and be supportive<br />
<strong>of</strong> <strong>the</strong> university and its mission, goals, and<br />
programs;<br />
■ Government Relations - provides assistance to<br />
<strong>the</strong> University by acting as a liaison between <strong>the</strong><br />
University, <strong>the</strong> District government, and its constituents;<br />
and<br />
■ Communications and Relations Administrationfosters<br />
<strong>the</strong> exchange <strong>of</strong> talents and resources <strong>of</strong><br />
alumni, students, parents, faculty, administration,<br />
and friends to advance <strong>the</strong> mission <strong>of</strong> <strong>the</strong><br />
University <strong>of</strong> <strong>the</strong> District <strong>of</strong> Columbia. This unit<br />
provides oversight <strong>of</strong> <strong>the</strong> following units: Alumni<br />
Relations, Major Gifts and Development,<br />
Communication and Branding, and<br />
Governmental Affairs.<br />
Executive Direction - provides leadership for central<br />
executive activities concerned with management and<br />
long-range planning and management for <strong>the</strong> entire<br />
institution. This program develops and implements<br />
<strong>the</strong> university’s strategic plan to ensure successful<br />
accomplishment <strong>of</strong> <strong>the</strong> university’s overall mission.<br />
This program contains <strong>the</strong> following 3 activities:<br />
■ <strong>Office</strong> <strong>of</strong> <strong>the</strong> President – is responsible for <strong>the</strong><br />
administration <strong>of</strong> <strong>the</strong> University. The mission <strong>of</strong><br />
this activity is to administer policies and proce-<br />
dures; plan, operate, and maintain plant facilities;<br />
manage <strong>the</strong> university’s financial affairs; ensure <strong>the</strong><br />
safety and welfare <strong>of</strong> <strong>the</strong> students, faculty, staff,<br />
visitors, and facilities; enhance <strong>the</strong> university’s efficiency<br />
and effectiveness through information<br />
technology utilization; improve and expand services<br />
<strong>of</strong>fered to university clientele; and support<br />
<strong>the</strong> overall mission <strong>of</strong> <strong>the</strong> University <strong>of</strong> <strong>the</strong><br />
District <strong>of</strong> Columbia;<br />
■ Quality Improvement - provides instruction and<br />
oversight <strong>of</strong> <strong>the</strong> entire university’s customer service<br />
practices and staff performance. This activity<br />
is designed to ensure <strong>the</strong> university’s ability to provide<br />
high quality service to customers on a consistent<br />
basis in every facet <strong>of</strong> operation. The primary<br />
function <strong>of</strong> this unit is to provide training and<br />
support to various units within <strong>the</strong> university to<br />
ensure that all employees are acclimated to <strong>the</strong><br />
expectations <strong>of</strong> <strong>the</strong> administration and <strong>the</strong> university's<br />
mission and goals; and<br />
■ <strong>Financial</strong> Reserve and Contingencies - provides<br />
financial support toward <strong>the</strong> President’s plan to<br />
make <strong>the</strong> university an institution that is destined<br />
for growth and expansion. This activity serves as<br />
a holding place for <strong>the</strong> disbursement <strong>of</strong> anticipated<br />
revenue collections, as well as projected expenditures<br />
relating to litigation and contingencies.<br />
<strong>Agency</strong> Management - provides for administrative<br />
support and <strong>the</strong> required tools to achieve operational<br />
and programmatic results. This program is standard<br />
for all agencies using performance-based budgeting.<br />
<strong>Agency</strong> <strong>Financial</strong> Operations – provides comprehensive<br />
and efficient financial management services to,<br />
and on behalf <strong>of</strong>, District agencies so that <strong>the</strong> financial<br />
integrity <strong>of</strong> <strong>the</strong> District <strong>of</strong> Columbia is maintained.<br />
This program is standard for all agencies using<br />
performance-based budgeting.<br />
Program Structure Change<br />
The University <strong>of</strong> <strong>the</strong> District <strong>of</strong> Columbia had no<br />
program structure changes in <strong>the</strong> FY 2010 Proposed<br />
<strong>Budget</strong>.<br />
University <strong>of</strong> <strong>the</strong> District <strong>of</strong> Columbia<br />
H-47
FY 2010 Proposed Operating <strong>Budget</strong> and FTEs, by Program and Activity<br />
Table GF0-4 contains <strong>the</strong> proposed FY 2010 budget by program and activity compared to <strong>the</strong> FY 2009 approved budget.<br />
It also provides FY 2008 actual data.<br />
Table GF0-4<br />
(dollars in thousands)<br />
Dollars in Thousands Full-Time Equivalents<br />
Change Change<br />
Actual Approved Proposed from Actual Approved Proposed from<br />
Program/Activity<br />
(1000) <strong>Agency</strong> Management<br />
FY 2008 FY 2009 FY 2010 FY 2009 FY 2008 FY 2009 FY 2010 FY 2009<br />
(1010) Personnel 70 904 2,104 1,200 0.0 11.0 12.0 1.0<br />
(1020) Contracting & Procurement 828 920 1,020 100 13.1 8.0 8.0 0.0<br />
(1030) Property Management 11,852 12,975 18,528 5,553 43.3 43.0 41.0 -2.0<br />
(1040) Information Technology 3,447 4,046 4,103 56 37.0 19.0 19.0 0.0<br />
(1050) <strong>Financial</strong> Services -5,521 6,199 3,220 -2,979 1.1 0.0 0.0 0.0<br />
(1055) Risk Management 2,776 2,996 3,158 162 62.1 38.0 39.0 1.0<br />
(1060) Legal Services 364 609 760 152 5.4 4.0 6.0 2.0<br />
(1080) Communications 126 0 0 0 2.2 0.0 0.0 0.0<br />
(1090) Performance Management 450 5,216 2,521 -2,695 5.5 40.6 4.1 -36.5<br />
No Activity Assigned -5 0 0 0 0.0 0.0 0.0 0.0<br />
Subtotal (1000) <strong>Agency</strong> Management<br />
(100F) <strong>Agency</strong> <strong>Financial</strong> Operations<br />
14,386 33,864 35,416 1,551 169.7 163.6 129.1 -34.5<br />
(101F) <strong>Agency</strong> Fiscal <strong>Office</strong>r Operations 1,427 1,233 1,230 -4 26.2 3.0 3.0 0.0<br />
(110F) <strong>Budget</strong> Operations 318 1,064 1,244 180 4.4 10.0 12.0 2.0<br />
(120F) Accounting Operations 1,772 2,967 7,765 4,798 61.2 33.0 29.0 -4.0<br />
Subtotal (100F) <strong>Agency</strong> <strong>Financial</strong> Operations<br />
(2000) Student Affairs<br />
3,517 5,265 10,239 4,974 91.8 46.0 44.0 -2.0<br />
(2020) Community Outreach & Involvement - SAF 8 9 9 0 0.0 0.0 0.0 0.0<br />
(2030) Career Services 100 130 118 -13 2.2 1.7 1.5 -0.2<br />
(2040) Student Services Administration 1,673 1,339 1,015 -323 74.4 8.0 5.8 -2.2<br />
(2050) Records Management 216 260 222 -38 4.3 6.5 3.0 -3.5<br />
(2060) <strong>Financial</strong> Aid 7,434 7,244 7,877 633 50.0 45.5 36.8 -8.7<br />
(2070) Athletics Department 2,020 4,509 4,309 -199 21.2 13.5 24.5 11.0<br />
(2080) Health Services 640 403 649 246 0.0 0.0 0.0 0.0<br />
(2090) Student Life and Services 2,304 3,107 3,686 579 56.2 31.5 46.6 15.1<br />
Subtotal (2000) Student Affairs<br />
(Continue on next page)<br />
14,395 17,000 17,885 884 208.3 106.7 118.3 11.6<br />
FY 2010 Proposed <strong>Budget</strong> and <strong>Financial</strong> Plan<br />
H-48
FY 2010 Proposed Operating <strong>Budget</strong> and FTEs, by Program and Activity<br />
Table GF0-4 contains <strong>the</strong> proposed FY 2010 budget by program and activity compared to <strong>the</strong> FY 2009 approved budget.<br />
It also provides FY 2008 actual data.<br />
Table GF0-4 (Continued)<br />
(dollars in thousands)<br />
Dollars in Thousands Full-Time Equivalents<br />
Change Change<br />
Actual Approved Proposed from Actual Approved Proposed from<br />
Program/Activity<br />
(3000) University Advancement<br />
FY 2008 FY 2009 FY 2010 FY 2009 FY 2008 FY 2009 FY 2010 FY 2009<br />
(3001) Alumni Relations 136 231 228 -4 1.1 2.0 2.0 0.0<br />
(3002) Major Gifts and Development 373 219 148 -71 4.4 2.0 1.0 -1.0<br />
(3003) Communications and Branding 337 437 450 14 7.1 5.0 4.5 -0.5<br />
(3004) Governmental Affairs 9 142 193 50 0.0 1.0 2.0 1.0<br />
(300B) Communications and Relations 1,150 1,134 1,429 294 17.3 7.6 6.0 -1.6<br />
Subtotal (3000) University Advancement<br />
(4000) Academic Affairs<br />
2,005 2,164 2,447 283 29.9 17.6 15.5 -2.1<br />
(4001) Academic Support (PROVOST/VPAA) 8,905 6,588 7,037 449 108.2 99.4 128.7 29.3<br />
(4002) Nursing and Allied Health Pr<strong>of</strong>essions 837 3,079 3,921 842 2.2 36.2 47.4 11.2<br />
(4003) Learning Resources 3,199 3,337 3,457 119 60.4 31.0 32.2 1.2<br />
(4004) Enrollment Management 1,822 2,240 2,084 -157 38.2 23.7 23.0 -0.6<br />
(4005) Adult Literacy 369 499 38 -461 8.8 0.0 0.0 0.0<br />
(4006) Applied Research & Urban Planning 1,113 7,186 7,186 0 45.2 10.5 12.7 2.2<br />
(4008) Community Outreach & Extension Services 4,623 4,461 4,529 68 88.0 66.6 73.1 6.5<br />
(4009) Continuing Education 5,774 3,788 4,607 819 120.3 47.8 60.9 13.1<br />
(4010) Engineering 4,394 5,267 4,916 -351 78.1 56.2 50.0 -6.2<br />
(4020) Business and Public Administration 6,490 5,324 4,788 -536 95.0 67.5 55.0 -12.5<br />
(4030) David A. Clarke School Of Law 6,119 5,665 6,990 1,325 97.8 46.4 57.5 11.1<br />
(4040) College <strong>of</strong> Arts and Sciences 26,145 18,975 22,490 3,515 398.4 256.4 245.6 -10.8<br />
(4050) Institutional Research 186 382 297 -86 4.4 4.0 3.0 -1.0<br />
Subtotal (4000) Academic Affairs<br />
(6000) Executive Direction<br />
69,977 66,791 72,337 5,546 1,144.9 745.7 789.1 43.4<br />
(6001) Executive Management (President's <strong>Office</strong>) 1,274 1,931 1,468 -463 11.0 7.0 8.0 1.0<br />
(6002) Quality Improvement 124 400 100 -300 0.0 0.0 0.0 0.0<br />
(6003) <strong>Financial</strong> Reserves & Contingencies 2,290 1,065 397 -668 0.0 0.0 0.0 0.0<br />
Subtotal (6000) Executive Direction 3,688 3,396 1,965 -1,430 11.0 7.0 8.0 1.0<br />
Total Proposed Operating <strong>Budget</strong> 107,968 128,480 140,288 11,809 1,655.5 1,086.6 1,103.9 17.3<br />
(Change is calculated by whole numbers and numbers may not add up due to rounding)<br />
Note: For more detailed information regarding <strong>the</strong> proposed funding for <strong>the</strong> activities within this agency’s programs, please see Schedule 30-PBB<br />
Program Summary by Activity in <strong>the</strong> FY 2010 Operating Appendices located on <strong>the</strong> <strong>Office</strong> <strong>of</strong> <strong>the</strong> <strong>Chief</strong> <strong>Financial</strong> <strong>Office</strong>r’s website.<br />
University <strong>of</strong> <strong>the</strong> District <strong>of</strong> Columbia<br />
H-49
Major Baseline Adjustments, Cost Savings<br />
and Policy Initiatives<br />
Baseline Adjustments: There was a decrease <strong>of</strong><br />
$17,776,561 in subsidies and transfers in Special<br />
Purpose Revenue Funds. The University requested<br />
budget authority to expend accumulated unreserved<br />
fund balance identified in its annual audit; however, it<br />
was determined that components <strong>of</strong> <strong>the</strong> proposed<br />
uses <strong>of</strong> <strong>the</strong>se nonrecurring funds were for recurring<br />
costs such as salaries. The budget authority was<br />
reduced for <strong>the</strong>se items and left as a policy decision<br />
pursuant to District <strong>of</strong> Columbia Official Code<br />
Section 38-1202.06(4), which provides for <strong>the</strong> Mayor<br />
and Council to “establish <strong>the</strong> maximum amount <strong>of</strong><br />
funds for each <strong>of</strong> <strong>the</strong> major components <strong>of</strong> <strong>the</strong><br />
University and <strong>the</strong> total University budget.”<br />
Policy Initiatives: The proposed FY 2010 budget for<br />
<strong>the</strong> University <strong>of</strong> <strong>the</strong> District <strong>of</strong> Columbia is<br />
$140,288,460 and 1,103.9 FTEs, and increase <strong>of</strong><br />
$11,808,850 from <strong>the</strong> FY 2009 Approved budget.<br />
The increase includes authorization to spend onetime<br />
funds that have accumulated over time in <strong>the</strong><br />
Municipal University Fund. The University is authorized<br />
to spend <strong>the</strong>se funds on one-time expenses, and<br />
<strong>the</strong>re is no expectation <strong>of</strong> an increased District subsidy<br />
to UDC in <strong>the</strong> out-years <strong>of</strong> <strong>the</strong> multi-year budget.<br />
Note on Special Purpose Revenue: The University’s<br />
Special Purpose Revenue Fund includes budget<br />
authority to expend $10,607,000 <strong>of</strong> undesignated,<br />
unreserved fund balance during FY 2010. The actual<br />
amount available to <strong>the</strong> University during FY 2010<br />
will be limited by <strong>the</strong> lesser <strong>of</strong> this amount or <strong>the</strong><br />
actual available, undesignated, unreserved fund balance<br />
in <strong>the</strong> University’s Special Purpose Revenue fund<br />
as certified by <strong>the</strong> <strong>Office</strong> <strong>of</strong> <strong>the</strong> <strong>Chief</strong> <strong>Financial</strong><br />
<strong>Office</strong>r when <strong>the</strong> University’s FY 2009<br />
Comprehensive Annual <strong>Financial</strong> Report is issued.<br />
Additionally, uses <strong>of</strong> <strong>the</strong> University’s individual<br />
Special Purpose Revenue funds are limited to <strong>the</strong> purposes<br />
specified in <strong>the</strong> provisions <strong>of</strong> <strong>the</strong> District <strong>of</strong><br />
Columbia Official Code that established each fund.<br />
FY 2010 Proposed <strong>Budget</strong> and <strong>Financial</strong> Plan<br />
H-50
FY 2009 Approved <strong>Budget</strong> to FY 2010 Proposed <strong>Budget</strong>, by Revenue Type<br />
Table GF0-5 itemizes <strong>the</strong> changes by revenue type between <strong>the</strong> FY 2009 approved budget and <strong>the</strong> FY 2010 proposed<br />
budget. The four categories <strong>of</strong> changes reflected in this table are: (1) changes to <strong>the</strong> baseline budget (includes<br />
agency request), (2) changes representing cost savings or efficiencies, (3) changes related to policy initiatives, and (4)<br />
changes to specifically address <strong>the</strong> projected revenue shortfall.<br />
Table GF0-5<br />
(dollars in thousands)<br />
PROGRAM BUDGET FTE<br />
LOCAL FUND: FY 2009 Approved <strong>Budget</strong> and FTE 62,070 660.0<br />
Initial and Baseline Adjustments<br />
Net effect <strong>of</strong> fixed cost adjustments - Net effect <strong>of</strong> Fixed Costs <strong>Agency</strong> Management -3,106 0.0<br />
Net effect <strong>of</strong> salary and benefits changes - Increase in Personal Services Student Affairs 3,993 0.0<br />
Intra-<strong>Agency</strong> changes - Decrease in Supplies and Materials Multiple -524 0.0<br />
Intra-<strong>Agency</strong> changes - Reduction in O<strong>the</strong>r Services and Charges Multiple -336 0.0<br />
Intra-<strong>Agency</strong> changes - Increase in Contractual Services Multiple 161 0.0<br />
Intra-<strong>Agency</strong> changes - Increase in Subsidies and Transfers Multiple 105 0.0<br />
Intra-<strong>Agency</strong> changes - Reduction in Equipment and Equipment Rental Multiple -293 0.0<br />
LOCAL FUND: FY 2010 Proposed <strong>Budget</strong> and FTE 62,070 660.0<br />
SPECIAL PURPOSE REVENUE FUNDS: FY 2009 Approved <strong>Budget</strong> and FTE<br />
Initial and Baseline Adjustments<br />
36,819 203.1<br />
Net effect <strong>of</strong> fixed cost adjustments - net effect <strong>of</strong> fixed costs <strong>Agency</strong> Management 3,013 0.0<br />
Net effect <strong>of</strong> salary and benefits changes - Net effect <strong>of</strong> salary and<br />
benefits change<br />
Multiple -291 -0.1<br />
Intra-<strong>Agency</strong> changes - Reduction in Materials and Supplies Multiple -315 0.0<br />
Intra-<strong>Agency</strong> changes - Reduction in O<strong>the</strong>r Services and Charges Multiple -344 0.0<br />
Intra-<strong>Agency</strong> changes - Reduction in Contractual Services Multiple -1,612 0.0<br />
Intra-<strong>Agency</strong> changes - Increase in Subsidies and Transfers, primarily<br />
reflecting <strong>the</strong> agency's request to expend fund balance during FY 2010<br />
Multiple 23,279 0.0<br />
Intra-<strong>Agency</strong> changes - Reduction in Equipment and Equipment Rental Multiple -457 0.0<br />
Baseline Adjustments: Intra-<strong>Agency</strong> changes - Reduction <strong>of</strong> Subsidies<br />
and Transfers, primarily reflecting an adjustment to remove <strong>the</strong> agency's<br />
request to use one-time fund balance resources to fund proposed<br />
expenditures that were identified as potentially recurring costs<br />
Multiple -17,777 0.0<br />
Policy Initiatives and Cost Savings<br />
Intra-<strong>Agency</strong> Changes - Adjustment to align<br />
future expenditures to projected Fund Balance<br />
Multiple -12,672 0.0<br />
Enhance - Authorize <strong>the</strong> use <strong>of</strong> accumulated funds in <strong>the</strong> Municipal<br />
University Fund (one-time resources)<br />
Multiple 17,777 0.0<br />
SPECIAL PURPOSE REVENUE FUNDS: FY 2010 Proposed <strong>Budget</strong> and FTE<br />
(Continued on next page)<br />
47,419 203.0<br />
University <strong>of</strong> <strong>the</strong> District <strong>of</strong> Columbia<br />
H-51
Table GF0-5 (continued)<br />
(dollars in thousands)<br />
PROGRAM BUDGET FTE<br />
FEDERAL GRANT FUND: FY 2009 Approved <strong>Budget</strong> and FTE 18,487 152.2<br />
Initial and Baseline Adjustments<br />
Net effect <strong>of</strong> fixed cost adjustments - Net effect <strong>of</strong> fixed costs adjustments Academic Affairs -5 0.0<br />
Net effect <strong>of</strong> salary and benefits changes - Net effect <strong>of</strong> salary and Academic Affairs 1,078 15.2<br />
benefits changes<br />
Intra-<strong>Agency</strong> changes - Increase in supplies and materials Academic Affairs 106 0.0<br />
Intra-<strong>Agency</strong> changes - Increase in o<strong>the</strong>r services and charges Academic Affairs 262 0.0<br />
Intra-<strong>Agency</strong> changes - Increase in contractual services Academic Affairs 532 0.0<br />
Intra-<strong>Agency</strong> changes - Reduction in subsidies and transfers Academic Affairs -1,217 0.0<br />
Intra-<strong>Agency</strong> changes - Increase in equipment and equipment rental Academic Affairs 597 0.0<br />
FEDERAL GRANT FUND: FY 2010 Proposed <strong>Budget</strong> and FTE 19,839 167.4<br />
PRIVATE GRANT FUND: FY 2009 Approved <strong>Budget</strong> and FTE 891 9.8<br />
Initial and Baseline Adjustments<br />
Net effect <strong>of</strong> salary and benefits changes - Net effect <strong>of</strong> salary and Academic Affairs 141 0.0<br />
benefits changes<br />
Intra-<strong>Agency</strong> changes - Reduction in supplies and materials Academic Affairs -2 0.0<br />
Intra-<strong>Agency</strong> changes - Reduction in o<strong>the</strong>r services and charges Academic Affairs -12 0.0<br />
Intra-<strong>Agency</strong> changes - Increase in contractual services Academic Affairs 42 0.0<br />
Intra-<strong>Agency</strong> changes - Reduction in subsidies and transfers Academic Affairs -523 0.0<br />
Intra-<strong>Agency</strong> changes - Reduction in equipment and equipment rental Academic Affairs -10 0.0<br />
PRIVATE GRANT FUND: FY 2010 Proposed <strong>Budget</strong> and FTE 527 9.8<br />
INTRA-DISTRICT FUNDS: FY 2009 Approved <strong>Budget</strong> and FTE 10,212 61.5<br />
Initial and Baseline Adjustments<br />
Net effect <strong>of</strong> fixed cost adjustments - Net effect <strong>of</strong> fixed cost adjustments Academic Affairs -1 0.0<br />
Net effect <strong>of</strong> salary and benefits changes - Net effect <strong>of</strong> salary and Academic Affairs 266 2.2<br />
benefits changes<br />
Intra-<strong>Agency</strong> changes - Increase in supplies and materials Academic Affairs 198 0.0<br />
Intra-<strong>Agency</strong> changes - Reduction in o<strong>the</strong>r services and charges Academic Affairs -75 0.0<br />
Intra-<strong>Agency</strong> changes - Increase in contractual services Academic Affairs 117 0.0<br />
Intra-<strong>Agency</strong> changes - Reduction in subsidies and transfers Academic Affairs -657 0.0<br />
Intra-<strong>Agency</strong> changes - Increase in equipment and equipment rental Academic Affairs 375 0.0<br />
INTRA-DISTRICT FUNDS: FY 2010 Proposed <strong>Budget</strong> and FTE 10,433 63.7<br />
Gross for GF0 - University <strong>of</strong> <strong>the</strong> District <strong>of</strong> Columbia 140,288 1,103.9<br />
<strong>Agency</strong> Performance Plan<br />
The agency’s Performance Plan has <strong>the</strong> following<br />
objectives for FY 2010:<br />
Objective 1: Achieve annual increases <strong>of</strong> student<br />
enrollment and a higher level <strong>of</strong> success in student<br />
retention and graduation.<br />
Objective 2: Achieve and maintain a high level <strong>of</strong><br />
competitiveness and quality in teaching, learning,<br />
research and public service.<br />
FY 2010 Proposed <strong>Budget</strong> and <strong>Financial</strong> Plan<br />
H-52<br />
Objective 3: Enhance workforce development program<br />
<strong>of</strong>ferings and ensure that <strong>the</strong>se <strong>of</strong>ferings address<br />
employment market demand in <strong>the</strong> District <strong>of</strong><br />
Columbia.<br />
Objective 4: Provide a student centered campus environment<br />
through <strong>the</strong> delivery <strong>of</strong> effective and efficient<br />
student services.
<strong>Agency</strong> Performance Measures<br />
Table GF0-6<br />
FY 2008 FY 2009 FY 2009<br />
Year-End Original Year-End FY 2010 FY 2010 FY 2011<br />
Measure<br />
Objective 1<br />
Percent increase in student head count enrollment<br />
in <strong>the</strong> undergraduate, graduate and Juris Doctor<br />
Actual Target Actual Projection Projection Projection<br />
programs<br />
Percent <strong>of</strong> first-time full-time entering freshmen<br />
who demonstrate progress by returning for <strong>the</strong><br />
-2.8% N/A -0.3% 1.5% 2.0% 3.0%<br />
second year 50.0% 53.0% 57.4% 55.0% 60.0% 65.5%<br />
Objective 2<br />
Percent <strong>of</strong> programs that received special<br />
accreditation from National or International<br />
Pr<strong>of</strong>essional Accrediting Agencies<br />
Percent increase in <strong>the</strong> number <strong>of</strong> degrees<br />
granted (Associate, Baccalaureate, Masters and<br />
81.4% 80.0% 79.6% 80.0% 80.0% 83.0%<br />
Juris Doctor)<br />
Percent <strong>of</strong> full-time faculty engaged in research,<br />
-11.4% N/A -1.8% 2.0% 2.5% 3.0%<br />
scholarship and public service activities 63.6% 65.0% 79.2% 80.0% 82.0% 84.0%<br />
Percent <strong>of</strong> research proposals funded<br />
Percent student pass rate for pr<strong>of</strong>essional<br />
57.1% 39.0% --- 40.0% 42.0% 45.0%<br />
licensing or certificate exams<br />
Objective 3<br />
Percent increase in student enrollment in Career<br />
& Technical Education and Workforce Development<br />
69.3% 75.0% 82.2% 83.0% 84.0% 85.0%<br />
Programs N/A N/A N/A1 Percent increase in <strong>the</strong> number <strong>of</strong> state/national<br />
industry certifications awarded in <strong>the</strong> Career &<br />
Technical Education and Workforce Development<br />
15.0% 5.0% 5.0%<br />
Programs N/A N/A N/A2 10.0% 5.0% 5.0%<br />
Objective 4<br />
Increase student satisfaction rate for basic<br />
student services<br />
Percent increase <strong>of</strong> student utilization <strong>of</strong> basic student<br />
N/A 60.0% 86.6% 87.0% 88.0% 90.0%<br />
services<br />
Percent increase <strong>of</strong> student participation in formal<br />
N/A N/A 13.0% 13.5% 14.5% 15.0%<br />
leadership development activities<br />
Percent <strong>of</strong> financial aid students whose aid is disbursed<br />
N/A N/A 18.5% 12.5% 11.10% 10.0%<br />
within 6-weeks <strong>of</strong> <strong>the</strong> start <strong>of</strong> <strong>the</strong> school year N/A N/A N/A 62.0% 65.0% 70.0%<br />
1 The percent increase was not calculated, because FY 2009 is <strong>the</strong> base year for this particular measure.<br />
2 The percent increase was not calculated, because FY 2009 is <strong>the</strong> base year for this particular measure.<br />
University <strong>of</strong> <strong>the</strong> District <strong>of</strong> Columbia<br />
H-53
(UV0)<br />
D.C. Department <strong>of</strong> Human Resources<br />
<strong>Agency</strong> Trust<br />
www.dchr.dc.gov<br />
Telephone: 202-442-9700<br />
% Change<br />
FY 2008 FY 2009 FY 2010 from<br />
Description Actual Approved Proposed FY 2009<br />
Operating <strong>Budget</strong> $2,625 $2,400,000 $0 -100.0<br />
The D.C. Department <strong>of</strong> Human Resources <strong>Agency</strong> Trust is being<br />
dissolved in FY 2009.<br />
The agency’s FY 2010 proposed budget is presented in <strong>the</strong> following tables:<br />
FY 2010 Proposed Gross Funds Operating <strong>Budget</strong>, by Revenue Type<br />
Table UV0-1 contains <strong>the</strong> proposed FY 2010 agency budget compared to <strong>the</strong> FY 2009 approved budget. It also<br />
provides FY 2007 and FY 2008 actual expenditures.<br />
Table UV0-1<br />
(dollars in thousands)<br />
Actual Actual Approved Proposed<br />
Change<br />
from Percent<br />
Appropriated Fund<br />
General Fund<br />
FY 2007 FY 2008 FY 2009 FY 2010 FY 2009 Change*<br />
Special Purpose Revenue Funds 1,262 3 2,400 0 -2,400 -100.0<br />
Total for General Fund 1,262 3 2,400 0 -2,400 -100.0<br />
Gross Funds<br />
*Percent Change is based on whole dollars.<br />
1,262 3 2,400 0 -2,400 -100.0<br />
Note: If applicable, for a breakdown <strong>of</strong> each Grant (Federal and Private), Special Purpose Revenue type and Intra-District<br />
agreement, please refer to Schedule 80, <strong>Agency</strong> Summary by Revenue Source, in <strong>the</strong> Operating Appendices located on <strong>the</strong><br />
<strong>Office</strong> <strong>of</strong> <strong>the</strong> <strong>Chief</strong> <strong>Financial</strong> <strong>Office</strong>r’s website.<br />
D.C. Department <strong>of</strong> Human Resources <strong>Agency</strong> Trust<br />
H-55
FY 2010 Proposed Operating <strong>Budget</strong>, by Comptroller Source Group<br />
Table UV0-2 contains <strong>the</strong> proposed FY 2010 budget at <strong>the</strong> Comptroller Source Group (object class) level compared<br />
to <strong>the</strong> FY 2009 approved budget. It also provides FY 2007 and FY 2008 actual expenditures.<br />
Table UV0-2<br />
(dollars in thousands)<br />
Actual Actual Approved Proposed<br />
Change<br />
from Percent<br />
Comptroller Source Group FY 2007 FY 2008 FY 2009 FY 2010 FY 2009 Change*<br />
14 Fringe Benefits - Curr Personnel 1,262 3 2,400 0 -2,400 -100.0<br />
Subtotal Personal Services (PS) 1,262 3 2,400 0 -2,400 -100.0<br />
Gross Funds 1,262 3 2,400 0 -2,400 -100.0<br />
*Percent Change is based on whole dollars.<br />
Program Description<br />
The D.C. Department <strong>of</strong> Human Resources <strong>Agency</strong><br />
Trust contains no programs or activities because <strong>the</strong><br />
agency is being dissolved in FY 2009.<br />
Program Structure Change<br />
The D.C. Department <strong>of</strong> Human Resources <strong>Agency</strong><br />
Trust separates <strong>the</strong> agency trust fund administered by<br />
FY 2010 Proposed Operating <strong>Budget</strong> and FTEs, by Program and Activity<br />
Table UV0-3 contains <strong>the</strong> proposed FY 2010 budget by program and activity compared to <strong>the</strong> FY 2009 approved budget.<br />
It also provides FY 2008 actual data.<br />
Table UV0-3<br />
(dollars in thousands)<br />
Dollars in Thousands Full-Time Equivalents<br />
Change Change<br />
Actual Approved Proposed from Actual Approved Proposed from<br />
Program/Activity<br />
(0001) DCOP Trust Funds<br />
FY 2008 FY 2009 FY 2010 FY 2009 FY 2008 FY 2009 FY 2010 FY 2009<br />
(0010) O<strong>the</strong>r Post Employment Benefits 3 2,400 0 -2,400 0.0 0.0 0.0 0.0<br />
Subtotal (0001) DCOP Trust Funds 3 2,400 0 -2,400 0.0 0.0 0.0 0.0<br />
Total Proposed Operating <strong>Budget</strong> 3 2,400 0 -2,400 0.0 0.0 0.0 0.0<br />
(Change is calculated by whole numbers and numbers may not add up due to rounding)<br />
Note: For more detailed information regarding <strong>the</strong> proposed funding for <strong>the</strong> activities within this agency’s programs, please see<br />
Schedule 30-PBB, Program Summary by Activity, in <strong>the</strong> FY 2010 Operating Appendices located on <strong>the</strong> <strong>Office</strong> <strong>of</strong> <strong>the</strong> <strong>Chief</strong><br />
<strong>Financial</strong> <strong>Office</strong>r’s website.<br />
FY 2010 Proposed <strong>Budget</strong> and <strong>Financial</strong> Plan<br />
H-56<br />
<strong>the</strong> D.C. Department <strong>of</strong> Human Resources (DCHR)<br />
from <strong>the</strong> DCHR budget. Currently, <strong>the</strong> D.C.<br />
Department <strong>of</strong> Human Resources <strong>Agency</strong> Trust has<br />
no expenditures. The proposed budget eliminates all<br />
funding for <strong>the</strong> D.C. Department <strong>of</strong> Human<br />
Resources <strong>Agency</strong> Trust.
Major Baseline Adjustments, Cost Savings and Policy Initiatives<br />
Dissolving <strong>the</strong> D.C. Department <strong>of</strong> Human Resources <strong>Agency</strong> Trust includes no changes in FTEs from <strong>the</strong> FY<br />
2009 approved program budget <strong>of</strong> 0.0 FTEs. The agency attributes this change to <strong>the</strong> decision to charge <strong>the</strong> O<strong>the</strong>r<br />
Post-Employment Benefits (OPEB) expenditures directly to <strong>the</strong> general fund and not to use this agency to record<br />
expenses.<br />
FY 2009 Approved <strong>Budget</strong> to FY 2010 Proposed <strong>Budget</strong>, by Revenue Type<br />
Table UV0-4 itemizes <strong>the</strong> changes by revenue type between <strong>the</strong> FY 2009 approved budget and <strong>the</strong> FY 2010 proposed<br />
budget. The four categories <strong>of</strong> changes reflected in this table are: (1) changes to <strong>the</strong> baseline budget (includes<br />
agency request), (2) changes representing cost savings or efficiencies, (3) changes related to policy initiatives, and (4)<br />
changes to specifically address <strong>the</strong> projected revenue shortfall.<br />
Table UV0-4<br />
(dollars in thousands)<br />
PROGRAM BUDGET FTE<br />
SPECIAL PURPOSE REVENUE FUNDS: FY 2009 Approved <strong>Budget</strong> and FTE 2,400 0.0<br />
Initial and Baseline Adjustments<br />
Reduction for nonrecurring costs - Reduction in Funding as a result <strong>of</strong> zeroing DCOP Trust Funds -2,400 0.0<br />
out <strong>the</strong> agency in FY 2010.<br />
SPECIAL PURPOSE REVENUE FUNDS: FY 2010 Proposed <strong>Budget</strong> and FTE 0 0.0<br />
Gross for UV0 - D.C. Department <strong>of</strong> Human Resources <strong>Agency</strong> Trust 0 0.0<br />
D.C. Department <strong>of</strong> Human Resources <strong>Agency</strong> Trust<br />
H-57
District <strong>of</strong> Columbia Public Library<br />
Trust Fund<br />
www.dclibrary.org<br />
Telephone: 202-727-1101<br />
% Change<br />
FY 2008 FY 2009 FY 2010 from<br />
Description Actual Approved Proposed FY 2009<br />
Operating <strong>Budget</strong> $336 $17,000 $17,000 0.0<br />
This trust fund includes two bequests that are administered by <strong>the</strong><br />
District <strong>of</strong> Columbia Public Library and enables <strong>the</strong> District budget<br />
format to more closely align with <strong>the</strong> presentation <strong>of</strong> <strong>the</strong> District’s<br />
Comprehensive Annual <strong>Financial</strong> Report (CAFR).<br />
The agency’s FY 2010 proposed budget is presented in <strong>the</strong> following tables:<br />
FY 2010 Proposed Gross Funds Operating <strong>Budget</strong>, by Revenue Type<br />
(UW0)<br />
Table UW0-1 contains <strong>the</strong> proposed FY 2010 agency budget compared to <strong>the</strong> FY 2009 approved budget. It also<br />
provides FY 2007 and FY 2008 actual expenditures.<br />
Table UW0-1<br />
(dollars in thousands)<br />
Actual Actual Approved Proposed<br />
Change<br />
from Percent<br />
Appropriated Fund<br />
General Fund<br />
FY 2007 FY 2008 FY 2009 FY 2010 FY 2009 Change*<br />
Special Purpose Revenue Funds 6 0 17 17 0 0.0<br />
Total for General Fund 6 0 17 17 0 0.0<br />
Gross Funds 6 0 17 17 0 0.0<br />
*Percent Change is based on whole dollars.<br />
Note: If applicable, for a breakdown <strong>of</strong> each Grant (Federal and Private), Special Purpose Revenue type and Intra-District agreement,<br />
please refer to Schedule 80, <strong>Agency</strong> Summary by Revenue Source, in <strong>the</strong> Operating Appendices located on <strong>the</strong> <strong>Office</strong> <strong>of</strong> <strong>the</strong> <strong>Chief</strong><br />
<strong>Financial</strong> <strong>Office</strong>r’s website.<br />
D.C. Public Library Trust Fund<br />
H-59
FY 2010 Proposed Operating <strong>Budget</strong>, by Comptroller Source Group<br />
Table UW0-2 contains <strong>the</strong> proposed FY 2010 budget at <strong>the</strong> Comptroller Source Group (object class) level compared<br />
to <strong>the</strong> FY 2009 approved budget. It also provides FY 2007 and FY 2008 actual expenditures.<br />
Table UW0-2<br />
(dollars in thousands)<br />
Actual Actual Approved Proposed<br />
Change<br />
from Percent<br />
Comptroller Source Group FY 2007 FY 2008 FY 2009 FY 2010 FY 2009 Change*<br />
20 Supplies and Materials 4 0 9 8 -1 -11.1<br />
40 O<strong>the</strong>r Services and Charges 2 0 3 6 3 100.0<br />
70 Equipment & Equipment Rental 0 0 5 3 -2 -40.0<br />
Subtotal Nonpersonal Services (NPS) 6 0 17 17 0 0.0<br />
Gross Funds 6 0 17 17 0 0.0<br />
*Percent Change is based on whole dollars.<br />
Program Description<br />
The District <strong>of</strong> Columbia Public Library Trust Fund<br />
operates through <strong>the</strong> following program:<br />
Library Trust Funds: For accounting purposes,<br />
agency trust funds are classified as fiduciary funds that<br />
show assets held by <strong>the</strong> District in a trustee capacity<br />
or as an agent for individuals, private organizations,<br />
and o<strong>the</strong>r governments. Such trust funds are custodial<br />
in nature, reporting only assets and liabilities. Since<br />
fiduciary funds cannot be used for <strong>the</strong> operations <strong>of</strong><br />
<strong>the</strong> government, <strong>the</strong>y are not included in <strong>the</strong> District’s<br />
government-wide financial statements. Prior to FY<br />
2005, <strong>the</strong> budget authority for agency trust funds was<br />
included in <strong>the</strong> operating budgets <strong>of</strong> <strong>the</strong> agencies that<br />
administered <strong>the</strong>m. Since FY 2005, <strong>the</strong>se trust funds<br />
have been shown as separate budget agencies so that<br />
<strong>the</strong> District’s budget structure would show <strong>the</strong>se trust<br />
funds in a manner consistent with <strong>the</strong>ir presentation<br />
in <strong>the</strong> District’s CAFR.<br />
FY 2010 Proposed <strong>Budget</strong> and <strong>Financial</strong> Plan<br />
H-60<br />
This program contains <strong>the</strong> following 2 activities:<br />
■ Theodore W. Noyes Trust Fund - Comprised <strong>of</strong><br />
a bequest <strong>of</strong> $7,000; and<br />
■ Georgetown Peabody Trust Fund - The Peabody<br />
Library Association <strong>of</strong> Georgetown provided, by<br />
deed, a gift <strong>of</strong> securities, cash, and o<strong>the</strong>r valuables<br />
in 1979 to support <strong>the</strong> Georgetown library<br />
branch and for o<strong>the</strong>r designated purposes.<br />
Program Structure Change<br />
The District <strong>of</strong> Columbia Public Library Trust Fund<br />
had no program structure changes in <strong>the</strong> FY 2010<br />
<strong>Budget</strong>.
FY 2010 Proposed Operating <strong>Budget</strong> and FTEs, by Program and Activity<br />
Table UW0-3 contains <strong>the</strong> proposed FY 2010 budget by program and activity compared to <strong>the</strong> FY 2009 approved budget.<br />
It also provides FY 2008 actual data.<br />
Table UW0-3<br />
(dollars in thousands)<br />
Dollars in Thousands Full-Time Equivalents<br />
Change Change<br />
Actual Approved Proposed from Actual Approved Proposed from<br />
Program/Activity<br />
(0001) DCPL Trust Funds<br />
FY 2008 FY 2009 FY 2010 FY 2009 FY 2008 FY 2009 FY 2010 FY 2009<br />
(0010) Theodore Noyes Trust Funds 0 7 7 0 0.0 0.0 0.0 0.0<br />
Subtotal (0001) DCPL Trust Funds<br />
(0002) DCPL Trust Funds<br />
0 7 7 0 0.0 0.0 0.0 0.0<br />
(0020) Peabody Trust Funds 0 10 10 0 0.0 0.0 0.0 0.0<br />
Subtotal (0002) DCPL Trust Funds 0 10 10 0 0.0 0.0 0.0 0.0<br />
Total Proposed Operating <strong>Budget</strong> 0 17 17 0 0.0 0.0 0.0 0.0<br />
(Change is calculated by whole numbers and numbers may not add up due to rounding)<br />
Note: For more detailed information regarding <strong>the</strong> proposed funding for <strong>the</strong> activities within this agency’s programs, please see Schedule 30-PBB<br />
Program Summary by Activity in <strong>the</strong> FY 2010 Operating Appendices located on <strong>the</strong> <strong>Office</strong> <strong>of</strong> <strong>the</strong> <strong>Chief</strong> <strong>Financial</strong> <strong>Office</strong>r’s website.<br />
Major Baseline Adjustments, Cost Savings and Policy Initiatives<br />
The District <strong>of</strong> Columbia Public Library Trust Fund had no initial or baseline adjustments from <strong>the</strong> FY 2009 Approved<br />
<strong>Budget</strong> to <strong>the</strong> FY 2010 Proposed <strong>Budget</strong>.<br />
FY 2009 Approved <strong>Budget</strong> to FY 2010 Proposed <strong>Budget</strong><br />
Table UW0-4 itemizes <strong>the</strong> changes by revenue type between <strong>the</strong> FY 2009 approved budget and <strong>the</strong> FY 2010 proposed<br />
budget. The four categories <strong>of</strong> changes reflected in this table are: (1) changes to <strong>the</strong> baseline budget (includes<br />
agency request), (2) changes representing cost savings or efficiencies, (3) changes related to policy initiatives, and<br />
(4) changes to specifically address <strong>the</strong> projected revenue shortfall.<br />
Table UW0-4<br />
(dollars in thousands)<br />
PROGRAM BUDGET FTE<br />
SPECIAL PURPOSE REVENUE FUNDS: FY 2009 Approved <strong>Budget</strong> and FTE 17 0.0<br />
SPECIAL PURPOSE REVENUE FUNDS: FY 2010 Proposed <strong>Budget</strong> and FTE 17 0.0<br />
Gross for UW0 - D.C. Public Library Trust Fund 17 0.0<br />
D.C. Public Library Trust Fund<br />
H-61
Unemployment Insurance Trust Fund<br />
www.does.dc.gov<br />
Telephone: 202-724-7000<br />
% Change<br />
FY 2008 FY 2009 FY 2010 from<br />
Description Actual Approved Proposed FY 2009<br />
Operating <strong>Budget</strong> $150,236,736 $180,000,000 $251,000,000 39.4<br />
The Unemployment Insurance Trust Fund was separated from <strong>the</strong><br />
Department <strong>of</strong> Employment Services (DOES) budget for improved<br />
fiscal transparency and to enable <strong>the</strong> District's budget format to more<br />
closely follow <strong>the</strong> presentation <strong>of</strong> <strong>the</strong> Comprehensive Annual<br />
<strong>Financial</strong> Report.<br />
The Unemployment Insurance Trust Fund, administered<br />
by DOES, represents <strong>the</strong> proceeds from unemployment<br />
taxes paid by private sector employers and<br />
reimbursements from <strong>the</strong> District and federal governments<br />
deposited in <strong>the</strong> Unemployment Trust Fund<br />
(<strong>the</strong> Fund). The Fund is used to pay benefits for private<br />
and public sector employees during periods <strong>of</strong><br />
unemployment. Payments include transfers to o<strong>the</strong>r<br />
governments to reimburse unemployment benefits<br />
paid to District residents.<br />
<strong>Agency</strong> trust funds are fiduciary funds that are<br />
used to account for assets held by <strong>the</strong> District in a<br />
trustee capacity or as an agent for individuals, private<br />
organizations and o<strong>the</strong>r governments. Such trust<br />
funds are custodial in nature, reporting only assets<br />
and liabilities. Because fiduciary funds cannot be<br />
used for <strong>the</strong> operations <strong>of</strong> <strong>the</strong> government, <strong>the</strong>y are<br />
not included in <strong>the</strong> District's government-wide financial<br />
statements.<br />
(UI0)<br />
Prior to FY 2005, <strong>the</strong>se agency trust funds were<br />
included in <strong>the</strong> operating budgets <strong>of</strong> <strong>the</strong> agencies that<br />
administered <strong>the</strong> trust funds. The District created a<br />
separate agency fund in FY 2005 so that <strong>the</strong> District's<br />
budget structure would treat <strong>the</strong>se trust funds in <strong>the</strong><br />
same manner as <strong>the</strong> District's accounting structure.<br />
The agency’s FY 2010 proposed budget is presented<br />
in <strong>the</strong> following tables:<br />
Unemployment Insurance Trust Fund<br />
H-63
FY 2010 Proposed Gross Funds Operating <strong>Budget</strong>, by Revenue Type<br />
Table UI0-1 contains <strong>the</strong> proposed FY 2010 agency budget compared to <strong>the</strong> FY 2009 approved budget. It also<br />
provides FY 2007 and FY 2008 actual expenditures.<br />
Table UI0-1<br />
(dollars in thousands)<br />
Actual Actual Approved Proposed<br />
Change<br />
from Percent<br />
Appropriated Fund<br />
General Fund<br />
FY 2007 FY 2008 FY 2009 FY 2010 FY 2009 Change*<br />
Special Purpose Revenue Funds 99,920 150,237 180,000 251,000 71,000 39.4<br />
Total for General Fund 99,920 150,237 180,000 251,000 71,000 39.4<br />
Gross Funds 99,920 150,237 180,000 251,000 71,000 39.4<br />
*Percent Change is based on whole dollars.<br />
Note: If applicable, for a breakdown <strong>of</strong> each Grant (Federal and Private), Special Purpose Revenue type and Intra-District agreement,<br />
please refer to Schedule 80, <strong>Agency</strong> Summary by Revenue Source, in <strong>the</strong> Operating Appendices located on <strong>the</strong> <strong>Office</strong> <strong>of</strong> <strong>the</strong> <strong>Chief</strong><br />
<strong>Financial</strong> <strong>Office</strong>r’s website.<br />
FY 2010 Proposed Operating <strong>Budget</strong>, by Comptroller Source Group<br />
Table UI0-2 contains <strong>the</strong> proposed FY 2010 budget at <strong>the</strong> Comptroller Source Group (object class) level compared<br />
to <strong>the</strong> FY 2009 approved budget. It also provides FY 2007 and FY 2008 actual expenditures.<br />
Table UI0-2<br />
(dollars in thousands)<br />
Actual Actual Approved Proposed<br />
Change<br />
from Percent<br />
Comptroller Source Group FY 2007 FY 2008 FY 2009 FY 2010 FY 2009 Change*<br />
50 Subsidies and Transfers 99,920 150,237 180,000 251,000 71,000 39.4<br />
Subtotal Nonpersonal Services (NPS) 99,920 150,237 180,000 251,000 71,000 39.4<br />
Gross Funds 99,920 150,237 180,000 251,000 71,000 39.4<br />
*Percent Change is based on whole dollars.<br />
Program Description<br />
The Unemployment Insurance Trust Fund operates<br />
through <strong>the</strong> following program:<br />
Unemployment Trust Fund - pays benefits for private<br />
and public sector employees during periods <strong>of</strong><br />
unemployment.<br />
FY 2010 Proposed <strong>Budget</strong> and <strong>Financial</strong> Plan<br />
H-64<br />
Program Structure Change<br />
The Unemployment Insurance Trust Fund had no<br />
program structure changes in <strong>the</strong> FY 2010 Proposed<br />
<strong>Budget</strong>.
FY 2010 Proposed Operating <strong>Budget</strong> and FTEs, by Program and Activity<br />
Table UI0-3 contains <strong>the</strong> proposed FY 2010 budget by program and activity compared to <strong>the</strong> FY 2009 approved budget.<br />
It also provides FY 2008 actual data.<br />
Table UI0-3<br />
(dollars in thousands)<br />
Dollars in Thousands Full-Time Equivalents<br />
Change Change<br />
Actual Approved Proposed from Actual Approved Proposed from<br />
Program/Activity FY 2008 FY 2009 FY 2010 FY 2009 FY 2008 FY 2009 FY 2010 FY 2009<br />
(2000) Unemployment Trust Fund<br />
(2200) Benefits Trust Fund 150,237 180,000 251,000 71,000 0.0 0.0 0.0 0.0<br />
Subtotal (2000) Unemployment Trust Fund 150,237 180,000 251,000 71,000 0.0 0.0 0.0 0.0<br />
Total Proposed Operating <strong>Budget</strong> 150,237 180,000 251,000 71,000 0.0 0.0 0.0 0.0<br />
(Change is calculated by whole numbers and numbers may not add up due to rounding)<br />
Note: For more detailed information regarding <strong>the</strong> proposed funding for <strong>the</strong> activities within this agency’s programs, please see<br />
Schedule 30-PBB Program Summary By Activity in <strong>the</strong> FY 2010 Operating Appendices located on <strong>the</strong> <strong>Office</strong> <strong>of</strong> <strong>the</strong> <strong>Chief</strong><br />
<strong>Financial</strong> <strong>Office</strong>r’s website.<br />
Major Baseline Adjustments, Cost Savings and Policy Initiatives<br />
Policy Initiative: Given projected labor market trends and unemployment compensation benefits, <strong>the</strong> proposed<br />
budget increases budget authority for <strong>the</strong> Unemployment Insurance Trust Fund by $71,000,000.<br />
FY 2009 Approved <strong>Budget</strong> to FY 2010 Proposed <strong>Budget</strong>, by Revenue Type<br />
Table UI0-4 itemizes <strong>the</strong> changes by revenue type between <strong>the</strong> FY 2009 approved budget and <strong>the</strong> FY 2010 proposed<br />
budget. The four categories <strong>of</strong> changes reflected in this table are: (1) changes to <strong>the</strong> baseline budget (includes<br />
agency request), (2) changes representing cost savings or efficiencies, (3) changes related to policy initiatives, and (4)<br />
changes to specifically address <strong>the</strong> projected revenue shortfall.<br />
Table UI0-4<br />
(dollars in thousands)<br />
PROGRAM BUDGET FTE<br />
SPECIAL PURPOSE REVENUE FUNDS: FY 2009 Approved <strong>Budget</strong> and FTE 180,000 0.0<br />
Policy Initiatives and Cost Savings<br />
Cost Increase - Cover higher benefit payments resulting from increases Unemployment Trust Fund 71,000 0.0<br />
in <strong>the</strong> unemployment rate and <strong>the</strong> average duration <strong>of</strong> unemployment<br />
SPECIAL PURPOSE REVENUE FUNDS: FY 2010 Proposed <strong>Budget</strong> and FTE 251,000 0.0<br />
Gross for UI0 - Unemployment Insurance Trust Fund 251,000 0.0<br />
Unemployment Insurance Trust Fund<br />
H-65
Housing Production Trust Fund<br />
www.dhcd.dc.gov<br />
Telephone: 202-442-7200<br />
(UZ0)<br />
% Change<br />
FY 2008 FY 2009 FY 2010 from<br />
Description Actual Approved Proposed FY 2009<br />
Operating <strong>Budget</strong> $114,979,281 $108,679,538 $51,328,694 -52.8<br />
FTEs 8.0 18.0 18.0 0.0<br />
The mission <strong>of</strong> <strong>the</strong> Housing Production Trust Fund (HPTF) is to provide<br />
financial assistance to a variety <strong>of</strong> affordable housing programs<br />
and opportunities across <strong>the</strong> District <strong>of</strong> Columbia. The HPTF funds<br />
initiatives to build affordable rental housing, preserve expiring federalassisted<br />
housing, and help provide affordable homeownership opportunities<br />
for low-income families.<br />
The agency’s FY 2010 proposed budget is presented in <strong>the</strong> following tables:<br />
FY 2010 Proposed Gross Funds Operating <strong>Budget</strong>, by Revenue Type<br />
Table UZ0-1 contains <strong>the</strong> proposed FY 2010 agency budget compared to <strong>the</strong> FY 2009 approved budget. It also<br />
provides FY 2007 and FY 2008 actual expenditures.<br />
Table UZ0-1<br />
(dollars in thousands)<br />
Actual Actual Approved Proposed<br />
Change<br />
from Percent<br />
Appropriated Fund<br />
General Fund<br />
FY 2007 FY 2008 FY 2009 FY 2010 FY 2009 Change<br />
Local Funds 0 30,304 0 0 0 N/A<br />
Dedicated Taxes 69,742 84,675 108,680 51,329 -57,351 -52.8<br />
Total for General Fund 69,742 114,979 108,680 51,329 -57,351 -52.8<br />
Gross Funds<br />
*Percent Change is based on whole dollars.<br />
69,742 114,979 108,680 51,329 -57,351 -52.8<br />
Note: If applicable, for a breakdown <strong>of</strong> each Grant (Federal and Private), Special Purpose Revenue type and Intra-District agreement,<br />
please refer to Schedule 80, <strong>Agency</strong> Summary by Revenue Source, in <strong>the</strong> Operating Appendices located on <strong>the</strong> <strong>Office</strong> <strong>of</strong> <strong>the</strong> <strong>Chief</strong><br />
<strong>Financial</strong> <strong>Office</strong>r’s website.<br />
Housing Production Trust Fund<br />
H-67
FY 2010 Proposed Full-Time Equivalents, by Revenue Type<br />
Table UZ0-2 contains <strong>the</strong> proposed FY 2010 FTE level compared to <strong>the</strong> FY 2009 approved FTE level by revenue<br />
type. It also provides FY 2007 and FY 2008 actual data.<br />
Table UZ0-2<br />
Change<br />
Actual Actual Approved Proposed from Percent<br />
Appropriated Fund FY 2007 FY 2008 FY 2009 FY 2010 FY 2009 Change<br />
General Fund<br />
Dedicated Taxes 0.0 8.0 18.0 18.0 0.0 0.0<br />
Total for General Fund 0.0 8.0 18.0 18.0 0.0 0.0<br />
Total Proposed FTEs 0.0 8.0 18.0 18.0 0.0 0.0<br />
FY 2010 Proposed Operating <strong>Budget</strong>, by Comptroller Source Group<br />
Table UZ0-3 contains <strong>the</strong> proposed FY 2010 budget at <strong>the</strong> Comptroller Source Group (object class) level compared<br />
to <strong>the</strong> FY 2009 approved budget. It also provides FY 2007 and FY 2008 actual expenditures.<br />
Table UZ0-3<br />
(dollars in thousands)<br />
Actual Actual Approved Proposed<br />
Change<br />
from Percent<br />
Comptroller Source Group FY 2007 FY 2008 FY 2009 FY 2010 FY 2009 Change*<br />
11 Regular Pay - Cont Full Time 66 727 1,409 1,734 325 23.1<br />
12 Regular Pay - O<strong>the</strong>r 343 29 0 0 0 N/A<br />
13 Additional Gross Pay 0 42 10 26 16 155.4<br />
14 Fringe Benefits - Curr Personnel 75 127 208 256 48 23.1<br />
15 Overtime Pay 0 7 0 11 11 N/A<br />
Subtotal Personal Services (PS) 484 931 1,626 2,025 399 24.5<br />
20 Supplies and Materials 0 0 2 21 19 958.3<br />
30 Energy, Comm. and Bldg Rentals 0 0 2 0 -2 -100.0<br />
31 Telephone, Telegraph, Telegram, Etc 0 0 27 0 -27 -100.0<br />
32 Rentals - Land and Structures 0 0 205 0 -205 -100.0<br />
33 Janitorial Services 0 0 2 0 -2 -100.0<br />
34 Security Services 0 0 8 0 -8 -100.0<br />
40 O<strong>the</strong>r Services and Charges 0 49 9 140 131 1,536.6<br />
41 Contractual Services - O<strong>the</strong>r 652 235 2,119 2,574 456 21.5<br />
50 Subsidies and Transfers 68,606 113,765 104,678 46,535 -58,143 -55.5<br />
70 Equipment & Equipment Rental 0 0 2 34 32 1,637.9<br />
Subtotal Nonpersonal Services (NPS) 69,258 114,048 107,053 49,303 -57,750 -53.9<br />
Gross Funds 69,742 114,979 108,680 51,329 -57,351 -52.8<br />
*Percent Change is based on whole dollars.<br />
FY 2010 Proposed <strong>Budget</strong> and <strong>Financial</strong> Plan<br />
H-68
Program Description<br />
The Housing Production Trust Fund operates<br />
through <strong>the</strong> following program:<br />
Housing Production Trust Fund – provides financial<br />
assistance to a variety <strong>of</strong> affordable housing programs<br />
and opportunities across <strong>the</strong> District.<br />
This program contains <strong>the</strong> following 2 activities:<br />
■ Housing Production Trust Fund (Admin) – provides<br />
administrative services associated with <strong>the</strong><br />
operation <strong>of</strong> <strong>the</strong> Housing Production Trust Fund;<br />
and<br />
FY 2010 Proposed Operating <strong>Budget</strong> and FTEs, by Program and Activity<br />
■ Housing Production Trust Fund – provides<br />
financial assistance to promote and enable affordable<br />
rental housing and residential housing in <strong>the</strong><br />
District.<br />
Program Structure Change<br />
The Housing Production Trust Fund had no program<br />
structure changes in <strong>the</strong> FY 2010 Proposed<br />
<strong>Budget</strong>.<br />
Table UZ0-4 contains <strong>the</strong> proposed FY 2010 budget by program and activity compared to <strong>the</strong> FY 2009 approved budget.<br />
It also provides FY 2008 actual data.<br />
Table UZ0-4<br />
(dollars in thousands)<br />
Dollars in Thousands Full-Time Equivalents<br />
Change Change<br />
Actual Approved Proposed from Actual Approved Proposed from<br />
Program/Activity<br />
(1000) Housing Production Trust Fund<br />
FY 2008 FY 2009 FY 2010 FY 2009 FY 2008 FY 2009 FY 2010 FY 2009<br />
(1100) Housing Production Trust Fund (Admin.) 951 4,002 2,380 -1,622 8.0 18.0 18.0 0.0<br />
(1101) Housing Production Trust Fund 114,029 104,678 48,949 -55,729 0.0 0.0 0.0 0.0<br />
Subtotal (1000) Housing Production Trust Fund 114,979 108,680 51,329 -57,351 8.0 18.0 18.0 0.0<br />
Total Proposed Operating <strong>Budget</strong> 114,979 108,680 51,329 -57,351 8.0 18.0 18.0 0.0<br />
(Change is calculated by whole numbers and numbers may not add up due to rounding)<br />
Note: For more detailed information regarding <strong>the</strong> proposed funding for <strong>the</strong> activities within this agency’s programs, please see Schedule 30-PBB<br />
Program Summary By Activity in <strong>the</strong> FY 2010 Operating Appendices located on <strong>the</strong> <strong>Office</strong> <strong>of</strong> <strong>the</strong> <strong>Chief</strong> <strong>Financial</strong> <strong>Office</strong>r’s website.<br />
Major Baseline Adjustments, Cost Savings<br />
and Policy Initiatives<br />
Initial Adjustments: The Housing Production Trust<br />
Fund had a reduction <strong>of</strong> $47,536,357 in subsidies<br />
and transfers due to revised revenue estimates.<br />
Cost Savings: A decrease <strong>of</strong> $10,973,000 in <strong>the</strong><br />
Housing Production Trust Fund (HPTF) reflects<br />
revised revenue estimates from Deed Recordation and<br />
Deed Transfer taxes in FY 2010. This reduction<br />
leaves <strong>the</strong> HPTF with $11,900,000 in new revenues<br />
and an estimated fund balance availability <strong>of</strong><br />
$39,428,694. Actual fund balance availability will<br />
depend on a number <strong>of</strong> factors, including FY 2009<br />
activity. Note that total estimated FY 2010<br />
Dedicated Deed Taxes are $17,900,000, <strong>of</strong> which<br />
$6,000,000 is budgeted for Debt Service on borrowings<br />
against future revenues for New Communities<br />
projects.<br />
Housing Production Trust Fund<br />
H-69
Policy Initiatives: This proposed budget and subtitle<br />
<strong>of</strong> <strong>the</strong> <strong>Budget</strong> Support Act amends <strong>the</strong> Housing<br />
Production Trust Fund Act to change <strong>the</strong> fund’s<br />
administrative cap from 5 percent to 10 percent in<br />
order to appropriately allocate <strong>the</strong> administrative<br />
costs across various funding sources. Currently, <strong>the</strong><br />
federal funding sources, in particular <strong>the</strong> Community<br />
Development Block Grant (CDBG) program, have a<br />
FY 2009 Approved <strong>Budget</strong> to FY 2010 Proposed <strong>Budget</strong>, by Revenue Type<br />
Table UZ0-5 itemizes <strong>the</strong> changes by revenue type between <strong>the</strong> FY 2009 approved budget and <strong>the</strong> FY 2010 proposed<br />
budget. The four categories <strong>of</strong> changes reflected in this table are: (1) changes to <strong>the</strong> baseline budget (includes<br />
agency request), (2) changes representing cost savings or efficiencies, (3) changes related to policy initiatives, and (4)<br />
changes to specifically address <strong>the</strong> projected revenue shortfall.<br />
Table UZ0-5<br />
(dollars in thousands)<br />
PROGRAM BUDGET FTE<br />
DEDICATED TAXES: FY 2009 Approved <strong>Budget</strong> and FTE 108,680 18.0<br />
Initial and Baseline Adjustments<br />
Net effect <strong>of</strong> fixed cost adjustments - Revised fixed cost estimates for HPTF 283 0.0<br />
multiple commodities<br />
Net effect <strong>of</strong> salary and benefits changes - Revised personal services HPTF 399 0.0<br />
Intra-<strong>Agency</strong> changes - Increase in o<strong>the</strong>r services and charges HPTF 132 0.0<br />
Intra-<strong>Agency</strong> changes - Increase in contractual services HPTF 295 0.0<br />
Intra-<strong>Agency</strong> changes - Decrease in subsidies and transfers HPTF -47,536 0.0<br />
Intra-<strong>Agency</strong> changes - Increase in supplies HPTF 19 0.0<br />
Intra-<strong>Agency</strong> changes - Increase in equipment and equipment rentals HPTF 32 0.0<br />
Baseline Adjustments: Net effect <strong>of</strong> fixed cost adjustments - Revised HPTF -527 0.0<br />
fixed cost estimates for multiple commodities<br />
Baseline Adjustments: Intra-<strong>Agency</strong> changes - Increase in subsidies and HPTF 527 0.0<br />
transfers due to revised fixed cost estimates<br />
Policy Initiatives and Cost Savings<br />
Reduce - Adjust HPTF budget to reflect revised FY 2010 revenue HPTF -10,973 0.0<br />
estimates from deed recordation and transfer taxes, partially<br />
<strong>of</strong>fset by additional estimated fund balance availability<br />
DEDICATED TAXES: FY 2010 Proposed <strong>Budget</strong> and FTE 51,329 18.0<br />
Gross for UZ0 - Housing Production Trust Fund 51,329 18.0<br />
FY 2010 Proposed <strong>Budget</strong> and <strong>Financial</strong> Plan<br />
H-70<br />
disproportionate share <strong>of</strong> <strong>the</strong> administrative costs for<br />
housing and community development. Moving forward,<br />
HPTF is required to pay for its appropriate<br />
share <strong>of</strong> <strong>the</strong> administrative costs for housing and community<br />
development under federal entitlement funds<br />
regulations, which require jurisdictions to develop a<br />
cost allocation up to 20 percent for charging non-federal<br />
costs to non-federal funding sources.
(TX0)<br />
Tax Increment Financing (TIF) Program<br />
% Change<br />
FY 2008 FY 2009 FY 2010 from<br />
Description Actual Approved Proposed FY 2009<br />
Operating <strong>Budget</strong> $17,550,555 $24,330,000 $32,105,844 32.0<br />
Tax Increment Financing (TIF) is a program through which <strong>the</strong><br />
District provides economic development project funds by borrowing<br />
against future tax receipts expected to be generated as a result <strong>of</strong> <strong>the</strong><br />
construction and operations <strong>of</strong> projects partially funded by <strong>the</strong>se<br />
funds.<br />
The agency’s FY 2010 proposed budget is presented in <strong>the</strong> following tables:<br />
FY 2010 Proposed Gross Funds Operating <strong>Budget</strong>, by Revenue Type<br />
Table TX0-1 contains <strong>the</strong> proposed FY 2010 agency budget compared to <strong>the</strong> FY 2009 approved budget. It also<br />
provides FY 2007 and FY 2008 actual expenditures.<br />
Table TX0-1<br />
(dollars in thousands)<br />
Actual Actual Approved Proposed<br />
Change<br />
from Percent<br />
Appropriated Fund<br />
General Fund<br />
FY 2007 FY 2008 FY 2009 FY 2010 FY 2009 Change*<br />
Special Purpose Revenue Funds 17,955 17,551 24,330 32,106 7,776 32.0<br />
Total for General Fund 17,955 17,551 24,330 32,106 7,776 32.0<br />
Gross Funds 17,955 17,551 24,330 32,106 7,776 32.0<br />
*Percent Change is based on whole dollars.<br />
Note: If applicable, for a breakdown <strong>of</strong> each Grant (Federal and Private), Special Purpose Revenue type and Intra-District agreement,<br />
please refer to Schedule 80 <strong>Agency</strong> Summary by Revenue Source in <strong>the</strong> Operating Appendices located on <strong>the</strong> <strong>Office</strong> <strong>of</strong> <strong>the</strong> <strong>Chief</strong><br />
<strong>Financial</strong> <strong>Office</strong>r’s website.<br />
Tax Increment Financing (TIF) Program<br />
H-71
FY 2010 Proposed Operating <strong>Budget</strong>, by Comptroller Source Group<br />
Table TX0-2 contains <strong>the</strong> proposed FY 2010 budget at <strong>the</strong> Comptroller Source group (object class) level compared<br />
to <strong>the</strong> FY 2009 approved budget. It also provides FY 2007 and FY 2008 actual expenditures.<br />
Table TX0-2<br />
(dollars in thousands)<br />
Actual Actual Approved Proposed<br />
Change<br />
from Percent<br />
Comptroller Source Group FY 2007 FY 2008 FY 2009 FY 2010 FY 2009 Change*<br />
50 Subsidies and Transfers 8,247 7,839 0 0 0 N/A<br />
80 Debt Service 9,708 9,712 24,330 32,106 7,776 32.0<br />
Subtotal Nonpersonal Services (NPS) 17,955 17,551 24,330 32,106 7,776 32.0<br />
Gross Funds 17,955 17,551 24,330 32,106 7,776 32.0<br />
*Percent Change is based on whole dollars.<br />
Program Description<br />
Tax Increment Financing operates through <strong>the</strong><br />
following program:<br />
Tax Increment Financing - provides budget<br />
authority pursuant to <strong>the</strong> Tax Increment<br />
Financing Act <strong>of</strong> 1998, which established a TIF<br />
program and authorized <strong>the</strong> issuance <strong>of</strong> up to<br />
$300 million in debt to support economic development<br />
projects that would not be developed<br />
"but for" public financial assistance. The initiative<br />
was reauthorized by <strong>the</strong> Tax Increment<br />
Financing Reauthorization Act <strong>of</strong> 2002, which<br />
included an increase in TIF authority to a total <strong>of</strong><br />
$500 million. In addition, <strong>the</strong> District Council<br />
can approve o<strong>the</strong>r project-based tax-supported<br />
revenue bonds, including Tax Increment<br />
Financings, outside <strong>the</strong> scope <strong>of</strong> <strong>the</strong> TIF Act.<br />
The program contains <strong>the</strong> following projects:<br />
■ Gallery Place - a mixed-use project that<br />
opened in <strong>the</strong> summer <strong>of</strong> 2004 and has an<br />
estimated debt service payment <strong>of</strong><br />
$5,206,000;<br />
■ The Mandarin Oriental Hotel - opened in<br />
March 2004 and has an estimated debt service<br />
payment <strong>of</strong> $4,504,000;<br />
■ Verizon Center – provides debt services assistance<br />
for improvements to be repaid using an<br />
incremental tax <strong>of</strong> 4.25 percent on merchandise<br />
sold and tickets for events at <strong>the</strong> venue<br />
FY 2010 Proposed <strong>Budget</strong> and <strong>Financial</strong> Plan<br />
H-72<br />
and has an estimated debt service payment <strong>of</strong><br />
$3,357,000;<br />
■ D.C. USA - a retail development project that<br />
opened in March <strong>of</strong> 2008. The District<br />
financed a publicly owned garage and has an<br />
estimated debt service payment <strong>of</strong><br />
$3,290,000;<br />
■ The Embassy Suites Hotel - opened in FY<br />
2005 and has an estimated debt service payment<br />
<strong>of</strong> $1,230,000;<br />
■ Capitol Hill Towers - a housing, hotel, retail,<br />
and parking development project that has an<br />
estimated debt service payment <strong>of</strong> $935,000;<br />
and<br />
■ Special Retail – smaller TIF financings issued<br />
under a special retail TIF program in <strong>the</strong><br />
downtown area. Estimated debt service payments<br />
for <strong>the</strong>se projects in 2010 are: West<br />
Elm - $657,000; Zara - $228,000; Madame<br />
Toussauds - $162,000; National Crime and<br />
Punishment Museum - $390,000; and H&M<br />
- $435,000.<br />
The Shakespeare Theatre TIF note requires no debt<br />
service in 2010; it will not pay debt service until 2011.<br />
Some <strong>of</strong> <strong>the</strong> projects include a provision that requires<br />
<strong>the</strong> District to make repayments from General Fund<br />
revenues if TIF revenues are less than <strong>the</strong> debt service
obligations. Ra<strong>the</strong>r than budget a reserve in Local<br />
funds, <strong>the</strong> District has obtained language in its<br />
Appropriations Act allowing it to appropriate an additional<br />
amount from its fund balance to make any<br />
required repayment.<br />
For certain projects, a revenue contingency <strong>of</strong><br />
$5,713,000 is budgeted in <strong>the</strong> event that revenues<br />
collected are higher than anticipated and must be paid<br />
out in accordance with <strong>the</strong> bond agreements.<br />
FY 2010 Proposed Operating <strong>Budget</strong> and FTEs, by Program and Activity<br />
Table TX0-3 contains <strong>the</strong> proposed FY 2010 budget by program and activity compared to <strong>the</strong> FY 2009 approved budget.<br />
It also provides <strong>the</strong> FY 2008 actual data.<br />
Table TX0-3<br />
(dollars in thousands)<br />
Dollars in Thousands Full-Time Equivalents<br />
Change Change<br />
Actual Approved Proposed from Actual Approved Proposed from<br />
Program/Activity FY 2008 FY 2009 FY 2010 FY 2009 FY 2008 FY 2009 FY 2010 FY 2009<br />
(1000) Tax Increment Financing (TIF) Program<br />
(1100) Tax Increment Financing (TIF) Program 17,551 24,330 32,106 7,776 0.0 0.0 0.0 0.0<br />
Subtotal (1000) Tax Increment Financing (TIF) Program 17,551 24,330 32,106 7,776 0.0 0.0 0.0 0.0<br />
Total Proposed Operating <strong>Budget</strong> 17,551 24,330 32,106 7,776 0.0 0.0 0.0 0.0<br />
(Change is calculated by whole numbers and numbers may not add up due to rounding)<br />
In addition, a total <strong>of</strong> $86,150,000 <strong>of</strong> debt<br />
issuance has been authorized for <strong>the</strong> Great Streets<br />
and Convention Center Hotel TIF projects, and<br />
<strong>the</strong> budget includes an estimate <strong>of</strong> $3,730,000 <strong>of</strong><br />
debt service for debt which may be issued during<br />
FY 2009 or FY 2010.<br />
Program Structure Change<br />
Tax Increment Financing had no program structure<br />
changes in <strong>the</strong> FY 2010 Proposed <strong>Budget</strong>.<br />
Note: For more detailed information regarding <strong>the</strong> proposed funding for <strong>the</strong> activities within this agency’s programs, please see<br />
Schedule 30-PBB, Program Summary by Activity, in <strong>the</strong> FY 2010 Operating Appendices located on <strong>the</strong> <strong>Office</strong> <strong>of</strong> <strong>the</strong> <strong>Chief</strong><br />
<strong>Financial</strong> <strong>Office</strong>r’s website.<br />
Tax Increment Financing (TIF) Program<br />
H-73
Major Baseline Adjustments, Cost Savings<br />
and Policy Initiatives<br />
Initial Adjustments: The Tax Increment Financing<br />
budget increased by $25,892,047 due to higher debt<br />
service payment costs, additional projects in <strong>the</strong> program,<br />
and <strong>the</strong> inclusion <strong>of</strong> contingency funding.<br />
Cost Savings: The budget was reduced by<br />
$11,335,047 to align with <strong>the</strong> actual level <strong>of</strong> expected<br />
revenues for <strong>the</strong> program.<br />
FY 2009 Approved <strong>Budget</strong> to FY 2010 Proposed <strong>Budget</strong>, by Revenue Type<br />
Table TX0-4 itemizes <strong>the</strong> changes by revenue type between <strong>the</strong> FY 2009 approved budget and <strong>the</strong> FY 2010 proposed<br />
budget. The four categories <strong>of</strong> changes reflected in this table are: (1) changes to <strong>the</strong> baseline budget (includes<br />
agency request), (2) changes representing cost savings or efficiencies, (3) changes related to policy initiatives, and (4)<br />
changes to specifically address <strong>the</strong> projected revenue shortfall.<br />
Table TX0-4<br />
(dollars in thousands)<br />
PROGRAM BUDGET FTE<br />
SPECIAL PURPOSE REVENUE FUNDS: FY 2009 Approved <strong>Budget</strong> and FTE 24,330 0.0<br />
Initial and Baseline Adjustments<br />
Programmatic increase - An increase due to <strong>the</strong> addition <strong>of</strong> new Tax Increment Financing (TIF) 25,892 0.0<br />
projects and <strong>the</strong> provision <strong>of</strong> contingency funding Program<br />
Policy Initiatives and Cost Savings<br />
Correction to align budget with expected revenues Tax Increment Financing (TIF) -11,335 0.0<br />
Program<br />
Gap-Closing Initiatives<br />
Policy initiative - An increase due to <strong>the</strong> inclusion <strong>of</strong> <strong>the</strong> Tax Increment Financing (TIF) 950 0.0<br />
future Convention Center Hotel bond issuance Program<br />
Gap closing - Portion <strong>of</strong> future Great Streets Tax Increment Financing (TIF) -9,800 0.0<br />
bond issuance rescinded Program<br />
Policy initiative - An increase in contingency funding Tax Increment Financing (TIF) 2,069 0.0<br />
Program<br />
SPECIAL PURPOSE REVENUE FUNDS: FY 2010 Proposed <strong>Budget</strong> and FTE 32,106 0.0<br />
Gross for TX0 - Tax Increment Financing (TIF) Program 32,106 0.0<br />
FY 2010 Proposed <strong>Budget</strong> and <strong>Financial</strong> Plan<br />
H-74<br />
Gap-Closing Initiatives: The proposed budget will<br />
reduce <strong>the</strong> future reservation <strong>of</strong> Great Streets borrowing<br />
costs by $9,800,000. The proposed budget will<br />
also include a total <strong>of</strong> $3,019,000 for TIF contingency<br />
and <strong>the</strong> future reservation <strong>of</strong> <strong>the</strong> proposed<br />
Convention Center Hotel borrowing costs.
Ballpark Revenue Fund<br />
(BK0)<br />
% Change<br />
FY 2008 FY 2009 FY 2010 from<br />
Description Actual Approved Proposed FY 2009<br />
Operating <strong>Budget</strong> $110,774,918 $76,755,000 $67,572,000 -12.0<br />
The Ballpark Revenue Fund is a non-lapsing special fund to pay certain<br />
costs <strong>of</strong> <strong>the</strong> development, construction, and renovation <strong>of</strong> a stadium<br />
that has as its primary purpose <strong>the</strong> hosting <strong>of</strong> pr<strong>of</strong>essional athletic<br />
events in <strong>the</strong> District. The Ballpark Omnibus Financing and Revenue<br />
Act <strong>of</strong> 2004 created <strong>the</strong> Fund. The District <strong>of</strong> Columbia owns <strong>the</strong> stadium.<br />
The agency’s FY 2010 proposed budget is presented in <strong>the</strong> following tables:<br />
FY 2010 Proposed Gross Funds Operating <strong>Budget</strong>, by Revenue Type<br />
Table BK0-1 contains <strong>the</strong> proposed FY 2010 agency budget compared to <strong>the</strong> FY 2009 approved budget. It also<br />
provides <strong>the</strong> FY 2007 and FY 2008 actual expenditures.<br />
Table BK0-1<br />
(dollars in thousands)<br />
Actual Actual Approved Proposed<br />
Change<br />
from Percent<br />
Appropriated Fund<br />
General Fund<br />
FY 2007 FY 2008 FY 2009 FY 2010 FY 2009 Change*<br />
Local Funds 449 0 3,382 0 -3,382 -100.0<br />
Dedicated Taxes 76,266 110,775 65,873 59,572 -6,301 -9.6<br />
Special Purpose Revenue Funds 0 0 7,500 8,000 500 6.7<br />
Total for General Fund 76,715 110,775 76,755 67,572 -9,183 -12.0<br />
Gross Funds 76,715 110,775 76,755 67,572 -9,183 -12.0<br />
*Percent Change is based on whole dollars.<br />
Note: If applicable, for a breakdown <strong>of</strong> each Grant (Federal and Private), Special Purpose Revenue type and Intra-District agreement, please refer to Schedule 80, <strong>Agency</strong> Summary by<br />
Revenue Source, in <strong>the</strong> Operating Appendices located on <strong>the</strong> <strong>Office</strong> <strong>of</strong> <strong>the</strong> <strong>Chief</strong> <strong>Financial</strong> <strong>Office</strong>r’s website.<br />
Ballpark Revenue Fund<br />
H-75
FY 2010 Proposed Operating <strong>Budget</strong>, by Comptroller Source Group<br />
Table BK0-2 contains <strong>the</strong> proposed FY 2010 budget at <strong>the</strong> Comptroller Source Group (object class) level compared<br />
to <strong>the</strong> FY 2009 approved budget. It also provides FY 2007 and FY 2008 actual expenditures.<br />
Table BK0-2<br />
(dollars in thousands)<br />
Actual Actual Approved Proposed<br />
Change<br />
from Percent<br />
Comptroller Source Group FY 2007 FY 2008 FY 2009 FY 2010 FY 2009 Change*<br />
50 Subsidies and Transfers 42,322 80,722 55,485 35,723 -19,762 -35.6<br />
80 Debt Service 34,392 30,053 21,270 31,849 10,579 49.7<br />
Subtotal Nonpersonal Services (NPS) 76,715 110,775 76,755 67,572 -9,183 -12.0<br />
Gross Funds 76,715 110,775 76,755 67,572 -9,183 -12.0<br />
*Percent Change is based on whole dollars.<br />
Program Description<br />
The Ballpark Revenue Fund operates through <strong>the</strong> following<br />
2 programs:<br />
<strong>Office</strong> <strong>of</strong> <strong>the</strong> <strong>Chief</strong> <strong>Financial</strong> <strong>Office</strong>r - provides for<br />
<strong>the</strong> collection <strong>of</strong> applicable taxes related to baseball in<br />
<strong>the</strong> District, including a ballpark fee on businesses<br />
within <strong>the</strong> District with over $5 million in gross<br />
receipts, a sales tax at <strong>the</strong> point <strong>of</strong> sale on tickets <strong>of</strong><br />
admission to certain events at <strong>the</strong> ballpark, a sales tax<br />
on certain personal property and services at <strong>the</strong> ballpark,<br />
a sales tax on food and beverages, a tax on parking<br />
at <strong>the</strong> ballpark, funding from <strong>the</strong> team to cover<br />
certain costs outside <strong>of</strong> <strong>the</strong> original stadium construction<br />
agreement as well as annualized lease payments<br />
to occupy <strong>the</strong> new baseball stadium, and a utility tax<br />
collected from non-residential users.<br />
FY 2010 Proposed <strong>Budget</strong> and <strong>Financial</strong> Plan<br />
H-76<br />
Capital Project – Ballpark - provides for anticipated<br />
monetary debt service payments related to <strong>the</strong> construction<br />
and ancillary long-term costs <strong>of</strong> <strong>the</strong> construction<br />
<strong>of</strong> <strong>the</strong> District’s baseball stadium. Revenue<br />
is collected from a ballpark fee on businesses within<br />
<strong>the</strong> District with over $5 million in gross receipts as<br />
well as from o<strong>the</strong>r sources.<br />
For additional information regarding general<br />
fund transfer <strong>of</strong> dedicated taxes for baseball, please<br />
refer to <strong>the</strong> Baseball Transfer - Dedicated Taxes<br />
(BO0) chapter in this volume.<br />
Program Structure Change<br />
The Ballpark Revenue Fund had no program structure<br />
changes in <strong>the</strong> FY 2010 Proposed <strong>Budget</strong>.
FY 2010 Proposed Operating <strong>Budget</strong> and FTEs, by Program and Activity<br />
Table BK0-3 contains <strong>the</strong> proposed FY 2010 budget by program and activity compared to <strong>the</strong> FY 2009 approved budget.<br />
It also provides <strong>the</strong> FY 2008 actual data.<br />
Table BK0-3<br />
(dollars in thousands)<br />
Dollars in Thousands Full-Time Equivalents<br />
Change Change<br />
Actual Approved Proposed from Actual Approved Proposed from<br />
Program/Activity<br />
(4000) <strong>Office</strong> <strong>of</strong> <strong>Chief</strong> <strong>Financial</strong> <strong>Office</strong>r<br />
FY 2008 FY 2009 FY 2010 FY 2009 FY 2008 FY 2009 FY 2010 FY 2009<br />
(4100) <strong>Office</strong> <strong>of</strong> Finance & Treasury 80,034 0 4,000 4,000 0.0 0.0 0.0 0.0<br />
(4200) <strong>Office</strong> <strong>of</strong> Tax & Revenue 0 50,044 31,723 -18,321 0.0 0.0 0.0 0.0<br />
(4300) <strong>Office</strong> <strong>of</strong> Econ Develop Finance 688 5,441 0 -5,441 0.0 0.0 0.0 0.0<br />
Subtotal (4000) <strong>Office</strong> <strong>of</strong> <strong>Chief</strong> <strong>Financial</strong> <strong>Office</strong>r 80,722 55,485 35,723 -19,762 0.0 0.0 0.0 0.0<br />
(8000) Capital Project - Ballpark<br />
(8008) Baseball Debt Service 30,053 21,270 31,849 10,579 0.0 0.0 0.0 0.0<br />
Subtotal (8000) Capital Project - Ballpark 30,053 21,270 31,849 10,579 0.0 0.0 0.0 0.0<br />
Total Proposed Operating <strong>Budget</strong> 110,775 76,755 67,572 -9,183 0.0 0.0 0.0 0.0<br />
(Change is calculated by whole numbers and numbers may not add up due to rounding)<br />
Note: For more detailed information regarding <strong>the</strong> proposed funding for <strong>the</strong> activities within this agency’s programs, please see Schedule 30-PBB Program Summary by Activity in <strong>the</strong> FY 2010<br />
Operating Appendices located on <strong>the</strong> <strong>Office</strong> <strong>of</strong> <strong>the</strong> <strong>Chief</strong> <strong>Financial</strong> <strong>Office</strong>r’s website.<br />
Major Baseline Adjustments, Cost Savings and<br />
Policy Initiatives<br />
Initial adjustment: The Ballpark Revenue Fund<br />
increased by a net amount <strong>of</strong> $743,000 due to changes<br />
required to cover debt service payment costs and revenue<br />
from ballpark rent. The Local funds portion <strong>of</strong> <strong>the</strong> budget<br />
was eliminated, so <strong>the</strong> entire FY 2010 budget is in<br />
Dedicated Taxes and Special Purpose Revenue.<br />
Gap-Closing Initiatives: To align with certified revenues,<br />
<strong>the</strong> proposed budget is increased by<br />
$1,074,000. The proposed budget will transfer<br />
$11,000,000 in additional revenue from taxes related<br />
to baseball to <strong>the</strong> District’s General Fund..<br />
Ballpark Revenue Fund<br />
H-77
FY 2009 Approved <strong>Budget</strong> to FY 2010 Proposed <strong>Budget</strong>, by Revenue Type<br />
Table BK0-4 itemizes <strong>the</strong> changes by revenue type between <strong>the</strong> FY 2009 approved budget and <strong>the</strong> FY 2010 proposed<br />
budget. The four categories <strong>of</strong> changes reflected in this table are: (1) changes to <strong>the</strong> baseline budget (includes<br />
agency request), (2) changes representing cost savings or efficiencies, (3) changes related to policy initiatives, and (4)<br />
changes to specifically address <strong>the</strong> projected revenue shortfall.<br />
Table BK0-4<br />
(dollars in thousands)<br />
Program BUDGET FTE<br />
LOCAL FUND: FY 2009 Approved <strong>Budget</strong> and FTE 3,382 0.00<br />
Initial and Baseline Adjustments<br />
A decrease in <strong>the</strong> Local funds requirement for Subsidies and Transfers <strong>Office</strong> <strong>of</strong> <strong>Chief</strong> <strong>Financial</strong> <strong>Office</strong>r -1,691 0.0<br />
A decrease in <strong>the</strong> Local funds requirement for Debt Service costs Capital Project - Ballpark -1,691 0.0<br />
LOCAL FUND: FY 2010 Proposed <strong>Budget</strong> and FTE 0 0.0<br />
DEDICATED TAXES: FY 2009 Approved <strong>Budget</strong> and FTE 65,873 0.0<br />
Initial and Baseline Adjustments<br />
A decrease primarily due to a reduction in payments to property <strong>Office</strong> <strong>of</strong> <strong>Chief</strong> <strong>Financial</strong> <strong>Office</strong>r -8,395 0.0<br />
owners who were relocated from <strong>the</strong> Ballpark footprint, a reduction in<br />
Ballpark rent collections, and <strong>the</strong> transfer <strong>of</strong> funds to <strong>the</strong> Capital Project-<br />
Ballpark program<br />
An increase primarily due to <strong>the</strong> projected amount needed to cover Capital Project - Ballpark 12,020 0.0<br />
debt service costs and <strong>the</strong> transfer <strong>of</strong> funds from <strong>the</strong> <strong>Office</strong> <strong>of</strong> <strong>the</strong> <strong>Chief</strong><br />
<strong>Financial</strong> <strong>Office</strong>r program<br />
Gap Closing Initiatives<br />
Gap closing - Increase to match new certified revenues <strong>Office</strong> Of <strong>Chief</strong> <strong>Financial</strong> <strong>Office</strong>r 1,074 0.0<br />
Policy initiative - Transfer <strong>of</strong> additional revenue from taxes related to baseball <strong>Office</strong> Of <strong>Chief</strong> <strong>Financial</strong> <strong>Office</strong>r -11,000 0.0<br />
to <strong>the</strong> District’s General Fund<br />
DEDICATED TAXES: FY 2010 Proposed <strong>Budget</strong> and FTE 59,572 0.0<br />
SPECIAL PURPOSE REVENUE FUNDS: FY 2009 Approved <strong>Budget</strong> and FTE 7,500 0.0<br />
Initial and Baseline Adjustments<br />
An increase due to an increase in revenue from certain fees <strong>Office</strong> <strong>of</strong> <strong>Chief</strong> <strong>Financial</strong> <strong>Office</strong>r 250 0.0<br />
An increase due to an increase in revenue from certain fees Capital Project - Ballpark 250 0.0<br />
SPECIAL PURPOSE REVENUE FUNDS: FY 2010 Proposed <strong>Budget</strong> and FTE 8,000 0.0<br />
Gross for BK0 - Ballpark Revenue Fund 67,572 0.0<br />
FY 2010 Proposed <strong>Budget</strong> and <strong>Financial</strong> Plan<br />
H-78
Repayment <strong>of</strong> PILOT Financing<br />
(TY0)<br />
% Change<br />
FY 2008 FY 2009 FY 2010 from<br />
Description Actual Approved Proposed FY 2009<br />
Operating <strong>Budget</strong> $0 $9,770,000 $13,886,000 42.1<br />
Repayment <strong>of</strong> PILOT Financing is a program through which <strong>the</strong><br />
District pays debt service on borrowing against future receipts <strong>of</strong> a<br />
Payment-in Lieu-<strong>of</strong>-Taxes (PILOT). The District can encourage economic<br />
development by providing project grants from <strong>the</strong> proceeds <strong>of</strong><br />
such borrowing, with repayment to come from future payments by<br />
developers who have received <strong>the</strong> grants.<br />
The agency’s FY 2010 proposed budget is presented in <strong>the</strong> following tables:<br />
FY 2010 Proposed Gross Funds Operating <strong>Budget</strong>, by Revenue Type<br />
Table TY0-1 contains <strong>the</strong> proposed FY 2010 agency budget compared to <strong>the</strong> FY 2009 approved budget. It also<br />
provides <strong>the</strong> FY 2007 and FY 2008 actual expenditures.<br />
Table TY0-1<br />
(dollars in thousands)<br />
Actual Actual Approved Proposed<br />
Change<br />
from Percent<br />
Appropriated Fund<br />
General Fund<br />
FY 2007 FY 2008 FY 2009 FY 2010 FY 2009 Change*<br />
Special Purpose Revenue Funds 0 0 9,770 13,886 4,116 42.1<br />
Total for General Fund 0 0 9,770 13,886 4,116 42.1<br />
Gross Funds 0 0 9,770 13,886 4,116 42.1<br />
*Percent Change is based on whole dollars.<br />
Note: If applicable, for a breakdown <strong>of</strong> each Grant (Federal and Private), Special Purpose Revenue type and Intra-District agreement, please refer to Schedule 80, <strong>Agency</strong> Summary by<br />
Revenue Source, in <strong>the</strong> Operating Appendices located on <strong>the</strong> <strong>Office</strong> <strong>of</strong> <strong>the</strong> <strong>Chief</strong> <strong>Financial</strong> <strong>Office</strong>r’s website.<br />
Repayment <strong>of</strong> PILOT Financing<br />
H-79
FY 2010 Proposed Operating <strong>Budget</strong>, by Comptroller Source Group<br />
Table TY0-2 contains <strong>the</strong> proposed FY 2010 budget at <strong>the</strong> Comptroller Source group (object class) level compared<br />
to <strong>the</strong> FY 2009 approved budget. It also provides FY 2007 and FY 2008 actual expenditures.<br />
Table TY0-2<br />
(dollars in thousands)<br />
Actual Actual Approved Proposed<br />
Change<br />
from Percent<br />
Comptroller Source Group FY 2007 FY 2008 FY 2009 FY 2010 FY 2009 Change*<br />
80 Debt Service 0 0 9,770 13,886 4,116 42.1<br />
Subtotal Nonpersonal Services (NPS) 0 0 9,770 13,886 4,116 42.1<br />
Gross Funds 0 0 9,770 13,886 4,116 42.1<br />
*Percent Change is based on whole dollars.<br />
Program Description<br />
Repayment <strong>of</strong> PILOT Financing operates through<br />
<strong>the</strong> following program:<br />
Repayment <strong>of</strong> PILOT Financing - provides budget<br />
authority for debt borrowed against <strong>the</strong> U.S.<br />
Department <strong>of</strong> Transportation headquarters building<br />
PILOT to support District park and infrastructure<br />
improvements in <strong>the</strong> Anacostia Waterfront Initiative<br />
area.<br />
A PILOT payment on debt issued under <strong>the</strong><br />
District’s PILOT Act equals <strong>the</strong> amount <strong>the</strong> property<br />
owner would o<strong>the</strong>rwise pay in property taxes, based<br />
on <strong>the</strong> assessed value <strong>of</strong> <strong>the</strong> property. The repayment<br />
<strong>of</strong> <strong>the</strong> borrowing against this future PILOT revenue is<br />
budgeted in this program. Such borrowing is similar<br />
in concept to Tax Increment Financing, in which <strong>the</strong><br />
District borrows against future tax receipts and uses<br />
<strong>the</strong> proceeds to spur economic development.<br />
FY 2010 Proposed <strong>Budget</strong> and <strong>Financial</strong> Plan<br />
H-80<br />
The debt service payment in FY 2010 is estimated<br />
to be $13,100,000. A revenue contingency <strong>of</strong><br />
$786,000 is budgeted in <strong>the</strong> event that revenues collected<br />
are higher than anticipated and must be paid<br />
out in accordance with <strong>the</strong> bond agreements.<br />
Program Structure Change<br />
Repayment <strong>of</strong> PILOT Financing had no program<br />
structure changes in <strong>the</strong> FY 2010 Proposed <strong>Budget</strong>.
FY 2010 Proposed Operating <strong>Budget</strong> and FTEs, by Program and Activity<br />
Table TY0-3 contains <strong>the</strong> proposed FY 2010 budget by program and activity compared to <strong>the</strong> FY 2009 approved budget.<br />
It also provides <strong>the</strong> FY 2008 actual data.<br />
Table TY0-3<br />
(dollars in thousands)<br />
Dollars in Thousands Full-Time Equivalents<br />
Change Change<br />
Actual Approved Proposed from Actual Approved Proposed from<br />
Program/Activity FY 2008 FY 2009 FY 2010 FY 2009 FY 2008 FY 2009 FY 2010 FY 2009<br />
(1000) Repayment <strong>of</strong> PILOT Financing<br />
(1100) Repayment <strong>of</strong> PILOT Financing 0 9,770 13,886 4,116 0.0 0.0 0.0 0.0<br />
Subtotal (1000) Repayment <strong>of</strong> PILOT Financing 0 9,770 13,886 4,116 0.0 0.0 0.0 0.0<br />
Total Proposed Operating <strong>Budget</strong> 0 9,770 13,886 4,116 0.0 0.0 0.0 0.0<br />
(Change is calculated by whole numbers and numbers may not add up due to rounding)<br />
Note: For more detailed information regarding <strong>the</strong> proposed funding for <strong>the</strong> activities within this agency’s programs, please see Schedule 30-PBB Program Summary By Activity in <strong>the</strong> FY 2010<br />
Operating Appendices located on <strong>the</strong> <strong>Office</strong> <strong>of</strong> <strong>the</strong> <strong>Chief</strong> <strong>Financial</strong> <strong>Office</strong>r’s website.<br />
Major Baseline Adjustments, Cost Savings,<br />
and Policy Initiatives<br />
Initial Adjustment - The Repayment <strong>of</strong> PILOT<br />
Financing budget increased by $1,566,000 due to<br />
higher debt service payment costs and <strong>the</strong> inclusion <strong>of</strong><br />
contingency funding.<br />
FY 2009 Approved <strong>Budget</strong> to FY 2010 Proposed <strong>Budget</strong>, by Revenue Type<br />
Table TY0-4 itemizes <strong>the</strong> changes by revenue type between <strong>the</strong> FY 2009 approved budget and <strong>the</strong> FY 2010 proposed<br />
budget. The four categories <strong>of</strong> changes reflected in this table are: (1) changes to <strong>the</strong> baseline budget (includes<br />
agency request), (2) changes representing cost savings or efficiencies, (3) changes related to policy initiatives, and (4)<br />
changes to specifically address <strong>the</strong> projected revenue shortfall.<br />
Table TY0-4<br />
(dollars in thousands)<br />
Gap-Closing Initiative - The proposed budget will<br />
include a total <strong>of</strong> $2,550,000 in Special Purpose<br />
Revenue Funds for <strong>the</strong> future reservation <strong>of</strong> <strong>the</strong> proposed<br />
Capper Carrollsburg project borrowing costs.<br />
PROGRAM BUDGET FTE<br />
SPECIAL PURPOSE REVENUE FUNDS: FY 2009 Approved <strong>Budget</strong> and FTE<br />
Initial and Baseline Adjustments<br />
9,770 0.0<br />
Programmatic increase - An increase due to <strong>the</strong> USDOT PILOT<br />
payment for certain improvements as part <strong>of</strong> <strong>the</strong> Anacostia Waterfront<br />
Initiative and revenue contingency<br />
Repayment <strong>of</strong> PILOT Financing 1,566 0.0<br />
Gap Closing Initiative<br />
Policy initiative - An increase due to <strong>the</strong> inclusion <strong>of</strong> <strong>the</strong> future Capper Repayment <strong>of</strong> PILOT Financing 2,550 0.0<br />
Carrollsburg costs<br />
SPECIAL PURPOSE REVENUE FUNDS: FY 2010 Proposed <strong>Budget</strong> and FTE 13,886 0.0<br />
Gross for TY0 - Repayment <strong>of</strong> PILOT Financing 13,886 0.0<br />
Repayment <strong>of</strong> PILOT Financing<br />
H-81
The GovernmenT <strong>of</strong> The DiSTriCT <strong>of</strong> ColumbiA<br />
<strong>Office</strong> <strong>of</strong> <strong>the</strong> <strong>Chief</strong> <strong>Financial</strong> <strong>Office</strong>r<br />
<strong>Office</strong> <strong>of</strong> <strong>Budget</strong> and Planning<br />
1350 Pennsylvania Avenue, Suite 229<br />
Washington, DC 20004<br />
202.727.6343 fax 202.727.1400<br />
www.cfo.dc.gov<br />
www.dc.gov<br />
Cover photo by: Ernest Grant, OCFO’s <strong>Office</strong> <strong>of</strong> Communications