

Research Article
Research Article
Research Article

Create successful ePaper yourself
Turn your PDF publications into a flip-book with our unique Google optimized e-Paper software.
1794<br />
B/B 0<br />
0.8<br />
0.7<br />
0.6<br />
0.5<br />
0.4<br />
0.3<br />
0.2<br />
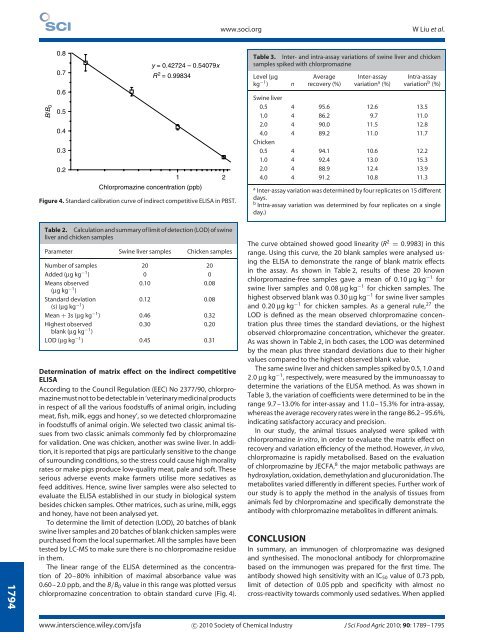
y = 0.42724 – 0.54079x<br />
R 2 = 0.99834<br />
Chlorpromazine concentration (ppb)<br />
Figure 4. Standard calibration curve of indirect competitive ELISA in PBST.<br />
Table 2. Calculation and summary of limit of detection (LOD) of swine<br />
liver and chicken samples<br />
Parameter Swine liver samples Chicken samples<br />
Number of samples 20 20<br />
Added (µgkg−1 ) 0 0<br />
Means observed<br />
(µgkg−1 )<br />
0.10 0.08<br />
Standard deviation<br />
(s) (µgkg−1 )<br />
0.12 0.08<br />
Mean + 3s (µgkg−1 ) 0.46 0.32<br />
Highest observed<br />
blank (µgkg−1 )<br />
0.30 0.20<br />
LOD (µgkg−1 ) 0.45 0.31<br />
Determination of matrix effect on the indirect competitive<br />
ELISA<br />
According to the Council Regulation (EEC) No 2377/90, chlorpromazine<br />
must not to be detectable in ‘veterinary medicinal products<br />
in respect of all the various foodstuffs of animal origin, including<br />
meat, fish, milk, eggs and honey’, so we detected chlorpromazine<br />
in foodstuffs of animal origin. We selected two classic animal tissues<br />
from two classic animals commonly fed by chlorpromazine<br />
for validation. One was chicken, another was swine liver. In addition,<br />
it is reported that pigs are particularly sensitive to the change<br />
of surrounding conditions, so the stress could cause high morality<br />
rates or make pigs produce low-quality meat, pale and soft. These<br />
serious adverse events make farmers utilise more sedatives as<br />
feed additives. Hence, swine liver samples were also selected to<br />
evaluate the ELISA established in our study in biological system<br />
besides chicken samples. Other matrices, such as urine, milk, eggs<br />
and honey, have not been analysed yet.<br />
To determine the limit of detection (LOD), 20 batches of blank<br />
swine liver samples and 20 batches of blank chicken samples were<br />
purchased from the local supermarket. All the samples have been<br />
tested by LC-MS to make sure there is no chlorpromazine residue<br />
in them.<br />
The linear range of the ELISA determined as the concentration<br />
of 20–80% inhibition of maximal absorbance value was<br />
0.60–2.0 ppb, and the B/B0 valueinthisrangewasplottedversus<br />
chlorpromazine concentration to obtain standard curve (Fig. 4).<br />
1<br />
www.soci.org W Liu et al.<br />
2<br />
Table 3. Inter- and intra-assay variations of swine liver and chicken<br />
samples spiked with chlorpromazine<br />
Level (µg<br />
kg −1 ) n<br />
Average<br />
recovery (%)<br />
Inter-assay<br />
variation a (%)<br />
Intra-assay<br />
variation b (%)<br />
Swine liver<br />
0.5 4 95.6 12.6 13.5<br />
1.0 4 86.2 9.7 11.0<br />
2.0 4 90.0 11.5 12.8<br />
4.0 4 89.2 11.0 11.7<br />
Chicken<br />
0.5 4 94.1 10.6 12.2<br />
1.0 4 92.4 13.0 15.3<br />
2.0 4 88.9 12.4 13.9<br />
4.0 4 91.2 10.8 11.3<br />
a Inter-assay variation was determined by four replicates on 15 different<br />
days.<br />
b Intra-assay variation was determined by four replicates on a single<br />
day.)<br />
The curve obtained showed good linearity (R 2 = 0.9983) in this<br />
range. Using this curve, the 20 blank samples were analysed using<br />
the ELISA to demonstrate the range of blank matrix effects<br />
in the assay. As shown in Table 2, results of these 20 known<br />
chlorpromazine-free samples gave a mean of 0.10 µgkg −1 for<br />
swine liver samples and 0.08 µg kg −1 for chicken samples. The<br />
highest observed blank was 0.30 µgkg −1 for swine liver samples<br />
and 0.20 µgkg −1 for chicken samples. As a general rule, 27 the<br />
LOD is defined as the mean observed chlorpromazine concentration<br />
plus three times the standard deviations, or the highest<br />
observed chlorpromazine concentration, whichever the greater.<br />
As was shown in Table 2, in both cases, the LOD was determined<br />
by the mean plus three standard deviations due to their higher<br />
values compared to the highest observed blank value.<br />
The same swine liver and chicken samples spiked by 0.5, 1.0 and<br />
2.0 µg kg −1 , respectively, were measured by the immunoassay to<br />
determine the variations of the ELISA method. As was shown in<br />
Table 3, the variation of coefficients were determined to be in the<br />
range 9.7–13.0% for inter-assay and 11.0–15.3% for intra-assay,<br />
whereas the average recovery rates were in the range 86.2–95.6%,<br />
indicating satisfactory accuracy and precision.<br />
In our study, the animal tissues analysed were spiked with<br />
chlorpromazine in vitro, in order to evaluate the matrix effect on<br />
recovery and variation efficiency of the method. However, in vivo,<br />
chlorpromazine is rapidly metabolised. Based on the evaluation<br />
of chlorpromazine by JECFA, 8 the major metabolic pathways are<br />
hydroxylation, oxidation, demethylation and glucuronidation. The<br />
metabolites varied differently in different species. Further work of<br />
our study is to apply the method in the analysis of tissues from<br />
animals fed by chlorpromazine and specifically demonstrate the<br />
antibody with chlorpromazine metabolites in different animals.<br />
CONCLUSION<br />
In summary, an immunogen of chlorpromazine was designed<br />
and synthesised. The monoclonal antibody for chlorpromazine<br />
based on the immunogen was prepared for the first time. The<br />
antibody showed high sensitivity with an IC50 value of 0.73 ppb,<br />
limit of detection of 0.05 ppb and specificity with almost no<br />
cross-reactivity towards commonly used sedatives. When applied<br />
www.interscience.wiley.com/jsfa c○ 2010 Society of Chemical Industry J Sci Food Agric 2010; 90: 1789–1795


