Our Petroleum Challenge - Centre for Energy
Our Petroleum Challenge - Centre for Energy
Our Petroleum Challenge - Centre for Energy

You also want an ePaper? Increase the reach of your titles
YUMPU automatically turns print PDFs into web optimized ePapers that Google loves.
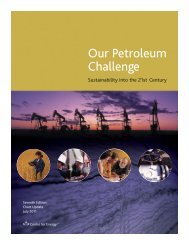
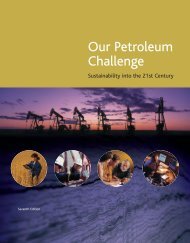
Seventh Edition<br />
Chart Update<br />
July 2011<br />
<strong>Our</strong> <strong>Petroleum</strong><br />
<strong>Challenge</strong><br />
Sustainability into the 21st Century
2<br />
Section 1<br />
<strong>Our</strong><br />
Hydrocarbon<br />
Legacy<br />
Location in OPC7: Page 1<br />
500<br />
450<br />
400<br />
350<br />
300<br />
250<br />
200<br />
150<br />
100<br />
50<br />
Section 1 OPC7 Charts and Graphs Update July 2011<br />
Following are chart updates <strong>for</strong> the seventh edition of <strong>Our</strong> <strong>Petroleum</strong> <strong>Challenge</strong>,<br />
Sustainability into the 21st Century. The statistical data has been updated based<br />
on in<strong>for</strong>mation available as of June 30, 2011. For your reference, the page number<br />
of each chart in the publication is noted.<br />
MaJOr SUPPlierS Of CrUDe Oil anD refineD PrODUCtS tO the UniteD StateS 2000–2010<br />
(thousands of cubic metres per day)<br />
2000 2001 2002 2003 2004 2005 2006 2007 2008 2009 2010<br />
CANADA MEXICO<br />
SAUDI ARABIA VENEZUELA<br />
CANADIAN CanaDian PRIMARY PriMary ENERGY enerGy DEMAND DeManD BY by FUEL fUel<br />
(thousands of petajoules) of petajoules)<br />
13<br />
12<br />
11<br />
10<br />
9<br />
8<br />
7<br />
6<br />
5<br />
4<br />
3<br />
2<br />
1<br />
Source: <strong>Energy</strong> In<strong>for</strong>mation Administration<br />
Location in OPC7: Page 2<br />
Did<br />
?<br />
you know?<br />
About 26 per cent<br />
of Canadian natural gas usage is<br />
<strong>for</strong> home heating.<br />
Location in OPC7: Page 14<br />
No new data available, updated as of June 30, 2010<br />
1970 1975 1980 1985 1990 1995 2000 2005<br />
2008<br />
LIQUID PETROLEUM PRODUCTS NATURAL GAS COAL HYDRO NUCLEAR OTHER* Source: Canadian Association of of <strong>Petroleum</strong> Producers<br />
* Includes biomass and wind<br />
and Natural and Resources Natural Resources Canada 2008 Canada
Location in OPC7: Page 18<br />
tOtal ValUe Of CanaDian exPOrtS 2010<br />
($ billions)<br />
E<br />
H<br />
F<br />
G<br />
$ billions %<br />
A <strong>Energy</strong> Products 90.7 22.4<br />
B Agriculture and Fishing Products 36.9 9.1<br />
C Forestry Products 21.8 5.4<br />
D Industrial Goods and Materials 96.5 23.9<br />
E Machinery and Equipment 76.0 18.8<br />
F Automotive Products 56.8 14.0<br />
G Other Consumer Goods 16.4 4.1<br />
H Unallocated Adjustments 9.5 2.3<br />
Total 404.6 100.0<br />
D<br />
Location in OPC7: Page 22<br />
A<br />
C<br />
B<br />
ValUe Of CanaDian enerGy exPOrtS 2010<br />
($ millions)<br />
Electricity<br />
<strong>Petroleum</strong><br />
and<br />
Coal Products<br />
Coal/Bituminous Crude Oil<br />
Natural Gas<br />
$ millions %<br />
Crude Oil 51,942 55.4<br />
Natural Gas 15,613 16.7<br />
Coal/Bituminous 6,144 6.6<br />
<strong>Petroleum</strong> and Coal Products 18,044 19.2<br />
Electricity 2,022 2.2<br />
Total 93,765 100.0<br />
Source: Statistics Canada 2009<br />
Numbers may not add up due to rounding<br />
ValUe Of UPStreaM PrODUCtiOn anD PayMentS tO GOVernMentS<br />
VALUE ($ billions)<br />
OF PRODUCTION AND PAYMENTS TO GOVERNMENTS<br />
($ billions)<br />
150<br />
125<br />
100<br />
75<br />
50<br />
25<br />
Upstream producer sales<br />
(Includes crude oil and condensate, oil sands, natural gas,<br />
pentanes plus, propane, butanes, sulphur and ethane)<br />
Amount available to industry<br />
(For reinvestment, operating costs, dividends and interest payments)<br />
Government’s share of upstream sales<br />
(Includes royalties, land bonuses and corporate income taxes)<br />
1999 2000 2001 2002 2003 2004 2005 2006 2007 2008 2009<br />
36.2 65.1 64.3 58.7 77.5 87.3 110.2 106.5 110.5 148.4 88.4<br />
6.1 14.1 15.5 10.9 14.8 17 22.4 20.9 18.2 27.5 14.5<br />
Source: Canadian Association of <strong>Petroleum</strong> Producers<br />
©Canadian Association of <strong>Petroleum</strong> Producers and Statistics Canada (tax in<strong>for</strong>mation) 2009<br />
Section 1 OPC 7 Charts and Graphs Update July 2011 3
HISTORICAL hiStOriCal CRUDE CrUDe OIL Oil PRICES PriCeS<br />
($U.S. ($ U.S. per per barrel) barrel)<br />
110<br />
100<br />
90<br />
80<br />
70<br />
60<br />
50<br />
40<br />
30<br />
20<br />
10<br />
4<br />
0<br />
$ 2010 U.S. dollars<br />
$ Money of the day<br />
Pennsylvanian<br />
oil boom<br />
Russian<br />
oil exports<br />
began<br />
Sumatra<br />
production<br />
began<br />
Discovery of<br />
Spindletop,<br />
Texas<br />
Fears of<br />
shortage<br />
in USA<br />
Growth of<br />
Venezuelan<br />
production<br />
1861-1944 U.S. average 1945-1983 Arabian light posted at Ras Tanura 1984-2008 Brent dated<br />
Section 1 OPC7 Charts and Graphs Update July 2011<br />
East Texas<br />
field<br />
discovered<br />
Post-war<br />
reconstruction<br />
Loss of<br />
Iranian<br />
supplies<br />
Location in OPC7: Page 24<br />
Iranian<br />
revolution<br />
Source: BP Statistical Review of World <strong>Energy</strong> 2010<br />
Location in OPC7: Page 24<br />
($ ($U.S. U.S. per cubic metre) metre)<br />
1870 1880 1890 1900 1910 1920 1930 1940 1950 1960 1970 1980 1990 2000 2010<br />
hiStOriCal WeStern CanaDian natUral GaS PriCeS<br />
HISTORICAL WESTERN CANADA NATURAL GAS PRICES<br />
($Cdn<br />
($ Cdn<br />
per<br />
per<br />
thousand<br />
thousand<br />
cubic feet)<br />
cubic feet)<br />
($ Cdn per<br />
($Cdn<br />
thousand<br />
per thousand<br />
cubic<br />
cubic<br />
metres)<br />
metres)<br />
350<br />
8.51 300<br />
7.09 250<br />
5.67 200<br />
4.25 150<br />
2.83 100<br />
1.42 50<br />
0<br />
$ 2009<br />
$ Money of the day<br />
TransCanada<br />
gas pipeline<br />
completed<br />
National <strong>Energy</strong><br />
Program announced<br />
Export floor<br />
price <strong>for</strong><br />
natural gas<br />
adopted<br />
Western Accord<br />
commits to deregulation<br />
Deregulation of pricing<br />
and marketing<br />
Alliance Pipeline<br />
in service<br />
U.S./Canada<br />
Free Trade<br />
Agreement signed<br />
N.A.F.T.A.<br />
signed<br />
1950 1960 1970 1980 1990 2000 2009<br />
Suez<br />
Crisis<br />
Source: Canadian Association of <strong>Petroleum</strong> Producers 2009<br />
300<br />
250<br />
200<br />
150<br />
100<br />
50<br />
0<br />
Yom Kippur<br />
War<br />
Netback<br />
pricing<br />
introduced<br />
Asian<br />
financial<br />
crisis<br />
Iraq<br />
invaded<br />
Kuwait<br />
Invasion<br />
of Iraq<br />
693<br />
630<br />
567<br />
504<br />
441<br />
378<br />
315<br />
252<br />
189<br />
126<br />
63<br />
0
Location in OPC7: Page 27<br />
CANADA’S CanaDa'S eStabliSheD ESTABLISHED reSerVeS RESERVES Of COnVentiOnal OF CONVENTIONAL CrUDe CRUDE Oil OIL<br />
(millions of of cubic metres)<br />
5000<br />
4500<br />
4000<br />
3500<br />
3000<br />
2500<br />
2000<br />
1500<br />
1000<br />
500<br />
CanaDa'S CANADA’S eStabliSheD ESTABLISHED reSerVeS RESERVES Of Marketable OF MARKETABLE natUral NATURAL GaS GAS<br />
(billions of cubic metres)<br />
7000<br />
6000<br />
5000<br />
4000<br />
3000<br />
2000<br />
1000<br />
Conventional crude oil reserves<br />
Cumulative conventional production<br />
1965 1970 1975 1980 1985 1990 1995 2000 2005 2009<br />
Marketable reserves – Arctic Islands, Mackenzie and Beau<strong>for</strong>t Sea<br />
Marketable reserves – other Canada<br />
Cumulative production<br />
Source: Canadian Association of <strong>Petroleum</strong> Producers 2009<br />
1965 1970 1975 1980 1985 1990 1995 2000 2005 2009<br />
Source: Canadian Association of <strong>Petroleum</strong> Producers 2009<br />
Note: Remaining marketable natural gas reserves decline in 1992 and 1993 because the Canadian Association of <strong>Petroleum</strong><br />
Producers discontinued the practice of carrying reserves <strong>for</strong> the Arctic Islands and Mackenzie Delta/Beau<strong>for</strong>t Sea respectively.<br />
Section 1 OPC 7 Charts and Graphs Update July 2011 5
CanaDian CANADIAN UltiMate RECOVERABLE natUral NATURAL GaS reSOUrCe GAS RESOURCE POtential POTENTIAL<br />
2009<br />
(billions of of cubic metres)<br />
6<br />
CanaDian CANADIAN UltiMate RECOVERABLE COnVentiOnal CONVENTIONAL CrUDe Oil CRUDE reSOUrCe OIL POTENTIAL<br />
POtential 2009<br />
(millions of of cubic metres)<br />
8072.1 2572.0<br />
5933.1<br />
1075.8<br />
347.7<br />
177.7<br />
50.6<br />
78.7<br />
2.8<br />
4022.1 4917.0<br />
2300.6<br />
184.1<br />
111.6<br />
36.0<br />
33.1<br />
0.4<br />
819.2<br />
196.4<br />
113.7<br />
44.7<br />
42.3<br />
14.3<br />
0.1<br />
Remaining<br />
768.5<br />
234.8<br />
35.6<br />
44.0<br />
25.2<br />
0.9<br />
Remaining<br />
Mainland Territories<br />
Saskatchewan<br />
Ontario<br />
British Columbia<br />
Manitoba<br />
Ontario<br />
Other Eastern Canada<br />
East Coast Offshore<br />
Mainland Territories<br />
East Coast Offshore<br />
Produced<br />
Other Eastern Canada<br />
Produced<br />
British Columbia<br />
Section 1 OPC7 Charts and Graphs Update July 2011<br />
Saskatchewan<br />
Alberta<br />
0 2000 4000 6000 8000 10000 12000<br />
Source: Source: Canadian Canadian Association Association of <strong>Petroleum</strong> of <strong>Petroleum</strong> Producers Producers 2009<br />
Alberta<br />
0 2000 4000 6000 8000 10000<br />
Source: Source: Canadian Canadian Association Association of <strong>Petroleum</strong> of <strong>Petroleum</strong> Producers Producers 2009<br />
Location in OPC7: Page 28
Location in OPC7: Page 28<br />
WOrlD WORLD PrOVeD PROVED CrUDe CRUDE Oil OIL reSerVeS RESERVES<br />
(billions of of cubic cubic metres, metres, January January 2009) 2011)<br />
41.7<br />
33.6<br />
27.8<br />
21.8<br />
18.3<br />
16.5<br />
15.5<br />
9.5<br />
7.4<br />
5.9<br />
0<br />
Russia<br />
Libya<br />
Nigeria<br />
Location in OPC7: Page 32<br />
Iran<br />
Iraq<br />
Kuwait<br />
United Arab Emirates<br />
Venezuela<br />
Canada<br />
Saudi Arabia<br />
10 20 30 40 50<br />
CANADIAN CanaDian GREENHOUSE GreenhOUSe GAS GaS EMISSIONS eMiSSiOnS – ALL – all SECTORS SeCtOrS<br />
CO2 CO emissions (million (million tonnes tonnes 2 CO2 equivalent CO equivalent)<br />
2 )<br />
282.1<br />
190.7<br />
97.4<br />
77.9<br />
63.7<br />
21.1<br />
733.0<br />
38.5%<br />
26.0%<br />
13.3%<br />
10.6%<br />
8.7%<br />
2.9%<br />
WOrlD WORLD PrOVeD PROVED natUral NATURAL GaS GAS reSerVeS RESERVES<br />
(trillions of of cubic cubic metres, metres, January January 2009) 2011)<br />
47.6<br />
29.6<br />
25.4<br />
7.8<br />
7.7<br />
7.5<br />
6.5<br />
5.3<br />
5.1<br />
4.5<br />
1.6<br />
0<br />
Saudi Arabia<br />
United States<br />
Turkmenistan<br />
United Arab Emirates<br />
Nigeria<br />
Venezuela<br />
Algeria<br />
Canada (world ranking: 21)<br />
Iran<br />
Qatar<br />
10 20 30 40 50<br />
Source: <strong>Energy</strong> In<strong>for</strong>mation Administration Source: <strong>Energy</strong> In<strong>for</strong>mation Administration<br />
<strong>Energy</strong><br />
industries<br />
Vehicle<br />
transportation<br />
Industry<br />
Residential and<br />
commercial<br />
Agriculture/Forestry<br />
Waste<br />
94.0<br />
87.8<br />
8.8<br />
49.3<br />
46.1<br />
4.6%<br />
Freight<br />
119.0<br />
68.0<br />
63.8<br />
23.9<br />
7.5<br />
Light duty gasoline<br />
cars and trucks<br />
Other passenger<br />
transportation<br />
42.2%<br />
24.1%<br />
22.6%<br />
8.5%<br />
2.6%<br />
Electricity and<br />
heat generation<br />
Russia<br />
No new data available, updated as of June 30, 2010<br />
Fossil fuel industries<br />
Fugitive emissions<br />
Mining and oil<br />
and gas extraction<br />
Pipelines<br />
Source: Environment Canada, National Inventory Report 1990-2008<br />
Greenhouse Gas Sources and Sinks in Canada, April 2010<br />
Section 1 OPC 7 Charts and Graphs Update July 2011 7
8<br />
Section 2<br />
Inside<br />
the<br />
Industry<br />
CANADIAN<br />
CanaDian<br />
DRILLING<br />
DrillinG<br />
ACTIVITY<br />
aCtiVity<br />
TOTALS<br />
tOtalS 2010<br />
(number<br />
(number<br />
of<br />
of<br />
wells<br />
wells<br />
drilled)<br />
drilled)<br />
2000<br />
2001<br />
2002<br />
2003<br />
2004<br />
2005<br />
2006<br />
2007<br />
2008<br />
2009<br />
2010<br />
9,987<br />
Section 2 OPC7 Charts and Graphs Update July 2011<br />
12,343<br />
17,182<br />
Location in OPC7: Page 50<br />
5000 10000 15000 20000 25000 30000<br />
18,480<br />
19,752<br />
20,203<br />
21,210<br />
23,365<br />
24,874<br />
25,811<br />
Oil<br />
Gas<br />
Dry and service<br />
Source: Canadian Association of <strong>Petroleum</strong> Producers<br />
* Includes suspended wells and natural gas from coal (coalbed methane) wells not yet in production. Source: Canadian Association of <strong>Petroleum</strong> Producers<br />
26,951
MaJOr CrUDe Oil anD PrODUCtS PiPelineS<br />
Location in OPC7: Page 90<br />
Canadian<br />
<strong>Energy</strong> Pipeline<br />
Association Members<br />
Enbridge<br />
Kinder Morgan<br />
Pembina<br />
Access<br />
BP<br />
Inter Pipeline<br />
Spectra<br />
Portland-Montreal<br />
Trans-Northern<br />
Transcanada<br />
Non-member pipeline<br />
Source: Canadian <strong>Energy</strong> Pipelines Association 2010<br />
Section 2 OPC 7 Charts and Graphs Update July 2011 9
CrUDe Oil anD eqUiValent PrODUCtiOn, SUPPly anD DiStribUtiOn 2009<br />
(Mbbl/d)<br />
10<br />
Location in OPC7: Page 91<br />
13.8<br />
40.3<br />
PADD<br />
V<br />
Norman Wells<br />
34.7<br />
47.8<br />
106.3<br />
15.5<br />
1,951.3<br />
425.5<br />
417.2<br />
219.0<br />
PADD<br />
IV<br />
PADD<br />
III<br />
26.2<br />
1,168.0<br />
Section 2 OPC7 Charts and Graphs Update July 2011<br />
PADD II<br />
78.7<br />
1.5<br />
17.0 14.5<br />
39.6<br />
253.0 12.0<br />
PADD I<br />
59.1<br />
Hibernia’<br />
Terra Nova and<br />
White Rose<br />
267.7<br />
337.3<br />
68.5<br />
365.6<br />
81.2 Sable<br />
8.8<br />
120.2<br />
Northeastern <strong>Petroleum</strong><br />
Administration <strong>for</strong><br />
Defense District #1<br />
Production of crude<br />
oil and equivalent<br />
Source: Production – Canadian Association of <strong>Petroleum</strong> Producers<br />
Distribution – Canada’s National <strong>Energy</strong> Board
MaJOr natUral GaS tranSMiSSiOn lineS<br />
Location in OPC7: Page 92<br />
Canadian<br />
<strong>Energy</strong> Pipeline<br />
Association Members<br />
Enbridge<br />
ATCO<br />
Terasen Gas<br />
TransCanada<br />
BP<br />
TransGas<br />
Spectra<br />
Alliance<br />
Trans Quebec<br />
& Maritimes<br />
Maritimes<br />
& Northeast<br />
Non-member<br />
pipeline<br />
Source: Canadian <strong>Energy</strong> Pipeline Association 2010<br />
Section 2 OPC 7 Charts and Graphs Update July 2011 11
12<br />
Location in OPC7: Page 93<br />
MarketeD natUral GaS PrODUCtiOn anD DiStribUtiOn 2009<br />
(bcf/d)<br />
0.8<br />
0.7<br />
2.8<br />
1.8<br />
A<br />
Section 2 OPC7 Charts and Graphs Update July 2011<br />
B<br />
0.02<br />
11.5<br />
2.4<br />
0.5<br />
0.6<br />
0.2<br />
1.3<br />
Other export points<br />
0.6<br />
0.02<br />
1.3<br />
1.5<br />
0.5<br />
0.5<br />
0.2<br />
2.5 0.3<br />
1.0<br />
0.3<br />
Natural gas production<br />
Major export points:<br />
A<br />
B<br />
C<br />
D<br />
E<br />
F<br />
G<br />
H<br />
Huntingdon<br />
Kingsgate<br />
Monchy<br />
Elmore<br />
Emerson<br />
Niagara Falls<br />
Iroquois<br />
St. Stephen<br />
Source: Canadian Association of <strong>Petroleum</strong> Producers 2010
internatiOnal CrUDe Oil PriCinG<br />
Valdez, Alaska<br />
Pacific Ocean<br />
Edmonton<br />
Cushing to Chicago<br />
Transportation cost:<br />
US $1.45/bbl<br />
Cushing<br />
CRUDE OIL PRICES AND TRANSPORTATION COSTS<br />
Edmonton par<br />
2010 Price (U.S. $/bbl) 75.29<br />
2010 Transport costs Edmonton - Chicago $3.70<br />
The Edmonton par price is the amount offered by<br />
Edmonton refineries <strong>for</strong> light sweet crude oil (40<br />
on the American <strong>Petroleum</strong> Institute gravity scale<br />
with 0.5 per cent sulphur content).<br />
Edmonton to Chicago<br />
Transportation cost:<br />
US $3.70/bbl<br />
Chicago<br />
Toronto<br />
New York<br />
Atlantic Ocean<br />
North Sea Brent to Chicago<br />
Transportation cost:<br />
US $3.00 to $4.00/bbl<br />
North Sea Brent to U.S. Gulf Coast<br />
Transportation cost: US $3.00 to $4.00/bbl<br />
West Texas Intermediate<br />
2010 Price (U.S. $/bbl) 79.53<br />
2010 Transport Costs Cushing - Chicago $1.45<br />
West Texas Intermediate (WTI) is a light grade of<br />
U.S. crude oil (40 on the American <strong>Petroleum</strong><br />
Institute gravity scale, with 0.5 per cent sulphur<br />
content) widely traded on commodity markets.<br />
The price is established <strong>for</strong> deliveries of this crude<br />
to a terminal at Cushing, Oklahoma.<br />
Major crude oil transportation route<br />
Other key markets affecting Canadian crude oil prices<br />
Location in OPC7: Page 94<br />
Brent<br />
Sullom Voe<br />
London<br />
North<br />
Sea<br />
North Sea Brent<br />
2010 Price (U.S. $/bbl) 81.23<br />
2007 Transport Costs North Sea - Chicago $3.00 to $4.00<br />
2007 Transport Costs North Sea - Gulf Coast $3.00 to $4.00<br />
North Sea Brent is another crude oil commonly<br />
traded on international commodity markets.<br />
The price refers to a grade of crude oil (37 on<br />
the American <strong>Petroleum</strong> Institute gravity scale,<br />
with one per cent sulphur content) which is somewhat<br />
heavier and more sour than Edmonton par or WTI.<br />
The Brent price is quoted <strong>for</strong> deliveries to the<br />
Sullom Voe terminal in the North Sea.<br />
Source: Canadian Association of <strong>Petroleum</strong> Producers 2010<br />
Section 2 OPC 7 Charts and Graphs Update July 2011 13
14<br />
Location in OPC7: Page 104<br />
internatiOnal retail GaSOline PriCeS<br />
INTERNATIONAL RETAIL GASOLINE PRICES<br />
(Canadian ($ Cdn per dollars litre) per 2010 litre) 2008 average Average Price Price<br />
0.930<br />
0.896<br />
1.015<br />
0.949<br />
1.071<br />
0.991<br />
0.964<br />
0.919<br />
1.277<br />
1.300<br />
1.172<br />
1.218<br />
0.768<br />
0.976<br />
0.379<br />
0.107<br />
Excluding Taxes<br />
Tax<br />
Location in OPC7: Page 105<br />
42.7<br />
40.6<br />
38.5<br />
38.0<br />
36.2<br />
32.2<br />
30.6<br />
29.8<br />
26.3<br />
25.5<br />
23.8<br />
21.2<br />
21.0<br />
United States<br />
Canada<br />
0.5 1.0 1.5 2.0 2.5<br />
Section 2 OPC7 Charts and Graphs Update July 2011<br />
Japan<br />
taxeS On GaSOline When the PUMP PriCe iS One DOllar Per litre<br />
TAXES ON GASOLINE WHEN THE PUMP PRICE IS ONE DOLLAR PER LITRE<br />
(cents per litre) as of July 1, 2010<br />
(cents per litre)<br />
Calgary<br />
Nunavut<br />
Whitehorse<br />
Spain<br />
Germany<br />
United Kingdom<br />
Italy<br />
France<br />
Source:<br />
Source:<br />
International<br />
International<br />
<strong>Energy</strong><br />
<strong>Energy</strong><br />
Agency<br />
Agency<br />
Excise Tax<br />
Vancouver<br />
GST<br />
Montreal<br />
HST<br />
Halifax<br />
Provincial<br />
St. John's<br />
PST<br />
Toronto<br />
Municipal<br />
Saint John<br />
Carbon<br />
Charlottetown<br />
Regina<br />
Winnipeg<br />
Yellowknife<br />
5 10 15 20 25 30 35 40 45 50<br />
Source: Natural Resources Canada<br />
Source: Natural Resources Canada
Location in OPC7: Page 104<br />
CanaDian aVeraGe<br />
GaSOline CANADIAN PriCe AVERAGE COMPOnentS 2010<br />
(based GASOLINE on $1.00 PRICE per COMPONENTS litre)<br />
(Based on $1.00 per litre)<br />
13.3%<br />
6.8%<br />
46.9%<br />
33.0%<br />
1.00<br />
Taxes<br />
Crude oil costs<br />
Refining operating margin<br />
Marketing operating margin<br />
Source: Natural Resources Canada<br />
Section 3<br />
Sustainable<br />
Development<br />
Location in OPC7: Page 108<br />
CANADIAN CanaDian MOTOR MOtOr VEHICLE VehiCle EFFICIENCY<br />
effiCienCy in 2007<br />
(litres per per 100 100 kilometres) kilometres)<br />
Location in OPC7: Page 105<br />
Did<br />
?<br />
you know?<br />
Between 1999 and 2010,<br />
the number of retail service<br />
stations in Canada declined from<br />
15,140 to 12,710. About half sell<br />
under the brand names of major<br />
refining companies. Independent owners,<br />
regional companies and retail chains<br />
operate the remainder.<br />
Light Vehicles Medium Trucks Heavy Trucks<br />
Age of vehicles (gasoline) (diesel) (diesel)<br />
2 and less 10.5 21.8 32.2<br />
3 to 5 10.9 22.7 34.7<br />
6 to 9 10.7 22.3 36.0<br />
10 to 13 11.2 29.6 38.2<br />
14 and over 11.5 31.3 45.8<br />
Avg 11.0 25.5 37.4<br />
Source: Natural Resources Canada<br />
Section 2 OPC 7 Charts and Graphs Update July 2011 15