impact of high oil prices on freight transportation: modal shift ...
impact of high oil prices on freight transportation: modal shift ...
impact of high oil prices on freight transportation: modal shift ...

You also want an ePaper? Increase the reach of your titles
YUMPU automatically turns print PDFs into web optimized ePapers that Google loves.
PREPARED FOR:<br />
MARITIME ADMINISTRATION,<br />
U.S. DEPARTMENT OF TRANSPORTATION<br />
PREPARED BY:<br />
TEMS<br />
IMPACT OF HIGH OIL PRICES<br />
ON FREIGHT TRANSPORTATION:<br />
MODAL SHIFT POTENTIAL<br />
IN FIVE CORRIDORS<br />
TECHNICAL REPORT<br />
TRANSPORTATION ECONOMICS & MANAGEMENT SYSTEMS, INC.<br />
OCTOBER 2008
TECHNICAL REPORT - IMPACT OF HIGH OIL PRICES ON FREIGHT TRANSPORTATION:<br />
MODAL SHIFT POTENTIAL IN FIVE CORRIDORS<br />
TABLE OF CONTENTS<br />
1 THE PURPOSE OF THE STUDY............................................................................................................................1<br />
2 INTRODUCTION.....................................................................................................................................................2<br />
2.1 THE OIL PRICE ISSUE ...................................................................................................................................2<br />
2.2 THE ABILITY TO MAINTAIN AND GROW THE GLOBAL ECONOMY ...............................................................4<br />
2.3 THE COSTS OF MARINE AND INLAND SHIPPING...........................................................................................4<br />
2.4 COMPETITIVE RELATIONSHIPS AND INLAND DISTRIBUTION SYSTEM ..........................................................6<br />
3 OIL PRICES TODAY AND IN THE FUTURE .......................................................................................................8<br />
3.1 THE HISTORY OF OIL PRICES.......................................................................................................................8<br />
3.2 THE FUTURE RANGE OF OIL PRICES..........................................................................................................10<br />
4 POTENTIAL IMPACT OF OIL PRICE SCENARIOS...........................................................................................13<br />
4.1 OIL PRICE SCENARIOS...............................................................................................................................13<br />
4.2 EVALUATION PROCESS..............................................................................................................................13<br />
4.3 ANALYSIS METHOD...................................................................................................................................15<br />
4.4 SUPPLY SIDE ISSUES..................................................................................................................................15<br />
4.5 DEMAND SIDE ISSUES ...............................................................................................................................19<br />
5 THE IMPACT OF OIL PRICES ON TRANSPORTATION COSTS ...................................................................21<br />
5.1 OVERVIEW ................................................................................................................................................21<br />
5.2 TRUCKING EFFICIENCY .............................................................................................................................22<br />
5.3 RAIL LINE-HAUL EFFICIENCY ...................................................................................................................24<br />
5.4 MARITIME LINE-HAUL EFFICIENCY ..........................................................................................................25<br />
5.5 MODAL PERFORMANCE COMPARISON.......................................................................................................31<br />
6 MODAL SHIFT POTENTIAL IN THE FIVE CORRIDORS.................................................................................36<br />
6.1 OVERVIEW ................................................................................................................................................36<br />
6.2 BASE-LINE CONDITIONS ...........................................................................................................................36<br />
6.3 CONTAINER FORECAST RESULTS ..............................................................................................................40<br />
6.4 CONTAINERIZED FORECAST RESULTS .......................................................................................................44<br />
6.5 BULK DIVERSION POTENTIALS..................................................................................................................46<br />
7 CONCLUSIONS AND RECOMMENDATIONS ..................................................................................................49<br />
7.1 KEY RESULTS BY CORRIDOR.....................................................................................................................49<br />
7.2 NATIONAL IMPLICATIONS .........................................................................................................................50<br />
7.3 CONCLUSION.............................................................................................................................................51<br />
REFERENCES .............................................................................................................................................................52<br />
APPENDICES<br />
TEMS, INC. OCTOBER 2008 III
1<br />
TECHNICAL REPORT - IMPACT OF HIGH OIL PRICES ON FREIGHT TRANSPORTATION:<br />
MODAL SHIFT POTENTIAL IN FIVE CORRIDORS<br />
THE PURPOSE OF THE STUDY<br />
In recent m<strong>on</strong>ths the price <str<strong>on</strong>g>of</str<strong>on</strong>g> <str<strong>on</strong>g>oil</str<strong>on</strong>g> has risen sharply and with it, gasoline, diesel, and fuel <str<strong>on</strong>g>oil</str<strong>on</strong>g> <str<strong>on</strong>g>prices</str<strong>on</strong>g>. The<br />
<str<strong>on</strong>g>impact</str<strong>on</strong>g> <str<strong>on</strong>g>of</str<strong>on</strong>g> these <str<strong>on</strong>g>oil</str<strong>on</strong>g> price increases is very str<strong>on</strong>g as it flows through the U.S. ec<strong>on</strong>omy. Firstly, its <str<strong>on</strong>g>impact</str<strong>on</strong>g> <strong>on</strong><br />
producti<strong>on</strong> costs results in a reducti<strong>on</strong> <strong>on</strong> the overall demand for goods and services in the ec<strong>on</strong>omy.<br />
Sec<strong>on</strong>d, its <str<strong>on</strong>g>impact</str<strong>on</strong>g> <strong>on</strong> transport costs is changing distributi<strong>on</strong> systems and the ability <str<strong>on</strong>g>of</str<strong>on</strong>g> existing logistics<br />
chains to serve world markets. This sec<strong>on</strong>d <str<strong>on</strong>g>impact</str<strong>on</strong>g> affects not <strong>on</strong>ly the hinterland and distributi<strong>on</strong> systems<br />
<str<strong>on</strong>g>of</str<strong>on</strong>g> major markets, but also the relative competitiveness <str<strong>on</strong>g>of</str<strong>on</strong>g> the modes that serve those markets.<br />
In order to understand the <str<strong>on</strong>g>impact</str<strong>on</strong>g> <str<strong>on</strong>g>of</str<strong>on</strong>g> <str<strong>on</strong>g>oil</str<strong>on</strong>g> <str<strong>on</strong>g>prices</str<strong>on</strong>g> <strong>on</strong> markets and their logistic chains, the Maritime<br />
Administrati<strong>on</strong> (an agency <str<strong>on</strong>g>of</str<strong>on</strong>g> the U.S. Department <str<strong>on</strong>g>of</str<strong>on</strong>g> Transportati<strong>on</strong>) asked Transportati<strong>on</strong> Ec<strong>on</strong>omics &<br />
Management Systems, Inc. (TEMS) to evaluate the <str<strong>on</strong>g>impact</str<strong>on</strong>g> <str<strong>on</strong>g>of</str<strong>on</strong>g> <str<strong>on</strong>g>oil</str<strong>on</strong>g> <str<strong>on</strong>g>prices</str<strong>on</strong>g> <strong>on</strong> U.S. domestic <strong>freight</strong><br />
transportati<strong>on</strong>. The study first forecasts the potential range <str<strong>on</strong>g>of</str<strong>on</strong>g> <str<strong>on</strong>g>oil</str<strong>on</strong>g> <str<strong>on</strong>g>prices</str<strong>on</strong>g> in the short and l<strong>on</strong>g term, and<br />
then assesses how such <str<strong>on</strong>g>prices</str<strong>on</strong>g> would <str<strong>on</strong>g>impact</str<strong>on</strong>g> transportati<strong>on</strong> logistics chains and evaluate likely changes. The<br />
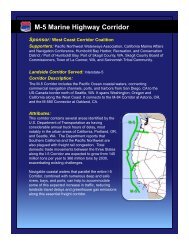
analysis c<strong>on</strong>siders both the nati<strong>on</strong>al <str<strong>on</strong>g>impact</str<strong>on</strong>g> as well as the <str<strong>on</strong>g>impact</str<strong>on</strong>g> in five critical corridor markets, as shown<br />
in Exhibit 1. These five corridors include over 95 percent <str<strong>on</strong>g>of</str<strong>on</strong>g> the US populati<strong>on</strong> and an even <str<strong>on</strong>g>high</str<strong>on</strong>g>er share<br />
<str<strong>on</strong>g>of</str<strong>on</strong>g> its total producti<strong>on</strong> and c<strong>on</strong>sumpti<strong>on</strong>.<br />
Exhibit 1: The Five Corridors Evaluated in the Analysis<br />
TEMS, INC. OCTOBER 2008<br />
1
2<br />
TECHNICAL REPORT - IMPACT OF HIGH OIL PRICES ON FREIGHT TRANSPORTATION:<br />
MODAL SHIFT POTENTIAL IN FIVE CORRIDORS<br />
INTRODUCTION<br />
2.1 THE OIL PRICE ISSUE<br />
Over the last forty years, <strong>on</strong>e <str<strong>on</strong>g>of</str<strong>on</strong>g> the most difficult transportati<strong>on</strong> policy questi<strong>on</strong>s has been the issue <str<strong>on</strong>g>of</str<strong>on</strong>g> the<br />
price <str<strong>on</strong>g>of</str<strong>on</strong>g> <str<strong>on</strong>g>oil</str<strong>on</strong>g> and its associated <str<strong>on</strong>g>impact</str<strong>on</strong>g> <strong>on</strong> transportati<strong>on</strong> systems 1. Since the 1950’s the North American<br />
ec<strong>on</strong>omy and its transportati<strong>on</strong> system have become increasingly dependent <strong>on</strong> <str<strong>on</strong>g>oil</str<strong>on</strong>g> both in terms <str<strong>on</strong>g>of</str<strong>on</strong>g> its<br />
producti<strong>on</strong> <str<strong>on</strong>g>of</str<strong>on</strong>g> goods and services, and their distributi<strong>on</strong> from producti<strong>on</strong> centers to market c<strong>on</strong>sumpti<strong>on</strong><br />
centers. Oil drives a large part <str<strong>on</strong>g>of</str<strong>on</strong>g> the costs <str<strong>on</strong>g>of</str<strong>on</strong>g> the producti<strong>on</strong> <str<strong>on</strong>g>of</str<strong>on</strong>g> agricultural, manufacturing, and service<br />
industries. Furthermore, as industries have globalized over the last thirty years the low price <str<strong>on</strong>g>of</str<strong>on</strong>g> <str<strong>on</strong>g>oil</str<strong>on</strong>g> has<br />
been critical in allowing logistics chains to become more and more el<strong>on</strong>gated. As a result <str<strong>on</strong>g>of</str<strong>on</strong>g> ec<strong>on</strong>omic<br />
globalizati<strong>on</strong>, more and more <str<strong>on</strong>g>of</str<strong>on</strong>g> the U.S. Gross Domestic Product (GDP) has become dependent <strong>on</strong><br />
internati<strong>on</strong>al trade and movements across the world. 2 It is estimated that whereas <strong>on</strong>ly five percent <str<strong>on</strong>g>of</str<strong>on</strong>g> U.S.<br />
GDP was generated from trade in 1950, the growth <str<strong>on</strong>g>of</str<strong>on</strong>g> internati<strong>on</strong>al trade (See Exhibits 2 and 3) by the<br />
year 2000 resulted in twenty percent <str<strong>on</strong>g>of</str<strong>on</strong>g> GDP being generated by internati<strong>on</strong>al trade, and that by 2050<br />
it will be fifty percent. 3<br />
The transport systems that support this growth in “ec<strong>on</strong>omic globalism” are very dependent <strong>on</strong> <str<strong>on</strong>g>oil</str<strong>on</strong>g>.<br />
Whether it’s the ships that carry c<strong>on</strong>tainers with c<strong>on</strong>sumer goods from Asia and Europe, or the <str<strong>on</strong>g>oil</str<strong>on</strong>g> tankers<br />
bringing fuel <str<strong>on</strong>g>oil</str<strong>on</strong>g> to the U.S., or bulk carriers moving coal, ores, and grain, marine shipping has been driven<br />
by ec<strong>on</strong>omies <str<strong>on</strong>g>of</str<strong>on</strong>g> scale being generated by faster and larger ships, and steady if not falling <str<strong>on</strong>g>oil</str<strong>on</strong>g> <str<strong>on</strong>g>prices</str<strong>on</strong>g>.<br />
Equally, in terms <str<strong>on</strong>g>of</str<strong>on</strong>g> inland distributi<strong>on</strong> whether by truck, rail, or inland water, steady or falling <str<strong>on</strong>g>oil</str<strong>on</strong>g> <str<strong>on</strong>g>prices</str<strong>on</strong>g><br />
have allowed the growth <str<strong>on</strong>g>of</str<strong>on</strong>g> an efficient distributi<strong>on</strong> system using existing infrastructure systems that had<br />
adequate capacity. Interstates were built and maintained by Federal and state government, railroads<br />
maintained by the private railroad companies, and port and inland water systems have been built and<br />
maintained by the Federal and state government, and the private sector.<br />
In the global ec<strong>on</strong>omy and both the internal and external transportati<strong>on</strong> systems <str<strong>on</strong>g>of</str<strong>on</strong>g> the United States,<br />
significantly increased <str<strong>on</strong>g>oil</str<strong>on</strong>g> <str<strong>on</strong>g>prices</str<strong>on</strong>g> will have a very large <str<strong>on</strong>g>impact</str<strong>on</strong>g> <strong>on</strong> a number <str<strong>on</strong>g>of</str<strong>on</strong>g> demand and supply factors,<br />
including:<br />
• The ability to maintain and grow the global ec<strong>on</strong>omy<br />
• The costs <str<strong>on</strong>g>of</str<strong>on</strong>g> both marine and inland shipping<br />
• The competitive relati<strong>on</strong>ships and role <str<strong>on</strong>g>of</str<strong>on</strong>g> inland shipping services (i.e., <strong>modal</strong> share).<br />
1 A.E. Metcalf and D. O’Sullivan. “Planning for Energy C<strong>on</strong>servati<strong>on</strong> in Transportati<strong>on</strong>: The Opti<strong>on</strong>s,” Irish Institute <str<strong>on</strong>g>of</str<strong>on</strong>g><br />
Engineers. Dublin. March 1979.<br />
2 A.E. Metcalf, E. Kraft, L.Y. Bzhilyanskaya. “Ohio Inter<strong>modal</strong> Rail Freight Growth Strategy-C<strong>on</strong>cept Study.” TEMS,<br />
Inc. November 2006.<br />
3 Bureau <str<strong>on</strong>g>of</str<strong>on</strong>g> Ec<strong>on</strong>omic Analysis. U.S. Department <str<strong>on</strong>g>of</str<strong>on</strong>g> Commerce.<br />
TEMS, INC. OCTOBER 2008<br />
2
$2,500<br />
$2,000<br />
$1,500<br />
$1,000<br />
$500<br />
TECHNICAL REPORT - IMPACT OF HIGH OIL PRICES ON FREIGHT TRANSPORTATION:<br />
MODAL SHIFT POTENTIAL IN FIVE CORRIDORS<br />
$0<br />
1945 1950 1955 1960 1965 1970 1975 1980 1985 1990 1995 2000 2005 2010<br />
$900<br />
$800<br />
$700<br />
$600<br />
$500<br />
$400<br />
$300<br />
$200<br />
$100<br />
Exhibit 2: U.S. Exports & Imports, 1950-2005 (Billi<strong>on</strong>s <str<strong>on</strong>g>of</str<strong>on</strong>g> $2005)<br />
Exports (includes re-exports) Year Imports Exports & Imports<br />
Exhibit 3: U.S. Exports & Imports by Internati<strong>on</strong>al Regi<strong>on</strong>, 1950-2005<br />
(Billi<strong>on</strong>s <str<strong>on</strong>g>of</str<strong>on</strong>g> $2005)<br />
$0<br />
1945 1950 1955 1960 1965 1970 1975 1980 1985 1990 1995 2000 2005 2010<br />
Canada Latin America Europe Asia Africa Other<br />
TEMS, INC. OCTOBER 2008<br />
3
TECHNICAL REPORT - IMPACT OF HIGH OIL PRICES ON FREIGHT TRANSPORTATION:<br />
MODAL SHIFT POTENTIAL IN FIVE CORRIDORS<br />
2.2 THE ABILITY TO MAINTAIN AND GROW THE GLOBAL ECONOMY<br />
In the short run, <str<strong>on</strong>g>high</str<strong>on</strong>g>er <str<strong>on</strong>g>oil</str<strong>on</strong>g> <str<strong>on</strong>g>prices</str<strong>on</strong>g> will undoubtedly have an <str<strong>on</strong>g>impact</str<strong>on</strong>g> <strong>on</strong> the rate <str<strong>on</strong>g>of</str<strong>on</strong>g> growth <str<strong>on</strong>g>of</str<strong>on</strong>g> the global<br />
ec<strong>on</strong>omy, as <str<strong>on</strong>g>oil</str<strong>on</strong>g> has such a significant role as a factor <str<strong>on</strong>g>of</str<strong>on</strong>g> producti<strong>on</strong> in agriculture, basic raw materials,<br />
manufactured products, and service industries. For agriculture, <str<strong>on</strong>g>oil</str<strong>on</strong>g> <str<strong>on</strong>g>impact</str<strong>on</strong>g>s as much as 20-50 percent <str<strong>on</strong>g>of</str<strong>on</strong>g><br />
total costs, for raw material industries 20-30 percent, for manufacturing industries 10-20 percent, and for<br />
service industries 5-10 percent. 4 However, while increased <str<strong>on</strong>g>oil</str<strong>on</strong>g> <str<strong>on</strong>g>prices</str<strong>on</strong>g> will slow the growth, and in the short<br />
term may limit or cut producti<strong>on</strong>, there are in many cases a wide range <str<strong>on</strong>g>of</str<strong>on</strong>g> substitutes for <str<strong>on</strong>g>oil</str<strong>on</strong>g> that could<br />
replace <str<strong>on</strong>g>oil</str<strong>on</strong>g> given time. For example, in the generati<strong>on</strong> <str<strong>on</strong>g>of</str<strong>on</strong>g> power, the electricity supply can within the short<br />
or medium term switch from <str<strong>on</strong>g>oil</str<strong>on</strong>g> to natural gas, coal, nuclear, solar, and even wind alternatives. In additi<strong>on</strong>,<br />
a range <str<strong>on</strong>g>of</str<strong>on</strong>g> c<strong>on</strong>servati<strong>on</strong> measures may be applied <strong>on</strong> the demand side. Changing to these new fuel<br />
sources will allow the producti<strong>on</strong> and c<strong>on</strong>sumpti<strong>on</strong> markets to expand after a short-term hiatus. As a result,<br />
<str<strong>on</strong>g>oil</str<strong>on</strong>g> will tend to become more focused into specific “products” such as, fertilizers for agriculture, or feed<br />
stock for plastics and chemicals as low cost substitutes will be harder to develop in the short and medium<br />
term (0-10 years) in these areas. In the l<strong>on</strong>ger term (10-15 years) 5 liquefied coal or cellulose-based<br />
alternatives (e.g., bioplastics) will likely be developed that can substitute for <str<strong>on</strong>g>oil</str<strong>on</strong>g>. Overall, therefore, while<br />
the <str<strong>on</strong>g>prices</str<strong>on</strong>g> <str<strong>on</strong>g>of</str<strong>on</strong>g> today may be moderated by substituti<strong>on</strong>, the worldwide expanding demand for <str<strong>on</strong>g>oil</str<strong>on</strong>g> is likely<br />
to be a c<strong>on</strong>sistently upward pressure <strong>on</strong> <str<strong>on</strong>g>oil</str<strong>on</strong>g> <str<strong>on</strong>g>prices</str<strong>on</strong>g>, and result in <str<strong>on</strong>g>oil</str<strong>on</strong>g> <str<strong>on</strong>g>prices</str<strong>on</strong>g> stabilizing at far <str<strong>on</strong>g>high</str<strong>on</strong>g>er levels<br />
than were experienced in the 1990’s or before 2005. This will result in a short or even medium downturn<br />
in the U.S. and world ec<strong>on</strong>omies shaving 1 or 2 percentage points per year <str<strong>on</strong>g>of</str<strong>on</strong>g>f U.S. GDP.<br />
2.3 THE COSTS OF MARINE AND INLAND SHIPPING<br />
In the last five years the transport industry has experienced a five to eight fold increase in the price <str<strong>on</strong>g>of</str<strong>on</strong>g> fuel<br />
for marine and inland shipping (i.e., as a result <str<strong>on</strong>g>of</str<strong>on</strong>g> a price increase in crude <str<strong>on</strong>g>oil</str<strong>on</strong>g> from $20 to $140 per<br />
barrel). This causes a major “dislocati<strong>on</strong>” for industry that may significantly <str<strong>on</strong>g>impact</str<strong>on</strong>g> the current distributi<strong>on</strong><br />
pattern <str<strong>on</strong>g>of</str<strong>on</strong>g> goods and services. In the year 2000 fuel represented <strong>on</strong>ly 20 percent <str<strong>on</strong>g>of</str<strong>on</strong>g> transport operating<br />
costs, recently at $140 per barrel it represents over 50 percent, and were the <str<strong>on</strong>g>oil</str<strong>on</strong>g> price to rise to $200 a<br />
barrel, it would be over 70 percent <str<strong>on</strong>g>of</str<strong>on</strong>g> operating cost. Transport <str<strong>on</strong>g>prices</str<strong>on</strong>g> have risen by nearly 100 percent<br />
between 2002 and 2008, and could increase by almost another 300 percent if <str<strong>on</strong>g>oil</str<strong>on</strong>g> <str<strong>on</strong>g>prices</str<strong>on</strong>g> increase to $200<br />
per barrel. A <strong>on</strong>e-dollar rise in world <str<strong>on</strong>g>oil</str<strong>on</strong>g> <str<strong>on</strong>g>prices</str<strong>on</strong>g> leads to a 1 percent rise in trade transport costs. In terms<br />
<str<strong>on</strong>g>of</str<strong>on</strong>g> the marine and inland transport movement <str<strong>on</strong>g>of</str<strong>on</strong>g> a 40-foot c<strong>on</strong>tainer from Shanghai to Columbus, Ohio, the<br />
total transport cost was $3,000 when <str<strong>on</strong>g>oil</str<strong>on</strong>g> <str<strong>on</strong>g>prices</str<strong>on</strong>g> were $20 per barrel in the year 2000. Today at $140<br />
per barrel, the cost is $8,000, and should <str<strong>on</strong>g>oil</str<strong>on</strong>g> <str<strong>on</strong>g>prices</str<strong>on</strong>g> rise to $200 per barrel transport cost would rise to<br />
$15,000 per FEU (See Exhibit 4).<br />
4 R. Jimenez-Rodriquez. “The Industrial Impact <str<strong>on</strong>g>of</str<strong>on</strong>g> Oil Price Shocks: Evidence from the Industries <str<strong>on</strong>g>of</str<strong>on</strong>g> Six OECD<br />
Countries.” Documentos de Trabajo No. 0731. 2007; N. Velazquez. “Impact <str<strong>on</strong>g>of</str<strong>on</strong>g> Rising Energy Costs <strong>on</strong> Small<br />
Business.” C<strong>on</strong>gress <str<strong>on</strong>g>of</str<strong>on</strong>g> the United States. House <str<strong>on</strong>g>of</str<strong>on</strong>g> Representatives. August 10, 2006.<br />
5 M. Der Hovanesian. “I Have Just One Word For You: Bioplastics.” Business Week. June 30, 2008; B. Elgin. “The<br />
Dirty Truth About Clean Coal.” Business Week. 30 June 2008; D. M<strong>on</strong>tgomery. “Air Force Leads Push to Liquified<br />
Coal Fuel.” Seattle Times. March 30, 2008.<br />
TEMS, INC. OCTOBER 2008<br />
4
TECHNICAL REPORT - IMPACT OF HIGH OIL PRICES ON FREIGHT TRANSPORTATION:<br />
MODAL SHIFT POTENTIAL IN FIVE CORRIDORS<br />
Exhibit 4: Cost <str<strong>on</strong>g>of</str<strong>on</strong>g> Transporting a C<strong>on</strong>tainer (FEU) from Shanghai to Columbus, Ohio<br />
at Different Oil Prices ($2008)<br />
$16,000<br />
$14,000<br />
$12,000<br />
$10,000<br />
$8,000<br />
$6,000<br />
$4,000<br />
$2,000<br />
$0<br />
$20<br />
2000 2005 2008<br />
Price per Barrel<br />
Ocean Shipping Inland Transport<br />
The <str<strong>on</strong>g>prices</str<strong>on</strong>g> <str<strong>on</strong>g>of</str<strong>on</strong>g> food, c<strong>on</strong>sumer goods (e.g., electr<strong>on</strong>ics, furniture, and clothes), and capital goods items like<br />
cars and houses are all likely to suffer from c<strong>on</strong>tinuing <str<strong>on</strong>g>oil</str<strong>on</strong>g> price shocks. 6 It is estimated that the realignment<br />
<str<strong>on</strong>g>of</str<strong>on</strong>g> <str<strong>on</strong>g>prices</str<strong>on</strong>g> will result in a significant set back in the growth <str<strong>on</strong>g>of</str<strong>on</strong>g> the world ec<strong>on</strong>omy and both suppliers and<br />
c<strong>on</strong>sumers will face a change in “equilibrium” <str<strong>on</strong>g>of</str<strong>on</strong>g> the ec<strong>on</strong>omy, with suppliers having to increase <str<strong>on</strong>g>prices</str<strong>on</strong>g> to<br />
pay for the increased producti<strong>on</strong> and transport costs, and c<strong>on</strong>sumers having to reduce demand as <str<strong>on</strong>g>prices</str<strong>on</strong>g><br />
rise. A good example <str<strong>on</strong>g>of</str<strong>on</strong>g> the <str<strong>on</strong>g>impact</str<strong>on</strong>g> <str<strong>on</strong>g>of</str<strong>on</strong>g> increased <str<strong>on</strong>g>oil</str<strong>on</strong>g> <str<strong>on</strong>g>prices</str<strong>on</strong>g> <strong>on</strong> transportati<strong>on</strong> is shown by the change in the<br />
supply and demand c<strong>on</strong>diti<strong>on</strong>s for steel producti<strong>on</strong>. Chinese exports <str<strong>on</strong>g>of</str<strong>on</strong>g> steel to the U.S. are now falling <strong>on</strong><br />
a year over year basis by more than 20 percent, while U.S. steel output is rising by 10 percent a year.<br />
While producti<strong>on</strong> costs in China and the U.S. are very similar at $600 per t<strong>on</strong> <str<strong>on</strong>g>of</str<strong>on</strong>g> rolled steel (due to<br />
exchange rate changes), the extra shipping cost faced by Chinese steel <str<strong>on</strong>g>of</str<strong>on</strong>g> $100 per t<strong>on</strong> is making it<br />
uncompetitive in U.S. markets (See Exhibit 5). The new equilibrium will result in a short to medium term<br />
change in the market. In effect, the el<strong>on</strong>gated supply chain from China has been neutralized by <str<strong>on</strong>g>high</str<strong>on</strong>g>er <str<strong>on</strong>g>oil</str<strong>on</strong>g><br />
<str<strong>on</strong>g>prices</str<strong>on</strong>g>. As the market had become reflective <str<strong>on</strong>g>of</str<strong>on</strong>g> transport c<strong>on</strong>diti<strong>on</strong>s 10 to 20 years earlier in terms <str<strong>on</strong>g>of</str<strong>on</strong>g><br />
volumes transported and supplied to the market, 7 the result should be a short-term shake out am<strong>on</strong>g<br />
producers, and a more competitive market as demand falls. Lower cost producers will gain market share<br />
at the expense <str<strong>on</strong>g>of</str<strong>on</strong>g> <str<strong>on</strong>g>high</str<strong>on</strong>g> cost producers. All producers will look for cheaper ways to supply the market, and<br />
c<strong>on</strong>sumers will look for competitively priced goods. Clearly pressure will be <strong>on</strong> the transport supply<br />
industry to find more cost-effective alternatives.<br />
6 R. Avent. “A World Less Flat.” Guardian, UK. June 25, 2008.<br />
7 J. Rubin. “The New Inflati<strong>on</strong>.” CIBC World Markets. May 27, 2008.<br />
TEMS, INC. OCTOBER 2008<br />
$50<br />
$140<br />
$150<br />
$200<br />
5
TECHNICAL REPORT - IMPACT OF HIGH OIL PRICES ON FREIGHT TRANSPORTATION:<br />
MODAL SHIFT POTENTIAL IN FIVE CORRIDORS<br />
Exhibit 5: China’s Steel Exports to U.S. Fall, While U.S. Steel Producti<strong>on</strong> Rises<br />
2.4 COMPETITIVE RELATIONSHIPS AND INLAND DISTRIBUTION SYSTEM<br />
In the marine transport system, the <str<strong>on</strong>g>high</str<strong>on</strong>g>er costs <str<strong>on</strong>g>of</str<strong>on</strong>g> <str<strong>on</strong>g>oil</str<strong>on</strong>g> and its market <str<strong>on</strong>g>impact</str<strong>on</strong>g>s will put tremendous pressure<br />
<strong>on</strong> carriers to become more and more competitive, and to seek both operating savings and “ec<strong>on</strong>omies <str<strong>on</strong>g>of</str<strong>on</strong>g><br />
scale” to <str<strong>on</strong>g>of</str<strong>on</strong>g>fset <str<strong>on</strong>g>high</str<strong>on</strong>g>er fuel <str<strong>on</strong>g>prices</str<strong>on</strong>g>. For example, in terms <str<strong>on</strong>g>of</str<strong>on</strong>g> operating savings, it is estimated that over the<br />
last 15 years the increase in speed <str<strong>on</strong>g>of</str<strong>on</strong>g> the world fleet from 20 to 29 knots has doubled fuel c<strong>on</strong>sumpti<strong>on</strong><br />
per unit <str<strong>on</strong>g>of</str<strong>on</strong>g> <strong>freight</strong>. As such, it is not surprising that the increased cost <str<strong>on</strong>g>of</str<strong>on</strong>g> <str<strong>on</strong>g>oil</str<strong>on</strong>g> is now slowing the fleet. In<br />
terms <str<strong>on</strong>g>of</str<strong>on</strong>g> “ec<strong>on</strong>omies <str<strong>on</strong>g>of</str<strong>on</strong>g> scale” this would suggest an even more intense drive to larger ships as a mechanism<br />
to <str<strong>on</strong>g>of</str<strong>on</strong>g>fset <str<strong>on</strong>g>high</str<strong>on</strong>g>er <str<strong>on</strong>g>oil</str<strong>on</strong>g> <str<strong>on</strong>g>prices</str<strong>on</strong>g> per unit <str<strong>on</strong>g>of</str<strong>on</strong>g> <strong>freight</strong>. As a result, there may well be a new round <str<strong>on</strong>g>of</str<strong>on</strong>g> tanker, bulk,<br />
and c<strong>on</strong>tainer ship development as carriers seek to be more and more competitive. Equally, given the<br />
<str<strong>on</strong>g>high</str<strong>on</strong>g>er costs <str<strong>on</strong>g>of</str<strong>on</strong>g> the inland distributi<strong>on</strong> system, shippers may well seek to maximize marine movements and<br />
minimize inland distributi<strong>on</strong> costs. Inland distributi<strong>on</strong> costs8,9 are much <str<strong>on</strong>g>high</str<strong>on</strong>g>er per t<strong>on</strong>, teu, etc., than maritime<br />
costs. As a result, <str<strong>on</strong>g>high</str<strong>on</strong>g>er <str<strong>on</strong>g>oil</str<strong>on</strong>g> <str<strong>on</strong>g>prices</str<strong>on</strong>g> could:<br />
• Increase the maritime trip length, which favors Atlantic and Gulf ports instead <str<strong>on</strong>g>of</str<strong>on</strong>g> West Coast<br />
ports for Asian traffic.<br />
• Shift traffic from truck to rail and water for inland distributi<strong>on</strong>.<br />
In terms <str<strong>on</strong>g>of</str<strong>on</strong>g> inland distributi<strong>on</strong>, the increase in <str<strong>on</strong>g>oil</str<strong>on</strong>g> <str<strong>on</strong>g>prices</str<strong>on</strong>g> has significantly <str<strong>on</strong>g>impact</str<strong>on</strong>g>ed the relative advantage<br />
<str<strong>on</strong>g>of</str<strong>on</strong>g> the lower cost modes rail and water. The truck industry has been badly damaged, and in particular,<br />
many small owner-operators have been forced out <str<strong>on</strong>g>of</str<strong>on</strong>g> the market by increased <str<strong>on</strong>g>oil</str<strong>on</strong>g> <str<strong>on</strong>g>prices</str<strong>on</strong>g>. Already beset<br />
with labor shortages and l<strong>on</strong>ger travel times due to <str<strong>on</strong>g>high</str<strong>on</strong>g>way c<strong>on</strong>gesti<strong>on</strong>, the industry is being forced to<br />
c<strong>on</strong>solidate by <str<strong>on</strong>g>high</str<strong>on</strong>g>er <str<strong>on</strong>g>oil</str<strong>on</strong>g> <str<strong>on</strong>g>prices</str<strong>on</strong>g>, which will have a tendency to increase truck rates. This will occur despite<br />
the improvements in productivity that c<strong>on</strong>solidati<strong>on</strong> will produce. For example, an improved percentage <str<strong>on</strong>g>of</str<strong>on</strong>g><br />
backhauls, which are so difficult for the smaller trucking firms to obtain, are more likely in a c<strong>on</strong>solidated<br />
industry. Large firms with a wide range <str<strong>on</strong>g>of</str<strong>on</strong>g> “hubs” and “operating centers” across the country can far more<br />
easily find backhauls from <strong>on</strong>e regi<strong>on</strong> to another, and c<strong>on</strong>solidate traffic because <str<strong>on</strong>g>of</str<strong>on</strong>g> their broader network<br />
<str<strong>on</strong>g>of</str<strong>on</strong>g> routes.<br />
8 Maritime Administrati<strong>on</strong> (USDOT)/Transport Canada, Great Lakes-St. Lawrence Seaway Study- New Cargoes/New<br />
Vessels Market Assessment Report, TEMS, Inc./RAND. January 2007.<br />
9 U.S. Ports Model: Route Choice Model, TEMS, Inc. 2008.<br />
TEMS, INC. OCTOBER 2008<br />
6
TECHNICAL REPORT - IMPACT OF HIGH OIL PRICES ON FREIGHT TRANSPORTATION:<br />
MODAL SHIFT POTENTIAL IN FIVE CORRIDORS<br />
For rail, increasing <str<strong>on</strong>g>oil</str<strong>on</strong>g> <str<strong>on</strong>g>prices</str<strong>on</strong>g> are far less <str<strong>on</strong>g>of</str<strong>on</strong>g> a problem than for trucking because rail is far more fuelefficient.<br />
The cost <str<strong>on</strong>g>of</str<strong>on</strong>g> fuel <str<strong>on</strong>g>oil</str<strong>on</strong>g> is a far smaller percentage <str<strong>on</strong>g>of</str<strong>on</strong>g> total rail operating costs and as such will result<br />
in far smaller percentage rate increases. However, <strong>freight</strong> rail faces a very significant set <str<strong>on</strong>g>of</str<strong>on</strong>g> capacity<br />
problems and so rail has <strong>on</strong>ly very limited ability to expand market share. As a result, the <strong>freight</strong> railroad<br />
is likely to price-up (including fuel surcharges), specialize in <str<strong>on</strong>g>high</str<strong>on</strong>g>er value goods, and reduce low value<br />
traffic. Key rail <strong>freight</strong> include coal and grain (for ethanol), which while being affected by the slow down<br />
in the world ec<strong>on</strong>omy due to <str<strong>on</strong>g>oil</str<strong>on</strong>g>, are in themselves fuels that may be used to substitute for <str<strong>on</strong>g>oil</str<strong>on</strong>g>, and may<br />
therefore c<strong>on</strong>tinue to see rising demand despite the reduced rate <str<strong>on</strong>g>of</str<strong>on</strong>g> world ec<strong>on</strong>omic growth. However,<br />
another key rail service, inter<strong>modal</strong> traffic has clearly reflected the slow down in the ec<strong>on</strong>omy. This is<br />
encouraging the railroads into collaborati<strong>on</strong> with trucking industry and may result in more diversi<strong>on</strong> from<br />
truck to rail, creating growth in some lanes while others shrink. For example, Kansas Southern saw<br />
inter<strong>modal</strong> revenues rise by 19 percent in the first quarter <str<strong>on</strong>g>of</str<strong>on</strong>g> 2007, as traffic switched from truck to rail.<br />
For water, the market positi<strong>on</strong> is similar to that <str<strong>on</strong>g>of</str<strong>on</strong>g> rail as it can provide an alternative to truck because <str<strong>on</strong>g>of</str<strong>on</strong>g><br />
water’s lower operating costs. The major issue is that because the water mode is so much slower than truck<br />
or rail it has not been able to move into the <str<strong>on</strong>g>high</str<strong>on</strong>g>er value c<strong>on</strong>tainer or inter<strong>modal</strong> business, and has<br />
typically <strong>on</strong>ly substituted for truck or rail in bulk and neobulk markets. However, as both truck and rail<br />
have capacity problems while water has c<strong>on</strong>siderable capacity, the opportunity may now exist for water<br />
to move up market from bulk traffic, first into neobulks (steel c<str<strong>on</strong>g>oil</str<strong>on</strong>g>) and then into c<strong>on</strong>tainerized <strong>freight</strong>,<br />
particularly where market c<strong>on</strong>diti<strong>on</strong>s provide additi<strong>on</strong>al advantage for water (e.g., shorter water distance,<br />
easier port transfers, etc.).<br />
TEMS, INC. OCTOBER 2008<br />
7
3<br />
TECHNICAL REPORT - IMPACT OF HIGH OIL PRICES ON FREIGHT TRANSPORTATION:<br />
MODAL SHIFT POTENTIAL IN FIVE CORRIDORS<br />
OIL PRICES TODAY AND IN THE FUTURE<br />
3.1 THE HISTORY OF OIL PRICES<br />
Since 1970 and prior to 2004 the world has suffered a number <str<strong>on</strong>g>of</str<strong>on</strong>g> <str<strong>on</strong>g>oil</str<strong>on</strong>g> price shocks largely due to the<br />
acti<strong>on</strong>s <str<strong>on</strong>g>of</str<strong>on</strong>g> OPEC, and Middle East wars (See Exhibit 6). However, the recent <str<strong>on</strong>g>oil</str<strong>on</strong>g> crisis has resulted in the<br />
nominal price <str<strong>on</strong>g>of</str<strong>on</strong>g> <str<strong>on</strong>g>oil</str<strong>on</strong>g> far exceeding any previous crisis at $140 per barrel. In nominal terms, the refiner<br />
acquisiti<strong>on</strong> cost <str<strong>on</strong>g>of</str<strong>on</strong>g> <str<strong>on</strong>g>oil</str<strong>on</strong>g> (which is typically 95 percent <str<strong>on</strong>g>of</str<strong>on</strong>g> domestic market price) did not exceed $40 per<br />
barrel, prior to 2006 and major price spikes were largely due to Middle East wars, such as the Arab <str<strong>on</strong>g>oil</str<strong>on</strong>g><br />
embargo (1973), Iran/Iraq War (1982), and Persian Gulf War (1992). That situati<strong>on</strong> changed after the<br />
year 2000 when n<strong>on</strong>-supply issues like the growth in world <str<strong>on</strong>g>oil</str<strong>on</strong>g> demand (2003 to 2007) began to <str<strong>on</strong>g>impact</str<strong>on</strong>g><br />
<str<strong>on</strong>g>oil</str<strong>on</strong>g> <str<strong>on</strong>g>prices</str<strong>on</strong>g>. From a low <str<strong>on</strong>g>of</str<strong>on</strong>g> $10 per barrel in 1999, <str<strong>on</strong>g>oil</str<strong>on</strong>g> <str<strong>on</strong>g>prices</str<strong>on</strong>g> rose quickly in nominal terms to nearly $70<br />
per barrel in 2006 and to $140 per barrel in 2008.<br />
$ per barrel<br />
$140<br />
$130<br />
$120<br />
$110<br />
$100<br />
$90<br />
$80<br />
$70<br />
$60<br />
$50<br />
$40<br />
$30<br />
$20<br />
$10<br />
$-<br />
Saudi<br />
Light<br />
1970<br />
1972<br />
Exhibit 6: Major Events and Nominal World Oil Prices, 1970-2008:<br />
Imported Refiner Acquisiti<strong>on</strong> Cost<br />
Iranian<br />
Revoluti<strong>on</strong>;<br />
Shah Deposed<br />
1974<br />
1976<br />
Iran-Iraq War<br />
Begins; <str<strong>on</strong>g>oil</str<strong>on</strong>g> <str<strong>on</strong>g>prices</str<strong>on</strong>g><br />
peak<br />
1973 Arab Oil<br />
Embargo<br />
1978<br />
TEMS, INC. OCTOBER 2008<br />
1980<br />
1982<br />
Saudis<br />
aband<strong>on</strong><br />
"swing<br />
producer" role;<br />
<str<strong>on</strong>g>oil</str<strong>on</strong>g> <str<strong>on</strong>g>prices</str<strong>on</strong>g><br />
collapse<br />
1984<br />
1986<br />
Iraq<br />
Invades<br />
Kuwait<br />
1988<br />
1990<br />
1992<br />
Gulf War<br />
Asian ec<strong>on</strong>omic crisis;<br />
<str<strong>on</strong>g>oil</str<strong>on</strong>g> oversupply; <str<strong>on</strong>g>prices</str<strong>on</strong>g><br />
fall sharply<br />
1994<br />
Prices rise <strong>on</strong> OPEC<br />
cutbacks, increased<br />
demand<br />
1996<br />
1998<br />
Prices spike<br />
due to<br />
demand<br />
factors<br />
Prices spike <strong>on</strong> Iraq war, rapid<br />
demand increases,<br />
c<strong>on</strong>strained OPEC capacity,<br />
low inventories, etc.<br />
2000<br />
Prices fall sharply<br />
<strong>on</strong> 9/11 attacks;<br />
ec<strong>on</strong>omic weakness<br />
2002<br />
2004<br />
August-08<br />
$135 (Est)<br />
June-08<br />
$125<br />
PdVSA<br />
workers<br />
strike in<br />
Venezuela<br />
2006<br />
2008<br />
Source: EIA, BLS and TEMS<br />
8
TECHNICAL REPORT - IMPACT OF HIGH OIL PRICES ON FREIGHT TRANSPORTATION:<br />
MODAL SHIFT POTENTIAL IN FIVE CORRIDORS<br />
Even in real terms (See Exhibit 7), <str<strong>on</strong>g>oil</str<strong>on</strong>g> <str<strong>on</strong>g>prices</str<strong>on</strong>g> (adjusted for inflati<strong>on</strong>) remained within historic norms up to<br />
2006, when the <str<strong>on</strong>g>oil</str<strong>on</strong>g> price per barrel was at $70. The price was lower than that in the 1982 Iran/Iraq war<br />
when the <str<strong>on</strong>g>oil</str<strong>on</strong>g> price peak at over $90 per barrel in 2006 dollars. However, after 2006 it is clear that there<br />
is a major change in the market with the average 2008 price rising dramatically to $125 in 2006 dollars,<br />
and peaking at over $140 per barrel in 2008 dollars.<br />
C<strong>on</strong>stant $ per barrel<br />
$140<br />
$130<br />
$120<br />
$110<br />
$100<br />
$90<br />
$80<br />
$70<br />
$60<br />
$50<br />
$40<br />
$30<br />
$20<br />
$10<br />
$-<br />
1970<br />
Saudi<br />
Light<br />
1973 Arab Oil<br />
Embargo<br />
1972<br />
Exhibit 7: Major Events and Real World Oil Prices, 1970-2008: Imported<br />
Refiner Acquisiti<strong>on</strong> Cost (Prices adjusted by CPI using June 2008 as a base)<br />
Iran-Iraq War Begins;<br />
<str<strong>on</strong>g>oil</str<strong>on</strong>g> <str<strong>on</strong>g>prices</str<strong>on</strong>g> peak-<br />
$96.74<br />
1974<br />
Iranian<br />
Revoluti<strong>on</strong>;<br />
Shah Deposed<br />
1976<br />
1978<br />
TEMS, INC. OCTOBER 2008<br />
1980<br />
1982<br />
1984<br />
Saudis aband<strong>on</strong> "swing<br />
producer" role; <str<strong>on</strong>g>oil</str<strong>on</strong>g> <str<strong>on</strong>g>prices</str<strong>on</strong>g><br />
collapse<br />
1986<br />
Iraq Invades<br />
Kuwait<br />
1988<br />
1990<br />
1992<br />
Gulf War<br />
Asian ec<strong>on</strong>omic crisis;<br />
<str<strong>on</strong>g>oil</str<strong>on</strong>g> oversupply; <str<strong>on</strong>g>prices</str<strong>on</strong>g><br />
fall sharply<br />
1994<br />
Prices rise <strong>on</strong> OPEC<br />
cutbacks, increased<br />
demand<br />
1996<br />
1998<br />
Prices spike<br />
due to<br />
demand<br />
factors<br />
Prices spike <strong>on</strong> Iraq war, rapid<br />
demand increases,<br />
c<strong>on</strong>strained OPEC capacity,<br />
low inventories, etc.<br />
2000<br />
Prices fall sharply<br />
<strong>on</strong> 9/11 attacks;<br />
ec<strong>on</strong>omic weakness<br />
2002<br />
2004<br />
August-08<br />
$135 (Est)<br />
June-08<br />
$125<br />
PdVSA<br />
workers strike<br />
in Venezuela<br />
2006<br />
2008<br />
Source: EIA, BLS and TEMS<br />
According to the Internati<strong>on</strong>al Energy Agency (IEA), the recent rise in <str<strong>on</strong>g>oil</str<strong>on</strong>g> <str<strong>on</strong>g>prices</str<strong>on</strong>g> reflects the <str<strong>on</strong>g>impact</str<strong>on</strong>g> <str<strong>on</strong>g>of</str<strong>on</strong>g> global<br />
demand factors. For the first time world demand is c<strong>on</strong>sidered to have become a significant influence <strong>on</strong><br />
<str<strong>on</strong>g>oil</str<strong>on</strong>g> <str<strong>on</strong>g>prices</str<strong>on</strong>g> and heralded a new <str<strong>on</strong>g>oil</str<strong>on</strong>g> price equilibrium. For example, Mr. Rick Wag<strong>on</strong>er CEO <str<strong>on</strong>g>of</str<strong>on</strong>g> General<br />
Motors described the new <str<strong>on</strong>g>oil</str<strong>on</strong>g> <str<strong>on</strong>g>prices</str<strong>on</strong>g> as a major dislocati<strong>on</strong> in the world ec<strong>on</strong>omy to which his firm would<br />
need to adjust. 10 It was not c<strong>on</strong>sidered a temporary <str<strong>on</strong>g>impact</str<strong>on</strong>g> that, in the case <str<strong>on</strong>g>of</str<strong>on</strong>g> previous “war driven” <str<strong>on</strong>g>oil</str<strong>on</strong>g><br />
crises, would slowly subside as peace was restored to the Middle East. Rather, it represented a major<br />
permanent structural ec<strong>on</strong>omic <strong>shift</strong> that would need to be resp<strong>on</strong>ded to <strong>on</strong> a permanent basis,<br />
representing not a temporary shortage <str<strong>on</strong>g>of</str<strong>on</strong>g> supply but l<strong>on</strong>g-term growth in world demand that existing<br />
world supply could not meet.<br />
10 H. Schneider. “GM Closing 4 Truck and SUV Plants in North America.” washingt<strong>on</strong>post.com. June 3, 2008<br />
9
TECHNICAL REPORT - IMPACT OF HIGH OIL PRICES ON FREIGHT TRANSPORTATION:<br />
MODAL SHIFT POTENTIAL IN FIVE CORRIDORS<br />
3.2 THE FUTURE RANGE OF OIL PRICES<br />
From the review <str<strong>on</strong>g>of</str<strong>on</strong>g> discussi<strong>on</strong> and historic data <strong>on</strong> <str<strong>on</strong>g>oil</str<strong>on</strong>g> <str<strong>on</strong>g>prices</str<strong>on</strong>g>, it is clear that there is much uncertainty about<br />
how <str<strong>on</strong>g>oil</str<strong>on</strong>g> <str<strong>on</strong>g>prices</str<strong>on</strong>g> may change in the future. To evaluate how the potential range <str<strong>on</strong>g>of</str<strong>on</strong>g> <str<strong>on</strong>g>oil</str<strong>on</strong>g> <str<strong>on</strong>g>prices</str<strong>on</strong>g> might affect the<br />
transport industry, three potential scenarios 11 were developed. These include a low (optimistic) case, <str<strong>on</strong>g>high</str<strong>on</strong>g><br />
(pessimistic) case, and a central case.<br />
In order to prepare these scenarios the following procedures were used. First, historic data from years<br />
2000 to 2007 12 were derived from the Energy Informati<strong>on</strong> Administrati<strong>on</strong> (EIA database). In additi<strong>on</strong>,<br />
forecasts from the EIA Short Term Energy Outlook (2008-2009) 13 were used that reflected recent price<br />
increases for the first six m<strong>on</strong>ths <str<strong>on</strong>g>of</str<strong>on</strong>g> 2008. This established new forecasts for years 2008 and 2009.<br />
Sec<strong>on</strong>d, in order to develop l<strong>on</strong>g-term forecasts, the growth rates developed by the EIA for l<strong>on</strong>g term<br />
central, <str<strong>on</strong>g>high</str<strong>on</strong>g>, and low case scenarios were used. 14 The EIA average annual growth rates were linked<br />
directly to the July 2008 short term values, and forecasts were generated to 2020 for the central, <str<strong>on</strong>g>high</str<strong>on</strong>g>,<br />
and low case scenarios. The forecasts are shown in Exhibits 8 and 9 in both nominal and c<strong>on</strong>stant (2008)<br />
dollars. To develop the nominal dollar estimate for the <str<strong>on</strong>g>prices</str<strong>on</strong>g> <str<strong>on</strong>g>of</str<strong>on</strong>g> <str<strong>on</strong>g>oil</str<strong>on</strong>g>, the c<strong>on</strong>stant 2008 dollar values were<br />
inflated by an inflati<strong>on</strong> rate <str<strong>on</strong>g>of</str<strong>on</strong>g> 3 percent per year.<br />
Optimistic Scenario (Low Case): Under the optimistic view or low price scenario, new <str<strong>on</strong>g>oil</str<strong>on</strong>g> supplies and<br />
substitutes are gradually brought <strong>on</strong> line (i.e., over 2-3 years) and then <str<strong>on</strong>g>oil</str<strong>on</strong>g> <str<strong>on</strong>g>prices</str<strong>on</strong>g> fall to a new <str<strong>on</strong>g>high</str<strong>on</strong>g>er<br />
equilibrium level <str<strong>on</strong>g>of</str<strong>on</strong>g> $60-80 per barrel. This reflects the fact that supply c<strong>on</strong>diti<strong>on</strong>s improve and that an<br />
increase in supply will return the ec<strong>on</strong>omy to a moderate or <str<strong>on</strong>g>high</str<strong>on</strong>g> growth strategy. While c<strong>on</strong>diti<strong>on</strong>s will<br />
not be as advantageous as they were in the 1990’s, increased <str<strong>on</strong>g>oil</str<strong>on</strong>g> supplies and improved energy use<br />
productivity result in a new equilibrium level for the ec<strong>on</strong>omy that will operate very efficiently with <str<strong>on</strong>g>oil</str<strong>on</strong>g> costs<br />
<strong>on</strong>ly double or triple what they were in the 1990’s. This scenario is similar to what happened after the<br />
Iran-Iraq war when <str<strong>on</strong>g>oil</str<strong>on</strong>g> <str<strong>on</strong>g>prices</str<strong>on</strong>g> peaked at $97 compared to the $140 recently experienced. The difference<br />
with that situati<strong>on</strong> is that <str<strong>on</strong>g>oil</str<strong>on</strong>g> returned to $20 - $30 per barrel after five years <str<strong>on</strong>g>of</str<strong>on</strong>g> a steady fall, instead <str<strong>on</strong>g>of</str<strong>on</strong>g><br />
halting at a <str<strong>on</strong>g>high</str<strong>on</strong>g>er level <str<strong>on</strong>g>of</str<strong>on</strong>g> $60 - $80 per barrel forecast under this scenario. This scenario assumes that<br />
OPEC would expand output so that it’s nearly keeping pace with the expanding demand in China and<br />
India so that while world demand is <str<strong>on</strong>g>high</str<strong>on</strong>g>, so is supply. As a result, the ability to stabilize <str<strong>on</strong>g>oil</str<strong>on</strong>g> <str<strong>on</strong>g>prices</str<strong>on</strong>g> even at<br />
a new <str<strong>on</strong>g>high</str<strong>on</strong>g>er equilibrium price floor will lead to renewed growth in the ec<strong>on</strong>omy and a gradual rise over<br />
3 to 5 years in GDP growth to the 1990’s levels <str<strong>on</strong>g>of</str<strong>on</strong>g> 3 to 4 percent per year.<br />
Pessimistic Scenario (High Case): Under the pessimistic or <str<strong>on</strong>g>high</str<strong>on</strong>g> price scenario, the expansi<strong>on</strong> <str<strong>on</strong>g>of</str<strong>on</strong>g> world<br />
demand is so str<strong>on</strong>g that the new equilibrium level will be c<strong>on</strong>sistently rising to over $200 per barrel, and<br />
that this change is likely to be permanent, and specifically, due to the growth <str<strong>on</strong>g>of</str<strong>on</strong>g> Asian and Latin American<br />
markets. In this scenario, it is envisaged that despite OPECs best efforts to expand producti<strong>on</strong>, the use <str<strong>on</strong>g>of</str<strong>on</strong>g><br />
supply substitutes, and efficient energy use, it is still not possible to keep world <str<strong>on</strong>g>oil</str<strong>on</strong>g> producti<strong>on</strong> up with<br />
expanding world demand for <str<strong>on</strong>g>oil</str<strong>on</strong>g>. Rising l<strong>on</strong>g-term <str<strong>on</strong>g>oil</str<strong>on</strong>g> <str<strong>on</strong>g>prices</str<strong>on</strong>g> dampens the U.S. ec<strong>on</strong>omy’s ability to grow<br />
so that growth rates moderate to 1 to 2 percent per year as increasing <str<strong>on</strong>g>oil</str<strong>on</strong>g> <str<strong>on</strong>g>prices</str<strong>on</strong>g> almost completely<br />
absorbs much <str<strong>on</strong>g>of</str<strong>on</strong>g> the productivity gains and growth <str<strong>on</strong>g>of</str<strong>on</strong>g> the ec<strong>on</strong>omy. While living standards rise, such slow<br />
growth will reduce the dynamism <str<strong>on</strong>g>of</str<strong>on</strong>g> the ec<strong>on</strong>omy and its ability to rebuild itself every ten to twenty years.<br />
11 Prepared by TEMS using EIA historic data and projecti<strong>on</strong>s.<br />
12 The historic data for 2000-2007 is taken from Energy Informati<strong>on</strong> Administrati<strong>on</strong> (EIA) website.<br />
(http://t<strong>on</strong>to.eia.doe.gov/dnav/pet/pet_pri_rac2_dcu_nus_m.htm).<br />
13 Data for 2008-2009 are obtained from EIA Short Term Energy Outlook, July 8, 2008, (http://www.eia.doe.gov/steo).<br />
14 L<strong>on</strong>g-term forecast for years 2010-2020 was prepared by using growth rates assumed by EIA in accordance with three<br />
scenarios - low, reference and <str<strong>on</strong>g>high</str<strong>on</strong>g>. (See: Annual Energy Outlook 2008, June 2008 Table 12,<br />
http://www.eia.doe.gov/oiaf/aeo/index.html). EIA growth rates were applied to the 2009 numbers obtained in step 3.<br />
Annual inflati<strong>on</strong> rate <str<strong>on</strong>g>of</str<strong>on</strong>g> 3.0% was assumed in order to transfer data into nominal <str<strong>on</strong>g>prices</str<strong>on</strong>g>.<br />
TEMS, INC. OCTOBER 2008<br />
10
TECHNICAL REPORT - IMPACT OF HIGH OIL PRICES ON FREIGHT TRANSPORTATION:<br />
MODAL SHIFT POTENTIAL IN FIVE CORRIDORS<br />
In the worst case, the U.S. may suffer from the “European disease” <str<strong>on</strong>g>of</str<strong>on</strong>g> a “mature ec<strong>on</strong>omy,” or the<br />
“Japanese disease” <str<strong>on</strong>g>of</str<strong>on</strong>g> stagflati<strong>on</strong>.<br />
Central Scenario (Middle Case): As a result, we have two very different perspectives <strong>on</strong> <str<strong>on</strong>g>oil</str<strong>on</strong>g> <str<strong>on</strong>g>prices</str<strong>on</strong>g> as<br />
shown in Exhibit 8. A third, central scenario would be a stable or slightly falling set <str<strong>on</strong>g>of</str<strong>on</strong>g> <str<strong>on</strong>g>oil</str<strong>on</strong>g> <str<strong>on</strong>g>prices</str<strong>on</strong>g> based <strong>on</strong><br />
the idea that increasing world demand will strain existing <str<strong>on</strong>g>oil</str<strong>on</strong>g> supplies, but that new substitutes would<br />
gradually become available (e.g., ethanol based <strong>on</strong> sugar cane/biomass), and new <str<strong>on</strong>g>oil</str<strong>on</strong>g> finds will be<br />
brought <strong>on</strong> line such as the recently U.S. Geological Survey announced Bakken <str<strong>on</strong>g>oil</str<strong>on</strong>g> finds in North Dakota,<br />
M<strong>on</strong>tana, and southeastern Saskatchewan. 15 This suggests an intermediate course that would fall between<br />
the optimistic and pessimistic cases. However, this scenario will see l<strong>on</strong>g term <str<strong>on</strong>g>oil</str<strong>on</strong>g> <str<strong>on</strong>g>prices</str<strong>on</strong>g> at least quadruple<br />
in nominal terms what they were in the 1990’s. In this scenario, the pace <str<strong>on</strong>g>of</str<strong>on</strong>g> the ec<strong>on</strong>omy quickens after<br />
two or three years <str<strong>on</strong>g>of</str<strong>on</strong>g> very low growth reflecting the current slowdown. Increased growth results from<br />
increased <str<strong>on</strong>g>oil</str<strong>on</strong>g> producti<strong>on</strong>, substitute fuels, and energy use productivity, which gradually outpace growth in<br />
world demand for <str<strong>on</strong>g>oil</str<strong>on</strong>g>. This leads to stable or slowly falling <str<strong>on</strong>g>oil</str<strong>on</strong>g> <str<strong>on</strong>g>prices</str<strong>on</strong>g> at $100 to $120 a barrel by 2016<br />
in nominal <str<strong>on</strong>g>prices</str<strong>on</strong>g>, but remaining under $100 per barrel in 2008 <str<strong>on</strong>g>prices</str<strong>on</strong>g>. After six to ten years <str<strong>on</strong>g>of</str<strong>on</strong>g> 2-3<br />
percent GDP growth, the new equilibrium <str<strong>on</strong>g>oil</str<strong>on</strong>g> price <str<strong>on</strong>g>of</str<strong>on</strong>g> $90-$100 enables U.S. ec<strong>on</strong>omy to increase 3-4<br />
percent GDP growth per year. This middle-case equilibrium price for <str<strong>on</strong>g>oil</str<strong>on</strong>g> reflects the balance between<br />
OPEC and the world <str<strong>on</strong>g>oil</str<strong>on</strong>g> producti<strong>on</strong> capability, and the expansi<strong>on</strong> <str<strong>on</strong>g>of</str<strong>on</strong>g> world demand. It assumes major<br />
gains in energy supply, the development <str<strong>on</strong>g>of</str<strong>on</strong>g> substitute fuels, and improved energy use productivity (e.g.,<br />
<str<strong>on</strong>g>high</str<strong>on</strong>g>er fuel-efficiency standards for automobiles), not just in the U.S., North America, and Europe but in<br />
Asia as well.<br />
Exhibit 8: Crude Oil Nominal Prices - Annual Averages (Imported Refiner Acquisiti<strong>on</strong> Cost per Barrel)<br />
$250<br />
$200<br />
$150<br />
$100<br />
$50<br />
$0<br />
2000 2002 2004 2006 2008 2010 2012 2014 2016 2018 2020 2022<br />
Year<br />
Low Central High<br />
15 U.S. Department <str<strong>on</strong>g>of</str<strong>on</strong>g> the Interior. U.S. Geological Survey. April 10, 2008. www.usgc.gov. It is estimated that from this<br />
3.6-4.2 billi<strong>on</strong> barrel <str<strong>on</strong>g>oil</str<strong>on</strong>g> field (which represents an increase <str<strong>on</strong>g>of</str<strong>on</strong>g> 20 percent in current U.S. reserves), <str<strong>on</strong>g>oil</str<strong>on</strong>g> can be produced at<br />
$16-$20 per barrel and be completely marketed at <str<strong>on</strong>g>prices</str<strong>on</strong>g> <str<strong>on</strong>g>of</str<strong>on</strong>g> $40-$80 per barrel.<br />
TEMS, INC. OCTOBER 2008<br />
11
TECHNICAL REPORT - IMPACT OF HIGH OIL PRICES ON FREIGHT TRANSPORTATION:<br />
MODAL SHIFT POTENTIAL IN FIVE CORRIDORS<br />
Exhibit 9: Crude Oil C<strong>on</strong>stant Prices - Annual Averages (Imported Refiner Acquisiti<strong>on</strong> Cost per Barrel)<br />
$250<br />
$200<br />
$150<br />
$100<br />
$50<br />
$0<br />
2000 2002 2004 2006 2008 2010 2012 2014 2016 2018 2020 2022<br />
Low Central High<br />
TEMS, INC. OCTOBER 2008<br />
12
4<br />
TECHNICAL REPORT - IMPACT OF HIGH OIL PRICES ON FREIGHT TRANSPORTATION:<br />
MODAL SHIFT POTENTIAL IN FIVE CORRIDORS<br />
POTENTIAL IMPACT OF OIL PRICE<br />
SCENARIOS<br />
4.1 OIL PRICE SCENARIOS<br />
The analysis <str<strong>on</strong>g>of</str<strong>on</strong>g> <str<strong>on</strong>g>oil</str<strong>on</strong>g> price scenarios shows clearly that the operating costs <str<strong>on</strong>g>of</str<strong>on</strong>g> transportati<strong>on</strong> systems that<br />
support U.S. ground transportati<strong>on</strong> have fundamentally changed. At a minimum, U.S. transportati<strong>on</strong><br />
systems face a doubling <str<strong>on</strong>g>of</str<strong>on</strong>g> fuel costs compared with the equilibrium c<strong>on</strong>diti<strong>on</strong>s <str<strong>on</strong>g>of</str<strong>on</strong>g> the late 1990’s, and in<br />
the worst case a six-fold to eight increase by 2020. The most likely central scenario would be a<br />
quadrupling <str<strong>on</strong>g>of</str<strong>on</strong>g> <str<strong>on</strong>g>prices</str<strong>on</strong>g> by 2020.<br />
Under any <str<strong>on</strong>g>of</str<strong>on</strong>g> these c<strong>on</strong>diti<strong>on</strong>s, the <str<strong>on</strong>g>impact</str<strong>on</strong>g> <strong>on</strong> transportati<strong>on</strong> is very significant with quite radical resp<strong>on</strong>ses<br />
in logistics chains and inter<strong>modal</strong> competiti<strong>on</strong> to be expected. All <str<strong>on</strong>g>oil</str<strong>on</strong>g> price scenarios result in significant<br />
changes in U.S. logistics and the role <str<strong>on</strong>g>of</str<strong>on</strong>g> ports, <str<strong>on</strong>g>high</str<strong>on</strong>g>way, rail, and water infrastructure in meeting nati<strong>on</strong>al<br />
transportati<strong>on</strong> requirements. In c<strong>on</strong>sequence, it is important to understand specifically how <str<strong>on</strong>g>oil</str<strong>on</strong>g> <str<strong>on</strong>g>prices</str<strong>on</strong>g> will<br />
<str<strong>on</strong>g>impact</str<strong>on</strong>g>:<br />
• Nati<strong>on</strong>al transportati<strong>on</strong> trends and requirements<br />
• Corridor specific changes<br />
4.2 EVALUATION PROCESS<br />
A micro-ec<strong>on</strong>omic evaluati<strong>on</strong> framework provided a basis for assessing the “elasticities” associated with<br />
providing different levels <str<strong>on</strong>g>of</str<strong>on</strong>g> service in the different corridors. To define elasticities, a supply and demand<br />
analysis is required that shows the equilibrium resp<strong>on</strong>se <str<strong>on</strong>g>of</str<strong>on</strong>g> demand to any given set <str<strong>on</strong>g>of</str<strong>on</strong>g> supply c<strong>on</strong>diti<strong>on</strong>s. It<br />
is critical to measure elasticities at equilibrium since elasticities can change dramatically for quite small<br />
changes in the levels <str<strong>on</strong>g>of</str<strong>on</strong>g> service provided by any mode. For example, service frequency elasticities change<br />
dramatically as water service increases from <strong>on</strong>e vessel call per week to eight calls per week (-0.95 to –<br />
0.1). As well, different elasticities apply to either increasing or decreasing services or costs. As a result,<br />
the final form <str<strong>on</strong>g>of</str<strong>on</strong>g> the structure depended <strong>on</strong> final corridor and route definiti<strong>on</strong>s, but the evaluati<strong>on</strong><br />
framework should provide a basis for comparing alternative logistic structures and the ability to provide a<br />
competitive service in each corridor. To meet this requirement, both the supply side and demand side<br />
factors were evaluated within a “what-if” framework.<br />
TEMS, INC. OCTOBER 2008<br />
13
TECHNICAL REPORT - IMPACT OF HIGH OIL PRICES ON FREIGHT TRANSPORTATION:<br />
MODAL SHIFT POTENTIAL IN FIVE CORRIDORS<br />
The what-if framework c<strong>on</strong>tains three major comp<strong>on</strong>ents:<br />
• Ec<strong>on</strong>omic scenarios and transportati<strong>on</strong> strategies – what-if alternatives<br />
• Demand model factors and systems<br />
• Supply model factors and systems<br />
SUPPLY FACTORS<br />
COST<br />
TIME<br />
RELIABILITY<br />
SERVICE LEVEL<br />
Exhibit 10: Evaluati<strong>on</strong> Frameworks<br />
WHAT-IF<br />
ALTERNATIVES<br />
EVALUATION<br />
FRAMEWORK<br />
POLICY ASSESSMENT<br />
The structure shown in Exhibit 10 allows the character <str<strong>on</strong>g>of</str<strong>on</strong>g> demand for the transportati<strong>on</strong> system to be tested<br />
under a range <str<strong>on</strong>g>of</str<strong>on</strong>g> different ec<strong>on</strong>omic or transportati<strong>on</strong> price (time, cost, etc.) alternatives. As a result, the<br />
model can be used to perform sensitivity tests <str<strong>on</strong>g>of</str<strong>on</strong>g> <str<strong>on</strong>g>oil</str<strong>on</strong>g> price potentials. This is d<strong>on</strong>e by developing <strong>modal</strong><br />
transportati<strong>on</strong> networks for each regi<strong>on</strong> that include <str<strong>on</strong>g>high</str<strong>on</strong>g>er <str<strong>on</strong>g>oil</str<strong>on</strong>g> <str<strong>on</strong>g>prices</str<strong>on</strong>g> forecast under the optimistic, central,<br />
and pessimistic case <str<strong>on</strong>g>oil</str<strong>on</strong>g> price scenarios described above.<br />
For each <str<strong>on</strong>g>of</str<strong>on</strong>g> the five corridors defined in Exhibit 1, demand and supply for <strong>freight</strong> shipments was set up in<br />
TEMS’ GOODS model by defining <strong>on</strong> the supply side the required input Truck, Rail and Maritime<br />
networks, with costing coefficients appropriate to the scenarios being tested; and by loading <strong>on</strong> the<br />
demand side an origin-destinati<strong>on</strong> traffic database that was primarily derived from USDOT Freight<br />
Analysis Framework (FAF) data. The traffic database, however, was augmented with Bureau <str<strong>on</strong>g>of</str<strong>on</strong>g><br />
Transportati<strong>on</strong> Statistics data <strong>on</strong> cross-border flows and with Transport Canada data for Canadian<br />
domestic flows in the GLSLS (Central Canada) regi<strong>on</strong>, and other TEMS statistics. The GOODS model<br />
was then run for each corridor and forecast scenario to develop Base Line (2005) and fuel price sensitivity<br />
scenarios.<br />
The basic calibrati<strong>on</strong> <str<strong>on</strong>g>of</str<strong>on</strong>g> the model is designed to identify the potential for waterborne transportati<strong>on</strong><br />
capture <str<strong>on</strong>g>of</str<strong>on</strong>g> c<strong>on</strong>tainerized traffic, which normally requires a truck pickup and delivery at each end <str<strong>on</strong>g>of</str<strong>on</strong>g> such<br />
moves. However, there may be additi<strong>on</strong>al traffic potential for development <str<strong>on</strong>g>of</str<strong>on</strong>g> water feeder services to<br />
specific ports. This type <str<strong>on</strong>g>of</str<strong>on</strong>g> analysis requires more port-specific data than is generally available in the FAF<br />
data, which takes an overall metropolitan area view. However, as will be discussed later, it may be<br />
possible to identify a potential for development <str<strong>on</strong>g>of</str<strong>on</strong>g> additi<strong>on</strong>al feeder services, particularly <strong>on</strong> the East and<br />
West Coast, through a follow-up analysis <str<strong>on</strong>g>of</str<strong>on</strong>g> port specific data.<br />
TEMS, INC. OCTOBER 2008<br />
DEMAND FACTORS<br />
ECONOMIC GROWTH<br />
INDUCED DEMAND<br />
COMPETITIVE<br />
MODES, PORTS<br />
AND ROUTES<br />
14
TECHNICAL REPORT - IMPACT OF HIGH OIL PRICES ON FREIGHT TRANSPORTATION:<br />
MODAL SHIFT POTENTIAL IN FIVE CORRIDORS<br />
4.3 ANALYSIS METHOD<br />
For each corridor, an analysis <str<strong>on</strong>g>of</str<strong>on</strong>g> the potential <str<strong>on</strong>g>oil</str<strong>on</strong>g> price <str<strong>on</strong>g>impact</str<strong>on</strong>g> was accomplished using the GOODS<br />
demand and supply model (See Exhibit 11). This model was originally developed for the Great Lakes<br />
and St. Lawrence Seaway Study carried out by the Maritime Administrati<strong>on</strong> (USDOT) and Transport<br />
Canada for the New Cargoes/New Vessels Market Assessment as part <str<strong>on</strong>g>of</str<strong>on</strong>g> the Great Lakes – St. Lawrence<br />
Seaway Study. The model was subsequently used for the Panama Canal Route Choice study, as well as<br />
for regi<strong>on</strong>al studies (e.g., Northeast Freight Study for USDOT’s Federal Railroad Administrati<strong>on</strong>). The<br />
GOODS model sets up a supply and demand analysis for <strong>freight</strong> transportati<strong>on</strong> in each corridor being<br />
examined.<br />
ZONE<br />
SYSTEM<br />
SOCIO-ECONOMIC<br />
DATA (POPULATION,<br />
EMPLOYMENT, ETC.)<br />
O-D COMMODITY<br />
FLOW DATA (BY<br />
MODE AND SIC<br />
COMMODITY)<br />
NETWORK DATA<br />
(TIMES, COSTS BY<br />
MODE)<br />
4.4 SUPPLY SIDE ISSUES<br />
Exhibit 11: GOODS Demand Model<br />
The GOODS model uses a generalized cost (GC) framework for assessing the factors that are most<br />
directly relevant to shippers’ and carriers’ decisi<strong>on</strong>s for routing <strong>freight</strong>. A GC metric incorporates all <str<strong>on</strong>g>of</str<strong>on</strong>g> the<br />
critical factors that motivate shippers and carriers to use a particular route, mode and shipment type. This<br />
GC framework focuses <strong>on</strong> four main factors: Transit Time, Shipping Cost, Frequency and Reliability to<br />
reflect shippers’ choice behavior. The generalized cost <str<strong>on</strong>g>of</str<strong>on</strong>g> shipping is typically defined in shipping time<br />
(i.e., hours) rather than dollars. Costs are c<strong>on</strong>verted to time by applying appropriate c<strong>on</strong>versi<strong>on</strong> factors,<br />
as shown below. These c<strong>on</strong>versi<strong>on</strong> factors, VOTmp, VOFmp, and VORmp are based <strong>on</strong> the results <str<strong>on</strong>g>of</str<strong>on</strong>g> stated<br />
preference surveys, showing how shippers value each <str<strong>on</strong>g>of</str<strong>on</strong>g> these comp<strong>on</strong>ents <str<strong>on</strong>g>of</str<strong>on</strong>g> generalized cost (GC). The<br />
generalized cost <str<strong>on</strong>g>of</str<strong>on</strong>g> shipping between z<strong>on</strong>es i and j for route m and commodity p is calculated as follows:<br />
GC<br />
ijmp<br />
= TT<br />
TEMS, INC. OCTOBER 2008<br />
ijm<br />
TC<br />
+<br />
VOT<br />
STATED<br />
PREFERENCE<br />
SURVEY OF<br />
DISUTILITY VALUES<br />
TOTAL DEMAND<br />
MODELS<br />
ijmp<br />
MODAL SPLIT<br />
MODELS<br />
ROUTE CHOICE<br />
MODELS<br />
mp<br />
VOF mp OH<br />
+<br />
VOT mp F ijm C<br />
i jm<br />
SOCIO-ECONOMIC<br />
PROJECTIONS FOR<br />
FORECAST YEARS<br />
MODEL FORECASTS<br />
FOR YEAR 2020<br />
TRANSPORTATION<br />
INFRASTRUCTURE,<br />
PRICE, & SERVICE<br />
VOR<br />
+<br />
mp<br />
exp(−OTP<br />
VOT<br />
mp<br />
BASE & FORECAST<br />
YEAR TRAFFIC<br />
FLOWS<br />
i jm<br />
)<br />
FINANCIAL<br />
ANALYSIS<br />
ECONOMIC<br />
ANALYSIS<br />
15
Where:<br />
TECHNICAL REPORT - IMPACT OF HIGH OIL PRICES ON FREIGHT TRANSPORTATION:<br />
MODAL SHIFT POTENTIAL IN FIVE CORRIDORS<br />
TTijm = Shipping Time (in hours) between z<strong>on</strong>es i and j for route m<br />
TCijmp = Shipping Cost ($) between z<strong>on</strong>es i and j for route m and commodity type p<br />
VOTmp = Value <str<strong>on</strong>g>of</str<strong>on</strong>g> Time ($/hr) for route m and commodity type p<br />
VOFmp = Value <str<strong>on</strong>g>of</str<strong>on</strong>g> Frequency ($/hr) for route m and commodity type p<br />
VORmp = Value <str<strong>on</strong>g>of</str<strong>on</strong>g> Reliability (%/hr) for route m and commodity type p<br />
Fijm = Frequency in departures per week between z<strong>on</strong>es i and j for route m<br />
OTPijm = On-time performance (%) for shipping between z<strong>on</strong>es i and j for route m<br />
OH = Operating hours per week<br />
The first term in generalized cost functi<strong>on</strong> is the shipping time.<br />
The sec<strong>on</strong>d term c<strong>on</strong>verts the cost <str<strong>on</strong>g>of</str<strong>on</strong>g> shipping into time units.<br />
The third term in the generalized cost equati<strong>on</strong> c<strong>on</strong>verts the frequency attribute into time units. Operating hours<br />
divided by frequency is a measure <str<strong>on</strong>g>of</str<strong>on</strong>g> the headway or time between departures (e.g., <strong>on</strong>ce or twice weekly).<br />
Trade<str<strong>on</strong>g>of</str<strong>on</strong>g>fs are made in the stated preference surveys resulting in the value <str<strong>on</strong>g>of</str<strong>on</strong>g> frequencies <strong>on</strong> this measure. The<br />
third term represents the <str<strong>on</strong>g>impact</str<strong>on</strong>g> <str<strong>on</strong>g>of</str<strong>on</strong>g> perceived frequency valuati<strong>on</strong>s <strong>on</strong> generalized cost.<br />
The fourth term <str<strong>on</strong>g>of</str<strong>on</strong>g> the generalized cost functi<strong>on</strong> is a measure <str<strong>on</strong>g>of</str<strong>on</strong>g> the value placed <strong>on</strong> reliability <str<strong>on</strong>g>of</str<strong>on</strong>g> the route. The<br />
negative exp<strong>on</strong>ential form <str<strong>on</strong>g>of</str<strong>on</strong>g> the reliability term implies that improvements from low levels <str<strong>on</strong>g>of</str<strong>on</strong>g> reliability have<br />
<str<strong>on</strong>g>high</str<strong>on</strong>g>er <str<strong>on</strong>g>impact</str<strong>on</strong>g>s than similar improvements from <str<strong>on</strong>g>high</str<strong>on</strong>g>er levels <str<strong>on</strong>g>of</str<strong>on</strong>g> reliability.<br />
Generalized costs are developed for each origin destinati<strong>on</strong> pair, based <strong>on</strong> the aggregate time, cost, frequency,<br />
and reliability characteristics <str<strong>on</strong>g>of</str<strong>on</strong>g> all the links that make up a route. The following describes each <str<strong>on</strong>g>of</str<strong>on</strong>g> the key inputs<br />
that are captured by the GC formulati<strong>on</strong>.<br />
Price<br />
Line Haul: A key feature <str<strong>on</strong>g>of</str<strong>on</strong>g> any supply chain is price. Typically, water transportati<strong>on</strong> has been able to<br />
<str<strong>on</strong>g>of</str<strong>on</strong>g>fer the lowest line-haul price. Although price dominates bulk transportati<strong>on</strong>, it is far less important in the<br />
movement <str<strong>on</strong>g>of</str<strong>on</strong>g> c<strong>on</strong>tainer traffic where transit time and a wide range <str<strong>on</strong>g>of</str<strong>on</strong>g> other service variables play a major<br />
role.<br />
In the case <str<strong>on</strong>g>of</str<strong>on</strong>g> bulk traffic, given the volumes involved, shipper c<strong>on</strong>cerns focus <strong>on</strong> the lowest rate per t<strong>on</strong>. In<br />
the case <str<strong>on</strong>g>of</str<strong>on</strong>g> c<strong>on</strong>tainer traffic, by comparis<strong>on</strong>, the main focus is <strong>on</strong> transit times and the ability to reach<br />
certain markets by a given deadline. Faster transit times allow a <str<strong>on</strong>g>high</str<strong>on</strong>g>er price to be charged. Clearly,<br />
faster transit times that are competitive with rail and truck can attract a price similar to that <str<strong>on</strong>g>of</str<strong>on</strong>g> rail and<br />
truck and dramatically increase revenues per t<strong>on</strong>-mile.<br />
Since water opti<strong>on</strong>s generally <str<strong>on</strong>g>of</str<strong>on</strong>g>fer l<strong>on</strong>ger transit times than rail or truck, the ability to <str<strong>on</strong>g>of</str<strong>on</strong>g>fer lower <str<strong>on</strong>g>prices</str<strong>on</strong>g> is<br />
critical to their success. This means that from an operating cost perspective, the water mode must be<br />
lower-cost than rail (including the cost <str<strong>on</strong>g>of</str<strong>on</strong>g> port or terminal handling) wherever the rail opti<strong>on</strong> is present, as it<br />
is for most proposed short-sea shipping lanes. As a result, it will be important for vessel operators to<br />
maximize ec<strong>on</strong>omies <str<strong>on</strong>g>of</str<strong>on</strong>g> scale by using vessels that are both large and fast enough to be able to <str<strong>on</strong>g>of</str<strong>on</strong>g>fer a<br />
competitive service in the marketplace.<br />
TEMS, INC. OCTOBER 2008<br />
16
TECHNICAL REPORT - IMPACT OF HIGH OIL PRICES ON FREIGHT TRANSPORTATION:<br />
MODAL SHIFT POTENTIAL IN FIVE CORRIDORS<br />
In this study, fuel is an important comp<strong>on</strong>ent <str<strong>on</strong>g>of</str<strong>on</strong>g> operating cost and so the <str<strong>on</strong>g>impact</str<strong>on</strong>g> <str<strong>on</strong>g>of</str<strong>on</strong>g> rising fuel costs <strong>on</strong> each<br />
mode was evaluated for each <str<strong>on</strong>g>of</str<strong>on</strong>g> the three <str<strong>on</strong>g>oil</str<strong>on</strong>g> price scenarios.<br />
Access/Egress/Terminal Costs and Time: The experience <str<strong>on</strong>g>of</str<strong>on</strong>g> both rail and water transportati<strong>on</strong> providers is<br />
that access, egress, and port/terminal dwell time al<strong>on</strong>g with drayage are very expensive comp<strong>on</strong>ents <str<strong>on</strong>g>of</str<strong>on</strong>g><br />
both shipment cost and time, and can rapidly reduce the viability <str<strong>on</strong>g>of</str<strong>on</strong>g> a service. For example, the reas<strong>on</strong><br />
for development <str<strong>on</strong>g>of</str<strong>on</strong>g> the Alameda Corridor in California was the need to reduce dwell time, access/egress,<br />
and drayage times for the ports <str<strong>on</strong>g>of</str<strong>on</strong>g> Los Angeles and L<strong>on</strong>g Beach. The c<strong>on</strong>gesti<strong>on</strong> and delays associated<br />
with getting from both ports across Los Angeles was such that shippers were willing to pay as much as $17<br />
per box for improved service. 16<br />
The costs <str<strong>on</strong>g>of</str<strong>on</strong>g> access/egress and terminal time were modeled by including “centroid c<strong>on</strong>nector” links in the<br />
network definiti<strong>on</strong>. These links c<strong>on</strong>nect the traffic z<strong>on</strong>e origins to the ports and include a cost for both local<br />
trucking and port charges. Such access costs can be significant, especially for a short-haul service, and<br />
comprise a large percentage <str<strong>on</strong>g>of</str<strong>on</strong>g> the overall shipping cost.<br />
The <str<strong>on</strong>g>impact</str<strong>on</strong>g> <str<strong>on</strong>g>of</str<strong>on</strong>g> short-haul trucking or drayage cost is not <str<strong>on</strong>g>of</str<strong>on</strong>g>ten understood, but it forms a key comp<strong>on</strong>ent in<br />
establishing the viability <str<strong>on</strong>g>of</str<strong>on</strong>g> inter<strong>modal</strong> rail as well water services. The problem is that loaded drayage<br />
moves are <str<strong>on</strong>g>of</str<strong>on</strong>g>ten not balanced so the backhaul must return empty. Up to six trucking moves can be<br />
required to get <strong>on</strong>e loaded trailer to and from its destinati<strong>on</strong>, as follows:<br />
• Truck from Depot to Port to pick up loaded c<strong>on</strong>tainer (bob-tailing)<br />
• Port to Customer (loaded)<br />
• Customer back to Depot (bob-tailing)<br />
• Depot to Customer to pick up empty c<strong>on</strong>tainer (bob-tailing)<br />
• Customer to Port (empty)<br />
• Port back to Depot (bob-tailing)<br />
Under these circumstances it is not unusual for drayage to cost anywhere from three up to six times the<br />
normal over-the-road trucking rate. This factor plus the port handing cost impose a minimum distance<br />
threshold, which in rail is thought to be 700-1,000 miles before the efficiency <str<strong>on</strong>g>of</str<strong>on</strong>g> the line-haul <str<strong>on</strong>g>of</str<strong>on</strong>g>fsets the<br />
added cost for the drayage and port handling charges. For domestic inter<strong>modal</strong> services, another effect<br />
<str<strong>on</strong>g>of</str<strong>on</strong>g> <str<strong>on</strong>g>high</str<strong>on</strong>g>-cost truck drayage is to generally limit their effective service areas to immediate port hinterlands,<br />
usually in the range 30-50 miles around a port, because trucking costs are just too <str<strong>on</strong>g>high</str<strong>on</strong>g> for collecting<br />
traffic from bey<strong>on</strong>d that range.<br />
Transit Time<br />
In a just-in-time ec<strong>on</strong>omy, transit time has become the prime factor in shippers’ decisi<strong>on</strong>s for c<strong>on</strong>tainer<br />
traffic. Improved transit time, therefore, has a str<strong>on</strong>g relati<strong>on</strong>ship with the ability <str<strong>on</strong>g>of</str<strong>on</strong>g> the water mode to<br />
attract c<strong>on</strong>tainer traffic. This can happen in several ways: water transit time can be improved relative to<br />
other modes because <str<strong>on</strong>g>of</str<strong>on</strong>g> the improved operati<strong>on</strong> <str<strong>on</strong>g>of</str<strong>on</strong>g> the ports and waterway system; by the use <str<strong>on</strong>g>of</str<strong>on</strong>g> new and<br />
faster vessels; or as a result <str<strong>on</strong>g>of</str<strong>on</strong>g> increased time and cost for other modes as due to c<strong>on</strong>gesti<strong>on</strong>, capacity<br />
delays, and <str<strong>on</strong>g>high</str<strong>on</strong>g>er fuel <str<strong>on</strong>g>prices</str<strong>on</strong>g>. In each case, the relative difference between water transit time and its<br />
competitor’s transit time must be significantly reduced for water inter<strong>modal</strong> service to be an effective<br />
opti<strong>on</strong>. For example, nowadays it takes about ten days for a ship to go from <strong>on</strong>e end <str<strong>on</strong>g>of</str<strong>on</strong>g> the Great Lakes<br />
and St. Lawrence Seaway (GLSLS) system to the other. Critical bottlenecks include the M<strong>on</strong>treal-Lake<br />
16 “Expanded Preliminary Model – Alameda Corridor”. Transportati<strong>on</strong> Ec<strong>on</strong>omics & Management Systems, Inc. March<br />
1993.<br />
TEMS, INC. OCTOBER 2008<br />
17
TECHNICAL REPORT - IMPACT OF HIGH OIL PRICES ON FREIGHT TRANSPORTATION:<br />
MODAL SHIFT POTENTIAL IN FIVE CORRIDORS<br />
Ontario secti<strong>on</strong>, which has a 22- to 24-hour average transit time, and the Welland Canal with an 11-hour<br />
transit time. For bulk <strong>freight</strong> such as grain, ir<strong>on</strong> ore, coal, and steel, these times are both reas<strong>on</strong>able and<br />
competitive given the volume <str<strong>on</strong>g>of</str<strong>on</strong>g> cargo involved. However, for c<strong>on</strong>tainer or palletized products – the<br />
typical way to move manufactured products – these time scales are generally unacceptable. Since the<br />
gap between water service for bulk <strong>freight</strong> and its competitors is currently three to four days <str<strong>on</strong>g>of</str<strong>on</strong>g> transit<br />
time; water service for c<strong>on</strong>tainerized <strong>freight</strong> would probably need to be improved to within <strong>on</strong>e or two<br />
days, at the most, to become an effective shipping opti<strong>on</strong>. What this means is that fast ships operating in<br />
the 18-22 knots speed-range will likely be required to compete with surface transportati<strong>on</strong> in short-sea<br />
lanes. Technologically, sailing speeds in this range are not a problem for modern vessels.<br />
Frequency <str<strong>on</strong>g>of</str<strong>on</strong>g> Service<br />
The frequency <str<strong>on</strong>g>of</str<strong>on</strong>g> service is <str<strong>on</strong>g>of</str<strong>on</strong>g>ten a critical factor in a shipper’s decisi<strong>on</strong> to use a particular transportati<strong>on</strong><br />
opti<strong>on</strong>. On Europe’s Rhine/Danube River System, c<strong>on</strong>tainer traffic barges are scheduled to ensure that<br />
required frequencies are being met and that their reliability is improved. It is likely that frequency will be<br />
a critical factor for any short-sea shipping service where a minimum daily service level will be essential to<br />
attracting shippers and new cargoes. In c<strong>on</strong>trast, weekly service is c<strong>on</strong>sidered to be the norm for<br />
internati<strong>on</strong>al shipping lanes.<br />
Reliability<br />
The new ec<strong>on</strong>omy <str<strong>on</strong>g>of</str<strong>on</strong>g> the 21st century is entirely dependent up<strong>on</strong> reliable transportati<strong>on</strong> service to support<br />
the just-in-time manufacturing and processing <str<strong>on</strong>g>of</str<strong>on</strong>g> modern industry. Improving reliability significantly<br />
improves the ability <str<strong>on</strong>g>of</str<strong>on</strong>g> any short-sea shipping service to attract c<strong>on</strong>tainer traffic. Reliability needs,<br />
therefore, to be built into the supply model.<br />
Other Factors<br />
Several other factors are not explicitly included in the Generalized Cost equati<strong>on</strong> but are reflected in the<br />
“<strong>modal</strong> bias” c<strong>on</strong>stant factors that result from the calibrati<strong>on</strong> regressi<strong>on</strong>s.<br />
Seas<strong>on</strong>ality: A key issue for water transportati<strong>on</strong> system is seas<strong>on</strong>ality. This c<strong>on</strong>cern applies mainly to the<br />
GLSLS system where, over the last quarter century, its St. Lawrence Seaway comp<strong>on</strong>ent has typically<br />
opened in late March and closed in late December, a period <str<strong>on</strong>g>of</str<strong>on</strong>g> 274 days, or more than 9 m<strong>on</strong>ths. While<br />
the m<strong>on</strong>ths <str<strong>on</strong>g>of</str<strong>on</strong>g> January to March are typically some <str<strong>on</strong>g>of</str<strong>on</strong>g> the slowest for manufacturing and, in particular, the<br />
retail industry, the inability to <str<strong>on</strong>g>of</str<strong>on</strong>g>fer any service at this time has been perceived as a major limitati<strong>on</strong>.<br />
The <str<strong>on</strong>g>impact</str<strong>on</strong>g> <str<strong>on</strong>g>of</str<strong>on</strong>g> closing the GLSLS System for three m<strong>on</strong>ths is that shippers and carriers will look for other<br />
alternatives. Once they find those alternatives, build relati<strong>on</strong>ships, negotiate c<strong>on</strong>tracts, and develop a<br />
dependable logistics chain it is difficult to see why they would return to the GLSLS. To evaluate the <str<strong>on</strong>g>impact</str<strong>on</strong>g><br />
<str<strong>on</strong>g>of</str<strong>on</strong>g> seas<strong>on</strong>ality, specific shipper and carrier input is required that shows the “disruptiveness” <str<strong>on</strong>g>of</str<strong>on</strong>g> the<br />
seas<strong>on</strong>ality issue, how it affects costs and the penalty associated with forcing shippers to use alternative<br />
rail and truck opti<strong>on</strong>s. Shippers and carriers are looking for seamless logistic systems negotiated for a<br />
given business cycle. One possible alternative is for the GLSLS to develop partnership arrangements to<br />
mitigate this issue, as was proposed in TEMS’ earlier New Cargoes/New Vessels Market Assessment.<br />
Security: Before c<strong>on</strong>tainerizati<strong>on</strong>, pilferage from all forms <str<strong>on</strong>g>of</str<strong>on</strong>g> transportati<strong>on</strong> was a problem. As a result <str<strong>on</strong>g>of</str<strong>on</strong>g><br />
c<strong>on</strong>tainerizati<strong>on</strong>, moving goods became more secure and the level <str<strong>on</strong>g>of</str<strong>on</strong>g> pilferage diminished. Although the<br />
use <str<strong>on</strong>g>of</str<strong>on</strong>g> c<strong>on</strong>tainers has enhanced shipment security, the level <str<strong>on</strong>g>of</str<strong>on</strong>g> security between different modes <str<strong>on</strong>g>of</str<strong>on</strong>g><br />
transportati<strong>on</strong> may not be the same, which can be a significant shipping issue. In general, shippers regard<br />
water transportati<strong>on</strong> as a safer mode than rail and truck, and this percepti<strong>on</strong> could be an advantage in<br />
the movement <str<strong>on</strong>g>of</str<strong>on</strong>g> some specific kinds <str<strong>on</strong>g>of</str<strong>on</strong>g> <strong>freight</strong>, such as hazardous materials or waste.<br />
TEMS, INC. OCTOBER 2008<br />
18
TECHNICAL REPORT - IMPACT OF HIGH OIL PRICES ON FREIGHT TRANSPORTATION:<br />
MODAL SHIFT POTENTIAL IN FIVE CORRIDORS<br />
Shipment Characteristics: Cargoes have special characteristics that make them more or less subject to<br />
transportati<strong>on</strong> restricti<strong>on</strong>s <strong>on</strong> certain modes. For example, hazardous materials or cargo requiring<br />
refrigerati<strong>on</strong> both <str<strong>on</strong>g>of</str<strong>on</strong>g>ten have special handling cost implicati<strong>on</strong>s and <strong>modal</strong> restricti<strong>on</strong>s. Hazardous<br />
materials might be banned from critical bridges and tunnels, and waterborne transport is also generally<br />
superior to other modes in terms <str<strong>on</strong>g>of</str<strong>on</strong>g> its ability to handle very large or wide “dimensi<strong>on</strong>al” loads that may<br />
simply be too large or heavy to fit through existing <str<strong>on</strong>g>high</str<strong>on</strong>g>way or rail bridges or tunnels.<br />
Capacity: An increasingly important factor in shipping decisi<strong>on</strong>s in the future will be system capacity. This<br />
factor generally reflects indirectly through the transit time and reliability factors associated with the<br />
service. It is anticipated that supply side limitati<strong>on</strong>s including labor (trucking industry) and infrastructure<br />
will make existing distributi<strong>on</strong> systems less cost effective and physically limited in what they can carry. As<br />
a result, capacity issues need to be c<strong>on</strong>sidered for their <str<strong>on</strong>g>impact</str<strong>on</strong>g> <strong>on</strong> transit times and reliability, which are<br />
expected to worsen in the future for <str<strong>on</strong>g>high</str<strong>on</strong>g>way transportati<strong>on</strong>. However, the forecasts produced for this<br />
assessment assume base-year reliability and parameterize fuel cost <strong>on</strong>ly, which makes them c<strong>on</strong>servative<br />
with respect to future forecast years.<br />
C<strong>on</strong>clusi<strong>on</strong>: The supply side model needs to be able to faithfully replicate these factors in <strong>freight</strong><br />
shipping decisi<strong>on</strong>-making and to show the <str<strong>on</strong>g>impact</str<strong>on</strong>g> <str<strong>on</strong>g>of</str<strong>on</strong>g> changing any <strong>on</strong>e <str<strong>on</strong>g>of</str<strong>on</strong>g> the factors <strong>on</strong> the supply chain<br />
and overall <strong>modal</strong> efficiency.<br />
4.5 DEMAND SIDE ISSUES<br />
On the demand side, a number <str<strong>on</strong>g>of</str<strong>on</strong>g> market issues need to be assessed in the analysis. These include –<br />
Changes in Market Size Due to Ec<strong>on</strong>omic Growth<br />
Over the next twenty to thirty years, if current trends c<strong>on</strong>tinue, the <strong>freight</strong> volumes will increase by at least<br />
70 to 100 percent. Recent Statistics Canada, U.S. Bureau <str<strong>on</strong>g>of</str<strong>on</strong>g> Commerce, and OECD data show trade<br />
volumes increasing rapidly from the early 1980’s al<strong>on</strong>g with the increasing integrati<strong>on</strong> <str<strong>on</strong>g>of</str<strong>on</strong>g> the world<br />
ec<strong>on</strong>omy. For example, U.S. exports increased 63 percent in the ten years from 1992-2002, while U.S.<br />
imports grew 138 percent over the same time period, according to the U.S. Bureau <str<strong>on</strong>g>of</str<strong>on</strong>g> Ec<strong>on</strong>omic Analysis. 17<br />
The existing infrastructure will find this difficult to handle due to capacity limitati<strong>on</strong>s and, <strong>on</strong>ce existing<br />
modes reach full capacity, cargo will seek new opportunities to reach markets. At this point, short sea<br />
shipping will become more competitive and more attractive for c<strong>on</strong>tainer traffic. Assessing the <str<strong>on</strong>g>impact</str<strong>on</strong>g>s <str<strong>on</strong>g>of</str<strong>on</strong>g><br />
<str<strong>on</strong>g>high</str<strong>on</strong>g>er <str<strong>on</strong>g>oil</str<strong>on</strong>g> <str<strong>on</strong>g>prices</str<strong>on</strong>g> <strong>on</strong> total demand requires c<strong>on</strong>siderati<strong>on</strong> <str<strong>on</strong>g>of</str<strong>on</strong>g> how macroec<strong>on</strong>omic factors will <str<strong>on</strong>g>impact</str<strong>on</strong>g> supply<br />
chains. Initial indicati<strong>on</strong>s have suggested that imports may decline, but both domestic producti<strong>on</strong> and<br />
exports may go up as a result not <strong>on</strong>ly <str<strong>on</strong>g>of</str<strong>on</strong>g> <str<strong>on</strong>g>oil</str<strong>on</strong>g> <str<strong>on</strong>g>prices</str<strong>on</strong>g>, but also currency <strong>shift</strong>s. This suggests that imports may<br />
level <str<strong>on</strong>g>of</str<strong>on</strong>g>f as producti<strong>on</strong> <strong>shift</strong>s back to the United States. But as a result <str<strong>on</strong>g>of</str<strong>on</strong>g> this same <strong>shift</strong>, the domestic<br />
<strong>freight</strong> market may be expected to c<strong>on</strong>tinue to grow rapidly, and it appears likely that a more<br />
competitive short-sea shipping mode due to its greater fuel efficiency could capture at least some <str<strong>on</strong>g>of</str<strong>on</strong>g> this<br />
growth.<br />
Because <str<strong>on</strong>g>of</str<strong>on</strong>g> the current uncertainty surrounding ec<strong>on</strong>omic and traffic growth forecasts, however, this report<br />
based its projecti<strong>on</strong>s <strong>on</strong> the historical Freight Analysis Framework (FAF) traffic levels and will focus<br />
primarily <strong>on</strong> identifying the prospects for market share <strong>shift</strong> between direct trucking and rail and water<br />
inter<strong>modal</strong> services. The FAF database itself relies heavily <strong>on</strong> the Commodity Flow Survey (CFS) data but<br />
was selectively enhanced using other data sources prior to public release. In additi<strong>on</strong> the base year data<br />
was augmented with Canadian and cross-border data for the GLSLS New Cargoes/New Vessels study, so<br />
the database reflects the best available source for assessing the traffic that might potentially be available<br />
to a new water shipping system.<br />
17 U.S. Bureau <str<strong>on</strong>g>of</str<strong>on</strong>g> Ec<strong>on</strong>omic Analysis <str<strong>on</strong>g>of</str<strong>on</strong>g> Current Business. April 2003.<br />
TEMS, INC. OCTOBER 2008<br />
19
TECHNICAL REPORT - IMPACT OF HIGH OIL PRICES ON FREIGHT TRANSPORTATION:<br />
MODAL SHIFT POTENTIAL IN FIVE CORRIDORS<br />
Impact <str<strong>on</strong>g>of</str<strong>on</strong>g> Market Accessibility <strong>on</strong> Total Demand<br />
As existing <strong>freight</strong> opti<strong>on</strong>s reach capacity, new routes will open. If these new routes prove not to be as<br />
competitive as existing routes, this will reduce the size <str<strong>on</strong>g>of</str<strong>on</strong>g> the overall market. Significant distributi<strong>on</strong>al<br />
<str<strong>on</strong>g>impact</str<strong>on</strong>g>s might follow. C<strong>on</strong>versely, <strong>on</strong>ce the minimum volume threshold required to support short-sea<br />
shipping services has been attained, shippers will have additi<strong>on</strong>al competitive opti<strong>on</strong>s for transporting their<br />
goods. While demand for transportati<strong>on</strong> services is largely derived from the needs <str<strong>on</strong>g>of</str<strong>on</strong>g> the agricultural,<br />
manufacturing, and service industries, a less competitive transportati<strong>on</strong> market will reduce the total<br />
demand for shipping <strong>freight</strong> across all modes <str<strong>on</strong>g>of</str<strong>on</strong>g> transportati<strong>on</strong> while a more competitive transportati<strong>on</strong><br />
market makes the overall market larger. This is due to the <str<strong>on</strong>g>impact</str<strong>on</strong>g> the competiti<strong>on</strong> has <strong>on</strong> the costs <str<strong>on</strong>g>of</str<strong>on</strong>g><br />
transportati<strong>on</strong> and the overall pricing <str<strong>on</strong>g>of</str<strong>on</strong>g> products. The demand model in c<strong>on</strong>juncti<strong>on</strong> with the supply model<br />
must be capable <str<strong>on</strong>g>of</str<strong>on</strong>g> determining the appropriate level <str<strong>on</strong>g>of</str<strong>on</strong>g> demand at equilibrium (i.e., the balance <str<strong>on</strong>g>of</str<strong>on</strong>g><br />
market price and supply costs).<br />
Level <str<strong>on</strong>g>of</str<strong>on</strong>g> Modal and Route Competiti<strong>on</strong><br />
The competiti<strong>on</strong> between different modes <str<strong>on</strong>g>of</str<strong>on</strong>g> transportati<strong>on</strong> and routes was assessed by a comparis<strong>on</strong> <str<strong>on</strong>g>of</str<strong>on</strong>g><br />
their relative performance as measured by transit time, price, frequency, etc. Changes in the relative<br />
performance <str<strong>on</strong>g>of</str<strong>on</strong>g> a mode or route will make it more or less competitive. The size <str<strong>on</strong>g>of</str<strong>on</strong>g> a given mode’s market<br />
share is proporti<strong>on</strong>al to its relative competitiveness as measured by its performance compared to other<br />
modes. In evaluating route opti<strong>on</strong>s, the study has c<strong>on</strong>sidered the potential changes in trade with Asia, the<br />
increasing role <str<strong>on</strong>g>of</str<strong>on</strong>g> south and west Asia, and the potential for Asian traffic to the Midwest and central<br />
Canada to divert to Atlantic routes via the Suez Canal.<br />
Capacity C<strong>on</strong>straints and Traffic Shifts<br />
The <str<strong>on</strong>g>impact</str<strong>on</strong>g> <str<strong>on</strong>g>of</str<strong>on</strong>g> mode, route, or port capacity c<strong>on</strong>straints <strong>on</strong> ports, railroad, and trucks can cause a<br />
fundamental <strong>shift</strong> in the competitive advantage <str<strong>on</strong>g>of</str<strong>on</strong>g> the modes. If the relative performance <str<strong>on</strong>g>of</str<strong>on</strong>g> today’s port<br />
and inland transportati<strong>on</strong> distributi<strong>on</strong> system worsens due to increased fuel <str<strong>on</strong>g>prices</str<strong>on</strong>g> or capacity c<strong>on</strong>straints,<br />
short sea shipping could become an overflow opti<strong>on</strong> for the truck and rail services.<br />
C<strong>on</strong>clusi<strong>on</strong>: Analysis <str<strong>on</strong>g>of</str<strong>on</strong>g> the demand side factors was undertaken using a model that provided a<br />
mechanism for evaluating the full supply chain <str<strong>on</strong>g>of</str<strong>on</strong>g> each mode and set <str<strong>on</strong>g>of</str<strong>on</strong>g> <strong>modal</strong> service opti<strong>on</strong>s. This<br />
showed the relevance <str<strong>on</strong>g>of</str<strong>on</strong>g> each comp<strong>on</strong>ent <str<strong>on</strong>g>of</str<strong>on</strong>g> the supply chain to a shipper or carrier’s decisi<strong>on</strong>-making<br />
process, which was assessed in an earlier study with stated preference surveys that allow the strengths and<br />
weaknesses <str<strong>on</strong>g>of</str<strong>on</strong>g> each service/supply chain opti<strong>on</strong> to be evaluated. The demand-side analysis showed not<br />
<strong>on</strong>ly how competitive the existing shipping services are, but also how they need to change in order to<br />
attract new cargo. In this way, the thresholds that water services need to reach to achieve their potential<br />
market shares have been identified and the actual potential <str<strong>on</strong>g>of</str<strong>on</strong>g> achieving the threshold defined.<br />
TEMS, INC. OCTOBER 2008<br />
20
5<br />
TECHNICAL REPORT - IMPACT OF HIGH OIL PRICES ON FREIGHT TRANSPORTATION:<br />
MODAL SHIFT POTENTIAL IN FIVE CORRIDORS<br />
THE IMPACT OF OIL PRICES ON<br />
TRANSPORTATION COSTS<br />
5.1 OVERVIEW<br />
In general, transportati<strong>on</strong> systems will adjust to fuel price changes by passing through the added costs to<br />
their customers. In an envir<strong>on</strong>ment <str<strong>on</strong>g>of</str<strong>on</strong>g> c<strong>on</strong>tract rates, fuel surcharges that allow for short-term rate<br />
adjustments have been implemented by a number <str<strong>on</strong>g>of</str<strong>on</strong>g> carriers. However, it must be noted that firms are<br />
<strong>on</strong>ly able to price “according to what the market will bear.” This means, for example, that in a<br />
competitive envir<strong>on</strong>ment such as that for transc<strong>on</strong>tinental double-stack inter<strong>modal</strong> service, railroads will<br />
c<strong>on</strong>sider rates based <strong>on</strong> what ocean carriers charge for an all-water movement to the East Coast, rather<br />
than based solely <strong>on</strong> their own cost. In these cases, transportati<strong>on</strong> systems may not be able to pass <strong>on</strong> the<br />
full cost <str<strong>on</strong>g>of</str<strong>on</strong>g> the fuel increases, and so must seek efficiency gains to remain viable. As a result, a fuel price<br />
increase may result in a wide range <str<strong>on</strong>g>of</str<strong>on</strong>g> <str<strong>on</strong>g>impact</str<strong>on</strong>g>s depending <strong>on</strong> just how much <str<strong>on</strong>g>of</str<strong>on</strong>g> the increase can be passed<br />
<strong>on</strong> to c<strong>on</strong>sumers.<br />
The key results <str<strong>on</strong>g>of</str<strong>on</strong>g> the analysis show that:<br />
• Large fast vessels, such as the 22-knot, 342-FEU (GLSLS-max) RORO’s c<strong>on</strong>sidered by the earlier<br />
New Cargoes/New Vessels (NC/NV) Market Assessment, can maintain competitive parity with rail<br />
inter<strong>modal</strong> service and present a str<strong>on</strong>g opportunity for diversi<strong>on</strong> <str<strong>on</strong>g>of</str<strong>on</strong>g> truck traffic, through the<br />
development <str<strong>on</strong>g>of</str<strong>on</strong>g> appropriately structured, water inter<strong>modal</strong> services.<br />
• Small and/or slow vessels, such as the 90-FEU European “Coaster” design c<strong>on</strong>sidered by the<br />
earlier NC/NV study, are not rail-competitive. These vessels could divert some truck traffic or<br />
serve as short-distance feeders, but overall, such vessels were not competitive to rail before the<br />
fuel price increases, and become even less so after the increases.<br />
• On shallow inland waters, COB is the most energy-efficient mode. As such, it may see the<br />
development <str<strong>on</strong>g>of</str<strong>on</strong>g> some c<strong>on</strong>tainer traffic as the differential between COB costs and those <str<strong>on</strong>g>of</str<strong>on</strong>g> other<br />
modes, c<strong>on</strong>tinues to widen.<br />
Because the main focus <str<strong>on</strong>g>of</str<strong>on</strong>g> this study is <strong>on</strong> the development <str<strong>on</strong>g>of</str<strong>on</strong>g> coastal short-sea shipping, in general the<br />
vessel technology assumpti<strong>on</strong>s and costing approach employed here are c<strong>on</strong>sistent with that <str<strong>on</strong>g>of</str<strong>on</strong>g> the earlier<br />
GLSLS NC/NV study. This discussi<strong>on</strong> focuses <strong>on</strong> the cost <str<strong>on</strong>g>impact</str<strong>on</strong>g>s <str<strong>on</strong>g>of</str<strong>on</strong>g> fuel cost increases for the various types<br />
<str<strong>on</strong>g>of</str<strong>on</strong>g> technologies that would be appropriate for deployment <strong>on</strong> short-haul Inter<strong>modal</strong> lanes. However, the<br />
comparative ec<strong>on</strong>omics <str<strong>on</strong>g>of</str<strong>on</strong>g> larger ships that are used in the main internati<strong>on</strong>al trade lanes will also be<br />
discussed as it <str<strong>on</strong>g>impact</str<strong>on</strong>g>s the market for movement <str<strong>on</strong>g>of</str<strong>on</strong>g> goods within the U.S.<br />
TEMS, INC. OCTOBER 2008<br />
21
TECHNICAL REPORT - IMPACT OF HIGH OIL PRICES ON FREIGHT TRANSPORTATION:<br />
MODAL SHIFT POTENTIAL IN FIVE CORRIDORS<br />
This chapter is organized as follows: first, there is a discussi<strong>on</strong> <str<strong>on</strong>g>of</str<strong>on</strong>g> the <str<strong>on</strong>g>impact</str<strong>on</strong>g> <str<strong>on</strong>g>of</str<strong>on</strong>g> fuel price increases <strong>on</strong> the<br />
efficiency <str<strong>on</strong>g>of</str<strong>on</strong>g> each individual transport mode: truck, rail, and water; then these results are integrated<br />
together in a Competitive analysis secti<strong>on</strong> that identifies the <str<strong>on</strong>g>impact</str<strong>on</strong>g>s across the modes.<br />
5.2 TRUCKING EFFICIENCY<br />
The trucking sector is <str<strong>on</strong>g>high</str<strong>on</strong>g>ly sensitive to fuel price increases. Truck fuel c<strong>on</strong>sumpti<strong>on</strong> is <str<strong>on</strong>g>high</str<strong>on</strong>g>ly sensitive to<br />
vehicle weight, as shown in Exhibit 12. An empty truck can get 6 miles per gall<strong>on</strong>, but fuel efficiency<br />
declines to 3 miles per gall<strong>on</strong> for a fully loaded truck.<br />
Exhibit 12: Miles per Gall<strong>on</strong> vs. Truck Gross Weight*<br />
* Source: http://www.goodyear.com/truck/pdf/radialretserv/Retread_S9_V.pdf<br />
In 2005, average diesel fuel <str<strong>on</strong>g>prices</str<strong>on</strong>g> were $2.40 per gall<strong>on</strong>; so with a fully-loaded truck getting about 3<br />
miles per gall<strong>on</strong>, fuel already comprised 80¢ per mile or 46 percent <str<strong>on</strong>g>of</str<strong>on</strong>g> the trucker’s overall operating<br />
cost. There is a direct relati<strong>on</strong>ship between <str<strong>on</strong>g>oil</str<strong>on</strong>g> cost per barrel and the cost <str<strong>on</strong>g>of</str<strong>on</strong>g> diesel fuel, and this allows<br />
the trucking cost per mile to be estimated as a functi<strong>on</strong> <str<strong>on</strong>g>of</str<strong>on</strong>g> fuel price. In Exhibit 13, it can be seen that<br />
trucking costs rise less rapidly than do fuel costs because capital and labor costs are added to the fuel cost<br />
to provide the total Truck costs. This holds true if capital and labor costs remain c<strong>on</strong>stant, but in recent<br />
years these costs have been rising as well, making trucking cost rise even faster than just the fuel price<br />
<str<strong>on</strong>g>impact</str<strong>on</strong>g>.<br />
TEMS, INC. OCTOBER 2008<br />
22
TECHNICAL REPORT - IMPACT OF HIGH OIL PRICES ON FREIGHT TRANSPORTATION:<br />
MODAL SHIFT POTENTIAL IN FIVE CORRIDORS<br />
Exhibit 13: Line Haul Trucking Costs as a functi<strong>on</strong> <str<strong>on</strong>g>of</str<strong>on</strong>g> Fuel Price<br />
Scenario $/Barrel Diesel/Gal<br />
Truck<br />
Cost/Mile<br />
Local pickup and delivery, called “drayage,” is more expensive than normal over-the-road trucking<br />
because drayage typically requires many empty miles, as well as n<strong>on</strong>-productive time that a truck must<br />
spend at the port, inter<strong>modal</strong> terminal, and the shipper’s and c<strong>on</strong>signee’s loading docks in the process <str<strong>on</strong>g>of</str<strong>on</strong>g><br />
picking up and delivering both empties and loads. Typically drayage moves are priced <strong>on</strong> the basis <str<strong>on</strong>g>of</str<strong>on</strong>g><br />
100-percent empty return since it takes at least two round trips to complete the movement <str<strong>on</strong>g>of</str<strong>on</strong>g> <strong>on</strong>e load. In<br />
the typical example used as the basis for Exhibit 14, 72 empty or bob-tailing miles were required to<br />
support a <strong>on</strong>e-way loaded movement <str<strong>on</strong>g>of</str<strong>on</strong>g> 30-miles. Because <str<strong>on</strong>g>of</str<strong>on</strong>g> this, while over-the-road trucking cost<br />
$1.75 per mile in the 2005 base, comparable rates where drayage is involved were quoted in the range<br />
<str<strong>on</strong>g>of</str<strong>on</strong>g> $5 to $10 per mile.<br />
Taking the large number <str<strong>on</strong>g>of</str<strong>on</strong>g> empty miles into account, as shown in Exhibit 14, drayage costs do not rise as<br />
quickly (<strong>on</strong> a percentage basis) as those for over-the-road trucking. In the 2020 Pessimistic (<str<strong>on</strong>g>high</str<strong>on</strong>g> <str<strong>on</strong>g>oil</str<strong>on</strong>g> price)<br />
scenario, it can be seen that drayage costs rise <strong>on</strong>ly by 66 percent, whereas over-the-road trucking costs<br />
rise by 85 percent as fuel costs go up to the anticipated level <str<strong>on</strong>g>of</str<strong>on</strong>g> $6.88 per gall<strong>on</strong>. N<strong>on</strong>etheless, the cost<br />
<str<strong>on</strong>g>of</str<strong>on</strong>g> a typical movement involving drayage increased significantly in absolute terms. Cost increases <str<strong>on</strong>g>of</str<strong>on</strong>g> this<br />
magnitude, whether for over-the-road trucking or for drayage, put significant pressure <strong>on</strong> the owneroperator,<br />
causing further c<strong>on</strong>solidati<strong>on</strong> <str<strong>on</strong>g>of</str<strong>on</strong>g> the trucking industry since larger firms are better able to<br />
minimize empty movements.<br />
Scenario<br />
Exhibit 14: Drayage Costs as a functi<strong>on</strong> <str<strong>on</strong>g>of</str<strong>on</strong>g> Fuel Price<br />
TEMS, INC. OCTOBER 2008<br />
Fuel % <str<strong>on</strong>g>of</str<strong>on</strong>g><br />
2005 base<br />
Truck % <str<strong>on</strong>g>of</str<strong>on</strong>g> 2005<br />
base<br />
2002 Historic $28.85 $1.37 $1.41 53% 80%<br />
2005 Base $54.79 $2.40 $1.75 100% 100%<br />
2020 Optimistic $59.61 $2.61 $1.82 109% 104%<br />
2020 Central $91.03 $3.99 $2.28 166% 130%<br />
2020 Pessimistic $157.18 $6.88 $3.24 287% 185%<br />
Loaded<br />
Cost/Mi<br />
Empty<br />
Cost/Mi<br />
Average<br />
Cost/Mi<br />
Total Cost for<br />
a 30 Mile<br />
Loaded Move<br />
Drayage Per<br />
Loaded Mile % <str<strong>on</strong>g>of</str<strong>on</strong>g> 2005 base<br />
2002 Historic $1.41 $1.18 $1.25 $127.28 $4.24 85%<br />
2005 Base $1.75 $1.35 $1.47 $150.00 $5.00 100%<br />
2020 Optimistic $1.82 $1.39 $1.51 $154.65 $5.15 103%<br />
2020 Central $2.28 $1.61 $1.81 $184.96 $6.17 123%<br />
2020 Pessimistic $3.24 $2.10 $2.43 $248.77 $8.29 166%<br />
23
TECHNICAL REPORT - IMPACT OF HIGH OIL PRICES ON FREIGHT TRANSPORTATION:<br />
MODAL SHIFT POTENTIAL IN FIVE CORRIDORS<br />
5.3 RAIL LINE-HAUL EFFICIENCY<br />
In terms <str<strong>on</strong>g>of</str<strong>on</strong>g> the direct operating cost that it takes to move a train from point A to point B, rail line-haul costs<br />
also show a large sensitivity to fuel, as shown in Exhibit 15.<br />
Exhibit 15: Rail Line-Haul Costs as a functi<strong>on</strong> <str<strong>on</strong>g>of</str<strong>on</strong>g> Fuel Price<br />
Scenario $/Barrel<br />
Fuel %<br />
<str<strong>on</strong>g>of</str<strong>on</strong>g> 2005<br />
base<br />
In the 2020 Pessimistic scenario, it can be seen that rail costs rise by 64 percent, which is comparable with<br />
the trucking cost increase. But in m<strong>on</strong>etary terms the rail cost increase is much less since overall rail costs<br />
start from a lower base:<br />
• While rail costs rise by 64 percent, this represents <strong>on</strong>ly a 24¢ per FEU-mile increase (from Exhibit<br />
15).<br />
• Trucking costs rise by 85 percent, but this represents a $1.49 increase per FEU-mile (from Exhibit<br />
13).<br />
So in absolute terms, overall rail costs are affected much less by the fuel price increase, reflecting the<br />
relative energy efficiency <str<strong>on</strong>g>of</str<strong>on</strong>g> rail over trucking. In additi<strong>on</strong>, rail costs include a substantial comp<strong>on</strong>ent <str<strong>on</strong>g>of</str<strong>on</strong>g><br />
terminal operating cost, which are largely fixed; and therefore these costs comprise a greater share <str<strong>on</strong>g>of</str<strong>on</strong>g><br />
total cost for short hauls, and a lesser share for l<strong>on</strong>g hauls. Finally, since railroads have to pay for their<br />
own capacity expansi<strong>on</strong>, they need to charge more than just their cost in order to have anything left over<br />
for funding capital projects, or return <strong>on</strong> investment.<br />
As a rule, railroads must price competitively to other modes <str<strong>on</strong>g>of</str<strong>on</strong>g> transportati<strong>on</strong> and thus, their price increases<br />
may be more reflective <str<strong>on</strong>g>of</str<strong>on</strong>g> other modes’ costs than <str<strong>on</strong>g>of</str<strong>on</strong>g> their own. “As roadway c<strong>on</strong>gesti<strong>on</strong> and <str<strong>on</strong>g>high</str<strong>on</strong>g> fuel<br />
<str<strong>on</strong>g>prices</str<strong>on</strong>g> c<strong>on</strong>tinue to drive shippers to the railroads, CSX expects its rates to rise 5 percent to 6 percent this<br />
year, with <strong>on</strong>ly a small porti<strong>on</strong> <str<strong>on</strong>g>of</str<strong>on</strong>g> that stemming from fuel surcharges meant to <str<strong>on</strong>g>of</str<strong>on</strong>g>fset rising diesel <str<strong>on</strong>g>prices</str<strong>on</strong>g>. 18”<br />
Accordingly, the asserti<strong>on</strong> in Exhibit 4 that inland distributi<strong>on</strong> costs are likely to rise al<strong>on</strong>g with maritime<br />
costs is a reas<strong>on</strong>able <strong>on</strong>e, since for import/export traffic (particularly transc<strong>on</strong>tinental double-stack traffic<br />
to the East coast); maritime costs establish the competitive envir<strong>on</strong>ment within which the railroads must set<br />
their own <str<strong>on</strong>g>prices</str<strong>on</strong>g> for inter<strong>modal</strong> service.<br />
18 “CSX Powers Up”, Railway Age magazine, May 2008, page 28.<br />
TEMS, INC. OCTOBER 2008<br />
Rail Cost<br />
per FEU-<br />
Mile<br />
Rail % <str<strong>on</strong>g>of</str<strong>on</strong>g><br />
2005<br />
base<br />
2002 Historic $28.85 53% $0.30 84%<br />
2005 Base $54.79 100% $0.36 100%<br />
2020 Optimistic $59.61 109% $0.37 103%<br />
2020 Central $91.03 166% $0.45 123%<br />
2020 Pessimistic $157.18 287% $0.60 164%<br />
24
TECHNICAL REPORT - IMPACT OF HIGH OIL PRICES ON FREIGHT TRANSPORTATION:<br />
MODAL SHIFT POTENTIAL IN FIVE CORRIDORS<br />
5.4 MARITIME LINE-HAUL EFFICIENCY<br />
Maritime costs are str<strong>on</strong>gly affected by fuel cost, since vessels move comparatively large volumes and are<br />
so efficient in terms <str<strong>on</strong>g>of</str<strong>on</strong>g> crew and capital utilizati<strong>on</strong> that fuel still comprises a <str<strong>on</strong>g>high</str<strong>on</strong>g> percentage <str<strong>on</strong>g>of</str<strong>on</strong>g> their total<br />
operating cost. Vessel operators have a great opportunity to save fuel by slowing down, but slowing<br />
down will be difficult for short-sea shipping lanes since they have to compete with surface transportati<strong>on</strong>.<br />
Because <str<strong>on</strong>g>of</str<strong>on</strong>g> the time-sensitive nature <str<strong>on</strong>g>of</str<strong>on</strong>g> the kinds <str<strong>on</strong>g>of</str<strong>on</strong>g> loads that would be diverted from trucking, these<br />
services will need to maintain or even improve their speed, even at the cost <str<strong>on</strong>g>of</str<strong>on</strong>g> some fuel.<br />
This secti<strong>on</strong> presents cost curves, as a functi<strong>on</strong> <str<strong>on</strong>g>of</str<strong>on</strong>g> vessel speed, for two different kinds <str<strong>on</strong>g>of</str<strong>on</strong>g> ships:<br />
• A 342-FEU GLSLS-max RORO that was developed by the earlier GLSLS NC/NV study.<br />
• A smaller 90-FEU “Coaster” vessel was also c<strong>on</strong>sidered by the NC/NV study.<br />
Additi<strong>on</strong>ally, the <str<strong>on</strong>g>impact</str<strong>on</strong>g> <str<strong>on</strong>g>of</str<strong>on</strong>g> fuel <str<strong>on</strong>g>prices</str<strong>on</strong>g> <strong>on</strong> C<strong>on</strong>tainer-<strong>on</strong>-Barge (COB) costs will also be developed.<br />
Exhibit 16 reproduces the vessel speed versus cost functi<strong>on</strong> for the GLSLS-max RORO ship that was<br />
developed by the NC/NV study at a time when <str<strong>on</strong>g>oil</str<strong>on</strong>g> <str<strong>on</strong>g>prices</str<strong>on</strong>g> were about $55 per barrel. This study found<br />
that a GLSLS-max RORO ship would have a line-haul operating cost <str<strong>on</strong>g>of</str<strong>on</strong>g> just 23¢ per FEU-mile at 22-knots,<br />
as compared to rail’s cost <str<strong>on</strong>g>of</str<strong>on</strong>g> 36¢ per FEU-mile. As shown in Exhibit 16, although the minimum operating<br />
cost for this vessel occurred at about a 12-knots speed, the vessel was still assumed to operate at the<br />
<str<strong>on</strong>g>high</str<strong>on</strong>g>er speed. This strategy found a “sweet spot” by producing a cost and transit time combinati<strong>on</strong> that<br />
could be rail-competitive.<br />
Exhibit 16: GLSLS-max RO-RO Costs, original NC/NV Study, $55 per barrel<br />
$0.25<br />
$0.20<br />
$0.15<br />
$0.10<br />
$0.05<br />
$0.00<br />
0.0 5.0 10.0 15.0 20.0 25.0<br />
Time Cost<br />
Knots<br />
Fuel Cost Total Cost<br />
TEMS, INC. OCTOBER 2008<br />
25
TECHNICAL REPORT - IMPACT OF HIGH OIL PRICES ON FREIGHT TRANSPORTATION:<br />
MODAL SHIFT POTENTIAL IN FIVE CORRIDORS<br />
Exhibits 17-20 show four other <str<strong>on</strong>g>oil</str<strong>on</strong>g> price scenarios that are also <str<strong>on</strong>g>of</str<strong>on</strong>g> interest in this study. Exhibit 17 shows<br />
the c<strong>on</strong>diti<strong>on</strong>s in 2002 when <str<strong>on</strong>g>oil</str<strong>on</strong>g> <str<strong>on</strong>g>prices</str<strong>on</strong>g> were much lower, at less than $30 per barrel, the price <str<strong>on</strong>g>of</str<strong>on</strong>g> <str<strong>on</strong>g>oil</str<strong>on</strong>g> during<br />
the 1990’s. Exhibits 18-20 show the vessel operating cost curves for the three forecast scenarios where <str<strong>on</strong>g>oil</str<strong>on</strong>g><br />
<str<strong>on</strong>g>prices</str<strong>on</strong>g> are $60, $90 and $160 per barrel, respectively. Note that all three forecast scenarios are for <str<strong>on</strong>g>oil</str<strong>on</strong>g><br />
<str<strong>on</strong>g>prices</str<strong>on</strong>g> that are much <str<strong>on</strong>g>high</str<strong>on</strong>g>er than they were during the equilibrium market c<strong>on</strong>diti<strong>on</strong>s <str<strong>on</strong>g>of</str<strong>on</strong>g> the late 1990’s and<br />
early 2000’s.<br />
Exhibit 17: GLSLS-max RORO Costs, Historic 2002 Market Equilibrium, $30 per barrel<br />
$0.25<br />
$0.20<br />
$0.15<br />
$0.10<br />
$0.05<br />
$0.00<br />
0.0 5.0 10.0 15.0 20.0 25.0<br />
Time Cost<br />
Knots<br />
Fuel Cost Total Cost<br />
Exhibit 18: GLSLS-max RORO Costs, Optimistic Forecast Scenario, $60 per barrel<br />
$0.30<br />
$0.25<br />
$0.20<br />
$0.15<br />
$0.10<br />
$0.05<br />
$0.00<br />
0.0 5.0 10.0 15.0 20.0 25.0<br />
Time Cost<br />
Knots<br />
Fuel Cost Total Cost<br />
TEMS, INC. OCTOBER 2008<br />
26
TECHNICAL REPORT - IMPACT OF HIGH OIL PRICES ON FREIGHT TRANSPORTATION:<br />
MODAL SHIFT POTENTIAL IN FIVE CORRIDORS<br />
Exhibit 19: GLSLS-max RORO Costs, Central Forecast Scenario, $90 per barrel<br />
$0.40<br />
$0.35<br />
$0.30<br />
$0.25<br />
$0.20<br />
$0.15<br />
$0.10<br />
$0.05<br />
$0.00<br />
0.0 5.0 10.0 15.0 20.0 25.0<br />
Time Cost<br />
Knots<br />
Fuel Cost Total Cost<br />
Exhibit 20: GLSLS-max RORO Costs, Pessimistic Forecast Scenario, $160 per barrel<br />
$0.60<br />
$0.50<br />
$0.40<br />
$0.30<br />
$0.20<br />
$0.10<br />
$0.00<br />
0.0 5.0 10.0 15.0 20.0 25.0<br />
Time Cost<br />
Knots<br />
Fuel Cost Total Cost<br />
TEMS, INC. OCTOBER 2008<br />
27
TECHNICAL REPORT - IMPACT OF HIGH OIL PRICES ON FREIGHT TRANSPORTATION:<br />
MODAL SHIFT POTENTIAL IN FIVE CORRIDORS<br />
The results <str<strong>on</strong>g>of</str<strong>on</strong>g> Exhibits 16-20 are summarized in Exhibit 21, which presents the resulting maritime cost<br />
projecti<strong>on</strong>s for a 22-knots GLSLS-max RORO vessel under each <str<strong>on</strong>g>of</str<strong>on</strong>g> the forecast scenarios. As has been<br />
menti<strong>on</strong>ed previously, the cost-optimizing speed declines as fuel <str<strong>on</strong>g>prices</str<strong>on</strong>g> go up, but this is <str<strong>on</strong>g>of</str<strong>on</strong>g> little relevance<br />
to a vessel service that has to compete with surface transportati<strong>on</strong> modes for time-sensitive traffic. All the<br />
costs in Exhibit 21 are based <strong>on</strong> the full speed 22-knot service that is quite a bit faster than the cost<br />
minimizing point.<br />
Exhibit 21: GLSLS-max RORO Costs Summary<br />
Scenario $/Barrel<br />
Fuel %<br />
<str<strong>on</strong>g>of</str<strong>on</strong>g> 2005<br />
base<br />
In terms <str<strong>on</strong>g>of</str<strong>on</strong>g> the ec<strong>on</strong>omics <str<strong>on</strong>g>of</str<strong>on</strong>g> a smaller ship, Exhibits 22-26 show the speed performance curves for the 90-<br />
FEU “Coaster” RORO vessel that was evaluated by the earlier NC/NV study. Exhibit 27 summarizes those<br />
results, which show that the GLSLS-max vessel <str<strong>on</strong>g>of</str<strong>on</strong>g>fers c<strong>on</strong>siderable ec<strong>on</strong>omies <str<strong>on</strong>g>of</str<strong>on</strong>g> scale over the smaller ship.<br />
Exhibit 22: “Coaster” RORO Costs, original NC/NV Study, $55 per barrel<br />
$0.90<br />
$0.80<br />
$0.70<br />
$0.60<br />
$0.50<br />
$0.40<br />
$0.30<br />
$0.20<br />
$0.10<br />
$0.00<br />
TEMS, INC. OCTOBER 2008<br />
RORO<br />
Cost per<br />
FEU-<br />
Mile<br />
Ship %<br />
<str<strong>on</strong>g>of</str<strong>on</strong>g> 2005<br />
base<br />
2002 Historic $28.85 53% $0.15 66%<br />
2005 Base $54.79 100% $0.23 100%<br />
2020 Optimistic $59.61 109% $0.25 106%<br />
2020 Central $91.03 166% $0.34 148%<br />
2020 Pessimistic $157.18 287% $0.55 236%<br />
0.0 5.0 10.0 15.0 20.0 25.0<br />
Time Cost<br />
Knots<br />
Fuel Cost Total Cost<br />
28
TECHNICAL REPORT - IMPACT OF HIGH OIL PRICES ON FREIGHT TRANSPORTATION:<br />
MODAL SHIFT POTENTIAL IN FIVE CORRIDORS<br />
Exhibit 23: “Coaster” RORO Costs, Historic 2002 Market Equilibrium, $30 per barrel<br />
$0.90<br />
$0.80<br />
$0.70<br />
$0.60<br />
$0.50<br />
$0.40<br />
$0.30<br />
$0.20<br />
$0.10<br />
$0.00<br />
0.0 5.0 10.0 15.0 20.0 25.0<br />
Time Cost<br />
Knots<br />
Fuel Cost Total Cost<br />
Exhibit 24: “Coaster” RORO Costs, Optimistic Forecast Scenario, $60 per barrel<br />
$0.90<br />
$0.80<br />
$0.70<br />
$0.60<br />
$0.50<br />
$0.40<br />
$0.30<br />
$0.20<br />
$0.10<br />
$0.00<br />
0.0 5.0 10.0 15.0 20.0 25.0<br />
Time Cost<br />
Knots<br />
Fuel Cost Total Cost<br />
TEMS, INC. OCTOBER 2008<br />
29
TECHNICAL REPORT - IMPACT OF HIGH OIL PRICES ON FREIGHT TRANSPORTATION:<br />
MODAL SHIFT POTENTIAL IN FIVE CORRIDORS<br />
Exhibit 25: “Coaster” RORO Costs, Central Forecast Scenario, $90 per barrel<br />
$0.90<br />
$0.80<br />
$0.70<br />
$0.60<br />
$0.50<br />
$0.40<br />
$0.30<br />
$0.20<br />
$0.10<br />
$0.00<br />
0.0 5.0 10.0 15.0 20.0 25.0<br />
Time Cost<br />
Knots<br />
Fuel Cost Total Cost<br />
Exhibit 26: “Coaster” RORO Costs, Pessimistic Forecast Scenario, $160 per barrel<br />
$1.00<br />
$0.90<br />
$0.80<br />
$0.70<br />
$0.60<br />
$0.50<br />
$0.40<br />
$0.30<br />
$0.20<br />
$0.10<br />
$0.00<br />
0.0 5.0 10.0 15.0 20.0 25.0<br />
Time Cost<br />
Knots<br />
Fuel Cost Total Cost<br />
TEMS, INC. OCTOBER 2008<br />
30
TECHNICAL REPORT - IMPACT OF HIGH OIL PRICES ON FREIGHT TRANSPORTATION:<br />
MODAL SHIFT POTENTIAL IN FIVE CORRIDORS<br />
Exhibit 27: “Coaster” RORO, Summary <str<strong>on</strong>g>of</str<strong>on</strong>g> Vessel Costs<br />
Scenario $/Barrel<br />
It can be seen in Exhibit 27 that the Coaster RORO costs per FEU are all substantially <str<strong>on</strong>g>high</str<strong>on</strong>g>er, almost<br />
double, those <str<strong>on</strong>g>of</str<strong>on</strong>g> the larger GLSLS max ship at all levels <str<strong>on</strong>g>of</str<strong>on</strong>g> fuel price. This differential reflects the<br />
improved capital, operating, and energy efficiency <str<strong>on</strong>g>of</str<strong>on</strong>g> the larger ship, which in turn becomes a key factor<br />
in the ability <str<strong>on</strong>g>of</str<strong>on</strong>g> maritime technology to successfully compete with rail and truck for market share.<br />
Finally, C<strong>on</strong>tainer <strong>on</strong> Barge (COB) service, which is <strong>on</strong>e <str<strong>on</strong>g>of</str<strong>on</strong>g> the few opti<strong>on</strong>s available for the Mississippi<br />
River, is the most energy efficient transportati<strong>on</strong> mode being evaluated. COB shows a surprising<br />
insensitivity to rising energy <str<strong>on</strong>g>prices</str<strong>on</strong>g>. According to MARAD 19, COB can move a t<strong>on</strong> <str<strong>on</strong>g>of</str<strong>on</strong>g> <strong>freight</strong> 514 miles <strong>on</strong><br />
<strong>on</strong>e gall<strong>on</strong> <str<strong>on</strong>g>of</str<strong>on</strong>g> fuel; while rail moves it 202 miles and trucks move <strong>on</strong>ly 59 miles. This shows up in the costing<br />
models as well, where fuel comprised <strong>on</strong>ly 18 percent <str<strong>on</strong>g>of</str<strong>on</strong>g> COB line-haul cost in Base Year 2005, while it<br />
represented 35 percent <str<strong>on</strong>g>of</str<strong>on</strong>g> rail cost and 46 percent <str<strong>on</strong>g>of</str<strong>on</strong>g> trucking cost.<br />
Accordingly as fuel <str<strong>on</strong>g>prices</str<strong>on</strong>g> go up, COB costs rise <strong>on</strong>ly a small amount in comparis<strong>on</strong> to the costs <str<strong>on</strong>g>of</str<strong>on</strong>g> other<br />
modes. COB costs rise from 21¢ per FEU-mile in the 2005 Base up to <strong>on</strong>ly 28¢ per FEU-mile in the 2020<br />
Pessimistic <str<strong>on</strong>g>oil</str<strong>on</strong>g>-price scenario. This opens up a huge differential in the cost comparis<strong>on</strong> between COB and<br />
that <str<strong>on</strong>g>of</str<strong>on</strong>g> other modes. In the past the price differential has not been quite enough for shippers to justify the<br />
added time that COB service would take. In the future, the differential may be much larger if energy<br />
<str<strong>on</strong>g>prices</str<strong>on</strong>g> c<strong>on</strong>tinue to rise, making COB service much more competitive.<br />
RORO is suggested for both ship and COB opti<strong>on</strong>s, because RORO vessels can be loaded and unloaded<br />
much more quickly and at a lower cost than crane-loaded vessels. This makes RORO appropriate for<br />
short-distance shipping lanes where <str<strong>on</strong>g>high</str<strong>on</strong>g> port charges could easily overwhelm any advantage that water<br />
may have in line-haul efficiency. RORO makes for a more cost effective movement overall because even<br />
though its line haul cost has g<strong>on</strong>e up by a little, this added transportati<strong>on</strong> cost is more than <str<strong>on</strong>g>of</str<strong>on</strong>g>fset by the<br />
much larger savings in port handling charges.<br />
5.5 MODAL PERFORMANCE COMPARISON<br />
Fuel %<br />
<str<strong>on</strong>g>of</str<strong>on</strong>g> 2005<br />
The <str<strong>on</strong>g>impact</str<strong>on</strong>g> <str<strong>on</strong>g>of</str<strong>on</strong>g> <str<strong>on</strong>g>high</str<strong>on</strong>g>er <str<strong>on</strong>g>oil</str<strong>on</strong>g> <str<strong>on</strong>g>prices</str<strong>on</strong>g> <strong>on</strong> U.S. transportati<strong>on</strong> costs is dramatic. Exhibit 28 shows how inland<br />
shipping costs change under the low, central, and <str<strong>on</strong>g>high</str<strong>on</strong>g> <str<strong>on</strong>g>oil</str<strong>on</strong>g> price scenarios by 2020. 20 In the Central Case<br />
scenario with <str<strong>on</strong>g>oil</str<strong>on</strong>g> <str<strong>on</strong>g>prices</str<strong>on</strong>g> at over $90 per barrel in 2020:<br />
base<br />
• Truck costs increase from $1.41 per FEU-mile to $2.28 per FEU-mile, an increase <str<strong>on</strong>g>of</str<strong>on</strong>g> over $0.87<br />
per FEU-mile.<br />
19 See: http://www.irpt.net/irpt.nsf/LinksView/Envir<strong>on</strong>mentalAdvantages?Opendocument.<br />
20 The order <str<strong>on</strong>g>of</str<strong>on</strong>g> modes in the legend goes from most expensive to least expensive mode, respectively.<br />
TEMS, INC. OCTOBER 2008<br />
RORO<br />
Cost per<br />
FEU-Mile<br />
Ship %<br />
<str<strong>on</strong>g>of</str<strong>on</strong>g> 2005<br />
base<br />
2002 Historic $28.85 53% $0.37 76%<br />
2005 Base $54.79 100% $0.48 100%<br />
2020 Optimistic $59.61 109% $0.50 104%<br />
2020 Central $91.03 166% $0.64 133%<br />
2020 Pessimistic $157.18 287% $0.93 193%<br />
31
TECHNICAL REPORT - IMPACT OF HIGH OIL PRICES ON FREIGHT TRANSPORTATION:<br />
MODAL SHIFT POTENTIAL IN FIVE CORRIDORS<br />
• Rail line-haul costs rise from $0.30 per FEU-mile to $0.45, an increase <str<strong>on</strong>g>of</str<strong>on</strong>g> $0.15.<br />
• For COB, the increase from $0.19 per FEU-mile to $0.23 per FEU-mile is <strong>on</strong>ly $0.04.<br />
Scenario<br />
Line-Haul Cost per FEU-Mile<br />
Exhibit 28: Comparis<strong>on</strong> by Mode <str<strong>on</strong>g>of</str<strong>on</strong>g> Fuel Prices and Line-Haul Costs ($2008)<br />
$3.50<br />
$3.00<br />
$2.50<br />
$2.00<br />
$1.50<br />
$1.00<br />
$0.50<br />
Crude Oil per<br />
Barrel<br />
2002 Historical<br />
Fuel Prices Line-Haul Costs per C<strong>on</strong>tainer (FEU) Mile<br />
Diesel per<br />
Gall<strong>on</strong> Truck Rail IMX*<br />
* Rail IMX is rail inter<strong>modal</strong> traffic.<br />
** GLSLS-max ships are vessels built to the maximum physical c<strong>on</strong>straints <str<strong>on</strong>g>of</str<strong>on</strong>g> the St. Lawrence Seaway and other<br />
lock restricti<strong>on</strong>s in the Great Lakes.<br />
Exhibit 29 shows the <str<strong>on</strong>g>impact</str<strong>on</strong>g> <str<strong>on</strong>g>of</str<strong>on</strong>g> increases in diesel fuel <str<strong>on</strong>g>prices</str<strong>on</strong>g> <strong>on</strong> line-haul costs. The fuel-efficient rail and<br />
water modes, especially COB, are far less affected by fuel price increases than trucking. The gap<br />
between line-haul costs for truck versus rail and water widens as fuel <str<strong>on</strong>g>prices</str<strong>on</strong>g> increase, such that shippers will<br />
be able to realize significant savings by diverting to rail and water.<br />
Exhibit 29: Comparis<strong>on</strong> by Mode <str<strong>on</strong>g>of</str<strong>on</strong>g> the Impact <str<strong>on</strong>g>of</str<strong>on</strong>g> Diesel Fuel Prices <strong>on</strong> Line-Haul Costs ($2008)<br />
$0.00<br />
$1.00 $2.00 $3.00 $4.00<br />
Diesel Fuel Price/Gall<strong>on</strong><br />
$5.00 $6.00 $7.00<br />
Truck Coaster RORO Rail GLSLS-Max RORO COB<br />
TEMS, INC. OCTOBER 2008<br />
2005 Base Case<br />
2020 Low Case<br />
2020 Central Case<br />
GLSLS-Max<br />
RORO**<br />
A widening<br />
gap due to<br />
<str<strong>on</strong>g>high</str<strong>on</strong>g>er <str<strong>on</strong>g>oil</str<strong>on</strong>g><br />
<str<strong>on</strong>g>prices</str<strong>on</strong>g><br />
Coaster<br />
RORO COB<br />
2002 Historical $28.85 $1.37 $1.41 $0.30 $0.15 $0.37 $0.19<br />
2005 Base Case $54.79 $2.40 $1.75 $0.36 $0.23 $0.48 $0.21<br />
2020 Low Case $59.61 $2.61 $1.82 $0.37 $0.25 $0.50 $0.21<br />
2020 Central Case $91.03 $3.99 $2.28 $0.45 $0.34 $0.64 $0.23<br />
2020 High Case $157.18 $6.88 $3.24 $0.60 $0.55 $0.93 $0.28<br />
2020 High Case<br />
32
TECHNICAL REPORT - IMPACT OF HIGH OIL PRICES ON FREIGHT TRANSPORTATION:<br />
MODAL SHIFT POTENTIAL IN FIVE CORRIDORS<br />
As a result, the energy-efficient rail and water modes, especially COB are far less affected by fuel price<br />
increases than trucking. As a result, shippers can make real savings by diverting <strong>freight</strong> to rail and water<br />
as <str<strong>on</strong>g>oil</str<strong>on</strong>g> <str<strong>on</strong>g>prices</str<strong>on</strong>g> rise.<br />
However, an important issue for rail and water modes is the cost <str<strong>on</strong>g>of</str<strong>on</strong>g> drayage (i.e., the movement from the<br />
terminal or port by truck to the final c<strong>on</strong>signee), and like other trucking costs, drayage costs rise<br />
significantly with the price <str<strong>on</strong>g>of</str<strong>on</strong>g> <str<strong>on</strong>g>oil</str<strong>on</strong>g>. Drayage charges are very <str<strong>on</strong>g>high</str<strong>on</strong>g> as there is frequently no back haul and<br />
trips involve extra time for pickups and delivery, both at ports and at the customer’s loading dock.<br />
Fortunately, drayage distances are usually short, limiting the <str<strong>on</strong>g>impact</str<strong>on</strong>g> <strong>on</strong> the overall ec<strong>on</strong>omics. Drayage<br />
costs rise from historical $4.24 per mile to $6.17 per mile in the 2020 Central Case. This will encourage<br />
firms that make use <str<strong>on</strong>g>of</str<strong>on</strong>g> inter<strong>modal</strong> services to locate even closer to ports and rail terminals to minimize the<br />
drayage costs. Exhibit 30 illustrates the results presented in Exhibit 14 earlier in this chapter.<br />
Exhibit 30: Impact <str<strong>on</strong>g>of</str<strong>on</strong>g> Fuel Prices <strong>on</strong> Drayage and Line-Haul Trucking Costs per Mile ($2008)<br />
Cost per Mile<br />
$9<br />
$8<br />
$7<br />
$6<br />
$5<br />
$4<br />
$3<br />
$2<br />
$1<br />
$0<br />
$0 $1 $2 $3 $4 $5 $6 $7 $8<br />
Diesel Fuel Price/Gall<strong>on</strong><br />
Drayage Line-Haul<br />
However, Exhibit 31 shows that even with typical drayage costs included, rail and water costs remain much<br />
lower than truck as energy <str<strong>on</strong>g>prices</str<strong>on</strong>g> rise. Since the drayage and port costs remain relatively fixed, and the<br />
costs for water and rail are lower per mile, the advantage <str<strong>on</strong>g>of</str<strong>on</strong>g> rail and water shipping increases over<br />
l<strong>on</strong>ger distances. N<strong>on</strong>etheless, under the central case <str<strong>on</strong>g>of</str<strong>on</strong>g> a diesel fuel price <str<strong>on</strong>g>of</str<strong>on</strong>g> $3.99 per gall<strong>on</strong>, water<br />
shipping using RORO vessels or barges can be cost-competitive to trucking for distances as short as 250<br />
miles. Rail still costs more than trucking at 250 miles because <str<strong>on</strong>g>of</str<strong>on</strong>g> the <str<strong>on</strong>g>high</str<strong>on</strong>g> terminal costs for lifting doublestack<br />
c<strong>on</strong>tainers <strong>on</strong>to railcars. Specialized short-haul rail Inter<strong>modal</strong> technologies, such as Canadian<br />
Pacific’s Expressway c<strong>on</strong>cept that uses RORO rather than Lift-On/Lift-Off (LOLO) railcar loading, are not<br />
in widespread use in the rail industry today. 21<br />
21 See: http://findarticles.com/p/articles/mi_m1215/is_1_204/ai_97447670.<br />
TEMS, INC. OCTOBER 2008<br />
A widening<br />
gap due to<br />
<str<strong>on</strong>g>high</str<strong>on</strong>g>er <str<strong>on</strong>g>oil</str<strong>on</strong>g><br />
<str<strong>on</strong>g>prices</str<strong>on</strong>g><br />
33
TECHNICAL REPORT - IMPACT OF HIGH OIL PRICES ON FREIGHT TRANSPORTATION:<br />
MODAL SHIFT POTENTIAL IN FIVE CORRIDORS<br />
Exhibit 31: 2020 Central Case Scenario – Comparis<strong>on</strong> <str<strong>on</strong>g>of</str<strong>on</strong>g> Water, Rail and Trucking Total Cost<br />
per Mile for Line-Haul and Drayage ($2008)<br />
Total Cost per C<strong>on</strong>tainer (FEU)<br />
$3,000<br />
$2,500<br />
$2,000<br />
$1,500<br />
$1,000<br />
$500<br />
$0<br />
250 500 750<br />
Trip Length in Miles<br />
1000 1250<br />
COB GLSLS-Max RORO Rail Truck<br />
Exhibit 32 shows the minimum breakeven length <str<strong>on</strong>g>of</str<strong>on</strong>g> haul needed to support the viability <str<strong>on</strong>g>of</str<strong>on</strong>g> inter<strong>modal</strong><br />
shipping by the water and rail modes. Although the calculated breakeven for rail is <strong>on</strong>ly 400 miles,<br />
typically railroads require at least 700 to 1,000 miles in order to generate a sufficient pr<str<strong>on</strong>g>of</str<strong>on</strong>g>it margin.<br />
Railroads need this pr<str<strong>on</strong>g>of</str<strong>on</strong>g>it margin because they must finance their infrastructure privately and pay their<br />
own costs for capacity expansi<strong>on</strong>. Under these circumstances, railroad operators do not believe that shorthaul<br />
traffic generates enough pr<str<strong>on</strong>g>of</str<strong>on</strong>g>it to justify the required infrastructure investments. Furthermore, for the<br />
last 10 years U.S. railroads have faced capacity problems and are limited in terms <str<strong>on</strong>g>of</str<strong>on</strong>g> how much<br />
additi<strong>on</strong>al traffic they can carry, particularly in East-West corridors.<br />
In c<strong>on</strong>trast, vessels would use existing waterways, which have c<strong>on</strong>siderable capacity. For example, the St.<br />
Lawrence Seaway is <strong>on</strong>ly operating at around 50 percent capacity. Therefore, water can compete for<br />
short-haul inter<strong>modal</strong> truck traffic at distances which rail does not have the capacity to handle. This means<br />
also that water will complement or augment existing rail capacity rather than competing directly with rail.<br />
In the current market, water will tend to take inter<strong>modal</strong> traffic which rail is not able to handle. This is<br />
especially true for the lower-cost water shipping opti<strong>on</strong>s such as COB.<br />
In terms <str<strong>on</strong>g>of</str<strong>on</strong>g> the different types <str<strong>on</strong>g>of</str<strong>on</strong>g> water vessels, <strong>on</strong>e <str<strong>on</strong>g>of</str<strong>on</strong>g> the most important results <str<strong>on</strong>g>of</str<strong>on</strong>g> the analysis is the<br />
relative strength <str<strong>on</strong>g>of</str<strong>on</strong>g> the COB opti<strong>on</strong>. As energy <str<strong>on</strong>g>prices</str<strong>on</strong>g> rise, COB becomes more and more cost-competitive<br />
with truck and rail. Although COB is slower than rail, costs are much less affected by fuel <str<strong>on</strong>g>prices</str<strong>on</strong>g> than either<br />
RORO ship or rail alternative, reflecting cost increases that are <strong>on</strong>ly <strong>on</strong>e third <str<strong>on</strong>g>of</str<strong>on</strong>g> those <str<strong>on</strong>g>of</str<strong>on</strong>g> the RORO<br />
vessels.<br />
TEMS, INC. OCTOBER 2008<br />
34
TECHNICAL REPORT - IMPACT OF HIGH OIL PRICES ON FREIGHT TRANSPORTATION:<br />
MODAL SHIFT POTENTIAL IN FIVE CORRIDORS<br />
Line-Haul Distance in Miles<br />
450<br />
400<br />
350<br />
300<br />
250<br />
200<br />
Exhibit 32: Line-Haul Breakeven Distance by Mode ($2008)<br />
150<br />
$0 $1 $2 $3 $4 $5 $6 $7 $8<br />
Rail<br />
Diesel Fuel Price/Gall<strong>on</strong><br />
GLSLS-Max RORO COB<br />
As a result, it is clear that the water and rail modes are least affected by rising energy <str<strong>on</strong>g>prices</str<strong>on</strong>g>. However,<br />
trucking costs rise significantly with energy <str<strong>on</strong>g>prices</str<strong>on</strong>g>. Large 22-knot inland or coastal RORO vessels can<br />
compete with rail and truck <strong>on</strong> a transit time basis and will maintain their cost competitiveness as energy<br />
<str<strong>on</strong>g>prices</str<strong>on</strong>g> rise.<br />
COB service is remarkably insensitive to fuel price as a result <str<strong>on</strong>g>of</str<strong>on</strong>g> its dramatic energy efficiency, but it is<br />
much slower than either rail or trucking. Accordingly, COB may develop a niche market in price-sensitive<br />
commodities that can afford to take a few extra days <str<strong>on</strong>g>of</str<strong>on</strong>g> transit time. Up to this point, the cost differential<br />
between COB and other modes has not been quite enough to entice the development <str<strong>on</strong>g>of</str<strong>on</strong>g> commercially<br />
feasible COB services, but it is quite possible that such services can easily be developed in the future if the<br />
cost differential widens. The COB opti<strong>on</strong> may then very well become attractive to shippers who need a<br />
lower-cost alternative, as they become increasingly frustrated with the very <str<strong>on</strong>g>high</str<strong>on</strong>g> costs that will be<br />
associated with all the other modes as fuel <str<strong>on</strong>g>prices</str<strong>on</strong>g> rise.<br />
The effect <str<strong>on</strong>g>of</str<strong>on</strong>g> these changing energy <str<strong>on</strong>g>prices</str<strong>on</strong>g> <strong>on</strong> the overall market share are addressed by the <strong>freight</strong><br />
forecasts that are presented in the next Chapter.<br />
TEMS, INC. OCTOBER 2008<br />
35
6<br />
TECHNICAL REPORT - IMPACT OF HIGH OIL PRICES ON FREIGHT TRANSPORTATION:<br />
MODAL SHIFT POTENTIAL IN FIVE CORRIDORS<br />
MODAL SHIFT POTENTIAL IN THE FIVE<br />
CORRIDORS<br />
6.1 OVERVIEW<br />
This study estimates <strong>modal</strong> share <strong>shift</strong>s that are likely to result from the Optimistic, Central, and Pessimistic<br />
<str<strong>on</strong>g>oil</str<strong>on</strong>g> price scenarios. 2005 is used as a base line since that is the time period used in the earlier GLSLS<br />
NC/NV study. Using the same Base Year helps maintain c<strong>on</strong>sistency and comparability between the<br />
studies. Although the market equilibrium scenarios are defined with respect to potential <str<strong>on</strong>g>oil</str<strong>on</strong>g> <str<strong>on</strong>g>prices</str<strong>on</strong>g> in 2020,<br />
all <strong>freight</strong> numbers referenced are with respect to 2005 base year flows. A total market forecast <str<strong>on</strong>g>of</str<strong>on</strong>g><br />
future year flows was not prepared.<br />
The sensitivity analysis has been developed to show the effect <str<strong>on</strong>g>of</str<strong>on</strong>g> the historically lower <str<strong>on</strong>g>oil</str<strong>on</strong>g> <str<strong>on</strong>g>prices</str<strong>on</strong>g> that were<br />
in effect during the most recent market equilibrium c<strong>on</strong>diti<strong>on</strong>s <str<strong>on</strong>g>of</str<strong>on</strong>g> the late 1990’s and early 2000’s, as well<br />
as a range <str<strong>on</strong>g>of</str<strong>on</strong>g> <str<strong>on</strong>g>high</str<strong>on</strong>g>er price scenarios that are possible for the future. Oil <str<strong>on</strong>g>prices</str<strong>on</strong>g> started rising steadily<br />
after 2002 and have not really attained a stable equilibrium since then. This report will assess the likely<br />
<str<strong>on</strong>g>impact</str<strong>on</strong>g> <strong>on</strong> transportati<strong>on</strong> costs <str<strong>on</strong>g>of</str<strong>on</strong>g> three possible equilibrium scenarios that were defined in Chapter 3 as<br />
compared both to these earlier equilibrium market c<strong>on</strong>diti<strong>on</strong>s as well as the interim n<strong>on</strong>-equilibrium costs<br />
that were in effect during 2005.<br />
6.2 BASE-LINE CONDITIONS<br />
This study broadly evaluates the market prospects for introducing maritime shipping services al<strong>on</strong>g each <str<strong>on</strong>g>of</str<strong>on</strong>g><br />
the five corridors that were defined in Chapter 4. As shown in Exhibits 33-37, these corridors are:<br />
• East Coast Corridor - Bost<strong>on</strong> to Miami<br />
• West Coast Corridor - Seattle to Los Angeles<br />
• Gulf Coast Corridor - Houst<strong>on</strong> to Miami<br />
• Mississippi River Corridor - New Orleans to Twin Cities<br />
• Great Lakes and St. Lawrence Seaway Corridor - Duluth to Halifax<br />
TEMS, INC. OCTOBER 2008<br />
36
TECHNICAL REPORT - IMPACT OF HIGH OIL PRICES ON FREIGHT TRANSPORTATION:<br />
MODAL SHIFT POTENTIAL IN FIVE CORRIDORS<br />
Exhibit 33: East Coast Corridor<br />
Exhibit 35: Gulf Coast Corridor<br />
TEMS, INC. OCTOBER 2008<br />
Exhibit 34: West Coast Corridor<br />
37
TECHNICAL REPORT - IMPACT OF HIGH OIL PRICES ON FREIGHT TRANSPORTATION:<br />
MODAL SHIFT POTENTIAL IN FIVE CORRIDORS<br />
Exhibit 36: Mississippi River Corridor<br />
Exhibit 37: Great Lakes and St. Lawrence Seaway Corridor<br />
TEMS, INC. OCTOBER 2008<br />
38
TECHNICAL REPORT - IMPACT OF HIGH OIL PRICES ON FREIGHT TRANSPORTATION:<br />
MODAL SHIFT POTENTIAL IN FIVE CORRIDORS<br />
The corridors were defined to be l<strong>on</strong>g enough to capture both short and l<strong>on</strong>g-haul traffic potential, yet<br />
short enough so that the distinct characteristics <str<strong>on</strong>g>of</str<strong>on</strong>g> each regi<strong>on</strong> can be captured and identified. For the<br />
most part, the degree <str<strong>on</strong>g>of</str<strong>on</strong>g> interacti<strong>on</strong> between the corridors is expected to be minimal, although there is<br />
some potential for l<strong>on</strong>g haul traffic to c<strong>on</strong>nect around Florida between the East and Gulf coast regi<strong>on</strong>s,<br />
which was not included here because separate models were developed for each corridor.<br />
To assess nati<strong>on</strong>al trends, an analysis compared the resp<strong>on</strong>se <str<strong>on</strong>g>of</str<strong>on</strong>g> traffic to <str<strong>on</strong>g>high</str<strong>on</strong>g>er fuel <str<strong>on</strong>g>prices</str<strong>on</strong>g> and estimated<br />
the <str<strong>on</strong>g>impact</str<strong>on</strong>g> <strong>on</strong> relative <strong>modal</strong> competitiveness and potential changes in <strong>modal</strong> shares. To fully assess the<br />
policy issues, a range <str<strong>on</strong>g>of</str<strong>on</strong>g> potential <str<strong>on</strong>g>oil</str<strong>on</strong>g> price scenarios that reflect the potential range <str<strong>on</strong>g>of</str<strong>on</strong>g> <str<strong>on</strong>g>oil</str<strong>on</strong>g> price changes<br />
were developed for each corridor.<br />
The existing transportati<strong>on</strong> market in each <str<strong>on</strong>g>of</str<strong>on</strong>g> the five corridors are described in the following secti<strong>on</strong>s,<br />
including a descripti<strong>on</strong> <str<strong>on</strong>g>of</str<strong>on</strong>g> the prospects for introducing short-sea or maritime service based <strong>on</strong> Base Year<br />
2005 traffic c<strong>on</strong>diti<strong>on</strong>s. This placed all the corridor analyses <strong>on</strong> a c<strong>on</strong>sistent basis with respect to the<br />
earlier GLSLS NC/NV study. After this, a series <str<strong>on</strong>g>of</str<strong>on</strong>g> fuel price sensitivities were run to describe how the<br />
market c<strong>on</strong>diti<strong>on</strong>s in each <str<strong>on</strong>g>of</str<strong>on</strong>g> the five corridors will change as a result <str<strong>on</strong>g>of</str<strong>on</strong>g> fuel price assumpti<strong>on</strong>s. These<br />
results are presented in the next subsecti<strong>on</strong> under “Fuel Price Sensitivities.”<br />
6.2.1 GREAT LAKES AND ST. LAWRENCE SEAWAY SYSTEM<br />
The Great Lakes and St. Lawrence Seaway system incorporates major areas <str<strong>on</strong>g>of</str<strong>on</strong>g> the Midwestern United<br />
States and Eastern Canada. The GLSLS system extends from the vicinity <str<strong>on</strong>g>of</str<strong>on</strong>g> Halifax in eastern Canada,<br />
through M<strong>on</strong>treal and Tor<strong>on</strong>to, Buffalo, Cleveland, Toledo, and Detroit, to Chicago and Duluth <strong>on</strong> the west<br />
end. The GLSLS NC/NV study extensively evaluated this corridor’s market potential and best-fit<br />
technology. This corridor is well served by truck and competitive inter<strong>modal</strong> rail service in Canada, but<br />
rail cross-border services are extremely weak, where those that are available are primarily focused <strong>on</strong><br />
l<strong>on</strong>g-haul traffic. The NC/NV study found that a RORO service using 342-FEU GLSLS-max RORO ships<br />
could <str<strong>on</strong>g>of</str<strong>on</strong>g>fer rail and truck-competitive service, and would have an advantage for developing cross-border<br />
lanes that are today poorly served by rail. Proposed services would cater to both domestic and crossborder<br />
shipping, as well as handling import/export traffic received at the ports <str<strong>on</strong>g>of</str<strong>on</strong>g> M<strong>on</strong>treal and Halifax.<br />
The NC/NV study evaluated the market potential for COB at about 20 percent that <str<strong>on</strong>g>of</str<strong>on</strong>g> the RORO vessel<br />
service, because at 2005 <str<strong>on</strong>g>oil</str<strong>on</strong>g> price levels, the costs per FEU <str<strong>on</strong>g>of</str<strong>on</strong>g> COB and RORO services were about the<br />
same although COB transport takes twice as l<strong>on</strong>g.<br />
6.2.2 U.S. EAST COAST<br />
The U.S. East Coast lanes encompass the area from Maine to Florida including the heavily built-up<br />
Northeast Corridor area from Norfolk, VA through Richm<strong>on</strong>d, Washingt<strong>on</strong>, Baltimore and Philadelphia to<br />
Bost<strong>on</strong>, MA. North <str<strong>on</strong>g>of</str<strong>on</strong>g> Bost<strong>on</strong> or south <str<strong>on</strong>g>of</str<strong>on</strong>g> Richm<strong>on</strong>d, populati<strong>on</strong> densities are much lower. On the south, the<br />
corridor extends past the southeastern ports <str<strong>on</strong>g>of</str<strong>on</strong>g> Charlest<strong>on</strong> and Savannah as far as Miami, Florida. On the<br />
north, the Huds<strong>on</strong> River at New York City forms a natural barrier to rail <strong>freight</strong> to New England, the<br />
southernmost rail bridge crossing <str<strong>on</strong>g>of</str<strong>on</strong>g> the Huds<strong>on</strong> being in the vicinity <str<strong>on</strong>g>of</str<strong>on</strong>g> Albany, NY. There is some<br />
competiti<strong>on</strong> from Halifax, which <str<strong>on</strong>g>of</str<strong>on</strong>g>fers a feeder vessel service to the northern New England states; but this<br />
geographic barrier should enhance the potential for development <str<strong>on</strong>g>of</str<strong>on</strong>g> short sea shipping services from New<br />
York and the south to New England, which historically has been a very maritime-oriented regi<strong>on</strong>.<br />
TEMS, INC. OCTOBER 2008<br />
39
6.2.3 U.S. GULF COAST<br />
TECHNICAL REPORT - IMPACT OF HIGH OIL PRICES ON FREIGHT TRANSPORTATION:<br />
MODAL SHIFT POTENTIAL IN FIVE CORRIDORS<br />
The U.S. Gulf Coast is a lightly populated, but heavily industrialized regi<strong>on</strong> <str<strong>on</strong>g>of</str<strong>on</strong>g> the United States with not<br />
just petrochemical, but also extensive grain and coal, movements coming out <str<strong>on</strong>g>of</str<strong>on</strong>g> the Mississippi River delta.<br />
Houst<strong>on</strong> anchors the regi<strong>on</strong> with a major port, while New Orleans also plays a major role in Caribbean<br />
trade and bulk cargoes. This regi<strong>on</strong> includes Miami and Tampa, FL and <strong>on</strong> the west end, and vessel<br />
services could actually extend south to Mexico and South American ports; although <strong>on</strong>ly domestic traffic<br />
potential was evaluated for this study. The corridor’s industrial base supports a str<strong>on</strong>g intracoastal<br />
shipping business, which could <strong>on</strong>ly be enhanced by the additi<strong>on</strong> <str<strong>on</strong>g>of</str<strong>on</strong>g> maritime services for c<strong>on</strong>tainers or<br />
trailers.<br />
6.2.4 MISSISSIPPI RIVER SYSTEM<br />
The Mississippi River system extends as far north as Minneapolis, MN, east to Pittsburgh, PA and as far<br />
west as Kansas City; with major port cities at St. Louis and Memphis. Feeding the port <str<strong>on</strong>g>of</str<strong>on</strong>g> New Orleans, the<br />
river system has historically played a str<strong>on</strong>g role in the shipment <str<strong>on</strong>g>of</str<strong>on</strong>g> bulk products – grain, <str<strong>on</strong>g>oil</str<strong>on</strong>g>, coal, and<br />
st<strong>on</strong>e – but it has had difficulty gaining a foothold in the movement <str<strong>on</strong>g>of</str<strong>on</strong>g> c<strong>on</strong>tainerized traffic because <str<strong>on</strong>g>of</str<strong>on</strong>g> its<br />
slow transit times. During the previous era <str<strong>on</strong>g>of</str<strong>on</strong>g> low energy <str<strong>on</strong>g>prices</str<strong>on</strong>g>, the cost differential between COB, rail, or<br />
even trucking was not large enough to spur the development <str<strong>on</strong>g>of</str<strong>on</strong>g> COB services.<br />
However, at <str<strong>on</strong>g>high</str<strong>on</strong>g>er energy <str<strong>on</strong>g>prices</str<strong>on</strong>g>, the relative energy efficiency <str<strong>on</strong>g>of</str<strong>on</strong>g> COB opens up a large cost differential<br />
that is capable <str<strong>on</strong>g>of</str<strong>on</strong>g> attracting some traffic to the mode. In additi<strong>on</strong>, some new kinds <str<strong>on</strong>g>of</str<strong>on</strong>g> c<strong>on</strong>tainerized traffic<br />
are developing – such as export grain in c<strong>on</strong>tainers – which are known to be amenable to COB movement,<br />
since they already move by COB in the Pacific Northwest.<br />
As a result <str<strong>on</strong>g>of</str<strong>on</strong>g> the c<strong>on</strong>vergence <str<strong>on</strong>g>of</str<strong>on</strong>g> these trends we see a vital role for the c<strong>on</strong>tinuati<strong>on</strong> <str<strong>on</strong>g>of</str<strong>on</strong>g> current energyefficient<br />
bulk shipping <strong>on</strong> the river system, as well as an improved potential for the development <str<strong>on</strong>g>of</str<strong>on</strong>g> COB<br />
services as a result <str<strong>on</strong>g>of</str<strong>on</strong>g> rising energy <str<strong>on</strong>g>prices</str<strong>on</strong>g>.<br />
6.2.5 U.S. WEST COAST<br />
U.S. West Coast ports have historically been focused or oriented towards the development <str<strong>on</strong>g>of</str<strong>on</strong>g> east-west<br />
Asian c<strong>on</strong>tainer business; similarly, the rail inter<strong>modal</strong> system has been much more oriented to shipping<br />
towards the interior <str<strong>on</strong>g>of</str<strong>on</strong>g> the country (east-west) rather than al<strong>on</strong>g domestic north south lanes. As a result,<br />
the rail inter<strong>modal</strong> network running parallel to the West Coast is weak, since east-west traffic commands a<br />
much l<strong>on</strong>ger haul and is therefore more pr<str<strong>on</strong>g>of</str<strong>on</strong>g>itable to the railroads.<br />
RORO services could possibly help fill this gap in the West Coast network, helping to relieve truck traffic<br />
c<strong>on</strong>gesti<strong>on</strong> al<strong>on</strong>g I-5 and parallel corridors. In additi<strong>on</strong>, RORO services could c<strong>on</strong>ceivably be used to help<br />
alleviate port capacity c<strong>on</strong>straints at the major west cost ports such as Los Angeles / L<strong>on</strong>g Beach (LA/LB)<br />
by promoting development <str<strong>on</strong>g>of</str<strong>on</strong>g> “satellite” ports linked by vessel feeder services. While the West Coast has<br />
<strong>on</strong>ly a very limited number <str<strong>on</strong>g>of</str<strong>on</strong>g> deep-draft internati<strong>on</strong>al ports, there are numerous smaller ports potentially<br />
available for port development for RORO ships.<br />
6.3 CONTAINER FORECAST RESULTS<br />
Exhibit 38 shows how the transportati<strong>on</strong> market changes in each <str<strong>on</strong>g>of</str<strong>on</strong>g> the corridors as a functi<strong>on</strong> <str<strong>on</strong>g>of</str<strong>on</strong>g> the fuel<br />
price, illustrating the prospects for a successful introducti<strong>on</strong> <str<strong>on</strong>g>of</str<strong>on</strong>g> c<strong>on</strong>tainer shipping. All these results are<br />
based <strong>on</strong> 2005 Base Year traffic levels with <strong>modal</strong> shares adjusted for fuel price differentials.<br />
TEMS, INC. OCTOBER 2008<br />
40
TECHNICAL REPORT - IMPACT OF HIGH OIL PRICES ON FREIGHT TRANSPORTATION:<br />
MODAL SHIFT POTENTIAL IN FIVE CORRIDORS<br />
Exhibit 38: Sensitivity by Domestic Corridor C<strong>on</strong>tainer (FEU) Traffic to Diesel Fuel Prices ($2008)<br />
Annual Number <str<strong>on</strong>g>of</str<strong>on</strong>g> Loaded C<strong>on</strong>tainers (FEUs)<br />
1,400,000<br />
1,200,000<br />
1,000,000<br />
800,000<br />
600,000<br />
400,000<br />
200,000<br />
2002<br />
Note: East and West Coast traffic estimates do not include most import and export c<strong>on</strong>tainers.<br />
For domestic traffic, as shown in Exhibit 38, the model results show that the best opportunities for<br />
introducti<strong>on</strong> <str<strong>on</strong>g>of</str<strong>on</strong>g> water c<strong>on</strong>tainer services lie <strong>on</strong> the interior corridors: GLSLS, Mississippi, and Gulf Coast.<br />
This occurs because the primary producti<strong>on</strong> regi<strong>on</strong>s in the United States lie in the interior <str<strong>on</strong>g>of</str<strong>on</strong>g> the country.<br />
The East and West Coast ec<strong>on</strong>omies are heavily focused <strong>on</strong> “New Ec<strong>on</strong>omy” services, and so these two bicoastal<br />
regi<strong>on</strong>s primarily c<strong>on</strong>sume, rather than produce, goods. These two markets primarily trade goods<br />
with the interior regi<strong>on</strong>s <str<strong>on</strong>g>of</str<strong>on</strong>g> the country rather than al<strong>on</strong>g the coasts.<br />
6.3.1 EAST COAST DETAIL RESULTS<br />
2005<br />
0<br />
$0 $1 $2 $3 $4 $5 $6 $7 $8<br />
Diesel Fuel Price/Gall<strong>on</strong><br />
Great Lakes East Coast Gulf Cost<br />
Mississippi West Coast<br />
The total East Coast market potential was assessed at 103,207 FEU in 2005, about <strong>on</strong>e-sixth the level <str<strong>on</strong>g>of</str<strong>on</strong>g><br />
the comparable GLSLS forecast for the same year.<br />
As shown in Exhibit 39, analysis <str<strong>on</strong>g>of</str<strong>on</strong>g> East Coast market potential suggest that many <str<strong>on</strong>g>of</str<strong>on</strong>g> the main East Coast<br />
water opportunities centered <strong>on</strong> the Port <str<strong>on</strong>g>of</str<strong>on</strong>g> M<strong>on</strong>treal. This reflects the strength <str<strong>on</strong>g>of</str<strong>on</strong>g> the Port <str<strong>on</strong>g>of</str<strong>on</strong>g> M<strong>on</strong>treal for<br />
import/export traffic, and the weakness <str<strong>on</strong>g>of</str<strong>on</strong>g> rail inter<strong>modal</strong> services from M<strong>on</strong>treal into the U.S. East Coast<br />
markets. This weakness has led the Port <str<strong>on</strong>g>of</str<strong>on</strong>g> M<strong>on</strong>treal into using l<strong>on</strong>g-haul trucking to reach important U.S.<br />
markets. As a result, water becomes an important competitor to trucking as fuel <str<strong>on</strong>g>prices</str<strong>on</strong>g> rise. However, this<br />
result should not be interpreted that vessels should immediately start providing service between M<strong>on</strong>treal<br />
and Bost<strong>on</strong>. Because as <str<strong>on</strong>g>oil</str<strong>on</strong>g> <str<strong>on</strong>g>prices</str<strong>on</strong>g> rise, we see a <str<strong>on</strong>g>high</str<strong>on</strong>g> likelihood that this import/export traffic may <strong>shift</strong><br />
either to Halifax, where it can use existing water feeder services to the New England states, or more likely<br />
to the Port <str<strong>on</strong>g>of</str<strong>on</strong>g> New York and New Jersey.<br />
TEMS, INC. OCTOBER 2008<br />
41
TECHNICAL REPORT - IMPACT OF HIGH OIL PRICES ON FREIGHT TRANSPORTATION:<br />
MODAL SHIFT POTENTIAL IN FIVE CORRIDORS<br />
Exhibit 39: EAST C<strong>on</strong>tainerized Traffic –Top Ten Flows<br />
(Annual FEU’s Forecast by Corridor)<br />
Origin port Destinati<strong>on</strong> Port Food Raw Semi-Finished Finished Total<br />
"M<strong>on</strong>treal, PQ" "Bost<strong>on</strong>, MA" 6,948 248 9,509 0 16,705<br />
"M<strong>on</strong>treal, PQ" "Baltimore, MD" 1,204 644 8,782 12 10,642<br />
"M<strong>on</strong>treal, PQ" "Philadelphia, PA" 900 570 8,643 20 10,133<br />
"M<strong>on</strong>treal, PQ" "New York, NY" 108 73 8,842 45 9,068<br />
"M<strong>on</strong>treal, PQ" "Norfolk, VA" 127 1,113 5,778 1 7,019<br />
"Norfolk, VA" "Philadelphia, PA" 1,724 1,208 1,567 3 4,502<br />
"M<strong>on</strong>treal, PQ" "Springfield, MA" 943 28 2,442 3 3,416<br />
"M<strong>on</strong>treal, PQ" "Newark Terminal, NJ" 29 417 2,603 10 3,059<br />
"Savannah, GA" "Jacks<strong>on</strong>ville, FL" 656 384 1,679 184 2,903<br />
"Baltimore, MD" "Philadelphia, PA" 1,984 388 259 3 2,634<br />
Total All Flows 19,629 14,875 67,860 843 103,207<br />
6.3.2 WEST COAST DETAIL RESULTS<br />
The total West Coast market potential, excluding the existing Alaska and Hawaii trade (a few additi<strong>on</strong>al<br />
small Alaska and Hawaii flows were generated by our forecasting process) was assessed at 157,975 FEU<br />
in 2005, about <strong>on</strong>e-fourth the level <str<strong>on</strong>g>of</str<strong>on</strong>g> the comparable GLSLS forecast for the same year.<br />
As shown in Exhibit 40, analysis <str<strong>on</strong>g>of</str<strong>on</strong>g> West Coast market potential indicates an opportunity to develop vessel<br />
feeder services between Los Angeles and San Diego and Oakland. The potential volumes available for<br />
these services are probably understated since the analysis was c<strong>on</strong>structed using <strong>on</strong>ly domestic flows. As<br />
such, it does not reflect the special characteristics <str<strong>on</strong>g>of</str<strong>on</strong>g> import and export c<strong>on</strong>tainers that make this traffic<br />
much more likely to use an appropriately designed feeder service. The development <str<strong>on</strong>g>of</str<strong>on</strong>g> feeder services<br />
also for internati<strong>on</strong>al would help ease West Coast port c<strong>on</strong>gesti<strong>on</strong>, and would likely double or triple the<br />
forecast traffic presented here that are based <strong>on</strong>ly <strong>on</strong> domestic traffic flows.<br />
Exhibit 40: WEST C<strong>on</strong>tainerized Traffic –Top Ten Flows<br />
(Annual FEU’s Forecast by Corridor)<br />
Origin port Destinati<strong>on</strong> Port Food Raw Semi-Finished Finished Total<br />
Los Angeles, CA San Diego, CA 10,220 13,664 7,885 2,639 34,408<br />
San Diego, CA Los Angeles, CA 9,384 12,476 7,182 2,855 31,897<br />
Los Angeles, CA Oakland, CA 8,584 3,709 5,721 1,031 19,045<br />
Oakland, CA Los Angeles, CA 6,941 3,535 4,266 958 15,700<br />
Vancouver, BC Seattle-Tacoma, WA 4,941 185 10,359 3 15,488<br />
Anchorage, AK Seattle-Tacoma, WA 6,546 108 1,254 65 7,972<br />
Vancouver, WA Seattle-Tacoma, WA 4,787 547 207 0 5,541<br />
Seattle-Tacoma, WA Vancouver, WA 4,772 491 181 0 5,444<br />
Vancouver, BC Anchorage, AK 1,303 0 1,421 15 2,739<br />
Vancouver, BC H<strong>on</strong>olulu, HI 2,092 0 0 0 2,092<br />
Total All Flows 66,497 35,927 47,502 8,050 157,975<br />
TEMS, INC. OCTOBER 2008<br />
42
TECHNICAL REPORT - IMPACT OF HIGH OIL PRICES ON FREIGHT TRANSPORTATION:<br />
MODAL SHIFT POTENTIAL IN FIVE CORRIDORS<br />
6.3.3 GLSLS DETAIL RESULTS<br />
The total GLSLS market was assessed at 594,780 FEU in 2005, the same as the comparable GLSLS<br />
NC/NV forecast for the same year.<br />
As shown in Exhibit 41, analysis <str<strong>on</strong>g>of</str<strong>on</strong>g> GLSLS market potential identifies a number <str<strong>on</strong>g>of</str<strong>on</strong>g> short haul lanes,<br />
including some Canadian services, which were included within the scope <str<strong>on</strong>g>of</str<strong>on</strong>g> the original NC/NV study and<br />
are still in the GLSLS database. These numbers are substantially less than some <str<strong>on</strong>g>of</str<strong>on</strong>g> the NC/NV projecti<strong>on</strong>s<br />
through 2050, which also take demographic growth and traffic c<strong>on</strong>gesti<strong>on</strong> into account. Based <strong>on</strong> 2005<strong>freight</strong><br />
flows <strong>on</strong>ly, these new results are reported to provide a comparis<strong>on</strong> <str<strong>on</strong>g>of</str<strong>on</strong>g> the four new corridor results<br />
against the previous NC/NV benchmark.<br />
Exhibit 41: GLSLS C<strong>on</strong>tainerized Traffic –Top Ten Flows<br />
(Annual FEU’s Forecast by Corridor)<br />
Origin port Destinati<strong>on</strong> Port Food Raw Semi-Finished Finished Total<br />
M<strong>on</strong>treal, QB Tor<strong>on</strong>to, ON 1,983 9,144 8,253 212 19,592<br />
Tor<strong>on</strong>to, ON M<strong>on</strong>treal, QB 2,374 7,678 5,696 1,355 17,103<br />
Chicago, IL Milwaukee, WI 794 8,526 1,957 2,617 13,894<br />
Milwaukee, WI Chicago, IL 5,527 4,121 2,020 1,089 12,757<br />
Chicago, IL Burns Harbor 1,889 6,392 2,135 2,152 12,568<br />
Burns Harbor Chicago, IL 2,333 7,467 1,091 1,248 12,139<br />
Cleveland, OH Toledo, OH 1,425 7,199 1,693 1,140 11,457<br />
M<strong>on</strong>treal, QB Halifax, NS 614 7,345 1,240 354 9,553<br />
Milwaukee, WI Green Bay, WI 1,243 4,144 2,142 302 7,831<br />
Detroit, MI Cleveland, OH 2,680 2,759 843 1,463 7,745<br />
Total All Flows 109,300 254,449 160,882 70,149 594,780<br />
6.3.4 GULF COAST DETAIL RESULTS<br />
The Gulf Coast market was assessed at 423,183 FEU in 2005, about two-third the size <str<strong>on</strong>g>of</str<strong>on</strong>g> the comparable<br />
GLSLS market forecast for the same year.<br />
As shown in Exhibit 42, analysis <str<strong>on</strong>g>of</str<strong>on</strong>g> Gulf Coast market potential identifies a number <str<strong>on</strong>g>of</str<strong>on</strong>g> significant short-sea<br />
shipping markets, including Miami to Tampa and Corpus Christi to Galvest<strong>on</strong> services. Pensacola also<br />
emerged as a significant potential Gulf Coast c<strong>on</strong>tainer port, if linked by feeder service to Miami.<br />
Exhibit 42: Gulf Coast C<strong>on</strong>tainerized Traffic –Top Ten Flows<br />
(Annual FEU’s Forecast by Corridor)<br />
Origin port Destinati<strong>on</strong> Port Food Raw Semi-Finished Finished Total<br />
"Miami, FL" "Tampa, FL" 2,821 101,053 2,881 554 107,309<br />
"Tampa, FL" "Miami, FL" 2,590 67,659 2,444 508 73,201<br />
"Corpus Christi, TX" "Galvest<strong>on</strong>, TX" 4,896 32,886 3,503 764 42,049<br />
"Galvest<strong>on</strong>, TX" "Corpus Christi, TX" 4,878 32,654 3,447 750 41,729<br />
"Pensacola, FL" "Tampa, FL" 711 21,045 627 90 22,473<br />
"Tampa, FL" "Pensacola, FL" 478 15,270 434 70 16,252<br />
"Miami, FL" "Pensacola, FL" 290 11,417 218 19 11,944<br />
"Pensacola, FL" "Miami, FL" 401 11,085 250 23 11,759<br />
"Biloxi, MS" "Biloxi, MS" 3,972 2,600 3,722 176 10,470<br />
"Galvest<strong>on</strong>, TX" "New Orleans, LA" 612 8,882 340 31 9,865<br />
Total All Flows 34,640 348,553 35,834 4,156 423,183<br />
TEMS, INC. OCTOBER 2008<br />
43
TECHNICAL REPORT - IMPACT OF HIGH OIL PRICES ON FREIGHT TRANSPORTATION:<br />
MODAL SHIFT POTENTIAL IN FIVE CORRIDORS<br />
6.3.5 MISSISSIPPI CORRIDOR DETAIL RESULTS<br />
The Mississippi c<strong>on</strong>tainerizable traffic market was assessed at 425,110 FEU in 2005, about two-third <str<strong>on</strong>g>of</str<strong>on</strong>g><br />
the size <str<strong>on</strong>g>of</str<strong>on</strong>g> the comparable GLSLS market forecast for the same year. This finding is especially significant<br />
in view <str<strong>on</strong>g>of</str<strong>on</strong>g> the fact that a COB service was assumed for the Mississippi system, whereas the GLSLS and<br />
three coastal corridors could use faster RORO ships.<br />
As shown in Exhibit 43, analysis <str<strong>on</strong>g>of</str<strong>on</strong>g> Mississippi corridor market potential identifies a number <str<strong>on</strong>g>of</str<strong>on</strong>g> short haul<br />
lanes, which need to be reviewed in more detail to establish whether inter<strong>modal</strong> moves <str<strong>on</strong>g>of</str<strong>on</strong>g> this distance<br />
really fall within the realm <str<strong>on</strong>g>of</str<strong>on</strong>g> commercial feasibility. However, even if such COB services are not feasible<br />
at current fuel price levels, they could be in the future as fuel <str<strong>on</strong>g>prices</str<strong>on</strong>g> go up.<br />
Exhibit 43: Mississippi C<strong>on</strong>tainerized Traffic –Top Ten Flows<br />
(Annual FEU’s Forecast by Corridor)<br />
Origin port Destinati<strong>on</strong> Port Food Raw Semi-Finished Finished Total<br />
Cincinnati-OH Louisville, KY 1,104 65,083 1,420 51 67,658<br />
Cincinnati-OH Pittsburgh-PA 1,065 17,884 706 172 19,827<br />
Peoria, IL Davenport, IA 1,286 17,331 2 21 18,640<br />
Davenport, IA Peoria, IL 9,968 3,516 3,151 5 16,640<br />
New Orleans, LA Bat<strong>on</strong> Rouge, LA 393 10,973 2,680 23 14,069<br />
Cincinnati-OH Huntingt<strong>on</strong>, WV 188 11,259 423 30 11,900<br />
Bat<strong>on</strong> Rouge, LA New Orleans, LA 405 6,984 2,349 26 9,764<br />
Jeffers<strong>on</strong> City, MO Kansas City-KS 4,167 2,062 3,364 9 9,602<br />
Minneapolis-MN Onalaska, Ill 4,246 761 4,019 18 9,044<br />
Cincinnati-OH Evansville, IL 383 6,773 154 5 7,315<br />
Total All Flows 89,797 276,365 57,887 1,061 425,110<br />
6.4 CONTAINERIZED FORECAST RESULTS<br />
Exhibit 38 in the previous secti<strong>on</strong> clearly shows the str<strong>on</strong>g growth potential that is associated with the<br />
GLSLS, Gulf, and Mississippi River corridors as fuel <str<strong>on</strong>g>prices</str<strong>on</strong>g> go up. Forecast traffic potential rises by a<br />
factor <str<strong>on</strong>g>of</str<strong>on</strong>g> 2 to 3 times as fuel <str<strong>on</strong>g>prices</str<strong>on</strong>g> rise from $2 up to $7. However, the $7 scenario is not such a remote<br />
possibility, since diesel fuel <str<strong>on</strong>g>prices</str<strong>on</strong>g> above $5 per gall<strong>on</strong> have already been seen this summer.<br />
6.4.1 EAST AND WEST COAST – PORT FEEDER SERVICE POTENTIAL<br />
A major caveat and excepti<strong>on</strong> needs to be noted with respect to the distributi<strong>on</strong> <str<strong>on</strong>g>of</str<strong>on</strong>g> import and export<br />
c<strong>on</strong>tainers within the East and West Coast regi<strong>on</strong>s, which is really bey<strong>on</strong>d the scope <str<strong>on</strong>g>of</str<strong>on</strong>g> the FAF-based data<br />
available and so requires a special study. To understand the potential for feeder services in U.S.<br />
internati<strong>on</strong>al trade requires access to more detailed port-specific data than were available for this study.<br />
Since import/export traffic is already c<strong>on</strong>centrated at coastal seaports, the ec<strong>on</strong>omics <str<strong>on</strong>g>of</str<strong>on</strong>g> keeping such<br />
traffic in the inter<strong>modal</strong> system as l<strong>on</strong>g as possible are generally favorable. Overall, two counteracting<br />
trends are at work in the maritime industry:<br />
• Vessel ec<strong>on</strong>omics naturally favors larger ships, as larger ships are more fuel efficient than smaller<br />
<strong>on</strong>es, and so maritime ec<strong>on</strong>omics favors a c<strong>on</strong>tinuati<strong>on</strong> <str<strong>on</strong>g>of</str<strong>on</strong>g> this trend in coming years. The use <str<strong>on</strong>g>of</str<strong>on</strong>g><br />
ever larger vessels, however, tends to c<strong>on</strong>centrate more traffic at the few coastal “mega ports”<br />
that have the equipment and deep shipping channels to accommodate such large vessels. As a<br />
result, this heavy c<strong>on</strong>centrati<strong>on</strong> <str<strong>on</strong>g>of</str<strong>on</strong>g> large ships in fewer ports also tends to increase inland<br />
distributi<strong>on</strong> costs.<br />
TEMS, INC. OCTOBER 2008<br />
44
TECHNICAL REPORT - IMPACT OF HIGH OIL PRICES ON FREIGHT TRANSPORTATION:<br />
MODAL SHIFT POTENTIAL IN FIVE CORRIDORS<br />
• In c<strong>on</strong>trast, as fuel costs c<strong>on</strong>tinue to rise, there is more <str<strong>on</strong>g>of</str<strong>on</strong>g> an ec<strong>on</strong>omic incentive to bring c<strong>on</strong>tainers<br />
closer to their ultimate destinati<strong>on</strong>, which can maximize the use <str<strong>on</strong>g>of</str<strong>on</strong>g> the lower-cost water mode and<br />
minimize the use <str<strong>on</strong>g>of</str<strong>on</strong>g> <str<strong>on</strong>g>high</str<strong>on</strong>g>-cost inland distributi<strong>on</strong> such as trucking.<br />
Both goals, however, are likely to be satisfied <strong>on</strong>ly by development <str<strong>on</strong>g>of</str<strong>on</strong>g> hub-and-spoke transshipment<br />
networks. A key questi<strong>on</strong> is the structure <str<strong>on</strong>g>of</str<strong>on</strong>g> these future networks. Are they going to be based in <str<strong>on</strong>g>of</str<strong>on</strong>g>f-shore<br />
ports like Freeport, Bahamas; or will existing U.S. ports develop effective feeder systems that can help<br />
them maintain their own competitiveness and commercial relevance?<br />
Another questi<strong>on</strong> regards the level <str<strong>on</strong>g>of</str<strong>on</strong>g> rail integrati<strong>on</strong> within these feeder networks? For example, there is<br />
little questi<strong>on</strong> that there would be sufficient traffic to support a barge feeder service from New York to<br />
New England, if the CSX and NS railroads would agree to use the barge to develop their own “satellite<br />
ramps” for New England rail traffic.<br />
In short, the primary potential al<strong>on</strong>g the East and West coasts probably lies in development <str<strong>on</strong>g>of</str<strong>on</strong>g> feeder<br />
services for existing ports and rail services. Development <str<strong>on</strong>g>of</str<strong>on</strong>g> such services would provide a new <strong>freight</strong><br />
distributi<strong>on</strong> mechanism that can support existing rail and truck systems.<br />
6.4.2 NOTE ON IMPORT/EXPORT PORT IMPACTS<br />
Apart from the <str<strong>on</strong>g>impact</str<strong>on</strong>g> <str<strong>on</strong>g>of</str<strong>on</strong>g> recent <str<strong>on</strong>g>high</str<strong>on</strong>g> <str<strong>on</strong>g>oil</str<strong>on</strong>g> <str<strong>on</strong>g>prices</str<strong>on</strong>g>, the recent devaluati<strong>on</strong> <str<strong>on</strong>g>of</str<strong>on</strong>g> the U.S. dollar (which may be<br />
<strong>on</strong>going) has been affecting the distributi<strong>on</strong> <str<strong>on</strong>g>of</str<strong>on</strong>g> U.S. internati<strong>on</strong>al trade patterns, which cannot be analyzed<br />
using the USDOT’s FAF database as it does not identify the ultimate overseas origins or destinati<strong>on</strong>s <str<strong>on</strong>g>of</str<strong>on</strong>g><br />
<strong>freight</strong> shipments.<br />
First, the devaluati<strong>on</strong> <str<strong>on</strong>g>of</str<strong>on</strong>g> the dollar has tended to reduce U.S. imports while boosting exports. While this<br />
has required some adjustments in liner shipping operati<strong>on</strong>s, overall it would appear that the trend is<br />
towards greater efficiency. Rather than running <strong>on</strong>e way loaded and returning empty, ships now have a<br />
better ability to obtain a balanced load in both directi<strong>on</strong>s.<br />
The decline in the growth rate <str<strong>on</strong>g>of</str<strong>on</strong>g> imports, moreover, has taken some <str<strong>on</strong>g>of</str<strong>on</strong>g> the immediate pressure <str<strong>on</strong>g>of</str<strong>on</strong>g>f West<br />
Coast port capacity, although l<strong>on</strong>g-term c<strong>on</strong>cerns remain. Even if the pause is <strong>on</strong>ly temporary, however,<br />
the West Coast ports now have a little more time to implement infrastructure expansi<strong>on</strong> plans to stay<br />
ahead <str<strong>on</strong>g>of</str<strong>on</strong>g> demand. This pause in import growth will also relieve rising c<strong>on</strong>gesti<strong>on</strong> at the Panama Canal, as<br />
it completes its planned expansi<strong>on</strong> for accommodating post-Panamax vessels and increased traffic<br />
volumes, which is due to be completed in 2014.<br />
As a result, there does not appear to be any extreme urgency, from a capacity point <str<strong>on</strong>g>of</str<strong>on</strong>g> view, for <strong>shift</strong>ing<br />
large amounts <str<strong>on</strong>g>of</str<strong>on</strong>g> Asian c<strong>on</strong>tainers from West coast to East coast ports. N<strong>on</strong>etheless, after the Panama<br />
Canal expands in 2014, some <strong>shift</strong> from West to East Coast ports should be anticipated as a result <str<strong>on</strong>g>of</str<strong>on</strong>g> the<br />
improved operating ec<strong>on</strong>omics <str<strong>on</strong>g>of</str<strong>on</strong>g> larger ships now able to use the Canal.<br />
Therefore, this study does not predict any radical traffic <strong>shift</strong>s as a result <str<strong>on</strong>g>of</str<strong>on</strong>g> recent large changes in fuel<br />
price and current exchange. Rather, there may be an opportunity for railroads to “price up” <strong>on</strong> their<br />
transc<strong>on</strong>tinental double-stack services. While the railroads also need to raise <str<strong>on</strong>g>prices</str<strong>on</strong>g> to cover their own<br />
rising fuel expenses, they are likely to raise rates to maintain the current market equilibrium with respect to<br />
East versus West coast ports until after 2014, when expanded Panama Canal facilities are open for<br />
business. After 2014, shippers should anticipate a moderate traffic <strong>shift</strong> towards East Coast ports as<br />
carriers take advantage <str<strong>on</strong>g>of</str<strong>on</strong>g> improved vessel ec<strong>on</strong>omics by transiting the Canal with larger vessels.<br />
TEMS, INC. OCTOBER 2008<br />
45
TECHNICAL REPORT - IMPACT OF HIGH OIL PRICES ON FREIGHT TRANSPORTATION:<br />
MODAL SHIFT POTENTIAL IN FIVE CORRIDORS<br />
6.5 BULK DIVERSION POTENTIALS<br />
Bulk traffic <strong>shift</strong>s have been modeled, and as in the case <str<strong>on</strong>g>of</str<strong>on</strong>g> c<strong>on</strong>tainerized traffic significant differences<br />
between the corridors. Exhibits 44 through 48 summarize forecast results.<br />
500<br />
450<br />
400<br />
350<br />
300<br />
250<br />
200<br />
150<br />
100<br />
50<br />
0<br />
Exhibit 44: East Coast Bulk Volume (Milli<strong>on</strong>s <str<strong>on</strong>g>of</str<strong>on</strong>g> Short T<strong>on</strong>s)<br />
as a Functi<strong>on</strong> <str<strong>on</strong>g>of</str<strong>on</strong>g> Diesel Fuel Price<br />
$0.00 $1.00 $2.00 $3.00 $4.00 $5.00 $6.00 $7.00 $8.00<br />
250<br />
200<br />
150<br />
100<br />
50<br />
2002<br />
2005<br />
Grain Petro<br />
Exhibit 45: West Coast Bulk Volume (Milli<strong>on</strong>s <str<strong>on</strong>g>of</str<strong>on</strong>g> Short T<strong>on</strong>s)<br />
as a Functi<strong>on</strong> <str<strong>on</strong>g>of</str<strong>on</strong>g> Diesel Fuel Price<br />
2002<br />
2005<br />
0<br />
$0.00 $1.00 $2.00 $3.00 $4.00 $5.00 $6.00 $7.00 $8.00<br />
Grain Petro<br />
TEMS, INC. OCTOBER 2008<br />
46
200<br />
180<br />
160<br />
140<br />
120<br />
100<br />
80<br />
60<br />
40<br />
20<br />
0<br />
1,200<br />
1,000<br />
800<br />
600<br />
400<br />
200<br />
0<br />
TECHNICAL REPORT - IMPACT OF HIGH OIL PRICES ON FREIGHT TRANSPORTATION:<br />
MODAL SHIFT POTENTIAL IN FIVE CORRIDORS<br />
Exhibit 46: Gulf Coast Bulk Volume (Milli<strong>on</strong>s <str<strong>on</strong>g>of</str<strong>on</strong>g> Short T<strong>on</strong>s)<br />
as a Functi<strong>on</strong> <str<strong>on</strong>g>of</str<strong>on</strong>g> Diesel Fuel Price<br />
2002<br />
Exhibit 47: GLSLS Bulk Volume (Milli<strong>on</strong>s <str<strong>on</strong>g>of</str<strong>on</strong>g> Short T<strong>on</strong>s)<br />
as a Functi<strong>on</strong> <str<strong>on</strong>g>of</str<strong>on</strong>g> Diesel Fuel Price<br />
2002<br />
2005<br />
$0.00 $1.00 $2.00 $3.00 $4.00 $5.00 $6.00 $7.00 $8.00<br />
2005<br />
Grain Petro<br />
$0.00 $1.00 $2.00 $3.00 $4.00 $5.00 $6.00 $7.00 $8.00<br />
Grain Petro<br />
TEMS, INC. OCTOBER 2008<br />
47
400<br />
350<br />
300<br />
250<br />
200<br />
150<br />
100<br />
50<br />
TECHNICAL REPORT - IMPACT OF HIGH OIL PRICES ON FREIGHT TRANSPORTATION:<br />
MODAL SHIFT POTENTIAL IN FIVE CORRIDORS<br />
Exhibit 48: Mississippi Bulk Volume (Milli<strong>on</strong>s <str<strong>on</strong>g>of</str<strong>on</strong>g> Short T<strong>on</strong>s)<br />
as a Functi<strong>on</strong> <str<strong>on</strong>g>of</str<strong>on</strong>g> Diesel Fuel Price<br />
2002<br />
2005<br />
0<br />
$0.00 $1.00 $2.00 $3.00 $4.00 $5.00 $6.00 $7.00 $8.00<br />
Grain Petro<br />
In summary, it can be seen that East Coast bulk shipping has probably already captured as much traffic as<br />
can feasibly move by water. There appears to be an increased potential for West Coast petroleum<br />
shipping as fuel <str<strong>on</strong>g>prices</str<strong>on</strong>g> rise.<br />
But the real bulk growth potential appears to be <strong>on</strong> the GLSLS, Mississippi, and Gulf Coast corridors where<br />
in recent years, rail productivity improvement has flattened water traffic growth. However the prospect <str<strong>on</strong>g>of</str<strong>on</strong>g><br />
rising fuel <str<strong>on</strong>g>prices</str<strong>on</strong>g> is likely to <strong>shift</strong> the cost advantage back to water, which has a substantial energy<br />
efficiency advantage even over rail.<br />
TEMS, INC. OCTOBER 2008<br />
48
7<br />
TECHNICAL REPORT - IMPACT OF HIGH OIL PRICES ON FREIGHT TRANSPORTATION:<br />
MODAL SHIFT POTENTIAL IN FIVE CORRIDORS<br />
CONCLUSIONS AND RECOMMENDATIONS<br />
7.1 KEY RESULTS BY CORRIDOR<br />
This analysis has explored the effect <str<strong>on</strong>g>of</str<strong>on</strong>g> fuel <str<strong>on</strong>g>prices</str<strong>on</strong>g> <strong>on</strong> the likely prospects for implementati<strong>on</strong> <str<strong>on</strong>g>of</str<strong>on</strong>g> Short Sea<br />
shipping <strong>on</strong> five corridors: East, West, Gulf, GLSLS, and Mississippi River.<br />
The fuel price sensitivity encompasses a full range <str<strong>on</strong>g>of</str<strong>on</strong>g> diesel fuel <str<strong>on</strong>g>prices</str<strong>on</strong>g> from $1.37 per gall<strong>on</strong> (historic<br />
2002 levels) to $6.88 (2020 pessimistic <str<strong>on</strong>g>high</str<strong>on</strong>g>-<str<strong>on</strong>g>oil</str<strong>on</strong>g>-price scenario). Within this wide range, a set <str<strong>on</strong>g>of</str<strong>on</strong>g> water<br />
<strong>modal</strong> share forecasts have been prepared to assess the likely prospects for both c<strong>on</strong>tainerized <strong>freight</strong><br />
and bulk movement by water.<br />
Key results for each <strong>freight</strong> corridor are summarized in the following secti<strong>on</strong>s.<br />
7.1.1 EAST COAST CORRIDOR<br />
Relative to the other four corridors, the East Coast corridor is the weakest in terms <str<strong>on</strong>g>of</str<strong>on</strong>g> its potential for<br />
attracting domestic c<strong>on</strong>tainer traffic. Most East Coast <strong>freight</strong> moves to and from interior states, not up and<br />
down the coast. N<strong>on</strong>etheless, there is a substantial volume <str<strong>on</strong>g>of</str<strong>on</strong>g> trucks moving <strong>on</strong> the I-95 corridor. This study<br />
assesses <strong>on</strong>ly the short-term potential for <strong>modal</strong> <strong>shift</strong>, since it is based <strong>on</strong> historical 2005 FAF data, and<br />
does not develop any projecti<strong>on</strong> <str<strong>on</strong>g>of</str<strong>on</strong>g> future traffic or levels <str<strong>on</strong>g>of</str<strong>on</strong>g> c<strong>on</strong>gesti<strong>on</strong>. As such, it is quite plausible that<br />
given the anticipated c<strong>on</strong>gesti<strong>on</strong> and lack <str<strong>on</strong>g>of</str<strong>on</strong>g> capacity <strong>on</strong> I-95, that water could attract some <str<strong>on</strong>g>of</str<strong>on</strong>g> this I-95<br />
traffic in the future.<br />
There appears to be an immediate potential, however, for developing c<strong>on</strong>tainer feeder services in<br />
c<strong>on</strong>juncti<strong>on</strong> with existing internati<strong>on</strong>al gateway ports and rail inter<strong>modal</strong> services, for delivering trailers<br />
and c<strong>on</strong>tainers closer to end–use points, particularly given rising corridor road c<strong>on</strong>gesti<strong>on</strong> affecting truck<br />
service al<strong>on</strong>g Interstate 95 from Bost<strong>on</strong> through the Virginia Beach area. The key c<strong>on</strong>siderati<strong>on</strong> is <strong>modal</strong><br />
integrati<strong>on</strong> between rail yards and maritime ports so that all services (import/export as well as domestic)<br />
can take advantage <str<strong>on</strong>g>of</str<strong>on</strong>g> the proposed new inter<strong>modal</strong> links. Arbitrarily limiting the use <str<strong>on</strong>g>of</str<strong>on</strong>g> such services <strong>on</strong>ly<br />
to internati<strong>on</strong>al port traffic restricts their potential and may cause them to fall short <str<strong>on</strong>g>of</str<strong>on</strong>g> the minimum volume<br />
require to ec<strong>on</strong>omically sustain the service.<br />
With regard to bulk traffic, waterborne transportati<strong>on</strong> appears to have has captured nearly all <str<strong>on</strong>g>of</str<strong>on</strong>g> the<br />
water-available traffic al<strong>on</strong>g the East Coast. As a result, corridor growth potential with respect to the<br />
<str<strong>on</strong>g>impact</str<strong>on</strong>g> <str<strong>on</strong>g>of</str<strong>on</strong>g> <str<strong>on</strong>g>high</str<strong>on</strong>g> fuel <str<strong>on</strong>g>prices</str<strong>on</strong>g> was found to be very limited.<br />
7.1.2 WEST COAST CORRIDOR<br />
The West Coast corridor has str<strong>on</strong>ger domestic c<strong>on</strong>tainer traffic potential than the East Coast. A major<br />
opportunity has been identified for the development <str<strong>on</strong>g>of</str<strong>on</strong>g> feeder services from Los Angeles to both San<br />
TEMS, INC. OCTOBER 2008<br />
49
TECHNICAL REPORT - IMPACT OF HIGH OIL PRICES ON FREIGHT TRANSPORTATION:<br />
MODAL SHIFT POTENTIAL IN FIVE CORRIDORS<br />
Diego and Oakland. In additi<strong>on</strong>, there appears to be potential for growth in petroleum traffic as fuel<br />
<str<strong>on</strong>g>prices</str<strong>on</strong>g> rise.<br />
7.1.3 GLSLS CORRIDOR<br />
In a <str<strong>on</strong>g>high</str<strong>on</strong>g> fuel price envir<strong>on</strong>ment, the GLSLS has the sec<strong>on</strong>d str<strong>on</strong>gest domestic c<strong>on</strong>tainer traffic potential,<br />
next the Mississippi River corridor. Compared to coastal corridors, perhaps this should come as no surprise,<br />
since both “sides” <str<strong>on</strong>g>of</str<strong>on</strong>g> the heavily industrialized and densely populated riverbank are capable <str<strong>on</strong>g>of</str<strong>on</strong>g> feeding<br />
traffic into the GLSLS, whereas a typical coastal regi<strong>on</strong> has the demographics <str<strong>on</strong>g>of</str<strong>on</strong>g> <strong>on</strong>ly <strong>on</strong>e “coast”<br />
available to generate traffic.<br />
The GLSLS also stands to gain in bulk traffic versus rail as fuel <str<strong>on</strong>g>prices</str<strong>on</strong>g> go up, since shipping is more energy<br />
efficient than rail.<br />
7.1.4 GULF COAST CORRIDOR<br />
The Gulf Coast corridor assessment came out sec<strong>on</strong>d to the GLSLS and exhibits a very similar behavior.<br />
Its demand forecast rises three times as <str<strong>on</strong>g>high</str<strong>on</strong>g> as fuel <str<strong>on</strong>g>prices</str<strong>on</strong>g> go up, reflecting diversi<strong>on</strong> <str<strong>on</strong>g>of</str<strong>on</strong>g> both truck and rail<br />
to the more efficient water mode.<br />
This Gulf Corridor also stands to gain in bulk traffic, both grain and petroleum, as fuel <str<strong>on</strong>g>prices</str<strong>on</strong>g> increase,<br />
since shipping is more energy efficient than rail.<br />
7.1.5 MISSISSIPPI RIVER CORRIDOR<br />
The Mississippi River Corridor, unlike the other four corridors, used COB rather than ship. As the most<br />
energy efficient mode, COB shows the str<strong>on</strong>gest resp<strong>on</strong>se to fuel price with the demand forecast going up<br />
nearly four times as fuel <str<strong>on</strong>g>prices</str<strong>on</strong>g> rise.<br />
In additi<strong>on</strong>, <str<strong>on</strong>g>high</str<strong>on</strong>g>er fuel <str<strong>on</strong>g>prices</str<strong>on</strong>g> will help bulk traffic <strong>on</strong> the Mississippi River system as well, likely reversing<br />
years <str<strong>on</strong>g>of</str<strong>on</strong>g> an eroding or stable market share. Higher fuel <str<strong>on</strong>g>prices</str<strong>on</strong>g> would likely reestablish the historical<br />
relati<strong>on</strong>ship between rail and water <str<strong>on</strong>g>prices</str<strong>on</strong>g>, clearly establishing water as the low-cost mode.<br />
7.2 NATIONAL IMPLICATIONS<br />
In order for new water services to be competitive in <strong>freight</strong> corridors now dependent <strong>on</strong> truck and rail<br />
services, there needs to be a paradigm <strong>shift</strong> in decisi<strong>on</strong>-making for goods movement. As the cost <str<strong>on</strong>g>of</str<strong>on</strong>g><br />
shipping rises with <str<strong>on</strong>g>high</str<strong>on</strong>g>er fuel <str<strong>on</strong>g>prices</str<strong>on</strong>g>, better envir<strong>on</strong>mental protecti<strong>on</strong>, and rising c<strong>on</strong>gesti<strong>on</strong>, the speed <str<strong>on</strong>g>of</str<strong>on</strong>g><br />
delivery <str<strong>on</strong>g>of</str<strong>on</strong>g> goods may become less significant in shipping decisi<strong>on</strong>s. In additi<strong>on</strong>, instituti<strong>on</strong>al policies and<br />
regulatory and tax structures can be re-aligned so that industry is encouraged to make large new<br />
investments and to assume the associated risks. Furthermore, water and inter<strong>modal</strong> rail infrastructure at<br />
both coastal and inland ports needs to be developed to ensure the optimum distributi<strong>on</strong> <str<strong>on</strong>g>of</str<strong>on</strong>g> <strong>freight</strong> through<br />
all modes <str<strong>on</strong>g>of</str<strong>on</strong>g> transportati<strong>on</strong> so that the U.S. transportati<strong>on</strong> network develops in an efficient and integrated<br />
manner.<br />
TEMS, INC. OCTOBER 2008<br />
50
7.3 CONCLUSION<br />
TECHNICAL REPORT - IMPACT OF HIGH OIL PRICES ON FREIGHT TRANSPORTATION:<br />
MODAL SHIFT POTENTIAL IN FIVE CORRIDORS<br />
In an envir<strong>on</strong>ment <str<strong>on</strong>g>of</str<strong>on</strong>g> <str<strong>on</strong>g>high</str<strong>on</strong>g> <str<strong>on</strong>g>oil</str<strong>on</strong>g> <str<strong>on</strong>g>prices</str<strong>on</strong>g>, the results <str<strong>on</strong>g>of</str<strong>on</strong>g> this study, as well as the previous NC/NV Market<br />
Assessment, indicate that c<strong>on</strong>tainer shipping services are likely to become viable not <strong>on</strong>ly <strong>on</strong> the GLSLS but<br />
now also <strong>on</strong> the Mississippi River and Gulf Coast corridors as well. Further work to follow up such <str<strong>on</strong>g>high</str<strong>on</strong>g><br />
level analysis with greater market detail appears to be warranted.<br />
Meanwhile, in order to reduce excessive trucking distances from evolving mega-c<strong>on</strong>tainer ports, East and<br />
West Coast planners should seek to establish and improve the feeder-capability <str<strong>on</strong>g>of</str<strong>on</strong>g> local or “satellite”<br />
ports. Either COB or RORO ships could be viable opti<strong>on</strong>s for developing feeder services, but commercial<br />
success may require a greater degree <str<strong>on</strong>g>of</str<strong>on</strong>g> <strong>modal</strong> integrati<strong>on</strong> than has existed in the past.<br />
Overall, the <str<strong>on</strong>g>impact</str<strong>on</strong>g> <str<strong>on</strong>g>of</str<strong>on</strong>g> <str<strong>on</strong>g>high</str<strong>on</strong>g>er <str<strong>on</strong>g>oil</str<strong>on</strong>g> <str<strong>on</strong>g>prices</str<strong>on</strong>g> is to create a str<strong>on</strong>g case for investing in the waterborne<br />
transportati<strong>on</strong> industry – for both inland and coastal distributi<strong>on</strong>. Potential increases in <str<strong>on</strong>g>oil</str<strong>on</strong>g> <str<strong>on</strong>g>prices</str<strong>on</strong>g> already<br />
forecast could increase transport costs two- to eight-fold. Despite the wide range in forecast <str<strong>on</strong>g>oil</str<strong>on</strong>g> <str<strong>on</strong>g>prices</str<strong>on</strong>g>,<br />
even the minimum forecast is creating a transportati<strong>on</strong> envir<strong>on</strong>ment more like that <str<strong>on</strong>g>of</str<strong>on</strong>g> Europe in the 1990’s<br />
than previous short-term fuel price hikes previously experienced in the United States.<br />
Historically, coastal and inland waterborne transportati<strong>on</strong> has enjoyed a larger market share in Europe<br />
than in the United States because <str<strong>on</strong>g>of</str<strong>on</strong>g> Europe’s <str<strong>on</strong>g>high</str<strong>on</strong>g>er inland rail and truck transport costs that make water<br />
cost-effective. The recent European experience also dem<strong>on</strong>strates that water-based logistics chains can<br />
work effectively, for distributing not <strong>on</strong>ly bulk goods and industrial products but c<strong>on</strong>sumer goods as well.<br />
This could well become the case in the United States, if the cost differential between truck, rail, and water<br />
transportati<strong>on</strong> is sustained at the levels reached during the summer <str<strong>on</strong>g>of</str<strong>on</strong>g> 2008 as the result <str<strong>on</strong>g>of</str<strong>on</strong>g> <str<strong>on</strong>g>high</str<strong>on</strong>g>er <str<strong>on</strong>g>oil</str<strong>on</strong>g><br />
<str<strong>on</strong>g>prices</str<strong>on</strong>g>.<br />
Finally, it is recommended that fuel price levels be c<strong>on</strong>sidered in future <strong>freight</strong> planning with respect to the<br />
relative roles <str<strong>on</strong>g>of</str<strong>on</strong>g> the various modes <str<strong>on</strong>g>of</str<strong>on</strong>g> transportati<strong>on</strong>. While rail has enjoyed dramatically improved<br />
productivity in recent years, many <str<strong>on</strong>g>of</str<strong>on</strong>g> its gains relative to water stand to be erased should fuel <str<strong>on</strong>g>prices</str<strong>on</strong>g> rise<br />
to anticipated levels in coming years. As water is the most energy-efficient mode <str<strong>on</strong>g>of</str<strong>on</strong>g> <strong>freight</strong> transportati<strong>on</strong>,<br />
planners should recognize it is likely to play a greatly expanded role in the future. Hence, nati<strong>on</strong>al policy<br />
towards the water mode needs to become more proactive. Given <str<strong>on</strong>g>high</str<strong>on</strong>g>er <str<strong>on</strong>g>oil</str<strong>on</strong>g> <str<strong>on</strong>g>prices</str<strong>on</strong>g>, market forces could<br />
well promote a significantly enhanced role for water in the U.S. transportati<strong>on</strong> system, provided that the<br />
potential for this <strong>modal</strong> <strong>shift</strong> is recognized and supported by public policies that are directed toward<br />
developing the needed infrastructure and in encouraging industry to make the needed investments.<br />
TEMS, INC. OCTOBER 2008<br />
51
REFERENCES<br />
TECHNICAL REPORT - IMPACT OF HIGH OIL PRICES ON FREIGHT TRANSPORTATION:<br />
MODAL SHIFT POTENTIAL IN FIVE CORRIDORS<br />
Annual Energy Outlook (2008, June). Energy Informati<strong>on</strong> Administrati<strong>on</strong>. Official Energy Statistics from the<br />
U.S. Government: www.eia.doe.gov.<br />
Avent, R. (2008, June 25) “A World Less Flat.” Guardian, UK.<br />
Bureau <str<strong>on</strong>g>of</str<strong>on</strong>g> Ec<strong>on</strong>omic Analysis, U.S. Department <str<strong>on</strong>g>of</str<strong>on</strong>g> Commerce.<br />
Bureau <str<strong>on</strong>g>of</str<strong>on</strong>g> Labor Statistics, U.S. Department <str<strong>on</strong>g>of</str<strong>on</strong>g> Labor: www.bls.gov.<br />
Der Hovanesian, M. (2008, June 30) “I Have Just One Word For You: Bioplastics.” Business Week.<br />
Elgin, B. (2008, June 30) “The Dirty Truth About Clean Coal.” Business Week.<br />
Jimenez-Rodriquez, R. (2007) “The Industrial Impact <str<strong>on</strong>g>of</str<strong>on</strong>g> Oil Price Shocks: Evidence from the Industries <str<strong>on</strong>g>of</str<strong>on</strong>g> Six<br />
OECD Countries.” Documentos de Trabajo No. 0731.<br />
King, N. (2008, June 27) “Global Oil-Supply Worries; Fuel Debate in Saudia Arabia.” Wall Street<br />
Journal, New York.<br />
Maritime Administrati<strong>on</strong>/USDOT/Transport Canada (2007, January). Great Lakes-St. Lawrence Seaway<br />
Study- New Cargoes/New Vessels Market Assessment Report: TEMS, Inc./RAND.<br />
Metcalf, A.E. & D. O’Sullivan. (1979, March) “Planning for Energy C<strong>on</strong>servati<strong>on</strong> in Transportati<strong>on</strong>: The<br />
Opti<strong>on</strong>s,” Irish Institute <str<strong>on</strong>g>of</str<strong>on</strong>g> Engineers. Dublin.<br />
Metcalf, A.E., Kraft, E., Bzhilyanskaya, L.Y. (2006, November) “Ohio Inter<strong>modal</strong> Rail Freight Growth<br />
Strategy-C<strong>on</strong>cept Study.” TEMS, Inc.<br />
M<strong>on</strong>tgomery, D. (2008, March 30) “Air Force Leads Push to Liquefied Coal Fuel.” Seattle Times.<br />
Odell, P. (1970) “Oil and World Power.” L<strong>on</strong>d<strong>on</strong>: Penguin Books.<br />
Rubin, J. (2008, May 27) “The New Inflati<strong>on</strong>.” CIBC World Markets.<br />
Schneider, H. (2008, June 3) “GM Closing 4 Truck and SUV Plants in North America”:<br />
www.washingt<strong>on</strong>post.com.<br />
Short-Term Energy Outlook (2008, July 8). Energy Informati<strong>on</strong> Administrati<strong>on</strong>. Official Energy Statistics<br />
from the U.S. Government: www.eia.doe.gov.<br />
TEMS, INC. OCTOBER 2008<br />
52
TECHNICAL REPORT - IMPACT OF HIGH OIL PRICES ON FREIGHT TRANSPORTATION:<br />
MODAL SHIFT POTENTIAL IN FIVE CORRIDORS<br />
U.S. Census Bureau, U.S. Department <str<strong>on</strong>g>of</str<strong>on</strong>g> Commerce: www.census.gov.<br />
U.S. Department <str<strong>on</strong>g>of</str<strong>on</strong>g> the Interior. U.S. Geological Survey (2008, April 10): www.usgc.gov.<br />
U.S. Ports Model: Route Choice Model (2008). TEMS, Inc.<br />
Velazquez, N. “Impact <str<strong>on</strong>g>of</str<strong>on</strong>g> Rising Energy Costs <strong>on</strong> Small Business.” C<strong>on</strong>gress <str<strong>on</strong>g>of</str<strong>on</strong>g> the United States. House <str<strong>on</strong>g>of</str<strong>on</strong>g><br />
Representatives. August 10, 2006.<br />
World Energy Outlook (2006). Internati<strong>on</strong>al Energy Agency: www.iea.org.<br />
World Trade Organizati<strong>on</strong>: www.wto.org<br />
TEMS, INC. OCTOBER 2008<br />
53
TECHNICAL REPORT - IMPACT OF HIGH OIL PRICES ON FREIGHT TRANSPORTATION:<br />
MODAL SHIFT POTENTIAL IN FIVE CORRIDORS<br />
Appendices<br />
A. MODAL SPLIT MODEL AND CALIBRATION<br />
The model calibrati<strong>on</strong> process establishes a Base Case that reflects current market c<strong>on</strong>diti<strong>on</strong>s. Calibrati<strong>on</strong><br />
includes all the processes that are required to establish a base case, including the development <str<strong>on</strong>g>of</str<strong>on</strong>g> base<br />
year transportati<strong>on</strong> networks and costs. The derivati<strong>on</strong> <str<strong>on</strong>g>of</str<strong>on</strong>g> base year origin-destinati<strong>on</strong> traffic flows, and<br />
the performance <str<strong>on</strong>g>of</str<strong>on</strong>g> regressi<strong>on</strong> analyses for establishing the model parameter values (e.g. market<br />
elasticities with respect to cost, transit time, reliability and frequency) <strong>on</strong> a route and commodity basis.<br />
The calibrati<strong>on</strong> establishes sets <str<strong>on</strong>g>of</str<strong>on</strong>g> logit coefficients that specify model elasticities with respect to the<br />
network variables, which in turn allows predicti<strong>on</strong> <str<strong>on</strong>g>of</str<strong>on</strong>g> how market shares are likely to <strong>shift</strong> if network<br />
c<strong>on</strong>diti<strong>on</strong>s change. In this study, the calibrati<strong>on</strong> is based <strong>on</strong> a Nested Logit Model (NLM) that has two levels<br />
as shown in the A.1. The first level c<strong>on</strong>sists <str<strong>on</strong>g>of</str<strong>on</strong>g> two modes: Rail and Water, and the sec<strong>on</strong>d level has two<br />
modes: Fixed Route and Truck. Fixed Route is a composite mode made up <str<strong>on</strong>g>of</str<strong>on</strong>g> Rail mode and Water mode.<br />
The calibrati<strong>on</strong> starts from bottom to top i.e. from the first level to the sec<strong>on</strong>d level. The following tables in<br />
A.2 show the calibrati<strong>on</strong> results and associated statistical measurements.<br />
In terms <str<strong>on</strong>g>of</str<strong>on</strong>g> the calibrati<strong>on</strong>, the results for the Great Lakes and St Laurence Seaway, the Mississippi, and<br />
East Coast all produced very good t statistic and R2 results. The Gulf Coast corridor and the West Coast<br />
corridor were not quite as str<strong>on</strong>g particularly for bulk products such as grain and petroleum. Only in the<br />
case <str<strong>on</strong>g>of</str<strong>on</strong>g> the Gulf Coast were any difficulties experienced for any <str<strong>on</strong>g>of</str<strong>on</strong>g> the c<strong>on</strong>tainer classificati<strong>on</strong>s. The issue<br />
for calibrati<strong>on</strong> in the few areas where significant t statistics were not obtained was probably due to the<br />
scale <str<strong>on</strong>g>of</str<strong>on</strong>g> z<strong>on</strong>e system and the lack <str<strong>on</strong>g>of</str<strong>on</strong>g> details in the networks that were developed. A more refined z<strong>on</strong>e<br />
system for the West Coast and Gulf Coast would likely improve the calibrati<strong>on</strong>. It should be noted,<br />
however, that all the parameters identified had correct signs and reflected appropriate shipper behaviors.<br />
TEMS, INC. OCTOBER 2008<br />
A-1
2nd Level<br />
1st Level<br />
A.1 Hierarchy<br />
A.2 Calibrati<strong>on</strong><br />
TECHNICAL REPORT - IMPACT OF HIGH OIL PRICES ON FREIGHT TRANSPORTATION:<br />
MODAL SHIFT POTENTIAL IN FIVE CORRIDORS<br />
Fixed-Route Truck<br />
Rail Water<br />
Exhibit 1<br />
A. 2.1 Great Lakes and St. Lawrence Seaway<br />
a. Level 1: Rail vs Water<br />
Ln ( Rail / Water)<br />
α + β × GC − β × GC<br />
= 1 Rail 2<br />
α β 1<br />
β 2<br />
R 2<br />
Para t Stat Para t Stat Para t Stat<br />
Food 0.1942 3.06 -8.2E-05 -23.82 -7.6E-05 28.97 0.56<br />
Raw material 0.00012 0.0026 -0.0001 -33.48 -9.5E-05 37.41 0.67<br />
Semi-finished 0.1656 2.77 -0.00011 -33.07 -0.0001 42.73 0.69<br />
Finished 0.000032 0.0034 -0.00014 -41.24 -0.000145 49.86 0.80<br />
Grain -0.4912 -8.53 -5.9E-05 -17.925 -4.09E-05 14.11 0.42<br />
Petroleum -1.5577 -0.74 -0.00016 -2.008 -0.000147 3.03 0.51<br />
b. Level 2: Fixed-route vs Truck<br />
Ln ( Fixed / Truck)<br />
α + β × U − β × GC<br />
= 1 Fixed 2<br />
α β 1<br />
β 2<br />
R 2<br />
Para t Stat Para t Stat Para t Stat<br />
Food -4.0662 -51.32 0.2141 2.27 -0.000575 28.03 0.69<br />
Raw material -2.587 -16.93 1.8148 14.52 -0.000918 26.56 0.63<br />
Semi-finished -3.5561 -29.54 0.7886 6.47 -0.000756 28.71 0.61<br />
Finished -3.9342 -17.51 0.8295 4.76 -0.001263 17.22 0.54<br />
Grain 1.0293 29.91 0.8401 19.02 -1.51E-05 10.19 0.47<br />
Petroleum -2.6083 -20.33 0.1438 3.34 -3.63E-05 9.70 0.54<br />
TEMS, INC. OCTOBER 2008<br />
Water<br />
Truck<br />
A-2
.<br />
TECHNICAL REPORT - IMPACT OF HIGH OIL PRICES ON FREIGHT TRANSPORTATION:<br />
MODAL SHIFT POTENTIAL IN FIVE CORRIDORS<br />
A.2.2 Mississippi River Corridor<br />
a. Level 1: Rail vs Water<br />
Ln ( Rail / Water)<br />
α + β × GC − β × GC<br />
= 1 Rail 2<br />
α β 1<br />
β 2<br />
R 2<br />
Para t Stat Para t Stat Para t Stat<br />
Food 0.1638 0.048 -0.00054 -2.47 -0.000298 2.42 0.38<br />
Raw Material 0.72049 6.37 -0.00074 -9.30 -0.000149 1.62 0.55<br />
Semi-finished 1.70904 5.14 -0.00156 -5.04 -3.82E-05 0.24 0.66<br />
Finished 4.5217 6.44 -0.00018 -2.64 -0.000152 3.87 0.37<br />
Grain -4.4345 -1.14 -0.00029 -2.73 -0.000117 1.68 0.42<br />
Petroleum -1.5135 -1.75 -9.4E-05 -3.31 -0.000188 6.87 0.33<br />
b. Level 2: Fixed-route vs Truck<br />
Ln ( Fixed / Truck)<br />
α + β × U − β × GC<br />
= 1 Fixed 2<br />
α β 1<br />
β 2<br />
R 2<br />
Para t Stat Para t Stat Para t Stat<br />
Food -2.9462 -19.37 0.0343 1.74 -0.000795 21.07 0.31<br />
Raw Material -1.1125 -6.40 0.1426 4.35 -0.000251 4.28 0.55<br />
Semi-finished -2.2792 -13.83 0.1402 3.67 -0.000507 8.15 0.48<br />
Finished -0.9003 -15.48 0.4037 14.84 -0.000374 24.21 0.45<br />
Grain -2.7958 -8.66 0.1096 1.65 -0.000161 14.11 0.32<br />
Petroleum -1.6064 -6.99 0.0248 0.51 -0.000112 10.90 0.41<br />
A.2.3 Gulf Coast Corridor<br />
a. Level 1: Rail vs Water<br />
Ln ( Rail / Water)<br />
α + β × GC − β × GC<br />
= 1 Rail 2<br />
α β 1<br />
β 2<br />
R 2<br />
Para t Stat Para t Stat Para t Stat<br />
Food 5.915 9.20 -1.7E-05 -0.062 -0.000119 1.51 0.27<br />
Raw Material 1.3122 4.22 -0.0004 -5.24 -7.87E-05 3.29 0.32<br />
Semi-finished 2.5853 13.27 -0.00012 -1.83 -2.63E-05 5.93 0.78<br />
Finished 4.7816 29.09 -0.00043 -4.13 -0.000141 4.46 0.44<br />
Grain -2.9307 -2.28 -0.00035 -1.55 -0.00011 0.98 0.54<br />
Petroleum 0.4356 0.88 -0.00049 -6.88 -0.000141 5.96 0.46<br />
TEMS, INC. OCTOBER 2008<br />
Water<br />
Truck<br />
Water<br />
A-3
TECHNICAL REPORT - IMPACT OF HIGH OIL PRICES ON FREIGHT TRANSPORTATION:<br />
MODAL SHIFT POTENTIAL IN FIVE CORRIDORS<br />
b. Level 2: Fixed-route vs Truck<br />
Ln ( Fixed / Truck)<br />
α + β × U − β × GC<br />
= 1 Fixed 2<br />
α β 1<br />
β 2<br />
R 2<br />
Para t Stat Para t Stat Para t Stat<br />
Food -5.3284 -10.10 0.6332 1.55 -0.000541 5.16 0.34<br />
Raw Material -2.2334 -7.80 0.3506 1.24 -0.000561 7.01 0.31<br />
Semi-finished -7.5510 -1.07 0.9135 0.58 -0.000552 4.24 0.91<br />
Finished -2.4583 -7.51 0.1022 0.74 -0.00049 4.77 0.55<br />
Grain -5.9137 -10.88 0.4211 1.62 -8.85E-05 5.97 0.40<br />
Petroleum -0.8908 -10.84 0.2397 4.69 -2.08E-05 5.15 0.68<br />
A.2.4 East Coast Corridor<br />
a. Level 1: Rail vs Water<br />
Ln ( Rail / Water)<br />
α + β × GC − β × GC<br />
= 1 Rail 2<br />
α β 1<br />
β 2<br />
R 2<br />
Para t Stat Para t Stat Para t Stat<br />
Food 10.377 3.51 -0.00157 -4.42 -0.00204 5.92 0.34<br />
Raw Material 2.89598 7.16 -0.00033 -6.90 -0.00038 7.72 0.49<br />
Semi-finished 2.43071 5.44 -0.00035 -11.57 -0.00032 12.91 0.48<br />
Finished 8.78931 24.88 -0.00057 -9.57 -0.00064 11.29 0.45<br />
Grain -0.84690 -4.75 -0.00011 -2.75 -0.00014 3.19 0.29<br />
Petroleum -2.07929 -8.90 -0.00049 -17.75 -0.00055 7.66 0.61<br />
b. Level 2: Fixed-route vs Truck<br />
Ln ( Fixed / Truck)<br />
α + β × U − β × GC<br />
= 1 Fixed 2<br />
α β 1<br />
β 2<br />
R 2<br />
Para t Stat Para t Stat Para t Stat<br />
Food -2.8450 -6.08 0.00539 0.52 -0.00079 13.36 0.28<br />
Raw Material -2.10694 -29.33 0.05291 7.93 -0.00013 8.11 0.38<br />
Semi-finished -1.9321 -26.37 0.07439 7.53 -0.00041 26.57 0.39<br />
Finished -5.6099 -15.39 0.09412 3.21 -0.00073 11.91 0.28<br />
Grain -2.91851 -18.47 0.31415 7.80 -7.3E-05 16.12 0.27<br />
Petroleum 0.11091 0.57 0.06809 6.09 -0.00013 26.53 0.36<br />
TEMS, INC. OCTOBER 2008<br />
Truck<br />
Water<br />
Truck<br />
A-4
TECHNICAL REPORT - IMPACT OF HIGH OIL PRICES ON FREIGHT TRANSPORTATION:<br />
MODAL SHIFT POTENTIAL IN FIVE CORRIDORS<br />
A.2.5 West Coast Corridor<br />
a. Level 1: Rail vs Water<br />
Ln ( Rail / Water)<br />
α + β × GC − β × GC<br />
= 1 Rail 2<br />
α β 1<br />
β 2<br />
R 2<br />
Para t Stat Para t Stat Para t Stat<br />
Food 7.93772 2.19 -0.00084 -1.42 -5.11E-05 0.32 0.53<br />
Raw Material 0.59814 3.76 -0.00003 -1.91 -1.23E-05 1.75 0.31<br />
Semi-finished 1.8440 0.83 -0.00075 -0.99 -3.74E-04 1.30 0.43<br />
Finished 5.9848 4.75 -0.00243 -4.87 -7.05E-04 4.01 0.80<br />
Grain 0.7135 0.95 -0.00014 -1.45 -1.07E-04 1.74 0.35<br />
Petroleum 0.10572 6.14 -0.00009 -2.32 -1.06E-04 5.84 0.41<br />
b. Level 2: Fixed-route vs Truck<br />
Ln ( Fixed / Truck)<br />
α + β × U − β × GC<br />
= 1 Fixed 2<br />
α β 1<br />
β 2<br />
R 2<br />
Para t Stat Para t Stat Para t Stat<br />
Food -3.4794 -5.45 0.44907 2.38 -6.80E-05 2.99 0.44<br />
Raw Material -3.5140 -16.03 0.72987 1.01 -1.68E-04 5.10 0.33<br />
Semi-finished -3.5175 -12.81 0.03325 1.34 -5.24E-04 13.12 0.57<br />
Finished -3.2038 -1.17 0.11145 0.41 -4.52E-04 1.24 0.67<br />
Grain -2.2508 -1.83 0.36131 3.58 -1.84E-04 4.98 0.30<br />
Petroleum -0.2341 -1.26 0.47273 4.69 -2.75E-04 12.47 0.28<br />
TEMS, INC. OCTOBER 2008<br />
Water<br />
Truck<br />
A-5