JM FINANCIAL PRODUCTS LIMITED - Bombay Stock Exchange
JM FINANCIAL PRODUCTS LIMITED - Bombay Stock Exchange
JM FINANCIAL PRODUCTS LIMITED - Bombay Stock Exchange

Create successful ePaper yourself
Turn your PDF publications into a flip-book with our unique Google optimized e-Paper software.
<strong>JM</strong> <strong>FINANCIAL</strong> <strong>PRODUCTS</strong> LTD<br />
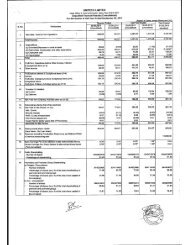
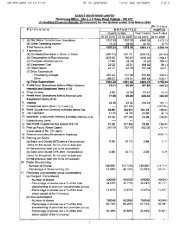
STATEMENT OF CASH FLOW FOR THE YEAR ENDED MARCH 31, 2012<br />
11<br />
Previous Year<br />
PARTICULARS Rupees Rupees<br />
A Net Profit before tax 1,305,333,438 972,826,494<br />
Adjustment for :<br />
Depreciation/ Amortisation 10,383,608 9,985,604<br />
Loss on fixed assets sold / discarded (net) 7,434,033 -<br />
Loss on diminution in value of non-current investments (non trade) (net) 16,699,682 -<br />
Loan funds written off 2,599,347 17,430,554<br />
Provision for doubtful loans 7,688,835 -<br />
Interest expenses - Others 837,072 472,554<br />
Provision for doubtful loans written back (2,599,347) (17,430,554)<br />
Interest Income (441,787,334) (169,813,500)<br />
Dividend on non trade investments (35,435,892) (211,860,437)<br />
Profit on sale of non-current investments (non trade) - (79,372,674)<br />
Profit on sale of current investments (non trade) (73,174,557) (31,897,930)<br />
Provision for non-current investments (non trade) written back - (1,704,775)<br />
Operating Profit before Working Capital Changes 797,978,885 488,635,336<br />
Adjustment for :<br />
(Increase) in loans and advances and other current assets (1,144,308,281) (6,756,523,989)<br />
Decrease/ (Increase) in stock-in-trade 1,738,190,192 (2,882,907,990)<br />
(Increase) in other bank balances - (250,000,000)<br />
(Decrease)/ Increase in trade payables, other liabilities and provisions (165,708,737) 182,054,438<br />
Increase/ (Decrease) in accrued interest expenses related to operating<br />
activities 139,548,950 (435,048,230)<br />
(Increase) in accrued interest income related to operating activities (72,853) (5,067,583)<br />
Cash generated from/ (used in) operations 1,365,628,156 (9,658,858,018)<br />
Direct taxes paid (370,480,658) (258,200,760)<br />
Net Cash from/(used in) Operating Activities (A) 995,147,498 (9,917,058,778)<br />
B Cash flow from Investing Activities<br />
Purchase of fixed assets (9,343,345) (10,069,965)<br />
Sale of fixed assets 980,513 -<br />
Purchase of non-current investments (504,686,462) (650,000,000)<br />
Sale/ Redemption of non-current investments 563,446,000 623,101,058<br />
Investment in subsidiaries - (433,499,940)<br />
Sale of investment in a subsidiary 80,000,000 -<br />
Purchase of current investments (89,655,563,388) (348,706,818,471)<br />
Sale of current investments 91,303,223,328 350,072,763,065<br />
(Increase) in other bank balances (2,384,689,657) (4,000,000,000)<br />
Interest received 547,747,058 38,828,633<br />
Dividend received 35,435,892 211,860,437<br />
Net Cash (used in) Investing Activities (B) (23,450,061) (2,853,835,183)