Distribution Channel Analysis: a Guide for Hotels - IHG Owners ...
Distribution Channel Analysis: a Guide for Hotels - IHG Owners ...
Distribution Channel Analysis: a Guide for Hotels - IHG Owners ...
- TAGS
- hotels
- owners
- owners.org

You also want an ePaper? Increase the reach of your titles
YUMPU automatically turns print PDFs into web optimized ePapers that Google loves.
AN AH&LA ANd STR SpeciAL RepoRT<br />
<strong>Distribution</strong> <strong>Channel</strong> <strong>Analysis</strong>:<br />
a <strong>Guide</strong> <strong>for</strong> <strong>Hotels</strong><br />
Cindy Estis GrEEn &<br />
Mark V. LoManno<br />
PubLishEd by thE hsMai Foundation
Executive Summary —<br />
Appendix <strong>Distribution</strong> 1 <strong>Channel</strong> <strong>Analysis</strong><br />
The Ten Things You Should Know,<br />
Detailed Findings and Implications<br />
1 An Ah&lA And stR sPeCiAl RePoRt<br />
This study is the culmination of research on distribution practices,<br />
the distribution landscape and hotel per<strong>for</strong>mance based on<br />
channel mix. <strong>Distribution</strong> costs have been rising steadily. As current<br />
and emerging intermediaries take advantage of an active<br />
digital travel market, they will wield substantial influence as gatekeepers,<br />
imposing fees and charges <strong>for</strong> directing the consumer traffic to the hotel.<br />
Growth in digital travel shopping will expand the transparency of hotel<br />
pricing structures putting additional competitive pressure on rates.<br />
The combination of the higher booking volumes passing through<br />
intermediaries, the costs imposed <strong>for</strong> intermediation and the pressure<br />
on rates will challenge the hotel owner and manager to maintain profit<br />
levels. This report and analysis is meant to be a starting point <strong>for</strong> any<br />
member of the hotel community to better understand distribution<br />
dynamics and its impact on hotel profitability.<br />
The focus of the study is primarily on<br />
the U.S. hotel industry, and although<br />
many of those interviewed manage distribution<br />
worldwide, and the strategic<br />
issues are global in scope, they may play<br />
out differently in different parts of the<br />
world. It also focuses on the transient<br />
business so although the increased<br />
usage in third party intermediaries<br />
in the group/meetings segments is<br />
recognized as a distribution issue,<br />
it is not addressed in this study.<br />
Published by the hsMAi FoundAtion 1
THE TEn THInGs You<br />
sHouLD Know<br />
1 hotel demand in the u.s. market is “price inelastic”<br />
on an industrywide basis <strong>for</strong> all hotel types. that<br />
means lowering prices will not stimulate enough<br />
incremental demand to make up <strong>for</strong> the rate reductions;<br />
there isn’t enough demand in most markets to<br />
compensate—there<strong>for</strong>e, the net result of lower rates<br />
is lower revenue levels. this is mainly due to limited<br />
demand <strong>for</strong> lodging services overall in a mature u.s.<br />
hotel market.<br />
2 An Ah&lA And stR sPeCiAl RePoRt<br />
2 on a property level, a hotel may be able to lower<br />
prices in certain circumstances to generate enough<br />
demand within a comp set to result in a net positive<br />
revenue outcome. however, because the rates are so<br />
transparent and prominent in current and emerging<br />
digital venues, by the time the competitors match the<br />
lowered rate, the first hotel that lowered its rates loses<br />
any benefit in terms of a demand bump and the entire<br />
competitive set may have a harder time increasing<br />
rates commensurate with the increased cost of doing<br />
business.<br />
3 the u.s. hotel market at the comp set level operates<br />
as a near zero-sum game. the fact that there<br />
has been limited hotel demand growth in the u.s.<br />
market (averaging 1.6% year-over-year <strong>for</strong> the last<br />
20 years) means that any claim that a channel vendor<br />
will create substantial new industry level demand is<br />
unrealistic. <strong>Channel</strong> vendors may be very effective in<br />
helping a hotel shift share, from one hotel to another<br />
or one time period to another. despite the fact that<br />
they might generate some new demand coming from<br />
inbound international markets, they are unlikely to<br />
bring meaningful incremental demand into any u.s.<br />
marketplace in the near term.<br />
4 hotels rooms are <strong>for</strong> sale in a dynamic and volatile<br />
distribution landscape that is launching many market<br />
savvy and financially well-endowed “gatekeepers”<br />
who will become a new breed of third party intermediary<br />
(e.g., Google, Facebook, Apple); their power will<br />
grow as they gradually become the preferred points<br />
of entry <strong>for</strong> consumers to do travel shopping and<br />
buying. they will charge fees <strong>for</strong> referrals to hotels<br />
and, while there is no firm evidence pointing to an<br />
exact number, it is plausible that upwards of half of<br />
the hotel business could ultimately pass through third<br />
parties be<strong>for</strong>e being delivered to a hotel or brand;<br />
also possible is that costs may run as much as 10%<br />
to 20% of revenue <strong>for</strong> this emerging new network.<br />
Although they also pose great opportunities, how<br />
the hotel brands manage them in the near future will<br />
be critical to the longer-term outcomes and hoteliers<br />
will have to remain vigilant to ensure that each new<br />
channel has a reasonable return on investment. the<br />
categories to watch are meta-search (e.g., Google,<br />
hotel Finder, Room Key), social (e.g., Facebook, trip<br />
Advisor) and mobile (e.g., all otAs, all hotel brands<br />
and new mobile-only players). new technologies<br />
like voice- and map-activated applications that are<br />
suited to the native mobile environment will become<br />
attractive substitutes <strong>for</strong> the traditional search engine<br />
browser <strong>for</strong> consumers to initiate their shopping and<br />
buying. even when these new third parties send a<br />
hotel its business directly, they will charge referral<br />
or media fees and these bookings will still require a<br />
technology infrastructure to support the inquiries and<br />
transaction delivery, all adding to the cost.<br />
5 For those concerned about intermediary costs such as<br />
the estimated $2.7 billion cost of otA commissions in<br />
2010 (as calculated and estimated by this study) or the<br />
additional estimated $1.3 billion paid to retail travel<br />
agencies through the Gdss (as calculated and estimated<br />
by this study), the prospect of paying double these<br />
costs to a widening array of third party intermediaries<br />
within 3 to 5 years may be shocking, but it is not unrealistic.<br />
using a hypothetical example, a hotel with $3<br />
million in room revenue may have paid $120,000 to<br />
$150,000 in distribution costs in 2010 and may well<br />
be paying close to $200,000 to $250,000 by 2015.<br />
When the u.s. hotel industry AdR in 2010 appears to<br />
be $10 below the inflation-adjusted rate charged in<br />
2000, these added costs aggravate an already challenging<br />
profit picture <strong>for</strong> a hotel owner.<br />
6 the primary source of new incremental demand in<br />
the u.s. market will come internationally. despite<br />
security restrictions on inbound travel to the u.s., the<br />
growing number of Chinese and indian travelers will<br />
provide meaningful growth in major markets. Many<br />
large hotel companies are building brand awareness<br />
in China and india through aggressive hotel development<br />
ef<strong>for</strong>ts, but the third parties with marketing<br />
savvy and substantial budgets also have their eye on<br />
capturing this lucrative inbound demand potential and<br />
are laser-focused on securing adoption and loyalty<br />
as a reservation channel of choice within these new<br />
markets, making them crucial players in the consumer<br />
hotel selection process.
7 some third party distribution channels may start to<br />
offer similar services as those provided by current<br />
franchise and branded hotel organizations. they may<br />
develop into a kind of “soft brand” to support client<br />
hotels by (1) maintaining a brand presence, (2) providing<br />
substantial reservation contribution, (3) maintaining<br />
quality metrics <strong>for</strong> customer evaluation and (4)<br />
offering the benefits of a frequency/loyalty program.<br />
8 For the hotelier who does not take proper precautions<br />
and execute careful planning and control, “last minute”<br />
pricing strategies can (1) make <strong>for</strong>ecasting more<br />
difficult; (2) lower rates overall; (3) reduce the volume<br />
of high rated business booked further out from arrival<br />
(why book early when you can wait and get a better<br />
deal?); (4) cause consumers to believe that there is<br />
little difference between hotel brands (there is a growing<br />
commoditization of hotels as a product); and (5)<br />
put into question the issue of who “owns” the guest<br />
by making the reservation portal the “place to go” <strong>for</strong><br />
hotel buyers and, in so doing, potentially degrading<br />
the value of the hotel brand.<br />
9 the prominence and transparency of rates on the<br />
internet and emerging mobile applications, and the<br />
concern <strong>for</strong> “rate parity” to keep the same rates in<br />
all channels, may result in a “one-rate-fits-all” pricing<br />
structure <strong>for</strong> many hotels. this undermines the power<br />
of marketing which is a discipline built on a foundation<br />
that calls <strong>for</strong> offering relevant products and services<br />
with corresponding rates by segment in order to best<br />
meet the needs of each customer group. Rates are<br />
often diluted by (1) the pressure to keep prominent<br />
online rates as low as possible, (2) the reality that<br />
many customers have been trained to believe that he<br />
or she will find a lower rate closer to arrival, and (3) a<br />
propensity <strong>for</strong> hotels to think that the demand generated<br />
by lower rates will always compensate <strong>for</strong> the<br />
rate reduction.<br />
Executive Summary<br />
10 With a highly fragmented distribution network and<br />
limited marketing resources, it is imperative <strong>for</strong> hotel<br />
marketers to understand which promotional ef<strong>for</strong>ts<br />
to credit with their bookings. the Cornell’s Center<br />
<strong>for</strong> hospitality Research (ChR) published two studies<br />
concluding that expedia creates a “billboard effect”<br />
that causes a major lift in a hotel’s website bookings.<br />
the studies documented specific hotels in conditions<br />
that may not mirror a realistic situation <strong>for</strong> many hotels<br />
and do not address variables that may influence the<br />
findings in a meaningful way. it would be misleading<br />
<strong>for</strong> a hotel marketer to assume that the study findings<br />
can be projected to his or her own hotel. however, the<br />
study has become part of the industry dialogue that<br />
has lead many hotel companies to develop “attribution<br />
models” that systematically help the brands figure<br />
out how much to credit each consumer touch point<br />
with its contribution to bookings. there is no simple<br />
answer to this question and it will become even more<br />
complex as new channels come online making a clear<br />
case <strong>for</strong> brands and marketing partners of independents<br />
to focus on this question in order to most<br />
efficiently deploy marketing resources.<br />
Published by the hsMAi FoundAtion 3
DETAILED FInDInGs<br />
Prices, Price Elasticity and demand<br />
4 in the mature u.s. lodging market, with demand<br />
growth <strong>for</strong> hotel rooms over the last 20 years averaging<br />
1.6% per year, and indications that this pattern<br />
is likely to continue <strong>for</strong> the <strong>for</strong>eseeable future, the<br />
primary expectation of hotels from their distribution<br />
channel partners will be in shifting demand share,<br />
rather than generating new incremental demand.<br />
4 Aggregate hotel room demand was found to be relatively<br />
inelastic. this is true both at the total u.s. level<br />
as well as <strong>for</strong> each smith travel Research (stR) chain<br />
scale category. that means that a reduction in room<br />
rate will yield growth in demand, but not enough to<br />
offset the lower price charged <strong>for</strong> the room resulting<br />
in a net negative result in room revenue. this generally<br />
applies at the property level as well, but can play out<br />
differently under certain competitive conditions.<br />
4 if increases in hotel room rates are not at or above the<br />
inflation rate, then the price increases year-over-year<br />
are not sufficient to cover the increased cost of doing<br />
business. When AdR growth was examined over time,<br />
the u.s. industrywide AdR in 2010 was approximately<br />
$10 below the inflation-adjusted rate charged in<br />
2000.<br />
<strong>Channel</strong> Production Profile and<br />
relationship between <strong>Channel</strong>s<br />
4 More than eight in ten room nights (81%) in 2010<br />
were booked through direct channels — voice, brand.<br />
com, property direct — as opposed to almost 20%<br />
through third party channels (online travel agency or<br />
otA, global distribution system or Gds).<br />
4 Greater than one-third (35%) of the hotel room bookings<br />
in 2010 came to the hotel digitally (i.e., brand.<br />
com, otA and Gds), up from 33% in 2009. this<br />
component is expected to continue its upward trend<br />
through 2011.<br />
4 West coast markets tend to have a much higher percentage<br />
of their room nights booked through digital<br />
channels than other parts of the country.<br />
4 there appears to be an inverse relationship between<br />
customer usage of brand.com and the otA channels.<br />
the data showed that when the percentage of bookings<br />
through one of these two channels rose there<br />
was a decline in the percentage booked through the<br />
other and vice versa. A more detailed analysis of this<br />
pattern should be undertaken to better understand<br />
the magnitude and nature of the relationship.<br />
4 An Ah&lA And stR sPeCiAl RePoRt<br />
4 the flow-through of revenue to gross operating profit<br />
(GoP) or net operating income (noi) by channel varies<br />
dramatically when the full cost of hotel operations<br />
are applied to a hotel’s base revenue. An examination<br />
of some chain scale average rates and expenses<br />
by channel reveal that some hotels do not attain a<br />
high enough average rate in every channel to cover<br />
the hotel operating expenses. An analysis of average<br />
distribution costs versus average AdR <strong>for</strong> 2010<br />
indicated that the average contribution to noi <strong>for</strong> the<br />
respective booking channels in the mid-scale limited<br />
service hotels had a range of $29 per room night from<br />
the highest to lowest channel with an average hotel<br />
average daily rate (AdR) of $76.13. the spread <strong>for</strong><br />
upscale full service hotels was $75 from highest to<br />
lowest contribution by channel to noi per room night<br />
with a hotel AdR of $132.46. (note: the analysis of<br />
marginal costs applied to incremental room revenue is<br />
a different model and both models are included in the<br />
chapter on distribution Costs and benefits.)<br />
4 length of stay and ancillary spend vary widely by<br />
booking channel and can impact revenue and profit<br />
and there<strong>for</strong>e, have a meaningful effect on channel<br />
mix evaluation.<br />
individual <strong>Channel</strong> Profiles<br />
4 brand.com continues to capture a larger share of<br />
both the absolute number of rooms booked and the<br />
percentage of total rooms booked in year-over-year<br />
comparisons representing (in 2010) 16.4% of the<br />
demand and 18.5% of the revenue.<br />
4 Central Reservation system (CRs)/Voice share of total<br />
rooms booked continued to decline in 2010 as more<br />
consumers shifted to digital channels. however, this<br />
channel still accounts <strong>for</strong> more than 13% of all rooms<br />
booked and 17% of revenue.<br />
4 Property direct/other remains by far the largest booking<br />
channel <strong>for</strong> each chain scale category although<br />
it is a mixture of group/meetings, walk-in, contract<br />
and other local business so cannot be easily compared<br />
between hotel segments. however, the erosion<br />
caused by digital channels in both demand and room<br />
revenue share is dramatic and consistent. nonetheless,<br />
in 2010, it contributed 51.4% of demand and 45.9%<br />
of revenue.<br />
4 Gds bookings, which are dominated by transient business<br />
travelers, grew substantially in 2010 as the lodging<br />
demand in this segment rose rapidly. it represented<br />
8.3% of demand and 10.8% of the revenue in 2010.
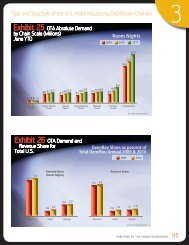
online travel agency (ota) Profile<br />
4 otA share of room night bookings grew substantially in<br />
2010 over 2009, representing almost 11% of all room<br />
night demand and 7.7% of the revenue.<br />
4 historically the highest percentage of otA penetration<br />
had been in the higher end chain scale segments. beginning<br />
in 2010, the economy and mid-scale chain segments<br />
experienced a notable jump in that they captured the<br />
highest percentage of rooms booked through otAs of all<br />
the chain scale categories.<br />
4 All three of the otA business models (i.e., merchant, retail<br />
and opaque) experienced growth in both their demand<br />
and room revenue share in 2010 over the prior year. of<br />
the three, the retail segment was the fastest growing in<br />
2011 largely driven by booking.com’s entrance and success<br />
in the u.s. market.<br />
4 there has been a recent shift in the percentage of total<br />
room revenue booked through the otAs. between 2001<br />
and 2009, the otA share of total room revenue booked<br />
experienced big jumps primarily when the economy<br />
dipped, and leveled off when lodging demand growth<br />
was strong. however, this pattern seems to have changed<br />
in 2011, in a year when the economy was recovering and<br />
lodging demand rebounded strongly; the otA channel<br />
had a notable rise in revenue likely due to strong growth<br />
in the retail model, higher rates overall, and the rise in use<br />
by the economy and midscale hotel segments.<br />
4 spending on hotel rooms by the guest was estimated by<br />
this study to be approximately $2.7 billion higher in 2010<br />
than what was reported on hotel profit and loss (P&l)<br />
statements due to the portion of the revenue collected<br />
directly by the otA (using the merchant and opaque<br />
models) that did not pass through the hotels.<br />
4 When the actual customer spend collected by the otAs<br />
(using the merchant and opaque models) is factored into<br />
industry room revenues, total overall u.s. average room<br />
rates nationally increased about $2.35 in both 2009 and<br />
2010, to more than $100.<br />
4 the otA model, supported by healthy profit margins, is<br />
popular in the investment community. For example, in Q3<br />
2011 Priceline’s market capitalization was more than $27<br />
billion, which was almost three times that of any hotel<br />
company. ironically, this value transfer from hotel companies<br />
to their intermediaries is largely fueled by the hotel<br />
fees and commissions making up the majority of the otA<br />
profits.<br />
Marketing and distribution strategy<br />
4 the two largest consumer media budgets applied in the<br />
promotion of hotels in the united states are spent by<br />
otAs and hotel brands. in 2010, the otAs outspent the<br />
hotels more than 2-to-1 in tV advertising and almost<br />
4-to-1 in online paid search advertising.<br />
Executive Summary<br />
4 Most hotel per<strong>for</strong>mance is evaluated on the basis of total<br />
room revenue. little is known about how each hotel<br />
per<strong>for</strong>ms compared to its competitive set in terms of<br />
channel mix and how that mix affects overall relative per<strong>for</strong>mance.<br />
lack of data on this subject limits the hotel’s<br />
ability to monitor and manage by channel.<br />
4 the online consumer sales path is complex. Although it<br />
would be helpful <strong>for</strong> marketing planning purposes, there<br />
has not been an industrywide analysis of online attribution<br />
to determine which promotional vehicles should be<br />
credited with triggering hotel website (brand.com) bookings.<br />
the only studies published on this topic came from<br />
Cornell’s Center <strong>for</strong> hospitality Research in october 2009<br />
and April 2011, both of which referred to a “billboard<br />
effect.” the two ChR “billboard effect” studies document<br />
outcomes, but do not prove causation between<br />
a presence on expedia and production of brand.com<br />
bookings. While helpful to focus industry discussion on<br />
an important topic, neither the April 2011 study nor the<br />
earlier “pseudo-experiment” in october 2009 sufficiently<br />
tested all the variables involved in the complex issue of<br />
identifying and appropriately crediting each of the many<br />
touch points that lead to brand.com bookings.<br />
the first “billboard effect” study in october 2009, called<br />
a “pseudo-experiment,” looked at brand.com production<br />
to see if it increased or not while the four test hotels were<br />
cycled on and off expedia. it concluded that a presence<br />
on expedia increased brand.com bookings significantly,<br />
however, it did not consider the fact that other promotional<br />
activity was undertaken by those four properties<br />
(or their parent brands), and this activity could also have<br />
a material effect on brand.com bookings. it also did not<br />
test whether ranking the test hotel in a position other<br />
than the top of page 1 would make a difference to the<br />
number of brand.com bookings. the more comprehensive<br />
April 2011 study of 1,720 hotel bookings does not<br />
give any credit to the other seven to eight travel websites<br />
visited by consumers in the run-up to each booking, nor<br />
does it evaluate email, offline advertising, banner ads or<br />
any other commonly used promotional vehicles, each<br />
of which may create the effect of an added “billboard”<br />
on a travel shopper’s path. it also does not consider rank<br />
placement on the otA. both studies examine expedia<br />
in isolation, in an environment where many points of<br />
contact play into the outcomes, and neither study factors<br />
these other touch points in or out of the consumer<br />
decision process. the industry would benefit from a more<br />
comprehensive examination of this topic.<br />
4 the three greatest emerging <strong>for</strong>ces in online distribution<br />
are: search, social media and mobile. driven by consumer<br />
behavior and some large influential online companies such<br />
as Google, Facebook and Apple, these three categories are<br />
dynamic and volatile and are likely to dramatically change<br />
the travel shopping/booking paradigm and, with it, the<br />
overall hotel distribution landscape over the next 2-3 years.<br />
Published by the hsMAi FoundAtion 5
IMpLICATIons<br />
oF THE FInDInGs<br />
The online environment imposes constant and<br />
significant changes on lodging distribution. Paradoxically,<br />
the more diffused consumer Internet<br />
usage with its many new emerging website types,<br />
the more centralized the players will be that control<br />
it. The power will be in the hands of gatekeepers<br />
who control consumer access, and many are vying<br />
<strong>for</strong> that position, especially in the travel sector. This<br />
doesn’t bode well <strong>for</strong> a fragmented industry such as<br />
lodging that largely divides its ownership, management,<br />
and branding. There are already powerful<br />
online media interests (e.g., Google, Facebook, and<br />
the OTAs) that are well positioned to control the<br />
traffic leading to the demand <strong>for</strong> hotel rooms. These<br />
companies have deep pockets, centralized product<br />
and marketing strategies and are rewarded by the<br />
investment community <strong>for</strong> attaining near-monopoly<br />
positions. This dynamic can push up the costs of<br />
acquiring and retaining demand, and challenge a<br />
hotel’s ability to achieve acceptable profit levels;<br />
conversely, it can create competition between intermediaries<br />
that can be leveraged to the hotelier’s<br />
advantage. To compete effectively and retain control<br />
of pricing, inventory, and brand value, the hospitality<br />
industry has to make a substantial commitment<br />
to manage a burgeoning array of transactional<br />
and marketing channels and harness its customer<br />
relationships, the asset it can control best, more<br />
effectively than any third party intermediary. Given<br />
the limited demand growth in the mature U.S. lodging<br />
market, distribution channel marketing will be<br />
a primary tool used to shift existing share among<br />
hotels. Proactively managing to an optimal channel<br />
mix objective will drive resource decisions <strong>for</strong> a<br />
hotel, and although no one can make a consumer<br />
choose a particular channel, a bias can be created<br />
<strong>for</strong> direct channels, primarily through improved<br />
content on a hotel’s own website and the application<br />
of consumer intelligence in the shopping and<br />
buying processes to favor the use of direct channels.<br />
Closely managing channel costs and choosing the<br />
best mix of channel partners can refine a distribution<br />
strategy to deliver optimal results at a brand<br />
and hotel level.<br />
6 An Ah&lA And stR sPeCiAl RePoRt<br />
1. Price Elasticity at the Competitive Set Level<br />
the fact that year-over-year growth in hotel room<br />
demand is small (1.6% average since 1990) is a factor<br />
at the industry and local market level. saying that this<br />
demand is “price inelastic” means that room rate reductions<br />
on an industrywide level will not generate enough<br />
incremental demand to compensate <strong>for</strong> the lower room<br />
rates and, there<strong>for</strong>e, will result in eroded industrywide<br />
room revenue. however, on a property basis, this price<br />
elasticity plays out differently. For example, hotel A can<br />
lower its rates and as long as no other hotel matches<br />
the lower rate, it is feasible that it can generate enough<br />
incremental demand to come out net positive from a<br />
room revenue standpoint. un<strong>for</strong>tunately, hotels b, C,<br />
d, and e, in the competitive set, are unlikely to stand<br />
by without also lowering their rates to ensure that they<br />
get their fair share of the finite demand coming into<br />
the comp set. there<strong>for</strong>e, the result can be that hotel<br />
A gets some benefit, reduced by the degree to which<br />
the others match the room rate, resulting in all hotels<br />
ending up with lower rates and profits. As this dynamic<br />
continues over time, all hotels in the comp set may well<br />
continue to lower rates to try to be the one hotel in the<br />
comp set that gets the short-term bump in demand,<br />
but since they are all chasing the same limited demand,<br />
it can become a “race to the bottom.” When these<br />
rates get so low that a hotel can no longer sustain employment<br />
levels and capital reinvestment, it is not good<br />
<strong>for</strong> the hotel, the community in which it operates, or its<br />
customers.<br />
2. Its All About Share Shift<br />
As demand growth in the mature u.s. lodging industry<br />
typically only varies in a narrow range from year to<br />
year, incremental demand brought by any channel<br />
partner will be marginal. however, each channel<br />
can be viewed <strong>for</strong> its potential to “share shift” from<br />
another hotel in its market, which is the primary<br />
method a hotel can use to gain an advantage. otAs<br />
are particularly adept at helping a hotel shift share<br />
either from one time period to another or from one<br />
hotel to another. this facility appears to be the primary<br />
reason why hotels have been drawn to work so closely<br />
with them. some mistake the contribution from share<br />
shifting to be creation of incremental new demand,<br />
however, the overall demand patterns recorded <strong>for</strong> the<br />
last 20 years, and consistent <strong>for</strong> the last 10 since the<br />
advent of the otA model, do not support this. due<br />
to finite and limited demand, especially at the comp<br />
set level, the dynamic usually plays out as a zero sum<br />
game. one hotel wins at the expense of the others<br />
in their immediate comp set or in the nearby market.<br />
but, even so, there is still often “not enough to go<br />
around” to those contending <strong>for</strong> the limited demand.
sometimes, in a high demand market, several hotels<br />
will gain share, but as demand through the otA channel<br />
grows in the comp set, since demand <strong>for</strong> hotel<br />
rooms is always finite, at some point, it will divert business<br />
from other channels. the data in the study from<br />
2009 through June 2011 point to brand.com as the<br />
primary channel that loses as the otA channel grows;<br />
it also appears that when the brand.com channel<br />
grows, the otA channel share shrinks. this may occur<br />
because both are “fishing in the same pond” and<br />
tapping many of the same channel-agnostic online<br />
shoppers. hotels should develop the tools to share<br />
shift the business from all channels, not limit share<br />
shifting just to the otA channel. taking business from<br />
a competitor through voice, Gds or brand.com could<br />
incur lower transaction fees and may have less of an<br />
impact on the AdR. share shifting largely occurs (1)<br />
from one hotel to another in the same or a different<br />
chain scale, (2) from one time period to another and<br />
(3) from one channel to another. in a model where a<br />
marketer allocates resources to acquisition, persuasion,<br />
and retention, hotels would benefit by working<br />
harder at converting existing traffic from all channels<br />
at higher rates (persuasion), and on retention, rather<br />
than solely focusing on acquisition which can be most<br />
expensive, especially without a strong conversion and<br />
retention plan.<br />
3. Costs and Benefits of <strong>Distribution</strong><br />
each channel carries distribution costs; the range is<br />
wide and can run from 10% to 50% of revenue.<br />
hotel owners and managers have not always measured<br />
the full cost of distribution consistently and have<br />
not factored these costs into channel decisions. too<br />
often, when hotels price rooms below marginal and<br />
fixed costs with an eye toward cash flow, they will<br />
withstand long-term negative effects on rate structure<br />
and profit. however, costs in 2010 may look reasonable<br />
when compared to where they might be in 2015.<br />
the following is a hypothetical scenario using 2010<br />
business volumes and estimated costs and projecting a<br />
potential outcome in 2015 with many new intermediaries<br />
in the hotel sales path.<br />
a. Industry Level: For anyone concerned about the<br />
almost $4 billion paid to third parties in 2010 (as<br />
estimated in this study), the prospect of paying double<br />
that amount within 3-5 years may be shocking, but<br />
not unrealistic. When the u.s. hotel industry AdR in<br />
2010 appears to be $10 below the inflation-adjusted<br />
rate charged in 2000, these added costs aggravate an<br />
already challenging profit picture <strong>for</strong> a hotel owner.<br />
on $10 billion in otA revenue in 2010 (consumer<br />
spending on hotels), the otA commissions and<br />
transaction fees are estimated in this study to cost the<br />
Executive Summary<br />
Intermediary <strong>Distribution</strong> Costs—<br />
Estimated 2010 and 2015 scenarios<br />
2010<br />
Intermediaries<br />
Revenue<br />
(Base: $100<br />
billion)<br />
Estimated<br />
Costs<br />
oTA $10 billion* $2.5 billion<br />
GDs $11 billion $1.3 billion<br />
TOTAL $21 billion $3.8 billion<br />
*estimated consumer spending through oTAs: hotels collected $7.7<br />
2015<br />
Intermediaries<br />
50% of total<br />
revenue: metasearch,<br />
mobile,<br />
social, oTA,<br />
travel againcy<br />
Revenue<br />
(Base: $100<br />
billion)<br />
Estimated Costs<br />
(based on 15%<br />
of revenue)<br />
$50 billion $7.5 billion<br />
industry approximately 25% or $2.5 billion. (Refer<br />
to the intermediary distribution Costs chart.) Add to<br />
that the 12% in commission and fees on $11 billion<br />
sold through the Gdss (also estimated in this study),<br />
and the major third party agencies incurred distribution<br />
costs of approximately $3.8 billion (3.8% of the<br />
overall industry total of $100 billion in room revenue1 ).<br />
Projecting the current trend of increased online access<br />
and a spike in mobile usage <strong>for</strong> hotel buying, the<br />
potential exists <strong>for</strong> the industry to pay commissions<br />
or transaction fees on as much as half of the business<br />
when more is booked online and large media<br />
enterprises control access to that demand. to play out<br />
this scenario, assuming an estimated 15% cost margin<br />
on average charged against 50% of total revenue (using<br />
the 2010 baseline of $100 billion), this could cost<br />
the industry close to $7.5 billion or 7.5% of the total<br />
room revenue2 .<br />
b. Property level: Managing costs and channel mix<br />
will become a priority. to illustrate this hypothetical<br />
situation <strong>for</strong> an individual property, a relatively small<br />
hotel with $3 million in annual room revenue may<br />
be facing distribution costs of $225,000 or more per<br />
year (refer to hotel distribution Costs chart), up from<br />
$150,000 in 2010. due to the prevalence of net rates,<br />
not all costs may be documented on the P&l.<br />
1 this estimate does not include travel agency business booked<br />
through other sources besides Gds, or traditional wholesaler business<br />
that may substantially raise the third party-sourced revenue<br />
and associated costs in many hotels.<br />
2 these numbers are estimates to illustrate a scenario that reflects<br />
an anticipated large increase in third party participation in hotel<br />
shopping.<br />
Published by the hsMAi FoundAtion 7
the wide range of profit contribution by<br />
each channel, and the fact that some<br />
channels in some markets may deliver<br />
rates that drop below the break-even<br />
point, creates urgency <strong>for</strong> a deeper dive<br />
into a hotel’s channel mix. Knowing the<br />
costs associated with each channel will<br />
be essential <strong>for</strong> managing a hotel in the<br />
highly fragmented distribution landscape,<br />
even when these costs do not appear<br />
as line items on the P&l statement.<br />
it is equally crucial to evaluate the full<br />
benefit from a channel including length<br />
of stay, ancillary spend and repeat and<br />
referral potential.<br />
some of the costs are easier to identify<br />
such as the portion that is transactionbased,<br />
while others may be less visible such as the degree<br />
to which rates have to be lowered to accomplish<br />
the goal of shifting share and the impact a channel may<br />
have on a hotel’s ability to engage its customers. each<br />
channel will vary and, there<strong>for</strong>e, needs to be carefully<br />
assessed. shifting share is a good objective to expect<br />
from each channel partner, but it has to be done with a<br />
mix of channels that yields optimal profit. shifting share<br />
to gain occupancy without regard <strong>for</strong> the price incurred<br />
is rarely beneficial to a hotel in the short term and never<br />
in the long term.<br />
Careful tracking of costs and benefits by channel can<br />
lead a hotel to pursue a channel mix that results in<br />
higher profits. shifting focus from generating revenue<br />
to generating profit will be a change <strong>for</strong> many revenue<br />
managers, but a useful perspective to apply to<br />
inventory and rate decisions.<br />
4. Threats and Opportunities on the Horizon<br />
there are new threats that are emerging in the<br />
distribution ecosystem; with these threats comes opportunity.<br />
hotels will have to be cautious and monitor<br />
the environment. some new channels may incur high<br />
costs and provide hotels minimal leverage <strong>for</strong> negotiating<br />
acceptable terms and some may prove to be<br />
highly effective venues to reach a large customer base<br />
at a reasonable price; the outcome will depend on the<br />
manner in which hotel companies engage them early<br />
in their development.<br />
a. With a clear domination in general search, if Google<br />
becomes equally successful in travel search it may:<br />
(1) bias the search results to point travelers to the<br />
advertisers most active in using the Google travel<br />
tools; (2) create competition <strong>for</strong> those wanting a<br />
prominent position in search results thereby pushing<br />
up the cost of acquisition <strong>for</strong> any hotel that wants to<br />
8 An Ah&lA And stR sPeCiAl RePoRt<br />
Timeframe<br />
Hotel<br />
Room<br />
Revenue<br />
Hotel <strong>Distribution</strong> Costs<br />
estimated 2010 and 2015 scenarios<br />
% through<br />
third party<br />
intermediaries<br />
Average<br />
cost as<br />
% revenue<br />
Dominant<br />
third party<br />
intermediaries<br />
2010 $3,000,000 25% 20% oTA, GDs,<br />
Travel agency<br />
direct<br />
2015 $3,000,000 50% 15% Meta-search,<br />
Mobile, social/<br />
travel inspiration,<br />
oTA, GDs,<br />
Travel agent<br />
direct<br />
utilize the travel-specific search tools, which then may<br />
make it more difficult <strong>for</strong> travel marketers with limited<br />
budgets to use this resource cost effectively; (3) limit<br />
the leverage a hotel or brand has in negotiation over<br />
cost since there is no inventory involved and fees may<br />
be incurred whether there is a booking consummated<br />
or not; and (4) expand its role in travel planning, with<br />
added tools like the travel inspiration tool schemer to<br />
further cement its already strong position as the point<br />
of entry <strong>for</strong> a majority of travel buyers.<br />
b. new players, such as Facebook, already in a relationship<br />
with Microsoft (active in travel search with<br />
bing), and Apple, possibly in partnership with Kayak<br />
(or other meta-search sites, like Room Key, with access<br />
to a robust travel inventory), are dabbling in travel and<br />
can gain traction quickly due to deep pockets and<br />
a high level of consumer adoption. likewise, large<br />
consumer sites like Amazon, ebay or other consumersavvy<br />
retailers as well as media companies who need<br />
to expand their traditional reader base like USA Today<br />
or The New York Times may well get in the game. it<br />
is not clear which business models they will offer and<br />
what kind of control a hotel may have to gain visibility<br />
and participate cost effectively. the traditional travel<br />
shopping path of the browser-to-search-engine model<br />
will likely be diversified with new methods including<br />
direct access to travel shopping through mobile devices,<br />
social sites and through some new search media<br />
such as voice-activated (e.g., Apple’s siri, Google’s<br />
Majel, Microsoft’s tellme) or map-based models,<br />
which lend themselves well to travel planning.<br />
c. the primary source of potential new incremental<br />
demand <strong>for</strong> hotel rooms in north America in the<br />
upcoming five-year time horizon (and likely beyond) is<br />
through inbound international travelers from the rapidly<br />
growing economies, especially China and india.<br />
Estimated<br />
<strong>Distribution</strong><br />
Costs<br />
$150,000<br />
$225,000
third party vendors may dominate these markets and<br />
train the consumers to use them be<strong>for</strong>e hotel brands<br />
have a chance to gain recognition through their hotel<br />
development ef<strong>for</strong>ts in those markets. Whoever gets<br />
the Chinese and indian consumers in the habit of<br />
using them to book travel to europe and the united<br />
states may hold onto that position <strong>for</strong> a long time because<br />
early adopted habits may be hard to break. For<br />
the secondary or tertiary u.s. markets that are unlikely<br />
to benefit from the inbound global demand, there will<br />
be some general improvement in demand in all hotel<br />
segments as the economy improves.<br />
d. some third party distribution channels with strong<br />
marketing positions may choose to offer services similar<br />
to those that current franchise and brand organizations<br />
may provide. this may create a new type of model that<br />
will compete with the legacy franchise and brand operators<br />
as a kind of “soft brand” based on the strength<br />
of the third party’s ability to (1) maintain a brand presence<br />
(2) provide a meaningful reservation contribution<br />
(3) maintain quality metrics <strong>for</strong> consumer evaluation<br />
and (4) offer the benefits of frequency/loyalty programs.<br />
5. New Priorities in the <strong>Distribution</strong> Landscape<br />
due to the anticipated rapid growth in consumers’ use<br />
of search, mobile and social tools <strong>for</strong> travel shopping,<br />
planning and booking, a hotel has to become conversant<br />
in the multitude of ways these tools may be<br />
utilized. each hotel and hotel company should have a<br />
plan <strong>for</strong> how to leverage the opportunities presented.<br />
Given how quickly consumers have adopted mobile<br />
and social media tools, the need is immediate to<br />
develop strategies <strong>for</strong> each. taking advantage of the<br />
native mobile environment and building functionality<br />
that is purpose-built <strong>for</strong> it will be essential to succeed<br />
in this space. Although the current mobile apps focus<br />
on “last minute deals,” as mobile access grows, more<br />
robust capabilities will be demanded by consumers<br />
such as voice-activated or map-based capabilities.<br />
hotels will benefit from moving away from offering<br />
“cheap deals” and into higher value offers tapping<br />
mobile’s unique functionality that lends itself so well<br />
to travel planning. Mobile users are not likely to use<br />
dozens of travel apps so there will be a shakeout at<br />
some point, and hotels have to be sure they make the<br />
cut. Monitoring and testing the new travel-specific<br />
search models will also be important since they are<br />
likely to become another major set of portals through<br />
which consumers will explore their travel options.<br />
social sites are quickly evolving into sales channels.<br />
Consumer review sites, Facebook business and fan<br />
pages and travel inspiration/trip planning sites with<br />
heavy social components will all offer opportunities to<br />
travelers to gather in<strong>for</strong>mation and then refer them<br />
to suppliers. search, mobile and social media tools<br />
Executive Summary<br />
will need to be mastered <strong>for</strong> their role in merchandising,<br />
as in<strong>for</strong>mation sources, and as commercial<br />
transactional plat<strong>for</strong>ms. Costs and benefits have to be<br />
monitored every step along the way.<br />
sHIFTInG FoCus FRoM GEnERATInG<br />
REvEnuE To GEnERATInG pRoFIT<br />
wILL BE A CHAnGE FoR MAnY<br />
REvEnuE MAnAGERs, BuT A<br />
usEFuL pERspECTIvE To AppLY To<br />
InvEnToRY AnD RATE DECIsIons.<br />
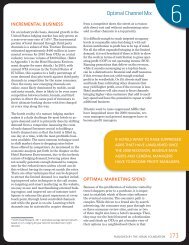
6. Consumer Media and Commoditization<br />
of Hotel Rooms<br />
Knowing that a dominant theme being conveyed to the<br />
consumer in the current marketplace is that last minute<br />
bookings typically result in discounted hotel rooms,<br />
hotels have to be mindful of the implications that<br />
message sends and rein<strong>for</strong>ces with the consumer. it<br />
renders hotel rooms to be a commodity purchase with<br />
the primary distinguishing feature being price, with<br />
secondary consideration <strong>for</strong> quality level. When hotels<br />
provide “last minute” inventory, they are fueling the<br />
spread of this message. in the short term, it can reduce<br />
rates and profits, but in the long term, it rein<strong>for</strong>ces the<br />
message that it is better to wait until the last minute<br />
to book a room to get the best rate, and that there is<br />
little difference between any hotel at a given quality<br />
level — any hotel will serve the same purpose <strong>for</strong> the<br />
traveler. For the hotelier, this (1) makes <strong>for</strong>ecasting more<br />
difficult; (2) lowers rates overall; (3) reduces the volume<br />
of high rated business booked further out from arrival;<br />
(4) causes consumers to believe that there is little difference<br />
between hotel brands; and (5) puts into question<br />
the issue of who “owns” the guest. besides causing<br />
some hotels to operate with a disproportionate amount<br />
of marginally profitable business, on an industrywide<br />
level, the brand erosion may be one of the most<br />
damaging outcomes of the situation. With brand erosion<br />
comes the associated marginalization of frequent<br />
guest programs that are currently vital to the chains<br />
<strong>for</strong> sustaining a recurring profit stream from a base of<br />
repeat customers. With third parties pursuing the same<br />
customers as hotels, and even deploying similar tactics<br />
(best rate guarantees and loyalty programs), the question<br />
of who controls the guest relationship may strongly<br />
affect the value proposition of a brand.<br />
Published by the hsMAi FoundAtion 9
7. The Transparency of the Internet<br />
Although the otA channel may only represent 10%<br />
or less of most major hotel chain demand, due to the<br />
prominence and transparency of rates on the internet,<br />
along with rate parity guidelines, the rates posted on<br />
these sites affect those sold through the channels that<br />
bring the other 90% of a hotel’s business. the same<br />
is likely to hold true <strong>for</strong> new media sites and mobile<br />
applications. Meeting planners, corporate travel<br />
managers, citywide attendees, and others will often<br />
check the rates offered online through third parties,<br />
and those rates will influence the negotiation of rates<br />
sold through all other channels. this is a major departure<br />
from the “old days” when the rack rate was the<br />
anchor and all other rates keyed off that rate. now,<br />
hotels set the highly prominent otA rate and the other<br />
rates are likely to cascade from that. the public nature<br />
of the otA rate, or <strong>for</strong> that matter any other rates<br />
offered online, along with rate parity terms, also limit a<br />
hotel from offering a range of customized rates and/or<br />
value packages to sub-segments of its customer base<br />
so it seems that there is often a “one-rate-fits-all” pricing<br />
structure. this undermines the power of marketing<br />
which is a discipline built on a foundation that calls<br />
<strong>for</strong> offering relevant products and services with corresponding<br />
rates by segment in order to best meet the<br />
needs of each customer group. Rates are often diluted<br />
by (1) the pressure to keep prominent online rates as<br />
low as possible, (2) the reality that many customers<br />
have been trained to believe that he or she will find<br />
a lower rate closer to arrival, and (3) a propensity <strong>for</strong><br />
hotels to think that the demand generated by lower<br />
rates will always compensate <strong>for</strong> the rate reduction.<br />
10 An Ah&lA And stR sPeCiAl RePoRt<br />
8. Billboard Effect and Online<br />
Attribution Models<br />
the number of factors influencing how a hotel booking<br />
is consummated is large and untested; there has<br />
not been a conclusive study in the lodging industry to<br />
determine how to independently credit the source(s)<br />
of direct bookings to a hotel or hotel brand. because<br />
each hotel or hotel brand has its own set of customers,<br />
each needs to examine the websites, media, and<br />
other promotional vehicles that are part of the travel<br />
shopper’s sales path (there are many billboards) and<br />
work on testing which one(s) can be credited with<br />
affecting the booking decision. this will likely differ by<br />
many variables including customer group, hotel brand,<br />
hotel type, season, day-of-week and trip purpose.<br />
be<strong>for</strong>e deploying significant marketing resources to<br />
generate online traffic, deepen engagement and trigger<br />
bookings, the hotel marketer should decide how<br />
much credit to apply to each element of an online<br />
marketing plan so the resources are most effectively<br />
applied to meet the marketer’s objectives.<br />
9. Optimal <strong>Channel</strong> Mix<br />
each hotel has an optimal channel mix; this is the case<br />
whether the hotel is in the u.s. market or anywhere<br />
else globally. it is affected by supply and demand; the<br />
number of rooms booked through the channel, and at<br />
what room rate; the strategy of each competitor; and<br />
the position of each hotel in its marketplace. Most of<br />
the hotel business in north America remains a “street<br />
corner” business. other than destination hotels and<br />
resorts, which have their own competitive dynamic,<br />
most hotels in highly populated areas compete with<br />
their immediate neighbors. understanding the hotel’s<br />
potential in its marketplace will drive its tactical actions<br />
and refine the decisions of its management in<br />
terms of pricing, marketing and yield management.<br />
being mindful of the use of discounting to drive<br />
demand and the affect it has on overall AdR is at the<br />
heart of achieving an optimal channel mix. improving<br />
techniques to systematically evaluate merchandising<br />
through every channel will go a long way to improving<br />
conversion rates on existing traffic even when incremental<br />
traffic is not available. if a hotel can accurately<br />
set objectives <strong>for</strong> its optimal channel mix, it is more<br />
likely to achieve them through better use of marketing<br />
resources and more targeted and decisive actions.<br />
10. The Devil We Know, The Devil We Don’t<br />
While it is easy <strong>for</strong> a hotel to agonize over high-cost<br />
channels or limited demand in a market, knowing the<br />
available demand generators, the costs and benefits of<br />
each, and which ones are a good fit at any given time<br />
is the best defense in times of economic adversity. As<br />
long as a hotel has control of its inventory and pricing,
one of its most crucial marketing decisions will be<br />
about its channel mix, which reflects the way in which<br />
that inventory is sold. Riskier even than lowering rates,<br />
ceding control of inventory (or access to inventory) —<br />
such as offering last room availability, especially <strong>for</strong> low<br />
value business — can do great damage to near- and<br />
long-term profits if it is not tightly controlled.<br />
there will be many emerging new distribution opportunities;<br />
some will be booking channels, others will<br />
be marketing and referral channels. learning how to<br />
assess each opportunity is essential given the rapidly<br />
changing nature of the distribution environment.<br />
With eyes wide open, a hotel management team has<br />
to confront its market position, establish its optimal<br />
channel mix and use every tool available to achieve its<br />
objective. the mature nature of hotel demand in the<br />
u.s. market has to be taken into account and hotels<br />
have to realize that with a slow-growing market pie,<br />
they will spend most of their time shifting share from<br />
their competitors, who at the same time will be trying<br />
to do the exact same thing to them. historically, hotels<br />
have not focused clearly on their channel mix, have<br />
not had the metrics or inclination to manage this way,<br />
and have not systematically worked on merchandising<br />
techniques to improve conversion, retention and ancillary<br />
spend in each channel.<br />
Executive Summary<br />
leveraging new distribution opportunities, knowing<br />
they will primarily facilitate share shift, should put a laser<br />
focus on managing demand in lockstep with associated<br />
costs. in the absence of buoyant demand, the share a<br />
hotel gets of that limited demand has to deliver optimal<br />
profit. Placing an emphasis on generating ancillary<br />
revenue will be part of the centerpiece of a successful<br />
hotel’s revenue strategy. Many channel partners will<br />
promise to grow a hotel’s “slice” of the comp set “pie,”<br />
but each also takes a bite in exchange <strong>for</strong> helping. this<br />
“bite” may also include less visible costs such as the<br />
need to impose deeper discounts on the rate in order to<br />
accomplish the desired shift in market share. the hotel’s<br />
actions determine the size of its slice and how many<br />
bites are left after all channel partners are compensated.<br />
in the interest of a sustainable profit stream to support<br />
a hotel’s employees, its community, and its customers,<br />
how much can a hotel keep <strong>for</strong> itself?<br />
LEvERAgINg NEW DISTRIBuTION<br />
OPPORTuNITIES, KNOWINg<br />
THEy WILL PRIMARILy fACILITATE<br />
SHARE SHIfT, SHOuLD PuT A LASER<br />
fOCuS ON MANAgINg DEMAND IN<br />
LOCKSTEP WITH ASSOCIATED COSTS.<br />
Published by the hsMAi FoundAtion 11
1<br />
2<br />
3<br />
45<br />
FIvE ACTIons A CHAIn/<br />
BRAnD CAn TAKE now<br />
invest in and develop internal and external low-cost<br />
channels with as much control over rates, inventory<br />
and branding as possible. if you can only focus on one<br />
new thing internally, get your mobile strategy right.<br />
build up programs to expand high margin ancillary<br />
revenue streams through centrally controlled channels<br />
and facilitate the same <strong>for</strong> hotels to supplement ef<strong>for</strong>ts<br />
at the local level.<br />
hold the line as tightly as possible on costs <strong>for</strong> existing<br />
and emerging channels keeping in mind that a growing<br />
percentage of the business going <strong>for</strong>ward will pass<br />
through intermediaries prior to arriving at brand-controlled<br />
channels.<br />
Audit every channel to ensure it is capturing the most<br />
incremental business possible from all traffic that passes<br />
through it; view all channels through the same multichannel<br />
lens the customers use so the management<br />
and development of them is integrated. investigate and<br />
develop attribution modeling, examining all channels to<br />
understand which touch points are contributing to the<br />
bookings.<br />
tap the intelligence you have about your customers<br />
and apply it extensively at every touch point possible to<br />
optimize acquisition, persuasion and retention through<br />
customer service and merchandising. this may be the<br />
primary advantage a hotel chain can leverage when<br />
competing with the many new third parties that have<br />
strong adoption in consumer markets but limited<br />
knowledge of hotel customer’s personal preferences<br />
and stay patterns.<br />
12 An Ah&lA And stR sPeCiAl RePoRt<br />
1<br />
2<br />
3<br />
45<br />
FIvE ACTIons A HoTEL<br />
MAnAGER oR ownER<br />
CAn TAKE now<br />
determine a hotel’s optimal channel mix and manage<br />
to that objective. determine the potential <strong>for</strong> the hotel<br />
based on the nature of market demand, competitive<br />
behavior and consumer perception.<br />
Monitor the hotel’s ability to manage its channels<br />
relative to its competitors in the marketplace as well<br />
as new channel opportunities that arise in the market.<br />
Compare channels in their ability to shift share and<br />
the cost they each incur including transaction fees,<br />
commissions, impact on rate and impact on customer<br />
engagement.<br />
seek out, develop and invest in channels that help<br />
acquire, engage, and retain customers and also create<br />
sustainable profit streams.<br />
Guard your most valuable assets: a hotel’s pricing<br />
structure, inventory and brand — this applies equally<br />
to national branded hotels and independents. evaluate<br />
channel opportunities carefully be<strong>for</strong>e putting these<br />
assets at risk. Price smart.<br />
Conduct a systematic audit of every channel to ensure<br />
it is functioning at its peak, that the channel and the<br />
processes supporting it are designed <strong>for</strong> the customers<br />
it is best suited to serve, and that its position in the distribution<br />
ecosystem makes it accessible and compelling<br />
in comparison to its competitors.