2005 STATE OF CORAL REEF REPORT.pdf - Mote Marine Laboratory
2005 STATE OF CORAL REEF REPORT.pdf - Mote Marine Laboratory
2005 STATE OF CORAL REEF REPORT.pdf - Mote Marine Laboratory

You also want an ePaper? Increase the reach of your titles
YUMPU automatically turns print PDFs into web optimized ePapers that Google loves.
The State of Coral Reef Ecosystems<br />
of the United States and Pacific<br />
Freely Associated States: <strong>2005</strong><br />
Produced by the National Oceanic and Atmospheric Administration,<br />
in cooperation with partners from Federal, State, Territorial and<br />
Commonwealth Agencies, and the Pacific Freely Associated States.<br />
NOAA Technical Memorandum NOS NCCOS 11
page<br />
i<br />
CITATIONS:<br />
Citation for the entire document:<br />
Waddell, J.E. (ed.), <strong>2005</strong>. The State of Coral Reef Ecosystems of the United States and Pacific Freely Associated<br />
States: <strong>2005</strong>. NOAA Technical Memorandum NOS NCCOS 11. NOAA/NCCOS Center for Coastal Monitoring<br />
and Assessment’s Biogeography Team. Silver Spring, MD. 522 pp.<br />
Citation for an individual chapter (example of Main Hawaiian Islands chapter):<br />
Friedlander, A.M., G. Aeby, E. Brown, A. Clark, S. Coles, S. Dollar, C. Hunter, P. Jokiel, J. Smith, B. Walsh, I.<br />
Williams, and W. Wiltse. <strong>2005</strong>. The State of Coral Reef Ecosystems of the Main Hawaiian Islands. pp. 222-269.<br />
In: J. Waddell (ed.), The State of Coral Reef Ecosystems of the United States and Pacific Freely Associated<br />
States: <strong>2005</strong>. NOAA Technical Memorandum NOS NCCOS 11. NOAA/NCCOS Center for Coastal Monitoring<br />
and Assessment’s Biogeography Team. Silver Spring, MD. 522 pp.<br />
ACKNOWLEDGEMENTS:<br />
The production of this report would not have been possible without the participation of the people recognized<br />
below. Their efforts to help compile, format, edit, and review the document are very much appreciated. Particular<br />
recognition goes to Julie Kellner, who formatted the figures and tables in the document; Aurelie Shapiro, who<br />
created the maps; Lynn Dancy, who editied the text for grammatical accuracy and consistency; and Kevin Mc-<br />
Mahon, who formatted the references.<br />
Additional editorial and support staff include:<br />
Ann Borowik, Kenneth Buja, Chris Caldow, Russell Callender, John Christensen, Sarah Davidson, Katherine<br />
Eschelbach, Lilli Ferguson, Tracy Gill, Christine Harvey, Jamison Higgins, Tom Hourigan, Christopher Jeffrey,<br />
Matthew Kendall, Laura Letson, Kevin McMahon, Mark Monaco, Connie Moy, David Moe Nelson, Simon Pittman,<br />
and Shauna Slingsby.<br />
FOR MORE INFORMATION:<br />
For more information about this report or to request a copy, please contact NCCOS CCMA’s Biogeography Team<br />
at 301-713-3028 or visit http://biogeo.nos.noaa.gov.<br />
DISCLAIMER:<br />
This publication does not constitute an endorsement of any commercial product or intend to be an opinion beyond<br />
scientific or other results obtained by the National Oceanic and Atmospheric Administration (NOAA). No<br />
reference shall be made to NOAA, or this publication furnished by NOAA, in any advertising or sales promotion<br />
which would indicate or imply that NOAA recommends or endorses any proprietary product mentioned herein, or<br />
which has as its purpose an interest to cause directly or indirectly the advertised product to be used or purchased<br />
because of this publication.<br />
Cover photo by Miles Anderson, Analytical Laboratories of Hawaii.
The State of Coral Reef Ecosystems<br />
of the United States and Pacific<br />
Freely Associated States: <strong>2005</strong><br />
Report coordinators/ editors by jurisdiction:<br />
U.S. Virgin Islands–Christopher Jeffrey<br />
Puerto Rico–Jorge (Reni) García-Sais<br />
Navassa–Margaret W. Miller<br />
Florida–Kacky Andrews, Larry Nall, Christopher Jeffrey and Simon Pittman<br />
Flower Garden Banks–Emma Hickerson<br />
Main Hawaiian Islands–Alan Friedlander and Athline Clark<br />
Northwestern Hawaiian Islands–Alan Friedlander and Russell Brainard<br />
American Samoa–Christopher Hawkins<br />
Pacific Remote Island Areas–Russell Brainard and Jim Maragos<br />
Republic of the Marshall Islands–Shauna Slingsby<br />
Federated States of Micronesia–Shauna Slingsby<br />
Commonwealth of the Northern Mariana Islands–John Starmer and Erica Cochrane<br />
Guam–Trina Leberer and Valerie Porter<br />
Republic of Palau–Yimnang Golbuu<br />
Additional contributors:<br />
Andy Bruckner, John Christensen, Elizabeth Fairey, Kelly Gleason, Michelle Harmon,<br />
Christine Harvey, Scott Heron, Tom Hourigan, Christopher Jeffrey, Julie Kellner, Ruth Kelty,<br />
Gang Liu, Mark Monaco, Joel Murray, Simon Pittman, Steve Rohmann, Aurelie Shapiro,<br />
Shauna Slingsby, Dana Topousis, Shay Viehman, Jenny Waddell, Lani Watson.<br />
United States<br />
Department of<br />
Commerce<br />
Carlos M. Gutierrez<br />
Secretary<br />
NOAA Technical Memorandum NOS NCCOS 11<br />
May <strong>2005</strong><br />
National Oceanic and<br />
Atmospheric Administration<br />
Vice Admiral Conrad C.<br />
Lautenbacher, Jr. USN (Ret.)<br />
Administrator<br />
National Ocean Service<br />
Richard W. Spinrad, Ph.D.<br />
Assistant Administrator<br />
page<br />
ii
page<br />
iii<br />
TABLE <strong>OF</strong> CONTENTS<br />
Introductory Information<br />
Citations i<br />
Acknowledgements i<br />
Table of Contents iii–vi<br />
Preface vii-ix<br />
Chapter 1: Executive Summary 1<br />
Chapter 2: Introduction 3<br />
Chapter 3: Environmental and Anthropogenic Threats to Coral Reef Ecosystems 12<br />
Andy Bruckner, Ken Buja, Liz Fairey, Kelly Gleason, Michelle Harmon, Scott Heron, Tom Hourigan,<br />
Chris Jeffrey, Julie Kellner, Ruth Kelty, Bob Leeworthy, Gang Liu, Simon Pittman, Aurelie Shapiro,<br />
Al Strong, Jenny Waddell, and Peter Wiley.<br />
• Climate Change and Coral Bleaching 13<br />
• Diseases 16<br />
• Tropical Storms 17<br />
• Coastal Development and Runoff 19<br />
• Coastal Pollution 21<br />
• Tourism and Recreation 22<br />
• Fishing 23<br />
• Trade in Coral and Live Reef Species 26<br />
• Ships, Boats and Groundings 27<br />
• <strong>Marine</strong> Debris 29<br />
• Aquatic Invasive Species 30<br />
• Security Training Activities 32<br />
• Offshore Oil and Gas Exploration 33<br />
• Other 35<br />
Chapter 4: The State of Coral Reef Ecosystems of the U.S. Virgin Islands 45<br />
Christopher F.G. Jeffrey, Ursula Anlauf, James Beets, Sheri Caseau, William Coles, Alan M. Friedlander,<br />
Steve Herzlieb, Zandy Hillis-Starr, Matthew Kendall, Violeta Mayor, Jeffrey Miller, Richard Nemeth,<br />
Caroline Rogers, and Wesley Toller.<br />
Environmental and Anthropogenic Stressors 47<br />
Coral Reef Ecosystem Data Gathering Activities and Resource Condition 57<br />
Water Quality 59<br />
Benthic Habitats 62<br />
Associated Biological Communities 73<br />
Current Conservation Management Activities 80<br />
Overall Conclusions and Recommendations 83<br />
Chapter 5: The State of Coral Reef Ecosystems of Puerto Rico 91<br />
Jorge (Reni) García-Sais, Richard Appeldoorn, Andy Bruckner, Chris Caldow, John D. Christensen,<br />
Craig Lilyestrom, Mark E. Monaco, Jorge Sabater, Ernest Williams, and Ernesto Diaz.<br />
Environmental and Anthropogenic Stressors 94<br />
Coral Reef Ecosystem Data Gathering Activities and Resource Condition 105<br />
Water Quality 108<br />
Benthic Habitats 109<br />
Associated Biological Communities 120<br />
Current Conservation Management Activities 126<br />
Overall Conclusions and Recommendations 127
Chapter 6: The State of Coral Reef Ecosystems of Navassa 135<br />
Margaret Miller, Joseph Schwagerl, David McClellan, Mark Vermeij, Dana Williams.<br />
Environmental and Anthropogenic Stressors 136<br />
Coral Reef Ecosystem Data Gathering Activities and Resource Condition 140<br />
Water Quality 141<br />
Benthic Habitats 141<br />
Associated Biological Communities 144<br />
Current Conservation Management Activities 148<br />
Overall Conclusions and Recommendations 148<br />
Chapter 7: The State of Coral Reef Ecosystems of Florida 150<br />
Katherine Andrews, Larry Nall, Chris Jeffrey, and Simon Pittman, eds.<br />
Environmental and Anthropogenic Stressors 153<br />
Coral Reef Ecosystem Data Gathering Activities and Resource Condition 165<br />
Water Quality 165<br />
Benthic Habitats 170<br />
Associated Biological Communities 177<br />
Current Conservation Management Activities 186<br />
Overall Conclusions and Recommendations 192<br />
Chapter 8: The State of Coral Reef Ecosystems of the Flower Garden Banks and Other Banks<br />
of the Northwestern Gulf of Mexico 201<br />
Emma L. Hickerson and G.P. Schmahl.<br />
Environmental and Anthropogenic Stressors 204<br />
Coral Reef Ecosystem Data Gathering Activities and Resource Condition 209<br />
Water Quality 211<br />
Benthic Habitats 212<br />
Associated Biological Communities 216<br />
Current Conservation Management Activities 218<br />
Overall Conclusions and Recommendations 219<br />
Chapter 9: The State of Coral Reef Ecosystems of the Main Hawaiian Islands 222<br />
Alan Friedlander, Greta Aeby, Eric Brown, Athline Clark, Steve Coles, Steve Dollar,<br />
Cindy Hunter, Paul Jokiel, Jennifer Smith, Bill Walsh, Ivor Williams, and Wendy Wiltse.<br />
Environmental and Anthropogenic Stressors 224<br />
Coral Reef Ecosystem Data Gathering Activities and Resource Condition 243<br />
Water Quality 245<br />
Benthic Habitats 247<br />
Associated Biological Communities 253<br />
Current Conservation Management Activities 259<br />
Overall Conclusions and Recommendations 262<br />
Chapter 10: The State of Coral Reef Ecosystems of the Northwestern Hawaiian Islands 270<br />
Alan Friedlander, Greta Aeby, Russell Brainard, Athline Clark, Edward DeMartini, Scott Godwin,<br />
Jean Kenyon, Randy Kosaki, Jim Maragos, and Peter Vroom.<br />
Environmental and Anthropogenic Stressors 272<br />
Coral Reef Ecosystem Data Gathering Activities and Resource Condition 282<br />
Water Quality 284<br />
Benthic Habitats 288<br />
Associated Biological Communities 297<br />
Current Conservation Management Activities 306<br />
Overall Conclusions and Recommendations 307<br />
page<br />
iv
page<br />
v<br />
Chapter 11: The State of Coral Reef Ecosystems of American Samoa 312<br />
Peter Craig, Guy DiDonato, Douglas Fenner, and Christopher Hawkins.<br />
Environmental and Anthropogenic Stressors 314<br />
Coral Reef Ecosystem Data Gathering Activities and Resource Condition 318<br />
Water Quality 321<br />
Benthic Habitats 323<br />
Associated Biological Communities 328<br />
Current Conservation Management Activities 332<br />
Overall Conclusions and Recommendations 334<br />
Chapter 12: The State of Coral Reef Ecosystems of the Pacific Remote Island Areas 338<br />
Rusty Brainard, Jim Maragos, Robert Schroeder, Jean Kenyon, Peter Vroom, Scott Godwin,<br />
Ronald Hoeke, Greta Aeby, Russell Moffitt, Marc Lammers, Jamison Gove, Molly Timmers,<br />
Stephani Holzwarth, and Steve Kolinski.<br />
Environmental and Anthropogenic Stressors 340<br />
Coral Reef Ecosystem Data Gathering Activities and Resource Condition 348<br />
Water Quality 348<br />
Benthic Habitats 351<br />
Associated Biological Communities 359<br />
Current Conservation Management Activities 369<br />
Overall Conclusions and Recommendations 370<br />
Chapter 13: The State of Coral Reef Ecosystems of the Republic of the Marshall Islands 373<br />
Silvia Pinca, Maria Beger, Dean Jacobson, and Terry Keju.<br />
Environmental and Anthropogenic Stressors 375<br />
Coral Reef Ecosystem Data Gathering Activities and Resource Condition 380<br />
Water Quality 380<br />
Benthic Habitats 380<br />
Associated Biological Communities 381<br />
Current Conservation Management Activities 383<br />
Overall Conclusions and Recommendations 384<br />
Chapter 14: The State of Coral Reef Ecosystems of the Federated States of Micronesia 387<br />
Mike Hasurmai, Eugene Joseph, Steve Palik, and Kerat Rikim.<br />
Environmental and Anthropogenic Stressors 389<br />
Coral Reef Ecosystem Data Gathering Activities and Resource Condition 392<br />
Water Quality 392<br />
Benthic Habitats 393<br />
Associated Biological Communities 395<br />
Current Conservation Management Activities 396<br />
Overall Conclusions and Recommendations 397<br />
Chapter 15 The State of Coral Reef Ecosystems of the Commonwealth of the Northern Mariana Islands 399<br />
John Starmer, ed.<br />
Environmental and Anthropogenic Stressors 406<br />
Coral Reef Ecosystem Data Gathering Activities and Resource Condition 416<br />
Water Quality 418<br />
Benthic Habitats 423<br />
Associated Biological Communities 430<br />
Current Conservation Management Activities 437<br />
Overall Conclusions and Recommendations 438
Chapter 16: The State of Coral Reef Ecosystems of Guam 442<br />
Val Porter, Trina Leberer, Mike Gawel, Jay Gutierrez, David Burdick, Victor Torres, and Evangeline Lujan.<br />
Environmental and Anthropogenic Stressors 445<br />
Coral Reef Ecosystem Data Gathering Activities and Resource Condition 458<br />
Water Quality 461<br />
Benthic Habitats 462<br />
Associated Biological Communities 468<br />
Current Conservation Management Activities 476<br />
Overall Conclusions and Recommendations 481<br />
Chapter 17: The State of Coral Reef Ecosystems of the Republic of Palau 488<br />
Yimnang Golbuu, Andrew Bauman, Jason Kuartei, and Steven Victor.<br />
Environmental and Anthropogenic Stressors 490<br />
Coral Reef Ecosystem Data Gathering Activities and Resource Condition 496<br />
Water Quality 497<br />
Benthic Habitats 498<br />
Associated Biological Communities 501<br />
Current Conservation Management Activities 503<br />
Overall Conclusions and Recommendations 505<br />
Chapter 18: National Summary 508<br />
page<br />
vi
page<br />
vii<br />
PREFACE<br />
The purpose of this report is to provide an assessment of the current condition of coral reef ecosystems in U.S.<br />
jurisdictions, including the U.S. Virgin Islands, Puerto Rico, Navassa, Florida, Flower Garden Banks and other<br />
banks of the Gulf of Mexico, Hawaii, the Northwestern Hawaiian Islands, American Samoa, the Pacific Remote<br />
Island Areas, Guam, and the Commonwealth of the Northern Mariana Islands (CNMI). The report also provides<br />
an examination of coral reefs in the Pacific Freely Associated States (FAS), including the Republic of the Marshall<br />
Islands, Federated States of Micronesia, and Republic of Palau. The report focuses primarily on shallow-water<br />
portions of these states and territories, from the shoreline to the maximum depth at which sunlight-dependent<br />
corals can survive. Coral communities occuring in deep and cold waters are the subject of a complementary<br />
report currently under development.<br />
This report is the second in a series of national coral reef ecosystem status reports. The initial report, The State<br />
of Coral Reef Ecosystems of the United States and Pacific Freely Associated States: 2002 (Turgeon et al., 2002),<br />
is similar to this report in that it incorporates the work of many scientists and managers from across the world.<br />
The first report provided a broad introduction to and a preliminary look at the status of coral reef ecosystems and<br />
was based primarily on qualitative information from the contributing authors. The initial report also included a<br />
considerable amount of background information that is not included in this report.<br />
The lead entity coordinating the development of this report was the National Oceanic and Atmospheric Administration’s<br />
(NOAA) Center for Coastal Monitoring and Assessment’s Biogeography Team (CCMA-BT), which is part<br />
of the National Centers for Coastal Ocean Science. CCMA-BT scientists are responsible for three main tasks<br />
related to coral reef ecosystem conservation: 1) administration of a Federal grant program that supports selected<br />
monitoring efforts in U.S. jurisdictions and the FAS; 2) collection of standardized monitoring data in several U.S.<br />
jurisdictions through a well-established scientific field program; and 3) systematic production of benthic (sea<br />
floor) habitat maps depicting the spatial extent of the primary habitats comprising U.S. coral reef ecosystems.<br />
CCMA-BT was assisted in this reporting effort by NOAA Fisheries’ Office of Habitat Conservation and NOAA’s<br />
Coral Reef Conservation Program.<br />
This report differs from the 2002 status report in several ways. The current report is based primarily on the<br />
analysis of monitoring data collected by scientists rather than qualitative assessments of ecosystem conditions.<br />
It utilizes the most recent monitoring data from all available sources, including but not limited to the activities supported<br />
by the grant program mentioned above. This report also includes a mapping component, which provides<br />
an analysis of the spatial extent of coral reef ecosystem habitats within each jurisdiction based on the estimated<br />
area in nearshore waters to 20 meters of water depth. It is critical to keep in mind that the term ‘coral reef ecosystems’<br />
includes not only the coral reefs themselves, but also the associated habitats that are functional components<br />
of the ecosystem, such as mangroves, seagrass and macroalgae beds, and unconsolidated sediments.<br />
Because the chapters reflect the hard work and dedication of writing teams from each jurisdiction, the teams<br />
should be cited as primary authors for the jurisdictional chapters of this report. Over 160 individuals from 14<br />
jurisdictions contributed to this report, providing not only their time, attention, and hard work, but also in many<br />
cases, unpublished data that would otherwise not be available to the public at this time. The writing teams were<br />
assembled by each jurisdiction’s report coordinators, who deserve praise for undertaking the daunting task of<br />
identifying and coordinating writing teams, arranging meetings, assigning tasks, assembling data sets, filling<br />
information gaps, and responding to requests from the report editor. The report would not be possible without<br />
their coordination efforts.<br />
To assist in the challenging task of assimilating data and study results from 14 jurisdictions spanning 16 time<br />
zones, CCMA-BT scientists held two regional workshops in the spring of 2003–one in Saipan, CNMI and one<br />
in San Juan, Puerto Rico. Coordinators and authors from each of the jurisdictions attended the meetings and<br />
helped develop a report outline that would provide a common structure to guide chapter development. The<br />
coordinators, many of whom are the designated point of contact for all coral reef activities in their area, then<br />
assembled a writing team of coral reef ecosystem experts from academic, non-governmental, state, territorial,<br />
and Federal organizations. These teams were tasked with compiling an inventory of current monitoring efforts in<br />
their jurisdiction to determine which data sets should be used to assess ecosystem status within the established<br />
reporting structure. Subsequently, each team summarized the available data and provided a quantitative assess-
ment of the condition of the ecosystem based on three broad themes: water quality, benthic habitats, and associated<br />
biological communities. When considered altogether, these themes provide a basis for assessing overall<br />
condition and diagnosing potential contributing factors to threatened and impacted ecosystems.<br />
Ongoing agency efforts to assess and monitor elements of coral reef ecosystems form the basis for this report.<br />
However, it is important to realize that monitoring data are rarely collected in the same way or with the same<br />
frequency. Indeed, methods differ considerably among jurisdictions. These differences preclude the comparison<br />
of data or important metrics across jurisdictions in the National Summary section of this report. Instead, conclusions<br />
drawn across jurisdictions are limited to whether a particular attribute is being measured and whether these<br />
measurements result in data that are sufficiently robust to illuminate trends or patterns. Therefore, the condition<br />
of coral reef ecosystems within each jurisdiction is evaluated independently and is not comparable to other jurisdictions.<br />
Unless all of the jurisdictions implement a standard protocol, it is unlikely that interjurisdictional comparisons<br />
can ever be made with any scientific rigor. A few agencies have already initiated a standard complement<br />
of monitoring activities across multiple jurisdictions in an attempt to address this problem. If met with success,<br />
these integrated programs may aid coral resource managers throughout the U.S. and FAS in the development of<br />
a common set of diagnostic tools to help affect positive change in coral reef ecosystems.<br />
This report is structured to provide information according to the primary threats, topics, and goals outlined in the<br />
National Coral Reef Action Strategy (NCRAS; NOAA, 2002) and other guidance documents developed by the<br />
U.S. Coral Reef Task Force (USCRTF) and its member organizations. Following the Executive Summary, which<br />
distills general conclusions from the entire document, an introductory chapter provides background information<br />
about the distribution of coral reef ecosystems in the U.S. and FAS, the different types of reefs that occur in these<br />
areas, and an estimate of the potential extent of coral reef ecosystems (including reefs, seagrass and macroalgae<br />
beds, sand patches, etc.) for each jurisdiction. The third chapter summarizes the current understanding of<br />
the 13 key natural and anthropogenic threats to coral reef ecosystems that were identified in the NCRAS. An additional<br />
‘other’ threat category was included to allow writing teams to characterize threats that may be important<br />
or unique to a specific jurisdiction, but do not appear on the NCRAS list of key threats.<br />
Chapters 4 through 17 comprise the heart of this report. In these chapters, the local writing teams characterized<br />
the current understanding of the condition of the coral reef ecosystems in their jurisdictions. Writing teams<br />
were asked to: 1) describe the geographical distribution of reefs and provide salient background information; 2)<br />
discuss how each of the key threats has manifested in their area; 3) describe existing monitoring programs and<br />
identify specific data sets upon which their assessments are based; 4) present methods, results, and discussion<br />
for each monitoring data set, organized around the three primary themes of water quality, benthic habitats, and<br />
associated biological communities; 5) introduce the conservation and management actions currently being undertaken<br />
to respond to issues of concern; and 6) provide an overall summary of the status of each jurisdiction’s<br />
coral reef ecosystems and priority recommendations for future research and management alternatives.<br />
Finally, the National Summary chapter synthesizes and integrates the results and conclusions from each of the<br />
preceding chapters to present broad-scale conclusions from a national perspective. The structure of the National<br />
Summary chapter reframes the results of the jurisdiction chapters in the context of the goals identified in the<br />
NCRAS. Grouping the information in this way clearly demonstrates how the report conclusions can help measure<br />
progress towards overarching NCRAS goals and provide a means to evaluate the effectiveness of management<br />
actions.<br />
This report represents an evolving effort to determine the condition of coral reef ecosystems at both local and<br />
national scales. To do this, scientists must ask the right questions, and then design effective studies to gather<br />
data with sufficient frequency to confidently answer those questions. This report serves as a vehicle for the dissemination<br />
of information about data collection activities in the U.S. and FAS. As more monitoring data are collected<br />
and analyzed, scientists will be better equipped to present time series information and provide condition<br />
reports that address all aspects of these complex and dynamic ecosystems.<br />
Another objective of this report is to increase the participation of scientists and managers at all levels in synthesizing<br />
all available information to provide the most robust, integrated assessments possible. Data collection and<br />
integrated reporting of information are crucial to management efforts that strive to protect and conserve coral<br />
reefs, their associated habitats, and the organisms that depend on them. It is hoped that, through this and future<br />
page<br />
viii
page<br />
ix<br />
reporting efforts, gaps in the current state of knowledge about U.S. coral reef ecosystems will be identified and<br />
filled, and that the availability of up-to-date, accurate, comprehensive scientific information will enable managers<br />
to slow or even halt the general decline in coral reef ecosystem health that has become evident in the last<br />
several decades.
EXECUTIVE SUMMARY<br />
The State of Coral Reef Ecosystems of the United States and Pacific Freely Associated States: <strong>2005</strong><br />
For over three decades, scientists have been documenting the decline of coral reef ecosystems, amid increasing<br />
recognition of their value in supporting high biological diversity and their many benefits to human society.<br />
Coral reef ecosystems are recognized for their benefits on many levels, such as supporting economies by<br />
nurturing fisheries and providing for recreational and tourism opportunities, providing substances useful for<br />
medical purposes, performing essential ecosystem services that protect against coastal erosion, and providing<br />
a diversity of other, more intangible contributions to many cultures. In the past decade, the increased<br />
awareness regarding coral reefs has prompted action by governmental and non-governmental organizations,<br />
including increased funding from the U.S. Congress for conservation of these important ecosystems and<br />
creation of the U.S. Coral Reef Task Force (USCRTF) to coordinate activities and implement conservation<br />
measures [Presidential Executive Order 13089].<br />
Numerous partnerships forged among Federal agencies and state, local, non-governmental, academic and<br />
private partners support activities that range from basic science to systematic monitoring of ecosystem components<br />
and are conducted by government agencies, non-governmental organizations, universities, and the<br />
private sector. This report shares the results of many of these efforts in the framework of a broad assessment<br />
of the condition of coral reef ecosystems across 14 U.S. jurisdictions and Pacific Freely Associated States.<br />
This report relies heavily on quantitative, spatially-explicit data that has been collected in the recent past and<br />
comparisons with historical data, where possible. The success of this effort can be attributed to the dedication<br />
of over 160 report contributors who comprised the expert writing teams for each jurisdiction. The content of the<br />
report chapters are the result of their considerable collaborative efforts.<br />
The writing teams, which were organized by jurisdiction and comprised of experts from numerous research<br />
and management institutions, were provided a basic chapter outline and a length limit, but the content of each<br />
chapter was left entirely to their discretion. Each jurisdictional chapter in the report is structured to: 1) describe<br />
how each of the primary threats identified in the National Coral Reef Action Strategy (NCRAS) has manifested<br />
in the jurisdiction; 2) introduce ongoing monitoring and assessment activities relative to three major categories<br />
of inquiry – water quality, benthic habitats, and associated biological communities – and provide summary<br />
results in a data-rich format; and 3) highlight recent management activities that promote conservation of coral<br />
reef ecosystems.<br />
Due to the wide variety of monitoring and assessment techniques employed by each jurisdiction, as well as<br />
the variations in spatial and temporal resolution of the data being collected, it is necessary to evaluate each<br />
jurisdiction independently over time and resist the temptation to compare jurisdictions. Only data collection<br />
efforts that employ consistent methods across jurisdictions will allow for the comparison of data values; such<br />
regional efforts are underway and are beginning to yield results. At this point, however, the limited ability to<br />
make cross-jurisdictional data comparisons restricted the authors of the National Summary chapter to conclusions<br />
that are primarily qualitative. Still, useful conclusions can be drawn with regard to variables being monitored,<br />
data gaps that exist, general trends in the condition of resources, and national-level progress toward<br />
conservation activities.<br />
Ultimately, the goal of this report is to answer the difficult but vital question: what is the condition of U.S. coral<br />
reef ecosystems? Coral reef ecosystems clearly are beset by a wide array of significant threats, and while<br />
managers and scientists may be able to demonstrate improvements in some aspects of an ecosystem, deterioration<br />
in other aspects may yield an overall conclusion of ‘no change’ or decline. A valid response to the<br />
above question is that it is too soon to tell, not because deterioration or recovery is in an early stage, but because<br />
the necessary long-term datasets that quantify such conditions have not been amassed. Few monitoring<br />
programs have been in place for longer than a decade, and many have been initiated only within the past<br />
two to five years. Some of these monitoring programs are still in their infancy and have not collected enough<br />
data to provide conclusive results. With continued support of these critical monitoring activities, however,<br />
trends may become more apparent over time.<br />
Major conclusions of this report related to the threats and stressors impacting coral reef ecosystems indicate<br />
that some appear to be intensifying while others are decreasing in intensity. Climate change was identified by<br />
11 of the 14 jurisdictions (78%) as being a moderate (6) or high (5) threat to coral reef ecosystem resources.<br />
Executive Summary<br />
Sidebar<br />
page<br />
1
Executive Summary<br />
page<br />
2<br />
The State of Coral Reef Ecosystems of the United States and Pacific Freely Associated States: <strong>2005</strong><br />
Climate change, whether due to natural variability or human activity, is central to several of the threats impacting<br />
coral reef ecosystems. Potential impacts from climate change on coral reef ecosystems include modification<br />
of water chemistry and sea level rise that may affect coral growth, the greater incidence and prevalence of<br />
coral bleaching associated with increased sea surface temperatures, and the increased intensity and frequency<br />
of storm events. Coastal development was cited as a moderate (2) or high (8) threat in 10 of the jurisdictions.<br />
Coastal development and population growth, whether permanent or temporary (such as in the case of<br />
tourism), are correlated with the intensification of several threats because development frequently translates<br />
to increases in pollution entering the marine environment; sedimentation from construction, agriculture, and<br />
road-building activities; and physical damage from recreational users through trampling, vessel groundings,<br />
or the use of anchors in fragile habitats. Another urgent threat, which was cited as a moderate (6) or high<br />
(8) threat by all of the 14 jurisdictions, stems from fishing. Changes in the populations of marine organisms,<br />
and fish in particular, can have far-reaching cascade effects throughout the ecosystem. For example, the removal<br />
of herbivorous fish may precipitate changes in benthic communities by favoring algal species that can<br />
outcompete corals following a release of predation pressure. The removal of top level predators may have a<br />
cascading effect on the entire ecosystem by reducing overall ecosystem productivity and upsetting the balance<br />
of energy flow throughout the system with unknown consequences.<br />
Improvements in the status of some threats have also been documented. One positive development has been<br />
the removal of over 400 tons of marine debris, largely nets and fishing line, from the shallow reefs of the Northwestern<br />
Hawaiian Islands. In addition, many jurisdictions continue to install mooring buoys to help minimize<br />
anchor damage while facilitating access for recreational activities. Management of the trade in aquarium fish<br />
has resulted in more protection for some U.S. coastal areas, and implementation of the provisions of the Convention<br />
on International Trade in Endangered Species of Wild Flora and Fauna and the Federal Endangered<br />
Species Act extend protection to coral species, largely prohibiting their sale or exportation. In addition, nine<br />
grounded, rusted-out fishing vessels were removed from a reef flat in Pago Pago Harbor, American Samoa.<br />
These and other important improvements are detailed in the jurisdictional chapters.<br />
Other important conclusions can be drawn in relation to advancements in management and conservation science.<br />
Major highlights include the progress made in the development of tools that scientists and coastal managers<br />
use to measure the condition of the resources. Digital map products of nearshore (< 30 m) coral reef<br />
habitats now exist for most jurisdictions and are being used to structure monitoring programs, inform management<br />
decisions, and build capacity in current and future coastal managers. Complementary multibeam maps<br />
of mid-depth (>20 m) environments are also being developed, and products are becoming increasingly available.<br />
Techniques to investigate genetic linkages among populations and identify and track the spread of coral<br />
disease are becoming more sophisticated and more widely disseminated. Other research is being conducted<br />
to determine optimal restoration techniques and calculate resource damages, which enables natural resource<br />
trustees to seek compensation for injured coral reef ecosystems and devote those funds toward restoration<br />
and monitoring activities. Advances in satellite observing systems and the deployment of additional buoys that<br />
monitor oceanographic conditions continue to improve the ability to characterize coral reef ecosystems.<br />
As implementation of the NCRAS continues, it is crucial that existing gaps, especially in the shortage of trained<br />
personnel and infrastructure, be filled with additional resources. Without the availability of reliable, consistent<br />
data collected at sufficient spatial and temporal resolutions, answering management questions and evaluating<br />
management effectiveness cannot be confidently achieved.<br />
This report represents the second in an ongoing series of reports that integrate the wealth of quantitative and<br />
qualitative information on the condition of U.S. coral reef ecosystems that has emerged since the inception<br />
of the USCRTF. Future reporting efforts will continue to document progress toward the goals outlined by the<br />
USCRTF and in the NCRAS and contribute to a broader understanding of U.S. coral reef ecosystems.
INTRODUCTION<br />
The State of Coral Reef Ecosystems of the United States and Pacific Freely Associated States: <strong>2005</strong><br />
Much of the vast ocean realm that covers the planet is composed of very deep water. Thousands of meters below<br />
the surface, the bottom of the ocean lies in complete darkness and is sparsely populated. However, where<br />
the seafloor slopes up toward the continental shelf and the flanks of oceanic islands, marine life becomes<br />
more concentrated due to the greater availability of sunlight and nutrients from upwelled water and terrestrial<br />
inputs. Tropical nearshore areas are comprised of a variety of habitats which are frequently classified according<br />
to their dominant substrate, geological, and biological features. While some sandy or rocky substrates are<br />
sparsely colonized or devoid of life, others provide habitat for seagrasses and other plant and algal communities.<br />
In some hardbottom areas where conditions are right, the seafloor is colonized by a variety of tiny colonial<br />
invertebrates known generally as corals. Over millions of years, these tiny organisms have created enormous<br />
underwater structures that provide a foundation for an elaborate community of creatures that together constitute<br />
one of the most amazing and diverse ecosystems on the planet. An oasis in a vast ocean, coral reefs attract<br />
and concentrate a breathtaking<br />
assemblage of colorful and fanciful<br />
organisms that challenge the limits of<br />
the imagination (Figure 2.1). Scientists<br />
estimate that this highly complex<br />
interdependent system supports over<br />
one million species, with potentially<br />
millions more yet to be described. In<br />
addition to their importance for biodiversity,<br />
coral reef ecosystems are<br />
important for human communities as<br />
well, by performing essential ecosystem<br />
services; supporting major fishery<br />
resources; providing educational,<br />
social, recreational, cultural, and<br />
medicinal opportunities; and generating<br />
economic benefits for millions<br />
of people, especially through coastal<br />
tourism.<br />
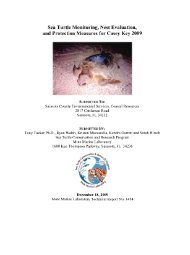
Figure 2.1. Coral reefs provide the structure that attracts and concentrates a colorful<br />
assortment of interesting organisms. Photo: NOAA NOS.<br />
The vibrant underwater world of coral reefs comprises less than 1% of the surface of the planet, primarily due<br />
to the narrow physiological tolerances of hermatypic, or reef-building, corals. Nearly all coral reefs are found<br />
throughout tropical and subtropical oceans between 30ºS and 30ºN latitude, primarily in waters less than 30<br />
m deep (Huston, 1985; Grigg and Epp, 1989). Their distribution is influenced by nutrient availability, salinity,<br />
light, substrate, sediment type, temperature, and exposure to wave action (Lalli and Parsons, 1995; Hoegh-<br />
Guldberg, 1999; Szmant, 2002; Leichter et al., 2003; Wolanski et al., 2003). Seawater temperatures in coral<br />
ecosystems generally range between 18°–29°C (Glynn, 1996; Barnes and Hughes, 1999), although some<br />
corals seem to have adapted to tolerate slightly higher temperatures for short periods of time. Many organisms<br />
living in coral reef ecosystems are photosynthetic and are restricted to shallow depths with sufficient light<br />
penetration (Veron, 1986; Barnes, 1987).<br />
Shallow-water coral reef ecosystems under United States jurisdiction occur in the shared waters of the Caribbean<br />
Basin, Gulf of Mexico, and Atlantic Ocean near the east coast of Florida, and across the Pacific Ocean<br />
on both sides of the equator. The Freely Associated States of the Republic of Palau, the Federated States of<br />
Micronesia (FSM) and the Republic of the Marshall Islands (RMI) are located in the tropical western Pacific<br />
Ocean. Pacific reef systems tend to proliferate on oceanic islands in a number of habitats ranging from offshore<br />
banks to shallow atoll lagoons. Many Pacific islands formed as a result of volcanic activity beneath the<br />
earth’s surface and/or uplift of limestone or sedimentary rock. Movement of the enormous Pacific plate across<br />
tectonic ‘hot spots’ resulted in the creation of several long island chains which developed complex reef systems<br />
over time. In general, as soon as lava cools and forms stable, hard substrate, corals begin to colonize the<br />
submarine margins of islands as narrow fringing reefs. As the islands age, coral reefs continue to gradually accrete<br />
while the central land area slowly erodes and subsides, until, after millions of years, the island itself may<br />
Introduction<br />
Sidebar<br />
page<br />
3
Introduction<br />
page<br />
4<br />
The State of Coral Reef Ecosystems of the United States and Pacific Freely Associated States: <strong>2005</strong><br />
disappear completely, leaving a necklace of low sand<br />
islets and extensive reefs surrounding a broad lagoon<br />
(Figure 2.2). Cores taken from coral reefs near Bikini<br />
and Enewetak Atolls, Marshall Islands revealed coral<br />
deposits nearly 1.4 km thick, which are believed to be<br />
50-59 million years old (Spalding et al., 2001). Many<br />
stages of island development, from creation by active<br />
volcanoes to submergence beneath the surface, are<br />
evident in the archipelagos of the Pacific.<br />
In contrast to most Pacific reefs, many reef formations<br />
in the Caribbean Basin have developed in shallowwater<br />
environments near relatively stable continental<br />
land masses. Coral reef ecosystems near continents<br />
tend to be older than reef systems on many oceanic<br />
islands, and are often subject to greater terrestrial inputs,<br />
such as freshwater, sediments and nutrients.<br />
To a large extent, reefs located on broad continental<br />
shelves benefit from their close association with estuaries<br />
and mangrove forests which filter out harmful<br />
nutrients and sediments as well as nurture large juvenile<br />
fish populations important to reef ecosystems.<br />
In turn, shallow or emergent reefs protect fragile<br />
coastlines by absorbing wave action during storms<br />
and high swells.<br />
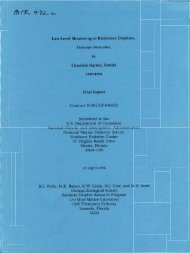
Coral Reef Ecosystem Components<br />
A coral ecosystem can be considered a mosaic of<br />
habitats defined by substrate, cover, and structural<br />
zones (Figure 2.3). Benthic habitats found in a coral<br />
ecosystem include unconsolidated sediments (e.g.,<br />
sand and mud); mangroves and other emergent<br />
Fringing<br />
Barrier<br />
Atoll<br />
Figure 2.2. A diagram depicting the evolution of a coral ecosystem<br />
on a volcanic island. As the island ages, wind and rain erode<br />
the land while reefs along the island perimeter accrete.<br />
vegetation; submerged vegetation (e.g., seagrass and macroalgae); hermatypic coral reefs and associated<br />
colonized hardbottom habitats (e.g., spur and groove, individual and aggregated patch reefs, and gorgoniancolonized<br />
pavement and bedrock); and uncolonized hardbottom (e.g., reef rubble and uncolonized bedrock).<br />
Typical structural zones include the reef crest, forereef, reef flat, backreef and lagoon (FMRI, 1998; Kendall et<br />
al., 2001; Coyne et al., 2003; NOAA, 2003). While hermatypic coral reefs are important marine habitats, other<br />
habitats, such as bare sand or seagrass, are also important to the overall ecology and function of the ecosystem.<br />
Mangrove forests, hardbottom coral habitats, submerged vegetation habitats, and softbottom sand<br />
and mud habitats serve as important spawning and growth areas (Ogden and Ehrlich, 1977; Lindeman, 1986;<br />
Parrish, 1989; Christensen et al., 2003; Kendall et al., 2003; Mumby et al., 2004).<br />
Humans in Coral Reef Ecosystems<br />
For thousands of years, humans have lived in coastal areas adjacent to coral reef ecosystems. Coastal and<br />
island communities regularly harvested marine resources for food, and in some areas, marine resources provided<br />
the primary, if not only, source of protein. In addition to providing basic sustenance to island and coastal<br />
communities, reefs have inspired art and legends and provided humans with natural products, jewelry, pharmaceuticals,<br />
building materials, transportation pathways, and recreational opportunities. Many cultures cite<br />
strong cultural ties to reef ecosystems and resources, and have gone to great lengths to protect the resources<br />
from overexploitation, as evidenced by the elaborate systems of reef tenure and conservation practices devised<br />
by some Pacific island communities to regulate the use of marine resources.
The State of Coral Reef Ecosystems of the United States and Pacific Freely Associated States: <strong>2005</strong><br />
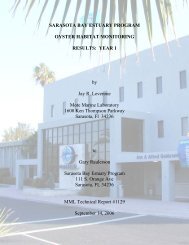
Figure 2.3. Examples of some of the types of benthic habitats found in the shallow-water coral ecosystems of the United States. Left<br />
to right and top to bottom, these are:<br />
1. Mangrove, Salt River, St. Croix, USVI<br />
2. Bare Sand, Midway Atoll, NWHI<br />
3. Macroalgae and sand, Puerto Rico<br />
4. Hardbottom with macroalgae, Kure Atoll, NWHI<br />
5. Thalassia seagrass, St. Croix, USVI<br />
6. Linear reef with live coral, Midway Atoll, NWHI<br />
7. Hardbottom with crustose coraline algae, Lisianski, NWHI<br />
8. Spur and groove, Mona Island, Puerto Rico<br />
9. Uncolonized pavement with sand channels, Mona Island, Puerto Rico<br />
Photos: CCMA-BT.<br />
Introduction<br />
Sidebar<br />
page<br />
5
Introduction<br />
page<br />
6<br />
The State of Coral Reef Ecosystems of the United States and Pacific Freely Associated States: <strong>2005</strong><br />
Reef ecosystems also provide intangible benefits that have inspired a long romance with the coast and draw<br />
millions of people each year to visit or live near coastal areas of the tropics. On the U.S. mainland alone, 10.5<br />
million people live in areas adjacent to coral reef ecosystems, and island populations continue to increase<br />
through population growth and immigration. In fact, population growth and associated development has been<br />
identified as a key threat in American Samoa and several other small island states. Tourism and recreational<br />
activities also temporarily increase the number of people inhabiting coastal areas. A recent report by the U.S.<br />
Commission on Ocean Policy (2004) provides evidence of the increasing importance of tourism and recreation<br />
to the economies of coastal communities. Staggering numbers of people visit coastal areas every year<br />
to fish, dive, surf and recreate. As a result, the economic benefits from coastal and ocean resources have<br />
experienced a fundamental shift from a products-based to services-based system, with tourism and recreation<br />
generating more income than mineral and living resource extraction, transportation, and shipbuilding (U.S.<br />
Commission on Ocean Policy, 2004).<br />
Coral reef ecosystems found in the U.S. support millions of dollars worth of goods and services (e.g., commercial<br />
and recreational fisheries, tourism, etc.). Recent estimates indicate that activities associated with<br />
Hawaii’s coastal ecosystems produce about $364 million for the state’s economy every year (Davidson et al.,<br />
2003). Activities associated with Florida’s coastal ecosystems contribute an estimated $2.7 billion annually to<br />
its economy (Johns et al., 2001). The intangible values of U.S. coral reef ecosystems–such as aesthetic, ecological,<br />
and cultural values–are difficult to quantify and are excluded from these economic value estimates.<br />
All of this attention and interest in coastal areas in general, and coral reef ecosystems in particular, are not<br />
without consequence. Against a background of natural disturbances, increased disturbance from human activities<br />
reduces the resilience of coral reef ecosystems and can contribute to alarming declines in their overall<br />
health. Key anthropogenic stressors include climate change and bleaching; disease; urban and tourism-related<br />
coastal development; sedimentation; toxic chemical pollution; overfishing; physical damage from ships,<br />
boats, and anchors; invasions of exotic species; and marine debris (Davidson, 2002; Wilkinson, 2002; Gardner<br />
et al., 2003; NCRAS, 2002).<br />
Setting<br />
The U.S. is responsible for managing and conserving extensive shallow-water coral reef ecosystems within<br />
its maritime boundaries in cooperation with local governments of various types. U.S. States with coral reef<br />
ecosystems include Florida and Hawaii. U.S. Territories include the U.S. Virgin Islands (USVI), American<br />
Samoa, and Guam. The Commonwealths of Puerto Rico and the Northern Marianas Islands also have coral<br />
reef ecosystems. Navassa Island is an unincorporated U.S. Territory near Haiti. The Flower Garden Banks<br />
lie in Federal waters off the coast of Texas, and some of the banks are managed by the National Oceanic<br />
and Atmospheric Administration’s (NOAA) National <strong>Marine</strong> Sanctuary Program in cooperation with the U.S.<br />
Department of the Interior’s Minerals Management Service. The Northwestern Hawaiian Islands (NWHI) are<br />
jointly managed by the U.S. Fish and Wildlife Service (USFWS), the State of Hawaii, and the NWHI Coral Reef<br />
Ecosystem Reserve, but the islands have been proposed as the nation’s 13th national marine sanctuary, and<br />
sanctuary designation seems likely in the near future. The Pacific Remote Island Areas (PRIAs) of the Line<br />
and Phoenix Islands and Johnston Atoll are primarily managed by the USFWS as national wildlife refuges,<br />
and jurisdiction over Wake and Johnston Atolls is currently in the process of being transferred from the U.S.<br />
Department of Defense to the USFWS. The Freely Associated States (FAS) of the RMI, FSM, and the Republic<br />
of Palau are sovereign nations that maintain a close economic association with the U.S. and claim similar<br />
maritime boundaries. Coral ecosystems of the U.S. and FAS cover a vast area and are distributed across<br />
large portions of the earth’s surface (Figures 2.4 and 2.5).<br />
Using depth curves depicted on nautical charts as a surrogate for the potential distribution and extent of<br />
shallow-water coral ecosystems, Rohmann et al. (in press) estimated that 36,816 km 2 of coral ecosystems<br />
may potentially be found in U.S. waters less than 10 fathoms (approximately 18 m) deep, and an estimated<br />
143,058 km 2 in waters less than 100 fathoms (approximately 183 m) deep (Table 2.1).
Figure 2.4. A map depicting the location of U.S. coral reef ecosystems in the Atlantic Ocean, Gulf of Mexico, and Caribbean Sea.<br />
Figure 2.5. A map depicting the location of U.S. coral reef ecosystems in the Pacific Ocean. Maps: A. Shapiro.<br />
Exclusive Economic<br />
Zone (EEZ)<br />
Exclusive Economic<br />
Zone (EEZ)<br />
Introduction<br />
Sidebar<br />
page<br />
7
Introduction<br />
page<br />
8<br />
The State of Coral Reef Ecosystems of the United States and Pacific Freely Associated States: <strong>2005</strong><br />
Table 2.1. The potential area of coral ecosystems within the United States territorial sea and exclusive economic zone. a The area inside<br />
the 10-fathom (18 m) or 100-fathom (183 m) depth curves was derived from NOAA nautical charts. b Estimates for the RMI, FSM,<br />
and Republic of Palau were derived from Landsat satellite imagery. Source: Rohmann et al., in press.<br />
LOCATION<br />
ESTIMATED AREA INSIDE<br />
10-FATHOM (18 M)<br />
DEPTH CURVE (km 2 )<br />
ESTIMATED AREA INSIDE<br />
100-FATHOM (183 M)<br />
DEPTH CURVE (km 2 )<br />
USVI 3 344 2,126<br />
Puerto Rico 4 2,302 5,501<br />
Navassa 3 14<br />
Southern Florida 5 30,801 113,092<br />
Flower Gardens NMS 6 0 164<br />
Main Hawaiian Islands 7 1,231 6,666<br />
Northwestern Hawaiian Islands 8 1,595 13,771<br />
American Samoa 9 55 464<br />
Pacific Remote Island Areas 11 252 436<br />
AREA <strong>OF</strong> SHALLOW<br />
WATER (
species than degraded areas.<br />
The State of Coral Reef Ecosystems of the United States and Pacific Freely Associated States: <strong>2005</strong><br />
Biodiversity, or the number and abundance of species that exist within a region, is another important variable.<br />
Global marine biodiversity is believed to be highest in the western Pacific Ocean, near eastern Indonesia, and<br />
the total number of species tends to decline with distance from this biological hot spot. As a result, among U.S.<br />
and FAS jurisdictions, the Republic of Palau and other western Pacific locations (i.e., Guam, CNMI, FSM and<br />
the Marshall Islands) naturally contain a higher number of species than do locations in the eastern Pacific,<br />
Caribbean, Atlantic or Gulf of Mexico.<br />
The degree of endemism, or the number of species that are found only within a particular location or region,<br />
is another important factor that distinguishes the jurisdictions. Scientists studying remote areas, such as the<br />
NWHI, which have a relatively low overall number of species, have recorded a large number of endemic species.<br />
Endemic species contribute greatly to the overall diversity of life on the planet and thus constitute an<br />
important conservation priority.<br />
Among other important distinguishing characteristics among the jurisdictions is the actual composition of<br />
the coral and fish communities. Highly disturbed ecosystems often are dominated by species of coral and<br />
macroalgae that are opportunistic and tolerant of negative natural and anthropogenic impacts. Heavily fished<br />
ecosystems often are dominated by small, undesirable food fish not targeted by fishers. For corals, the<br />
prevalence of long-lived versus opportunistic species may provide some indication of the level of disturbance<br />
experienced in a region and thereby the health of the system as a whole.<br />
The prevalence of threats and stressors to coral reef ecosystems also varies among and within jurisdictions.<br />
The NCRAS identified thirteen major threats and stressors to coral reef ecosystems that are introduced in the<br />
following chapter (NCRAS, 2002). Chapter 4 begins a series of fourteen jurisdiction chapters, in which each<br />
jurisdictional writing team provides a condition report according to a standardized structure. Each chapter<br />
begins with a few paragraphs of contextual information and a discussion of how each of the thirteen primary<br />
threats currently affects their jurisdiction. That information is followed by a summary of current monitoring activities,<br />
and project results which are grouped into the three categories of water quality, benthic habitats, and<br />
associated biological communities. They then discuss current conservation management activities pertinent to<br />
their jurisdiction before providing overall conclusions and recommendations for further action. The final chapter<br />
serves as a national-level summary of the preceding information, in addition to providing information about<br />
selected national-level developments that are pertinent to all the jurisdictions.<br />
Introduction<br />
Sidebar<br />
page<br />
9
Introduction<br />
page<br />
10<br />
The State of Coral Reef Ecosystems of the United States and Pacific Freely Associated States: <strong>2005</strong><br />
REFERENCES<br />
Barnes, R. 1987. Invertebrate zoology: Fifth Edition. Harcourt Brace Jovanovich, Inc., Orlando, FL. pp. 149-163.<br />
Barnes R. and R. Hughes. 1999. An introduction to marine ecology: Third Edition. Blackwell Science, Inc., Malden, MA.<br />
pp. 117-141.<br />
Coyne, M.S., T.A. Battista, M. Anderson, J. Waddell, W. Smith, P. Jokiel, M.S. Kendall, and M.E. Monaco. 2003. Benthic<br />
habitats of the main Hawaiian Islands. NOAA Technical Memorandum NOS NCCOS CCMA (On–line). Silver Spring,<br />
Maryland. Available from the internet URL: http://biogeo.nos.noaa.gov/projects/mapping/pacific<br />
Christensen, J.D., C.F.G. Jeffrey, C. Caldow, M.E. Monaco, M.S. Kendall, and R.S. Appeldoorn. 2003. Cross-shelf habitat<br />
utilization patterns of reef fishes in southwestern Puerto Rico. Gulf and Carib Research 14(2): 9-27<br />
Davidson, K., M. Hamnett, and C. Minato. 2003. The first four years: Hawaii coral reef initiative research program (1998-<br />
2002). Social Science Research Institute, University of Hawaii at Manoa. 72 pp<br />
Davidson, M.G. 2002. Protecting coral reefs: the principal national and international legal instruments. Harvard Environmental<br />
Law Review 26: 499-546<br />
FMRI (Florida Fish and Wildlife Conservation Commission, Florida <strong>Marine</strong> Research Institute and National Oceanic and<br />
Atmospheric Administration). 1998. Benthic habitats of the Florida Keys. FMRI Technical Report TR-4. 53 pp.<br />
Gardner, T.A., I.M. Cote, J.A. Gill, A.Grant, and A.R. Watkinson. 2003. Long-term region-wide declines in Caribbean corals.<br />
Science 301: 958-960<br />
Glynn, P.W. 1996. Coral reef bleaching: facts, hypotheses and implications. Global Change Bio 2: 495-509<br />
Grigg, R.W. and D. Epp. 1989. Critical depth for the survival of coral islands: effects on the Hawaiian Archipelago. Science<br />
243: 638-641<br />
Hoegh-Guldberg, O. 1999. Climate change, coral bleaching and the future of the world’s coral reefs. <strong>Marine</strong> and Freshwater<br />
Research 50: 839–866<br />
Huston, M.A. 1985. Patterns in species diversity on coral reefs. Annual Review of Ecological Systems 6: 149-177.<br />
Johns, G.M., V.R. Leeworthy, F.W. Bell, and M.A. Bonn. 2001. Socioeconomic study of reefs in southeast Florida. Report<br />
by Hazen and Sawyer under contract to Broward County, Florida. 255 pp.<br />
Kendall, M.S., J.D. Christensen, and Z. Hillis-Starr. 2003. Multi-scale data used to analyze the spatial distribution of<br />
French grunts, Haemulon flavolineatum, relative to hard and soft bottom in a benthic landscape. Environmental Biology<br />
of Fishes 66: 19–26<br />
Kendall, M.S., M.E. Monaco, K.R. Buja, J.D. Christensen, C.R Kruer, M. Finkbeiner, and R.A. Warner. 2001. Methods<br />
used to map the benthic habitats of Puerto Rico and the U.S. Virgin Islands. National Oceanic and Atmospheric Administration<br />
Technical Memorandum NOS NCCOS CCMA 152. Silver Spring, Maryland.<br />
Lalli, C.M. and T.R.Parsons. 1995. Biological Oceanography: An Introduction. Oxford, UK: Butterworth–Heinemann Ltd.<br />
p 220-233<br />
Leichter, J.J., H.L. Stewart, and S.L. Miller. 2003. Episodic nutrient transport to Florida coral reefs. Limnologic Oceanography<br />
48: 1394-1407.<br />
Lindeman, K.C. 1986. Development of larvae of the French grunt, Haemulon flavolineatum, and comparative development<br />
of twelve western Atlantic species of Haemulon. Bulletin of <strong>Marine</strong> Science 39: 673-716.<br />
Mumby, P.J., A.J. Edwards, J.E. Arlas-Gonzalez, K.C. Lindeman, P.G. Blackwell, A. Gall, M.I. Gorczynska, A.R. Harborne,<br />
C.L. Pescod, H. Renken, C.C.C. Wabnitz, G. Llewellyn. 2004. Mangroves enhance the biomass of coral reef fish communities<br />
in the Caribbean. Nature 427: 533-536.<br />
NCRAS (National Coral Reef Action Strategy). 2002. A National Coral Reef Action Strategy: Report to Congress on<br />
implementation of the Coral Reef Conservation Act of 2002 and the National Action Plan to Conserve Coral Reefs in<br />
2002-2003. NOAA. Silver Spring, Maryland. 120 pp. + appendix.
The State of Coral Reef Ecosystems of the United States and Pacific Freely Associated States: <strong>2005</strong><br />
NOAA (National Oceanic and Atmospheric Administration). 2003. Atlas of the Shallow-water Benthic Habitats of the<br />
Northwestern Hawaiian Islands (Draft). 160 pp. Available from the internet URL: http://ccma.nos.noaa.gov/rsd/products.<br />
html#nwhi<br />
Ogden, J.C., and P.R. Ehrlich. 1977. The behavior of heterotypic resting schools of juvenile grunts (Pomadasyidae).<br />
<strong>Marine</strong> Biology 42: 273-280.<br />
Parrish, JD (1989) Fish communities of interacting shallow-water habitats in tropical oceanic regions. <strong>Marine</strong> Ecology<br />
Progress Series 58: 143-160.<br />
Rohmann, S.O., J.J. Hayes, R.C. Newhall, M.E. Monaco, and R.W. Grigg. In press. The Area of Potential Shallow-water<br />
Tropical and Subtropical Coral Ecosystems in the United States. Coral Reefs.<br />
Spalding, M.D., C. Ravilious, and E.P. Green. 2001. World atlas of coral reefs. Prepared at the UNEP World Conservation<br />
Monitoring Centre. University of California Press, Berkeley, California. 424 pp.<br />
Szmant, A.M. 2002. Nutrient enrichment on coral reefs: is it a major cause of coral reef decline? Estuaries 25: 743-766<br />
U.S. Commission on Ocean Policy. 2004. An Ocean Blueprint for the 21st Century: Final Report. Washington, DC.<br />
Veron, J.E.N. 1986. Corals of Australia and the Inso-Pacific. Angus and Robertson, London.<br />
Wilkinson, C. (Ed.) 2002. Status of coral reefs of the world: 2002. Australian Institute of <strong>Marine</strong> Science.<br />
Wolanski, E., R. Richmond, L. McCook, and H. Sweatman. 2003. Mud, marine snow and coral reefs. Amercan Scientist<br />
91: 44–51.<br />
Introduction<br />
Sidebar<br />
page<br />
11
Threats<br />
page<br />
12<br />
Threats and Stressors to U.S. Coral Reef Ecosystems<br />
Andy Bruckner 1 , Ken Buja 2 , Liz Fairey 1 , Kelly Gleason 2 , Michelle Harmon 3 , Scott Heron 4 , Tom Hourigan 1 , Chris Jeffrey 2 ,<br />
Julie Kellner 2 , Ruth Kelty 3 , Bob Leeworthy 5 , Gang Liu 4 , Simon Pittman 2 , Aurelie Shapiro 2 , Al Strong 4 , Jenny Waddell 2 ,<br />
Peter Wiley 5 .<br />
Human activity is commonly identified as a major contributor to the observed global deterioration of coral reef<br />
ecosystem health, with loss of live coral cover, declining species diversity, and reduced abundance reported<br />
in many areas (NOAA, 2002a; Wilkinson, 2002; Turgeon et al., 2002). Degradation in the structure and functioning<br />
of coral reef ecosystems results in a concomitant loss in the intrinsic value of the ecological system,<br />
as well as a significant loss in the provision of goods and services for society. Approximately 8% of the global<br />
population live within 100 km of a coral reef (Bryant et al., 1998) and many local communities and national<br />
economies are directly dependent on coral reef ecosystems for tourism revenue, food, and coastal protection<br />
(Spurgeon, 1992). As such, human pressures can be intense, and developing strategies to mitigate stressors<br />
is a complex task.<br />
Shallow-water coral reef ecosystems experience a wide range of physical, biological, and chemical threats<br />
and stressors, which stem from both anthropogenic and natural causes. Threats are defined as environmental<br />
trends with potentially negative impacts. Stressors are defined as factors or processes that harm ecosystem<br />
components, causing lethal or sublethal negative effects. Categories of stressors include chemical (e.g., pollution),<br />
physical (e.g., extreme events), and biological (e.g., invasive species) stressors, and the relationship<br />
between key stressors and the threats discussed in this document are listed in Table 3.1. The relative importance<br />
of each threat varies substantially among jurisdictions and individual reefs.<br />
Table 3.1. This table is a crosswalk between the threats identified in “A National Coral Reef Action Strategy” (NOAA, 2002a) and the<br />
stressors identified by the National Science and Technology Council’s Committee on Environmental and Natural Resources. Source:<br />
CENR, 2001.<br />
STRESSORS POLLUTION INVASIVE<br />
SPECIES<br />
EXTREME<br />
EVENTS<br />
RESOURCE<br />
AND LAND USE<br />
CLIMATE<br />
CHANGE<br />
Climate Change and Bleaching X<br />
Diseases X<br />
Tropical Storms X<br />
Coastal Development and Runoff X X<br />
Coastal Pollution X<br />
Tourism and Recreation X<br />
Fishing X<br />
Trade in Coral and Live Reef Species X<br />
Ships, Boats and Groundings X<br />
<strong>Marine</strong> Debris X<br />
Aquatic Invasive Species X<br />
Security Training Activities X<br />
Offshore Oil and Gas Exploration X<br />
Multiple Stressors<br />
The occurrence of multiple sequential stressors and the synergistic interaction between stressors can be especially<br />
detrimental to coral reef ecosystems. For example, in many parts of the Caribbean, the compounding<br />
effects of eutrophication, decline of key herbivores from disease and overfishing, and impacts of hurricanes<br />
and coral bleaching have likely led to the observed shifts in community structure from coral-dominated to macroalgal-dominated<br />
reefs (Hughes, 1994; McManus et al., 2000). Generally, the effects of multiple stressors<br />
are poorly understood, making it difficult or even inappropriate to assign a single cause to local or regional<br />
1 NOAA Fisheries, Office of Habitat Conservation<br />
2 NOAA Oceans and Coasts, NCCOS, Center for Coastal Monitoring and Assessment, Biogeography Team<br />
3 NOAA Oceans and Coasts, National Centers for Coastal Ocean Science<br />
4 NOAA Satellites and Information, Coral Reef Watch Program<br />
5 NOAA Oceans and Coasts, Special Projects Office
The State of Coral Reef Ecosystems of the United States and Freely Associated States: <strong>2005</strong><br />
widespread decline. The challenge now is to understand the complex interactions among stressors by refining<br />
existing techniques and developing new multidisciplinary approaches aimed at detailing mechanisms and<br />
predicting effects at multiple spatial and temporal scales.<br />
Determining how humans utilize coral reef ecosystems and estimating the social and economic costs and benefits<br />
of those uses are key steps for resource managers. Techniques such as causal chain analysis (e.g., in<br />
Belausteguigoitia, 2004) may provide a useful approach for modeling and communicating the many significant<br />
cause-effect linkages between human systems and coral reef ecosystems.<br />
Climate Change and Coral Bleaching<br />
Climate change refers to any change in climate over time, whether due to natural variability or human activity<br />
(IPCC, 2001). Over the 20th century, mean near-surface air temperature over land and mean sea surface<br />
temperature (SST) increased 0.6 ± 0.2°C, with the 1990s being the warmest decade and 1998 being the<br />
warmest year since 1861 when instrumental records began (IPCC, 2001; Figure 3.1).<br />
Most of the observed warming over the last 50 years may have resulted from an increase in concentrations of<br />
greenhouse gases such as carbon dioxide (CO 2 ) and methane (CH 4 ) in the atmosphere (IPCC, 2001; NRC,<br />
2001). The atmospheric concentration of CO 2 has increased by 31% since the beginning of the industrial revolution,<br />
and represents a level that has not been exceeded in at least the last 420,000 years (Petit et al., 1999),<br />
and probably not exceeded in over 24 million years (Pearson and Palmer, 2000). The rate of increase of CO 2<br />
concentration has been about 0.4% per year over the last two decades (IPCC, 2001). Such increases have<br />
been shown to decrease the calcium carbonate (CaCO 3 ) saturation state of seawater and the calcification<br />
rates of corals (Kleypas et al., 1999; Feely et al., 2004). In combination with potentially more frequent bleaching<br />
episodes, reduced calcification<br />
could reduce the energy that a coral<br />
would otherwise apply to reproduction<br />
and thereby impede a reef’s ability to<br />
keep pace with sea level rise (IPCC,<br />
2001) or recover from other potential<br />
impacts of climate change.<br />
Elevated water temperatures cause<br />
corals to bleach, a process that is<br />
characterized by the loss of zooxanthellae<br />
(a symbiotic alga) from coral<br />
tissues. Increased ultraviolet irradiance,<br />
typically from unusually calm,<br />
clear waters, may aggravate the<br />
impact of increased temperatures<br />
(Lesser and Lewis, 1996). Although<br />
corals may recover from brief episodes<br />
of bleaching, if ocean temperatures<br />
warm too much or remain high<br />
for an extended period, bleached corals<br />
often will die. Several correlative<br />
field studies show a close association<br />
between warmer than normal conditions<br />
(at least 1°C higher than the annual<br />
maximum) and the incidence of<br />
bleaching (Hoegh-Guldberg, 1999).<br />
In 1997-1998, an estimated 16% of<br />
the world’s coral reefs were seriously<br />
damaged in a global coral bleaching<br />
event associated with high SST<br />
Temperature Anomalies (°C)<br />
Temperature Anomalies (°F)<br />
Figure 3.1. Mean global temperature anomalies over the period 1880-2001. Zero<br />
line represents the long term mean temperature throughout the period, while red and<br />
blue bars indicate annual departures from that mean. Source: NOAA’s National Climactic<br />
Data Center.<br />
Threats<br />
page<br />
13
Threats<br />
page<br />
14<br />
The State of Coral Reef Ecosystems of the United States and Freely Associated States: <strong>2005</strong><br />
which was apparently enhanced by an extreme El Niño event (Wilkinson, 1998). A U.S. Department of State<br />
report to the U.S. Coral Reef Task Force (USCRTF; Pomerance, 1999) concluded that the severity and extent<br />
of the 1998 event cannot be explained by El Niño alone, and that the “...geographic extent, increasing frequency,<br />
and regional severity of mass bleaching events are likely a consequence of a steadily rising baseline<br />
of marine temperatures...”<br />
Several bleaching events in Florida, the U.S. Caribbean, and the U.S. Pacific have been associated with elevated<br />
SST events during the 1980s and 1990s, and especially in 1997-1998. The occurrence of bleaching is<br />
highly variable in both time and space, but generally affects shallow-water reefs with reduced water circulation.<br />
In U.S. waters, substantial bleaching has been observed on shallow reefs off the coasts of Florida, the Commonwealth<br />
of the Northern Mariana Islands (CNMI), Palmyra Atoll (PRIAs), and portions of the Northwestern<br />
Hawaiian Islands (NWHI), and recent data suggest that elevated SST is still a significant threat to coral reefs<br />
in the U.S. Caribbean (Nemeth and Slakek-Nowlis, 2001). Palau suffered the worst coral bleaching mortality<br />
of any U.S. associated region during the 1997-1998 global bleaching event (Wilkinson, 2000). During a 2002<br />
Figure 3.2. 2002 Maximum annual DHW values indicate locations that experienced<br />
significant thermal stress, which has been shown to be highly correllated with coral<br />
bleaching. Values above 4 represent areas that are likely to experience bleaching,<br />
while values above 8 represent areas that are likely to experience significant bleaching<br />
with widespread mortality. Source: NOAA’s Coral Reef Watch Program.<br />
summertime warm water event in the<br />
higher latitudes of the mid-Pacific,<br />
Midway Atoll (NWHI) experienced<br />
unprecedented bleaching, including<br />
considerable mortality (Liu et al.,<br />
2004). Mass bleaching episodes are<br />
predicted to reoccur in the future with<br />
increasing frequency (IPCC, 2001).<br />
Coral reef ecosystem managers and<br />
stakeholders consistently use one<br />
particular satellite-derived index–the<br />
Degree Heating Week (DHW)–to<br />
gauge accumulated thermal stress on<br />
reef ecosystems. The DHW, which<br />
was developed by scientists in the<br />
National Oceanic and Atmospheric<br />
Administration’s (NOAA) Coral Reef<br />
Watch (CRW) Program, represents<br />
the accumulated temperature stress<br />
for each 50 x 50 km 2 pixel during the<br />
preceding 12-week period as compared to the baseline value calculated for that pixel. The unique baseline<br />
value, roughly equal to the expected annual maximum temperature, was empirically determined for each of<br />
the 250 km 2 pixels shown in Figure 3.2. To calculate the DHW, temperature deviations (in degrees Celsius)<br />
above this baseline are multiplied by the duration of the elevated temperature event (in weeks). For example,<br />
if there is a sustained SST of 1°C above the threshold for one week , during a 12-week period, the DHW value<br />
will be one; if SST is 2°C above the threshold for three weeks, the DHW value will be six. Figure 3.2 illustrates<br />
the distribution of the maximum DHW values for each pixel for 2002.<br />
In-situ observations show that widespread bleaching is most likely to occur at locations where DHW≥4; significant<br />
bleaching with widespread mortality is expected where the DHW >8. Table 3.2 shows the maximum annual<br />
DHW value in the 14 U.S. jurisdictions with coral reefs for 2001-2003. The DHW values are color-coded<br />
to reflect the intensity of accumulated thermal stress [Blue, DHW=0; Green, DHW 8]. If a thermal stress event spans two calendar years (e.g., November-January), then the maximum<br />
DHW for each of those years may occur during that single event. This is most likely to occur at reefs<br />
located near the equator. Such occurrences are shown in Table 3.2 as DHW values enclosed in a grey box.<br />
The CRW Program utilizes satellite and in situ tools for near real-time, hindcast, and long-term monitoring,<br />
modeling, and reporting of environmental conditions that affect domestic and foreign coral reef ecosystems.<br />
A full list of the CRW Program’s operational products can be found on-line at http://coralreefwatch.noaa.gov<br />
(Accessed 2/16/05).
The State of Coral Reef Ecosystems of the United States and Freely Associated States: <strong>2005</strong><br />
Table 3.2. Maximum annual DHWs for each of the 14 jurisdictions for 2001-2003. The DHW values are color-coded to reflect the<br />
intensity of accumulated thermal stress [Blue, DHW=0; Green, DHW8]. If a thermal stress event<br />
spans two calendar years (e.g., November-January), then the maximum DHW for each of those years may occur during that single<br />
event. Such occurrences are shown by enclosing the DHW values in a grey box.<br />
JURISDICTION LOCATION 2001 2002 2003 JURISDICTION LOCATION 2001 2002 2003<br />
USVI<br />
Kingman<br />
Puerto Rico Baker<br />
USPRIAs<br />
Navassa Wake<br />
(cont.)<br />
Florida Jarvis<br />
Flower Garden<br />
Banks<br />
Hawaii<br />
Northwestern<br />
Hawaiian<br />
Islands<br />
American<br />
Samoa<br />
USPRIAs<br />
Hawaii<br />
Howland<br />
Bikini<br />
Marshall<br />
Oahu Kwajalein<br />
Islands<br />
Kauai Majuro<br />
Nihoa<br />
French<br />
Frigate<br />
Shoals<br />
Federated<br />
States of<br />
Micronesia<br />
Yap<br />
Chuuk<br />
Maro Reef Pohnpei<br />
Lisianski Kosrae<br />
Midway<br />
Asuncion<br />
Kure Agrihan<br />
CNMI<br />
Tutuila Pagan<br />
Rose Atoll Saipan<br />
Johnson Guam<br />
Palmyra Palau<br />
Threats<br />
page<br />
15
Threats<br />
page<br />
16<br />
The State of Coral Reef Ecosystems of the United States and Freely Associated States: <strong>2005</strong><br />
Diseases in Coral Reef Ecosystems<br />
In the past two decades, there has been a worldwide increase in the reporting of diseases affecting marine<br />
organisms, with the Caribbean Basin emerging as a hot spot (Harvell et al., 1999). The first documented coral<br />
reef epizootic was the mass mortality of the keystone herbivore, Diadema antillarum, which was caused by an<br />
unknown waterborne pathogen (Figure 3.3). This disease spread throughout the Caribbean between 1982<br />
and 1983, moving with Caribbean oceanic currents and causing the loss of up to 90-95% of the Diadema population<br />
(Lessios et al., 1984). Mass<br />
mortalities of Diadema have contributed<br />
to phase-shifts from coral- to<br />
algal-dominated reefs in many locations,<br />
and the recovery of urchin<br />
populations has been slow. Another<br />
Caribbean-wide epizootic observed<br />
during the 1980s was attributed to a<br />
fungal infection in Thalassia testudinum<br />
seagrasses. In Florida Bay, an<br />
estimated 4,000 ha of seagrasses<br />
were lost and severe declines were<br />
observed across an additional 23,000<br />
ha (Roblee et al., 1991). During one<br />
of the best documented of coral disease<br />
outbreaks which occurred in<br />
the 1980s, two of the dominant reef-<br />
building coral species on shallow<br />
western Atlantic reefs (Acropora palmata<br />
and A. cervicornis) were virtually<br />
eradicated by white-band disease<br />
(Aronson and Precht, 2001). The frequency<br />
and severity of outbreaks of<br />
common as well as newly emerging<br />
diseases may increase with changing<br />
Figure 3.3. Coral disease and mortality from numerous pathogens have been reported<br />
with increased frequency since the 1970s. Disease in other ecosystem organisms<br />
can also result in cascading effects that can disrupt the entire system. Scientists<br />
believe that ~90% of the Caribbean population of Diadema antillarum, an important<br />
herbivore, was killed by disease in the late 1980s, and the subsequent reduction in<br />
grazing pressure allowed for algal overgrowth on many reefs. Populations are beginning<br />
to rebound as shown in this photo taken in St. Croix in October 2004. Photo: R.<br />
Clark.<br />
environmental conditions such as a rise in SST and anthropogenic impacts that: 1) increase the prevalence<br />
and virulence of pathogens; 2) facilitate invasions of new pathogens from terrestrial or aerial sources; and 3)<br />
reduce host resistance and resilience, thereby facilitating pathogen transmission and infection (Sutherland et<br />
al., 2004).<br />
Since the early 1990s, scientists have documented a rapid emergence of diseases among corals, with increases<br />
in the number of diseases reported, coral species affected, geographic extent, prevalence and incidence,<br />
and rates of associated coral mortality (Richardson, 1998; Harvell et al., 1999; Knowlton, 2001;<br />
Sutherland et al., 2004). A survey of the coral disease literature conducted by Green and Bruckner (2000)<br />
described 29 differently named diseases on 102 scleractinian coral species. At least 12 new syndromes have<br />
been reported in recent years, with a dramatic increase in observations from the Indo-Pacific. More than 150<br />
scleractinian, gorgonian, and hydrozoan zooxanthellate species are now known to be susceptible to diseases<br />
(Sutherland et al., 2004). Despite an increase in coral disease research, the understanding of the causative<br />
agents, host-pathogen interactions, and impacts on host populations and associated communities is still very<br />
limited (Richardson, 1998; Harvell et al., 1999; Sutherland et al., 2004). For instance, microbial pathogens<br />
have been isolated, identified, and defined as the causative agent in only five diseases; while several other<br />
putative pathogens have been reported, it is unclear whether these are the cause or merely opportunistic infections<br />
(Bythell et al., 2002; Sutherland et al., 2004).<br />
Diseases directly and indirectly alter reef community structure and function, and are considered to be playing<br />
an increasingly important role in regulating coral population size, diversity, and demographic characteristics<br />
(Porter and Tougas, 2001; Aronson and Precht, 2001; Bruckner, 2004). For example, the Caribbean-wide loss<br />
of Acroporid corals, the two dominant space occupants and most important framework builders in reef crest
The State of Coral Reef Ecosystems of the United States and Freely Associated States: <strong>2005</strong><br />
and forereef habitats, is the leading cause of the decline in coral cover in the Caribbean reported during the<br />
1980s and 1990s (Richardson and Aronson, 2002). Coring studies from Belize and other locations revealed<br />
that mass mortalities at this scale had not occurred in at least the previous 3,000-4,000 years (Aronson et al.,<br />
2004). More recently, Montastraea annularis complex populations are experiencing significant declines as<br />
a result of multiple diseases including black-band disease, yellow-band disease, and white plague (Santavy<br />
et al., 1999; Kuta and Richardson, 2002; Gill-Agudelo and Garzon-Ferriera, 2001; Richardson and Aronson,<br />
2002; Bruckner and Bruckner, 2003, 2004).<br />
Understanding the relationships between coral health and environmental parameters is of key importance in<br />
the study of coral disease (Harvell et al., 1999; Green and Bruckner, 2000; Kuta and Richardson, 2002). Environmental<br />
stressors, including those associated with degraded water quality and climate change, are often<br />
cited as potential factors causing coral mortality, yet rarely have studies adequately identified causal linkages<br />
to specific environmental stressors (Woodley et al., 2003). In addition, human activity may enhance the<br />
global transport of pathogens, such as Aspergillus sydowii (a fungus of terrestrial origin) that causes infection<br />
and mortality in sea fans and other gorgonians, and is postulated to have entered the marine environment<br />
via terrestrial runoff or clouds of dust from West Africa (Harvell et al., 1999; Richardson and Aronson, 2002).<br />
White pox, a disease only known to affect Acropora palmata in Florida, is caused by a common fecal enterobacterium<br />
Serratia marcescens, which may enter the marine environment via sewage discharge (Patterson<br />
et al., 2002). Other diseases are thought to be caused by known microorganisms that have changed hosts<br />
or exhibited increased virulence in response to environmental stresses and reduced resistance of the host<br />
coral (Santavy and Peters, 1997; Harvell et al., 1999; Sutherland et al., 2004). At least four coral diseases<br />
(black-band disease, white plague, dark-spots disease, and Aspergillosis) are associated with high water<br />
temperatures (Kuta and Richardson, 1996; Bruckner et al., 1997; Richardson et al., 1998; Gill-Agudelo and<br />
Garzon-Ferriera, 2001; Alker et al., 2001). Nutrient input, sedimentation, and runoff have also been implicated<br />
as potential contributing factors in the initiation and elevated virulence of a disease, although few quantitative<br />
data have been published (Bruckner et al., 1997; Harvell et al., 1999; Kim and Harvell, 2001; Richardson and<br />
Aronson, 2002).<br />
It appears that the ability of corals and other organisms to withstand infection has been compromised by<br />
climate change, eutrophication, sedimentation (Rogers, 1990), and other human-induced ecosystem perturbations<br />
(Knowlton, 2001). The vulnerability of tropical coral reef ecosystems is related to the fact that many<br />
warm water corals grow slowly and persist only within a narrow range of light, temperature, dissolved oxygen<br />
and salinity fluctuations, and, in an evolutionary sense, they are thought to have a limited ability to recover<br />
from disease (Knowlton, 2001). However, the relative importance of anthropogenic influences is still unclear,<br />
especially since disease outbreaks are being reported with increasing frequency on reefs that exist in areas<br />
relatively far from the direct effects of human activity (Bruckner and Bruckner, 2004).<br />
A decline in the health of many coral reefs worldwide has created an urgent need for multidisciplinary studies<br />
of coral health and disease, with emphases on coral physiology, biology, and disease etiology, including mechanisms<br />
of resistance and susceptibility to disease, factors affecting the transmission, spread and virulence of<br />
pathogens, and relationships between environmental factors and disease. By better understanding causative<br />
agents and factors responsible for the emergence and proliferation of diseases, scientists will be able to contribute<br />
to the development of strategies that can be used by resource managers to mitigate disease impacts.<br />
Tropical Storms<br />
Most coral reef environments are found in tropical climates and periodically experience cyclonic storm events.<br />
Cyclonic storms are an important process in the structure and dynamics of coral reef ecosystems (Hughes and<br />
Connell, 1999). They are classified as “pulse disturbances” since they are typically intense and of relatively<br />
short duration, yet are a powerful mechanism for change and can dramatically disrupt ecosystems, communities,<br />
population structure, resource availability, and the physical environment (Pickett and White, 1985).<br />
Coral reefs, however, are often located in dynamic regions of the ocean and have clearly shown resilience to<br />
historical bouts of disturbance. In fact, such disturbances are thought to maintain high species diversity, particularly<br />
when the disturbance alters the structure of the reef by opening up bare substratum, thereby creating<br />
Threats<br />
page<br />
17
Threats<br />
page<br />
18<br />
The State of Coral Reef Ecosystems of the United States and Freely Associated States: <strong>2005</strong><br />
space available for the settlement of new coral recruits (planulae). The influence of disturbance in community<br />
structure and dynamics has been illustrated by the intermediate disturbance hypothesis, which states that the<br />
highest number of species in a community will occur at intermediate levels (frequency and size) of natural<br />
disturbance. Lower diversity will exist where disturbances are either very large or very small, or very frequent<br />
or very infrequent (Connell, 1978, 1979). The size of the new space also influences the type of recruitment.<br />
Small patches are usually colonized by the nearest dominant species, while larger areas provide an opportunity<br />
for less dominant species to establish. Interestingly, many Caribbean corals release planulae in late summer/early<br />
fall, which coincides with the hurricane season in the Atlantic, and this may enhance recolonization<br />
(Rogers, 1993).<br />
The effect of storms is strongly dependent on the ecology and geology of a specific area and the characteristics<br />
of the storm. For instance, a wide range of reef-specific variables influence the magnitude of the impact<br />
including spatial location, community structure, coral age, size, morphology, and reef depth. Variables associated<br />
with the storm itself include the path of the storm and its strength (measures of wind velocity and wave<br />
height), and heavy rain can cause excessive runoff as well as localized decreases in salinity which have been<br />
linked to a reduction in the planulae production (Figure 3.4; Jokiel, 1985). Some species of corals exhibit<br />
a growth form that is more robust to<br />
storm energy than others (e.g., boulder<br />
shapes). In contrast, corals with<br />
fragile skeletons and typically those<br />
with branching morphology will be<br />
more easily damaged by extreme<br />
wave action. In the Caribbean, Acropora<br />
palmata and Acropora cervicornis<br />
are very susceptible to storm<br />
damage (Brown, 1997). Breakages<br />
may be advantageous to these species<br />
since they produce relatively<br />
few larvae and instead are thought<br />
to rely primarily on asexual reproduction<br />
through fragmentation to produce<br />
new colonies (Bak and Engel,<br />
1979; Hughes, 1985). Furthermore,<br />
delayed mortality from outbreaks of<br />
disease among injured corals, bioerosion<br />
of damaged skeleton, and<br />
altered predator-prey relationships<br />
may occur for years after a hurricane<br />
has struck (Knowlton et al., 1990).<br />
Figure 3.4. Hurricane Georges, a category 3-4 storm hit the USVI, Puerto Rico,<br />
and the Florida Keys in September, 1998. Damage included the physical breakage<br />
of corals and a massive pulse of sediment and nutrients that were discharged into<br />
nearshore waters. Georges was one of four hurricanes in progress in the Caribbean<br />
at the time. Photo: NASA and NOAA, http://rsd.gsfc.nasa.gov/rsd/images/Georges.<br />
html, Accessed 2/10/05.<br />
Age is another factor that influences the ability of a coral colony to withstand the mechanical stresses of large<br />
storms. As corals grow, they become more vulnerable to breakage and dislocation (Brown, 1997). The majority<br />
of wave impacts occur in the shallowest (0-20 m) depth range, so corals at greater depths are generally<br />
less directly impacted. Deeper corals, however, can be significantly damaged indirectly by large blocks that<br />
tumble down from shallower waters (Brown, 1997). Damage to corals can indirectly impact other reef-associated<br />
organisms through the reduction of coral cover and topographic complexity which influence biological<br />
interactions such as predation, succession, and competition. As coral cover is reduced, the refuge function for<br />
many fish and invertebrates is diminished. Also the removal of organisms from substrate via scouring reduces<br />
the abundance of food available for some species. In addition, increases in turbidity and sedimentation that<br />
often accompany storms can affect the emergent community by impairing photosynthesis and feeding, and<br />
limiting sexual reproduction (Kojis and Quinn, 1985).<br />
The direct effects of cyclones on fish are size-specific. Lassig (1983) noted that during the final stages of Cyclone<br />
Peter, many fish that were normally associated closely to the benthos were found in the water column
The State of Coral Reef Ecosystems of the United States and Freely Associated States: <strong>2005</strong><br />
and some had fresh wounds. This suggests that fish try to weather the storm in the water column, where they<br />
are less likely to be injured. It was also noted that after the storm, overall fish abundance decreased significantly,<br />
with juveniles sustaining higher mortality than adults due to strong storm-driven currents.<br />
To understand how a cyclonic storm affects a reef requires examination of the recovery patterns and processes.<br />
Detailed comparative investigations of pre- and post-hurricane coral reef ecosystems that include variables<br />
such as amount of coral, number of species, settlement characteristics and growth rates, and nutrient<br />
cycling may provide valuable insights. Multiple year trends using continuous monitoring data, however, are<br />
likely to provide the most accurate assessment of both short- and longer-term impact and recovery (Hughes<br />
and Connell, 1999). The trajectory and rate of recovery will be influenced by a number of interacting factors<br />
including the rates of recruitment, species involved, and sequence of colonization (Brown, 1997). Research<br />
also suggests that anthropogenic impacts can interfere with the recovery process. Finally, separating storm<br />
effects from those caused by direct human activity and phenomena such as coral bleaching and competition<br />
with algae, is problematic due to the level of degradation of some reef systems (Brown, 1997).<br />
The terms “hurricane” and “typhoon” are regionally specific names for a strong tropical cyclone. This report<br />
follows the geographically-specific naming convention recognized by NOAA (i.e., NOAA Research’s Hurricane<br />
Research Division, http://www.aoml.noaa.gov/hrd/tcfaq/A1.html, Accessed 01/07/05) whereby the term “hurricane”<br />
applies to the North Atlantic Ocean, Northeast Pacific Ocean east of the dateline, and South Pacific<br />
Ocean east of 160E; “typhoon” applies to the Northwest Pacific Ocean west of the dateline; “cyclone” applies<br />
to the Southwest Pacific Ocean west of 160E and Southeast Indian Ocean east of 90E. The characteristics<br />
of storm and hurricane categories are given in Table 3.3.<br />
Table 3.3. The Saffir-Simpson scale for tropical storm and hurricane classification and associated storm characteristics provide a<br />
consistent way to characterize major storm events. na=not applicable. Source: NOAA National Hurricane Center.<br />
SAFFIR-SIMPSON SCALE FOR HURRICANE CLASSIFICATION<br />
Storm Type Category Wind Speed (kts) Wind Speed (mph) Pressure (millibars) Damage Potential<br />
Tropical Depression na 20-34 kts 23-39 mph 1007 mb na<br />
Tropical Storm na 35-64 kts 39-74 mph 1006-1000 mb na<br />
Hurricane 1 65- 82 kts 74- 95 mph 980-999 mb minimal<br />
Hurricane 2 83- 95 kts 96-110 mph 965-979 mb moderate<br />
Hurricane 3 96-113 kts 111-130 mph 945-964 mb extensive<br />
Hurricane 4 114-135 kts 131-155 mph 920-944 mb extreme<br />
Hurricane 5 >135 kts >155 mph 919 mb catastrophic<br />
Coastal Development and Runoff<br />
In the past several decades, there has been a well-documented demographic shift toward higher concentrations<br />
of human settlement in the coastal zones of many countries including the U.S. (Culliton et al., 1990;<br />
Figure 3.5). More than half of the U.S. population now lives in coastal counties, a trend that is expected to<br />
continue to increase (Pew Oceans Commission, 2003; Cicin-Sain et al., 1999). This trend has increased the<br />
frequency and magnitude of impacts from activities such as the construction of residential developments,<br />
hotels and resorts, recreational facilities, and infrastructure such as roads and wastewater treatment plants<br />
(WWTPs).<br />
Terriginous sediments in runoff from construction sites and roads are often a major threat to nearshore areas.<br />
Dredging of nearshore sediments for marina facilities, ship access and navigation, beach nourishment, and<br />
building materials can introduce significant quantities of particulate matter into the water column. While strong<br />
currents tend to dissipate some of the added sediments, nearshore areas with gentle slopes and low flushing<br />
rates tend to accumulate sediments, which can have detrimental effects on sessile invertebrates like corals<br />
(Rogers, 1990). Physical smothering may be the most obvious effect of sedimentation. Although most corals<br />
have some ability to rid themselves of foreign particles, the removal of sediments requires the diversion<br />
of energy from vital activities such as reproduction and feeding. The negative effects of the accumulation of<br />
Threats<br />
page<br />
19
Threats<br />
page<br />
20<br />
The State of Coral Reef Ecosystems of the United States and Freely Associated States: <strong>2005</strong><br />
Guam and<br />
Southern<br />
Islands of<br />
CNMI<br />
Main Hawaiian<br />
Islands<br />
American<br />
Samoa<br />
Southern<br />
United States<br />
Puerto Rico and the<br />
U.S. Virgin Islands<br />
Figure 3.5. Coastal population change between 1990 and 2000 and associated development pressure pose a significant threat to<br />
coral reef ecosystems, particularly in island jurisdictions with limited land area. Maps not drawn to scale. Maps: K. Buja. Data: U.S.<br />
Census, 1990, 2000; Secretariat of the Pacific Community, http://www.spc.org.nc/prism, Accessed 2/15/05.<br />
sediments on corals can be exacerbated by wave action that repeatedly resuspends sediments into the water<br />
column (Rogers, 1990). Increased turbidity in the water column, whether episodic or chronic, reduces light<br />
availability for photosynthesis and growth. Increases in nearshore sediment loads have been shown to affect<br />
morphology of corals and gorgonians as well as inhibit the development and recruitment of coral larvae (Rogers,<br />
1990). Coral species react differently to this stressor, and coral reefs in waters experiencing increased<br />
turbidity may exhibit a shift in community composition toward greater dominance of corals that are more tolerant<br />
of lower light levels and better adapted to remove sediments.<br />
Alteration of watersheds and associated changes in vegetative cover often decrease the ability of the land to<br />
absorb rainfall, which flows through streams and channels, carrying sediments and pollutants into nearshore<br />
areas. Generally, runoff from developed watersheds carries higher sediment loads than from undeveloped<br />
areas, and this is more pronounced in areas where the topography is characterized by steep slopes. Removal<br />
of mangrove forests that normally trap sediments may allow a greater proportion of terriginous sediments to<br />
reach reef ares.<br />
In addition to sediments, runoff from developed watersheds tends to have higher concentrations of waste<br />
products. Increased freshwater inputs are actually considered pollutants as they can decrease the salinity<br />
levels in some nearshore areas. Other contaminants derived from human use of nearshore areas include oil<br />
leaking from vehicles, pesticides and lawn fertilizers applied to yards, parks and golf courses, chemicals in<br />
asphalt that wash off roads, excrement from livestock and domesticated animals, and litter.
The State of Coral Reef Ecosystems of the United States and Freely Associated States: <strong>2005</strong><br />
The development of infrastructure is also a major concern. In many areas, coastal development often occurs<br />
without a commensurate improvement in the wastewater infrastructure, and existing systems cannot<br />
adequately accommodate the added burden. As a result, untreated or partially-treated sewage overflows into<br />
nearshore areas. Outside of urban areas, many homeowners are not able to access WWTPs and often must<br />
rely on septic tanks, which are subject to corrosion and leakage. The hard-to-detect leaks often allow untreated<br />
sewage to seep into groundwater and nearshore waters. A recent report (Carter and Burgess, Inc., 2002)<br />
assessing the sustainability of tourism in Hawaii noted that many of the island’s municipal wastewater systems<br />
are nearing capacity. While most new developments have private WWTPs to satisfy permit conditions, many<br />
residents still rely on private systems, such as septic tanks, which are in various stages of disrepair. Though<br />
they considered myriad aspects of tourism, the authors of the study contend that such nonpoint source pollution<br />
is “one of Hawaii’s greatest environmental threats” (Carter and Burgess, Inc., 2002).<br />
Other infrastructural issues include the problems of adequate waste disposal and the construction of docks<br />
and piers that can result in habitat loss. In summary, coastal development presents a wide range of challenges<br />
for coastal areas, especially in terms of the number and scale of construction projects, capabilities of<br />
infrastructure, intensity and type of land use, and increases in sedimentation and pollution levels.<br />
Coastal Pollution<br />
Worldwide, the threat to coral reef ecosystems from pollution is surpassed in severity only by coral bleaching<br />
and fishing (Spalding et al., 2001). Model estimates indicate 22% of the world’s coral reef ecosystems<br />
are threatened by land-based pollution and soil erosion (Bryant et al., 1998). Pollution often desensitizes<br />
the ecosystem, so that it becomes more susceptible to other stressors such as climate change, disease, and<br />
invasive species. The primary stressors from land-based sources are nutrient and chemical pollution from<br />
fertilizers, herbicides, pesticides, human-derived sewage, and increased amounts of sediment from coastal<br />
development and storm water runoff. Other pollutants, such as heavy metals and oil, can also be prominent<br />
at specific locations.<br />
This section focuses on point source pollution. Point sources of pollution originate from confined or discrete<br />
conveyances, such as a pipe, tunnel, ditch, channel, well, or fissure. Examples of point source pollution include<br />
sewage outfalls, factory wastewater, and dumping of chemicals. Household chemicals and untreated<br />
industrial wastewater may also be discharged into the domestic wastewater stream. Finally, short outfalls<br />
contribute to the pollution of nearshore waters. Other point sources include vessels without holding tanks that<br />
discharge their wastes in marinas and nearshore coastal areas. Dredging for shipping lanes, marinas, and<br />
coastal construction projects resuspends sediments that increase turbidity and decrease coral reef ecosystem<br />
productivity. Industrial point sources include manufacturing operations, effluent discharges, accidental<br />
oil spills and the release of contaminants discharged as a byproduct of oil-drilling (e.g., toxic poly-aromatic<br />
hydrocarbons (PAHs), benzene, ethylbenzene, xylene) and heavy metals, such as lead, copper, nickel and<br />
mercury.<br />
Direct impacts of pollutants include reduced recruitment, loss of biodiversity, altered species composition (a<br />
shift from predominantly phototrophic to heterotropic fauna), and shallower depth distribution limits. Sewage<br />
pollution causes nutrient enrichment around population centers, treatment facilities, and sewage outfalls.<br />
Increased nutrient concentrations promote increased algal and bacterial growth, can degrade seagrass and<br />
coral reef ecosystems, and ultimately may decrease fisheries production. Sediments smother benthic organisms,<br />
which can become diseased when exposed to dredged sediments contaminated with toxic heavy metals<br />
and organic pollutants. Toxic chemicals can decrease coral reef ecosystem productivity and biodiversity and<br />
increase human health risks through food contamination.<br />
Management actions by NOAA to address water quality concerns are taken in partnership with the Environmental<br />
Protection Agency (EPA), the Department of Agriculture, and local or state governments. Research is<br />
needed to understand how coral reef ecosystems respond to poor water quality, and to provide mangers with<br />
tools to detect, assess, and remedy negative impacts from pollution. Therefore, the sources of the substances<br />
that adversely affect water quality must be identified, and relevant policies and control strategies for limiting<br />
pollutants must be developed and validated. Monitoring pollutants in highly polluted or “at risk” areas can alert<br />
managers to changes in pollutant inputs and impacts. To be most useful, results from pollution monitoring<br />
Threats<br />
page<br />
21
Threats<br />
page<br />
22<br />
The State of Coral Reef Ecosystems of the United States and Freely Associated States: <strong>2005</strong><br />
programs should be integrated into modeling efforts that quantify the relative amounts of natural and anthropogenic<br />
inputs to ecosystems Additionally, monitoring results should be used to develop models and indicators<br />
that assess threats or identify stressors causing coral reef ecosystem decline.<br />
Tourism and Recreation<br />
Tourism and recreation are by far the fastest growing sector of coastal area economies. This growth is predicted<br />
to continue as incomes rise, more Americans retire, leisure time expands and accessibility to the coasts and<br />
oceans increases (U.S. Commission on Ocean Policy, 2004). Coral reefs, in particular, have a major economic<br />
value. Cesar et al. (2002) calculated that the greatest contribution to the annual value of coral reefs in Hawaii<br />
is tourism and recreation, which brings in $304 million per year. Coastal tourism contributes $9.9 billion to the<br />
Californian economy annually and is considered the largest sector of the “ocean industry” compared with $6<br />
billion/year for ports, $860 million/year for offshore oil and gas development, and $550 million/year for fisheries<br />
and mariculture (Wilson and Wheeler, 1997; Cicin-Sain and Knecht, 2000). Travel and tourism are estimated<br />
to have provided $746 billion annually to the U.S. gross domestic product (GDP), making travel and tourism<br />
the second largest contributor to GDP (Houston, 1995). Tourism is particularly significant in many Caribbean<br />
and Pacific islands surrounded by coral reef ecosystems. In the Florida Keys alone, over four million tourists<br />
purchase about $1.2 billion in services annually. Over three million tourists visit at least one of Hawaii’s coral<br />
reef sites per year, and approximately 90% of new economic development in Guam and the CNMI is related<br />
to coastal tourism (NOAA, 1997). The vast demand for tourism and recreational services associated with<br />
coral reefs generates considerable income for many local communities. Those who engage in reef-related<br />
recreational activities purchase goods and services, such as charter boats and diving trips via dive centers. In<br />
addition, they spend money on lodging, travel, food and beverages, etc. English et al. (1996) estimate an annual<br />
economic impact of $1.2 billion in visitor spending in the Florida Keys which results in a total sales impact<br />
of $1.3 billion, $506 million in income, and over 33,000 jobs. Leeworthy and Wiley (1997) estimate an annual<br />
economic impact of $94.3 million in resident spending in the Florida Keys, resulting in a total sales impact of<br />
$105.6 million and supporting over 2,400 jobs. Cesar et al. (2002) estimated that recreational use values in<br />
Hawaii represent 85% of annual benefits accrued from coral reefs (the others being amenity/property values,<br />
biodiversity, fisheries, and educational spillover), which amount to $304.16 million/year. In southeast Florida,<br />
the annual use value accrued from coral reefs is estimated at $229.3 million (Johns et al., 2003).<br />
Human uses of coral reefs are both direct and indirect, with recreation and tourism among the most prominent<br />
uses. Recreational activities on U.S. coral reefs include snorkeling, scuba diving, boating, fishing, and<br />
shell-collecting. The intensity of each activity varies widely from region to region, but can be considerable<br />
in some areas. In southeast Florida, residents and visitors spent 28 million person-days using artificial and<br />
natural reefs during a 12 month period<br />
(June 2000 to May 2001) and<br />
4.94 million person-days snorkeling<br />
and scuba diving (Johns et al., 2003;<br />
Figure 3.6). Water-based activities<br />
such as scuba diving are increasing<br />
in popularity, and over 3 million people<br />
are currently certified to dive in<br />
the U.S. Scientific studies have now<br />
shown that divers and snorkelers can<br />
have a significant negative impact on<br />
coral reefs in terms of physical damage<br />
and a concomitant reduction in<br />
their aesthetic appeal (Hawkins and<br />
Roberts, 1993; Hawkins et al., 1999;<br />
Rouphael and Inglis, 2001). For example,<br />
a snorkeling trail created in<br />
the Virgin Islands National Park’s<br />
Trunk Bay in the 1960s had deteriorated<br />
substantially when observed in<br />
Figure 3.6. Some reef areas in the Florida Keys may have hundreds of visitors per<br />
day. Photo: Bill Harrigan.
The State of Coral Reef Ecosystems of the United States and Freely Associated States: <strong>2005</strong><br />
1986 with visitor numbers estimated at over 170,000 per year. Only 10 of 50 tagged Elkhorn coral colonies remained<br />
undisturbed during a seven-month period of observation (Rogers et al., 1988). Plathong et al. (2000)<br />
examined the effects of snorkelers using self-guided interpretative trails around a reef within the Great Barrier<br />
Reef <strong>Marine</strong> Park, Australia and found that despite comparatively low levels of use (approximately 15 snorkelers<br />
per trail per week), snorkelers caused significant damage to corals along the trails. Hawkins et al. (1999)<br />
examined the impacts of diving on a reef off the Caribbean island of Bonaire and concluded that impacts would<br />
be minimized by maintaining a site carrying capacity of between 4,000 and 6,000 dives per year. In contrast,<br />
Rouphael and Inglis (2002) suggested that management actions should focus on identifying and mitigating the<br />
causes of damaging behavior rather than setting numerical limits to site use.<br />
Concern has also been directed at the activity of fish-feeding. Feeding fishes negatively impacts both fishes<br />
and habitat in several ways including: (1) fish consume food that is very different to their normal diets; 2) the<br />
concentration of fish at feeding stations disrupts normal distribution/abundance patterns; (3) fish behavior<br />
changes with some individuals or aggregations exhibiting abnormal aggression; and (4) inputs of nutrients<br />
and incidental damage to benthic structure can result in an increase of macroalgae (Perrine, 1989; Alevizon,<br />
2004).<br />
In addition to these direct threats, indirect threats can be equally, if not more devastating to coral reefs. Indirect<br />
threats include development of hotels and resorts, construction of the infrastructure needed to support<br />
such resorts, seafood consumption, beach replenishment, construction of airports and marinas, as well as the<br />
operation of cruise ships. The impacts resulting from these activities include increased sedimentation, nutrient<br />
enrichment, pollution, exploitation of endangered species, and increased litter and waste (UNEP, 2002).<br />
Mitigation of the impacts of tourism often involves education and raising awareness with the goal of behavioral<br />
change (UNEP, 2002). In Hawaii, a strategy for both defining a carrying capacity and influencing visitor behavior<br />
through education has been implemented. Oahu’s Hanauma Bay Nature Preserve in Hawaii has an<br />
estimated three million visitors annually and 13,000 per day in the high season. Impacts at Hanauma Bay,<br />
including widespread trampling of reefs and resuspension of sediments, fish-feeding, littering, and other pollution,<br />
prompted a management strategy to limit visitor numbers (NOAA CSC, 2004). Determining the carrying<br />
capacity for this area was critical to its long-term sustainability and was supported by the development of an<br />
education center aimed at influencing visitor behavior (Cesar et al., 2002).<br />
Clearly, tourism is a major source of economic welfare and livelihood for many coastal communities. Unfortunately,<br />
detrimental side effects and physical damage often result from direct visitor activity and the development<br />
of facilities to support tourism. Without long-term planning for tourist activities at these fragile sites,<br />
both resourcse and revenues are at risk. Sites such as Hanauma Bay Nature Preserve have had to make<br />
operational adjustments and offer education and instruction to visitors. Managers are increasingly challenged<br />
to develop strategies that mitigate unsustainable usage, while continuing to support the tourism industry.<br />
Fishing<br />
Coral reefs and associated habitats support important commercial and recreational fisheries. Over 4,000 species<br />
of fishes (>25% of all marine fishes) inhabit shallow coral reefs (Spalding et al., 2001), along with a large<br />
number of marine plants and invertebrates – many of which are exploited for human use. Coral reef fisheries<br />
support and sustain communities by providing food and sources of income. Fishing also plays a central<br />
social and cultural role in many island communities. Coral reef fisheries are generally small-scale, but coral<br />
reef fishers exploit hundreds of species of fishes and invertebrates using a wide variety of fishing gear. In a<br />
number of U.S. reef areas, recreational fishery catch now equals or exceeds the commercial catch. The rich<br />
biodiversity of coral reefs also supports a valuable marine aquarium industry, especially in Hawaii and Florida,<br />
and provides materials for a range of natural products developed by the biotechnology and pharmaceutical<br />
industries.<br />
Unfortunately, these fishery resources and the ecosystems that support them are under increasing threat<br />
from overfishing and fishery-associated impacts on habitats and ecosystems. Fishery-related impacts include:<br />
1) direct overexploitation of fish, invertebrates, and algae for food and the aquarium trade; 2) removal of a<br />
Threats<br />
page<br />
23
Threats<br />
page<br />
24<br />
The State of Coral Reef Ecosystems of the United States and Freely Associated States: <strong>2005</strong><br />
species or group of species which can impact multiple trophic levels; 3) by-catch and mortality of non-target<br />
species; and 4) physical impacts to reef environments associated with fishing techniques, fishing gear, and<br />
anchoring of fishing vessels.<br />
Overfishing<br />
Overfishing, along with pollution and global climate change, is generally considered to be one of the greatest<br />
threats to the health of coral reefs. It is also the most widespread threat, estimated to be of medium or<br />
high threat to over 35% of the world’s reefs (Bryant et al., 1998). In many cases, significant depletion of reef<br />
resources (especially large fishes and sea turtles) had already occurred before 1900 (Jackson et al., 2001;<br />
Pandolfi et al., 2003). Since then, increases in coastal population, improved fishing technology, and overcapitalization<br />
of fishing fleets driven by demand from rapidly growing export markets have greatly accelerated<br />
resource depletion. Many reef fishes have relatively slow growth rates, late maturity, and irregular recruitment<br />
- characteristics that make overexploitation more likely. The trend is for high-value or vulnerable resources<br />
– generally large predators such as groupers, jacks and sharks – to be removed first, and then target species<br />
further down the food chain are subsequently fished (Pauly et al., 1998).<br />
Overfishing has been identified as a major concern in all U.S. states and territories with coral reefs and has<br />
been identified by the USCRTF as a priority reason for the development of local action strategies. In most cases,<br />
the large number of species in these multi-gear, small-scale fisheries has made it impractical to conduct<br />
standard stock assessments for more than a fraction of the species (see Table 3.4), and such data-intensive,<br />
single-species approaches have been criticized as unrealistic for most reef fish systems (Sale, 2002). There<br />
is evidence of serial depletion of reef resources in Florida and around all populated U.S. islands. In Hawaii,<br />
long-term catch rates suggest that stocks of nearshore fishes have declined by nearly 80% between 1900 and<br />
the mid-1980s (Shomura, 1987). Catch per unit effort (CPUE) of reef fishes in Guam fell by more than 50%<br />
between 1985 and 2000 (Birkeland et al., 2000), while the CPUE fell 70% in the American Samoan reef fishery,<br />
accompanied by a shift in species composition, over a period of 15 years between 1979 and 1994 (Birkeland,<br />
1997). The Nassau grouper fishery, the highest value commercial fishery in Puerto Rico and the U.S. Virgin<br />
Islands (USVI), collapsed in the 1980s due to overexploitation of spawning aggregation sites and the species<br />
was identified as a candidate to be listed as threatened or endangered under the Federal Endangered Species<br />
Act (16 U.S.C. § 460 et seq.) in 1991. In the Florida Keys, the nation’s most extensive and long-term reef fish<br />
monitoring program has revealed that 77% of the 35 individual stocks that could be analyzed in Biscayne Bay<br />
are overfished (Ault et al., 2001).<br />
Table 3.4. Overfished Coral Reef Species in Federal Fishery Management Plans (FMPs). Source: 2003 Status of U.S. Fisheries<br />
Report (NOAA, http://www.nmfs.noaa.gov/sfa/reports/html, Accessed 2/14/05) and Western Pacific Coral Reef Ecosystem Fishery<br />
Management Plan (NOAA, http://www.wpcouncil.org/coralreef.htm, Accessed 2/14/05).<br />
Table: Overfished Coral Reef Species in Federal Fishery Management Plans 1<br />
Region Total Number of<br />
Federally Managed<br />
Coral Reef Species<br />
Number of Species<br />
Overfished or<br />
Approaching Overfished<br />
Number of Species<br />
Not Overfished<br />
Species with<br />
Insufficient Data<br />
South Atlantic2 62 8 12 42<br />
Gulf of Mexico2 44 5 4 35<br />
Caribbean2 154 3 1 150<br />
Western Pacific3 28 0 0 28<br />
Total<br />
Notes:<br />
422 16 16 389<br />
1 Overfished analysis includes only stocks in Federal waters–most reefs and fishing pressure occur in state and territorial waters.<br />
2 Excludes coral species for which the fishery is closed.<br />
3 From the Bottomfish, Precious Coral and Crustacean FMPs only–does not include the hundreds of species covered by the new<br />
Coral Reef Ecosystem FMP.<br />
Because of long-term trends in the exploitation of mixed reef fisheries, there are few places that maintain relatively<br />
intact fish populations to serve as experimental controls. The Northwestern Hawaiian Islands (NWHI)<br />
and some of the uninhabited U.S. Pacific Remote Island Areas probably represent the closest approximation<br />
to unexploited coral reef ecosystems in U.S. waters. The average fish biomass in the NWHI is 2.6 times
The State of Coral Reef Ecosystems of the United States and Freely Associated States: <strong>2005</strong><br />
greater than in the Main Hawaiian Islands (MHI). More than 54% of the total fish biomass in the NWHI is<br />
composed of apex predators, compared to less than 3% in the MHI. These differences have been attributed<br />
to overfishing in the MHI (Friedlander and DeMartini, 2002).<br />
Ecosystem Shifts<br />
There is increasing evidence that overfishing on reefs results not just in shifts in fish size, abundance, and<br />
species composition, but that it is also a major driver altering the ecological balance and contributing to the<br />
degradation of coral reef ecosystems (Bellwood et al., 2004). In particular, overfishing of herbivorous fishes<br />
has been linked to phase-shifts from high-diversity coral-dominated systems to low-productivity algal-dominated<br />
communities (Hughes, 1994). U.S. reefs, especially in the Atlantic, are increasingly facing coral declines,<br />
though uncertainty remains about the processes and links to fishing levels, especially in the Pacific (Jennings<br />
and Polunin, 1997). Herbivores comprise a significant component of the catch in the MHI, Guam, CNMI,<br />
and American Samoa. Parrotfishes and surgeonfishes are increasingly important in Puerto Rico and in St.<br />
Croix, where they represent the predominant catch. In nearly all areas except Florida, declines in the abundance<br />
of these species have been observed. There is also evidence that heavy fishing pressure on certain<br />
invertebrate-feeding fishes has played a key role in outbreaks of crown-of-thorns (COTS) starfish, snails, and<br />
herbivorous sea urchins (Hay, 1984; McClanahan, 2000; Dulvy et al., 2004). There is no clear evidence of the<br />
extent to which this has been an important factor in bioerosion on U.S. reefs, nor is there a clear understanding<br />
of the ecosystem effects due to the removal of top predators. Overfishing can also compound the impact of<br />
other threats. For example, overfishing of herbivorous fishes and enhanced nutrient flows to reefs may lead to<br />
reef overgrowth by macroalgae. Likewise, reefs devoid of herbivores may be less likely to recover from coral<br />
bleaching events (Westmacott et al., 2000).<br />
Impacts from Fishing Gear<br />
A number of protected species, such as hawksbill and green sea turtles as well as a number of seabird species<br />
are untargeted victims of fishing activity and are especially vulnerable to longline fishing and shrimp trawling.<br />
Traps and gill nets also result in mortality of non-target species.<br />
Physical damage to the benthos from certain fishing techniques is well-documented. Traps set for fishes or<br />
lobsters can cause physical damage to corals, gorgonians, and sponges. They may also result in by-catch<br />
and “ghost fishing” if they are lost or not regularly checked. Trap fisheries are most common in Florida (lobster<br />
and stone crab) and the U.S. Caribbean (fish and lobster), and are generally less prevalent in the U.S. Pacific.<br />
Large gill and trammel nets have also been identified as a growing concern, particularly in St. Croix (USVI)<br />
and Hawaii. Large gill nets are set on reefs and their lead-lines can cause extensive damage when the nets<br />
are hauled into the boats. In addition to legal fishing activities, illegal techniques can cause severe damage<br />
to reefs. Use of chlorine bleach has been reported in Hawaii, Guam, and Puerto Rico (USCRTF, 1999), and<br />
traditional plant-derived poisons are still used occasionally in the subsistence fishery in American Samoa.<br />
The use of cyanide for fishing has not been reported on U.S. reefs, although the expansion of the live food<br />
fish trade to the Marshall Islands has raised concerns about its potential use there. Blast fishing, probably the<br />
most destructive technique, has rarely been reported on U.S. reefs.<br />
Other indirect impacts to coral reefs associated with fisheries include anchor damage from fishing boats,<br />
which has been identified as a problem in Florida and the U.S. Caribbean. Trawling damage to coral areas<br />
has been identified as a problem in deeper coral areas in the Gulf of Mexico. It was also a major cause of<br />
destruction of the deep water Oculina coral banks off the east coast of Florida before the development of the<br />
Experimental Oculina Research Reserve. In general, such damage is inadvertent rather than due to directed<br />
fishing, but trawls can cause tremendous damage when hauled over hard bottoms with coral. Furthermore,<br />
groundings of fishing vessels have had major, albeit localized, impacts on certain reefs.<br />
Threats<br />
page<br />
25
Threats<br />
page<br />
26<br />
The State of Coral Reef Ecosystems of the United States and Freely Associated States: <strong>2005</strong><br />
Trade in Coral and Live Reef Species<br />
Many coral reef species are harvested domestically and internationally to supply a growing international demand<br />
for seafood, aquarium pets, live food fish, construction materials, jewelry, pharmaceuticals, traditional<br />
medicines and other products. In many locations, collection is occurring at unsustainable levels, and overharvesting<br />
may lead to reductions in the abundance and biomass of target species, shifts in species composition,<br />
and large-scale ecosystem shifts including population explosions of non-target species or the replacement of<br />
thriving, coral-dominated systems with low-productivity algal reefs (Hughes, 1994; McClanahan, 1995; Jennings<br />
and Polunin, 1996). In addition to overfishing, there is widespread use of destructive techniques such as<br />
cyanide poisoning of fishes and coral colony breakage. Cyanide is used illegally in Southeast Asia and other<br />
parts of the Indo-Pacific to capture live reef fish for the aquarium trade and live fish markets, and has been<br />
found to: 1) kill many non-target species, 2) cause habitat damage, and 3) pose human health risks (Barber<br />
and Pratt, 1997). High levels of mortality associated with cyanide and inadequate handling and transport<br />
practices pose significant challenges to achieving sustainability. The use of cyanide has not been reported or<br />
observed in the U.S., with the possible exception of limited use in some of the Freely Associated States (e.g.,<br />
Marshall Islands) associated with the live reef fish food trade. In addition, unsafe diving practices resulting<br />
from the collection of corals, sea cucumbers, fish, and other species in deep water are causing a high incidence<br />
of illness, paralysis, and even death of collectors in some regions (Johannes and Riepen, 1995; Barber<br />
and Pratt, 1997).<br />
The <strong>Marine</strong> Aquarium Trade<br />
The marine aquarium trade has an estimated value of $200-300 million per year (Larkin and Degner, 2001).<br />
The global trade in coral has increased by 500% over the last 10 years, with over one million live corals and<br />
1.87 million kg of live rock traded in 2002 (Bruckner, 2003). In addition, an estimated 20-24 million reef fishes<br />
are traded annually, representing 1,450 species in 50 families (Balboa, 2002; Wabnitz et al., 2003). The U.S.<br />
is the world’s largest consumer of ornamental coral reef species, importing 60-80% of the live coral, over 50%<br />
of the curio coral, 95% of live rock, and 50-60% of the marine aquarium fishes each year (Wood, 2001; Bruckner,<br />
2003). The most important sources of coral are currently Indonesia, Fiji, and Vietnam (Bruckner, 2001).<br />
Indonesia and the Philippines each supply about 30% of the total global trade in reef fishes, with another 30%<br />
exported from five locations (Brazil, the Maldives, Hawaii, Sri Lanka, and Vietnam); Florida and Puerto Rico<br />
are currently the largest exporters from the wider Caribbean (Wood, 2001; Balboa, 2002).<br />
Although it is illegal to harvest stony corals and live rock in U.S. waters, ornamental reef fishes and many motile<br />
invertebrates are collected in U.S. waters both for domestic use and export. In Florida, 318 marine species<br />
(181 fishes and 137 invertebrates) have been collected for commercial purposes, with a total annual value of<br />
up to $4.2 million. Over 200,000 ornamental reef fishes are landed in Florida each year, with a maximum of<br />
425,781 fishes in 1994 (Larkin, 2003). Annual reported harvest of ornamentals from West Hawaii rose from<br />
90,000 in 1973 to 422,823 in 1995 (Tissot and Hallacher, 1999).<br />
The Live Reef Food Fish Trade<br />
Groupers, humphead wrasse, coral trout, and other large fishes that use coral reefs are harvested live to<br />
supply restaurants in Hong Kong. Exports increased rapidly during the 1990s and peaked at 32,000 metric<br />
tons (mt) in 1997, with a slight decline between 1998 and 2000 due to the Asian economic crisis (Lau and<br />
Parry-Jones, 1999). More recently an estimated 22,000 to 28,000 mt of live reef fishes have been imported by<br />
Hong Kong, China, Taiwan, and other Asian markets, with Hong Kong imports comprising 65-80% of the total<br />
regional trade (Graham et al., 2001). In addition to widespread use of cyanide to capture the fish live, fishers<br />
target spawning aggregations and have been reported to eliminate entire breeding populations relatively rapidly<br />
(Lau and Parry-Jones, 1999). In addition to concerns regarding the use of destructive fishing techniques,<br />
most of these species are vulnerable to heavy fishing pressure due to their longevity, late sexual maturation,<br />
aggregation spawning, and sex change habits (Sadovy et al., 2004).<br />
Curios and Jewelry Trade<br />
Coral reef species harvested for curios and jewelry include mollusk shells; stony coral skeletons; and black,<br />
pink, gold, bamboo, and other precious corals (Figure 3.7). Of these species, only stony corals, black coral,<br />
and giant clams are internationally regulated through the Convention on International Trade in Endangered<br />
Species of Wild Fauna and Flora (CITES). International trade in shells involves as many as 5,000 species
of an unknown volume primarily supplied<br />
by the Philippines, Indonesia,<br />
Thailand, Singapore, Taiwan, Mexico,<br />
India, Africa, and Haiti (Wells, 1989).<br />
Shells are used for construction materials;<br />
shell craft; mother of pearl and<br />
other collectors items; as well as additives<br />
to floor tiles, toothpaste, pottery,<br />
and poultry feed (Marshall et al.,<br />
2001). The volume of trade in coral<br />
skeletons has varied over the years,<br />
with the Philippines being the major<br />
supplier in the 1970s and 1980s; exports<br />
from the Philippines were prohibited<br />
in the late 1980s, with a temporary<br />
lifting of trade bans in 1992<br />
during which over three million kg<br />
were exported. Fiji and Vietnam are<br />
currently the major source countries<br />
for coral skeleton (Bruckner, 2001).<br />
The State of Coral Reef Ecosystems of the United States and Freely Associated States: <strong>2005</strong><br />
Figure 3.7. The shells of reef organisms are often sold at curio shops, such as this<br />
one in Palau. Although many of the shells were probably imported from Southeast<br />
Asia, some local collection is thought to occur as well. Photo: J. Waddell.<br />
International trade in black coral, according to the CITES trade database, has averaged 430,000 items per<br />
year since 1983, with the maximum trade in 1994, and 320,000 items traded in 1998 (CITES Trade Database,<br />
http://www.cites.org/eng/resources/trade.shtml, Accessed 02/16/05). The world’s largest supplier of worked<br />
black coral is Taiwan (>90% of the total), with most reported to be harvested in the Philippines. Commercial<br />
harvest occurs in U.S. waters in Hawaii, with annual landings averaging 1,014 kg/year; about 90% of this is<br />
for domestic use.<br />
International Protection<br />
CITES is an international agreement among the governments of 165 countries to protect wildlife by ensuring<br />
that international trade does not threaten the survival of a species in the wild. CITES regulates international<br />
trade in wildlife according to three levels, or appendices, of threat. Species listed in Appendix I, which includes<br />
marine turtles and most whales, are believed to be threatened with extinction and thus, commercial trade of<br />
these species is generally prohibited. Most species are listed in Appendix II which includes organisms that<br />
are not presently threatened or endangered, but may become so if trade is not regulated. These species can<br />
still be commercially traded with export permits which require the exporting country to ensure that the species<br />
was legally harvested and its export will not be detrimental. Coral reef species currently listed in Appendix II<br />
include about 2,000 species of stony corals (including all scleractinian corals), black coral, giant clams, queen<br />
conch, and seahorses. Trade of Appendix III species requires an export permit ensuring that the organism<br />
was harvested legally and prepared and shipped so as to minimize damage, injury or cruel treatment.<br />
Ships, Boats, and Groundings<br />
Of all physical damage caused to coral reefs by human activity, ship groundings and the impacts of boats and<br />
anchors are perhaps the most destructive. The U.S. Coast Guard (USCG) reports that over 2,100 grounding<br />
accidents are reported annually, with about 440 vessels sinking each year. In addition, over 800 abandoned<br />
barges litter the inland and coastal waters of the U.S., many still loaded with hazardous cargo (Helton, 2003).<br />
As recreational and commercial boating traffic increases in nearshore ocean waters, these shipwrecks pose<br />
a threat to coral reef habitat. When anchors, especially the enormous anchors of cruise ships, are carelessly<br />
dropped and dragged on fragile reef, hundreds of meters of habitat can be destroyed. Recent studies demonstrate<br />
the extensive impacts of groundings when hazardous cargo is released. However, once cargo and<br />
fuel are spilled, the vessel may continue to cause repeated physical damage to the reef due to movement by<br />
wind and waves. Furthermore, abandoned barges can often become illegal dump sites for other hazardous<br />
materials, trap wildlife, and become public safety hazards (Helton and Zelo, 2003).<br />
Threats<br />
page<br />
27
Threats<br />
page<br />
28<br />
The State of Coral Reef Ecosystems of the United States and Freely Associated States: <strong>2005</strong><br />
Initially many considered the impacts of grounded vessels to be significant only at a local level, but the widespread<br />
effects of these events have recently been the subject of closer examination (Precht et al., 2001;<br />
Ebersole, 2001). Damage resulting from ship groundings often continues well beyond the initial event of<br />
impact as a result of slow recovery and fragmentation of keystone species essential to reef structure and<br />
function. In particular, spur and groove reefs do not seem to recover their diverse fish assemblages following<br />
a ship grounding incident (Ebersole, 2001). The potential threats of grounded vessels became the subject<br />
of increased political attention in 1999 when nine vessels were cleaned, cut apart, and removed from a reef<br />
in Pago Pago, American Samoa and the grounding sites were restored by the USCG, NOAA, and American<br />
Samoan government. The increasing frequency of vessel groundings in coral reef environments led to the development<br />
of the National Action Plan to Conserve Coral Reefs (USCRTF, 2000) which recognizes the impact<br />
of grounded vessels to coral reefs and their associated habitats (Helton and Zelo, 2003). In response, NOAA<br />
initiated the Abandoned Vessel Project, which seeks to increase awareness of abandoned vessels, particularly<br />
where they occur in coral reef systems, as well as provide the technical assistance necessary to remove the<br />
vessels (NOAA OR&R, http://response.restoration.noaa.gov/dac.vessels/overview.html, Accessed 6/2/04).<br />
A study conducted on the site of the 1984 grounding of the M/V Wellwood in the Florida Keys National <strong>Marine</strong><br />
Sanctuary suggested that damaged spur and groove habitat will take decades to recover without substantial<br />
restoration efforts (Smith et al., 1998). A reduction of topographic complexity also influences local hydrodynamics<br />
and the structure of reef fish and invertebrate communities (Miller et al., 1993; Szmant, 1997).<br />
The damage caused to a coral reef habitat by boat anchors is an additional threat resulting from frequent boat<br />
traffic. A study conducted in a 220 ha area of coral reef in Fort Jefferson National Monument, Dry Tortugas,<br />
Florida documented the extensive damage that can be caused by anchors (Davis, 1977). Cruise ship anchors<br />
present a significant and increasing threat to coral reefs. In Grand Cayman, an estimated 1.2 million m 2 of coral<br />
reef have been destroyed by cruise ship anchors (Smith, 1998), while cruise ships in the Cancun National<br />
Park in Mexico, are thought to have impacted over 80% of the coral reefs there (Schultz, 1998). Designation<br />
of anchorages in less sensitive areas, installation of mooring buoys, and identification of areas sensitive to anchor<br />
damage are necessary to reduce the destructive practice of unregulated anchor dropping and dragging.<br />
Major vessel groundings in the FKNMS such as the M/V Alec Owen Maitland and M/V Elpis in 1989 and the<br />
R/V Iselin in 1994 are examples of events in which waves and currents occuring between the grounding and<br />
restoration resulted in further injury to the reef. Loose coral rubble threatened adjacent undisturbed coral habitat,<br />
and restoration efforts involved removing broken pieces of coral from the seafloor and re-attaching them<br />
before the arrival of winter storms. The extent of the broken coral can be extensive. For example, the 325-<br />
foot M/V Fortuna Reefer container<br />
ship ran aground near Mona Island,<br />
Puerto Rico in July 1997 and damaged<br />
over 6,400 m 2 of elkhorn coral<br />
(Figure 3.8; Zobrist, 1998).<br />
An additional impact of ship groundings<br />
involves contamination from Tributyltin<br />
(TBT), a component of antifouling<br />
paint. TBT-based paints have<br />
been banned for use on small craft,<br />
but TBT-based paints are still widely<br />
used on large ships which navigate<br />
routes that pass through coral reef<br />
habitat. The effects of this paint on<br />
a reef were examined following the<br />
grounding of a 184 m cargo ship<br />
Bunga Teratai Satu on Sudbury Reef,<br />
Australia in 2000. Results demonstrated<br />
that this kind of contamination<br />
can significantly reduce coral recruit-<br />
Figure 3.8. The M/V Fortuna Reefer, a container ship that ran aground near Mona Island,<br />
Puerto Rico, damaged a large area of reef including stands of Acropora palmata.<br />
NOAA scientists have undertaken restoration efforts at the site and have monitored<br />
the recovery of the coral community there since 1998. Photo: NOAA Fisheries.
The State of Coral Reef Ecosystems of the United States and Freely Associated States: <strong>2005</strong><br />
ment in the area of the grounding and may consequently hinder recovery of the community (Negri et al.,<br />
2002).<br />
With boat traffic rapidly growing, it is crucial to better understand the ecological implications of vessel groundings<br />
and anchor damage, and to take steps to limit or prevent damage through education and guidance supported<br />
by strong legislation. Severe physical damage to coral reefs by vessels requires a rapid response and<br />
carefully designed methods of removal and restoration to limit the extent of the impact (NOAA, 2002b).<br />
<strong>Marine</strong> Debris<br />
Globally, marine debris presents a continuous threat to the marine environment. <strong>Marine</strong> debris adversely impacts<br />
marine life through the destruction of essential habitat as well as entanglement and ingestion by marine<br />
organisms and seabirds. Typically, the majority of marine debris comes from land-based sources, particularly<br />
urban centers, but a significant proportion comes from ships.<br />
All U.S. jurisdictions with coral reefs<br />
participate in the International Coastal<br />
Cleanup to remove marine debris<br />
from their shorelines and nearshore<br />
waters. Additional community-based<br />
cleanup efforts have been conducted<br />
at many locations, including South<br />
Point and Kahoolawe in Hawaii. Typical<br />
debris collected from the shorelines<br />
includes beverage cans and<br />
bottles, cigarettes, disposable lighters,<br />
plastic utensils, food wrappers,<br />
and fishing line (Figure 3.9). Underwater<br />
cleanups conducted by snorkelers<br />
and divers have found similar<br />
materials beneath the surface.<br />
The most notable impacts of marine<br />
debris on coral reef ecosystems<br />
come from derelict fishing gear including<br />
nets, fishing line, and traps.<br />
Prior to the 1950s, fishing gear was<br />
composed of natural fibers, such as<br />
cotton and linen, and was susceptible<br />
to environmental degradation. Since<br />
the 1950s, fishing gear has primarily<br />
been constructed with synthetic materials,<br />
such as nylon and polyethylene,<br />
which is less susceptible to environmental<br />
degradation. Synthetic<br />
nets and fishing line can persist in the<br />
ocean for decades and can be transported<br />
for thousands of kilometers.<br />
Figure 3.9. Tons of marine debris wash up on the shores of the NWHI every year.<br />
Though NOAA’s Pacific Islands Fisheries Science Center, Coral Reef Ecosystem Division<br />
has removed 401,055 kg of debris from the shallow waters of the NWHI since<br />
2001, resource limitations prevent debris removal on land. Photo: S. Holst.<br />
The NWHI has been a focal point for the removal of abandoned fishing gear comprised of conglomerates of<br />
netting and fishing line that roll across coral reef habitats, crushing corals and dislodging sessile organisms<br />
(Figure 3.10). Fishing gear frequently becomes snagged on corals and continues to trap fish (“ghost fishing”)<br />
and endangered monk seals and sea turtles (Boland and Donohue, 2003; Donohue et al., 2001; Henderson,<br />
2001; Balazs, 1985). Since 2001, NOAA’s Pacific Islands Fisheries Science Center, Coral Reef Ecosystem Division<br />
(PIFSC-CRED) has led a large-scale interagency partnership to study and remove derelict fishing gear<br />
from the NWHI. NOAA collaborates with the State of Hawaii, City and County of Honolulu, U.S. Fish and Wild-<br />
Threats<br />
page<br />
29
Threats<br />
page<br />
30<br />
The State of Coral Reef Ecosystems of the United States and Freely Associated States: <strong>2005</strong><br />
life Service (USFWS), USCG, U.S.<br />
Navy, University of Hawaii, Hawaii<br />
Sea Grant, Hawaii Metals and Recycling,<br />
Honolulu Waste Disposal,<br />
and other partners from local agencies,<br />
businesses, and non-governmental<br />
organizations. From 2001 to<br />
2004, this large-scale effort removed<br />
401,055 kg of fishing gear from these<br />
remote islands and atolls (R. Brainard,<br />
pers. comm.). Types of fishing<br />
gear removed included monofilament<br />
gillnet, seine net, and trawl nets, the<br />
majority of which was thought to<br />
have originated from fisheries operating<br />
around the continental shelves<br />
of the North Pacific Rim which are<br />
located thousands of kilometers from<br />
the NWHI.<br />
Derelict fishing gear has also been a<br />
concern in other U.S. coral reef ecosystems.<br />
Chiappone et al. (2002)<br />
surveyed the Florida Keys for fishing<br />
gear and other marine debris<br />
and concluded that lobster trap debris<br />
was often found in offshore and<br />
mid-channel patch reefs, while hook<br />
and line gear was more common in<br />
shallow and deep forereef areas.<br />
Since 1994, the FKNMS, The Nature<br />
Conservancy, The Bacardi Foundation,<br />
and local dive operators have<br />
supported an annual effort to clean<br />
the reefs around the Florida Keys. In<br />
2002, divers removed over 1,800 kg<br />
of marine debris including fishing line<br />
Figure 3.10. A tangle of abandoned fishing gear removed from Pearl and Hermes<br />
Atoll in the NWHI by a team of divers from PIFSC-CRED and the Joint Institute for<br />
<strong>Marine</strong> and Atmospheric Research (JIMAR). The net had to be freed from the reef,<br />
lifted to the surface, and towed to shallow water before debris team members could<br />
cut it into smaller pieces and remove it. Photo: A. Hall.<br />
from the Keys. In 2003 and 2004, Amigos de Amoná, Inc. and other partners removed 3,235 kg of marine<br />
debris from the islands in Puerto Rico’s Mona Channel. The debris consisted of fishing gear (48%), plastics<br />
(13%), glass (14%), metal (8%), and miscellaneous items such as refrigerator doors, rubber shoes, packing<br />
and insulation materials, and washing machines (17%; Amigos de Amoná, Inc., 2004).<br />
Aquatic Invasive Species<br />
Aquatic invasive species are aquatic organisms that have been introduced, either intentionally or unintentionally,<br />
into new ecosystems which result in harmful ecological, economic, and human health impacts (USDA,<br />
http://www.invasivespecies.gov, Accessed 2/11/05). Aquatic invasive species have been reported in all U.S.<br />
reions and probably exist in every region of the world. Invasive species are generally second only to habitat<br />
destruction in causing declines in biodiversity and are thought to impact nearly half of the species currently<br />
listed as threatened or endangered under the Federal Endangered Species Act (Wilcove et al., 1998).<br />
The impacts are not only ecological. Damages to infrastructure, such as clogged intake pipes, and environmental<br />
losses due to terrestrial and aquatic invasive species cost over $120 billion per year in the U.S. alone<br />
(Pimentel et al., in press). The cumulative effects and costs of aquatic invasive species are difficult to quantify,<br />
but evidence clearly indicates that the impacts will continue to increase. In fact, the frequency of aquatic
The State of Coral Reef Ecosystems of the United States and Freely Associated States: <strong>2005</strong><br />
invasions has increased exponentially since the late 1700s and shows no signs of diminishing (Ruiz et al.,<br />
2000).<br />
Although there have not been many studies that focus specifically on the impacts of aquatic invasive species<br />
on shallow-water coral reef ecosystems as a whole, there have been a handful of smaller studies. In<br />
Hawaii, it has been determined that the number of marine and estuarine invasive species is approximately<br />
343, including 287 invertebrates, 24 algae, 20 fish, and 12 flowering plants (Bishop Museum, http://www2.<br />
bishopmuseum.org/HBS/invertguide, Accessed 02/14/05). Pearl Harbor alone contains more than 100 invasive<br />
species. Additionally, some of Hawaii’s worst invaders have been intentionally introduced, such as algal<br />
species, Kappaphycus alvarezii and K. striatum, which smothered large tracts of coral reefs in Kaneohe Bay,<br />
thus diminishing the ecological and economic value of the area (Carlton, 2001).<br />
Shallow-water coral reef ecosystems are particularly sensitive to a number of non-native species introduction<br />
pathways, including ships (due to ballast water discharges and hull fouling), aquaculture of non-native species,<br />
releases by aquarium hobbyists, and marine debris.<br />
Introductions from Ballast Water<br />
By 1996, 80% of all commercial goods were being transported aboard ocean-going vessels (NRC, 1996).<br />
That percentage is likely to increase as global trade increases. In addition to greater movement of goods<br />
across the world’s oceans, the speed and size of ships have greatly increased, resulting in faster voyages<br />
and larger volumes of ballast water. Because most marine species have planktonic stages as part of their life<br />
cycle, they are subject to entrainment during the uptake and discharge of ballast water. Furthermore, because<br />
voyage times have greatly decreased, the chances of survival are greater. Ballast tanks have been shown<br />
to carry bacteria, protists, dinoflagellates, diatoms, zooplankton, algae, benthic invertebrates (e.g., mollusks,<br />
corals, sea anemones, and crustaceans), and fish (LaVoie et al., 1999; NRC, 1996).<br />
Releases by Aquarium Hobbyists<br />
Although there are relatively few documented marine fish invasions, 94 of the 241 documented invasions<br />
involved tropical marine species. Additionally, a link has been identified between invasions and marine aquarium<br />
imports. Such findings highlight the susceptibility of warm water coral reef ecosystems to intentional introductions<br />
by hobbyists and the need for public education. For example, a species of lionfish (Pterois volitans)<br />
common to the Indo-Pacific regions that was thought to have been introduced from a home aquarium in 1992<br />
has established viable populations all<br />
along the southeastern coast of the<br />
U.S., with juveniles recently found as<br />
far north as Long Island (Figure 3.11;<br />
Whitfield et al., 2002).<br />
Introductions from <strong>Marine</strong> Debris<br />
The amount of marine debris generated<br />
as waste from society has<br />
increased at a rapid rate in recent<br />
years (Silvia-Iniguez and Fischer,<br />
2003; Moore, 2003). For instance,<br />
the amount of marine debris in the<br />
waters around Great Britain doubled<br />
from 1994 to 1998 (Barnes, 2002).<br />
Much of the debris is fisheries related,<br />
comprised mostly of netting.<br />
Floating material provides habitat for<br />
many organisms and can result in the<br />
transportation of species into new areas,<br />
often many thousands of kilometers<br />
from their existing species range<br />
(Barnes and Fraser, 2003). Problems<br />
occur when newly arrived alien spe-<br />
Figure 3.11. The Red Lionfish, Pterois volitans, is native to the Indo-Pacific but has<br />
established viable populations along the southeastern coast of the U.S. This fish was<br />
photographed off the coast of Beaufort Inlet, North Carolina in about 40m of water.<br />
Photo: P. Whitfield.<br />
Threats<br />
page<br />
31
Threats<br />
page<br />
32<br />
The State of Coral Reef Ecosystems of the United States and Freely Associated States: <strong>2005</strong><br />
cies successfully colonize and overwhelm local marine ecosystems. Barnes (2002) found that marine debris<br />
was typically colonized by bryozoans, barnacles, polychaetes, hydroids and mollusks.<br />
Security Training Activities<br />
U.S. military installations near coral reefs include operations in Hawaii (Hickam Air Force Base, Pearl Harbor,<br />
and Kaneohe Bay); Johnston Atoll (PRIAs); Wake Atoll (PRIAs); Kwajelein Atoll (Republic of the Marshall Islands);<br />
Guam; CNMI; Key West and Panama City, Florida; Puerto Rico; USVI; Cuba; and Diego Garcia in the<br />
Indian Ocean. Military bases and associated activities including exercises, training, and operational procedures<br />
(i.e., construction, dredging, and sewage discharge) have the potential for adverse ecological impacts<br />
on coral reefs such as excessive noise, explosives and munitions disposal, oil and fuel spillage, wreckage and<br />
debris, breakage of reef structure, and non-native species introductions from ship bilge water or aircraft cargo<br />
(Coral Reef Conservation Guide for the Military, https://www.denix.osd.mil/denix/Public/ES-Programs/Conservation/Legacy/Coral/coral.html,<br />
Accessed 12/6/04).<br />
In recent years, the military has decommissioned several properties and transferred management responsibility<br />
to other agencies. In June 1997, the U.S. Navy officially turned over the management of Midway Atoll<br />
(NWHI) to the USFWS for use as a national wildlife refuge. Parts of the island required major remediation<br />
to mitigate contamination by lead-based paints, asbestos, fuels and chemicals, but the refuge soon offered<br />
fishing, diving, and eco-tour opportunities. When the military decommissioned Kaho’olawe, a former naval<br />
bombing range in the MHI, they established a framework for cleanup that included government-appropriated<br />
funds and a transfer of the island to a native Hawaiian organization with a state-appointed council to oversee<br />
the cleanup process. In June 1995, an evaluation of the nearshore coral reef resources of Kaho’olawe documented<br />
the continued presence of metal debris, but reported that relatively few pieces of ordnance were found<br />
despite many years of bombing exercises on the island (Naughton, 1995). The 10-year, $460 million cleanup<br />
on Kaho’olawe ended November 11, 2003. At that time, the Navy ceased active remediation and access<br />
control was returned to the State of Hawaii. The Navy continued surface clearance as a further risk reduction<br />
measure until April 2004 when final demobilization occurred. At that point, full-time management of the<br />
island shifted to the state. In May 2003, the U.S. Navy ceased military training on the eastern side of Vieques<br />
Island, Puerto Rico and transferred management of all remaining Navy property on Vieques, including the<br />
bombing training range on the easternmost parcel, to the USFWS. According to the statute governing such<br />
transfers, the property can only be used as a wilderness area. Vieques and the surrounding waters have been<br />
proposed by the U.S. Environmental Protection Agency (EPA) for listing on the National Priorities List, which<br />
EPA uses to determine which uncontrolled waste sites warrant further investigation. As such, the Navy, EPA,<br />
and Puerto Rico Environmental Quality Board will work cooperatively on conducting investigations required<br />
by the Comprehensive Environmental Response, Compensation and Liability Act (42 U.S.C. § 9601 et seq.).<br />
The investigation may conclude the need for the Navy to complete hazardous substances remediation and/or<br />
munitions clearance in some areas. Baseline assessments of 24 permanent coral reef monitoring sites at<br />
Vieques Island were commissioned by the U.S. Navy and completed in 2001-2002 in an effort to comply with<br />
Executive Order 13089 and the U.S. Department of Defense (DoD) Initiative for Coral Reef Protection at the<br />
Roosevelt Roads Naval Station in Puerto Rico (Deslares et al., 2004).<br />
According to the DoD Coral Reef Implementation Plan (2000), U.S. military services (i.e., the Air Force, Army,<br />
Navy, and <strong>Marine</strong> Corps) “generally avoid coral reef areas in their normal operations except for some missionessential<br />
ashore and afloat activities.” DoD policy is to avoid adversely impacting coral reefs during military<br />
operations and ensure safe and environmentally responsible action in and around coral reef ecosystems, to<br />
the maximum extent practicable. However, exceptions to this policy can be made during wars; national emergencies;<br />
and threats to national security, human health, and the safety of vessels, aircraft, and platforms (Executive<br />
Order 13089, 1998). DoD has implemented a number of actions to comply with natural resource and<br />
environmental protection laws, and has developed programs to protect and enhance coral reef ecosystems.<br />
These efforts include developing geographic information system (GIS) planning tools, coral surveys to evaluate<br />
impacts from bombing exercises, assessments to determine the impact of amphibious training exercises<br />
on reef ecosystems, pollution and oil spill prevention programs, and invasive species management and effective<br />
land management programs (Defense Environmental Network and Information Exchange, https://www.<br />
denix.osd.mil, Accessed 2/14/05).
The State of Coral Reef Ecosystems of the United States and Freely Associated States: <strong>2005</strong><br />
Oil and Gas in Coral Reef Ecosystems<br />
The introduction of oil and other hydrocarbons into the marine environment can have serious consequences for<br />
coral reef ecosystems. Whether from chronic or episodic oil spills or from activities related to the exploration,<br />
production or transport of energy resources, oil can impact reefs through physical breakage, sedimentation<br />
and smothering, toxic contamination by heavy metals, and by inhibition of growth and recruitment. Sources of<br />
oil entering the marine environment vary. Summary information for North America is provided in Figure 3.12.<br />
Once introduced, oil tends to persist<br />
in sheltered tropical coastal environments.<br />
Because of the difficulty<br />
of navigation in shallow-water coral<br />
reef environments, cleanup following<br />
a spill is often extremely difficult.<br />
Booms and skimmers can be<br />
used in lagoon areas when the oil is<br />
on the surface, but these responses<br />
become less useful over time as the<br />
oil combines with mineral particles<br />
in the water and sinks or is churned<br />
into the water column during inclement<br />
weather. The use of dispersants<br />
is often discouraged in shallow-water<br />
areas because they cause the oil to<br />
sink to the bottom where it comes<br />
into contact with sensitive reef habitats.<br />
Reduced water circulation in<br />
nearshore areas hinders natural dis-<br />
sipation by currents. When spills oc-<br />
Figure 3.12. Sources of oil entering the marine environment of North America.<br />
Source: Minerals Management Service, 2002.<br />
cur in shallow-water coral reef ecosystems, the best option may be to let natural processes handle the task of<br />
removing oil from the fine sediments of mangrove forests, seagrass meadows, and complex reef frameworks<br />
(Corredor et al., 1990; Guzman et al., 1994). Oil spill recovery in shallow-water reef ecosystems can require<br />
decades. Five years after a major oil spill on a Panamanian reef (April 1986), scientists found that surviving<br />
colonies of the four most massive species of reef-building corals were still experiencing extensive, chronic effects<br />
on vital processes (Guzman et al., 1994).<br />
Several studies have been undertaken to determine the impact of oil on the physiology of coral reef organisms<br />
(reviews in Shigenaka, 2001). <strong>Laboratory</strong> experiments have demonstrated that exposure of coral species to<br />
oil can result in decreased growth, reproduction, and colonization capacity, as well as other negative effects on<br />
feeding, behavior, and mucous cell function (IPIECA, 1992). A field study in the Gulf of Eilat, Red Sea demonstrated<br />
that repeated discharges of oil onto a coral reef caused many changes to the reef system as a whole,<br />
and in particular damaged the reproductive system of scleractinian corals (Rinkevich and Loya, 1979).<br />
In southern Florida, Dustan et al. (1991) evaluated the impacts of drilling wells on reef building corals, gorgonians,<br />
sea grasses, macroalgae, and reef fishes. Primary impacts included physical destruction by drilling<br />
machinery and the accumulation of drilling debris, although no organisms appeared to be damaged by drilling<br />
fluids or cuttings. The results implied that exploratory drilling, in light of present technology and stringent<br />
dumping regulations, may be achieved without leaving lasting impacts; however, no conclusions could be<br />
drawn from this study relative to the drilling production wells (Dustan et al., 1991).<br />
In the North Sea, Olsgard and Gray (1995) assessed the spatial and temporal effects of production discharges<br />
on benthic fauna along contamination gradients. Results suggested that discharges reduced abundance of<br />
benthic fauna, many of which were key prey species for bottom-living fish. The fauna that became established<br />
in the contaminated sediments was considered less valuable as a food source for fish populations.<br />
In addition to spills, exploration for offshore oil and gas reserves has the potential to have major impacts on<br />
marine ecosystems. Petroleum resources are difficult to find, and the process of locating, recovering, trans-<br />
Threats<br />
page<br />
33
Threats<br />
page<br />
34<br />
The State of Coral Reef Ecosystems of the United States and Freely Associated States: <strong>2005</strong><br />
ferring and transporting them can pose a significant potential hazard to species living in the surrounding area.<br />
In the early stages, exploration for oil and gas involves seismic testing which involves emitting loud booming<br />
shock waves in order to determine what lies under the seafloor. The impacts of seismic testing on marine organisms<br />
are not well understood (The Ocean Conservancy, 2003). Once oil and gas reserves are located, energy<br />
exploration and production requires platform installation; dredging; drilling; the discharge of liquid, solid,<br />
and gaseous wastes and drill cuttings; noise and light pollution; and polluted air emissions. These impacts,<br />
in addition to the physical effects related to the movement of ships and equipment, can all present significant<br />
threats to the environment where the activity is taking place (http://earthsci.org/energy/gasexpl/exproil.html,<br />
Accessed 6/25/04).<br />
The primary drilling areas in the U.S. Exclusive Economic Zone that occur near reef ecosystems are in the<br />
Gulf of Mexico, where major development has resulted in the installation of 6,500 production platforms and<br />
over a 160,900 km of pipelines and other infrastructure. Numerous wells, platforms and pipelines surround<br />
the Flower Garden Banks National <strong>Marine</strong> Sanctuary (FGBNMS) in the northwestern Gulf of Mexico (see<br />
Chapter 8), and one oil production platform even lies within the boundaries of the sanctuary, less than 1.6 km<br />
from the East Flower Garden coral cap. Fortunately, FGBNMS managers report that no major spills or impacts<br />
have occurred to date within sanctuary waters.<br />
Because oil and gas development is such a major activity on the outer continental shelf in the Gulf of Mexico,<br />
the U.S. Department of the Interior’s Minerals Management Service (MMS) has supported mapping and study<br />
programs of the Flower Garden Banks since the early 1970s to determine how to mitigate environmental<br />
impacts of oil and gas exploration. Information from these studies has supported MMS’s belief that lease<br />
stipulations can minimize the potential impact of discharged contaminants to reef communities in the area.<br />
One such important stipulation requires shunting of drill cuttings so that they are deposited within 10 m of the<br />
bottom and not further up in the water column (MMS, http://www.mms.gov/eppd/compliance/13089/banks.<br />
htm, accessed 6/25/04).<br />
Furthermore, removal of the enormous platforms, which weigh thousands of tons, is nearly impossible without<br />
the use of explosive materials. Gitschlag and Herczeg (1994) conducted one of the few known observations<br />
of fish mortality following such explosive activity. They reported that one event killed as many as 51,000 fish<br />
(larvae and juveniles were not counted). Removal of structures may also decrease the availability of habitat<br />
for fish that utilize the sites as artificial reefs (Patin, 2004, http://www.offshore-environment.com/abandonment.html,<br />
accessed 6/24/04).
Other Threats<br />
Crown-of-Thorns Starfish Outbreaks<br />
The COTS (Acanthaster planci)<br />
is a species of echinoderm found<br />
throughout the Indo-Pacific region<br />
(Figure 3.13). COTS feeds on several<br />
common species of hard coral,<br />
particularly Acropora spp., showing<br />
a clear preference for tabular forms<br />
and those corals that are least well<br />
defended (De’ath and Moran, 1998;<br />
Pratchett, 2001). They reproduce<br />
sexually with synchronized release<br />
of gametes and have a remarkable<br />
ability to regenerate damaged parts.<br />
COTS is preyed upon by several<br />
species of fish including triggerfish<br />
(Balistidae), and pufferfish (Tetradontidae),<br />
and a few large crustaceans<br />
and mollusks. At relatively low densities,<br />
the starfish are considered to<br />
play an important role in maintaining<br />
high diversity on coral reefs (Ar-<br />
onson and Precht, 1995). At many<br />
The State of Coral Reef Ecosystems of the United States and Freely Associated States: <strong>2005</strong><br />
Figure 3.13. A closeup of a crown-of-thorns starfish, Acanthaster planci, on a reef<br />
in the PRIAs. Photo: J. Maragos.<br />
locations, however, populations periodically increase to levels that result in the degradation of coral reefs.<br />
Aggregations of hundreds of thousands of individuals have been reported across the Indo-Pacific, including<br />
Australia’s Great Barrier Reef, Fiji, Micronesia, American Samoa, the Cook Islands, the Society Islands, the<br />
Ryukyu Islands (Japan), Hawaii, Malaysia, the Maldives, and the Red Sea. The rate of recovery after a major<br />
outbreak is highly variable, with full recovery estimated to take decades or even many hundreds of years<br />
(Sano, 2000; Lourey, 2000).<br />
A number of environmental factors have been considered causative in COTS outbreaks, including hurricanes,<br />
nutrient input, and overfishing (Birkeland, 1982; Ormond et al., 1991). The level of impact from human activity<br />
is still unclear since outbreaks have also been reported in remote areas with very little human activity. Nevertheless,<br />
stressors generated through human activity are likely to influence the trajectory and rate of postoutbreak<br />
recovery.<br />
Outbreaks of other echinoderms, such as spiny sea urchins (Echinoidea), can also adversely impact coral reef<br />
ecosystems through excessive erosion of coral substratum, removal of newly settled corals, and intense herbivory<br />
(Sammarco, 1982; Carreiro-Silva and McClanahan, 2001). Damage to coral reefs due to high density<br />
populations (12-100 urchins/m 2 ) of urchins have been occasionally reported in U.S. waters including Hawaii,<br />
USVI, and the Marshall Islands.<br />
Threats<br />
page<br />
35
Threats<br />
page<br />
36<br />
The State of Coral Reef Ecosystems of the United States and Freely Associated States: <strong>2005</strong><br />
Earthquakes and Volcanoes<br />
Many islands in the Pacific and Caribbean<br />
were formed and transformed<br />
through tectonic and volcanic activity.<br />
In fact, coral reef atolls are formed<br />
through the erosion and subsidence<br />
of volcanoes and the subsequent<br />
gradual upward growth of coral reefs<br />
(Darwin, 1842). Volcanic eruptions<br />
can have important direct and indirect<br />
consequences for coral reefs.<br />
The eruption of Mt. Pagan, CNMI in<br />
1981 resulted in extensive damage to<br />
coral communities due to scouring by<br />
lava and smothering by volcanic ash,<br />
although observation of new coral<br />
recruits indicated recovery occurring<br />
within two years of the eruption<br />
(Eldredge and Kropp, 1985). Similarly,<br />
rapid recovery was observed<br />
after high coral mortality as a result<br />
of burial by ash after the 1994 erup-<br />
tion of Rabaul Caldera in Papua New<br />
Figure 3.14. In the past few years, eruptions of the volcanic island Anatahan in CNMI<br />
have deposited tons of ash on nearby reefs and temporarily closed international airports<br />
in Saipan and Guam. The latest major cluster of eruptions occurred in April<br />
<strong>2005</strong>. Photo: NASA, MODIS sensor.<br />
Guinea (Maniwavie et al., 2001). Major eruptions can also impact coral reefs many thousands of kilometers<br />
away through a complex sequence of events (Figure 3.14). For example, the 1991 eruption of Mount Pinatubo<br />
in the Philippines led to a short-term atmospheric cooling throughout the Middle East during the winter of 1992.<br />
This abnormal cooling resulted in deep vertical mixing in the Gulf of Eilat and excessive nutrient upwelling,<br />
which in turn, triggered algal blooms causing widespread coral death (Genin et al., 1995). However, cooled<br />
larva flow can also create new habitat suitable for the settlement and growth of corals and other organisms.<br />
In 1993, an earthquake measuring 8.2 on the Richter scale caused collapse of some coral reefs around Guam<br />
and also destroyed some large coral colonies that had formed on unstable substrata (Birkeland, 1997). Earthquakes<br />
that uplift some areas while subsiding others, or even triggering catastrophic sedimentary events, are<br />
thought to be important factors in the present spatial patterns of fringing reefs in the Gulf of Aqaba, Red Sea<br />
(Shaked et al., 2004). In the Hawaiian archipelago, a high frequency of deep earthquakes combined with<br />
submergence and rising sea-level may explain the absence of coral reefs in some locations around the island<br />
of Hawaii.<br />
Cable-laying Operations<br />
There has been a rapid increase in the need for submarine cables, particularly fiber optic cables, to support<br />
the telecommunications industry. Cable-laying operations and the movements of unsecured cables have<br />
been found to disrupt and destabilize benthic structure (Sultzman, 2002). The impact of laying a cable on<br />
benthic habitats will depend on the location of landing points, route chosen, and installation process. In some<br />
instances, sand channels through reefs have been used, but damage has occurred where cables have been<br />
laid directly over corals. Coral transplants and artificial reef modules have been used to replace lost hard<br />
coral, yet little is known about the effectiveness of these methods. Furthermore, few restoration efforts have<br />
considered damage to non-scleractinian components of the biota.
REFERENCES<br />
The State of Coral Reef Ecosystems of the United States and Freely Associated States: <strong>2005</strong><br />
Alevizon, W. 2004. Divers feeding fishes: a continuing issue in MPA management. MPA News 6 (5). Available from the internet<br />
URL: http://depts.washington.edu/mpanews/MPA58.htm.<br />
Alker, A.P., G.W. Smith and K. Kim. 2001. Characterization of Aspergillus sydowii (Thom et Church), a fungal pathogen of<br />
Caribbean sea fan corals. Hydrobiologia 460: 105-111.<br />
Amigos de Amoná, Inc. 2004. Final Report fo the Mona Channel <strong>Marine</strong> Debris Removal, Puerto Rico. Prepared for the<br />
National Fish and Wildlife Foundation and funded through the NOAA Coral Reef Conservation Program in 2002. Cabo Rojo,<br />
Puerto Rico.<br />
Aronson, R.B., I.G. Macintyre, C.M. Wapnick and W.M. O’Neill. 2004. Phase Shifts, Alternate States, and the Unprecedented<br />
Convergence of Two Reef Systems. Ecology 85 (7): 1876-1891.<br />
Aronson, R.B. and W.F. Precht. 1995. Landscape patterns of reef coral diversity: a test of the intermediate disturbance hypothesis.<br />
Journal of Experimental <strong>Marine</strong> Biology and Ecology 192: 1-14.<br />
Aronson, R.B. and W.F. Precht. 2001. White-band disease and the changing face of Caribbean coral reefs, Hydrobiologia 460<br />
(1-3): 25-38.<br />
Ault, J.S., S.G. Smith, G.A. Meester, J. Juo and J.A. Bohnsack. 2001. Site Characterization for Biscayne National Park: Assessment<br />
of Fisheries Resources and Habitats. NOAA Technical Memorandum NMFS-SEFSC-468. 156 pp.<br />
Bak, R.P.M. and M.S. Engel. 1979. Distribution, abundance and survival of juvenile hermatypic corals (Scleractinia) and the<br />
importance of life history strategies in the parent coral community. <strong>Marine</strong> Biology 54: 341-352.<br />
Balazs, G.H. 1985. Impact of ocean debris on marine turtle in the Hawaiian Islands. pp. 387-429. In: R.S. Shomura and H.O.<br />
Yoshida (eds.) In: Proceedings of the Workshop on the Fate and Impact of <strong>Marine</strong> Debris. NOAA Technical Memorandum<br />
NOAA-TM-NMFS-SWFC-45.<br />
Balboa, C.M. 2002. The United States consumption of ornamental fish: a preliminary analysis of import data. Final report for<br />
NOAA grant NFFKP300-2-00010. World Resources Institute, Washington, DC. 46 pp.<br />
Barber, C.V. and V.R. Pratt. 1997. Sullied Seas: Strategies for Combatting Cyanide Fishing in Southeast Asia and Beyond,<br />
World Resources Institute. 57 pp.<br />
Barnes, D.K.A. 2002. Invasions by marine life on plastic debris. Nature 416 (6883): 808-809.<br />
Barnes, D.K.A. and K.P.P. Fraser. 2003. Rafting by five phyla on man-made flotsam in the Southern Ocean. <strong>Marine</strong> Ecology<br />
Progress Series 262: 289-291.<br />
Belausteguigoitia, J.C . 2004. Causal chain analysis and root causes: The GIWA approach. AMBIO 33 (1-2): 7-12.<br />
Bellwood, D.R., T.P. Hughes, C. Folke and M. Nystrom. 2004. Confronting the coral reef crisis. Nature 429: 827-833.<br />
Birkeland, C.E. 1982. Terrestrial runoff as a cause of outbreaks of Acanthaster planci (Echinodermata: Asteroidea). <strong>Marine</strong><br />
Biology 69: 175-185.<br />
Birkeland, C.E. (ed.) 1997. Life and death of coral reefs. Chapman and Hall, New York. 536 pp.<br />
Birkeland, C.E. 1997. Status of coral reefs in the Marianas. pp. 91-100. In: R.W. Grigg and C. Birkeland (eds.) Status of Coral<br />
Reefs in the Pacific. Sea Grant College Program, University of Hawaii.<br />
Birkeland, C.E., P. Craig, G. Davis, A. Edward, Y. Golbuu, J. Higgins, J. Gutierrez, N. Idechong, J. Maragos, K. Miller, G. Paulay,<br />
R. Richmond, A. Tafileichig and D. Turgeon. 2000. Status of coral reefs of American Samoa and Micronesia: U.S.-affiliated and<br />
Freely Associated islands of the Pacific. pp. 199-217. In: C. Wilkinson (ed.) Status of Coral Reefs of the World 2000. Australian<br />
Institute of <strong>Marine</strong> Science.<br />
Boland, R.C. and M.J. Donohue. 2003. <strong>Marine</strong> debris accumulation in the nearshore marine habitat of the endangered Hawaiian<br />
monk seal, Monachus schauinslandi 1999-2001. <strong>Marine</strong> Pollution Bulletin 46 (11): 1385-1394.<br />
Brainard, Russell. Pacific Islands Fisheries Science Center, Coral Reef Ecosystem Division. Honolulu, HI. Personal communication.<br />
Brown, B.E. 1997. Disturbances to reefs in recent times. pp. 354-379. In: C. Birkeland (ed.) Life and Death of Coral Reefs.<br />
Kluwer Academic Publishers.<br />
Bruckner, A.W. 2001. Tracking the Trade in Ornamental Coral Reef Organisms: The Importance of CITES and its limitations.<br />
Aquarium Sciences and Conservation 3 (1-3): 79-94.<br />
Threats<br />
page<br />
37
Threats<br />
page<br />
38<br />
The State of Coral Reef Ecosystems of the United States and Freely Associated States: <strong>2005</strong><br />
Bruckner, A.W. 2003. Sustainable Management Guidelines for Stony Coral Fisheries. pp. 167-184. In: Cato, J. and C. Brown<br />
(eds.) <strong>Marine</strong> ornamental species collection, culture and conservation. Blackwell Scientific. Iowa State University Press,<br />
Iowa.<br />
Bruckner, A.W. 2004. Coral health and mortality: Recognizing the signs of coral diseases and predators. Undersea Journal.<br />
First quarter 2004.<br />
Bruckner A.W., R.J. Bruckner and E.H. Williams. 1997. Spread of a black-band disease epizootic through the coral reef system<br />
in St. Ann’s Bay, Jamaica. Bulletin of <strong>Marine</strong> Science 61: 918-928.<br />
Bruckner, A.W. and R.J. Bruckner. 2003. Condition of coral reefs off less developed coastlines of Curaçao (stony corals and<br />
algae). Atoll Research Bulletin 496: 370-393.<br />
Bruckner, A.W. and R.J. Bruckner 2004. Impact of yellow-band disease (YBD) on Montastraea annularis (species complex)<br />
populations on remote reefs off Mona Island, Puerto Rico. Abstract. In: Proceedings of the 10th International Coral Reef Symposium.<br />
Bryant, D., L. Burke, J. McManus and M. Spaulding. 1998. Reefs at Risk: A Map-Based Indicator of Threats to the World’s<br />
Coral Reefs. World Resources Institute Report. 56 pp<br />
Bythell, J., M. Barer, R. Cooney, J. Guest, A. O’donnell, O. Pantos and M. Le Tissier. 2002. Histopathological methods for the<br />
investigation of microbial communities associated with disease lesions in reef corals. Letters in Applied Microbiology 34 (5):<br />
359-364.<br />
Carlton, J.T. 2001. Introduced species in U.S. Coastal waters: Environmental Impacts and Management Priorities. Pew Oceans<br />
Commission, Arlington, FL.<br />
Carreiro-Silva, M. and T.R. McClanahan. 2001 Echinoid bioerosion and herbivory on Kenyan coral reefs: the role of protection<br />
from fishing. Journal of Experimental <strong>Marine</strong> Biology and Ecology 262 (2): 133-153.<br />
Carter and Burgess, Inc., 2002. Planning for Sustainable Tourism in Hawaii. Part 1: Infrastructure and Environmental Overview<br />
Study. Prepared for the State of Hawaii Department of Business, Economic Development and Tourism. Honolulu. 141 pp.<br />
Cesar, H., P. van Beukering, S. Pintz and J. Dierking. 2002. Economic Valuation of the Coral Reefs of Hawaii: Final Report (FY<br />
2001-2002). Hawaii Coral Reef Initiative Research Program. University of Hawaii, Honolulu.<br />
Chiappone, M., A. White, D.W. Swanson and S.L. Miller. 2002. Occurrence and Biological Impacts of Fishing Gear and Other<br />
<strong>Marine</strong> Debris in the Florida Keys. <strong>Marine</strong> Pollution Bulletin 44: 597-604.<br />
Cicin-Sain B., R.W. Knecht and N. Foster (eds.). 1999. Trends and Future Challenges for U.S. National Ocean and Coastal<br />
Policy. National Oceanic and Atmospheric Administration, Silver Spring, Maryland. 142 pp.<br />
Cicin-Sain, B and R.W. Knecht. 2000. The Future of U.S. Ocean Policy: Choices for the New Century. Island Press, Washington,<br />
DC. 416 pp.<br />
CENR (Committee on Environment and Natural Resources, Subcommittee on Ecological Systems). 2001. Ecological Forecasting:<br />
Agenda for the Future. Washington, DC. 12 pp.<br />
Connell, J.H. 1978. Diversity in tropical rain forests and coral reefs. Science 199: 1302-1310.<br />
Connell, J.H. 1979. Tropical rain forests and coral reefs as open non-equilibrium systems. pp. 141-163. In: R.M. Anderson,<br />
B.D. Turner and L.R. Taylor (eds.) Population Dynamics, Symposium of British Ecological Society. Blackwell Science Publications,<br />
Oxford, England.<br />
Corredor, J.E., J.M. Morell and C.E. del Castillo, 1990. Persistence of spilled crude oil in a tropical intertidal environment. <strong>Marine</strong><br />
Pollution Bulletin 21: 385-388.<br />
Culliton, T.J., M.A. Warren, T.R. Goodspeed, D.G. Remer, C.M. Blackwell and J.J. McDonough, III. 1990. 50 years of population<br />
change along the Nation’s coasts, 1960-2010. National Oceanic and Atmospheric Administration Coastal Trends Series.<br />
Rockville, MD. 41 pp.<br />
Darwin, C. 1842. The Structure and Distribution of Coral Reefs. Being the First Part of the Geology of the Voyage of the<br />
‘Beagle.’ Smith, Elder and Co., London.<br />
Davis, G.E. 1977. Anchor Damage to a Coral Reef on the Coast of Florida. Biological Conservation 11: 29-34.<br />
De’ath G. and P.J. Moran. 1998. Factors affecting the behaviour of crown-of-thorns starfish (Acanthaster planci) on the Great<br />
Barrier Reef 2: Feeding preferences. Journal of Experimental <strong>Marine</strong> Biology and Ecology 220 (1): 107-126.<br />
Deslarez, K.J.P., R. Nawojchik, D.J. Evans, C.J. McGarrity and P. Gehring. 2004. The condition of fringing reefs off former military<br />
bombing ranges at Isla de Culebra and Isla de Vieques, Puerto Rico. Report prepared for the U.S. Department of Defense,<br />
U.S. Navy. 24 pp.
The State of Coral Reef Ecosystems of the United States and Freely Associated States: <strong>2005</strong><br />
Donohue, M.J., R.C. Boland, C.M. Sramek and G.A. Antonelis. 2001. Derelict Fishing Gear in the Northwest Hawaiian Islands:<br />
Diving Surveys and Debris Removal in 1999 Confirm Threat to Coral Reef Ecosystems. <strong>Marine</strong> Pollution Bulletin 42 (12):<br />
1301-1312.<br />
Dulvy, N.K., R.P. Freckleton and N.V.C. Polunin. 2004. Coral reef cascades and the indirect effects of predator removal by<br />
exploitation. Ecology Letters 7: 410-416.<br />
Dustan, P., B.H. Lidz and E.A. Shinn, 1991. Impact of Exploratory Wells, Offshore Florida: A Biological Assessment. Bulletin of<br />
<strong>Marine</strong> Science 48 (1): 94-124.<br />
Ebersole, J.P. 2001. Recovery of Fish Assemblages From Ship Groundings On Coral Reefs in the Florida Keys National <strong>Marine</strong><br />
Sanctuary. Bulletin of <strong>Marine</strong> Science 69 (2): 655-671.<br />
Eldredge, L.G. and R.K. Kropp. 1985. Volcanic ashfall effects on intertidal and shallow water coral reef zones at Pagan, Mariana<br />
Islands. pp. 4: 195-200. In: Proceedings of the 5th International Coral Reef Congress.<br />
English, D., W.A. Kriesel, V.R. Leeworthy and P.C. Wiley. 1996. Economic Contribution of Recreating Visitors to the Florida<br />
Keys/Key West. Athens, GA: USDA Forest Service, Southern Research Station, Outdoor Recreation and Wilderness Assessment<br />
Group. University of Georgia, Department of Agricultural and Applied Economics, Athens, GA; and National Oceanic and<br />
Atmospheric Administration, Strategic Environmental Assessments Division, Silver Spring, MD. 22 pp.<br />
Feely, R.A., C.L. Sabine, K. Lee, W. Berelson, J. Kleypas, V.J. Fabry and F.J. Millero. 2004. Impact of anthropogenic CO2 on<br />
the CaCO 3 system in the oceans. Science 305 (5682): 362-366.<br />
Friedlander, A.M. and E.E. DeMartini. 2002. Contrasts in density, size, and biomass of reef fishes between the northwester and<br />
the main Hawaiian islands: the effects of fishing down apex predators. <strong>Marine</strong> Ecology Progress Series 230: 253-264.<br />
Genin A., B. Lazar and S. Brenner. 1995. Atmospheric cooling, unusual vertical mixing and coral mortality following the eruption<br />
of Mt. Pinatubo. Nature 377: 507-510.<br />
Gill-Agudelo, D. and J. Garzón-Ferreira. 2001. Spatial and seasonal variations of dark-spots disease in coral communities of<br />
the Santa Marta area (Columbian Caribbean). Bulletin of <strong>Marine</strong> Science 69: 619-630.<br />
Gitschlag, G.R. and B.A. Herczeg. 1994. Sea turtle observations at explosive removals of energy structures. <strong>Marine</strong> Fisheries<br />
Review 56 (2): 1-8.<br />
Graham, T. 2001. A collaborative strategy to address the live reef food fish trade. Asia-Pacific Coastal <strong>Marine</strong> Program, Report<br />
0101. The Nature Conservancy, Honolulu.<br />
Green, E.P. and A.W. Bruckner. 2000. The significance of coral disease epizootiology for coral reef conservation. Biological<br />
Conservation 96 (3): 347-361.<br />
Guzman, H.M., K.A. Burns and J.B.C. Jackson, 1994. Injury, regeneration and growth of Caribbean reef corals after a major<br />
oil spill in Panama. <strong>Marine</strong> Ecology Progress Series 10: 231-241.<br />
Harvell, C.D., K. Kim, J.M. Burkholder, R.R. Colwell, P.R. Epstein, D.J. Grimes, E.E. Hofmann, E.K. Lipp, A.D.M.E. Osterhaus,<br />
R.M. Overstreet, J.W. Porter, G.W. Smith and G.R. Vasta. 1999. Emerging <strong>Marine</strong> Diseases--Climate Links and Anthropogenic<br />
Factors. Science 285: 1505-1510.<br />
Hawkins, J.P. and C.M. Roberts. 1993. Effects of Recreational scuba diving on coral reefs: trampling on reef-flat communities.<br />
Journal of Applied Ecology. 30: 25-30.<br />
Hawkins, J.P., C.M. Roberts, T. Van’T Hof, K. De Meyer, J. Tratalos and C. Aldam. 1999. Effects of Recreational Scuba Diving<br />
on Caribbean Coral and Fish Communities. Conservation Biology 13 (4): 888-897.<br />
Hay, M.E. 1984. Patterns of fish and urchins grazing on Caribbean coral reefs: are previous results typical? Ecology 65: 446-<br />
454.<br />
Helton, D. 2003. Wreck Removal: A Federal Perspective. In: National Salvage Conference Proceedings. Available from the<br />
internet URL: http://response.restoration.noaa.gov/dac/vessels/docs/Helton_salvage2003.<strong>pdf</strong>.<br />
Helton, D. and I. Zelo. 2003. Developing Information and Support Necessary to Prioritize and Support Removal of Abandoned<br />
Vessels Impacting Coral Resources. In: Proceedings of the 13th Biennial Coastal Zone Conference.<br />
Henderson, J.R. 2001. A Pre- and Post- MARPOL Annex V Summary of Hawaiian Monk Seal Entanglement and <strong>Marine</strong> Debris<br />
Accumulation in the Northwestern Hawaiian Islands, 1982-1998. <strong>Marine</strong> Pollution Bulletin 42 (7): 584-589.<br />
Hoegh-Guldberg, O. 1999. Climate change, coral bleaching and the future of the world’s coral reefs. <strong>Marine</strong> and Freshwater<br />
Research 50: 839-866.<br />
Houston, J.R. 1995. The Economic Value of Beaches. Coastal Engineering Research Center. Volume CERC-95-4.<br />
Threats<br />
page<br />
39
Threats<br />
page<br />
40<br />
The State of Coral Reef Ecosystems of the United States and Freely Associated States: <strong>2005</strong><br />
Hughes, T.P. 1985. Life histories and population dynamics of early successional corals. pp. 101-106. In: Proceedings of the 5th<br />
International Coral Reef Symposium.<br />
Hughes, T.P. 1994. Catastrophes, phase-shifts, and large-scale degradation of a Caribbean coral reef. Science 265: 1547-<br />
1551<br />
Hughes T.P. and J.H. Connell. 1999. Multiple stressors on coral reefs: A long-term perspective. Limnology and Oceanography<br />
44: 932-940.<br />
Intergovernmental Panel on Climate Change. 2001. Climate Change 2001: The Scientific Basis, Contribution of Working<br />
Group I to the Third Assessment Report of the Intergovernmental Panel on Climate Change (IPCC). J.T. Houghton, Y. Ding,<br />
D.J. Griggs, M. Noguer, P.J. van der Linden and D. Xiaosu (eds.). Cambridge University Press. 944 pp.<br />
International Petroleum Industry Environmental Conservation Association (IPIECA). 2000. Biological Impacts of Oil Pollution:<br />
Coral Reefs. Available from the internet URL: http://www.ipieca.org.<br />
IPIECA (International Pertoleum Industry Environmental Conservation Association). 1992. Biological Impacts of Oil Pollution:<br />
Coral Reefs. International Pertoleum Industry Environmental Conservation Association. IPIECA Report Series, Volume 3.<br />
London, England. 17 pp.<br />
Jackson, J.B.C., M.X. Kirby, W.H. Berger, K.A. Bjorndal, L.W. Botsford, B.J. Bourque, R.H. Bradbury, R. Cooke, J. Erlandson,<br />
J.A. Estes, T.P. Hughes, S. Kidwell, C.B. Lange, H.S. Lenihan, J.M. Pandolfi, C.H. Peterson, R.S. Steneck, M.J. Tegner and<br />
R.R. Warner. 2001. Historical overfishing and the recent collapse of coastal ecosystems. Science 293: 629-638.<br />
Jennings, S. and N.V.C Polunin. 1996. Impacts of fishing on tropical reef ecosystems. Ambio 25: 44-49.<br />
Jennings, S. and N.V.C. Polunin. 1997. Impacts of predator depletion by fishing on the biomass and diversity of non-target reef<br />
fish communities. Coral Reefs 16: 71-82<br />
Johannes, R.E. and M. Riepen. 1995. Environmental, economic and social implications of the live reef fish trade in Asia and<br />
the Western Pacific. Report to the Nature Conservancy and the South Pacific Commission. 83 pp.<br />
Johns, G.M., V.R. Leeworthy, F.W. Bell and M.A. Bonn. 2003. Socioeconomic study of reefs in southeast Florida October 19,<br />
2001 as revised April 18, 2003. National Oceanic and Atmospheric Administration, National Ocean Service. Silver Spring, MD.<br />
255 pp.<br />
Jokiel, P.L. 1985. Lunar periodicity of planulae release in the reef coral Pocillopora damicornis in relation to various environmental<br />
factors. pp. (4): 289-293. In: Proceedings of the 5th International Coral Reef Symposium.<br />
Kim, K. and C.D. Harvell. 2001. Aspergillosis of Sea Fan Corals: Disease Dynamics in the Florida Keys. pp. 813-824. In: Porter,<br />
J.W. and K.G. Porter [eds.]. The Everglades, Florida Bay, and Coral Reefs of the Florida Keys: An Ecosystem Sourcebook.<br />
CRC Press, New York.<br />
Kleypas, J.A., R.W. Buddemeier, D. Archer, J.P. Gattuso, C. Langdon and B.N. Opdyke. 1999. Geochemical consequences of<br />
increased atmospheric carbon dioxide on coral reefs. Science 284: 118-119.<br />
Knowlton, N. 2001. The future of coral reefs. pp. 5419–5425 In: Proceedings of the National Academy of Science 98.<br />
Knowlton, N., J.C. Lang and B.D. Keller. 1990. Case study of natural population collapse: post-hurricane predation on Jamaican<br />
staghorn corals. Smithsonian Contributions to the <strong>Marine</strong> Sciences 31: 1-25.<br />
Kojis B.L. and N.J. Quinn. 1985. Puberty in Goniastrea favulus. Age or size limited? pp. (4): 289-283. In: Proceedings of the<br />
5th Internatinal Coral Reef Symposium.<br />
Kuta, K.G. and L.L. Richardson. 1996. Abundance and distribution of black band disease on coral reefs in the northern Florida<br />
Keys. Coral Reefs. 15: 219-223.<br />
Kuta, K.G. and L.L. Richardson. 2002. Ecological aspects of black band disease of corals: relationship between disease incidence<br />
and environmental factors. Coral Reefs 21 (4): 393-398.<br />
Larkin, S. 2003. The U.S. Wholesale <strong>Marine</strong> Ornamental Market: Trade, Landings, and Market Opinions. pp. 77-89. In: <strong>Marine</strong><br />
Ornamental Species: Collection, Culture and Conservation. Iowa State Press.<br />
Larkin, S. and R. Degner. 2001. “The U.S. Wholesale Market for <strong>Marine</strong> Ornamentals.” Aquarium Sciences and Conservation<br />
3 (1/3): 13-24.<br />
Lassig, B.R. 1983. The effects of cyclonic storms on coral reef fish assemblages. Environmental Biology of Fishes 9 (1): 55-<br />
63.<br />
Lau, P.P.F. and R. Parry-Jones. 1999. The Hong Kong trade in live reef fish for food. Traffic East Asia and the World Wildlife<br />
Fund for Nature Hong Kong.<br />
LaVoie, D.M., L.D. Smith and G.M. Ruiz. 1999. The potential for intracoastal transfer of nonindigenous species in the ballast<br />
water of ships. Estuarine Coastal and Shelf Science 48: 551-564.
The State of Coral Reef Ecosystems of the United States and Freely Associated States: <strong>2005</strong><br />
Leeworthy, V.R. and P.C. Wiley. 1997. A Socioeconomic Analysis of the Recreation Activities of Monroe County Residents in<br />
the Florida Keys/Key West. National Oceanic and Atmospheric Administration, National Ocean Service, Silver Spring, MD. 49<br />
pp.<br />
Lesser, M.P. and S. Lewis. 1996. Action spectrum for the effects of UV radiation on photosynthesis in the hermatypic coral<br />
Pocillopora damicornis. <strong>Marine</strong> Ecology Progress Series 134 (1-3): 171-177.<br />
Lessios, H.A., D.R. Robertson and J.D. Cubit. 1984. Spread of Diadema mass mortality throughout the Caribbean. Science<br />
226: 335-337.<br />
Liu, G, A.E. Strong, W. Skirving and L.F. Arzayus, 2004. Overview of NOAA Coral Reef Watch Program’s Near-Real Time Global<br />
Satellite Coral Bleaching Monitoring Activities. In: Proceedings of the 10th International Coral Reef Symposium, Okinawa.<br />
Lourey, M.L., D.A.J. Ryan and I.R. Miller. 2000. Rates of decline and recovery of coral cover on reefs impacted by, recovering<br />
from and unaffected by crown-of thorns starfish Acanthaster planci: a regional perspective of the Great Barrier Reef. <strong>Marine</strong><br />
Ecology Progress Series 196: 176-186.<br />
Maniwavie, T.J. Rewald, J. Aitsi, T.P. Wagner and P.L. Munday. 2001. Recovery of corals after volcanic eruptions in Papua New<br />
Guinea. Coral Reefs 20 (1): 24.<br />
Marshall, N, S A.H. Milledge and P.S. Afonso. 2001. Trade review. Stormy seas for marine invertebrates. Trade in sea cucumbers,<br />
seashells and lobsters in Kenya, Tanzania and Mozambique. TRAFFIC East/Southern Africa. Nairobi, Kenya 70 pp.<br />
McClanahan, T.R. 1995. A coral reef ecosystem-fisheries model: impacts of fishing intensity and catch selection on reef structure<br />
and processes. Ecological Modelling. 80: 1-19.<br />
McClanahan, T.R. 2000. Recovery of a coral reef keystone predator, Balistapus undulatus, in East African marine parks. Biological<br />
Conservation 94: 191-198<br />
McManus, J.W., L.A.B. Meñez, K.N.K. Reyes, S.G. Vergara and M.C. Ablan. 2000. Coral reef fishing and coral-algal phase<br />
shifts: implications for global reef status. ICES Journal of <strong>Marine</strong> Science, 57 (3): 572 -578.<br />
Miller, S.L., G.B. McFall and A.W. Hulbert, 1993. Guidelines and recommendations for coral reef restoration in the Florida Keys<br />
National <strong>Marine</strong> Sanctuary. National Undersea Research Center. University of North Carolina at Wilmington. 38 pp.<br />
Minerals Management Service. 2002. OCS Oil Spill Facts. Available from the internet URL: http://www.mms.gov/stats/<br />
PDFs/2002_OilSpillFacts.<strong>pdf</strong>.<br />
Minerals Management Service. 2004. E.O. 13089-The Flower Garden Banks. Available from the internet URL: http://www.<br />
mms.gov/eppd/compliance/13089/banks.htm.<br />
Moore, C. 2003. Trashed-Across the Pacific Ocean, plastics, plastics, everywhere. Natural History 112 (9): 46-51.<br />
NRC (National Research Council). 1996. Stemming the Tide: Controlling Introductions of Nonindigenous Species by Ships’<br />
Ballast Water. National Academy Press, Washington, DC.<br />
Naughton, J. 1995. Inshore Fisheries and Fishery Habitat, Sea Turtles, and <strong>Marine</strong> Mammals. In: An Evaluation of the Nearshore<br />
Coral Reef Resources of Kahoolawe, Hawaii. Chapter 4. National <strong>Marine</strong> Fisheries Service, NOAA. http://cramp.wcc.<br />
hawaii.edu/Study_Sites/Kahoolawe/An_Evaluation_of_the_Nearshore_Coral_Reef_Resources_of_Kahoolawe/CHAP4.asp.<br />
Negri, A.P., L.D. Smith, N.S. Webster and A.J. Heyward. 2002. Understanding ship-grounding impacts on a coral reef: potential<br />
effects of anti-foulant paint contamination on coral recruitment. <strong>Marine</strong> Pollution Bulletin 44: 111-117.<br />
Nemeth R.S. and J.S. Nowlis. 2001. Monitoring the effects of land development on the near-shore reef environment of St.<br />
Thomas, USVI. Bulletin of <strong>Marine</strong> Science 69 (2): 759-775.<br />
NMFS (National <strong>Marine</strong> Fisheries Service). 2004, Annual Report to Congress on the Status of U.S. Fisheries – 2003. National<br />
Oceanic and Atmospheric Administration, NMFS. Silver Spring, MD. 24 pp.<br />
NOAA (National Oceanic and Atmospheric Administration). 1997. NOAA Coral Reef Initiative. Silver Spring, MD. 12 pp.<br />
NOAA (National Oceanic and Atmospheric Administration). 2002a. A National Coral Reef Action Strategy: Report to Congress<br />
on implementation of the Coral Reef Conservation Act of 2002 and the National Action Plan to Conserve Coral Reefs in 2002-<br />
2003. NOAA. Silver Spring, Maryland.<br />
NOAA (National Oceanic and Atmospheric Administration). 2002b. Environmental Assessment: M/V Wellwood Grounding<br />
Site Restoration. Florida Keys National <strong>Marine</strong> Sanctuary, Monroe County, Florida. NOAA, <strong>Marine</strong> Sanctuaries Division. Silver<br />
Spring, MD. 10 pp.<br />
NOAA (National Oceanic and Atmospheric Administration). 2004. Coral Reef Initiative. From the internet url: http://www.publicaffairs.noaa.gov/cri.<strong>pdf</strong>.<br />
Threats<br />
page<br />
41
Threats<br />
page<br />
42<br />
The State of Coral Reef Ecosystems of the United States and Freely Associated States: <strong>2005</strong><br />
NOAA CSC (National Oceanic and Atmospheric Administration, Coastal Services Center). 2004. Hawaii Balances Use and<br />
Sustainability of Hanuama Bay. NOAA, Coastal Services Center (CSC). Available from the internet URL: http://www.csc.noaa.<br />
gov/techniques/recreation/hanauma.html.<br />
NRC (National Research Council). 2001. NRC Committee on the Science of Climate Change, Climate Change Science: An<br />
Analysis of Some Key Questions. National Academy Press, Washington, D.C.<br />
Ocean Conservancy. 2003. Offshore Oil and Gas Leasing, Exploration, and Development. Available from the internet URL:<br />
http://www.oceanconservancy.org.<br />
Olsgard, F. and J.S. Gray. 1995. A comprehensive analysis of the effects of offshore oil and gas exploration and production on<br />
the benthic communities of the Norwegian continental shelf. <strong>Marine</strong> Ecology Progress Series 122: 277-306.<br />
Ormond, R.F.G., R. Bradbury, S. Bainbridge, K. Fabricus, J. Keesing, L. De Vantier, P. Medley, and A. Steven. 1991. Test of<br />
a model of regulation of Crown-of-Thorns starfish by fish predators. In: R.H. Bradbury (ed.) Acanthaster and the coral reef: a<br />
theoretical perspective. Springer-Verlag, Berlin.<br />
Pandolfi, J.M., R.H Bradbury, E. Sala, T.P. Hughes, K.A. Bjorndal, R.G. Cooke, D. McArdle, L. McClenachan, M.J.H. Newman,<br />
G. Paredes, R.R. Warner and J.B.C. Jackson. 2003. Global trajectories of the long-term decline of coral reef ecosystems. Science<br />
301: 955-958.<br />
Patin, S. 2004. Decommissioning, abandonment and removal of obsolete offshore installations. Available from the internet<br />
URL: http://www.offshore-environment.com/abandonment.html.<br />
Patterson, K.L., J.W. Porter, K.B. Ritchie, S.W. Polson, E. Mueller, E.C. Peters, D.L. Santavy and G.W. Smith. 2002. The etiology<br />
of white pox, a lethal disease of the Caribbean elkhorn coral, Acropora palmata. pp. 99 (13): 8725-8730. In: Proceedings<br />
of the National Academy of Sciences.<br />
Pauly, D., V. Christensen, J. Dalsgaard, R. Froese and F. Torres Jr. 1998. Fishing down marine food webs. Science 279: 861-<br />
863.<br />
Pearson, P.N. and M.R. Palmer, 2000, Atmospheric carbon dioxide concentrations over the past 60 million years. Nature 406:<br />
695.<br />
Perrine, D. 1989. Reef fish feedings: amusement or nuisance? Sea Frontiers 35 (5): 272-279.<br />
Petit, J.R., J. Jouzel, D. Raynaud, N.I. Barkov, J.-M. Barnola, I. Basile, M. Benders, J. Chappellaz, M. Davis, G. Delayque, M.<br />
Delmotte, V.M. Kotlyakov, M. Legrand, V.Y. Lipenkov, C. Lorius, L. Pépin, C. Ritz, E. Saltzman and M. Stievenard. 1999. Climate<br />
and atmospheric history of the past 420,000 years from the Vostok ice core, Antarctica. Nature 399: 429-436.<br />
Pew Oceans Commission. 2003. America’s living oceans: charting a course for sea change. Pew Oceans Commission, Arlington,<br />
VA. Available from the Internet URL: http://www.pewoceans.org.<br />
Pickett, S.T.A. and P.S. White. 1985. Patch dynamics: a synthesis. pp. 371 – 384. In: S.T.A. Pickett and P.S. White (eds.) The<br />
ecology of natural disturbance and patch dynamics. Academic Press, Orlando.<br />
Pimental, D., R. Zuniga and D. Morrison. In press. Update on the environmental and economic costs associated with alieninvasive<br />
species in the United States. Ecological Economics.<br />
Plathong, S., G.J. Inglis and M.E. Huber. 2000. Effects of Self-Guided Snorkeling Trails on Corals in a Tropical <strong>Marine</strong> Park.<br />
Conservation Biology. 14 (6): 1821-1830.<br />
Pomerance, R. 1999. Coral bleaching, coral mortality, and global climate change, U.S. Bureau of Oceans and International<br />
Environmental and Scientific Affairs. Available from the internet url: http://www.state.gov/www/global/global_issues/coral_<br />
reefs/990305_coralreef_rpt.html.<br />
Porter, J.W. and J.I. Tougas. 2001. Reef ecosystems: threats to their biodiversity. Encyclopedia of Biodiversity 5: 73-95<br />
Pratchett M.S. 2001. Influence of coral symbionts on feeding preferences of crown-of-thorns starfish. <strong>Marine</strong> Ecology Progress<br />
Series 214: 111-119.<br />
Precht, W.F. 1998. The art and science of reef restoration. Geotimes. 43 (1): 16-20.<br />
Precht, W.F., R.B. Aronson and D.W. Swanson. 2001. Improving Scientific Decision-Making In the Restoration of Ship-Grounding<br />
Sites on Coral Reefs. Bulletin of <strong>Marine</strong> Science. 69 (2): 1001-1012.<br />
Richardson, L.L. 1998. Coral diseases: what is really known. Trends in Ecological Evolution 13: 438-443.<br />
Richardson L.L, W.M. Goldberg, R.G. Carlton and J.C. Halas. 1998. Coral disease outbreak in the Florida Keys: Plague type<br />
II. Revista de Biologica Tropical 46 (5): 187-198.<br />
Richardson, L.L. and R.A. Aronson. 2002. Infectious diseases of reef corals. In: Proceedings of the 9th International Coral Reef<br />
Symposium.
The State of Coral Reef Ecosystems of the United States and Freely Associated States: <strong>2005</strong><br />
Rinkevich, B. and Y. Loya, 1979. <strong>Laboratory</strong> Experiments on the Effects of Crude Oil on the Red Sea Coral Sylophora pistillata.<br />
<strong>Marine</strong> Pollution Bulletin 10: 328-330.<br />
Roblee, M.B., T.R. Barber, P.R. Carlson, M.J. Durako, J.W. Fourqurean, L.K. Muehlstein, D. Porter, L.A. Yarboro, L.A. Zieman<br />
and R.T. Zieman. 1991. Mass mortality of the tropical seagrass Thalassia testudinum in Florida Bay (USA). <strong>Marine</strong> Ecology<br />
Progress Series 71: 297-299.<br />
Rogers, C.S. 1990. Reponses of coral reefs and reef organisms to sedimentation. <strong>Marine</strong> Ecology Progress Series 62: 185-<br />
202.<br />
Rogers, C.S. 1993. Hurricanes and coral reefs: the intermediate disturbance hypothesis revisted. Coral Reefs 12: 127-137.<br />
Rogers, C.S., L.N. McLain and E. Zullo. 1988. Damage to coral reef in the Virgin Islands National Park and Biosphere Reserve<br />
from recreational activities. Proceedings from the 6th International Coral Reef Symposium. 2: 405-410.<br />
Rouphael, A.B. and G.J. Inglis. 2001. Take only photographs and leave only footprints: an experimental study of the impacts of<br />
underwater photographers on coral reef dive sites. Biological Conservation 100: 281-287.<br />
Rouphael A.B. and G.J. Inglis. 2002. Increased spatial and temporal variability in coral damage caused by recreational scuba<br />
diving. Ecological Applications 12(2): 427-440.<br />
Ruiz, G.M., P.W. Fofonoff, J.T. Carlton, M.J. Wonham and A.H. Hines. 2000. Invasion of coastal marine communities in North<br />
America: apparent patterns, processes, and biases. Annual Review of Ecology and Systematics 31: 481-531.<br />
Sadovy, Y.J., T.J. Donaldson, T.R. Graham, F. McGilvray, G.J. Muldoon, M.J. Phillips, M.A. Rimmer, A. Smith and B. Yeeting.<br />
2004. While stocks last: The live reef food fish trade. Asian Development Bank, Manila. 147 pp.<br />
Sale, P.F. 2002. The Science we need to develop more effective management. pp. 361-376. In: P.F. Sale (ed.) Coral Reef<br />
Fishes: Dynamics and Diversity in a Complex Ecosystem. Academic Press, San Diego.<br />
Sammarco, P.W. 1982. Echinoid grazing as a structuring force in coral communities: whole reef manipulations. Journal of Experimental<br />
<strong>Marine</strong> Biology and Ecology 61: 31-55.<br />
Sano, M. 2000. Stability of reef fish assemblages: Responses to coral recovery after catastrophic predation by Acanthaster<br />
planci. <strong>Marine</strong> Ecology Progress Series 198: 121-130.<br />
Santavy, D.L. and E.C. Peters. 1997. Microbial pests: Coral disease in the western Atlantic. pp. 1: 607-612. In: Proceedings of<br />
the 8th International Coral Reef Symposium.<br />
Santavy, D.L., E.C. Peters and C. Quirolo. 1999. Yellow-blotch disease outbreak on reefs of the San Blas Islands, Panama.<br />
Coral Reefs 18 (1): 97.<br />
Schultz, S. 1998. Passenger Ship May Have Destroyed Coral Reef off Mexico. Shipping International 1: 1-2.<br />
Shaked, Y., A. Agnon, B. Lazar, S. Marco, U. Avner and M. Stein. 2004. Large earthquakes kill coral reefs at the north-west Gulf<br />
of Aqaba. Terra Nova 16 (3): 133-138.<br />
Shigenaka, G. 2001. Toxicity of oil to reef-building corals: a spill response perspective. National Oceanic and Atmospheric<br />
Administration Technical Memorandum, National Ocean Service, Office of Research and Restoration 8. Seattle. 87 pp.<br />
Shomura, R.S. 1987. Hawaii’s <strong>Marine</strong> Fisheries Resources: Yesterday (1900) and Today (1986). NMFS Southwest Fisheries<br />
Science Center Administrative Report H-87-21. NMFS, SFSC, St. Petersburg, FL. 15 pp.<br />
Silva-Iniguez, L. and D.W. Fischer. 2003. Quantification and classification of marine litter on the municipal beach of Ensenada,<br />
Baja California, Mexico. <strong>Marine</strong> Pollution Bulletin 46 (1): 132-138.<br />
Smith, S.H. 1998. Cruise ships: A Serious Threat to Coral Reefs and Associated Organisms. Ocean and Shoreline Management.<br />
(11): 231-248.<br />
Smith, S.R., D.C. Hellin and S.A. McKenna. 1998. Patterns of Juvenile Coral Abundance, Mortality, and Recruitment at the<br />
M/V Wellwood and M/V Elpis Grounding Sites and Their Comparison to Undisturbed Reefs in the Florida Keys. Final Report<br />
to NOAA Sanctuary and Reserves Division and the National Undersea Research Program. University of North Carolina, Wilmington.<br />
42 pp.<br />
Spaulding, M.D., C. Ravilious and E.P. Green. 2001. World Atlas of Coral Reefs. UNEP World Conservation Monitoring Centre.<br />
University of California Press, Berkley. 424 pp.<br />
Spurgeon, J.P.G. 1992. The Economic Valuation of Coral Reefs. <strong>Marine</strong> Pollution Bulletin 24 (11): 529-536.<br />
Sultzman, C. 2002. A Professional Jury Report on the Biological Impacts of Submarine Fiber Optic Cables on Shallow Reefs<br />
off Hollywood, Florida. Report to PEER.<br />
Sutherland, K.P., J.W. Porter and C. Torres.2004. Disease and immunity in Caribbean and Indo-Pacific zooxanthellate corals.<br />
<strong>Marine</strong> Ecological Progress Series 266: 265-272.<br />
Threats<br />
page<br />
43
Threats<br />
page<br />
44<br />
The State of Coral Reef Ecosystems of the United States and Freely Associated States: <strong>2005</strong><br />
Szmant, A.M. 1997. Nutrient effects on coral reefs: a hypothesis on the importance of topographic and trophic complexity to<br />
reef nutrient dynamics. pp. (2): 1527-1532. In: Proceedings of the 8th International Coral Reef Symposium.<br />
Tissot, B.N. and L.E. Hallacher. 1999. Impact of aquarium collectors on reef fishes in Kona, Hawaii. Final report. Department<br />
of Land and Natural Resources, State of Hawaii, Honolulu. 32 pp.<br />
Turgeon, D.D., R.G. Asch, B.D. Causey, R.E. Dodge, W. Jaap, K. Banks, J. Delaney, B.D. Keller, R. Speiler, C.A. Matos, J.R.<br />
Garcia, E. Diaz, D. Catanzaro, C.S. Rogers, Z. Hillis-Starr, R. Nemeth, M. Taylor, G.P. Schmahl, M.W. Miller, D.A. Gulko, J.E.<br />
Maragos, A.M. Friedlander, C.L. Hunter, R.S. Brainard, P. Craig, R.H. Richond, G. Davis, J. Starmer, M. Trianni, P. Houk, C.E.<br />
Birkeland, A. Edward, Y. Golbuu, J. Gutierrez, N. Idechong, G. Paulay, A. Tafileichig and N. Vander Velde. 2002. The State of<br />
Coral Reef Ecosystems of the United States and Pacific Freely Associated States: 2002. National Oceanic and Atmospheric<br />
Administration/National Ocean Service/National Centers for Coastal Ocean Science, Silver Spring, MD. 265 pp.<br />
UNEP (United Nations Environmental Programme). 2004. Available from the internet URL: http://www.uneptie.org/pc/tourism/<br />
sensitive/coral-threats.htm.<br />
UNEP (United Nations Environmental Programme). 2002. Industry as a partner for sustainable development: tourism. Earthprint:<br />
England. 76 pp.<br />
U.S. Census Data. 1990. http://www.census.gov/main/www/cen1990.html.<br />
U.S. Census Data. 2000. http://www.census.gov/main/www/cen2000.html.<br />
U.S. Commission on Ocean Policy. 2004. Preliminary Report of the U.S. Commission on Ocean Policy - Governor’s Draft.<br />
USCRTF (United States Coral Reef Task Force). 1999. Coastal Uses Working Group Summary Report. November 1999. U.S.<br />
Coral Reef Task Force. Washington, D.C. 170 pp.<br />
USCRTF (United States Coral Reef Task Force). 2000. The National Action Plan to Conserve Coral Reefs. Washington, D.C.<br />
34 pp.<br />
U.S. Department of Defense. 2000. Coral Reef Protection Implementation Plan. Washington, D.C. 61 pp. plus appendices.<br />
Available from the internet URL: https://www.denix.osd.mil/denix/Public/ES-Programs/Conservation/Legacy/Coral-Reef/Plan/<br />
coralreef.html.<br />
Wabnitz, C, M. Taylor, E. Green and T. Razak. 2003. From Ocean to Aquarium. UNEP-WCMC, Cambribge, U.K. 64 pp.<br />
Wells, S.M. 1989. Impacts of the precious shell harvest and trade: conservation of rare or fragile resources. pp. 443-454. In:<br />
J.F. Caddy (ed.) <strong>Marine</strong> Invertebrate Fisheries: their assessment and management. John Wiley and Sons, Inc., New York.<br />
Westmacott, S., K. Teleki, S. Wells and J. West. 2000. Management of bleached and severely damaged coral reefs. IUCN,<br />
Gland, Switzerland and Cambridge, UK. vii + 36 pp.<br />
Whitfield, P.E., T. Gardner, S.P. Vives, M.R. Gilligan, W.R. Courtenay, G.C. Ray and J.A. Hare. 2002. Biological invasion of the<br />
Indo-Pacific lionfish (Pterois volitans) along the Atlantic coast of North America. <strong>Marine</strong> Ecology Progress Series 235: 289-<br />
297.<br />
Wilcove, D.S., D. Rothstein, J. Dubow and A. Phillips and E. Losos. 1998. Quantifying threats to imperiled species in the United<br />
States. BioScience 48: 607-615.<br />
Wilkinson, C. (ed.). 1998. Status of Coral Reefs of the World: 1998. Australian Institute of <strong>Marine</strong> Science, Townsville, Australia.<br />
Available from the internet URL: http://www.aims.gov.au/scr1998.<br />
Wilkinson, Clive (ed.). 2002. Status of Coral Reefs of the World: 2002. Australian Institute of <strong>Marine</strong> Science, Townsville, Australia.<br />
357 pp. Available from the internet URL: http://www.reefbase.org/<strong>pdf</strong>/GCRMN/GCRMN2000.<strong>pdf</strong>.<br />
Wilson, P. and D.P. Wheeler. 1997. California’s Ocean Resources: An Agenda for the Future. The Resources Agency of California.<br />
Wood, E.M. 2001. Collection of coral reef fish for aquaria: Global trade, conservation issues and management strategies. <strong>Marine</strong><br />
Conservation Society, Ross-on-Wye, UK.<br />
Woodley CM, A.W. Bruckner, S.B. Galloway, S.M. McLaughlin, C.A. Downs, J.E. Fauth, E.B. Shotts and K.L. Lidie. 2003. Coral<br />
Disease and Health: A National Research Plan. National Oceanic and Atmospheric Administration, Silver Spring, MD. 72 pp.<br />
Zobrist, E.C. 1998. Coral Reef Restoration and Protection from Vessel Groundings. In: GERS Meeting Abstracts.
The State of Coral Reef Ecosystems of the U.S. Virgin Islands<br />
The State of Coral Reef Ecosystems of the U.S. Virgin Islands<br />
Christopher F.G. Jeffrey 1 , Ursula Anlauf 2 , James Beets 3 , Sheri Caseau 4 , William Coles 2 , Alan M. Friedlander 1,5 , Steve<br />
Herzlieb 6 , Zandy Hillis-Starr 7 , Matthew Kendall 1 , Violeta Mayor 2 , Jeffrey Miller 4 , Richard Nemeth 6 , Caroline Rogers 8 ,<br />
Wesley Toller 2<br />
INTRODUCTION AND SETTING<br />
Coral reef ecosystems in the U.S. Virgin Islands (USVI) consist of a mosaic of habitats, namely coral and other<br />
hardbottom areas, seagrasses, and mangroves that house a large diversity of organisms. These biologically<br />
rich ecosystems provide important ecosystem services (e.g., shoreline protection) and support valuable socio-economic<br />
activities (e.g., fishing and tourism), but they are also affected directly and indirectly by these<br />
activities. This chapter presents an assessment of the current status of coral reef ecosystems in the USVI. It<br />
provides a comprehensive review of historic and current literature and long-term datasets that describe coral<br />
reef ecosystems of the territory. It also provides data synthesized from current monitoring programs conducted<br />
by Federal and territorial organizations.<br />
The USVI comprises three large main islands and several smaller islands (Figure 4.1). St. Croix – the largest<br />
island – is 207 km 2 in size. St. Thomas is the second largest island at 83 km 2 , and St. John is the third largest<br />
at 52 km 2 . The geologically dissimilar islands lie between two major island archipelagos: the older Greater<br />
Antilles to the west and the younger Lesser Antilles to the east. St. Thomas and St. John are more similar to<br />
the Lesser Antilles than to Puerto Rico with which they share an extensive shallow water platform (Adey et al.,<br />
1977). St. Croix geologically belongs to the Greater Antilles but is isolated by the Virgin Islands Trough that is<br />
over 4,000 m deep (NOAA National Geophysical Data Center, http://www.ngdc.noaa.gov/mgg/gdas/gd_<br />
sys.html, accessed: 11/2/2004). Managed areas in coastal waters of the three main islands exist to protect,<br />
maintain, or restore natural and cultural resources (Figure 4.1).<br />
Reefs in St. Thomas and St. John generally form fringing, patch, or spur and groove formations that are distributed<br />
patchily around the islands (see Figure 4.20). The eastern and southern shores of St. Croix are protected<br />
by well-developed barrier reef systems with near-emergent reef crests that separate lagoons from off-shore<br />
bank areas (Adey, 1975; Hubbard et al., 1993). Bank reefs and scattered patch reefs occur on geological<br />
features at greater depths offshore. Recently, the National Oceanic and Atmospheric Administration (NOAA)<br />
mapped 485 km 2 of benthic habitats in the USVI to a nominal depth of 30 m. Analyses of these maps revealed<br />
that coral reef and hard-bottom habitats comprise 300 km 2 (61%), submerged aquatic vegetation covers 161<br />
km 2 (33%), and unconsolidated sediments comprise 24 km 2 (4%) of shallow water areas (Kendall et al., 2001;<br />
Monaco, 2001; http://biogeo.nos.noaa.gov, accessed 1/19/05).<br />
1 NOAA National Ocean Service, Center for Coastal Monitoring and Assessment, Silver Spring, MD<br />
2 Virgin Islands Department of Planning and Natural Resources, St. Croix, USVI.<br />
3 University of Hawaii, HI<br />
4 National Park Service, St. John, USVI<br />
5 Oceanic Institute, HI<br />
6 University of the Virgin Islands Center for <strong>Marine</strong> Environmental Studies, St. .Thomas, USVI.<br />
7 National Park Service, St. Croix, USVI<br />
8 US Geological Survey, St. John, USVI.<br />
U.S. Virgin Islands<br />
Sidebar<br />
page<br />
45
U.S. Virgin Islands<br />
page<br />
46<br />
Figure 4.1. A map of the USVI showing managed areas, municipalities, and other locations mentioned in this chapter. Map: A. Shapiro.
ENVIRONMENTAL AND ANTHROPOGENIC STRESSORS<br />
The State of Coral Reef Ecosystems of the U.S. Virgin Islands<br />
Coral reefs in the USVI face similar pressures as reefs elsewhere in the Caribbean (Rogers and Beets, 2001).<br />
Of the 13 major coral reef stressors identified by the U.S. Coral Reef Task Force, 10 have been identified<br />
as being problematic to reef ecosystems in the territory. These stressors include climate change; diseases;<br />
tropical storms; coastal development and runoff; coastal pollution; tourism and recreation; fishing; and ships,<br />
boats, and groundings. The impacts of these stressors on USVI coral reefs are summarized in this chapter.<br />
Other stressors such as alien species, security activities, and offshore oil activities are not relevant to the<br />
USVI. Stressors are described fully in Chapter 3 of this report.<br />
Climate Change and Coral Bleaching<br />
Climate change refers to the trend of<br />
increasing mean global air temperature<br />
and sea surface temperatures<br />
(SST) within the last century compared<br />
with previous estimates. This<br />
warming trend is generally attributed<br />
to the atmospheric accumulation of<br />
greenhouse gases. Bleaching in the<br />
USVI has been reported since 1987<br />
(Figure 4.2). Bleaching was most<br />
severe and had the highest reported<br />
incidence of occurrence during the<br />
Caribbean-wide event of 1998-1999.<br />
According to the U.S. National Park<br />
Service (NPS), the 1998 bleaching<br />
event coincided with the highest recorded<br />
SSTs in the USVI. Bleaching<br />
was less severe in 1999 probably<br />
because water temperatures were<br />
slightly lower (28.8ºC) during that<br />
year. The 1999 bleaching event did<br />
not result in extensive coral colony<br />
mortality because most colonies recovered<br />
within six months of being<br />
bleached (Nemeth and Sladek-Nowlis,<br />
2001; Nemeth et al., 2003c). For<br />
both years, bleaching was most severe<br />
in St. Croix, followed by St. John,<br />
and then St. Thomas (Figure 4.2).<br />
Diseases<br />
Several diseases have affected coral<br />
community structure and have degraded<br />
coral cover (Table 4.1). Between<br />
1976 and 1989, white band<br />
disease (WBD), bleaching, and hurricanes<br />
reduced the cover of elkhorn<br />
coral (Acropora palmata) by as much<br />
as 85% within the Virgin Islands Na-<br />
tional Park (VINP) and the Buck Is-<br />
Figure 4.2. Annual trends in coral bleaching in the USVI. Upper panel shows the<br />
number of bleaching reports by year and severity. Arrows indicate the Caribbeanwide<br />
bleaching event of 1998-1999. Source: Reefbase 2003, http://www.reefbase.<br />
org, Accessed: 10/23/2003. Lower panel shows the estimated percent of coral tissues<br />
that bleached in 1998-1999. Bars represent the maximum percent of sampled coral<br />
colonies that bleached by island and year. Source: Rogers and Miller, 2001; Nemeth<br />
et al., 2003c.<br />
land Reef National Monument (BIRNM; Gladfelter et al., 1977; Rogers et al., 1982; Edmunds and Witman,<br />
1991; Bythell et al., 1992; Rogers and Beets, 2001). Between December 1997 and May 2001, 14 species of<br />
U.S. Virgin Islands<br />
Sidebar<br />
page<br />
47
U.S. Virgin Islands<br />
page<br />
48<br />
The State of Coral Reef Ecosystems of the U.S. Virgin Islands<br />
Table 4.1. Diseases affecting coral reef organisms in the U.S. Caribbean and Florida. Source: Bruckner, 2001.<br />
DISEASE DESCRIPTION CAUSATIVE<br />
AGENT<br />
Aspergillosis Irregular lesion(s) of various sizes<br />
distributed throughout the sea fan blade<br />
due to loss of tissue and skeleton. Tissue<br />
surrounding the lesion often becomes<br />
dark purple and may have nodules, both<br />
of which occur in response to a variety<br />
of stressors. Identification of this disease<br />
requires confirmation of the presence of<br />
white fungal filaments.<br />
Black band Crescent shaped or circular band of black<br />
filamentous material separating living,<br />
colored coral tissue from white exposed<br />
coral skeleton.<br />
Dark spots Dark purple, gray, or brown circular or<br />
irregular patches of discolored tissue<br />
scattered on the surface of a colony or at<br />
the colony’s margin. The discolored tissue<br />
increases in size and radiates outward<br />
as the area first affected dies. Darkened<br />
polyps often are depressed and appear<br />
smaller in size than normal polyps.<br />
Red band-I Narrow band or mat of filamentous<br />
cyanobacteria that advances slowly across<br />
the surface of a coral and kills living tissue<br />
as it progresses. It is similar in appearance<br />
to black band disease, in that it forms a<br />
distinctive band that separates live coral<br />
tissue from bare white skeleton.<br />
Red band-II During daylight, the filaments spread out<br />
like a net in a diffuse fashion over live<br />
tissue and bare skeleton; at night the band<br />
forms a compact balled-up mat at the<br />
interface between live tissue and exposed<br />
skeleton.<br />
White band Coral tissue peels or sloughs off from coral<br />
skeleton in a uniform band, from the base<br />
of the colony upwards. A second form<br />
(WBD-II) exhibits a transient zone between<br />
apparently healthy tissue and exposed<br />
skeleton that consists of bleached but<br />
intact tissue.<br />
White<br />
plague<br />
complex<br />
(Types I, II,<br />
and III)<br />
Similar to white band in that an abrupt line<br />
of exposed (white) coral skeleton separates<br />
living tissue from dead coral colonized by<br />
algae.<br />
Fungus<br />
(Aspergillus<br />
sydowii)<br />
Cyanobacteria,<br />
Sulfideoxidizing<br />
bacteria,<br />
Sulfatereducing<br />
bacteria<br />
NUMBER<br />
<strong>OF</strong> <strong>CORAL</strong><br />
SPECIES<br />
AFFECTED<br />
10+ (Weil<br />
and Smith,<br />
2003)<br />
<strong>CORAL</strong> SPECIES<br />
AFFECTED<br />
Common sea fan<br />
(Gorgonia ventalina),<br />
Venus sea fan (G.<br />
flabellum), and<br />
other branching<br />
gorgonians including<br />
Pseudoterigorgia spp.<br />
20 Several soft corals<br />
and 20 hard corals<br />
including boulder star<br />
corals (Montastraea<br />
annularis complex)<br />
and symmetrical<br />
brain coral (Diploria<br />
strigosa)<br />
Unknown 3 or 4 Massive starlet coral<br />
(Siderastrea siderea),<br />
blushing star coral<br />
(Stephanocoenia<br />
intersepta), and<br />
Montastraea annularis<br />
complex<br />
Cyanobacteria 14 or more Lettuce corals<br />
(Agaricia spp.),<br />
boulder brain coral<br />
(Colpophyllia natans),<br />
cactus corals<br />
(Mycetophyllia spp.),<br />
blushing star coral,<br />
the common seafan<br />
(Gorgonia ventalina)<br />
Cyanobacteria 6 D. strigosa, C.natans,<br />
M. annularis, M.<br />
cavernosa, Porites<br />
astreoides, and<br />
Siderastrea radians<br />
Unknown 3 Elkhorn and staghorn<br />
corals (Acropora spp.)<br />
Plague type II<br />
is caused by<br />
a bacterium<br />
(Aurantamonus<br />
coralicida);<br />
the cause of<br />
Plague types<br />
I and III is still<br />
unknown<br />
32 or more At least 32 species<br />
including brain corals<br />
(Diploria spp. and C.<br />
natans), cactus corals<br />
(Mycetophyllia spp.),<br />
the elliptical star coral<br />
(Dichocoenia stokesii),<br />
star corals, and starlet<br />
coral (Siderastrea<br />
siderea)<br />
RATE <strong>OF</strong><br />
INFECTION<br />
(MM PER<br />
DAY)<br />
Unknown<br />
1 - 20<br />
Unknown<br />
Unknown<br />
Unknown<br />
5<br />
3 - 200
The State of Coral Reef Ecosystems of the U.S. Virgin Islands<br />
Table 4.1 (con’t.). Diseases affecting coral reef organisms in the U.S. Caribbean and Florida. Source: Bruckner, 2001.<br />
DISEASE DESCRIPTION CAUSATIVE<br />
AGENT<br />
White pox White circular lesions on the surface of<br />
infected colonies.<br />
Yellow<br />
blotch<br />
Pale, circular blotches of translucent tissue<br />
or a narrow band of pale tissue at the<br />
colony margin surrounded by normal, fully<br />
pigmented tissue. Infected tissue dies, and<br />
exposed skeleton is colonized by algae.<br />
Serratia<br />
marcescens<br />
Figure 4.3. Mean monthly and annual frequency of disease occurrence on Tektite<br />
Reef, St. John, over 42 months. Source: Miller et al., 2003.<br />
NUMBER<br />
<strong>OF</strong> <strong>CORAL</strong><br />
SPECIES<br />
AFFECTED<br />
<strong>CORAL</strong> SPECIES<br />
AFFECTED<br />
1 Elkhorn coral (A.<br />
palmata)<br />
Unknown 3 Boulder star corals<br />
(Montastraea spp.)<br />
and the brain coral<br />
(Colpophyllia natans)<br />
RATE <strong>OF</strong><br />
INFECTION<br />
(MM PER<br />
DAY)<br />
250 -1,050<br />
hard coral in the VINP were infected<br />
with the white plague type II, a newly<br />
identified disease (Miller et al., 2003;<br />
Weil and Smith, 2003). Miller et al.<br />
(2003) observed a new incidence of<br />
white plague type II every month, although<br />
the monthly frequency of infections<br />
decreased during the study<br />
(Figure 4.3). A disease-causing fungus,<br />
Aspergillis sydowii, has been<br />
isolated from air samples taken during<br />
African dust storms and has been<br />
infecting sea fans on reefs in the<br />
USVI (Garrison et al., 2003).<br />
Tropical Storms<br />
Tropical storms are a major force structuring coral reef communities in the Caribbean. Storms have the capacity<br />
to degrade reefs in several ways. They increase terrestrial runoff, sedimentation, and pollution affecting<br />
coral reefs, and cause extensive physical damage to the substratum. Several hurricanes have affected USVI<br />
reefs since 1979, but Hurricanes David (1979) and Hugo (1989) were the most severe and destructive (Figure<br />
4.4). The eye of David – a category five hurricane - traveled about 160 km southwest of St. Croix; the eye<br />
of Hugo – a category four hurricane – passed directly over the island (Figure 4.4). Damage to reefs varied<br />
with storm path, strength and velocity, wave height and direction, the dominant coral species, and reef depth<br />
(Rogers et al., 1997; Bythell et al., 2000). The strongest evidence of storm damage to reefs was observed<br />
at Lameshur Bay, St. John, and Buck Island, St. Croix. Hurrincane David resulted in large stands of elkhorn<br />
coral on reef crests being replaced by mounds of dead elkhorn coral rubble at both Lameshur Bay and Buck<br />
Island (Rogers et al., 1982; Beets et al., 1986). In Lameshur Bay, Hurricane Hugo caused significant declines<br />
in total live coral cover, including star coral (Montastrea annularis), a dominant and slow growing coral species<br />
(Edmunds, 1991; Rogers et al., 1991). At Buck Island, Hurricane Hugo resulted in significant declines in cover<br />
of M. annularis and Porites porites at depths of 8–10 m, although M. annularis suffered greater mortality from<br />
predation and tissue necrosis over a two-year period than from physical damage from the hurricane (Bythell et<br />
al., 1993; Bythell et al., 2000). Hurricane Hugo also reduced areas on the south side of Buck Island to rubble<br />
pavement and moved the reef crest off the island’s south side 30 m landward (Hubbard, 1991).<br />
< 1<br />
U.S. Virgin Islands<br />
Sidebar<br />
page<br />
49
U.S. Virgin Islands<br />
page<br />
50<br />
The State of Coral Reef Ecosystems of the U.S. Virgin Islands<br />
Figure 4.4. Hurrcanes that affected the coral reef ecosystems in the USVI between<br />
1979 and 2001. Storm names are followed by year of occurrence and storm category<br />
on the Saffir-Simpson hurricane scale. H1 to H5 = Hurricane categories one through<br />
five. Arrows indicate the direction and path of the storms. Map: A. Shapiro. Source:<br />
NOAA Coastal Services Center.<br />
Fifteen years after Hurricane Hugo,<br />
reefs in Lameshur Bay still have not<br />
shown significant increases in live<br />
coral cover (Rogers et al., 1997; C.<br />
Rogers, pers. obs.; J. Miller, pers.<br />
obs.). Exposure by Hugo of new<br />
substrates for colonization, coupled<br />
with a reduction in abundance of<br />
urchins and herbivorous fishes that<br />
consume macroalgae, may have facilitated<br />
extensive growth of macroalgae<br />
(Lessios et al., 1984; Levitan,<br />
1988; Rogers et al., 1997). Macroalgae<br />
inhibit settlement and survival of<br />
coral recruits and growth by existing<br />
colonies, and mean benthic cover of<br />
macroalgae sometimes reaches over<br />
30% in the affected areas (Lessios et<br />
al., 1984; Levitan, 1988; Rogers et<br />
al., 1997). At Buck Island, recovery<br />
of elkhorn coral damaged by Hurricane<br />
David was hindered by WBD<br />
and by Hurricane Marilyn in 1995<br />
(Rogers et al., 1982; Rogers et al.,<br />
2002). Some recruitment of elkhorn<br />
coral has occurred since the 1995<br />
hurricane (Bythell et al., 2000; Rogers<br />
et al., 2002).
The State of Coral Reef Ecosystems of the U.S. Virgin Islands<br />
Coastal Development and Runoff<br />
Sedimentation associated with runoff from coastal development poses a serious threat to water quality in the<br />
USVI. In St. Thomas and St. John, the problem is worsened by the steep terrain of the islands (80% of the<br />
slopes exceed 30° in incline), and runoff from unpaved roads after intense rain showers is considered the largest<br />
contributor of eroded sediments to coastal waters (CH2M Hill Inc., 1979; Anderson and MacDonald, 1998;<br />
IRF, 1999). Although published data on the temporal increase and spatial extent of coastal development in<br />
the USVI are scarce, unplanned and poorly regulated development for a growing population, and a booming<br />
tourism industry may have taken a toll on coral reef ecosystems through the years (see Tourism and Recreation<br />
section). Nemeth and Sladek-Nowlis (2001) monitored the impacts of a hotel development on a nearby<br />
fringing coral reef at Caret Bay, St. Thomas (Figure 4.5) monthly for two years. The hotel construction site was<br />
on a steep hillside less than 50 m from the shoreline. The landward edge of the reef was 75-140 m from the<br />
shoreline. Rates of sedimentation, changes in water quality, and changes in the abundance and diversity of<br />
corals and other reef organisms were measured along five permanent transects from July 1997 to March 1999.<br />
Sediment loads and suspended solids<br />
were highest at ravine outlets and<br />
sheltered locations, increased during<br />
large rainfall events, and decreased<br />
after buildings and road pavements<br />
were completed. Live coral cover<br />
along the entire reef tract declined<br />
about 14% and was lowest at sites<br />
with the highest rates of sedimentation<br />
(Figure 4.6).<br />
Severe rainfall events are problematic<br />
and can overwhelm existing sewer<br />
and stormwater systems. During November<br />
2003, a low pressure system<br />
dropped 38 cm of rain in five days<br />
throughout the territory and contributed<br />
to the formation of large sediment<br />
plumes along developed areas<br />
of the coastline. Sediment plumes<br />
resulted in a decline in water quality,<br />
elevated turbidity on nearby reefs<br />
and seagrass beds, and forced the<br />
closure of swimming beaches. Additionally,<br />
wastewater disposal and<br />
sewage systems frequently malfunction<br />
and discharge raw sewage into<br />
nearshore areas. Despite the many<br />
environmental problems associated<br />
with coastal development, major development<br />
projects adjacent to environmentally<br />
sensitive habitats are<br />
being proposed and welcomed by<br />
government officials as boosters of<br />
the economy. Such projects may exacerbate<br />
existing problems of coastal<br />
pollution and runoff, and ultimately<br />
may harm the islands’ economy that<br />
is at least partly dependent on the<br />
health of their natural resources.<br />
Figure 4.5. A large mound of dirt was excavated from a construction site located less<br />
than 100 m from the shoreline at Solitude Bay, St. Croix. Photo: C. Jeffrey.<br />
Figure 4.6. Percent change in live coral cover as a function of increasing rate of<br />
sedimentation at Caret Bay, St. Thomas. Data were collected from five permanent<br />
transects at Caret Bay Reef between July 1997 and March 1999 before, during, and<br />
after the construction of the Caret Bay Villas. The decline in live coral was significant<br />
(p
U.S. Virgin Islands<br />
page<br />
52<br />
The State of Coral Reef Ecosystems of the U.S. Virgin Islands<br />
Coastal Pollution<br />
Coastal pollution has led to several days of beach closings in the USVI. In 1999, the USVI was ranked third<br />
in the number of beach closings per year among U.S. States and Territories with 307 beach-closing days (National<br />
Resources Defense Council, http://www2.nrdc.org/water/oceans/ttw/sumvi.<strong>pdf</strong>, Accessed: 11/10/2004).<br />
Beach closings decreased to eight days in 2002, but increased tenfold to 80 days in 2003. The continued decline<br />
in coastal water quality has been linked to coastal development and runoff, as well as point and nonpoint<br />
source discharges (USVI DPNR, 2004). In St. Croix, the Virgin Islands rum manufacturing plant discharges<br />
a plume of wastewater that is visible from the discharge point to about 10 km westward along the shoreline.<br />
Biological pollution of coastal water results largely from a failing, overloaded municipal sewage system that<br />
frequently empties sewage directly into nearshore waters as well as the discharge of vessel wastes directly<br />
into the sea by boat owners. Coastal waters also become polluted when groundwater that has been contaminated<br />
by failing septic tanks, sewage infiltration, and petroleum is carried to the marine environment during<br />
flooding after intense rainfall (USVI DPNR, 2004). These pollution problems are worsened by a lack of public<br />
awareness about the importance of USVI waters, which further contributes to the degradation of marine water<br />
quality.<br />
The USVI Department of Planning and Natural Resources (DPNR) conducts a Water Pollution Control Program<br />
to monitor all known point source discharges of pollution such as outfalls, harbors, marinas, and main<br />
recreational areas (USVI DPNR, 2004). The program also evaluates coastal water quality by monitoring<br />
nonpoint source discharges through a signed Memoranda of Agreement and Cooperation with several partner<br />
agencies, including the Virgin Islands Resource Conservation and Development Council, VI Conservation<br />
District, University of the Virgin Islands (UVI), U.S. Geological Survey (USGS), Island Resources Foundation,<br />
the NPS, and the St. Croix Environmental Association (SEA). Additionally, the NPS in St. John and UVI publish<br />
a local newsletter to inform and educate the public on nonpoint source pollution problems (USVI DPNR,<br />
2004).<br />
Tourism and Recreation<br />
Historically dependent on agriculture and trade, the USVI has developed a robust tourism industry during the<br />
last 34 years, which has shifted the islands’ economy to one that is mainly tourism-based. The number of tourist<br />
arrivals to St. Thomas and St. John has quadrupled between 1970 and 2000; tourist arrivals to St. Croix remained<br />
relatively unchanged during the same period (Figure 4.7). In 2000, 108,612 USVI residents were joined<br />
by 2.2 million visitors, but the annual number of tourists has remained fairly constant since then (U.S. Census<br />
Bureau, 2003, http://www.census.gov/prod/cen2000/island/VIprofile.<strong>pdf</strong>, Accessed 3/1/05; USVI Bureau of<br />
Economic Research, http://www.usviber.org,<br />
Accessed 11/7/2004).<br />
Tourism accounts for more than 70%<br />
of the gross domestic product of the<br />
territory, and as in other tourism-dependent<br />
countries, the environmental<br />
costs of tourism are evident. Visible<br />
impacts of increased visitation include<br />
physical damage to habitats,<br />
poor treatment and control of solid<br />
waste and sewage, increased eutrophication,<br />
groundwater depletion and<br />
contamination, increased sediment<br />
loads, and displacement of traditional<br />
resource use (IRF, 1996; Bryant et<br />
al., 1998; Burke and Maidens, 2004).<br />
Snorkeling and diving are major recreational<br />
activities that could cause<br />
physical damage to reefs. For exam-<br />
Figure 4.7. Number of visitors to St. Croix and St. Thomas/St. John between 1970<br />
and 2000. Source: USVI Bureau of Economic Research, http://www.usviber.org, accessed<br />
11/7/04.
The State of Coral Reef Ecosystems of the U.S. Virgin Islands<br />
ple, physical damage to corals has been observed at the BIRNM underwater snorkel trail, which attracts up to<br />
200 visitors per day (Z. Hillis-Starr, pers. obs.). However, the more obvious impact of increased tourism has<br />
been the exacerbation of solid waste disposal problems caused by the high density of tourists and residents<br />
as well as an economy heavily dependent on high energy-consumption.<br />
Tourists, residents, and poorly regulated development also contribute directly and indirectly to coastal pollution.<br />
For example, participation by residents and tourists in diverse marine recreational activities such as<br />
boating, fishing, diving, snorkeling, kayaking and beach camping negatively impact the marine environment in<br />
overpopulated areas. Most reported oil spills in the USVI stem from the refueling of yachts, ferries, and cruise<br />
ships (IRF, 1996). Poor lawn care practices on golf courses, in residential areas, and at tourist resorts are considered<br />
major sources of nitrate and phosphate contamination to nearshore areas through stormwater runoff<br />
(IRF, 1996). Finally, the development of major tourism facilities in coastal areas further threatens the coastal<br />
environment through increased sediment loads from the construction of buildings and roads, the operations of<br />
facilities, and stormwater runoff (IRF, 1996).<br />
More thought and effort is now being given to promoting sustainable tourism. Dive and anchor buoys have<br />
been installed at popular dive sites to reduce the incidence of anchor damage. Environmental education and<br />
outreach is on the agenda of the national and local non-governmental organizations (NGOs), as well as territorial<br />
and Federal government agencies. For example, the NPS, UVI, SEA, and The Nature Conservancy<br />
are providing eco-hikes and other educational tours and programs for the public.<br />
Fishing<br />
Fishery resources have declined in the USVI since the 1960s (e.g., Appeldoorn et al., 1992). Although fishing<br />
is a visible and obvious impact to fisheries species in coral reef ecosystems, less tractable environmental<br />
threats such as habitat degradation or loss and marine pollution have also undoubtedly contributed to the decline<br />
in fisheries. Fishing has a long history in the USVI (Fiedler and Jarvis, 1932). Strongly integrated into the<br />
Virgin Islands culture, fishing provides subsistence, supplemental income, recreation, or full-time employment<br />
to the islanders. Residents and tourists consume a wide variety of marine species in relatively large quantities<br />
(i.e., about 15 kg/person/year; Swingle et al., 1979; Olsen et al., 1984). Resource managers divide the USVI<br />
fisheries into commercial and recreational fishing sectors. Presently, the bulk of information on USVI fisheries<br />
is derived from the commercial sector.<br />
The USVI commercial fishery is artisanal in nature and consists of about 380 registered fishers – 240 on St.<br />
Croix and 140 on St. Thomas and St. John (Brownell, 1971; Brownell and Rainey, 1971; Tobias et al., 2000;<br />
CFMC, 2003; Gordon and Uwate, 2003; Kojis, 2004). Typically, fishers use small, open vessels (6 to 8 m in<br />
length) powered by outboard motors to fish with a variety of gear types and methods, although traps or fish<br />
pots are the most popular gear type (Sylvester and Dammann, 1972; Appeldoorn et al., 1992; Beets, 1997;<br />
Kojis, 2004). Scuba diving is also a common commercial method used to harvest reef fishes (by spear) and<br />
invertebrates (by hand or with snare; CFMC, 2003). In the past decade, gillnets and trammel nets used with<br />
the aid of scuba equipment have become common fishing gear on St. Croix, and annual landing from nets<br />
now exceed annual landings from traps on this island (Tobias and Toller, 2004). USVI commercial fishers must<br />
submit monthly catch records as a stipulation for permit renewal.<br />
Recreational fishing is also very important to the USVI economy. Boat-based recreational fishing may have<br />
contributed as much as $5.9 million in fishing-related expenditures to the local economy in 2000 (UVI EEC,<br />
2002), up from about $90,000 in 1986 (Jennings, 1992). Snappers were the most preferred species-group of<br />
fishers. Collectively, however, much of the reported fishing effort was directed towards pelagic fish species<br />
such as blue marlin, sailfish, dolphinfish, tuna, wahoo, and kingfish (UVI EEC, 2002). The recreational fishery<br />
for pelagics has been routinely monitored for over a decade but is not the subject of this review (see Adams,<br />
1995; Mateo, 2000). Less data exist on the impact of recreational fishing to reef-associated species primarily<br />
because recreational fishers do not obtain fishing permits, and no records are kept on their population size or<br />
activity (Appeldoorn et al., 1992).<br />
U.S. Virgin Islands<br />
Sidebar<br />
page<br />
53
U.S. Virgin Islands<br />
page<br />
54<br />
The State of Coral Reef Ecosystems of the U.S. Virgin Islands<br />
Reef Fish Fishery<br />
Reef fish assemblages and the composition of reef fish landings have changed markedly in the USVI over the<br />
past 40 years (Appeldoorn et al., 1992; Rogers and Beets, 2001). Catanzaro et al. (2002) reviewed the lamentable<br />
collapse of the USVI fishery for Nassau groupers during the 1970s (Olsen and LaPlace, 1978) and red<br />
hind during the 1980s (Beets and Friedlander, 1992). Landings of larger individuals of snappers (Lutjanidae)<br />
and other groupers (e.g., the coney, Epinephelus fulvus) also declined in the 1980s (Appeldoorn et al., 1992).<br />
Although fishery-dependent monitoring data for the 1990s are still unavailable, a growing number of fishery-independent<br />
studies, primarily utilizing visual survey methods, indicate that populations of targeted grouper and<br />
snapper species have not recovered to date (Rogers and Beets, 2001; Beets and Friedlander, 2003; CCMA-<br />
BT, unpublished data; Nemeth et al., 2004). On average, fewer than eight groupers per year were observed<br />
during monitoring of reef fish assemblages at four reference sites within the VINP between 1989 and 2000<br />
(Figure 4.8). Nassau grouper were observed in only 3% of 1,764 visual surveys conducted at the four ref-<br />
erence sites during the entire study<br />
period (Beets and Friedlander, 2003).<br />
Of the 2,292 snappers and groupers<br />
observed during 756 visual fish surveys<br />
within the VINP and the BIRNM,<br />
less than 2% were greater than 35<br />
cm in length (CCMA-BT, unpublished<br />
data). On nearshore reefs throughout<br />
the USVI, Nemeth et al. (2003c) also<br />
found a similar trend where snappers<br />
and groupers larger than 40 cm were<br />
mostly absent from the fish assemblage.<br />
Densities of snappers and<br />
groupers averaged five and three<br />
fish/100 m 2 , respectively, with the<br />
most common size class of both families<br />
being 11-20 cm (Nemeth et al.,<br />
2003c). In contrast, the herbivorous<br />
fishes (e.g., Acanthuridae and Scaridae)<br />
dominated the fish assemblage<br />
with average densities between 10-<br />
20 fish/100 m 2 .<br />
Figure 4.8. Abundance trends in groupers (Serranidae) among the four reference<br />
sites around St. John, U.S. Virgin Islands, from 1989-2000. Source: Beets and Friedlander,<br />
2003.<br />
Lobster Fishery<br />
The Caribbean spiny lobster, Panulirus argus, is a species of tremendous commercial and recreational importance<br />
in the USVI. Spiny lobsters accounted for 6% of total reported landings in 1998-1999 (Tobias, 2000) and<br />
its commercial value probably exceeds that of any other single reef-associated species in the USVI. Although<br />
Bohnsack et al. (1991) concluded that USVI lobster populations appeared healthy, more recent studies found<br />
a 10% decrease in mean size between 1997 and 2000, which suggests that overfishing is occurring (Tobias,<br />
2000; Mateo and Tobias, 2002). The Virgin Islands Division of Fish and Wildlife (DFW) routinely monitors<br />
commercial lobster landings (weight and carapace length) and has periodically monitored lobster recruitment<br />
around St. Thomas, where recruitment appears to be highly variable but generally low (Gordon and Vasques,<br />
in press). Limited field surveys around St. John also indicate that average lobster size and density have decreased<br />
since 1970 (Wolf, 1998).<br />
Conch Fishery<br />
The queen conch, Strombus gigas, forms an important fishery in the USVI. During the 1990s, conch accounted<br />
for about 2% of total USVI landings, with most conch landed on St. Croix (5% of total St. Croix landings) and<br />
less landed on St. Thomas and St. John (0.4% of total landings on St. Thomas and St. John; Valle-Esquivel,<br />
2002). The value of reported USVI commercial conch landings in 1998-99 was about $340,000 (Tobias et<br />
al., 2000). In the USVI, commercial fishers harvest queen conch by hand, primarily by scuba diving, although<br />
some conch are also harvested by free diving (Rosario, 1995). Very little information exists presently on the<br />
recreational harvest of conch, but concerns about declining stocks have been voiced for over 20 years (Wood
The State of Coral Reef Ecosystems of the U.S. Virgin Islands<br />
and Olsen, 1984; Valle-Esquivel, 2002). Although numerous territorial regulations were enacted in 1988 to<br />
protect conch stocks including a five-year closure of the fishery on St. Thomas and St. John, conch stocks<br />
have either not shown significant recovery or have continued to decline in the USVI (Friedlander, 1997; Gordon,<br />
2002).<br />
It is difficult to separate out the causal factors of fishery decline in the USVI. Overfishing, technological advances<br />
in fishery gear (larger boats, more powerful engines, and improved gear), and the deterioration of<br />
habitats may have contributed to significant changes in the community structure of reef fish assemblages and<br />
the observed decline in fishery yields. Several studies have documented the failure of existing regulations and<br />
a lack of enforcement in protecting reef fishes or reversing the declines in the abundance of preferred species<br />
such as the large groupers and snappers (Beets,1996; Wolff, 1996; Garrison et al., 1998; Rogers and Beets,<br />
2001). Likewise, other studies have identified sedimentation and pollution as major factors in the decline of<br />
nearshore reef ecosystems, which may have contributed to the decline of fisheries species (deGraaf and<br />
Moore, 1987; Rogers and Beets, 2001).<br />
On a more positive note, some USVI fisheries are beginning to show small signs of recovery. Since the closure<br />
of an important red hind spawning aggregation site south of St. Thomas in 1990, the average size of red<br />
hind from the St. Thomas fishery increased significantly from 26 cm to over 34 cm total length in 2003 (Nemeth,<br />
in review). Moreover, tag and release studies conducted by the UVI on a red hind spawning aggregation<br />
near a shelf-edge reef south of St. Thomas found that 78% of the fish were over 35 cm, 50% over 37.5 cm,<br />
and fish greater than 40 cm (Nemeth, unpublished data). In March 2004, scientists at UVI discovered the first<br />
evidence of a Nassau grouper spawning aggregation reestablishing itself south of St. Thomas. Underwater<br />
surveys estimated that up to 100 Nassau groupers have aggregated and showed signs of reproductive activity<br />
(Nemeth, in review). Unfortunately local fishers have targeted this unprotected reef for the past several years<br />
and fishing mortality may seriously threaten this Nassau spawning aggregation. In this same area, yellowfin<br />
grouper, tiger grouper, and cubera snapper have all been seen forming large spawning aggregations (Nemeth,<br />
in review).<br />
Trade in Coral and Live Reef Species<br />
The trade in coral and live species is a minor problem in the USVI and has not received as much attention as<br />
it has in other U.S. jurisdictions with coral reef ecosystems. The trade in live coral and fishes is prohibited by<br />
the USVI Endangered and Indigenous Species Act of 1990 (Title 12, Chapter 2), the purpose of which is “to<br />
protect, conserve, and manage indigenous fish, wildlife and plants, and endangered or threatened species for<br />
the ultimate benefit of all Virgin Islanders, now and in the future.” Very few permits have been issued for the<br />
harvest or take of live coral and non-commercial or recreational fishes. Issued permits have been for research<br />
and education purposes only. Thus, there are very few exports of live coral (W. Coles, pers. obs.). Locally,<br />
U.S. Customs and Department of Agriculture officials have confiscated small amounts of live coral that had<br />
been recently collected by tourists departing from the territory. A much greater problem is the export of dead<br />
coral (some of which may have been collected alive) and other marine organisms. Considerable amounts<br />
of dead and dried coral, undersized conch, and shells have been confiscated at airports on the islands of St.<br />
Thomas and St. Croix and at the U.S. Postal Service inspection facility in Puerto Rico.<br />
Ships, Boats, and Groundings<br />
Data on the impacts of resource use within the territory are limited, and research on this topic is needed. A<br />
recent assessment of marine resource utilization identified boating as a major recreational activity in the USVI,<br />
and damage from small boats anchored in corals and seagrasses as a primary concern (Link, 1997). A total<br />
of 2,462 private and commercial boats were registered throughout the territory in 2000 (Uwate et al., 2001).<br />
To reduce anchor damage to reefs, the VINP has installed over 300 mooring and protection buoys around<br />
St. John and at the BIRNM. Another local program initiative called “Anchors Away” has recently installed 50<br />
mooring buoys around the island of St. Croix. Additionally, funding from the NOAA Coral Reef Conservation<br />
Program has been approved for additional moorings within the East End <strong>Marine</strong> Park in St. Croix. Boat<br />
groundings are also of concern. In 1988, a cruise ship destroyed 283 m 2 of reef within the VINP, and coral<br />
recovery after 10 years has been minimal (Rogers and Garrison, 2001).<br />
U.S. Virgin Islands<br />
Sidebar<br />
page<br />
55
U.S. Virgin Islands<br />
page<br />
56<br />
The State of Coral Reef Ecosystems of the U.S. Virgin Islands<br />
<strong>Marine</strong> Debris<br />
<strong>Marine</strong> debris has become a problem in the USVI. Debris that washes out to sea via runoff (sewers, street<br />
litter) pollutes the water and shorelines and can be life-threatening to marine organisms and humans. Fishing<br />
line and nets, rope and other trash can wrap around animals and cause drowning, infection, or amputation, or<br />
can settle on hard bottom areas and kill coral colonies. A major landfill that exists along the coast near Sandy<br />
Point, St. Croix receives most of the solid waste from the island. Debris from this landfill – consisting primarily<br />
of fishing lines, bottles, plastic bags and other street litter – is often washed out to sea where it becomes a<br />
health hazard to marine life. The same may be true for landfills on St. Thomas and St. John. The SEA has<br />
organized several beach cleanup campaigns to increase public awareness about marine debris and reduce<br />
the amount of debris that litters the nearshore environment, but this threat is an ongoing concern.<br />
Aquatic Invasive Species<br />
Aquatic invasive species are not recognized as a major threat in this jurisdiction.<br />
Security Training Activities<br />
No security training activities currently occur in this jurisdiction.<br />
Offshore Oil and Gas Exploration<br />
No offshore oil and gas exploration currently occurs in the USVI.
ECOSYSTEM<br />
COMPONENT<br />
Water quality 2000 Water Quality Assessment for the United States<br />
Virgin Islands. 305b Report to the Environmental Protection<br />
Agency.<br />
Water Quality Assessment for the Virgin Islands National<br />
Park, St. John, 1988 to 1998.<br />
Coral Bay Sediment Deposition and Reef Assessment<br />
Study. Report to the USVI Department of Planning and<br />
Natural Resources, Division of Environmental Protection<br />
(USVI DPNR-DEP), Non-Point Source Pollution Grant<br />
Program MOA# NPS-01801 by the Center for <strong>Marine</strong> and<br />
Environmental Studies (Devine et al., 2003).<br />
Benthic habitats Coral Monitoring Program for the Virgin Islands National<br />
Park (Miller et al., 2003).<br />
Elkhorn Coral Monitoring Project (C. Rogers, unpublished<br />
data).<br />
Video monitoring assessment of coral reefs in St. Croix,<br />
USVI. Year I and Year II reports to the USVI DPNR<br />
(Nemeth et al., 2002, 2003a).<br />
Atlantic and Gulf Rapid Reef Assessment Program. A rapid<br />
assessment of coral reefs in the Virgin Islands, Part 1:<br />
stony corals and algae (Nemeth et al., 2003b).<br />
Characterization of benthic habitats in the Virgin Islands<br />
National Park and the Buck Island Reef National<br />
Monument (NOAA, unpublished data).<br />
The State of Coral Reef Ecosystems of the U.S. Virgin Islands<br />
<strong>CORAL</strong> <strong>REEF</strong> ECOSYSTEMS—DATA-GATHERING ACTIVITIES AND RESOURCE CONDITION<br />
This section focuses on resource monitoring activities, data collection and analyses, and summaries of published<br />
studies and data sets to provide an assessment of the current condition of resources in coral reef ecosystems<br />
of the USVI. Information is presented to describe three functional or structural components of coral<br />
reef ecosystems: marine water quality, benthic habitats, and coral reef-associated fauna (Table 4.2). A brief<br />
summary of ongoing research and monitoring programs, methods, results and discussion, and an assessment<br />
of overall condition are presented for each ecosystem component. Locations of monitoring and research efforts<br />
are shown in Figure 4.9.<br />
Table 4.2. Data sets selected for the description of the current condition and status of coral reef ecosystems in the USVI.<br />
Associated<br />
biological<br />
communities<br />
DATA SET SOURCE AGENCY/ORGANIZATION<br />
Characterization of reef fish in the Virgin Islands National<br />
Park and the Buck Island Reef National Monument<br />
(Kendall et al., 2003, Monaco et al., in prep.).<br />
Quantitative estimates of species composition and<br />
abundance of fishes, and fish species/habitat associations<br />
in St. Croix, USVI. Year II report (Nemeth et al., 2003a).<br />
Temporal Analysis of Monitoring Data on Reef Fish<br />
Assemblages inside Virgin Islands National Park and<br />
around St. John, US Virgin Islands, 1988-2000. Report to<br />
USGS/BRD (Beets and Friedlander, 2003).<br />
Atlantic and Gulf Rapid Reef Assessment Program. A rapid<br />
assessment of coral reefs in the Virgin Islands, Part 2:<br />
fishes (Nemeth et al., 2003b).<br />
Department of Planning and Natural Resources,<br />
Division of Environmental Protection (USVI<br />
DPNR-DEP)<br />
NPS and U.S. Geological Survey, Biological<br />
Resource Division (USGS-BRD)<br />
University of the Virgin Islands and USVI DPNR-<br />
DEP<br />
NPS and USGS-BRD<br />
NPS and USGS-BRD<br />
UVI-CMES<br />
UVI-CMES<br />
NOAA CCMA-BT<br />
NOAA CCMA-BT<br />
USVI DPNR-DFWS<br />
NPS<br />
UVI-CMES<br />
U.S. Virgin Islands<br />
Sidebar<br />
page<br />
57
U.S. Virgin Islands<br />
page<br />
58<br />
The State of Coral Reef Ecosystems of the U.S. Virgin Islands<br />
Figure 4.9. Locations of monitoring and research efforts in the USVI between 1988-2004. The boundary of the Buck Island Reef<br />
National Monument was expanded in 2001 from 880 acres to 19,015 acres. Both the original and expanded boundaries are shown.<br />
Water quality monitoring is conducted by the USVI DPNR. Coral monitoring is conducted by NOS, NPS, USGS, USVI DPNR, and<br />
UVI-CMES. Map: A. Shapiro.
WATER QUALITY<br />
USVI DPNR/DEP Water Quality Monitoring<br />
The State of Coral Reef Ecosystems of the U.S. Virgin Islands<br />
Methods<br />
Water sampling in the USVI was initiated by the local health department in 1968. A network of fixed monitoring<br />
stations was selected within the bays and nearshore waters of the islands to target areas of particular<br />
concern, such as outfalls, harbors, marinas, and main recreational areas. The Division of Environmental Protection<br />
(DEP) within the USVI DPNR samples 135 sites quarterly each year (53 around St. Croix, 64 around<br />
St. Thomas, and 18 around St. John). At each monitoring site, water samples are collected at the surface<br />
to measure and record the chemical and physical parameters listed in Table 4.3. All data are uploaded into<br />
STORET, a national online database maintained by the U.S. Environmental Protection Agency (EPA, http://<br />
www.epa.gov/storet/dw_home.html, Accessed: 12/28/2004). Quarterly assessments are also complemented<br />
by periodic assessments of water quality during episodic events (e.g., a sewage bypass), when USVI DPNR-<br />
DEP collects daily samples until acceptable levels of water quality are reestablished.<br />
Table 4.3. Water quality parameters measured by the USVI DPNR-DEP, NPS, and the U.S. Geological Survey.<br />
PARAMETER UNITS COLLECTION METHOD<br />
Temperature ° C In situ - YSI multi parameter meter: surface and near bottom<br />
Dissolved oxygen ml/L In situ - YSI multi parameter meter: surface and near bottom<br />
Salinity Parts per thousand (ppt) In situ - YSI multi parameter meter: surface and near bottom<br />
pH Scale of 1-14 In situ - YSI multi parameter meter: surface and near bottom<br />
Turbidity NTU In situ - YSI multi parameter meter: surface and near bottom<br />
Secchi disk depth Meters (m) In situ - Average depth of Secchi disk (disappearance/appearance)<br />
Total suspended solids mg/L Grab near surface and send to a certified lab<br />
Fecal Coliform / Enterococci number of colonies/100 ml Grab near surface and send to a certified lab<br />
Nutrients mg/L Grab near surface and send to a certified lab<br />
Results and Discussion<br />
Data from the USVI DPNR-DEP water quality monitoring program indicate that water quality in the USVI is<br />
generally good but declining because of an increase in point and nonpoint source pollution (S. Caseau, pers.<br />
obs.). Almost all direct discharges in the USVI were traced to a failing and overloaded municipal sewage system.<br />
Moreover, sewage treatment plants malfunction as the result of human error, old equipment, or unusual<br />
conditions in the raw sewage.<br />
Flooding is a major concern in the Virgin Islands. Watersheds have small areas, steep slopes, and increasing<br />
amounts of impervious surfaces, which in turn can result in high-volume runoff after short periods of intense<br />
rainfall. The territorial system consists of combined sewers, which are pipes designed to carry both raw sewage<br />
and stormwater. When the volume of rain becomes too great, the sewer system becomes overloaded,<br />
and untreated sewage discharge flows into nearby marine waters (Figure 4.10A). In non-urban and suburban<br />
areas, rainwater often flows directly over farms, golf courses, and lawns, washing pathogenic animal waste,<br />
fertilizers, and pesticides into the water. Failure to use effective silt-control devices during construction activities<br />
and improper discharge of waste by boat owners can result in pathogens that pollute beaches in less<br />
densely populated areas (Figures 4.10B, C).<br />
The Virgin Islands rum manufacturing process generates wastewater that is discharged on the south coast<br />
of St. Croix. The effluent typically forms a plume visible from the discharge point to about 10 km westward<br />
along the shoreline. As a result, a strong turbidity and color gradient decreases light penetration, which could<br />
impede normal growth of submerged aquatic vegetation and corals. This effluent may be a reason for the<br />
absence of significant coral reefs within direct influence of the discharge.<br />
U.S. Virgin Islands<br />
Sidebar<br />
page<br />
59
U.S. Virgin Islands<br />
page<br />
60<br />
The State of Coral Reef Ecosystems of the U.S. Virgin Islands<br />
Figure 4.10. Pollution of marine waters in the USVI. Left panel: Flooding of a sewer system in St. Croix after an intense rainfall.<br />
Center panel: Poor land management practices associated with accelerating coastal development in St. John. Right panel: Improper<br />
discharge of gasoline in marine waters from boating activities in St. Thomas. Source: V. Mayor, USVI DPNR-DEP.<br />
NPS and USGS Water Quality Monitoring<br />
Methods<br />
The NPS and USGS conduct assessments of water quality within the VINP in St. John. Monitoring of water<br />
quality within and outside the park began in 1988. Thirty-one sites were originally identified for monitoring but<br />
were reduced to 15 in 1996. Samples are taken every three months at each site for the parameters listed in<br />
Table 4.3. Data through 2000 are available on-line at the EPA STORET website. Data from 2000 through the<br />
present are being processed and analyzed for uploading to STORET (http://www.epa.gov/storet/dw_home.<br />
html, Accessed: 12/28/2004). In June 2000, monthly sampling for Enterococcus spp. and fecal coliform began<br />
at three park swimming beaches.<br />
Results and Discussion<br />
Data collected by the NPS and USGS from 1988-1998 indicate that marine water quality in the VINP is excellent<br />
except at Cruz Bay. Horizontal visibility ranged from 10-20 m. Mean water temperature at 1m depth was<br />
27.9°C with a range of 20.2-31.9°C. At a depth of 10 m, temperature varied from 24.5°C to 30.8°C. Average<br />
salinity was 35 parts per thousand and average conductivity was 54 siemens. <strong>Marine</strong> systems in the region<br />
experience little variation in these parameters. The extinction coefficient of photosynthetically active radiation<br />
(PAR) was approximately 0.18, which is extremely good. Dissolved oxygen over dense seagrass beds was<br />
7-8 mg/L. Dissolved oxygen over barren, muddy substrates (e.g., Cruz Bay) averaged 6.0 mg/L and ranged<br />
between 5.0-7.1 mg/L.<br />
Turbidity, a measure of particles in the water column, has been increasing. Additionally, turbidity was consistently<br />
higher outside the park than in waters inside the park, which may have resulted from sediment erosion<br />
caused by development of land outside the VINP. Total suspended solids (TSS) ranged from 1-15 mg/L adjacent<br />
to heavily disturbed watersheds after large rainfall events. Likewise, nutrient analyses resulted in detectable<br />
levels of micronutrients around mangroves, probably resulting from the natural production of organic<br />
nutrients and in bays adjacent to the most developed watersheds such as Coral Bay, Cruz Bay, and Great<br />
Cruz Bay. Clean, clear water is critical to maintaining healthy coral communities and seagrass beds.<br />
UVI-CMES and USVI DPNR-DEP Coral Bay Study<br />
Methods<br />
The UVI Center for <strong>Marine</strong> and Environmental Studies (UVI-CMES) conducted a descriptive assessment of<br />
sediment deposition and marine water quality in Coral Bay, St. John. Nonpoint source pollution resulting from<br />
runoff contamination, sediment deposition, solid waste, and dumping of unregulated human waste is a common<br />
problem in the Virgin Islands, especially in Coral Bay.
The State of Coral Reef Ecosystems of the U.S. Virgin Islands<br />
Sediment coring and data on TSS were used to provide a rapid assessment of the state of Coral Bay. Sampling<br />
site locations were chosen based on: 1) proximity to expected inputs of terrigenous sediment and 2)<br />
achieving adequate spatial coverage throughout the bay. Sites were concentrated within Coral Harbor, the<br />
area most expected to be impacted by the recent increase in development. Sites outside of the harbor were<br />
chosen as control sites or sites at which to detect point sources of input from recent development. The assessment<br />
of water quality conditions in Coral Bay, Coral Harbor, and at other sites around St. John was based<br />
on a review of TSS data from the NPS water quality monitoring program at the VINP. Detailed descriptions of<br />
the sampling protocol are provided in Devine et al., 2003.<br />
Results and Discussion<br />
Devine et al. (2003) found poor water quality in Coral Bay. Vibracores and surface sediment samples indicated<br />
a seven-fold increase in the sedimentation rate and terrigenous input into Coral Bay as a direct result<br />
of development within the watershed during the last 100 years, and more probably over the past 40 years.<br />
Analyses of sediment samples also suggest that within the last 10-15 years, sedimentation rates in Coral Bay<br />
were 1) 10-20 times greater than the rate of natural sediment deposition averaged over the last 5,000 years<br />
and 2) the plantation era had a very small impact on sediment deposition. TSS was four times higher in Coral<br />
Harbor than the average for all other sampled locations in St. John. Mapping of sediment deposition and data<br />
on water chemistry indicate a growing problem within the harbor and the adjacent Coral Reef National Monument.<br />
Coral Bay, an Area of Particular Concern (APC), is one of the largest watershed drainage areas within the<br />
territory at 1,215 ha (Hubbard et al., 1987; Devine et al., 2003). The area also has the highest recorded rate<br />
of population growth (79%) in the USVI between 1990 and 2000 (U.S. Census Bureau, 2001). The Coral<br />
Bay Watershed has steep slopes that average 18º (several greater than 35º), highly erodable soils, and very<br />
diverse land use along the shoreline (Devine et al., 2003).<br />
Coral Bay has a protected inner harbor with critically valuable fringing mangroves and salt ponds. The area<br />
is also home to a cruising and live-aboard population of between 75-150 boats at any particular time. Many<br />
boats (i.e., 15-20) are permanently anchored to the small mangrove fringe. No pump-out facilities exist to<br />
handle vessel septic waste, no inspections are made of these vessels’ holding tanks, and no regulations are<br />
enforced to protect marine resources. Along the inner harbor, commercial businesses and an undeveloped<br />
marina operate without containment for liquid spills or solid waste, paint, and dust. Residential roads, new<br />
homes, and failing septic systems contribute unmeasured amounts of pollutants to the harbor.<br />
The tremendous growth and diverse uses of the landscape and marine resources in this watershed have<br />
visibly deteriorated marine water quality. Sedimentation and runoff are increasing in intensity and frequency,<br />
with routine sediment plumes inundating the area during the rainy season. Chronic pollution from point and<br />
nonpoint sources including the dumping of human and animal wastes, failing septic systems, and dumping of<br />
boat tank materials has resulted in high nutrient levels in Coral Bay.<br />
U.S. Virgin Islands<br />
Sidebar<br />
page<br />
61
U.S. Virgin Islands<br />
page<br />
62<br />
The State of Coral Reef Ecosystems of the U.S. Virgin Islands<br />
BENTHIC HABITATS<br />
NPS and USGS Coral Disease and Benthic Cover Abundance Monitoring<br />
Methods<br />
Long-term monitoring of coral diseases and abundance (percent cover) is conducted by the Inventory and<br />
Monitoring Program around St. John and Buck Island in St. Croix. Diseases of corals are specifically monitored<br />
using two different methods at two sites in VINP. The incidence and progression of the coral disease<br />
white plague type II in 28 tagged coral colonies is being monitoring approximately quarterly using still photography.<br />
Coral diseases are also monitored monthly with 1 m 2 quadrats along eight 10-m transects. Details of<br />
these monitoring projects, which began in 1997 and are still on-going, are given in Miller et al. (2003).<br />
Benthic cover monitoring is conducted annually through the use of digital videography at four representative<br />
sites around St. John US Virgin Islands (three within VINP, one outside of the park); and at two sites within<br />
BIRNM in St. Croix. Monitoring of benthic cover began at two sites in 1999; four additional sites have been<br />
added since 2000 (J. Miller, pers. obs.). The benthic sampling protocol involves the selection of random (transect<br />
origin) sites, which is accomplished by using a SONAR-based mapping system (AquaMap®). Twenty<br />
10-m transects are filmed using a digital video camera, and then the images are downloaded to a computer.<br />
Random dots are placed upon images captured from transects. The substrate underneath each dot is identified<br />
to the lowest taxonomic unit possible (e.g., coral to species, algae to genus) and entered into a database.<br />
Queries of the database produce values on the percent cover, diversity indices of species, and cover groups.<br />
Qualitative data on coral disease are also collected. A detailed description of the protocol is available online<br />
(http://science.nature.nps.gov/im/monitor/protocoldb.cfm, Accessed: 12/28/2004).<br />
Results and Discussion<br />
Live coral cover along disease monitoring transects decreased from 65.3% (± 7.41 standard deviation [SD]) to<br />
43.4% (± 5.08 SD) between December 1997 and May 2001. The frequency of disease within transects ranged<br />
from 3% to 58%, and the area of disease patches ranged from 0.25 to 9,000 cm 2 within that same period. New<br />
incidences of disease were observed every month with associated loss of living coral. Increases in disease<br />
occurrence did not correlate with elevated water temperatures. The photos and observations revealed no recovery<br />
of diseased corals with all necrotic tissue being overgrown rapidly by turf algae, usually within less than<br />
one month. Most coral colonies suffered partial mortality and some colonies greater than 1.5 m in diameter<br />
were completely consumed in less than six months. Some limited recruitment (e.g., Porities spp., Agaricia<br />
spp., Favia spp., and sponges) has been noted on the diseased areas.<br />
In general, reefs monitored by the NPS and USGS were dominated by dead coral with turf algae (Figure 4.11).<br />
Other benthic organisms such as gorgonians and sponges were not abundant and showed no significant temporal<br />
patterns in percent cover. In contrast, the estimates of the percent cover of macroalgae, turf algae, and<br />
abiotic substrates (sand, rubble, and pavement) varied substantially among sites and among sample periods.<br />
A total of 19 coral species were recorded throughout the study period; the number of species varied among<br />
sites and years. At Newfound Reef in St. John, the Montastraea annularis complex was the most abundant<br />
and most frequently observed coral, accounting for approximately 70% of live coral cover and was present in<br />
all 20 transects. The percent cover of live coral and algae was variable among sites, with Mennebeck Reef in<br />
St. John having the highest estimates of live coral cover (Figure 4.11). Mennebeck Reef and Western Spur<br />
and Groove Reef, St. Croix had more live coral than macroalgae, but live coral was twice as abundant on<br />
Mennebeck as on Western Spur and Groove (Figure 4.11). At Yawzi Reef, the opposite pattern occurred, with<br />
macroalgae being more abundant than live coral for all years (Figure 4.11). At South Fore Reef, St. Croix and<br />
Newfound Reef, mean estimates of live coral cover were similar to those for macroalgae (Figure 4.11).<br />
Significant changes in live coral cover occurred only at Newfound Reef in St. John, where the mean percent<br />
live cover decreased by approximately 24% between 1999 and 2001 (p
% Cover<br />
The State of Coral Reef Ecosystems of the U.S. Virgin Islands<br />
Figure 4.11. Mean percent cover (± SE) of coral, macroalgae, and dead coral with turf algae at six sites in the USVI. Data were collected<br />
according to video monitoring protocols developed by the USGS and NPS (http://science.nature.nps.gov/im/monitor/protocoldb.<br />
cfm). Specific sites or years without data were not sampled or the data are not yet analyzed. Source: J. Miller, unpublished data.<br />
U.S. Virgin Islands<br />
Sidebar<br />
page<br />
63
U.S. Virgin Islands<br />
page<br />
64<br />
The State of Coral Reef Ecosystems of the U.S. Virgin Islands<br />
NPS, USGS, and UVI-CMES Elkhorn Coral (Acropora palmata) Monitoring<br />
Methods<br />
Researchers from the USGS, NPS, and UVI-CMES began an 18-month study of 66 tagged elkhorn coral colonies<br />
at Haulover Bay, St. John in January 2003. The geographic coordinates of the perimeter of each monitoring<br />
site and the locations of sampled elkhorn colonies are mapped onto geo-referenced aerial photographs.<br />
Data are recorded on the depth, three-dimensional size of colonies, type of substrate, percent cover of live<br />
and dead coral, presence/absence of specific diseases and lesions, and counts of damselfish territories and<br />
predators (snails – Coralliophila abbreviata and C. caribaea; and fireworms – Hermodice spp.).<br />
Results and Discussion<br />
Observations of 66 tagged corals over an 18-month period showed that 17% died, 74% had disease, and<br />
30% suffered physical breakage, most likely from careless snorkelers (Table 4.4). Although 92% showed new<br />
growth throughout the study period,<br />
15% of the new growth later lost 90-<br />
100% of their tissue. White pox disease<br />
was the most significant cause<br />
of coral mortality, however white pox<br />
lesions can heal. Forty-eight percent<br />
of the white pox lesions healed completely,<br />
mostly within three months.<br />
The onset of a severe disease outbreak<br />
coincided with increasing sea<br />
surface temperatures. Both the number<br />
of corals with white pox and the<br />
total number of disease lesions started<br />
to rise in September and continued<br />
increasing into November, tracking<br />
the trend in SST.<br />
Table 4.4. The results of a study on the health and condition of Acropora palmata<br />
colonies (N=67). Data were collected through videography and in situ observation<br />
by the USGS Caribbean field station since February 2003 at Haulover Bay, St. John,<br />
USVI. Source: Rogers and Muller, unpublished data.<br />
NUMBER <strong>OF</strong> <strong>CORAL</strong>S AFFECTED (N=67)<br />
6 Months 18 Months 22 Months<br />
New Growth 40 61 61<br />
New White Pox 15 49 57<br />
Healed White Pox 5 28 32<br />
Snails Present 15 29 30<br />
Physical Breakage 6 20 23<br />
Complete Mortality 3 11 11<br />
Unidentified Lesions 2 2 2<br />
White Band 1 3 3<br />
Bleached 0 1 1<br />
Damselfish Territory 1 1 1
UVI-CMES Video Assessment of Benthic Substrates<br />
The State of Coral Reef Ecosystems of the U.S. Virgin Islands<br />
Methods<br />
UVI-CMES researchers used digital videography along belt-transects to characterize and monitor benthic<br />
cover at permanent and rapid assessment sites in St. Croix and St. Thomas. The maximum width and height<br />
and the percent of diseased coral cover were estimated from the videos for all coral colonies greater than 10<br />
cm in diameter that were located directly under the transect lines. Data on diseases and bleaching were not<br />
collected at rapid assessment sites. In St. Croix, divers filmed three to six permanent 10-m transects at 10<br />
long-term and two rapid assessment sites between April 2001 and March 2003. In St. Thomas, digital video<br />
transects were conducted at six coral reef sites between August 2002 and September 2003. The St. Thomas<br />
reefs were placed into three categories based upon their location along the insular platform: nearshore reefs<br />
(5-30 m deep, 30 m deep, 10-50 km offshore). Detailed video sampling methods are discussed in Nemeth et al. (2002).<br />
Results are reported separately here for St. Croix and St. Thomas.<br />
Results and Discussion<br />
St. Croix<br />
The percent cover of living coral was<br />
variable among sites and ranged<br />
from 4.4% to 39.1%. Coral was the<br />
most abundant component at only<br />
one site. Turf algae covering dead<br />
coral comprised 50% or more of the<br />
substrata and was dominant at most<br />
sites (Figure 4.12A, B). Dead coral<br />
included both long dead and recently<br />
killed coral covered with a layer of turf<br />
algae. The percent cover of macroalgae<br />
ranged from 3.2% to 34.9% (Figure<br />
4.12C). Percent cover of living<br />
coral was similar among years but<br />
a significant increase in turf algae<br />
and a corresponding decrease in<br />
macroalgae were observed at Buck<br />
Island between years (Figure 4.12<br />
B, C). These trends were reversed<br />
at Sprat Hole, where an increase in<br />
macroalgae corresponded with a decrease<br />
in turf algae (Figure 4.12B, C).<br />
Significant increases in macroalgae<br />
also occurred at Long Reef (Figure<br />
4.12C). It is unlikely that the significant<br />
changes observed in the abundance<br />
of macroalgae between years<br />
at Buck Island and Sprat Hole were<br />
caused by urchins (D. antillarum) because<br />
macroalgae were very rare at<br />
those sites. Sponges and gorgonians<br />
each comprised less than 10% of<br />
the benthic cover at all sites (Figure<br />
4.13D, E). Sand was the only non-<br />
Figure 4.12. Annual mean percent of (A) scleractinian corals, (B) dead coral with<br />
turf algae, and (C) macroalgae for 12 sampling sites in St. Croix. Site codes are:<br />
BI=Buck Island, CB=Cane Bay, CS=Castle, GS=Gerson, GP=Great Pond, JB=Jacks<br />
Bay, LB=Lang Bank, LR=Long Reef/Eagle Ray, MS=Mutton Snapper, SRE=Salt<br />
River East Wall, SRW=Salt River West Wall, SH=Sprat Hole. Error bars represent<br />
standard deviation. Asterisks denote significant differences: *=p
U.S. Virgin Islands<br />
page<br />
66<br />
The State of Coral Reef Ecosystems of the U.S. Virgin Islands<br />
The composition of the coral community<br />
was similar among sites, with<br />
10 species representing 95% of the<br />
coral community (Figure 4.14). Montastraea<br />
spp. were the most dominant<br />
corals except at Castle where Porites<br />
porites was most abundant, at Great<br />
Pond where Porites astreoides was<br />
most abundant, and at Gerson and<br />
Lang Bank where Diploria strigosa<br />
was most abundant. Coral diversity<br />
ranged from a Shannon-Weaver<br />
diversity index (H’) of 1.50 at Great<br />
Pond to 2.40 at Salt River West Wall<br />
(Figure 4.15).<br />
Coral condition varied greatly among<br />
sites. The incidence of coral disease<br />
and bleaching ranged from 0-17%<br />
at several sites and 0-22% at Lang<br />
Bank. Diseases and bleaching were<br />
observed among eight dominant coral<br />
species, with Siderastrea siderea<br />
having the highest incidence of disease<br />
(50% of colonies) and bleaching<br />
(80% of sampled colonies). Divers<br />
observed white plague, dark spots<br />
disease, yellow blotch/band disease,<br />
and white spots that were classified<br />
as disease, but were unidentifiable to<br />
a specific disease.<br />
Figure 4.13. Annual mean percent of (A) sponges, (B) gorgonians, and (C) sand/sediment<br />
for 12 sampling sites in St. Croix. Site codes are: BI=Buck Island, CB=Cane Bay,<br />
CS=Castle, GS=Gerson, GP=Great Pond, JB=Jacks Bay, LB=Lang Bank, LR=Long<br />
Reef/Eagle Ray, MS=Mutton Snapper, SRE=Salt River East Wall, SRW=Salt River<br />
West Wall, SH=Sprat Hole. Error bars represent standard deviation. Asterisks denote<br />
significant differences: *=p
St. Thomas<br />
The percent cover of living coral<br />
ranged from a low of 8.3% at Benner<br />
Bay to a high of 42% at Grammanik<br />
Bank (Figure 4.16A). The percent<br />
cover of dead coral covered with turf<br />
algae ranged from 15% at Seahorse<br />
Cottage Shoal to 45.6% at Benner<br />
Bay (Figure 4.16B). The percent<br />
cover of macroalgae ranged from<br />
13.8% at Black Point to 42.7% at Seahorse<br />
Cottage Shoal (Figure 4.16C).<br />
Sponges and gorgonians each comprised<br />
less than 10% of the benthic<br />
cover at all sites (Figure 4.17D, E).<br />
No gorgonians were observed on the<br />
shelf-edge sites. The percent cover<br />
of sand/sediment ranged from 3% at<br />
the Grammanik Bank to 28% at Black<br />
Point (Figure 4.17F). Almost all of the<br />
substrate at Black Point was covered<br />
by sediment, whereas the substrates<br />
at other sites were predominantly<br />
sandy areas mixed with vertical reef<br />
structures.<br />
The State of Coral Reef Ecosystems of the U.S. Virgin Islands<br />
Figure 4.15. Annual diversity index (Shannon-Weaver H’) for corals at 12 sites in<br />
St. Croix. BI=Buck Island, CB=Cane Bay, CS=Castle, GS=Gerson, GP=Great Pond,<br />
JB=Jacks Bay, LB=Lang Bank, LR=Long Reef/Eagle Ray, MS=Mutton Snapper,<br />
SRE=Salt River East Wall, SRW=Salt River West Wall, SH=Sprat Hole. Source: Nemeth<br />
et al., 2002, 2003a.<br />
Figure 4.16. Mean percent cover of benthic organisms in St. Thomas at: BB=Benner<br />
Bay, BP=Black Point, SC=Seahorse Cottage Shoal, FC=Flat Cay, GB=Grammanik<br />
Bank, RH=Red Hind Bank. BB and BP are nearshore sites; SC and FC are mid-shelf<br />
sites; GB and RH are shelf-edge sites. n=6 transects for all sites. Error bars represent<br />
standard deviation. Source: S. Herzlieb, unpublished data.<br />
U.S. Virgin Islands<br />
Sidebar<br />
page<br />
67
U.S. Virgin Islands<br />
page<br />
68<br />
The State of Coral Reef Ecosystems of the U.S. Virgin Islands<br />
Nearshore sites tended to have lower<br />
percent cover of living coral and<br />
higher percent cover of dead coral<br />
covered with turf algae than midshelf<br />
and shelf-edge sites (Figure<br />
4.18). Also, nearshore sites tended<br />
to have lower percent composition of<br />
corals within the M. annularis complex<br />
and higher percent composition<br />
of the stress tolerant corals P. astreoides<br />
and S. siderea than mid-shelf<br />
and shelf-edge sites (Figure 4.18).<br />
The coral reefs of St. Thomas were<br />
generally dominated by coral species<br />
in the genus Montastraea (Figure<br />
4.18). The Shannon-Weaver Diversity<br />
Index (H’) for coral ranged from<br />
a high of 2.26 at Flat Cay to a low of<br />
1.20 at Grammanik Bank. In general,<br />
deeper shelf-edge sites (Seahorse<br />
Cottage, Grammanik Bank, and Red<br />
Hind Bank) had lower diversity than<br />
the shallow sites (Figure 4.19).<br />
Since most research and monitoring<br />
in the Virgin Islands in have generally<br />
been concentrated on nearshore<br />
fringing reefs, mid-shelf and shelfedge<br />
sites were chosen to fill gaps in<br />
the knowledge of other reef systems,<br />
as well as to establish an experimental<br />
design to test hypotheses involving<br />
differences between reefs located<br />
at different points along the insular<br />
platform off the coast of St. Thomas.<br />
Figure 4.17. Mean percent cover of A. sponges, B. gorgonians, and C. sand/sediment<br />
in St. Thomas: BB=Benner Bay, BP=Black Point, SC=Seahorse Cottage Shoal,<br />
FC=Flat Cay, GB=Grammanik Bank, RH=Red Hind Bank. BB and BP are nearshore<br />
sites, SC and FC are mid-shelf sites, and GB and RH are shelf-edge sites. n=6 transects<br />
for all sites. Error bars represent standard deviation. Source: S. Herzlieb,<br />
unpublished data.<br />
The close proximity of nearshore fringing reefs to human populations and their relatively shallow depths, increases<br />
the susceptibility of these reefs to both harmful human activities (overfishing, sedimentation, nutrient<br />
enrichment, and physical damage) and the effects of natural disturbances (storm wave damage, high SSTs,<br />
and high irradiance).<br />
Due to their similar depths but greater distance from shore, mid-shelf reefs are less susceptible to the humaninduced<br />
stresses listed above, but are exposed to levels of natural impacts similar to nearshore reefs. Thus,<br />
the mid-shelf reefs provide an ideal control for measuring the effects of human-induced stresses on nearshore<br />
reefs. Deep reefs located along the edge of the insular platform are largely free from human induced stresses<br />
(excluding fishing and anchoring) and natural impacts because of their greater distance from human populations<br />
and their greater depths. The shelf-edge deep reefs are quite extensive, but largely unstudied. Monitoring<br />
of these systems will contribute greatly to an understanding of coral reef resources in the Virgin Islands.<br />
Cross-shelf patterns in benthic composition in St. Thomas warrant special attention because they suggest that<br />
overall reef quality is lower at nearshore sites compared with sites further offshore. However, only two reefs<br />
of each reef type were surveyed, thus robust comparisons between reef types are difficult. Future monitoring<br />
efforts involving a greater number of St. Thomas reefs will help to elucidate these and any further differences<br />
among the near-shore, mid-shelf, and shelf-edge reef systems.
The State of Coral Reef Ecosystems of the U.S. Virgin Islands<br />
Figure 4.18. Percentage of coral species composition at nearshore sites, mid-shelf sites, shelf-edge sites and all sites combined for<br />
St. Thomas. ‘Other’ denotes percent of all other coral species combined and includes: Agaricia grahamae, A. humilis, Dendrogyra<br />
cylindrus, Diploria clivosa, D. labyrinthiformis, Eusmilia fastigiata, Manicina areolata, Mycetophyllia aliciae, M. danaana, M. lamarckiana,<br />
P. divaricata, Solenastrea bournoni, S. hyades, and Stephanocoenia michelinii. Source: S. Herzlieb, unpublished data.<br />
Figure 4.19. Shannon-Weaver Diversity Index (H’) for corals at eight monitored sites<br />
in St. Thomas: BB=Benner Bay, BP=Black Point, SC=Seahorse Cottage Shoal, FC=<br />
Flat Cay, GB=Grammanik Bank, RH=Red Hind Bank. BB and BP are nearshore<br />
sites, SC and FC are mid-shelf sites, and GB and RH are shelf-edge sites. n=6 transects<br />
for all sites. Error bars represent standard deviation. Source: S. Herzlieb,<br />
unpublished data.<br />
U.S. Virgin Islands<br />
Sidebar<br />
page<br />
69
U.S. Virgin Islands<br />
page<br />
70<br />
The State of Coral Reef Ecosystems of the U.S. Virgin Islands<br />
UVI-CMES AGRRA Assessments of Benthic Substrates<br />
Methods<br />
Between May 1998 and August 2000, 16 sites within the USVI were surveyed (Nemeth et al., 2003a) using the<br />
Atlantic and Gulf Rapid Reef Assessment protocol (AGRRA; Version 2.0). The AGRRA protocol focuses on<br />
three aspects of benthic reef communities: coral condition, algae abundance, and sea urchin density along a<br />
10-m transect. To assess coral condition, the dimensions of 50-100 coral colonies, occurring directly beneath<br />
the transect line were measured. Coral colonies >25 cm in diameter were inspected for signs of disease,<br />
predation, and overgrowth. The percent of old or recent tissue mortality was also estimated for each coral<br />
colony from a planar view. Along these same transects, the point intercept method was used to estimate<br />
percent coral cover, and the number of Diadema antillarium sea urchins occurring within 1 m of each side of<br />
the transect line were counted. Finally at least 50 quadrats (0.25 m 2 ) were placed along the transect lines to<br />
estimate the percent cover and height of macroalgae, turf algae, and coralline algae, and to count the number<br />
of coral recruits 6 m) and geographic region (St. Thomas/St. John and St.<br />
Croix). St. Croix was considered a unique geographic region because of its isolation from the northern Virgin<br />
Island Archipelago, its unique geology (sedimentary/carbonate), and its location completely within the Caribbean<br />
Sea. St. Croix sites included Cane Bay, Salt River East Wall, and Long Reef. St. Thomas and St. John<br />
were grouped as the northern Virgin Islands because of their close proximity, similar geographic origins and<br />
topography (high volcanic islands), and exposure to both Atlantic waters from the north and Caribbean waters<br />
from the south. Reefs around St. Thomas included Brewer’s Bay, Buck Island, Caret Bay, Flat Cay and Sprat<br />
Bay. Reefs around St. John included two sites in Great Lameshur Bay (Tektite, Yawzi Point) and two sites in<br />
Fish Bay (outer east and west). Shallow reefs
The State of Coral Reef Ecosystems of the U.S. Virgin Islands<br />
Between 1998 and 2000 the condition of coral colonies varied among island groups. Coral bleaching was<br />
recorded at all sites with the highest average values occurring on St. Croix, the lowest occurring around St.<br />
Thomas, and moderate levels around St. John (Table 4.6). Alternatively, incidence of disease was lowest on<br />
St. Croix and the shallow reefs of St. John but higher on the deeper reefs of the northern Virgin Islands. Divers<br />
were able to recognize four general disease types: black band, yellow blotch, white plague, and dark spots.<br />
The coral species most susceptible to disease included M. faveolata, M. franksi, M. cavernosa, M. annularis,<br />
Colpophyllia natans, and Siderastrea siderea. The high percentage of coral colonies with fish bites contributed<br />
to the elevated level of recent tissue mortality on shallow reefs of St. John. These shallow nearshore<br />
reefs were also affected by sedimentation especially those outside the boundaries of the VINP (i.e., Fish Bay)<br />
that had high levels of old tissue mortality.<br />
Table 4.6. Summary data for algae (macro, turf, crustose coralline) and coral recruitment from AGRRA assessment of reefs around<br />
St. John, St. Thomas, and St. Croix and the shallow reefs
U.S. Virgin Islands<br />
page<br />
72<br />
The State of Coral Reef Ecosystems of the U.S. Virgin Islands<br />
Figure 4.20. Nearshore benthic habitat maps were developed in 2001 by CCMA-BT based on visual interpretation of aerial photography<br />
and hyperspectral imagery. For more info, see: http://biogeo.nos.noaa.gov. Map: A. Shapiro.
ASSOCIATED BIOLOGICAL COMMUNITIES<br />
The State of Coral Reef Ecosystems of the U.S. Virgin Islands<br />
Data from four monitoring and assessment programs were used to characterize community structure, biomass,<br />
trophic structure, and the size frequency distribution of fish assemblages in the USVI. Mean estimates<br />
of standard reef fish assemblage variables were determined from each data set. Species richness is the total<br />
number of species observed per sample. Abundance is the mean number of individuals per sample. Biomass<br />
is the estimated live wet weight of individuals per sample. Live wet weight (W) of each fish was estimated<br />
from the mean visually estimated fork-length (FL) with the equation: W = a(FL) b , where a and b are known<br />
parameters of the length-weight relationship for each species (Randall et al., 1967; Froese and Pauly, 2000;<br />
http://fishbase.org., Accessed 12/28/2004). For species not in these databases, estimates from available<br />
literature on the species or congeners were used. The biomass of all fishes recorded in all censuses was<br />
obtained by multiplying the mean live wet weight for each size class for each species by the total number of<br />
individuals observed in that size class.<br />
NPS Long-term Monitoring of Reef Fish Assemblages<br />
Methods<br />
Annual trends in total species richness, fish abundance, and biomass were analyzed and are presented<br />
separately for the NPS long-term reef fish monitoring dataset. NPS has been monitoring reef fish populations<br />
monthly at four reference sites in the VINP on St. John for 12 years (1988-2000). This data set represents<br />
one of the longest time series data sets on reef fishes for the territory. An investigation to study the monthly<br />
variation in reef fish assemblages was initiated in November 1988 and continued through May 1991 (Beets<br />
and Friedlander, 1990; Beets, 1993). The study was conducted at two sites (Yawzi Point Reef and Cocoloba<br />
Reef) using the stationary visual census technique developed by Bohnsack and Bannerot (1986). Following<br />
Hurricane Hugo in September 1989, NPS initiated reef fish sampling at several reef sites (n=18) around St.<br />
John in addition to the monthly sampling at the two sites in the southern portion of the VINP. The NPS used<br />
a modified visual census technique that was developed and used in the Dry Tortugas National Park in 1987<br />
(Kimmel, 1992). Monitoring at the sites established in 1989 (originally 18 reef sites were selected with a few<br />
omitted and added among years) continued each June/July until 1994 using the modified method. In 1995,<br />
the standard stationary visual census technique (Bohnsack and Bannerot, 1986) was employed to continue<br />
long-term monitoring at four established reference sites, representing topographically complex, speciose sites<br />
including areas selected for monitoring other resources (coral, macroalgae, water quality). The goals of this<br />
monitoring project were to 1) establish a baseline of information on reef fish assemblages around St. John;<br />
2) conduct sustained monitoring on representative high-diversity reefs; 3) collect data on reefs with known or<br />
potential environmental degradation; 4) compare fish assemblages among selected reefs; and 5) determine<br />
trends in reef fish assemblages over time. The four permanent reference sites (Yawzi Point Reef, Tektite Reef,<br />
Newfound Bay West Reef, and Haulover Bay West Reef) were monitored annually from 1989-2000 (except in<br />
1990). Yawzi Point Reef was monitored monthly from 1988-1991.<br />
U.S. Virgin Islands<br />
Sidebar<br />
page<br />
73
U.S. Virgin Islands<br />
page<br />
74<br />
The State of Coral Reef Ecosystems of the U.S. Virgin Islands<br />
Results and Discussion<br />
In most tropical fisheries, many changes go relatively unnoticed and undocumented. Data acquisition and<br />
monitoring programs are frequently initiated following large resource changes. While this is true for the USVI,<br />
the area has fortunately received much scientific investigation at other times as well. A comparison of historical<br />
data (1958-1961) and more recent monitoring data (1989-2000) provides a view of changes in reef fish<br />
abundance over 60 years.<br />
NPS reef fish monitoring data documented<br />
numerous significant declines<br />
in the abundance of several<br />
reef fish over a 12-year period (Beets<br />
and Friedlander, 2003; Figure 4.21).<br />
However, numerous species that<br />
were historically common in landings,<br />
such as the Nassau grouper, demonstrated<br />
no significant trend over the<br />
monitoring period (Figure 4.21). This<br />
may be because their abundance is<br />
presently too low to show significant<br />
trends, assuming that a decline in<br />
abundance has occurred. Furthermore,<br />
large declines in abundance for<br />
species, such as the Nassau grouper,<br />
may have occurred before monitoring<br />
projects were initiated.<br />
Figure 4.21. Significant (A-C) and non-significant (D) declines in abundance of four<br />
commercially-targeted species observed in visual monitoring data from four reefs<br />
around St. John, US Virgin Islands from 1991-2000. Source: Beets and Friedlander,<br />
2003.
Historical data collected by previous<br />
investigators provide comparative<br />
information, although comparative<br />
abundance data frequently are<br />
not available. For example, Randall<br />
(1967) collected many species of<br />
fish for his landmark studies of Caribbean<br />
reef fishes around St. John<br />
from 1958-1961. Although few were<br />
quantitative, Randall’s studies provided<br />
relative abundance and size<br />
structure of species. Large groupers<br />
frequently captured by Randall<br />
in 1958-61 were in very low relative<br />
abundance in the 1989-2000 monitoring<br />
data (Figure 4.22). The two<br />
smaller-sized groupers, red hind and<br />
coney, were much more common in<br />
the recent monitoring data. These<br />
long-term comparisons suggest that<br />
large changes have occurred in Virgin<br />
Islands fisheries, similar to patterns<br />
observed throughout the Caribbean.<br />
Over-exploitation by fisheries<br />
certainly has been a strong contributor<br />
to the observed declines.<br />
The most apparent temporal signal<br />
in reef fish assemblage characteristics<br />
around St. John over the 12year<br />
monitoring period resulted from<br />
the influence of large storm events<br />
(Beets and Friedlander, 2003). The<br />
Virgin Islands have been greatly influenced<br />
by numerous large storms<br />
since 1988. Data were separated<br />
into two periods (1989-1994 and<br />
1996-2000) representing the poststorm<br />
recovery periods following the<br />
two major storms affecting St. John<br />
(Hurricane Hugo, Sept. 1989; Hurricane<br />
Marilyn, Sept. 1995). As data<br />
for 1995 were collected just prior to<br />
Hurricane Marilyn, those data were<br />
excluded from analysis. Assemblage<br />
characteristics (species richness,<br />
abundance, and biomass) showed<br />
statistically significant increases during<br />
the five-year period following<br />
Hurricane Hugo (1989, Figure 4.23).<br />
While species, number of individuals,<br />
and biomass all increased following<br />
Hurricane Marilyn (1995), none of<br />
these trends were significant for the<br />
The State of Coral Reef Ecosystems of the U.S. Virgin Islands<br />
Figure 4.22. Comparison of the relative abundance of groupers collected by Randall<br />
from 1958-1961 and groupers sampled during 1989-2000 around St. John. Source:<br />
Beets and Friedlander, 2003.<br />
Figure 4.23. Trends in assemblage characteristics during the five years following two<br />
hurricanes which affected St. John (Hugo, Sept. 1989; Marilyn, Sept. 1995). Average<br />
values for each of the four reference sites are represented by circles for each year.<br />
Regression lines and coefficients were obtained from linear regression analysis. Data<br />
for 1995 were excluded from these analyses. Source: Beets and Friedlander, 2003.<br />
U.S. Virgin Islands<br />
Sidebar<br />
page<br />
75
U.S. Virgin Islands<br />
page<br />
76<br />
The State of Coral Reef Ecosystems of the U.S. Virgin Islands<br />
five-year period following the storm (Figure 4.23). Large storms that passed near the USVI in 1998 and 1999<br />
may have had a significant negative impact on reef fish assemblage recovery, as lower values in assemblage<br />
characteristics were noted for 2000. Without long-term consistent data, the ability to evaluate such events is<br />
limited.<br />
Current Status of Reef Fish Assemblages in the USVI<br />
Methods<br />
The current status of reef fish assemblages in the USVI was determined from the CCMA-BT, DFW, and UVI-<br />
CMES reef fish monitoring programs. These programs present the most recent data on the status of reef<br />
fishes in the USVI. In 1998, UVI-CMES joined the Caribbean-wide effort to assess reef fish assemblages at<br />
16 sites throughout the USVI. Since<br />
2001, CCMA-BT has surveyed reef<br />
fishes semi-annually for three years<br />
at 309 and 128 hard bottom sites in<br />
St. Croix and St. John, respectively.<br />
Most recently, the DFW conducted 80<br />
visual surveys and collected 120 trap<br />
samples at eight permanent hard bottom<br />
areas in St. Croix during spring<br />
and fall of 2002.<br />
Mean biomass density of 12 commercially<br />
important species of groupers<br />
and snappers (Table 4.8), the<br />
trophic biomass ratio of three broad<br />
feeding guilds (Table 4.9), and the<br />
size frequency distribution of selected<br />
species were calculated for each<br />
site. Biomass density is the live wet<br />
weight of groupers and snappers ob-<br />
Table 4.9. Trophic guilds used to determine trophic biomass ratio of fishes in the USVI. Source: Randall, 1967.<br />
TROPHIC GUILD FOOD TYPE EXAMPLE TAXA<br />
Table 4.8. Species of commercially important snappers (Lutjanidae) and groupers<br />
(Serranidae) for which estimates of mean biomass density (g/m 2 ) were calculated<br />
for the Virgin Islands National Park, St. John and the BIRNM, St. Croix. Source: Appeldoorn<br />
et al., 1992.<br />
FAMILY SPECIES COMMON NAME<br />
Lutjanidae (snapper) Lutjanus analis mutton snapper<br />
Lutjanus apodus schoolmaster<br />
Lutjanus griseus gray snapper<br />
Lutjanus jocu dog snapper<br />
Lutjanus mahogoni mahogany snapper<br />
Lutjanus synagris lane snapper<br />
Ocyurus chrysurus yellowtail snapper<br />
Serranidae (grouper) Epinephelus cruentatus graysby<br />
Epinephelus fulvus coney<br />
Epinephelus guttatus red hind<br />
Epinephelus morio red grouper<br />
Mycteroperca tigris tiger grouper<br />
served per area (m 2 ) sampled. Trophic biomass ratio is the proportion of live wet weight of fishes in one of<br />
three feeding guilds. Fishes were assigned to trophic guilds according to Randall (1996). However, Randall’s<br />
trophic classification was reduced to three trophic groups to simplify the interpretation of the results. Randall’s<br />
“mobile invertebrate feeders/piscivores” were integrated into the group “piscivores”; herbivores were not reclassified;<br />
all other trophic groups (“detritivores”, “sessile invertebrate feeders”, “zooplanktivores”, and “omnivores”)<br />
were combined into one category called ‘generalized carnivores’ (Table 4.9). Size class frequency<br />
is the proportion of individuals of a species belonging to one of eight size classes. Size classes were based<br />
on visual estimates of fork length (FL). Size class frequency was estimated for three commercially important<br />
species - red hind grouper (Epinephelus guttatus), coney (E. fulvus), and red band parrotfish (Sparisoma<br />
aurofrenatum) - and the bluehead wrasse (Thalassoma bifasciatum), a commonly occurring species with no<br />
commercial importance. These assemblage and species variables were chosen because they can provide<br />
a relative index of the condition of coral reef fish assemblages. Current estimates of these assemblage variables<br />
will be used as a baseline for comparison with estimates from future monitoring data to determine how<br />
reef fish assemblages are changing over time.<br />
Herbivores <strong>Marine</strong> plants Damselfishes, parrotfishes, surgeonfishes<br />
Piscivores, mobile invertivores/piscivores Other fish, crabs Red hind, other groupers, snappers<br />
Mobile invertivores, sessile invertivores, Crustaceans, corals, Spanish hogfish, wrasses, gobies, filefish, butterflyfish,<br />
zooplanktivores, generalized carnivores zooplankton, etc. blennies, cardinal fishes, angelfishes, squirrel fishes,<br />
goatfishes, scadblennies, cardinal fishes
The State of Coral Reef Ecosystems of the U.S. Virgin Islands<br />
NOAA CCMA-BT<br />
Since August 2000, NOAA’s CCMA-BT has led a collaborative effort to monitor coral reef ecosystems throughout<br />
the U.S. Caribbean, including the USVI. This regionally-integrated monitoring effort explicitly links observed<br />
fish distributions to shallow (
U.S. Virgin Islands<br />
page<br />
78<br />
The State of Coral Reef Ecosystems of the U.S. Virgin Islands<br />
UVI-CMES<br />
Between May 1998 and August 2000 16 sites within the USVI were surveyed (Nemeth et al., 2003b) with the<br />
AGRRA protocol (Version 2.0; Ginsburg et al., 1996). Visual fish counts along at least 10 60-m 2 transects were<br />
conducted at each site. On St. Croix, additional surveys were conducted at Cane Bay (n=3), Long Reef (n=5)<br />
and Salt River (n=6). Transect width and fish lengths (measured in 5-cm increments up to 35 cm) were estimated<br />
using a 1 m wide t-bar constructed of pvc. Using transects as replicates, the average density (no./100<br />
m 2 ) and size (cm) of each species and family were calculated for each site and island group (see below).<br />
Parrotfish and grunts less than 5 cm were counted and identified to species when possible at all sites except<br />
St. Croix. Sites were identical to those listed in the UVI-CMES AGGRA Assessments of Benthic Substrates<br />
section of this chapter.<br />
Results and Discussion<br />
Despite the variation in sampling techniques, spatial extent, and temporal coverage, analysis reveals patterns<br />
in the abundance and assemblage structure of reef fishes that were consistent among the data sets. These<br />
patterns are described below.<br />
The biomass of commercially important groupers and snappers was very low for all monitoring programs.<br />
Mean biomass density of groupers and snappers was 5.67 ± 0.55 g/m 2 (CCMA-BT) and 8.76 ± 1.17 g/m 2 (UVI-<br />
CMES). Furthermore, the NPS long-term reef fish data show clearly that the average number and frequency<br />
of occurrence of groupers decreased at reference sites during 12 years of sampling (Figure 4.22). Low estimates<br />
of biomass also reflect low abundance of groupers and snappers in USVI waters, and indicate a lack<br />
of recovery of local grouper populations to fishable levels. Intense fishing pressure, degradation of coral reef<br />
habitats, and tropical storm events have contributed to the demise of several large-sized grouper and snapper<br />
species such as the Nassau grouper, Epinephelus striatus and the dog snapper, L. jocu in the USVI (Olsen<br />
and LaPlace, 1978; Beets and Friedlander, 1992; Rogers and Beets, 2001). Now, the abundance of smallersized<br />
groupers (e.g., red hind, E. gutatus; coney, E. fulvus; graysby, E. cruentatus) that have replaced the<br />
decimated fisheries are so low that they too are rarely caught in recreational or commercial fisheries (W. Tobias,<br />
pers. comm.). Continued monitoring of grouper/snapper biomass density would provide an easy way to<br />
assess the future trends and health of USVI reef fish assemblages.<br />
Overfished reef fish assemblages typically are characterized by a higher proportion of herbivores and fewer<br />
piscivores compared with unfished assemblages. Many large-bodied predatory species (e.g., groupers and<br />
snappers) usually are the primary targets of fishers, which results in the depletion of the largest and most valu-<br />
able fishes from reef fisheries. As the<br />
abundance of these larger species<br />
decrease to unfishable levels, fishers<br />
are forced to switch to smaller and<br />
more undesirable fishes, a phenomenon<br />
known as “serial overfishing”<br />
(see Ault et al., 1998). Assuming a<br />
reduction in fishing pressure may result<br />
in an increase in the abundance<br />
of predators, monitoring temporal<br />
changes in the trophic structure could<br />
provide another way to determine<br />
the status of USVI reef fish assemblages.<br />
The three trophic categories<br />
were well represented among most<br />
of the data sets. Piscivores comprise<br />
25% (CCMA-BT), 2% (DFW), and 6%<br />
(UVI-CMES) of fish biomass at sampled<br />
locations (Figure 4.24). Herbivores<br />
comprised 43% (CCMA-BT),<br />
3% (DFW), and 18% (UVI/CMES) of<br />
Figure 4.24. Percent biomass of piscivores, herbivores, and omnivores based on<br />
data collected by three monitoring and assessment programs: CCMA-BT, USVI DFW,<br />
and UVI CMES. Sources: Kendall et al., 2001; Nemeth et al., 2003a,c.
The State of Coral Reef Ecosystems of the U.S. Virgin Islands<br />
fish biomass. Other trophic guilds accounted for 38% (CCMA-BT), 67% (DFW), and 64% (UVI-CMES) of the<br />
observed biomass. Comparisons of current baseline data with future estimates of trophic biomass ratios could<br />
indicate whether fishing pressure on UVSI reef fish assemblages is increasing or decreasing.<br />
The size frequency distributions of groupers suggest that grouper populations in the USVI consist predominantly<br />
of small-sized individuals. The average adult size of a red hind grouper ranges from 25-38 cm, with a<br />
maximum known length of 61 cm (Humann and Deloach, 2002). The coney is smaller with an average adult<br />
size ranging from 15-25 cm and a maximum length of 40 cm (Humann and Deloach, 2002). Eighty-three percent<br />
of the 909 red hind and coney groupers observed by CCMA-BT were smaller than 25 cm in size (Figure<br />
4.25A). DFW caught 513 red hind and 46 coney groupers during trap and hand-line fishing in St. Croix. Of<br />
these, 89% were smaller than 25 cm in size (Figure 4.25B). UVI-CMES divers observed 30 red hind and 72<br />
coney groupers, 94% of which were smaller than 30 cm in size (Figure 4.25C).<br />
Most redband parrotfish observed in the USVI were smaller than the average size of an adult. The average<br />
adult-sizde redband parrotfish ranges from 15-25 cm (Humann and Deloach, 2002). A total of 3,043 redband<br />
parrotfish were observed during 373 CCMA-BT surveys (Figure 4.25D). Thirty-four percent (1,035 individuals)<br />
were 0-5 cm in length. The number of individuals decreased consistently as size-class increased, and only<br />
21% were larger than 15 cm in length. DFW divers observed 590 red band parrotfish grouped into four sizeclasses,<br />
and 93% were less than 20 cm (Figure 4.25E). UVI-CMES reported 721 redband parrotfish grouped<br />
into five size-classes, with 82% being less than 20 cm in size (Figure 4.25F). The size frequency distribution<br />
CCMA-BT<br />
Figure 4.25. Size frequency histograms for four reef fishes based on data collected by three monitoring and assessment programs:<br />
CCMA-BT, USVI DFW, and UVI CMES. Sources: Kendall et al., 2003; Nemeth et al., 2003a,c.<br />
U.S. Virgin Islands<br />
Sidebar<br />
page<br />
79
U.S. Virgin Islands<br />
page<br />
80<br />
The State of Coral Reef Ecosystems of the U.S. Virgin Islands<br />
indicates that redband parrotfish populations in the USVI generally consisted of immature individuals.<br />
Bluehead wrasse populations in the USVI also consisted primarily of individuals smaller than the average<br />
adult size (10-13 cm; Humann and Deloach, 2002). CCMA-BT divers observed 15,337 bluehead wrasse on<br />
398 of 437 surveys (Figure 4.25G). Most (98.5%) were less than 10 cm in length. DFW divers observed 4,959<br />
bluehead wrasse in three size-classes and 99% were less than 10 cm in length (Figure 4.25H). UVI-CMES<br />
reported 375 bluehead wrasse grouped into three size-classes, and 98% were smaller than 10 cm in size (Figure<br />
4.25I). The size frequency distribution of the bluehead wrasse indicates that the USVI populations consist<br />
primarily of juveniles and immature adults.<br />
In summary, fish species composition on reefs and in fisheries catch has shifted to more herbivorous species<br />
since 1988. Additionally, there has been a decline in the number of grouper and snapper species as well as<br />
the average size of fishes observed on reefs during field surveys. Commercially important species such as<br />
large grouper and snapper species, that once abounded on USVI reefs during the 1950s and 1960s are currently<br />
of low abundance in fisheries landings. Continued monitoring of the status of reef populations and reef<br />
fisheries as well as commercially important macroinvertebrates (e.g., conch and lobster) is important.<br />
CURRENT CONSERVATION MANAGEMENT ACTIVITIES<br />
The U.S. Department of the Interior (DOI), U.S. Department of Commerce (DOC), and Virgin Islands Territorial<br />
Government all have jurisdiction in overlapping sections of submerged lands within the USVI (Table 4.10).<br />
These agencies have conducted several research and monitoring activities to aid in the management of USVI<br />
coral reef ecosystems. Both Federal and territorial agencies in the USVI use a variety of management tools<br />
to address issues such as fishing, recreational use, and land-based sources of pollution to protect the marine<br />
resources of the territory.<br />
Table 4.10. Authorities with jurisdiction over waters and submerged lands with coral reefs in the USVI.<br />
GOVERNMENT AGENCY JURISDICTION<br />
Department of Interior,<br />
Minerals Management Service<br />
Leasing responsibility for Federal submerged lands within 200 nmi of<br />
shore.<br />
NPS Buck Island Reef National Monument, Salt River Bay National Historical<br />
Park and Ecological Preserve, Virgin Islands National Park, Virgin Islands<br />
Coral Reef National Monument<br />
NOAA 3-200 nmi<br />
Virgin Islands Territorial Government All other waters and submerged lands from the shoreline to 3 nmi.<br />
Mapping<br />
In 2000, an extensive seafloor mapping project around the USVI was completed by NOAA, local partners, and<br />
the U.S. Coral Reef Task Force. For this project, much of the insular shelf of the USVI from the shoreline to<br />
a depth of approximately 20 m was mapped using visual interpretation of aerial photographs, a 26-category<br />
classification scheme, and a minimum mapping unit (MMU) of 1 acre (NOAA, 2001). Completed maps cover<br />
approximately 490 km 2 of benthic features including mangroves, seagrass, and coral reefs. These maps have<br />
been used for a wide variety of research and management applications, including stratification of sampling<br />
effort in reef fish monitoring projects, distribution and abundance surveys for elkhorn coral and lobster populations,<br />
and an inventory of cryptic fish. Mapping projects since 2000 have primarily covered smaller areas of<br />
particular interest in the USVI, focused on specific bottom types, and had smaller MMUs. Aerial photos have<br />
been used recently to map Buck Island and Salt River, St. Croix at a finer scale (100 m 2 MMU) than was done<br />
previously by CCMA-BT and NPS. These activities are focused on providing a more refined inventory of habitat<br />
types in the national parks located at those sites.
The State of Coral Reef Ecosystems of the U.S. Virgin Islands<br />
Automated computer analysis of historical and current aerial photos was recently completed to detect changes<br />
in seagrass beds northeast of St. Croix (Kendall et al., 2004). This information is currently being used to<br />
establish records of this critical habitat in a location where anchor damage has historically been a problem.<br />
Lidar has also been collected by USGS northeast of St. Croix and around St. John for fine-scale bathymetry<br />
and habitat mapping. Several groups at NOAA are using satellite data to map benthic cover and bathymetry.<br />
LandSat has been used to map bathymetry around the USVI (EarthSat), with cover mapping currently underway.<br />
IKONOS is being used by CCMA-BT to map bathymetry and bottom types around Buck Island, St.<br />
Croix.<br />
Several sonar-based projects have also been completed or are underway in the region. These projects cover<br />
areas too deep or too turbid to map with either aerial or satellite-based sensors. Side scan sonar has been<br />
used by the Caribbean Fishery Management Council and DPNR to map the marine conservation district south<br />
of St. Thomas along with some nearby areas to aide fisheries management. An upcoming project by CCMA-<br />
BT and partners will use multi-beam sonar to map bottom features below 20 m around the BIRNM, St. Croix<br />
and along the mid-shelf reef south of St. John and St. Thomas. The cumulative result of these and future<br />
projects will be continuous map coverage of benthic cover and bathymetry from the shoreline to deep water<br />
areas beyond the insular shelf.<br />
<strong>Marine</strong> Protected Areas<br />
MPAs are used as management tools to protect, maintain, or restore natural and cultural resources in coastal<br />
and marine waters. They have been used effectively both nationally and internationally to conserve biodiversity,<br />
manage natural resources, protect endangered species, reduce user conflicts, provide educational and<br />
research opportunities, and enhance commercial and recreational activities (Salm et al., 2000).<br />
Many different types of MPAs have been established throughout the USVI to provide different levels of protection<br />
for resources based on their size, management goals, and intended purpose (Table 4.11). Over the years,<br />
the number and size of these protected areas have grown steadily, thereby providing protection to a greater<br />
proportion of coral reef ecosystems. Recently, additional marine areas have been set aside for protection<br />
through Federal and local legislation.<br />
The BIRNM is a large coral reef national park located off the island of St. Croix. The monument, originally<br />
established in 1962 by Presidential Proclamation, included a tropical dry forest island (0.7 km 2 ) and 2.9 km 2<br />
of submerged land. Created to protect the island’s elkhorn coral (Acropora palmata) barrier reef, the original<br />
park boundaries did not fully encompass all essential coral reef habitats or the unique “haystack” formations<br />
along the north side of the reef.<br />
When the USVI was highlighted by the U.S. Coral Reef Task Force in 1999, the Secretary of the Interior actively<br />
sought to improve protection for coral reef areas under DOI jurisdiction. In 2001, this effort resulted in<br />
two Presidential Proclamations, one expanding BIRNM by adding over 75 km 2 acres of submerged lands,<br />
and another creating the Virgin Islands Coral Reef National Monument (VICRNM) on St. John. The VICRNM<br />
contains 48.9 km 2 of marine waters adjacent to the VINP, including bank shelf and spur-and-groove reef<br />
formations, mangrove shorelines, hardbottom habitat, and seagrass beds. VICRNM is almost entirely a notake<br />
area (fishing for baitfish and blue runner in a specified zone is allowed) and anchoring is prohibited. The<br />
BIRNM expansion not only added many of the missing and essential coral reef habitats (seagrass, sand,<br />
shallow and deep shelf-edge reefs, and deep pelagic areas), but it also made the entire park a no-take area.<br />
Anchoring at BIRNM requires a permit.<br />
BIRNM and VICRNM are two of the four units in the National Park System that contain fully-protected marine<br />
reserves. The parks were given two years to develop new general management plans and a vessel management<br />
plan, but the expansion of BIRNM and new regulations prohibiting all extractive uses were legally challenged<br />
by the USVI territorial government. To determine if the President had the right to expand BIRNM and<br />
create VICRNM, the Virgin Islands’ delegate to Congress requested that the U.S. General Accounting Office<br />
review the Presidential Proclamations. The review, which took almost 18 months, found that the Proclamations<br />
were valid. The regulations for both monuments went into effect on May 5, 2003.<br />
U.S. Virgin Islands<br />
Sidebar<br />
page<br />
81
U.S. Virgin Islands<br />
page<br />
82<br />
The State of Coral Reef Ecosystems of the U.S. Virgin Islands<br />
Table 4.11. USVI <strong>Marine</strong> Managed Areas (MMA) and their management agencies.<br />
TYPE <strong>OF</strong><br />
PROTECTION<br />
MPAs, Reserves<br />
and No-Take<br />
National<br />
Monuments<br />
ST. THOMAS ST. JOHN ST. CROIX MANAGING<br />
JURISDICTION<br />
Cas Cay/Mangrove<br />
Lagoon Reserve<br />
Small Pond at Frank<br />
Bay Wildlife and <strong>Marine</strong><br />
Sanctuary<br />
St. Croix East End <strong>Marine</strong> Park<br />
established 2003, in early stages<br />
of implementation<br />
St. James Reserve Salt River Bay National Historical<br />
Compass Point<br />
<strong>Marine</strong> Reserve and<br />
Wildlife Sanctuary<br />
Virgin Islands Coral Reef<br />
National Monument<br />
established 2001 by<br />
Presidential Proclamations<br />
National Parks Virgin Islands National<br />
Park established 1956,<br />
expanded marine portions<br />
added in 1962<br />
Spawning<br />
Aggregations<br />
Red hind Closure -<br />
closed year round<br />
Park and Ecological Preserve<br />
established 1992, expanded<br />
1975 and 2003 by Presidential<br />
Proclamations<br />
Buck Island Reef National<br />
Monument established 1962,<br />
expanded 1975 and 2001 by<br />
Presidential Proclamations<br />
Salt River Bay National Historical<br />
Park and Ecological Preserve *<br />
established 1992, expanded 2002<br />
* jointly with territorial government<br />
Red hind Closure - closed<br />
December 1 - February 28<br />
Mutton snapper Closure - closed<br />
March 1 - June 30<br />
Restricted Areas Altona Lagoon and Great Pond<br />
shrimp management area,<br />
restricted gear use<br />
USVI<br />
Government<br />
The most recent addition to the existing network of protected areas is the St. Croix East End <strong>Marine</strong> Park, the<br />
first territorial park designated by the USVI Legislature in January 2003. With this designation, the USVI Legislature<br />
opened the way for the establishment of a territorial network of marine parks. The St. Croix East End<br />
<strong>Marine</strong> Park is not yet functional, but an advisory committee – comprised of stakeholders from the community<br />
– developed a management plan and will be involved in the implementation and management of the park.<br />
By far, one of the most compelling reasons for the implementation of MPAs in the USVI has been their potential<br />
use as fisheries management tools. To this end, one permanent and two temporary closures exist to protect<br />
spawning aggregations of red hind grouper and mutton snapper in St. Thomas and St. Croix (Table 4.11).<br />
These closures were prompted by the drastic decline of grouper populations in the USVI primarily caused by<br />
heavy fishing pressure during spawning season, when the groupers and snappers form large aggregations.<br />
The Red Hind Bank <strong>Marine</strong> Conservation District south of St. Thomas, USVI was closed permanently in 1999<br />
following nine years of seasonal protection covering the red hind spawning period. Recent data indicate that<br />
enforcement of these closures have been successful because the size and numbers of fish spawning within<br />
the aggregations have increased, as have the size of fish caught in the fishery (Nemeth, in review). The implementation<br />
of the MPA resulted in a reversal of the trend of declining red hind size (Figure 4.26) and a dramatic<br />
increase in the biomass of spawning individuals (Figure 4.27).<br />
The NPS Sea Turtle Research Program is in its 18th year of operation (<strong>2005</strong>). This critical program provides<br />
for long-term monitoring, research, and conservation of nesting hawksbill (Eretmochelys imbricata), green<br />
(Chelonia mydas), leatherback (Dermochelys coriacea), and loggerhead (Caretta caretta) turtles at BIRNM.<br />
In 2003, the <strong>Marine</strong> Managed Area (MMA) Inventory was completed for the territory through the collaborative<br />
efforts of the NOAA, DOI, and USVI Coastal Zone Management Program. The USVI inventory is part of a<br />
U.S.-wide MMA inventory. It is currently under review and will be accessible on-line at: http:/www.mpa.gov.<br />
The database contains detailed information on each MMA and can be queried for geographic location, management<br />
characteristics, resources, level of protection, and specific restrictions.<br />
NPS<br />
NPS<br />
NPS<br />
USVI<br />
Joint Federal and<br />
Territorial<br />
Government<br />
Territorial<br />
Government
Other Management Tools<br />
The DFW has deployed several fish<br />
aggregating devices (FADs) in territorial<br />
waters and the adjacent Exclusive<br />
Economic Zone in order to take<br />
fishing pressure off the reefs and<br />
promote a shift to pelagic fishes (Tobias,<br />
2001). Six FADS are currently<br />
deployed around St. Croix and three<br />
around St. Thomas. Efforts are underway<br />
to increase these numbers<br />
during 2004.<br />
Mooring buoys have been installed<br />
throughout the territory by Federal<br />
and territorial agencies as a management<br />
tool to decrease recreational<br />
impacts on coral reefs and related<br />
ecosystems. Mooring buoys are well<br />
used by dive operators, recreational<br />
fishers and boaters. Funding has<br />
been secured by the territorial government<br />
to increase the number of<br />
mooring buoys throughout the territory,<br />
especially within the St. Croix<br />
East End <strong>Marine</strong> Park.<br />
Outside of managed areas, fishing is<br />
regulated under Federal and territorial<br />
rules and regulations. Size restrictions<br />
exist for whelks, conch, and lobster.<br />
The harvest of goliath grouper<br />
(E. Itajara) and Nassau grouper (E.<br />
striatus), as well as the commercial<br />
harvest of billfish is prohibited. Other<br />
restrictions are in place. The territorial<br />
fishing rules and regulations are<br />
currently under review and will be revised<br />
in the near future.<br />
The State of Coral Reef Ecosystems of the U.S. Virgin Islands<br />
Figure 4.26. Length of red hind from fishery port surveys conducted over 30 years and<br />
from red hind spawning aggregation (SPAG). Modified from Nemeth (in review).<br />
Figure 4.27. Biomass of spawning red hind at the <strong>Marine</strong> Conservation district south<br />
of St. Thomas USVI. Source: 1997 data: Beets and Friedlander (1999); 2000-2001:<br />
Nemeth (in review).<br />
OVERALL CONCLUSIONS AND RECOMMENDATIONS<br />
This report has identified several threats facing coral reef ecosystems in the USVI. Current assessments<br />
indicate that water quality is generally good, but it is declining because of an increase in point and nonpoint<br />
source discharges into the marine environment. Coral diseases remain abundant and epidemic, and the percent<br />
cover of coral remains low, while macroalgae abundance on reefs remains high. Dense stands of elkhorn<br />
coral that occurred on reefs during the 1960s and 1970s have not recovered to date. Likewise, populations of<br />
large-sized grouper and snapper species, which were abundant on reefs and were common in fisheries land-<br />
U.S. Virgin Islands<br />
Sidebar<br />
page<br />
83
U.S. Virgin Islands<br />
page<br />
84<br />
The State of Coral Reef Ecosystems of the U.S. Virgin Islands<br />
ings 40 years ago, have not rebounded. Notwithstanding, the size and numbers of groupers and snappers<br />
spawning within some enforced MPAs may be increasing, which is very encouraging. Due to the existence of<br />
several MPAs, current coral reef ecosystem conditions could improve with: 1) a reduction in the number and<br />
intensity of the major threats affecting reefs; 2) enforcement of existing MPAs and laws governing resource<br />
use and extraction; and 3) increased environmental education and awareness among residents and visitors.<br />
Furthermore, coral reef ecosystems would benefit substantially from stronger coordination and collaboration<br />
among Federal and territorial agencies and NGOs that have an interest in marine conservation in the USVI.<br />
Gaps, Problems, and Recommendations<br />
Although the importance of MPAs has been recognized and much effort has been put into their establishment<br />
by government agencies and NGOs, a lack of enforcement of MPAs is a major problem. Minimal enforcement<br />
stems from a lack of management capacity caused by understaffed teams and limited project funding. The<br />
establishment of MPAs is meaningless unless rules and regulations governing those areas can be properly<br />
enforced. This is also true for territorial and Federal fishing regulations, which are not enforced because enforcement<br />
offices are understaffed. This issue must be addressed before additional or stricter regulations can<br />
be proposed and enacted.<br />
Another problem caused by a lack of capacity is the absence of a flow of information between research and<br />
management programs within and among management agencies. For instance, monitoring programs have<br />
collected several years’ worth of data, but analyses of these data have been delayed. Limited human resources<br />
caused by a lack of funding are a primary reason why the results and recommendations from data analyses<br />
sometimes are not available to local managers in a timely manner. Thus, management decisions concerning<br />
resource issues usually are not proactive. Additionally, research and management programs run by territorial<br />
agencies are supported mainly through funding from Federal agencies (EPA, NPS, NOAA and USGS) rather<br />
than through funding from the territorial government. Consequently, the direction and emphasis of research<br />
programs in the USVI are often directed by the programmatic mandates of non-territorial funding agencies<br />
rather than by specific resource issues that affect the territory.<br />
The fact that several jurisdictions are involved in resource management has led to conflicts in the past. Approaches<br />
are very different among management agencies and jurisdictions, and conflicts have arisen where<br />
jurisdictions overlap. Whereas the territorial government tried to involve stakeholders and communities, the<br />
establishment of monuments and national parks has been a top-down approach. This approach has led to<br />
conflicts between managers of monuments and territorial management agencies, such as when objections<br />
were raised, and are still being raised to the 2001 presidential proclamation that expanded the BIRNM. The<br />
territory is also in need of management plans for all designated APC. As of now, these areas exist only on paper<br />
and are useful only for supporting permit decisions for coastal development. Along with efforts to address<br />
the issues here, the following actions would be very valuable in helping to manage and protect resources in<br />
the USVI. These actions include the following:<br />
1. Establishing acceptable limits of change or carrying capacity for protected areas;<br />
2. Training judges on adjudication of environmental issues and concerns;<br />
3. Hiring trained environmental prosecutors (as environmental crimes are currently of low priority in the territory);<br />
4. Shifting toward eco-tourism and increased support and promotion of sustainable and ecologically sound<br />
coastal development by the territorial government; and<br />
5. Establishing pollution control criteria.
REFERENCES<br />
The State of Coral Reef Ecosystems of the U.S. Virgin Islands<br />
Adams, A. 1995. Final Report, Recreational Fishery Assessment Project. Division of Fish and Wildlife, Department of<br />
Planning and Natural Resources, U.S. Virgin Islands. 50 pp.<br />
Adey, W.H. 1975. The algal ridges and coral reefs of St.Croix their structure and Holocene development. Atoll Research<br />
Bulletin 187: 1-67.<br />
Adey, W.H., W. Gladfelter and R.D. Ogden. 1977. Field Guidebook to the reefs and reef communities of St. Croix, Virgin<br />
Islands. Atlantic Reef Committee, University of Miami, Miami Beach, Florida. 52 pp.<br />
Anderson, D.M. and L.H. MacDonald. 1998. Modelling road surface sediment production using a vector geographic information<br />
system. Earth Surface Processes and Landforms 23: 95-107.<br />
Appeldoorn, R., J. Beets, J. Bohnsack, S. Bolden, D. Matos, S. Meyers, A. Rosario, Y. Sadovy and W. Tobias. 1992.<br />
Shallow Water Reef Fish Stock Assessment for the U.S. Caribbean. National Oceanic and Atmospheric Administration<br />
Technical Memorandum NMFS-SEFSC-304. 70 pp.<br />
Ault, J.S., J.A. Bohnsack and G.A. Meester. 1998. A retrospective (1979-1996) multi-species assessment of coral reef<br />
fish stocks in the Florida Keys. Fishery Bulletin 96: 395-414.<br />
Beets, J. 1993. Long-term monitoring of fisheries in Virgin Islands National Park: Chapter I. Baseline data, 1988-1992,<br />
with emphasis on the impact of Hurricane Hugo. Virgin Islands National Park, Technical Report, VINP 1/93.<br />
Beets, J. 1996. The effects of fishing and fish traps on fish assemblages within Virgin Islands National Park and Buck<br />
Island National Monument. U.S. Virgin Islands National Park Technical Report 5/96. 44pp.<br />
Beets, J. 1997. Can coral reef fish assemblages be sustained as fishing intensity increases? Proceedings of the 8th International<br />
Coral Reef Symposium 2: 2009-2014.<br />
Beets, J., L. Lewand and E. Zullo. 1986. <strong>Marine</strong> community descriptions and maps of bays within the Virgin Islands National<br />
Park/Biosphere Reserve. Virgin Islands Resource Management Cooperative. Biosphere Reserve Research Report<br />
2. National Park Service. 117 pp.<br />
Beets, J. and A. Friedlander. 1990. Long-term monitoring of fisheries in the Virgin Islands National Park: Impact of Hurricane<br />
Hugo. Annual Project Report to Virgin Islands National Park. 20 pp.<br />
Beets, J. and A. Friedlander. 1992. Assessment and management strategies for red hind, Epinephelus guttatus, in the<br />
U.S. Virgin Islands. Proceedings of the 42nd Gulf and Caribbean Fisheries Institute 42: 226-242.<br />
Beets, J. and A. Friedlander. 1999. Evaluation of a conservation strategy: a spawning aggregation closure for red hind,<br />
Epinephelus guttatus, in the U.S. Virgin Islands. Environmental Biology of Fishes 55: 91-98.<br />
Beets, J. and A. Friedlander. 2003. Temporal analysis of monitoring data on reef fish assemblages inside the Virgin<br />
Islands National Park and around St. John, U.S. Virgin Islands, 1988-2000. Final Report to the U.S. Geological Survey<br />
Caribbean Field Station, St. John, Virgin Islands.<br />
Bohnsack, J.A. and S.P. Bannerot. 1986. A stationary visual census technique for quantitatively assessing community<br />
structure of coral reef fishes. NOAA Technical Report NMFS 41. 15 pp.<br />
Bohnsack, J.A., S. Meyers, R. Appeldoorn, J. Beets, D. Matos and Y. Sadovy. 1991. Stock Assessment of Spiny Lobster,<br />
Panulirus argus, in the U.S. Caribbean. Report to the Caribbean Fishery Management Council. Miami <strong>Laboratory</strong> Contribution<br />
No. MIA-90/91-49.<br />
Brownell, W.N. 1971. Fisheries of the Virgin Islands. Commercial Fisheries Review 33 (11-12): 23-30.<br />
Brownell, W.N. and W.E. Rainey. 1971. Research and development of deep water commercial and sport fisheries around<br />
the Virgin Islands plateau. Virgin Islands Ecological Research Station, Contribution No. 3. 88 pp.<br />
Bruckner, A.W. 2001. Coral health and mortality: Recognizing signs of coral diseases and predators. pp. 240-271 In: P.<br />
Humann and N. Deloach (eds.) Reef Coral Identification: Florida Caribbean Bahamas. New World Publications, Inc.,<br />
Jacksonville, FL.<br />
Bryant, D., L. Burke, J. McManus and M. Spalding. 1998. Reefs at risk: a map-based indicator of threats to the world’s<br />
coral reefs. World Resources Institute. Washington, D.C. 59 pp.<br />
U.S. Virgin Islands<br />
Sidebar<br />
page<br />
85
U.S. Virgin Islands<br />
page<br />
86<br />
The State of Coral Reef Ecosystems of the U.S. Virgin Islands<br />
Burke, L. and J. Maidens. 2004. Reefs at Risk in the Caribbean. World Resources Institute, Washington, DC. 80 pp. Available<br />
from the internet url: http://marine.wri.org/publications.cfm.<br />
Bythell, J.C., E.H. Gladfelter and M. Bythell. 1992. Ecological studies of Buck Island Reef National Monument, St Croix,<br />
US Virgin Islands. A quantitative assessment of selected components of the coral reef ecosystem and establishment of<br />
long-term monitoring sites. Part II. US National Park Service, Cruz Bay, St John, U.S. Virgin Islands. 72 pp.<br />
Bythell, J.C., E.H. Gladfelter and M. Bythell. 1993. Chronic and catastrophic natural mortality of three common Caribbean<br />
reef corals. Coral Reefs 12: 143-152.<br />
Bythell, J.C., Z. Hillis-Starr and C.S. Rogers. 2000. Local variability but landscape stability in coral reef communities following<br />
repeated hurricane impacts. <strong>Marine</strong> Ecology Progress Series 204: 93-100.<br />
Catanzaro, D., C. Rogers, Z. Hillis-Satrr, R. Nemeth and M. Taylor. 2002. Status of coral reefs of the U.S. Virgin Islands.<br />
pp. 131-150 In: Turgeon D.D., R.G. Asc, B.D. Cause, R.E. Dodg, W. Jaap, K. Banks, J. Delaney , B.D. Keller, R. Speiler,<br />
C.A. Mato, J.R. Garcia, E. Diaz, D. Catanzaro, C.S. Rogers, Z. Hillis-Starr, R. Nemeth, M. Taylor, G.P. Schmahl, M.W.<br />
Miller, D.A. Gulko, J.E. Maragos, A.M. Friedlander, C.L. Hunter, R.S. Brainard, R. Craig, R.H. Richmond, G. Davis, J.<br />
Starmer, M. Trianni, R. Houk, C.E. Birkeland, A. Edward, Y. Golbuu, J. Gutierrez, N. Idechong, G. Paulay, A. Tafileichig<br />
and N.V. Velde. The state of coral reef ecosystems of the United States and Pacific freely associated states: 2002. NOAA/<br />
NOS, Silver Springs, MD. 265 pp.<br />
CFMC (Caribbean Fishery Management Council). 2003. Draft Environmental Impact Statement for the Generic Essential<br />
Fish Habitat Amendment to: Spiny Lobster Fishery Management Plan, Queen Conch Fishery Management Plan, Reef<br />
Fish Fishery Management Plan, Coral Fishery Management Plan for the U.S. Caribbean. Caribbean Fishery Managment<br />
Council Volume 1.<br />
CH2M Hill Inc. 1979. A sediment Reduction Program. Report to the Department and Cultural Affairs. U.S. Virgin Islands<br />
(USVI). Government of the USVI. 88 pp.<br />
Christensen, J.D., C.F.G. Jeffrey, C. Caldow, M.E. Monaco, M.S. Kendall, and R.S. Appeldoorn. 2003. Cross-shelf habitat<br />
utilization patterns of reef fishes in southwestern Puerto Rico. Gulf and Caribbean Research 14: 9-27.<br />
Coles W. 2004. Virgin Islands. Department of Planning and Natural Resources. St. Croiz, US Virgin Islands. Personal<br />
communication.<br />
deGraaf, J. and D. Moore. 1987. Proceedings of the conference on fisheries in crisis. Government of the United States<br />
Virgin Islands, Department of Planning and Natural Resources, Fish and Wildlife Division. 147 pp.<br />
Devine, B., G. Brooks, and R. Nemeth. 2003. Coral Bay Sediment Deposition and Reef Assessment Study. State of the<br />
Bay Final Project Report, submitted to the V.I. Department of Planning and Natural Resources, Division of Environmental<br />
Protection. Non-Point Source Pollution Grant Program MOA# NPS –01801. University of Virgin Islands, St. Thomas, U.S.<br />
Virgin Islands.<br />
Edmunds, P.J. 1991. Extent and effect of black band disease on a Caribbean reef. Coral Reefs 10: 161-165.<br />
Edmunds, P.J. and J. Witman. 1991. Effect of Hurricane Hugo on the primary framework of reefs along the south shore<br />
of St John, US Virgin Islands. <strong>Marine</strong> Ecology Progress Series 78: 201-204.<br />
Fiedler, R.H. and N.D. Jarvis. 1932. Fisheries of the Virgin Islands of the United States. U.S. Dept. of Commerce, Bureau<br />
of Fisheries. Investigational Report 14. 32 pp.<br />
Friedlander, A.M. 1997. Status of queen conch populations around the northern US Virgin Islands with management recommendations<br />
for the Virgin Islands National Park. Biological Resources Division, United States Geological Survey.<br />
Froese, R. and D. Pauly (eds.). 2000. Fishbase 2000: concepts, design, and data sources. ICLARM, Los Banos, Laguna,<br />
Phillipines.<br />
Garrison, V.H., C.S. Rogers and J. Beets. 1998. Of reef fish, overfishing, and in situ observations of fish traps in St. John,<br />
U.S. Virgin Islands. Revista de biología tropical 46: 41-59.<br />
Garrison, V.H., E.A. Shinn, W.T. Foreman, D.W. Griffin, C.W. Holmes, C.A. Kellogg, A. Christina, M.S. Majewski, L.L.<br />
Richardson, K.B. Ritchie and G.W. Smith. 2003. African and Asian Dust: From Desert Soils to Coral Reefs. BioScience<br />
53: 469-480.
The State of Coral Reef Ecosystems of the U.S. Virgin Islands<br />
Ginsburg, R.N., R.P.M. Bak, W.E. Kiene, E. Gischler and V. Kosmynin. 1996. Rapid assessment of reef condition using<br />
coral vitality. Reef Encounter 19: 12-24.<br />
Gladfelter W.B., E.H. Gladfelter, R.K. Monahan, J.C. Ogden and R.D. Dill. 1977. Environmental studies of Buck Island<br />
Reef National Monument, St. Croix, US Virgin Islands. National Park Service. 140 pp.<br />
Gordon, S. 2002. USVI queen conch assessment. Final Report to the Southeast Area Monitoring and Assessment Program-Caribbean.<br />
Division of Fish and Wildlife, Department of Planning and Natural Resources, U.S. Virgin Islands. 65<br />
pp.<br />
Gordon, S. and K.R. Uwate. 2003. 2002 opinion survey of U.S. Virgin Islands commercial fishers and the marine recreational<br />
industry. Division of Fish and Wildlife, Department of Planning and Natural Resources, US Virgin Islands. 31 pp.<br />
Gordon, S. and J.A. Vasques. In press. Spatial and temporal variation in postlarval settlement of the spiny lobster, Panulirus<br />
argus, between 1992 and 2003 with the Cas Cay/Mangrove Lagoon and Great St. James <strong>Marine</strong> Reserves, St.<br />
Thomas. Gulf Caribbean Fisheries Institute.<br />
Hillis-Starr, Z. 2004. U.S. National Park Service, St. Croix, US Virgin Islands. Personal communication.<br />
Hubbard, D. K., J. D. Stump and B. Carter. 1987. Sedimentation and reef development in Hawksnest, Fish, and Reef<br />
bays, St. John, U.S. Virgin Islands. Virgin Islands National Park/Biosphere Reserve, Virgin Islands Resource Management<br />
Cooperative, National Park Service. Biosphere Reserve Research Report 21. 99 pp.<br />
Hubbard, D.K., K.M. Parsons, J.C. Bythell and N.D. Walker. 1991. The effects of Hurricane Hugo on the reefs and associated<br />
environments of St Croix, US Virgin Islands – a preliminary assessment. Journal of Coastal Research Special<br />
Issue 8: 33-48.<br />
Hubbard, D.K., E.H. Gladfelter and J.C. Bythell. 1993. Comparison of biological and geological perspectives of coral-reef<br />
community structure at Buck Island, U.S. Virgin Islands. In: R.N. Ginsburg (ed.) Proceedings of the global aspects of coral<br />
reefs: health hazzards, and history. Rosentiel School of <strong>Marine</strong> and Atmospheric Sciences, University of Miami.<br />
Humann, P. and N. Deloach. 2002. Reef Fish Identification: Florida Caribbean Bahamas, 3rd edition. New World Publications,<br />
Inc., Jacksonville, FL. 481 pp.<br />
IRF (Island Resource Foundation). 1996. Tourism and coastal resources degradation in the wider Caribbean. Island Resources<br />
Foundation, Washington, DC. 53 pp. Available from the internet URL: http://www.irf.org/irtourdg.html.<br />
IRF (Island Resource Foundation). 1999. Abbreviated 1998 water quality assessment of the United States Virgin Islands.<br />
Submitted to the U.S. Environmental Protection Agency. Division of Environmental Protection, Department of Planning<br />
and Natural Resources (DPNR), Government of the Virgin Islands (USVI) of the United States. 101 pp.<br />
Jarrell, J.D., M. Mayfield and E.N. Rappaport. 2001. The deadliest, costliest, and most intense United States hurricanes<br />
from 1900 to 2000 (and other frequently requested hurricane facts). NOAA AOML Hurricane Research Division, Miami.<br />
7 pp.<br />
Jennings, C.A. 1992. Survey of non-charter boat recreational fishing in the U.S. Virgin Islands. Bulletin of <strong>Marine</strong> Science<br />
50 (2): 342-351.<br />
Kendall, M.S., C.R. Kruer, K.R. Buja, J.D. Christensen, M. Finkbeiner, R.A. Warner and M.E. Monaco. 2001. Methods<br />
used to map the benthic habitats of Puerto Rico and the U.S. Virgin Islands. NOAA, NOS, NCCOS. Silver Spring MD.<br />
45 pp.<br />
Kendall, M.S., J.D. Christensen and Z. Hillis-Starr. 2003. Multi-scale data used to analyze the spatial distribution of<br />
French grunts, /Haemulon flavolineatum/, relative to hard and soft bottom in a benthic landscape. Environmental Biology<br />
of Fishes 66: 19-26.<br />
Kendall, M.S., T. Battista and. Z. Hillis-Starr. 2004. Long term expansion of a deep Syringodium filiforme meadow in St.<br />
Croix, US Virgin Islands: the potential role of hurricanes in the dispersal of seeds. Aquatic Botany 78: 15-25.<br />
Kimmel, J. 1992. NPS coral reef assessment program: preliminary assessment of fishes in the Dry Tortugas, Florida.<br />
Report to the National Park Service Coral Reef Assessment Program. 4 pp.<br />
Kojis, B. 2004. Census of the marine commercial fishers of the U.S. Virgin Islands. Report to the Caribbean Fishery<br />
Management Council. Division of Fish and Wildlife, Department of Planning and Natural Resources, U.S. Virgin Islands.<br />
87 pp.<br />
U.S. Virgin Islands<br />
Sidebar<br />
page<br />
87
U.S. Virgin Islands<br />
page<br />
88<br />
The State of Coral Reef Ecosystems of the U.S. Virgin Islands<br />
Lessios, H.A., D.R. Robertson and J.D. Cubit. 1984. Spread of Diadema mass mortality through the Caribbean. Science<br />
226: 335-337.<br />
Levitan, D.R. 1988. Algal-urchin biomass responses following the mass mortality of the sea urchin Diadema antillarum<br />
Philippi at St. John, U.S. Virgin Islands. Journal of Experimental <strong>Marine</strong> Biology and Ecology 119: 167-178.<br />
Link, E.G. 1997. Information transfer between managers and boaters and compliance with mooring and anchoring regulations<br />
in the Virgin Islands National Park. Masters thesis for the University of Rhode Island. 138 pp.<br />
Mateo, I. 2000. Final Report, Recreational Fishery Assessment Project. Division of Fish and Wildlife, Department of Planning<br />
and Natural Resources, U.S. Virgin Islands. 52 pp.<br />
Mateo, I. and W.J. Tobias. 2002. Preliminary estimations of growth, mortality, and yield per recruit for the spiny lobster<br />
Panulirus argus. pp. 58-75. In: St. Croix, USVI. Proceedings of the Gulf and Caribbean Fisheries Institute 53.<br />
Miller, J., C. Rogers and R. Waara. 2003. Monitoring the coral disease, plague type II, on coral reefs in St. John, U.S.,<br />
Virgin Islands. Revista de biología tropical 51: 47-55.<br />
Monaco, M.E., J.D. Christensen and S.O. Rohmann. 2001. Mapping and monitoring of U.S. coral reef ecosystems-the<br />
coupling of ecology, remote sensing and GIS technology. Earth System Monitor 12 (1): 1-16<br />
Monaco, M.E., A.M. Friedlander, C. Caldow, J.D. Christensen, J. Beets, J. Miller and C.S. Rogers. In preparation. A Preliminary<br />
Assessment of Virgin Islands Coral Reef National Monument: Comparison of Fish Populations and Habitat Inside<br />
and Outside of a <strong>Marine</strong> Protected Area.<br />
National Resources Defense Council. 2004. Testing the waters: a guide to water quality at vacation beaches. Available<br />
from the internet URL: http://www.nrdc.org/water/oceans/ttw/sumvi.<strong>pdf</strong>.<br />
Nemeth, R.S. In review. Recovery of a US Virgin Islands red hind spawning aggregation following protection. <strong>Marine</strong><br />
Ecology Progress Series.<br />
Nemeth, R.S. and J. Sladek-Nowlis. 2001. Monitoring the effects of land development on the near-shore reef environment<br />
of St. Thomas, USVI. Bulletin of <strong>Marine</strong> Science 69: 759-775.<br />
Nemeth, R.S., S. Herzlieb and M. Taylor. 2002. Coral reef monitoring in St. Croix and St. Thomas, United States Virgin<br />
Islands. Year 1 final report. Division of Fish and Wildlife, Department of Planning and Natural Resources. US Virgin Islands.<br />
33 pp.<br />
Nemeth, R.S., L. Whaylen and C. Pattengill-Semmens. 2003a. A rapid assessment of coral reefs in the Virgin Islands<br />
(Part 1: stony corals and algae). Atoll Resesearch Bulletin 496: 544-566.<br />
Nemeth, R.S., L.D. Whaylen and C.V. Pattengill-Semmens. 2003b. A rapid assessment of coral reefs in the Virgin Islands<br />
(Part 2: fishes). Atoll Resesearch Bulletin 496: 567-590.<br />
Nemeth, R.S., S. Herzlieb, M. Taylor, S. Herald and W. Toller. 2003c. Coral reef monitoring in St. Croix and St. Thomas,<br />
United States Virgin Islands. Year 2 final report, submitted to Department of Planning and Natural Resources.<br />
Nemeth, R.S., S. Herzlieb, E.S. Kadison, M. Taylor, P. Orthenberger and S. Harold. 2004. Coral reef monitoring in St.<br />
Croix and St. Thomas, United States Virgin Islands. Year 3 final report. Division of Fish and Wildlife, Department of Planning<br />
and Natural Resources, US Virgin Islands. 74 pp.<br />
NOAA (National Oceanic and Atmospheric Administration). 2001. National Ocean Service, National Centers for Coastal<br />
Ocean Science, Biogeography Program. Benthic Habitats of Puerto Rico and the U.S. Virgin Islands. CD-ROM. Silver<br />
Spring, MD.<br />
Olsen, D.A. and J.A. LaPlace. 1978. A study of a Virgin Islands grouper fishery based on a breeding aggregation. Proceedings<br />
of the 31st Gulf and Caribbean Fisheries Institute 31: 130-144.<br />
Olsen, D.A., D.W. Nellis and R.S. Wood. 1984. Ciguatera in the eastern Caribbean. <strong>Marine</strong> Fisheries Review 46: 13-18.<br />
Randall, J.E. 1967. Food habits of reef fishes of the West Indies. Studies in Tropical Oceanography 5: 665-847.<br />
Randall, J.E. 1996. Caribbean Reef Fishes, 3rd edition. T.F.H. Publications, Inc., Neptune City, NJ. 368 pp.
The State of Coral Reef Ecosystems of the U.S. Virgin Islands<br />
Rogers, C.S., T. Suchanek and F. Pecora. 1982. Effects of Hurricanes David and Frederic (1979) on shallow Acropora<br />
palmata reef communities: St Croix, USVI. Bulletin of <strong>Marine</strong> Science 32: 532-548.<br />
Rogers, C.S., L. McLain and C. Tobias. 1991. Effects of Hurricane Hugo (1989) on a coral reef in St John, USVI. <strong>Marine</strong><br />
Ecology Progress Series 78: 189 – 199.<br />
Rogers, C.S., V. Garrison and R. Grober-Dunsmore. 1997. A fishy story about hurricanes and herbivory: seven years of<br />
research on a reef in St John, US Virgin Islands. pp. 555-560. In: H. A. Lessios and I. G. Macintyre (eds.) Proceedings of<br />
the 8th International Coral Reef Symposium. Smithsonian Tropical Research Institute, Balboa, Panama.<br />
Rogers, C.S. and J. Beets. 2001. Degradation of marine ecosystems and decline of fishery resources in marine protected<br />
areas in the US Virgin Islands. Environmental Conservation 28: 312-322.<br />
Rogers, C.S. and V.H. Garrison. 2001. Ten years after the crime: lasting efects of damage from a cruise ship anchor on<br />
a coral reef in St. John, US. Virgin Islands. Bulletin of <strong>Marine</strong> Science 69: 793-803.<br />
Rogers, C.S and J. Miller. 2001. Coral bleaching, hurricane damage, and benthic cover on coral reefs in St. John, U.S.<br />
Virgin Islands: a comparison of surveys with the chain transect method and videography. Bulletin of <strong>Marine</strong> Science 69:<br />
459 – 470.<br />
Rogers, C.S., W. Gladfelter, D. Hubbard, E. Gladfelter, J. Bythell, R. Dunsmore, C. Loomis, B. Devine, Z. Hillis-Starr and<br />
B. Phillips. 2002. Acropora in the U.S. Virgin Islands: A Wake or an Awakening? A Status Report Prepared for the National<br />
Oceanographic and Atmospheric Administration. pp. 99 – 122. In: A.W. Bruckner, A. (ed.) NOAA Technical Memorandum<br />
NMFS-OPR-24. National Oceanic and Atmospheric Administration, Silver Spring, MD.<br />
Rosario, A. 1995. Queen conch stratification survey. SEAMAP-Caribbean Program. CFMC/NMFS. 33 pp.<br />
Salm, R.V., J. Clark and E. Sirila. 2000. <strong>Marine</strong> and Coastal Protected Areas: A Guide for Planners and Managers. Washington,<br />
DC: IUCN-The World Conservation Union. 371 pp.<br />
Swingle, W.E., A.E. Dammann and J.A. Yntema. 1979. Survey of the commercial fishery of the Virgin Islands of the<br />
United States. pp. 22: 110-121. In: Proceedings of the 22nd Gulf and Caribbean Fisheries Institute.<br />
Sylvester, J.R. and A.E. Dammann. 1972. Pot fishing in the Virgin Islands. Commercial Fisheries Review 34: 33-35.<br />
Tobias, W. USVI Dept of Planning and Natural Resources. St. Croix, USVI. Personal communication.<br />
Tobias, W. 2000. U.S. Virgin Islands/National <strong>Marine</strong> Fisheries Service inter-jurisdictional fisheries program final progress<br />
report, 1 October 1997 – 30 September, 2000. 25 pp.<br />
Tobias, W. 2001. Fish attracting device (FAD) construction, placement, monitoring and maintenance. Final Report to<br />
U.S. Fish and Wildlife Service Sport Fish Restoration Program. Division of Fish and Wildlife, Department of Planning and<br />
Natural Resources, U.S. Virgin Islands. 35 pp.<br />
Tobias, W., R. Gomez, I. Mateo and B. Kojis. 2000. Three Year Summary Report, 1 April 1997-31 March 1999, Cooperative<br />
Statistics Program NA77FT0093. USVI Department of Planning and Natural Resources, Division of Fish and Wildlife,<br />
Bureau of Fisheries, 40 pp.<br />
Tobias, W., W. Toller, H. Rivera and W. Ventura. 2002. SEAMAP-C USVI St. Croix fisheries independent trap and line survey.<br />
Summary report: Caribbean/NMFS Cooperative SEAMAP Program NA07FS0100-01. Division of Fish and Wildlife,<br />
Department of Planning and Natural Resources, U.S. Virgin Islands. 27 pp.<br />
Tobias, W. and W. Toller. 2004. Netfishing overview-St. Croix, U.S. Virgin Islands. Management implications for restrictions<br />
on the use of gill and trammel nets. Report to the Commissioner of Department of Planning and Natural Resources,<br />
Division of Fish and Wildlife, US Virgin Islands. 21 pp.<br />
U.S. Census Bureau (USCB). 2001. Census 2000 population counts for the U.S. Virgin Islands. USCB, Washington, DC.<br />
Available from the internet URL: http://www.census.gov/Press-Release/www/2001/cb01cn172.html.<br />
U.S. Census Bureau. 2003. Population and Housing Profile: 2000: 2000 census of population and housing, U.S. Virgin<br />
Islands. Washington, DC. 219 pp. Available from the internet URL: http://www.census.gov/prod/cen2000/island/VIprofile.<br />
<strong>pdf</strong>.<br />
USVI (United States Virgin Islands) Bureau of Economic Research. 2004. U.S. Virgin Islands annual tourism indicators.<br />
Charlotte Amalie, St. Thomas, USVI.<br />
U.S. Virgin Islands<br />
Sidebar<br />
page<br />
89
U.S. Virgin Islands<br />
page<br />
90<br />
The State of Coral Reef Ecosystems of the U.S. Virgin Islands<br />
USVI DPNR (United States Virgin Islands. Department of Planning and Natural Resources). 2004. The 2004 Integrated<br />
Water Quality Monitoring and Assessment Report for the United States Virgin Islands. DPNR, Division of Environmental<br />
Protection, U.S. Virgin Islands. 193 pp.<br />
UVI-ECC (United States Virgin Islands. Eastern Caribbean Center). 2002. Telephone survey of boat-based marine recreational<br />
fishing in the U.S. Virgin Islands, 2000. University of the Virgin Islands, ECC. Department of Planning and Natural<br />
Resources, Division of Fish and Wildlife, U.S. Virgin Islands. 56 pp.<br />
Uwate, K.R., W. Tobias, P. Nieves, H. Rivera, W. Ventura and L. Critchley. 2001. Survey of U.S. Virgin Island commercial<br />
fishery opinions and usage of New National Monument areas (Buck Island and South of St. John). Department of Planning<br />
and Natural Reosurces, Division of Fish and Wildlife, Bureau of Fisheries, U.S. Virgin Islands. 13 pp.<br />
Valle-Esquivel, M. 2002. U.S. Caribbean queen conch (Strombus gigas) data update with emphasis on the commercial<br />
landings statistics. University of Miami, Sustainable Fisheries Division Contribution SFD-01/02-169.<br />
Weil, E. and G. Smith. 2003. Status, variability, and extended host and geographic range of Caribbean coral diseases in<br />
Bermuda. In: Proceedings, 7th International Conference on Coelenterate Biology. University of Kansas, Lawrence.<br />
Wolff, N. 1996. The Fish Assemblages within Four Habitats found in the Nearshore Waters of St. John, USVI: With some<br />
Insights into the Nature of Trap Fishing. M.S. Thesis for the University of Rhode Island. 207 pp.<br />
Wolff, N. 1998. Spiny lobster evaluation within Virgin Islands National Park (Summer of 1996). Report to U.S. Geological<br />
Survey (USGS), Biological Resources Division, Washington DC. 16 pp.<br />
Wood, D. and D. Olsen. 1984. Application of biological knowledge to the management of the Virgin Islands conch fishery.<br />
pp: 112-121. In: Proceedings of the 35th Gulf and Caribbean Fisheries Institute.
The State of Coral Reef Ecosystems of the Commonwealth of Puerto Rico<br />
Jorge (Reni) García-Sais 1 , Richard Appeldoorn 1 , Andy Bruckner 2 , Chris Caldow 3 , John D. Christensen 3 , Craig Lilyestrom 4 ,<br />
Mark E. Monaco 3 , Jorge Sabater 5 , Ernest Williams 1 , Ernesto Diaz 6<br />
INTRODUCTION AND SETTING<br />
Puerto Rico, the smallest of the Greater Antilles, is located in the north central Caribbean, between the U.S.<br />
Virgin Islands (USVI) to the east and the Dominican Republic to the west (Figure 5.1). Puerto Rico is an<br />
archipelago comprised of the main island; the oceanic islands of Mona, Monito, and Desecheo in the Mona<br />
Passage; Caja de Muertos Island on the south coast; Vieques Island; Culebra Island; and a series of smaller<br />
islets or cays known as the “Cordillera de Fajardo.” The total area of the Puertorrican archipelago is 8,929,468<br />
km 2. .<br />
The geological, climatological, and oceanographic features that affect growth and development of coral reefs<br />
vary markedly among insular shelf segments (García-Sais et al., 2003). The north and northwest coasts are<br />
narrow (
Puerto Rico<br />
page<br />
92<br />
The State of Coral Reef Ecosystems of Puerto Rico<br />
Figure 5.1. A map of Puerto Rico showing locations mentioned in this chapter. Map: A. Shapiro.<br />
Mona and Desecheo are oceanic islands in the Mona Passage that belong to Puerto Rico. The northern<br />
sections of the islands are strongly impacted by wave action and their insular platforms are narrow, whereas<br />
the southern coastal sections of these islands are more protected and have wider platforms where coral<br />
reefs develop. There are no rivers on either of the islands, which are surrounded by waters of exceptional<br />
transparency (Cintrón et al., 1975). In Desecheo, the coral reef system is impressive at depths between<br />
20-30 m with live coral cover exceeding 70% in many sections. The coral reef system off Puerto Canoas at<br />
Desecheo Island extends down to a depth of 40 m (García-Sais et al., 2004).<br />
Modern shelf-edge reefs formed in Puerto Rico some 8,000 years ago (Adey, 1978). Inner reefs, formed<br />
on top of submerged banks and sandy bottoms of the flooded shelf are believed to be about 5,000 years<br />
old (Adey, 1978). The rise in sea level associated with the last Pleistocene glaciation (Wisconsin) flooded<br />
the lower limestone ridges of the shelf, providing appropriate sites for coral growth and subsequent reef<br />
development (Goenaga and Cintrón, 1979). Cross-shelf seismic profiles provided by Morelock et al. (1977)<br />
support the theory of Kaye (1959), which states that reefs on the southwest coast developed on drowned<br />
calcarenite cuestas formed as eolianite structures parallel to the coastline during the Wisconsin glacial period.<br />
Proper substrate, depth, and water transparency conditions in the southwest coast allowed for extensive<br />
development of coral reefs during the mid-Holocene period (Goenaga and Cintrón, 1979). At least three major<br />
types of reefs (rock reefs, hard ground reefs, coral reefs) are recognized within the Puertorrican shelf (García-<br />
Sais et al., 2003) although different coral reef formations have been reported (Goenaga and Cintrón, 1979;<br />
Hernández-Delgado, 1992; Morelock et al., 1977).<br />
Rock reefs are submerged hard substrate features of moderate to high topographic relief with typically low<br />
to very low coral cover, mostly colonized by turf algae and other encrusting biota (Figure 5.2). Coral colonies<br />
are abundant in some cases (e.g., Diploria spp., Siderastrea spp., Montastrea cavernosa, Porites astreoides)<br />
but grow mostly as encrusting forms, providing minimal topographic relief. These types of reefs fringe the<br />
west and northwest coasts and are believed to be the main components of deep reef systems beyond the<br />
shelf-edge. Rock reefs are important habitats for fishes and macroinvertebrates since they are usually the<br />
only available structure providing underwater topographic relief in these areas. Some have developed atop of<br />
submerged rocky headlands and are characterized by the development of coralline communities adapted for<br />
growth under severe wave action and strong currents.
The State of Coral Reef Ecosystems of Puerto Rico<br />
There are deep basaltic rock reefs; an extensive and complex system of slabs, boulders, crevices; and vertical<br />
walls associated with the insular slope. The most extensive deep reef formation is the great southern Puerto<br />
Rico fault zone (Glover, 1967; Garrison and Buell, 1971), a submerged section of the Antillean Ridge that<br />
extends across the entire Mona Passage. The ridge rises from a mean depth of 4,600 m and includes the<br />
islands of Mona, Monito and Desecheo, as well as submerged seamount peaks that rise to depths of less than<br />
100 m, such as Bajo de Cico and Bajo Esponjas<br />
Hard ground reefs are mostly flat platforms ranging in depth from 5-30 m and largely covered by turf algae,<br />
encrusting sponges, and scattered patches of stony corals (Figure 5.2). Coral colonies are typically encrusting<br />
forms, an adaptation to the extremely high wave energy that prevails seasonally on the north coast. Many of<br />
the encrusting coral colonies grow over vertical walls in crevices among the hard ground. The barrel sponge,<br />
Xestospongia muta, is usually abundant in hard ground reefs, where it represents one of the main features<br />
contributing topographic relief. Low-relief sand channels aligned perpendicular to the coast cut through the<br />
hard ground platform in many areas and provide topographic discontinuities. The sand is generally coarse<br />
and mostly devoid of biota, reflecting short deposition times and highly dynamic movements across the shelf<br />
due to the high wave action. These systems are found off the north central and northeast coastlines (García-<br />
Sais et al., 2003).<br />
Coral reefs are mostly found as fringing, patch, and shelf-edge formations in Puerto Rico. Fringing coral reefs<br />
are by far the most common. These are located throughout most of the northeast, east, and southwestern<br />
coastlines associated with erosional “rocky” features of the shelf. In most instances, coral is not the main<br />
constituent of the basic reef structure, but its development has significantly contributed to topographic relief,<br />
influencing the sedimentation of adjacent areas and providing habitat for a taxonomically diverse community<br />
that is consistent with a coral reef system (García-Sais et al., 2003). On the south coast, coral reefs fringe<br />
many small islands or keys, and are found as extensive coral formations associated with the shoreline at<br />
the mouths of coastal embayments. In some instances, coral growth has been primarily responsible for the<br />
formation of emergent island reefs, or keys, such as the reefs off La Parguera (García-Sais and Sabater,<br />
2004). Fringing reefs are also found off the northeast coast, mostly on the leeward section of the islets off<br />
Fajardo (in the Cordillera de Fajardo Natural Reserve).<br />
Shelf-edge reefs are the best developed (but least studied) coral reef systems in Puerto Rico. An extensive<br />
reef formation is found at the shelf-edge off the southwest coast in La Parguera. This reef displays the typical<br />
“spur-and-groove” growth formation with sand channels cutting through the shelf perpendicular to the coastline<br />
(Figure 5.2). Also, the reef formations at the shelf-edge of Ponce (Derrumbadero), Guánica, and Desecheo<br />
and Mona Islands are characterized by structurally and taxonomically complex communities. The shelf break<br />
on the north coast is characterized by a more gentle slope than on the south coast and the substrate is<br />
generally sandy or a flat, hard ground with low relief. Scattered rock reefs occur throughout many sections<br />
of the north coast. Some are present down the insular slope and represent the main substrate for deep reef<br />
communities with live hermatypic and ahermatypic corals providing important physical habitat.<br />
Figure 5.2. Left photo depicts rock reef habitat in the Aguadilla shelf, northwest coast. Center photo shows hard ground reef habitat<br />
in Arecibo, north coast. Right photo depicts a “spur and groove” coral reef formation in La Parguera, southwest coast. Photos: J.<br />
Sabater.<br />
Puerto Rico<br />
Sidebar<br />
page<br />
93
Puerto Rico<br />
page<br />
94<br />
The State of Coral Reef Ecosystems of Puerto Rico<br />
The Coral Reef Monitoring Program for Puerto Rico, which is sponsored by the National Oceanic and<br />
Atmospheric Administration (NOAA) and administered by the Puerto Rico Department of Natural and<br />
Environmental Resources (DNER), is now fully implemented and has achieved its initial goals in collaboration<br />
with Federal and local governmental agencies and marine scientists from research institutions. This chapter<br />
provides an assessment of the status of coral reef systems in Puerto Rico. A synopsis of scientific research<br />
undertaken in characterization of coral reefs is included, along with an evaluation of temporal and spatial<br />
trends of reef community structure and health, as suggested by the data emerging from ongoing monitoring<br />
programs. Quantitative baseline characterizations of sessile-benthic and fish communities at natural reserve<br />
sites and other sensitive coastal areas represent the basis for this assessment of Puertorrican coral reefs.<br />
Inferences derived from basic research on coral diseases, coral bleaching, mass mortalities and potentially<br />
relevant environmental and anthropogenic stressors, such as global warming, storms, eutrophication, fishing,<br />
sediment runoff, dredging activities and others are also presented. A description of the major ongoing programs<br />
on coral reef community characterizations and monitoring is included, along with a database on percent cover<br />
and taxonomic composition of live corals and fishes from reefs surveyed around Puerto Rico. Conservation<br />
management strategies that include active marine protected area (MPA) programs and revisions to fishing laws<br />
are presented and evaluated. Preliminary conclusions about the status of coral reefs and recommendations<br />
for management are also included in this chapter.<br />
ENVIRONMENTAL AND ANTHROPOGENIC STRESSORS<br />
Climate Change and Coral Bleaching<br />
Bleaching has been reported on Caribbean reefs since the 1940s (Goreau, 1964) and has been associated<br />
with localized events including marked changes in salinity, turbidity and extreme low tides (Winter et al., 1998).<br />
During the summer of 1987, a massive coral bleaching event was observed in Puerto Rico (Goenaga et al.,<br />
1989; Williams et al., 1987) and throughout the Caribbean (Williams and Bunkley-Williams, 1988).<br />
Goenaga et al. (1989) reported extensive bleaching of zooxanthellate cnidarians from forereef environments<br />
in La Parguera that included scleractinians, zoanthids, encrusting and arborescent gorgonians, anemones<br />
and hydrocorals. A total of 64 species of coral reef photosymbiotic hosts were affected (Williams and Bunkley-<br />
Williams, 1989). Goenaga et al. (1989) associated the bleaching event to exceptionally calm seas coupled<br />
with high water transparency and increased water temperature. Vicente (1994b) found 22% of 326 corals<br />
monitored at Cayo Enrique Reef in La Parguera bleached in 1987 and 44% of those showed tissue necrosis.<br />
Goenaga et al. (1989) also found that bleaching was unrelated to depth and that the Boulder star coral,<br />
Montastrea annularis, had been most affected by the bleaching event in Cayo Enrique, La Parguera. Lingering<br />
effects of the 1987 mass bleaching of corals in La Parguera that lasted until late 1988 were reported by<br />
Bunkley-Williams et al. (1991). Williams and Bunkley-Williams (1990b, 2000) argued that beyond the initial<br />
damage, corals do not have sufficient time to recover between closely spaced major bleaching events and<br />
therefore the damage may be cumulative and ever increasing.<br />
Velasco et al. (2003) tagged and observed 386 specimens of 23 species of corals off southwestern Puerto<br />
Rico after a bleaching event in 1998. They found 99% of coral colonies recovered from bleaching after<br />
three years, including the 15% that bleached again in 1999 (Velasco et al., 2003). Wilkinson (2003) and<br />
Williams and Bunkley-Williams (2000) suggested that the 1998 event in the northern Caribbean consisted of<br />
widespread, but only low to moderate bleaching. Wilkinson (2003) suggested that most susceptible corals<br />
had been killed by previous bleaching.<br />
A number of bleaching studies have been conducted around Puerto Rico (e.g., Bunkley-Williams et al., 1991;<br />
Goenaga and Canals, 1990; Goenaga et al., 1989; Goreau et al., 1992; Hall et al., 1999; Hernández-Delgado<br />
and Alicea-Rodriguez, 1993; Velasco et al., 2003; Vicente, 1989, 1990, 1994a,b; Williams and Bunkley-Williams,<br />
1988, 1989; Williams et al., 1987; Winter et al., 1998; Woodley et al., 1997). The nearshore reefs seem to have<br />
been damaged more by bleaching and have recovered less than the shelf-edge reefs in southwestern Puerto<br />
Rico (Williams and Bunkley-Williams, unpublished data). Many former inshore coral reefs have deteriorated<br />
to algal reefs. The reefs at Mona Island appear to have been damaged more than those on the main island of<br />
Puerto Rico, but this seems to be due more to diseases than bleaching, although bleaching may have had a<br />
precursor effect (Williams and Bunkley-Williams, unpublished data).
The State of Coral Reef Ecosystems of Puerto Rico<br />
Winter et al. (1998) compared coral reef bleaching events at La Parguera to a 30-year (1966-1995) record of<br />
sea surface temperature (SST) for that location and found that the annual temperature indices of maximum<br />
daily SST, days >29.5°C, and days >30°C all predicted the years of severe coral bleaching in La Parguera<br />
corresponding to 1969, 1987, 1990, and 1995. However, no one simple predictor of the onset of a bleaching<br />
event within a single year may be applicable according to Winter et al. (1998).<br />
Diseases<br />
Coral disease, specifically black band disease (BBD), was first reported on reefs surrounding mainland Puerto<br />
Rico in 1972 (Antonius, 1981), with sporadic observations by other researchers over the last three decades<br />
(Williams and Bunkley-Williams, 1990b). A coral disease monitoring program established in 1994 has<br />
documented outbreaks of BBD in selected locations near La Parguera, Rincón, and Aguadilla, with isolated<br />
cases observed in other locations including the offshore islands of Desecheo and Mona (Bruckner, 1999). The<br />
prevalence of BBD has declined since Hurricane Georges (1998), although localized outbreaks in previously<br />
unaffected locations continue to occur. A recent Caribbean-wide survey reported an unusually high prevalence<br />
of BBD (6.8%) on Desecheo Island (Weil et al., 2002). On Mona Island, BBD has affected 1-11% of the brain<br />
corals (Diploria strigosa and D. clivosa) in reef crest and backreef environments since the mid-1990s, with<br />
infections occurring sporadically (
Puerto Rico<br />
page<br />
96<br />
The State of Coral Reef Ecosystems of Puerto Rico<br />
Tropical Storms<br />
Hurricanes are natural catastrophic<br />
events that have caused massive<br />
mortalities to coral reef and other<br />
coastal marine communities in Puerto<br />
Rico (Figure 5.3). In particular,<br />
hurricanes appear to be the main<br />
factor for the large-scale decimation<br />
of elkhorn coral (Acropora palmata)<br />
biotopes in Puertorrican reefs. The<br />
intense wave action, surge, and<br />
sediment abrasion stress associated<br />
with hurricanes cause the mechanical<br />
detachment and mortality of many<br />
benthic reef organisms, including<br />
corals in shallow reef zones. Coastal<br />
communities are also impacted by<br />
high sediment and nutrient loads<br />
from rainfall runoff during and several<br />
days after the pass of hurricanes.<br />
The effects of Hurricane Edith (1963)<br />
on the shallow reefs of La Parguera<br />
were documented by Glynn et al.<br />
(1964). In addition to the massive<br />
mortality of reef benthic invertebrates<br />
and algae, destruction of the elkhorn<br />
Figure 5.3. The path and intensity of hurricanes passing near Puerto Rico between<br />
1979 and 2004. Year of storm, Hurricane name and storm strength on the Saffir-<br />
Simpson scale (H1-5) are indicated for each. Map: A. Shapiro. Source: NOAA Coastal<br />
Services Center.<br />
coral biotope to the extent of 50% mortality was noted on inner reefs by Glynn et al. (1964). Based on aerial<br />
photoanalysis, Armstrong (1981) described the large-scale detachment and deposition of coral fragments,<br />
mostly elkhorn coral (A. palmata), finger coral (Porites porites), and fire coral (Millepora spp.) on the forereef<br />
of Cayo Enrique, La Parguera, after Hurricane David passed 340 km south of Puerto Rico during August 1979.<br />
The fringing red mangrove (Rhizophora mangle) also suffered significant damage from Hurricane David due to<br />
uprooting and scalding of the leaves (Armstrong, 1981). Extensive mass mortalities of benthic algae down to<br />
a depth of 17 m were reported by Ballantine (1984) after the pass of Hurricanes David and Allen one year later<br />
(in August 1980). Matta (1981) also noted a drastic decline in abundance and species richness of macroalgae<br />
in Cayo Turrumote, one of La Parguera’s outer reefs.<br />
Massive destruction of elkhorn coral biotopes off the northwest coast of Vieques Island reefs was reported<br />
by García-Sais et al. (2001d). These reefs appear to have been impacted by a high magnitude mechanical<br />
force, probably Hurricane Hugo in 1989. Large broken arms and other smaller coral fragments have been<br />
overgrown by benthic algae and other encrusting biota. This catastrophic phenomenon was highly significant<br />
for the north coast reef communities of Vieques in particular because of the relatively extensive area of the reef<br />
crest in relation to deeper reef physiographic zones. Re-colonization and growth of A. palmata colonies, as<br />
inferred from observations at La Parguera and Vieques reefs appears to be occurring at a very slow pace.<br />
At a broader scale, hurricanes can change the biogeochemistry and productivity of coastal regions due to<br />
their influence upon river discharge and loading of sediments, nutrients, organic matter and other materials<br />
that affect phytoplankton primary productivity. Using a time series of remotely sensed imagery to analyze<br />
changes in ocean color, Gilbes et al. (2001) showed that after the pass of Hurricane Georges (September<br />
21-22, 1998), phytoplankton biomass increased by at least two orders of magnitude, extending from coastal<br />
to adjacent oceanic regions more than 37 km offshore. Based on U.S. Geological Survey (USGS) stream<br />
flow measurements at 55 stations in 15 drainage basins, Gilbes et al. (2001) estimated that more than 1,000<br />
metric tons of nitrate were discharged to the coastal waters of Puerto Rico during September 20-25, 1998 and<br />
concluded that this massive pulse of nutrients significantly increased phytoplankton productivity, generating a<br />
signal that was prominent in the SeaWiFS imagery.
The State of Coral Reef Ecosystems of Puerto Rico<br />
Coastal Development and Runoff<br />
Puerto Rico has a population of approximately 3.8 million people. The capitol city of San Juan is the main<br />
population center with 434,000 people, or 11.4% of the total population (2001 Census; http://www.censo.<br />
gobierno.pr/Centro_Datos_Censales.htm, accessed 1/20/05). Bayamón (224,000), Ponce (186,000), Carolina<br />
(186,000), Arecibo (100,000), Guaynabo (100,000), and Mayaguez (98,000) are the other main population<br />
centers. With the exception of Guaynabo, the remaining six cities (which combine for 1.23 million people<br />
or 32% of the total population) are located on the coast (Figure 5.1). San Juan, Bayamón, Carolina, and<br />
Arecibo are located on the north coast, where no significant development of coral reefs occurs. These are<br />
coastal areas with a narrow insular shelf that experience heavy wave action during the winter and are under<br />
the influence of major river runoff. Most coral reef systems in Puerto Rico are located in areas upstream of<br />
major rivers and away from population centers and terrestrial inputs, such as those in Cordillera de Fajardo,<br />
Vieques, Culebra, and the oceanic islands of Desecheo and Mona. Extensive coral reefs also exist along the<br />
protected southwest coast, from Guayanilla to La Parguera and Cabo Rojo.<br />
Important coral reef systems are found along the Mayaguez and Ponce sections of the insular shelf. Coral reefs<br />
on these coastal sections developed under the influence of moderate (Ponce) to high (Mayaguez) seasonal<br />
runoff from river discharge and have experienced significant degradation, particularly in systems located close<br />
to the shoreline. These two cities share a history of coastal development that has been detrimental to coral<br />
reefs. Both are cities where dredging activities have been required to allow large ship traffic within the bays.<br />
Primary sewage was discharged inshore close to reef systems via submarine outfalls for several decades.<br />
Organic discharges from tuna factories were dumped through submarine outfalls in both bays for more than 20<br />
years. Benthic habitats have been subjected to sedimentation caused by resuspension during ship docking<br />
activities and navigation within the bays. The result has been the loss of coral reefs within the inner shelf<br />
and a major shift of benthic community structure on mid-shelf sections, where soft corals have colonized hard<br />
ground benthic habitats (García-Sais and Castro, 1995). However, outer shelf reef systems at both bays, such<br />
as Tourmaline Reef in Mayaguez Bay and Derrumbadero Reef in Ponce Bay, rank among the best developed<br />
coral reefs in Puerto Rico, with live coral cover exceeding 40% at both sites.<br />
Significant water quality restoration initiatives have been implemented during the last decade to prevent further<br />
deterioration of the marine habitats at both bays. In Mayaguez Bay, secondary treatment was mandated by<br />
the U.S. Environmental Protection Agency (EPA) for both domestic sewage and tuna factory discharges into<br />
the bay. At Ponce, the primary treated submarine sewage outfall was relocated to discharge at a depth of<br />
150 m down the insular slope below the pycnocline. The tuna factory finished operations and moved out of<br />
Ponce Bay, but the proposed expansion of the Ponce port into the Megaport of the Americas poses relevant<br />
challenges to avoid further deterioration of coral reefs in the bay. Sediment re-suspension by large cargo<br />
ships and dredging represents the major threats to coral health. Concerns have also been raised in relation to<br />
potential impacts of the Ponce megaport operations on downstream coral reef systems at Guayanilla, Guánica<br />
and La Parguera. Guayanilla Bay is an important port that supported large scale industrial (petrochemical)<br />
operations between the 1960s and 1980s, and still harbors two large thermoelectric power plants (i.e., Costa<br />
Sur and EcoEléctrica) and several smaller coastal industries. As with Ponce and Mayaguez Bays, the inner<br />
coral reefs have been severely impacted, but those at the outer shelf appear to be in better condition. The<br />
coral reefs off Guánica Bay are mostly associated with the bay’s entrance and the shelf-edge. Inside the<br />
enclosed bay, conditions are estuarine and unfavorable for coral reef development.<br />
Coastal Pollution<br />
Most industrial discharges are connected to Regional Waste Water Treatment Plants (RWWTP), which<br />
are administered by the Puerto Rico Aqueducts and Sewers Authority (PRASA). Five RWWTPs discharge<br />
disinfected (chlorinated) primary-treated effluent via submarine outfalls to the marine environment in<br />
compliance with the Federal Clean Water Act, Section 301(h). These include the five RWWTPs of Carolina,<br />
Bayamón-Puerto Nuevo, Arecibo, Aguadilla and Ponce. The location of these outfalls is shown in Figure 5.9<br />
and discussion of the results of monitoring activities at outfall sites can be found in the ‘Water Quality’ section<br />
of this chapter.<br />
Puerto Rico<br />
Sidebar<br />
page<br />
97
Puerto Rico<br />
page<br />
98<br />
The State of Coral Reef Ecosystems of Puerto Rico<br />
Another potentially relevant source of pollution to the coastal waters of Puerto Rico results from the operation<br />
of thermoelectric power plants as large volumes of seawater are used to cool the machinery. The plants of<br />
San Juan (in San Juan Bay), Palo Seco (in San Juan), Aguirre (in Jobos Bay, Guayama), and Costa Sur<br />
(in Guayanilla Bay) are administered by the Puerto Rico Power Authority, whereas the EcoEléctrica Power<br />
Plant is privately owned. The power plants of Aguirre and EcoEléctrica have seawater cooling towers and<br />
do not discharge heated effluents to coastal waters. All power plants have to comply with EPA-mandated<br />
demonstration studies in compliance with Federal Clean Water Act, Section 316(a) to evaluate the effect of<br />
thermal discharge upon marine communities, including zooplankton entrainment and impingement of small<br />
fishes and invertebrates. An initial evaluation of thermal and entrainment impact by the Costa Sur power<br />
plant in Jobos Bay was prepared by the Puerto Rico Nuclear Center (PRNC, 1972). Significant impacts of the<br />
thermal effluent upon mangrove root and seagrass communities were observed within the mangrove fringed<br />
coastal lagoon in the immediate vicinity of the thermal discharge, also known as the “thermal cove” (PRNC,<br />
1972). Entrainment of zooplankton affected mostly estuarine populations of copepods and larval stages of<br />
benthic invertebrates and fishes. Taxonomic assessments of fishes and invertebrates entrained by the power<br />
plant were not provided in the study by the PRNC (1972). Coral reef systems located in the outer bay section<br />
were not directly affected by thermal pollution associated with thermoelectric power plant operations in Jobos<br />
Bay. Potential indirect effects of larval mortality and/or recruitment failure of reef organisms with mangrove-<br />
related developmental stages were not quantitatively evaluated.<br />
As part of the environmental baseline studies for establishment of the EcoEléctrica power plant in Guayanilla<br />
Bay, García-Sais et al. (1995) studied the taxonomic composition and temporal abundance patterns of<br />
zooplankton, including ichthyoplankton in the vicinity of the proposed plant’s intake and outfall structure<br />
locations in the bay. Clupeiform (including anchovies and sardines) and Gobioidei (mostly Gobiidae) larvae<br />
and other estuarine types were the numerically dominant assemblage of larval fishes and zooplankton present<br />
within the inner- and mid-sections of Guayanilla Bay. Coral reef fish larvae, including snapper (Lutjanidae)<br />
and grunts (Haemulidae), were collected from the deeper sections of the mid- and outer-bay shelf-edge,<br />
where a submarine canyon connects the inner-bay (estuarine) environment with the outer bay’s fringing reefs<br />
and adjacent offshore waters. The information on larval reef fish distributions was pursued with the objective<br />
of locating intake structures in areas that would minimize entrainment of reef fish larvae. An EPA-mandated<br />
monitoring program of reef benthic populations and zooplankton entrainment is ongoing in Guayanilla Bay.<br />
Tourism and Recreation<br />
The effect of tourism activities upon coral reef systems in Puerto Rico is not well known. According to the<br />
Puerto Rico Tourism Company (PRT,<br />
2002), a total of 2.5 million rooms in<br />
hotels and “paradores” were occupied<br />
throughout the island during 2001-<br />
2002. The total room occupancy<br />
maintained a gradually increasing<br />
rate from 1992 to 2000 (1.08-2.63<br />
million), and then declined slightly<br />
(2.51 million) during 2001 (Figure 5.4).<br />
Approximately 58% of the total room<br />
occupancy has been concentrated<br />
within the San Juan metropolitan<br />
area, where coral reefs do not occur.<br />
However, tourists staying in San Juan<br />
often travel to the northeast, south<br />
and southwest coasts to participate<br />
in scuba diving charters and other<br />
marine recreation activities. There is<br />
a generalized perception that passive<br />
recreational diving has minimal impact<br />
Figure 5.4. Annual occupancy rates for hotels and paradores in Puerto Rico from<br />
1992-2001. Source: Puerto Rico Tourism Company, 2002.
The State of Coral Reef Ecosystems of Puerto Rico<br />
upon coral reef systems. The diving charter industry is at the forefront in terms of coral reef protection policies<br />
and is active and highly visible in many activities organized for coral reef protection. In most instances, diving<br />
charters do not allow spearfishing during diving expeditions and emphasize coral reef protection. The effect<br />
of anchoring by relatively large diving vessels was a problem that has been significantly improved by the<br />
installation of mooring buoys by the DNER in the most heavily visited dive sites.<br />
One of the main concerns regarding the ecological health of coral reefs in Puerto Rico is the unknown recreational<br />
carrying capacity of these systems. There has been an increasing trend of utilization of coastal resources by<br />
local and non-local tourists without consideration of the maximum level of resource utilization that the system<br />
can withstand. Between 1996-2003, the total number of boats registered in Puerto Rico increased almost 28%,<br />
from 44,050 units in 1996 to 60,911 units in 2003 (Figure 5.5). Coral reef areas are favorite destinations for<br />
recreational boat users because of the protected waters they create on the leeward side of reefs. For example,<br />
on holidays, over 200 boats can be anchored on a small reef in La Parguera. Concerns over reef health<br />
include many activities that are usually undocumented, such as the extra fishing pressure, damage of corals<br />
and seagrass during anchoring and propeller groundings, trampling on corals and seagrass during snorkeling<br />
activities, and the contamination of<br />
the water by garbage, engine fuel,<br />
and other substances.<br />
There is a critical need to establish a<br />
maximum capacity of boats allowed<br />
per reef and orientation guidelines<br />
for best utilization of reef resources,<br />
including illustrative presentations<br />
of the underwater life and prepared<br />
underwater trails for recreational<br />
snorkeling that minimize damage and<br />
optimize resource utilization (García-<br />
Sais and Sabater, 2004).<br />
Fishing<br />
Reef fish are under intense pressure<br />
in Puerto Rico from a variety of<br />
user groups, including commercial<br />
fishers, recreational anglers, as well<br />
as ornamental organism collectors<br />
and exporters. Reef fisheries have<br />
plummeted during the last two<br />
decades and show the classic signs<br />
of overfishing: reduced total landings,<br />
declining catch per unit effort (CPUE),<br />
shifts to smaller fish, and recruitment<br />
failures. Commercial fish landings<br />
reported between 1979 and 1990 fell<br />
by 69% (Appeldoorn et al., 1992).<br />
The latest commercial fishery census<br />
(Matos-Caraballo, 2002) reported<br />
1,163 commercial fishers in Puerto<br />
Rico for 2002, a reduction of 38%<br />
since 1982 (Figure 5.6). The 2002<br />
commercial fisheries data includes<br />
956 fishing vessels, 10,372 fish traps,<br />
Figure 5.5. Number of boats registered in Puerto Rico between 1996 and 2003.<br />
Source: Matos-Caraballo et al., 2002.<br />
Figure 5.6. Number of active fishers in Puerto Rico since 1974. Source: Matos-<br />
Caraballo, 2004.<br />
Puerto Rico<br />
Sidebar<br />
page<br />
99
Puerto Rico<br />
page<br />
100<br />
The State of Coral Reef Ecosystems of Puerto Rico<br />
2,774 lobster pots, 147 beach seines,<br />
993 gill nets, 391 trammel nets,<br />
1,267 cast nets and 12,310 fishing<br />
lines of different types. Among the<br />
different fishing techniques, 385<br />
fishers practice skin diving and 225<br />
practice scuba diving. An average<br />
of 3.07 million pounds of fish and<br />
shellfish per year were captured from<br />
2001-2003 by the commercial fishery<br />
(Matos-Caraballo, 2004). Yellowtail,<br />
silk, lane, and mutton snapper were<br />
the four main species, collectively<br />
representing 32.2% of the total fish<br />
catch between 2001 and 2003 (Table<br />
5.1). Landings of conch and lobster<br />
averaged approximately 574,000<br />
pounds between 2001-2003, or<br />
18.7% of the total commercial<br />
fisheries landings.<br />
Reef associated fisheries represented<br />
82% of the total commercial landings<br />
between 2001 and 2003, whereas<br />
deep water snappers (silk, queen,<br />
wenchman) and groupers (misty)<br />
represented 11.3% of the total catch.<br />
Large pelagic species, including<br />
dolphinfish, tunas, and wahoo, were<br />
6.6% of the total landings. Between<br />
2001 and 2003 notable catch<br />
reductions were observed for most<br />
reef fishes, particularly for mutton and<br />
yellowfin snappers which declined<br />
72.6% and 46.3%, respectively<br />
(Table 5.1). The catch of silk snapper<br />
also declined markedly, from 291,722<br />
pounds in 2001 to 169,826 pounds in<br />
2003.<br />
Until 2000, the only fishery statistics<br />
available in Puerto Rico relied on<br />
data collected by the commercial<br />
fishing industry. In January of 2000,<br />
NOAA Fisheries’ <strong>Marine</strong> Recreational<br />
Fisheries Statistics Survey (MRFSS)<br />
reinitiated data collection in Puerto<br />
Rico, and has greatly increased the<br />
understanding of recreational fishing<br />
pressure on reef fish populations<br />
(Lilyestrom and Hoffmaster, 2002).<br />
On average, the angler population is<br />
comprised of approximately 200,000<br />
residents and 40,000 non-residents.<br />
Table 5.1. Total reported commercial fisheries landings (in lbs.) by species in Puerto<br />
Rico during 2001-2003. Source: Matos-Caraballo, 2004.<br />
COMMON NAME CATEGORY 2001 2002 2003 MEAN<br />
Yellowtail snapper Reef 328,998 291,024 176,569 265,530<br />
Silk snapper Slope 291,722 198,028 169,826 219,859<br />
Lane snapper Reef 186,225 184,630 123,150 164,668<br />
Mutton snapper Reef 291,722 91,842 79,980 154,515<br />
Grunts Reef 156,641 147,100 107,566 137,102<br />
Queen snapper Slope 107,671 110,058 126,999 114,909<br />
Cero mackerel Reef 84,711 117,869 80,897 94,492<br />
Dolphinfish Oceanic 111,075 100,622 64,848 92,182<br />
Parrotfishes Reef 99,255 107,543 69,590 92,129<br />
Trunkfishes Reef 77,814 79,110 58,596 71,840<br />
Red hind Reef 69,098 81,206 48,045 66,116<br />
Hogfish Reef 68,843 68,578 55,957 64,459<br />
Ballyhoo Reef 60,905 68,045 41,094 56,681<br />
Mullets Reef 61,129 57,023 42,846 53,666<br />
Triggerfishes Reef 60,929 56,694 35,998 51,207<br />
Bar jack Reef 50,845 63,137 37,085 50,356<br />
King mackerel Reef 101,572 28,053 16,946 48,857<br />
Unid. groupers Reef 54,180 46,837 31,709 44,242<br />
Barracudas Reef 19,888 53,546 41,997 38,477<br />
Sharks Reef 45,169 38,437 25,210 36,272<br />
Skipjack tuna Oceanic 38,391 38,443 30,655 35,830<br />
Rays Reef 3,637 53,326 35,624 30,862<br />
Unid. jacks Reef 38,168 30,117 23,074 30,453<br />
Blackfin tuna Oceanic 25,286 27,107 34,196 28,863<br />
Vermilion snapper Reef 44,891 23,135 15,835 27,954<br />
Unid. snappers Reef 60,114 9,495 9,943 26,517<br />
Yellowfin tuna Oceanic 35,392 19,303 23,467 26,054<br />
Porgies Reef 37,031 24,558 11,276 24,288<br />
Snooks Reef 11,830 37,836 20,900 23,522<br />
Mojarras Reef 19,445 20,995 17,411 19,284<br />
Sardines Reef 25,398 28,053 16,946 19,062<br />
Goatfishes Reef 22,475 19,004 12,785 18,088<br />
Unid. tunas Oceanic 26,147 11,055 14,818 17,340<br />
Nassau grouper Reef 18,706 18,708 10,217 15,877<br />
Little tunny Reef 20,323 14,486 11,704 15,504<br />
Coney Reef 16,091 19,038 11,002 15,377<br />
Squirrelfishes Reef 18,313 16,086 10,701 15,033<br />
Wenchman Slope 7,731 6,197 7,233 7,054<br />
Misty grouper Slope 6,222 5,679 5,861 5,921<br />
Horse-eye jack Reef 6,607 4,823 4,188 5,206<br />
Yellowfin grouper Reef 3,708 6,916 4,893 5,172<br />
Wahoo Oceanic 8,344 1,095 2,012 3,817<br />
Tarpon Reef 2,193 4,421 2,436 3,016<br />
Yellow jack Reef 3,934 3,215 827 2,659<br />
TOTAL FISHES 2,887,686 2,689,338 1,921,936 2,499,653<br />
Lobster Reef 285,018 300,753 242,583 276,118<br />
Conch Reef 328,467 235,608 188,020 250,698<br />
Octopus Reef 33,939 28,561 26,476 29,659<br />
Other shellfish Reef 14,241 12,092 8,127 11,487<br />
Land crabs Reef 6,322 6,460 1,619 4,800<br />
TOTAL SHELLFISH 671,338 583,474 466,825 573,879<br />
TOTAL LANDINGS 3,559,024 3,272,812 2,388,761 3,073,532
According to Sadovy (1992) export of<br />
marine organisms from Puerto Rico<br />
for the aquarium trade began in the<br />
early 1970s with approximately 50<br />
species. From the available data,<br />
reef fishes and motile megabenthic<br />
invertebrates comprise the bulk of the<br />
aquarium trade. The most commonly<br />
captured and exported fish species is<br />
the royal gramma (Gramma loreto),<br />
followed by yellowhead jawfish,<br />
blue chromis, redlip blenny and rock<br />
beauty, although over 100 species<br />
have historically been exported (<strong>Mote</strong><br />
Environmental Services, Inc., 2002).<br />
Table 5.2 presents a list of the main<br />
fish and invertebrate species in the<br />
aquarium trade in Puerto Rico. There<br />
are approximately 12 ornamental<br />
organism collectors in Puerto Rico,<br />
and three main exporters who<br />
exported over 37,000 royal gramma<br />
and over 8,400 yellowhead jawfish<br />
between 1998 and 2000.<br />
Approximately 113 marine<br />
invertebrates have also been<br />
historically exported, with the top five<br />
species in terms of numbers exported<br />
being Condylactis spp. anemones,<br />
blue legged hermit crabs, feather<br />
dusters, serpent stars and turbo<br />
snails. A total of 7,500 blue legged<br />
hermit crabs and 3,600 Condylactis<br />
The State of Coral Reef Ecosystems of Puerto Rico<br />
Total annual fishing trips varied from a high of 1,411,943 in 2001 to a low of 1,098,420 in 2002. Total angler<br />
participation dropped from 249,869 to 216,861 in 2003. Trends in the recreational fishery indicate a decline<br />
in the use of traps and nets due to their high costs and relatively low yield, and an increase in the use of<br />
lines and scuba gear. The largest percentage (58-64%) of recreational fishing trips were made by shoreline<br />
anglers. Private boat trips accounted for 35-40% of trips and the remainder (1-3%) was charter fishing trips.<br />
Reef fish comprised 16-29% of the total catch. Most of the reef fish were caught by private boat anglers.<br />
Total recreational catch from 2000 to 2002 varied between 4,601,748 lbs. and 2,413,878 lbs (Lilyestrom and<br />
Hoffmaster, 2002). Overall CPUE declined an average of 40% per year over this same period. As for the<br />
commercial fisheries landings, consistent declines were noted in the catch of lane snapper, mutton snapper<br />
and silk snapper.<br />
In an effort to convert the collapsing fishery into one which will be sustainable over time, the DNER has enacted<br />
new fishing regulations which will require recreational fishing licenses, prohibit recreational spearfishing with<br />
scuba gear, eliminate beach seines within three years, establish size limits and daily quotas on several species,<br />
require species-specific permits for high-value and sensitive species (i.e., spiny lobsters, queen conch, and<br />
land crabs), and create MPAs around Mona, Monito, and Desecheo Islands and the Condado Lagoon, among<br />
other measures. Compatibility with Federal fisheries management measures has been achieved to a high<br />
degree with these regulations.<br />
Trade in Coral and Live Reef Species<br />
Table 5.2. Reef fish and invertebrate species exported in largest quantities from<br />
Puerto Rico for the aquarium trade during 1998-2000. Source: LeGore and Associates,<br />
2002.<br />
FISHES<br />
Common Name Species<br />
Royal gramma Gramma loreto<br />
Yellowhead jawfish Opistognathus aurifrons<br />
Blue chromis Chromis cyanea<br />
Redlip blenny Ophioblennius atlanticus<br />
Rock beauty Holacanthus tricolor<br />
Greenbanded goby Gobiosoma multifasciatum<br />
Blue tang Acanthurus coeruleus<br />
Horned blenny Hysoblennius exstochilus<br />
Bluehead wrasse Thalassoma bifasciatum<br />
Pygmy angelfish Centropyge argi<br />
Spanish hogfish Bodianus rufus<br />
Flame cardinal Apogon maculatus<br />
Redtail trigger Xantichthys ringens<br />
French angelfish Pomacanthus paru<br />
Neon wrasse Halichoeres garnoti<br />
INVERTEBRATES<br />
Blue leg hermit crab<br />
Pink tip anemone<br />
Turbo snail<br />
Serpent starfish<br />
Feather duster worm<br />
Rock anemone<br />
Curly cue anemone<br />
Flame scallop<br />
Sea cucumber<br />
Puerto Rico<br />
Sidebar<br />
page<br />
101
Puerto Rico<br />
page<br />
102<br />
The State of Coral Reef Ecosystems of Puerto Rico<br />
spp. were exported in the first five months of 2002. In addition to the quantified exports, there are unquantified<br />
sales to local aquarium shops and private collections for home aquariums. Efforts are underway to estimate<br />
the number of private marine ornamental organism collectors in Puerto Rico through the MRFSS telephone<br />
survey. A proposal has been submitted to provide a stock assessment and design management strategies for<br />
aquarium trade target species in Puerto Rico (Le Gore and Associates, 2002).<br />
Ships, Boats, and Groundings<br />
Since 2001 there have been seven reported ship groundings off Puerto Rico and the associated islands<br />
involving substantial coral reef injuries as well as a number of additional unreported incidents. Relatively<br />
few of these involved significant restoration efforts, although local scientists and volunteers have performed<br />
coral rescue operations to stabilize broken coral. The largest effort was undertaken in Vieques after a ferry<br />
grounding in November 2002, which involved reattachment of over 100 coral fragments using cement.<br />
One of the largest restoration efforts undertaken in Puerto Rico to date is in response to the M/V Fortuna<br />
Reefer ship grounding. On July 24, 1997, the Fortuna Reefer ran aground on a fringing reef located off the<br />
southeast coast of Mona Island (18°02’N; 67°51’W), 65 km from Puerto Rico. The 326-foot freighter remained<br />
grounded for eight days within the island’s largest remaining elkhorn coral (Acropora palmata) stand.<br />
The grounding and subsequent removal of the Fortuna Reefer impacted 6.8 acres of shallow forereef. The reef<br />
substrate was crushed and fractured, and entire colonies of A. palmata and D. strigosa were dislodged and<br />
fractured along the direct path of the vessel, and hundreds of additional A. palmata branches were sheared<br />
off by the cables used to remove the vessel. Coral fragments (n=1,857) were reattached to the reef substrate<br />
or standing dead colonies using wire within three months of the grounding, and fragment survivorship and<br />
patterns of recovery have been monitored twice per year since 1999. More than half (57%) of the fragments<br />
were alive two years after the restoration effort, while the remainder died (26%) or were detached and removed<br />
from the site (17%; Bruckner and Bruckner, 2001).<br />
Six years after the restoration, 20.3% (377) of the restored fragments were living (Figure 5.7). Many of these<br />
(58%) had produced new branches and 30% (114) had reattached to the substrate. Fragments had an<br />
average of 60% live tissue, although 33% had little or no mortality and 22% showed signs of re-sheeting over<br />
previously denuded skeleton. Each fragment had developed an average of four new 21 cm branches (maximum<br />
of 30 branches, up to 73 cm long per fragment), and branching patterns had the typical tree-like morphology<br />
seen on adult colonies. The most significant sources of mortality include overgrowth by boring Cliona spp.<br />
sponges, predation by Coralliophila<br />
abbreviata gastropods, and WBD,<br />
with partial mortality associated with<br />
algal interactions (primarily Dictyota<br />
and Halimeda spp.) and damselfish<br />
(Stegastes planifrons) algal lawns<br />
(Figure 5.8). In 2003, an outbreak<br />
of WBD affected 15% of the standing<br />
colonies within the grounding site<br />
and surrounding area, with a lower<br />
prevalence (4%) among restored<br />
colonies.<br />
Reef fish communities appear to be<br />
recovering within the Fortuna Reefer<br />
grounding site, with an increase in<br />
abundance, species richness and<br />
diversity over the last four years.<br />
Mean fish abundance per transect<br />
(total area 60 m 2 ) has increased from<br />
13.9 (± 5.17 standard error [SE]) to<br />
Figure 5.7. Status of restored fragments at the Fortuna Reefer site. Source: Bruckner<br />
and Bruckner, in press.
32.3 (± 4.8 SE) and the number of<br />
species has increased from 2.5 (±<br />
0.54 SE) to 7.3 (± 0.332 SE). While<br />
the number of species per transect<br />
is similar inside and outside the<br />
grounding site, abundance outside<br />
of the site is nearly three times as<br />
high (mean=90.6). This difference<br />
in abundance may be due in part<br />
to the presence of large schools of<br />
acanthurids observed outside the<br />
grounding area.<br />
The State of Coral Reef Ecosystems of Puerto Rico<br />
Figure 5.8. Sources of fragment mortality at the Fortuna Reefer site. Source: Bruckner<br />
and Bruckner, in press.<br />
<strong>Marine</strong> Debris<br />
<strong>Marine</strong> debris is has not been reported to be a significant problem affecting Puertorrican reefs.<br />
Aquatic Invasive Species<br />
A number of freshwater non-native/invasive/alien species have been introduced into Puerto Rico (Bunkley-<br />
Williams and Williams, 1994; Bunkley-Williams et al., 1994; Williams and Sindermann, 1992; Williams et al.,<br />
2001b). The Mozambique tilapia, Oreochromis mossambicus (Cichlidae), dominates in local brackish waters,<br />
but has not invaded coral reef areas. This species is known to utilize coral reefs in the Pacific and the reasons<br />
for its current limited distribution in the Caribbean are not known (Williams and Bunkley-Williams, unpublished<br />
data). The introduced jellyfish, purple sea mane (Drymonema dalmatinum) experienced a major population<br />
explosion in Puerto Rico in 1999 (Williams et al., 2001a) and a minor one in the Virgin Islands in 2003 (Williams<br />
and Bunkley-Williams, unpublished data). These outbreaks are not known to have caused much damage, but<br />
the potential for greater problems exists.<br />
Williams and Bunkley-Williams (1990b; 2000) suggested that the 1983-1984 mass mortalities of the black<br />
long-spined sea urchin, Diadema antillarum Phillipi (Echinometridae), and later die-offs (Williams et al., 1991)<br />
were caused by a virus introduced from the Pacific region. These events changed the ecology of the reefs<br />
throughout the region, and neither the urchins nor the reefs have ever recovered. In addition, Juste and Cortés<br />
(1990) reported the presence of non-native clams including southern quahog (Mercenaria campechiensis),<br />
northern quahog (M. mercenaria and M. mercenaria notata) from five localities around Puerto Rico. The nonnative<br />
clams are not considered a major threat to coral reefs.<br />
Whitfield et al. (2002) reported red lionfish, Pterois volitans (Scorpaenidae) established along the Atlantic coast<br />
of the U.S. and in Bermuda. This species was recently observed in Puerto Rico (Williams et al., unpublished<br />
data), but it is not known if a reproductively viable population has been established. Widespread rumors of<br />
the escape and establishment of Indo-Pacific clownfishes (Pomacentridae) in Puertorrican waters (Williams<br />
et al., 1994a) are unconfirmed.<br />
Williams et al. (1994a) suggested that the euryhaline leech, Myzobdella lugubris (Rhynchobdellida: Piscicolidae)<br />
was introduced from the continental U.S. to eastern Puerto Rico along with mariculture animals. It also occurs<br />
in western Puerto Rico (Williams and Bunkley-Williams, unpublished data).<br />
Puerto Rico<br />
Sidebar<br />
page<br />
103
Puerto Rico<br />
page<br />
104<br />
The State of Coral Reef Ecosystems of Puerto Rico<br />
Security Training Activities<br />
The islands of Vieques, Culebra, and Desecheo have served as training ranges for the U.S. Navy since the<br />
1940s. There is no published information regarding the impact of such training activities in Culebra and<br />
Desecheo Islands. Rogers et al. (1978) reported severe destruction of coral reefs in Vieques Island caused<br />
by bombing activities during military training. For the last two decades, there have been no reliable monitoring<br />
records for Vieques’ easternmost coral reefs, although 8% to 50% declines in coral cover from coral reefs<br />
located within maneuver areas in Vieques have been reported (Antonius and Weiner, 1982). Decline in coral<br />
cover has been attributed to hurricanes, concluding that the impact of bombing in the coral reef was negligible<br />
(Antonius and Weiner, 1982). Unfortunately, deep reef sections that are typically unaffected by hurricanes<br />
have not been included in the assessment of bombing effects. Efforts to include the coral reef systems within<br />
the shooting range of eastern Vieques as part of the National Coral Reef Monitoring Program of NOAA have<br />
not been successful to date. However, a large biological baseline data set is now available for 11 reefs outside<br />
the shooting range in Vieques (García-Sais et al., 2001d).<br />
Offshore Oil and Gas Exploration<br />
There are currently no offshore oil and gas exploration activities occurring in Puerto Rico.
The State of Coral Reef Ecosystems of Puerto Rico<br />
<strong>CORAL</strong> <strong>REEF</strong> ECOSYSTEMS- DATA GATHERING ACTIVITIES AND RESOURCE CONDITION<br />
Puertorrican coral reefs were initially described in terms of their taxonomic composition by Almy and Carrión-<br />
Torres (1963). This initial survey identified a total of 35 species of scleractinian corals from La Parguera, on<br />
the southwest coast of Puerto Rico. Later surveys were reported by Rogers et al. (1978), Armstrong (1980),<br />
Goenaga and Boulon (1991), Hernandez-Delgado (1992, 1994a,b), and Hernandez-Delgado and Alicea-<br />
Rodriguez (1993a,b).<br />
Goenaga and Cintrón (1979) prepared the first geographical inventory of Puertorrican reefs. This work, along<br />
with subsequent qualitative surveys of reef geomorphology and community structure (Cintrón et al., 1975;<br />
Canals and Ferrer, 1980; Canals et al., 1983), established criteria for designation of marine areas with coral<br />
reef development as natural reserves by the government of Puerto Rico.<br />
During the last decade, coral reef research in Puerto Rico has largely focused on community characterization<br />
and monitoring programs, benthic habitat mapping, marine reserve feasibility studies, environmental impact<br />
assessments, coral diseases, and mitigation programs. As part of the U.S. Coral Reef Initiative Program for<br />
Puerto Rico (NOAA), a series of coral reefs located in natural reserves were recently selected as priority sites<br />
for characterization and monitoring programs. Other initiatives have included characterization efforts in support<br />
of the coral reef systems occurring within the Rio Espiritu Santo Natural Reserve (Hernández-Delgado,1995),<br />
Isla de Mona Natural Reserve (Canals et al.,1983; Hernández-Delgado, 1994a) and La Cordillera de Fajardo<br />
Natural Reserve (Hernández-Delgado, 1994b).<br />
The purpose and priorities of the Coral Reef Monitoring Program for Puerto Rico were initially presented by<br />
the DNER to NOAA’s U.S. Island Coral Reef Initiative in 1997. The main objectives of the program were<br />
to map the spatial distribution of coral reefs, produce a baseline characterization of priority reef sites and<br />
establish a monitoring program targeting selected high-priority reef sites. The monitoring program would<br />
provide information needed for effective resource management and public awareness, while contributing to a<br />
scientific database for long-term analysis of the coral reefs in natural reserves of Puerto Rico.<br />
The DNER has identified the natural reserves of Mayaguez Bay, Desecheo Island, Rincón, La Parguera,<br />
Bahía de Jobos, Ponce Bay, Cordillera de Fajardo and the islands of Culebra and Vieques as high-priority<br />
monitoring sites. Baseline characterizations for these reef systems were prepared by García-Sais et al. (2001<br />
a, b, c, d). The baseline characterization and monitoring for the Culebra <strong>Marine</strong> Reserve was prepared by<br />
Hernández-Delgado (2003). The baseline characterization of the newly-established MPA at Tres Palmas Reef<br />
in Rincón is ongoing. This report includes monitoring data from a total of 12 reef sites under the U. S. Coral<br />
Reef Monitoring Program funded by NOAA and two additional reef sites monitored since 1999 as part of EPA’s<br />
301(h) studies associated with operations of the submarine outfalls of the RWWTPs at Arecibo and Aguadilla,<br />
on the north and northeast coasts, respectively. La Parguera, on the southwest coast of the island, is the<br />
monitoring site within Puerto Rico for the Caribbean Coastal <strong>Marine</strong> Productivity Program (CARICOMP). The<br />
CARICOMP data base is available on-line at http://www.caricomp.com.<br />
Additional quantitative and qualitative characterizations of reef communities were included as part of<br />
environmental impact studies related to the submarine outfall discharges of RWWTPs of PRASA from 11 sites<br />
around Puerto Rico (Figure 5.9; García-Sais et al., 1985). Other characterizations of coral reef communities<br />
were performed in relation to operations of thermoelectric power plants with thermal outfalls in Jobos Bay<br />
(Szmant-Froelich,1973), San Juan Bay (García-Sais and Castro,1995), and Guayanilla Bay (Castro and<br />
García-Sais,1996; García-Sais and Castro,1998). Table 5.3 provides a list of reef sites for which quantitative<br />
baseline characterizations were performed, along with geographic references and depths. Mass mortalities<br />
of corals and related reef organisms have also received research attention in Puerto Rico. Vicente and<br />
Goenaga (1984) reported on the mass mortality of the black sea-urchin, Diadema antillarum, around the<br />
coastline of Puerto Rico and provided a general description of dying specimens from direct observations in<br />
the field. A series of reports of massive coral bleaching in the waters of Puerto Rico were produced in the late<br />
1980s (Bunkley-Williams and Williams, 1987; Williams and Bunkley-Williams, 1989; Goenaga et al., 1989;<br />
Williams and Bunkley-Williams, 1990a,b). These studies highlighted the permanent damage of the bleaching<br />
phenomena on reef corals and associated the periodic bleaching events to elevated SSTs.<br />
Puerto Rico<br />
Sidebar<br />
page<br />
105
Puerto Rico<br />
page<br />
106<br />
The State of Coral Reef Ecosystems of Puerto Rico<br />
Figure 5.9. Coral reef monitoring sites around Puerto Rico. Map: A. Shapiro. Source: Garcia-Sais, pers. obs.; CCMA-BT, unpublished<br />
data.<br />
Table 5.3. Geographic references, dates, and depths of reef habitats surveyed during baseline characterization and monitoring programs.<br />
Source: Garcia-Sais, pers. obs.<br />
DATES<br />
GEOGRAPHIC REFERENCES<br />
<strong>REEF</strong> - SITE<br />
Baseline Monitoring Latitude Longitude DEPTH (m)<br />
Bajíos - SJ 1994 none 18° 27.900’ N 066° 07.800’ W 6.7<br />
Guayanilla - GY 1995 none 17° 58.600’ N 066° 45.800’ W 3.6-5.5<br />
Caja de Muertos 1 - PON May-99 2001 17° 53.341’N 066° 29.810’ W 9.1<br />
Boca Vieja - SJ 93-94 none 18° 28.700’ N 066° 09.800’ W 6<br />
Río - TAY 1995 none 17° 58.800’ N 066° 44.700’ W 3<br />
Unitas - GY 1995 none 17° 57.900’ N 066° 46.100’ W 10.6<br />
Media Luna - MAY Jun-99 2001 18° 06.079’ N 067° 18.731’ W 10.6<br />
Caribe 1 - JOB Sep-96 none 17° 55.400’ N 66° 12.300’ W 4.0-6.0<br />
Manchas Grandes- MAY 1997 none 18° 12.500’ N 067° 12.100’ W 10<br />
Berberia - PON May-99 2001 17° 55.190’ N 066° 27.190’ W 7.6<br />
La Barca - JOB Sep-96 2001 17° 54.635’ N 066° 13.564’ W 10<br />
Manchas Ext. 2 - MAY 1997 none 18° 14.300’ N 067° 12.600’ W 10<br />
Caribe 2 - JOB Sep-96 2001 17° 55.094’ N 66° 12.595’ W 10<br />
Caja de Muertos 2 - PON May-99 2001 17° 53.701’ N 066° 31.703’ W 7.6<br />
Cayo Coral - GUA Jun-99 2001 17° 56.173’ N 066° 53.303’ W 7.6<br />
Pta. Maguey - CUL n/d none 18° 17.600’ N 065° 18.100’ W 5.0-6.0<br />
Manchas Int 2 - MAY 1997 none 18° 13.600’ N 067° 12.000’ W 10<br />
Pta. Ventana 2 - GY Jun-99 2001 17° 56.500’ N 066° 48.400’ W 12<br />
Las Coronas - MAY Jun-99 2001 18° 05.836’ N 067° 17.225’ W 10<br />
Pta. Ballena - GUA Jun-99 2001 17° 56.380’ N 066° 51.633’ W 10<br />
Fanduco - GY 1995 none 17° 57.900’ N 066° 45.600’ W 6.1<br />
Isla Palominitos - FAJ Jul-99 none 18° 20.142’ N 065° 33.944’ W 10.6 - 7.6<br />
Cayo Diablo - FAJ Jul-99 2001 18° 21.602’ N 065° 31.942’ W 10.6<br />
Media Luna - LP 1996 none 17° 56.200’ N 067° 03.200’ W 10<br />
Turrumote - LP 1996 none 17° 56.100’ N 067° 01.100’ W 10<br />
Tourmaline - MAY Jun-99 2001 18° 09.794’ N 067° 16.418’ W 10.6<br />
Pta. Maguey - CUL n/d none 18° 17.600’ N 065° 18.100’ W 5.0-6.0<br />
Manchas Int 2 - MAY 1997 none 18° 13.600’ N 067° 12.000’ W 10<br />
Isla Palomino - FAJ Jul-99 2001 18° 21.333’ N 065° 34.267’ W 10.6<br />
North Reef - DES Jun-00 2001 18 ° 23.416’ N 067° 29.229’ W 11<br />
Pto. Botes - DES Jun-00 2001 18° 22.895’ N 067° 29.316’ W 17<br />
Pto. Canoas - DES Jun-00 2001 18° 22.699’ N 067° 29.026’ W 18<br />
El Palo - CRO May-00 2001 18° 00.034’ N 067° 12.670’ W 3<br />
Resuellos - CRO May-00 2001 17° 59.470’ N 067° 13.987’ W 8.2
The State of Coral Reef Ecosystems of Puerto Rico<br />
Table 5.3, (continued). Geographic references, dates, and depths of reef habitats surveyed during baseline characterization and<br />
monitoring programs. Source: Garcia-Sais, pers. obs.<br />
DATES<br />
GEOGRAPHIC REFERENCES<br />
<strong>REEF</strong> - SITE<br />
Baseline Monitoring Latitude Longitude DEPTH (m)<br />
Pto. Canoas - DES Jun-00 2001 18° 22.699’ N 067° 29.026’ W 18<br />
El Palo - CRO May-00 2001 18° 00.034’ N 067° 12.670’ W 3<br />
Resuellos - CRO May-00 2001 17° 59.470’ N 067° 13.987’ W 8.2<br />
South of Margarita Reef - LP May-00 none 17° 52.068’ N 067° 06.017’ W 8.2<br />
La Boya (Shelf edge) - LP May-00 none 17° 53.304’ N 066° 59.877’ W 18.1<br />
South of Turrumote - LP Jul-00 none 17° 53.949’ N 067° 01.108’ W 13<br />
Arrecife Las Mujeres - MON Jun-00 none 18° 04.302’ N 067° 56.215’ W 18<br />
Pajaros - MON Jun-00 none 18° 03.168’ N 067° 51.995’ W 13.6<br />
Carmelitas - MON Jun-00 none 18° 05.923’ N 067° 56.300’ W 8.5<br />
Boya 2 - PON Aug-01 none 17° 55.815’ N 066°37.814’ W 16.1<br />
Bajo Derrumbadero - PON Aug-01 none 17° 54.237’ N 066° 36.516’ W 16.7<br />
Bajo Tasmania - PON Aug-01 none 17° 56.564’ N 066° 37.147’ W 9.1<br />
Maria Langa Veril 50’ - GY Aug-01 none 17° 57.563’ N 066° 45.255’ W 15.2<br />
Maria Langa 30’ - GY Aug-01 none 17° 57.630’ N 066° 45.256’ W 10<br />
Tallaboa 35’ - GY Aug-01 none 17° 56.759’ N 066° 43.480’ W 10.6<br />
Las Mareas 55’ - GMA Sep-01 none 17° 53.093’ N 066° 08.956’ W 16.7<br />
Las Mareas 70’ - GMA Sep-01 none 17° 53.057’ N 066° 08.947’ W 21.2<br />
Cayos de Barca 35’ - GMA Sep-01 none 17° 54.830’ N 066° 14.866’ W 10.6<br />
Arrecife Guayama 45’ - ARO Sep-01 none 17° 55.353’ N 066° 03.675’ W 13.6<br />
Punta Guilarte Shoal 33’ - ARO Sep-01 none 17° 57.219’ N 066° 00.112’ W 10<br />
West Caballo Blanco - VIE May-01 2004 18° 10.297’ N 065° 28.126’ W 4.5<br />
Arrecife Mosquito - VIE May-01 2004 18° 09.804’ N 065° 29.632’ W 10.6<br />
Arrecife Comandante - VIE May-01 none 18° 09.465’ N 065° 28.227’ W 5.5<br />
Boya 6 - VIE May-01 none 18° 10.711 N 065° 31.148’ W 10.6<br />
Arrecife Coronas - VIE May-01 2004 18° 09.896’ N 065° 29.454’ W 10.6<br />
North Caballo Blanco - VIE May-01 none 18° 10.563’ N 065° 28.029’ W 3<br />
Black Jack - VIE May-01 2004 18° 03.319’ N 065° 27.794’ W 30.3<br />
Canjilones Reef - VIE Feb-01 2004 18° 05.380’ N 065° 35.413’ W 15.2<br />
Puerto Ferro Reef - VIE Feb-01 none 18° 04.845’ N 065° 25.057’ W 12<br />
Pirata Reef - VIE Feb-01 2004 18° 05.512’ N 065° 35.011, W 15.2<br />
Boya Esperanza Reef - VIE Feb-01 2004 18° 04.832’ N 065° 29.277’ W 9.1<br />
Capitan Reef - VIE May-01 none 18° 04.766’ N 065° 28.572’ W 13<br />
Bajo Holiday - VIE May-01 none 18° 13.500’ N 065° 23.500’ W 18.2<br />
Arecibo - AA1 Oct-99 2000-2004 18° 29.478’ N 066° 40.878’ W 16.1<br />
Arecibo - AA2 Oct-99 2000-2004 18° 29.460’ N 066° 40.974’ W 21.2<br />
Aguadilla - AGS2 Oct-99 2000-2004 18° 24.780’ N 067° 10.878’ W 13.9<br />
Aguadilla - AGS3 Oct-99 2000-2004 18° 23.256’ N 067° 13.350’ W 10.9<br />
Bayamon - B15 1999 2000-2004 18° 28.728’ N 066° 10.632’ W 11.5<br />
Bayamon - B14 1999 2000-2004 18° 28.788’ N 066° 08.538’ W 11.5<br />
Carolina - CC3 1999 2000-2004 18° 26.892’ N 065° 50.934’ W 9.1<br />
Carolina - CC4 1999 2000-2004 18° 27.018’ N 065° 51.156’ W 9.7<br />
Carolina - CC5 1999 2000-2004 18° 27.078’ N 065° 51.534 ‘ W 9.7<br />
Carolina - CC6 1999 2000-2004 18° 27.426’ N 065° 53.514’ W 7.3<br />
Carolina - CC7 1999 2000-2004 18° 27.468’ N 065° 53.826’ W 10.3<br />
Carolina - CC8 1999 2000-2004 18° 27.432’ N 065° 54.294’ W 10.3<br />
Carolina - CC9 1999 2000-2004 18° 27.426’ N 065° 54.552’ W 10<br />
Carolina - CC10 1999 2000-2004 18° 27.402’ N 065° 55.002’ W 9.7<br />
Puerto Rico<br />
Sidebar<br />
page<br />
107
Puerto Rico<br />
page<br />
108<br />
The State of Coral Reef Ecosystems of Puerto Rico<br />
WATER QUALITY<br />
Water quality monitoring is conducted by several organizations in Puerto Rico and is under the official purview<br />
of the DNER. Most of its monitoring data were not available for inclusion in this report, but the data should be<br />
analyzed and incorporated in the next reporting effort.<br />
Data analyzed in this section primarily comes from monitoring of industrial discharges associated with RWWTPs<br />
administered by PRASA. Five RWWTPs discharge disinfected (chlorinated) primary-treated effluent via<br />
submarine outfalls to the marine environment under EPA 301(h) waiver compliance programs. These include<br />
the RWWTPs of Carolina, Bayamón-Puerto Nuevo, Arecibo, Aguadilla, and Ponce, as shown in Figure 5.9.<br />
Methods<br />
Water quality monitoring of the effluent and receiving waters has been in effect for all of the above mentioned<br />
RWWTPs since 1999. The receiving water monitoring program analyzes of 171 water and sediment<br />
chemistry parameters including nutrients, suspended sediments, trace metals, pesticides, and bacteriology<br />
(CSA/CH2MHILL, 1999). Sampling is performed quarterly or biannually within the discharge zone, at one<br />
reference station, and at upstream and downstream far-field stations. Water samples are taken at 10%,<br />
50% and 90% of the total station depth. Supporting data on ocean currents and biological assessments of<br />
infaunal and epibenthic invertebrates, fish, and coral reef communities are also included as part of the 301(h)<br />
monitoring programs for receiving waters of the RWWTPs (CSA/CH2MHILL, 1999). Secondary treatment<br />
plants discharge via submarine outfalls in the vicinity of Humacao, Barceloneta, Manatí, and Mayaguez Bay.<br />
All of the submarine outfalls discharging disinfected primary-treated effluent are located in the immediate<br />
vicinity of a large river.<br />
Results and Discussion<br />
In general, sediment and nutrient loading to the marine environment by RWWTPs submarine outfalls represents<br />
a small fraction of the river discharge. For example, the mean loading of total suspended solids (TSS) by the<br />
Aguadilla RWWTP submarine outfall from 2000 to 2002 was approximately 1.35% of the Culebrinas River<br />
loading for the same period (Table 5.4). Likewise, dissolved inorganic nitrogen (DIN) and total phosphorus<br />
(TP) loading by the RWWTP was 0.5% and 1.49% of the loading by the Culebrinas River, respectively. In<br />
terms of fecal coliform contamination of coastal waters, the RWWTP input was less than 1% (
BENTHIC HABITATS<br />
U.S. National Coral Reef Monitoring Program in Puerto Rico<br />
The State of Coral Reef Ecosystems of Puerto Rico<br />
Methods<br />
Quantitative assessments of sessile-benthic reef communities were performed on at least 79 reefs around<br />
Puerto Rico between 1985 and 2003 (Table 5.5). Scientists utilized various techniques to collect information<br />
on the percent cover by reef substrate (sessile-benthic) categories, including: continuous measurements along<br />
10 m linear transects using chain links (CARICOMP, 1996), video-transects (CSA/CH2MHill, 1999), and 1 m 2<br />
standard quadrat techniques (CSA/CH2MHill, 1999). Data on reef community structure and coral taxonomic<br />
composition were separated into three relative depth strata: shallow (1-5 m), intermediate (6-14 m) and deep<br />
(15-25 m), representing different reef types and physiographic zones within each reef. Mean percent substrate<br />
cover was calculated from replicate line transects or quadrat surveys (n=4 or 5) for each reef.<br />
Results and Discussion<br />
Percent cover by sessile-benthic substrate categories at shallow reefs (1-5 m) is presented in Figure 5.10.<br />
Benthic algae was the dominant substrate type in terms of percent cover in seven of the nine shallow reefs<br />
surveyed, ranging in substrate cover between a minimum of 31.8% at Algodones Reef in Naguabo, and a<br />
maximum of 82.1% at Punta Bandera Reef in Luquillo (García-Sais et al., 2003). The mean cover of algae on<br />
shallow reefs was 65%. Live coral at shallow reefs varied between a maximum of 48.9% at Algodones Reef<br />
and a minimum of 3.7% at Punta Bandera Reef (Figure 5.10). Mean live coral cover was 15.5%. The two<br />
shallow reefs with live coral cover of 20% or higher were both from the southeast coast (Algodones and Punta<br />
Fraile), whereas reefs with live coral cover below 10% were all from the northeast coast, including Vieques<br />
Island. The taxonomic composition of stony corals at shallow reefs was characterized by a mixed assemblage<br />
of species (Figure 5.11). Between four and 10 species of corals were intercepted on linear transects at each<br />
reef. The Porites astreoides, P. porites, Siderastrea radians, and S. siderea assemblage represented more<br />
than 50% of the total coral cover at shallow reefs surveyed. Porites astreoides and Siderastrea radians were<br />
present at all reefs surveyed in the 1-5 m depth range. Other common taxa included Diploria spp. and the<br />
hydrocorals, Millepora spp. The encrusting octocoral, Erythropodium caribaeorum, was present in five of<br />
eight reefs surveyed, with maximum cover (44%) at Gallito Beach Reef in Vieques. Zoanthids, particularly the<br />
encrusting, colonial form Palythoa spp., and sponges were the other main biotic components of the shallow<br />
reef benthos. Abiotic cover (sand, holes, overhangs, etc.) averaged 8% at shallow reefs (García-Sais et al.,<br />
2003).<br />
In the intermediate depth range (6-14 m), live coral cover varied from 0.6% to 51.9% at surveyed reefs<br />
(n=52). Mainland reefs from the north and northeast coastlines (Mameyal, Bajíos, Morrillos, Boca Vieja and<br />
Cerro Gordo) contained very low coral cover (
Puerto Rico<br />
page<br />
110<br />
The State of Coral Reef Ecosystems of Puerto Rico<br />
Figure 5.10. Mean linear cover by sessile-benthic substrate categories for various reef depths. Total cover may not equal 100% due<br />
to rounding within categories. Source: Garcia-Sais et al., 2003; Garcia-Sais et al., 2001d.
The State of Coral Reef Ecosystems of Puerto Rico<br />
Benthic algae was the dominant substrate on 47 of the 52 reefs studied at intermediate depths, ranging<br />
in cover from 28.2% in Turrumote to 98% at Mameyal Reef (Figure 5.10). A mixed assemblage of short<br />
filamentous algae forming an “algal turf” was the most common type of algal cover, although substantial fleshy<br />
algae was observed at La Barca and Cayo Caribes Reefs from Jobos Bay, as well as at Mameyal and Cerro<br />
Gordo Reefs in Dorado. Calcareous algae, (mostly Halimeda opuntia) was an important component of the<br />
algal cover at Cayo Rio and Guayanilla Reef. The encrusting octocoral, Erythropodium caribaeorum, was<br />
observed in variable percent cover at most reefs surveyed from intermediate depths (6-14 m). The highest<br />
cover was observed in the Tasmania Reef in Ponce (17.3%). Conversely, encrusting gorgonian was mostly<br />
absent from the high energy hard ground and rock reef communities of the north coast. Zoanthids (Palythoa<br />
spp.) and sponges were the other main biotic components of the reef benthos at intermediate depths. Abiotic<br />
cover (e.g., sand, holes, overhangs) ranged from 0-26.8%.<br />
The taxonomic composition of corals at reefs of intermediate depth (6-14 m) is presented in Figure 5.11.<br />
Montastrea annularis was the dominant scleractinian coral in 19 of the 22 reefs with highest live coral cover<br />
and was absent from 12 of the 13 reefs with lowest live coral cover among the 52 reefs surveyed. Montastrea<br />
cavernosa and Porites astreoides occurred in more reefs than any other coral taxa and were the main<br />
components of the live coral assemblage of highly degraded reefs, such as Mameyal, Cayo Río, Morrillos,<br />
and Guayanilla Reef.<br />
Live coral cover from the deeper reefs studied (15-25 m) was highest at Puerto Canoas and Puerto Botes<br />
Reefs in Desecheo Island (in the Mona Passage) with 52.2% and 48.8%, respectively (Figure 5.10). Puerto<br />
Canoas had extensive reef sections where live coral cover exceeded 80% and featured some of the largest<br />
live coral colonies of the Puertorrican coral reefs. Live coral cover at Puerto Canoas Reef peaked at depths<br />
between 22-25 m. The reef extended down the insular slope to a maximum depth of 40 m. Further down<br />
the insular slope, live coral cover declined sharply with increasing depth and sponges became the dominant<br />
sessile-benthic invertebrate taxa (García-Sais et al., 2003). Derrumbadero Reef in Ponce presented the third<br />
highest live coral cover among reefs studied in the 15-25 m depths with a mean of 41.8%. Derrumbadero Reef<br />
is a submerged seamount with a spectacular “spur-and groove” coral reef formation fringing the southern edge<br />
of the seamount top. The spurs rise about 5-6 m from their coralline sandy base and are colonized with corals<br />
and other encrusting biota on their top and at the walls, forming ledges and overhangs at the shelf-edge.<br />
Among coral reefs associated with the mainland shelf-edge, La Boya Vieja Reef in La Parguera presented<br />
the highest live coral cover with a mean of 41.2% (Figure 5.10). Shelf-edge reefs in the south and eastern<br />
sections of the mainland (e.g., Boya 2 near Ponce, Maria Langa near Guayanilla, Las Mareas near Guayama)<br />
presented generally lower live coral cover (
Puerto Rico<br />
page<br />
112<br />
The State of Coral Reef Ecosystems of Puerto Rico<br />
Figure 5.11. Mean linear cover by species for reefs at various depths. Source: Garcia-Sais et al., 2003; Garcia-Sais et al., 2001d.
The State of Coral Reef Ecosystems of Puerto Rico<br />
substrate cover by live corals (García-Sais et al., 2004; R. Armstrong, pers. comm.). Other less prominent<br />
species of scleractinian corals present on the deeper reefs studied include M. cavernosa, Porites astreoides,<br />
and Agaricia spp. (Figure 5.11).<br />
U.S. National Coral Reef Monitoring Program in Puerto Rico (NOAA), Natural Reserves<br />
A series of coral reef systems located in natural reserves in Puerto Rico were selected as priority sites for<br />
biological characterization under the U. S. Coral Reef Initiative Program for Puerto Rico (NOAA) in 1999-<br />
2000. These included reef sites at Desecheo and Mona Islands, Fajardo, Guanica, Guayama, Guayanilla,<br />
La Parguera, Mayaguez, Arroyo, Cabo Rojo, Caja de Muertos, Ponce, and Vieques. Figure 5.9 shows the<br />
location of coral reef monitoring sites.<br />
Methods<br />
Quantitative and qualitative baseline characterizations of the reef community at these sites were reported by<br />
García-Sais et al. (2001a, b, c, d). Monitoring efforts by personnel from the DNER began on these reefs in<br />
2001. Table 5.5 presents a summary of the quantitative data gathered during the 2001 monitoring effort for<br />
reefs included in the National Coral Reef Monitoring Program.<br />
Table 5.5. Mean percent substrate cover by benthic categories for 18 monitored reefs. Source: DNER, unpublished data.<br />
<strong>REEF</strong> SITES<br />
Barca-Guayama<br />
Coral-Guanica<br />
Ballena-Guanica<br />
Ventana-Guayanilla<br />
Tourmaline-Mayaguez<br />
Coronas-Mayaguez<br />
Media Luna-Mayaguez<br />
Caribe-Guayama<br />
BENTHIC<br />
CATEGORIES<br />
Live Coral 14.9 18.7 19.4 29.2 23.4 59.7 30.4 8.8 24.9 2 17.6 23.1 45.3 52.5 26 36.8 12.8 21.5<br />
Gorgonian 3.2 2.3 4 13.4 6.1 2.5 8.7 4 2.1 0.1 6.3 0.1 0 0 2.7 3.7 10.5 31.8<br />
Turf Algae 54.9 34.9 55.1 42.5 50.3 22.6 40.2 78 59.7 83.6 31.5 29.8 29.1 12.9 57.7 41.1 52.2 33.6<br />
Fleshy Algae 6.7 25.3 0 0 1 0 0.8 0.1 0.2 3.4 17.1 37.3 15 24.6 4.8 1.5 0.6 0<br />
Encr. Algae 1 1.5 0.9 2.1 6.4 1.8 0.2 0.3 0.1 1.2 1.4 2.8 2.2 3 0.5 3 0.4 0.3<br />
Calcareous Algae 8.8 5.1 1.8 0.5 2.6 2.8 12.7 0 0.2 1.5 20.6 0 0.2 0 0 0 4 0<br />
Sponges 6.9 4.2 1.4 4.7 7.2 1.9 1.4 7.8 2.3 7.2 1.8 4.5 3.2 3.3 0.4 1.6 2.8 4.2<br />
Zoanthids 0.7 0 1.1 3.7 0 0.7 0.1 0.1 0 0 0.4 0 0 0 0.2 0.3 0 0<br />
Tunicates 0 0 0.1 0 0.1 0.1 0.2 0.1 0 0.4 0 0 0.2 0 0 0 0 0<br />
Sand 0.1 2.8 3.8 1.7 0.9 0.2 1.4 0.7 1.2 0.5 0 2.2 0.7 1.1 1.2 7.5 0.9 0.3<br />
Gravel / Rubble 0.5 0 4.6 0 0 0 0 0 0 0 0 0 0 0 0.4 0 0 0<br />
Dead Coral 0.2 0 0 0 0 3.6 0.4 0 2.3 0.2 0 0 0.1 0.1 0 0 0 0<br />
Overhangs 2.2 5.2 7.6 2.2 1.9 3.9 3.2 0 7 0 3 0.2 4.1 2.3 5.9 4.5 15.4 8.3<br />
West-Caja de Muertos<br />
Windward- Caja de Muertos<br />
Berberia- Caja de Muertos<br />
Norte-Desecheo Island<br />
Botes-Desecheo Island<br />
Canoas-Desecheo Island<br />
Palominos-Fajardo<br />
Diablo-Fajardo<br />
El Palo-Fajardo<br />
Resuellos-Cabo Rojo<br />
Puerto Rico<br />
Sidebar<br />
page<br />
113
Puerto Rico<br />
page<br />
114<br />
The State of Coral Reef Ecosystems of Puerto Rico<br />
Results and Discussion<br />
At most sites, the percent cover of<br />
stony corals remained within 3%<br />
of baseline levels (Figure 5.12).<br />
Exceptions included the decline in<br />
coral cover at Cayo Coral in Guánica<br />
and at Cayo Caribes in Guayama.<br />
These changes may be related to<br />
small scale localized disturbances,<br />
since adjacent reefs (Ballena Reef<br />
in Guánica and Barca in Guayama)<br />
appeared relatively stable and varied<br />
very little from the baseline data. In<br />
addition, increases in coral cover<br />
that were detected at Tourmaline<br />
Reef were not detected at any other<br />
surveyed reefs within Mayaguez Bay<br />
(i.e., Coronas and Media Luna), which<br />
remained within 2% of the baseline<br />
data.<br />
Caribbean Coastal <strong>Marine</strong> Productivity Program<br />
The Caribbean Coastal <strong>Marine</strong> Productivity Program (CARICOMP) is a Caribbean-wide coral reef monitoring<br />
program established to examine changes in the ecological health of coral reefs and associated ecosystems<br />
(e.g., fringing mangroves, seagrass beds) across a network of laboratories and marine reserves, including the<br />
Puertorrican site of La Parguera (CARICOMP,1996). This program is directed in Puerto Rico by the University<br />
of Puerto Rico (UPR), Department of <strong>Marine</strong> Sciences and has been active since 1994. Dr. Ernesto Weil is<br />
currently the site director for the CARICOMP program in Puerto Rico. The CARICOMP Data Management<br />
Center is based in Kingston, Jamaica. Only limited CARICOMP monitoring results have been incorporated in<br />
this report, but should be included in the next reporting effort.<br />
Methods<br />
Monitoring methods can be found in<br />
Woodley et al., 1996.<br />
Results and Discussion<br />
Baseline characterization and early<br />
coral reef monitoring records for the<br />
site of La Parguera were presented<br />
at the 8th International Coral Reef<br />
Symposium in Panama (Woodley et<br />
al., 1996). The CARICOMP coral<br />
reef monitoring database includes<br />
available data for Media Luna Reef<br />
from Puerto Rico (CARICOMP, http://<br />
www.ccdc.org.jm/caricomp.html,<br />
Accessed: 12/29/04). Figure 5.13<br />
shows the annual variation of mean<br />
cover by live corals at Media Luna<br />
Reef (10 m depth).<br />
Figure 5.12. Comparison of percent live coral cover at 18 sites between baseline<br />
characterization in 1999 and first monitoring event in 2001. Source: DNER, unpublished<br />
data.<br />
Figure 5.13. Annual variation of mean percent live coral cover (10 m depth) at Media<br />
Luna Reef in La Parguera, Puerto Rico from 1994-2000. Source: CARICOMP,<br />
unpublished data.
The State of Coral Reef Ecosystems of Puerto Rico<br />
NOAA’s Coral Reef Ecosystems Study<br />
In 2002, NOAA’s Coastal Ocean Program initiated a five-year program to address the continued decline<br />
of coral reef ecosystem health. Based at UPR-Mayaguez, the Coral Reef Ecosystems Study (CRES) is a<br />
collaborative research program involving five universities, one non-government organization (NGO), and two<br />
Federal agencies. The CRES program was developed to:<br />
• Identify and evaluate factors critical to the decline of coral reefs;<br />
• Evaluate effective management approaches;<br />
• Develop tools to assist resource managers;<br />
• Evaluate socio-economic concerns vital to management plans; and<br />
• Integrate environmental studies, socioeconomic impacts, and modeling into a comprehensive ecological<br />
study.<br />
The overall strategic assessment will<br />
address four major research focus<br />
areas: 1) relationships between<br />
watershed activities and coral reefs;<br />
2) causes of ecological stress; 3)<br />
coral reef ecosystem integrity; and 4)<br />
evaluation and linkages of MPAs. The<br />
principal study area is the reef system<br />
off La Parguera, with additional work<br />
being conducted in conjunction with<br />
the Luis Peña Channel <strong>Marine</strong> Fishery<br />
Reserve (LPCMFR) on Culebra<br />
Island and the National Park on St.<br />
John, USVI. Figures 5.14 and 5.15<br />
show preliminary results identifying<br />
watershed sources of sedimentation<br />
to the coastline in the natural reserve<br />
at La Parguera, Lajas.<br />
The CRES project has conducted<br />
only one full year of sampling,<br />
yet certain trends have become<br />
apparent. Detailed seasonal<br />
sampling has shown that the reef<br />
system is very dynamic, with large<br />
changes occurring over short periods<br />
of time. Some of these seem to be<br />
associated with seasonal variations<br />
(e.g., temperature, rainfall) while<br />
others may be indicative of increased<br />
nutrient stress (e.g., cyanobacterial<br />
overgrowths in La Parguera and<br />
Culebra).<br />
Coastal development, especially in<br />
hilly areas, is often a major cause of<br />
increased sedimentation. The unique<br />
environmental signal resulting from<br />
the intense rain event in November<br />
2003 provided an opportunity to study<br />
Figure 5.14. Measured erosion rates for different sediment sources in the watershed<br />
of La Parguera. Source: C. Ramos, unpublished data.<br />
Figure 5.15. Rate of sediment production as a function of slope in disturbed areas of<br />
La Parguera watershed. Source: C. Ramos, unpublished data.<br />
Puerto Rico<br />
Sidebar<br />
page<br />
115
Puerto Rico<br />
page<br />
116<br />
The State of Coral Reef Ecosystems of Puerto Rico<br />
the transport of nutrients and sediments into the La Parguera system. These studies showed the process to<br />
be complex and result from both nearshore and upstream processes that differentially act at various locations<br />
across the shelf. A combination of techniques (permanent data loggers, sediment traps, high spatial and<br />
temporal sampling) is necessary to fully understand how the system operates.<br />
Diseases and bleaching continue to be a problem, with the worst bleaching event since 1988 occurring in<br />
2003. While some progress has been made in identifying potential pathogens, new diseases were observed<br />
(e.g., of coralline algae) and the potential for disease reservoirs suggests that the causes and cycles of<br />
disease infection may be more complex that previously thought.<br />
Luis Peña Channel <strong>Marine</strong> Fishery Reserve Monitoring (LPCMFR)<br />
The Luis Peña Channel <strong>Marine</strong> Fishery Reserve (LPCMFR) was established on the west coast of Culebra<br />
by the government of Puerto Rico in May 1999. The main objective of this project is to monitor benthic<br />
organisms and fish at permanent stations within and outside of the reserve in order to determine the impact<br />
of protection.<br />
Methods<br />
Monitoring methods can be found in<br />
Hernández-Delgado, 2003<br />
Results and Discussion<br />
As in past years, fish biomass within<br />
the reserve has increased since<br />
closure. The most striking results are<br />
illustrated in Figure 5.16.<br />
At one site within the LPCMFR, the<br />
data showed a decline in coral cover<br />
over time and then a more recent<br />
stabilization. This result may have<br />
followed the delayed but eventual<br />
increase in herbivores observed<br />
since the reserve was closed. The<br />
opposite trend to that of corals would<br />
represent the change in percent<br />
algal cover. However, as Figure 5.16<br />
illustrates, the recorded increase<br />
in algae was due almost entirely to<br />
an increase in cyanobacteria. This<br />
strongly suggests that the increase<br />
in herbivorous fishes has mostly<br />
impacted fleshy macroalgae, while<br />
an increase in nutrient loading into<br />
the reserve (a trend supported by<br />
observed changes in nearby land<br />
use, resulting in runoff and increased<br />
turbidity) has allowed cyanobacteria<br />
to colonize the open space.<br />
Figure 5.16. Decline in coral cover and increase in cyanobacteria cover within the<br />
Luis Peña Channel <strong>Marine</strong> Fishery Reserve, Culebra. Source: Hernández-Delgado,<br />
2003.
The State of Coral Reef Ecosystems of Puerto Rico<br />
PRASA Submarine Outfall Studies-301h Waiver Demonstration<br />
Another ongoing, long-term monitoring of reef communities in Puerto Rico is associated with EPA’s 301(h)<br />
waiver demonstration studies for the submarine outfalls of the PRASA RWWTPs. The location of these<br />
submarine outfalls in the north and south coasts of Puerto Rico are shown in Figure 5.9. Initial baseline<br />
characterization studies of marine communities in the vicinity of these submarine outfalls were prepared by<br />
García-Sais et al. (1985). Monitoring studies of water quality and currents, sediment chemistry, infaunal benthic<br />
communities, fish and epibenthic invertebrate communities, and coral reef communities started in October 1999<br />
and have continued to the present at the RWWTPs of Carolina, Bayamón-Puerto Nuevo, Arecibo, Aguadilla,<br />
and Ponce. The 301(h) monitoring program for the Arecibo RWWTP submarine outfall includes monitoring of<br />
coral communities to assess whether effluent discharge has had any measurable impact on the maintenance<br />
of balanced indigenous populations of corals and associated fish and epibenthic invertebrate communities.<br />
Included in this report are summarized results for the RWWTPs of Arecibo and Aguadilla, which are being<br />
monitored by UPR-Department of <strong>Marine</strong> Sciences under the direction of Dr. Jorge (Reni) Garcia-Sais.<br />
Methods<br />
Sampling protocols and EPA-approved quality assurance/quality control manuals for the monitoring program<br />
were prepared by CSA Group/CH2MHill (1999). With the exception of Ponce, which is an ocean outfall 150<br />
m deep, all other outfalls discharge within the insular shelf at depths ranging between 15-40 m on the north<br />
coast of Puerto Rico. From these sites, true coral reef systems are only present in the vicinity of the RWWTP<br />
submarine outfall in Aguadilla, but coral communities associated with rock and hard ground reefs are included<br />
in the monitoring program for all RWWTP submarine outfalls.<br />
Two coral community monitoring stations were studied in the vicinity of the Arecibo outfall. Stations AA1 and<br />
AA2 were established on a hard ground reef habitat, located approximately 1 km and 0.8 km due east of the<br />
outfall, respectively. The insular shelf section located to the west of the outfall is under the direct influence<br />
of the Rio Grande de Arecibo plume and impractical for monitoring benthic communities due to the prevailing<br />
high turbidity of the water. Both coral stations AA1 and AA2 are sections of an extensive hard ground reef<br />
habitat found off the Arecibo coastline. Coral monitoring stations were located at similar distances due east<br />
of the outfall, but at different depths. AA1 reef was studied at a depth of 16 m, whereas AA2 was surveyed<br />
at a depth of approximately 21 m. The geographic coordinates of the alternative coral community stations are<br />
included in Table 5.3.<br />
Monitoring of coral reef communities within the Arecibo RWWTP 301(h) program has followed a winter and<br />
summer cycle with sampling efforts usually occurring in February and July. The two Arecibo coral monitoring<br />
stations are located within a general area subject to extended periods of high wave energy (from October to<br />
March) and the influence of the Rio Grande de Arecibo plume.<br />
Two coral community monitoring stations were established to the east and west of the Aguadilla RWWTP<br />
outfall. Aguadilla station AGS2 was established on a hard ground reef habitat, located approximately 0.93 km<br />
northeast of the outfall. Station AGS3 was established on a coral reef area approximately 4.26 km southwest<br />
of the outfall. The location of sampling stations is shown in Figure 5.9. Coral community monitoring stations<br />
were established at locations that characterized the typical reef communities present in the vicinity of the<br />
outfall. Station AGS2 is a submerged patch hard ground habitat that rises from a depth of approximately<br />
18 m to a fairly even platform at 14 m. This station is close to the outfall and also under the influence of the<br />
Culebrinas River plume. Station AGS3 is located in a zone of abundant rock outcrops farther offshore than<br />
AGS2 and also farther from the influence of both the outfall and the Culebrinas River plume. The coordinates<br />
of the alternative coral community stations are included in Table 5.3.<br />
Results and Discussion<br />
Summarized monitoring data of coral benthic community structure for the Arecibo Reefs AA1 and AA2 are<br />
presented in Figure 5.20. As can be inferred from the percent cover of biota at these reefs, it is evident that<br />
benthic algae (both turf and fleshy growth) represent the dominant biological assemblage colonizing hard<br />
substrate at AA1 and AA2, and sponges represent the most prominent invertebrate taxa of the reef community.<br />
Live corals represent minor components of the reef community structure at both Arecibo sites and occur mostly<br />
as encrusting forms, providing low topographic relief and scarce habitat for fishes and other reef biota. The<br />
poorly developed state of these hard ground reefs is related to the strong wave and surge energy seasonally<br />
Puerto Rico<br />
Sidebar<br />
page<br />
117
Puerto Rico<br />
page<br />
118<br />
The State of Coral Reef Ecosystems of Puerto Rico<br />
Figure 5.17. Percent cover by substrate categories at coral communities in the vicinity of the Arecibo and Aguadilla RWWTP outfalls,<br />
from 2001-2004. Source: EPA 301(h) Waiver Demonstration Monitoring Program.<br />
affecting the north coast of Puerto Rico and the localized effect of large river plumes.<br />
Summarized monitoring data on percent cover by substrate categories at Aguadilla reef community stations<br />
AGS2 and AGS3 also appear in Figure 5.17. Coral stations in Aguadilla are located in a high-energy<br />
environment and evidently under the estuarine influence of the Culebrinas and Guayabo River plumes. Coral<br />
communities in the study area are representative of the typical hard ground reef habitat that prevails on many<br />
sections of the north coast of Puerto Rico (e.g., AGS2), and of sparse and relatively small patch reef systems<br />
that have developed on top of rocky promontories (e.g., AGS3).<br />
The higher taxonomic complexity and percent cover of live corals at AGS3, as compared to AGS2, may be<br />
related to a combination of factors, including the higher exposure to river runoff and associated sedimentation<br />
stress at AGS2; the deeper location of the reef at AGS2, with its implications for lower light availability for<br />
corals; differences of sediment types at the base of reefs between both stations; and the higher separation of<br />
the reef at AGS3 from the unconsolidated substrate at its base. The two latter differences have implications<br />
for higher propensity of AGS2 to sediment re-suspension effects, as compared to AGS3. The higher number<br />
of fish species and abundance at AGS3 are probably associated with the higher topographic relief (habitat<br />
heterogeneity) and availability of live coral habitats.<br />
It is difficult to make an assessment of what has been the effect, if any, of the Aguadilla RWWTP discharge<br />
on coral reefs in this region due to the confounding effects of sedimentation stress, both from the strong wave<br />
and surge action and from the massive river runoff from the Culebrinas and Guayabo Rivers. Nevertheless,<br />
the hard ground coral community at AGS2 does not show any structural evidence of previous coral reef<br />
development, nor does AGS3 show any evidence of significant degradation of its standing coral structures.<br />
Records from permanent photoquadrats show that an active coral growth and recruitment process is taking<br />
place at the Alt-AGS3 reef station.
The State of Coral Reef Ecosystems of Puerto Rico<br />
Benthic Habitat Mapping Project<br />
NOAA’s Center for Coastal Monitoring and Assessment, Biogeography Team (CCMA-BT), completed a<br />
nearshore benthic habitat mapping project for Puerto Rico in 2001.<br />
Methods<br />
Map development was based on visual interpretation of aerial photographs, which were used to delineate<br />
habitat polygons in a geographic information system (GIS). Habitat polygons were defined and described<br />
according to eight geomorphologic zones and a hierarchical habitat classification system consisting of 21<br />
discreet habitat types within five major habitat categories. A detailed description of methods can be found in<br />
Kendall et al. (2001).<br />
Results and Discussion<br />
The mapping project was completed in 2001 and resulted in a series of maps encompassing 1,599 km 2<br />
of nearshore habitat in Puerto Rico. The maps are currently being distributed on a CD-ROM and on-line<br />
at http://biogeo.nos.noaa.gov/products/benthic/. A summary map (Figure 5.18), where polygons have been<br />
aggregated into five major habitat categories, depicts the geographical distribution of reefs and other types of<br />
benthic habitats on the Puertorrican shelf (Kendall et al., 2001).<br />
Figure 5.18. Nearshore benthic habitat maps were developed in 2001 by CCMA-BT based on visual interpretation of aerial photography<br />
and hyperspectral imagery. For more info, see: http://biogeo.nos.noaa.gov. Map: A. Shapiro. Sources: García et al., 2004;<br />
Kendall et al., 2001.<br />
Puerto Rico<br />
Sidebar<br />
page<br />
119
Puerto Rico<br />
page<br />
120<br />
The State of Coral Reef Ecosystems of Puerto Rico<br />
ASSOCIATED BIOLOGICAL COMMUNITIES<br />
U.S. National Coral Reef Monitoring Program in Puerto Rico (NOAA), Reef Fish Monitoring<br />
Methods<br />
Quantitative and qualitative surveys of diurnal, non-cryptic reef fishes have been included as part of the<br />
biological baseline characterizations and monitoring of coral reef communities in Puerto Rico. Reef fishes<br />
were surveyed using a belt-transect technique. Transects 10 m long and 3 m wide (30 m 2 survey area)<br />
centered over the linear transects were used to characterize the reef benthic community. A total of five belttransects<br />
were surveyed at each reef station.<br />
Results and Discussion<br />
The mean abundance of fishes ranged from 241.4 per 30 m 2 at Puerto Botes Reef at Desecheo Island to<br />
22.0 per 30 m 2 at El Palo Reef in Boquerón (Table 5.6). Number of species was highest (29 per 30 m 2 ) at<br />
Puerto Canoas Reef in Desecheo and lowest (10 per 30 m 2 ) at Caña Gorda and Ballena Reefs in the Guánica<br />
area. The highest number of diurnal, non-cryptic fish species observed was also from Puerto Canoas Reef<br />
at Desecheo Island with a total of 54 species. The highest fish abundance was found at offshore island sites<br />
separated from the main island of Puerto Rico. Puerto Canoas and Puerto Botes at Desecheo Island were the<br />
only reefs surveyed with an average of 25 or more (non-cryptic) fish species per transect. Highest abundance<br />
(96.9 per 30 m 2 ) and number of species (22 per 30 m 2 ) of fish among the mainland reefs surveyed were found<br />
at Turrumote Reef in outer Mayaguez Bay.<br />
Table 5.6. Mean abundance and species richness of reef fishes present within belt transects during baseline characterization surveys<br />
in 1999-2000. Source: Garcia-Sais et al., 2003; Garcia-Sais, unpublished data.<br />
<strong>REEF</strong>/ SITE MEAN ABUNDANCE / 30 m 2 TOTAL # SPP. / 150 m 2 MEAN SPP / 30 m 2<br />
Puerto Botes - DES 241.4 49 25<br />
Puerto Canoas - DES 208.6 54 29<br />
Derrumbadero - PON 161.4 47 25.2<br />
Playa Mujeres - MON 133 48 23<br />
SE Cayo Diablo/99 - FAJ 128 49 21<br />
North Reef - DES 127.4 38 21<br />
Tourmaline - MAY 96.8 42 22<br />
Playa de Pájaros - MON 89 40 19<br />
Las Carmelitas - MON 86 42 22<br />
La Barca - JOB 84.6 30 15.2<br />
Maria Langa 15m - GUY 82.2 46 23<br />
Cayo Puerca West - JOB 71 32 14.8<br />
La Boya - PAR 70.4 38 24<br />
Caribes - JOB 70.2 38 20.4<br />
Boya Esperanzan - VIE 63.4 46 20<br />
Corona - VIE 63.4 37 18<br />
West Reef/99 - CMU 61.8 45 21<br />
Mosquito - VIE 60.8 34 17<br />
Punta Ventana/99 - GUA 60.4 34 16<br />
Comandante - VIE 56 41 19<br />
North Palomino/99 - FAJ 55 31 18<br />
Palominos/01- FAJ 55 31 18<br />
Cayo Puerca East - JOB 54.8 25 10.4<br />
SE Palominitos/99 - FAJ 54.6 29 14<br />
Tallaboa - GUY 50 38 17<br />
Puerto Ferro - VIE 49.2 46 19<br />
Punta Colchones West - JOB 48 24 12.8<br />
Boya 2 - PON 47.8 34 17<br />
Bajo Gallardo - BOQ 46.6 36 17<br />
Canjilones - PAR 44 31 19<br />
Media Luna/99 - MAY 43.2 26 13
The State of Coral Reef Ecosystems of Puerto Rico<br />
Table 5.6 (continued). Mean abundance and species richness of reef fishes present within belt transects during baseline characterization<br />
surveys in 1999-2000. Source: Garcia-Sais et al., 2003; Garcia-Sais, unpublished data.<br />
<strong>REEF</strong>/ SITE MEAN ABUNDANCE / 30 m 2 TOTAL # SPP. / 150 m 2 MEAN SPP / 30 m 2<br />
Boya 6 - VIE 43 40 19<br />
Punta Colchones East - JOB 42.6 27 14.2<br />
Maria Langa 10m - GUY 40.4 42 17<br />
Monte Pirata - VIE 38.6 38 17<br />
Canjillones - VIE 36.8 43 17<br />
Windward Reef - CMU 36.8 19 13<br />
Punta Ballena - GUA 36.5 20 10<br />
Las Coronas - MAY 34.8 30 15<br />
Margarita Hard Ground - PAR 33.4 27 15<br />
Caballo Blanco Reef Crest - VIE 32 22 13<br />
Caña Gorda - GUA 31.8 20 10<br />
Berberia - CMU 28.8 26 11<br />
Caballo Blanco Reef Slope - VIE 28.4 26 11<br />
Resuellos - BOQ 28 32 15<br />
Cayo Coral/99 - GUA 26.8 29 14<br />
El Palo - BOQ 22 24 11<br />
Tasmania - PON 16.2 21 16.2<br />
Figure 5.19. Taxonomic composition and abundance of numerically dominant fish taxa from belt-transect surveys performed during<br />
the USCRI-NOAA baseline characterization studies of Puertorrican reefs (1999-2001). Source: Garcia-Sais et al., 2003; Garcia-Sais,<br />
unpublished data.<br />
Puerto Rico<br />
Sidebar<br />
page<br />
121
Puerto Rico<br />
page<br />
122<br />
The State of Coral Reef Ecosystems of Puerto Rico<br />
Fish assemblages at offshore island<br />
reefs, particularly those surveyed<br />
at Desecheo and Mona Islands,<br />
were characterized by a high<br />
abundance of zooplanktivorous<br />
fishes, such as Chromis spp., creole<br />
wrasse (Clepticus parrae), bicolor<br />
damselfish (Stegastes partitus) and<br />
juvenile stages of Spanish hogfish<br />
(Bodianus rufus) (Figure 5.19). High<br />
live coral cover was associated with<br />
high abundance of the sharknose<br />
goby (Gobiosoma evelynae) and<br />
peppermint goby (Coryphopterus<br />
lipernes) that live on top of large coral<br />
colonies. Number of fish species was<br />
positively correlated (p
Results and Discussion<br />
By relating monitoring data to the<br />
habitat maps, CCMA-BT and its<br />
partners are able to map and model<br />
(predict) species and community level<br />
parameters throughout the seascape.<br />
Furthermore, by integrating this work<br />
with other concurrent studies on<br />
fish migration patterns, home range<br />
size, fish dispersal, and recruitment<br />
being conducted by partner groups,<br />
the program is in a unique position<br />
to answer questions about marine<br />
zoning strategies (e.g., placement<br />
of MPAs), and will be in a position<br />
to evaluate management efficacy as<br />
long-term monitoring continues.<br />
Since August 2000, a total of 628<br />
locations in southwestern Puerto<br />
Rico have been surveyed, resulting<br />
in abundance estimates for over<br />
200 species of fishes, 50 species<br />
of coral, and 100 species of algae.<br />
The highlights of this section are<br />
the relationships observed between<br />
fish species and the habitats they<br />
occupy throughout their life histories,<br />
as well as changes in the observed<br />
patterns since the last reporting effort<br />
in 2002.<br />
Measures of fish community<br />
structure (abundance, species<br />
richness, and species diversity)<br />
were markedly different among<br />
the habitat types sampled (reef,<br />
mangrove, and other substrates),<br />
with reefs exhibiting highest overall<br />
species diversity (r 2 =0.50, p
Puerto Rico<br />
page<br />
124<br />
The State of Coral Reef Ecosystems of Puerto Rico<br />
this same period has increased<br />
(Figure 5.22). This may indicate that<br />
the declining abundances of several<br />
once numerically dominant reef<br />
species (e.g., grunts; Figure 5.23),<br />
coupled with a relatively stable level<br />
of species richness, has resulted in<br />
increased diversity.<br />
Results of the CCMA-BT monitoring<br />
activities clearly indicate that fish<br />
community structure is different<br />
among the various habitats that<br />
comprise the coral reef ecosystem in<br />
southwestern Puerto Rico, and further<br />
corroborate findings by Christensen<br />
et al. (2002). It is important, however,<br />
to understand that many species in<br />
the region require several habitat<br />
types throughout their life-histories<br />
for growth and reproductive success.<br />
Furthermore, these data suggest<br />
that preserving a mosaic of habitats<br />
is critical to managing significant<br />
numbers of fish species that are<br />
associated with coral reefs as<br />
adults. An analysis of frequencies<br />
(correspondence analysis/reciprocal<br />
averaging) using data collected since<br />
2002 indicated that many snapper<br />
(family Lutjanidae), grunt (family<br />
Haemulidae), and wrasse (family<br />
Labridae) species exhibit clear<br />
ontogenetic shifts in patterns of habitat<br />
utilization. For example, lane snapper<br />
(Lutjanus synagris) less than5 cm<br />
fork-length disproportionately inhabit<br />
seagrass meadows, and then move<br />
into the cover provided by mangrove<br />
prop roots (from 5-15 cm). L. synagris<br />
Figure 5.23. Comparison of log-transformed abundance of grunts (family Haemulidae)<br />
among years. Model is significant (p=0.02), with abundances in 2003 and 2004<br />
lower than in 2002. Source: CCMA-BT, unpublished data.<br />
Figure 5.24. Results of correspondence analysis of lane snapper size class distributions<br />
among habitats monitored in southwestern Puerto Rico, 2002-2004. Source:<br />
CCMA-BT, unpublished data.<br />
larger than 15 cm subsequently move from this refuge to reef sites along the entire shelf (Figure 5.24). This is<br />
just one of many examples that underscores the need for continued monitoring of reef fish populations in all<br />
component habitats of the coral ecosystem.
Coral reefs exhibited the highest<br />
number of species and the highest<br />
average diversity among all of the<br />
habitat types monitored. Measures<br />
of habitat characteristics, particularly<br />
topographic complexity (measured<br />
as rugosity) and percent live coral<br />
cover, were important determinants<br />
of fish abundance, richness, and<br />
diversity. Figure 5.25 shows the<br />
relationships between fish community<br />
structure and percent live coral<br />
coverage. Each parameter exhibited<br />
a statistically significant relationship<br />
(log 10 abundance, r 2 =0.48, p
Puerto Rico<br />
page<br />
126<br />
The State of Coral Reef Ecosystems of Puerto Rico<br />
CURRENT CONSERVATION MANAGEMENT ACTIVITIES<br />
The purpose and priorities of the Coral Reef Monitoring Program for Puerto Rico were initially presented by the<br />
DNER to the U.S. Island Coral Reef Initiative of NOAA in 1997. The main objectives of the program were to<br />
map the geographical distribution of coral reefs, produce a baseline characterization of priority reef sites, and<br />
establish a monitoring program targeting a selection of high-priority reef sites. The monitoring program would<br />
provide information needed for effective resource management and public awareness, while constructing a<br />
scientific data base for long-term analysis of the coral reefs in natural reserves of Puerto Rico.<br />
The benthic habitat maps of Puerto Rico and the USVI developed by NOAA in 2001 provided a valuable<br />
information source on the geographical distribution of Puertorrican reefs and other benthic habitats of the<br />
insular shelf. A more detailed physical assessment of benthic habitats using side-scan sonar technology has<br />
been produced for the reef system of La Parguera (Prada, 2002). These works corroborated and expanded<br />
upon an initial geographical inventory of Puertorrican reefs by Goenaga and Cintrón (1979). The initial work of<br />
Goenaga and Cintrón (1979) combined with studies on reef physiography and community structure (Cintrón<br />
et al., 1975; Canals and Ferrer, 1980; Canals et al., 1983) established criteria for designation of marine<br />
areas with coral reefs as natural reserves by the government of Puerto Rico. Still, there is a need for more<br />
specific physical and biological characterization of hard ground features of the insular shelf, preliminarily those<br />
classified as “linear reefs” and other hard ground habitat designations by NOAA (2000).<br />
DNER has identified the natural reserves of Mayaguez Bay, Desecheo Island, Rincón, La Parguera, Bahía de<br />
Jobos, Ponce Bay, Cordillera de Fajardo and the islands of Culebra and Vieques as high-priority monitoring<br />
sites. Baseline characterizations for these reef systems were prepared by García-Sais et al. (2001a, b, c)<br />
and are available online at http://www.coralpr.net/index.php. The baseline characterization and monitoring for<br />
the LPCMFR was prepared by Hernández-Delgado (2003). The baseline characterization of the Tres Palmas<br />
Reef in Rincón is underway. This report includes monitoring data from a total of 12 reef sites under the U.S.<br />
Coral Reef Monitoring Program funded by NOAA and two additional reef sites monitored since 1999 as part<br />
of U.S. EPA 301(h) studies associated with operations of the submarine outfalls of the RWWTPs at Arecibo<br />
and Aguadilla, on the north and northeast coasts, respectively. La Parguera, on the southwest coast, is a<br />
CARICOMP monitoring site. The CARICOMP database is available online (CARICOMP, http://www.ccdc.org.<br />
jm/caricomp.html, Accessed: 12/29/04).<br />
Public awareness and outreach programs focused on the ecological and socioeconomic value of Puerto Rico’s<br />
coral reef systems have started in the form of special television presentations transmitted by the government<br />
television channel, WIPR, through the series “Geoambiente”. An interagency committee directed to promote<br />
public awareness on the importance of coral reefs has prepared a local action strategy (LAS) to convey basic<br />
knowledge about coral reefs to secondary level students in the public education system. The plan integrates<br />
municipal governments and the tourism industry in an effort to promote awareness of human activities that<br />
negatively affect coral reef health. UPR’s Sea Grant Program has played an important role in disseminating<br />
information geared toward the general public and local fishers based on scientific research regarding the<br />
ecological health of coral reef systems and associated fisheries in Puerto Rico. Educational brochures on<br />
marine life at highly impacted recreational reef sites at La Parguera and the LPCMFR have been produced<br />
and distributed.<br />
The Caribbean Fisheries Management Council (CFMC) and the NOAA Fisheries office in Puerto Rico have<br />
collaborated with DNER scientists and management to significantly revise Puerto Rico’s fisheries law. The<br />
new law is directed to protect the integrity of coral reef systems by regulating fishing activities through the<br />
implementation of catch quotas, establishment of no-take areas within three natural reserve sites (Culebra,<br />
Desecheo and Rincón) and seasonal fishing closures for overexploited species including red hind (Epinephelus<br />
guttatus), mutton snapper (Lutjanus analis) and queen conch (Strombus gigas).<br />
Designations of coastal areas with extensive coral reef development as natural reserves by the DNER<br />
represents a first step towards conservation of Puertorrican coral reef resources. Natural reserves in Puerto<br />
Rico are regulated by restrictive zoning designations to protect the marine ecosystem from detrimental effects<br />
of activities occurring upstream in the watershed, such as the increased rates of terrestrial sediment runoff
The State of Coral Reef Ecosystems of Puerto Rico<br />
associated with soil movement during construction work. DNER has assigned personnel to enforce regulations<br />
applicable to the commercial and recreational utilization of marine resources within natural reserves.<br />
The ever increasing pressure to develop the coastline into urban, industrial and tourist centers has dramatically<br />
influenced the modification of initial watershed zoning designations pertaining to many natural reserves<br />
in Puerto Rico. The trend is towards less restrictive zoning designations that allow for increased urban<br />
development within the watershed and open rural areas to tourism and commercial development. The effects<br />
have been a decrease in water quality due to increased sediment runoff and an exponential increase in the<br />
recreational utilization of marine resources. Water quality monitoring programs have been implemented to<br />
focus specifically on effects of submarine outfalls in the vicinity of Arecibo, Aguadilla, Carolina, San Juan<br />
and Ponce and thermoelectric power plant thermal discharges in the vicinity of San Juan, Guayanilla and<br />
Guayama.<br />
Other activities underway include an evaluation of the status of organism collecting for the aquarium trade.<br />
OVERALL CONCLUSIONS AND RECOMMENDATIONS<br />
The benthic habitat mapping effort by Kendall et al. (2001), in conjunction with the initial inventory of coral reefs<br />
by Goenaga and Cintrón (1979) and the most recent work by Prada (2002) in La Parguera, have provided<br />
important data on the geographical location of coral reefs and other benthic habitats in Puerto Rico. Continued<br />
field validations of this preliminary work will lead to more specific and accurate classification of the benthic<br />
habitats. A comprehensive baseline characterization of the main Puertorrican coral reefs has been produced.<br />
The database includes quantitative assessments of substrate cover by benthic categories and abundance<br />
estimates of fishes and motile megabenthic invertebrates from 28 reefs in Puerto Rico. Permanent transects<br />
allow for prospective quantitative monitoring of these reefs.<br />
Reefs with the highest substrate cover of live corals were generally found at the leeward side of oceanic<br />
islands (e.g., Desecheo, Mona); at offshore islands within the Puertorrican shelf (e.g., Vieques, Culebra,<br />
Cayo Diablo); and associated with the mainland shelf-edge in the south (e.g., Derrumbadero), southwest<br />
(e.g., La Boya Vieja) and west coasts (e.g., Tourmaline). Boulder star coral, Montastrea annularis, is the<br />
dominant coral species in terms of substrate cover in reefs with relatively high coral cover. Great star coral,<br />
Montastrea cavernosa, Siderastrea spp., and Porites astreoides constitute the main coral assemblage of<br />
degraded reefs.<br />
Year-round high water transparency and protection from extreme wave action are the main factors associated<br />
with healthy coral reef systems in Puerto Rico. Rivers represent the main sources of material loading to coastal<br />
waters of Puerto Rico, including pollutants in the form of suspended sediments, biological oxygen demand,<br />
chemical oxygen demand, fecal coliforms, heavy metals, and pesticides. Coral reef monitoring programs<br />
associated with the 301(h) RWWTP submarine outfall study in Aguadilla show that no major changes of<br />
live coral cover have occurred during the last four years of observations. The first monitoring cycle of reefs<br />
through NOAA’s U.S. Coral Reef Monitoring Program in 2001 did not detect any major shifts in community<br />
structure, nor live coral cover in 16 of the 18 reefs studied. The second monitoring cycle (2004) is currently in<br />
progress. The marked decline of live coral cover from the reefs at the LPCMFR, combined with the outbreak<br />
of cyanobacterial colonization of reef substrate, was unprecedented and deserves further monitoring and<br />
evaluation.<br />
A positive correlation exists between species richness of reef fishes and the percent of live coral cover in reefs<br />
around Puerto Rico. Coral reefs with high live coral cover generally exhibit relatively high abundance and a<br />
diverse assemblage of zooplanktivorous fishes (Chromis spp., Clepticus spp., Stegastes partitus), whereas<br />
coral reefs with low live coral cover numerically dominated by dusky damselfish (Stegastes dorsopunicans).<br />
Large, commercially important reef fishes have virtually disappeared from shallow reefs around Puerto Rico.<br />
Preliminary findings from the LPCMFR suggest that commercially important reef fishes are increasing in size<br />
and abundance within reserve boundaries.<br />
Puerto Rico<br />
Sidebar<br />
page<br />
127
Puerto Rico<br />
page<br />
128<br />
The State of Coral Reef Ecosystems of Puerto Rico<br />
Public awareness and outreach programs that educate the Puertorrican community about coral reef systems,<br />
the role they play in our society, and how they can be most effectively managed and utilized are underway by<br />
several organizations, including an interagency (DNER, CFMC, NOAA Fisheries, Sea Grant) effort to develop<br />
LASs and a weekly television program from the government channel, WIPR, entitled ‘Geoambiente.’<br />
The initial objectives of the U.S. Coral Reef Initiative Program for Puerto Rico, such as the mapping of benthic<br />
habitats (including coral reefs), the baseline quantitative characterization of coral reef communities, training<br />
of DNER personnel for coral reef monitoring, monitoring of reef sites, and the launching of a coral reef public<br />
awareness and outreach program have been fully addressed and achieved to a significant level due to the<br />
combined effort from local government, Federal agencies, public and private universities, and NGOs. It is time<br />
for evaluation of new priorities and re-definition of program goal objectives.<br />
Recommendations<br />
Recommendations for future management activities include defining and implementing a long-term coral reef<br />
monitoring program focused on a selected group of eight reef sites where baseline characterizations and<br />
previous monitoring is already available. The recommended sites include reefs within no-take MPAs (e.g.,<br />
Desecheo, Tres Palmas, LPCMFR), shelf-edge reefs (Tourmaline, Boya Vieja, Derrumbadero), representative<br />
mid-shelf/coastal reefs that can be monitored cost-effectively (Media Luna, Caribes, Barca), and representative<br />
island reefs with high recreational potential (La Cordillera de Fajardo, Vieques) that are currently unprotected.<br />
Proposed coral reef monitoring sites and the region in which they are located include:<br />
• Puerto Canoas/Puerto Botes Reefs - Desecheo<br />
• Tourmaline Reef – Mayaguez Bay<br />
• Boya Vieja/Media Luna Reefs – La Parguera<br />
• Derrumbadero Reef – Ponce<br />
• Caribes/La Barca Reefs – Guayama<br />
• LPCMFR Reefs – Culebra<br />
• Comandante/Esperanza/Mosquito Reefs – Vieques<br />
• Tres Palmas Reef – Rincón<br />
• La Cordillera Reefs – Fajardo<br />
Field validation and classification of selected reef habitats as they appear in the benthic habitat map of Puerto<br />
Rico (Kendall et al., 2001) are required. The priority is to refine the classification of reefs as coral reef, hard<br />
ground, or rock reef habitats in order to validate area estimates of benthic habitats and their distribution within<br />
the Puertorrican shelf.<br />
In addition, exploratory surveying, mapping, and monitoring of deep coral reef systems within the 30-50 m<br />
depth range is needed. Preliminary surveys indicate that deeper water reefs exhibit exceptionally high live<br />
coral cover and rich biological communities, particularly within deep sections of the eastern and western shelf<br />
of Puerto Rico.<br />
Management activities must also be supported with an increased effort to raise public awareness and develop<br />
outreach activities on coral reef ecology and resource conservation, focusing on fishers and communities<br />
adjacent to natural reserves. It is also recommended that the topic of coral reef ecology and resource conservation<br />
be incorporated into the science curriculum at all educational levels in Puerto Rico. Guidelines for<br />
recreational use of coral reefs and associated ecological systems within natural reserves are needed and<br />
should be widely disseminated.
REFERENCES<br />
The State of Coral Reef Ecosystems of Puerto Rico<br />
Acevedo, R. and J. Morelock. 1988. Effects of terrigenous sediment influx on coral reef zonation in southwestern Puerto<br />
Rico. pp. 2: 189-184. In: Proceedings of the 6th International Coral Reef Symposium, Australia.<br />
Adey, W. H. 1978. Coral reef morphogenesis: a multidimensional model. Science 202: 831.<br />
AGRRA (Atlantic and Gulf Rapid Reef Assessment). 2003. AGRRA surveys in Eastern Puerto Rico, including Fajardo,<br />
Culebra, and Vieques. Final report submitted to NOAA’s Office of Habitat Conservation. 25 pp.<br />
Almy, C. Jr and C. Carrión Torres. 1963. Shallow water stony corals of Puerto Rico. Caribbean Journal of Science 3:<br />
269-279.<br />
Antonius, A. 1981. Coral reef pathology – A review. pp. 3-6. In: Proceedings of the 4th International Coral Reef Symposium<br />
2.<br />
Antonius, A. and A. Weiner. 1982. Coral reefs under fire. <strong>Marine</strong> Ecology 3: 255-277<br />
Armstrong, R. Department of <strong>Marine</strong> Sciences, University of Puerto Rico, Mayaguez, Puerto Rico. Personal communication.<br />
Armstrong, R. 1980. New records of scleractinian corals from Puerto Rico. pp. 3. In: Proceedings of the Association of<br />
Island <strong>Marine</strong> Laboratories of the Caribbean 15.<br />
Armstrong, R. 1981. Changes in a Puerto Rican coral reef from 1936-1979 using aerial photoanalysis. pp. (1) 309-315.<br />
In: Proceedings of the fourth International Coral reef Symposium, Manila.<br />
Appeldoorn, R., J. Beets, J. Bohnsack, S. Boldlen, D. Matos, S. Meyers, A. Rosario, Y. Sadovy, and W. Tobias. 1992.<br />
Shallow water reef fish stock assessment for the U.S. Caribbean. NOAA Technical Memorandum NMFS-SEFSC-304.<br />
70 pp.<br />
Ballantine, D.L. 1984. Hurricane-induced mass mortalities to a tropical sub-tidal algal community and subsequent recoveries.<br />
<strong>Marine</strong> Ecology Progress Series 20: 75-83.<br />
Bruckner, A.W. 1999. Black-band disease (BBD) of scleractinian corals: occurrence, impacts and mitigation. Ph.D. Thesis<br />
for Univesity of Puerto Rico. 286 pp.<br />
Bruckner, A.W. and R.J. Bruckner. 1997. Outbreak of coral disease in Puerto Rico. Coral Reefs 16: 260.<br />
Bruckner, A.W. and R.J. Bruckner. 2001. Condition of Restored Acropora palmata Fragments off Mona Island, Puerto<br />
Rico, Two Years after the Fortuna Reefer Ship Grounding. Coral Reefs 20: 235-243.<br />
Bruckner, A.W. and R.J. Bruckner. 2004. Impact of yellow-band disease (YBD) on remote reefs off Mona Island, Puerto<br />
Rico. pp. (1) 218. In: Tenth International Coral Reef Symposium.<br />
Bruckner, A.W. and R.J. Bruckner. In press. Restoration outcomes of the Fortuna Reefer Grounding at Mona Island,<br />
Puerto Rico. Chapter 19. In: W.F Precht (ed.) Coral Reef Restoration Handbook – The Rehabilitation of an Ecosystem<br />
Under Siege CRC Press, Boca Raton, FL.<br />
Bunkley-Williams, L. and E. H. Williams. 1987. Coral reef bleaching peril reported. Oceanus 30 (4): 71.<br />
Bunkley-Williams, L., J. Morelock, and E. H. Williams. 1991. Lingering effects of the 1987 mass bleaching of Puerto Rican<br />
coral reefs in mid to late 1988. Journal of Aquatic Animal Health 3 (4): 242-247.<br />
Bunkley-Williams, L. and E.H. Williams, Jr. 1994. Parasites of Puerto Rican Freshwater Sport Fishes. Puerto Rico Department<br />
of Natural and Environmental Resources, San Juan and Department of <strong>Marine</strong> Sciences, University of Puerto<br />
Rico, Mayagüez. 168 pp.<br />
Bunkley-Williams, L., E.H. Williams, Jr., C.G. Lilystrom, I. Corujo-Flores, A. J. Zerbi, C. Aliaume and T.N. Churchill. 1994.<br />
The South American sailfin armored catfish, Liposarcus multiradiatus (Hancock), a new exotic established in Puerto Rican<br />
fresh waters. Caribbean Journal of Science 30: 90-94.<br />
Canals, M. and H. Ferrer. 1980. Los arrecifes de Caja de Muertos. Department of Natural Resources, San Juan. 39 pp.<br />
Puerto Rico<br />
Sidebar<br />
page<br />
129
Puerto Rico<br />
page<br />
130<br />
The State of Coral Reef Ecosystems of Puerto Rico<br />
Canals, M., H. Ferrer, and H. Merced. 1983. Los arrecifes de coral de Isla de Mona. pp. 1-26. In: Proceedings of the 8th<br />
Symposium, Department of Natural Resources, San Juan, Puerto Rico.<br />
Castro, R. and J. R. García. 1996. Characterization of marine communities associated with reefs and seagrass/algal<br />
beds in Guayanilla and Tallaboa Bays. Report to EcoElectrica/ Gramatges and Associates, Inc. Department of <strong>Marine</strong><br />
Sciences, University of Puerto Rico, Mayaguez, Puerto Rico. 171 pp.<br />
CARICOMP. 1996. Caribbean Coastal <strong>Marine</strong> Productivity: a research and monitoring network of marine laboratories,<br />
parks and reserves. pp. 1-6. In: CARICOMP Papers, Proceedings of the 8th International Coral Reef Symposium. Data<br />
Management Center, Centre for <strong>Marine</strong> Sciences, University of the West Indies, Mona, Kingston, Jamaica.<br />
CSA/CH2M HILL Group. 1999. Quality Assurance Project Plan and Sampling and Analysis Protocols for the Arecibo RW-<br />
WTP 301 (h) Waiver Demonstration Studies. Submitted to the USEPA by the Puerto Rican Aqueduct and Sewer Authority.<br />
Volume 2.<br />
CSA/CH2M HILL Group. 2000-2003. Quarterly Reports for the Aguadilla Aguadilla Regional Waste Water Treatment Plant<br />
301 (h) Waiver Demonstration Studies. Submitted to the US Evnironmental Protection Agency, Region II, New York.<br />
Christensen, J.D., C.F.G. Jeffrey, C. Caldow, M.E. Monaco, M.S. Kendall, and R.S. Appeldoorn. 2003. Cross-shelf habitat<br />
utilization patterns of reef fishes in Southwestern Puerto Rico. Gulf and Caribbean Research 14 (2): 9-27.<br />
Cintrón, G., J. Thurston, J. Williams, and F. MacKenzie. 1975. Caracteristicas de la plataforma insular de Isla de Mona.<br />
pp. 69-91. In: Proceedings of the 2nd Symposium of the Department of Natural Resources, San Juan, P.R.<br />
Davis, M, E. Gladfelter, H. Lund, and M. Anderson. 1986. Geographic range and research plan for monitoring white band<br />
disease. Virgin Islands Resource Management Cooperative. Biosphere Reserve Research Report 6. 28 pp.<br />
García-Sais, J.R., C. Goenaga, and V. Vicente. 1985. Characterization of marine communities in the vicinity of PRASA<br />
submarine outfalls. Report to Metcalf and Eddy, Inc. Department of <strong>Marine</strong> Sciences, University of Puerto Rico, Mayaguez.<br />
220 pp.<br />
García-Sais, J.R. and R. Castro. 1995. Characterization of marine communities associated with reefs and seagrass/algal<br />
beds in San Juan Bay and Ensenada Boca Vieja, Palo Seco. Report to Grammatges and Associates, Inc.<br />
García-Sais, J.R., E. Ojeda and A. González. 1995. Zooplankton/ichthyoplankton communities of Guayanilla and Tallaboa<br />
Bays: Taxonomic structure and spatial/temporal patterns. Report submitted to Gramatges and Associates. EcoEléctrica<br />
Power Plant Studies. San Juan, Puerto Rico. 91 pp.<br />
García-Sais, J.R. and R. Castro. 1998. Pre-construction survey of marine communities associated with coral reefs and<br />
seagrass/algal bed habitats in Guayanilla and Tallaboa Bays, southwestern Puerto Rico. Report to Grammatges and Associates,<br />
Inc. Department of <strong>Marine</strong> Sciences, University of Puerto Rico, Mayaguez. 83 pp.<br />
García-Sais, J.R., R. Castro, and J. Sabater. 2001a. Coral reef communities from Natural Reserves in Puerto Rico: a<br />
baseline quantitative assessment for prospective monitoring programs. Vol. 1-Cordillera de Fajardo, Guánica, Bahía de<br />
Mayaguez, Caja de Muertos. U.S. Coral Reef Initiative Program, NOAA-DNER. 232 pp.<br />
García-Sais, J.R., R. Castro, J. Sabater, and M. Carlo. 2001b. Coral reef communities from Natural Reserves in Puerto<br />
Rico: a baseline quantitative assessment for prospective monitoring programs. Vol. 2-La Parguera, Boqueron, Isla de<br />
Mona, Isla Desecheo. U.S. Coral Reef Initiative Program, NOAA-DNER. 193 pp.<br />
García-Sais, J.R., R. Castro, J. Sabater, and M. Carlo. 2001c. Coral reef communities from Natural Reserves in Puerto<br />
Rico: a baseline quantitative assessment for prospective monitoring programs. Volume 3-Guayanilla, Ponce, Guayama,<br />
Arroyo. U. S. Coral Reef Initiative Program, NOAA-DNER. 147 pp.<br />
García-Sais, J.R, R. Castro, J. Sabater, and M. Carlo. 2001d. Baseline characterization of coral reef and seagrass communities<br />
from Isla de Vieques, Puerto Rico. U.S. Coral Reef National Monitoring Program, NOAA, DNER. 108 pp.<br />
García-Sais, J., J. Morelock, R. Castro, C. Goenaga, and E. Hernández-Delgado. 2003. Puertorican reefs: research síntesis,<br />
present tretas and management perspectives. pp. 111-130. In: J. Cortéz (ed.) Latin American Coral Reefs. Elsevier<br />
Science B.V.<br />
García-Sais, J.R. and J. Sabater. 2004. Distribución y caracterización biológica de los principales habitats marinos en la<br />
Reserva Natural de La Parguera, Lajas, PR. Informe Final. DRNA, San Juan, Puerto Rico. 140 pp.
The State of Coral Reef Ecosystems of Puerto Rico<br />
García-Sais, J.R., R. Castro, J. Sabater, and M. Carlo. 2004. Inventory and atlas of corals and coral reefs, with emphasis<br />
on deep-water coral reefs from the U. S. Caribbean EEZ. Caribbean Fisheries Management Council. San Juan, Puerto<br />
Rico. 36 pp.<br />
Garrison, L.E. and M.W. Buell. 1971. Sea-floor structure of the eastern Greater Antilles. pp. 240-245. In: Symposium on<br />
Investigations and Resources of the Caribbean Sea and Adjacent Regions. UNESCO.<br />
Gilbes, F., R.A. Armstrong, R.M.T. Webb and F. Muller-Karger. 2001. SeaWiFS helps assess Hurricane impact on phytoplankton<br />
in the Caribbean Sea. EOS, Transactions, American Geophysical Union 82 (45): 529-533.<br />
Glover, L. III. 1967. Geology of the Coamo area, Puerto Rico; with comments on Greater Antillean volvanic island arctrench<br />
phenomena. U. S. Geological Survey. 329 pp.<br />
Glynn, P.W., L.R. Almodovar, and J.G. González. 1964. Effects of Hurricane Edith on marine life in La Parguera, Puerto<br />
Rico. Caribbean Journal of Science 4: 335-345.<br />
Goenaga, C. and G. Cintrón. 1979. Inventory of the Puerto Rican Coral Reefs. Department of Natural Resources, San<br />
Juan, Puerto Rico. 190 pp.<br />
Goenaga, C., V. Vicente, and R. Armstrong. 1989. Bleaching induced mortalities in reef corals from La Parguera, Puerto<br />
Rico; a precursor of change in the community structure of coral reefs? Caribbean Journal of Science 25: 59-65.<br />
Goenaga, C. and M. Canals. 1990. Island-wide coral bleaching in Puerto Rico: 1990. Caribbean Journal of Science 26:<br />
171-175.<br />
Goenaga, C. and R.H. Boulon, Jr. 1991. The State of Puerto Rican and U.S. Virgin Islands Corals. Caribbean Fishery<br />
Management Council, Hato Rey, Puerto Rico. 66 pp.<br />
Goreau, T.F. 1964. Mass expulsion of zooxanthellae from Jamaican reef communities after Hurricane Flora. Science 145:<br />
383-386.<br />
Goreau, T.J., R.L. Hayes, J.W. Clark, D.J. Basta and C.N. Robertson. 1992. Elevated satellite sea surface temperatures<br />
correlate with Caribbean coral reef bleaching. In: Geyer, R.A. (ed.) A global warming forum: scientific, economic and legal<br />
overview 2(4). CRC Press, Boca Raton, Florida.<br />
Hall, K., J. Rafols, N. Memeth, and J. Rowland. 1999. Puerto Rico’s northwestern reefs: Maintaining unstressed conditions.<br />
Punta Borinquen and Desecheo Reef Monitor Update. Reef Keeper International. 5 pp. Available from the Internet<br />
URL http://www.reefkeeper.org/CRM/DownloadSite/Puerto_Rico/DesecheoRMU/RMUBorinquenDesecheoS99.<strong>pdf</strong>.<br />
Hernandez-Delgado, E.A. University of Puerto Rico. Rio Piedras, Puerto Rico. Personal communication.<br />
Hernández-Delgado, E.A. 1992. Coral reef status of northeastern and eastern Puerto Rican waters: recommendations<br />
for long-term monitoring, restoration and management. Caribbean Fishery Management Council, Hato Rey, Puerto Rico.<br />
87 pp.<br />
Hernández-Delgado, E. and L. Alicea-Rodriguez. 1993. Blanqueamiento. Pérdida de pigmentos y recuperación en los<br />
cnidarios de la costa este de Puerto Rico entre el 1992 y 1993. pp. 73. In: Proceedings of the 12th Symposium on Caribbean<br />
Fauna and Flora, University of Puerto Rico, Humacao. Abstract Volume.<br />
Hernández Delgado, E.A. and L. Alicea Rodríguez. 1993 a. Estado ecológico de los arrecifes decoral en la costa este<br />
de Puerto Rico: I. Bahía Demajagua, Fajardo, y Playa Candelero, Humacao. Proceedings of the 12th Symposium of the<br />
Caribbean Fauna and Flora. University of Puerto Rico, Humacao. 2 pp.<br />
Hernández Delgado, E.A. and L. Alicea Rodríguez. 1993 b. Blanqueamiento, pérdida de pigmentos y recuperación en<br />
los cnidarios de la costa este de Puerto Rico entre el 1992 y 1993. Proceedings of the 12th Symposium of the Caribbean<br />
Fauna and Flora. University of Puerto Rico, Humacao. 73 pp.<br />
Hernández Delgado, E.A. 1994a. National <strong>Marine</strong> Sanctuary Site Nomination: Mona and Monito Islands. National Oceanic<br />
and Atmospheric Administration, Washington, D.C. 18 pp.<br />
Hernández-Delgado, E.A. 1994b. Preliminary inventory of the coral reef systems and hard ground communities from La<br />
Cordillera Natural Reserve, Puerto Rico. Project Reefkeeper, Miami, FL. 38 pp.<br />
Hernandez-Delgado, E.A. 1995. Inventario preliminar de las comunidades coralinas de la costa de Río Grande, incluyendo<br />
la Reserva Natural del Estuario del Río Espíritu Santo. (Informe) Junta de Planificación, San Juan, P.R.<br />
Puerto Rico<br />
Sidebar<br />
page<br />
131
Puerto Rico<br />
page<br />
132<br />
The State of Coral Reef Ecosystems of Puerto Rico<br />
Hernández-Delgado, E.A. 2003. Coral reef ecological change long term monitoring program for the Luis Peña Channel<br />
no-take Natural Reserve, Culebra, Puerto Rico (1997-2003): I. Status of the coral reef epibenthic communities. Technical<br />
Report submitted to the DNER/USCRI, San Juan, Puerto Rico. 163 pp.<br />
Hernández-Delgado, E.A. and A.M. Sabat. In press. Long-term phase shifts in a coral reef community within a no-take<br />
natural reserve Puerto Rico. Coral Reefs.<br />
Juste, V. and R. Cortés. 1990. Distribution and biological aspects of the hard clam Mercenaria mercenaria (Linnaeus), M.<br />
mercenaria notata (Say), M. campechiensis (Gmelin) in Puerto Rico. Caribbean Journal of Science 26: 136-140.<br />
Kaye, C. 1959. Shoreline features and quaternary shoreline changes, Puerto Rico. USGS Professional Paper. 317-B:<br />
49-140.<br />
Kendall, M.S., C.R. Cruer, K.R. Buja, J.D. Christensen, M. Finkbeiner, R.A. Warner, and M.E. Monaco. 2001. Methods<br />
used to map the Benthic Habitats of Puerto Rico and the U.S. Virgin Islands. NOAA Technical Memorandum NOS NC-<br />
COS CCMA 152. 45 pp.<br />
Le Gore and Associates. 2002. Phase II monitoring for the export fishery of marine ornamental fish and invertebrates in<br />
Puerto Rico. Puerto Rico Department of Natural and Environmental Resources. San Juan, Puerto Rico. 31 pp.<br />
Lilyestrom, C. and E. Hoffmaster. 2002. Recreational fishery statistics of coral reef fisheries in Puerto Rico. pp. 30-31. In:<br />
Proceedings, Coral Reef Fisheries, Caribbean Regional Workshop: collaboration on successful management, enforcement<br />
and education methods for fisheries managers of the U.S. Caribbean.<br />
Matos-Caraballo. 2004. Puerto Rico/NMFS Cooperative Fisheries Statistics Program. April 2001-March 2004. Final Report<br />
submitted to the National <strong>Marine</strong> Fisheries Service by the Fisheries Research <strong>Laboratory</strong>, Department of Natural and<br />
Environmental Resources, San Juan. 83 pp.<br />
Matos-Caraballo, D., M. Cartagena-Haddock, and N. Peña-Alvarado. 2002. Comprehensive census of the marine commercial<br />
fishery of Puerto Rico 2002. Puerto Rico Department of Natural and Environmental Resources, Fishery Research<br />
<strong>Laboratory</strong>. Unpublished Report. 8 pp.<br />
Matta, J.L. 1981. The effects of Hurricane David on the benthic algae of a coral reef in La Parguera, Puerto Rico. M. S.<br />
Thesis for the University of Puerto Rico, Mayaguez.<br />
<strong>Mote</strong> Environmental Services, Inc. 2002. A description of the export industry for marine ornamental fish and invertebrates<br />
in Puerto Rico. Unpublished report to Puerto Rico Department of Natural and Environmental Resources’ Coral Reef Advisory<br />
Committee. 85 pp.<br />
Morelock, J., N. Schneiderman and W. R. Bryant. 1977. Shelf reefs, southwestern Puerto Rico. pp. 17 – 28. In: Frost,<br />
S.H., M.P. Weiss, and J.B. Saunders (eds.) Reefs and Related Carbonates-Ecology and Sedimentology, American Association<br />
of Petroleum Geologists, Studies in Geology 4.<br />
NOAA. 2000. Benthic habitats of Puerto Rico and the U. S. Virgin Islands. National Center for Coastal and Ocean Science,<br />
Coastal Services Center, Silver Spring, Maryland. 277 pp.<br />
Prada, M. 2002. Mapping benthic habitats on the southwest Puerto Rico as determined by side scan sonar. M.S. Thesis<br />
for the University of Puerto Rico, Mayaguez. 177 pp.<br />
PRNC (Puerto Rico Nuclear Center). 1972. Aguirre Power Project Environmental Studies 1972. Annual Report. Puerto<br />
Rico Nuclear Center, PRNC-162. University of Puerto Rico. 464 pp.<br />
Puerto Rico Tourism Co. 2002. Selected statistics of the Puerto Rico Tourism Industry in Puerto Rico. 2001-02 edition,<br />
Office of Research and Statistics, Commonwealth of Puerto Rico Tourism Company. 66 pp.<br />
Rogers, C.S., G. Cintrón, and C. Goenaga. 1978. The impact of military operations on the coral reefs of Vieques and<br />
Culebra. Department of Natural Resources, San Juan, Puerto Rico. 26 pp.<br />
Sadovy, I. 1992. A preliminary assessment of the marine aquarium export trade in Puerto Rico. pp. 2: 1014-1022. In:<br />
Proceedings of the Seventh International Coral Reef Symposium.<br />
Szmant-Froelich, A. 1973. The zonation and ecology of Jobos Bay coral reefs. Annual Report, Puerto Rico Nuclear Center-DOE.<br />
Environmental Studies. PRNC-162: 174-224.
The State of Coral Reef Ecosystems of Puerto Rico<br />
Velasco, A.T., E. Weil, and A. Bruckner. 2003. Climate change and coral reef bleaching in Puerto Rico: Efforts and challenges.<br />
In: Proceedings of the Coral Reef, Climate and Bleaching Workshop, Oahu, Hawaii.<br />
Vicente, V.P. 1990. Response of sponges with autotrophic endosymbionts during the coral-bleaching episode in Puerto<br />
Rico. Coral Reefs 8: 199-202.<br />
Vicente, V. and C. Goenaga. 1984. Mass mortalities of the sea-urchin Diadema antillarum in Puerto Rico. Center for Energy<br />
and Environment Research. CEER-M-195: 1-26.<br />
Vicente, V.P. 1989. Ecological effects of sea level rise and sea surface temperatures on mangroves, coral reefs, seagrass<br />
beds and sandy beaches of Puerto Rico: A preliminary evaluation. Science-Ciencia 16: 27-39.<br />
Vicente, V.P. 1994a. Response of sponges with antotrophic symbionts during the coral-bleaching episode in Puerto Rico.<br />
Coral Reefs 8: 199-202.<br />
Vicente, V.P. 1994b. Structural changes and vulnerability of a coral reef (Cayo Enrigue) in La Parguera, Puerto Rico. pp.<br />
C39-C44 In: R. H. Ginsburg (compiler) Proceedings of the colloquium on global aspects of coral reefs: Health, hazards<br />
and history, 1993. Rosentiel School of <strong>Marine</strong> and Atmospheric Science, University of Miami, Miami.<br />
Weil, E. 2004. Coral Reef Disease in the Wider Caribbean. In: E. Rosenberg and Y. Loya (eds) Coral Health and Disease.<br />
Springer-Verlag, New York.<br />
Weil, E., I. Urreiztieta, and J Garzon-Ferreira. 2002. Geographic variability in the incidence of coral and octocoral diseases<br />
in the wider Caribbean. pp. (2): 1231-1237. In: Proceedings of the 9th International Coral Reef Symposium.<br />
Whitfield, P., T. Gardner, S.P. Vives, M.R. Gilligan, W.R. Courtenay, Jr., G.C. Ray, and J.A. Hare. 2002. Biological invasion<br />
of the Indo-Pacific lionfish Pterois volitans along the Atlantic coast of North America. <strong>Marine</strong> Ecology Progress Series<br />
235: 289-297.<br />
Wilkinson, C. 2003. Coral bleaching and mortality: The 1998 event four years later and bleaching to 2002. Chapter 1 In:<br />
C. Wilkinson (ed.) Status of the coral reefs of the world: 2002. Australian Institute of <strong>Marine</strong> Sciences, Townsville.<br />
Williams, E.H., Jr. and L. Bunkley-Williams. 1988. Bleaching of coral reef animals in 1987-1988: An updated summary.<br />
pp. 19-21. In: J. Ogden and R. Wicklund (eds.) Mass bleaching of coral reefs in the Caribbean: A research strategy. National<br />
Undersea Research Program, NOAA, Research Report 88-2, Appendix III.<br />
Williams, E.H., Jr., C. Goenaga and V. Vicente. 1987. Mass bleaching on Atlantic coral reefs. Science 238: 877-878.<br />
Williams, E.H. Jr. and L. Bunkley-Williams. 1989. Bleaching of Caribbean coral reef symbionts in 1987-1988. pp. 3: 313-<br />
318. In: Proceedings of the 6th International Coral Reef Symposium.<br />
Williams, E.H., Jr. and L. Bunkley-Williams. 1990a. Coral reef bleaching alert. Nature 346: 225.<br />
Williams, E.H., Jr. and L. Bunkley-Williams. 1990b . The world-wide coral reef bleaching cycle and related sources of<br />
coral mortality. Atoll Research Bulletin 335: 1-71.<br />
Williams, E.H., Jr., L. Bunkley-Williams, E.C. Peters, J. Bauer, G. Sullivan, R.A. Bullis, J. Woodley, G. Ebanks, J.M.<br />
Grizzle, and K.E. Nusbaum. 1991. Threat to black sea urchins. Nature 352: 385.<br />
Williams, E. H., Jr. and C. J. Sindermann. 1992. Effects of disease interactions with exotic organisms on the health of<br />
the marine environment. pp. 1: 71-77. In: Proceedings of the Introductions and Transfers of <strong>Marine</strong> Species Workshop,<br />
South Carolina Sea Grant.<br />
Williams, E.H., Jr., L. Bunkley-Williams, and E. Burreson. 1994a. Some new records of marine and freshwater leeches<br />
from Caribbean, southeastern U.S.A., eastern Pacific, and Okinawan animals. Journal of the Helminthological Society of<br />
Washington 61: 133-138.<br />
Williams, E.H., Jr., L. Bunkley-Williams, and W.G. Dyer. 1994b. A Caribbean digenean, Lecithophyllum pyriforme, parasitizing<br />
an exotic fish, Phremias bicelatus, from Australia. Caribbean Journal of Science 30: 151.<br />
Williams, E.H., Jr., L. Bunkley-Williams, E.C. Peters, B. Pinto-Rodríguez, R. Matos-Morales, A.A. Mignucci-Giannoni,<br />
K.V. Hall, J.V. Rueda-Almonacid, J. Sybesma, I. Bonnelly de Calventi, and R.H. Boulon, 1994c. An epizootic of cutaneous<br />
fibropapillomas in green turtle, Chelonia mydas of the Caribbean: Part of a panzootic? Journal of Aquatic Animal Health<br />
6: 70-78.<br />
Puerto Rico<br />
Sidebar<br />
page<br />
133
Puerto Rico<br />
page<br />
134<br />
The State of Coral Reef Ecosystems of Puerto Rico<br />
Williams, E.H., Jr. and L. Bunkley-Williams. 2000. Caribbean marine major ecological disturbances. Infectious Diseases<br />
Review 2: 110-127.<br />
Williams, E.H., Jr., L. Bunkley-Williams, C.G. Lilyestrom, R.J. Larson, N.A. Engstrom, E.A.R. Ortiz-Corps, and J.H. Timber.<br />
2001a. A population explosion in the rare tropical/subtropical purple sea mane, Drymonema dalmatinum, around<br />
Puerto Rico in the summer and fall of 1999. Caribbean Journal of Science 37: 127-130.<br />
Williams, E.H., Jr., L. Bunkley-Williams, C.G. Lilyestrom and E.A.R. Ortiz-Corps. 2001b. A review of recent introductions<br />
of aquatic invertebrates into Puerto Rico and implications for the management of nonindigenous species. Caribbean<br />
Journal of Science 37: 246-251.<br />
Winter, A., R.S. Appledorn, A. Bruckner, E.H. Williams, Jr. and C. Goenaga. 1998. Sea surface temperatures and coral<br />
reef bleaching off La Parguera, Puerto Rico (northeastern Caribbean). Coral reefs 17: 377-382.<br />
Woodley, J. D., D. Bone, K. Buchan, P. Bush, K. De Meyer, J. Garzón-Ferreira, P. Gayle, D.T. Gerace, L. Grober, E. Klein,<br />
K. Koltes, F. Losada, M.D. McField, T. McGrath, J.M. Mendes, I. Nagelkerken, G. Ostrander, L.P. J.J. Pors, A. Rodríguez,<br />
R. Rodríguez, F. Ruiz-Renteria, G. Smith, J. Tschirky, P. Alcolado, K. Bonair, J.R. Garcia, F.X. Geraldes, H. Guzman, C.<br />
Parker, and S.R. Smith. 1997. Studies on Caribbean coral bleaching, 1995-96. pp. 1: 673-678. In: Proceedings of the 8th<br />
International Coral Reef Symposium.<br />
Woodley, J. D., S. R. Smith, J. Garzón-Ferreira, K. Koltes, P. Alcolado, K. Bonair, D. Bone, K. Buchanan, P. Bush, K.<br />
de Mayer, J. R. García, P. Gayle, D. T. Gerace, F. X. Geraldes, E. Jordan-Dahlgreen, E. Knobbe, E. Klein, R. Laydoo,<br />
F. Losada, G. Ostrander, H. Oxenford, C. Parker, L.P. Pors, F. Ruiz-Rentería, J. Ryan, J. Tschirky and R. Varela. 1996.<br />
CARICOMP Monitoring of coral reefs. pp. 41-46. In: Proceedings of the 8th International Coral Reef Symosium. CARI-<br />
COMP Data Management Center, Centre for <strong>Marine</strong> Sciences, University of the West Indies, Mona, Kingston, Jamaica.
The State of Coral Reef Ecosystems of Navassa Island<br />
Margaret Miller 1 , Joseph Schwagerl 2 , David McClellan 1 , Mark Vermeij 1,3 , Dana Williams 1,3<br />
INTRODUCTION AND SETTING<br />
Navassa Island is a small, uninhabited, oceanic island approximately 50 km off the southwest tip of Haiti (Figure<br />
6.1). It is under the jurisdiction of the U.S. Fish and Wildlife Service (USFWS) as one component of the<br />
Caribbean Islands National Wildlife Refuge (NWR). Based on some preliminary quantitative surveys in 2000,<br />
and because of its isolated and uninhabited status, Navassa has been presumed to provide a relatively pristine<br />
end member for reef status in the Caribbean (Miller and Gerstner, 2002). Local land-based anthropogenic<br />
pollution and recreational uses are essentially absent. Thus, Navassa reefs may provide valuable insight<br />
regarding Caribbean coral reef structure and function. However, there is substantial but unquantified fishing<br />
activity at Navassa by transient Haitians and their impact has been suggested to be substantial (Collette et al.,<br />
2003) and potentially rapidly increasing (Miller and Gerstner, 2002).<br />
Navassa is a raised dolomite plateau ringed by vertical cliffs. For most of the Island’s circumference, these<br />
cliffs reach straight down to approximately 25 m depth where a submarine terrace slopes out gradually. In<br />
limited areas around the northwest point and at Lulu Bay, the island has small shoulders of shallow reef habitat<br />
(10-15 m). The primary reef habitats are: 1) reef walls (formed by the cliffs); 2) large boulders that have<br />
been dislodged from the cliffs; 3) scattered patch reefs and hardbottom areas on the 25-30 m terrace; and 4)<br />
deeper reef slopes (>30 m) farther offshore that have not been well described. Navassa’s oceanic position in<br />
the Windward Passage exposes it to substantial physical energy. The East Coast bears the brunt of persistent<br />
swells and regular storms and hurricanes. The Island does not exhibit typical Caribbean patterns of reef<br />
zonation; inshore and backreef habitats including mangroves, sandy beaches, and seagrasses (important in<br />
the life history of several reef fish groups) are largely absent at Navassa.<br />
Despite its status as a NWR, regulations are currently not enforced and fishing activity is unmanaged with no<br />
quantitative catch or effort data available. Substantial fishing activities are, however, undertaken by transient<br />
Haitian subsistence fishers and appear to have been ongoing since at least the 1970s. Qualitative observations<br />
suggest that rapid depletion of Navassa fishery resources is underway.<br />
1 NOAA Fisheries, Southeast Fisheries Science Center, Miami, Florida<br />
2 U.S. Fish and Wildlife Service, Caribbean Islands National Wildlife Refuge, Boqueron, Puerto Rico<br />
3 University of Miami, Cooperative Institute for <strong>Marine</strong> and Atmospheric Science, Miami, Florida<br />
Navassa<br />
Sidebar<br />
page<br />
135
Navassa<br />
page<br />
136<br />
The State of Coral Reef Ecosystems of Navassa<br />
Figure 6.1. A map of Navassa Island showing locations referenced in this chapter. Map: A. Shapiro.<br />
ENVIRONMENTAL AND ANTHROPOGENIC STRESSORS<br />
Climate Change and Coral Bleaching<br />
No historic observations are available that are suitable for the evaluation of effects of climate change or episodes<br />
of coral bleaching. Much of the high coral-cover habitat, however, is in deep (18-30 m) waters exposed<br />
to strong currents and surge. This may provide some protection from elevated water temperatures.<br />
Diseases<br />
No diseased corals were noted in quantitative surveys that observed a total of 985 colonies at six shallow-water<br />
sites (
Tropical Storms<br />
Navassa’s oceanic position in the<br />
Windward Passage exposes it to<br />
substantial physical energy. The East<br />
Coast, in particular, bares the brunt<br />
of persistent swells, regular storms,<br />
and occasional hurricanes (Figure<br />
6.2). However, no quantitative studies<br />
have been done on the effects of<br />
a particular storm.<br />
The State of Coral Reef Ecosystems of Navassa<br />
Figure 6.2. The path and intensity of hurricanes passing near Navassa Island. Year<br />
of storm, Hurricane name and storm strength on the Saffir-Simpson scale (H1-5) are<br />
indicated for each. Map: A. Shapiro. Source: NOAA Coastal Services Center.<br />
Coastal Development and Runoff<br />
Navassa is uninhabited, although Haitian squatters frequent the Island. With the exception of an old abandoned<br />
lighthouse building and cistern, there is no development on Navassa. Approximately 200 acres were<br />
burned in 2000 by transient Haitians and 5-7 acres were planted in corn, squash, and watermelon. Native<br />
vegetation is not fire adapted, so recovery rates are very slow.<br />
Though there is no activity presently, there was an active terrestrial mining operation (guano and/or other<br />
phosphorus-rich deposits) on Navassa from the late 1800s through the turn of the century. The Navassa<br />
Phosphate Company acquired the Island in 1864 and invested $50,000 to establish a small town which had<br />
grown to include two dozen small buildings by 1889, although none remain today. It was estimated that one<br />
million tons of phosphate-bearing materials were removed from the Island by the mining operations subsequent<br />
to burning and vegetation removal to facilitate access to the mined material.<br />
Coastal Pollution<br />
Navassa is uninhabited.<br />
Tourism and Recreation<br />
There is no tourism or recreational use at Navassa. A Special Use Permit from the USFWS is required for<br />
entry.<br />
Navassa<br />
Sidebar<br />
page<br />
137
Navassa<br />
page<br />
138<br />
The State of Coral Reef Ecosystems of Navassa<br />
Fishing<br />
Despite its status as a NWR, fisheries at Navassa are effectively unmanaged as regulations are not well publicized<br />
and enforcement is nonexistent. Fishing activities are undertaken by migrant Haitian artisanal fishers,<br />
and these activities have been ongoing since at least the 1970s. Anecdotal evidence suggests that some<br />
technological escalation in Navassa fisheries occurred between 1997 and 2000. While no motors were observed<br />
in 1997, all of the vessels observed during the 2000 expedition had 10-15 h.p. motors. Quantification<br />
of catch or effort has not been undertaken for the Navassa fisheries, although deliberate qualitative observations<br />
were made during scientific expeditions in April 2000 (Miller and Gerstner, 2002) and November 2002<br />
(Miller et al., 2003).<br />
Fishing boats observed were wooden, 6-9 m in length, and manned by three to six fishers (Figure 6.3). In<br />
2000, hook-and-line and Antillean Z-traps were observed whereas in 2002, the additional use of nets was observed.<br />
The adoption of net fishing corresponded with exploitation of new species, particularly queen conch<br />
(Strombus gigas) and Hawksbill sea turtles (Eretmchelys imbricata). Finfish catch appeared unselective and<br />
included predominantly small (
<strong>Marine</strong> Debris<br />
There is a small amount of marine<br />
debris (large tanks, metal debris)<br />
leftover from earlier mining activities<br />
on the Island (Figure 6.5) as well as<br />
from more recent fishing activities at<br />
Lulu Bay, the only landing site on the<br />
island. It is not known to what extent<br />
fish traps are lost and continue “ghost<br />
fishing” or are broken up, as no comprehensive<br />
survey of the mid-depth<br />
shelf (25-35 m) has been made.<br />
Whatever debris is present is likely to<br />
impose relatively large impacts given<br />
Navassa’s high-energy environment<br />
and frequent exposure to storms.<br />
Aquatic Invasive Species<br />
No aquatic invasive species are<br />
known to occur at Navassa.<br />
Security Training Activities<br />
No military activities are undertaken at Navassa.<br />
Offshore Oil and Gas Exploration<br />
No oil and gas exploration activities occur at Navassa.<br />
The State of Coral Reef Ecosystems of Navassa<br />
Figure 6.5. Debris remains of a former mining operation, circa 1900. Photo: D. Mc-<br />
Clellan.<br />
Navassa<br />
Sidebar<br />
page<br />
139
Navassa<br />
page<br />
140<br />
The State of Coral Reef Ecosystems of Navassa<br />
<strong>CORAL</strong> <strong>REEF</strong> ECOSYSTEM MONITORING EFFORTS AND RESOURCE CONDITION<br />
Description of Local Coral Reef Monitoring Programs<br />
There is no formal reef monitoring program for Navassa. The only quantitative reef status information available<br />
for Navassa has been obtained on individual cruises. Specifically, a cruise in April 2000 funded by the<br />
Center for <strong>Marine</strong> Conservation (now the Ocean Conservancy) in partnership with the John G. Shedd Aquarium,<br />
National Oceanic and Atmospheric Administration (NOAA) Fisheries, USFWS, and academic researchers<br />
focused on building a taxonomic inventory and conducting some limited reef assessments. More extensive<br />
assessments (as reported here) were performed in October and November 2002 during a cruise funded by<br />
NOAA Fisheries Southeast Fisheries Science Center, in partnership with U.S. Fish and Wildlife Service and<br />
academic researchers (Miller, 2003). The extent of data obtained in the 2002 cruise was greatly enhanced by<br />
the availability of nitrox diving (i.e., using a gas mixture different from compressed air) which allows extended<br />
bottom times for work in the mid- and deep-shelf habitats around Navassa (Figure 6.6).<br />
Figure 6.6. A map of the monitoring locations visited during recent scientific expeditions to Navassa. Map: A. Shapiro.
The State of Coral Reef Ecosystems of Navassa<br />
WATER QUALITY<br />
There is neither data nor targeted<br />
monitoring regarding water quality at<br />
Navassa. Qualitatively, Navassa’s<br />
oceanic position appears to afford it<br />
extremely high water clarity as well<br />
as strong currents and swells. Zooplankton<br />
density sampled in November<br />
2002 was substantially lower than<br />
that measured in other Caribbean<br />
reef areas (Sandin, 2003). Also, a<br />
few targeted water samples taken in<br />
and around a small underwater cave<br />
during the April 2000 cruise suggested<br />
that at least some natural high<br />
nutrient input, perhaps a groundwater<br />
seep, was occurring on Navassa<br />
reefs (Figure 6.7). Figure 6.7. Dissolved inorganic nutrient concentrations (note log scale) in and adjacent<br />
to a cave along the western cliff of Navassa measured in 2000. Number of<br />
replicate analyses given in bars. Source: M. Miller, unpublished data.<br />
BENTHIC HABITATS<br />
Methods<br />
Standard line intercept transects (15 m x one point sampled each 15 cm) were primarily used to estimate<br />
cover of primary community components (scleractinian corals, macroalgae, octocorals, sponges). In addition,<br />
a 1 m swath around this transect was used to estimate size and condition of coral colonies (diameter,<br />
height, presence of predators, disease, competitive damage) (Miller et al., 2003). Special attention was paid<br />
to crustose coralline algae and voucher specimens were collected for species level identification (Begin and<br />
Steneck, 2003). In deeper habitats (>20 m) where in situ transect sampling was not feasible due to bottom<br />
time constraints, ten haphazard 1 m 2 photo quadrats were taken and percent cover was later analyzed by<br />
superimposing dots on the image.<br />
During the 2002 cruise, permanent monitoring quadrats were established to quantify scleractinian recruitment<br />
and survivorship. At each of two sites (15 m and 20 m depth), 15 1 m 2 permanent quadrats were marked with<br />
stakes and numbered tags. Photographs and in situ maps were made to indicate location of juvenile corals<br />
within quadrats. The in situ maps were used to annotate the photographs that will be used in subsequent<br />
surveys to assess persistence and growth of individual colonies.<br />
Lastly, settlement plates (15 x 15 cm) were deployed (as part of a Caribbean-wide study by R. Steneck) to<br />
examine coral settlement in relation to colonization by crustose coralline algae.<br />
Results and Discussion<br />
The 2002 assessment included extensive survey of deeper shelf reef habitats (20-30 m). The percent cover<br />
by the dominant benthic groups for all sites is given in Figure 6.8.<br />
Macroalgae (predominantly Lobophora variegata and Dictyota spp.) comprise the dominant benthic group<br />
overall, and a breakdown by genus is provided in Table 6.1. At several sites, however, (e.g., shallow shelf at<br />
Lulu Bay and several deep patch reefs), live coral cover was equal to or exceeded the cover of macroalgae.<br />
Live coral cover was highest (up to 46%) at the deep sites (25-30 m) including patch reefs and one site on the<br />
deep southwest dropoff. In shallower habitats (10-20 m), live coral cover was in the range of 10-20%. Live<br />
coral less than 10% (coinciding with extremely high macroalgal cover) was observed in sites with apparently<br />
intense disturbance regimes, including the East Coast; apparently scoured deep hardbottom habitats; and the<br />
“avalanche zone” observed at the North Shelf.<br />
Navassa<br />
Sidebar<br />
page<br />
141
Navassa<br />
page<br />
142<br />
The State of Coral Reef Ecosystems of Navassa<br />
Figure 6.8. Lower panel: Community composition for all sites surveyed at Navassa in November 2002. Sites along the bottom axis<br />
with asterisk were surveyed by haphazard photo quadrats (n=8-15); others were surveyed in situ via point intercept transects (n=2-4<br />
per site). Algal turfs were not resolvable from photographs. The “avalanche zone” is located on the north shelf, but is treated as a<br />
different habitat due to the level of disturbance. “Calves” are blocks of fallen rock from sea cliffs. Categories along the bottom axis<br />
indicate a priori habitat type classified according to depth and topography. Upper panel: Comparison with sites that were surveyed in<br />
April 2000. Source: Miller et al., 2003.
The State of Coral Reef Ecosystems of Navassa<br />
Table 6.1. Mean ± one standard deviation (SD) percent cover by genus for macroalgae at the six sites sampled by in situ line intercept<br />
transects. The first three sites are deeper sites (~20 m) while the last three sites are shallow reefs (25 m) sampled via photo<br />
quadrats. Source: Miller et al., 2003.<br />
Navassa<br />
Sidebar<br />
page<br />
143
Navassa<br />
page<br />
144<br />
The State of Coral Reef Ecosystems of Navassa<br />
Table 6.2. Percent of scleractinian coral colonies (>4 cm diameter) surveyed at subset of shallow sites (
The State of Coral Reef Ecosystems of Navassa<br />
column of water above the quadrat. Fast-moving fish were counted individually, noting species identity and<br />
length estimate. Lengths of fish were converted into biomass estimates based on published length-mass relations<br />
(available online at http://www.fishbase.org). The simple allometric function M = αL β was used, where M<br />
is the mass of the fish, L represents fish standard length, and β and α are species-specific constants. Although<br />
this functional form is not ideal for estimating all size classes of a fish species, it provides an efficient sizespecific<br />
mass scaling for this analysis. For species lacking specific allometric constants, parameters from a<br />
closely related, similarly shaped species were used. Final quadrat biomass estimates were calculated as the<br />
sum of all site-attached fish plus one third of the biomass of each fish counted in each of the three transient<br />
fish counts. The transient fish mass estimates thus were averaged across the three replicate scan samples.<br />
Fish densities and size-frequency distributions were equivalently computed as this weighted sum of resident<br />
and transient fish. This technique minimizes the overrepresentation of mobile species in long duration counts,<br />
yet still allows a reasonably efficient means to account for all types of fish on the reef.<br />
Density of the long-spined sea urchin, Diadema antillarum, was quantitatively sampled in benthic transects<br />
described above. Lastly, population structure (size structure and sex ratio) of the corallivorous snail, Coralliophila<br />
abbreviata, was described based on animals collected haphazardly from a range of host coral species.<br />
Results and Discussion<br />
Navassa reef fish assemblages were numerically dominated by planktivores, which comprised 71% of all individual<br />
fishes in both census methods, and large size fish were virtually absent from the population structure<br />
of all species. This expedition added an additional 35 fish species to the 237 Navassa Island fish species<br />
reported by Collette et al. (2003).<br />
One hundred and ten RVC samples were collected from around the Island (McClellan and Miller, 2003), and<br />
because of depth and bottom time constraints, only two samples could be taken per site. A total of 20,901<br />
fishes representing 110 (and one unidentified) species (45 families) were recorded from these 110 stationary<br />
samples. The most abundant fish species, comprising 59.1% of the total number, were the blue chromis Chromis<br />
cyanea (n=4,912), creole wrasse Clepticus parrae (n=3,050), bluehead wrasse Thalassoma bifasciatum<br />
(n=2,950), and bicolor damselfish Stegastes partitus (n=1,449). Species with the highest frequency of occurrence<br />
from all of the samples were the blue tang Acanthurus coeruleus (88.2%), followed by the princess parrotfish<br />
Scarus taeniopterus (86.4%), redband parrotfish Sparisoma aurofrenatum (86.4%), bluehead wrasse<br />
(86.4%), bicolor damselfish (86.4%), and black durgon Melichthys niger (80.9%).<br />
Only 12 individuals of larger grouper<br />
species (Graysby, red hind, yellowmouth,<br />
yellowedge, and tiger; no<br />
Nassau) were observed and 109 individuals<br />
of commercially important<br />
snappers were counted (8.6% of total<br />
biomass). Average size and density<br />
of grouper, snapper, and parrotfishes<br />
were substantially less in the more extensive<br />
2002 survey than observed in<br />
2000 at a subset of shallower habitats<br />
(Miller and Gerstner, 2002). Average<br />
length in the exploitable phase (>12<br />
cm) of several fish families is given<br />
in Figure 6.10. Based on the second<br />
fish survey technique (weighted<br />
surveys of 37 5 x 2 m plots, Sandin,<br />
2003), it was estimated that overall<br />
reef fish density was 5.6 ± 0.4 m 2 and<br />
overall fish biomass was 49.3 ± 4.6<br />
Figure 6.10. Mean lengths of selected families (in exploitable phase) observed in<br />
RVC samples. Family groups do not include individuals
Navassa<br />
page<br />
146<br />
The State of Coral Reef Ecosystems of Navassa<br />
g/m 2 . For comparison, sampling via the same method in the Netherlands Antilles yielded biomass estimates<br />
ranging from 114-185 g/m 2 on heavily fished reefs.<br />
Within the censused quadrats, most fish were planktivores (70.8%), followed distantly by herbivores (17.8%).<br />
The remaining trophic groups each accounted for less than 5% of the community density. In units of biomass,<br />
planktivores were the dominant contributors to reef community (36.3%). Piscivores and herbivores were<br />
the next most massive guilds (28.9%<br />
and 24.7%, respectively). Browsers<br />
composed 7.8% of community mass,<br />
and the two groups of invertebrate<br />
feeders each composed less than<br />
2% of the total biomass (Figure 6.11).<br />
Guild-specific length-frequency distributions<br />
help to reconcile the disparity<br />
between guild contributions to<br />
density and biomass (Figure 6.12).<br />
Across all sampled fish, the average<br />
total length (TL) was 4.6 cm and only<br />
11 individual fish (of the 1,227 counted<br />
in this approach) were larger than<br />
24 cm standard length. Microinvertivores,<br />
planktivores, and macroinvertivores<br />
were each smaller than the<br />
community mean, averaging 3.5, 4.1,<br />
and 4.1 cm TL, respectively. Herbivores,<br />
browsers, and piscivores were<br />
each larger than the overall mean<br />
length (5.1, 8.6, and 17.7 cm TL respectively).<br />
Quantitative transect surveys of Diadema<br />
antillarum at three shallow<br />
sites (7-10 m) and three mid-depth<br />
sites (17-25 m) showed they were<br />
present at mid-depth (0.16 ± 0.24 m 2 )<br />
and much rarer in the shallow reefs<br />
(0.02 ± 0.02 m 2 ; Begin and Steneck<br />
2003). A total of 18 D. antillarum<br />
were observed in the 110 five-minute<br />
RVC surveys across all habitat types<br />
(McClellan and Miller, 2003).<br />
Figure 6.11. Diurnal fish biomass across trophic guilds. Averages and standard error<br />
(SE) were calculated from 37 10 m 2 quadrats. Fish were partitioned into trophic guilds<br />
based on the dominant food items consumed by adults. Source: Sandin, 2003.<br />
Figure 6.12. Fish community size frequency distribution observed via the weighted<br />
biomass surveys. Source: Sandin, 2003.
The State of Coral Reef Ecosystems of Navassa<br />
Table 6.3. Survey of the corallivorous snail, Coralliophila abbreviata, and its host corals: Agaricia spp., Montastraea annularis complex,<br />
and Diploria spp. from six sites around Navassa. Group size indicates the mean number of snails per colony. Source: Williams<br />
and Miller, 2003.<br />
Agaricia spp.<br />
Montastraea annularis<br />
Diploria spp.<br />
SITE TOTAL # HOST<br />
COLONIES (A)<br />
Corallivorous snails, Coralliophila abbreviata, were found on Agaricia spp., Montastraea spp., and Diploria<br />
spp. to different degrees (Table 6.3) along transects in the shallower sites (
Navassa<br />
page<br />
148<br />
The State of Coral Reef Ecosystems of Navassa<br />
CURRENT CONSERVATION MANAGEMENT ACTIVITIES<br />
Navassa Island and a 12-mile radius of marine habitat became the 517 th NWR on April 22, 1999. Navassa is<br />
one of nine NWRs administered by the USFWS as part of the Caribbean Islands NWR complex and the only<br />
refuge encompassing marine habitat. The Refuge complex will begin comprehensive conservation planning<br />
in 2004 to produce a 15-year management plan for each refuge including Navassa. The planning process will<br />
be open to public participation and comment. Thus, while Navassa does not yet have an official management<br />
plan, annual expeditions to the Refuge have produced a substantial amount of biological information which will<br />
serve as the framework for the management plan.<br />
Six expeditions have been made to the Island to date including two land-based trips. These trips concentrated<br />
on inventory and documentation of the flora and fauna of the Island and the establishment of vegetation monitoring<br />
plots. Hunting and camping on the Island by transient Haitian fishermen have led to frequent wildfires<br />
which have been detrimental to the maintenance of forest habitat necessary for migratory songbirds and nesting<br />
seabirds.<br />
The four marine expeditions to date have involved partners including NOAA Fisheries, U.S. Geological Survey,<br />
Ocean Conservancy, Shedd Aquarium, American Museum of Natural History, Smithsonian Institution’s<br />
National Museum of Natural History, and various universities. Permanent transects have now been established<br />
around the Island to monitor changes in invertebrate and coral abundance and diversity.<br />
Fishing pressure involving hand lines and traps by transient Haitians has been a concern since 1998. General<br />
observations have led to additional questions and further assessment and quantification is needed. The logistical<br />
difficulties involved in visiting the Island, language barriers, and international politics are all management<br />
handicaps. The USFWS has been fortunate to have so many dedicated partners who have facilitated trips to<br />
the Refuge and have contributed much of the research effort. It is hoped that annual expeditions to the Refuge<br />
will continue and that additional partners, including Haitian nationals, will be recruited.<br />
OVERALL CONCLUSIONS AND RECOMMENDATIONS<br />
Navassa Island NWR encompasses approximately 290,000 acres of marine habitat in the heart of the Caribbean.<br />
Declining coral reef habitat conditions throughout the Caribbean underscores the conservation importance<br />
of this Refuge’s marine ecosystem. Multinational fishing pressure within this largely marine refuge<br />
remains unquantified, but certain. Continuous heavy fishing pressure in the immediate vicinity of the Island<br />
appears to be having deleterious effects on coral reef ecosystems. Immediate implementation of systematic<br />
monitoring is needed to document ongoing changes. Of particular importance is the collection of quantitative<br />
fishery data including catch and effort information. This effort needs to include catch of the critically endangered<br />
Hawksbill sea turtles. Regular funding for the Navassa Island NWR is necessary for the accomplishment<br />
of this critical conservation effort.<br />
While fishing is clearing having a strong impact on Navassa reef ecosystems, Navassa’s small size and high<br />
physical disturbance regime imply that its communities will show strong temporal variation. The interpretation<br />
of “snapshot” surveys of reef condition is problematic and therefore subsequent periodic surveys must be<br />
undertaken at Navassa in order to draw meaningful conclusions regarding possible trends in reef condition.
REFERENCES<br />
The State of Coral Reef Ecosystems of Navassa<br />
Ault, J.S., J.A. Bohnsack and G.A. Meester. 1998. A retropsective (1979-1996) multispecies assessment of coral reef fish<br />
stocks in the Florida Keys. Fisheries Bulletin 96: 395-414.<br />
Ault, J.S., S.G. Smith, G.A. Meester, J. Luo, and J.A. Bohnsack. 2001. Site characterization for Biscayne National Park:<br />
assessment of fisheries resources and habitats. NOAA Technical Memorandum NMFS-SEFSC-468. 185 pp.<br />
Ault, J.S., S.G. Smith, G.A. Meester, J. Luo, J.A. Bohnsack, and S.L. Miller. 2002. Baseline multispecies coral reef fish<br />
stock assessments for the Dry Tortugas. NOAA Technical Memorandum NMFS-SEFSC-487. 117 pp.<br />
Baums, I.B. 2004. Genetic Status of the Caribbean Reef Building Coral, Acropora palmata. Ph.D. Dissertation for the<br />
University of Miami.<br />
Baums, I.B., M.W. Miller, and A.M. Szmant. 2003. Ecology of a corallivorous gastropod, Coralliophila abbreviata, on two<br />
scleractinian hosts I: population structure of snails and corals. <strong>Marine</strong> Biology 142: 1083-1091.<br />
Begin, C. and R.S. Steneck. 2003. Crustose coralline algae and juvenile scleractinian corals of Navassa. pp. 57-65 In:<br />
Status of reefs of Navassa Island. NOAA Technical Memorandum NMFS-SEFSC-501.<br />
Bohnsack, J.A. and S.P. Bannerot. 1986. A stationary visual census technique for quantitatively assessing community<br />
structure of coral reef fishes. National Oceanic and Atmospheric Administration Technical Report 41. 15 pp.<br />
Bruckner, R.J., A.W. Bruckner, and E.H. Williams, Jr. 1997. Life History Strategies of Coralliophila abbreviata Lamark<br />
(Gastropoda: Coralliophillidae) on the southwest coast of Puerto Rico. pp. 1: 627 – 632. In: Proceddings, 8th International<br />
Coral Reef Symposium.<br />
Collette, B.B., J.T. Williams, C.E. Thacker, and M.L. Smith. 2003. Shore fishes of Navassa Island: a case study on the<br />
need for rotenone sampling in reef fish biodiversity studies. AQUA: Journal of Ichthyology and Aquatic Biology 6 (3): 89-<br />
131.<br />
McClellan, D.B. and G.M. Miller. 2003. Reef Fish Abundance, Biomass, Species Composition, and Habitat Characterization<br />
of Navassa Island. pp. 24 – 42. In: M.W. Miller (ed.) Status of reefs of Navassa Island. National Oceanic and Atmospheric<br />
Administration Technical Memorandum NMFS-SEFSC-501.<br />
Miller, M.W. (ed.) 2003. Status of reefs of Navassa Island, Nov 2003. National Oceanic and Atmospheric Administration<br />
Technical Memorandum NMFS-SEFSC-501.<br />
Miller, M.W. and C.L. Gerstner. 2002. Reefs of an uninhabited Caribbean island: fishes, benthic habitat, and opportunities<br />
to discern reef fishery impact. Biological Conservation 106: 37-44.<br />
Miller, M.W., D.B. McClellan, and C. Begin. 2003. Observations on fisheries activities at Navassa Island. <strong>Marine</strong> Fisheries<br />
Review 65: 43-49.<br />
Miller, M.W., M.J.A. Vermeij, D.E. Williams, D.B. McClellan and B. Yoshioka. 2003. Benthic Habitats and Community<br />
Structure. pp. 6-23. In: M.W. Miller (ed.) Status of reefs of Navassa Island. National Oceanic and Atmospheric Administration<br />
Technical Memorandum NMFS-SEFSC-501.<br />
Sandin, S.A. 2003. Reef fish trophic analysis from Navassa Island: Exploring biotic and anthropogenic factors. pp. 43-<br />
56. In: M.W. Miller (ed.) Status of reefs of Navassa Island. National Oceanic and Atmospheric Administration Technical<br />
Memorandum NMFS-SEFSC-501.<br />
Williams, D.E. 2003. Symbiont-bearing foraminifera of Navassa Island. pp: 84-89. In: M.W. Miller (ed.) Status of reefs of<br />
Navassa Island. National Oceanic and Atmospheric Administration Technical Memorandum NMFS-SEFSC-501.<br />
Williams, D.E. and M.W. Miller. 2003. Population demographics of the corallivorous snail Coralliophila abbreviata from<br />
Navassa Island. pp.75-83 In: M.W. Miller (ed.) Status of reefs of Navassa Island. National Oceanic and Atmospheric Administration<br />
Technical Memorandum NMFS-SEFSC-501.<br />
Navassa<br />
Sidebar<br />
page<br />
149
Florida<br />
page<br />
150<br />
The State of Coral Reef Ecosystems of Florida<br />
Edited by:<br />
Katherine Andrews 1 , Larry Nall 1 , Chris Jeffrey 2 , Simon Pittman 2<br />
Contributing Authors:<br />
Ken Banks 3 , Carl Beaver 4 , James Bohnsack 5 , Richard E. Dodge 6,7 , David Gilliam 6,7 , Walt Jaap 4 , Brian Keller 8 , V. Robert<br />
Leeworthy 9 , Tom Matthews 4 , Ramon Ruiz-Carus 4 , Deborah Santavy 10 , Richard Spieler 6,7<br />
Other Contributors:<br />
Jerald Ault 11 , Gabriel Delgado 4 , Fleur Ferro 8 , Carol R. Fretwell 7 , Bill Goodwin 8 , Doug Harper 5 , John Hunt 4 , Margaret<br />
Miller 5 , Christy Pattengil-Semmens 12 , Bill Sharp 4 , Steve Smith 11 , Jennifer Wheaton 4 , Dana Williams 5<br />
INTRODUCTION AND SETTING<br />
Florida is located at the convergence of the subtropical and temperate climate zones (Chen and Gerber,<br />
1990). The Gulfstream (a warm-water boundary current) has a major influence on water temperature and the<br />
transport of flora and fauna to the region (Jaap and Hallock, 1990). The Gulfstream intrudes into the Gulf of<br />
Mexico as the Loop Current and reverses flow to return to the Straits of Florida, joining the main body of the<br />
Florida Current before flowing in a northeasterly direction towards Europe. The influence of the Gulfstream<br />
together with the presence of a broad-shallow continental shelf around Florida and the absence of any major<br />
rivers have provided conditions for the development of extensive coral reefs (Figure 7.1). Most coral reefs are<br />
found in water less than 18 m deep. Rohmann et al. (in press) have estimated that 30,801 km 2 of shallowwater<br />
inshore areas around Florida could potentially support coral reef ecosystems. In comparison, the area<br />
estimated was 16.4 km 2 in Guam, 1,231.4 km 2 in the Main Hawaiian Islands and 2,207.6 km 2 in Puerto Rico.<br />
Florida Reef Tract<br />
The Florida Reef Tract, which extends from Soldier Key to Tortugas Banks, has coral reef characteristics similar<br />
to many areas in the Bahamas and Caribbean Basin (Vaughan, 1914). The undeveloped coastal fringe<br />
includes extensive mangrove forests and a mosaic of exposed rock and sediments. Elevated rock formations<br />
support coral reef development and the sediments support the most extensive seagrass beds in the world<br />
(Fourqurean et al., 2002).<br />
Three types of coral reef habitats found in the Florida Keys are hardbottom, patch reefs, and bank reefs (Table<br />
7.1). Hardbottom or live bottom habitat is the most extensive habitat type, found at a wide range of water<br />
depths and characterized by rock colonized with calcifying algae (e.g., Halimeda spp.), sponges, octocorals,<br />
and several species of stony coral. Local environmental conditions determine the composition of the communities<br />
that colonize the rock. Patch reefs typically consist of massive stony corals, with the boulder star coral<br />
(Montastraea annularis) being most dominant. Other common foundation-building species include Colpophyllia<br />
natans and Siderastrea siderea. Patch reefs are concentrated in north Key Largo, Hawk Channel between<br />
Marathon Key and Key West, and the area off Elliott Key. Species diversity and richness of stony corals are<br />
highest in patch reef habitats (Jaap et al., 2003). Bank reefs are the most seaward of coral reef habitats in<br />
the Florida Keys coastal ecosystem and are frequently visited by recreational scuba divers and snorkelers.<br />
Their principal unique feature is the spur-and-groove system, a series of ridges and channels built primarily by<br />
elkhorn coral (Acropora palmata) (Shinn, 1963). Spur-and-groove systems occur in depths ranging from a few<br />
centimeters to 10 m. In deeper waters, spur-and-groove formations may continue seaward as very low relief<br />
structures. Often, this type of habitat is referred to as the forereef and may continue to about 30 m in depth.<br />
Seaward, sediments separate the fore-reef from deeper reef formations at a depth of about 40 m.<br />
1 Florida Department of Environmental Protection<br />
2 NOAA, Center for Coastal Monitoring and Assessment, Biogeography Team<br />
3 Broward County Environmental Protection Department<br />
4 Florida Fish and Wildlife Conservation Commission<br />
5 NOAA Fisheries, Southeast Fisheries Science Center<br />
6 Nova Southeastern University Oceanographic Center<br />
7 National Coral Reef Institute<br />
8 Florida Keys National <strong>Marine</strong> Sanctuary<br />
9 NOAA Ocean Service, Special Projects Office<br />
10 U.S. Environmental Protection Agency, Gulf Ecology Division<br />
11 University of Miami, Rosenstiel School of <strong>Marine</strong> and Atmospheric Sciences<br />
12 Reef Environmental Education Foundation
Figure 7.1. Locator map for Florida. Map: A. Shapiro.<br />
The State of Coral Reef Ecosystems of Florida<br />
Tortugas Banks<br />
The Tortugas Banks are coral reefs that developed on a foundation of Pleistocene karst limestone at depths of<br />
20-40 m. The banks are extensive with low coral diversity, but high coral cover. The most conspicuous coral<br />
is Montastraea cavernosa, and black coral (Antipatharia) are common on the outer bank edges. The banks<br />
are also used by groupers and snappers that support a major fishery.<br />
Florida<br />
Sidebar<br />
page<br />
151
Florida<br />
page<br />
152<br />
The State of Coral Reef Ecosystems of Florida<br />
The Southeastern Coast<br />
This reef system continues the Florida<br />
reef tract northwards and runs from<br />
northern Monroe County to Martin<br />
County in a series of discontinuous<br />
reefs paralleling the shore. Duane<br />
and Meisberger (1969) and Goldberg<br />
(1973) defined the habitat including<br />
corals at several locations. Moyer et<br />
al. (2003) investigated the ecological<br />
and spatial patterns of the benthos<br />
on various reefs of Southeast Florida<br />
(Broward County; Figure 7.2).<br />
In addition to nearshore hardbottom<br />
areas, there are generally three lines<br />
of reef – one that nominally crests in<br />
3-4 m of water (inner reef), another in<br />
6-8 m (middle reef), and a third in 15-<br />
21 m (outer reef). A series of ridges<br />
that are not reefal in origin occur on<br />
the shoreward side of inner reef areas<br />
(Moyer et al., 2003).<br />
Inner reefs are characterized by mac-<br />
Table 7.1. Habitat area estimates for the Florida Reef Tract. Source: FMRI 1998.<br />
TYPE <strong>OF</strong> <strong>REEF</strong> HABITAT HECTARES KM2 ACRES<br />
Hardbottom 82370 824 203540<br />
Patch Reef 3370 34 8330<br />
Bank Reef 29550 295 73010<br />
Total coral reef estimate 115290 1153 284880<br />
Seagrass 292520 2925 722840<br />
Figure 7.2. A reef profile along a shore-perpendicular transect of high resolution<br />
bathymetry data from 0-30m depth off central Broward County. The x-axis represents<br />
distance from shore in meters and y-axis represents elevation in meters. The seafloor<br />
of the profile is categorized in the sections below the profile line. The red line along<br />
the profile represents the three main shore-parallel reef tracts. Source: R. Dodge,<br />
National Coral Reef Institute, http://www.nova.edu/ocean/ncri/, Accessed 1/6/<strong>2005</strong>.<br />
roalgae and numerous small octocorals. The substrate is relict reef of Anastasia Formation limestone and<br />
worm reef (Phragmatopoma spp.), with breaks and sediment pockets within the reef. Typical sessile organisms<br />
are lesser starlet coral (Siderastrea radians) and colonial zoanthids (Palythoa mammilosa and P. caribaeorum).<br />
In the past few years, vigorous recruitment of staghorn coral (Acropora cervicornis) have occurred,<br />
and some extensive aggregations are now present generally inshore of inner reefs in Broward County. Here,<br />
monospecific stands of coral form significant habitats (Vargas-Ángel et al., 2003). Spawning activity has been<br />
documented in late July to early August (Vargas-Ángel and Thomas, 2002; Vargas-Ángel et al., in prep.).<br />
Middle reefs have more relief and dissecting channels. Octocorals are most conspicuous, with densities of<br />
more than 30 per m² in some areas. Abundant stony corals include great star coral (Montastraea cavernosa),<br />
massive starlet coral (Siderastrea siderea), and mustard hill coral (Porites astreoides) (Gilliam et al., 2003).<br />
The outer reef system often has stronger vertical relief and exhibits the highest diversity and abundance of<br />
sessile reef organisms. Octocorals and large barrel sponges (Xestospongia muta) are most conspicuous and<br />
visually dominate this reef. Stony corals are somewhat larger than those located on the middle reef. Moderate-sized<br />
colonies of star corals are common.<br />
The reef system at St. Lucie Inlet Preserve State Park (27°05´ to 27°09´ N) is the northern limit for subtropical<br />
coral reefs on the east coast of Florida. The topography is composed of Anastasia Formation limestone that<br />
is covered with reef biota. Diploria clivosa forms very large pancake-like colonies and provides the majority of<br />
the cover. Montastraea cavernosa also attains large sizes. The other species present - Siderastrea radians,<br />
Isophyllia sinuosa, Solenastrea bournoni, and Oculina diffusa - are not large. Stony corals accounted for 3-5%<br />
of benthic cover at two 100-m transects (Herren, 2004).
The State of Coral Reef Ecosystems of Florida<br />
ENVIRONMENTAL AND ANTHROPOGENIC STRESSORS<br />
Coral reefs in Florida face a number of different stressors. These include coral bleaching, diseases, water pollution,<br />
physical impacts (such as groundings, dredging activities, and beach renourishment), tropical storms,<br />
and winter cold fronts. Other stressors of less concern in Florida include national security activities and trade<br />
in coral species.<br />
Climate Change and Coral Bleaching<br />
Coral bleaching due to exceptionally high water temperatures has been reported in Florida since the early 20th<br />
century (Vaughan, 1911; Mayer, 1918). Jaap (1979, 1984) also reported coral bleaching events in the Lower<br />
Keys following late summer doldrums<br />
when water temperatures exceeded<br />
31ºC. Other significant and severe<br />
bleaching events on reefs throughout<br />
Florida occurred in 1987, 1990,<br />
and 1997-98 (Causey, 2001). These<br />
bleaching events have caused moderate<br />
mortality of the more sensitive<br />
stony corals, Millepora complanata<br />
and Agaricia agaricites. Bleaching<br />
episodes have become much more<br />
severe in space and time in the past<br />
few decades.<br />
Coral bleaching assessments were<br />
made during the 1998 global bleaching<br />
event by the U.S. Environmental<br />
Protection Agency’s (EPA) Gulf Ecology<br />
Division, in collaboration with the<br />
National Oceanic and Atmospheric<br />
Administration’s (NOAA) Florida Keys<br />
National <strong>Marine</strong> Sanctuary (FKNMS),<br />
<strong>Mote</strong> <strong>Marine</strong> <strong>Laboratory</strong>’s Center for<br />
Tropical Research, and University of<br />
Georgia. Surveys were conducted<br />
in the Florida Keys, with sites in the<br />
Lower Keys, New Grounds, and Dry<br />
Tortugas. Details of the sampling<br />
design, approach, and methods are<br />
described in Santavy et al. (2001).<br />
Bleaching was scored if greater than<br />
50% of a coral colony had translucent<br />
white tissue present. Every species<br />
recorded in this assessment was observed<br />
to be bleaching. At least 50%<br />
of the colonies of the species Acropora<br />
palmata, Diploria labyrinthiformis,<br />
D. strigosa, Colpophyllia natans,<br />
Mycetophyllia danaana and Montastraea<br />
cavernosa were over 50%<br />
bleached (Figure 7.3). Reefs in the<br />
Lower Keys exhibited the greatest<br />
bleaching (43% ± 5.7 SE) compared<br />
to reefs in the Dry Tortugas and New<br />
Figure 7.3. Mean percentage of coral colonies that were greater than 50% bleached<br />
identified by species assessed in September 1998 in the Lower Keys and the Dry<br />
Tortugas sites. Error bars represent 1 SE. X axis legend: Acer: Acropora cervicornis;<br />
Apal: A. palmata; Cnat: Colpophyllia natans; Dlab: Diploria labyrinthiformis; Dsto:<br />
Dichocoenia stokesii; Dstr: Diploria strigosa; Mann. Montastraea annularis; Mcav:<br />
Montastraea cavernosa; Mdan: Meandrina danae; Mfer: Mycetophyllia ferox; Past:<br />
Porites astreoides; Sbou: Solenastrea bournoni; Smic: Stephanocoenia michelinii;<br />
Ssid: Siderastrea siderea. Source: Santavy et al., 2001.<br />
Figure 7.4. Mean percentage of coral colonies that were greater than 50% bleached<br />
assessed in September 1998 in the Dry Tortugas, Lower Keys, and New Grounds.<br />
Error bars represent 1 SE. Source: Santavy et al., 2001.<br />
Florida<br />
Sidebar<br />
page<br />
153
Florida<br />
page<br />
154<br />
The State of Coral Reef Ecosystems of Florida<br />
Grounds (Figure 7.4). Shortly after the assessments, Hurricane Georges passed over Key West as a Class<br />
3 hurricane which caused substantial physical destruction. The stress from intense bleaching and Hurricane<br />
Georges was responsible for significant coral mortality that occurred between surveys in late summer 1998<br />
and late spring 1999. Detailed information concerning bleaching distributions are reported in Santavy et al.<br />
(2001).<br />
Disease<br />
Surveys conducted along the Florida Keys Reef Tract during 1998-2002 assessed coral diseases for several<br />
applications. The first application was to determine the frequency and distribution of coral condition, using<br />
coral disease as the indicator to determine the overall health of corals. This approach was applied during the<br />
2000 survey. The second application was to compare coral diseases between geographical regions in the<br />
Dry Tortugas, New Grounds, Key West region, Lower Keys, Middle Keys, and Upper Keys. Coral diseases<br />
were assessed by scientists from EPA’s Gulf Ecology Division, FKNMS, and <strong>Mote</strong> <strong>Marine</strong> <strong>Laboratory</strong>’s Center<br />
for Tropical Research. In general, diseases were most abundant in 1998, with observed changes in species<br />
composition which suggest that corals are increasingly dying and not recovering. In extreme cases, there has<br />
been almost complete deterioration of several keystone species, most notably Acropora palmata (Patterson<br />
et al., 2002). Although it is clear that new diseases are emerging at an accelerated rate, cause and effect<br />
relationships are not well documented. Coral health and diseases have not been critically or thoroughly characterized,<br />
and few baseline studies have been conducted in this region. More information about the results of<br />
coral disease studies can be found in the ‘Benthic Habitats’ section.<br />
Tropical Storms<br />
Storms are a normal part of the<br />
South Florida ecosystem because<br />
of the close proximity of Florida to<br />
the Caribbean Basin, where intense<br />
hurricanes develop seasonally. Hurricanes<br />
that have impacted Florida<br />
since 1979 are shown in Figure 7.5.<br />
Tropical storms can be a major force<br />
structuring coral reef communities<br />
through processes such as direct<br />
physical impact, increased terrestrial<br />
runoff, sedimentation, and pollution.<br />
For example, Hurricane Georges<br />
(1998) broke and reduced to rubble<br />
many large branching elkhorn and<br />
staghorn corals which were already<br />
weakened by disease (USGS, 1998;<br />
AOML, 1999). In 2004, various parts<br />
of Florida’s coastline were hit by four<br />
major hurricanes (Charley, Francis,<br />
Ivan, and Jeanne). Hurricane Charley<br />
caused moderate damage to coral<br />
reefs at Dry Tortugas and off Broward.<br />
For instance, at the northeast side of<br />
Loggerhead Key, a patch of Acropora<br />
cervicornis was broken into small<br />
pieces and washed inshore; however,<br />
a month later surviving fragments<br />
appeared healthy. On Bird Key Reef,<br />
many large coral formations were dislodged<br />
and abundance of benthic algae<br />
was drastically reduced on most<br />
Figure 7.5. The paths and intensities of hurricanes in Florida, 1979-2004. Year of<br />
storm, hurricane name and storm strength on the Saffir-Simpson scale (H1-5) are<br />
indicated for each. Map: A. Shapiro. Source: NOAA Coastal Services Center.
The State of Coral Reef Ecosystems of Florida<br />
of the reefs visited after the storm (W.C. Japp, pers. obs.). Hurricanes Francis and Jeanne caused damage<br />
to coral reefs off Palm Beach and Martin Counties (W.C. Japp, pers. obs.).<br />
Nevertheless, tropical storms may have beneficial effects on coral reef ecosystems off Florida’s southeast<br />
coastline. Florida Bay is very shallow (1 m), with a myriad of banks and shoals that quickly dissipate tidal exchanges<br />
and prevent regular flushing of the bay. Reduced tidal flushing has contributed to the accumulation<br />
of organic matter, sediments, and nutrients which promote phytoplankton blooms that decrease the amount<br />
of light available to seagrass beds (AOML, 1999). Increased storm surge and wave action from powerful hurricanes<br />
increase tidal flushing, reduce sedimentation and are thought to reduce phytoplankton blooms (AOML,<br />
1999). After Hurricane Georges (1998), however, water quality conditions were not significantly different than<br />
before because nutrient-enriched waters remained trapped within Florida Bay by broad, shallow banks in the<br />
central and western portions of the bay (AOML, 1999). Additionally, Lirman (2003) found that the abundance<br />
of A. palmata correlated positively with an increase in storm frequency from one storm every 15 years to one<br />
storm every two years, but declined with a further increase in storm frequency. Successful survivorship, reattachment,<br />
and growth of coral fragments after storm events may be the only means of propagation for A. palmata<br />
when sexual recruitment is limited (Lirman, 2003). However, the synergistic effects of multiple stressors<br />
(e.g., disease, coastal pollution, and overgrowth by algae) could prevent normal patterns of recovery in corals<br />
after storm events (USGS, 1998).<br />
Coastal Development and Runoff<br />
The reefs of mainland Southeast Florida, by virtue of their high latitude and proximity to shore, exist at the<br />
environmental extremes for corals. Natural phenomena, such as cold weather fronts; upwelling of cold, nutrient-rich<br />
waters; and freshwater runoff from land all contribute to “pushing the environmental limits” for corals<br />
and other reef-associated organisms. Anthropogenic activity that leads to a reduction in water quality may<br />
result in further physiological stress to corals and adversely impact coral reef ecosystems.<br />
Nonpoint sources of pollution include surface water runoff, storm water discharge, and groundwater seeps.<br />
The nonpoint-source pollution may be delivered to the reef directly, as in the case of runoff, through navigational<br />
inlets and passes, and through the porous limestone substrate underlying south Florida. Nutrient<br />
loading of nitrogen and phosphorus from inland agriculture to the coastal waters offshore of Palm Beach<br />
County (mainland Southeast Florida) via surface water discharge are 2,473 and 197 metric tons (mt) per year,<br />
respectively, and via submarine groundwater discharge are 5,727 and 414 (mt) per year, respectively (Finkl<br />
and Charlier, 2003; Finkl and Krupa, 2003). Studies have estimated that groundwater from the interior parts<br />
of South Florida can take five to eight decades to reach the nearshore zone (Finkl and Charlier, 2003). Furthermore,<br />
run-off from the Everglades via Florida Bay and the Keys has been found to impact water quality<br />
around the Keys (Boyer and Jones, 2002).<br />
Coastal Pollution<br />
The effects of coastal pollution on reef-associated communities are not entirely understood. One obvious impact,<br />
however, is an increase in the magnitude and persistence of macroalgal blooms, which have increased<br />
worldwide during the past several decades (Morand and Briand, 1996). There is evidence that blooms may<br />
be a result of nutrient loading from land-based sources (NRC, 2000). Lapointe (1997) and Lapointe and Barile<br />
(2001) linked nitrogen from land-based sewage to macroalgal blooms in Southeast Florida. In Southeast<br />
Florida, harmful macroalgal blooms have occurred extensively in the offshore waters of Palm Beach County<br />
during the past decade (Lapointe and Barile, 2003), and over the past two years the cyanobacterium (Lyngbya<br />
confervoides) has covered an extensive area of the middle reef tract offshore Broward County. These blooms<br />
have had a significant impact on reef-associated organisms (Lapointe, 1997). The impacts include smothering<br />
and resultant mortality, as well as substrates dominated by macroalgae that would naturally be colonized<br />
by other organisms, such as corals and sponges. Researchers in Barbados (Tomascik, 1991; Wittenberg<br />
and Hunte, 1992) reported decreased coral larval settlement on reefs in nutrient-rich waters. Other impacts<br />
of water pollution on reef communities include increased bioerosion rates (reviewed by Risk et al., 2001) and<br />
possible links to coral diseases. Patterson et al. (2002) identified the human fecal bacterium (Serratia marcescens)<br />
as the causal agent of white pox disease in corals in the Florida Keys, and Bruno et al. (2003) reported<br />
evidence of nutrient enrichment increasing the severity of disease in sea fans and some coral species.<br />
Florida<br />
Sidebar<br />
page<br />
155
Florida<br />
page<br />
156<br />
The State of Coral Reef Ecosystems of Florida<br />
An extensive water quality monitoring program for the Florida Keys and Florida Bay underway since 1995<br />
(Boyer and Jones, 2003) has reported elevated nitrogen levels in the nearshore areas of the Keys but not in<br />
the Tortugas region, suggesting a relationship with land-use patterns. No coastal water quality monitoring is<br />
underway for the mainland Southeast Florida region. There is a great need for such a monitoring program,<br />
particularly in light of the number of extensive macroalgal blooms that have occurred on mainland reefs in<br />
recent years. In addition to monitoring, further research to identify cause-and-effect relationships (i.e., water<br />
quality and reef community response) are needed.<br />
The most extensive program underway to reduce water pollution is the National Pollution Discharge Elimination<br />
System (NPDES), a Federal program to regulate pollution from point source and stormwater discharges<br />
into receiving waters. The NPDES program is mandated in the Federal Clean Water Act (33 U.S.C. § 1251<br />
et seq.) and is administered by the EPA and delegated to states, including Florida. Industrial, municipal, and<br />
other facilities must obtain permits if their discharges go directly to surface waters. Facilities discharging<br />
stormwater must meet appropriate treatment criteria and may not cause or contribute to a violation of water<br />
quality standards. The program has been effective in requiring many private small wastewater treatment<br />
plants to eliminate raw sewage discharges. All municipal wastewater treatment plants must attain minimum<br />
levels of effluent quality using secondary treatment, including facilities with ocean outfalls. Water quality standards<br />
need to be re-evaluated from a perspective that addresses impacts to coral reef systems.<br />
Wastewater in the Florida Keys is handled by approximately 200 treatment plants and numerous private septic<br />
tanks. Because of the low land elevation in the Keys, the septic tank drain fields are under tidal influence and<br />
nutrient-rich water leaches through the porous limestone into coastal waters. In order to decrease this nutrient<br />
loading, Monroe County is undertaking a study of the septic tank problem and consolidation of the wastewater<br />
plants into regional facilities.<br />
Tourism and Recreation<br />
Florida’s coral reefs are located near the four most densely populated counties of the state (U.S. Census<br />
Bureau, 2003). The combined population of these four counties is more than five million, with 2.3 million in<br />
Miami-Dade, 80,000 in Monroe, 1.7 million in Broward, and 1.2 million in Palm Beach County (U.S. Census<br />
Bureau, 2003). Tourism is Florida’s top industry and generates over $50 billion a year for the state’s economy.<br />
In 2003, Florida hosted over 74 million visitors who participated in reef-based recreation, generating $18 million<br />
annually in the Florida Keys (VISIT FLORIDA Year-in-Brief, 2003). Reef tourism is a significant economic<br />
asset in Palm Beach, Broward, Miami-Dade, and Monroe Counties, which are all on the list of top ten destination<br />
counties for tourists to Florida (Johns et al., 2001; VISIT FLORIDA Year-in-Brief, 2003). The primary<br />
tourism activities include snorkeling, scuba diving, fishing, glass bottom boat tours, boat rentals, dive training,<br />
and dive shop sales (Table 7.2). By far, the largest economic benefits generated by direct use of the reefs of<br />
Southeast Florida are related to recreation and tourist activities. For example, in the June 2000 to May 2001<br />
tourist season, tourism generated over $16 billion in output/sales, including local multiplier impacts. These<br />
sales, in turn, generated an estimated $6.2 billion in income, which supported over 251,000 full-time and parttime<br />
jobs. In Florida, the Monroe County economy is the most highly dependent on tourism, with 61% of all<br />
county employment related to tourist activity.<br />
Johns et al. (2001) estimated direct use of both the artificial and natural reefs and the associated market and<br />
non-market economic use values for Southeast Florida. For the four-county area, direct use of natural reefs<br />
by both residents and visitors was estimated at 18.4 million person-days of snorkeling, scuba diving, fishing,<br />
and viewing coral reefs from glass-bottom boats, which resulted in over $2.7 billion in output/sales (Table 7.2).<br />
This activity further generated over $1.2 billion in income that supported over 43,000 full-time and part-time<br />
jobs. Annual net direct user value of natural reefs was over $229 million. Residents and visitors to the Florida<br />
Keys (Monroe County) spent about 3.9 million person-days of diving, fishing, and viewing coral reefs and $373<br />
million in local sales, which generated about $107 million in income locally that supported over 7,600 jobs. In<br />
addition to these economic impacts, users received over $57 million in net annual user value, with an asset<br />
value of $1.9 billion.<br />
In Palm Beach County, users spent over 2.8 million person-days on the natural reefs off the coast of the county<br />
with economic impacts on the county of $354 million in sales, which generated $141 million in local income
and supported 4,500 jobs. Reefs off<br />
Palm Beach County had a net annual<br />
user value of over $42 million, with<br />
an asset value of $1.4 billion. In Broward<br />
County, users spent about 5.4<br />
million person-days on the natural<br />
reefs, spent $1.1 billion, generated<br />
$547 million in local income, and supported<br />
about 18,600 jobs (Table 7.2).<br />
Reefs off Broward County had a net<br />
annual user value of about $83 million<br />
and an asset value of $2.8 billion.<br />
In Miami-Dade County, users spent<br />
over 6.3 million person-days on the<br />
natural reefs, generated $878 million<br />
in sales and $419 million in income<br />
locally, and supported about 12,600<br />
jobs. The reefs of Miami-Dade had a<br />
net annual user value of almost $47<br />
million, with an asset value of $1.6<br />
billion (Table 7.2).<br />
The State of Coral Reef Ecosystems of Florida<br />
Table 7.2. Estimates by county of area and monetary value of recreational and tourism-related<br />
activities occurring in coral reef ecosystems of Southeastern Florida,<br />
2000-2001. Source: Johns et al., 2001.<br />
ATTRIBUTE BROWARD MIAMI-DADE MONROE PALM<br />
BEACH<br />
Habitat area (x 1000<br />
hectares)<br />
Person days of activity<br />
(millions of days)<br />
Sales and Services<br />
(millions of $)<br />
Income<br />
(millions of $)<br />
8.3 7.2 115.3 12.0<br />
5.4 6.3 3.9 2.8<br />
1100 878 373 354<br />
547 419 107 141<br />
Number of jobs 18,600 12,600 7,600 4,500<br />
Asset value<br />
(millions of $)<br />
Snorkeling<br />
(millions of $)<br />
Scuba diving<br />
(millions of $)<br />
Fishing<br />
(millions of $)<br />
Glass-bottom boat<br />
rides (millions of $)<br />
2,800 1,600 1,900 1,400<br />
0.8 1.5 1.5 0.4<br />
2 0.7 0.5 1.3<br />
2.6 4.1 1.8 1.1<br />
0.04 0.01 0.07 0<br />
Fishing<br />
Coral reefs provide the ecological foundation for important fisheries and a tourism-based economy in South<br />
Florida that generated an estimated 71,000 jobs and $6 billion of economic activity in 2001 (Johns et al.,<br />
2001). Fishing is an important part of this activity and a human stressor on coral reefs.<br />
Florida’s reef fisheries are concentrated in South Florida and are complex (Bannerot and Alevizon, 1990; Chiappone<br />
and Sluka, 1996). Commercial and sport fisheries target adult reef fishes and spiny lobster for food<br />
and sport around bridges and on patch reefs and offshore bank reefs. Fisheries also target live fishes and invertebrates<br />
for marine aquaria. Pink shrimp, which are ecologically important as a principal prey item for many<br />
reef species, are also economically important and intensively exploited. Adult pink shrimp inhabiting soft and<br />
rubble bottoms near coral reefs are targeted by the commercial fishery as a food, and juvenile pink shrimp are<br />
targeted as live bait for the recreational fishery in coastal bays and near barrier islands. Finally, pre-spawning<br />
subadult pink shrimp are targeted by both food and sport fisheries as they emigrate from coastal bay nursery<br />
grounds to offshore spawning grounds.<br />
Total fishing activity reflects Florida’s population, which grew tenfold from 1.5 million people in 1930 to 16<br />
million in 2000. In 2000, over five million residents, nearly one-third of Florida’s population, lived in the five<br />
southern counties adjacent to coral reefs (Palm Beach, Broward, Miami-Dade, Monroe, and Collier Counties).<br />
Like residents, recreational fishing (i.e., sport angling and spear fishing) is a popular activity for tourists. Over<br />
three million tourists annually visit the Florida Keys alone (Leeworthy and Vanasse, 1999).<br />
Precise data on fishing effort on coral reefs do not exist, but are reflected by statewide fishing statistics. In<br />
2001, for example, an estimated 6.7 million recreational fishers took 28.9 million marine fishing trips in Florida,<br />
catching 171.6 million fish, of which 89.5 million (52%) were released or discarded (U.S. DOC, 2003). Although<br />
some measures of recreational fishing activity such as the annual number of anglers and fishing trips were unchanged<br />
between 1993 and 2002, other measures (e.g., annual totals of fishes caught, released, and landed)<br />
may have increased between 1997 and 2002 (Figure 7.6). Additionally, the number of registered recreational<br />
boats in five South Florida counties adjacent to coral reefs grew more than 500% between 1964 and 2002,<br />
although the number of registered vessels actually used for fishing is unknown (Figure 7.7). In comparison,<br />
the number of commercial vessel registrations grew at a much lower rate of about 150% (Figure 7.7). Besides<br />
an increased fleet size, average fishing power (the proportion of stock removed per unit of fishing effort) may<br />
Florida<br />
Sidebar<br />
page<br />
157
Florida<br />
page<br />
158<br />
The State of Coral Reef Ecosystems of Florida<br />
have quadrupled in recent decades<br />
because of technological advances<br />
in fishing tackle, hydroacoustics<br />
(depth sounders and fish finders),<br />
navigation (charts and global positioning<br />
systems), communications,<br />
and vessel propulsion (Mace, 1997;<br />
Bohnsack and Ault, 1996; Ault et al.,<br />
1998, in press).<br />
Fishing can stress coral reefs by removing<br />
targeted species, killing nontarget<br />
species as bycatch, and causing<br />
habitat damage. Because fishing<br />
is size-selective, concerns exist about<br />
ecosystem disruption by removal of<br />
ecologically important keystone species,<br />
top predators (groupers, snappers,<br />
sharks, and jacks), and prey<br />
(e.g., shrimps and baitfish). Fishing<br />
stress is compounded when combined<br />
with other stressors such as<br />
pollution and habitat damage. From<br />
a fishery perspective, whether stocks<br />
decline from fishing or detrimental environmental<br />
changes, reducing fishing<br />
pressure is an appropriate fishery<br />
policy choice (Rosenberg, 2003).<br />
To balance increased fishing pressure,<br />
many new fishery regulations<br />
have been enacted since the 1980s<br />
in Florida state waters by the Florida<br />
Fish and Wildlife Conservation Commission<br />
(FFWCC; http://www.state.<br />
fl.us/gfc/marine) and in Federal waters<br />
by the South Atlantic Fishery<br />
Management Council (SAFMC, http://<br />
www.safmc.net/fishid) and Gulf of<br />
Mexico Fishery Management Council<br />
(GMFMC, http://www.gulfcouncil.org/<br />
about.htm). Their actions include:<br />
prohibiting destructive or wasteful<br />
fishing gear (e.g., roller trawls, explosives,<br />
wire fish traps); requiring<br />
reduced bycatch survival (e.g., ves-<br />
Figure 7.6. Florida total marine recreational fishing trips, angler fishing trips, total<br />
catch, and total landings for the period 1993 to 2002 estimated from the MRFSS database.<br />
Source: National <strong>Marine</strong> Fisheries Service SEFSC.<br />
Figure 7.7. Time series of nominal fishing effort for commercial (open circles) and<br />
recreational (dark circles) fleets directed at South Florida reef fish from 1964 to 2002.<br />
Source: Ault et al. (2001, 2002).<br />
sel-holding requirements and limits on number of short lobster used as live bait in lobster traps, escape gaps<br />
and release hatches for lobster traps); establishing minimum size and bag limits on a number of reef species<br />
landed; establishing seasonal and spatial closures for certain fishing gears (e.g., spears, power heads, lobster<br />
diving) and breeding seasons (e.g., for amberjack and black grouper; Bohnsack et al., 1994); limiting or restricting<br />
fishing for some species; and limiting entry into certain fisheries. The FKNMS has numerous marine<br />
protected areas (MPAs), many of which restrict or eliminate fishing and diving (http://www.fknms. nos.noaa.<br />
gov, accessed 2/8/<strong>2005</strong>). Fisheries for Nassau grouper (Epinephelus striatus), goliath grouper (E. itajara),<br />
queen conch (Strombus gigas), and stony corals (Bohnsack et al., 1994) were closed in 1998 and remain<br />
closed today.
The State of Coral Reef Ecosystems of Florida<br />
Trade in Coral and Live Reef Species<br />
The trade in coral and live reef species is not considered a major direct threat to coral reef ecosystems in<br />
Florida.<br />
Ships, Boats, and Groundings<br />
Many ship groundings have occurred on Florida’s coral reefs (Table 7.3). Federal and state rules and regulations<br />
protect the stony coral (Magnuson-Stevens Fishery Conservation and Management Act, FWC Rule<br />
68B-42.009) and there are specific laws and regulations regarding vessel groundings (16 U.S.C. § 1443 and<br />
1437, FS 253.001 and 253.04). Nevertheless, ship groundings and anchors can damage and destroy corals<br />
and other biota. According to the FFWCC’s law enforcement records, there are between 500 and 600 vessel<br />
groundings reported in the FKNMS annually. In addition, there are many unreported groundings that damage<br />
resources. FFWCC data indicate that approximately 12-15% (60 to 90) of groundings have involved injuries<br />
to coral reef habitat.<br />
Vessel groundings can be arbitrarily classified as small (
Florida<br />
page<br />
160<br />
The State of Coral Reef Ecosystems of Florida<br />
jority of grounding incidents are caused by small, privately owned vessels often resulting in minimal resource<br />
damage to the resources, the cumulative impacts can be detrimental and long-lasting. Several large- and<br />
medium-sized vessel grounding incidents have occurred off the east and south coasts of Florida (Table 7.3).<br />
Large vessels often create injuries exceeding 1,000 m 2 . The majority of vessel groundings in Florida coral<br />
reefs are the result of operator error (poor navigating, lack of local knowledge, and inappropriate charts).<br />
Several groundings have occurred because of stormy weather or an inappropriate anchorage. Anchors and<br />
chains from large ships can also cause substantial damage, as occurred with the ships M/V Diego in 2001<br />
and M/V Puritan in 2004. Many of the reported incidents included damage from anchor and chain, as well<br />
as from the physical impact of the hull. Damage included crushed, broken, and dislodged organisms (e.g.,<br />
sponges, Millepora spp., octocorals, scleractinian corals, zooanthids, anemones, and bryozoans). Large vessels<br />
pulverize the limestone reef substrata creating rubble deposits, fractured structure, and in some cases,<br />
canyons or trenches. Ships often attempt to free themselves from the reef by engaging the propeller. The<br />
propwash from the propeller mobilizes loose material and may create pits, trenches, and piles of sediment and<br />
rubble. Damage caused by a propwash can be more severe than the damage caused by hull contact alone.<br />
In Broward County, significant damage to coral reefs was caused by the grounding and subsequent propwash<br />
of the nuclear submarine USS Memphis (Banks et al., 1999).<br />
The type of impact depends upon grounding circumstances such as storm conditions; the ship’s cargo, which<br />
governs how much the ship draws; and the length of anchor chain or tug boat line used to tow the vessel off<br />
the reef. Many large vessel groundings have occurred near Port Everglades, Broward County (Table 7.3),<br />
where ships attempting to anchor or at anchor are driven inshore onto the reef by severe weather. In the Florida<br />
Keys, large ship groundings have occurred at Pulaski Shoal, Maryland Shoal, Looe Key, and Molasses,<br />
Elbow, and Carysfort reefs. Navigational error was the principal cause, although all of the large ships were<br />
equipped with advanced navigating technology, such as, global positioning system (GPS) receivers, radar,<br />
radio direction finders, and depth recorders. Often, foreign ships do not have local charts; for example, the<br />
Mavro Vetranic was found trying to navigate from the eastern Gulf of Mexico into the Straits of Florida with a<br />
chart that had coverage of the entire Atlantic Ocean at a scale that did not show local aids to navigation (e.g.,<br />
lighthouses).<br />
Efforts to reduce the effects of vessel groundings have included installing mooring buoys on highly visited reefs<br />
in Monroe, Miami-Dade, and Broward Counties. This has reduced chronic effects from small boat anchoring.<br />
The State of Florida and FKNMS have published brochures and made information available on the internet to<br />
educate users on the risks and best ways to navigate in coral reef areas. The FKNMS has established large<br />
vessel avoidance areas and installed Racon beacons on lighthouses between Dry Tortugas and Key Largo.<br />
The beacon transmits a unique signal that is received on active radar receivers identifying the reef lighthouse.<br />
There is an active effort to find a better anchorage for Port Everglades. Projected future efforts to reduce<br />
groundings include extending vessel avoidance zones, prohibiting the use of Port Everglades anchorage<br />
when the wind speed exceeds 25 knots, and enhancing management of the Port Everglades anchorage.<br />
Vessels that run aground because of negligent operation are held responsible by natural resource trustees<br />
including the State of Florida, NOAA, and National Park Service (NPS). The nominal responsibility of the<br />
shipping company-insurance carrier includes assessment, triage, direct restoration, compensatory restoration<br />
(and/or punitive actions), and post-restoration monitoring. Small boat owners are also held responsible for<br />
their negligent actions. Scaling for compensation and restoration is based on assessing the injury: defining<br />
the spatial extent using biological metrics (abundance and cover of coral) and determining the time necessary<br />
for recovery to pre-incident status for both the injured area and the compensatory action. The Habitat Equivalency<br />
Analysis method is a useful approach in determining compensation restoration (Fonseca et al., 2000;<br />
NOAA, 1997, 2000; Milon and Dodge, 2001).<br />
Restoration at grounding sites has taken a variety of forms in order to enhance recovery (Jaap, 2000). While<br />
it is impossible to instantly replace an injured coral reef resource, steps can be taken to promote recovery.<br />
The typical scenario is to salvage all detached coral and cache them for subsequent reattachment. It is desirable<br />
to remove loose injury-generated rubble to expose the reef foundation (limestone rock) and to eliminate<br />
a source of material that could be mobilized and create additional injury in future storm events. If the reef<br />
framework is fractured to a significant extent, concrete, native limestone boulders and fiberglass rods may be
The State of Coral Reef Ecosystems of Florida<br />
needed and have been used to stabilize the fractured foundation. After the reef has been cleared of rubble<br />
and the foundation made stable, corals are reattached based on microhabitat requirements (e.g., orientation<br />
to light and waves). In cases where the reef was rendered flat by severe hull injuries, the topographic relief<br />
can be enhanced using native limestone, concrete and prefabricated rock structures. These are often secured<br />
with concrete and reinforcement rods.<br />
While there are few detailed studies comparing recovery of restored sites with unrestored injury areas, it is<br />
clear that there have been some successes. Coral reattachment has been a useful method. A number of<br />
monitoring studies off Broward County have demonstrated very high Scleractinian coral reattachment success<br />
(80-95%) (Continental Shelf Associates, 2000; Gilliam et al., 2001, 2003; Thornton et al., 2002). After approximately<br />
three years, recruitment of coral (octocoral and scleractinian corals) is very common. For example,<br />
there are restored areas off Miami-Dade County where measurements of percent cover, density, and diversity<br />
of sessile benthic organisms exceed those at a nearby reference site (Miami-Dade County, 2003).<br />
<strong>Marine</strong> Debris<br />
Lost and discarded lobster, stone crab, and blue crab traps are a common component of marine debris in<br />
Florida. Traps and the associated buoys and ropes are commonly lost during both routine fishing operations<br />
and when conflicts occur with other fishing gear and boats. Surveys suggest that, of the 500,000 lobster traps<br />
currently in the fishery, 20% of them are lost annually. No surveys have been conducted that estimate the<br />
number of lost stone crab and blue crap traps, but fishers report that they replace 20% of the 818,000 stone<br />
crab traps used annually, and anecdotal reports suggest that during 1998, 30-50% of the 360,000 blue crab<br />
traps were lost. Additional trap losses occur during tropical and severe winter storms. During the Ground Hog<br />
Day storm in 1998, approximately 80,000 lobster traps and 22,000 stone crab traps were lost in the Florida<br />
Keys. The combined effects of Hurricane Georges and Tropical Storm Mitch later that same year destroyed<br />
an estimated 111,000 lobster traps and a few thousand stone crab traps.<br />
Trap debris is distributed in coastal environments and underwater. One shoreline debris removal program<br />
conducted during 1999 removed<br />
12,700 kg of plastic trap debris and<br />
buoys, filling 1,445 50-gallon plastic<br />
bags along five miles of shoreline<br />
in the Florida Keys (Figure 7.8). An<br />
underwater survey conducted in the<br />
Florida Keys during 1993 estimated<br />
that there were 2.84 lost or discarded<br />
traps per ha. Trap debris on shorelines<br />
is a significant source of visual<br />
pollution, but probably poses little<br />
threat to marine life unless the material<br />
is reintroduced to the marine<br />
environment. However, submerged<br />
trap debris is known to cause the loss<br />
of vegetation from beneath the traps<br />
and may have more severe effects if<br />
moved during storms. The impact of<br />
trap debris on coral communities is<br />
currently being examined.<br />
Figure 7.8. A mountain of debris removed from the Florida Shoreline during 1999.<br />
Photo: T. Matthews.<br />
Aquatic Invasive Species<br />
Fish<br />
Within the United States the number of non-native fishes caught in the wild in Florida is second only to the<br />
number caught in California. At least 123 non-native fish species have been caught in Florida. Of these, 56<br />
are established in freshwater habitats and at least four are established in estuaries (FMRI, unpublished data;<br />
Florida<br />
Sidebar<br />
page<br />
161
Florida<br />
page<br />
162<br />
The State of Coral Reef Ecosystems of Florida<br />
USGS, 2003). Fifteen species of non-native tropical reef fishes, mainly angelfishes (Pomacanthus spp.),<br />
surgeonfishes (Zebrasoma spp.), and a serranid (Chromileptes altivelis), have been observed in southeastern<br />
Florida reefs (Semmens et al., 2004; USGS, 2003), but are not known to be established. The ecological<br />
impact of non-native species has been discussed by various authors (Taylor et al., 1984; Carlton and Geller,<br />
1993; Simberloff et al., 1997; Carlton, 2001; Kolar and Lodge, 2002).<br />
The red lionfish (Pterois volitans) is the only marine species that appears to have become established in<br />
Florida (Whitfield et al., 2002; Ruiz-Carus et al., in press). Six lionfish were freed into Biscayne Bay, Dade<br />
County on August 24, 1992, when Hurricane Andrew destroyed a large marine aquarium (Courtenay, 1995).<br />
Red lionfish were initially sighted on shallow-water reefs off Palm Beach in October 1992 (Courtenay, 1995).<br />
Reports of lionfish were sporadic from 1993 to 2001. In 2002, two voucher specimens were captured off St.<br />
Augustine and Jacksonville. Sightings were reported in Nassau, Palm Beach, and Miami-Dade Counties.<br />
Gonad histology of the voucher female lionfish showed that most likely it spawned in local waters; the male<br />
voucher showed a testis in the mid-maturation class (Ruiz-Carus et al., in press). Red lionfish are now found<br />
along the seaward edge of reefs and in lagoons, turbid inshore areas, and harbors (Schultz, 1986; Myers,<br />
1991). In the U.S., red lionfish were also observed at artificial reefs and in waters as deep as 79 m off North<br />
and South Carolina (Ruiz-Carus et al., in press). Red lionfish are often found during the day under ledges and<br />
crevices but may also hunt small fish, shrimps, and crabs in open water at night (Myers, 1991). The paucity<br />
of biological data on red lionfish brings new challenges to managers and researchers.<br />
The red lionfish could pose a threat to Florida’s fishers, divers, and wildlife inspectors because it is venomous.<br />
Furthermore, potential ecological effects include habitat alteration; water quality degradation; and introduction<br />
of diseases and parasites, competition, predation, hybridization, and replacement of native species. As<br />
introduction of non-native marine fishes is relatively rare, the effects of such introductions are not well documented.<br />
Both the accidental and purposeful introductions of non-native fishes into Florida waters reflect the rise in<br />
Florida’s consumption and production of tropical ornamental fishes (Ruiz-Carus et al., in press). It is likely<br />
that the number of marine species in the market will increase because of improvements in “mini-reef system”<br />
aquaria (Larkin and Degner, 2001), and greater access to remote areas where additional non-native species<br />
can be obtained (Larkin, 2003).<br />
Coral<br />
Orange cup coral (Tubastrea coccinea) is a solitary or cluster of tubes, usually less than 15 cm high and 2 cm<br />
in diameter. Larger clusters may include 50 or more bright orange tubes. The tentacles are orange and often<br />
extend outward from the top of the tube capturing food.<br />
Tubastrea coccinea is well known in the Pacific Ocean, Red Sea, and Indian Ocean. The species type was<br />
found off of Bora Bora by Lesson in 1829. The earliest report of T. coccinea in the Caribbean/western Atlantic<br />
is in 1943 from Puerto Rico and Curacao and it was subsequently sited throughout the Caribbean Basin (Jamaica-1955,<br />
Cuba-1982, Bahamas-1985, western Gulf of Mexico-1999). In Florida, the preferred habitat is on<br />
vertical steel structures (sunken ships and engineering platforms). Tubes are usually facing in the direction of<br />
the current. A good example is the sunken vessel, U.S. Coast Guard cutter Duane off Key Largo, where the<br />
southern facing deck structures are veneered with multiple colonies. T. coccinea was reported on the Duane<br />
in 1999 (J. Sprung, pers. comm.) and that it was well established there by March 2002 (W. Jaap, pers. obs.).<br />
In the Pacific, T. coccinea is often found in caves with swift water movement, usually below 15 m depth.<br />
The appearance of this coral in Florida indicates that some Indo-Pacific reef fauna can reproduce and survive<br />
in the western Atlantic. To date, there are no reports of T. coccinea replacing native species and it is only<br />
known to settle and grow on steel structures. Monitoring is recommended at selected locations to follow the<br />
status and trends in abundance and distribution for T. coccinea.<br />
Plants<br />
While non-native fishes and corals may threaten Florida’s coral reef, non-native plants pose the greatest<br />
risks. The world-wide spread of the algae, Caulerpa taxifolia, and its effects in the Mediterranean have
een well documented (http://www.pbs.org/<br />
wgbh/nova/algae/chronology.html). More recently,<br />
Caulerpa brachypus (Figure 7.9), native<br />
to the Pacific region, has been detected<br />
in Florida on nearshore reefs and in the Indian<br />
River Lagoon. The species was probably released<br />
from saltwater aquaria or from ships’<br />
ballast water. In the absence of predators it<br />
grows unchecked and can smother corals and<br />
seagrass beds rapidly if sufficient nutrients are<br />
available (http://www.dep.state.fl.us/southeast/<br />
hottopics/caulerpa/cbrachypusalertbulletin.<br />
<strong>pdf</strong>). Recent reports from divers and fishers indicate<br />
that the algae has now become so thick<br />
on reefs in Palm Beach County, that it is forcing<br />
lobsters and fish away. The species has<br />
also now been observed 100 km north at Fort<br />
Pierce, Florida, and Lapointe and Barile (2003)<br />
believe the rapid spread is enhanced by anthropogenic<br />
enrichment.<br />
The State of Coral Reef Ecosystems of Florida<br />
Figure 7.9. The ‘green menace’, Caulerpa brachypus, was introduced to<br />
Florida from the Pacific. Anecdotal reports indicate that it is flourishing in<br />
Florida and poses a threat to native reef organisms. Photo: L. Nall.<br />
Security Training Activities<br />
Security training activities are not recognized as a major threat to coral reef ecosystems in Florida.<br />
Offshore Oil and Gas Exploration<br />
There is currently no oil or gas drilling occurring in state waters. Florida law prohibits future leasing or drilling<br />
of the seabed within the state’s territorial sea for purposes of oil and gas exploration and development. Holders<br />
of any offshore drilling leases that were granted by the state prior to the enactment of the current law must<br />
obtain permits under state environmental laws and regulations prior to conducting any drilling activities. No<br />
leases exist in Florida areas where coral reef tracts are located.<br />
Other<br />
Subsea Engineering Projects: Fiber Optic Cables and Gas Pipelines<br />
In the past decade, multiple fiber optic cables have been installed off Miami-Dade, Broward, and Palm Beach<br />
Counties. The nominal construction included horizontal directional drilling from the coast to beyond the first<br />
reef terrace. After exiting from the bore hole, the cable was deployed eastward on the surface of the seafloor.<br />
During some cable installations, there were “frac-outs” (i.e., when drilling mud escapes from the bore hole<br />
through a crack or void in the rock). These incidents were not serious in terms of mortality or morbidity of<br />
marine fauna.<br />
In 1999, AT&T Corporation installed four cables off Hollywood Beach in Broward County. Two of the cable<br />
deployments resulted in injuries to numerous coral colonies (Table 7.4), and several large barrel sponges<br />
(Xestospongia muta) were amputated at their bases. The contracting firm paid for direct and compensatory<br />
restoration, which included installing mitigation modules (limestone boulders imbedded in a concrete base).<br />
In April 2001, a second cable injury<br />
occurred at the ARCOS-I cable deployment<br />
in Sunny Isles, Miami-Dade<br />
County. Injuries to corals are provided<br />
in Table 7.5. The injuries were<br />
repaired and compensatory mitigation<br />
included installing a boulder field<br />
Table 7.4. Impacts to coral from AT&T incident. Source: PBS&J, 2000.<br />
IMPACT CATEGORY AMERICAS II CABLE COLUMBUS III CABLE<br />
Cable overhanging coral 78 56<br />
Cable lying on top of coral 45 63<br />
Cable abrasion injury 12 29<br />
Totals 135 148<br />
Florida<br />
Sidebar<br />
page<br />
163
Florida<br />
page<br />
164<br />
The State of Coral Reef Ecosystems of Florida<br />
near the cables. Subsequent to the Table 7.5. Impacts to coral from ARCOS incident. Source: PBS&J, 2003.<br />
cable installations in 1999-2001, the<br />
ARCOS NORTH ACROS SOUTH<br />
State of Florida directed cable com- IMPACT CATEGORY<br />
CABLE<br />
CABLE<br />
panies to install all future cables in ar-<br />
Cable overhanging coral 67 75<br />
eas where there are gaps in the reefs<br />
Cable lying on top of coral 34 23<br />
to reduce resource injury risks.<br />
Cable abrasion injury 8 16<br />
A 36-inch diameter gas pipeline (Gulf- Totals 109 114<br />
stream Gas Natural Gas System)<br />
was installed from Mobile Bay, Alabama to Port Manatee, Tampa Bay and began operating in May 2002. The<br />
pipeline was required to be buried three feet under the seafloor to a water depth of 200 ft; beyond 200 ft, the<br />
pipe was positioned on the seafloor. A trench was created with a submarine plow and the pipe was laid in the<br />
trench. In multiple areas in and offshore Tampa Bay, the trenching was impeded by dense-hard rock. In cases<br />
of partial pipe burial, the contractor used boulders to cover the pipe; in cases where the plow did not penetrate<br />
the rock, the contractor fastened the pipe to the rock with metal hardware. Trenching resulted in injuries to<br />
coral and other hardbottom resources within Tampa Bay and the Gulf of Mexico. Injuries also occurred from<br />
vessel and barge mooring anchors and cables. Injuries within Tampa Bay were compensated by mitigation<br />
projects. Two-hundred sponges and octocorals were moved from hardbottom areas in the pipeline corridor to<br />
mitigation structures and eight acres of habitat structures (at six mitigation sites) were installed. Each mitigation<br />
site provides 1.3-1.4 acres of limestone boulder-pyramids; each site includes 16 to 17 pyramids which are<br />
composed of 20 ft long by 24 ft wide, by 3-4 ft high boulders (ENSR International, 2002). Inspections reveal<br />
colonization of these structures by algae, sponges, octocorals, blue crabs, stone crabs, and schools of anchovies<br />
and spadefish. In the eastern Gulf of Mexico, the pipeline installation disturbed 27 acres of hardbottom,<br />
including sponges, octocorals, and stony coral communities. Installation of nine boulder fields and three<br />
pre-fabricated module sites mitigated the injuries. Approximately 49 acres of mitigation was provided at the<br />
12 locations seaward of Egmont Key, in depths ranging from 52 to 120 ft (Continental Shelf Associates, 2001;<br />
Sea Byte, 2001). Over 400,000 tons of boulders were deployed in discrete fields. The boulders (at least 3 ft in<br />
dimension) were deployed in multiple layers to provide refuge. Inspections of boulders and modules revealed<br />
colonization by algae, sponges, hydroids, snapper, schools of anchovies, nurse sharks, and goliath grouper.<br />
Additional gas pipeline projects on the east coast of Florida are currently being reviewed for permits. Two<br />
proposals from the Calypso-Tractebel and AES Ocean Express have advanced to the point that permitting<br />
may occur in <strong>2005</strong>. Another pipeline proposed by El Paso is not as far along in the permitting process. These<br />
projects propose to install 24-inch diameter pipelines that would originate in the Bahamas, cross the Straits of<br />
Florida, and terminate near Port Everglades (Jupiter for El Paso). The draft environmental impact statements<br />
for the first two projects proposed the removal of rubber tires deployed in the 1960s as artificial reefs for mitigation<br />
of their impacts. These tires have become unbundled, have moved, and are injuring reef resources.<br />
Larger corals in known areas of impact will be relocated to non-impacted sites. The pipeline companies propose<br />
to avoid injuring reef habitat by drilling under the reefs and connecting the sections of pipe in non-reef<br />
areas. There are concerns regarding deployment of construction equipment, “frac-outs” from drilling, possible<br />
of a major storm events during drilling, and deployment of pipes in a major boundary current (Gulfstream or<br />
Florida Current) in extremely deep water.<br />
Construction of the pipeline projects will involve direct impacts to coral reef habitat from horizontal directional<br />
drilling and associated sump berms, trenching in areas where the pipeline will transit from horizontal directional<br />
drilling holes, sedimentation and turbidity associated with drilling and trenching, and possible “frac-outs”<br />
during drilling. In addition, some pipeline strings have to be laid out and pulled into horizontal directional drilling<br />
holes. Some pulling will occur over coral reef habitat, thereby causing injury from the dragging.
The State of Coral Reef Ecosystems of Florida<br />
<strong>CORAL</strong> <strong>REEF</strong> ECOSYSTEMS—DATA-GATHERING ACTIVITIES AND RESOURCE CONDITION<br />
The FKNMS enabling legislation requires a comprehensive water quality status and trends monitoring program<br />
with three major components: water chemistry, seagrass, and coral reefs (U.S. DOC, 1996). The<br />
protocols and sampling strategies were developed in collaboration with EPA in 1994-95. Water chemistry and<br />
seagrass monitoring are conducted by Florida International University; coral reef monitoring is conducted by<br />
the FFWCC’s Fish and Wildlife Research Institute. The two institutions began collecting data in 1995-96.<br />
The waters of the FKNMS are characterized by complex water circulation patterns, with much of the spatial<br />
and temporal variability due to seasonal influences on regional circulation regimes. The Sanctuary is directly<br />
influenced by the Florida Current, Gulf of Mexico Loop Current, inshore currents of the southwestern Florida<br />
Continental Shelf (Shelf), discharge from the Everglades through the Shark River Slough, and tidal exchange<br />
with both Florida Bay and Biscayne Bay (Lee et al., 1994, 2002). Advection from these external sources has<br />
significant effects on the physical, chemical, and biological composition of waters within the Sanctuary, as may<br />
internal nutrient loading and freshwater runoff from the Keys themselves and episodic upwelling (Leichter et<br />
al., 2003).<br />
A spatial framework for water quality management was proposed on the basis of geographical variation of<br />
regional circulation patterns (Klein and Orlando, 1994). Quarterly sampling of more than 200 stations in the<br />
Sanctuary and on the Shelf, as well as and monthly sampling of 100 stations in Florida Bay, Biscayne Bay,<br />
and the mangrove estuaries of the southwestern Florida coast, provide a unique opportunity to explore the<br />
spatial variability in water quality measures in South Florida’s coastal waters (Figure 7.10). Details on water<br />
chemistry sampling strategy, field sampling methods, laboratory analyses, and data processing are available<br />
on-line at http://sefrc.fiu.edu/wqmnetwork/ (accessed 1/31/05).<br />
WATER QUALITY<br />
Methods<br />
Several variables were measured in situ and from grab samples at 54 fixed stations within the Sanctuary<br />
boundary beginning in March 1995 (Figure 7.10). Depth profiles of temperature, salinity, dissolved oxygen<br />
(DO), photosynthetically active radiation<br />
(PAR), in situ chlorophyll a<br />
(CHLa) specific fluorescence, optical<br />
backscatterance turbidity, depth, and<br />
density were measured by conductivity-temperature-depth<br />
(CTD) casts<br />
using a Seabird SBE 19 instrument<br />
(Table 7.6). Vertical light attenuation<br />
(k d , per meter) was calculated at<br />
0.5 m intervals from PAR and depth<br />
(Kirk, 1994) and averaged over the<br />
depth of each station. Where it was<br />
too shallow to use a CTD, surface<br />
salinity and temperature were measured<br />
using a combined salinity-conductivity-temperature<br />
probe. DO was<br />
measured with an oxygen electrode<br />
corrected for salinity and temperature.<br />
PAR was measured with a Li-<br />
Cor irradiance meter. The extent of<br />
water stratification was calculated as<br />
the difference between surface and<br />
bottom density (∆δ t ), such that positive<br />
values denoted greater densities<br />
Figure 7.10. The Southeast Environmental Research Center (SERC) Water Quality<br />
Monitoring Network showing the distribution of fixed sampling stations (+) within the<br />
Florida Keys National <strong>Marine</strong> Sanctuary (red stations) and Florida Bay, Biscayne Bay,<br />
Whitewater Bay, Ten Thousand Islands, and Southwest Florida Shelf (blue stations).<br />
Source: Boyer and Jones, 2003.<br />
Florida<br />
Sidebar<br />
page<br />
165
Florida<br />
page<br />
166<br />
The State of Coral Reef Ecosystems of Florida<br />
of bottom water relative to the surface and negative values indicated the opposite. A value of ∆δ t >1 indicated<br />
weak stratification, whereas ∆δ t >2 meant strong water stratification.<br />
Water samples were collected from approximately 0.25 m below the surface and at approximately 1 m from<br />
the bottom. Unfiltered water samples were analyzed for total organic carbon (TOC), total nitrogen (TN), total<br />
phosphorus (TP), silicate (Si(OH) ), alkaline phosphatase activity (APA), and turbidity. Fluorescences at initial<br />
4<br />
and after two-hour incubation were measured using a spectrofluorometer (Jones, 1996). Filtrates were ana-<br />
- - + lyzed for nitrate+nitrite (NO ), nitrite (NO2 ), ammonium (NH4 ), and soluble reactive phosphorus (SRP).<br />
x<br />
Several parameters were not mea-<br />
- sured directly. Nitrate (NO ) was<br />
3<br />
- - calculated as NO - NO2 , dissolved<br />
x<br />
inorganic nitrogen (DIN) was deter-<br />
- + mined as NO + NH4 , and total or-<br />
x<br />
ganic nitrogen (TON) was defined as<br />
TN - DIN. DO saturation in the water<br />
column (DO ) was calculated using<br />
sat<br />
the equations of Garcia and Gordon<br />
(1992). Stations were stratified according<br />
to water quality characteristics<br />
(i.e., physical, chemical, and biological<br />
variables) using multivariate<br />
statistical techniques, an approach<br />
that has been very useful in understanding<br />
the factors influencing nutrient<br />
biogeochemistry in Florida Bay,<br />
Biscayne Bay, and the Ten Thousand<br />
Islands (Boyer and Jones, 2003).<br />
Data from individual sites for the<br />
complete period of record were plotted<br />
as time series graphs to illustrate<br />
any temporal trends that might have<br />
occurred. Temporal trends were<br />
quantified by simple regression with<br />
significance set at P
The State of Coral Reef Ecosystems of Florida<br />
making up the bulk (median 10.3 µM). SRP concentrations were very low (median 0.013 µM) and comprised<br />
only 6% of the TP pool. CHLa concentrations were also very low overall (0.26 µg/L), but ranged from 0.01 to<br />
15.2 µg/L. TOC was 199.7, a value higher than open-ocean levels but consistent with coastal areas. Median<br />
turbidity was low (0.6 nephelometric turbidity units, or NTUs) as reflected in a low k d (0.23/m). This resulted in<br />
a median photic depth of approximately 22 m, which was within 1% of incident PAR. Molar ratios of nitrogen<br />
(N) to phosphorous (P) suggested that was P was limited in the water column (median TN:TP = 57), but observed<br />
ratios of N to P could have resulted because TN may not be biologically available.<br />
Principal component analysis identified five composite variables (hereafter refered to PC1, PC2, etc.) that ac-<br />
- - + counted for 63.2% of the total variance. PC1 had high factor loadings for NO , NO2 , NH4 , and SRP and was<br />
3<br />
named the inorganic nutrient component. PC2 included TP, APA, CHLa, and turbidity and was designated as<br />
the phytoplankton component. The covariance of TP with CHLa implies that, in many areas, phytoplankton<br />
biomass may be limited by phosphorus availability. This is contrary to much of the literature on the subject,<br />
which usually ascribes nitrogen as the limiting factor for phytoplankton production in coastal oceans. TON and<br />
TOC were included in PC3 as the terrestrial organic component. Temperature and DO were inversely related<br />
in PC4. Finally, PC5 included salinity and TP, implying a source of TP from marine waters.<br />
Spatial distributions of the mean factor<br />
score for each station indicated that<br />
water quality varied over the study<br />
area (Figure 7.11). The inorganic<br />
nutrient component had two peaks<br />
in the Backcountry, and along the<br />
northern side (bayside) of the Middle<br />
Keys (Figure 7.11). The phytoplankton<br />
component described a north to<br />
south gradient in the Backcountry and<br />
Sluiceway that extended west across<br />
the northern Marquesas. The terrestrial<br />
organic component was highest<br />
in eastern Sluiceway extending into<br />
the Backcountry and was also distributed<br />
as a gradient away from land on<br />
the Atlantic side (oceanside) of the<br />
Keys. Temperature and DO showed<br />
a distribution heavily loaded in the<br />
oceanside. Finally, the salinity/TP<br />
component showed lower loadings in<br />
the nearshore Upper Keys and bayside<br />
Sluiceway extending through<br />
most Atlantic sites of the Middle and<br />
Lower Keys.<br />
Cluster analysis separated sampling<br />
sites (n=150) into eight clusters, with<br />
most stations grouped within clusters<br />
1, 3, 5, 6, 7, and 8 (Figure 7.12).<br />
Statistically significant differences<br />
between clusters indicated a nutrient<br />
gradient throughout the Sanctuary<br />
(highest to lowest concentrations:<br />
clusters 7 & 8 > 1 > 5 > 6 > 3). Cluster<br />
7 was composed primarily of stations<br />
located inside the Backcountry,<br />
Figure 7.11. Map of South Florida showing the boundary of the Florida Keys National<br />
<strong>Marine</strong> Sanctuary and geographic segments (names and numbers) used for site selection<br />
during routine water quality sampling for the period 1995 to 2003. Source:<br />
Boyer and Jones, 2003.<br />
Figure 7.12. Map of sample stations forming distinct water quality groups represented<br />
by colored dots. Station groups were identified through objective classification<br />
analysis. Source: Boyer and Jones, 2003.<br />
8<br />
Florida<br />
Sidebar<br />
page<br />
167
Florida<br />
page<br />
168<br />
The State of Coral Reef Ecosystems of Florida<br />
bayside Middle Keys, and inshore sites off Lower Matecumbe Key. This group was highest in inorganic nu-<br />
- trients, especially NO , TOC, and TON. In the shallow Backcountry sites benthic flux of nutrients might be<br />
3<br />
very important, whereas elevated DIN at inshore Lower Matecumbe sites may be the result of anthropogenic<br />
loading. Cluster 8 included the northernmost sites in the Sluiceway, Backcountry, and Marquesas, which had<br />
the highest TP, CHLa, and turbidity, but was low in inorganic nutrients, DON, and DOC. Water quality in this<br />
cluster probably was driven primarily by Shelf circulation patterns.<br />
Cluster 1 was composed of two sites in the northern Sluiceway and 12 sites in the northern Backcountry extending<br />
out to the Marquesas (Figure 7.12). This group was high in TP, CHLa, and turbidity. The main distinction<br />
between Clusters 1 and 8 was that Cluster 8 was higher in CHLa and lower in TOC. These clusters may<br />
be viewed as a gradient of high-TP Shelf water being attenuated by uptake of nutrients within the Backcountry<br />
and/or mixing with Atlantic Ocean waters.<br />
Clusters 5, 6, and 3 may be interpreted as representing an onshore-offshore nutrient gradient (Figure 7.12).<br />
Cluster 5 included most of the inshore sites of the Keys, excluding the northernmost and southernmost ones.<br />
They were elevated in DIN relative to Hawk Channel and reef tract sites. Cluster 6 was made up of sites in<br />
Hawk Channel of the Lower Keys and alongshore sites in the Upper Keys. This group was slightly lower in<br />
nutrients than Cluster 5. Cluster 3 was made up of outer reef tract and Tortugas stations. These sites had<br />
the lowest nutrients, CHLa, turbidity, and TOC in the Sanctuary. A clear gradient of elevated DIN, TP, TOC,<br />
and turbidity from alongshore to offshore was observed in the Keys, with the Upper Keys being lower than the<br />
Middle and Lower Keys. The elevated DIN in the nearshore zone of the Keys was not observed in the nearly<br />
uninhabited Tortugas, indicating an anthropogenic source. No significant onshore-offshore gradient was observed<br />
for CHLa.<br />
The highest concentrations of CHLa<br />
were observed on the southwestern<br />
Shelf (Figure 7.13), with a strong<br />
decreasing gradient toward the Marquesas<br />
and Tortugas. This pattern<br />
was likely caused by higher TP concentrations<br />
on the Shelf because of<br />
southward advection of water along<br />
the mainland coast. Most parameters<br />
were relatively consistent from year<br />
to year, with some seasonal excursions.<br />
The exceptions were statistically<br />
significant increases in TP and<br />
decreases in DO and TOC throughout<br />
the region (Figure 7.14).<br />
The local trends described in this<br />
study may occur across the whole region,<br />
although less pronounced. This<br />
spatial autocorrelation in water quality<br />
is an inherent property of highly inter-<br />
connected systems such as coastal<br />
Figure 7.13. Distribution of median concentrations of Chlorophyll a in Florida’s coastal<br />
waters for the period 1995 to 2003. Sampling stations are indicated with a + symbol.<br />
Source: Boyer and Jones, 2003.<br />
and estuarine ecosystems driven by similar hydrological and climatological forcings. Large changes have<br />
occurred in Sanctuary water quality over time, and some sustained monotonic trends have been observed<br />
(Figure 7.14). However, trend analysis is limited to the window of observation; trends may change, or even<br />
reverse, with additional data collection.<br />
The large scale of this monitoring program has allowed a holistic view of broad physical/chemical/biological<br />
interactions occurring over the South Florida region. Much information has been gained by inference<br />
from this type of data collection program; major nutrient sources have be confirmed, relative differences in
geographical determinants of water<br />
quality have been demonstrated, and<br />
large-scale transport via circulation<br />
pathways has been elucidated. In<br />
addition, this program demonstrates<br />
the importance of looking “outside<br />
the box” for questions asked within.<br />
Rather than thinking of water quality<br />
monitoring as a static, non-scientific<br />
pursuit, it should be viewed as a tool<br />
for answering management questions<br />
and developing new scientific<br />
hypotheses.<br />
Downloadable contour maps, timeseries<br />
graphs, and interpretive reports<br />
from the Southeast Environmental<br />
Research Center’s water quality<br />
network (which includes Florida Bay,<br />
Whitewater Bay, Biscayne Bay, Ten<br />
Thousand Islands, and Southwest<br />
Florida Shelf) are available at http://<br />
serc.fiu.edu/wqmnetwork (Accessed,<br />
1/31/<strong>2005</strong>).<br />
The State of Coral Reef Ecosystems of Florida<br />
Figure 7.14. Distribution of significant increases in total phosphorus concentrations<br />
(top panel) and decreases in dissolved oxygen (middle panel) and total organic carbon<br />
(bottom panel). Sampling stations are indicated with a + symbol. Source: Boyer<br />
and Jones, 2003<br />
Florida<br />
Sidebar<br />
page<br />
169
Florida<br />
page<br />
170<br />
The State of Coral Reef Ecosystems of Florida<br />
BENTHIC HABITATS<br />
The Coral Reef Evaluation and Monitoring Project<br />
Methods<br />
The FFWCC’s Coral Reef Evaluation and Monitoring Project (CREMP) tracks the status and trends of stony<br />
corals and selected benthic biota at 53 stations across the Florida Reef Tract from Palm Beach through the<br />
Dry Tortugas. The project annually samples at 43 permanent sites in the Florida Keys and Dry Tortugas and<br />
10 sites off the Southeast Florida coast in Palm Beach, Broward, and Miami-Dade Counties. Habitat types<br />
include hardbottom, patch reef, shallow offshore, and deep offshore communities. Within stations, sampling<br />
consists of a station species inventory (SSI), video transects, and a bioeroding sponge survey. Diseased coral<br />
surveys, stony coral abundance surveys, and temperature surveys are also conducted at selected sites. Details<br />
on sampling strategy, field methods, and data processing and analyses may be accessed at http://www.<br />
floridamarine.org/corals (Accessed 2/8/05).<br />
Results and Discussion<br />
The inventory of coral species richness within FKNMS from 1996 through 2003 exhibited a trend of general<br />
decline in stony coral species richness in all reef types and geographic areas (Upper, Middle, and Lower<br />
Keys). The number of species observed declined at 74 stations (70%), increased at 21 stations (20%), and<br />
remained stable at 10 stations (10%). More coral species were seen at deep reef and patch reef stations than<br />
in shallow reef and hardbottom stations<br />
(Table 7.7).<br />
The number of stations where Acropora<br />
cervicornis and Scolymia lacera<br />
were present decreased significantly<br />
(P
tinel species; they bleach at a slightly<br />
lower threshold than many of the<br />
other corals. M. complanata cover<br />
decline was greatest from 1998 to<br />
1999 and has not recovered since<br />
then (Table 7.8). The percent cover<br />
and frequency of occurrence of corals<br />
improved slightly after 2001. The<br />
bleaching event in 1997 may have<br />
stressed M. complanata, and a second<br />
exposure to hypothermia in 1998<br />
may have been sufficient to reduce<br />
the population drastically.<br />
The golden sea mat (Palythoa mammillosa)<br />
is conspicuous in shallow<br />
reefs. The CREMP analysis pooled<br />
all zooanthids (Zoanthus spp., Palythoa<br />
spp., Ricordia spp.) into a single<br />
category. Virtually all zoanthids observed<br />
in the images were P. mammillosa.<br />
Unlike the fire coral, (M.<br />
complanata), P. mammillosa showed<br />
little change in cover after the bleaching<br />
disturbance (Table 7.9). A slight<br />
reduction in the mean percent cover<br />
of P. mammillosa occurred between<br />
1997 and 1998, although population<br />
levels equaled or exceeded the prebleaching<br />
period in 2000 and subsequent<br />
years.<br />
Hurricane Georges crossed the<br />
Straits of Florida near Key West on<br />
September 25, 1998. Sombrero Key<br />
C-MAN buoy recorded a maximum<br />
sustained wind of 82 knots with a<br />
peak gust to 92 knots at 1500 Universal<br />
Time on September 25 (Table<br />
7.10). Hurricane Georges’ greatest<br />
influence on coral reef communities<br />
was between Sombrero Key and<br />
Dry Tortugas. The hurricane’s impact<br />
was evidenced by the change<br />
in Acropora palmata cover, which<br />
decreased in range, mean, and frequency<br />
of occurrence after Hurricane<br />
Georges (Table 7.11). Sampling occurred<br />
before the hurricane struck in<br />
1998, thus the major decline is most<br />
noticeable in 1999 and subsequent<br />
years. A. palmata exhibited the high-<br />
est pre-hurricane cover at Western<br />
The State of Coral Reef Ecosystems of Florida<br />
Figure 7.15. Mean percent live coral cover in the Florida Keys National <strong>Marine</strong> Sanctuary<br />
between 1996 and 2003. Source: Jaap et al., 2003.<br />
Table 7.8. Descriptive statistics for annual percent cover of Millepora complanata in<br />
the Florida Keys National <strong>Marine</strong> Sanctuary between 1996 and 2002. Source: Jaap<br />
et al., 2003.<br />
YEAR 1996 1997 1998 1999 2000 2001 2002<br />
Range 0-15.71 0-17.33 0-16.44 0-1.88 0-1.19 0-0.85 0-0.49<br />
Mean 2.55 2.23 1.56 0.19 0.13 0.09 0.11<br />
Std.dev. 4.54 4.05 3.25 0.37 0.28 0.18 0.17<br />
Freq. 0.85 0.85 0.72 0.48 0.33 0.41 0.46<br />
Table 7.9. Descriptive statistics for annual percent cover of Palythoa mammillosa in<br />
the Florida Keys National <strong>Marine</strong> Sanctuary between 1996 and 2002. Source: Jaap<br />
et al., 2003.<br />
YEAR 1996 1997 1998 1999 2000 2001 2002<br />
Range 0-25.54 0-24.69 0-20.01 0-22.48 0-24.45 0-21.54 0-25.39<br />
Mean 4.36 4.97 4.4 4.25 4.61 4.48 5.3<br />
Std.dev. 5.4 5.74 4.95 5.11 5.67 5.6 6.32<br />
Freq. 0.92 0.97 0.92 0.94 0.92 0.92 0.89<br />
Table 7.10. Data on conditions during Hurricane Georges at C-MAN Stations in the<br />
Florida Keys, October, 1999. Source: NOAA National Hurricane Center, http://www.<br />
nhc.noaa.gov/abouttafb.shtml, Accessed: 2/14/2004.<br />
LOCATION PRESS.<br />
(mb)<br />
DATE/TIME<br />
(UTC)<br />
SUSTAINED<br />
WIND<br />
(kts)<br />
PEAK<br />
GUST<br />
(kts)<br />
DATE/<br />
TIME<br />
(UTC)<br />
Lake Worth, FL 1010.0 25/1100 30 35 25/1400<br />
Fowey Rocks, FL 1006.3 25/1000 45 52 25/1000<br />
Molasses Reef, FL 1003.1 25/0800 46 53 25/1400<br />
Long Key, FL 1000.0 25/1000 47 58 25/1400<br />
Sombrero Key, FL 994.5 25/1300 81 92 25/1500<br />
Sand Key, FL 990.5 25/1300 56 71 25/1400<br />
Dry Tortugas, FL 976.3 25/2000 59 68 26/0000<br />
Sambo station two: 15.28% in 1996 and 16.34% in 1997 (Table 7.11). Figure 7.16 provides evidence of the<br />
coral cover loss attributed to Hurricane Georges.<br />
Florida<br />
Sidebar<br />
page<br />
171
Florida<br />
page<br />
172<br />
The State of Coral Reef Ecosystems of Florida<br />
The National Hurricane Center reported<br />
that Tropical Storm Irene<br />
reached hurricane status over the<br />
Florida Straits on October 14, 1999.<br />
The center moved over Key West<br />
on October 15 (Table 7.12). Most<br />
of the hurricane force winds were<br />
confined to the east of Irene’s center<br />
over the lower to middle Florida<br />
Keys. Irene made its fourth landfall<br />
near Cape Sable, Florida and then<br />
moved across southeast Florida before<br />
crossing the Keys, into the Everglades.<br />
Its sustained and peak wind<br />
gusts were less than those of Hurricane<br />
Georges (Table 7.10). The second<br />
hurricane in 13 months disturbed<br />
offshore shallow reefs, but since Hurricane<br />
Georges had already reduced<br />
populations of A. palmata and other<br />
organisms, Hurricane Irene’s influence<br />
was somewhat muted.<br />
Frequency and Distribution of<br />
Coral Diseases<br />
Methods<br />
A broad-scale survey to determine<br />
the frequency and distribution of coral<br />
disease in the Florida Keys was conducted<br />
in August 2000 and incorporated<br />
30 sites from Key Biscayne to<br />
the Dry Tortugas. Sites were located<br />
in Biscayne National Park, FKNMS,<br />
New Grounds, and the Dry Tortugas<br />
National Park. A sampling protocol<br />
similiar to those used in EPA’s Environmental<br />
Monitoring and Assessment<br />
Program was used to select<br />
site locations (Summers et al., 1995;<br />
Santavy et al., 2001). The probabilistic<br />
sampling design was generated<br />
and implemented to estimate the<br />
baseline condition of reef corals to<br />
Table 7.11. Descriptive statistics for annual percent cover of Acropora palmata in the<br />
Florida Keys National <strong>Marine</strong> Sanctuary between 1996 and 2002. Source: Jaap et<br />
al., 2003.<br />
YEAR 1996 1997 1998 1999 2000 2001 2002<br />
Range 0-15.28 0-16.34 0-9.96 0-3.40 0-2.72 0-2.44 0-4.88<br />
Mean 2.97 2.91 1.79 0.4 0.33 0.27 0.4<br />
Std.dev. 4.6 4.55 3.2 0.9 0.73 0.58 0.98<br />
Freq. 0.44 0.44 0.38 0.28 0.3 0.28 0.28<br />
Figure 7.16. Loss of Acropora palmata along a video transect at Western Sambo,<br />
Florida Keys between 1996 and 2000. Source: Jaap et al., 2003.<br />
Table 7.12. Data on conditions during Hurricane Irene at C-MAN Stations in the<br />
Florida Keys, October, 1999. Source: NOAA National Hurricane Center, http://www.<br />
nhc.noaa.gov/abouttafb.shtml, Accessed: 2/14/2004.<br />
LOCATION PRESS.<br />
(mb)<br />
DATE/<br />
TIME<br />
(UTC)<br />
SUSTAINED<br />
WIND<br />
(kts)<br />
PEAK<br />
GUST<br />
(kts)<br />
DATE/<br />
TIME<br />
(UTC)<br />
Sombrero Key C-MAN 990.5 15/1700 57 69 15/1530<br />
Molasses Reef C-MAN 991.5 15/2100 53 64 15/2020<br />
Long Key C-MAN 988.7 15/2000 50 61 15/2000<br />
Sand Key C-MAN 987.0 15/1200 43 57 15/0610<br />
Dry Tortugas C-MAN 41 51 15/0850<br />
Key West Intl. Airport 987.6 15/1010 38 47 15/0518<br />
compare with future assessments. The survey will be repeated in August <strong>2005</strong>.<br />
The study produced unbiased estimates of coral condition with a quantifiable level of uncertainty for the distribution<br />
and frequency of coral diseases in the Florida Keys. The distribution of coral disease was assessed<br />
as present or absent for each site. The frequency of coral disease was the percentage of diseased coral from<br />
each site. The area represented by the study was 41 km 2 of the South Florida Keys Tract. The reef areas of<br />
the Florida Keys (Upper, Middle, and Lower Keys; New Grounds; and Dry Tortugas) that contained hard coral<br />
bottom were demarcated based on benthic habitat maps of the Florida Keys (FMRI, 1998). Habitat boundaries<br />
were redefined by experts to include areas known to have living corals and to eliminate areas that contained<br />
only dead or geological reef structure. The design was developed in three steps: (1) regional stratification, (2)<br />
overlay of a hexagonal grid on the sample frame, and (3) random selection of multiple sites within grid cells<br />
(Summers et al., 1995; Santavy et al., <strong>2005</strong>).
The State of Coral Reef Ecosystems of Florida<br />
Results and Discussion<br />
The areal estimates of coral disease generated by the 2000 survey indicated that at least one coral colony affected<br />
by active disease was observed in 85% ± 9 (95% confidence intervals) of the area sampled. Coral disease<br />
was widely dispersed throughout the Florida Keys Reef Tract and did not seem to be confined to a particular<br />
region. While the presence or distribution of disease was widespread, the proportion of colonies affected<br />
by disease or disease prevalence at any particular location was significantly less. The maximum percent of<br />
coral colonies affected with disease or maximum prevalence of coral disease in South Florida at any one site<br />
during August 2000 was 13%, with 2.2% ± 4 (97 ha) of the sampling area containing this maximum level of<br />
coral disease (Figure 7.17). Approximately 15% ± 9 (662 ha) of the area sampled contained no coral disease,<br />
whereas 31% ± 14 (1,369 ha) of the area had between 0.4%- 2.2% of the colonies affected by coral disease.<br />
Approximately 28% ± 15 (1,236 ha) of the area had greater than 2% and no more than 4% of colonies affected<br />
by disease. Finally, 24% ± 4 (1,060 ha) of the sampled area had between 4% and 9% frequency of coral disease.<br />
By establishing this baseline, future surveys can examine changes and trends in the spatial and tempo-<br />
ral distribution and frequency of coral disease in South Florida (Santavy et al., <strong>2005</strong>). This approach will allow<br />
the condition of reefs to be classified<br />
generally from excellent to degraded,<br />
to better communicate their status to<br />
the public and policy makers.<br />
Regional Coral Disease Assessments<br />
Methods<br />
Coral disease prevalence was compared<br />
between different geographical<br />
regions in the Dry Tortugas, New<br />
Grounds, Key West region, Lower<br />
Keys, Middle Keys, and Upper Keys<br />
from 1998 to 2002 (Figure 7.18). All<br />
surveys were conducted using a radial<br />
arc transect method developed for<br />
the coral disease surveys (Santavy<br />
et al., 2001). If the location had sufficient<br />
coral coverage (>5%), a permanent<br />
installation was made and<br />
the site was surveyed. Only the 8-10<br />
m segment of the radial arc transect<br />
(113 m 2 ) was necessary to estimate<br />
coral disease (Mueller et al., 1998;<br />
Santavy et al., 1999a, 2001). Twenty-two<br />
species of scleractinian corals<br />
and gorgonian sea fans were surveyed<br />
and only colonies greater than<br />
10 cm were counted. M. annularis, M.<br />
faveolata, and M. franksii, the three<br />
species of coral contained within the<br />
Montastraea annularis complex (Weil<br />
and Knowlton, 1994) were combined<br />
as a single taxon, M. annularis, for<br />
data analysis. Two gorgonian sea<br />
fan species were combined as Gorgonia<br />
spp.<br />
Only coral colonies containing active<br />
disease lesions were enumerated.<br />
Figure 7.17. Frequency of coral disease or percent area having 0-13% of colonies<br />
affected by coral diseases in South Florida Keys Tract. Error bars represent 95%<br />
confidence levels. Source: Santavy et al., <strong>2005</strong>.<br />
Figure 7.18. Map of the coral disease assessment regions, in which all the sites<br />
were contained in this study, including areas in Dry Tortugas National Park, New<br />
Grounds, Key West, Lower Keys, Middle Keys, Upper Keys and Biscayne National<br />
Park. Source: Santavy et al., <strong>2005</strong>.<br />
Florida<br />
Sidebar<br />
page<br />
173
Florida<br />
page<br />
174<br />
The State of Coral Reef Ecosystems of Florida<br />
The diseases consistently assessed are listed in Table 7.13. Signs used to distinguish coral diseases were obtained<br />
from published literature (McCarty and Peters, 1998; Patterson et al., 2002; Santavy and Peters, 1997;<br />
Santavy et al., 1999a,b, 2001). No distinction was made between white plague type 1 and 2 (Dustan,1977;<br />
Richardson et al.,1998a,b). Additionally, a combination of 13 disease conditions obtained from published literature<br />
was used to identify seafan disease (Smith et al., 1996; Nagelkerken et al., 1997a, b; Santavy et al.,<br />
2001; Kim and Harvell, 2002).<br />
Table 7.13. Diseases assessed in surveys with corresponding abbreviations and references detailing the signs used in assessing<br />
condition. Source: Santavy et al., <strong>2005</strong>.<br />
DISEASE NAME DISEASE<br />
ABBREVIATION<br />
SPECIES AFFECTED IN TROPICAL WESTERN<br />
ATLANTIC<br />
REFERENCES<br />
Sea Fan Disease SD Gorgonia spp. Nagelkerken et al., 1997a, b;<br />
Smith et al., 1996.<br />
Black Band Disease BB Diploria strigosa, D. labyrinthiformis, Colpophyllia natans,<br />
Montastraea cavernosa, M. annularis, M. frankii,<br />
M. faveolata, Siderastrea siderea, Gorgonia spp.<br />
Dark Spot Disease DS C. natans, M. annularis (species complex), S. siderea,<br />
Stephanocoenia intersepta<br />
Antonius,1981; Rützler et<br />
al.,1983; Rützler & Santavy,<br />
1983.<br />
Garzón-Ferreira and Gil, 1998.<br />
Hyperplasia HP D. strigosa, Dichocoenia stokesii Peters et al., 1986.<br />
Patchy Necrosis/<br />
White Pox<br />
PX Acropora palmata Bruckner and Bruckner, 1997;<br />
Patterson et al., 2002.<br />
Red Band Disease RB Gorgonia spp., C. natans Rützler and Santavy, 1983;<br />
Richardson, 1993.<br />
White Plague WP D. stokesii, Agaricia agaricites, A. lamarchi, C.<br />
natans, Dendrogyra cylindrus, D. labyrinthiformis, D.<br />
strigosa, Eusmilia fastigiata, Madracis decactis, M.<br />
mirabilis, Manicina areolata, Meandrina meandrites,<br />
M. annularis (species complex), M. cavernosa, S.<br />
siderea, Solenastrea bournoni, Stephanocoenia michilinii,<br />
and hydrocoral Millepora alcycornis.<br />
Richardson et al.,1998a, b.<br />
White Band Disease 1 WB1 A. cervicornis, A. palmata, A. prolifera Gladfelter, 1982; Peters, 1993.<br />
White Band Disease 2 WB2 A. cervicornis Ritchie and Smith, 1998.<br />
Yellow Blotch Disease YB M. faveolata, M. annularis Santavy et al.,1999b.<br />
Results and Discussion<br />
The percentage of diseased coral colonies ranged from 0-43% among all the sites surveyed during the four<br />
sampling periods. No geographic location was consistently identified as a ‘hotspot’ where a high level of disease<br />
was sustained at the same site for multiple survey periods. The greatest percentage of diseased colonies<br />
occurred at Looe Key back reef site during summer 1998; 42.9% of all the colonies were diseased, with<br />
white pox affecting 41.4% of them. Twelve sites had over 20% of the colonies diseased at a single sampling<br />
period, and six occurred during the summer 1998 sampling period (Table 7.14). Five of these six sites occurred<br />
in the Key West and Lower Keys regions, with white pox affecting the majority of these colonies. The<br />
other site was WH01 in the Dry Tortugas. These disease events co-occurred with the single most severe and<br />
massive bleaching event recorded in modern history. Table 7.15 shows the percentage of diseased corals<br />
encountered in each region. Each region was not assessed during each survey due to limitations based on<br />
level of support available. The 2001 survey was incomplete due to the termination of cruises after the events<br />
of September 11, 2001.
The State of Coral Reef Ecosystems of Florida<br />
Table 7.14. Sites with at least 20% disease prevalence in a survey. Abbreviation for diseases: DS=Dark Spots Disease; PX=White Pox<br />
Disease; PX_WB=White Pox Disease and White Band Disease on same colony; SD=Seafan Disease; and WB=White Band Disease.<br />
Source: Santavy et al., <strong>2005</strong>.<br />
REGION SITE YEAR PERIOD % DISEASED* PRIMARY<br />
DISEASE<br />
% PRIMARY<br />
DISEASE<br />
OTHER IMP.<br />
DISEASES<br />
Dry Tortugas White Shoals 2 1998 Summer 22.86 9 SD 17.14 DS, WB<br />
Dry Tortugas Bird Key 4 1999 Spring 28.33 6 PX 27.50 WB<br />
Dry Tortugas Bird Key 5 1999 Spring 27.37 8 PX 27.37<br />
Key West Rock Key 3 1998 Summer 27.27 8 PX 18.80 WB<br />
Key West Sand Key 2 1998 Summer 36.61 3 PX 16.94 WB, PX_WB<br />
Key West Sand Key 5 1998 Summer 27.78 7 PX 22.22 WB<br />
Lower Keys E. Sambo 3 1998 Summer 31.91 5 PX 31.91<br />
Lower Keys Looe Key 3 1998 Summer 42.86 1 PX 41.43 WB<br />
Middle Keys Alligator Reef 2 1998 Spring 22.22 10 SD 22.22<br />
Upper Keys Carysfort Reef 2 1998 Spring 20.00 11 SD 20.00<br />
Upper Keys Carysfort Reef 3 1998 Spring 32.29 4 SD 23.53 PX<br />
Upper Keys Carysfort Reef 3 1999 Spring 40.00 2 PX 25.00 WB, DS<br />
Table 7.15. Percent diseased colonies for each geographic region sampled from<br />
1998 to 2002. Source: Santavy et al., <strong>2005</strong>.<br />
REGION YEAR PERIOD % DISEASED<br />
Dry Tortugas 1998 Spring 4.49<br />
1998 Summer 4.93<br />
1999 Spring 4.51<br />
2000 Summer 4.61<br />
2002 Summer 3.64<br />
New Grounds 1998 Spring 0.98<br />
1998 Summer 1.13<br />
2000 Summer 0.46<br />
Key West 1998 Spring 5.91<br />
1998 Summer 12.8<br />
1999 Spring 6.84<br />
2000 Summer 5.34<br />
2002 Summer 4.55<br />
Lower Keys 1998 Spring 6.81<br />
1998 Summer 21.19<br />
1999 Spring 6.41<br />
2002 Summer 4.55<br />
Middle Keys 1998 Spring 3.36<br />
1998 Summer 1.84<br />
1999 Spring 2.46<br />
2002 Summer 2.38<br />
Upper Keys 1998 Spring 14.17<br />
1998 Summer 9.8<br />
1999 Spring 4.23<br />
2002 Summer 3.22<br />
Biscayne National Park 1998 Spring 8.77<br />
1998 Summer 3.91<br />
1999 Summer 0.6<br />
Florida<br />
Sidebar<br />
page<br />
175
Florida<br />
page<br />
176<br />
The State of Coral Reef Ecosystems of Florida<br />
Acroporid Species in the Upper<br />
Keys<br />
Methods<br />
The surviving Acropora spp. populations<br />
in the Upper Florida Keys are<br />
scarce and highly patchy in distribution,<br />
requiring a focal monitoring approach.<br />
In 1998, annual monitoring<br />
of Acropora palmata populations and<br />
their snail predators (Coralliophila abbreviata)<br />
was initiated at four sites in<br />
the FKNMS. Annual surveys record<br />
data on size structure and condition<br />
of A. palmata colonies at each site as<br />
well as snail infestation, damselfish<br />
territories, and disease prevalence<br />
(see Miller et al., 2002 for complete<br />
methods). Since 2002, individual colonies<br />
of Acropora palmata and A. cervicornis<br />
have been monitored at four<br />
sites in the FKNMS and four sites in<br />
Biscayne National Park (BNP). Approximately<br />
20 colonies at each site<br />
were chosen to reflect the range of<br />
conditions present at that site (e.g.,<br />
health, disease, predation). Colonies<br />
were tagged, mapped, extensively<br />
photographed, measured (length,<br />
width, and height), assessed for condition,<br />
and re-surveyed at 4-5 month<br />
intervals.<br />
Results and Discussion<br />
The annual survey of A. palmata<br />
patches shows that a substantial<br />
decline occurred between 1998 and<br />
1999. This interval included two major<br />
disturbances: Hurricane Georges<br />
and a major bleaching event. Since<br />
then, abundance of live coral at these<br />
four sites has remained fairly stable<br />
but has not shown any recovery (Figure<br />
7.19). The proportion of colonies<br />
infested by snail predators increased<br />
Figure 7.19. Total live area (sum of length x width x % live cover) of Acropora palmata<br />
at fully censused sites off Key Largo, FL from 1998 to 2003. Source: Miller et<br />
al., 2002.<br />
Figure 7.20. Average prevalence of Acropora palmata surveyed from reefs (n = 6)<br />
in the Upper Florida Keys that were infested with snails (Coralliophila abbreviata)<br />
inhabited by three-spot damselfish (Stegastes planifrons) or displayed active signs<br />
of disease (including White Band Disease and White Pox/Patchy Necrosis). Surveys<br />
were conducted at 6 reefs including South Carysfort, Horse Shoe, Little Grecian,<br />
French, Pickles, and Molasses reefs. Source: Miller et al., 2002.<br />
in 1999 following this decline in coral abundance, but has rebounded back to its previous (1998) level of about<br />
15-20% (Figure 7.20). A similar proportion of colonies are affected by three-spot damselfish biting, but a much<br />
smaller percentage of A. palmata colonies display signs of active disease (Figure 7.20).<br />
Over most of the study period, predation by snails appeared to be the condition posing greatest impact to recruits<br />
of both species in terms of both live tissue loss and decreased growth of individuals. Snail predation is<br />
also the most prevalent threat at the population level. However, in April 2003, this individual-based monitoring<br />
of Acropora spp. colonies led to the discovery of a coral disease outbreak at White Bank Dry Rocks (Figure<br />
7.21). In the observed outbreak, approximately 65% of the A. cervicornis colonies had significant or total
tissue loss. The tagged population<br />
(n=19 colonies) showed a loss of<br />
mean colony live tissue coverage<br />
from 95% prior to the outbreak to<br />
less than 15% in a follow-up survey<br />
in February 2004. This event emphasizes<br />
the vulnerability of Acropora<br />
spp. recovery to stochastic events<br />
which are difficult, if not impossible to<br />
manage or mitigate.<br />
ASSOCIATED BIOLOGICAL COMMUNITIES<br />
FISH<br />
The State of Coral Reef Ecosystems of Florida<br />
Figure 7.21. An Acropora cervicornis colony displays rapid tissue loss at White Bank<br />
Dry Rocks, Florida Keys. During this outbreak in spring 2003, many colonies exhibited<br />
this condition at several other reef sites in the Florida Keys. Source: Miller et al.,<br />
2002.<br />
Fishery-Dependent Monitoring<br />
Various programs that collect data directly from Florida fisheries are summarized in Table 7.16.<br />
Table 7.16. Florida fishery-dependent data collection programs. Source: J. Bohnsack, NOAA Fisheries, SEFSC.<br />
PROGRAM TARGET AGENCY DATE STARTED<br />
<strong>Marine</strong> Recreational Fishing Recreational fishing from shore, bridge, NOAA Fisheries 1979<br />
Statistical Survey (MRFSS) private, rental and charter boats<br />
NMFS Headboat Survey Recreational headboat landings and<br />
biostatistical sampling<br />
NOAA Fisheries 1978<br />
Recreational world record Largest fish landed by recreational angling by International Gamefish<br />
1939<br />
gamefish<br />
line class and rod type by men and women Association (IGFA)<br />
Recreational fishing licenses Recreational marine angling, spiny lobster Florida Fish & Wildlife<br />
1990<br />
diving<br />
Conservation Commission<br />
Florida Trip Ticket System Commercial food fish and invertebrate Florida Fish & Wildlife<br />
1986<br />
landings<br />
Conservation Commission<br />
Florida Trip Ticket System Commercial marine life fisheries Florida Fish & Wildlife<br />
Conservation Commission<br />
1990<br />
General Canvass Landings<br />
Statistics (GCLS)<br />
Commercial landings NOAA Fisheries 1967<br />
Trip Interview Program (TIP) Commercial biostatistical data NOAA Fisheries 1985<br />
Commercial Logbook Program Commercial fishing by fish traps, longlines NOAA Fisheries 1993<br />
Commercial vessel registrations Number of commercial vessels NOAA Fisheries 1985<br />
Biscayne National Park (BNP) Recreational fishing within and adjacent to Biscayne National Park 1976<br />
Creel Census<br />
BNP<br />
Everglades National Park Recreational fishing within and adjacent to Everglades National Park 1972<br />
(ENP) Creel Census<br />
ENP<br />
Florida<br />
Sidebar<br />
page<br />
177
Florida<br />
page<br />
178<br />
The State of Coral Reef Ecosystems of Florida<br />
Florida Fish and Wildlife Conservation Commission<br />
The FFWCC has collected commercial food fish landings since 1986 and commercial marine life fishery statistics<br />
since 1990. NOAA Fisheries (U.S. DOC, 2003) collects landings data for commercial and recreational<br />
food fisheries, and for recreational charter boats, headboats, private boats and shore fishing. Commercial and<br />
recreational spiny lobster fishing effort is reflected by the number of licenses issued (Figures 7.22 and 7.23).<br />
Results and Discussion<br />
Native Americans fished for reef fishes<br />
on Florida reefs long before the arrival<br />
of European settlers (Oppel and<br />
Meisel, 1871). Reef fishing accelerated<br />
in the 1920s. Following growing<br />
public conflicts and sharp declines<br />
in catches, monitoring programs at<br />
the species level began in the early<br />
1980s (Bohnsack et al., 1994; Bohnsack<br />
and Ault, 1996; Harper et al.,<br />
2000).<br />
Fishery-dependent reef fish landings<br />
trends were reported for the Florida<br />
Keys (Bohnsack et al., 1994). Reef<br />
fishes accounted for 58% of fish<br />
landings. From 1981-1992, mean<br />
total annual landings from recreational<br />
reef fisheries in the Florida<br />
Keys (Monroe County) were 0.107<br />
x 106 kg for headboats in the Tortugas<br />
0.201 x 10⁶ kg for the rest of the<br />
Keys, and 1.79 x 10⁶ kg for other recreational<br />
fisheries. In comparison,<br />
total commercial reef fishery landings<br />
were 2.12 x 10⁶ kg for spiny lobster,<br />
1.25 x 10⁶ kg for pink shrimp, 0.17 x<br />
106 kg for grouper, and 1.00 x 10⁶ kg<br />
(using 1992 as a benchmark). In the<br />
1980s, pink shrimp landings declined<br />
to approximately 40% of previous<br />
levels while total grouper declined to<br />
less than half of previous levels. Increases<br />
in landings were reported for<br />
yellowtail snapper, amberjack, and<br />
various jacks.<br />
Harper et al. (2000) described trends<br />
in the recreational hook-and-line and<br />
diving fishery in the BNP from 1976-<br />
1991 in which more than 170 taxa<br />
were recorded. Mean annual land-<br />
Figure 7.22. Commercial landings and license C-numbers for the spiny lobster fishery<br />
in Florida. Commercial landings include catch from traps and from diving. License<br />
numbers overestimate the number of vessels since some vessels may have<br />
more than one set of C-numbers. Landings for 2003-4 are preliminary. Source:<br />
Florida Fish and Wildlife Conservation Commission, unpublished data.<br />
Figure 7.23. Numbers of recreational licenses for the spiny lobster fishery in Florida<br />
(1991-2002). Source: Florida Fish and Wildlife Conservation Commission.<br />
ings were 4.77 fish/angler/trip (ranging from 3.80 in 1991 to 5.83 in 1981) and dropped significantly in years<br />
following Florida’s adoption of new minimum size restrictions in 1985 and 1990. Spiny lobster landings averaged<br />
8.02 per trip and releases averaged 5.73 per trip. Spearfishing accounted for 12% of trips and 10.3% of<br />
fish landed by numbers.
In a report to the U.S. Congress<br />
(U.S. DOC, 2003) the SAFMC listed<br />
six Florida reef fishes (speckled hind,<br />
warsaw grouper, black grouper, red<br />
porgy, goliath grouper, and Nassau<br />
grouper) as either overfished (i.e.,<br />
depleted below minimum standards)<br />
or undergoing overfishing (i.e., being<br />
fished at a rate that would lead<br />
to overfishing), four species were<br />
not overfished and 46 species were<br />
in unknown condition. The GMFMC<br />
listed two species, goliath and Nassau<br />
grouper, as either overfished<br />
or undergoing overfishing, while 26<br />
were in unknown condition. More recently<br />
hogfish (Lachnoliamus maximus)<br />
stocks were shown to be overfished<br />
and undergoing overfishing in<br />
the Florida Keys (Ault et al., 2003)<br />
The State of Coral Reef Ecosystems of Florida<br />
Figure 7.24. Estimated total annual fishing mortality rates (1985-2000) for Florida<br />
hogfish showing commercial (light) and recreational (dark) contributions. Source:<br />
Ault et al., 2003.<br />
although fishing mortality trends showed a gradual decrease following a fish trap prohibition in 1990 and establishment<br />
of minimum size regulations in 1993 (Figure 7.24).<br />
A yellowtail snapper (Ocyurus chrysurus) stock assessment (Muller et al., 2003) showed landing trends increased<br />
from 1000 mt in 1981 to 1643 mt in 1993, and then declined to 802 mt in 2001. Effort followed a<br />
similar trend as landings, increasing to a peak and then declining. Compliance with the 30.5 cm minimum size<br />
limit was high. Noncompliance, depending on the region, was 2% for commercial, 4-5% for recreational, and<br />
2-3% for headboat fisheries. Only 0.2% of anglers in the Atlantic region and 1.3% in the Keys exceed the 10<br />
fish per trip limit. The assessment concluded that the stock was neither undergoing overfishing or overfished<br />
(http://www.sefsc.noaa.gov/SEDAR2/yellowtailFinal.<strong>pdf</strong>, Accessed 02/09/05).<br />
Goliath grouper (Epinephelus itajara) fishing was closed in Florida and Atlantic waters in 1990 and in the Gulf<br />
of Mexico in 1992. In 2003, evidence indicated that the stock was rebuilding and had a 50% chance of being<br />
rebuilt by 2006 in its historical core habitat range in southern Florida (Porch et al., 2003).<br />
Fishery-Independent Monitoring<br />
Several monitoring programs collect resource data independent of Florida fisheries.<br />
NOAA Reef fish visual census<br />
Fishing mortality rate<br />
Methods<br />
The NOAA Southeast Fisheries Science Center’s reef fish visual census (RVC) method has used non-destructive<br />
visual survey methods to assess reef fish communities and habitat associations in the Florida Keys since<br />
1979. The goals of the method are to monitor trends and habitat associations of the entire reef fish fauna, and<br />
to monitor changes in various MPAs and specifically in FKNMS marine reserves following their establishment<br />
in 1997 and 2001. A stationary, centrally located diver in a random 7.5 m-radius plot assesses reef fish composition,<br />
abundance (density), and size structure. All species observed for five minutes are listed, counted,<br />
and their sizes estimated. Habitat features and depth are also recorded. Details on reef fish monitoring field<br />
methods and data processing and analyses are published in Bohnsack and Bannerot (1986) and Bohnsack<br />
et al. (1999).<br />
Florida<br />
Sidebar<br />
page<br />
179
Florida<br />
page<br />
180<br />
The State of Coral Reef Ecosystems of Florida<br />
Results and Discussion<br />
The RVC database was used to assess condition and retrospective changes in reef fish stocks in the Florida<br />
Keys. Ault et al. (1998) showed that a total of 13 of 16 groupers, seven of 13 snappers, and two of five grunts<br />
were found to be below the 30% spawning potential ratio the Federal definition of overfishing at that time.<br />
Some stocks appeared to have been chronically overfished since the late 1970s. Thus, 65% of the 35 assessed<br />
exploited reef fish stocks were below the then-existing Federal standards for sustainability.<br />
Monitoring of Sanctuary Preservation Areas<br />
Methods<br />
In 1997, the FKNMS established multiple no-take marine reserves, or “sanctuary preservation areas.” Annual<br />
underwater visual surveys have been conducted to assess changes in reef fish populations in areas open and<br />
closed to fishing compared to baselines established between 1994 and 1997.<br />
Results and Discussion<br />
A gradient of fishing impacts in the Florida Keys was found - from a high near human population centers near<br />
Miami in the BNP (Ault et al., 2001; Harper et al., 2000) and decreasing to a low southwest to the Dry Tortugas<br />
(Ault et al., 2002). In the BNP, the average size fish within the exploited phase for 35 important fishery spe-<br />
cies has remained relatively constant for the last 25 years and is very close to minimum size of capture and<br />
not to the historically unfished population<br />
size (Ault et al., 2001). The average<br />
size of adult black grouper, for<br />
example, was estimated to be 40% of<br />
what it was in 1940, fishing mortality<br />
was several times the level needed<br />
to achieve optimum yield (Figure<br />
7.25), and the spawning stock is now<br />
less than 5% of its historical unfished<br />
maximum (Figure 7.25).<br />
Overall, 77% of the 35 stocks that<br />
could be analyzed were overfished<br />
by federal standards, including 13 of<br />
16 grouper species, 11 of 13 snapper,<br />
barracuda, and two of five grunt.<br />
In addition, stock biomass was below<br />
standards for most of the key targeted<br />
species within the reef fish fishery<br />
(Figure 7.26).<br />
Figure 7.25. Fishery assessment for black grouper, Mycteroperca bonaci, in Biscayne<br />
National Park and the Florida Keys. Source: Ault et al., 2001.
The State of Coral Reef Ecosystems of Florida<br />
Figure 7.26. Fishery management benchmark spawning potential ratio (SPR) analyses for 35 exploited species of Biscayne National<br />
Park-Florida Keys reef fish, comprising groupers, snappers and hogfish, grunts and great barracuda. Filled bars indicate stock ‘overfishing’<br />
and hatched bars indicate the stock is above the 30% SPR (U.S. Federal standard). Asterisk indicates estimate from headboat<br />
data outside BNP. The high SPR estimate for Nassau grouper is dubious. Source: Ault et al., 2001.<br />
Florida<br />
Sidebar<br />
page<br />
181
Florida<br />
page<br />
182<br />
The State of Coral Reef Ecosystems of Florida<br />
Changes in no-take and fished zones<br />
were assessed and compared to a<br />
four-year baseline (1994-1997) established<br />
before new zone regulations<br />
were implemented in 1997.<br />
Although no-take zones established<br />
in 1997 comprised only 0.5% of the<br />
FKNMS, they included about 5.5%<br />
of the reef habitat because no-take<br />
zones were preferentially selected<br />
to include reefs. Preliminary results<br />
showed a significant and dramatic increase<br />
in mean density of exploitablesized<br />
individuals, but no significant<br />
changes for two species not targeted<br />
by fishing. In no-take zones within<br />
the first three years (1998-2000),<br />
densities of economically important<br />
exploitable phase yellowtail snapper<br />
(Ocyurus chrysurus) (Figure 7.27)<br />
and combined grouper (Serranidae)<br />
increased significantly compared to<br />
baseline levels. In the fourth year,<br />
gray snapper (Lutjanus griseus) had<br />
also increased significantly. In comparison,<br />
average densities of two<br />
non-exploited species, striped parrotfish<br />
(Scarus croicensis) and stoplight<br />
parrotfish (Sparisoma viride), were<br />
essentially unchanged compared to<br />
baseline performance ranges.<br />
Figure 7.27. Changes in density for yellowtail snapper (Ocyurus chrysurus) inside<br />
and outside marine reserves in the FKNMS. Source: Ault et al., 2001.
Ferro et al. (2003) used the RVC<br />
method to monitor reef fish trends<br />
and describe reef composition of the<br />
three reef tracts off Broward County,<br />
Florida from 1998-2002 (Figure 7.2).<br />
They collected 667 samples comprising<br />
86,463 individuals of 208 species<br />
from 52 families and showed that reef<br />
fish abundance, total biomass and<br />
species richness increased from inshore<br />
to offshore reefs.<br />
The State of Coral Reef Ecosystems of Florida<br />
Figure 7.28. Mean fish species richness, abundance, and biomass (n = 667) on the<br />
three reef tracts off Broward County, Florida from 1998 to 2002. Source: Ferro et al.<br />
2003.<br />
Florida<br />
Sidebar<br />
page<br />
183
Florida<br />
page<br />
184<br />
The State of Coral Reef Ecosystems of Florida<br />
Reef Environmental Education<br />
Foundation Reef Fish Monitoring<br />
The Reef Environmental Education<br />
Foundation (<strong>REEF</strong>) is a nonprofit organization<br />
that trains amateur divers<br />
to conduct standardized volunteer<br />
surveys of reef fishes in an effort to<br />
monitor species distributions and<br />
changes in reef fish occurrence.<br />
Methods<br />
Volunteers used a roving diver technique<br />
(Schmitt and Sullivan, 1996) to<br />
develop a comprehensive species list<br />
from a dive site and multiple surveys<br />
to calculate percent frequency-of-occurrence<br />
from a dive site. For each<br />
dive, observed species are scored in<br />
abundance categories based on what<br />
a diver observed. Between 1994 and<br />
2004, over 55,595 individual surveys<br />
have been conducted in the Tropical<br />
Western Atlantic Ocean. A total of<br />
11,105 surveys were collected in the<br />
Florida Keys through 2002. Details of<br />
methods are available at http://www.<br />
reef.org/ (Accessed 01/23/05).<br />
<strong>REEF</strong> fish monitoring involves expert<br />
<strong>REEF</strong> divers (members of the<br />
Advanced Assessment Team) that<br />
visit certain sites to do repeated fish<br />
surveys. Figure 7.29 shows trends in<br />
sighting frequency for Nassau grouper<br />
at no-take reserves and comparable<br />
fished sites in the FKNMS.<br />
Figure 7.30 shows trends for four angelfish<br />
species.<br />
MACROINVERTEBRATES<br />
Figure 7.29. Changes in mean sighting frequency for Nassau grouper at 16 reefs in<br />
no-take marine reserves and 11 fished reference reefs in the Florida Keys National<br />
<strong>Marine</strong> Sanctuary. Source: Reef Environmental Education Foundation, http://www.<br />
reef.org/data/fknms_02.<strong>pdf</strong>, Accessed 5/3/05.<br />
Figure 7.30. Changes in mean abundance scores for four species of angelfish<br />
(Pomacanthidae) at 27 sites in the Florida Keys National <strong>Marine</strong> Sanctuary. Source:<br />
Reef Environmental Education Foundation, http://www.reef.org/data/fknms_02.<strong>pdf</strong>,<br />
Accessed 5/3/05.<br />
FFWCC Spiny Lobster Monitoring<br />
To test the hypothesis that no-take zones would sufficiently protect spiny lobster and that their average abundance<br />
and size would increase in protected zones compared to similar fished areas, the FFWCC undertook<br />
a lobster monitoring program. Methods included documenting the abundance and size of spiny lobster in 15<br />
no-take and fished reference areas in the FKNMS during the closed and open lobster fishing seasons starting<br />
in 1977.
The State of Coral Reef Ecosystems of Florida<br />
FFWCC Queen Conch Monitoring in the Florida Keys<br />
Methods<br />
The FFWCC initiated a project to monitor the recovery of queen conch (Strombas gigas) in the Florida Keys<br />
and within no-take marine reserves. Divers conduct belt-transects in locations with conch aggregations, including<br />
marine reserves and adjacent reference areas. All conch within 1 m along each belt-transect (laid out<br />
across an aggregation) were counted and mapped. Density and area estimates were used to determine population<br />
abundance. More information on data collection methods can be found in Glazer and Delgado (2003).<br />
Results and Discussion<br />
Since Florida’s queen conch fishery was closed in 1986, there have been signs that adult queen conch have<br />
begun to recover (Glazer and Delgado,<br />
2003; Figure 7.31). Within aggregations,<br />
overall conch density has increased<br />
to approximately 700 conch<br />
per ha and the area encompassed<br />
by the aggregations is approximately<br />
49.5 ha. Approximately 37,000 adult<br />
queen conch were observed within<br />
breeding aggregations in 2003.<br />
Whereas the recovery of conch stock<br />
is occurring fairly rapidly in back reef<br />
areas, the lack of spawning and poor<br />
recovery of conch aggregations in<br />
areas immediately adjacent to the<br />
islands remain concerns. The FFW-<br />
CC, University of Florida, and NOAA<br />
have started a joint project to examine<br />
the effects of xenobiotics on the<br />
reproductive development and output Figure 7.31. Trends in the abundance of adult queen conch, Strombus gigas, in the<br />
Florida Keys, estimated from yearly monitoring of the breeding aggregations on the<br />
of conch from those aggregations.<br />
backreef. Source: Glazer and Delgado, 2003.<br />
Overall Conclusions and Summary of Analytical Results<br />
Inventories of coral richness show a general decline in stony coral species richness in all reef types and<br />
geographic areas. Diseased coral colonies were widely found, although no consistent geographic ‘hotspot’<br />
was identified. Acropora spp. in the Upper Keys declined substantially during 1998-99 due to hurricanes and<br />
bleaching; they remain scarce and have exhibited no comeback. Non-native corals and fish have been detected;<br />
Caulerpa brachypus – a macrophytic algae – is becoming widespread and is of considerable concern.<br />
Effects of coastal pollution on reef communities are not well understood. Elevated nitrogen levels have been<br />
detected in nearshore waters, may relate to land use patterns, and have resulted in macroalgal blooms including<br />
non-native algal species.<br />
Trends in fisheries effort show a continual increase in the number of recreational anglers in South Florida. A<br />
number of key species have exhibited signs of fishing stress. Stocks of the goliath grouper, however, appear<br />
to be recovering after a decade of fishery closure.<br />
Florida<br />
Sidebar<br />
page<br />
185
Florida<br />
page<br />
186<br />
The State of Coral Reef Ecosystems of Florida<br />
CURRENT CONSERVATION MANAGEMENT ACTIVITIES<br />
Mapping<br />
Only about 50% of Florida’s coral reef and associated benthic habitats have been mapped. As a result, reliable<br />
estimates of the percentage of coral reef and related habitats, as well as the area protected by no-take<br />
provisions, cannot be accurately computed statewide.<br />
Mapping efforts were undertaken in the FKNMS in the 1990s. NOAA and FFWCC’s Florida <strong>Marine</strong> Research<br />
Institute (FMRI) published digital benthic habitat maps for the Florida Keys in 1998 (FMRI, 1998; Figure 7.32).<br />
Recently, the Dry Tortugas region was characterized (Schmidt et al., 1999). Also, Agassiz (1882) produced<br />
a remarkable baseline map of Dry Tortugas benthic habitats, which suggests a 0.4 km 2 loss of elkhorn coral<br />
in a 100-year period (Davis, 1982). Mapping gaps exist for deeper regions of the Tortugas. The reefs along<br />
the Southeastern Florida coast are less well studied. In 1999, Nova Southeastern University’s National Coral<br />
Reef Institute (NCRI) and the Broward County Department of Planning and Environmental Protection (DPEP)<br />
initiated mapping of Broward County reefs. Together with the FMRI, NCRI is presently mapping the reefs of<br />
southern Palm Beach and northern Miami-Dade Counties. Maps still need to be completed for the remainder<br />
of Miami-Dade and Palm Beach Counties. Reef habitat mapping efforts are underway by the State of Florida<br />
and NCRI along the Southeast Florida coast using a variety of techniques including satellite remote sensing,<br />
laser-based bathymetry, acoustic bottom classification, and in situ diver assessment (Moyer et al., 2003).<br />
Figure 7.32. Benthic habitat map for the Florida Keys. Map: A. Shapiro. Source: CCMA-BT, http://sposerver.nos.noaa.gov/projects/<br />
benthic_habitats/, Accessed 02/14/05.<br />
Improved mapping for specific projects has resulted from aerial photos of nearshore areas and laser-based<br />
bathymetry of the three reef tracts off Southeastern Florida. For example, detailed laser depth sounding bathymetry<br />
is complete for all of Broward County, offshore to 36 m. A smaller amount of the area is also mapped<br />
with multibeam bathymetry and side-scan sonar. Using acoustic seafloor discrimination, NCRI is mapping the<br />
distribution of benthic fauna over the reef tracts of Broward County, southern Palm Beach County, and northern<br />
Miami-Dade County. The goal is to provide maps that allow quantification of patterns, and thus information<br />
on underlying ecological processes. The work proceeds in collaboration with the Broward County DPEP and<br />
FMRI.<br />
Estimates of benthic cover are available from some monitoring programs. There is a coral reef distribution<br />
map in Jaap and Hallock (1990). No mapping of the Florida Middle Grounds has been conducted to date.<br />
Monitoring, Assessments, and Research<br />
In the FKNMS, a comprehensive research and monitoring program has been implemented to establish baseline<br />
information on the various components of the ecosystem and help ascertain possible causes and effects
The State of Coral Reef Ecosystems of Florida<br />
of changes. This way, research and monitoring can ensure the effective implementation of management<br />
strategies using the best available scientific information.<br />
Research and monitoring are conducted by many groups, including local, state, and federal agencies, public<br />
and private universities, private research foundations, environmental organizations, and independent researchers.<br />
Sanctuary staff facilitate and coordinate research by registering researchers through a permitting<br />
system, recruiting institutions for priority research activities, overseeing data management, and disseminating<br />
findings to the scientific community and the public.<br />
The Water Quality Protection Program (WQPP), which began in 1994 and is funded by the EPA and NOAA, is<br />
the most comprehensive, long-term monitoring program in the Florida Keys. The program includes monitoring<br />
of three components: water quality, seagrasses, and coral/hardbottom communities. Reef fishes, spiny<br />
lobster, queen conch, and benthic cover are also monitored throughout the Sanctuary. Water quality has been<br />
monitored at 154 fixed stations since 1995. Water samples are collected to measure salinity, temperature,<br />
DO, turbidity, relative fluorescence, and light attenuation. The water chemistry study focuses on detecting<br />
- - + NO , NO2 , NH4 , DIN, and SRP. Concentrations of TON, TOC, TP, and silicate are also measured, along with<br />
3<br />
CHLA and APA (Jones and Boyer, 2001).<br />
Seagrass monitoring through the WQPP allows for the identification of seagrass the distribution and abundance<br />
within the Sanctuary and the tracking of changes over time. Quarterly monitoring is conducted at 30<br />
fixed stations and annual monitoring occurs at 206-336 randomly selected sites (Fourqurean et al., 2002).<br />
Permanent stations are co-located at 30 of the water quality monitoring sites to help discern relationships between<br />
seagrass health and water quality. This long-term monitoring is also invaluable for determining human<br />
impacts on the Sanctuary’s seagrass communities.<br />
The CREMP tracks the status and trends of coral and hardbottom communities throughout the Sanctuary<br />
(Jaap et al., 2001). The project’s 43 permanent sites include hardbottom, patch reef, shallow offshore reef,<br />
and deep offshore reef communities. Biodiversity, coral condition, and coral cover are recorded annually at<br />
four stations within each site, for a total of 172 stations. This project has recently been extended to reefs of<br />
Southeast Florida, adding 10 sites throughout Miami-Dade, Broward, and Palm Beach Counties (Gilliam et<br />
al., 2004b).<br />
Broward County’s <strong>Marine</strong> Biological Monitoring Program tracks the status and trends of coral and hardbottom<br />
communities in the county (Gilliam et al. 2004a). The program’s 25 permanent sites located on the nearshore<br />
and offshore reef terraces have been monitored yearly since 1997 by the Broward County DPEP and NCRI.<br />
Each site consists of one 30-m belt phototransect, two 30-m fish transects, one stationary fish point count,<br />
and a sediment trap. Along each belt phototransect, 40 0.75-m 2 quadrat (framer) images are taken; stony<br />
coral species (Millepora and Scleractinia) presence, colony size, and condition (diseased or bleached) are recorded;<br />
and sponge and octocoral densities are recorded. Fish species abundance and size classes are also<br />
recorded along transects and during point counts. Sedimentation rate and grain size analysis is determined<br />
bimonthly.<br />
In addition to the WQPP, the FKNMS Zone Monitoring Program monitors the 24 discrete marine reserves located<br />
within the Sanctuary. Implemented in 1997, the goal of the program is to determine whether these fully<br />
protected zones effectively protect marine biodiversity and enhance human uses related to the Sanctuary.<br />
Parameters measured include the abundance and size of fish, invertebrates, and algae, as well as economic<br />
and aesthetic values of the Sanctuary and compliance with regulations. This program monitors changes in<br />
ecosystem structure (size and number of invertebrates, fish, corals, and other organisms) and function (coral<br />
recruitment, herbivory, predation). Human uses of zoned areas are also tracked. Lastly, continuous monitoring<br />
of certain physical parameters of seawater and ocean conditions are recorded by instruments (C-MAN stations)<br />
installed along the Florida Reef Tract as part of the Florida Keys Seascape program (SEAKEYS, 2002).<br />
There are six C-MAN stations from Fowey Rocks to the Dry Tortugas and one in Florida Bay. These stations<br />
gather data and periodically transmit to satellites, to provide near real-time reports available on the Internet.<br />
For the past 10 years, the Sanctuary has maintained a network of 27 thermographs located both inshore and<br />
offshore throughout the Keys that record water temperature every two hours.<br />
Florida<br />
Sidebar<br />
page<br />
187
Florida<br />
page<br />
188<br />
The State of Coral Reef Ecosystems of Florida<br />
As baselines are being documented, FKNMS managers are developing a comprehensive science plan outlining<br />
specific management objectives and their associated monitoring and research needs. This is an evolving,<br />
adaptive management approach to help ensure management decisions are supported by the best available<br />
science. The science plan will identify high-priority research and monitoring projects to help fill gaps in understanding<br />
the ecosystem and its responses to management actions. Recognizing the importance of an ecosystem<br />
approach to management, the Sanctuary engages agencies working on the Comprehensive Everglades<br />
Restoration Plan to achieve appropriate restoration goals for the entire ecosystem, including coral reefs and<br />
seagrasses. Active monitoring of natural resources is a Sanctuary priority in order to detect changes occurring<br />
as a result of water management regimes and restoration.<br />
Along Florida’s southeastern coast, much of the present monitoring originated as impact and mitigation studies<br />
for activities that had adverse impacts to specific sites (e.g., dredging, ship groundings, pipeline and cable<br />
deployments, and beach renourishment). In the past, such studies have been of limited duration (e.g., one<br />
to three years) and the focus has been largely on beach renourishment, restoration for grounding impacts,<br />
and some baseline data collection from reference areas. Monitoring has begun in Broward County at 25 fixed<br />
30-m 2 sites for environmental conditions (sedimentation quantities and rates, water quality, and temperature),<br />
and coral, sponge, and fish abundance and/or cover (Figure 7.33). Assessment studies by NCRI scientists<br />
also identify the distribution, abundance, and disease condition of staghorn corals in Broward County. Re-<br />
search on the reproductive status and<br />
potential of Acropora cervicornis is<br />
also being conducted. There have<br />
been a number of discrete fish surveys<br />
on the reefs of Miami-Dade and<br />
Palm Beach Counties, most of which<br />
have been associated with beach renourishment<br />
projects or artificial reef<br />
management (Lindeman and Snyder,<br />
1999; P. Light, pers. comm.; Avila,<br />
<strong>2005</strong>). However, there is currently a<br />
concerted effort underway by NCRI<br />
scientists to complete a baseline survey<br />
of reef fishes off Broward County<br />
(Ettinger et al., 2001; Harttung et al.,<br />
2001; Ferro et al., 2003). Initiated in<br />
1998, this NOAA-funded survey is<br />
recording fishes on the edges and<br />
crests of the three major reef lines.<br />
Figure 7.33. Researcher conducting reef monitoring offshore of Broward County,<br />
Florida. Photo: D. Gilliam.<br />
The initial survey was completed in 2003 and consists of more than 650 point-counts. In addition, during summer<br />
2001, NCRI scientists inventoried fish on the first 30 m of the inshore reef at 158 m intervals for 25 km of<br />
shoreline using multiple visual techniques (point-count, 30 m transects, and 20 minute random swims) (Baron<br />
et al., 2001). Broward County now has a database comprised of more than 1,000 visual censuses from the<br />
shore to 30 m for reef fish. The NCRI inventory of reefs off Broward County is continuing with a NOAA-funded<br />
survey of the fishes in 30-150 m depths using a remotely operated vehicle.
Researchers at NCRI are also currently<br />
involved in a multivariate, hypothesis-driven<br />
study of the interaction<br />
of fish, transplanted corals, coral<br />
recruits, and potential coral attractants<br />
or optimal substrates (Figure<br />
7.34). Research variables include<br />
four potentially different fish assemblages<br />
(determined by reef complexity)<br />
and biofilm and coral recruitment<br />
on settlement plates made of concrete,<br />
concrete and iron, concrete<br />
and quarry rock, or concrete and coral<br />
transplants. Results of this threeyear<br />
study should yield information<br />
critical to reef restoration.<br />
MPAs and Fully Protected Reserves<br />
As with monitoring, assessment, and<br />
research programs, coral reef con-<br />
The State of Coral Reef Ecosystems of Florida<br />
Figure 7.34. Researcher assessing coral recruitment on experimental artificial reef<br />
modules offshore of Broward County, Florida. Photo: D. Gilliam.<br />
servation and management through the designation and implementation of MPAs varies widely. The largest<br />
and best-known MPA in Florida, the FKNMS, was designated in 1990, thereby placing 9,850 km 2 of coastal<br />
waters and 1,381 km 2 of coral reef area under NOAA and State of Florida management. Immediate protective<br />
measures were instituted as a result of Sanctuary designation, including prohibitions on oil and hydrocarbon<br />
exploration, mining, and other activities altering the seabed, as well as restrictions on large ship traffic. Coral<br />
reefs were protected by prohibiting anchoring on coral, touching coral, and harvesting or collecting coral and<br />
‘live rock.’ To address water quality concerns, discharges from within the Sanctuary and areas outside the<br />
Sanctuary that could potentially enter and affect local resources were also restricted.<br />
In addition, a network of marine zones was instituted in 1997 in the Sanctuary to address a variety of management<br />
objectives. Five types of zones were designed and implemented to achieve biodiversity conservation,<br />
wildlife protection, and the separation of incompatible uses, among other goals. Three of the zone types<br />
(sanctuary preservation areas, ecological reserves, and special use/research-only areas) are fully protected<br />
areas, or marine reserves, where lobstering, fishing, spearfishing, shell collecting, and all other consumptive<br />
activities are prohibited.<br />
The 1997 zoning plan established 23 discrete fully protected zones that encompass 65% of the Sanctuary’s<br />
shallow coral reef habitats. The largest zone at that time, the 30.8 km 2 Western Sambo Ecological Reserve,<br />
protects offshore reefs as well as other critical habitats, including mangrove fringe, seagrasses, productive<br />
hardbottom communities, and patch reefs. In July 2001, the 517.9 km 2 Tortugas Ecological Reserve was<br />
implemented (see Figure 7.1). It is now the largest of the Sanctuary’s fully protected zones. Located in the<br />
westernmost portion of the Florida Reef Tract, the Reserve conserves important deep-water reef resources<br />
and fish communities unique to this region of the Florida Keys. Together with the other fully protected zones,<br />
the Tortugas Ecological Reserve increased the total protected area of coral reefs within the Sanctuary to<br />
10%.<br />
The Tortugas Ecological Reserve is also significant because it adjoins a 157.8 km 2 research natural area in the<br />
Dry Tortugas National Park, a zone where shallow seagrass, coral, sand, and mangrove communities are now<br />
conserved. Anchoring is prohibited in the research natural area, and scientific research and educational activities<br />
consistent with management of this zone require advance permits from the NPS. To protect important<br />
fish nursery and spawning sites, no fishing is allowed in the research natural area. Wildlife viewing, snorkeling,<br />
diving, boating and sightseeing are managed in this zone primarily through commercial tour guides. Together,<br />
the Sanctuary’s Tortugas Ecological Reserve and the Dry Tortugas National Park’s research natural area fully<br />
protect nearshore to deep reef habitats of the Tortugas region and form the largest, permanent marine reserve<br />
in the U.S.<br />
Florida<br />
Sidebar<br />
page<br />
189
Florida<br />
page<br />
190<br />
The State of Coral Reef Ecosystems of Florida<br />
Overall, the Sanctuary management regime uses an ecosystem-wide approach to comprehensively address<br />
the variety of impacts, pressures, and threats to Florida Keys marine ecosystems. It is only through this inclusive<br />
approach that the complex problems facing coral reefs can be adequately addressed.<br />
The BNP encompasses 683 km 2 of waters just south of Miami, including the majority of Biscayne Bay and a<br />
substantial portion of the northern reef tract with 291 km 2 of coral reefs. The Park is renowned for its productive<br />
coastal bay, nearshore, and offshore habitats, including islands, mangrove shorelines, seagrass beds,<br />
hardbottom communities, and coral reefs, which provide important recreational opportunities and spectacular<br />
scenic areas. The NPS is concerned about degradation of BNP resources in the face of coastal development,<br />
increases in the number of recreational boats visiting the Park, and fishing pressure. The Park is revising<br />
its general management plan to allow for management zones that would give greater protection to Park resources,<br />
including natural resources reserve areas where fish nurseries and spawning habitats would be<br />
protected from fishing and other disturbances. In addition, the BNP is developing a cooperative plan with the<br />
State of Florida to adopt a coordinated and seamless approach to protecting and restoring fishery resources<br />
both within and outside Park boundaries.<br />
The Key West National Wildlife Refuge and Great White Heron National Wildlife Refuge overlap with portions<br />
of the FKNMS in the backcountry of the lower Keys and an extensive area around the Marquesas Islands<br />
between Key West and the Dry Tortugas. The Refuges, established in 1908 and 1938, respectively, contain<br />
over 1,619 km 2 of lush seagrass beds, reef tract, patch reefs, hardbottom communities, and pristine mangrove<br />
islets. A cooperative agreement between the U.S. Fish and Wildlife Service (USFWS) and State of Florida on<br />
the management of these submerged lands created a number of wildlife management zones in the refuges.<br />
These zones direct human activities away from sensitive wildlife and habitats, and help ensure their continued<br />
conservation. The USFWS, as administrator of the National Wildlife Refuge System, works cooperatively with<br />
the State and the FKNMS to protect these sites.<br />
Of the state parks in Southeast Florida, two are considered marine. One of the oldest marine parks in the world<br />
(acquisition began in 1959), the John Pennekamp Coral Reef State Park is located in Monroe County on Key<br />
Largo. It covers 249 km 2 and has 461 km 2 of coral reefs, seagrass beds, and mangrove swamps. The Lignum<br />
Vitae Key Botanical State Park, which includes Shell Key, is located in Monroe County, west of Islamorada.<br />
The Park’s submerged habitats are located in Florida Bay and the Atlantic Ocean, and include fringing mangrove<br />
forest, extensive seagrass beds, patch reef, and sand flats.<br />
Gaps in Monitoring and Conservation Capacity<br />
Current monitoring in the FKNMS has largely focused on detecting changes within the fully protected zones<br />
and determining Sanctuary-wide status and trends of water quality, seagrasses, and corals. While some<br />
trends are beginning to show and provide a source of hypotheses to be tested continued monitoring is critical.<br />
These data will facilitate the detection of long-term changes in communities locally and ecosystem-wide.<br />
Reef monitoring programs in southeastern Florida are limited by a lack of comprehensive inventories of the<br />
non-coral components of the marine communities. Baseline assessments of additional sites are needed.<br />
Furthermore, new monitoring programs should be developed at sites within counties in the region. The first<br />
step should be to develop a functional classification of the reef habitats. For effective selection of monitoring<br />
sites, this classification should incorporate criteria to ensure that both representative habitats and unique sites<br />
receive attention.
The databases of reef fish in Broward,<br />
Miami-Dade, and Palm Beach<br />
Counties are based on visual survey<br />
techniques that can overlook a substantial<br />
number of cryptic species (as<br />
many as 37% in a recent Caribbean<br />
survey; Collette et al., 2001). Thus,<br />
intensive and broad-scale monitoring<br />
is necessary to obtain a complete record<br />
of resident ichthyofauna. In addition,<br />
fish assemblages below a depth<br />
of 30 m are poorly characterized, yet<br />
they are exploited by recreational<br />
fishers. Likewise, the structure and<br />
composition of reef fish communities<br />
in seagrass and mangrove habitats of<br />
Port Everglades and the Intracoastal<br />
Waterway remain a mystery to researchers.<br />
Such habitats can be im-<br />
portant nursery sites for several reef<br />
The State of Coral Reef Ecosystems of Florida<br />
Figure 7.35. Mangrove prop roots serve as an important nursery area for some reef<br />
fish species. Photo: M. Kendall.<br />
associated fishes (Figure 7.35; Leis, 1991). Given the high level of human activity in these areas, monitoring<br />
of reef fish communities is necessary.<br />
In May 2002, Coleman and Jaap (W. Jaap, pers. obs.) mounted an expedition to the Florida Middle Grounds<br />
to sample sites surveyed by Hopkins in 1975. Data collected at most of the sample stations indicated that the<br />
sessile benthic community remained very similar to the status described by Hopkins et al. (1977). However,<br />
grouper and snapper populations were extremely depleted. Reefs along the southeast coast and the Middle<br />
Grounds banks should be fully mapped to develop map products including a reef atlas similar to that recently<br />
published for reef areas off Brazil. The Brazilian reef atlas includes high quality maps, aerial and satellite photographs,<br />
underwater habitat photos, and short descriptions of the reefs and resources.<br />
Government Policies, Laws, and Legislation<br />
When President George H. W. Bush signed the Florida Keys National <strong>Marine</strong> Sanctuary and Protection Act<br />
into law in 1990, the FKNMS became the first national marine sanctuary designated by Congress. Authority<br />
for the Sanctuary, along with the 12 other national marine sanctuaries, is established under the National <strong>Marine</strong><br />
Sanctuaries Act of 1972 (16 U.S.C. 1431 et seq., as amended). The FKNMS is administered by NOAA<br />
under the U.S. Department of Commerce, and is managed jointly with the State of Florida under a co-trustee<br />
agreement because over half of the Sanctuary waters are state territorial waters. The co-trustees agreement<br />
commits the Sanctuary to periodically review the Sanctuary’s management plan.<br />
In 1997, a comprehensive management plan for the Sanctuary was implemented. It contains 10 action plans<br />
and associated strategies for conserving, protecting, and managing the significant natural and cultural resources<br />
of the Florida Keys marine environment. Largely non-regulatory, the plan’s strategies are to educate<br />
citizens and visitors, use volunteers to build stewardship for local marine resources, appropriately mark channels<br />
and waterways, install and maintain mooring buoys for vessel use, survey submerged cultural resources,<br />
and protect water quality. As previously described the Sanctuary management plan also designated five types<br />
of marine zones to reduce pressures in heavily used areas, protect critical habitats and species, and reduce<br />
use conflicts. A total of 24 fully protected zones were implemented in 1997 and 2001, covering approximately<br />
6% of the Sanctuary and protecting 65% of shallow bank reef habitats and about 10% of coral reefs.<br />
Most of the smaller zones (sanctuary preservation areas) are located along the offshore reef tracts and encompass<br />
the most heavily used spur-and-groove coral formations. In these areas, all consumptive activities<br />
are prohibited. The effectiveness of these zones and other biological and chemical parameters are monitored<br />
under the FKNMS Research and Monitoring Action Plan.<br />
Florida<br />
Sidebar<br />
page<br />
191
Florida<br />
page<br />
192<br />
The State of Coral Reef Ecosystems of Florida<br />
With guidance from the U.S. Coral Reef Task Force, the Florida Department of Environmental Protection and<br />
the FFWCC have coordinated formation of an interagency Southeast Florida Action Strategy Team (SEFAST)<br />
for coral reef conservation and management. This team is developing a local action strategy (LAS) to improve<br />
coordination of technical and financial support for the conservation and management of coral reefs from the<br />
southern Miami-Dade County line to Hobe Sound (Martin County). The Southeast Florida Coral Reef Initiative<br />
is targeting this region because the coral habitats are close to shore and co-exist with intensely urbanized<br />
areas that lack a coordinated management plan.<br />
SEFAST is made up of four workgroups: Awareness and Appreciation; Fishing, Diving and Other Uses; Land-<br />
Based Sources of Pollution and Water Quality; and Maritime Industry and Coastal Construction Impacts.<br />
The workgroups are tasked with 1) outlining and presenting issues and threats at stakeholder workshops, 2)<br />
combining information from public input and technical advisory committees, 3) further defining threats to coral<br />
habitats, and 4) proposing projects to minimize harmful effects. The outcome will be a coordinated plan to<br />
address causes of coral degradation and provide a roadmap for successful management.<br />
Commercial fishing remains one of the largest industries in the Florida Keys, but it is regulated heavily by State<br />
and Federal fishery management councils. Regulations for most commercial invertebrates and finfish include<br />
annual catch quotas, closed seasons, and gear catch size restrictions. The State of Florida also collects<br />
landing information on approximately 400 kinds of fish, invertebrates, and plants to track species trends and<br />
evaluate regulations. The reefs of southeastern Florida are in state territorial waters and protected from some<br />
impacts by state laws and regulations. These include fishing regulations, dredging permits, and a law protecting<br />
corals from harvest, sale, or destruction. Broward County has a small boat mooring program intended to<br />
reduce anchoring impacts on reefs.<br />
OVERALL <strong>STATE</strong> CONCLUSIONS AND RECOMMENDATIONS<br />
Due to its high latitude and proximity to the continental U.S., reefs in Florida exist at the environmental extremes<br />
for coral. Natural phenomena such as cold fronts and freshwater run-off, as well as heavy use, introduction<br />
of non-native species, offshore and coastal construction activities, and water quality degradation are<br />
all stressors to Florida’s reefs. These factors provide challenges to Florida’s coral reef managers and emphasize<br />
the need for careful conservation of the resource. Overall, immediate action is needed to curtail alarming<br />
declines in coral reef condition throughout Florida.<br />
Habitat maps have been prepared for the Florida Keys and the Tortugas, but only about half of Florida’s coral<br />
reef and benthic resources have been mapped. Reefs on the southeastern Florida coast are not as well<br />
studied as those of the Keys. Broward County has begun a mapping program. NCRI has begun mapping<br />
programs in Broward, Palm Beach and Miami-Dade Counties. Mapping has been improved through the use<br />
of laser-based bathymetry. Detailed mapping of all benthic resources is essential. The distribution of non-native<br />
species - especially Caulerpa brachypus - should also be determined, and methods to restrict its spread<br />
must be examined.<br />
There are a considerable number of minor and major ship groundings on Florida’s reefs resulting in part<br />
from increased recreational and commercial boating activity. Groundings result in significant injury to coral,<br />
seagrass, and hardbottom resources. The majority of groundings is due to small vessels causing minor damage<br />
individually, but considerable cumulative effects. Installation of mooring buoys has reduced the chronic<br />
impacts of small boat anchoring. These efforts need to be expanded, especially for large vessels near ports.<br />
The State of Florida and the FKNMS have been educating boaters to limit risks and improve navigation in coral<br />
reef areas, and these efforts should be expanded.<br />
Large vessel avoidance and Racon beacons in lighthouses have resulted in declines in large vessel groundings.<br />
State and FKNMS officials have improved their response to grounding events and improved their restoration<br />
methods of damaged sites, thereby reducing the extent of damage. Reef restoration is a fertile field of<br />
study necessary to determine effective and efficient ways to restore degraded coral reef ecosystems.<br />
Effects of coastal pollution on reef communities are not well understood, however, there is evidence that it has
The State of Coral Reef Ecosystems of Florida<br />
resulted in macroalgal blooms including non-native species. A comprehensive water quality monitoring program<br />
for Southeast Florida does not exist, but is necessary to establish a relationship between water quality<br />
and reef community response in the area. Permitting programs have been effective in reducing raw sewage<br />
discharges. Monroe County is undertaking a study of the septic tank problem and possible consolidation into<br />
regional facilities. Continued monitoring is critical to establish a relationship between coastal activities and<br />
coral resource conditions.<br />
Coral reefs provide the ecological foundation for a multibillion dollar fisheries and tourism-based economy<br />
in South Florida. Thus reducing fishing pressure is an appropriate goal. The regional fisheries councils and<br />
State of Florida have prohibited destructive or wasteful fishing gear, established minimum size and bag limits,<br />
as well as seasonal closures, and restricted the taking of some species. Numerous MPAs have been established<br />
to restrict fishing. Exploitable species have shown significant increases in these areas. Monitoring and<br />
appropriate regulation must be maintained to prevent overfishing.<br />
Management programs in southeastern Florida are limited by a lack of comprehensive inventories. The State<br />
of Florida has formed the SEFAST to develop a LAS for coral reef conservation and management in the area.<br />
Such a plan is essential if these resources are to co-exist with the intensely urbanized area.<br />
Local communities that are culturally and economically supported by coral reefs are working to employ management<br />
strategies and to focus on alleviating controllable human impacts. For example, in southeastern<br />
Florida, the environmental impacts of fisheries, dredging, vessel anchorages, vessel groundings, freshwater<br />
management, and nutrient inputs should receive attention to maximize reef protection in this area. In the Florida<br />
Keys, the community is continuing to pursue solutions that address wastewater and stormwater problems,<br />
habitat degradation, and overfishing.<br />
Citizens, stakeholders, elected officials, and resource managers must work together to improve water quality,<br />
minimize physical impacts to corals and seagrasses, reduce nonpoint pollution, and increase education to<br />
instill a stronger sense of stewardship in Floridians for their coral reefs.<br />
Florida<br />
Sidebar<br />
page<br />
193
Florida<br />
page<br />
194<br />
The State of Coral Reef Ecosystems of Florida<br />
REFERENCES<br />
Agassiz, A. 1882. Explorations of the surface fauna of the Gulf Stream under the auspices of the United States Coast Survey<br />
II. The Tortugas and Florida Reefs. Memorandum of the Academy of Arts and Sciences Centennial 2 (1): 107-134.<br />
Atlantic Oceanographic and Meteorological <strong>Laboratory</strong> (AOML). 1999. Hurricane Georges Leaves Florida Bay Flustered<br />
but Not Flushed. 5 pp. Available from the internet URL: http://www.aoml.noaa.gov/flbay/georges/georges_final.html.<br />
Antonius, A. 1985. Coral diseases in the indo-pacific: A first record. Pubblicazioni della Stazione zoologica di Napoli I.<br />
<strong>Marine</strong> ecology 6(3): 197-218.<br />
Ault, J.S., J.A. Bohnsack and G. Meester. 1998. A retrospective (1979-1995) multispecies assessment of coral reef fish<br />
stocks in the Florida Keys. Fishery Bulletin 96 (3): 395-414.<br />
Ault, J.S., S.G. Smith, G.A. Meester, J. Luo and J.A. Bohnsack. 2001. Site Characterization for Biscayne National Park:<br />
Assessment of Fisheries Resources and Habitats. NOAA Technical Memorandum NMFS-SEFSC-468. 185 pp.<br />
Ault, J.S., S.G. Smith, G.A. Meester, J. Luo, J., E.C. Franklin, J.A. Bohnsack, D.E. Harper, D.B. McClellan, S.L. Miller, M.<br />
Chiappone and D.W. Swanson. 2002. Synoptic habitat and reef fish surveys support establishment of marine reserves in<br />
Dry Tortugas, Florida USA. Reef Encounter 31: 22-23.<br />
Ault, J.S., S.G. Smith, G.A. Diaz and E. Franklin. 2003. Florida hogfish fishery stock assessment. Report to the Florida<br />
Fish and Wildlife Conservation Commission. 67 pp. plus figures and tables.<br />
Ault, J., J.A. Bohnsack and S.G. Smith. In press. Towards Sustainable Multispecies Fisheries in the Florida USA Coral<br />
Reef Ecosystem. Bulletin of <strong>Marine</strong> Science.<br />
Avila, C. <strong>2005</strong>. Offshore reef fish assemblages of Miami-Dade County, Florida: effects associated with dredging for beach<br />
renourishments. Master’s thesis for Nova Southeastern University.<br />
Banks, K., R.E. Dodge, L.E. Fisher, D. Stout and W.C. Jaap. 1999. Grounding of the nuclear submarine USS MEMPHIS<br />
on a southeast Florida coral reef: Impact, assessment, and proposed restoration. pp. 17. In: Proceedings, International<br />
Conference on Scienctific Aspects of Coral Reef Assessment, Monitoring, and Restoration.<br />
Baron, R., P. Arena, F. Harttung, D. Fahy, B. Buskirk, L.K.B. Jordan, C. Miller, C. and R.E. Spieler. 2001. In: Proceedings,<br />
54th Annual Meeting Gulf and Caribbean Fisheries Institute.<br />
Bohnsack, J.A. and S.P. Bannerot. 1986. A Stationary Visual Census Technique for Quantitatively Assessing Community<br />
Structure of Coral Reef Fishes. NOAA NMFS Technical Report 41.<br />
Bohnsack, J.A., D.E. Harper and D.B. McClellan. 1994. Fisheries trends from Monroe County, Florida. Bulletin of <strong>Marine</strong><br />
Science 54: 982-1018.<br />
Bohnsack, J.A. and J.S. Ault. 1996. Management strategies to conserve marine biodiversity. Oceanography 9: 73-82.<br />
Bohnsack, J.A., D.B. McClellan, D.E. Harper, G.S. Davenport, G.J. Konoval, A.M. Eklund, J.P. Contillo, S.K. Bolden, P.C.<br />
Fischel, G.S. Sandorf, J.C. Javech, M.W. White, M.H. Pickett, M.W. Hulsbeck, J.L. Tobias, J.S. Ault, G.A. Meester, S.G.<br />
Smith and J. Luo. 1999. Baseline Data for Evaluating Reef Fish Populations in the Florida Keys. NOAA Techncial Memorandum<br />
NMFS-SEFSC-427. 61 pp.<br />
Boyer, J.N. and R.D. Jones. 2002. FY 2002 Annual Report of the Water Quality Monitoring Project for the Water Quality<br />
Protection Program in the Florida Keys National <strong>Marine</strong> Sanctuary. Report for Environmental Protection Agency, South<br />
Florida Water Management District and Monroe County by Southeast Environmental Research Center, Florida International<br />
University. 47pp.<br />
Boyer, J.N. and R.D. Jones. 2003. FY 2003 Annual Report of the Water Quality Monitoring Project for the Water Quality<br />
Protection Program in the Florida Keys National <strong>Marine</strong> Sanctuary, Executive Summary. Environmental Protection<br />
Agency, South Florida Water Management District and Monroe County. 7 pp.<br />
Bruckner A.W. and R.J. Buckner. 1997. Outbreak of coral disease in Puerto Rico. Coral Reefs. 16: 260.<br />
Bruno, J.F., L.E. Petes, C.D. Harvell and A. Hettinger. 2003. Nutrient enrichment can increase the severity of coral diseases.<br />
Ecology Letters 6: 105-1061.<br />
Carlton, J.T. 2001. Introduced species in U.S. coastal waters: Environmental impacts and management priorities. Pew<br />
Oceans Commission, Arlington, Virginia. 28 pp.
The State of Coral Reef Ecosystems of Florida<br />
Carlton, J.T. and J.B. Geller. 1993. Ecological roulette: The global transport of nonindigenous marine organisms. Science<br />
261 (5117): 78-82.<br />
Causey, B.D. 2001. Lessons learned form the intensification of coral bleaching from 1980-2000 in the Florida Keys, USA.<br />
pp. 60-66. In: Salm, R.V. and S.L. Coles (eds.) Coral Bleaching and <strong>Marine</strong> Protected Areas: Proceedings of the Workshop<br />
on Mitigating Coral Coastal <strong>Marine</strong> Program Report #0102.<br />
Chen, E. and J.F. Gerber, 1990. Climate. pp. 11-34. In: R.L. Myers and J.J. Ewel (eds.) Ecosystems of Florida. University<br />
of Central Florida Press, Orlando.<br />
Chiappone, M. and R. Sluka. 1996. Fish and Fisheries. Site characterization for the Florida Keys National <strong>Marine</strong> Sanctuary<br />
and environs. Volume 6. Farley Court Publishers, Zenda, Wisconsin.<br />
Continental Shelf Associates (CSA). 2000. Survey 2 report: monitoring reattached hard corals at the Firat grounding site.<br />
CSA, Jupiter, Florida. 10 pp.<br />
Continental Shelf Associates (CSA). 2001. Hard/live bottom mitigation plan-federal waters. Gulfstream Natural Gas System.<br />
CSA, Jupiter, Florida. 15 pp.<br />
Courtenay, Jr., W.R. 1995. <strong>Marine</strong> fish introductions in southeastern Florida. American Fisheries Society, Introduced Fish<br />
Section Newsletter 14 (1): 2-3.<br />
Davis, G.E. 1982. A century of natural change in coral distribution at the Dry Tortugas: a comparison of reef maps from<br />
1881-1976. Bulletin of <strong>Marine</strong> Science 32 (2): 608-623.<br />
Duane, D.B. and E.P. Meisburger. 1969. Geomorphology and sediments of the nearshore Continental Shelf, Miami to<br />
Palm Beach, Florida. U.S. Army Corps of Engineers, Coastal Engineering Research Center, Ft. Belvior, Virginia. Technical<br />
Memorandum 29. 47 pp.<br />
Dustan, P. 1977. Vitality of reef coral populations off Key Largo, Florida: Recruitment and mortality. Environmental Geology<br />
2: 51-58.<br />
ENSR International. 2002. 2001 Annual report on live bottom mitigation in Florida state waters for the Gulfstream Natural<br />
Gas System, 00449-007-20FM. Tallahassee, FL. 38 pp.<br />
Ettinger, B.D., D.S. Gilliam, L.K.B. Jordan, R.L. Sherman and R.E. Spieler. 2001. The coral reef fishes of Broward County<br />
Florida, species and abundance: a work in progress. pp. 748-756. In: Proceedings, 52nd Annual Gulf and Caribbean<br />
Fisheries Institute.<br />
Ferro, F., L.K.B. Jordan and R.E. Spieler. 2003. The marine fishes of Broward County, Florida: Final Report of 1998-2002<br />
Survey Results. 73 pp.<br />
Finkl, C.W. and R.H. Charlier. 2003. Sustainability of subtropical coastal zones in southeastern Florida: challenges for urbanized<br />
coastal environments threatened by development, pollution, water supply, and storm hazards. Journal of Coastal<br />
Research, 19 (4): 934-943.<br />
Finkl, C.W. and S.L. Krupa. 2003. Environmental impacts of coastal-plain activities on sandy beach systems: hazards,<br />
perception and mitigation. Journal of Coastal Research SI 35: 132-150.<br />
Florida <strong>Marine</strong> Research Institute (FMRI). 1998. Benthic habitats of the Florida Keys. Technical Report 4. St. Petersburg.<br />
53 pp.<br />
Fonseca, M.S., B.E. Julius and W.J. Kenworthy, 2000. Integrating biology and economics in seagrass restoration: how<br />
much is enough and why? Ecological Engineering 15: 227-237.<br />
Fourqurean, J.W., M.J. Durako, M.O. Hall and L.N. Hefty. 2002. Seagrass distribution in south Florida: a multi-agency<br />
coordinated monitoring program. pp. 497-522. In: J. W. Porter and K. G. Porter (eds.) The Everglades, Florida Bay, and<br />
coral reefs of the Florida Keys: an ecosystem source book. CRC Press, Boca Raton, FL.<br />
Garcia, H.E. and L.I. Gordon. 1992. Oxygen solubility in seawater: better fitting equations. Limnology and Oceanography<br />
37: 1307-1312.<br />
Garzón-Ferreira, J. and D. Gill. 1998. Another unknown Caribbean coral phenomenon? Reef Encounters 24: 10.<br />
Florida<br />
Sidebar<br />
page<br />
195
Florida<br />
page<br />
196<br />
The State of Coral Reef Ecosystems of Florida<br />
Gilliam, D.S., S.L. Thornton and R.E. Dodge. 2001. One-Year Post-Baseline Monitoring and Assessment of Coral Reattachment<br />
Success and Coral Recruitment, at the C/V Hind Grounding Site, Broward County Florida. Florida Fish and<br />
Wildlife Commission, Florida <strong>Marine</strong> Research Institute. 33 pp.<br />
Gilliam, D.S., J.A. Vernacchio and R.E. Dodge. 2003. Nurseries for Reef Fishery Habitat. Final Programmatic Report.<br />
National Fish and Wildlife Foundation. 33 pp<br />
Gilliam, D.S., R.E. Dodge, R.E. Spieler, L.K.B. Jordanand J.A. Monty. 2004a. <strong>Marine</strong> Biological Monitoring in Broward<br />
County Florida, Year 4 Annual Report. Broward County Technical Report 04-01. 92 pp.<br />
Gilliam, D.S., B. Ettinger, D. Fahy, E. Fahy, S. Gill, J.A. Monty, L. Shuman and B. Walker. 2004b. Southeast Florida Coral<br />
Reef Evaluation and Monitoring Project. Year 1 Report. Florida Fish and Wildlife Commission Florida <strong>Marine</strong> Research<br />
Institute. 12 pp.<br />
Gladfelter, W.B. 1982. White band disease in Acropora palmata: implications for the structure and growth of shallow coral<br />
reefs. Bulletin of <strong>Marine</strong> Science 32: 639-643.<br />
Glazer, R.A. and G.A. Delgado. 2003. Towards a holistic strategy to managing Florida’s queen conch (Strombus gigas)<br />
population. pp. 73-80. In: El Caracol Strombus gigas: Conocimiento Integral para su Manejo Sustentable en el Caribe. D.<br />
Aldana Aranda (ed.). CYTED, Programa Iberoamericano de Ciencia y Technología para el Desarrollo, Yucatán, México.<br />
Harper, D.E., J.A. Bohnsack and B. Lockwood. 2000. Recreational Fisheries in Biscayne National Park, Florida, 1976-<br />
1991. <strong>Marine</strong> Fisheries Review 62: 8-26.<br />
Harttung, F.M., P.T. Arena, L.K.B. Jordan, B.D. Ettinger and R.E. Spieler. 2001. Spatial variability of coral reef fish assemblages<br />
offshore Broward County, Florida. In: Proceedings, 54th Annual Meeting of the Gulf and Caribbean Fisheries<br />
Institute.<br />
Herren, L. 2004. St. Lucie Inlet Preserve State Park Reef Monitoring Progress Report 2. Florida Department of Environmental<br />
Protection, Jensen Beach. 43 pp.<br />
Hopkins, T.S., D.R. Blizzard, S.A. Brawley, S.A. Earle, D.E. Grimm, D.K. Gilbert, P.G. Johnson, E.H. Livingston, C.H.<br />
Lutz, J.K. Shaw and B.B. Shaw, 1977. A preliminary characterization of the biotic components of composite strip transects<br />
on the Florida Middlegrounds, northeastern Gulf of Mexico. pp. 1: 31-37. In: Proceedings, 3rd International Coral<br />
Reef Symposium.<br />
Jaap, W.C. 1979. Observation on zooxanthellae expulsion at Middle Sambo Reef, Florida Keys. Bulletin of <strong>Marine</strong> Science<br />
29 (3): 414-422.<br />
Jaap, W.C. 1984. The Ecology of the South Florida Coral Reefs: A Community Profile. U.S. Fish and Wildlife Service<br />
FWS/OBS – 82/08. Washington, D.C. 138 pp.<br />
Jaap, W.C. 2000. Coral reef restoration. Ecological Engineering 15: 345-364.<br />
Jaap, W.C. and P. Hallock, 1990. Coral Reefs. pp. 574-616. In: R.L. Myers and J.J. Ewel (eds.) Ecosystems of Florida.<br />
University of Central Florida Press, Orlando.<br />
Jaap, W.C. and M.D. McField. 2001. Video sampling for monitoring coral reef benthos. Bulletin of the Biological Society<br />
of Washington 10: 269-273.<br />
Jaap, W.C., J.W. Porter, J.W. Wheaton, C.R. Beaver, K. Hackett, M. Lybolt, M.K. Callahan, J. Kidney, S. Kupfner, C. Torres<br />
and K. Sutherland, 2003. EPA/NOAA coral reef evaluation and monitoring project, 2002 executive summary. Florida<br />
Fish and Wildlife Conservation Commission and the University of Georgia. St. Petersburg, FL. 28 pp.<br />
Johns, G.M., V.R. Leeworthy, F.W. Bell and M.A. Bonn. 2001. Socioeconomic Study of Reefs in Southeast Florida, Final<br />
Report. Broward County Environmental Protection Department, Technical Report 01-10. Available from the internet URL:<br />
http://www.broward.org/dni01200.htm.<br />
Jones, R.D. 1996. Phosphorus cycling. pp. 343-348. In: G.J. Hurst, G.A. Knudsen, M.J. McInerney, L.D. Stetzenbach,<br />
and M.V. Walter (eds.), Manual of Environmental Microbiology. ASM Press,Materials Park, OH.<br />
Jones, R.D. and J.N. Boyer. 2003. FY2002 Annual Report of the Water Quality Monitoring Project for the Water Quality<br />
Protection Program in the Florida Keys National <strong>Marine</strong> Sanctuary. SERC Technical Report T192. Southeast Environmental<br />
Research Center, Florida International University, Miami. Available from the internet URL: http://serc.fiu.edu/wqmnetwork.
The State of Coral Reef Ecosystems of Florida<br />
Kim, K. and C.D. Harvell. 2002. Aspergillosis of sea fan corals: disease dynamics in the Florida Keys. The Everglades of<br />
Florida Bay, and Coral Reefs of the Florida Keys An Ecosystem Sourcebook 30: 813-824.<br />
Kirk, J.T.O. 1994. Light and Photosynthesis in Aquatic Systems, 2nd edition. Cambridge University Press, Cambridge,<br />
UK:<br />
Klein, C.J. and S.P. Orlando, Jr. 1994. A spatial framework for water-quality management in the Florida Keys National<br />
<strong>Marine</strong> Sanctuary. Bulletin of <strong>Marine</strong> Science 54: 1036-1044.<br />
Kolar, C.S. and D.M. Lodge. 2002. Ecological predictions and risk assessment for alien fishes in North America. Science<br />
298: 1233-1236.<br />
Lapointe, B.E. 1997. Nutrient thresholds for bottom-up control of macroalgal blooms on coral reefs in Jamaica and southeast<br />
Florida. Limnology and Oceanography. 42 (5): 1119-1131.<br />
Lapointe, B.E. and P.J. Barile. 2001. Discrimination of Nitrogen Sources to Harmful Macroalgal Blooms on Coral Reefs<br />
off Southeast Florida. Florida Institute of Oceanography. 27 pp.<br />
Lapointe, B.E. and P.J. Barile. 2003. Invasive macroalgal blooms in coastal southeastern Florida supported by anthropogenic<br />
nitrogen. Abstract 81. Estuarine Research Federation, Port Republic, MD.<br />
Larkin, S.L. 2003. The U.S. wholesale marine ornamental market: Trade, landings, and market options. pp. 77-898 In:<br />
J.C. Cato and C.L. Brown (eds.) <strong>Marine</strong> ornamental species. Collection, culture and conservation. Iowa State Press,<br />
Ames.<br />
Larkin, S.L. and R.L. Degner. 2001. The U.S. wholesale market for marine ornamentals. Aquarium Sciences and Conservation<br />
3 (1/3): 13-24.<br />
Lee, T.N., M.E. Clarke, E. Williams, A.F. Szmant and T. Berger. 1994. Evolution of the Tortugas gyre and its influence on<br />
recruitment in the Florida Keys. Bulletin of <strong>Marine</strong> Science 54: 621-646.<br />
Lee, T.N., E. Williams, E. Johns, D. Wilson and N.P. Smith. 2002. Transport processes linking South Florida ecosystems.<br />
pp. 309-342. In: Porter, J.W. and K.G. Porter (eds.) The Everglades, Florida Bay, and Coral Reefs of the Florida Keys: An<br />
Ecosystem Sourcebook. CRC Press, Boca Raton, Florida.<br />
Leeworthy, V.R. and P. Vanasse. 1999. Economic contribution of recreating visitors to the Florida Keys/Key West: Updates<br />
for years 1996-1997 and 1997-1998. National Oceanic and Atmospheric Administration, Silver Spring, MD. 20 pp.<br />
Leichter, J.J., H.L. Stewart and S.L. Miller. 2003. Episodic nutrient transport to Florida coral reefs. Limnology and Oceanography<br />
48: 1394-1407.<br />
Leis, J.M. 1991. The pelagic stages of reef fishes: the larval biology of coral reef fishes. pp. 183-230. In P.F. Sale (ed.)<br />
The Ecology of Fishes on Coral Reefs. Academic Press, CA. 754 pp.<br />
Light, P. Palm Beach County Department of Environmental Resources Management, West Palm Beach, FL. Personal<br />
communication.<br />
Lindeman, K.C. and D.B. Snyder. 1998. Nearshore hardbottom fishes of southeast Florida and effects of habitat burial<br />
caused by dredging. Fisheries Bulletin 97: 508-525.<br />
Lirman, D. 2003. A simulation model of the population dynamics of the branching coral Acropora palmata Effects of storm<br />
intensity and frequency. Ecological Modelling 161: 167-180.<br />
Mace, P. 1997. Developing and sustaining world fishery resources: state of science and management. pp. 1-20. In: D.A.<br />
Hancock, D.C. Smith, A. Grant, and J.P. Beumer (eds.). In: Proceedings, Second World Fishery Congress. 797 pp.<br />
Mayer, A.G. 1918. Toxic effects due to high temperature. Carnegie Institution of Washington, Department of <strong>Marine</strong> Biology<br />
12: 175-178.<br />
McCarty, H.B. and E.C. Peters. 1998. The Coral Disease Page©. Available from the internet URL: http://ourworld.compuserve.com/homepages/mccarty_and_peters/coraldis.htm.<br />
Miami-Dade County Dept. of Environmental Resource Management (DERM). 2003. Third annual report, Bal Harbor mitigation<br />
artificial reef monitoring program. DERM, Miami. 20 pp.<br />
Florida<br />
Sidebar<br />
page<br />
197
Florida<br />
page<br />
198<br />
The State of Coral Reef Ecosystems of Florida<br />
Miller, M.W., I.B. Baums, D.E. Williams and A.M. Szmant. 2002. Status of candidate coral, Acropora palmata, and its<br />
snail predator in the upper Florida Keys National <strong>Marine</strong> Sanctuary: 1998-2001. NOAA Technical Memorandum NMFS-<br />
SEFSC-479. 27 pp.<br />
Milon, J.W. and R.E. Dodge. 2001. Applying habitat equivalency analysis for coral reef damage assessment and restoration.<br />
Bulletin of <strong>Marine</strong> Science 69: 975-988.<br />
Morand, P. and X. Briand. 1996. Excessive growth of macroalgae: a symptom of environmental disturbance. Botanica<br />
Marina 39: 491-516.<br />
Moyer, R.P., B. Riegl, K. Banks and R.E. Dodge. 2003. Spatial patterns and ecology of benthic communities on a highlatitude<br />
South Florida (Broward County, USA) reef system. Coral Reefs 22 (4): 447-464.<br />
Mueller, E., D.L. Santavy and E.C. Peters. 1998. Survey and quality assurance protocols for the assessment of coral<br />
disease distribution. In: Abstracts from European Meeting. International Society for Reef Studies.<br />
Muller, R.G., M.D. Murphy, J. DeSilva and L.R. Barbieri. 2003. Stock assessment report of yellowtail snapper (Ocyurus<br />
chrysurus) in the Southeast United States. Final Report. FWC-FMRI Report IHR 2003-10. 239 pp.<br />
Myers, R.F. 1991. Micronesian reef fishes, 2nd edition. Coral Graphics, Barrigada, Guam. 298 pp.<br />
Nagelkerken, I., K. Buchan, G.W. Smith, K. Bonair, P. Bush, J. Garzón-Ferreira, L. Botero, P. Gayle, C.D. Harvell, C. Heberer,<br />
K. Kim, C. Petrovic, L. Pors and P. Yoshioka. 1997a. Widespread disease in Caribbean sea fans: I. Spreading and<br />
general characteristics. pp. 679-682. In: Proceedings of the 8th International Coral Reef Symposium.<br />
Nagelkerken, I., K. Buchan, G.W. Smith, K. Bonair, P. Bush, J. Garzón-Ferreira, L. Botero, P. Gayle, C.D. Harvell, C.<br />
Heberer, K. Kim, C. Petrovic, L. Pors and P. Yoshioka. 1997b. Widespread disease in Caribbean sea fans: II. Patterns of<br />
infection and tissue loss. <strong>Marine</strong> Ecology Progress Series 160: 255–263.<br />
National Oceanic and Atmospheric Administration (NOAA). 1997. Scaling Compensatory Restoration Actions. Guidance<br />
Document for Natural Resource Damage Assessment Under the Oil Pollution Act of 1990. NOAA Damage Assessment<br />
and Restoration Program, Silver Spring, MD.<br />
National Oceanic and Atmospheric Administration (NOAA). 2000. Habitat Equivalency Analysis: An Overview. March 21,<br />
1995 (Revised October 4, 2000). NOAA Damage Assessment and Restoration Program, Washington, DC.<br />
National Research Council. 2000. Clean coastal waters: understanding and reducing the effects of nutrient pollution.<br />
Ocean Studies Board, Water Science and Technology Board. 391 pp.<br />
Oppel, F. and T. Meisel. 1871. Along the Florida Reef. pp. 265-309. In: Tales of Old Florida. Castle Press. Seacaucus,<br />
NJ.<br />
Patterson, K.L., J.W. Porter, K.B. Ritchie, S.W. Polson, E. Mueller, E.C. Peters, D.L. Santavy and G.W. Smith. 2002.<br />
The etiology of White Pox, a lethal disease of the Caribbean elkhorn coral, Acropora palmata. pp. 99(11): 8725-8730. In:<br />
Proceedings of the National Academy of Sciences of the United States of America.<br />
PBS&J. 2000. Six-month monitoring report for repaired corals and artificial reef modules. Jacksonville, FL. 9 pp.<br />
PBS&J. 2003. Arcos-1 North and south cables Sunny Isles, Dade County, Florida. Year two coral restoration and artificial<br />
reef monitoring report. Jacksonville, FL. 11 pp.<br />
Peters, E.C., J.J. Oprand and P.P. Yevich. 1983. Possible causal agent of “white band disease” in Caribbean acroporid<br />
coral. Journal of Invertebrate Pathology 41: 394-396.<br />
Peters, E.C., J.C. Halas and H.B. McCarty. 1986. Neoplasia in Acropora palmata, with a review of reports on anomalies<br />
of growth and form in the stony corals. Journal of the National Cancer Institute 76: 895-912.<br />
Porche, C.E., A.M. Eklund and G.P. Scott. 2003. An assessment of rebuilding times for goliath grouper. SEDAR6-RW-3.<br />
25 pp.<br />
<strong>REEF</strong> (Reef Environmental Education Foundation). 2002. Voluntary reef fish monitoring in the Florida Keys National<br />
<strong>Marine</strong> Sanctuary: 2002 update report. Unpublished report for the Florida Keys National <strong>Marine</strong> Sanctuary. <strong>REEF</strong>, Key<br />
Largo, Florida. 6 pp.<br />
Richardson, L.L. 1993. Red band disease: a new cyanobacterial infestation of corals. American Academy for Understanding<br />
Science 13:153-160.
The State of Coral Reef Ecosystems of Florida<br />
Richardson, L.L., W.M. Goldberg, R.G. Carlton and J.C. Halas. 1998a. Coral disease outbreak in the Florida Keys:<br />
Plague type II. Revista Biologia Tropical 46(5): 187-189.<br />
Richardson, L.L., W.M. Goldberg, K.G. Kuta, R.B. Aronson, G.W. Smith, K.B. Ritchie, J.C. Halas, J.S. Feingold and S.L.<br />
Miller. 1998b. Florida’s mystery coral-killer identified. Nature 392: 557-558.<br />
Risk, J.J., J.M. Heikoop, E.N. Edinger and M.V. Erdmann. 2001. The assessment ‘toolbox’: community-based reef evaluation<br />
methods coupled with geochemical techniques to identify sources of stress. Bulletin of <strong>Marine</strong> Science 69 (2): 443-<br />
458.<br />
Ritchie, K.B. and G.W. Smith. 1998a, Description of type II white band disease in acroporid corals. Revista Biologia Tropical<br />
46(5): 173-185.<br />
Rohmann, S.O., J.J. Hayes, R.C. Newhall, M.E. Monaco and R.W. Grigg. In press. The Area of Potential Shallow-water<br />
Tropical and Subtropical Coral Ecosystems in the United States. Coral Reefs.<br />
Rosenberg, A.A. 2003. Managing to the margins: the overexploitation of fisheries. Frontiers in Ecology and the Environment<br />
1(2): 102-106.<br />
Ruiz-Carus, R., R.E. Matheson, Jr., D.E. Roberts, Jr. and P.E. Whitfield. In press. The western Pacific red lionfish, Pterois<br />
volitans (Scorpaenidae) in Florida: evidence for reproduction and parasitism in the first exotic marine fish established in<br />
state waters. Biological Conservation.<br />
Rützler, K. and D.L. Santavy. 1983. The black band disease of Atlantic reef corals I. Description of the cyanophyte pathogen.<br />
<strong>Marine</strong> Ecology 4: 301-319.<br />
Rützler, K., D.L. Santavy, and A. Antonius. 1983. The black-band disease of Atlantic reef corals III. Distribution, ecology,<br />
and development. <strong>Marine</strong> Ecology 4: 329-358.<br />
Santavy, D.L. and E.C. Peters. 1997. Microbial pests: Coral disease research in the western Atlantic. pp. 1: 607-612. In:<br />
H.A. Lessios and I.G. Macintyre (eds.) Proceedings of the 8th International Coral Reef Symposium.<br />
Santavy, D.L., E. Mueller, E.C. Peters, J.W. Porter, V.D. Engle and J.G. Campbell. 1999a. Quality assurance measures<br />
associated with coral reef monitoring. pp. 170-171. In: International Conference on Scientific Aspects of Coral Reef Assessment,<br />
Monitoring and Restoration.<br />
Santavy, D.L., E.C. Peters, C. Quirolo, J.W. Porter and C.N. Bianchi. 1999b. Yellow-blotch disease outbreaks on reefs of<br />
the San Blas Islands, Panama. Coral Reefs 19: 97.<br />
Santavy, D.L., E. Mueller, E.C. Peters, L. MacLaughlin, J.W. Porter, K.L. Patterson and J. Campbell. 2001 Quantitative<br />
assessment of coral diseases in the Florida Keys: Strategy and methodology. Hydrobiologia 460: 39-52.<br />
Santavy, D.L., J.K. Summers, V.D. Engle and L.C. Harwell. <strong>2005</strong>. The Condition of Coral Reefs in South Florida. 2000.<br />
Using Coral Disease and Bleaching as Indicators. Environmental Monitoring and Assessment 100 (1-3): 129-152.<br />
Schmitt, E.F. and K.M. Sullivan. 1996. Analysis of a volunteer method for collecting fish presence and abundance data in<br />
the Florida Keys. Bulletin of <strong>Marine</strong> Science 59 (2): 404-416.<br />
Schmidt, T.W. and L. Pikula 1997. Scientific studies on Dry Tortugas National Park: an annotated bibliography. U.S. Dept.<br />
of Commerce, National Oceanic and Atmospheric Administration and U.S. Dept. of the Interior, National Park Service.<br />
108 pp.<br />
Schultz, E.T. 1986. Pterois volitans and Pterois miles: two valid species. Copeia 1986 (3): 686-690.<br />
Sea Byte, Inc. 2001. Gulfstream Natural Gas Pipeline benthic habitat survey, Florida State Waters. Tequesta, FL. 43<br />
pp.<br />
Semmens, B.X., E.R. Buhle, A.K. Salomon and C.V. Pattengill-Semmens. 2004. A hotspot of non-native marine fishes:<br />
evidence for the aquarium trade as an invasion pathway. <strong>Marine</strong> Ecology Progress Series 266: 239-244.<br />
Shinn, E.A. 1963. Spur and groove formation on the Florida reef tract. Journal of Sedimentary Petrology 33 (2): 291-<br />
303.<br />
Simberloff, D., D.C. Schmitz and T.C. Brown (eds.). 1997. Strangers in paradise: Impact and management of nonindigenous<br />
species in Florida. Island Press, Washington, DC. 479 pp.<br />
Florida<br />
Sidebar<br />
page<br />
199
Florida<br />
page<br />
200<br />
The State of Coral Reef Ecosystems of Florida<br />
Smith, G.W., L.D. Ives, I.A. Nagelkerken and K.B. Ritchie. 1996. Caribbean sea-fan mortalities. Nature 383: 487.<br />
Sprung, J. Two Little Fishes, Inc. Coconut Grove, FL. Available from the internet URL: http://www.twolittlefishies.com.<br />
Summers, J.K., J.F. Paul and A. Robertson, 1995. Monitoring the ecological condition of estuaries in the United States.<br />
Environmental Toxicology and Chemistry 49: 93-108.<br />
Taylor, J.N., W.R. Courtenay and J.A. McCann. 1984. Known impacts of exotic fish in the continental United States. pp.<br />
322-373 In: W.R. Courtenay, Jr. and J.R. Stauffer (eds.) Distribution, biology and management of exotic fishes. John<br />
Hopkins University Press. Baltimore, Maryland.<br />
Thornton, S.L., D.S. Gilliam, R.E. Dodge, R.E. Fergen and P. Cooke. 2002. Success and growth of corals transplanted<br />
to cement armor mat tiles in Southeast Florida: Implications for reef restoration. pp. 1: 955-962. In: Proceedings, 9th<br />
International Coral Reef Symposium.<br />
Tomascik, T. 1991. Settlement patterns of Caribbean scleractinian corals on artificial substrata along a eutrophication<br />
gradient, Barbados, West Indies. <strong>Marine</strong> Ecology Progress Series 77: 261-269.<br />
U.S. Census Bureau (USCB). 2003. Census of Population and Housing, Summary Social, Economic, and Housing<br />
Characteristics, PHC-2-11, Florida. USCB, Washington, DC. Available from the internet URL: http://www.census.gov/<br />
prod/cen2000/phc-2-11.<strong>pdf</strong>.<br />
U.S. DOC (Department of Commerce). 1996. Strategy for Stewardship: Florida Keys National <strong>Marine</strong> Sanctuary Final<br />
Management Plan/Environmental Impact Statement. National Oceanic and Atmospheric Administration, Silver Spring,<br />
MD. Available from the internet URL: http://floridakeys.noaa.gov/regs.<br />
U.S. DOC (Department of Commerce). 2003. Fisheries of the United States, 2002. Current Fishery Statistics No. 2002.<br />
U.S. DOC, Washington, DC. 126 pp. Available from the internet URL: http://www.st.nmfs.gov/st1/fus/current/2002-fus.<br />
<strong>pdf</strong>.<br />
U.S.G.S. (U.S. Geological Survey) 1998. Hurricane effects on wildlife and ecosystems. 5 pp. U.S.G.S., Washington, DC.<br />
Available from the internet URL: http://biology.usgs.gov/pr/newsrelease/1998/12-8.html.<br />
U.S.G.S. (U.S. Geological Survey) Nonindigenous Aquatic Species. 2003. U.S.G.S., Washington, D.C. Available from the<br />
internet URL: http://nas.er.usgs.gov/queries/default.asp.<br />
Vargas-Ángel, B. and J.D. Thomas. 2002. Sexual reproduction of Acropora cervicornis in nearshore waters off Broward<br />
County, Florida, USA. Coral Reefs 21: 25-26.<br />
Vargas-Ángel, B., J.D. Thomas and S.M. Hoke. 2003. High-latitude Acropora cervicornis thickets off Fort Lauderdale,<br />
Florida. Coral Reefs 22: 465-472<br />
Vargas-Ángel, B., S.B. Colley, S.H. Hoke and J.D. Thomas. In preparation. The reproductive seasonality and gametogenic<br />
cycle of Acropora cervicornis off Broward County, Florida.<br />
Vaughan, T.W. 1911. Recent Madreporaria of southern Florida. Carnegie Institution of Washington Year Book 8: 135-<br />
144.<br />
Vaughan, T.W. 1914. Building of the Marquesas and Tortugas Atolls and a sketch of the geologic history of the Florida reef<br />
tract. Carnegie Institution, Washington, D.C. Publication 182. Papers from the Department of <strong>Marine</strong> Biology 5: 55-67.<br />
Visit Florida Year-in-Brief. 2003. Available from the internet URL: http://www.visitflorida.org/_<strong>pdf</strong>/partner_research/<br />
YearInBrief/2003YearInBrief.<strong>pdf</strong>.<br />
Weil, E. and N. Knowlton. 1994. A multi-character analysis of the Caribbean coral Montastraea annularis (Ellis and Solander,<br />
1786) and its two sibling species, M. faveolata (Ellis and Solander,1786) and M. franksi (Gregory,1895). Bulletin<br />
of <strong>Marine</strong> Science 55: 151-175.<br />
Whitfield, P. E., T. Gardner, S.P. Vives, M.R. Gilligan, W.R. Courtenay, Jr., G.C. Ray and J.A. Hare. 2002. Biological invasion<br />
of the Indo-Pacific lionfish Pterois volitans along the Atlantic coast of North America. <strong>Marine</strong> Ecological Progress<br />
Series 235: 289-297.<br />
Wittenberg, M. and W. Hunte. 1992. Effects of eutrophication and sedimentation on juvenile corals, I. Abundance, mortality<br />
and community structure. <strong>Marine</strong> Biology 112: 131-138.
The State of Coral Reef Ecosystems of the Flower Garden Banks,<br />
Stetson Bank, and Other Banks in the Northwestern Gulf of Mexico<br />
Emma L. Hickerson 1 , G.P. Schmahl 1<br />
INTRODUCTION AND SETTING<br />
The East and West Flower Garden Banks (EFGB and WFGB) were designated as the Flower Garden Banks<br />
National <strong>Marine</strong> Sanctuary (FGBNMS) through the National Oceanic and Atmospheric Administration (NOAA) in<br />
January 1992. The two banks are prominent geological features located near the outer edge of the continental<br />
shelf in the northwestern Gulf of Mexico, approximately 192 km southeast of Galveston, Texas (Figure 8.1).<br />
These features, created by the uplift of underlying salt domes of Jurassic origin, rise from surrounding water<br />
depths of over 100 m to within 17 m of the surface. The northernmost thriving coral reef communities in North<br />
America cap the shallow portions of the EFGB and WFGB. They are relatively isolated from other coral reefs<br />
of the Caribbean and Gulf of Mexico, located over 690 km from the nearest reefs of the Campeche Bank off<br />
Mexico’s Yucatan Peninsula, and over 1,200 km from the coral reefs of the Florida Keys. The area of the<br />
EFGB (27 54.5’ N, 93 36.0’ W) comprises about 65.8 km 2 of which about 1.02 km 2 is coral reef. Located 19.3<br />
km to the west, the WFGB (27 52.5’ N, 93 49.0’ W) comprises about 77.2 km 2 of which about 0.4 km 2 is coral<br />
reef (Gardner et al., 1998).<br />
Structurally, the coral reefs of the Flower Garden Banks are comprised of aggregations of large, closely<br />
spaced boulder and brain coral heads that grow to up to 3 m or more in diameter and height (Figure 8.2).<br />
Reef topography is relatively rough, with many vertical and inclined surfaces. Between groups of coral heads,<br />
there are numerous sand patches and channels. Coral growth is relatively uniform over the entire top of both<br />
banks, occupying the bank crests down to about 50 m. As the reef slopes on the flanks of the coral caps, the<br />
corals grow flatter and individual heads can cover large areas. Despite the low species numbers on the reef<br />
crest, the reefs exhibit extremely high coral cover, ranging on average between 45-52% down to 30 m depth,<br />
and 70% in areas down to at least 43 m depth.<br />
Probably due to its geographic isolation, water temperature, and other factors, there is a relatively low diversity<br />
(only about 21 species) of reef-building corals on the Flower Garden Banks. Interestingly, the coral reefs of<br />
the Flower Garden Banks contain no elkhorn or staghorn corals, and no shallow-water sea whips or sea fans<br />
(gorgonians) that are common elsewhere in the Caribbean. Deepwater surveys below 43 m, however, reveal<br />
a rich diversity of gorgonians and antipatharian corals.<br />
Stetson Bank was added to the FGBNMS in 1996. It is located 48 km to the northwest of the WFGB and is also<br />
associated with an underlying salt dome. Stetson Bank is classified as a mid-shelf bank (Rezak et al., 1985),<br />
and is comprised of claystone/siltstone outcrops forming distinct pinnacles near its northern edge. Stetson<br />
Bank is not a true coral reef, but it does contain a low diversity coral community in addition to a prominent<br />
sponge fauna. Stetson Bank is dominated by fire coral (Millepora alcicornis) and in certain areas, ten-ray star<br />
coral (Madracis decactis). These two species comprise about 32% coral cover in the pinnacle region. Stetson<br />
Bank is composed of claystone outcroppings that have been pushed up to within 17 m of the sea surface.<br />
Including the two dominant species, about 10 species of coral have been documented. The pinnacle region<br />
is the most conspicuous feature of the bank, which stretches along the northwest face of Stetson Bank for<br />
approximately 500 m. With the addition of Stetson Bank, the FGBNMS encompasses 145.8 km 2 and includes<br />
the entire bank areas of each of the three features, including the shallow coral reef areas.<br />
The user groups of the FGBNMS are recreational SCUBA divers and recreational and commercial fishers.<br />
Three dive charter vessels routinely visit the Sanctuary. Limited data are available to sufficiently quantify the<br />
numbers of private vessels and fishing vessels visiting the FGBNMS.<br />
In addition to the coral reefs within the FGBNMS, there are a number of other reefs and banks in the northwestern<br />
Gulf of Mexico that contain corals or coral communities. The Flower Garden Banks and Stetson Bank are but<br />
1 Flower Garden Banks National <strong>Marine</strong> Sanctuary<br />
Flower Garden Banks<br />
Sidebar<br />
page<br />
201
Flower Garden Banks<br />
page<br />
202<br />
The State of Coral Reef Ecosystems of the Flower Garden Banks and Other Banks of the NW Gulf of Mexico<br />
Figure 8.1. Map showing the locations of the coral banks of the Gulf of Mexico. While some of the banks are protected by the provisions<br />
of the FGBNMS, unprotected coral communities are present at Bright, Sonnier, Geyer, and McGrail Banks. These banks are<br />
part of the network of reefs and banks which are biologically and ecologically associated with the ecosystems of the FGBNMS. Map:<br />
A. Shapiro. Source: D. Weaver.
The State of Coral Reef Ecosystems of the Flower Garden Banks and Other Banks of the NW Gulf of Mexico<br />
three of a network of over one hundred continental shelf-edge features<br />
off the coasts of Texas and Louisiana. Many of these topographic<br />
features were the subjects of baseline scientific investigations in the<br />
late 1970s and early 1980s (Rezak et al., 1985). These studies first<br />
documented that a number of the banks contained coral reef resources.<br />
Recent surveys by FGBNMS staff and collaborators have further<br />
characterized several of these features. At least four of these reefs and<br />
banks harbor important populations of scleractinian coral: Bright Bank<br />
(11 species; Rezak et al., 1985; FGBNMS observations), Sonnier Bank<br />
(nine species; Rezak et al., 1985; Weaver et al., in press), Geyer Bank<br />
(four species; Rezak et al., 1985, FGBNMS observations), and McGrail<br />
Bank (nine species; Rezak et al., 1985; Weaver et al., in press; FGBNMS<br />
observations). The coral communities at McGrail Bank are especially<br />
significant. Recent surveys have revealed a community dominated by<br />
the blushing star coral (Stephanocoenia intersepta) which covers up to<br />
30% (Schmahl and Hickerson, in press) of the seafloor in some areas<br />
at depths between 45 m and 60 m (Figure 8.3).<br />
In addition, many of the other banks in the northwestern Gulf of<br />
Mexico contain significant communities of a variety of deeper water<br />
coral assemblages, characterized by<br />
antipatharians, gorgonians, solitary<br />
corals, and species of branching<br />
corals such as Oculina spp. and<br />
Madrepora spp. These types of<br />
communities are typically observed<br />
in depths from 60 m to 150 m. All<br />
of the reefs and banks in this vicinity<br />
provide hard bottom substrate that<br />
has been colonized by a high diversity<br />
of benthic invertebrates, and provide<br />
important habitat to a wide range of<br />
reef fish species (Dennis and Bright,<br />
1988). These banks are currently<br />
unprotected, with the exception of<br />
regulation of direct impacts from<br />
oil and gas development. Further<br />
investigations are warranted to fully<br />
determine the extent of these coral<br />
resources.<br />
Figure 8.2. Large boulder corals are a<br />
striking feature of the FGBNMS landscape.<br />
The coral caps of the FGBNMS boast over<br />
50% coral cover. Photo: Joyce and Frank<br />
Burek.<br />
Figure 8.3. McGrail Bank Stephanocoenia community at approximately 42 m depth.<br />
Estimates of percent coral cover reach upwards of 30%. Photo: FGBNMS and National<br />
Undersea Research Center-University of North Carolina, Wilmington.<br />
Flower Garden Banks<br />
Sidebar<br />
page<br />
203
Flower Garden Banks<br />
page<br />
204<br />
The State of Coral Reef Ecosystems of the Flower Garden Banks and Other Banks of the NW Gulf of Mexico<br />
ENVIRONMENTAL AND ANTHROPOGENIC STRESSORS<br />
Climate Change and Coral Bleaching<br />
The location and depth of these coral reefs buffer them somewhat from the short-term effects of global warming<br />
and climate change. However, even though the effects of coral bleaching are relatively low to date (less than<br />
4% annually; Hagman and Gittings, 1992; Gittings et al., 1993; US DOI-MMS, 1996; Dokken et al., 1999, 2003;<br />
Precht et al., in press), some bleaching is routinely observed, mostly when the water temperature approaches<br />
30 o C. Data on bleaching incidence from 1989-2003 is given in Figure 8.4. Overall, bleaching has resulted in<br />
negligible mortality (Hagman and Gittings, 1992). However, bleaching events and their severity are predicted<br />
to increase as global ocean temperatures increase.<br />
Diseases<br />
The incidence of disease is very low at<br />
the EFGB and WFGB of the FGBNMS.<br />
Observations of white plague type II<br />
were noted in Montastraea annularis,<br />
M. cavernosa, Colpophylia natans,<br />
and Diploria strigosa during the 2002-<br />
2003 monitoring effort (Precht et al.,<br />
in press) outside the random transect<br />
surveys. No white band disease is<br />
present.<br />
Considering the magnitude of<br />
the threat from coral diseases,<br />
we feel it is important to increase<br />
awareness among scuba divers to<br />
thoroughly wash scuba equipment,<br />
particularly wetsuits, before traveling<br />
to a new diving destination. There<br />
is no indication that disease can be<br />
transmitted through unclean gear, but<br />
proactive behavior may lessen the<br />
risk of disease transmission.<br />
Tropical Storms<br />
Since 1979, three hurricanes have<br />
passed near the Flower Garden<br />
Banks (Figure 8.5). At the EFGB<br />
and WFGB, it is suspected that<br />
coral boulders would be susceptible<br />
to toppling, particularly Diploria<br />
strigosa heads that are subjected to<br />
bioerosion, a process that produces<br />
mushroom-shaped colonies - large<br />
heads of coral on spindly coral stalks<br />
(Figure 8.6)<br />
Anecdotal reports from scuba divers<br />
noted up to 1.5 m sand waves in the<br />
sand flats of the Banks after tropical<br />
storms. At Stetson Bank, scouring of<br />
Figure 8.4. Incidence of bleaching at the East and West Banks of the FGBNMS from<br />
1989-2003. Source: USDOI-MMS, 1996; Dokken et al., 1999, 2003; Precht et al.,<br />
in press.<br />
Figure 8.5. A map showing the paths and intensities of tropical storms passing near<br />
the FGBNMS and nearby banks, 1979-2004. Year of storm, storm name and storm<br />
strength on the Saffir-Simpson scale (H1-5) are indicated for each. Map: A. Shapiro.<br />
Source: NOAA Coastal Services Center.
The State of Coral Reef Ecosystems of the Flower Garden Banks and Other Banks of the NW Gulf of Mexico<br />
the claystone/siltstone valleys occurs,<br />
as well as toppling of the claystone<br />
pinnacles.<br />
up to 16,500 km2 Coastal Development and Runoff<br />
Primary sources of potential<br />
degradation of water quality include<br />
coastal runoff, river discharges,<br />
and effluent discharges from<br />
offshore activities such as oil and<br />
gas development and marine<br />
transportation (Deslarzes, 1998).<br />
Oxygen-depleted (hypoxic) nearbottom<br />
waters have been found in<br />
a large area of the northern Gulf.<br />
Although relatively far from the Flower<br />
Garden Banks, there is concern that<br />
this area could grow and impact the<br />
Figure 8.6. These colonies of Diploria strigosa, mushroom-shaped due to bioerosion<br />
at their base, may be more susceptible to toppling during storms. Photo: Joyce and<br />
outer continental shelf. Often called<br />
the ‘dead zone’ this area has included<br />
Frank Burek.<br />
on the continental shelf from the Mississippi delta to the Texas coast.<br />
General coastal runoff and degraded nearshore water quality can potentially impact the banks through crossshelf<br />
transport processes which bring turbid, nutrient-rich water offshore. Deslarzes (in press) postulates<br />
the fluorescent bands observed in the carbonate skeletons of some corals come from the seasonal<br />
transport of nearshore water onto the FGBNMS, which may be tainted by urban, agricultural, and biological<br />
contaminants.<br />
Research using nitrogen isotopes suggests a pathway for direct primary nitrogen input from coastal river<br />
sources from a considerable distance. While nitrogen isotopes from the Flower Garden Banks have signatures<br />
of ocean origin (K. Dunton, pers. comm.), benthic algae from Stetson Bank have a distinct nitrogen isotope<br />
signature similar to plants found in coastal estuarine systems. These findings suggest that coastal influences<br />
are reaching only as far as Stetson Bank.<br />
Coastal Pollution<br />
Coastal pollution is not a major concern<br />
at this offshore location.<br />
Tourism and Recreation<br />
Recreational scuba diving is popular<br />
and the demand appears to be<br />
increasing. There are currently three<br />
live-aboard charter dive vessels that<br />
regularly visit the banks (Figure 8.7).<br />
Each of these vessels can carry up<br />
to 35 divers. In 1997, a survey of<br />
charter dive operations revealed that<br />
an estimated 2,350 divers visited the<br />
Flower Garden Banks. These divers<br />
spent $870,000 in Texas, of which<br />
approximately $636,000 was spent in<br />
Figure 8.7. Recreational dive charter vessel on mooring at FGBNMS. Photo: Russ<br />
Wilkins.<br />
Flower Garden Banks<br />
Sidebar<br />
page<br />
205
Flower Garden Banks<br />
page<br />
206<br />
The State of Coral Reef Ecosystems of the Flower Garden Banks and Other Banks of the NW Gulf of Mexico<br />
the local economy of Freeport, where it generated $1.1 million in sales/output, $477,000 in income, and 24<br />
full-time and part-time jobs. An additional $234,000 was spent in other areas of Texas, with $559,000 in sales/<br />
output, $228,000 in income, and 11 jobs (Ditton and Thailing, 2001). While scuba diving has helped these<br />
economie, resource managers suspect that recreational dive vessels often discharge inadequately treated<br />
sewage effluent into Sanctuary waters.<br />
Fishing<br />
The impacts of fishing and associated fishing activities are not well known. At this time, only traditional<br />
hook and line fishing is allowed in the Sanctuary. However, illegal fishing by both commercial long-liners<br />
and recreational spearfishers has been reported. Targeted fishing efforts, which are allowed under current<br />
regulations, could have a significant detrimental impact on snapper and grouper populations.<br />
Lost and discarded fishing gear has<br />
been observed in the FGBNMS.<br />
Such objects can cause localized<br />
physical injury to coral reefs and<br />
have been known to entangle and<br />
injure loggerhead sea turtles and<br />
other organisms. Fishing bycatch<br />
has occasionally been reported by<br />
scuba divers, and shrimping bycatch<br />
is illegally discarded on Stetson Bank.<br />
Stetson Bank is closer to shore, and<br />
is often targeted by recreational<br />
fishers (Figure 8.8). It is suspected<br />
that Stetson Bank is more prone to<br />
mechanical injury by fishing due to the<br />
relatively soft nature of the claystone/<br />
siltstone substrate. Continuous<br />
weakening of the substrate by fishing<br />
gear could possibly render it more<br />
susceptible to tropical storm and<br />
hurricane events.<br />
Trade in Coral and Live Reef Species<br />
This activity is prohibited by Sanctuary regulations.<br />
Figure 8.8. Dead spinner shark (Carcharhinus brevipinna) on Stetson Bank in April<br />
2004. While it is not known what caused the death of this animal, it is suspected that<br />
the death resulted from fishing activity. Photo: C. Loustalot.<br />
Ships, Boats, and Groundings<br />
Groundings do not occur at the FGBNMS due to the depth of the coral caps. However, anchors from large<br />
ships can have devastating local impacts to the living coral reef. Over the last 20 years there have been a<br />
number of incidences of significant impacts caused by the anchoring of large industry vessels, freighters,<br />
and fishing vessels (Gittings et al., 1992). Foreign-flagged cargo vessels have occasionally anchored at the<br />
Flower Garden Banks without knowing of the anchoring restrictions. There have been at least three large<br />
vessel anchoring incidents since 1994. In 2002, the FGBNMS became the first international ‘no-anchor zone’<br />
through the development of new language integrated by the International Maritime Organization.
The State of Coral Reef Ecosystems of the Flower Garden Banks and Other Banks of the NW Gulf of Mexico<br />
<strong>Marine</strong> Debris<br />
Lost and discarded fishing gear,<br />
including long-lines, floats, and nets<br />
have been observed at the Flower<br />
Garden Banks and Stetson Bank<br />
(Figure 8.9). Such incidents cause<br />
localized physical injury to coral reef<br />
resources, and have been known<br />
to entangle and injure resident<br />
and transient sea turtles and other<br />
organisms. Debris originating from<br />
historic activities, including seismic<br />
cables from acoustic surveying<br />
efforts, remain embedded in the coral<br />
reef around the flanks of the EFGB<br />
and WFGB. Remnants of anchors<br />
and old engine blocks are scattered<br />
throughout the three sites.<br />
Aquatic Invasive Species<br />
In August 2002, an invasive coral<br />
species, Tubastraea coccinea, was<br />
photographed at the EFGB on reef<br />
substrate at around 24 m depth<br />
(Figure 8.10). Prior to this report,<br />
no evidence of the coral had been<br />
reported on natural reef substrate<br />
in the Gulf of Mexico. However, it<br />
was known to inhabit the underwater<br />
structures of seven oil and gas<br />
platforms off the Texas coast. The<br />
first known sighting of T. coccinea<br />
on platforms in the Gulf occurred in<br />
1991, and it was later documented<br />
on several other platforms in the Gulf<br />
of Mexico (Fenner, 2001; Fenner and<br />
Banks, 2004). This coral species<br />
currently thrives on High Island<br />
A389A (HIA389A), a gas platform<br />
located within the EFGB boundaries.<br />
Figure 8.10. Tubastraea coccinea, an invasive coral species, was found on the underwater<br />
structure of gas platform HIA389A, which is located within the boundaries<br />
of the FGBNMS. This species threatens natural reef habitats both within and outside<br />
Sanctuary boundaries. Photo: Joyce and Frank Burek.<br />
In September 2004, several dozen colonies of T. coccinea were also documented by the FGBNMS research<br />
team at Geyer Bank, located 52 km east-southeast of the EFGB. This is further evidence of the threat to<br />
natural reef ecosystems by this invasive species.<br />
Security Training Activities<br />
No security training activities occur in the FGBNMS.<br />
Figure 8.9. A discarded net on WFGB. Photo: FGBNMS and National Undersea<br />
Research Center-University of North Carolina, Wilmington.<br />
Offshore Oil and Gas Exploration<br />
The northern Gulf of Mexico is one of the most active areas for oil and gas exploration and development in the<br />
world. By the end of 2003, approximately 6,500 production platforms had been installed (of which approximately<br />
2,400 were removed), about 43,300 wells had been drilled, and 168,474 km of pipeline installed (Figure 8.11).<br />
Flower Garden Banks<br />
Sidebar<br />
page<br />
207
Flower Garden Banks<br />
page<br />
208<br />
The State of Coral Reef Ecosystems of the Flower Garden Banks and Other Banks of the NW Gulf of Mexico<br />
The Gulf of Mexico accounts for more<br />
than 91% of the oil and 97% of the<br />
natural gas produced in offshore U.S.<br />
waters (J. Sinclair, pers. comm.).<br />
Within the four-mile zone of both the<br />
EFGB and WFGB regulated by the U.S.<br />
Department of the Interior-Minerals<br />
Management Service (MMS), there<br />
are currently 14 production platforms<br />
(six at the West Bank and eight at<br />
the East Bank, including one subsea<br />
station) and approximately 178.24<br />
km of pipeline, half of which are<br />
dedicated oil pipelines (Deslarzes,<br />
1998). Over the past two years, three<br />
platforms and approximately 134 km<br />
of pipeline have been added within<br />
the MMS four-mile regulatory zones<br />
of the East and West Banks. One<br />
platform and approximately 17.44 km<br />
of pipeline is located within 6.5 km<br />
of Stetson Bank. There is one gas<br />
Figure 8.11. Oil and gas infrastructure in the vicinity of the FGBNMS. Blue circles<br />
indicate inactive platforms that have been cut off at depth and converted to artificial<br />
reefs. Map: A. Shapiro. Sources: D. Weaver; U.S. DOI-Minerals Management Service.<br />
production platform (HIA389A) located within the EFGB boundary, less than 2 km from the coral cap (Figure<br />
8.12). Recent exploration activities have been conducted by this platform. A pipeline has been constructed<br />
through the Sanctuary to tie in HIA389A to a subsea station outside of the Sanctuary boundaries. This pipeline<br />
will be used to bring in product from the subsea station to HIA389A for processing and shipment to shore.<br />
Potential impacts from offshore oil and gas exploration and development include accidental spills, contamination<br />
by drilling, related effluents and discharge, anchoring of vessels involved in placing pipelines, drilling rigs and<br />
production platforms, seismic exploration, use of dispersants in oil spill mitigation, and platform removal. In<br />
spite of the intense industrial activity, long-term monitoring studies indicate no significant detrimental impact<br />
to the coral reefs of the FGBNMS from nearby oil and gas development (Gittings, 1998). Fortunately, there<br />
have been no major oil spills or impacts from these<br />
activities.<br />
While the structures of the platform appear to provide<br />
artificial substrate for both motile and sessile marine<br />
populations, there is growing concern that the oil<br />
and gas structures may act as vectors for the spread<br />
of invasive and exotic species. An example is the<br />
introduction and establishment of sergeant majors<br />
(Abudefduf saxatilis) at the FGBNMS and recent<br />
(1997) appearance of yellowtail snapper (Ocyurus<br />
chrysurus). Pattengill (1998) suggests that these<br />
resulted from “hopping” along the platforms in the<br />
eastern side of the Gulf, where they have been<br />
reported by recreational fishers. We suspect that<br />
this is the vector used by the orange cup coral, T.<br />
coccinea, to reach the EFGB.<br />
Figure 8.12. Gas platform HIA389A (W&T Offshore) is located<br />
within Sanctuary boundaries, within 1 mile of the coral cap. Photo:<br />
FGBNMS.
The State of Coral Reef Ecosystems of the Flower Garden Banks and Other Banks of the NW Gulf of Mexico<br />
<strong>CORAL</strong> <strong>REEF</strong> ECOSYSTEMS—DATA-GATHERING ACTIVITIES AND RESOURCE CONDITION<br />
East and West Flower Garden Banks, Long-Term Monitoring Project<br />
Since 1989, the coral caps of the East and West Banks of the FGBNMS have been monitored annually<br />
through a contract funded cooperatively by the FGBNMS and MMS. Since 2002, the contract has been held<br />
by a group led by PBS&J, Geo<strong>Marine</strong>, Inc., and Dauphin Island Sea Lab. Monitoring of Stetson Bank is not<br />
included in the contract. The data presented below are from the long-term monitoring report through 2001.<br />
The most recent investigations (2002-2003) are currently in press and will be included in future reporting<br />
efforts.<br />
The FGBNMS Long-Term Monitoring (LTM) Project is conducted within a 100 m 2 area on the reef cap, and<br />
evaluates water quality (temperature, salinity, light attenuation, pH, turbidity, DO 2 ), reef diversity, growth rates,<br />
long-term changes in individual coral colonies, accretionary growth, general coral reef community health, fish,<br />
lobster, and Diadema surveys (Figure 8.13). Water samples are analyzed for nitrogen, nitrate, nitrite, dissolved<br />
ammonia, soluble reactive phosphorus and total phosphorus, and chlorophyll A. It is realized that the 100 m 2<br />
study site does not incorporate discreet zones found elsewhere in the coral reef area (e.g., Madracis mirabilis<br />
fields).<br />
Figure 8.13. West and East FGB 100 m 2 study sites located on the coral caps (indicated in red). The coral caps represent less than<br />
2% of the area within the Sanctuary boundaries. Map: A. Shapiro. Source: Gardner et al., 1998; D. Weaver.<br />
Flower Garden Banks<br />
Sidebar<br />
page<br />
209
Flower Garden Banks<br />
page<br />
210<br />
The State of Coral Reef Ecosystems of the Flower Garden Banks and Other Banks of the NW Gulf of Mexico<br />
Atlantic and Gulf Rapid Reef Assessment Surveys<br />
Benthic and fish communities at one site on each of the East and West Banks were assessed using the<br />
Atlantic and Gulf Rapid Reef Assessment (AGRRA) protocol in August 1999.<br />
Reef Environmental Education Foundation Fish Surveys<br />
The Reef Environmental Education Foundation (<strong>REEF</strong>) conducts fish surveys annually at the FGBNMS using<br />
roving diver surveys. The surveys do not quantify the abundance or biomass of the fish community, but all<br />
observations are entered into the <strong>REEF</strong> database. Methods and data are available at http://www.reef.org.<br />
Other Sanctuary Activities<br />
In addition to the AGRRA and <strong>REEF</strong> programs which are summarized in Table 8.1, the FGBNMS supports (by<br />
providing shiptime on chartered or Sanctuary vessels) several researchers investigating a wide array of topics.<br />
In addition, the Sanctuary research team conducts an annual data collection cruise, but funding limitations<br />
have precluded data analysis to date. Sanctuary staff encourage recreational divers to submit observations<br />
of charismatic megafauna, such as sharks, rays, and sea turtles, as the observations are maintained in the<br />
Sanctuary’s database.<br />
The most recent available data from the FGBNMS LTM Project and AGRRA surveys are presented below to<br />
characterize the status of reef ecosystems at the FGBNMS. The combination of these results best describes<br />
the status of the resources, with limitations as noted below.<br />
Table 8.1. Coral reef ecosystem monitoring activities that occur at the FGBNMS.<br />
ECOSYSTEM COMPONENT PROGRAM SOURCE<br />
Water Quality FGBNMS LTM Most recent report: Dokken et al., 2003.<br />
Benthic Habitats FGBNMS LTM<br />
AGRRA<br />
Reef Fish FGBNMS LTM<br />
<strong>REEF</strong><br />
AGRRA<br />
Current contractor: PBS&J<br />
2002-2003 report: Precht et al., in press<br />
Most recent report: Dokken et al., 2003.<br />
Current contractor: PBS&J<br />
2002-2003 report: Precht et al., in press<br />
AGRRA Program: Pattengill-Semmens and Gittings, 2003.<br />
Most recent report: Dokken et al., 2003.<br />
Current contractor: PBS&J<br />
2002-2003 report: Precht et al., in press<br />
<strong>REEF</strong> database (www.reef.org)<br />
AGRRA Program: Pattengill-Semmens and Gittings, 2003.
WATER QUALITY<br />
The State of Coral Reef Ecosystems of the Flower Garden Banks and Other Banks of the NW Gulf of Mexico<br />
East and West Flower Garden Banks, Long-Term Monitoring Project<br />
Methods<br />
YSI 6600 Datasondes are deployed at the reef crests of all three banks of the FGBNMS. Sensors log the<br />
following measurements at 30 minute intervals: temperature, salinity, photosynthetically active radiation (PAR)<br />
irradiance, pH, turbidity, and DO 2 . Quarterly servicing is maintained (Figure 8.14), although more regular<br />
servicing is recommended. Servicing is inhibited by weather conditions and access to the site. Quarterly<br />
water sampling is conducted at the surface, midwater, and near bottom. A reference PAR irradiance sensor<br />
has historically been maintained on the gas platform HIA389A located within 2 km of the coral cap at the<br />
EFGB, although it is not presently collecting data.<br />
Results and Discussion<br />
Only the EFGB and WFGB are discussed here; Stetson Bank data has been collected, but not yet analyzed.<br />
The mean PAR irradiance and corresponding values for -k were lower at the WFGB than at the EFGB during<br />
1997-1999; however, it does not appear that these differences were statistically significant. Seasonal variation<br />
in light levels was clearly evident in the plot of PAR values recorded at the HIA389A Platform. Seasonal<br />
variation in PAR was present, but less coherent for values recorded by the instruments at the EFGB and<br />
WFGB. Data gaps are frequent due to equipment failure.<br />
Between September 23, 2001 and November 2003, salinity, turbidity, dissolved oxygen, and pH, in addition<br />
to temperature and PAR, were continuously measured at 30 minute intervals. During this period, salinity<br />
at EFGB ranged from about 32-38 ppt; salinity at WFGB ranged from about 33-37 ppt. Sensor integrity is<br />
questionable for other parameters.<br />
Seawater temperatures were obtained from the Hobo-Temp recording thermographs (Onset Instruments,<br />
Pocasset, Massachusetts) deployed on the reef crest of EFGB and WFGB. 2002-2003 data show minimum<br />
temperatures at the EFGB and WFGB as 19.06 o C and 18.99 o C, respectively. Maximum temperatures were<br />
20.24 o C and 30.22 o C, respectively (Figure 8.14). Due to equipment failure of the sensor at the EFGB, no<br />
data was recorded from April to November 2000, or from May 15 to August 26, 2003 at that site.<br />
Figure 8.14. Left: YSI 6600 Datasonde quarterly servicing at the FGBNMS. Photo: PBS&J. Right: daily mean temperatures collected<br />
from October 2002 to April 2004. Source: Precht et al., in press.<br />
Flower Garden Banks<br />
Sidebar<br />
page<br />
211
Flower Garden Banks<br />
page<br />
212<br />
The State of Coral Reef Ecosystems of the Flower Garden Banks and Other Banks of the NW Gulf of Mexico<br />
BENTHIC HABITATS<br />
East and West Flower Garden Banks, Long-Term Monitoring Project<br />
Methods<br />
A 100 m 2 study site has been established at both the EFGB and WFGB, and virtually all formal monitoring<br />
occurs within these areas. The following is a description of the methods outlined in the Statement of Work for<br />
the contracted monitoring effort co-funded by FGBNMS and MMS (MMS Document: NSL-GM-04-06; GOM-<br />
C4100, Section C). The monitoring includes several elements:<br />
• Random Photographic Transects: 14 random photographic and/or digital video transects that are 10 m in<br />
length. Mean percent cover and standard deviation for each year and bank are calculated for coral species<br />
and other cover categories;<br />
• Permanent Growth Stations: photographs of 60 permanent stations for monitoring growth of the scleractinian<br />
coral Diploria strigosa;<br />
• Repetitive Quadrat Stations: 40 repetitive quadrat stations to detect and evaluate long-term changes in<br />
individual coral colonies. In addition to the initial 40 stations, nine repetitive quadrat stations have been<br />
established at the EFGB in coral reef habitat at deeper depths (30-40 m); and<br />
• Sclerochronology: Cores of Montastraea faveolata coral colonies are taken biannually on each bank in odd<br />
numbered years to determine annual growth.<br />
Results and Discussion<br />
The results presented below are from the FGBNMS long-term monitoring report covering the years 1996-<br />
2001 (Dokken et al., 2003). A subsample of results from the 2002-2003 field season are also included where<br />
available (Precht et al., in press).<br />
Random Photographic Transects—East Bank Community Composition and Structure (1996-2001)<br />
From 1996 to 2001, mean percent cover of the Montastraea annularis complex increased, then increased<br />
again in 2003 on the WFGB, and decreased in 2002-2003 on the EFGB (Table 8.2). During the 2000-2001<br />
and 2003 sampling years, coral cover ranged from 51.6-57.1% on the WFGB and 53.2-61.8% on the EFGB<br />
(Figure 8.15). The 2003 data reflect an overall reduction of coverage by the Montastraea annularis complex<br />
of at least 10%. Both Porites astreoides and Millepora spp. reflect higher percent coverages in 2003.<br />
Total algal cover was greatest in 1999, then fell in both 2000 and 2001, and in the case of the WFGB,<br />
decreased by a factor of a third in 2003. Diploria strigosa was also highest during 1999 and likewise declined<br />
in both 2000 and 2001. Although a minor component, cover of Siderastrea sp. was highest (1.8%) in 1996 and<br />
fell to less than 1% in successive years. Cover of the remaining coral species as well as sponges remained<br />
relatively stable throughout the monitoring period of 1996 to 2001, but increased in coverage at both banks in<br />
2003. Cover of reef rock was highest in 1998, the year before algal cover peaked, then declined. An additional<br />
parameter, calcareous bare turf was measured in the 2002-2003 data. This includes calcareous encrusting<br />
algae, including reds that may not be decipherable from bare space, and short turf algae
The State of Coral Reef Ecosystems of the Flower Garden Banks and Other Banks of the NW Gulf of Mexico<br />
Table 8.2. Percent cover in 2000, 2001, and 2003 for random transects in the WFGB and EFGB. Standard deviations are in parentheses.<br />
Source: Dokken et al., 2003; Precht et al., in press.<br />
SPECIES<br />
WFGB EFGB<br />
2000 2001 2003 2000 2001 2003<br />
Agaricia agaricites 0.3 (0.2) 0.3 (0.2) 0.24 (0.08) 0.2 (0.2) 0.4 (0.4) 0.33 (0.11)<br />
Agaricia fragilis 0.007 (0.03) 0.003 (0.01) 0 0 0.1 (0.6) 0.01 (0.01)<br />
Colpophyllia natans 3.6 (4.3) 2.8 (2.7) 2.17 (0.84) 2.6 (3.3) 2.6 (3.0) 3.29 (1.4)<br />
Diploria strigosa 8.1 (6.7 9.5 (5.8) 9.04 (2.68) 6.2 (2.8) 3.9 (4.1) 6.19 (1.55)<br />
Montastraea annularis complex* 30.9 (11.6) 35.1 (12.0) 33.8 (4.31) 39.5 (9.6) 44.8 (12.9) 28.47 (2.98)<br />
Montastraea cavernosa 5.8 (11.7) 2.1 (3.7) 2.67 (1.10) 4.8 (5.7) 3.6 (5.0) 4.24 (1.41)<br />
Scolymia sp. 0.01 (0.02) 0.003 (0.009) 0.04 (0.03) 0.01 (0.02) 0.002 (0.009) 0.01 (0.01)<br />
Stephanocoenia mechelinii 0.9 (0.9) 0.3 (0.6) 0.96 (0.45) 0.1 (0.2) 0.2 (0.5) 0.76 (0.32)<br />
Mussa angulosa 0.3 (0.6) 0.07 (0.2) 0.07 (0.04) 0.2 (0.4) 0.06 (0.3) 0<br />
Madracis sp. 0.2 (0.4) 0.06 (0.1) 0.37 (0.29) 0.8 (2.3) 0.2 (0.3) 0.83 (0.34)<br />
Porites astreoides 2.5 (1.6) 2.0 (0.9) 3.77 (0.46) 2.6 (1.7) 4.6 (2.7) 5.69 (0.98)<br />
Porites porites 0.1 (0.6) 0.003 (0.01) 0.04 (0.08) 0.03 (0.1)<br />
Siderastrea sp. 2.0 (4.0) 0.002 (0.009) 2.04 (1.1) 0.03 (0.1) 0.2 (0.5) 0<br />
Millepora sp. 0.7 (0.8) 0.7 (0.9) 1.94 (0.54) 1.3 (1.5) 0.9 (1.2) 2.23 (0.43)<br />
Total Coral 51.6 (13.7) 53.1 (11.4) 57.13 (3.81) 58.3 (6.7) 61.8 (10.0) 53.2 (3.01)<br />
* Montastraea annularis complex is comprised of M. annularis, faveolata, and franksi<br />
Figure 8.15. Benthic cover composition at the EFGB and WFGB from 2000-2003.<br />
Source: Dokken et al., 2003; Precht et al., in press.<br />
Random Photographic Transects—<br />
East Bank, Comparisons Among<br />
Years (1996-2001)<br />
ANOVA indicated that there were<br />
significant differences among years<br />
for five of the 13 coral species as well<br />
as total coral, total algae, and reef<br />
rock. Three overlapping, homogenous<br />
subsets of years were delineated<br />
for the M. annularis complex. The<br />
greatest difference was between the<br />
two years with highest cover, 2000<br />
and 2001 and the two years with<br />
lowest cover, 1996 and 1997. Total<br />
coral, with four overlapping subsets,<br />
exhibited a similar pattern due to<br />
the dominance of the M. annularis<br />
complex in the community. Cover of<br />
other coral species tended to overlap greatly with primary differences between the years of highest and lowest<br />
cover. Algal cover in 1999 was significantly higher than all other years and cover in 2000-2001 was significantly<br />
greater than 1996-1998. Reef rock was significantly higher than other years in both 1998 and 1999.<br />
Random Photographic Transects—West Bank Community Composition and Structure (1996-2001)<br />
Cover of the M. annularis complex and total coral increased slightly between 1996 and 2001. Total algal cover<br />
increased dramatically between 1997 and 2001. Although a minor component, cover of Millepora sp. was<br />
highest in 1997 and fell to less than 1% in each successive year. Also a minor component, Siderastrea sp.<br />
cover generally increased from 1996 to 2000, then dropped in 2001 to the lowest value recorded. Cover of<br />
the remaining coral species as well as sponges remained relatively stable throughout the monitoring period<br />
of 1996-2001. Cover of reef rock was highest in 1998 and 1999, declining by about 50% in each subsequent<br />
year.<br />
Flower Garden Banks<br />
Sidebar<br />
page<br />
213
Flower Garden Banks<br />
page<br />
214<br />
The State of Coral Reef Ecosystems of the Flower Garden Banks and Other Banks of the NW Gulf of Mexico<br />
Diversity was relatively stable between 1996 and 1999, increasing slightly in 2000, but then decreasing to a<br />
low in 2001. Evenness and dominance were fairly stable throughout the study period. Overall community<br />
similarity was 85%.<br />
Random Photographic Transects—West Bank, Comparisons Among Years (1996-2001)<br />
Only one coral, Madracis sp., a minor component of the coral community, exhibited significant differences<br />
among years. In 1999, Madracis spp. cover was significantly higher than all other years except 2000. There<br />
were also significant differences among years in algae cover and reef rock, with the delineated homogenous<br />
subsets representing the years of highest and lowest cover.<br />
There were significant positive correlations between total coral cover and cover of the M. annularis complex,<br />
D. strigosa, and M. cavernosa. Cover of reef rock was significantly negatively correlated with algal cover.<br />
Runs tests indicated no significant trends only random variation in deviations above or below median for any<br />
species or reef component.<br />
Permanent Growth Stations (2001-2002)<br />
A total of 22 analyses were completed for the EFGB, with 15 advances and three retreats recorded. The remaining<br />
four cases could not be evaluated. A total of 13 analyses were completed for the WFGB, with eight<br />
advances, three retreats, and two cases that could not be evaluated. Assuming a null hypothesis of equal<br />
probabilities of advances and retreats, the two-tailed, cumulative binomial probability of 15 or more advances<br />
out of 18 at EFGB is p=0.008, which is significant at α=0.05. The two-tailed, cumulative probability of eight or<br />
more advances out of 11 at WFGB is not significant at p=0.227. Combining the data from the two banks yields<br />
23 advances, six retreats, and six cases that could not be evaluated. The two-tailed, cumulative binomial<br />
probability of 23 or more advances out of 29 is p=0.002, which is significant.<br />
Permanent Growth Stations (2002-2003)<br />
A total of seven analyses were completed for EFGB, with four advances and three retreats. A total of five<br />
analyses were completed for WFGB, with one advance, three retreats, and one case that could not be evaluated.<br />
The sample sizes were too small to perform the binomial test on the banks separately. Combining the<br />
data from the two banks yields five advances and six retreats, and the two-tailed, cumulative binomial probability<br />
of six or more retreats out of 11 is p=1.000, which is not significant.<br />
There were significantly more advances than retreats at EFGB from 2001 to 2002, and this drove the overall<br />
significant result for 2001-2002. When considering both banks over both years of analysis, however, the<br />
results did not depart from the null expectation of equal numbers of advances and retreats. Although the<br />
samples for 2002-2003 were limited (a problem that the rehabilitation of stations has corrected for future<br />
years), we can conclude that the Diploria colonies may not have been growing, but they did not appear to be<br />
retreating either.<br />
Repetitive Quadrat Stations<br />
In general, the species composition and percent cover of the coral community in the 8 m 2 repetitive quadrats<br />
is similar to that found in the analysis of the random inside transects at EFGB. Overall, mean coral cover was<br />
about 7% lower than the inside random transects in 2000 and 10% in 2001; mean cover of the M. annularis<br />
complex was also 2-7% lower. D. strigosa mean cover was higher than the inside transects in both years.<br />
The mean cover of the remaining species was somewhat lower than that found in the inside transects, and<br />
four uncommon species, Agaricia agaricites, A. fragilis, Scolymia sp., and Siderastrea sp., were not found in<br />
the analysis of the 8 m 2 repetitive quadrats.<br />
Sclerochronology<br />
Four cores were taken from separate Montastraea faveolata colonies at the East Bank in August 2003.<br />
Estimated growth ranged from 0.77-1.07 cm from 1997-2003, with an overall mean of 0.92 cm ± 0.11 (Precht<br />
et al., in press). The highest mean growth rate occurred in 1999-2000 and the lowest occurred in 2002-2003<br />
(Figure 8.16). One core showed a partial mortality line in 1999; however, subsequent growth was established<br />
by surrounding polyps.
The State of Coral Reef Ecosystems of the Flower Garden Banks and Other Banks of the NW Gulf of Mexico<br />
Four cores were taken from M.<br />
faveolata heads at WFGB in August<br />
2003. Estimated growth ranged from<br />
0.63-0.85 cm ±0.07, with an overall<br />
mean rate of 0.76 cm ± 0.07 (Precht<br />
et al., in press). The highest mean<br />
growth rate occurred in 1999 and the<br />
lowest in 2002. Like the East Bank,<br />
one core showed partial mortality in<br />
1999, but subsequent recovery was<br />
seen by surrounding polyps.<br />
Atlantic and Gulf Rapid Reef Assessment<br />
Figure 8.16. Mean annual coral growth (cm) with standard errors for 1998-2003 from<br />
Montastraea faveolata cores (n=4) collected at EFGB and WFGB in August 2003.<br />
Source: Dokken et al., 2003; Precht et al., in press.<br />
Methods<br />
A team of seven scientists and three <strong>REEF</strong> experts conducted the AGRRA surveys (Pattengill et al., 2000)<br />
on EFGB and WFGB from August 15-20, 1999, at depths between 18-25 m. At the EFGB, 160 coral colonies<br />
were surveyed, 67 algae quadrats examined, 15 roving diver fish surveys conducted, and 12 fish<br />
belt-transects conducted. At the WFGB 135 coral colonies and 55 algae quadrats were examined, 11 roving<br />
diver fish surveys conducted, and 12 fish belt-transects performed.<br />
Results and Discussion<br />
The AGRRA surveys revealed very healthy reefs with high coral cover, dominated by impressive, healthy,<br />
and large corals, little macroalgae, and abundant fish populations. At the EFGB and WFGB, the average<br />
coral cover was 53.9% and 48.8%, respectively. The reefs were dominated by relatively large mounding<br />
corals primarily in the genera Montastraea, Diploria, and Colpophyllia. This was reflected in the average coral<br />
diameters from EFGB and WFGB, 81 and 93 cm, respectively. The percent of recent coral mortality was very<br />
low (
Flower Garden Banks<br />
page<br />
216<br />
The State of Coral Reef Ecosystems of the Flower Garden Banks and Other Banks of the NW Gulf of Mexico<br />
ASSOCIATED BIOLOGICAL COMMUNITIES<br />
East and West Flower Garden Banks, Long-Term Monitoring Project<br />
FISH<br />
Methods<br />
Fish counts were performed at both banks using stationary visual techniques for quantitatively assessing<br />
community structure of coral reef fishes (Bohnsack and Bannerot, 1986). A minimum of 24 surveys were<br />
performed at each bank to provide a statistically sound assessment of reef fish abundance and diversity.<br />
Survey sites were selected randomly from within the study location.<br />
Results and Discussion<br />
A mean of 51 fish species (SD=3.5) per year were observed at the EFGB and WFGB in 2002 and 2003. Fish<br />
abundances showed no significant differences between banks and years. The mean species richness per diver<br />
survey was shown to have a significant difference (p=0.0243) between the EFGB (16.72 species per diver<br />
survey) and the WFGB (18.55 species per diver survey). Only surveys at the WFGB proved to be significantly<br />
different (p=0.026) between years with 19.71 species per diver survey in 2003 and 15.72 species per diver<br />
survey in 2002. The observed species richness in 2002 at the EFGB and WFGB was 54 and 53 respectively,<br />
and 46 and 52, respectively in 2003.<br />
The Shannon-Wiener index of diversity (H’) is a common ecological measure of community structure that integrates<br />
the number and variety of species found in a given area or region. The diversity value (H’) consists<br />
of both a richness measure (no. of species) and an evenness measure (how individuals are distributed among<br />
species).<br />
Shannon-Wiener diversity indices are<br />
very similar at both banks in 2002 and<br />
2003 (Table 8.3). The highest value<br />
was for WFGB in 2003 (1.19) and<br />
lowest for EFGB in 2003 (0.90). Diversity<br />
indices for 2002 are 1.14 and<br />
1.16 for WFGB and EFGB, respectively.<br />
Index values for evenness (J’)<br />
Table 8.3. Shannon-Weiner diversity index (H’) and Evenness values (J’) for fish<br />
populations at EFGB and WFGB in 2002-2003. Source: Precht et al., in press.<br />
INDEX 2002 2003<br />
EFGB WFGB EFGB WFGB<br />
Diversity (H’) 1.16 1.14 0.90 1.19<br />
Evenness (J’) 0.67 0.66 0.54 0.69<br />
were calculated for the fish communities at both banks in 2002 and 2003 as well. As mean richness values<br />
were statistically lower on the EFGB than the WFGB, and evenness values (J’) were generally lower at EFGB<br />
than at WFGB, it follows that the overall diversity (H’) would exhibit a similar pattern.<br />
Expressed as density values (no. of fish/area), overall fish abundance for the EFGB and WFGB in 2002 was<br />
82.78 and 73.29 per 100 m 2 respectively, and in 2003 was 157.53 and 84.62, respectively. The increase in<br />
density at the EFGB in 2003 was primarily attributed to the increased abundance of two species: Clepticus<br />
parrae and Chromis multilineata. Divers recorded 63.66 C. parrae per 100 m 2 at EFGB in 2003, which represents<br />
a large increase in density from 2002, when the observed density of C. parrae was 14.59 per 100 m 2 .<br />
The observed density of C. multilineata also increased at EFGB from a value of 5.50 per 100 m 2 to 32.94 per<br />
100 m 2 . Thalassoma bifasciatum, C. parrae, and Paranthias furcifer were consistently among the top five<br />
most abundant fishes. C. cyanea, C. multilineata, Stegastes planifrons, and S. partitus were also among the<br />
most abundant fishes regularly encountered in diver surveys.<br />
A mean of 21 families (SD=0.82) were recorded. Labridae, Pomacentridae, and Serranidae were consistently<br />
the three most abundant fish families observed at the Flower Garden Banks with densities ranging from 6.92<br />
Serranids per 100 m 2 at the EFGB in 2002 to 70.74 Labrids per 100 m 2 at the EFGB in 2003. Pomacentrids,<br />
Serranids, and Labrids are also the three best represented families with 12, 10, and 6 species having been<br />
recorded for each, respectively.
The State of Coral Reef Ecosystems of the Flower Garden Banks and Other Banks of the NW Gulf of Mexico<br />
SEA URCHIN AND LOBSTER SURVEYS<br />
Methods<br />
Long spined urchin (Diadema antillarum) surveys were conducted to establish current population levels as a<br />
basis for comparison with future observations (Table 8.4). Surveys were conducted approximately 1.5 hours<br />
after sunset using site boundaries as transect lines. Two transects, each 100 m long and 2 m wide were<br />
surveyed using the same site boundary transect lines as those used for the video transects at each study<br />
site. Spiny lobster (Panulirus argus) and spotted lobster (P. guttatus) surveys were conducted in a similar<br />
manner.<br />
Results and Discussion<br />
For urchin and lobster counts, only descriptive data exist due to the low numbers observed. The D. antillarum<br />
populations continue to be depressed. No lobster data were presented by Dokken et al. (2003), and no lobster<br />
were reported during the surveys in 2002-2003 along the prescribed survey lines (Precht et al., in press).<br />
Table 8.4. Average number of Diadema antillarium per m 2 on the EFGB and WFGB from 1996-2001. Source: Dokken et al., 2003.<br />
YEAR EFGB WFGB<br />
1996 No counts made due to sea conditions 0.0033 m 2<br />
1997 No counts made due to sea conditions 0.0038 m 2<br />
1998 0.023 m 2 No counts made due to sea conditions<br />
1999 No counts made due to sea conditions No counts made due to sea conditions<br />
2000 0.018 m 2 0.030 m 2<br />
2001 0.005 m 2 0.050 m 2<br />
Atlantic and Gulf Rapid Reef Assessment (AGRRA)<br />
Methods<br />
A team of seven scientists and three <strong>REEF</strong> experts conducted the AGRRA surveys on EFGB and WFGB<br />
from August 15-20, 1999. Details of the methods used are contained in Pattengill et al. (2000). The reef<br />
surveys were conducted at depths between 18-25 m. At the EFGB, 160 coral colonies were surveyed, 67<br />
algae quadrats examined, 15 roving diver fish surveys conducted, and 12 fish belt-transects conducted. At<br />
the WFGB, 135 coral colonies and 55 algae quadrats were examined, 11 roving diver fish surveys conducted,<br />
and 12 fish belt-transects performed.<br />
Results and Discussion<br />
A total of 126 fish species were seen at EFGB and WFGB. One new record for the banks was recorded:<br />
sharptail eel (Myrichthys breviceps). The eel was seen at the WFGB, and had also been recorded on video<br />
earlier in the summer of 1999. Preliminary analyses of fish transect data showed high similarity between the<br />
EFGB and WFGB locations. Differences were seen in the butterflyfish and seabasses. The density of the reef<br />
butterflyfish (Chaetodon sedentarius) was two and a half times greater at the WFGB. Similarly, the density of<br />
graysby (Epinephelus cruentatus) at the WFGB was approximately twice that found at EFGB. Grunts were<br />
absent at both banks, a distinguishing characteristic of the Flower Garden Bank’s fish assemblages. Average<br />
size of parrotfish and seabass was relatively high, reflecting the low fishing pressure.<br />
Overall Condition and Summary of Analytical Results<br />
The overall health of the reefs of the EFGB and WFGB continues to be described as stable, supporting<br />
approximately 50% coral cover comprised of primarily robust and massive species. Initial estimates of coral<br />
cover at the deep stations of the EFGB indicate upwards of 69% coral cover (W. Precht, pers. comm.).<br />
Montastraea spp. dominates the community, with D. strigosa also providing substantial cover. The stability<br />
of the system is evidenced by the continued high coral cover. Very little coral disease has been documented<br />
at the site. The FGBNMS appears to be insulated from mortality resulting from bleaching events. Bleaching<br />
Flower Garden Banks<br />
Sidebar<br />
page<br />
217
Flower Garden Banks<br />
page<br />
218<br />
The State of Coral Reef Ecosystems of the Flower Garden Banks and Other Banks of the NW Gulf of Mexico<br />
occurs, but minimally, and usually is followed by 100% recovery. Algae appear to play a balanced role in<br />
the reef habitat, and do not appear threatening to the coral component. Water conditions continue to be<br />
consistently good.<br />
CURRENT CONSERVATION MANAGEMENT ACTIVITIES<br />
Regulations governing the FGBNMS are authorized under the National <strong>Marine</strong> Sanctuaries Act, as amended,<br />
16 U.S.C. 1431, and are contained within the Code of Federal Regulations 15 C.F.R. 922, Subparts A, E, and<br />
L, available on the Internet at http://www.sanctuaries.nos.noaa.gov/oms/omsflower/omsflowerpubdoc.html.<br />
They are designed to protect the sensitive coral reef features of the Sanctuary. They prohibit anchoring of any<br />
vessel within the Sanctuary; mooring of any vessel greater than 100 feet on a Sanctuary mooring buoy; oil and<br />
gas exploration and development within a designated no activity zone (almost the entire Sanctuary); injuring or<br />
taking coral and other marine organisms; using fishing gear other than traditional hook and line; discharging or<br />
depositing any substances or materials; altering the seabed; building or abandoning any structures; and using<br />
explosives or electrical charges.<br />
In 2001, the International Maritime Organization designated the FGBNMS as the world’s first international noanchor<br />
zone. This designation enhances the protection and awareness of the site by providing guidance and<br />
regulations at an international level.<br />
Over the past five years, the Sanctuary research team has conducted dedicated ROV cruises exploring the<br />
portions of the Sanctuary below the depths of the coral reef cap. Over 35 species of antipatharians and<br />
gorgonians, as well as several species of azooxanthelate corals have been found in deeper waters. There is<br />
some indication that the coral reef areas and deepwater habitat may be important spawning areas for several<br />
species of grouper.
The State of Coral Reef Ecosystems of the Flower Garden Banks and Other Banks of the NW Gulf of Mexico<br />
OVERALL CONCLUSIONS AND RECOMMENDATIONS<br />
The coral reef ecosystem at the Flower Garden Banks is thriving, despite its location in the middle of one of the<br />
largest oil and gas fields in the world. Each year, Sanctuary staff review dozens of new requests for pipeline<br />
or platform installation within the MMS four-mile regulatory zone. One unresolved concern associated with oil<br />
and gas activities is the large quantities of contaminated water, or ‘produced water,’ that is generated during<br />
offshore oil platform operations. The effects of produced water on coral reef ecosystems are unknown and<br />
represent a significant knowledge gap that needs to be addressed in response to the expansion of oil and gas<br />
activities in the region.<br />
Other substantial knowledge gaps exist, in part due to the difficulty of accessing this relatively remote location.<br />
While distance from shore may lessen some of the impacts attributed to recreational use, it also hampers<br />
monitoring of human activities, research with respect to recreational use of the area by divers and fishers, and<br />
enforcement of Sanctuary regulations. While some data on visitor use can be attained by a variety of remote<br />
methods such as overflights, satellite imagery, and remote radar systems, the Sanctuary needs to increase<br />
on-site observation, management, and enforcement.<br />
The location of the Flower Garden Banks also makes the logistics involved in monitoring activities difficult<br />
and expensive, which limits the frequency of sampling and the total area able to be surveyed during data<br />
collection. Under the current methods, sampling points are limited to a 100 m 2 area in the shallowest part of<br />
the coral caps, which represents a fraction of the total area of the banks. Limitations in sampling frequency<br />
and spatial distribution of survey sites restrict scientists’ analytical power to measure change with a sufficient<br />
level of confidence, especially when trying to account for adjacent reefs or banks. Addition of monitoring data<br />
from banks and reef areas in other parts of the Gulf of Mexico would help scientists understand the role of<br />
these banks in relation to coral reef ecosystems in the wider Gulf region.<br />
Despite these limitations, the LTM Project results indicate that the EFGB and WFGB reefs are relatively<br />
pristine as compared to other Caribbean reef systems. Budget constraints have precluded the analysis of<br />
Stetson Bank monitoring data to date, but analysis of existing data is a priority for increasing management<br />
capability. Anecdotal and photographic observations made at Stetson Bank are noted (e.g., a recent algal<br />
bloom), but cannot be acted upon without quantitative evidence.<br />
The observations indicating that FGBNMS is an important spawning area for several species of grouper<br />
warrants further investigation, and highlights the importance of considering a no-take marine reserve to protect<br />
the biodiversity of this region. While it is clear that the reefs of the FGBNMS are biologically and ecologically<br />
connected with the numerous reefs and banks found in the northwestern Gulf of Mexico, a newly described<br />
endemic wrasse (Weaver and Hickerson, in press) documented at all three banks of the FGBNMS illustrates<br />
the uniqueness on a local scale.<br />
The FGBNMS harbors a close to pristine coral reef ecosystem. It is crucial that the status of this resource<br />
be maintained in its current condition. In a world of declining coral reef health, this site can be used as a<br />
standard for comparison to all other Caribbean coral reef systems, and may function as a source of recruits<br />
for neighboring regions.<br />
It should be recognized that several reefs and banks that exist in the vicinity of the FGBNMS also harbor deep<br />
coral reef communities. These banks include Bright, Geyer, Sonnier, and McGrail Banks. No regulations<br />
currently protect these resources other than from the direct impacts from oil and gas activities.<br />
Flower Garden Banks<br />
Sidebar<br />
page<br />
219
Flower Garden Banks<br />
page<br />
220<br />
The State of Coral Reef Ecosystems of the Flower Garden Banks and Other Banks of the NW Gulf of Mexico<br />
REFERENCES<br />
Bohnsack, J. and S.P. Bannerot. 1986. A stationary visual census technique for quantitatively assessing community structure<br />
of coral reef fishes. NOAA Technical Report NMFS 41. 15 pp.<br />
Dennis, G.D. and T.J. Bright. 1988. Reef fish assemblages on hard banks in the northwestern Gulf of Mexico. Bulletin of<br />
<strong>Marine</strong> Science 43 (2): 280-307.<br />
Deslarzes, K.J.P. (ed.) 1998. The Flower Garden Banks (Northwest Gulf of Mexico): Environmental Characteristics and<br />
Human Interaction. OCS Report MMS 98-0010. U.S. Dept. of the Interior, Minerals Management Service, Gulf of Mexico<br />
OCS Region, New Orleans. 100 pp.<br />
Deslarzes, K.J.P., and A. Lugo-Fernández. In press. Influence of terrigenous runoff on offshore coral reefs: An example<br />
from the Flower Garden Banks, Gulf of Mexico. In R.B. Aronson (ed.) Geological approaches to coral reef ecology.<br />
Springer-Verlag, New York.<br />
Ditton, R.B. and C.E. Thailing 2001. The Economic Impacts of Sport Divers Using the Flower Garden Banks National<br />
<strong>Marine</strong> Sanctuary. Department of Wildlife and Fisheries Sciences, Texas A and M University, College Station, TX. 11 pp.<br />
Available from the internet url: http://lutra.tamu.edu/hdlab/downloads.htm.<br />
Dokken, Q.R., I.R. McDonald, J.W. Tunnell, Jr., C.R. Beaver, G.S. Boland and D.K. Hagman. 1999. Long-Term Monitoring<br />
at the East and West Flower Garden Banks, 1996-1997. U.S. Department of the Interior, Minerals Management<br />
Service, Gulf of Mexico OCS Region. OCS Study MMS 99-0005. 101 pp.<br />
Dokken, Q.R., I.R. MacDonald, J.W. Tunnell, Jr., T. Wade, K. Withers, S.J. Dilworth, T.W. Bates, C.R. Beaver and<br />
C.M.Rigaud. 2003. Long-Term Monitoring at the East and West Flower Garden Banks, 1998-2001: Final Report. U.S.<br />
Dept. of the Interior, Minerals Management Service, Gulf of Mexico OCS Region, New Orleans. OCS Study MMS 2003-<br />
031. 90 pp.<br />
Dunton, K. University of Texas <strong>Marine</strong> Science Institute, Port Aransas, TX. Personal communication.<br />
Fenner, D. 2001. Biogeography of Three Caribbean Corals (Scleractinia) and the invasion of Tubastraea coccinea into<br />
the Gulf of Mexico. Bulletin of <strong>Marine</strong> Science 69 (3): 1175-1189.<br />
Fenner, D. and K. Banks. 2004. Orange Cup Coral Tubastraea coccinea invades Florida and the Flower Garden Banks,<br />
Northwestern Gulf of Mexico. Coral Reefs 23: 505-507.<br />
Gardner, J.V., L.A. Mayer, J.E. Hughes Clarke and A. Kleiner. 1998. High-Resolution Multibeam Bathymetry of East and<br />
West Flower Gardens and Stetson Banks, Gulf of Mexico. Gulf of Mexico Science XVI 2: 128.<br />
Gittings, S.R. 1998. Reef Community Stability on the Flower Garden Banks, Northwest Gulf of Mexico. Gulf of Mexico<br />
Science XVI 2: 161.<br />
Gittings, S.R., K.J.P. Deslarzes, D.K. Hagman, and G.S. Boland. 1992. Reef coral populations and growth on the Flower<br />
Garden Banks, northwest Gulf of Mexico. pp. 1: 90-96. In: Proceedings of the 7th International Coral Reef Symposium.<br />
Gittings, S.R., T.J. Bright and D.K. Hagman. 1993. Protection and monitoring of reefs on the Flower Garden Banks, 1972-<br />
1992. pp. 181-187. In: R.N. Ginsburg (ed.) Proceedings of the Colloquium on Global Aspects of Coral Reefs: Healths,<br />
Hazards and History. University of Miami.<br />
Hagman, D.K. and S.R. Gittings. 1992. Coral bleaching on high latitude reefs at the Flower Garden Banks, NW Gulf of<br />
Mexico. pp. 1: 38-43. In: Proceedings of the 7th International Coral Reef Symposium.<br />
Pattengill, C.V. 1998. The Structure and Persistence of Reef Fish Assemblages of the Flower Garden Banks National<br />
<strong>Marine</strong> Sanctuary. Ph.D. dissertation for Texas A and M University. 164 pp.<br />
Pattengill, C.V., S.R. Gittings, and T. Shyka. 2000. Flower Garden Banks National <strong>Marine</strong> Sanctuary – A Rapid Assessment<br />
of Coral, Fish, and Algae Using the AGRRA Method. <strong>Marine</strong> Sanctuaries Conservation Series. Available from the<br />
internet url: http://www.sanctuaries.nos.noaa.gov/library/national/conseriesAGRRA.<strong>pdf</strong>.<br />
Pattengill-Semmens, C.V. and S. R. Gittings. 2003. A Rapid Assessment of the Flower Garden Banks National <strong>Marine</strong><br />
Sanctuary (Stony Corals, Algae and Fishes). pp. 500-511. In: E. Judith C. Lang (ed.) Status of Coral Reefs in the Western<br />
Atlantic: Results of Initial Surveys, Atlantic and Gulf Rapid Reef Assessment (AGRRA) Program.<br />
Precht, W. PBSandJ, Miami, FL. Personal communication.
The State of Coral Reef Ecosystems of the Flower Garden Banks and Other Banks of the NW Gulf of Mexico<br />
Precht, W., R. Aronson and K.J.P. Deslarzes. In press. Long-Term Monitoring at the East and West Flower Garden Banks,<br />
2002-2003: Final Report. Office of Coast Survey (OCS) Study, Minerals Mangement Service (MMS). U.S. Dept. of the<br />
Interior, MMS, Gulf of Mexico OCS Region, New Orleans.<br />
Rezak, R., T.J. Bright and D.W. McGrail. 1985. Reefs and Banks of the Northwestern Gulf of Mexico: Their Geological,<br />
Biological, and Physical Dynamics. John Wiley and Sons, New York. 259 pp.<br />
Schmahl, G.P. and E.L. Hickerson. In press. Deep tropical coral reef communities in the northwestern Gulf of Mexico. In:<br />
Proceedings of the 10th International Coral Reef Symposium.<br />
Sinclair, J. Department of the Interior, Minerals Management Service, New Orleans, LA. Personal communication.<br />
U.S. Dept. of Interior (USDOI). 1996. Long-term monitoring at the East and West Flower Garden Banks. OCS Study MMS<br />
96-0046. USDOI, Minerals Management Service, Gulf of Mexico OCS Region, New Orleans. 77 pp.<br />
Weaver, D.C. and E.L. Hickerson. In Press. Halichoeres bureki, A New Wrasse (Pisces: Labridae) from the Flower Garden<br />
Banks National <strong>Marine</strong> Sanctuary, Northwestern Gulf of Mexico, and a Review of Related Species in the Tropical<br />
Eastern Pacific and Western Atlantic Oceans. Gulf of Mexico Science.<br />
Weaver, D.C., E.L. Hickerson and G.P.Schmahl. In press. Deep reef fish surveys by submersible on Alderdice, McGrail,<br />
and Sonnier Banks in the Northwestern Gulf of Mexico. In: J.C. Tayler (ed.) Emerging Technologies for Reef Fisheries<br />
Management. National Oceanic and Atmospheric Administration Professional Papers National <strong>Marine</strong> Fisheries Service.<br />
Flower Garden Banks<br />
Sidebar<br />
page<br />
221
Main Hawaiian Islands<br />
page<br />
222<br />
The State of Coral Reef Ecosystems of the Main Hawaiian Islands<br />
Alan Friedlander 1,2 , Greta Aeby 3 , Eric Brown 3,4 , Athline Clark 3 , Steve Coles 5 , Steve Dollar 6 , Cindy Hunter 6 , Paul Jokiel 6 ,<br />
Jennifer Smith 6 , Bill Walsh 3 , Ivor Williams 3,7 , Wendy Wiltse 8 .<br />
Additional Contributions<br />
Leon Hallacher 6 , Carey Morishige 3,9 , Christine Woolaway 10 , Thierry Work 11 , Francis Oishi 3 , Brian Tissot 12<br />
INTRODUCTION AND SETTING<br />
Hawaii is one of the most isolated archipelagos in the world and as a result, possesses some of the highest<br />
marine endemism recorded anywhere on earth. Because they are located in the middle of the Pacific Ocean,<br />
Hawaii’s coral reefs are exposed to large open ocean swells and strong tradewinds that have a major impact<br />
on the structure of these coral reef communities. The archipelago consists of two regions: the Main Hawaiian<br />
Islands (MHI) which consists of populated, high volcanic islands with non-structural reef communities and<br />
fringing reefs abutting the shore (Figure 9.1), and the Northwestern Hawaiian Islands (NWHI) consisting of<br />
mostly uninhabited atolls and banks which are the subject of a separate chapter. This island chain stretches<br />
for over 2,500 km from the island of Hawaii in the southeast to Kure Atoll (the world’s highest atoll latitudinally)<br />
in the northwest.<br />
Coral reefs were important to the ancient Hawaiians for subsistence, culture, and survival. According to the<br />
Hawaiian Creation Chant, the kumulipo, the coral polyp was the first creature to emerge from the sea during<br />
creation. The early Hawaiians recognized that coral reefs were a building block of the islands and used<br />
coral in religious ceremonies to honor and care for ocean resources. Today, Hawaii’s coral reef communities<br />
provide protection from storm waves, create the large surf that makes Hawaii world famous, provide food for<br />
sustenance, and are critically important to the State’s approximately $800 million per year marine tourism<br />
industry.<br />
Over 70% of the state’s 1.2 million people live on Oahu, and are mostly concentrated in the Honolulu metropolitan<br />
area. In addition to the resident population, nearly seven million tourists visit Hawaii each year. This<br />
concentrated number of people has put pressure on Hawaii’s coral reefs through various direct and indirect<br />
means. In general, Hawaii’s coral reefs are in better condition than many other reefs around the world, although<br />
urban areas and embayments have suffered from land-based sources of pollution, overfishing, recreational<br />
overuse, and alien and invasive species.<br />
1 NOAA/ NOS/ NCCOS/ Center for Coastal Monitoring and Assessment, Biogeography Program.<br />
2 Oceanic Institute<br />
3 Hawaii Department of Land and Natural Resources, Division of Aquatic Resources<br />
4 National Park Service<br />
5 Bishop Museum<br />
6 University of Hawaii<br />
7 Hawaii Coral Reef Initiative<br />
8 Environmental Protection Agency<br />
9 NOAA/NOS/ Hawaiian Islands Humpback Whale National <strong>Marine</strong> Sanctuary<br />
10 Hawaii Sea Grant Program<br />
11 U.S. Geological Survey<br />
12 Washington State University
Figure 9.1. Maps of the MHI showing locations mentioned in this chapter. Map: A. Shapiro.<br />
The State of Coral Reef Ecosystems of the Main Hawaiian Islands<br />
Sidebar<br />
Main Hawaiian Islands<br />
page<br />
223
Main Hawaiian Islands<br />
page<br />
224<br />
The State of Coral Reef Ecosystems of the Main Hawaiian Islands<br />
ENVIRONMENTAL AND ANTHROPOGENIC STRESSORS<br />
Climate Change and Coral Bleaching<br />
Hawaiian waters show a trend of increasing<br />
temperature over the past<br />
several decades (Figure 9.2) that is<br />
consistent with observations in other<br />
coral reef areas of the world (Coles<br />
and Brown, 2003). The first documented<br />
multi-locational coral bleaching<br />
occurred in Hawaii in late summer<br />
of 1996, with a second event in 2002<br />
(Jokiel and Brown, 2004). Although<br />
bleaching events may have occurred<br />
prior to 1996, there is no quantitative<br />
or qualitative record of previous episodes.<br />
These documented bleaching<br />
events in Hawaii were triggered<br />
by a prolonged regional positive oceanic<br />
sea surface temperature anomaly<br />
greater than 1°C that developed<br />
offshore during the time of the annual<br />
summer temperature maximum.<br />
High solar energy input and low<br />
winds further elevated inshore water<br />
temperatures by 1-2°C in reef areas<br />
with restricted water circulation (e.g.,<br />
Kaneohe Bay, Oahu) and in areas<br />
where mesoscale eddies retain water<br />
masses close to shore for prolonged<br />
periods of time (Figure 9.3).<br />
Bleaching was recorded throughout<br />
the State of Hawaii in 1996, with<br />
the most severe impact observed on<br />
Oahu and lesser bleaching reported<br />
on Maui and Hawaii. On Maui, weekly<br />
temperatures on reefs at eight locations<br />
on the southwest coastline<br />
showed a range of 28.0-28.5°C in<br />
late August and early September,<br />
with peak temperatures approaching<br />
29°C. Corals began to bleach<br />
at Olowalu, Maui in late August, but<br />
the extent and severity of bleaching<br />
was minor, with less than 10% of the<br />
corals being affected. Recovery occurred<br />
after several months.<br />
The second major bleaching event in<br />
the NWHI transpired during the summer<br />
of 2002 (Aeby et al., 2003). A<br />
detailed description of this event is<br />
provided in the chapter on the NWHI’s<br />
coral reef ecosystems.<br />
Figure 9.2. Weekly averaged points for NOAA Fisheries temperature series taken<br />
at Koko Head, Oahu (21°17’N, 157°41’W) and weekly IGOSS-NMC data series that<br />
overlapped temporarily. Data sets were merged. Source: Jokiel and Brown, 2004.<br />
Figure 9.3. Map of Kaneohe Bay, Oahu. Shaded area shows reef areas with a high<br />
proportion of bleached corals (>20%) on 31 August 1996. Pie charts show relative<br />
portions of bleached, pale and normal coral coverage on transects located throughout<br />
Kaneohe Bay at that time. Source: Jokiel and Brown, 2004.
The State of Coral Reef Ecosystems of the Main Hawaiian Islands<br />
Diseases<br />
Coral populations in the Hawaiian Archipelago continue to be spared from epidemic disease outbreaks unlike<br />
many other corals reefs around the world. Baseline surveys for coral disease were recently conducted<br />
at 18 sites around Oahu. The average prevalence of disease (no. diseased colonies/total no. colonies) was<br />
estimated at 0.95% (range 0-4.4%). Differences in disease prevalence were found among coral genera, with<br />
Porites having the highest prevalence of disease. The most common condition found on Porites was growth<br />
anomalies or ‘tumors’ (Figure 9.4). Prior studies found growth anomalies on Porites from both Oahu and<br />
Hawaii Island (Hunter, 1999; Work and Rameyer, 2001). Similar growth anomalies have not yet been documented<br />
on Porites in the NWHI despite intensive coral disease surveys (Aeby, unpublished data). The cause<br />
of Porites tumors has not yet been elucidated, but the occurrence of tumors on Porites lobata is positively<br />
correlated with colony size (a broadly generalized proxy for colony age; Hunter, 1999).<br />
Another common disease found in both the MHI and NWHI is Porites trematodiasis caused by the larval stage<br />
of the digenetic trematode, Podocotyloides stenometra (Aeby, 1998; Figure 9.4). The greatest abundance of<br />
infected coral has been found on the reefs in Kaneohe Bay on the windward side of Oahu (Aeby, 2003). In<br />
Kaneohe Bay, infected corals have been found in all reef zones from the reef flat to the bottom of the reef slope<br />
and have persisted on the reefs since the 1970s (Cheng and Wong, 1974; Aeby, 2003). Trematode infection<br />
can cause reductions in coral growth of up to 50% (Aeby, 1992).<br />
General coral necroses also commonly occur on Hawaiian reefs. Hunter (1999) found that necrotic patches<br />
followed one of three outcomes: 1) complete recovery, 2) successional change from turf to crustose coralline<br />
algae on which new coral recruits become established, or 3) persistence of the turf community with a net loss<br />
of coral cover.<br />
No major die-off of corals has ever been documented due to disease in Hawaii. However, increasing human<br />
usage and the impacts of global climate change are causing concern about the health of Hawaiian reefs.<br />
Plans are currently underway to extend baseline disease surveys out to the MHI. The Hawaii Department of<br />
Land and Natural Resources - Division of Aquatic Resources (DAR) will also be integrating coral disease assessment<br />
into its monitoring program.<br />
The endangered Hawaiian green sea turtle is affected by fibropapillomatosis (FP), a disease that causes external<br />
and internal tumors in turtles. Turtles with FP also have significant additional complications including<br />
inflammation with vascular flukes, bacterial infections, poor body condition, and necrosis of salt gland (Work<br />
et al., in press). Recent evidence suggests the herpes virus as a probable cause or co-factor of FP (Herbst,<br />
1995). In Hawaii, FP has been found in 40-60% of observed turtles, with juvenile turtles constituting most of<br />
the cases (Balazs and Pooley, 1991). A recent study found that the majority of stranded turtles were juvenile<br />
turtles affected by FP and suggested that FP may detrimentally affect survival in juveniles (Work et al., in press).<br />
Figure 9.4. Left panel shows Porites lobata with tumor. Right panel shows Porites compressa with Trematodiasis. Swollen, pink<br />
nodules on the coral colony indicate polyps infected with the trematode. Photos: G. Aeby.<br />
Sidebar<br />
Main Hawaiian Islands<br />
page<br />
225
Main Hawaiian Islands<br />
page<br />
226<br />
The State of Coral Reef Ecosystems of the Main Hawaiian Islands<br />
As such, FP may pose a significant<br />
threat to the long-term survival of the<br />
species (Quackenbush et al., 2001).<br />
Tropical Storms<br />
By virtue of its isolation, the structure<br />
of Hawaiian reefs is molded by a<br />
unique set of biogeographical factors<br />
and physiological tolerances which<br />
limit community assemblages to a<br />
relatively few hearty species. Another<br />
unique aspect of the geographical<br />
location of Hawaii is direct exposure<br />
to long-period swells emanating from<br />
winter storms in both the northern<br />
and southern hemispheres (Figure<br />
9.5). Breaking waves from surf generated<br />
by Pacific storms is the single<br />
most important factor in determining<br />
the community structure and compo-<br />
sition of exposed reef communities<br />
Figure 9.5. Large winter swells, such as this in Peahi, Maui, impact the structure of<br />
coral reef communities in Hawaii. Photo: E. Brown.<br />
throughout the MHI (Dollar, 1982; Dollar and Tribble, 1993; Dollar and Grigg, 2004; Jokiel et al., 2004). The<br />
exception to this general rule is sheltered embayments that make up less than 5% of the coastal areas of the<br />
MHI.<br />
Hawaiian coral community structure has been shown to respond to storm wave stresses of varying frequency<br />
and intensity as described by the ‘intermediate disturbance hypothesis’ (Grigg, 1983). Moderate cover and<br />
peak diversity is attained as the result of a continual cycle of intermediate intensity disturbances. High coral<br />
cover with low species diversity is found in sheltered embayments and areas protected from direct swells (e.g.<br />
south Molokai).<br />
Based on the structure of coral communities on dated lava flows on the island of Hawaii, it has been projected<br />
that it takes about 50 years for Hawaiian reefs to regain peak diversity following a catastrophic event (Grigg<br />
and Maragos, 1974). A 30-year study documenting the impacts of storm waves of varying intensity on the<br />
west coast of the island of Hawaii has shown that shallow zones, populated primarily by a pioneering species<br />
of cauliflower coral, recovered completely within 20 years to pre-storm conditions, while deep reef slope zones<br />
showed only the initial stages of recovery during the same period. In addition, the study showed that recovery<br />
might not always result in immediate replacement of the same dominant species in a particular zone (Dollar,<br />
1982; Dollar and Tribble, 1993; Dollar, 2004).<br />
The cycle of repetitive impact and recovery is also a major factor in the present-day lack of reef accretion in<br />
exposed areas throughout the Hawaiian Islands. Extensive pre-Holocene (last major glacial epoch, approximately<br />
11,000 years ago) reefs have been noted throughout the Hawaiian chain. This may be due to greater<br />
storm wave intensity now relative to earlier periods (Rooney et al., 2004), or an increased resistance of pre-<br />
Holocene Hawaiian coral communities to such storms, possibly through species components more adapted<br />
to rapid recovery (Dollar and Tribble, 1993). As a result, the only reef accretion that is presently taking place<br />
in Hawaii occurs in sheltered embayments or inside barrier reefs that are protected from storm wave impact.<br />
A good understanding of the response of reef systems to natural stresses is an important aspect in evaluating<br />
the effects of human activities because responses of reef ecosystems to human-induced stress are superimposed<br />
on natural cycles of impact and recovery.<br />
The few studies in Hawaii to date that examined the effects of storms on fishes show that surf height and<br />
degree of wave exposure have negative relationships with various measures of fish assemblage organiza-
tion (Friedlander and Parrish, 1998a;<br />
Friedlander et al., 2003). This relationship<br />
suggests that habitats protected<br />
from the highest wave energies<br />
maintain larger fish populations<br />
with greater richness and diversity<br />
of species. Walsh (1983) found that<br />
the impacts on the fish assemblage<br />
following a large “kona” storm were<br />
ameliorated by the presence of deeper<br />
water refuges.<br />
Large storms and typhoons can also<br />
affect local fisheries by damaging essential<br />
fish habitat (Figure 9.6). In recent<br />
decades, two major hurricanes<br />
(Hurricane Iwa, 1982; Hurricane Iniki,<br />
1992) struck the islands and caused<br />
considerable coral and habitat damage<br />
on Oahu and Kauai (W. Aila, pers.<br />
comm.). Hurricane Iwa damaged extensive<br />
inshore reef areas, especially<br />
the prime aquarium fishing grounds<br />
along Oahu’s western and southern<br />
coast (DLNR-DAR, undated; Pfeffer<br />
and Tribble, 1985). Hurrincane Iniki<br />
also impacted coral reef communities<br />
on Oahu (Brock, 1996; Coles and<br />
Brown, in prep.), but limited evidence<br />
suggests the effects may have been<br />
less than with Iwa (Miyasaka, 1994a,<br />
b).<br />
Fish catch and value declined around<br />
Oahu after the hurricanes but rebounded<br />
somewhat in the following<br />
years (Walsh et al., 2004; Figure 9.7).<br />
With the loss of collecting habitat, collectors<br />
concentrated their efforts on<br />
those sites still relatively intact and<br />
economically viable. The net result<br />
of storm effects, when combined with<br />
overfishing, was a drastic long-term<br />
decline in the abundance of key targeted<br />
species such as yellow tangs<br />
(Zebrasoma flavescens) around<br />
Oahu (Figure 9.7).<br />
The State of Coral Reef Ecosystems of the Main Hawaiian Islands<br />
Figure 9.6. A map showing the paths and intensities of tropical storms passing near<br />
the MHI from 1979-2004. Year of storm, storm name and storm strength on the Saffir-Simpson<br />
scale (H1-5) are indicated for each. Map: A. Shapiro. Source: NOAA<br />
Coastal Services Center.<br />
Figure 9.7. Value (adjusted for inflation) of all aquarium fish caught on Oahu and<br />
number of yellow tangs caught in primary collecting areas of south and west Oahu.<br />
Dashed lines indicate year of major storms. Source: Walsh et al., 2004.<br />
Coastal Development and Runoff<br />
Coastlines of Hawaii continue to be developed for a variety of land uses. On all of the islands, agricultural<br />
lands (primarily for sugarcane and pineapple) are changing to residential and resort uses. Coastal development<br />
can bring a suite of social and environmental consequences including conflicts over shoreline access<br />
and viewplanes, the need for flood water storage and protection, infrastructure demands, and degradation<br />
Sidebar<br />
Main Hawaiian Islands<br />
page<br />
227
Main Hawaiian Islands<br />
page<br />
228<br />
The State of Coral Reef Ecosystems of the Main Hawaiian Islands<br />
of coastal waters from cumulative increases<br />
in runoff and groundwater<br />
contamination. Changes in land use<br />
from large-scale agriculture, which<br />
periodically exposes land to erosion,<br />
may result in an overall decrease in<br />
sediment delivery to the ocean.<br />
Many of Hawaii’s low-lying coastal<br />
areas were once wetlands and flood<br />
plains before being altered for agriculture<br />
and development. These<br />
areas served as excellent filters, removing<br />
sediments and nutrients from<br />
streams before the water entered<br />
the ocean. Development inevitably<br />
increases the amount of impervious<br />
surface and runoff. Runoff is generally<br />
diverted to storm drain systems<br />
that, like underground rivers,<br />
transport trash, soil, pathogens, and<br />
Figure 9.8. This steep roadcut at a construction site on Kauai is vulnerable to erosion<br />
and movement of sediments to the beach and nearby coral reef ecosystems.<br />
Practices to stabilize the slope include terracing, erosion control matting, hydromulch,<br />
and wattles. Photo: W. Wiltse.<br />
chemical pollutants to Hawaii’s streams and coastal waters (Figure 9.8). As coastal areas are developed,<br />
floodplains filled, storm drains constructed, and streams channelized, more sediment is delivered to nearshore<br />
waters. For example, Kulanihakoi Stream (Kihei, Maui) was recently channelized near the shoreline as part<br />
of a condominium development, removing a coastal wetland that flooded regularly. The new stream channel<br />
solved the flooding problem but increased turbidity in coastal waters has resulted.<br />
Harbor facilities on all the MHI are being improved to accommodate new large cruise ships, an inter-island car/<br />
cargo ferry, and large container ships. Harbor improvements involve dredging to deepen and widen entrance<br />
channels and turning basins, as well as construction of new piers, waterfront work areas, jetties, and breakwalls.<br />
The harbor improvements have the potential to impact coral reefs and areas used for recreation, such<br />
as surfing and canoeing. Proposed expansions can affect longshore transport and water quality as well. In<br />
Kahalui Harbor on Maui, the proposed development and expansion of pier space to accommodate cruise ships<br />
may result in displacement of several canoe teams from the harbor, due in part to the added security zones<br />
that would also be designated with the expansion and the resulting lack of protected water area for paddling.<br />
At Maalaea Harbor on Maui, a $10 million expansion of berthing facilities and reconfiguration of the entrance<br />
channel has been planned for 40 years. The preferred design is controversial because it will eliminate 4 acres<br />
of coral reef and impact a surf site, while providing over 100 new berths for recreational and commercial boats.<br />
No new construction or approval of permits has been considered to date with this proposed project due to the<br />
fact that the impacts to the coral reefs and offshore surf site have yet to be adequately addressed.<br />
Coastal Pollution<br />
Point Sources:<br />
In areas near offshore sewage outfalls, long-term studies show little or no effect of water chemistry on coral<br />
communities. This was not the case in the period from approximately the 1950s to 1970s when discharge of<br />
poorly treated sewage on shallow offshore areas of Sand Island (Dollar, 1979) and in Kaneohe Bay resulted in<br />
significant damage to coral reef communities (Smith et al., 1981). In the 1980s, Hawaii took significant action<br />
to improve coastal water quality by removing most wastewater outfalls from bays and shallow waters. Moving<br />
sewage outfalls to deep offshore waters (~40-75 m) has allowed significant recovery to the previously stressed<br />
areas (Dollar and Grigg, 2003). Another reversal of impacts from point source discharges has occurred on<br />
the Hamakua Coast of the island of Hawaii, where reef communities that were severely damaged by point<br />
source discharges of sugarcane processing waste have recovered following the closure of sugar plantations<br />
(S. Dollar, pers. obs.).
Seven major wastewater treatment<br />
plants discharge to the coastal ocean<br />
in Hawaii (Table 9.1). All but three<br />
of these discharge through deepwater<br />
outfalls (>40 m). Under terms of<br />
a consent decree filed in November<br />
1991 with the Federal district court<br />
for violations of the Federal Clean<br />
Water Act, the City and County of Honolulu<br />
agreed to provide $8 million for<br />
a comprehensive water quality study<br />
in Mamala Bay, the bight extending<br />
from Diamond Head to Barber’s Point<br />
along the southern coast of Oahu.<br />
The State of Coral Reef Ecosystems of the Main Hawaiian Islands<br />
Table 9.1. Wastewater treatment plants that discharge to Hawaii’s coastal waters.<br />
Source: U.S. EPA.<br />
LEVEL <strong>OF</strong> TREATMENT<br />
Deepwater Discharges (>40 m)<br />
Sand Island, Oahu Advanced primary<br />
Honouliuli, Oahu Advanced primary<br />
Waianae, Oahu Secondary<br />
Kailua, Oahu Secondary<br />
Hilo, Hawaii Secondary<br />
Shallow Water Discharges (
Main Hawaiian Islands<br />
page<br />
230<br />
The State of Coral Reef Ecosystems of the Main Hawaiian Islands<br />
runoff. Except for the island of Kauai,<br />
both groundwater and surface water<br />
discharge are equivalent to about<br />
20% of rainfall (Yuen and Associates,<br />
1992). Kauai has a higher percentage<br />
owing to greater overall rainfall.<br />
Groundwater in Hawaii typically contains<br />
two to three orders of magnitude<br />
higher concentrations of dissolved nitrogen<br />
and phosphorus than seawater.<br />
Thus, groundwater nutrients are<br />
an important natural factor of nearshore<br />
marine water chemistry. The<br />
groundwater nitrogen load reflects<br />
natural background and anthropogenic<br />
sources from wastewater and<br />
fertilizers. Calculations using values<br />
from U.S. Geological Survey (USGS) Figure 9.9. Maui shoreline showing nearshore sediment plumes resulting from run-<br />
groundwater models show that prisoff from pineapple fields after a Kona rainstorm. Photo: USGS.<br />
tine groundwater contributes about<br />
1,800 tons of nitrogen annually to the nearshore ocean along the west coast of the island of Hawaii.<br />
Monitoring programs seldom demonstrate a conclusive impact to Hawaiian reef communities from nonpoint<br />
source inputs. Runoff and groundwater have lower salinity than ocean water and in the absence of turbulent<br />
mixing, form a low-density surface layer. As a result, the elevated pollutant concentrations are not in contact<br />
with the bottom, hence there is little opportunity for exposure to reef communities.<br />
On neighbor islands, most of the sewage treatment plants discharge secondary treated wastewater into the<br />
ground through 15-60 m deep injection wells. In some cases, a portion of the effluent is reused for irrigation,<br />
providing additional opportunity for nutrient and particulate removal. Plumes from these injection wells have<br />
not been identified and traced. However, models predict that the wastewater plumes mix with groundwater<br />
and discharge to the ocean fairly close to the shoreline in water less than 30 m deep.<br />
Cesspools are a potentially harmful source of untreated wastewater, containing nutrients and pathogens<br />
that seep into the ocean along the<br />
shoreline. Hawaii has an estimated<br />
100,000 cesspools, more than any<br />
other state (EPA, unpublished data).<br />
While there is no statewide nutrient<br />
budget to assess the total magnitude<br />
of anthropogenic nutrient subsidies<br />
to groundwater, Soicher and Peterson<br />
(1997) developed such a comparison<br />
for the relatively small region<br />
of West Maui (Figure 9.10). In this<br />
region, 91.3% of the nitrogen delivery<br />
to the ocean is from factors associated<br />
with anthropogenic activities. It is<br />
of interest to note that since this estimate<br />
was compiled, sugarcane farming<br />
has ceased, and the last crops<br />
of pineapple are currently being harvested.<br />
While there have been no<br />
Figure 9.10. Total nitrogen delivery to the ocean from groundwater discharge in 1995<br />
off of west Maui. Source: Soicher and Peterson, 1997.
The State of Coral Reef Ecosystems of the Main Hawaiian Islands<br />
documented impacts to the reefs in West Maui as a result of the additional nutrients, this coastline is known<br />
to have nuisance algal blooms.<br />
Toxic pollutants are seldom measured in Hawaii’s marine waters. In southern Kaneohe Bay, Hunter et al.<br />
(1995) reported elevated concentrations of lead, copper, chromium, and zinc in oyster tissues near stream<br />
mouths. High levels of dieldrin and chlordane were also found in oyster tissues at some sites. In the Hanalei<br />
River and Estuary, the USGS (Orazio et al., 2003) reported quite low concentrations of semi-volatile aliphatic<br />
hydrocarbons, polyaromatic hydrocarbons (PAHs), polychlorinated biphenyls (PCBs), organochlorine pesticides,<br />
certain hydrophobic organics, and metals. Most organic contaminants were below, or slightly above,<br />
limits of detection.<br />
The USGS recently completed an assessment of water quality of streams and groundwater on the island of<br />
Oahu during 1999-2001 (Anthony et al., 2004). Anthony et al. (2004) found toxic contaminants in streams<br />
that drain urban and agricultural lands, and in groundwater supplies (although few chemicals exceeded the<br />
drinking water standards in groundwater). In Oahu’s urban streams, some of the highest levels of termitetreatment<br />
chemicals in the U.S. were reported. The USGS conducted no analyses in the marine environment<br />
where ocean mixing and dilution must be considered. Based on the USGS findings, screening of estuaries<br />
and coastal waters for toxic contaminants such as chlordane, dieldrin, and diazinon is warranted. Sediment<br />
particles containing toxic contaminants are easily transported to the ocean with storm flows and may be deposited<br />
at stream mouths and on reef flats.<br />
Kaneohe Bay remains a site of innovative work to establish the links between water quality and effects to<br />
reef communities. At present, an instrument array called the Coral Reef Instrumented Monitoring Platform<br />
(CRIMP) provides near real-time data at five to 10 minute intervals in order to characterize the biogeochemical<br />
and physical conditions of the water column of the coral reef environment of Southern Kaneohe Bay. CRIMP<br />
has been able to characterize changes from high intensity, short duration storms that previously were either<br />
“averaged” or undetected by manual sampling at longer time intervals (E. DeCarlo, pers. comm.). Results<br />
to date show that there are significant spikes in water chemistry constituents following storm events, but the<br />
elevated concentrations rapidly return to background levels following the storm. The model will be used to<br />
examine the timing and magnitude of fluxes of terrestrial materials to reef biota.<br />
Tourism and Recreation<br />
Tourism is Hawaii’s primary industry with state projections estimating about 6.7 million visitors arriving in 2004<br />
and spending more than $11.4 billion. An increase in tourism since 2003 is partially the result of the return of<br />
Asian travelers and the launching of a new Hawaii-based inter-island cruise ship with a passenger capacity of<br />
over 2,000 per trip. Between 1982 and 2002, there was a 66% increase in tourism representing a growth of<br />
over 2 million visitors (Hawaii DBEDT, 2003).<br />
There are over 1,000 ocean tourism companies, generating an estimated $700 million in gross revenues annually<br />
(Clark and Gulko, 1999). Over 80% of Hawaii’s tourists participate in some form of ocean recreation,<br />
from sunbathing and swimming, to snorkeling and surfing, to jet skiing and parasailing (Hawaii DBEDT, 2002).<br />
Most, if not all, of this activity occurs around Hawaii’s coral reefs that generate almost $364 million each year<br />
in added value (Cesar and van Beukering, 2004).<br />
Hawaii also consistently ranks as one of the top dive destinations in diver surveys conducted annually by<br />
Rodale’s Scuba Diving magazine. Nearly 52% of all visitors participate in diving or snorkeling activities during<br />
their stay in Hawaii (Hawaii DBEDT, 2002). Other than beach going, snorkeling and scuba diving activities<br />
outrank all other forms of recreational activities participated in by both U.S and Japanese visitors to Hawaii<br />
(Hawaii DBEDT, 2002).<br />
Hawaii’s marine life conservation districts (MLCDs) and other calm water locations are highly sought after<br />
locations in which to dive and snorkel and are marketed by the visitor industry as “must see destinations”<br />
(Clark and Gulko, 1999; Figure 9.11). Popular sites have high visitation and high economic value (Table 9.2).<br />
Hanauma Bay, a 41 ha marine protected area (MPA), and the surrounding City Nature Preserve generates<br />
Sidebar<br />
Main Hawaiian Islands<br />
page<br />
231
Main Hawaiian Islands<br />
page<br />
232<br />
The State of Coral Reef Ecosystems of the Main Hawaiian Islands<br />
over $31 million each year in added<br />
value (van Beukering and Cesar,<br />
2004). Over the next 50 years, this<br />
translates to nearly $2 billion in total<br />
benefits from this one site alone.<br />
Often the most popular sites are lacking<br />
in or have minimal shore side facilities,<br />
which increase the potential<br />
for impacts affecting the nearshore<br />
resources. As popularity increases,<br />
management agencies are faced with<br />
continuous and growing challenges<br />
to define the appropriate levels of<br />
use and how to gauge and monitor<br />
impacts.<br />
Recent studies have shown that extensive<br />
damage to corals can occur<br />
in shallow, calm water sites with high<br />
levels of human use (Rodgers and<br />
Cox, 2003). Trampling can occur in<br />
shallow nearshore reef flats which<br />
often possess fragile and delicate<br />
coral species. The greatest concentrations<br />
of human-substrate contacts<br />
occurred at shoreline access points<br />
where people stood or waded as they<br />
enter and exit the water (Holland and<br />
Meyers, 2003).<br />
In both the trampling study (Rodgers<br />
and Cox, 2003) and the human use<br />
impacts study (Holland and Meyer,<br />
2003), results indicated that patrons<br />
who were provided a brief orientation<br />
and given flotation devices for snor-<br />
Figure 9.11. Patterns and types of use at four MPAs in Hawaii. Fishing is prohibited<br />
or restricted in all of these areas. Source: Holland and Meyer, 2003.<br />
Table 9.2. Summaries of annual human use at various locations in Hawaii. All locations<br />
except Waikiki Beach are MLCDs.<br />
LOCATION NO. <strong>OF</strong> VISITORS<br />
Waikiki Beach, Oahu 8,355,448 1<br />
Hanauma Bay, Oahu 1,751,318 1<br />
2, 3<br />
Pupukea, Oahu 177,600<br />
Manele/Hulapoe Bays, Lanai 277,400 2<br />
Molokini Shoal, Maui 400,000 4<br />
Honolua/Mokuleia Bays, Maui 160,000 2<br />
Kealakekua Bay, Hawaii 189,800 2<br />
1<br />
2<br />
3<br />
4<br />
*<br />
DBEDT State Data Book, 2002.<br />
Adapted from Holland and Meyer, 2003 (based on mean hourly usage).<br />
Reflects only summer use for five months, as there is minimal use in the winter.<br />
Estimation by S. Hau, pers. comm.<br />
MLCDs are marine protected areas established to conserve and protect marine<br />
resources.<br />
keling were less likely to impact the reef than those visitors with no interpretive information or training. Mandatory<br />
education efforts at Hanauma Bay each year help conserve reefs statewide since visitors generally go to<br />
two or three additional sites during their stay and residents snorkel or dive at 10 sites per year. The cumulative<br />
effect of educating visitors and residents has resulted in improved behavior at sites across the state (Davidson<br />
et al., 2003).<br />
In a recent assessment of the economic benefits and costs of marine managed areas in Hawaii, a total of<br />
1,380 divers, snorkelers, and beachgoers at six sites where surveyed regarding their willingness to pay a<br />
coral reef conservation fee for more active management. More than 75% indicated that they would be willing<br />
to pay for reef conservation and the average payment indicated by respondents was $3.77 per experience.<br />
Based on these results, management improvements could be provided for a small fee including basic facilities,<br />
enforcement compliance, education/awareness, assessment and monitoring, and infrastructure (e.g., parking,<br />
moorings, etc.). These fees would result in significant benefits to the sites and a decrease in visitor impacts.<br />
Other mechanisms to define and determine appropriate levels of use are still needed as efforts continue to<br />
minimize the impacts from use while maintain the health of the ecosystem.
Figure 9.12. Commercial catch data from Hawaii DAR from 1948 to present. 1900<br />
data from statewide market surveys conducted by the United States Fish Commission.<br />
Sources: Cobb, 1905; DAR Commercial Landings Database.<br />
Figure 9.13. Top 10 taxa of commercially harvested coral reef organisms excluding<br />
coastal pelagic fish from 2001 commercial catch data. Source: DeMello, 2004.<br />
The State of Coral Reef Ecosystems of the Main Hawaiian Islands<br />
Fishing<br />
Fishing has been a way of life for Hawaii’s<br />
people for centuries, with fish<br />
and shellfish providing the major protein<br />
source for the Hawaiian people<br />
(Kamakau, 1839; Titcomb, 1972).<br />
The traditional system in Hawaii emphasized<br />
social and cultural controls<br />
on fishing with a code of conduct that<br />
was strictly enforced (Friedlander et<br />
al., 2002a; Poepoe et al., in press).<br />
After western contact, a breakdown<br />
of the traditional kapu system and the<br />
demise of the watershed as a management<br />
unit led to the virtual elimination<br />
of traditional Hawaiian fisheries<br />
management practices (Smith<br />
and Pai, 1992; Lowe, 2004).<br />
Over the past 100 years, the coastal<br />
fisheries in Hawaii have undergone<br />
enormous changes (Shomura, 1987;<br />
Friedlander, 2004). Overfishing is<br />
cited as the primary reason for the<br />
declining resources both by general<br />
ocean users (DLNR-DAR, 1988) and<br />
commercial fishers (Harman and<br />
Katekaru, 1988). Factors contributing<br />
to the decline of inshore fisheries<br />
include a growing human population,<br />
destruction or disturbance to habitat,<br />
introduction of new fishing techniques<br />
(i.e., inexpensive monofilament gill<br />
nets, scuba equipment, geographic<br />
positioning systems, power boats,<br />
sonar fish finders), and loss of traditional<br />
conservation practices (Lowe,<br />
1996; Birkeland and Friedlander,<br />
2002).<br />
Commercial landings for a number<br />
of important species have shown<br />
dramatic declines since the 1900s<br />
(Figure 9.12). With the exception of<br />
jacks, which have been associated<br />
with ciguatera poisoning, consumer<br />
demand and wholesale prices to fish-<br />
ers alone do not explain the dramatic<br />
decline in landings. The number of commercial fishers participating in the coral reef fishery rose from 282 in<br />
1966 to a peak of 1,178 in 1996, with the current level at 925 commercial fishers (DeMello, 2004). Excluding<br />
coastal pelagic fishes, which account for 80% of the nearshore commercial catch, 139.500 kg of coral reef fish<br />
were landed in 2001, consisting mainly of surgeonfishes, goatfishes, soldierfishes, unicornfishes, parrotfishes,<br />
and octopus (Figure 9.13; DeMello, 2004).<br />
Underreporting by commercial fishers and the existence of a large number of recreational and subsistence<br />
Sidebar<br />
Main Hawaiian Islands<br />
page<br />
233
Main Hawaiian Islands<br />
page<br />
234<br />
The State of Coral Reef Ecosystems of the Main Hawaiian Islands<br />
fishers without licensing or reporting<br />
requirements have resulted in<br />
uncertainty in actual fisheries catch<br />
statistics for the state (Lowe, 1996).<br />
The nearshore recreational and subsistence<br />
catch is likely equal to or<br />
greater than the nearshore commercial<br />
fisheries catch, and recreational<br />
and subsistence fishers take more<br />
species using a wider range of fishing<br />
gear (Friedlander and Parrish, 1997;<br />
Everson and Friedlander, 2004).<br />
The proliferation of long and inexpensive<br />
gill nets has allowed new fishers<br />
to enter the fishery and set nets<br />
deeper and in locations not previously<br />
harvested (Clark and Gulko, 1999).<br />
Intensive fishing pressure on highly<br />
prized and vulnerable species has<br />
led to substantial declines in catch<br />
and size as well as raised concerns<br />
about the long-term sustainability of<br />
these stocks (Smith, 1993; Friedlander<br />
and Parrish, 1997; Friedlander and<br />
DeMartini, 2002). Pacific threadfin is<br />
considered one of the premier Hawaiian<br />
food fishes and was reserved<br />
for the ruling chiefs in ancient Hawaii.<br />
The mean size of threadfin in all<br />
sexual categories has declined significantly<br />
since the 1960s, while the<br />
proportion of juveniles has increased<br />
from 6% to 40% of the catch during<br />
this time period (Friedlander and Ziemann,<br />
2003; Figure 9.14).<br />
Fishers frequently cite the lack of adequate<br />
enforcement of fishing and<br />
marine resource laws as one of their<br />
major concerns (Harman and Katekaru,<br />
1988; DLNR-DAR, 1998). The<br />
Hawaii Division of Conservation and<br />
Resources Enforcement (DOCARE)<br />
is the state’s primary agency for enforcement<br />
of natural resource regulations.<br />
Although the number of<br />
enforcement officers has increased<br />
substantially over the past 50 years,<br />
the number of fishing citations for<br />
freshwater and saltwater issued per<br />
officer has declined over time to 2.3<br />
citations per officer per year (Figure<br />
9.15).<br />
Figure 9.14. Proportion of juveniles, males, hermaphrodites, and females for Pacific<br />
threadfin (Polydactylus sexfilis) on windward Oahu from 1962 to 1968 (upper panel)<br />
and during 1999 (lower panel). Source: Friedlander and Ziemann, 2003.<br />
Figure 9.15. Number of fishing citations (including arrests) issued per DOCARE officer,<br />
and the number of officers over time. Gap in data due to unavailability of information.<br />
Source: DOCARE Database.
The State of Coral Reef Ecosystems of the Main Hawaiian Islands<br />
In 1981, Hawaii’s legislature expanded DOCARE’s traditional enforcement duties to include non-natural resource<br />
issues. Although legislation stipulated that the primary duty of enforcement officers would be the enforcement<br />
of conservation and resource laws, the proportion of citations (including arrests) related to natural<br />
resource violations (primarily hunting and fishing) has decreased in recent years and presently constitutes<br />
only 33% of total DOCARE citations. However, DOCARE’s responsibilities also increased substantially in<br />
1991, when the Division of Boating and Ocean Recreation was created within Hawaii’s Department of Land<br />
and Natural Resources, and the agency found that it must now also enforce all boating safety, small boat<br />
harbor, and ocean recreation regulations. A DOCARE volunteer officer program created in 1973 has similarly<br />
declined and the number of volunteer officers in the program is presently only 20% of what it was 20 years<br />
ago.<br />
In contrast to some other states, Hawaii DOCARE officers are presently prohibited from inspecting the bags,<br />
containers (e.g., coolers), or vehicles of any recreational fisher unless they have probable cause that a violation<br />
has taken place (HRS Title 12, subtitle 5). With the increase in responsibilities to enforce both natural<br />
resource and other laws, and the limitations on inspections and funding, it is unlikely that enforcement of existing<br />
and future rules and regulations will increase substantially.<br />
Trade in Coral and Live Reef Species<br />
It is against Hawaii state law to take or sell stony coral or live rock (i.e., marine substrate where living material<br />
is visibly attached). A number of recent enforcement cases have documented trafficking in Hawaiian corals,<br />
including one conviction resulting in over $1 million in fines and seven convictions resulting in jail time as long<br />
as seven months.<br />
The commercial aquarium fishery in<br />
Hawaii has developed over the last<br />
50 years into one of the state’s major<br />
inshore fisheries, with landings of<br />
over 708,000 specimens with a reported<br />
value of $1.06 million (Walsh<br />
et al., 2004). As the aquarium industry<br />
is composed of both independent<br />
contractors (collectors) and<br />
wholesalers, which may or may not<br />
be collectors themselves, the overall<br />
economic value of the aquarium<br />
fishery is estimated to be substantially<br />
higher than the reported value.<br />
Cesar et al. (2002) estimated industry<br />
gross sales at $3.2 million and industry<br />
profits at $1.2 million. A 1993<br />
analysis based on export figures by<br />
an aquarium trade group calculated<br />
total sales of Hawaiian fish (inclusive<br />
of freight and packing) at $4,909,654<br />
(Hawaii Tropical Fish Association,<br />
unpublished data). DAR reported the<br />
total average fishery value for fiscal<br />
year 1993-1994 as only $819,957<br />
(Miyasaka 1994a, b).<br />
While the overall economic value and<br />
total catch of the aquarium fishery in<br />
the state has been relatively stable<br />
over the last decade (Figure 9.16),<br />
Figure 9.16. Upper panel shows the number of commercial aquarium permits issued<br />
statewide and the numbers of fish and invertebrates reported caught. Lower panel<br />
shows dollar value of commercially caught fish and invertebrate aquarium specimens.<br />
Value is adjusted for inflation by means of Honolulu Consumer Price Index (Hawaii<br />
Dept. of Labor and Industrial Relations). Source: Walsh et al., 2004.<br />
Sidebar<br />
Main Hawaiian Islands<br />
page<br />
235
Main Hawaiian Islands<br />
page<br />
236<br />
The State of Coral Reef Ecosystems of the Main Hawaiian Islands<br />
there have been substantial changes<br />
in value on each of the islands (Figure<br />
9.17). The value (adjusted for<br />
inflation) of the Oahu aquarium fish<br />
catch in fiscal year 2003 has declined<br />
by 76% while that of Hawaii Island<br />
has increased 282%.<br />
The overall aquarium catch has been<br />
diverse, comprising 235 taxa of fish<br />
and 37 taxa of invertebrates. A relatively<br />
small number of species dominates<br />
the catch; the top 10 species<br />
constitute 73.3% of the total historical<br />
catch (Walsh et al., 2004; Table<br />
9.3). Surgeonfishes, butterflyfishes,<br />
and wrasses are the most commonly<br />
caught fish species, while feather<br />
duster worms, hermit crabs, and<br />
shrimp predominate among the in-<br />
Figure 9.17. Number of aquarium fish caught on each island per fiscal year. Kauai<br />
catch omitted due to low numbers. Source: Walsh et al., 2004.<br />
vertebrates. The yellow tang (Zebrasoma flavescens) accounts for 37% of the total catch.<br />
Table 9.3. Top 10 taxa of collected animals from FY 1976-2003. Source: Walsh et al., 2004.<br />
TAXA COMMON NAME TOTAL CAUGHT % <strong>OF</strong> TOTAL<br />
Zebrasoma flavescens Yellow tang 3,386,860 37.2<br />
Sabellastarte sanctijosephi Feather duster worm 741,949 8.1<br />
Hermit crabs Hermit crabs 707,654 7.8<br />
Ctenochaetus strigosus Goldring surgeonfish 346,944 3.8<br />
Acanthurus achilles Achilles tang 337,781 3.7<br />
Naso lituratus Orangespine unicornfish 298,884 3.3<br />
Centropyge potteri Potter’s angelfish 287,668 3.2<br />
Forcipiger flavissimus Forcepsfish 251,523 2.8<br />
Zanclus cornutus Moorish idol 187,662 2.1<br />
Halichoeres ornatissimus Ornate wrasse 121,766 1.3<br />
Subsequent to the overall contraction of the aquarium fishery in the late 1970s and early 1980s due to a<br />
downturn in the economy (Figure 9.7), there has been an increasing trend in the number of commercial fishery<br />
permits on all islands (Figure 9.16). In the early days of the fishery, most collecting activity was centered on<br />
the island of Oahu, which accounted for between 64% (1976) and 84% (1981) of the fish catch. This fishery<br />
has declined over the years due to hurricane impacts and localized overfishing, with the current catch from<br />
Oahu accounting for only 12% of the total catch. Low-value invertebrates are increasingly replacing fishes. In<br />
contrast to Oahu, the aquarium fishery on the island of Hawaii has experienced a 645% increase over the last<br />
two decades and now accounts for 55% of the catch and 68% of the total state fisheries value. The expansion<br />
on Hawaii was due to both an influx of new collectors and the relocation of collectors from Oahu.<br />
Recent research shows that collecting activities in Hawaii can significantly affect targeted species (Tissot and<br />
Hallacher, 2003). A network of fish replenishment areas (FRAs) has been established on the island of Hawaii<br />
to ensure sustainability of the aquarium fishery and to reduce user conflicts. Four years after implementation<br />
of the FRAs in 2000, there were significant increases in the abundance of several targeted species, and the<br />
overall value of the fishery is at an all-time high. Catch report compliance is low on the island of Hawaii and<br />
likely elsewhere within the state. Actual aquarium catch is thought to be underreported, but specific management<br />
actions are increasing reporting compliance by collectors.
The State of Coral Reef Ecosystems of the Main Hawaiian Islands<br />
Ships, Boats, and Groundings<br />
More than 16,000 recreational and commercial vessels are currently registered in Hawaii. On average, three<br />
to five ship groundings are reported each year in the MHI, but these values are likely an underestimate as<br />
many recreational vessel groundings go unreported. In most cases, responsible parties have not had to cover<br />
the cost for vessel salvage, and restitution for damage is rarely made. Cruise ships currently make over 400<br />
port calls annually in Hawaii, and this figure is expected to triple in the next few years. The limited port facilities<br />
have raised concerns about anchoring areas and potential reef damage. In February <strong>2005</strong>, a 550-ft bulk<br />
carrier freighter ran aground off SW Oahu causing considerable damage to corals to a depth of 70 ft.<br />
<strong>Marine</strong> Debris<br />
Each year, thousands of kilograms of debris wash onto Hawaii’s shorelines. This debris poses entanglement<br />
and ingestion threats to endangered Hawaiian monk seals, sea turtles, and sea birds (Henderson, 1984;<br />
Balazs, 1985). Fishing gear can snag on a reef, leading to the damage and breakage of coral heads and<br />
eventually mortality (Donohue et al., 2001; Yoshikawa and Asoh, 2004).<br />
Several efforts are made each year to clean up marine debris. One such effort is the National <strong>Marine</strong> Debris<br />
Monitoring Program (NMDMP), which is coordinated by the Ocean Conservancy and for which trained<br />
NMDMP volunteers monitor selected beaches across the state and conduct monthly beach cleanups. Another<br />
effort is the “Get the Drift and Bag It” event, part of the Ocean Conservancy’s International Coastal Cleanup,<br />
which is coordinated locally by the Hawaii Sea Grant Program. In 2002, nearly 2,000 volunteers across the<br />
state collected over 13,000 kg of marine debris along 151 km of shoreline in this one-day event. Over 100 divers<br />
removed 590 kg of underwater debris from 38 km of underwater area. The majority (54%) of the collected<br />
debris was derived from shoreline and recreational activities, with the remainder comprised of debris from<br />
smoking related (37%) and ocean/waterway activities (7%). Of all the debris types noted, cigarettes, plates,<br />
utensils, caps, and lids were the most common, accounting for over half of all debris collected (The Ocean<br />
Conservancy, 2002). Debris from ocean and waterway activities (i.e., fishing line and nets) are the most common<br />
types of entangling debris and many times do not wash ashore.<br />
In 2003, in conjunction with the International Coastal Cleanup, two focused cleanup events were conducted in<br />
remote areas that are impacted almost entirely by ocean-borne debris. At Kanapou Beach, Kahoolawe, staff<br />
and volunteers cleaned almost 2,700 kg of marine debris (primarily plastics) from this particular area in a oneday<br />
effort on a half kilometer strip of beach. At Kaalualu Bay, on the south coast of the island of Hawaii, over<br />
100 volunteers cleaned approximately three km of coastline in two days. Over 36,000 kg of marine debris,<br />
mostly ocean-borne plastic and nets, were removed.<br />
While statewide coastal cleanup events have documented that the majority of Hawaii’s debris is from landbased<br />
sources, there is a substantial amount of marine debris that washes ashore from sources outside Hawaii,<br />
particularly at more remote coastlines. Therefore, efforts are needed not only to continue the ongoing,<br />
local volunteer activities, but also to address this issue on the high seas and with Pacific Rim communities that<br />
share the impacts and responsibility for this marine pollution.<br />
Aquatic Invasive Species<br />
The coral reef communities surrounding the Hawaiian Islands have been inundated with alien species over<br />
the last century (Coles and Eldregde, 2002; Coles et al., 1999a; Eldredge and Smith, 2001; Friedlander et al.,<br />
2002b). Due to extreme isolation and subsequent high levels of endemism, alien invaders pose a significant<br />
threat to the native diversity of these unique marine environments. Perhaps because Hawaii lies in the middle<br />
of the Pacific Ocean and is located on shipping routes across the Pacific, the islands have intercepted more<br />
nonindigenous marine species (NIMS) than other tropical locations (Carlton, 1987). The estimated number<br />
of NIMS in Hawaii includes 287 invertebrates, 20 algae, 20 fish, and 12 flowering plant species (Eldredge<br />
and Smith, 2001). While the majority of NIMS in Hawaii are invertebrates, many of these species are cryptic<br />
and/or have remained in highly disturbed harbors and other fouling environments. These factors have made<br />
it difficult to determine the impacts and interactions that the invaders may be having on native marine flora<br />
Sidebar<br />
Main Hawaiian Islands<br />
page<br />
237
Main Hawaiian Islands<br />
page<br />
238<br />
The State of Coral Reef Ecosystems of the Main Hawaiian Islands<br />
and fauna. However, the larger and more conspicuous nonindigenous marine algae (NIMA) have become<br />
increasingly more common along Hawaiian shores over the last several decades (Smith et al., 2002; Smith et<br />
al., 2004; Smith, 2003).<br />
Out of the 20 or more species of NIMA introduced to Hawaii since the mid-1950s, recent surveys indicate that<br />
at least five of these have become well established (Smith et al., 2002). Several species of the red algal genera<br />
Kappaphycus and Eucheuma were introduced to open reef cultures in Kaneohe Bay, Oahu in the 1970s<br />
for experimental aquaculture for the carrageenen industry. Following experimental manipulations, plants were<br />
left on the reef. Some 30 years later, at least two of these species (Kappaphycus alvarezii and Eucheuma<br />
denticulatum) have spread throughout<br />
Kaneohe Bay and are beginning<br />
to appear on reefs outside of the<br />
bay (Woo et al., 1999; Rodgers and<br />
Cox, 1999; Smith et al., 2002; Smith,<br />
2003). These species are particularly<br />
threatening to the integrity of Hawaiian<br />
reefs, as they are able to overgrow,<br />
smother, shade, and kill reefbuilding<br />
corals (Figure 9.18; Smith,<br />
2003). These species generally grow<br />
in large three-dimensional mats that<br />
monopolize the benthos. Not only do<br />
these invaders kill coral, but they denude<br />
the three-dimensional complexity<br />
or rugosity (i.e., roughness) on a<br />
reef, thus posing negative cascading<br />
effects to the entire reef community.<br />
Hypnea musciformis was introduced<br />
from Florida to Kaneohe Bay, Oahu in<br />
1974. This species is now the second<br />
most widespread of the NIMA species<br />
in Hawaii and is found on all of<br />
the MHI except the island of Hawaii.<br />
This alga forms massive blooms on<br />
the shallow reef flats on the island of<br />
Maui (Hodgson, 1994). A recent economic<br />
evaluation has estimated that<br />
because of these blooms, the State<br />
of Hawaii suffers net losses of over<br />
$20 million per year due to reduced<br />
occupancy rates in hotels and condominiums,<br />
reduced property value in<br />
the impacted area, and direct costs<br />
associated with removing rotting seaweed<br />
from beaches (Figure 9.19; van<br />
Beukering and Cesar, 2004).<br />
Gracilaria salicornia was introduced<br />
to Waikiki and Kaneohe Bay for experimental<br />
aquaculture in 1971 and<br />
1978, respectively. The source population<br />
had been known to exist on the<br />
island of Hawaii prior to the 1950s.<br />
June August<br />
October December<br />
Figure 9.18. Representative photographic sequence showing the invasion of the red<br />
alga Eucheuma denticulatum into a live Porites compressa colony on a patch reef in<br />
Kaneohe Bay, Oahu, 2002. Several quadrats were permanently marked on a variety<br />
of reefs using steel pins and photographs were taken monthly for one year to monitor<br />
algal invasion and coral growth. Source: Smith, 2003.<br />
Figure 9.19. The introduced seaweed, Hypnea musciformis, forms massive blooms<br />
that have negative ecological and economic impacts. Photo: J. Smith.
The State of Coral Reef Ecosystems of the Main Hawaiian Islands<br />
There is some support for the idea that this population on the island of Hawaii was an early 20 th century introduction<br />
from ship ballasts originating in the Philippines, where G. salicornia is native (I. Abbott, pers. comm.).<br />
In 1999, G. salicornia still had a distinct and localized distribution (Smith et al., 2002). However, more recent<br />
surveys indicate that G. salicornia has become increasingly common on the island of Oahu (Smith et al.,<br />
2004). It is the most common species in the shallow reef areas off of Waikiki and readily overgrows and kills<br />
reef-building coral. Coral cover has declined significantly in Kaneohe Bay and Waikiki as a result of the G.<br />
salicornia invasion. At the same time, new populations continue to emerge across the state.<br />
Acanthophora spicifera, another red alga, was accidentally introduced to Honolulu Harbor in the 1950s on a<br />
heavily fouled barge originating from Guam. This species has now spread throughout the MHI and can be<br />
considered naturalized. While it is now a common component of the intertidal community, it generally does not<br />
form large monospecific blooms. However, high abundances have been recently documented from the reef<br />
slope area at numerous locations on West Maui (J. Smith, unpublished data).<br />
Avrainvillea amadelpha, a green alga, is currently considered to be a cryptogenic (i.e., of uncertain origin)<br />
species. It was first documented on Oahu in the 1980s and has since become highly abundant on Oahu’s<br />
south shore. It is unclear how this species got to Hawaii or even where it originated from specifically, but it is<br />
likely to have been a home aquarium introduction through the dumping of live rock. This species appears to<br />
be competing with Hawaii’s native seagrasses. Very little is known about the impacts and interactions of A.<br />
amadelpha on Hawaii’s reefs, but it is currently the subject of active research (K. Peyton, unpublished data).<br />
Only three invasive or potentially invasive species of invertebrates occur on Hawaiian coral reefs. The Philippine<br />
mantis shrimp (Gonodactylaceus falcatus) is common in Kaneohe Bay (Coles et al., 2002a), where it has<br />
displaced the native shrimp (Pseudosquilla ciliate) from coral rubble habitats (Kinzie, 1968), and in Waikiki<br />
(Coles et al., 2002b). The snowflake coral (Carijoa riisei) can occur in high densities from the intertidal zone<br />
(Coles et al., 2002b) to over 100 m deep where optimal growth conditions are provided by reduced light and<br />
moderate current. It occurs under ledges and in caves at many reef sites throughout the MHI and overgrows<br />
black coral beds off Maui between 75 m and 100 m that may be important source populations for shallow water<br />
black coral assemblages (Grigg, 2003). Other observations suggest that C. riisei, which was first reported in<br />
Hawaii in Pearl Harbor in 1972 (Evans et al., 1974; Devaney and Eldredge, 1977), is highly fecund and has a<br />
rapid growth rate (S. Kahng, pers. comm.), resulting in the proliferation of this species.<br />
A third introduced invertebrate recently designated as potentially invasive (Coles et al., 2004) is the orange<br />
keyhole sponge (Mycale armata Thiele). This sponge was observed at five of 41 rapid assessment sites,<br />
but at all sites other than in Kaneohe Bay, it was a minor component of the sessile benthos and appeared<br />
neither abundant nor invasive. However, in Kaneohe Bay and especially on reefs on or near Coconut Island,<br />
this sponge has become abundant and is growing at a sufficient rate to overgrow the dominant corals Porites<br />
compressa and Montipora capitata. The spatial extent and degree of competition among M. armata and other<br />
corals has not been established at present.<br />
Previous studies of the presence and impact of nonindigenous (introduced or alien) and cryptogenic marine<br />
species, collectively termed NIS, in Oahu’s harbors and embayments have indicated that 15-23% of the total<br />
biota in these enclosed or semi-enclosed areas is composed of confirmed or putative introductions (Table 9.4).<br />
Earlier surveys have not indicated a substantial presence of NIS on surveyed Hawaiian coral reefs except in<br />
Kaneohe Bay and at Waikiki where NIS comprised 14.5 and 6.9%, respectively, of total biota identified (Table<br />
9.3). Remote areas such as Kahoolawe, the NWHI and Johnston Atoll showed NIS to be a minor component<br />
of the reef total biota, comprising 0.3-1.5% of the total identified biota.<br />
At least 13 species of introduced marine fishes have become established in Hawaii (Eldredge, 1994). The<br />
Marquesan sardine (Sardinella marquesensis) was intentionally introduced as a tuna baitfish in the 1950s,<br />
while the gold spot herring (Herklotsichthys quadrimaculatus) was an accidental baitfish introduction that has<br />
proliferated at the expense of a local endemic silverside (Atherinomorus insularum; DeMartini et al., 1999). A<br />
mullet (Valamugil engeli) and goatfish (Upeneus vittatus) were unintentional introductions that arrived with the<br />
Marquesan sardine (Randall, 1987). The mullet is not important in the local fishery, but may be displacing the<br />
Sidebar<br />
Main Hawaiian Islands<br />
page<br />
239
Main Hawaiian Islands<br />
page<br />
240<br />
The State of Coral Reef Ecosystems of the Main Hawaiian Islands<br />
Table 9.4. Numbers of marine nonindigenous (N), cryptogenic (C), nonindigenous plus cryptic (NIS), and total species in Hawaii and<br />
Johnston Atoll.<br />
LOCATION (N) (C) TOTAL NIS TOTAL SPECIES % N + C SOURCE<br />
Hawaiian Islands<br />
Oahu, Pearl Harbor 69 26 95 419 23 Coles et al., 1997, 1999a<br />
Oahu, South Shore Commercial Harbors 73 27 100 585 17 Coles et al., 1999b<br />
Kaneohe Bay 82 34 116 617 14.5 Coles et al., 2002a<br />
Waikiki 33 19 52 749 6.9 Coles et al., 2002b<br />
Kahoolawe 3 0 3 298 1 Coles et al., 1998<br />
Midway 4 0 4 444 1.5 DeFelice et al., 1998<br />
French Frigate Shoals 2 0 2 617 0.3 DeFelice et al., 2002<br />
41 additional sites 18 8 26 486 5.3 Coles et al., 2004<br />
Johnston Atoll 5 5 10 668 1.5 Coles et al., 2001<br />
more valuable native mullet (Mugil cephalus). Several introduced tilapia species are also thought to reduce<br />
the abundance of the valuable native mullets through competition for food and other resources (Randall, 1987;<br />
Eldredge, 1994).<br />
Between 1951 and 1961, 11 demersal fish species (six groupers, four snappers, and one emperor) were<br />
intentionally introduced into Hawaii (Oda and Parrish, 1981; Randall, 1987). Of these species, the blacktail<br />
snapper (Lutjanus fulvus), bluestripe snapper (Lutjanus kasmira), and peacock grouper (Cephalopholis argus)<br />
have established viable breeding populations in the state. The latter two species have proven to be particularly<br />
controversial because they have adapted well to Hawaiian waters and are often blamed for depletion of<br />
desirable species due to competition or predation.<br />
Bluestripe snappers have been by far the most successful fish introduction to the Hawaiian coral reef ecosystem.<br />
From some 3,200 individuals introduced on the island of Oahu, the population has expanded its range<br />
as far north as Midway in the NWHI (~2,400 km). These records suggest a dispersal rate of about 33-130<br />
km/yr and attest to the interconnectedness of the entire archipelago. Recent research suggests that the purported<br />
impact on native species may be substantially less than what fishers commonly believe. A study of<br />
the interactions of bluestripe snappers with native deepwater snappers found little habitat or dietary overlap<br />
with native deepwater snappers (Parrish et. al., 2000). Preliminary results of feeding interactions between<br />
bluestripe snapper and shallow-water reef fishes do not suggest predatory effects on native populations by<br />
the introduced snapper, or vice versa (Schmacker and Parrish, 2004). Likewise, state fisheries data do not<br />
suggest a strong negative impact of this snapper on landings of deepwater snappers.<br />
Similarly, studies of bluestripe snappers in shallow water environments have not detected direct negative impacts<br />
on other fish species. Friedlander et al. (2002b) found that while bluestripe snappers associated with<br />
many native species, no clear and consistent relationships were observed that would suggest strong common<br />
dependence on an important, limited resource (e.g., space, shelter, food, and foraging grounds). Oda and<br />
Parrish (1981) reported that commercially important fish species were not eaten by bluestripe snapper nor did<br />
they appear to have diet overlap with food fish such as goatfishes (Mullidae) or soldierfishes (Holocentridae).<br />
Of the six species of groupers introduced to Hawaii, only peacock groupers (Cephalopholis argus) have become<br />
established. Peacock grouper now occur on all of the MHI and in low numbers on some of the NWHI.<br />
Increases in abundance have been noted at several locations since the early 1990s (Figure 9.20). Although<br />
this species was introduced to augment declining populations of food and game fishes, it has not been well<br />
received by most Hawaii fishers due to concerns about ciguatera poisoning. Peacock grouper have been<br />
blamed for a multitude of problems on the reefs, most notably a decline in important aquarium fish such as the<br />
yellow tang (Zebrasoma flavescens). Ongoing feeding studies have failed to find yellow tangs in the stomachs<br />
of peacock grouper (J. Dierking, pers. comm.; Walsh, pers. obs.). Peacock grouper appear to be omnivorous,
The State of Coral Reef Ecosystems of the Main Hawaiian Islands<br />
Figure 9.20. Mean abundance of peacock grouper on transects along West Maui (left panel) and West Hawaii (right panel). Source:<br />
E. Brown, unpublished data; West Hawaii Aquarium Project, unpublished data.<br />
feeding on both invertebrates and a range of fish types (diurnal/nocturnal), rather than targeting certain types<br />
of prey. Studies to date have not found any relationship between peacock grouper densities and species richness<br />
(i.e., number of species per transect), number of fishes, or recruitment, suggesting that they may not be<br />
having the dramatic impact on reef fish populations that has been attributed to them. In fact, Peacock grouper<br />
were found to have a positive relationship with other piscivores, which suggests that they are not outcompeting<br />
or otherwise negatively impacting these piscivores.<br />
Security Training Activities<br />
In Hawaii, the extensive presence of U.S. air force, army, coast guard, marine and naval installations makes<br />
the military the second largest economic activity in the state. Many of these areas are closed to fishing and<br />
this prohibition has resulted in high abundance of some targeted resource species. Large jacks are not frequently<br />
encountered around Oahu but large individuals and high numbers of these species have been observed<br />
in Pearl Harbor, likely due to restrictions on fishing at the facility (R. Brock, pers. comm.). The island of<br />
Kahoolawe was used as a military bombing target until 1990, and fishing restrictions resulted in certain sites<br />
having the highest biomass of reef fish and greatest number of predators compared to other sites around the<br />
MHI (Friedlander and DeMartini, 2002). Kaula Rock, a live-fire and bombing target 35 km southwest of Niihau,<br />
is also closed to harvest and is noted for its abundance of jacks and other large species. Recent surveys<br />
around Kaneohe Bay <strong>Marine</strong> Corp Base, Oahu have noted greater abundance and larger sizes for many reef<br />
fishes compared with other areas around Oahu.<br />
Negative impacts on coral reefs resulting from military activities include unexploded ordinance, pollution, and<br />
vessel groundings. Unexploded ordnance have been observed at all of the above mentioned locations as well<br />
as numerous other areas around the MHI that were previously used as bombing targets and live-fire training<br />
areas. The approximately 2,024 hectares of sediments (e.g., mud and sand) comprising the bottom of Pearl<br />
Harbor act as a sink or repository for many of the chemicals entering the harbor. Chemical contaminants<br />
found in the harbor have led State of Hawaii, U.S. Navy, and other Federal officials to notify the public and<br />
issue warnings to alert fishers not to eat any fish caught in the harbor. Amphibious training exercises have<br />
resulted in groundings and reef damage on several occasions.<br />
Sidebar<br />
Main Hawaiian Islands<br />
page<br />
241
Main Hawaiian Islands<br />
page<br />
242<br />
The State of Coral Reef Ecosystems of the Main Hawaiian Islands<br />
Offshore Oil and Gas Exploration<br />
No offshore oil and gas exploration occurs in Hawaiian waters.<br />
Other<br />
Crown-of-thorns starfish (Acanthaster planci)<br />
At present, outbreaks of crown-ofthorns<br />
starfish (COTS; Figure 9.21),<br />
Acanthaster planci, do not appear<br />
to be a problem in Hawaii except in<br />
isolated incidents. The last reported<br />
large-scale occurrence of COTS was<br />
in August 1969 when approximately<br />
20,000 COTS were observed off the<br />
south shore of Molokai (Branham et<br />
al., 1971). There have only been<br />
scattered reports of COTS aggregations<br />
since this time and all have been<br />
of considerably lesser magnitude.<br />
Figure 9.21. A crown-of-thorns starfish, Acanthaster planci, consuming its prey. Photo:<br />
S. Holst.
Table 9.5. Extant monitoring programs investigating coral reef ecosystems in the MHI.<br />
The State of Coral Reef Ecosystems of the Main Hawaiian Islands<br />
<strong>CORAL</strong> <strong>REEF</strong> ECOSYSTEMS—DATA GATHERING ACTIVITIES AND RESOURCE CONDITION<br />
Current coral reef monitoring, research, and assessment activities, including those that are represented in this<br />
report, are summarized in Table 9.5. Monitoring locations are shown in Figure 9.22.<br />
PROGRAM OBJECTIVES START<br />
DATE<br />
Hawaii Coral Reef<br />
Assessment and Monitoring<br />
Program (CRAMP)<br />
West Hawaii Aquariumfish<br />
Project (WHAP)<br />
Spread of alien algae in<br />
Kaneohe Bay, Oahu<br />
Fish Habitat Utilization<br />
Program (FHUP)<br />
Physical factors and<br />
biological processes<br />
affecting nuisance algae in<br />
W. Maui<br />
DAR statewide marine<br />
research and surveys of fish<br />
and habitat<br />
Hanalei Bay <strong>Marine</strong><br />
Communities Investigation<br />
Long-term monitoring of<br />
benthos and fishes across a<br />
statewide network of sites<br />
Assess aquarium fish collecting<br />
and MPA effectiveness<br />
Examine spread of alien algae<br />
and assoc. fish assemblages<br />
Examine fish habitat<br />
utilization patterns and MPA<br />
effectiveness statewide<br />
Examine linkages of physical<br />
and biological related to<br />
nuisance algae<br />
Habitat and species status<br />
relative to recreationally fished<br />
species<br />
Long-term trends in benthic<br />
and fish<br />
Reefcheck Volunteer, community-based<br />
monitoring protocol to measure<br />
the health of coral reefs on a<br />
global scale.<br />
The Reef Environmental<br />
Education Foundation<br />
(<strong>REEF</strong>)<br />
Volunteer scuba divers and<br />
snorkelers collect information<br />
on marine fish populations<br />
Kahe Point Coral monitoring Long-term trends in coral<br />
community<br />
Reef Watchers Program Volunteers monitor and provide<br />
data on near shore and<br />
intertidal sites<br />
Kapoho Reef Watch Monitor human use, water<br />
quality, and marine biota<br />
around Waiopae tide pools<br />
USGS Study of Coral Reefs<br />
in the Pacific Ocean<br />
Mapping, monitoring, remote<br />
sensing, sediment transport<br />
studies, and collection of tide,<br />
wave, and current data from<br />
remote stations.<br />
FUNDING PARTNERS<br />
1997 HCRI, USGS, EPA UH-Manoa, NOAA, DAR,<br />
USGS<br />
1998 HCRI, DAR Washington State Univ., DAR,<br />
Oregon State, UH-Hilo<br />
1999 HCRI UH-Manoa<br />
2002 NOAA DAR, NOAA, UH-Manoa, UH-<br />
Hilo, HIMB, NPS<br />
2003 NOAA, HCRI NOAA, DAR, UH-Manoa,<br />
USGS, DOH<br />
1970s USFWS DAR<br />
1992 NOAA, DAR, USGS,<br />
Hanalei Heritage River<br />
NOAA, DAR, Hanalei Heritage<br />
River Hui, HIMB, USGS<br />
1996 NOAA, CZM, DAR Oceanwide Sci. Instit., Waikiki<br />
Aquarium, Windward C.C.,<br />
Hawaii Pacific Univ., Hanauma<br />
Bay Edu. Center, MOP<br />
2001 CZM, NFWF, PADI –<br />
Project Aware, NOAA,<br />
NMSP<br />
Maui Community College MOP,<br />
Project SEA-Link, Hawaii Coral<br />
Reef Network, DAR<br />
1973 HECO HECO, AECOS, Sea<br />
Engineering<br />
1999 HCRI, CZM/DBEDT,<br />
NFWF, NOAA, Harold<br />
Castle Foundation,<br />
HCF, TNC, CCN<br />
2003 HCF, NFWF, VHCA,<br />
Kapoho Kai Water<br />
Assoc.<br />
DAR, TNC, CCN, DOE,<br />
UH-Hilo, Washington State<br />
University and West Hawaii<br />
participating residents<br />
Cape Kumukahi Foundation,<br />
UH-Hilo, DAR, DOCARE,<br />
NOAA<br />
2000 USGS USGS, UH-Manoa, HIMB,<br />
DAR, NPS<br />
DAR Coral Reef Monitoring Benthic and fish monitoring 2003 NOAA, HCRI UH-Hilo, UH-Manoa, NPS<br />
Oahu Offshore Islets<br />
Surveys<br />
Assessment of resources at<br />
offshore islets around Oahu<br />
AECOS – AECOS Inc. Environmental Consulting Company<br />
CCN – Community Conservation Network<br />
CZM – Hawaii Coastal Zone Management<br />
DAR – Hawaii Department of Land and Natural Resources, Division of Aquatic<br />
Resources<br />
DOE – Hawaii Department of Education<br />
DOH – Hawaii Department of Health<br />
EPA – Environmental Protection Agency<br />
HCF – Hawaii Community Foundation<br />
HCRI – Hawaii Coral Reef Initiative Program<br />
HECO – Hawaii Electric Company<br />
2004 NOAA DAR, UH, NOAA, USFWS<br />
HIMB – Hawaii Institute of <strong>Marine</strong> Biology<br />
MOP – Univ. of Hawaii <strong>Marine</strong> Options Program<br />
NOAA – National Oceanic and Atmospheric Administration<br />
NFWF - National Fish and Wildlife Foundation<br />
NMSP – National <strong>Marine</strong> Sanctuary Program<br />
NPS – National Park Service<br />
PADI – Professional Association of Diving Instructors<br />
UH – University of Hawaii<br />
USFWS – U.S. Fish and Wildlife Service<br />
USGS – U.S. Geological Survey<br />
VHCA – Vacationland Hawaii Community Association<br />
Sidebar<br />
Main Hawaiian Islands<br />
page<br />
243
Main Hawaiian Islands<br />
page<br />
244<br />
The State of Coral Reef Ecosystems of the Main Hawaiian Islands<br />
Figure 9.22. Monitoring locations in the MHI. Map: A. Shapiro.<br />
The monitoring programs presented in Figure 9.22 represent the major programs with the greatest spatial and<br />
temporal coverage in the MHI. In addition, there have been numerous studies and monitoring programs of<br />
short duration or limited spatial scope that extend back nearly 100 years.<br />
The DAR has been collecting data on fish and habitat at all of the state’s MLCDs since the 1970s. This is<br />
the longest running extant monitoring program in Hawaii and occurs on all major islands. The Hawaii Coral<br />
Reef Assessment and Monitoring Program (CRAMP) examines spatial and temporal changes at sites on<br />
Oahu, Kauai, Maui, Hawaii, Molokai, and Kahoolawe which encompass broad spectrum of environments and<br />
management regimes. Several monitoring sites sampled in the 1970s and 1980s were incorporated into the<br />
current CRAMP monitoring program, thus providing a 30-year time span at some locations. The West Hawaii<br />
Aquariumfish Project (WHAP) was established to monitor aquariumfish along the west Hawaii coastline. This<br />
program covers a broad spatial scale (~150 km) and includes a robust sampling design that evaluates various<br />
levels of fisheries management. The National Oceanic and Atmospheric Administration’s (NOAA) Center for<br />
Coastal Monitoring and Assessment - Biogeography Team (CCMA-BT) has developed digital benthic habitat<br />
maps for much of the MHI. Using these maps, CCMA-BT has been conducting an extensive evaluation of<br />
Hawaii’s MLCDs and adjacent areas in cooperation with DAR and the University of Hawaii.
WATER QUALITY<br />
The State of Coral Reef Ecosystems of the Main Hawaiian Islands<br />
There are no statewide comprehensive water quality monitoring programs assessing sediment or chemical<br />
impacts to coral reef areas in Hawaii. Water quality at beaches is monitored for bacteria that indicate a risk<br />
to human health. Pollutant concentrations normally decrease sharply with distance from shore, and offshore<br />
water quality in Hawaii is generally good.<br />
Hawaii’s Department of Health (DOH) regularly monitors indicator bacteria (Enterococcus) at swimming<br />
beaches. In recent years, DOH has also collected data on turbidity, nutrients, and chlorophyll a at specified<br />
shoreline stations (knee-deep water) and in perennial streams. DOH uses these data, and other available<br />
data that meet specific quality criteria, to identify streams and coastal segments that are “water quality impaired”<br />
(i.e., where state water quality criteria (Hawaii Administrative Rules, Title 11, Chapter 54; http://www.<br />
hawaii.gov/health/about/rules/admrules.html, Accessed 1/19/05) are regularly exceeded. A list of impaired<br />
waters is reported to the U.S. Environmental Protection Agency (EPA) every two years, as required by the<br />
Federal Clean Water Act (33 USC § 1251 et seq.) Section 303(d). Although the listings are a function of available<br />
data rather than the result of a comprehensive statewide sampling design, it is not surprising that the<br />
number of listed waters corresponds, roughly, with island population size (Table 9.6).<br />
The impaired coastal waters are primarily harbors, semi-enclosed bays, and protected shorelines, where<br />
mixing is reduced and resident time of pollutants is long when compared with exposed coasts. Several bays<br />
that have coral reefs, such as Kaneohe Bay and Pearl Harbor (Oahu), Nawiliwili Bay (Kauai), and Hilo Bay<br />
(Hawaii), are included on the list. Because offshore water quality is generally good and few data sets are<br />
available to characterize water quality around reefs, deeper and offshore waters where coral reefs occur are<br />
generally not included on the list. The most widely distributed coastal pollutants are nutrients, sediments, and<br />
Enterococcus (Table 9.6).<br />
Table 9.6. Number of waterbodies by island where ambient pollutant concentrations regularly exceed State water quality criteria.<br />
ND = No Data.<br />
POLLUTANTS HAWAII KAUAI MAUI MOLOKAI OAHU<br />
Sediments 14 7 41 2 45<br />
Enterococcus 8 9 3 ND 23<br />
Nutrients 4 5 11 1 54<br />
Chlorophyll a 8 2 22 ND 34<br />
Toxics: Metals, pesticides, PCBs ND ND ND ND 3<br />
Total Coastal Stations Listed 20 16 41 2 61<br />
Population Size 148,677 876,156 58,463 128,241 7,404<br />
A source of information on offshore water quality is the multitude of ongoing water quality monitoring programs<br />
associated with permit requirements for specific activities (Table 9.7). These include the assessment of<br />
point source discharges, such as sewage outfalls and cooling water discharges, required for NDPES permits.<br />
Results for NPDES permit monitoring are submitted to the DOH. Nonpoint source inputs from land-based<br />
sources, such as resorts and golf courses, are monitored through a variety of state and local permit requirements.<br />
Data generally include constituents listed in the State of Hawaii Water Quality Standards: dissolved<br />
- - + 3- inorganic nutrients (nitrate + nitrite [NO + NO2 ]), ammonium [NH4 ], orthophosphate [PO4 ], and silica [Si]),<br />
3<br />
chlorophyll a, salinity, turbidity, pH, temperature, and dissolved oxygen. In total, approximately 3,000 ocean<br />
water samples are analyzed annually by private entities as required by permit conditions. These permit-related<br />
data have not been synthesized by island or region into a comprehensive database or report.<br />
Sidebar<br />
Main Hawaiian Islands<br />
page<br />
245
Main Hawaiian Islands<br />
page<br />
246<br />
The State of Coral Reef Ecosystems of the Main Hawaiian Islands<br />
Table 9.7. Long-term water quality monitoring programs in the main Hawaiian Islands.<br />
ISLAND LOCATION PROJECT PERMIT<br />
REQUIREMENT<br />
DURATION FREQUENCY SAMPLES<br />
PER SURVEY<br />
Kauai Port Allen Kauai Island Utilities Coop NPDES 1990- Quarterly 50<br />
Kekaha Agribusiness Devel. Corp. NPDES 2000- Bi-Annual 15<br />
Kekaha Ceatech USA NPDES 1998- Quarterly 27<br />
Oahu Sandy Beach East Honolulu WWTP NPDES 1965- Semi-Monthly 18<br />
Ewa Ocean Pointe DLNR 1990- Quarterly 60<br />
Barbers Point Chevron USA NPDES 1985- Quarterly 20<br />
Ewa Cates International NPDES 2000- Quarterly 21<br />
Lanai Hulopoe Bay Castle & Cooke Maui Co. LUC 1989- Quarterly 21<br />
Maui Honolua Kapalua Land Co. None 1990 Annual 32<br />
Honokohua Kapalua Land Co. None 2001 Annual 32<br />
Napili Kapalua Land Co. None 2001 Annual 16<br />
Kaanapali North Beach Maui Co.<br />
Makena Makena Resort LUC, DOH 1990 Bi-Annual 50<br />
Hawaii Keahole Point NELHA DOH, Hawaii Co. 1987- Quarterly 72<br />
Hilo Bay Hilo WWTP NPDES 1985- Monthly 18<br />
Hamakua Papaiko WWTP NPDES 1985 Semi-Annual 6<br />
Hamakua Kulaimano NPDES 1985 Semi-Annual 5<br />
Hokulia Oceanside 250 DOH, Hawaii Co. 1989- Quarterly 47<br />
Kukio Kukio Resorts DOH, Hawaii Co. 1989- Quarterly 37<br />
Maniniowali Kukio Resorts DOH, Hawaii Co. 2000- Quarterly 21<br />
Waikoloa Waikoloa Land Co. DOH, Hawaii Co. 1987- Quarterly 26<br />
NPDES – National Pollutant Discharge Elimination System<br />
DLNR – Department of Land and Natural Resources<br />
LUC – Land Use Commission<br />
DOH – Department of Health
BENTHIC HABITATS<br />
The State of Coral Reef Ecosystems of the Main Hawaiian Islands<br />
CCMA-BT Benthic Habitat Mapping<br />
The CCMA-BT initiated a nearshore benthic habitat mapping program for the MHI in 2000. A NOAA Citation<br />
jet collected aerial photographs and hyperspectral imagery which was used to delineate habitat polygons in a<br />
geographic information system (GIS). Habitat polygons were defined and described according to a hierarchical<br />
habitat classification system consisting of 27 discreet habitat types. The project, which was completed in<br />
2003, mapped 774 km 2 of nearshore habitat in the islands and produced a series of 87 maps that are currently<br />
being distributed via a print atlas, a CD-ROM, and on-line at http://biogeo.nos.noaa.gov/products/hawaii_atlas,<br />
Accessed 02/28/05. The benthic habitat maps are depicted in Figure 9.23.<br />
Hawaii Coral Reef Assessment and Monitoring Program<br />
The CRAMP was established in 1998 and produced a comprehensive description of the spatial differences<br />
and the temporal changes in coral reef communities in the MHI. Spatial information described the major<br />
ecological factors controlling the status of reef coral communities in the MHI. Temporal trends documented<br />
patterns of reef decline, recovery, and stability.<br />
Methods<br />
The CRAMP monitoring sites were selected to give a cross-section of locations that differed in perceived<br />
environmental degradation, level of management protection, quantity of previous data, and extent of wave<br />
exposure. Two reef areas, a shallow (generally 3 m) and a deep (generally 10 m) station, were surveyed at<br />
each of the 30 statewide sites at least twice since 1999. Digital video transects, fixed photoquadrats, visual<br />
belt fish transects (Brock, 1954), substrate rugosity, sediment samples and additional qualitative data were<br />
collected at various times over the study period. Detailed methods and data analysis are described in Brown<br />
et al. (2004) and Jokiel et al. (2004). Total mean percent coral cover by station, mean percent coral cover<br />
by species within a station, and species richness and diversity (Shannon-Weiner Index) were documented.<br />
The monitoring site data were supplemented in the spatial dimension using a rapid assessment technique<br />
(RAT). The RAT is an abbreviated version of the CRAMP monitoring protocol, using a single 10 m transect<br />
to describe benthic cover, rugosity, and sediments. The RAT, however, is not designed to produce the type<br />
of data needed to detect temporal change. Other data sources included U.S. Navy WAM models (for wave<br />
direction and height) and the State of Hawaii GIS database (for data on population demographics, watershed<br />
characteristics, and precipitation levels).<br />
Results and Discussion<br />
Average coral coverage for all 152 reef stations (CRAMP plus RAT) combined was 20.8% ± 1.7 standard error<br />
(SE), with six species accounting for most of the coverage (20.3%). The six dominant species were: Porites<br />
lobata (6.1%), Porites compressa (4.5%), Montipora capitata (3.9%), Montipora patula (2.7%), Pocillopora<br />
meandrina (2.4%), and Montipora flabellata (0.7%).<br />
Spatial patterns:<br />
The spatial data set (CRAMP plus RAT) revealed that various biological parameters (i.e., coral cover, coral<br />
species richness, and coral diversity) showed a significant relationship with physical factors such as the geologic<br />
age of the islands, mean wave height, mean wave direction, rugosity, sediment composition, and rainfall.<br />
These observations are consistent with and amplify the findings of previous studies:<br />
• Geologic age is a major factor influencing reef coral community structure. The Hawaiian Islands formed over<br />
a hot spot located near the southeast end of the archipelago and have gradually moved to the northwest on<br />
the Pacific plate over millions of years. The islands are thus moving to higher latitude over time so there is a<br />
high correlation (r=0.95) between island age and latitude. Light and temperature conditions favorable to coral<br />
growth diminish with increasing latitude and increasing island age. Grigg (1983) previously demonstrated this<br />
trend over the range from the island of Hawaii (19 ° N) to Kure Atoll (28.5 ° N). The present study was conducted<br />
over a smaller latitudinal range (19 ° N to 22 ° N), but with a much more extensive sample size and validated<br />
these observations.<br />
• Sites exposed to the larger west and northwest swells on the older islands (e.g., Kauai and Oahu) generally<br />
Sidebar<br />
Main Hawaiian Islands<br />
page<br />
247
Main Hawaiian Islands<br />
page<br />
248<br />
The State of Coral Reef Ecosystems of the Main Hawaiian Islands<br />
Figure 9.23 Nearshore benthic habitat maps were developed in 2003 by CCMA-BT based on visual interpretation of aerial photography<br />
and hyperspectral imagery. For more info, see: http://biogeo.nos.noaa.gov. Map: A. Shapiro.
The State of Coral Reef Ecosystems of the Main Hawaiian Islands<br />
had lower coral coverage, species richness, and diversity. Mean wave direction (expressed as compass bearing)<br />
showed a negative relationship with coral cover, species richness, and diversity. This is because major<br />
storm surf in Hawaii arrives along a gradient that roughly diminishes in a counter clockwise direction from the<br />
north (Moberly and Chamberlain, 1964). The largest and most frequent storm surf arrives during the winter<br />
from the north Pacific swell (bearing 315o ) with the less frequent and less damaging storm waves during the<br />
summer from the south swell (bearing 190o ) and trade wind swell (bearing 45o ). Storlazzi et al. (2003) showed<br />
that waves in Hawaii can reach destructive levels that will damage corals and restrict species distribution patterns.<br />
• Rugosity measurements showed that areas of antecedent high rugosity allow corals to attach and grow on<br />
higher substrata not influenced by sand and sediment movement along the bottom. Rogers et al. (1984) found<br />
that coral larvae preferentially recruited to vertical surfaces and suggested that this pattern also applied to<br />
areas of higher rugosity. As coral reef communities develop, the structure and continued accretion of the coral<br />
skeletons further increase rugosity. Thus both physical and biological components are involved in development<br />
of high rugosity environments.<br />
• Sediment components played a role in explaining variation in the coral assemblage characteristics. Percent<br />
organics, an indicator of terrigenous input, showed negative relationships with coral species richness and<br />
diversity. Higher percent organic content was also important in explaining decline in coral cover over time.<br />
Other studies have determined that increased terrigenous input has an adverse impact on reef communities<br />
(e.g., Acevedo and Morelock, 1988). Continuing work by the USGS in Hawaii is helping to define the influence<br />
of sediment on reef development.<br />
• Higher levels of rainfall in a watershed corresponded to lower levels of coral cover on adjacent reefs. Jokiel<br />
et al. (1993) described the negative impacts of low salinity water on coral reef assemblages in Kaneohe Bay,<br />
Oahu.<br />
Temporal trends:<br />
• Coral cover at most stations changed less than 10% (absolute) over the three-year period. A total of 29 of<br />
60 stations experienced a statistically significant change in coral cover from the initial baseline survey to the<br />
last survey conducted (Figure 9.24). Sixteen stations showed a significant decline in coral cover, with the<br />
greatest drop of 19% occurring at the Kamalo 3-m station on Molokai. In contrast, 13 stations increased in<br />
coral cover, with the greatest increase of 14% at the Papaula Point 4-m station on Maui. One problematical<br />
site (2-m station at Kaalaea, Oahu), showed high fluctuations between samplings. This appeared to be due<br />
to several slumping events involving large sections of reef which moved the marking pins and blocks of live<br />
coral between the pins.<br />
• Patterns of change in coral cover observed in the CRAMP investigation are consistent with observations of<br />
other studies in Hawaii. For example, coral coverage declined at monitoring sites in Kaneohe Bay in the past<br />
three years, which continues a trend documented during the previous 20 years (Hunter and Evans, 1995).<br />
• The downward trend on Hawaiian coral reefs as measured in this study appears to be most prevalent in the<br />
central portion of the archipelago on the islands of Oahu, Molokai, and Maui (Figure 9.25). Most of the human<br />
population of Hawaii resides on Oahu (72%) and Maui (10%). Molokai has a lower human population, but<br />
suffers from extreme erosion and sedimentation of reefs along the south shore due to inadequate watershed<br />
management (Roberts, 2000). Maui also suffers from impaired watersheds and population centers that are<br />
adjacent to major reef areas (West Maui Watershed Management Advisory Committee, 1997). The islands of<br />
Kauai and Hawaii have relatively low human population and show an increase in coral reef coverage. At Kahoolawe,<br />
a former military target island, the condition of sediment-impacted reefs have held steady following<br />
the removal of all grazing animals, cessation of bombing, and a massive program of revegetation.<br />
• Temporal trends should be interpreted with caution over the relatively short time span of the study. This study<br />
did identify six reefs (10% of the total) that had major shifts in absolute coral cover (>10%), warranting further<br />
experimental investigation and more detailed observations in the future.<br />
Environmental variables that explained changes in coral cover included rugosity, mean wave height, and watershed<br />
area (Jokiel et al., 2004).<br />
Sidebar<br />
Main Hawaiian Islands<br />
page<br />
249
Main Hawaiian Islands<br />
page<br />
250<br />
The State of Coral Reef Ecosystems of the Main Hawaiian Islands<br />
Figure 9.24. Results of CRAMP monitoring efforts since 1999 show trends in coral cover at sites across the state. Shallow sites (3<br />
m) are shown in light pink and deeper sites (8 m) are shown in dark pink. Source: Jokiel et al., 2004.<br />
• Stations with higher rugosity or more topographical complexity experienced greater declines in coral cover.<br />
• In contrast, stations exposed to higher mean wave height or situated adjacent to larger watersheds had significant<br />
increases in coral cover.<br />
Turgeon et al. (2002) reported “the consensus of many ecologists is that, with a few exceptions, the health<br />
Figure 9.25. Trends in coral cover between 1999-2002 at CRAMP sites show a decline<br />
for the islands of Oahu, Molokai, and Maui. Source: Jokiel et al., 2004.<br />
of the near-shore reefs around the<br />
MHI remains relatively good.” On<br />
the other hand, some researchers,<br />
local fishers and recreational divers<br />
with long-term experience observe<br />
that reefs in many areas of Hawaii<br />
have declined over past decades.<br />
For example, Jokiel and Cox (1996)<br />
have noted degradation of Hawaiian<br />
reefs due to human population<br />
growth, urbanization, and coastal<br />
development. Absence of the catastrophic<br />
short-term reef declines that<br />
have been noted in other geographic<br />
areas (e.g., Hughes, 1994) can lead<br />
to the impression that Hawaiian reefs<br />
are in good condition. Slow rates of<br />
decline, however, will eventually result<br />
in severely degraded reefs. The<br />
spatial patterns and temporal change
The State of Coral Reef Ecosystems of the Main Hawaiian Islands<br />
of coral reef community structure in relation to human population that were observed in this study suggest<br />
that the rapidly growing human population of Hawaii may be having a negative effect on the reefs. Long-term<br />
monitoring will be required to differentiate the observed short-term declines in coral cover from natural oscillations<br />
(Done, 1992) in Hawaiian reef community structure (Hughes and Connell, 1999).<br />
Long-Term Monitoring at Selected Sites<br />
Selected sites throughout Hawaii have been monitored over a longer time period (>10 years) and were incorporated<br />
into CRAMP to extend the historical perspective including one site on Kauai, five on Oahu, and two on<br />
Maui (Table 9.8). Puako, Hawaii, which is not part of CRAMP, is included because it has also been surveyed<br />
for over 10 years. Coral cover at several stations within each site has been surveyed sporadically over the<br />
years (Table 9.8). Different methods have been used but studies that have compared methods produced similar<br />
results (e.g., Brown, 2004). For comparative purposes, only transects or quadrats that sampled the same<br />
spatial habitat as CRAMP were utilized.<br />
The selected sites may not be representative of wave exposed reefs around Hawaii because six of the nine<br />
sites (12 of 15 stations) are located in protected embayments. Sites such as Hanauma Bay, Honolua Bay,<br />
and Olowalu, however, are high human use areas and changes at these reefs have important management<br />
implications. In addition, long-term data sets on coral cover are uncommon and provide benchmarks for future<br />
comparisons. Temporal results for all of the sites are listed in Table 9.8.<br />
Table 9.8. Average percent coral cover at selected sites that have been surveyed at time periods spanning 10 or more years. Overall<br />
percent change (∆) from the initial survey to the last survey is shown in the last column. Data sources for each station are listed below.<br />
* indicates locations within Kaneohe Bay.<br />
ISLAND SITE STATION 70 71 72 73 74 75 76 77 78 79 80 81 82 83 84 85 86 87 88 89 90 91 92 93 94 95 96 97 98 99 00 01 02 03 ∆<br />
Kauai Hanalei 3m<br />
Bay<br />
1,2 15 16 26 17 17 2<br />
8m1,2 20 28 30 26 36 16<br />
Oahu Kahe<br />
Point<br />
3m2,3 19 19 15 16 16 18 22 20 18 17 12 10 5 5 4 5 9 7 12 13 15 15 -4<br />
Pili o<br />
Kahe<br />
3m2,3 19 12 10 10 9 8 10 11 12 18 17 16 14 11 9 8 8 7 9 7 10 11 -8<br />
Kaalaea*<br />
2m2,4,5 8m<br />
92 82 79 62 51 49 67 59 -33<br />
2,4,5 7 11 9 3 2 4 3 3 -4<br />
Heeia*<br />
2m2,4,5 8m<br />
33 64 62 36 23 18 24 22 -11<br />
2,4,5 1 15 2 8 7 7 5 7 6<br />
Moku o 2m<br />
Loe*<br />
2,4,5 6 45 21 30 20 16 13 14 9<br />
9m2,4,5 0 4 3 8 7 6 4 9 9<br />
Hanauma 3m<br />
Bay<br />
2,6,7 28 47 28 28 28 33 24 26 22 -6<br />
10m2,6,7 38 40 36 33 32 25 27 27 22 -15<br />
Maui<br />
Honolua<br />
North 3m<br />
2,7,8,9,10,11 39 23 51 56 41 35 28 28 24 15 17 15 14 -25<br />
Bay South 3m<br />
2,7,8,9,10,11 43 36 42 42 38 33 28 21 27 23 24 -19<br />
Olowalu<br />
3m2,10,12 8m<br />
31 32 30 23 30 30 23 25 22 23 -8<br />
2,10,12 55 56 47 57 51 55 54 53 51 -4<br />
Hawaii<br />
Puako<br />
3m7,13 10m<br />
66 42 42 43 47 58 60 -5<br />
7,13 63 46 41 43 44 59 45 -18<br />
DATA SOURCES<br />
1 Friedlander et al., 1997 8 Environmental Consultants, 1974<br />
2 Jokiel et al., 2004<br />
9 Torricer et al., 1979<br />
3 Coles, 1998<br />
10 Brown, 1999<br />
4 Maragos, 1972<br />
11 Dollar and Grigg, 2004<br />
5 Hunter and Evans, 1995 12 Ambrose et al., 1988<br />
6 Anderson, 1978<br />
13 Hayes et al., 1982<br />
7 Hunter, 1999<br />
Sidebar<br />
Main Hawaiian Islands<br />
page<br />
251
Main Hawaiian Islands<br />
page<br />
252<br />
The State of Coral Reef Ecosystems of the Main Hawaiian Islands<br />
Statewide Trends<br />
Hanalei Bay, Kauai<br />
Total coral cover at the 3-m station appears to be holding steady while total coral cover at the 8-m station has<br />
increased nearly 17% (84% relative increase).<br />
Kahe Point and Pili o Kahe, Oahu<br />
Both stations appear to be undergoing 12-13 year oscillations in total coral cover. The temporal patterns, however,<br />
do not coincide. Pili o Kahe reached a low point in coral cover in 1986 (8% ± 1% SE) and 1998 (7% ± 2%<br />
SE). In contrast, coral cover at Kahe Point declined in 1983 to 15% ± 2% SE and to 4% ± 1% SE in 1995.<br />
Kaalaea, Kaneohe Bay, Oahu<br />
The Kaalaea 2-m station has experienced a decline in total coral cover of 34% (36% relative decrease). Total<br />
coral cover at the 8-m station was higher in 1983 (7%) compared to 1971 (11%-68% relative increase), but<br />
then decreased to 3% (72% relative decrease) by 2003. Much of the decrease in coral cover was attributed<br />
to slumping of the reef slope (Jokiel et al., 2004).<br />
Heeia, Kaneohe Bay, Oahu<br />
The Heeia 2-m station followed a similar pattern to the Kaalaea 8-m station with higher total coral cover in<br />
1983 (64%) compared to 1971 (33%-93% relative increase). By 2003, coral cover declined to 22% (66% relative<br />
decrease). The percent cover at the 8-m station appears to have increased since 1971, but has fluctuated<br />
in the interim.<br />
Moku o Loe, Kaneohe Bay, Oahu<br />
At Moku o Loe, coral cover increased in 1983 at the 2-m station by 39% (680% relative increase), but subsequently<br />
declined to 14% in 2003 (68% relative decrease). In comparison, coral cover at the 9-m station has<br />
slowly increased from 0% to almost 9% since 1971.<br />
Hanauma Bay, Oahu<br />
The Hanauma Bay 3-m station experienced an 18% increase (65% relative increase) in coral cover from 1976<br />
to 1992. Subsequently, coral cover steadily declined to 22% (25% absolute decline, 53% relative) by 2002.<br />
The Hanauma Bay 10-m station had similar total coral cover values in 1976 (38%) and 1992 (40%), and then<br />
declined to 22% (18% absolute, 45% relative decrease) by 2002.<br />
Honolua Bay, Maui<br />
The 3-m stations on the north and south reefs appeared to be relatively stable from 1974 until 1994. From<br />
1994 to 1998, coral cover declined from 41% to 14% (66% relative decrease) at the north station and from<br />
43% to 24% (44% relative decrease) at the south station. Since 1999, coral cover has stabilized at both stations.<br />
Olowalu, Maui<br />
The Olowalu 3-m station showed a gradual decline in coral cover of 8% (26% relative decrease) since 1998.<br />
In contrast, the Olowalu 8-m station has remained relatively stable from 1994 to 2002, with total coral cover<br />
between 51-55%.<br />
Puako, Hawaii<br />
Total coral cover appears to be increasing at the Puako 3-m station (18% absolute increase, 43% relative increase)<br />
to 1982 levels, after an initial drop of 23% (36% relative decline) from 1982 to 1991. In comparison,<br />
total coral cover at the 10-m station was 63% in 1982 and only 46% in 1991. This was a 17% decline (27%<br />
relative decline) that increased to 58% (12% absolute increase, 27% relative increase) in 1997 and subsequently<br />
decreased to 45% in 1998. The increase in coral cover at the 10-m stations was mirrored at the 3-m<br />
station until 1998 when trends diverged at the two stations.<br />
Summary<br />
The long-term trends at the selected sites show that the majority of the stations (13 out of 18) have declined<br />
since the first survey. Several of these stations (e.g., Kahe Point 3-m station) have experienced minor decreases<br />
in coral cover that can be explained by measurement error and therefore are not ecologically relevant.<br />
Explanations for the major declines (>10%) include reef slumping (e.g., Kaalaea; Jokiel et al., 2004)
The State of Coral Reef Ecosystems of the Main Hawaiian Islands<br />
and sedimentation (e.g., Honolua Bay; Dollar and Grigg, 2004). Dollar and Grigg (2004) have suggested that<br />
embayments with restricted circulation, such as many of the sites previously listed, are more susceptible to<br />
anthropogenic stresses. Intermittent sampling, however, confounds most of the monitoring studies. As shown<br />
in the Kahe data, oscillations in coral cover may be occurring that are not detected from the sporadic sampling<br />
at the other stations. Therefore, inferring that the selected sites are in fact declining should be interpreted with<br />
caution. At present, however, these data sets are the best indicators of long-term trends in Hawaiian coral<br />
reefs.<br />
ASSOCIATED BIOLOGICAL COMMUNITIES<br />
West Hawaii Aquariumfish Project<br />
In response to longstanding concern and controversy over marine aquarium collecting in West Hawaii, the<br />
nineteenth Hawaiian legislature passed Act 306 in 1998 which established the West Hawaii Regional Fisheries<br />
Management Area in the nearshore waters from Upolu Point (North Kohala) to Ka Lae (Kau). One of the<br />
primary goals of the legislation was to improve management of fish resources by designating a minimum of<br />
30% of the West Hawaii coastline as FRAs where aquarium fish collecting was prohibited.<br />
Methods<br />
Study sites were established in early 1999 in six existing reference areas, eight open areas adjacent to FRAs,<br />
and all nine FRAs. Using stainless-steel bolts cemented into the bottom, four permanent 25-m transects were<br />
established in a H-shaped pattern at each of the study sites.<br />
Fish densities were estimated by a pair of divers who conducted visual surveys along each transect. Divers<br />
swam side by side and surveyed a column 2 m wide (4 m total width). On the outward-bound leg, larger planktivores<br />
and wide-ranging fishes were recorded. On the return leg, fishes closely associated with the bottom,<br />
new recruits, and fishes hiding in cracks and crevices were recorded.<br />
Power analysis of preliminary fish transect data indicated that the observational design would detect 10–160%<br />
changes in the abundance of the principal targeted aquarium fishes in West Hawaii during the first year using<br />
reasonable error rates (α=β=0.10).<br />
Results and Discussion<br />
Over the course of the four years of<br />
the WHAP study, overall aquarium<br />
fish abundance (top 10 species) has<br />
been increasing (linear regression,<br />
p
Main Hawaiian Islands<br />
page<br />
254<br />
The State of Coral Reef Ecosystems of the Main Hawaiian Islands<br />
Figure 9.27. Comparison of yellow tang (Zebrasoma flavescens) abundance in preclosure<br />
(1999) and post-closure years (2000-2003). Percentages are two sample<br />
comparisons between 1999 and 2003 (*values are significant using a two sample<br />
t-test at α=0.05). Source: Tissot et al., 2004; WHAP, unpublished data.<br />
Figure 9.28. Density of Zebrasoma flavescens young-of-year at all study sites during<br />
1999-2003. Source: Tissot et al., 2004; WHAP, unpublished data.<br />
duction due to collectors prior to FRA<br />
closure, suggesting that as a group,<br />
these fishes may have increased to<br />
their pre-exploitation levels (Tissot et<br />
al., 2004). Yellow tangs (Zebrasoma<br />
flavescens) increased in density by<br />
86% within FRAs between 1999 and<br />
2003, or about 12.2 fish/100 m 2 (Figure<br />
9.27). The yellow tang is by far<br />
the most heavily collected fish in West<br />
Hawaii, accounting for 79% of the total<br />
catch. The recovery of yellow tang<br />
populations was undoubtedly related<br />
to the high number of newly recruited<br />
fishes observed in 2001-2002 (Figure<br />
9.28). Large recruitment events are<br />
uncommon in West Hawaii but are<br />
likely to be an important factor determining<br />
the effectiveness of MPAs to<br />
help replenish depleted fish populations.<br />
There were no significant changes<br />
among non-collected species within<br />
FRAs or in aquarium and non-aquarium<br />
species in areas outside of FRAs.<br />
Furthermore, no aquarium fishes declined<br />
in abundance in open areas as<br />
might be expected if the intensity of<br />
harvesting increased outside of the<br />
FRAs.<br />
Although specific FRAs varied in their<br />
degree of effectiveness, the overall<br />
results demonstrate that MPAs can<br />
promote recovery of fish stocks depleted<br />
by fishing pressures in Hawaii,<br />
at least in heavily exploited species,<br />
without significant declines outside<br />
of MPAs. Overall, FRAs have successfully<br />
reduced conflicts between<br />
collectors and other resource users,<br />
promoted a sustainable fishery, and<br />
enhanced aquarium fish populations.<br />
The success of the FRAs in West Hawaii<br />
is likely to increase as aquarium<br />
fishes grow and mature within these<br />
MPAs and further replenish nearshore<br />
reefs.
The State of Coral Reef Ecosystems of the Main Hawaiian Islands<br />
Hanalei Bay <strong>Marine</strong> Communities Investigation<br />
In 1992, the DAR’s MHI <strong>Marine</strong> Resource Investigation Program identified Hanalei Bay, Kauai as one of five<br />
key sites upon which to focus extensive field research programs. This Program provides a broad base for<br />
understanding the state’s living marine systems and is directed towards more effective management (Friedlander<br />
and Parrish, 1998a; Friedlander, unpublished data). Hanalei Bay is one of the largest embayments on<br />
the island of Kauai and serves as a major recreational area for residents of many north shore communities and<br />
neighboring areas. The recent designation of the Hanalei River as an American Heritage River has increased<br />
the community’s awareness and involvement in protecting its marine environment.<br />
Methods<br />
Abundance of fishes on hard substratum was assessed using standard underwater visual belt transect survey<br />
methods. Twenty-two transects (25 m x 5 m) were permanently established in a wide variety of habitats<br />
throughout the bay to assess fish and associated benthic communities (Friedlander and Parrish, 1998a, b).<br />
Retrospective analysis of Hanalei data<br />
Monthly visual fish censuses of transects<br />
from December 1992 to November<br />
1994 showed that surf height<br />
and degree of wave exposure were<br />
negatively correlated with several<br />
measures of assemblage organization<br />
(Friedlander and Parrish, 1998a).<br />
Most measures of fish assemblage<br />
structure were lower during the winter<br />
months when large north Pacific swells<br />
and heavy rainfall, coupled with high<br />
river discharge, impacted the bay.<br />
Fish censuses were conducted at<br />
20 of the 22 permanent sites in June<br />
1999, September 2003, and June<br />
2004. Species richness, biomass,<br />
and diversity have all either increased<br />
or were constant during this time period<br />
(Figure 9.29).<br />
Three introduced fish species<br />
(bluestripe snapper, blacktail snapper,<br />
and peacock grouper) have become<br />
well established in Hanalei Bay<br />
(Friedlander et al., 2002b) and their<br />
contribution to total fish biomass has<br />
increased from 15% in 1993 to as<br />
high as 39% in 1999 (Figure 9.30).<br />
The bluestripe snapper is the most<br />
important, currently accounting for<br />
23% of total fish biomass in the bay.<br />
The blacktail snapper appeared in<br />
large numbers in 1999 but was not<br />
observed in high abundance in 2003<br />
or 2004. A large rain event just prior<br />
to the 1999 sample date may have<br />
caused blacktail snappers to move<br />
out onto the reef temporally. The pea-<br />
Figure 9.29. Mean fish species richness (upper panel), mean fish biomass (middle<br />
panel), and mean fish diversity (lower panel) in Hanalei Bay, Kauai. Note natural log<br />
scale for graph of mean fish biomass (middle panel). Source: Friedlander and Parrish,<br />
1998a; Friedlander, unpublished data.<br />
Sidebar<br />
Main Hawaiian Islands<br />
page<br />
255
Main Hawaiian Islands<br />
page<br />
256<br />
The State of Coral Reef Ecosystems of the Main Hawaiian Islands<br />
cock grouper has steadily increased<br />
in importance from less than 1% of<br />
fish biomass in 1993 to nearly 7% in<br />
2004. Increases in total fish biomass<br />
since the early 1990s cannot be attributed<br />
solely to introduced species,<br />
as other elements of the fish assemblage<br />
have also increased over this<br />
time period. Reduced fishing pressure<br />
has been cited as one potential<br />
reason for these trends.<br />
Figure 9.30. Percent contribution of introduced species, peacock grouper (Cephalopholis<br />
argus), bluestripe snapper (Lutjanus kasmira), and blacktail snapper (L. fulvus),<br />
to total fish biomass in Hanalei Bay, Kauai. Source: Friedlander and Parrish,<br />
1998a; Friedlander, unpublished data.<br />
Waikiki-Diamondhead FMA – Results of a rotational closure<br />
Unique among Hawaiian marine managed areas, a rotational closure strategy has been applied in the Waikiki<br />
Diamond Head Fishery Management Area (FMA). Created in 1978, the FMA initially operated on a four-year<br />
cycle: two years of closure followed by two years in which fishing was permitted. In 1988, a portion of the FMA<br />
was converted to a permanently closed area by becoming the Waikiki MLCD, and the rotational cycle in the<br />
remaining area was changed to one year open followed by one year closed.<br />
As part of the DAR’s reef monitoring program, fish populations in the FMA, including the ‘Kapahulu’ portion<br />
of the FMA which subsequently became the MLCD, have been monitored since 1978. Overall trends in biomass<br />
of fishery-target species in the FMA and MLCD are displayed in Figure 31. Within the FMA, biomass of<br />
fishery-target species has tended to increase during periods of closure, but such increases have been insufficient<br />
to compensate for declines occurring during open periods. Overall, there has been a striking decline in<br />
biomass of fishery-target species in the FMA from 40-50 g per m 2 in the early years after its creation to around<br />
10 g per m 2 in recent years (Figure 31).<br />
Assessment of the effects of fishing and closure on the FMA and the adjacent fully-closed MLCD has been<br />
complicated by declines in habitat quality, particularly within the MLCD. Beginning in the early 1990s, habitat<br />
quality was degraded by, among other things, the gradual overgrowth of much of the reef by the alien algae,<br />
Gracilaria salicornia. However, the initial effect of full closure was a dramatic reversal of the previous downward<br />
trend in fish biomass (Figure 9.31, B); during the first three years of full closure, biomass of target species<br />
averaged nearly 40 g per m 2 more in the MCLD than in the adjacent FMA (p
The State of Coral Reef Ecosystems of the Main Hawaiian Islands<br />
Figure 9.31. Annual mean biomass and SE (g/m 2 ) of main fishery-target species in Waikiki Diamond Head FMA (upper panel) and<br />
Kapahulu/Waikiki MLCD (middle panel). Lower panel indicates mean differences between FMA and Kapahlu/MLCD over four periods:<br />
(i) 1978-1987, when both were within original boundaries of the FMA; (ii) 1988-1990, immediately after creation of the MLCD, when<br />
(A) was rotationally managed and (B) fully-closed; (iii) 1990-1995, a period of significant algal overgrowth and habitat degradation; and<br />
(iv) 1995-2002, post habitat degradation in FMA and MLCD. Closed circles represent years when fishing was prohibited, open circles<br />
represent years when fishing was permitted. Source: Williams et al., in review.<br />
Both the FMA and MLCD now largely consist of low quality coral reef habitat, with shallow areas dominated by<br />
fleshy algaes and patchy coral cover. In the absence of any long-term habitat data, it is difficult to unequivocally<br />
determine the relative impacts of fishing or protection compared to habitat declines, but significant differences<br />
between the FMA and immediately adjacent MLCD indicate that rotational closure has been much less<br />
effective than permanent closure as a means of conserving fish populations.<br />
Sidebar<br />
Main Hawaiian Islands<br />
page<br />
257
Main Hawaiian Islands<br />
page<br />
258<br />
The State of Coral Reef Ecosystems of the Main Hawaiian Islands<br />
CRAMP Management Regime Comparison Study<br />
The CRAMP sampled the fish and benthic communities at 60 locations around the MHI in 2000 (Friedlander et<br />
al., 2003). Of these 60 locations surveyed, 18 had some level of protection from fishing associated with them.<br />
No-take areas (Hanauma Bay MLCD, Honolua Bay MLCD, Molokini Crater MLCD, and Moku o Loe (Coconut<br />
Island-Hawaii <strong>Marine</strong> <strong>Laboratory</strong> Refuge)) had the highest values for most fish assemblage characteristics,<br />
followed by areas under customary stewardship (Kaho‘olawe Island Reserve and Ahihi-Kinau Natural Area<br />
Reserve). Locations under community-based management with customary stewardship harbored fish biomass<br />
that was equal to or greater than that of no-take MPAs, although light fishing pressure and the remoteness<br />
of these locations may also contribute to the high biomass observed (Figure 9.32).<br />
General linear models were used to assess the importance of various environmental parameters and fisheries<br />
management regimes on fish assemblage characteristics (Table 9.9). Locations with protected status explained<br />
significant portions of variation in species richness (p=0.001), biomass (p=0.01), and diversity (p=0.008). For<br />
each of these characteristics, locations protected from fishing (no-take and customary stewardship) had higher<br />
numbers of species, greater biomass, and higher diversity.<br />
Figure 9.32. Comparisons of fish biomass (t ha-1) under various levels of protection<br />
from fishing. Error bars are standard error of the mean. Statistical results of one-way<br />
ANOVA are shown. Levels of fishing protection with the same letter designation are<br />
not significantly different (Tukey HSD multiple comparisons test, a=0.05). Source:<br />
adapted from Friedlander et al., 2003.<br />
The variability in species richness<br />
was explained by rugosity, live lobate<br />
coral cover, and areas protected from<br />
fishing which were all significant parameters<br />
(F 8,51 =6.73, p
The State of Coral Reef Ecosystems of the Main Hawaiian Islands<br />
than areas where fishing was restricted, and similar to areas completely open to fishing. The Pupukea MLCD<br />
is a partially protected area that has recently received additional protection through the expansion of existing<br />
boundaries and the restriction of most fishing activities within the reserve. The existing data will help to serve<br />
as a baseline in determining whether these new regulations enhance the fish assemblage within the reserve<br />
over time. MPAs in the MHI with high habitat complexity, moderate wave disturbance, a high percentage of<br />
branching and/or lobate coral, coupled with legal protection from fishing pressure, had higher values for most<br />
fish assemblage characteristics.<br />
CURRENT CONSERVATION MANAGEMENT ACTIVITIES<br />
Addressing Alien Species<br />
The 2003 Hawaii legislature and Hawaii Governor Linda Lingle established the Hawaii Invasive Species Council<br />
to address gaps in Hawaii’s current invasive species prevention and response measures. Governor Lingle<br />
introduced legislation in 2004 requesting $5 million from state general funds for alien species prevention, response,<br />
research, and education. Three million dollars was appropriated by the State legislature to begin to<br />
address this problem. One of the integrated elements of this larger initiative is the focus on aquatic invasive<br />
species (AIS).<br />
In December 2003, with guidance from the Federal Aquatic Nuisance Species Task Force as well as input<br />
from representatives of state and Federal agencies, industry, non-governmental organizations, and other<br />
stakeholders, the State of Hawaii AIS Management Plan was developed to comprehensively address AIS issues<br />
throughout Hawaii. The plan focuses on marine and freshwater alien species of concern and outlines a<br />
coordinated approach to minimize the harmful ecological, economic, and human health impacts of AIS. The<br />
plan calls for the prevention and management of their introduction, expansion, and dispersal into, within, and<br />
from Hawaii. It is the first comprehensive plan for aquatic nuisance species that has been developed for a<br />
tropical marine ecosystem.<br />
Water Quality<br />
Bare soils at coastal construction sites are very vulnerable to erosion. Construction projects >1 acre are<br />
required by DOH (via NPDES permit authorization) and Hawaiian counties (via grading permits) to use best<br />
management practices to control erosion. Nevertheless, heavy rainfall at development sites on Hawaii and<br />
Kauai has resulted in significant sediment discharge to the ocean. In both cases, lawsuits and enforcement<br />
actions delayed the work and cost the developer millions of dollars in remediation, penalties, and legal fees.<br />
Stormwater runoff in major urban areas of Oahu is regulated by the City and County of Honolulu’s (CCH) NP-<br />
DES permit issued by DOH. The permit requires CCH to monitor stormwater quality and use best management<br />
practices (e.g., street cleaning, inlet maintenance) to improve water quality. The other counties are not<br />
subject to stormwater permits.<br />
Many communities are organizing integrated watershed management projects to address polluted runoff and<br />
other water concerns. These watershed projects have many parallels with traditional Hawaiian watershed<br />
management. Hawaii’s local action strategy (LAS) for addressing pollution threats to coral reefs is a multiagency<br />
partnership building upon ongoing land management efforts and coral ecosystem monitoring in three<br />
watersheds: Hanalei, Kauai; Honolua, Maui; and Kawela to Kamalo, Molokai. Pollution control projects are<br />
being implemented on land, ranging from cesspool upgrades to erosion control. At the same time, coral reef<br />
monitoring programs are being designed specifically to assess pollution impacts. To date, $1.3 million has<br />
been identified for LAS projects, which include feral animal control, fire management, technical assistance for<br />
areas transitioning from agricultural to residential use and a workshop to identify indicators of impacts to coral<br />
reefs across the Pacific.<br />
To address public health and environmental risks from untreated wastewater in cesspools, EPA has banned<br />
large-capacity cesspools serving 20 or more people per day. Construction of new large-capacity cesspools<br />
was banned on April 5, 2000 and existing ones must be upgraded or closed by April 5, <strong>2005</strong>. Approximately<br />
30,000 large-capacity cesspools in Hawaii will be affected by this ban.<br />
Sidebar<br />
Main Hawaiian Islands<br />
page<br />
259
Main Hawaiian Islands<br />
page<br />
260<br />
The State of Coral Reef Ecosystems of the Main Hawaiian Islands<br />
One outcome of current land development pressures is a movement on all of the islands to preserve open<br />
space and beaches. The counties, along with local land trusts and conservation organizations, have purchased<br />
and preserved major coastal land parcels.<br />
Addressing Overfishing<br />
The DAR has undertaken a number of measures to improve the management of fisheries resources, including<br />
changes to minimum size limits for certain resource species, initiation of marine recreational fisheries surveys,<br />
evaluation and expansion of MPAs, and changes to commercial reporting forms. Other management measures<br />
have included the use of stock enhancement based on aquaculture for a few highly prized species and<br />
artificial reefs to improve the catch of some coastal fisheries species in a few select locations. A tag-and-release<br />
program initiated by DAR has involved over 850 volunteer anglers and has increased public awareness<br />
about fish biology and conservation.<br />
DAR has begun discussions on revisions to the bag limits for certain species and has held a series of public<br />
meetings to discuss the regulation of gill nets. DAR is also considering size and harvest regulations for<br />
additional species. Additional work and revisions to the MPA program are also being proposed to enhance<br />
fisheries resources.<br />
DAR and NOAA Fisheries are leading the effort to create a three-year LAS for coral reef fisheries. The LAS<br />
incorporates stakeholder input and defines the state’s strategy for coral reef fisheries management. LAS<br />
projects include stock assessment, life cycle studies, refinement of data collection and analysis, and outreach<br />
and education. The LAS will be used as a starting point to create a coral reef fisheries management plan for<br />
Hawaii’s nearshore reefs. The goal of the LAS is to work towards the development of an integrated fishery<br />
management plan to promote sustainable harvest using an ecosystem-based approach.<br />
DLNR has been creating MPAs for over 35 years. The types of MPAs vary greatly, as do the biological and<br />
management considerations that were used to create these sites. State MPAs include:<br />
• 11 MLCDs<br />
• 18 FMAs<br />
• 18 Bottomfish Restricted Fishing Areas<br />
• Hawaii Institute of <strong>Marine</strong> Biology Research Reserve<br />
• Ahihi Kinau Natural Area Reserve<br />
• Kahoolawe Island Reserve<br />
DAR administers the state’s MLCD program, which is designed to conserve and replenish marine resources<br />
statewide (DLNR-DAR 1992; Table 9.10). DAR also manages the FMAs, Bottomfish Restricted Fishing Areas,<br />
and the Biology Research Reserve. Most of these sites were established to regulate the use of certain gear<br />
types and to limit conflicting uses. DAR initiated a regulatory review of current sites and will propose a new set<br />
of social/economic and biological criteria to manage existing sites and designate new sites through a public<br />
participation process.<br />
Assessment of Efficacy of MLCDs<br />
In order to properly assess the efficacy of existing MLCDs in Hawaii, it is necessary to: 1) map the distribution<br />
and characteristics (quality) of benthic habitats; 2) inventory and map the distribution of macroinvertebrates<br />
and fishes; and 3) define species habitat affinities in space and time. The CCMA-BT has developed digital<br />
benthic habitat maps (Figure 9.23) for most MLCDs and adjacent habitats that are being used to evaluate<br />
the efficacy of existing MLCDs, as well as develop criteria for future MLCD design (Friedlander and Brown,<br />
2003a). The integrated mapping and monitoring of coral reef ecosystems and reef fish habitat utilization patterns<br />
have been conducted to support the Federally mandated MPA and essential fish habitat (EFH) initiatives.<br />
Using GIS technologies to couple the distribution of habitats and species habitat affinities enables the<br />
elucidation of species habitat utilization patterns for assemblages of animals at a scale that is commensurate<br />
with ecosystem processes. This integrated approach is useful in quantitatively defining EFH and defining<br />
biologically relevant boundaries of MPAs.<br />
Of the six MLCDs examined to date, all have nominally higher fish biomass than similar adjacent hard bottom
MLCD HECTARES YEAR<br />
ESTAB.<br />
OAHU<br />
The State of Coral Reef Ecosystems of the Main Hawaiian Islands<br />
Table 9.10. Summary of Hawaii MLCD characteristics. Levels of human use as classified by DAR (1992). Protection from fishing<br />
based on regulations, not on enforcement of these regulations. Source: Friedlander and Brown, 2003b.<br />
USE PROTECTION<br />
FROM FISHING<br />
Hanauma Bay 41 1967 High High Complete no-take<br />
PERMITTED ACTIVITIES<br />
Pupukea 1 71 2000 High Mod Pole and line from shore (2 lines only)<br />
Harvest of limu (seaweed) up to 2 lbs.<br />
Surround net for mackerel scad (Aug/Sep)<br />
Surround net for bigeye scad (Nov/Dec)<br />
Waikiki 31 1988 High High Complete no-take<br />
HAWAII<br />
Kealakekua Bay 127 1969 High Mod Pole and line – 60% of MLCD<br />
Thrownet – 60% of MLCD<br />
Mackerel and bigeye scad – 60% of MLCD<br />
Crustaceans – 60% MLCD<br />
Wai Opae Tidepools 34 2003 High High Complete no-take<br />
No commercial activity<br />
Lapakahi 59 1979 Low Low Pole and line – 90% of MLCD<br />
Throw net – 90% of MLCD<br />
Lift net for mackerel scad– 90% of MLCD<br />
Waialea Bay 14 1985 Low Low Pole and line;<br />
Netting<br />
Old Kona Airport 88 1992 Mod Mod Throw net from shore<br />
Pole & line from shore<br />
LANAI<br />
Manele-Hulopoe<br />
MAUI<br />
125 1976 Mod Mod Hook & line (shore) – 100% of MLCD<br />
All fishing except spear, trap, and net (other<br />
than thrownet) – 50% of MLCD<br />
Molokini Shoal 31 1977 High High Trolling in 60% of MLCD<br />
Honolua-Mokuleia<br />
Bays<br />
18 1978 Mod High Complete no-take<br />
Pupukea1 – Established 1983, amended 2000<br />
habitats (Figure 9.33). The MLCDs<br />
also had higher values for most other<br />
fish assemblage characteristics (e.g.,<br />
species richness, size, diversity), illustrating<br />
the effectiveness of these<br />
closures in conserving fish populations<br />
within these management units.<br />
Habitat complexity, quality, and size<br />
were important determinates of the<br />
effectiveness of these MLCDs with<br />
respect to their associated fish assemblages.<br />
Recreational Use<br />
A LAS is being developed to address<br />
the overuse and misuse of Hawaii’s<br />
reefs by non-consumptive users.<br />
Statewide scoping meetings are soliciting<br />
input on the issues that should<br />
be addressed in the LAS. Develop-<br />
Figure 9.33. Comparison of fish biomass in MLCDs, FMAs, and areas open to fishing<br />
in the MHI. Management regimes with the same letter are not significantly different (α<br />
= 0.05). Source: adapted from Friedlander and Brown, 2003a.<br />
Sidebar<br />
Main Hawaiian Islands<br />
page<br />
261
Main Hawaiian Islands<br />
page<br />
262<br />
The State of Coral Reef Ecosystems of the Main Hawaiian Islands<br />
ment and implementation of the LAS will be overseen by a cooperative state/Federal steering committee.<br />
Additionally, DAR has undertaken a series of studies to assess the impacts of recreational use on the most<br />
heavily used sites to begin to better understand management actions needed to address these impacts.<br />
OVERALL <strong>STATE</strong>/TERRITORIAL CONCLUSIONS AND RECOMMENDATIONS<br />
Coral ecosystems in the MHI range from fair to excellent condition but are threatened by continued population<br />
growth, overfishing, urbanization, runoff, and development. Ocean outfalls, urban growth, and coastal developments<br />
(i.e., hotels, golf courses, etc.) are focal points for potential coral reef degradation. New technologies<br />
for extraction, offshore aquaculture, and bioprospecting raise concerns about the continued ability of management<br />
agencies to keep ahead of impacts to coral reef resources. There is clear evidence of overexploitation<br />
of many target food fishes and invertebrates. Key marine aquarium trade species have been heavily exploited<br />
with potential underreporting of harvest levels and insufficient enforcement, which compound problems for resource<br />
managers. Introduced aquatic alien species now threaten the structure and function of Hawaii’s reefs<br />
and may outcompete endemic species. These introductions have caused complete phase shifts on some<br />
reefs.<br />
However, significant progress has been made in mapping, monitoring, researching, and managing Hawaii’s<br />
reefs. Habitat maps of the majority of the MHI provide a baseline for understanding the most critical areas<br />
for biodiversity and fisheries productivity. Research studies are improving the understanding of land-water<br />
interactions and how various stressors affect coral reefs, as well as which land-based mitigation measures are<br />
most effective. Monitoring programs are now documenting management effectiveness and improvements in<br />
ecosystem health and function. Improved socio-economic valuations of Hawaiian reef resources are fundamental<br />
for management and in seeking compensation for detrimental land-based activities (e.g., those causing<br />
sediment runoff) and/or ocean activities (e.g., ship groundings). Much of the data needed for decision-making<br />
has been obtained in recent years. Problems still remain with marine debris, but the local community is more<br />
aware and cooperative in removing it, especially from the MHI. Over the past several years, there has been<br />
tremendous success in removing a large portion (480 metric tons) of marine debris from the NWHI. The challenges<br />
of how to control the spread of alien species and eradicate them from Hawaiian reefs are just starting<br />
to be addressed, but the awareness of this threat has grown substantially in the past few years and funding is<br />
being made available to address this threat.<br />
Studies have demonstrated that Hawaiian MPAs can effectively promote recovery of heavily exploited fish<br />
stocks without significant declines in areas outside of MPAs. FRAs along the West Hawaii coastline have<br />
successfully reduced conflicts between collectors and other resource users, promoted a sustainable fishery,<br />
and enhanced aquarium fish populations. The success of the FRAs in West Hawaii is likely to increase as<br />
aquarium fishes grow and mature within these protected areas and further replenish nearby reefs.<br />
A new outreach campaign called Hawaii’s<br />
Living Reef Program launched<br />
in 2004 is raising the public awareness<br />
of the importance of healthy<br />
coral reefs (Figure 9.34). Similar<br />
initiatives are underway to address<br />
impacts from land-based sources<br />
of pollution through Federal, state<br />
and community partnerships. The<br />
partnerships between management<br />
agencies, academia, non-governmental<br />
organizations, and user communities<br />
continue to develop, but will<br />
need ongoing financial and political<br />
support to succeed within the complex<br />
pattern of different coral reef<br />
habitats and human communities in<br />
the Hawaiian Archipelago.<br />
Figure 9.34. Hawaii’s Living Reef Program aims to raise public awareness of the<br />
importance of healthy coral reefs. As part of the campaign, educational slides like this<br />
will be shown at movie theaters around the state. Source: DAR.
REFERENCES<br />
The State of Coral Reef Ecosystems of the Main Hawaiian Islands<br />
Abbott, I. University of Hawaii, Department of Botany, Honolulu. Personal communication.<br />
Acevedo, R.J. Morelock. 1988. Effects of terrigenous sedment influx on coral reef zonation in southwestern Puerto Rico.<br />
pp. (2) 189-194. In: Proceedings of the 6th International Coral Reef Symposium.<br />
Aeby, G.S. 1992. The potential effect the ability of a coral intermediate host to regenerate has had on the evolution of its<br />
association with a marine parasite. pp. (2) 809-815. In: Proceedings of the 7th International Coral Reef Symposium.<br />
Aeby, G.S. 1998. A digenean metacercaria from the reef coral, Porites compressa, experimentally identified as Podocotyloides<br />
stenometra. Journal of Parasitology 84 (6): 1259-1261.<br />
Aeby, G.S. 2003. Corals in the genus Porites are susceptible to infection by a larval trematode. Coral Reefs 22 (3): 216.<br />
Aeby, G.S., J.C. Kenyon, J.E. Maragos and D.C. Potts. 2003. First record of mass coral bleaching in the Northwestern<br />
Hawaiian Islands. Coral Reefs 22: 256.<br />
Aila, W. Waianae, Oahu, HI Harbormaster. Personal communication.<br />
Ambrose, E., K. Takahashi, D. Regan, K. Crozier, B. Akiona, A. Lee, W. Dudley and S. Maynard. 1988. Nearshore baseline<br />
survey of Olowalu Maui, Hawaii. University of Hawaii, Honolulu. 120 pp.<br />
Anderson, B.D. 1978. Coral community structure at Hanauma Bay, Oahu, Hawaii: a model for coral reef management,<br />
Ph.D. Thesis for Heed University. 150 pp.<br />
Anthony, S.S., C.D. Hunt, A.M.D. Brasher, L.D. Miller and M. S. Tomlinson. 2004. Water quality on the Island of Oahu,<br />
Hawaii, 1999-2001. U.S. Geological Survey (USGS) Circular 1239. USGS, Reston, Va. 37 pp.<br />
Bailey-Brock, J.H. 2004. The impacts of Polydactylus sexfilis mariculture on the benthos. HOARP Phase 3. Hawaii Offshore<br />
Aquaculture Research Project. University of Hawaii at Manoa.<br />
Balazs, G. 1985. Impact of ocean debris on marine turtles: entanglement and ingestion. In: Proceedings of the Workshop<br />
on the Fate and Impact of <strong>Marine</strong> Debris 27-29 November 1984, Honolulu. U.S. Department of Commerce, NOAA Technical<br />
Memorandum NMFS-SWFC-54. 387 pp.<br />
Balazs, G.H. and S.G. Pooley (eds.). 1991. Research plan for marine turtle fibropapilloma. U.S. Dep. Commerce, NOAA<br />
Technical Memorandum NMFSSWFSC-156. 113 pp.<br />
Birkeland, C. and A.M. Friedlander. 2002. The importance of refuges for reef fish replenishment in Hawaii. The Hawaii<br />
Audubon Society. 19 pp.<br />
Branham J.M., S.A. Reed, J.H. Bailey and J. Caperon. 1971. Coral-eating sea stars Acanthaster planci in Hawaii. Science<br />
172: 155-1157.<br />
Brock, R. University of Hawaii, Honolulu. Personal communication.<br />
Brock V.E. 1954. A preliminary report on a method of estimating reef fish populations. Journal of Wildlife Management<br />
18 (3): 297-308.<br />
Brock, R.E. 1996. A study of the impact of hurricane Iniki on coral communities at selected sites in Mamala Bay, Oahu,<br />
Hawaii. Water Resources Research Center. Project Report PR-96-09.<br />
Brown, E. 1999. Earthwatch field report. Pacific Whale Foundation, Kihei, Hawaii. Volume 15.<br />
Brown, E.K. 2004. Reef coral populations: Spatial and temporal differences observed at six reefs off West Maui. Zoology,<br />
Ph.D. Thesis for the University of Hawaii. 277 pp.<br />
Brown, E., E. Cox, P. Jokiel, K. Rodgers, W. Smith, B. Tissot, S.L. Coles and J. Hultquist. 2004. Development of benthic<br />
sampling methods for the Coral Reef Assessment and Monitoring Program (CRAMP) in Hawaii. Pacific Science 58 (2):<br />
145-158<br />
Carlton, J.T. 1987. Patterns of transoceanic marine biological invasions in the Pacific Ocean. Bulletin of <strong>Marine</strong> Science<br />
41: 452-465.<br />
Sidebar<br />
Main Hawaiian Islands<br />
page<br />
263
Main Hawaiian Islands<br />
page<br />
264<br />
The State of Coral Reef Ecosystems of the Main Hawaiian Islands<br />
Cesar, H., P. van.Beukering, S. Pintz and S. Dierking. 2002. Economic valuation of the coral reefs of Hawaii. Final Report.<br />
Hawaii Coral Reef Initiative Research Program. 117 pp.<br />
Cesar, H.S.J. and P.J.H. van Beukering. 2004. Economic valuation of the coral reefs of Hawaii. Pacific Science 58(2):<br />
231-242.<br />
Cheng, T.C. and A.K. Wong. 1974. Chemical, histochemical and histopathological studies on corals, Porites spp., parasitized<br />
by trematode metacercariae. Journal of Invertebrate Pathology 23: 303-317.<br />
Clark, A.M. and D.A. Gulko. 1999. Hawaii’s state of the reef report, 1998. State of Hawaii Department of Land and Natural<br />
Resources, Honolulu. 41 pp.<br />
Cobb, J.N. 1905. The commercial fisheries of the Hawaiian Islands. Bulletin of the U.S. Fish Commission, Volume 13 for<br />
1903, Part 3: 715-765.<br />
Coles S.L. 1998. Annual report. Kahe generating station NPDES monitoring report for 1997. AECOS, Inc., Kailua, Hawaii.<br />
Volume 31.<br />
Coles, S.L., R.C. DeFelice, L.G. Eldredge and J.T. Carlton. 1997. Biodiversity of marine communities in Pearl Harbor,<br />
Oahu, Hawaii with observations on introduced species. Technical Report No. 10. Bishop Museum, Honolulu.<br />
Coles, S.L., R.C. DeFelice, J.E. Smith and L.G. Eldredge. 1998. Determination of baseline conditions for introduced<br />
marine species in nearshore waters of the island of Kaho’olawe, Hawaii. Technical Report No. 14. Bishop Museum, Honolulu.<br />
Coles, S.L., R.C. DeFelice, L.G. Eldredge and J.T. Carlton. 1999a. Historical and recent introductions to non-indigenous<br />
marine species into Pearl Harbor, Oahu, Hawaiian Islands. <strong>Marine</strong> Biology 135: 1247-158.<br />
Coles, S.L., R.C. DeFelice and L.G. Eldredge. 1999b. Nonindigenous marine species introductions in the harbors of the<br />
south and west shores of Oahu, Hawaii. Technical Report No. 15. Bishop Museum, Honolulu.<br />
Coles, S.L., R.C. DeFelice and D. Minton. 2001. <strong>Marine</strong> species survey of Johnston Atoll June 2000. U.S. Fish and Wildlife<br />
Service, Pacific Islands Area Office, Technical Report 19. Bishop Museum, Honolulu.<br />
Coles, S.L., R.C. DeFelice and L.G. Eldredge. 2002a. Nonindigenous species in Kaneohe Bay, Oahu, Hawaii. Technical<br />
Report No. 24. Bishop Museum, Honolulu.<br />
Coles, S.L., R.C. DeFelice and L.G. Eldredge. 2002b. Nonindigenous marine species introductions at Waikiki and Hawaii<br />
Kai, Oahu, Hawaii. Technical Report No. 25. Bishop Museum, Honolulu.<br />
Coles, S.L. and B.E. Brown. 2003. Coral bleaching-capacity for acclimatization and adaptation. Advances in <strong>Marine</strong> Biology<br />
46: 183-223.<br />
Coles, S.L., L.G. Eldredge. F. Kandel, P.R. Reath and K. Longenecker. 2004. Assessment of nonindigenous species on<br />
coral reefs in the Hawaiian Islands, with emphasis on introduced invertebrates. Technical Report No. 27. Bishop Museum,<br />
Honolulu.<br />
Coles, S.L. and E.K. Brown. In preparation. Twenty year changes in coral cover on a hurricane impacted reef in the vicinity<br />
of a thermal outfall. <strong>Marine</strong> Ecology Progess Series.<br />
Davidson, K., M. Hammett and C. Minato (eds.). 2003. The first four years: Hawaii coral reef initiative research program<br />
(1998-2002). Social Science Research Institute, University of Hawaii at Manoa. 72 pp.<br />
DeCarlo, E. University of Hawaii, Department of Oceanography. Personal communication.<br />
DeFelice, R.C., S.L. Coles, D. Muir and L.G. Eldredge. 1998. Investigation of the marine communities of Midway Harbor<br />
and adjacent lagoon, Midway Atoll, Northwestern Hawaiian Islands. Hawaii Biological Survey Control No. 1998-014.<br />
Bishop Museum, Honolulu.<br />
DeFelice, R., D. Minton, and S. Godwin. 2002. Records of shallow-water marine invertebrates from French Frigate<br />
Shoals, Northwestern Hawaiian Islands with a note on nonindigenous species. Technical Report 23. Bishop Museum,<br />
Honolulu.<br />
DeMartini, E.E. B.C. Mundy and J.J. Polovina. 1999. Status of nearshore sports and commercial fishing and impacts on<br />
biodiversity in the tropical insular Pacific. pp. 339-355 In: L.G. Eldredge, J.E. Maragos, P.F. Holthus, and H. F. Takeuchi<br />
(eds.) <strong>Marine</strong> and coastal biodiversity in the tropical island Pacific region. Pacific Science Association. Honolulu.
The State of Coral Reef Ecosystems of the Main Hawaiian Islands<br />
DeMello, J.K. 2004. Commercial marine landings from fisheries on the coral reef ecosystem of the Hawaiian Archipelago.<br />
pp 160-173 In: A.M. Friedlander (ed.) Status of Hawaii’s coastal fisheries in the new millennium. Proceedings of a symposium<br />
sponsored by the American Fisheries Society, Hawaii Chapter. Honolulu, HI.<br />
Devaney, D.M. and L.G. Eldredge 1977. Subclass Octocorallia. pp. 119-129 In: D.M. Devaney and L. G. Eldredge, (eds.)<br />
Reef and Shore Fauna of Hawaii. Section 1: Protozoa through Ctenophora. Bishop Museum Press, Honolulu.<br />
Dierking, J. University of Hawaii, Department of Zoology. Honolulu. Personal communication.<br />
DLNR-DAR (Department of Land and Natural Resources, Divison of Aquatic Resources). (undated). A history of Hawaii’s<br />
aquarium fish industry. DLNR-DAR. Honolulu, HI. 14 pp.<br />
DLNR-DAR (Department of Land and Natural Resources, Divison of Aquatic Resources). 1988. Main Hawaiian Islands<br />
<strong>Marine</strong> Resource Investigation 1988 Survey. DLNR-DAR. Honolulu. 37 pp.<br />
DLNR-DAR (Department of Land and Natural Resources, Divison of Aquatic Resources). 1992. <strong>Marine</strong> Life Conservation<br />
District Plan. DLNR-DAR. Honolulu.<br />
DLNR-DAR (Department of Land and Natural Resources, Divison of Aquatic Resources). 1998. Fishing survey summary<br />
report. Current lines DLNR-DAR. Honolulu. 9 pp.<br />
Dollar, S.J. 1979. Ecological response to relaxation of sewage stress off Sand Island, Oahu, Hawaii. Water Resources<br />
Research Center, Technical Report No. 124.<br />
Dollar, S.J. 1982. Wave stress and coral community structure in Hawaii. Coral Reefs 1: 71-81.<br />
Dollar, S. 2004. Natural stress on coral reefs in Hawaii: a multi-decade study of storm wave impact and recovery (abstract).<br />
In: Proceedings, 10th International Coral Reef Symposium, Okinawa.<br />
Dollar, S.J. and Tribble G.W. 1993. Recurrent storm damage and recovery: a long-term study of coral communities in<br />
Hawaii. Coral Reefs 12: 223-233<br />
Dollar, S.J. and R.W. Grigg. 2003. Anthropogenic and Natural Stresses on Coral Reefs in Hawaii; A multi-decade synthesis<br />
of impact and recovery. Final Report. Hawaii Coral Reef Initiative.<br />
Dollar S.J. and R.W. Grigg. 2004. Anthropogenic and natural stresses on selected coral reefs in Hawaii: A multidecade<br />
synthesis of impact and recovery. Pacific Science 58 (2): 281-304.<br />
Done T.J. 1992. Phase shifts in coral reef communities and their ecological significance. Hydrobiologica 247: 121-132.<br />
Donohue, M., R. Boland, C. Sramek and G. Antonelis. 2001. Derelict Fishing Gear in the Northwestern Hawaiian Islands:<br />
Diving Surveys and Debris Removal in 1999 Confirm Threat to Coral Reef Ecosystems. <strong>Marine</strong> Pollution Bulletin 42 (12):<br />
1301.<br />
Eldredge, L.G. 1994. Introductions of commercially significant aquatic organisms to the Pacific Islands. Perspectives in<br />
Aquatic Exotic Species Management in the Pacific Islands. Vol.1. South Pacific Commission Inshore Fisheries Research<br />
Project Technical Document No. 7. 127 pp.<br />
Eldredge, L.G. and C.M. Smith. 2001. A guidebook to introduced marine species in Hawaii. Bernice P. Bishop Museum<br />
Technical Report 21.<br />
Environmental Consultants Inc. 1974. Honolua Bay study: <strong>Marine</strong> geological, physical, and biological surveys. Belt, Collins,<br />
and Associates, Honolulu. 62 pp.<br />
Evans, E.C., III and N.L. Buske, J.G. Grovhoug, E.B. Guinther, P.L. Jokiel, D.T.O. Kam, E.A. Kay, T.J. Peeling and S.V.<br />
Smith. 1974. Pearl Harbor Biological Survey - Final Report. Naval Undersea Center Report Number NUC TN 1128, San<br />
Diego.<br />
Everson, A. and A.M. Friedlander. 2004. Catch, effort, and yields for coral reef fisheries in Kaneohe Bay, Oahu and Hanalei<br />
Bay, Kauai: comparisons between a large urban and a small rural embayment. pp 110 -- 131 In: A.M. Friedlander (ed.)<br />
Status of Hawaii’s coastal fisheries in the new millennium. In: Proceedings of a symposium sponsored by the American<br />
Fisheries Society, Hawaii Chapter, Honolulu.<br />
Friedlander, A.M. (ed.) 2004. Status of Hawaii’s coastal fisheries in the new millennium. In: Proceedings of a symposium<br />
sponsored by the American Fisheries Society, Hawaii Chapter. Honolulu. 230 pp.<br />
Sidebar<br />
Main Hawaiian Islands<br />
page<br />
265
Main Hawaiian Islands<br />
page<br />
266<br />
The State of Coral Reef Ecosystems of the Main Hawaiian Islands<br />
Friedlander, A. M. and J. D. Parrish. 1997. Fisheries harvest and standing stock in a Hawaiian bay. Fisheries Research.<br />
32 (1): 33-50.<br />
Friedlander, A.M., R.C. DeFelice, J.D. Parrish and J.L. Frederick. 1997. Habitat resources and recreational fish populations<br />
at Hanalei Bay, Kauai. Hawaii Cooperative Fishery Research Unit, University of Hawaii, Honolulu. 320 pp.<br />
Friedlander, A.M. and J.D. Parrish. 1998a. Temporal dynamics of the fish assemblage on an exposed shoreline in Hawaii.<br />
Environmental Biology of Fishes 53: 1-18.<br />
Friedlander, A.M. and J.D. Parrish. 1998b. Habitat characteristics affecting fish assemblages on a Hawaiian coral reef.<br />
Journal of Experimental <strong>Marine</strong> Biology and Ecology 224 (1): 1-30.<br />
Friedlander, A.M. and E.E. DeMartini. 2002. Contrasts in density, size, and biomass of reef fishes between the northwestern<br />
and main Hawaiian islands: the effects of fishing down apex predators. <strong>Marine</strong> Ecological Progress Series 230:<br />
253-264.<br />
Friedlander, A.M., K. Poepoe, K. Helm, P. Bartram, J. Maragos and I. Abbott. 2002a. Application of Hawaiian Traditions to<br />
community-based fishery management. pp. 2: 813-818. In: Proceedings of the Ninth Coral Reef Symposium.<br />
Friedlander, A.M, J.D. Parrish and R.C. DeFelice. 2002b. Ecology of the introduced snapper Lutjanus kasmira in the reef<br />
fish assemblage of a Hawaiian bay. Journal of Fish Biology 60: 28-48.<br />
Friedlander, A.M. and E.K. Brown. 2003. Fish Habitat Utilization Patterns and Evaluation of the Efficacy of <strong>Marine</strong> Protected<br />
Areas in Hawaii: Integration and Evaluation of NOS Digital Benthic Habitats Maps and Reef Fish Monitoring Studies.<br />
Year one report to Hawaii Department of Land and Natural Resource, Division of Aquatic Resources, Honolulu. 79<br />
pp.<br />
Friedlander, A.M. and D.A. Ziemann. 2003. Impact of hatchery releases on the recreational fishery for Pacific threadfin in<br />
Hawaii. Fishery Bulletin. 101: 32-43.<br />
Friedlander, A.M., E.K. Brown, P.L. Jokiel, W.R. Smith and S.K. Rodgers. 2003. Effects of habitat, wave exposure, and<br />
marine protected area status on coral reef fish assemblages in the Hawaiian archipelago. Coral Reefs 22: 291-305<br />
Friedlander, A.M. and E. Brown. 2004. <strong>Marine</strong> protected areas and community-based fisheries management in Hawaii.<br />
Pages 208-230 In: Status of Hawaii’s coastal fisheries in the new millennium (A.M. Friedlander, ed.). Proceedings of the<br />
2001 fisheries symposium sponsored by the American Fisheries Society, Hawaii Chapter. Honolulu, Hawaii<br />
Grigg, R.W. 1983. Community structure, succession and development of coral reefs in Hawaii. <strong>Marine</strong> Ecology Progress<br />
Series 11: 1-14<br />
Grigg, R.W. 2003. Invasion of a deep black coral bed by an alien species Carijoa riisei, off Maui, Hawaii. Coral Reefs 22:<br />
121-122.<br />
Grigg, R.W. and J. E. Maragos. 1974. Recolonization of hermatypic corals on submerged lava flows in Hawaii. Ecology<br />
55: 387-395.<br />
Harman, R.F. and A. Z. Katekaru. 1988. Hawaii Commercial Fishing Survey 1987. Division of Aquatic Resources, Department<br />
of Land and Natural Resources, State of Hawaii. 71 pp.<br />
Hau, S. Department of Land and Natural Resources, Division of Aquatic Resources, Maui, HI. Personal communication.<br />
Hawaii DBEDT (Department of Business, Economic Development and Tourism). 2002. State of Hawaii Data Book 2002;<br />
A statistical abstract. DBEDT, Research and Economic Analysis Division. Statistics and Data Support Branch. Honolulu.<br />
Hawaii DBEDT (Department of Business, Economic Development and Tourism. Research and Economic Analysis Division.<br />
Statistics and Data Support Branch). 2003. State of Hawaii Data Book 2003; A statistical abstract. Honolulu, HI<br />
Hayes, T.A., T,F, Hourigan, S.C. Jazwinski, J.D. Johnson Sr. and D.J. Walsh. 1982. The coastal resources, fisheries and<br />
fishery ecology of Puako, West Hawaii. Cooperative Fishery Research Unit, Honolulu, Technical Report 82: 1.<br />
Henderson, J.R. 1984. Encounters of Hawaiian monk seals with fishing gear at Lisianski Island, 1982. <strong>Marine</strong> Fisheries<br />
Review 46 (3): 5961.<br />
Herbst L.H. 1995. Green turtle fibropapillomatosis: Challenges to assessing the role of environmental cofactors. Environmental<br />
Health Perspectives 103(4): 27-30
The State of Coral Reef Ecosystems of the Main Hawaiian Islands<br />
Hodgson, L.M. 1994. Maui algae project. A technical report submitted to Hawaii Department of Health. Environmental<br />
Planning Office. Honolulu.<br />
Holland, K.N. and C.G. Meyer. 2003. Human Activities in <strong>Marine</strong> Protected Area--Impact on Substrates. Final Report.<br />
Hawaii Institute of <strong>Marine</strong> Biology. Kaneohe, HI.<br />
Hughes, T.P. 1994. Catastrophes, phase shifts, and large-scale degradation of a Caribbean coral reef. Science 265:<br />
1547-1551.<br />
Hughes, T.P. and J.H. Connell. 1999. Multiple stressors on coral reefs: A long-term perspective. Limnology and Oceanography<br />
44 (3): 932-940.<br />
Hunter, C.L. and C.W. Evans. 1995. Coral reefs in Kaneohe Bay, Hawaii: Two centuries of western influence and two<br />
decades of data. Bulletin of <strong>Marine</strong> Science 57(2): 501-515.<br />
Hunter, C.L., M.D. Stephenson, R.S. Tjeerdema, D.G. Crosby, G.S. Ichikawa, J.D. Goetzl, K.S. Paulson, D.B. Crane, M.<br />
Martin and J.W. Newman. 1995. Contaminants in oysters in Kaneohe Bay. <strong>Marine</strong> Pollution Bulletin 30: 646-654.<br />
Hunter, C.L. 1999. First record of coral disease and tumors on Hawaiian reefs. pp. 73-98 In: Maragos, J.E. and R. Gober-<br />
Dunsmore (eds.) Proceedings of the Hawaii Coral Reef Monitoring Workshop. June 7-9, 1998.<br />
Jokiel, P.L. and E. Cox. 1996. Assessment and monitoring of U.S. coral reefs in Hawaii and the Central Pacific. In: Crosby,<br />
M.P., G.R. Gibson, and K.W. Potts (eds.) A Coral Reef Symposium on Practical, Reliable, Low Cost Monitoring Methods<br />
for Assessing the Biota and Habitat Conditions of Coral Reefs. NOAA Office of Coastal Resource Management. Silver<br />
Spring, MD.<br />
Jokiel, P.L, CL. Hunter, S. Taguchi and L. Watarai. 1993. Ecological impact of a fresh-water “reef kill” in Kaneohe Bay,<br />
Oahu, Hawaii. Coral Reefs 12: 177-184.<br />
Jokiel, P.L. and E.K. Brown. 2004. Global warming, regional trends and inshore environmental conditions influence coral<br />
bleaching in Hawaii. Global Change Biology 10: 1627-1641<br />
Jokiel, P.L., E.K. Brown, A.M. Friedlander, S.K. Rodger and W.R. Smith. 2004. Hawaii coral reef assessment and monitoring<br />
program: Spatial patterns and temporal dynamics in reef coral communities. Pacific Science 58 (2): 159-174.<br />
Kamakau, S.M. 1839. Na Hana a ka Poe Kahiko The Works of the People of Old Translated by M.K. Pukui, Bernice P.<br />
Bishop Museum, Special Publication No. 61. (1976 Ed.). Bishop Museum Press, Honolulu. 170 pp.<br />
Khang, S. Department of Oceanography. University of Hawaii, Honolulu. Personal communication.<br />
Kinzie, R.A. 1968. The ecology of the replacement of Pseudosquilla ciliata by Gonodactylus falcatus (Crustacea: Stomatopoda)<br />
recently introduced into the Hawaiian Islands. Pacific Science 22: 465-475.<br />
Lowe, M.K. 1995. The Main Hawaiian Islands <strong>Marine</strong> Resources Investigation (MHI-MRI): Integrated watershed and inshore<br />
fisheries management to conserve Hawaiian coastal fisheries ecosystems. Manuscript Collection of Country Statements<br />
and Background Papers. South Pacific Commission and Forum Fisheries Agency Workshop on the Management<br />
of South Pacific Inshore Fisheries. Noumea, New Caledonia. BP 76 (2): 677-691.<br />
Lowe, M.K. 1996. Protecting the future of small-scale fisheries in an economy dominated by tourism and coastal development,<br />
based on the results of the main Hawaiian Islands marine resources investigation (MHI-MRI). pp. 137-142. In:<br />
Nagata S. (ed.) Ocean Resources: development of marine tourism, fisheries, and coastal management in the Pacific<br />
Islands area. In: Proceedings of the Sixth Pacific Islands Area Seminar. Tokai University, Honolulu.<br />
Lowe, M.K. 2004. The status of inshore fisheries ecosystems in the main Hawaiian Islands at the dawn of the millennium:<br />
cultural impacts, fisheries trends and management. pp. 7-109 In: A.M. Friedlander (ed.) Status of Hawaii’s coastal fisheries<br />
in the new millennium. Proceedings of a symposium sponsored by the American Fisheries Society, Hawaii Chapter.<br />
Honolulu.<br />
Maragos, J. 1972. A study of the ecology of Hawaiian reef corals. PhD Thesis for the University of Hawaii. 290 pp.<br />
Moberly, R. and T. Chamberlain. 1964. Hawaiian beach systems. Harbors Division, Department of Transportation, State<br />
of Hawaii, Honolulu. 177 pp.<br />
Miyasaka, A. 1994a. Status Report, Aquarium fish collections, Fiscal Year 1992-1993. Division of Aquatic Resources,<br />
Department of Land and Natural Resources, State of Hawaii, Honolulu. 8 pp.<br />
Sidebar<br />
Main Hawaiian Islands<br />
page<br />
267
Main Hawaiian Islands<br />
page<br />
268<br />
The State of Coral Reef Ecosystems of the Main Hawaiian Islands<br />
Miyasaka, A. 1994b. Status Report, Aquarium fish collections, Fiscal Year 1993-1994. Division of Aquatic Resources,<br />
Department of Land and Natural Resources, State of Hawaii, Honolulu. 8 pp.<br />
The Ocean Conservancy. 2002. 2002 International Coastal Cleanup Hawaii Summary Report. The Ocean Conservancy,<br />
Office of Pollution Prevention and Monitoring. Virginia Beach.<br />
Oda, D.K. and J.D. Parrish. 1981. Ecology of commercial snappers and groupers introduced to Hawaiian Reefs. pp. 1:<br />
59-67. In: Proceedings of the Fourth International Coral Reef Symposium.<br />
Orazio, C., T. May and W.W.M. Steiner. 2003. USGS Final Reports CERC-8335-FY03-31-01 and CERC-8335-FY02-32-<br />
14.<br />
Parrish, J.D., G.S. Aeby, E.J. Conklin and G.L. Ivey. 2000. Interactions of nonindigenous blueline snapper (taape) with<br />
native deep-water fishery species. Project completion report to Hawaii Department of Land and Natural Resources. 40<br />
pp.<br />
Peyton, K. University of Hawaii, Botany Department. Honolulu. Personal communication.<br />
Pfeffer, R.A. and G.W. Tribble. 1985. Hurricane effects on an aquarium fish fishery in the Hawaiian Islands. pp. 3: 331-<br />
336. Proceedings of the Fifth International Coral Reef Symposium, Tahiti.<br />
Poepoe, K., P. Bartram and A. Friedlander. In press. The Use of Traditional Hawaiian Knowledge in the Contemporary<br />
Management of <strong>Marine</strong> Resources. In: B. Neis, I. Baird and N. Haggan, (eds.) Putting Fishers’ Knowledge to Work.<br />
Blackwell Science.<br />
Quackenbush, S.L., R.N. Casey, R.J. Murcek, T.A. Paul, T.M. Work, C.J. Limpus, A. Chaves, L. duToit, J. V. Perez, A.A.<br />
Aguirre, T.R. Spraker, J.A. Horrocks, L.A. Vermeer, G.H. Balazs and J.W. Casey. 2001. Quantitative analysis of herpesvirus<br />
sequences from normal tissue and fibropapillomas of marine turtle with real-time PCR. Virology 287: 105-111.<br />
Randall, J.E. 1987. Introductions of marine fishes to the Hawaiian Islands. Bulletin of <strong>Marine</strong> Science 41: 490-502.<br />
Roberts, L.M. 2000. Historical land use, coastal change, and sedimentation on South Molokai reefs. Recent advances in<br />
marine science and technology. pp. 167-176. In: Proceedings, Ninth Pacific Congress on <strong>Marine</strong> Science and Technology.<br />
Rodgers, S.K. and E.F. Cox. 1999. Rate of spread of introduced Rhodophytes Kappaphycus alvarezzii, Kappaphycus<br />
striatum, and Gracilaria salicornia and their current distributions in Kane’ohe Bay, O’ahu, Hawaii. Pacific Science 53:<br />
232-241.<br />
Rodgers, K.S. and E.F. Cox. 2003. The Effects of Trampling on Hawaiian Corals along a Gradient of Human Use. Biological<br />
Conservation 112(3): 383-389.<br />
Rogers, C.S., H.C. Fitz III, M. Gilnack, J. Beets and J. Hardin. 1984. Scleractinian coral recruitment patterns at Salt River<br />
submarine canyon, St. Croix, U.S. Virgin Islands. Coral Reefs 3: 69-76.<br />
Rooney: J., C. Fletcher, E. Grossman, M. Engels and M. Field. 2004. El Nino influence on Holocene Reef Accretion in<br />
Hawaii. Pacific Science 58(2): 305-324.<br />
Schmacker, B.D. and J.D. Parrish. 2004. Feeding interactions of the introduced blue-line snapper with important native<br />
fishery species in Hawaiian coral reef habitats. Project Report to Hawaii Coral Reef Initiative Program. 14 pp.<br />
Shomura, R. 1987. Hawaii’s marine fisheries resources: yesterday (1900) and today (1986). US NMFS-SWFC/HL. Admin.<br />
H-87-21: 14 pp.<br />
Smith, J.E. 2003. Factors influencing the formation of algal blooms on tropical reefs with an emphasis on nutrients, herbivores<br />
and invasive species. Ph.D. Thesis for the University of Hawaii at Manoa, Honolulu.<br />
Smith, J.E., C.M. Hunter and C.M. Smith. 2002. Distribution and reproductive characteristics of nonindigenous and invasive<br />
marine algae in the Hawaiian Islands. Pacific Science 53: 299-315.<br />
Smith, J.E., R. Most, T. Sauvage, C. Hunter, C. Squair and E. Conklin. 2004. Ecology of the invasive red alga Gracilaria<br />
salicornia in Waikiki and possible mitigation strategies. Pacific Science 58(2): 325-343.<br />
Smith, M.K. 1993. An ecological perspective on inshore fisheries in the main Hawaiian Islands. <strong>Marine</strong> Fisheries Review.<br />
55(2): 34-49.
The State of Coral Reef Ecosystems of the Main Hawaiian Islands<br />
Smith, M.K. and M. Pai. 1992. The ahupuaa concept: Relearning coastal resource management from ancient Hawaiians.<br />
NAGA: The ICLARM Quarterly. 15 (2): 11-13.<br />
Smith, S.V., W.J. Kimmerer, E.A. Laws, R.E. Brock and T.W. Walsh. 1981. Kaneohe Bay Sewage Diversion Experiment:<br />
perspectives on ecosystem response to nutritional perturbation. Pacific Science 34: 279-402.<br />
Soicher, A.J. and F.L. Peterson. 1997. Terrestrial nutrient and sediment fluxes to the coastal waters of West Maui, Hawaii.<br />
Pacific Science 51( 3): 221-232.<br />
Storlazzi, C.D., J.B. Logan and M.E. Field. 2003. Quantitative morphology of a fringing reef tract from high-resolution<br />
laser bathymetry: Southern Molokai, Hawaii. Geological Society of America Bulletin 115(11): 1344-1355.<br />
Tissot, B.N. and L.E. Hallacher. 2003. Effects of aquarium collectors on coral reef fishes in Kona, Hawaii. Conservation<br />
Biology 17(6): 1759-1768.<br />
Tissot, B.N., W.J. Walsh and L.E. Hallacher. 2004. Evaluating effectiveness of a marine protected area network in West<br />
Hawaii to increase productivity of an aquarium fishery. Pacific Science 58: 175-188.<br />
Titcomb, M. 1972. Native use of fish in Hawaii. University of Hawaii Press, Honolulu. Personal communication.<br />
The Ocean Conservancy. 2002. 2002 International Coastal Cleanup Hawaii Summary Report.<br />
Turgeon D.D., R.G. Asc, B.D. Cause, R.E. Dodg, W. Jaap, K. Banks, J. Delaney , B.D. Keller, R. Speiler, C.A. Mato, J.R.<br />
Garcia, E. Diaz, D. Catanzaro, C.S. Rogers, Z. Hillis-Starr, R. Nemeth, M. Taylor, G.P. Schmahl, M.W. Miller, D.A. Gulko,<br />
J.E. Maragos, A.M. Friedlander, C.L. Hunter, R.S. Brainard, R. Craig, R.H. Richmond, G. Davis, J. Starmer, M. Trianni,<br />
R. Houk, C.E. Birkeland, A. Edward, Y. Golbuu, J. Gutierrez, N. Idechong, G. Paulay, A. Tafileichig and N.V. Velde. 2002.<br />
The State of Coral Reef Ecosystems of the United States and Pacific Freely Associated States: 2002. National Oceanic<br />
and Atmospheric Administration, National Ocean Service, National Centers for Coastal Ocean Science. Silver Spring,<br />
MD. 265 pp.<br />
Van Beukering, P.J.H. and H.S.J. Cesar. 2004. Ecological economic modelling of coral reefs:evaluating tourist overuse at<br />
Hanauma Bay and algae blooms at the Kihei coast, Hawaii. Pacific Science 58: 243-260.<br />
Walsh, W.J. 1983. Stability of a coral reef fish community following a catastrophic storm. Coral Reefs 2: 49-63.<br />
Walsh, W.J., S.P. Cotton, J. Dierking and I.D. Williams 2004. The commercial marine aquarium fishery in Hawaii 1976-<br />
2003. pp. 132-159. In: A.M Friedlander (ed.) Status of Hawaii’s coastal fisheries in the new millennium. Proceedings of a<br />
symposium sponsored by the American Fisheries Society, Hawaii Chapter, Honolulu.<br />
West Maui Watershed Management Advisory Committee. 1997. West Maui watershed owners manual. West Maui Watershed<br />
Management Advisory Committee. 104 pp.<br />
Williams, I.D., W.J. Walsh, A. Miyasaka and A.M. Friedlander. In review. Effects of rotational closure on coral reef fishes<br />
in the Waikiki-Diamond Head Fishery Management Area, Oahu, Hawaii. <strong>Marine</strong> Ecology Progress Series.<br />
Woo, M., C.M. Smith and W. Smith. 1999. Ecological interactions and impacts of invasive Kappaphycus striatum in<br />
Kaneohe Bay, a tropical reef. pp. 186-191. In: J. Pederson (ed.) <strong>Marine</strong> Bioinvasions. MIT Sea Grant Program, Cambridge,<br />
MA.<br />
Work, T. and R. Rameyer. 2001. Evaluating coral health in Hawaii. US Geological Survey, National Wildlife Health Center,<br />
Hawaii Field Station. 42 pp.<br />
Work, T., G. Balaz, R. Rameyer and R. Morris. In press. Retrospective pathology survey of green turtles (Chelonia mydas)<br />
with fibropapillomatosis in the Hawaiian Islands, 1993-2003. Diseases of Aquatic Organisms.<br />
Yuen and Associates. 1992. State Water Resources Protection Plan: Vol. II. Commission on Water Resource Management,<br />
State of Hawaii. 214 pp.<br />
Yoshikawa, T. and K. Asoh. 2004. Entanglement of monofilament fishing lines and coral death. Biological Conservation<br />
117(5): 557-560.<br />
Sidebar<br />
Main Hawaiian Islands<br />
page<br />
269
Northwestern Hawaiian Islands<br />
page<br />
270<br />
The State of Coral Reef Ecosystems of the Northwestern Hawaiian Islands<br />
Alan Friedlander 1,2 , Greta Aeby 3 , Russell Brainard 4 , Athline Clark 3 , Edward DeMartini 4 , Scott Godwin 5 , Jean Kenyon 4,6 ,<br />
Randy Kosaki 7 , Jim Maragos 8 , Peter Vroom 4,6 .<br />
Additional Contributions: George Antonelis 4 , Jacob Asher 4,6 , George Balazs 4 , Kelly Curtis 4,6 , June Firing 4,6 , Ronald<br />
Hoeke 4,6 , Elizabeth Keenan 4,6 , Russell Moffitt 4 , Don Palawski 8 , Gregory Schorr 4,6 , Allison Veit 8 , Lee Ann Woodward 8 .<br />
INTRODUCTION AND SETTING<br />
The Northwestern Hawaiian Islands (NWHI) consist of small islands, atolls, submerged banks, and reefs, and<br />
stretch for more than 2,000 km northwest of the high windward main Hawaiian Islands (MHI; Figures 10.1 and<br />
10.2). From Nihoa and Necker Island (~7 and 10 million years old respectively) to Midway and Kure Atolls<br />
(~28 million years old), the NWHI represent the older portion of the emergent archipelago (Juvik and Juvik,<br />
1998). The majority of the islets and shoals remain uninhabited, although Midway, Kure, Laysan Island, and<br />
French Frigate Shoals have all been occupied for extended periods over the last century by various government<br />
agencies.<br />
The remoteness and limited reef fishing activities in the NWHI have resulted in minimal anthropogenic impacts.<br />
Large apex predators such as jacks and reef sharks are one of the most striking and unique components<br />
of the NWHI ecosystem. These top carnivores are no longer present in any abundance in the inhabited<br />
Hawaiian Islands. The NWHI flora and fauna include a large percentage of species that are endemic to the<br />
Hawaiian Islands, which are recognized for having some of the highest marine endemism in the world. The<br />
faunas of isolated oceanic archipelagos like the Hawaiian Islands represent species conservation hotspots<br />
that have become increasingly important due to the continual losses of biodiversity on coral reefs worldwide<br />
(DeMartini and Friedlander, 2004).<br />
The NWHI represent important habitat for a number of threatened and endangered species. The Hawaiian<br />
monk seal is one of the most critically endangered marine mammals in the U.S. (1,400 individuals) and depends<br />
almost entirely on the islands<br />
of the NWHI for breeding and the surrounding<br />
reefs for sustenance. Over<br />
90% of all sub-adult and adult Hawaiian<br />
green sea turtles found throughout<br />
Hawaii inhabit the NWHI. Seabird<br />
colonies in the NWHI constitute one<br />
of the largest and most important assemblages<br />
of seabirds in the world.<br />
Figure 10.1. The Northwestern Hawaiian Islands, which extend across the north<br />
central Pacific, represent a vast, remote coral ecosystem that has been subjected to<br />
relatively minimal anthropogenic impacts. Map: A. Shapiro.<br />
1 NOAA Ocean Service, NCCOS, CCMA, Biogeography Team<br />
2 Oceanic Institute<br />
3 Hawaii Department of Land and Natural Resources, Division of Aquatic Resources<br />
4 NOAA Fisheries, Pacific Islands Fisheries Science Center<br />
5 Bishop Museum<br />
6 University of Hawaii, Joint Institute for <strong>Marine</strong> and Atmospheric Research<br />
7 NOAA Ocean Service, National <strong>Marine</strong> Sanctuary Program<br />
8 U.S. Fish and Wildlife Service<br />
Despite their high latitude, similar<br />
numbers of coral species have been<br />
reported in the NWHI (57 spp.) compared<br />
to the MHI (59 spp.). Kure is<br />
the world’s most northern atoll and<br />
is referred to as the Darwin Point,<br />
where coral growth and subsidence<br />
and erosion balance one another.<br />
Unlike the MHI where alien and invasive<br />
algae have overgrown many<br />
coral reefs, the reefs in the NWHI are<br />
free of alien algae and the high natural<br />
herbivory results in a pristine algal<br />
assemblage.<br />
The reefs in the NWHI are among<br />
the few large-scale, intact, predator-
The State of Coral Reef Ecosystems of the Northwestern Hawaiian Islands<br />
Figure 10.2. Locator map for the Northwestern Hawaiian Islands. Island abbreviations in figures and tables are as follows: Kure<br />
Atoll=KUR; Midway Atoll=MID, Pearl and Hermes Atoll=P&H; Lisianski Island=LIS; Laysan Island=LAY; Maro Reef=MAR; French Frigate<br />
Shoals=FFS; Gardner Pinnacles=GAR; Necker Island=NEC; Nihoa Island=NIH. Map: A. Shapiro.<br />
dominated reef ecosystems remaining in the world and offer an opportunity to examine what could occur if<br />
larger more effective no-take marine reserves are established elsewhere (Friedlander and DeMartini, 2002).<br />
The nearly pristine condition of the NWHI allows scientists to study how unaltered ecosystems are structured,<br />
how they function, and how they can most effectively be preserved.<br />
Sidebar<br />
Northwestern Hawaiian Islands<br />
page<br />
271
Northwestern Hawaiian Islands<br />
page<br />
272<br />
The State of Coral Reef Ecosystems of the Northwestern Hawaiian Islands<br />
ENVIRONMENTAL AND ANTHROPOGENIC STRESSORS<br />
Climate Change and Coral Bleaching<br />
The NWHI were impacted by mass coral bleaching during late summer 2002 (Aeby et al., 2003; Kenyon et<br />
al., in review). No records of mass coral bleaching in the NWHI exist before this time and it was previously<br />
thought that the NWHI was less susceptible to bleaching due to its high latitude location. The first documented<br />
bleaching event in the MHI was reported in 1996 (Jokiel and Brown, 2004). Bleaching was most severe at<br />
the three northern-most atolls (Pearl and Hermes, Midway, and Kure), with lesser incidences of bleaching at<br />
Lisianski Island and farther south in the NWHI. At the three northern atolls, bleaching was most severe on the<br />
backreef, moderate in the lagoon, and low on the deeper forereef (Table 10.1). Of the three coral genera that<br />
predominate at these atolls (Porites, Montipora, Pocillopora), Montipora and Pocillopora were most affected by<br />
bleaching (Figure 10.3), with lesser incidences observed in Porites. The average incidence of coral bleaching<br />
experienced in the backreef, forereef,<br />
lagoon, and channel closely<br />
corresponds to the composition of<br />
the dominant coral fauna in these<br />
zones coupled with its susceptibility<br />
to bleaching. Sea surface temperature<br />
(SST) data derived from both remotely<br />
sensed satellite observations<br />
as well as in situ buoys from the National<br />
Oceanic and Atmospherid Administration<br />
(NOAA) Coral Reef Early<br />
Warning System (CREWS) suggest<br />
that prolonged, elevated SST was a<br />
likely explanation for the bleaching<br />
response (Figure 10.4). This prolonged<br />
period of elevated SST coincided<br />
with a prolonged period of<br />
anomalously light wind speed, suggesting<br />
decreased wind and wave<br />
mixing of the upper ocean (Hoeke et<br />
al., 2004a, b). No significant bleaching<br />
was found the following year during<br />
surveys conducted in July 2003.<br />
Table 10.1. Summary of towed-diver surveys conducted at the three northern-most<br />
atolls in the NWHI from September 20-28, 2002. NA=zone not surveyed at this atoll.<br />
Source: PIFSC-CRED, unpublished data.<br />
KURE MIDWAY P&H<br />
Backreef (0.4 - 4.0 m depth)<br />
distance surveyed (km) 12.26 8.66 35.22<br />
average % coral cover 10.19 11.26 10.20<br />
average % coral bleached<br />
Forereef *<br />
64.09 77.41 66.14<br />
distance surveyed (km) 10.56 21.95 4.88<br />
average % coral cover 6.72 1.59 5.89<br />
average % coral bleached<br />
Central lagoon patch reefs (1.2 - 5.3 m depth)<br />
14.35 15.04 75.38*<br />
distance surveyed (km) 1.63 0 9.42<br />
average % coral cover 18.57 NA 26.87<br />
average % coral bleached<br />
Atoll barrier channel (6.5 - 15.8 m depth)<br />
37.31 NA 36.81<br />
distance surveyed (km) 0 6.58 2.65<br />
average % coral cover NA 1.46 5.16<br />
average % coral bleached NA 32.41 73.06<br />
*Depth (m): 4.6-5.0 m at P&H; 9.0-16.5 m at MID and KUR<br />
Figure 10.3. Left panel shows Montipora capitata (bleached) and Montipora turgescens (lavender) on the northern backreef of Midway<br />
Atoll, September 2002. Right panel shows Pocillopora meandrina (bleached), with initial overgrowth by turf algae in the central<br />
patch reef of Kure Atoll, September 2002. Photos: J. Kenyon.
In late summer 2004, a second episode<br />
of mass coral bleaching was<br />
documented (Kenyon and Brainard,<br />
in review), as well as high mortality<br />
of Montipora capitata in backreef<br />
habitats at the three northern atolls.<br />
This second documented event, although<br />
milder in intensity than the<br />
2002 event, shared numerous spatial<br />
and taxonomic patterns with the 2002<br />
event. In situ temperature recorders<br />
that were deployed in July 2003<br />
for 14 months showed that corals in<br />
shallow backreef and lagoon habitats<br />
experienced substantially more thermal<br />
stress during late summer 2004<br />
than during 2003, exceeding local<br />
bleaching thresholds for as much as<br />
seven weeks. In both years, backreef<br />
sites at Pearl and Hermes Atoll<br />
experienced the highest incidences<br />
of bleaching.<br />
The State of Coral Reef Ecosystems of the Northwestern Hawaiian Islands<br />
Figure 10.4. Satellite and in situ measurements at MID and P&H during 2002 and<br />
2003, showing anomalously high SSTs at these northern atolls during the 2002 mass<br />
coral bleaching event. Both satellite Pathfinder SST and in situ SST at MID and P&H<br />
show values significantly exceeding long-term mean climatological values and the<br />
Coral Reef Watch bleaching threshold of maximum monthly mean SST plus 1° C.<br />
Source: Hoeke et al., 2004a, b.<br />
Disease<br />
There has been a worldwide increase in the reports of diseases affecting marine organisms. However, our<br />
ability to fully understand recent disease outbreaks is hampered by the paucity of baseline and epidemiological<br />
information on the normal disease levels in the ocean (Harvell et al., 1999). The NWHI is considered to be<br />
one of the last relatively pristine large coral reef ecosystems remaining in the world. As such, it provides the<br />
unique opportunity to document the normal levels of disease in a coral reef system exposed to limited human<br />
influence.<br />
Little work had been done regarding coral disease in the NWHI with the exception of one study by Work et al.<br />
(2002) in which 16 sites were surveyed at French Frigate Shoals. They reported tumors on Acropora (Figure<br />
10.5) as well as lesions associated with parasites, bacteria and fungi on a number of different coral species.<br />
During a multi-agency cruise conducted in September 2002, disease investigation was incorporated into the<br />
protocol and a characterization of coral disease was initiated. In July 2003, surveys were conducted, at 73<br />
Figure 10.5. Two examples of disease in Acropora cytherea colonies in the NWHI. Left photo shows a colony of A. cytherea with<br />
tumors; the colony in the right photo shows signs of severe tissue loss in FFS. Photos: G. Aeby.<br />
Sidebar<br />
Northwestern Hawaiian Islands<br />
page<br />
273
Northwestern Hawaiian Islands<br />
page<br />
274<br />
The State of Coral Reef Ecosystems of the Northwestern Hawaiian Islands<br />
sites throughout the NWHI, to quantify and further characterize coral disease. During this survey, evidence<br />
of coral disease was found at very low levels at 68.5% of the sites across all regions. The most common disease<br />
was Porites trematodiasis caused by the digenetic trematode, Podocotyloides stenometra (Aeby, 1998).<br />
This disease was widespread (57.5% of the sites) and is known to exclusively affect Porites spp. coral. Numerous<br />
other conditions were also observed but at much lower frequency of occurrence (1.4%-16.4% of the<br />
sites). The majority of the observed disease signs were distinct from what has been previously described from<br />
other coral reef systems. Numbers of colonies affected by Porites trematodiasis were not enumerated but<br />
other types of conditions were found to be present at low levels. The overall average prevalence of disease<br />
(no. diseased colonies/total no. colonies) was estimated at 0.5% (range 0-7.1%). A disease outbreak at one<br />
site at French Frigate Shoals resulted<br />
in massive tissue on large acroporid<br />
table corals (Aeby, in review; Figure<br />
10.5b).<br />
Coral genera were found to exhibit<br />
differences in types of conditions and<br />
prevalence of disease (Figure 10.6).<br />
Pocilloporids, which are one of the<br />
most common types of corals found<br />
on the reefs of the NWHI, seemed<br />
comparatively resistant to disease.<br />
Only a single colony of Pocillopora<br />
with disease signs was found out of<br />
more than 6,000 colonies searched<br />
(prevalence=0.016%). In contrast,<br />
Acroporids make up less than 5%<br />
of the coral community yet showed<br />
the greatest damage due to disease<br />
and the highest prevalence of disease<br />
(prevalence=2.7%). Studies<br />
are planned to further investigate and<br />
monitor the incidence of coral diseases<br />
in the NWHI.<br />
Storm and Wave Events<br />
Tropical Storms<br />
The coral reef ecosystems of the<br />
NWHI are only rarely in the path of<br />
tropical storms and hurricanes. On<br />
average, between four and five tropical<br />
cyclones are observed annually in<br />
the Central Pacific. This has ranged<br />
from zero, most recently in 1979, to<br />
11 in 1992 and 1994. Few tropical<br />
storms that develop in the region become<br />
hurricanes (Figure 10.7) and<br />
those that do tend to be relatively<br />
weak. Both of the hurricanes nearing<br />
the NWHI since 1979 were category<br />
2 on the Saffir/Simpson scale (maximum<br />
windspeeds of 96-110 mph) or<br />
weaker. Hurricane Patsy (in 1959)<br />
was the strongest hurricane reported<br />
Figure 10.6. Differences in overall prevalence of disease among coral genera in the<br />
NWHI. Source: G. Aeby, unpublished data.<br />
Figure 10.7. The path and magnitude of storms passing near the NWHI from 1979-<br />
2004. Year of storm, storm name and storm strength on the Saffir-Simpson scale (H1-<br />
5) are indicated for each. Map: A. Shapiro. Data: NOAA Coastal Services Center.
The State of Coral Reef Ecosystems of the Northwestern Hawaiian Islands<br />
for the NWHI in the past 50 years, with wind speeds exceeding 100 knots as it approached and passed between<br />
Midway and Kure Atolls. None of the other hurricanes reported to have occurred in the NWHI have had<br />
winds exceeding 100 knots.<br />
The impacts of these tropical storm events on the coral reef ecosystems of the NWHI are not documented.<br />
Though not observed, any damage to reef habitats associated with these storms would have been caused primarily<br />
by extreme wave energy events. No significant tropical storms have been observed in the NWHI since<br />
Hurricane Nele passed near Gardner Pinnacles in 1985. In summary, tropical storms represent a potential,<br />
but infrequent, threat to the coral reefs of the NWHI.<br />
Extratropical Storms and Significant Wave Events<br />
While the impacts of tropical storms on the coral reef ecosystems of the NWHI are relatively rare, the impacts of<br />
large wave events resulting from extratropical storms passing across the North Pacific each winter are thought<br />
to be significant. Most large (5-10+ m) wave events approach the islands and atolls of the NWHI from the<br />
west, northwest, north, and northeast, with the highest energy generally occurring from the northwest sector.<br />
The southern sides of most of the islands/atolls of the NWHI are exposed to fewer and weaker wave events.<br />
Average wave energy and wave power (energy transferred across a given area per unit time) is generally very<br />
high (~1.3 watts per meter, or W/m) between November and March and relatively low (~0.3 W/m) between<br />
May and September (Figure 10.8).<br />
October and April are generally transition<br />
months between the high energy<br />
winter months and the low energy<br />
summer months. In addition to mean<br />
wave power values increasing during<br />
the winter months, it is particularly<br />
noteworthy that the average maximum<br />
wave power during the winter<br />
months, associated with these storm<br />
events, is typically between 8 and 10<br />
W/m. These extreme wave events<br />
(10+ m waves) subject the shallow<br />
water coral reef communities to at<br />
least one order of magnitude more<br />
energy than the typical winter waves.<br />
As such, these extreme wave events<br />
are believed to play a fundamental<br />
role in forming and maintaining biogeographic<br />
(spatial and vertical) distributions<br />
of corals, algae, and fishes<br />
of the coral reef ecosystems of the<br />
NWHI.<br />
x 10 5<br />
Figure 10.8. Climatological values of wave power (W/m) derived from NOAA buoy #<br />
51001 located near NIH from 1981 to 2003. Green squares=monthly means; Shaded<br />
rectangles=standard deviation; Range bars=maximum and minimum monthly means.<br />
Data: NOAA National Data Buoy Center.<br />
Coastal Development and Runoff<br />
Previous land development and disturbance in the NWHI consisted of guano mining at Laysan Island a century<br />
ago, naval base construction at Midway and French Frigate Shoals during the first half of the 20 th century,<br />
and U.S. Coast Guard (USCG) LORAN station construction and operation at Kure and French Frigate Shoals<br />
for several decades following World War II (WWII). The affected islands are coralline, small, porous, and generate<br />
little runoff and soil erosion. During recent decades there has been very little land development except<br />
small-scale conversion of abandoned USCG buildings on Tern Island at French Frigate Shoals and Green<br />
Island at Kure to wildlife research stations.<br />
In-water development was limited to dredging of navigation channels for the naval bases at Midway and<br />
French Frigate Shoals during the middle of the 20 th century. The only recent coastal construction at any of the<br />
NWHI has been the repair of the seawall protecting Tern Island’s small runway and buildings and construction<br />
Sidebar<br />
Northwestern Hawaiian Islands<br />
page<br />
275
Northwestern Hawaiian Islands<br />
page<br />
276<br />
The State of Coral Reef Ecosystems of the Northwestern Hawaiian Islands<br />
of a small boat ramp at French Frigate Shoals in 2004. This project is now completed and marine environments<br />
monitored before construction were re-monitored in late 2004. Construction impacts were minimal, and<br />
removal of derelict sheet piling in the area eliminated injury and death to endangered monk seals, threatened<br />
green sea turtles, and migratory seabirds that had previously become trapped.<br />
The Midway Naval Air Station supported several hundred to several thousand soldiers and dependents during<br />
the pre- to post- WWII era before Midway was transferred to the U.S. Fish and Wildlife Service (USFWS)<br />
in 1996. Human population levels have been very small during the past several decades elsewhere in the<br />
NWHI, with only a few workers and volunteers now at the permanent wildlife stations at Laysan, French Frigate<br />
Shoals, and Midway, and the seasonal wildlife camps at Kure, Lisianski, and Pearl and Hermes. Due to the<br />
lack of any coastal development in the NWHI, runoff-induced impacts to nearshore reefs are non-existent.<br />
Coastal Pollution<br />
While no National Pollutant Discharge Elimination System (NPDES) permits or other industry permits were<br />
present in the NWHI, there has been a diverse history of use including: guano mining, fishing camps, USCG<br />
LORAN stations, U.S. Navy airfields and bases, and various Cold War missions. This history of use has left a<br />
legacy of contamination on many of the atolls. Contamination at all these sites includes offshore debris such<br />
as batteries (lead and mercury), transformers, capacitors, and barrels of chemical waste. Uncharacterized,<br />
unlined landfills remain on all of these islands. Specific known areas of contamination are the following:<br />
Kure and French Frigate Shoals both have point sources of polychlorinated biphenyls (PCBs) due to former<br />
USCG LORAN stations. While the USCG has mounted cleanup actions at both sites, contamination remains<br />
and is found in island soils and in nearshore sediments and biota.<br />
French Frigate Shoals and Pearl and Hermes were both used for WWII seaplane refueling. This activity is<br />
suspected to have been a source of petroleum contamination during operations.<br />
Midway Atoll was the site of a U.S. Navy airfield. Before transfer to the U.S. Department of the Interior in 1996,<br />
the Naval installation was part of the Base Realignment and Closure (BRAC) that identified and cleaned up<br />
numerous contaminated sites throughout the Atoll. Contamination identified and remediated included petroleum<br />
in the groundwater and nearshore waters, pesticides (e.g., DDT) in the soil, PCBs in soil, groundwater,<br />
and nearshore sediments and biota, metals such as lead and arsenic in soil and nearshore waters, and unlined,<br />
uncharacterized landfills. See the BRAC documents for a complete inventory (http://www.defenselink.<br />
mil/brac/). While most of the known areas were remediated, several areas warrant continued monitoring for<br />
potential releases. Since closure, the Navy has returned on several occasions for further remediation.<br />
Plutonium from the aboveground nuclear tests at Johnston Atoll in the 1960s has been detected in corals at<br />
French Frigate Shoals, 700 miles to the north. Finally, floating debris is a constant source of potential contamination<br />
to the islands and surrounding waters. A container of the pesticide carbofuran is suspected to have<br />
washed ashore at Laysan and killed many invertebrates. Named the ‘Dead Zone’, the area remained a hazard<br />
on the Island from 1987 until remediated by the USFWS in 2002. Debris continues to wash ashore on all of<br />
the islands and can cause localized adverse impacts. At Laysan, debris washed ashore or found in the surf<br />
over the last year has included unmarked bottles, military flares, a barrel marked diisocyanate (a carcinogen),<br />
and petroleum.<br />
Tourism and Recreation<br />
Tourism, sport fishing, recreational boating, and diving are not compatible with protection of fish and wildlife<br />
and their habitats in the Hawaiian Islands National Wildlife Refuge, and therefore are not permitted. Uses,<br />
such as research, that improve management of fish and wildlife are regulated through Special Use Permits<br />
issued by the USFWS. Midway Atoll National Wildlife Refuge (NWR) promotes visitor use including diving,<br />
snorkeling, beachgoing, nature photography, guided tours, birding, historical tours, and catch-and-release<br />
sport fishing. Visitor use in recent years, however, has been limited by the lack of routine, affordable air charter<br />
service to transport visitors to and from Midway Atoll NWR.
The State of Coral Reef Ecosystems of the Northwestern Hawaiian Islands<br />
Fishing<br />
Fishing and other resource extraction in the NWHI have been mostly limited to two commercial fisheries: the<br />
ongoing NWHI bottomfish fishery, and the now-closed NWHI lobster trap fishery. The bottomfish fishery has<br />
targeted several species of deepwater (generally >130-200 m) snappers (Lutjanidae) and one endemic species<br />
of epinepheline grouper (Serranidae) out of a total of a dozen common Bottomfish Management Unit<br />
Species (BMUS; WPFMC, 2004). This fishery is divided into two management zones: the Mau zone, which is<br />
closer to the MHI, and the more distant Hoomalu zone. The lobster trap fishery, which had historically targeted<br />
only the endemic Hawaiian spiny lobster, Panulirus marginatus, began targeting the non-endemic slipper<br />
lobster, Scyllarides squammosus, in 1998. The NWHI lobster trap fishery closed in 2000 because of growing<br />
uncertainty in the population models used to assess stock status (DeMartini et al., 2003).<br />
Relatively few BMUS are conspicuous members of the shallow-reef ecosystem (
Northwestern Hawaiian Islands<br />
page<br />
278<br />
The State of Coral Reef Ecosystems of the Northwestern Hawaiian Islands<br />
cial fishing using bottom longlines to<br />
catch reef sharks was conducted at<br />
French Frigate Shoals and nearby<br />
banks in the year 2000. During one<br />
21-day fishing trip, the vessel caught<br />
990 sharks in the NWHI consisting<br />
mainly of sandbar shark, Carcharhinus<br />
plumbeus (69%), Galapagos<br />
shark, Carcharhinus galapagensis<br />
(18%), and tiger shark, Galeocerdo<br />
cuvier (10%) (Vatter, 2003). Extraction<br />
of shallow reef fishes in the<br />
NWHI for the ornamental trade has<br />
been almost non-existent due to their<br />
relatively inaccessible location and<br />
the establishment of the NWHI Coral<br />
Reef Ecosystem Reserve (CRER) in<br />
January 2001. Extraction of food and<br />
aquarium fish by recreational fishers<br />
has similarly been protected (and recently<br />
prohibited in Federal waters)<br />
and is currently being proposed for<br />
closure in State waters. Collections<br />
of voucher and other research specimens<br />
of shallow-water reef fishes,<br />
corals, other invertebrates, and algae<br />
in the NWHI has been periodic (typically<br />
late summer) and of trivial magnitude<br />
(less than several hundred<br />
pieces weighing less than a few tens<br />
of kilograms in aggregate, per year).<br />
All such activity continues to be regulated<br />
by NWR Special Use Permits,<br />
which are issued only to qualified researchers<br />
by the USFWS, and State<br />
of Hawaii Scientific Collecting Permits.<br />
Figure 10.10. Time series plots of the NWHI commercial trap catch. Upper panel:<br />
Hawaiian spiny lobster landings (no. of lobsters x 1000), and effort (no. of trap-hauls x<br />
1000); Lower panel: Total spiny lobster CPUE at Necker Bank, during the 1983-1999<br />
comercial fishing seasons and as assessed on 1988-1999 lobster research cruises.<br />
Source: DeMartini et al., 2003.<br />
Trade in Coral and Live Reef Species<br />
Several species of reef fish found in the NWHI are highly desirable in the live aquarium fish trade. Of these,<br />
the endemic masked angelfish (Genicanthus personatus, Figure 10.11) is the most prized (R. Pyle, pers.<br />
comm.). Although two attempts have been made in recent years to access the NWHI to collect Genicanthus<br />
for the aquarium trade outside of Federally protected waters, the logistical and financial challenges of mounting<br />
such collecting trips and the difficulty of transporting live fish back to market in good condition have precluded<br />
any further efforts to obtain these fish.<br />
Recently, the Waikiki Aquarium has spawned and reared masked angelfish in captivity (Debelius et al., 2003).<br />
With the feasibility of aquaculture of this species demonstrated, it is unlikely that a cost-effective commercial<br />
fishery for this species will ever exist in the NWHI. Other desirable aquarium species found in the NWHI, such<br />
as the Japanese angelfish (Centropyge interrupta, Figure 10.11) are not endemic, are available from more<br />
accessible localities for the aquarium trade, and have also been spawned and reared in captivity.
The State of Coral Reef Ecosystems of the Northwestern Hawaiian Islands<br />
Figure 10.11. Left photo shows Endemic masked angel (Genicanthus personatus), and right photo shows Japanese angelfish (Centropyge<br />
interrupta). Both are valuable aquarium fish species. Photos: J. Watt.<br />
Commercial harvesting of live coral for the aquarium trade is not known to have occurred in the NWHI and is<br />
now illegal or unauthorized within the NWHI CRER and the two NWRs and is also illegal within State waters.<br />
Table coral (Acropora cytherea) and several congeners are essentially absent in the MHI but are common at<br />
French Frigate Shoals and neighboring reefs in the NWHI (Grigg et al., 1981; Grigg, 1981; Maragos et al.,<br />
2004). However, A. cytherea is also common at many readily accessible locales throughout the Indo-Pacific<br />
region, and it is unlikely that an economically viable and legal fishery for live corals could exist in the remote<br />
NWHI. Still, one dead specimen of A. cytherea attributed to the NHWI was available for sale on eBay in<br />
2002.<br />
Ships, Boats, and Groundings<br />
The NWHI region has a wide variety of submerged artificial structures including shipwrecks, aircraft wrecks,<br />
submerged landings, and unexploded ordinance. The systematic investigation of these objects in the NWHI<br />
began in 2002. Currently there are 52 known shipwrecks in the region, including rafts, whaling vessels, navy<br />
frigates, tankers, and modern fishing boats. Approximately 12 vessels have been located. In addition there<br />
are 67 known plane losses in the region, mainly naval aircraft from WWII, although only two have been located.<br />
Some of these ship and aircraft wreck sites fall into the category of war graves associated with major<br />
historic events. Unexploded ordinance and debris also exists in discrete locations.<br />
Wrecks of historic sailing vessels in high energy environments are considered artifact “scatter sites”, and do<br />
not pose an immediate or critical threat to their surroundings. The preservation and management of heritage<br />
resources are mandated by state and Federal laws. More modern shipwrecks, such as the fishing vessels<br />
Hoei Maru #5 and Paradise Queen II at Kure, or the tanker Mission San Miguel lost at Maro Reef, are greater<br />
threats to reef ecosystems. NOAA’s Damage Assessment Center maintains a list of sites for the NWHI.<br />
Mechanical damage from the initial grounding, subsequent re-deposition of wreck material by storm surge,<br />
fishing gear damage to reef and species, and fuel/oil or hazardous contents are all issues to be considered in<br />
protecting the integrity of the environment. Understanding the difference between historic wrecks and modern<br />
wrecks is crucial to proper (and legal) remediation and restoration efforts.<br />
<strong>Marine</strong> Debris<br />
<strong>Marine</strong> debris, mostly derelict fishing gear from distant fisheries around the Pacific Rim, is one of the greatest<br />
anthropogenic impacts to the reefs of the NWHI. These large nets damage corals and create an entanglement<br />
problem for monk seals, seabirds, and other marine organisms. Since 1996, the NOAA Fisheries Pacific Islands<br />
Fisheries Science Center (PIFSC), has led a highly successful multi-agency effort to remove and recycle<br />
over 329 metric tons of derelict fishing gear and other marine debris from the coral reef ecosystems of the<br />
NWHI (Table 10.2). The PIFSC Coral Reef Ecosystem Division (CRED) collaborates with NOAA’s National<br />
Ocean Service, NWHI Ecological Reserve, State of Hawaii, City and County of Honolulu, USFWS, USCG, U.S.<br />
Sidebar<br />
Northwestern Hawaiian Islands<br />
page<br />
279
Northwestern Hawaiian Islands<br />
page<br />
280<br />
The State of Coral Reef Ecosystems of the Northwestern Hawaiian Islands<br />
Table 10.2. <strong>Marine</strong> debris collection (kg) in the NWHI since 1996. Source: PIFSC-CRED.<br />
<strong>REEF</strong> 1996/1997 1998 1999 2000 2001 2002 2003 TOTAL<br />
KUR 3,298 23,516 1,567 1,227 29,608<br />
MID 9,091 7,457 18,620 35,168<br />
P&H 2,223 8,676 9,866 30,501 92,955 83,030 227,251<br />
LIS 5,444 2,035 830 1,087 3,589 12,985<br />
LAY 1,075 1,231 2,155 4,461<br />
FFS 2,145 7,500 2,145 5,625 432 2,246 20,093<br />
Total 4,368 7,500 25,356 22,656 61,547 97,272 110,867 329,566<br />
Navy, University of Hawaii, Sea Grant, Hawaii Metals and Recycling, Honolulu Waste Disposal, and other local<br />
agencies, businesses, and non-governmental partners. Additional shore- and land-based recovery of derelict<br />
fishing gear was conducted in cooperation with the NOAA monk seal field camp, State of Hawaii, and USFWS.<br />
The primary goals of these efforts have been to assess, document, and remove derelict fishing gear from the<br />
coral reef ecosystems of the NWHI. In addition, strategic research has been conducted to better understand<br />
the dynamics of marine debris, particularly accumulation rates and estimates for specific sites labeled High<br />
Entanglement Risk Zones (HERZ) for endangered Hawaiian monk seals (Monachus schauninslandi). <strong>Marine</strong><br />
debris survey and collection activities have been conducted at Kure, Midway, Pearl and Hermes, Lisianski,<br />
Laysan and French Frigate Shoals.<br />
The past and current marine debris removal operations have targeted the accumulation in the NWHI over the<br />
past several decades, with tremendous success in both the direct removal of debris from the ecosystem and<br />
increasing public awareness of the issue. Based on the amount removed to date, it is estimated that at most,<br />
1,000 tons of debris have accumulated in the NWHI over the past several decades. Assuming accumulation<br />
rates have been relatively constant over the past four decades, long-term average accumulation rates are approximately<br />
25 tons per year. At Kure, annual towboard surveys of the HERZ along the northeastern edge of<br />
Green Island elicited evidence of marine debris accumulation (2002: 63 nets/km 2 ; 2003: 73 nets/km 2 ).<br />
Until substantial efforts are made to significantly reduce the sources of debris and until debris can be effectively<br />
removed at sea, similar amounts are expected to continue accumulating indefinitely in the reef ecosystems<br />
of the NWHI.<br />
Aquatic Invasive Species<br />
Aquatic invasive species in the NWHI have only recently become an issue of interest, which has been driven<br />
by survey efforts in the MHI. The status of the taxonomy of many non-coral marine invertebrate groups is<br />
not fully developed for the NWHI and this does not allow comprehensive species inventories to be produced,<br />
although efforts to correct this are presently underway. In addition, when large-scale faunal surveys began in<br />
shallow water coral reef habitats in the NWHI in 2000 only two expeditions with such a focus had ever been to<br />
the area during the previous 100 years.<br />
The data concerning marine aquatic invasive species in the NWHI was collected from a single focused marine<br />
invasive species survey by the Bishop Museum at Midway and from multidiscipline efforts conducted under<br />
the auspices of the Northwestern Hawaiian Islands Rapid Assessment and Monitoring Program (NOWRAMP)<br />
in 2000 and 2002, and the PIFSC-CRED efforts in 2000, 2002, and 2003.<br />
Results of these efforts have recorded a total of eleven aquatic invasive marine invertebrate, fish, and algal<br />
species in the NWHI. Table 10.3 shows the species, their native ranges, their present status in the NWHI, and<br />
the hypothesized or documented mechanism of their introduction. The magnitude of the problem of aquatic<br />
invasive species is far greater in the MHI than the NWHI. Efforts in the NWHI should be focused on minimizing<br />
the likelihood of these remote habitats being exposed to aquatic invasive species through anthropogenic<br />
means. This can be achieved by outreach and education directed towards all activities that have the potential<br />
for acting as mechanisms of transport.
The State of Coral Reef Ecosystems of the Northwestern Hawaiian Islands<br />
Table 10.3. <strong>Marine</strong> invasive species in the NWHI. Sources: Zabin et al., 2003; Godwin, 2002; DeFelice et al., 2002; Godwin, 2000;<br />
DeFelice et al., 1998.<br />
SPECIES TAXA NATIVE RANGE PRESENT STATUS IN<br />
NWHI<br />
Hypnea musciformis Algae Unknown;<br />
Cosmopolitan<br />
Not Established; in drift<br />
only (MAR)<br />
Diadumene lineata Anemone Asia Unknown; on derelict net<br />
only (P&H)<br />
Pennaria disticha Hydroid Unknown;<br />
Cosmopolitan<br />
Established (P&H, LAY,<br />
LIS, KUR, MID)<br />
MECHANISM <strong>OF</strong> INTRODUCTION<br />
Intentional introduction to MHI<br />
(documented)<br />
Derelict fishing net debris<br />
(documented)<br />
Fouling on ship hulls (hypothesized)<br />
Balanus reticulatus Barnacle Atlantic Established (FFS) Fouling on ship hulls (hypothesized)<br />
Balanus venustus Barnacle Atlantic and Caribbean Not Established; on vessel<br />
hull only (MID)<br />
Fouling on ship hulls (documented)<br />
Chthamalus proteus Barnacle Caribbean Established (MID) Fouling on ship hulls (hypothesized)<br />
Amathia distans Bryozoan Unknown;<br />
Cosmopolitan<br />
Schizoporella errata Bryozoan Unknown;<br />
Cosmopolitan<br />
Lutjanus kasmira Fish Indo-Pacific Established (NIH, NEC,<br />
FFS, MAR, LAY, and MID)<br />
Cephalopholis argus Fish Indo-Pacific Established (NIH, NEC,<br />
FFS)<br />
Established (MID) Fouling on ship hulls (hypothesized)<br />
Established (MID) Fouling on ship hulls (hypothesized)<br />
Intentional introduction to MHI<br />
(documented)<br />
Intentional introduction to MHI<br />
(documented)<br />
Lutjanus fulvus Fish Indo-Pacific Established (NIH and FFS) Intentional introduction to MHI<br />
(documented)<br />
Eleven species of shallow-water snapper (Lutjanidae) and grouper (Serranidae) were purposefully introduced<br />
to the main islands of the Hawaiian Archipelago in the late 1950s and early 1960s. Two snappers, the<br />
bluestripe snapper (Lutjanus kasmira) and the blacktail snapper (L. fulvus), and one grouper, the peacock<br />
grouper (Cephalopholis argus), are well-established and have documented patterns of colonization along the<br />
island chain (Randall, 1987).<br />
Bluestripe snappers have been by far the most successful fish introduction to the Hawaiian coral reef ecosystem.<br />
From some 3,200 individuals introduced on the island of Oahu in the 1950s, the population has expand-<br />
ed its range widely and has been reported as far north as Midway in the NWHI (~2,400 km; Figure 10.12.).<br />
These records suggest a dispersal<br />
rate of about 33-130 km/yr. The other<br />
two species have only been recorded<br />
as far north as French Frigate Shoals<br />
and are present in much lower numbers<br />
than bluestripe snappers.<br />
Security Training Activities<br />
Areas between Kauai and Nihoa are<br />
sometimes subjected to closure when<br />
missile tests are conducted at the Pacific<br />
Missile Testing Range on Kauai.<br />
Offshore Oil and Gas Exploration<br />
No offshore oil or gas exploration occurs<br />
in Hawaii.<br />
Figure 10.12. The spread of bluestripe snapper, Lutjanus kasmira, throughout the<br />
Hawaiian archipelago. Map: A. Shapiro. Source: Sladek-Nowlis and Friedlander,<br />
2004.<br />
Sidebar<br />
Northwestern Hawaiian Islands<br />
page<br />
281
Northwestern Hawaiian Islands<br />
page<br />
282<br />
The State of Coral Reef Ecosystems of the Northwestern Hawaiian Islands<br />
<strong>CORAL</strong> <strong>REEF</strong> ECOSYSTEMS—DATA-GATHERING ACTIVITIES AND RESOURCE CONDITION<br />
Description of Coral Reef Monitoring, Research and Assessment Activities<br />
The monitoring programs that are currently collecting data in the NWHI are listed in Table 10.4. Many of the<br />
locations where monitoring has occurred recently are shown in Figure 10.13.<br />
Table 10.4. Monitoring programs in the NWHI.<br />
MONITORING PROGRAM OBJECTIVES YEAR<br />
EST.<br />
Northwestern Hawaiian<br />
Islands Reef Assessment and<br />
Monitoring Program<br />
Monk Seal Forage Base<br />
Study<br />
Monitor fishes, algae, coral and other<br />
invertebrates<br />
Track the temporal dynamics of the<br />
shallow-reef fish forage base of monk<br />
seals<br />
<strong>Marine</strong> debris program Oceanographic conditions and the<br />
rate of marine debris accumulation<br />
2000 NOAA,<br />
USFWS,<br />
HCRI<br />
FUNDING AGENCIES<br />
1992-2000 NOAA PIFSC<br />
PIFSC-CRED, DAR,<br />
USFWS, UH, NOS,<br />
numerous other institutions<br />
1996 NOAA PIFSC-CRED, UH,<br />
USFWS, DAR, USCG<br />
Oceanography program Water chemistry, circulation patterns 2000 NOAA PIFSC-CRED, UH<br />
Fishery independent lobster Monitor lobster using fishery- 1983 NOAA PIFSC<br />
monitoring<br />
independent sampling<br />
Fishery Monitoring and<br />
Economics Program<br />
Fisheries catch and effort statistics 1948 NOAA PIFSC, DAR<br />
<strong>Marine</strong> mammal research Monitor and assess reproductive 1985 NOAA PIFSC, USFWS<br />
program<br />
subpopulations<br />
<strong>Marine</strong> turtle research Monitor selected sea turtle breeding 1973* NOAA, PIFSC, USFWS<br />
program<br />
sites<br />
USFWS<br />
Seabird monitoring Monitor selected nesting seabird 1978 USFWS USFWS<br />
species<br />
(Albatross<br />
annually)<br />
Coral monitoring Monitoring of coral at permanent sites 2000 HCRI,<br />
USFWS<br />
USFWS, PIFSC-CRED<br />
PIFSC – Pacific Islands Fisheries Science Center<br />
CRED – Coral Reef Ecosystem Division, PIFSC, NOAA Fisheries<br />
DAR – Hawaii Division of Aquatic Resources, Department of Land and Natural Resources<br />
USFWS – U.S. Fish and Wildlife Service<br />
NOS – NOAA Ocean Service<br />
UH – University of Hawaii<br />
HICRI – Hawaii Coral Reef Initiative<br />
*USFWS personnel stationed at French Frigate Shoals since 1978 to monitor turtle breeding sites.
Figure 10.13. Monitoring locations in the NWHI. Map: A. Shapiro.<br />
The State of Coral Reef Ecosystems of the Northwestern Hawaiian Islands<br />
Sidebar<br />
Northwestern Hawaiian Islands<br />
page<br />
283
Northwestern Hawaiian Islands<br />
page<br />
284<br />
The State of Coral Reef Ecosystems of the Northwestern Hawaiian Islands<br />
OCEANOGRAPHIC CONDITIONS AND WATER QUALITY<br />
The health, functioning, and biogeography of the coral reef ecosystems of the NWHI are affected by the<br />
oceanographic conditions to which the fish, algae, corals, and other invertebrates of the ecosystem are exposed.<br />
These biological components depend on the time-varying ocean currents, waves, temperature, salinity,<br />
turbidity, nutrients, other measures of water quality, and other oceanographic conditions. As these conditions<br />
change, so do the health, distribution, and species diversity of each reef community. Table 10.5 provides<br />
a list of long-term oceanographic and water quality monitoring programs in place in the NWHI. Figure 10.14<br />
shows the station locations of many of these monitoring systems.<br />
Ocean Currents<br />
Ocean currents transport and distribute larvae among and between different atolls, islands, and submerged<br />
banks of the NWHI, and also provide the mechanism by which species are distributed to and from the MHI,<br />
as well as far distant regions. The relatively low species diversity and high endemism of the NWHI are the<br />
result of the relative oceanographic isolation of the Hawaiian Archipelago. Ocean currents are measured and<br />
monitored in the NWHI in many different ways (Table 10.4). Since 1990, ocean current profiles along the Ha-<br />
Table 10.5. Long-term oceanographic and water quality monitoring programs in the NWHI. Source: PIFSC-CRED.<br />
SYSTEM VARIABLES MONITORED DATES AGENCY<br />
Deepwater CTD* - 10 sites (NIH, temperature, salinity, dissolved May 1998 - present PIFSC-CRED<br />
NEC, FFS, GAR, MAR, LAY, LIS, oxygen, and chlorophyll versus<br />
P&H, MID, KUR)<br />
depth to a depth of 500 m<br />
Shallow-water CTD* -<br />
temperature, salinity, turbidity Sept. 2001 - PIFSC-CRED<br />
multiple sites each island/atoll<br />
present<br />
Coral Reef Early Warning System Standard: temperature (1 m), Oct. 2001 - present PIFSC-CRED<br />
(CREWS) Buoys - 4<br />
salinity, wind, atmospheric<br />
Standard (P&H, MAR, KUR), 1 pressure, Enhanced: Std plus<br />
Enhanced – (FFS)<br />
ultraviolet radiation, photosynthetic<br />
active radiation<br />
Sea Surface Temperature (SST)<br />
Buoys – 4 (NEC, LAY, LIS, MID)<br />
Temperature at 0.5 m Oct. 2001 - present PIFSC-CRED<br />
Subsurface Temperature Recorders Temperature at depths between 0.5 Oct. 2002 - present PIFSC-CRED<br />
(STR) – 22<br />
m and 5 m<br />
Ocean Data Platforms (ODP) – 2 temperature, salinity, spectral Oct. 2002 - present PIFSC-CRED<br />
(NEC, MID)<br />
directional wave motion, current<br />
profiles<br />
Wave and Tide Recorders (WTR) spectral wave motion, tides, July 2003 - present PIFSC-CRED<br />
– 4 (P&H, KUR)<br />
temperature<br />
Drifter Buoys temperature, surface circulation 2001 (6), 2002 (10), PIFSC-CRED<br />
(location)<br />
2003 (8)<br />
Autonomous Profiling Explorer temperature, surface circulation 2002 (6) PIFSC-CRED<br />
(APEX) Floats<br />
(location)<br />
Tide Gauges tidal fluctuations, sea level FFS=1974-present,<br />
MID=1947-present<br />
UH Sea Level Center<br />
Wave Monitoring Buoys wave height & period, wind speed 1980 - present NOAA National Weather<br />
& direction, atmospheric pressure,<br />
Service, National Data Buoy<br />
temperature<br />
Center<br />
Satellite Remote Sensing sea surface temperature, winds, SST -1981 NOAA Satellites and<br />
sea surface height, ocean color SSH – 1992<br />
Wind – 1995<br />
Ocean Color - 1994<br />
Information, Hawaii Coastwatch<br />
Model Fields waves / surface circulation NOAA National Weather<br />
Service, Wave Watch 3<br />
Naval Research <strong>Laboratory</strong>,<br />
Navy Coastal Ocean Model<br />
* CTD: Conductivity, Temperature and Depth
waiian Archipelago have been measured<br />
using acoustic Doppler current<br />
profilers (ADCP) aboard the NOAA<br />
ships Townsend Cromwell (1990 to<br />
2002) and Oscar Elton Sette (2003<br />
to present) during routine transects<br />
along the archipelago to support an<br />
array of scientific cruises for PIFSC.<br />
Based on 10 years of ADCP data<br />
during the period 1990 to 2000, Firing<br />
et al. (2004a) demonstrate that<br />
upper ocean currents in the NWHI<br />
are highly variable in both speed and<br />
direction, being dominated by eddy<br />
variability. Averaged over time, the<br />
resultant mean flow of the surface<br />
waters tend to flow predominantly<br />
from east to west in response to the<br />
prevailing northeast tradewinds (Figure<br />
10.15). The lack of coral reef<br />
ecosystems to the east, or upstream,<br />
of the Hawaiian Archipelago and the<br />
generally low biodiversity to the east<br />
explains the low species richness<br />
and high endemism. Surface Velocity<br />
Program (SVP) current drifters<br />
and autonomous profiling explorer<br />
(APEX) drifters have also been deployed<br />
in the NWHI by PIFSC annually<br />
since 2001. These SVP and<br />
APEX drifters provide indications of<br />
the Lagrangian (or water-following)<br />
flow, thereby representing potential<br />
larval pathways. Similar to the ADCP<br />
measurements, the drifters show significant<br />
eddy variability and a general<br />
surface flow from east to southwest<br />
(in 2001-2002) and northwest (in<br />
2003) (Figure 10.16). Interestingly,<br />
two of the six APEX drifters deployed<br />
near Nihoa and Necker in 2001 were<br />
advected close to Johnston and then<br />
moved back northward toward the<br />
The State of Coral Reef Ecosystems of the Northwestern Hawaiian Islands<br />
Figure 10.14. Long-term oceanographic monitoring stations in the NWHI. Wave and<br />
Tide Recorder (WTR) stations are indicated by yellow crosses. Ocean Data Platform<br />
(ODP) locations are indicated by green asterisks. Enhanced CREWS stations are<br />
indicated by orange triangles. Standard CREWS stations are indicated by green<br />
triangles. SST buoys are indicated by purple circles. Permanent deepwater CTD<br />
stations are indicated by red stars. Source: Hoeke et al., 2004a, b.<br />
Figure 10.15. ADCP data from 1990 to 2000 averaged over time. The upper ocean<br />
currents in the NWHI are highly variable in both speed and direction, being dominated<br />
by eddy variability. The resultant mean flow of the surface waters tends to flow<br />
predominantly from east to west in response to the prevailing northeast tradewinds.<br />
Source: Firing et al., 2004a.<br />
NWHI, suggesting the larval link between Johnston and the NWHI (Firing et al., 2004a). Spatial maps of<br />
ocean currents in the vicinity of the NWHI are also computed from satellite observations of sea surface height<br />
from the TOPEX Poseidon and JASON altimetric satellites (Polovina et al., 1995). In recent years, the PIFSC<br />
has also deployed ADCP moorings at Southeast Brooks Bank (1998-1999), Necker (2003-2004) and Midway<br />
(2003-2004) to look more closely at temporal variability of ocean currents over submerged banks and reef<br />
habitats in the NWHI.<br />
Ocean Waves<br />
Among each of the islands, atolls, and submerged banks of the NWHI, the distributions of species of corals<br />
and algae, and their associated fish and invertebrate assemblages are often determined not only by the ocean<br />
currents, but also by the exposure to ocean waves. Many species of corals and algae can survive in sheltered<br />
Sidebar<br />
Northwestern Hawaiian Islands<br />
page<br />
285
Northwestern Hawaiian Islands<br />
page<br />
286<br />
The State of Coral Reef Ecosystems of the Northwestern Hawaiian Islands<br />
Figure 10.16. Satellite-tracked drifter tracks from SVP drifters deployed along the<br />
NWHI in 2001 (reds), 2002 (greens), and 2003 (blues). Source: Firing et al., 2004b.<br />
x 10 5<br />
Figure 10.17. Time series of wave power computed from wave data from NOAA<br />
Buoy #51001 located near Nihoa Island in the NWHI. Data courtesy of NOAA Data<br />
Buoy Center. Source: Brainard et al., 2004.<br />
or quiescent habitats. Other species<br />
can survive or even thrive in the highenergy<br />
habitats of the surf zones on<br />
the northwestern facing reefs that<br />
are exposed to tremendous waves<br />
caused by winter storms across the<br />
North Pacific. The less hardy species<br />
cannot survive the pounding by<br />
these large winter waves.<br />
Significant wave events vary over<br />
interannual (between year) and<br />
decadal time scales (Figure 10.17).<br />
Interannually, some years experience<br />
greater or lesser amounts of<br />
cumulative wave energy or numbers<br />
of extreme wave events than other<br />
years. This temporal variability of<br />
wave power allows expansions and<br />
retractions of the spatial and vertical<br />
ranges of the some species during<br />
relatively quiescent and turbulent<br />
years, respectively. Over the past 20<br />
years, wave measurements at NOAA<br />
buoy 51001 (near Nihoa Island in<br />
the NWHI) show a pattern of anomalously<br />
high numbers of extreme wave<br />
events during the periods 1985-1989<br />
and 1998-2002 and anomalously low<br />
numbers of extreme wave events in<br />
the early 1980s and the period 1990-<br />
1996. This apparent decadal variability<br />
of wave power is possibly related<br />
to well-documented Pacific Decadal<br />
Oscillation (PDO) events, which are<br />
a mode of North Pacific climate variability<br />
at multi-decadal time scales<br />
that has widespread climate and ecosystem<br />
impacts (Mantua et al., 1997).<br />
Studies have shown decadal oscilla-<br />
tions of various components of NWHI ecosystems (lobsters, monk seals, seabirds, etc.) relate to larger scale<br />
climate shifts across the North Pacific (Polovina et al., 1995).<br />
Ocean temperatures<br />
While coral bleaching can be caused by a wide range of environmental variables acting alone or in combination<br />
(Jokiel and Brown, 2004), the predominant cause of increasing incidences of coral bleaching globally is<br />
believed to be anomalously warm water temperatures (Jokiel and Coles, 1990; Kenyon et al., in review). Because<br />
of the significant influence of temperature on coral reef ecosystem health, observations of temperature<br />
in the NWHI are collected by a wide array of instruments and platforms, including satellite remote sensing<br />
of SST using Advanced Very High Resolution Radiometer (AVHRR), moored surface buoys and subsurface<br />
temperature recorders, closely-spaced conductivity-temperature-depth profiles (CTD casts) in shallow water/<br />
nearshore reef habitats, broadly-spaced shipboard deep water CTD casts to depths of 500 m, and satellitetracked<br />
SVP drifters (Table 10.5).
The coral reefs of the NWHI are exposed<br />
to large seasonal temperature<br />
fluctuations, particularly Kure, Midway,<br />
and Pearl and Hermes Atolls at<br />
the northwestern end of the archipelago.<br />
SSTs at these northerly atolls<br />
range from less than 18°C in late<br />
winter of some years (17°C in 1997)<br />
to highs exceeding 28°C in the late<br />
summer months of some years (29°C<br />
in 2002) (Figure 10.18). Compared<br />
with most reef ecosystems around<br />
the globe, the annual fluctuations of<br />
SST of about 10°C at these northerly<br />
atolls is extremely high. While<br />
the summer temperatures are generally<br />
similar along the entire NWHI,<br />
the warmest summer temperatures<br />
tend to occur at the three northernmost<br />
atolls, presumably caused by<br />
reduced mixing due to weaker winds<br />
The State of Coral Reef Ecosystems of the Northwestern Hawaiian Islands<br />
Figure 10.18. Time series of Pathfinder SST at key islands and atolls of the NWHI<br />
from KUR to Oahu (OAH) between 1984 and 2004. Blue colors=northerly atolls and<br />
red colors=Kauai (KUA) and OAH in the Main Hawaiian Islands. Data provided by<br />
NOAA Satellites and Information, Hawaii CoastWatch. Source: Hoeke et al., 2004b.<br />
(situated closer to the center of the North Pacific high pressure ridge) and decreased circulation due to large<br />
shallow water lagoons (Brainard et al., 2004; Hoeke et al., 2004a, b). The winter temperatures tend to be<br />
3-7°C cooler at the northerly atolls than at the southerly islands and banks as the subtropical front migrates<br />
southward. These cooler winter temperatures are thought to reduce coral growth rates.<br />
In addition to the strong annual cycle, SST observations show significant interannual and decadal variability<br />
(Figure 10.18). The highest summer maximum SSTs at the northern atolls occurred during the summers<br />
of 1987, 1991, and 2002, possibly suggesting a teleconnection with El Niño Southern Oscillation (ENSO)<br />
events. Winter minimum temperatures at the northern atolls appear to oscillate over a longer time period, as<br />
indicated by a significant warming of winter SSTs beginning in 1999 and lasting for several years (Brainard et<br />
al., 2004).<br />
During the period between July and<br />
September 2002, ocean temperatures<br />
along the Hawaiian Archipelago<br />
were anomalously warm (Figure<br />
10.19). According to NOAA’s Coral<br />
Reef Watch Program, temperatures<br />
exceeded the coral bleaching threshold<br />
for four consecutive Degree<br />
Heating Weeks. As discussed elsewhere<br />
in this report, this resulted in<br />
widespread mass coral bleaching of<br />
many species of coral in shallow water<br />
habitats, particularly at the three<br />
northernmost atolls. While warming<br />
is common during the late summer<br />
months, this extreme warming event,<br />
and the resulting coral bleaching is<br />
believed to have been caused by<br />
anomalously low wind speeds during<br />
the period (Hoeke et al., 2004a, b).<br />
Figure 10.19. Satellite-derived wind speed and SST along Hawaiian Archipelago<br />
from Oahu (OAH) to KUR during 2002. The warming event associated with the 2002<br />
coral bleaching followed periods of light winds at the northernmost atolls. Source:<br />
Hoeke et al., 2004a, b.<br />
Sidebar<br />
Northwestern Hawaiian Islands<br />
page<br />
287
Northwestern Hawaiian Islands<br />
page<br />
288<br />
The State of Coral Reef Ecosystems of the Northwestern Hawaiian Islands<br />
Nutrients<br />
Satellite observations of ocean color from the National Aeronautics and Space Administration’s (NASA) Seaviewing<br />
Wide Field-of-view Sensor (SeaWiFS) reveal a significant chlorophyll front associated with the subtropical<br />
front, with high chlorophyll north of the front and low oligotrophic waters south of the front. These<br />
observations reveal significant seasonal and interannual migrations of the front northward during the summer<br />
months and southward during the winter months (Seki et al., 2002). The southward migration of the subtropical<br />
front generally brings these high chlorophyll waters to intersect the northern portions of the NWHI. During<br />
some years, these winter migrations of the subtropical front extend southward to include the southern end of<br />
the NWHI. Additional evidence suggests decadal scale movements in the southward extent of the subtropical<br />
front. During periods when high chlorophyll waters intersect the NWHI, overall productivity of the effected<br />
reef ecosystems is expected to be elevated. Changes across many trophic levels of the NWHI ecosystem are<br />
believed to be associated with these migrations (Polovina et al., 1995).<br />
BENTHIC HABITATS<br />
<strong>CORAL</strong><br />
Coral abundance, distribution, condition, biodiversity, and population structure in the NWHI were surveyed at<br />
more than 536 sites between 2000 and 2003. Several techniques were used: towed diver video surveys each<br />
averaging approximately 2 km in length, rapid ecological assessments (REA) each covering between 1000-<br />
5000 m 2 per site, photo-quadrat/video surveys at permanently marked 50-100 m transects, settlement and<br />
recruitment studies at six of the NWHI, and directed observations on coral disease, predation, and bleaching<br />
at all of the NWHI except Nihoa. Initially, the REA protocols focused on video-taping two 25 m transects at<br />
each site and visually inventorying species and estimating their relative abundance in broader surrounding<br />
areas. In 2002, the protocols were revised to shift towards in situ quantitative coral population data collection<br />
along the first two 25 m transects. The revised REA protocols are described in Maragos et al. (2004) and were<br />
used during the 2002 and 2003 surveys.<br />
Coral species inventories and distribution from REAs<br />
REA surveys at 465 discreet sites on 11 reefs in the NWHI inventoried coral species, their relative abundances,<br />
and their distributions during 2000-2002. Surveys (462) around the 10 islands were in depths of ≤20 m,<br />
and three surveys on the submerged Raita Bank were in depths of 30-35 m. Results include 11 first records<br />
for stony coral species in the Hawaiian Archipelago, and 29 species range extensions to the NWHI. Several<br />
species may be new to science. There are now 57 stony coral species known in the shallow subtropical waters<br />
of the NWHI (Table 10.6), similar to the 59 shallow and deepwater species known in the better-studied and<br />
more tropical MHI. Coral endemism is high in the NWHI: 17 endemic species (30%) account for 37-53% of<br />
the relative abundance of stony corals visually estimated on each reef of the NWHI. Three genera (Montipora,<br />
Porites, Pocillopora) account for 15 of the 17 endemic species and most of the endemic abundance. Seven<br />
Acropora species (Figure 10.20) are now known from the central NWHI despite their near absence from the<br />
MHI. Coral abundance and diversity are highest at the large open atolls of the central NWHI (French Frigate,<br />
Maro, Lisianski/Neva Shoal) and decline gradually through the remaining atolls to the northwest (Pearl<br />
and Hermes, Midway and Kure). Stony corals are also less abundant and diverse off the exposed basalt<br />
islands to the southeast (Nihoa, Necker, La Perouse, Gardner), where soft corals (Sinularia, Palythoa) are<br />
more abundant. Exposure to severe wave action appears to limit coral development off these small islands<br />
and surrounding deep platforms. Temperature extremes and natural accumulation of lagoon sediments may<br />
contribute to decline of coral species and abundance at the northwestern end of the chain, based on the REA<br />
survey results.
The State of Coral Reef Ecosystems of the Northwestern Hawaiian Islands<br />
Table 10.6. Checklist of stony corals reported from the NWHI, including 2000-2002 REA surveys. Source: Maragos et al. 2004.<br />
ACROPORIDAE FAVIIDAE<br />
++ j<br />
J<br />
++ j<br />
J<br />
++ j<br />
+ j<br />
j<br />
*? j<br />
* v<br />
* ++<br />
*<br />
* j<br />
* + j<br />
++ j<br />
* +<br />
AGARICIIDAE<br />
*? j<br />
j<br />
j<br />
v j<br />
j<br />
+ j<br />
+<br />
BALANOPHYLLIIDAE<br />
+<br />
+<br />
DENDROPHYLLIIDAE<br />
Acropora cerealis (Dana, 1846)<br />
A. cytherea (Dana, 1846)<br />
A. gemmifera (Brook, 1892)<br />
A. humilis (Dana, 1846)<br />
A. nasuta (Dana, 1846)<br />
A. paniculata (Verrill, 1902)<br />
A. valida (Dana, 1846)<br />
Montipora capitata (Dana, 1846)<br />
M. dilatata (Studer, 1901)<br />
M. cf. dilatata (Studer, 1901)<br />
M. flabellata (Studer, 1901)<br />
M. patula (Verrill, 1864)<br />
M. cf. incrassata (Dana, 1846)<br />
M. tuberculosa (Lamarck, 1816)<br />
M. turgescens (Bernard, 1897)<br />
M. verrilli (Vaughan, 1907)<br />
Pavona clavus (Dana, 1846)<br />
P. duerdeni (Vaughan, 1907)<br />
P. maldivensis (Gardiner, 1905)<br />
P. varians (Verrill, 1864)<br />
Leptoseris hawaiiensis (Vaughan, 1907)<br />
L. incrustans (Quelch, 1886)<br />
L. scabra (Vaughan, 1907)<br />
Gardineroseris planulata (Dana, 1846)<br />
Balanophyllia sp.<br />
Cladospammia cf. eguchii (Wells, 1982)<br />
+ Tubastraea coccinea (Lesson, 1829)<br />
+<br />
++<br />
* ++<br />
++<br />
j<br />
j<br />
FUNGIIDAE<br />
j<br />
++<br />
+ j<br />
POCILLOPORIDAE<br />
* r<br />
j<br />
j<br />
j<br />
* +<br />
* ++<br />
PORITIDAE<br />
*<br />
*<br />
* +<br />
* +<br />
j<br />
*<br />
* ++<br />
+<br />
SIDERASTREIDAE<br />
+<br />
+ j<br />
+ j<br />
* +<br />
Leptastrea agassizi (Vaughan, 1907)<br />
L. bewickensis (Veron & Pichon, 1977)<br />
L. cf. Favia hawaiiensis (Vaughan 1907)<br />
L. cf. pruinosa (Crossland, 1952)<br />
L. purpurea (Dana, 1846)<br />
Cyphastrea ocellina (Dana, 1846)<br />
Fungia scutaria (Lamarck, 1801)<br />
F. granulosa (Klunzinger, 1879)<br />
Cycloseris vaughani (Boschma, 1923)<br />
Pocillopora cf. cespitosa var. laysanensis (Vaughan,1907)<br />
P. damicornis (Linnaeus, 1758)<br />
P. eydouxi (Edwards & Haime, 1860)<br />
P. ligulata (Dana, 1846)<br />
P. meandrina (Dana, 1846)<br />
P. molokensis (Vaughan, 1907)<br />
P. cf. capitata (Verrill, 1864)<br />
Porites brighami (Vaughan, 1907)<br />
P. compressa (Dana, 1846)<br />
P. duerdeni (Vaughan, 1907)<br />
P. evermanni (Vaughan, 1907)<br />
P. lobata (Dana, 1846)<br />
P. rus (Forskal, 1775)<br />
P. hawaiiensis (Vaughan, 1907)<br />
P. cf. annae (Crossland, 1952)<br />
P. cf. solida (Forskål, 1775)<br />
Psammocora explanulata (Horst, 1921)<br />
P. nierstraszi (Horst, 1921)<br />
P. stellata (Verrill, 1864)<br />
P. verrilli (Vaughan, 1907)<br />
Notes: + New range record for the NWHI (previously known in main Hawaiian Islands).<br />
++ New range record for Hawaii as a whole.<br />
j Hawaiian species also reported at Johnston Atoll.<br />
r reported only at Raita Bank and now considered endemic at the species level.<br />
v reported by Vaughan (1907) at Laysan but not during present study.<br />
* species endemic to Hawai‘i and northern but Line Islands (including Johnston).<br />
*? considered endemic to Hawai‘i and Line Islands here and by Maragos (1995), not by Veron (2000).<br />
Sidebar<br />
Northwestern Hawaiian Islands<br />
page<br />
289
Northwestern Hawaiian Islands<br />
page<br />
290<br />
The State of Coral Reef Ecosystems of the Northwestern Hawaiian Islands<br />
Figure 10.20. A large table coral, Acropora cytherea, thrives near a permanent<br />
monitoring site at French Frigate Shoals. Photo: J. Watt.<br />
Figure 10.21. Differences in coral cover among regions within the NWHI. REA surveys<br />
were conducted at 173 sites in 2002. Coral cover was calculated from size<br />
frequency data of colony counts within transects. Data are mean and standard error.<br />
Source: PIFSC-CRED, unpublished data.<br />
Coral Community Structure<br />
REA surveys were conducted at 173<br />
sites across the NWHI in 2002. Based<br />
upon these surveys it was found that<br />
coral cover varies greatly across the<br />
NWHI. Most regions have low coral<br />
cover while Maro Reef and Lisianski<br />
having comparatively high coral cover<br />
(Figure 10.21). Grigg (1983) reported<br />
similar results with the exception<br />
of higher coral cover reported from<br />
French Frigate Shoals. However, his<br />
study was based on a much smaller<br />
and spatially limited number of sites.<br />
It was also found that coral cover varied<br />
among reef zones (Table 10.7),<br />
thus estimates of coral cover would<br />
vary greatly depending on where the<br />
surveys were conducted. The reef<br />
zone with the highest coral cover varied<br />
among regions with no consistent<br />
pattern emerging. Coral community<br />
structure also differed across the regions<br />
(Table 10.8) but overall Porites,<br />
Pocillopora, and Montipora were the<br />
dominant genera.<br />
Coral monitoring at permanent<br />
transects<br />
Methods<br />
Permanent monitoring sites were selected<br />
to cover representative shallow-water<br />
(
methods allows more precise detection<br />
of changes in coral and macroinvertebrate<br />
populations over time.<br />
The principal advantage of fixed sites<br />
is reduced spatial variability relative<br />
to temporal variability, provided that<br />
the original transects are precisely<br />
relocated and resurveyed. The principal<br />
disadvantage is the extra time<br />
required for installing permanent<br />
markers during the initial survey and<br />
relocating, repairing, or replacing<br />
lost markers during subsequent surveys.<br />
Permanently marked transects<br />
are particularly useful for tracking<br />
changes in sessile benthos such as<br />
individual coral colonies over many<br />
years. Analyses are still in progress<br />
and discussion here is limited to the<br />
results of initial baseline surveys.<br />
The State of Coral Reef Ecosystems of the Northwestern Hawaiian Islands<br />
Table 10.7. Differences in coral cover within different reef zones in the NWHI. Numbers<br />
represent the average coral cover (%) + standard error. Coral cover calculated<br />
from size frequency data of colonies within transects. Data based on REA surveys in<br />
2002. NS=not sampled. Source: PIFSC-CRED, unpublished data.<br />
<strong>REEF</strong> ZONE<br />
SHELF FORE<strong>REEF</strong> BACK<strong>REEF</strong> LAGOON<br />
NIH 11.5 (1.3) NS NS NS<br />
NEC 4.4 + 1.3 NS NS NS<br />
FFS 8.2 + 6.6 7.6 + 3.2 12.0 + 3.5 24.1 + 9.7<br />
GAR 7.3 + 2.5 NS NS NS<br />
MAR NS 64.1 + 10.0 NS NS<br />
LAY 21.7 + 8.0 NS NS NS<br />
LIS 50.0 + 12.1 73.2 + 11.2 NS 24.5+<br />
P&H NS 13.3 + 3.1 5.0 + 2.7 20.7 + 11.0<br />
MID 2.7 + 2.2 2.1 + 0.63 30.6 + 12.1 0.98 + 0.41<br />
KUR 20.2 + 11.7 8.9 + 2.0 12.3 + 3.6 19.9 + 5.3<br />
mean 15.8 (5.5) 28.2 (12.9) 14.9 (5.4) 18.0 (4.4)<br />
Table 10.8. Coral community structure within the NWHI. Numbers represent the average composition (%) by genera based on colony<br />
counts within belt transects conducted in 2002. The three most abundant genera are highlighted (bold type) within each region.<br />
Source: PIFSC-CRED, unpublished data.<br />
NWHI KUR MID P&H LIS LAY MAR GAR FFS NEC NIH<br />
# REA SITES PER ISLAND 21 31 32 22 10 14 6 29 6 2<br />
Acropora 0 0 0 0.4 0 2.6 0.06 8.8 0 0<br />
Cyphastrea/Leptastrea 3.2 3.3 13 12 8.5 4.2 2.5 3.2 0.4 1.1<br />
Fungia/Cycloceris 0.1 0.15 0.4 7.2 0 0.5 0 0.2 0 0<br />
Montipora 1.8 15 3.2 35 14 18 1.1 3.3 4.3 4.8<br />
Pocillopora 41 27 28 3.5 12 9.9 11 19 28 34<br />
Porites 54 53 52 41 65 54 81 63 68 60<br />
Pavona 0.2 0.43 1.9 3.5 0.9 5.7 1.9 1.9 0 0<br />
Psammocora 0 0.38 0.9 1 0 0.1 0.45 0.1 0 0<br />
Other stony coral 0 0 0 0 0 0 0 0.1 0 0<br />
Soft coral/anemones 0 0.92 1 0 0.3 4.9 1.94 2.5 0 0<br />
<strong>CORAL</strong> GENERA<br />
Live coral cover was quite variable ranging from 0.37% to 48.34% at the monitoring transects (Table 10.9).<br />
The highest values were concentrated at ocean reef sites sheltered from heavy tradewinds and large winter<br />
swell from the Northwest Pacific and at most lagoon sites, except the low values at sites near Tern Island at<br />
French Frigate Shoals which have a history of chronic disturbance from dredging filling, fuel spills, and other<br />
contamination since WWII. The lowest live coral values were concentrated at ocean facing reefs off Nihoa,<br />
Necker, Gardner, and Laysan Islands, which are more exposed to large waves and swells from any direction.<br />
Lisianki Island is protected by Neva Shoal, which might explain the higher coral cover there.<br />
Moreover, sites with large mean coral diameters positively correlated with those of high coral cover. However,<br />
sites with large frequencies (numbers of corals per square meter) did not correlate with high coral cover. Sites<br />
with the highest diversity of corals (numbers of coral types per transect) showed no strong correlations with<br />
other parameters. Many of these sites were situated where there was greater habitat variety and some shelter<br />
from heavy swells and wave action.<br />
Sidebar<br />
Northwestern Hawaiian Islands<br />
page<br />
291
Northwestern Hawaiian Islands<br />
page<br />
292<br />
The State of Coral Reef Ecosystems of the Northwestern Hawaiian Islands<br />
Table 10.9. Summary of NWHI coral monitoring data at permanently marked sites. C=central, N=north, S=south, E=east, W=west,<br />
lag=lagoon, tip=end of perimeter reef. Source: Maragos and Veit, 2004.<br />
ATOLL/<br />
ISLAND<br />
# <strong>OF</strong> SITES <strong>REEF</strong><br />
LOCALE<br />
YEAR # <strong>CORAL</strong><br />
TYPES/<br />
TRANSECT<br />
TRANSECT<br />
AREA (m 2 )<br />
% <strong>CORAL</strong><br />
COVER<br />
<strong>CORAL</strong><br />
FREQ. #/m 2<br />
<strong>CORAL</strong><br />
MEAN<br />
DIAM.-cm<br />
FFS 1 N tip 2001 5 25 20.7 2.8 25<br />
FFS 2 N tip 2002 5-8 72 11.5-23.1 2.3-7.7 19-23<br />
FFS 1 NE lag 2001 4 35 25.9 3.4 42.4<br />
FFS 2 NE lag 2002 3-4 73 29.1-34.7 1.6-2.9 32.6-76.2<br />
FFS 3 N lag 2002 3-4 119 0.4-1.6 1.5-1.9 5.3-8.7<br />
FFS 1 N ocean 2001 4 38 11.6 14.2 11.6<br />
FFS 1 N ocean 2002 3 51 12.5 11.7 13.3<br />
FFS 1 NC lag 2001 6 36 8.6 4.6 12.3<br />
FFS 1 NC lag 2002 3 45 6.7 8 9.3<br />
FFS 1 central lag 2001 5 33 24.1 8.5 19.9<br />
FFS 2 central lag 2002 2-4 69 14.6-28.8 6.2-7.1 16.1-30.3<br />
FFS 1 S tip 2001 8 36 31.6 5.1 25.5<br />
FFS 1 S tip 2002 2 16 46.1 3.3 43.6<br />
GAR 1 W side 2002 3 20 4.3 10 8.9<br />
LAY 2 W lag 2002 4 62 4.2-7.4 5.6-9.5 7.7-11.0<br />
LIS 1 S fringing 2002 2 51 4.8 1,0 14.5<br />
LIS 1 E ocean 2002 1 51 45.8 1.8 57.4<br />
LIS 1 N fringing 2002 2 51 15.5 5.1 22.9<br />
MAR 1 W lag 2001 3 34 3.7 3.8 10.9<br />
MAR 1 SE ocean 2002 3 17 26 4.6 29.6<br />
MAR 1 NW tip 2002 3 24 48.3 6.4 36.4<br />
MID 3 N&W lag 2002 2-3 154 29.6-40.6 1.5-2.0 46.6-53.2<br />
MID 5 E lag 2002 2-4 152 0.49-12.5 1.4-4.5 6.8-22.6<br />
MID 2 S lag 2002 2 80 4.4-5.1 2.8-12.2 8.0-14.7<br />
NEC 1 S ocean 2002 2 57 5.2 9.1 8.4<br />
NIH 2 S&W side 2002 2-4 57 0.6-7.9 3.2-4.3 2.4-18.0<br />
P&H 4 SE ocean 2000 2-5 271 6.2-8.9 3.0-7.7 11.0-21.1<br />
P&H 1 W ocean 2002 4 62 5.7 3.2 15.5<br />
P&H 1 S pass 2002 3 54 1.8 1.1 14.4<br />
P&H 1 S lag 2002 3 37 2.1 1.8 11.7<br />
P&H 1 C lag 2002 2 55 19.8 4.6 25.65<br />
Towed-diver surveys<br />
Since 2000, 333 towed-diver surveys have been conducted in the NWHI by PIFSC-CRED (Kenyon et al.,<br />
2004; Figure 10.22). During each survey, two divers maneuver separate boards that are equipped with digital<br />
video or still camera, as well as temperature and depth recorders, while being towed behind a small boat. The<br />
tow path is concurrently recorded by a global positioning system (GPS) receiver onboard the boat, to which<br />
a layback model is applied to more accurately map the position of the recorded imagery. Percent cover of<br />
salient benthic categories is quantified by whole-image analysis of still frames sampled at 30-second intervals.<br />
Towed-diver surveys bridge a gap between large-scale mapping efforts using satellite data and small-scale<br />
traditional belt transects or roving diver assessments, providing a mesoscale spatial assessment of reef habitats.
The State of Coral Reef Ecosystems of the Northwestern Hawaiian Islands<br />
Towboard results<br />
At French Frigate Shoals, where<br />
the greatest quantity of towed-diver<br />
survey benthic imagery has been<br />
analysed to date, three coral genera<br />
– Porites, Pocillopora, and Acropora<br />
– account for more than 93% of total<br />
coral cover throughout the atoll, while<br />
their relative percent cover, densities,<br />
and size distributions vary according<br />
to geomorphic and geographic location<br />
within the atoll system. Preliminary<br />
results from other atoll systems<br />
in the NWHI (Pearl and Hermes, Midway,<br />
and Kure) similarly reveal differences<br />
in total coral cover and the<br />
relative abundance of coral genera<br />
based upon zone (forereef, backreef,<br />
or lagoon) and geographic location.<br />
Porites and Pocillopora dominate the<br />
coral cover at these three northern Figure 10.22. Photo of towboard divers surveying a reef in the NWHI. Photo: PIFSC-<br />
CRED.<br />
atolls, with Montipora frequently codominating<br />
in the relatively protected backreef zone.<br />
Coral settlement and recruitment<br />
In fall 2001, settlement plates were attached to the base of CREWS moorings at each of French Frigate<br />
Shoals, Maro Reef, Lisianski, Pearl and Hermes, Midway, and Kure (Figure 10.23A) to assess larval recruitment<br />
and enable coupling of biological data with physical data collected by the buoys. The plates have been<br />
collected and fresh plates installed at roughly one-year intervals since that time in order to examine them for<br />
settlement by calcareous organisms. After recruitment plates were collected, all calcareous organisms present<br />
on the collected plates were counted and measured (Figure 10.23B).<br />
Coral recruits were present at all locations, but Maro had the highest density (270 recruits/m 2 /year versus the<br />
next highest at Kure of 43 recruits/m 2 /year) and a larger mean coral diameter (2.67 mm versus the next largest<br />
at Lisianski of 2.05 mm) than other plates. The recruitment rate at Maro is the highest rate yet recorded in<br />
the Hawaiian Archipelago. Recruits were identified from the families Acroporidae, Pocilloporidae, and Poriti-<br />
Figure 10.23. Left photo shows a newly-installed array of recruitment plates surrounding the anchor of an oceanographic buoy at FFS.<br />
Right photo shows NH2 - Pocilloporid recruit to a settlement plate deployed at MAR from October 1, 2002 to July 21, 2003. Photos:<br />
PIFSC-CRED; M. Dunlap.<br />
Sidebar<br />
Northwestern Hawaiian Islands<br />
page<br />
293
Northwestern Hawaiian Islands<br />
page<br />
294<br />
The State of Coral Reef Ecosystems of the Northwestern Hawaiian Islands<br />
dae, with Pocilloporids constituting up to 90% of the recruits. Lowest coral settlement occurred at Midway (7<br />
recruits/m 2 /year), followed by Pearl and Hermes (18 recruits/m 2 /year). Coral recruits were more abundant on<br />
the undersides (horizontal) and insides (vertical) of plates at five of the six locations. While low settlement at<br />
those sites could be a reflection of naturally low recruitment, numbers may have been affected by an August<br />
2002 bleaching event at the three northern atolls. Annual deployment and collection of plates will address<br />
whether low recruitment at these locations is typical or associated with bleaching events, as well as many<br />
recruitment questions important to management.<br />
ALGAE<br />
Until recently, algal collections from the NWHI were solely qualitative, intermittent, and often biased towards<br />
large, macroscopic species (Reinbold, 1899; Lemmerman, 1905; Howe, 1934; Buggeln, 1965; Tsuda, 1965,<br />
1966; Balazs, 1979). Abbott (1989) listed all known algae reported from historic collections, and added considerable<br />
detail to our knowledge of microscopic turf and epiphyte species; however, she acknowledged that<br />
a paucity of collections from the NWHI undoubtedly underrepresented the true algal diversity present in these<br />
ecosystems. Additionally, many collections were made from drift algae or off lobster traps, disassociating the<br />
algae from any data about the environments they inhabit. To ameliorate this problem, expeditions to the NWHI<br />
over the past five years have focused on in situ sampling of algal diversity, and five recent works have greatly<br />
increased our phycological knowledge. Abbott (1999) and Abbott and Huisman (2004) thoroughly examined<br />
numerous red, brown, and green algal collections from the NWHI, and Vroom et al. (in press, a,b) completed a<br />
detailed study of marine algae from 57 sites at the French Frigate Shoals and increased the number of known<br />
algae from this atoll system by over 380%. Okano et al. (in prep.) examined 28 sites from the lagoon at Kure<br />
Atoll and documented 92 algal species, and Vroom and Page (in press) completed a multivariate analysis of<br />
algal percent cover along the entire NWHI chain. Because of these studies, 355 species of algae are now<br />
known from the NWHI chain (Table 10.10).<br />
From an algal perspective, the NWHI contain many unique habitats and even several endemic species new<br />
to science which have recently been described (Figure 10.24; Abbott and McDermid, 2001, 2002; Vroom and<br />
Abbott, 2004a, b). Additionally, the NWHI contain a large number of Indo-Pacific algal species not found in the<br />
MHI. Among these, Halimeda velasquezii, represents one of the most common algal species in the NWHI.<br />
Expeditions during 2000-2002 found reproductive individuals of H. velasquezii for the first time (Vroom and<br />
Smith, 2003), allowing scientists to<br />
begin addressing ecologically-based<br />
algal questions for common species<br />
in the NWHI.<br />
Table 10.10. Numbers of algal species currently known from the NWHI. Source: Abbott<br />
1989, 1999; Vroom et al., in press, a,b.<br />
Red algae 204<br />
Brown algae 59<br />
Green algae 92<br />
Figure 10.24. Acrosymphtyon brainardii (left) and Scinaia huismanii (right) are two newly described species of red macroalgae from<br />
FFS that are endemic to the NWHI. Photos: P. Vroom.
The State of Coral Reef Ecosystems of the Northwestern Hawaiian Islands<br />
Quantitative baseline assessments of algal cover began on all NWHI in 2002 using a protocol devised specifically<br />
for remote tropical reef ecosystems (Preskitt et al., 2004). Detailed photoquadrat analysis combined<br />
with voucher specimens and field notes allowed for percent cover determination of algae and invertebrates at<br />
the species level. Analyses from French Frigate Shoals and Pearl and Hermes (Vroom et al., in press, a,b;<br />
Vroom et al., in prep.) have found that algal dominated reefs are normal for many of the healthy ecosystems<br />
of the NWHI. Expansive forereef and backreef regions are characterized by approximately 15% macroalgal<br />
cover while coral cover is less than 8%. Only select lagoonal and patch reef regions exhibited coral cover<br />
greater than macroalgal cover. This differs drastically from the generally held belief that healthy tropical reef<br />
ecosystems should be dominated by scleractinian coral species. Turf algal meadows were the most common<br />
component of essentially all benthic habitats and covered every non-living substrate except sand.<br />
Multivariate analyses of 28 sites from the French Frigate Shoals using the Preskitt method allowed seven<br />
distinct biogeographical zones to be interpreted based on substrate-type and algal/invertebrate species composition<br />
(Figure 10.25; Vroom et al., in press, a,b). The largest biogeographical group was located on the<br />
closed, eastern side of the atoll system and characterized by high densities of the green macroalga Mi-<br />
Figure 10.25. Map of FFS with seven biogeographical groups outlined in different<br />
colored lines. Biogeographical groups were determined, in part, through multivariate<br />
analysis of benthic species cover. Source: Vroom et al., in press, a,b.<br />
crodictyon setchellianum. The area<br />
surrounding La Pérouse Pinnacle on<br />
the open, western side of the atoll<br />
contained the highest crustose coralline<br />
algal cover at the atoll. Most<br />
lagoonal regions contained sand<br />
patches or broad regions of algal turf<br />
where macroalgae such as Halimeda<br />
velasquezii, Turbinaria ornata, and<br />
Asparagopsis taxiformis were very<br />
common. Oceanographic monitoring<br />
studies conducted concurrently with<br />
algal sampling suggested that water<br />
motion may be a major factor in defining<br />
algal distribution at the French<br />
Frigate Shoals. Multivariate percent<br />
cover studies similar to the one completed<br />
for the French Frigate Shoals<br />
are currently underway for Pearl and<br />
Hermes and Lisianski. Baseline assessment<br />
data for all other NWHI<br />
are in-hand, and available for future<br />
analyses.<br />
Algal monitoring in the NWHI is still in<br />
its infancy. Rapid archipelago-wide<br />
studies found no significant differ-<br />
ences in the prevalence or relative<br />
abundance of algal genera between research expeditions conducted in 2002 and 2003 (Vroom and Page,<br />
in press). Annual revisits to established sites throughout the NWHI will enable long-term data sets to be established<br />
that may reveal change over years or decades if environmental or anthropogenic changes occur.<br />
Analysis of similarity (ANOSIM) tests using Primer (Clarke and Warwick, 2001) revealed algal prevalence<br />
and relative abundance on reefs surrounding each island to differ more than comparisons among islands as<br />
a whole (Vroom and Page, in press). This is not surprising considering the number of different habitat types<br />
within a single island system (forereef, backreef, patch reef, etc.).<br />
Sidebar<br />
Northwestern Hawaiian Islands<br />
page<br />
295
Northwestern Hawaiian Islands<br />
page<br />
296<br />
The State of Coral Reef Ecosystems of the Northwestern Hawaiian Islands<br />
Figure 10.26. Nearshore benthic habitat maps were developed in 2003 by NOAA based on supervised classification of IKONOS satellite<br />
imagery. For more info, see: http://ccmaserver.nos.noaa.gov/rsd/products.html#nwhi. Map: A. Shapiro.<br />
BENTHIC HABITAT MAPPING<br />
In 2003 NOAA’s CCMA released an atlas of digital maps depicting<br />
the shallow-water benthic habitats of the Northwestern Hawaiian<br />
Islands and several related products (Figure 10.26). The maps<br />
and derived bathymetry products were generated from IKONOS<br />
satellite imagery and classified using a hierarchical classification<br />
system that accounts for both geomorphologic structure and biotic<br />
cover. Despite difficulties associated with conducting ground<br />
validation in this remote area, accuracy estimates suggest that the maps, which were derived primarily through<br />
spectral analysis, are approximately 72% accurate for the major habitat classes (NOAA, 2003). A multibeam<br />
mapping project and other benthic habitat characterization techniques are being employed by PIFSC-CRED<br />
to generate similar and complimentary products.
ASSOCIATED BIOLOGICAL COMMUNITIES<br />
The State of Coral Reef Ecosystems of the Northwestern Hawaiian Islands<br />
FISH<br />
Methods<br />
NOAA Fisheries conducted quantitative monitoring of shallow-reef fishes in the NWHI during the 1990s to<br />
track the temporal dynamics of the shallow-reef fish forage base of monk seals (Monk Seal Forage Base<br />
Study, or MSFBS) at French Frigate Shoals in 1992 and Midway in 1993 (DeMartini et al., 1996). Stations<br />
were resurveyed at sites established by James Parrish and Hawaii Cooperative Fisheries Research Unit<br />
co-workers during the 1980s. Starting in 1995, annual sampling was conducted in late summer-early fall to<br />
control for seasonal effects by surveying shortly after most fish settlement. DeMartini et al. (2002) provides a<br />
comprehensive summary of the spatial and temporal patterns of shallow reef fishes at these two atolls during<br />
this period.<br />
In late 2000, the Northwestern Hawaiian Resource Assessment and Monitoring Program (NOWRAMP) was<br />
established to assess the entire (ecosystem-level) resource base at all 10 emergent reefs and shallow (
Northwestern Hawaiian Islands<br />
page<br />
298<br />
The State of Coral Reef Ecosystems of the Northwestern Hawaiian Islands<br />
Results and Discussion<br />
Initial insights into new baseline patterns<br />
of NWHI reef fish distribution<br />
and abundance are provided by<br />
DeMartini et al. (1996). Differences<br />
between French Frigate Shoals and<br />
Midway in the relative abundance of<br />
herbivores and carnivores and in the<br />
distribution of fish numbers and biomass<br />
among barrier reef and lagoon<br />
patch reef habitats were first noted.<br />
The major conclusion reached in this<br />
study was that reasonable statistical<br />
power (80% probability of rejecting<br />
a false null hypothesis) for detecting<br />
a large but less-than-catastrophic<br />
(50%) change in shallow-reef fish<br />
density would be attainable using a<br />
decade-long series of annual surveys<br />
only if species were pooled into higher<br />
taxonomic or trophic categories for<br />
analyses.<br />
General results and conclusions related<br />
to the monitoring conducted by<br />
the MSFBS have been discussed by<br />
DeMartini et al. (2002). Briefly restated,<br />
these are: 1) There were no<br />
discernible temporal changes in the<br />
biomass densities of either herbivorous<br />
or carnivorous reef fishes at ei-<br />
Figure 10.28. Biomass densities of herbivores (solid histograms) and carnivores (diagonals)<br />
at FFS and MID in 1992 (FFS only), 1993 (MID only), and 1995-2000 (both<br />
sites), in barrier (B) and patch (P) reef habitats. Standard errors are noted for total<br />
(herbivore plus carnivore ) fishes. Source: DeMartini et al., 2002.<br />
ther French Frigate Shoals or Midway during the 1990s (Figure 10.28); 2) There was a consistently higher<br />
recruitment of young-of-year (YOY) life-stages of fishes at Midway Atoll versus French Frigate Shoals during<br />
the 1990s despite generally greater densities of older-stage fishes at French Frigate Shoals (Figure 10.29);<br />
and 3) Both giant trevally (Caranx ignobilis) and bluefin trevally (C. melampygus) were more frequently encountered<br />
and more abundant at French Frigate Shoals versus Midway, and the magnitude of this general<br />
difference increased (as giant trevally sightings decreased) subsequent to 1996 (Figure 10.30), at which time<br />
a recreational catch-and-release fishery was begun at Midway after the Midway Naval Air Station was closed<br />
and the atoll became a USFWS NWR (DeMartini et al., 2002).
Figure 10.29. Time series of the estimated mean numerical density of YOY and<br />
older-stage fishes of all taxa at FFS and MID during each survey year. Each vertical<br />
bar represents 1 standard error (SE) of the estimated survey year grand mean for<br />
both major habitats. Source: DeMartini et al., 2002.<br />
The State of Coral Reef Ecosystems of the Northwestern Hawaiian Islands<br />
A comparison between the fish assemblages<br />
in the NWHI and MHI was<br />
conducted following sampling in 2000<br />
across both regions (Friedlander<br />
and DeMartini, 2002). Grand mean<br />
fish standing stock in the NWHI was<br />
more than 260% greater than in the<br />
MHI across similar habitats (Figure<br />
10.31). The most striking difference<br />
was the abundance and size of large<br />
apex predators (primarily sharks and<br />
jacks) in the NWHI compared to the<br />
MHI. More than 54% of the total fish<br />
biomass on forereef habitats in the<br />
NWHI consisted of apex predators,<br />
whereas this trophic level accounted<br />
for less than 3% of the fish biomass<br />
in the MHI. In contrast, fish biomass<br />
in the MHI was dominated by herbivores<br />
(55%) and small-bodied lowerlevel<br />
carnivores (42%). Most of the<br />
dominant species by weight in the<br />
NWHI were either rare or absent in<br />
the MHI and the target species that<br />
were present, regardless of trophic<br />
level, were nearly always larger in<br />
the NWHI.<br />
Figure 10.30. Relative presence-absence of giant trevally (Caranx ignobilis) and bluefin trevally (C. melampygus) at FFS and MID stations<br />
during 1992 (FFS) or 1993 (MID) through 1995-2000 pooled. The stacked presence-absence bars indicate species subtotals up<br />
to and including 1996 (“Before”) versus after 1996 (“After”) at each site. Vertical lines atop histogram bars are 1 SE. Source: excerpted<br />
from DeMartini et al., 2002.<br />
Sidebar<br />
Northwestern Hawaiian Islands<br />
page<br />
299
Northwestern Hawaiian Islands<br />
page<br />
300<br />
The State of Coral Reef Ecosystems of the Northwestern Hawaiian Islands<br />
Several assessment-focused studies<br />
complement the contemporary<br />
monitoring program described below.<br />
DeMartini (2004) recognized the importance<br />
of back reef, lagoon patch<br />
reef, and other sheltered (wave-protected)<br />
habitats as nursery areas for<br />
juvenile reef fishes in the NWHI. This<br />
study, based on re-analyses of some<br />
of the data collected for the MSFBS,<br />
contributes substantially to development<br />
of both “essential fish habitat”<br />
and “habitats of particular concern”<br />
which recognize the greater per-unitarea<br />
value of atolls due to their larger<br />
proportion of sheltered habitats.<br />
Important to biodiversity concerns is<br />
the markedly high endemism of shallow<br />
reef fishes in the NWHI. Percentage<br />
endemism based on the typical<br />
species-presence criterion is about<br />
one-fifth higher (30% vs 25%) in the<br />
NWHI versus MHI (DeMartini and<br />
Friedlander, 2004). The MHI value<br />
is indistinguishable from present estimate<br />
of 23% for Hawaiian fishes<br />
based on comprehensive specimen<br />
sources including market sampling,<br />
poison stations, and museum collections<br />
(Randall, 1998). Endemism<br />
is even more strongly expressed in<br />
terms of standing stock per unit area–<br />
both biomass (mean 37%) and especially<br />
numerical (mean 52%) densities–in<br />
the NWHI, and increases with<br />
latitude throughout the Hawaiian Archipelago<br />
even though species-presence-based<br />
measures of endemism<br />
lack latitudinal pattern within the<br />
NWHI (Figure 10.32; DeMartini and<br />
Friedlander, 2004). These recent ob-<br />
Figure 10.31. Comparison of the biomass in major trophic guilds between the MHI<br />
and the NWHI. Source: Friedlander and DeMartini, 2002.<br />
Figure 10.32. Various measures of percentage endemism (based on species presence-absence,<br />
and on numerical and biomass densities) at each of ten emergent<br />
NWHI reefs, illustrating patterns of endemism with latitude-longitude. Presenceabsence<br />
data are indicated by line graph and density data by histograms. Species<br />
richness (number of species) is noted by numbers at base of histograms. Source:<br />
DeMartini and Friedlander, 2004.<br />
servations of a latitudinal effect on standing stock-based endemism were foreshadowed by an analogous pattern<br />
observed previously at French Frigate Shoals and Midway (DeMartini, 2004).<br />
Size structure data collected during the initial NOWRAMP assessment provided insights into the effects of<br />
apex predators on their shallow-water reef fish prey. Protogynous (female-to-male sex-changing) labroid<br />
fishes (wrasses and parrotfishes, especially the latter), the adult sexes of which conspicuously differ in body<br />
coloration, are the preferred prey of C. ignobilis, the dominant apex predator on shallow NWHI reefs (Sudekum<br />
et al., 1991; Friedlander and DeMartini, 2002). At the three northernmost atolls of the NWHI, body sizes at<br />
coloration (sex) change of labroids are larger, and overall size distributions are skewed larger in labroids and<br />
other prey fish species at Midway (Figure 10.33), where jacks are fewer, compared to two nearby atolls (Kure<br />
and Pearl and Hermes) where jacks are more abundant (DeMartini et al., in press). These latter observations<br />
have significant implications for reef fish management in the Hawaiian Archipelago. First, in situ observations,
Figure 10.33. Body size (TL) frequency distributions of eight species of sexually<br />
dimorphic, sex-changing labroids (four parrotfishes, four wrasses) at (A) P&H, (B)<br />
KUR, and (C) MID in the far northwestern NWHI, during Sept.-Oct. periods of 2000<br />
and 2002. Terminal-phase (sex-changed) males are indicated by fills within histogram<br />
bars. Source: DeMartini et al., in press.<br />
Table 10.11. Non-coral invertebrate species identified to date in the NWHI.<br />
PORIFERA 23 ARTHROPODA<br />
CNIDARIA Pycnogona 3<br />
Hydrozoans 10 Cirripedia 9<br />
Scyphozoans 2 Peracarids 76<br />
Anthozoans 13 Decapods 125<br />
PLATYHELMINTHES 5 ECHINODERMATA<br />
NEMERTEA 1 Asteroids 11<br />
BRYOZOA 39 Ophiuroids 26<br />
BRACHIOPODA 1 Echinoids 21<br />
SIPUNCULIDA 1 Holothuroids 17<br />
ANNELIDA<br />
MOLLUSCA<br />
52 UROCHORDATA 25<br />
Gastropods 310<br />
Bivalves 66<br />
Cephalopods 2<br />
TOTAL=838<br />
The State of Coral Reef Ecosystems of the Northwestern Hawaiian Islands<br />
instead of gonadal examination,<br />
can be used to estimate size at sex<br />
change, an important parameter for<br />
stock assessment. Second, prey<br />
size frequency distributions can be<br />
used as an effective proxy for predation<br />
intensity (predator abundance)<br />
when assessing functional change<br />
on NWHI coral reefs as part of an<br />
ecosystem-based approach to management<br />
(DeMartini et al., in press).<br />
NON-<strong>CORAL</strong> INVERTEBRATES<br />
Prior to efforts in 2000, there had<br />
been only two large-scale expeditions<br />
to the NWHI for the purpose of<br />
marine faunal surveys. The first was<br />
the Albatross Expedition in 1902 in<br />
which a variety of species were collected<br />
and deposited at the Smithsonian<br />
Institution’s National Museum<br />
of Natural History. A second effort<br />
was the Tanager Expedition in 1923,<br />
which was organized by the U.S. Department<br />
of Agriculture and the Bishop<br />
Museum.<br />
Recent efforts since 2000 have collected<br />
a large amount of non-coral<br />
marine invertebrate material (Table<br />
10.11), much of which remains to<br />
be definitively identified. To date, a<br />
number of new species have been<br />
recorded for the Hawaiian Archipelago<br />
and some species might prove to<br />
be endemic to the NWHI. Mollusks,<br />
crustaceans, and echinoderms dominate<br />
the non-coral invertebrate fauna<br />
in the NWHI, which is typical for most<br />
coral reef communities. These cryptic<br />
fauna are more abundant in the NWHI<br />
than the MHI, although remote locations<br />
of the MHI that are not heavily<br />
impacted by anthropogenic stressors<br />
are comparably abundant (DeFelice<br />
et al., 2002). Species data for noncoral<br />
invertebrates is incomplete and<br />
collaboration with taxonomic experts<br />
throughout the world is in progress.<br />
Sidebar<br />
Northwestern Hawaiian Islands<br />
page<br />
301
Northwestern Hawaiian Islands<br />
page<br />
302<br />
The State of Coral Reef Ecosystems of the Northwestern Hawaiian Islands<br />
HAWAIIAN MONK SEAL<br />
The Hawaiian monk seal (Monachus<br />
schauinslandi) is the only endangered<br />
pinniped occurring entirely within U.S.<br />
waters. Its current population is estimated<br />
at 1,300 seals, a decrease of<br />
about 60% since the 1950s. Counts<br />
declined about 5% per year from<br />
1985 to 1993, remained relatively<br />
stable through 2000, and declined<br />
again in 2001. When compared historically,<br />
the monk seal beach count<br />
abundance index reached record<br />
lows for 2001, 2002, and 2003 (Figure<br />
10.34).<br />
Population trends have been variable<br />
at the six main reproductive subpopulations<br />
in the NWHI. In recent years<br />
overall pup production and juvenile<br />
HAWAIIAN GREEN SEA TURTLE<br />
The green turtle (Chelonia mydas) is the most abundant large marine herbivore and has a circumtropical distribution<br />
with distinct regional population<br />
structures. Globally, the green<br />
turtle has been subject to a long history<br />
of human exploitation with some<br />
stocks now extinct and others in decline.<br />
The Hawaiian green sea turtle<br />
or honu (Figure 10.35) comprises a<br />
spatially disjunct metapopulation with<br />
numerous distinct foraging grounds<br />
within the 2,200 km span of the Hawaiian<br />
Archipelago.<br />
The principal rookery for the Hawaiian<br />
green sea turtle is located on<br />
sand islands at French Frigate Shoals<br />
which accounts for >90% of all nesting<br />
within the Hawaiian Archipelago.<br />
The main rookery island at French<br />
Frigate Shoals is East Island where<br />
Figure 10.34. Historical trend in beach counts (non-pups) of Hawaiian monk seals at<br />
the six main reproductive subpopulations. Source: Antonelis et al., in review.<br />
survival have decreased at most sites. The largest subpopulation is at French Frigate Shoals where counts<br />
of non-pups have dropped by 60% since 1989, and the age distribution has become severely inverted due to<br />
high juvenile mortality over the last decade. Future abundance trends will likely depend upon whether predicted<br />
losses at French Frigate Shoals are countered by gains at other locations. Monk seals occur throughout<br />
the Hawaiian Archipelago, and although most are found in the NWHI, a small but increasing number haulout<br />
and pup in the MHI. They commonly occur on isolated beaches for resting, molting, parturition, and nursing<br />
offspring, and forage on demersal and benthic prey. Past and present sources of anthropogenic and natural<br />
impacts to monk seals include hunting during the1880s, disturbance (e.g., active and post WWII military activities),<br />
entanglement in marine debris, direct fishery interaction prior to establishment of the 1991 Protected<br />
Species Zone in the NWHI, predation by sharks, aggression by adult male monk seals, and reduction of habitat<br />
and prey due to environmental change. Assessment and mitigation of factors limiting population growth<br />
are ongoing challenges and primary objectives of the monk seal recovery effort.<br />
Figure 10.35. Greater than 90% of the Hawaiian green sea turtles’ principal nesting<br />
areas are located on the sand islands of FFS. Photo: J. Watt.
The State of Coral Reef Ecosystems of the Northwestern Hawaiian Islands<br />
at least 50% of all French Frigate Shoals nesting occurs. Nesting females exhibit strong island fidelity, and<br />
the Hawaiian green sea turtle stock has been continuously monitored for several decades. Annual surveys<br />
of the number of female green turtles coming ashore to nest each night have been conducted at East Island<br />
since 1973.<br />
Green sea turtles in U.S. waters have been protected under the Federal Endangered Species Act since 1978.<br />
From the mid-1800s until about 1974, the Hawaiian stock was subject to human exploitation such as turtle<br />
harvesting at foraging grounds, harvesting of nesters and eggs, and nesting habitat destruction.<br />
The long-term trends based on a population model for the East Island nester abundance illustrates two main<br />
features: a dramatic increase in abundance<br />
over the 30-year study and<br />
substantial fluctuations in the number<br />
of annual nesters (Figure 10.36).<br />
Such fluctuations are characteristic<br />
of green turtle nesting populations<br />
and reflect a variable proportion of<br />
females in the population that breed<br />
each year in response to spatially<br />
correlated ocean-climate variability.<br />
The Hawaiian green sea turtle stock<br />
is clearly recovering after more than<br />
25 years of protecting their nesting<br />
and foraging habitats in the Hawaiian<br />
Archipelago.<br />
PEARL OYSTERS<br />
The population of black-lipped pearl<br />
oysters, Pinctada margaritifera, at<br />
Pearl and Hermes Atoll were discovered<br />
in 1927 and heavily harvested.<br />
Conservative estimates indicate that<br />
approximately 150,000 oysters were<br />
either exported or killed during the<br />
harvest. An expedition in 1930 to<br />
assess the population post-harvest<br />
found 480 pearl oysters, and estimated<br />
100,000 oysters remaining on the<br />
reef. More recent surveys in 1969,<br />
1996, and 2000 found only a few<br />
oysters and it was assumed that the<br />
population had not recovered since<br />
the harvest.<br />
In 2003, the NOAA Fisheries-led<br />
multi-agency marine debris removal<br />
team spent several months conducting<br />
surveys at Pearl and Hermes that<br />
included documenting sightings of<br />
Figure 10.36. Nester abundance shown as the number of female green sea turtles<br />
nesting each year at East Island from 1973 to 2002. Source: Balazs and Chaloupka,<br />
2004.<br />
Figure 10.37. Pearl oyster size frequency distribution at P&H in 1930 and 2003.<br />
Source: Keenan et al., in review.<br />
pearl oysters (Keenan et al., in review). Over 1,000 individuals were documented and mapped in this sampling<br />
effort. The average size of pearl oysters in the 2003 surveys was larger than the 1930 surveys (Figure 10.37).<br />
The number of individuals and the size structure from recent surveys may reflect a recovery of the population<br />
70 years after harvest ceased and/or a more thorough sampling effort relative to previous surveys.<br />
Sidebar<br />
Northwestern Hawaiian Islands<br />
page<br />
303
Northwestern Hawaiian Islands<br />
page<br />
304<br />
The State of Coral Reef Ecosystems of the Northwestern Hawaiian Islands<br />
SEABIRDS<br />
Seabird colonies in the NWHI constitute one of the largest and most important assemblages of seabirds in the<br />
world, with approximately 14 million birds (5.5 million breeding annually) representing 21 species. More than<br />
95% of the world’s Laysan and Black-footed albatross nest here. For several other species such as Bonin<br />
petrel, Christmas shearwater, Tristram’s storm-petrel, and Grey-backed tern, the NWHI supports colonies of<br />
global significance. The last complete inventory of NWHI breeding populations was done between 1979 and<br />
1984. Population trends since then have been derived from more intensive monitoring at three islands. Population<br />
trends in the NWHI are stable or increasing for most species but there is concern for a few, especially<br />
the albatross.<br />
Annual reproductive success (proportion<br />
of chicks fledged per egg laid) of<br />
Laysan albatross, Diomedea immutabilis,<br />
and Blackfooted albatross, D.<br />
nigripes, at French Frigate Shoals in<br />
the NWHI indicates strong coherence<br />
between the two species that is especially<br />
evident during two years of<br />
very low reproductive success (1984<br />
and 1999) (Figure 10.38; Seki, 2004).<br />
Both years of low reproductive success<br />
occurred about one year after<br />
major ENSO events. Other seabird<br />
species such as Red-footed boobies,<br />
Sula sula; Red-tailed tropicbirds,<br />
Phaethon rubricauda; and Black noddies,<br />
Anous tenuirostris, also exhibited<br />
very low reproductive success in<br />
1998-99, but not in 1984.<br />
Figure 10.38. Temporal trends in the reproductive success of Black-footed and Laysan<br />
albatrosses monitored at FFS from 1980 to 2001. Source: Seki, 2004.<br />
The conservation status of Hawaiian seabirds was assessed as part of the North American Waterbird Conservation<br />
Plan. Eleven of the 21 species were classified as highly imperiled or high conservation concerns<br />
at the broad scale of the plan (eastern North Pacific, western North Atlantic, and Caribbean). At the regional<br />
scale (Pacific Islands) six species were included in these highest concern categories: Laysan, Black-footed<br />
and Short-tailed albatross; Christmas shearwater; Tristram’s storm-petrel; and Blue noddy. Greatest threats<br />
to seabirds in the NWHI are introduced mammals and other invasive species, fishery interactions, contaminants,<br />
oil pollution, and climate change. Over the past 20 years, active management in the NWRs and Hawaii<br />
State Seabird Sanctuary has included eradication of rodents (Rattus rattus at Midway and R. exulans at Kure);<br />
eradication or control of invasive plants; coordination among NOAA Fisheries, Fishery Management Councils,<br />
industry, and conservation organizations to reduce fishing impacts; and cleanup of contaminants and hazards<br />
at former military sites. The NWHI are unique in being one of the largest marine protected areas in the world,<br />
established in 1909 for the express purpose of protecting seabirds. Early protection and active management<br />
have resulted in large, diverse, and relatively intact seabird populations.<br />
The estimated 14 million seabirds residing in the NWHI are primarily pelagic feeders that obtain the fish and<br />
squid they consume by associating with schools of large predatory fish such as tuna and billfish (Fefer et al.,<br />
1984). While both the predatory fish and the birds are capable of foraging throughout their pelagic ranges,<br />
which encompass the entire tropical ocean, the birds are most successful at feeding their young when they can<br />
find schools of predatory fish within easy commuting range of the breeding colonies. Recently fledged birds,<br />
inexperienced in this complex and demanding style of foraging, rely on abundant and local food resources to<br />
survive while they learn to locate and capture prey. Ashmole and Ashmole (1967) and Boehlert (1993) suggest<br />
that the circulation cells and wake eddies found downstream of oceanic islands may concentrate plankton<br />
and therefore enhance productivity near islands, thus allowing higher tuna populations locally.
The State of Coral Reef Ecosystems of the Northwestern Hawaiian Islands<br />
Johannes (1981) describes the daily migrations of skipjack tuna and yellowfin tuna to and from the waters near<br />
islands and banks. Conservation of these tunas in the vicinity of seabird colonies will enhance the birds’ ability<br />
to provide adequate food for their offspring. Wake eddies also concentrate the larvae of many reef fishes and<br />
other reef organisms and serve to keep them close to reefs, enhancing survivorship of larvae and recruitment<br />
of juveniles and adults back to the reefs. For at least four of the 21 seabird species breeding in the NWHI<br />
(brown noddies, black noddies, white terns, and brown boobies), significant proportions (33%-56%) of their<br />
diet originate from the surrounding coral reef ecosystem (Ashmole and Ashmole, 1967; Harrison et al., 1983;<br />
Diamond, 1978).<br />
Overall Condition and Summary of Analytical Results<br />
The remoteness and limited reef fishing activities that have occurred in the NWHI have resulted in minimal<br />
anthropogenic impacts. Large apex predators such as jacks, reef sharks, and amberjacks are one of the<br />
most striking and unique components of the NWHI ecosystem. These top carnivores are seldom encountered<br />
nowadays in the inhabited Hawaiian Islands.<br />
The flora and fauna of the NWHI include a large percentage of species that are endemic to the Hawaiian Islands.<br />
The faunas of isolated oceanic archipelagos like the Hawaiian Islands represent species conservation<br />
hotspots that have become increasingly important due to the continual losses of biodiversity on coral reefs<br />
worldwide. The NWHI represent important habitat for a number of threatened and endangered species. The<br />
Hawaiian monk seal is one of the most critically endangered marine mammals in the U.S. (1,400 individuals)<br />
and depends almost entirely on the islands of the NWHI for breeding and the surrounding reefs for sustenance.<br />
Over 90% of all sub-adult and adult Hawaiian green sea turtles found throughout Hawaii come from<br />
the NWHI.<br />
Despite their high latitude location, nearly as many species of coral have been reported from the NWHI (57)<br />
compared with the MHI (59). Kure is the world’s most northern atoll and is referred to as the Darwin Point,<br />
where coral growth and subsidence/ erosion balance one another. Unlike the MHI where alien and invasive<br />
algae have overgrown many coral reefs, the reefs in the NWHI are free of alien algae and the high natural<br />
herbivory results in a pristine algal assemblage.<br />
Spatial and temporal variability of key oceanographic processes influence the structure, function, and biogeography<br />
of the NWHI coral reef ecosystem. Although currents in the region are dominated by eddy-energy,<br />
there is a weak mean flow from the MHI towards the NWHI. Preliminary drifter observations suggest local<br />
retention at the northern atolls, supporting observations of increased endemism upchain. Wintertime temperature<br />
minima (17-20°C) and summetime maxima (27-29°C) are greater at the northern end of the chain<br />
compared with the MHI. Observations of an intermittent eastward-flowing Subtropical Countercurrent in the<br />
region between French Frigate Shoals and Gardner Pinnacles support the hypothesis of a genetic gateway to<br />
the archipelago from the central Pacific.<br />
Sidebar<br />
Northwestern Hawaiian Islands<br />
page<br />
305
Northwestern Hawaiian Islands<br />
page<br />
306<br />
The State of Coral Reef Ecosystems of the Northwestern Hawaiian Islands<br />
CURRENT CONSERVATION MANAGEMENT ACTIVITIES<br />
Administrative jurisdiction over the islands and marine waters is shared by NOAA, USFWS, and the State of<br />
Hawaii. Eight of the 10 NWHI (all except Kure and Midway Atolls) have been protected by what is now the<br />
Hawaiian Islands National Wildlife Refuge (HINWR) established by President Theodore Roosevelt in 1909.<br />
The Refuge includes all land and reef areas to 20 fathoms off Necker Island and to 10 fathoms off the remaining<br />
seven islands.<br />
The State of Hawaii manages the Kure Atoll Wildlife Refuge and all waters around each of the islands and<br />
atolls from 0-3 miles except Midway. The State has recently proposed regulations that would create the NWHI<br />
<strong>Marine</strong> Refuge. The new NWHI <strong>Marine</strong> Refuge would: 1) require an entry permit for any activities within State<br />
waters; 2) prohibit fishing of any kind at Kure Atoll, Pearl and Hermes Atoll, Lisianski Island, Laysan Island,<br />
Maro Reef, Gardner Pinnacles, French Frigate Shoals, and Necker Island; 3) prohibit fishing of any kind from<br />
0-10 fathoms in State waters surrounding Nihoa Island; 4) allow for Native Hawaiian cultural gathering; 5)<br />
prohibit engaging in any activity, including the anchoring of a vessel that can or does result in damaging or<br />
destroying coral, and; 6) prohibit engaging in any activity not authorized by this regulation. These proposed<br />
rules are undergoing final review and will be enacted into law sometime in early <strong>2005</strong>. The State also issues<br />
commercial fishing permits to all fishermen fishing in the NWHI and landing their catch in Hawaii. The State<br />
maintains the data base on effort and landings that are used by the management agencies for fisheries management<br />
decisions.<br />
NOAA Fisheries has also designated 10 areas from the shore to 20 fathoms in the NWHI as critical habitat<br />
for the Federally endangered Hawaiian monk seal, although this designation does not include any restrictions<br />
of activities. Commercial fishing in the NWHI within 100 m depth targets mostly bottomfish and previously<br />
lobsters, each of which is managed separately by the NOAA Fisheries through fishery management plans<br />
developed by the Western Pacific Regional Fishery Management Council. Both of these fisheries are limited<br />
entry with fewer than 20 vessels allowed to operate in each fishery. Presently, there are fewer than 10 vessels<br />
active in the bottomfish fishery. The lobster fishery has been closed by NOAA Fisheries since 2000 due<br />
to uncertainties in the lobster population model parameters used to accurately estimate the exploitable lobster<br />
population.<br />
Except for Midway, the NOAA Northwestern Hawaiian Islands Coral Reef Ecosystem Reserve (CRER), established<br />
in 2000 by President Clinton (Executive Order 13178 and amended with Executive Order 13196 in<br />
January 2001), extends protection and Federal jurisdiction beyond the offshore boundaries of State waters to<br />
a maximum distance of 50 nm (see Figure 10.1). Midway is outside both State of Hawaii and CRER jurisdiction<br />
and since 1996 has been under USFWS administration as the Midway Atoll NWR, affording protection<br />
to all reefs and islands at the atoll. This large reserve area, 2,200 km in length and 3-50 nautical miles (6-93<br />
km) from shorelines, is managed by the Secretary of Commerce and may be designated as a National <strong>Marine</strong><br />
Sanctuary. Executive Order 13178 also established caps on commercial fishing and 15 Reserve Preservation<br />
Areas in which extractive use is prohibited with limited exceptions. The Reserve boundaries lie seaward<br />
of the jurisdictional areas of the Hawaiian Islands NWR, Midway Atoll NWR, and State of Hawaii boundaries,<br />
mandating that all three agencies cooperate fully for effective protection of all NWHI and coral reefs.<br />
Except for Kure and Midway, recreational and commercial fishing activities are prohibited within the 10-fathom<br />
isobath of the eight islands (and inside 20 fathoms around Necker) within the Hawaiian Islands NWR managed<br />
by the USFWS. Kure Atoll currently falls under State jurisdiction, and fishing is permitted on its shallow reefs.<br />
Under the State’s proposed new marine refuge regulations, fishing will no longer be allowed within State waters<br />
at Kure. Midway Atoll NWR sponsored a catch-and-release sportfishery between 1996 and 2002, but all<br />
ecotourism activities including sport fishing have been greatly reduced due to funding shortfalls to operate the<br />
refuge associated transportation, housing facilities and utilities.
The State of Coral Reef Ecosystems of the Northwestern Hawaiian Islands<br />
OVERALL <strong>STATE</strong>/FEDERAL CONCLUSIONS AND RECOMMENDATIONS<br />
With coral reefs around the world in decline, it is extremely rare to be able to examine a coral reef ecosystem<br />
that is relatively free of human influence and consisting of a wide range of healthy coral reef habitats. The<br />
remoteness and limited activities that have occurred in the NWHI have resulted in minimal anthropogenic impacts.<br />
The region represents one of the few large-scale, intact, predator-dominated reef ecosystems remaining<br />
in the world and offers an opportunity to examine what could occur if larger more effective no-take marine<br />
reserves are established elsewhere. The high proportion of endemic species and unique mix of tropical and<br />
sub-tropical assemblages has identified the NWHI as a global biodiversity hotspot. The NWHI are critically important<br />
to a number of wide-ranging species such as seabirds, turtles, monk seals, and sharks (Figure 10.39).<br />
Strong ecological linkages are provided by these and a few other organisms for the transfer of energy and<br />
nutrients among ecosystems.<br />
The nearly pristine condition of the NWHI allows us to understand how unaltered ecosystems are structured,<br />
how they function, and how they can most effectively be preserved. The NWHI provide an unparalleled opportunity<br />
to assess how a “natural” coral reef ecosystem functions in the absence of major human intervention.<br />
These reefs consist of discreet ecological subunits that can be used as replicates to examine large-scale<br />
ecological processes, while the scale of the existing fisheries allows for adaptive management strategies<br />
that can address questions related to stock decline and recovery. The NWHI represents a baseline in which<br />
to understanding natural fluctuations and measure the success of existing management regimes elsewhere.<br />
Lessons learned from the NWHI can be used to help develop more effective management strategies in the<br />
MHI and other ecosystems. The NWHI should not only be conserved for their intrinsic value, but also for their<br />
value to hedge against fisheries collapses and as a model for ecosystem-based management.<br />
Figure 10.39. Seabirds, such as these Brown noddy terns and Brown booby at P&H (left photo), rely on the NWHI for nesting, feeding<br />
and breeding. The critically endangered Hawaiian monk seal (right photo) is an intergral component of the NWHI ecosystem. Photos:<br />
J. Watt.<br />
Sidebar<br />
Northwestern Hawaiian Islands<br />
page<br />
307
Northwestern Hawaiian Islands<br />
page<br />
308<br />
The State of Coral Reef Ecosystems of the Northwestern Hawaiian Islands<br />
REFERENCES<br />
Abbott, I.A. 1989. <strong>Marine</strong> Algae of the Northwest Hawaiian Islands. Pacific Science 43: 223-233.<br />
Abbott, I.A. 1999. <strong>Marine</strong> Red Algae of the Hawaiian Islands. Bishop Museum Press, Honolulu. 477 pp.<br />
Abbott, I.A. and K.J. McDermid. 2001. Dudresnaya battittiana (Dumontiaceae, Gigartinales), a new red algal species<br />
from Midway Atoll, North Central Pacific. Cryptogamie, Algologie 22: 249-261.<br />
Abbott, I.A. and K.J. McDermid. 2002. On two species of Kallymenia (Rhodophyta: Gigartinales: Kallymeniaceae) from<br />
the Hawaiian Islands, Central Pacific. Pacific Science 56: 149-162.<br />
Abbott, I.A. and J.M. Huisman. 2004. <strong>Marine</strong> Green and Brown Algae of the Hawaiian Islands. Bishop Museum Press,<br />
Honolulu. 259 pp.<br />
Aeby, G.S. 1998. A digenean metacercaria from the reef coral, Porites compressa, experimentally identified as Podocotyloides<br />
stenometra. Journal Parasitology 84 (6): 1259-1261.<br />
Aeby, G.S. In review. Outbreak of coral disease in the Northwestern Hawaiian Islands. Coral Reefs.<br />
Aeby G.S, J.C. Kenyon, J.E. Maragos and D.C. Potts. 2003. First record of mass coral bleaching in the Northwestern<br />
Hawaiian Islands. Coral Reefs 22 (3): 256.<br />
Antonelis, G.A., J.D. Baker, T.C. Johanos, R.C. Braun and A.L. Harting. In Review. Hawaiian monk seal (Monachus<br />
schauinslandi): Status and Conservation Issues. Third Northwestern Hawaiian Island Symposium, Honolulu.<br />
Ashmole, N.P. and M.J. Ashmole. 1967. Comparative Feeding Ecology of Sea Birds of a Tropical Oceanic Island. Peabody<br />
Museum of Natural History. Yale University Bulletin 24.<br />
Balazs G.H. 1979. <strong>Marine</strong> benthic algae collected from Kure Atoll, Maro Reef and Necker Bank, Northwestern Hawaiian<br />
Islands. Elepaio 39: 110-111.<br />
Balazs, G.H. and M. Chaloupka. 2004. Thirty-year recovery trend in the once depleted Hawaiian green sea trutle stock.<br />
Biological Conservation 117: 491-498.<br />
Boehlert, G. (ed.). 1993. Fisheries of Hawaii and the U.S. -associated Pacific Islands. <strong>Marine</strong> Fisheries Review 55: 1-<br />
138.<br />
Brainard, R.E., R. Hoeke, R.A. Moffitt, K.B. Wong, J. Firing, J. Gove, S. Choukroun and K. Hogrefe. In review. Spatial and<br />
temporal variability of key oceanographic processes influencing coral reef ecosystems of the Northwestern Hawaiian. In:<br />
Proceedings of the Northwestern Hawaiian Islands: 3rd Scientific Symposium, Honolulu. 18 pp.<br />
Buggeln, R.G. 1965. A preliminary list of the algal flora of the Midway Islands. Atoll Research Bulletin 109: 1-11.<br />
Clarke K.R. and R.M. Warwick. 2001. Change in marine communities: an approach to statistical analysis and interpretation,<br />
second edition. PRIMER-E: Plymouth <strong>Marine</strong> <strong>Laboratory</strong>, Plymouth.<br />
Debelius, H., H. Tanaka and R. Kuiter. 2003. Angelfishes: A comprehensive guide to Pomacathidae. TMC Publishing,<br />
Chorleywood, UK. 208 pp.<br />
DeFelice, R.C., S.L. Coles, D. Muir and L.G. Eldredge. 1998. Investigation of the marine communities of Midway Harbor<br />
and adjacent lagoon, Midway Atoll, Northwestern Hawaiian Islands. Bishop Museum, Hawaii Biological Survey Contribution<br />
No. 1998-014.<br />
DeFelice, R.C., D. Minton and L.S. Godwin. 2002. Records of shallow-water marine invertebrates from French Frigate<br />
Shoals, Northwestern Hawaiian Islands, with a note on non-indigenous species. Report to the U.S. Fish and Wildlife<br />
Service. Bishop Museum, Hawaii Biological Survey, Bishop Museum Technical Report No. 23.<br />
DeMartini, E.E. 2004. Habitat affinities of recruits to shallow-reef fish populations: selection criteria for no-take MPAs in<br />
the NWHI Coral Reef Ecosystem Reserve. Bulletin of <strong>Marine</strong> Science 74: 185-205.<br />
DeMartini E.E., F.A. Parrish and J.D. Parrish. 1996. Interdecadal change in reef fish populations at French Frigate Shoals<br />
and Midway Atoll, Northwestern Hawaiian Islands: statistical power in retrospect. Bulletin of <strong>Marine</strong> Science 58: 804-<br />
825.
The State of Coral Reef Ecosystems of the Northwestern Hawaiian Islands<br />
DeMartini E.E., F.A. Parrish and R.C. Boland. 2002. Comprehensive evaluation of shallow reef fish populations at French<br />
Frigate Shoals and Midway Atoll, Northwestern Hawaiian Islands (1992/93, 1995-2000). NOAA Technical Memorandum<br />
NMFS NOAA-TM-NMFS-SWFSC-347. 54 pp.<br />
DeMartini E.E., G.T. DiNardo and H.A. Williams. 2003. Temporal changes in population density, fecundity, and egg size<br />
in the Hawaiian spiny lobster (Panulirus marginatus) at Necker bank, Northwestern Hawaiian Islands. Fisheries Bulletin<br />
101: 22-31.<br />
DeMartini E.E. and A.M. Friedlander. 2004. Spatial patterns of endemism in shallow reef fish populations of the Northwestern<br />
Hawaiian Islands. <strong>Marine</strong> Ecology Progress Series 271: 281-296.<br />
DeMartini E.E., A.M. Friedlander and S. Holzwart. In press. Differences in size at sex change in protogynous labroids,<br />
prey body size distributions, and apex predator densities at Northwestern Hawaiian Island atolls. <strong>Marine</strong> Ecology Progress<br />
Series.<br />
Diamond, A.W. 1978. Feeding strategies and population size in tropical seabirds. American Naturalist 112: 215-223.<br />
Fefer, S.I., C.S. Harrison, M.B. Naughton and R.J. Shallenberger. 1984. Synopsis of results of recent seabird research<br />
conducted in the Northwestern Hawaiian Islands. pp. 9-77. In: Proceedings of the Second Symposium on Resource Investigations<br />
in the NWHI. UNIHI-SEAGRANT-MR-84-01.<br />
Firing, J.B., R. Brainard and E. Firing. 2004a. Ten years of shipboard ADCP measurements along the Northwestern Hawaiian<br />
Islands. Northwestern Hawaiian Islands: 3rd Scientific Symposium, Honolulu. 18 pp.<br />
Firing, J.B., R. Hoeke, R.E. Brainard and E. Firing. 2004b. Connectivity in the Hawaiian Archipelago and beyond: potential<br />
larval pathways. pp. 310. In: Proceedings of the 10th International Coral Reef Symposium, Okinawa.<br />
Friedlander, A.M. and E.E. DeMartini. 2002. Contrasts in density, size, and biomass of reef fishes between the northwestern<br />
and the main Hawaiian islands: the effects of fishing down apex predators. <strong>Marine</strong> Ecology Progress Series 230:<br />
253-264.<br />
Godwin, L.S. 2000. Records of the marine invertebrates from derelict fishing net debris in the Northwestern Hawaiian<br />
Islands. Report to the NOAA-NMFS, Coral Reef Ecosystem Investigation.<br />
Godwin, L.S. 2002. Preliminary report on non-coral marine invertebrates. NOAA-NMFS.<br />
Grigg, R.W. 1981. Acropora in Hawaii. Part 2. Zoogeography. Pacific Science 35: 15-24.<br />
Grigg, R.W. 1983. Community structure, succession and development of corall reefs in Hawaii. <strong>Marine</strong> Ecology Progress<br />
Series 11: 1-14.<br />
Grigg, R.W., J. Wells and C. Wallace. 1981. Acropora in Hawaii, Part 1. History of the scientific record, systematics and<br />
ecology. Pacific Science 35: 1-13.<br />
Harrison, C.S., T.S. Hida and M.P. Seki. 1983. Hawaiian Seabird Feeding Ecology. Wildlife Monographs 85: 1-71.<br />
Harvell, C, K. Kim, J. Burkholder, R. Colwell, P. Epstein, D. Grimes, E. Hofmann, E. Lipp, A. Osterhaus, R. Overstreet, J.<br />
Porter, G. Smith and G. Vasta. 1999. Emerging marine diseases-Climate links and anthropogenic factors. Science 285:<br />
1505-1510.<br />
Hoeke, R., R. Brainard, R. Moffitt, M. Merrifield and W. Skirving. 2004a. The role of oceanographic conditions and reef<br />
morphology in the 2002 coral bleaching event in the Northwestern Hawaiian Islands. pp. 61. In: Northwestern Hawaiian<br />
Islands: 3rd Scientific Symposium, Honolulu.<br />
Hoeke, R.K., R.E. Brainard, R.E. Moffitt, G. Lui, A.E. Strong and W. Skirving. 2004b. Oceanographic conditions implicated<br />
in the 2002 Northwestern Hawaiian Islands coral bleaching event. pp. 90. In: Proceedings of the 10th International<br />
Coral Reef Symposium, Okinawa.<br />
Howe MA. 1934. Hawaiian algae collected by Dr. Paul C. Galtsoff. Journal of Washington Academy of Sciences 24: 32-<br />
42.<br />
Johannes, R.E. 1981. Words of the Lagoon: Fishing and marine lore in the Palau District of Micronesia. University of<br />
California Press, Berkeley.<br />
Sidebar<br />
Northwestern Hawaiian Islands<br />
page<br />
309
Northwestern Hawaiian Islands<br />
page<br />
310<br />
The State of Coral Reef Ecosystems of the Northwestern Hawaiian Islands<br />
Jokiel, P.L. and S.L. Coles. 1990. Response of Hawaiian and other Indo-Pacific reef corals to elevated temperatures<br />
related to global warming. Coral Reefs 8: 155-162.<br />
Jokiel, P.L. and E.K. Brown. 2004. Global warming, regional trends and inshore environmental conditions influence coral<br />
bleaching in Hawaii. Global Change Biology 10: 1627-1641.<br />
Juvik S.P. and J.O. Juvik. 1998. Atlas of Hawaii, third edition. University of Hawaii Press, Honolulu.<br />
Keenan, E.E., R.E. Brainard and L.V. Basch. In review. Distribution and abundance of the pearl oyster, Pinctada margaritifer.<br />
Atoll Research Bulletin.<br />
Kenyon J.C., R.E. Brainard R.K. Hoeke F.A. Parrish and C.B. Wilkinson CB. 2004. Towed-diver surveys, a method for<br />
mesoscale spatial assessment of benthic reef habitat: a case study at Midway Atoll in the Hawaiian Archipelago. pp. 348<br />
– 356. In: Proceedings of the Coastal Zone Asia-Pacific Conference, Brisbane, Australia.<br />
Kenyon J.C. and R.E. Brainard. In review. A second episode of mass coral bleaching in the Northwestern Hawaiian Islands.<br />
Atoll Research Bulletin.<br />
Kenyon, J.C., R.E. Brainard, G.S. Aeby, J.D. Chojnacki, M.J. Dunlap and C.B. Wilkinson. In review. Mass coral bleaching<br />
on high latitude reefs in the Hawaiian Archipelago. In: Proceedings of the 10th International Coral Reef Symposium.<br />
Okinawa.<br />
Lemmerman E. 1905. Die algenflora der Sandwich-Iseln. Ergebnisse einer reise nach dem Pacific (H. Schauinsland,<br />
1896-97). Bot. Jahrb. Syst. 24: 607-663.<br />
Mantua, N.J., S.R. Hare, Y. Zhang, J.M. Wallace and R.C. Francis. 1997. A Pacific interdecadal climate oscillation with<br />
impacts on salmon production. Bulletin of the American Meteorological Society 78: 1069-1079.<br />
Maragos, J.E. 1995. Revised checklist of extant shallow-water corals from Hawaii (Cnidaria: Anthozoa: Scleractinia). pp.<br />
54-55. In: Bishop Museum Occassional Papers 42. Bishop Museum Press, Honolulu.<br />
Maragos J.E., D.C. Potts, G. Aeby, D. Gulko, J. Kenyon, D. Siciliano and D. Van Ravenswaay. 2004. 2000-2002 Rapid<br />
Ecological Assessment of Corals (Anthozoa) on Shallow Reefs of the Northwestern Hawaiian Islands. Part I: Species and<br />
Distribution. Pacific Science 58 (2): 211-230.<br />
Moffitt, R. 2004. NOAA Fisheries, PIFSC. Honolulu. Personal communication.<br />
National Oceanic and Atmospheric Administration. 2003. Atlas of the Shallow-water Benthic Habitats of the Northwestern<br />
Hawaiian Islands (Draft). 160 pp.<br />
Okano R.L.Y., C.M. Smith and I.A. Abbot. In preparation. The algae and other benthic organisms of Kure Atoll’s Lagoon.<br />
Polovina, J.P., G.T. Mitchem and G.T. Evans. 1995. Decadal and basin-scale variation in mixed layer depth and the impact<br />
on biological production in the central and north Pacific, 1960-1988. Deep-sea Research 1 (42): 1701-1716.<br />
Preskitt L.B., P.S. Vroom and C.M. Smith. 2004. A rapid ecological assessment (REA) quantitative survey method for<br />
benthic algae using photoquadrats with SCUBA. Pacific Science 58: 201-209.<br />
Pyle, R. 2004. Bishop Museum, Honolulu. Personal communication.<br />
Randall, J.E. 1987. Introductions of marine fishes to the Hwaiian Islands. Bulletin of <strong>Marine</strong> Science 41: 490-502.<br />
Randall J.E. 1998. Zoogeography of shore fishes of the Indo-Pacific region. Zoological Studies (Taiwan) 37: 227-268.<br />
Reinbold T. 1899. Ergebnisse einer reise nach dem Pacific (Prof. H. Schauinsland, 1896/97). Meeresalgen. Abh. Naturw.<br />
Ver. Bremen 16: 287-302.<br />
Seki, M.P. 2004. Transition zone. pp. 201-210. In: North Pacific Ecosystem Status Report. North Pacific <strong>Marine</strong> Science<br />
Organization. Sidney, British Columbia, Canada.<br />
Seki, M.P., J.J. Polovina, D.R. Kobayashi, R.R. Bidigare and G.T. Mitchum. 2002. An oceanographic characterization of<br />
swordfish longline fishing grounds in the Subtropical North Pacific Fisheries Oceanography 11 (5): 251-266.<br />
Sudekum, A.E., J.D. Parrish, R.L. Radtke and S. Ralston. 1991. Life history and ecology of large jacks in undisturbed,<br />
shallow oceanic communities. Fisheries Bulletin 89: 493-513.
The State of Coral Reef Ecosystems of the Northwestern Hawaiian Islands<br />
Tsuda, R.T. 1965. <strong>Marine</strong> algae from Laysan Island with additional notes on the vascular flora. Atoll Research Bulletin<br />
110: 1-22.<br />
Tsuda, R.T. 1966. <strong>Marine</strong> benthic algae from the Leeward Hawaiian group. Atoll Research Bulletin 115: 1-13.<br />
Vatter, A. 2003. Bottom longline fishing for sharks in the Northwestern Hawaiian Islands. NOAA, NMFS, Pacific Islands<br />
Region Administrative Report AR-PIR-03-01.<br />
Veron, J.E.N. 2000. Corals of the World. Volumes 1-3. Australian Institute of <strong>Marine</strong> Science.<br />
Vroom, P.S. and C.M. Smith. 2003. Reproductive features of Hawaiian Halimeda velasquezii (Bryopsidales, Chlorophyta),<br />
and an evolutionary assessment of reproductive characters in Halimeda. Cryptogamie. Algologie 24: 355-370.<br />
Vroom, P., S. Isabella and A. Abbott. 2004a. /Acrosymphyton brainardii/ sp. nov. (Gigartinales, Rhodophyta) from French<br />
Frigate Shoals, Northwestern Hawaiian Islands. Phycologia 43: 68-74.<br />
Vroom, P., S. Isabella and A. Abbott. 2004b. /Scinaia huismanii /sp. nov. (Nemaliales, Rhodophyta): an addition to the<br />
exploration of the marine algae of the northwestern Hawaiian Islands. Phycologia 43: 445-454.<br />
Vroom, P.S. and N.K. Page. In press. Relative abundance of macroalgae (RAM) on Northwestern Hawaiian Island reefs.<br />
Atoll Research Bulletin.<br />
Vroom P.S., K.N. Page, J.C. Kenyon and R.E. Brainard. In preparation. Breaking paradigms: healthy algal-dominated<br />
reefs in the Northwestern Hawaiian Islands.<br />
Vroom P.S., K.N. Page, K.A. Peyton and J.K. Kukea-Shutlz. In press, a. Spatial heterogeniety of benthic community assemblages<br />
with an emphasis on reef algae at French Frigate Shoals, Northwestern Hawaiian Islands. Coral Reefs.<br />
Vroom P.S., K.N. Page, K.A. Peyton and J.K. Kukea-Shutlz. In press, b. <strong>Marine</strong> algae of French Frigate Shoals, Northwestern<br />
Hawaiian Islands: species list and biogeographic comparisons. Pacific Science.<br />
Western, C. and R. Rameyer. 2002. French Frigate Shoals reef health survey. US Geological Survey, National Wildlife<br />
Health Center, Hawaii Field Station, 25 pp.<br />
Zabin, J.Z., J.T. Carlton and L.S. Godwin. 2003. First report of the Asian sea anemone Diadumene lineata from the Hawaiian<br />
Islands. Bishop Museum Occasional Papers.<br />
Sidebar<br />
Northwestern Hawaiian Islands<br />
page<br />
311
American Samoa<br />
page<br />
312<br />
The State of Coral Reef Ecosystems of American Samoa<br />
Peter Craig 1 , Guy DiDonato 2 , Douglas Fenner 3 , Christopher Hawkins 4<br />
INTRODUCTION AND SETTING<br />
American Samoa is a U.S. Territory located approximately 4,200 km south of Hawai’i. It is the southernmost<br />
of all U.S. possessions and the only U.S. jurisdiction in the South Pacific. American Samoa comprises seven<br />
islands (five volcanic islands and two coral atolls) with a combined land area of approximately 200 km 2 (Figure<br />
11.1). The five volcanic islands, Tutuila, Aunu’u, Ofu, Olosega, and Ta’u, are the major inhabited islands of<br />
American Samoa. Tutuila, the largest island, is also the center of government and business. Ofu, Olosega, and<br />
Ta’u, collectively referred to as the Manu’a Islands, are 107 km east of Tutuila. Two outer islands, Rose Atoll<br />
and Swains Island, are approximately 259 km and 327 km from Tutuila, respectively. Rose Atoll is uninhabited<br />
and is managed as a National Wildlife Refuge (NWR) by the U.S. Fish and Wildlife Service (USFWS), while<br />
Swains Island is inhabited by a subsistence population of approximately 10 people.<br />
The islands range in size from the populated high island of Tutuila (138 km 2 ) to the uninhabited and remote<br />
Rose Atoll (4 km 2 ). The total area of coral reefs (to the 100 m depth) in the Territory is 296 km 2 . Due to the<br />
steepness of the main islands, shallow water habitats around the islands are limited and consist primarily of<br />
fringing coral reefs (85% of total coral reef area) with a few offshore banks (12%) and two atolls (3%). The<br />
fringing reefs have narrow reef flats (50-500 m); depths of 1000 m are reached within 2-8 km from shore.<br />
Coral reefs in American Samoa support a high diversity of Indo-Pacific corals (over 200 species), fishes (890<br />
species), and countless invertebrates. In recent years the corals have demonstrated considerable resilience<br />
following a series of natural disturbances, including four hurricanes in the past 18 years, a devastating crownof-thorns<br />
starfish invasion in 1978, and several recent bleaching events. Following each disturbance, the<br />
corals eventually recovered and grew to maintain the structural elements of the reefs. However, because<br />
serious overfishing has occurred, the Territory’s coral reef ecosystem cannot be considered healthy based on<br />
the resilience of the corals alone. Furthermore, climate change impacts such as warm-water coral bleaching<br />
and coral disease are becoming increasingly apparent and pose a major, repetitive impact to the structure<br />
and function of local reefs. Additionally, the Territory’s high population growth rate (2.1% per year) continues<br />
to strain the environment with issues such as extensive coastal alterations, fishing pressure, loss of wetlands,<br />
soil erosion and coastal sedimentation, solid and hazardous waste disposal, and pollution.<br />
1 National Park of American Samoa<br />
2 American Samoa Environmental Protection Agency<br />
3 American Samoa Department of <strong>Marine</strong> and Wildlife Resources<br />
4 American Samoa Coral Reef Initiative
Figure 11.1. Map of the locations in American Samoa mentioned in this chapter. Map: A. Shapiro.<br />
The State of Coral Reef Ecosystems of American Samoa<br />
American Samoa<br />
Sidebar<br />
page<br />
313
American Samoa<br />
page<br />
314<br />
The State of Coral Reef Ecosystems of American Samoa<br />
ENVIRONMENTAL AND ANTHROPOGENIC STRESSES<br />
Climate Change and Coral Bleaching<br />
Global warming and climate change<br />
will impact coral reefs in at least two<br />
ways. First, these impacts increase<br />
water temperatures which can<br />
stress or kill corals; second, they<br />
increase the level of dissolved CO 2<br />
in sea water which may reduce the<br />
growth rate of corals and promote<br />
erosion of the reef itself. Despite the<br />
remote oceanic location of American<br />
Samoa, it is apparent that CO 2 (a<br />
primary greenhouse gas) is steadily<br />
increasing (Figure 11.2). In recent<br />
years, some coral bleaching has been<br />
observed annually on local reefs, and<br />
bleaching was particularly widespread<br />
and prolonged (four months) in 1994,<br />
2002, and 2003 (Figure 11.3A).<br />
However, systematic assessments<br />
of the degree of bleaching, species<br />
affected, and percent recovery/<br />
mortality is generally not available for<br />
the Territory.<br />
Figure 11.2. Increase of atmospheric CO 2 in American Samoa, Hawaii, and the North<br />
and South Poles. Source: NOAA Climate Monitoring and Diagnostic <strong>Laboratory</strong>.<br />
Diseases<br />
During bleaching episodes in 2002 and 2003, formerly rare coral diseases were commonly seen (Figure<br />
11.3B,C). At present, there is a lack of consistent descriptive terminology for Pacific coral diseases, but what<br />
has been observed seems similar to that called ‘white syndrome’ in the Great Barrier Reef. Coral tumors have<br />
also been observed on local reefs.<br />
A<br />
B C<br />
Figure 11.3. Images of bleached (A) and diseased (B, C) acroporid corals. The disease is similar to the ‘white syndrome’ seen in the<br />
Great Barrier Reef, and generally results in a three-tiered appearance: a healthy-colored section, a white zone of recently dead polyps,<br />
and a dead area that has been colonized by epiphytic algae. Photos: P. Craig.
Tropical Storms<br />
Tropical storms and cyclones are a<br />
natural occurrence in the South Pacific<br />
region. American Samoa has been hit<br />
by four cyclones in the past 18 years<br />
(1986, 1990, 1991, 2004). The 1986<br />
cyclone was especially damaging to<br />
the Manu’a Islands, the 1990 and<br />
1991 cyclones caused heavy damage<br />
throughout the Territory, while the<br />
recent cyclone in 2004 appears to<br />
have been less severe, causing the<br />
loss of perhaps 10% of reefs on the<br />
northern sides of the islands. During<br />
the latest cyclone (Figure 11.4), there<br />
was relatively little rainfall, so the<br />
massive sedimentation and nutrient<br />
enrichment that caused widespread<br />
growths of epiphytic algae after the<br />
1991 cyclone did not occur.<br />
Coastal Development and Runoff<br />
Most of the population of American<br />
Samoa resides on Tutuila. However,<br />
only approximately one-third of the<br />
land area has a slope of less than<br />
30%. As a result, the population<br />
density of the island is 1,350 people<br />
per km 2 , which surpasses the<br />
population density of Manhattan in<br />
New York City, even though the island<br />
is semi-rural and the tallest structures<br />
are two stories high. This density has<br />
placed considerable demands on<br />
American Samoa’s coastal areas.<br />
Though all of the Territory’s lands are<br />
within the coastal zone, most of the<br />
land favorable for development lies<br />
immediately adjacent to the coast<br />
(Figure 11.5). Several hundred landuse<br />
permit applications are received<br />
per year, a majority of which are<br />
approved with conditions.<br />
The State of Coral Reef Ecosystems of American Samoa<br />
Figure 11.4. A map showing the paths and intensities of tropical cyclones passing<br />
near American Samoa from 1979-2004. Year of storm, storm name and storm strength<br />
on the Saffir-Simpson scale (C1-5) are indicated for each. Map: A. Shapiro. Source:<br />
http://weather.unisys.com/hurricane, Accessed 1/10/05.<br />
Figure 11.5. Development pressure often occurs at locations adjacent to sensitive<br />
habitats, such as the mangrove forests and coral reefs that occur near this harbor.<br />
Photo: American Samoa Coastal Management Program.<br />
American Samoa<br />
Sidebar<br />
page<br />
315
American Samoa<br />
page<br />
316<br />
The State of Coral Reef Ecosystems of American Samoa<br />
Figure 11.6 Heavy rains can cause flooding, which transports sediment, nutrients,<br />
and pollutants into coastal waters. Photo: C. Hawkins.<br />
Coastal Pollution<br />
Pollution from human activities<br />
has directly impacted the coastal<br />
resources of American Samoa, with<br />
the most obvious evidence of this<br />
in Pago Pago Harbor. Historical<br />
industrial, commercial, and military<br />
activity in the harbor led to coastal<br />
pollution that degraded water quality<br />
and local reef habitats. In recent<br />
years, the regulation of commercial<br />
and industrial facilities in Pago Pago<br />
Harbor has reduced coastal pollution,<br />
and monitoring has tracked dramatic<br />
improvements in water quality (see<br />
‘Water Quality’ section). Limited<br />
evidence suggests that harbor reef<br />
habitats may be recovering as well.<br />
Point source pollution, which has been successfully identified and mitigated, has been replaced by nonpoint<br />
source pollution as the primary pollution in coastal areas (Figure 11.6). Runoff from impervious surfaces directly<br />
impacts coastal areas, while island streams transport elevated levels of nutrients to coastal areas. Nutrient<br />
sources to local streams include faulty or improperly constructed septic tanks and concentrated animal waste<br />
from small family-owned pigsties. Streams entering coastal waters carry large amounts of sediments and<br />
nutrients, as many homes and businesses are located along them. The flow can be heavy during rainfalls, since<br />
the topography is steep. Exacerbating this is the amount of impermeable surface that has been constructed<br />
along the low, flat coastal lands.<br />
Local streams also serve as temporary waste receptacles, and this debris causes unsightly trash deposits in<br />
the nearshore coastal areas. The island’s main road runs along the water’s edge and has historically been a<br />
convenient place to dump unwanted debris. In addition, vegetation clearing for crops often occurs on lands<br />
with slopes greater than 30%, which in turns leads to excessive erosion. As a consequence, most villages in<br />
the Territory have experienced major flooding, stream sedimentation, and impacts to reef ecosystems.<br />
Tourism and Recreation<br />
There is relatively little tourism in American Samoa and it appears that it will be some years before the Territory<br />
enters the mainstream of South Pacific tourism, as has nearby Fiji (400,800 tourists in 2003; Fiji Tourism,<br />
http://www.bulafiji.com/Industry.asp?lang=EN&sub=0156, Accessed 5/2/05). For example, the annual number<br />
of visitors to the National Park of American Samoa is currently estimated to be only 1,000 on Tutuila Island,<br />
1,000 on Ofu Island, and 20 on Ta’u Island. Perhaps half of these tourists use marine areas of the park for<br />
swimming, snorkeling, or scuba diving. There are also few pleasure boats – about 30 anchor in Pago Pago<br />
Harbor during the cyclone season, but none are found elsewhere in the Territory. Tournaments for pelagic<br />
sport fish (e.g., tuna, marlin, etc.) occur sporadically, with some 20 small local vessels competing to catch<br />
the largest fish. Over the years there has also been a slight increase in numbers of villagers participating in<br />
recreational fishing along island shorelines; however, their numbers are low and only a few are seen during a<br />
drive around the island.<br />
Fishing<br />
There are two types of fisheries that harvest coral reef fishes and invertebrates: 1) subsistence fishing by<br />
villagers, which is usually a shoreline activity using a variety of gear, such as rod and reel, spear guns, gillnet,<br />
and gleaning; and 2) artisanal fishing by free-divers who spear fish, and small-boat fishers who jig for bottomfish<br />
around the steeply sloping islands. Most of these fish are sold at local stores. Subsistence fishing has been
The State of Coral Reef Ecosystems of American Samoa<br />
declining over the past two decades (Coutures, 2003) as a result of the gradual change from a subsistence to<br />
a cash-based economy. A third type of fishery focuses on pelagic fishes, especially tuna. The pelagic fishery<br />
includes small longline boats and large commercial boats that deliver tuna to the local canneries.<br />
Coral reef fish and invertebrate resources have declined in abundance. Harvested species such as giant<br />
clams and parrotfish are overfished, and there has been heavy fishing pressure on surgeonfish (Craig et al.,<br />
1997; Page, 1998; Green and Craig, 1999). Groupers, snappers and jacks seen on the reef are smaller and<br />
less abundant than in the past. In addition, most village fishers and elders believe that numbers of fish and<br />
shellfish have declined (Tuilagi and Green, 1995). During an extensive survey in February 2004 of coral reefs<br />
in American Samoa, divers from the National Oceanic and Atmospheric Administration (NOAA) noted an<br />
unusually low abundance of large fishes and sharks around the main islands in the Territory (R. Brainard, pers.<br />
comm.). In response to this decline, a ban on scuba-assisted fishing was implemented in 2001.<br />
Trade in Coral and Live Reef Species<br />
Attempts to get coral reef products to off-island markets occur periodically, but there has been little development<br />
in these efforts, primarily due to the high cost of getting fresh or live shipments to markets in Hawaii and<br />
beyond, as well as the limited and frequently delayed flight schedule from the Territory to Hawaii (generally<br />
two or three flights per week).<br />
Ships, Boats, and Groundings<br />
In the past decade, 10 groundings of fishing vessels, all large (>30 m) foreign-flagged longliners, occurred in<br />
the Territory. Nine occurred in Pago Pago Harbor during Hurricane Val in 1991 and their rusting hulls remained<br />
on the reefs for nine years. They were finally removed in 2000, due to actions taken by the U.S. Coral Reef<br />
Task Force. The tenth longliner ran aground in 1993 at Rose Atoll, a NWR, spilling a full fuel load, fishing<br />
lines and other metal debris onto the atoll. Follow-up studies indicate that significant damage occurred to the<br />
atoll, with the loss of about 30% of the atoll’s foundation of crustose coralline algae and a community shift<br />
from a coralline algae substrate to one of fleshy blue-green algae, most likely due to iron enrichment (Green<br />
et al., 1998). USFWS personnel removed most of the debris during several cleanup trips to the atoll, but the<br />
community shift is still visible 11 years later, as evidenced by a recent NOAA site visit (R. Brainard, pers.<br />
comm.).<br />
<strong>Marine</strong> Debris<br />
<strong>Marine</strong> debris is not presently a major problem except in the industrialized Pago Pago Harbor. In addition to<br />
a 57-year old sunken ship (U.S.S. Chehalis) in the harbor that may still contain a fuel load, the shallow and<br />
deep harbor bottom is littered with fuel barrels, car batteries, and other debris. Outside of the harbor, most<br />
debris sighted in coastal waters derives from household garbage (aluminum cans, plastic bags, disposable<br />
diapers) that is thrown into the island’s creeks, though some larger items, such as refrigerators and fuel tanks,<br />
are occasionally seen drifting or beached.<br />
Aquatic Invasive Species<br />
Although Pago Pago Harbor has been a major shipping port for over 50 years, a recent survey of introduced<br />
marine species found that relatively few alien species have propagated in the Territory, with most being<br />
restricted to the inner portions of the harbor (Coles et al., 2003). Altogether, 28 non-indigenous or cryptogenic<br />
species were detected during this survey: bryozoans (6), hydroids (6), amphipods (4), tunicates (2), barnacles<br />
(2), algae (2), bivalves (2), sponge (1), polychaete (1), isopod (1), ophiuroid (1). However, none appeared to<br />
be invasive or is known to be invasive at sites outside of American Samoa. Most of these alien species occur<br />
in Hawaiian harbors and many are widely distributed around the world.<br />
American Samoa<br />
Sidebar<br />
page<br />
317
American Samoa<br />
page<br />
318<br />
The State of Coral Reef Ecosystems of American Samoa<br />
Security Training Activities<br />
No security training activities occur in<br />
the Territory.<br />
Offshore Oil and Gas Exploration<br />
No oil and gas exploration activities<br />
occur in the Territory.<br />
Other<br />
Population growth has been identified<br />
as a major threat to coral reefs in the<br />
Territory (Figure 11.7). The current<br />
population of 63,000 is increasing at<br />
a rapid rate of 2.1% per year. Most<br />
people in the Territory (96%) live<br />
on the south side of Tutuila Island, Figure 11.7. Population growth in American Samoa. Source: U.S. Census.<br />
where growth continues to strain<br />
the environment, causing chronic<br />
problems such as extensive coastal alterations, fishing pressure, loss of wetlands, soil erosion and coastal<br />
sedimentation, solid and hazardous waste disposal, and pollution.<br />
<strong>CORAL</strong> <strong>REEF</strong> ECOSYSTEMS-DATA GATHERING ACTIVITIES AND RESOURCE CONDITION<br />
American Samoa has a long history of coral research and monitoring activities. For example, the Aua Transect<br />
is the oldest known coral reef transect still being surveyed, and the second oldest monitoring program in the<br />
world (Green et al., 1997; Green, 2002); Fagatele Bay has been monitored for over 20 years (Green et al.,<br />
1999). However, there has not been an integrated monitoring program established in the Territory to determine<br />
overall coral reef ecosystem status and trends. Thus, a working group was created in 2003 to establish such<br />
a program, with the American Samoa Coastal Management Program (ASCMP) supporting the initial funding<br />
of a Territorial coral reef monitoring<br />
coordinator to lead this effort. In<br />
addition, the Department of <strong>Marine</strong><br />
and Wildlife Resources (DMWR) has<br />
begun to develop an agency-oriented<br />
program of long-term coral reef<br />
monitoring, and has hired a coral reef<br />
monitoring ecologist. The first year of<br />
monitoring is set to begin in January<br />
<strong>2005</strong> (Table 11.1, Figure 11.8).<br />
Table 11.1. Parameters to be included in the Territorial Coral Reef Monitoring Program.<br />
1. Coral Condition Disease, bleaching, % cover<br />
2. Algal Condition % cover, type<br />
3. Fish Species abundance (grouper, snapper, parrotfish)<br />
4. Macro-invertebrates Abundance (giant clam, lobsters, crown-of-thorns)<br />
5. Water Quality Temperature, nutrients (N, P), light transmission<br />
6. Anthropogenic Debris, damage<br />
7. Weather Air temperature, sun/cloud, wind
Figure 11.8. Monitoring program sites on Tutuila and Aunu’u Islands. Map:<br />
A. Shapiro; Sources: T. Curry, ASCMP; Birkeland et al., 2004; PIFSC-<br />
CRED.<br />
The State of Coral Reef Ecosystems of American Samoa<br />
In addition to those activities listed in Table 11.2, funding from the U.S. Coral Reef Task Force and other<br />
sources has made various studies possible, and data from these studies may provide the baseline for repetitive<br />
analyses.<br />
Bishop Museum Introduced <strong>Marine</strong> Species Survey<br />
A survey of marine organisms (macroinvertebrates, benthic macroalgae, fish) was conducted in Pago Pago<br />
Harbor, Fagatele Bay National <strong>Marine</strong> Sanctuary, the National Park on Tutuila Island, and other core sites to<br />
detect introduced marine species (Coles et al., 2003).<br />
American Samoa<br />
Sidebar<br />
page<br />
319
American Samoa<br />
page<br />
320<br />
The State of Coral Reef Ecosystems of American Samoa<br />
Table 11.2. Agency/organization-specific activities that provide information about coral reef health. Note: not all listed activities can<br />
be considered monitoring.<br />
PROJECT AFFILIATION LOCATION YEAR BEGUN FREQUENCY STATUS<br />
Aua Transect Territorial Aua Village 1917 Completed twice Ongoing<br />
Fagatele Bay Monitoring Fagatele Bay National<br />
<strong>Marine</strong> Sanctuary<br />
Fagatele Bay 1985 Approx. every 5<br />
years<br />
Ongoing<br />
Market Survey DMWR Tutuila 1994 Intermittent Ongoing<br />
Inshore Creel Survey DMWR South shore of Tutuila 1978 Daily Ongoing<br />
Vital Signs National Park of American<br />
Samoa<br />
U.S. EPA Environmental<br />
Monitoring and<br />
Assessment Program<br />
American Samoa Research<br />
and Monitoring Program<br />
National Park of American<br />
Samoa<br />
National Park waters 2004 Annual<br />
Territorial waters 2004 To be decided<br />
PIFSC-CRED Territory-wide 2002 Every 2 years Ongoing<br />
Stream/beach Monitoring American Samoa<br />
Environmental Protection<br />
Agency (ASEPA)<br />
Tutuila-wide 2002 Weekly Ongoing<br />
Soft Coral Survey National Park of American<br />
Samoa<br />
Utulei Village 1917 Completed twice Ongoing<br />
ASEPA ASEPA Tutuila-wide 2003 Bi-annual<br />
NPSP Program ASEPA Selected watershed<br />
sites on Tutuila<br />
2003 Annual<br />
Monitoring of Biological Populations and Oceanographic Processes<br />
In February-March 2002 and February 2004, the NOAA’s Pacific Island Fisheries Science Center, Coral Reef<br />
Ecosystem Division (PIFSC-CRED) conducted comprehensive, multidisciplinary assessments of the coral<br />
reef ecosystems around Rose Atoll and Tutuila, Aunuu, Tau, Ofu, Olosega, and Swains Islands. Spatial and<br />
temporal monitoring of biological populations (fish, coral, algae, macro-invertebrates) and oceanographic<br />
processes (current, temperature/salinity profiles, bio-acoustic surveys) were conducted to document natural<br />
conditions and to detect possible human impacts to these ecosystems. Detailed bathymetric maps were<br />
completed for Tutuila and the Manua Islands. Results of these studies will be included in the next reporting<br />
effort.<br />
Coral Disease Surveys<br />
Two disease studies were completed in American Samoa between 2002 and 2004. The first was a broad<br />
disease survey around Tutuila and the Manu’a Islands (Work and Rameyer, 2002). The second survey was<br />
recently led by Dr. Greta Aeby (Aeby and Work, in prep.) with the intent of linking coral disease to water quality<br />
there as well as to wider-Pacific coral disease distributions.<br />
Lobster Survey<br />
In 2003, a survey of the artisanal lobster fishery in American Samoa was conducted (Coutures, 2003). Results<br />
indicate that landings are small but overfishing does not seem to be occurring. Additionally, the report outlines<br />
several management recommendations.<br />
Algae Survey<br />
A study was conducted in 2003 to inventory the algae of American Samoa (Skelton, 2003). The study surveyed<br />
26 sites on Tutuila, Anuu, Ofu, and Olesega and documented the presence of 237 species of algae and<br />
two species of seagrass in the Territory.<br />
Economic Valuation Study<br />
A comprehensive economic valuation study of American Samoa’s coral reefs was completed by Spurgeon et<br />
al. in 2004. Salient results of this study will be included in the next reporting effort.
WATER QUALITY<br />
The State of Coral Reef Ecosystems of American Samoa<br />
Pago Pago Harbor Water Quality Monitoring<br />
Water quality in inner Pago Pago Harbor was determined from samples collected at several stations. Samples<br />
collected at multiple depths at each station were averaged, and the annual estimates of water quality parameters<br />
(e.g., total nitrogen, or TN, total phosphorus, or TP, chlorophyll a, or chl a) were calculated from station means.<br />
Field sampling is now performed only twice annually, once in the tradewinds season (June-October) and once<br />
in the non-tradewinds season (November-May).<br />
Coastal Water Quality Sampling<br />
The recent coastal sampling conducted in collaboration with the American Samoa Environmental Protection<br />
Agency (ASEPA) and the National Park of American Samoa followed the methods and approach of the U.S.<br />
Environmental Protection Agency’s (EPA) Environmental Monitoring and Assessment Program. Within the<br />
Territory’s coastal region (up to one-quarter mile out from the coast), 50 randomly selected sites were sampled<br />
for a standard suite of parameters. In addition to a standard hydrographic profile, grab samples of water at the<br />
surface, middle, and bottom of the water column were processed and analyzed for standard nutrients (TN, TP,<br />
ammonium, nitrate/nitrite, phosphate), chl a, and suspended solids. Where possible, sediments were collected<br />
with a modified Van Veen grab and analyzed for grain size, total organic carbon, organics, and metals. Fish<br />
were also collected at those stations and analyzed for tissue contaminants. Field methods are detailed in a<br />
U.S. EPA publication (2001).<br />
Stream Monitoring<br />
There are approximately 140 perennial streams on Tutuila, comprising nearly 420 stream km. The large<br />
number of streams precludes a census approach to monitoring, so ASEPA instead relies on random stream<br />
selection to quantify the range of stream ecological conditions. Streams are initially classified into four groups<br />
according to local population density as an indicator of the potential human impact on local streams. Streams<br />
from each class are pooled and then several are selected randomly for intensive monitoring.<br />
In the first year, eight streams were selected, two from each of four watershed classes. Each stream was visually<br />
assessed using methods based on the U.S. EPA’s Rapid Bioassessment Protocols (Barbour et al., 1999).<br />
The following variables were evaluated for each stream: epifaunal substrate/available cover, embeddedness,<br />
sediment deposition, channel flow status, channel alteration, and riparian vegetative zone width. After the<br />
initial habitat assessment, streams were then monitored at a monthly or near-monthly frequency for water<br />
hydrography (temperature, pH, dissolved oxygen, turbidity), water chemistry (TN, TP, nitrate, ammonium),<br />
and bacterial contamination (Enterococcus).<br />
After the first year, a new pool of streams was selected from the four classes. These streams were visited and<br />
monitored monthly, and their habitats were assessed visually.<br />
Beach Monitoring<br />
In 2003, ASEPA monitored 16 beaches in Pago Pago Harbor, the center of industry and commerce on Tutuila<br />
Island. At weekly intervals, water samples (0.5 L) were collected in sterile bottles at water depths no less than<br />
knee level of the technician, independent of tidal height. Samples were stored in coolers for transport and<br />
returned to the laboratory within two hours of collection. Enterococci were enumerated using Enterolert ® and<br />
most probable number methods. Enterolert ® utilizes chromogenic substrate technology to enumerate indicator<br />
bacteria. Enterococci numbers were then compared to the American Samoa’s legal Water Quality Standards<br />
(WQS) to determine compliance.<br />
Results and Discussion<br />
Craig et al. (2000) suggested that American Samoa’s oceanic waters demonstrate excellent quality, and there<br />
are no indications that oceanic water quality has since changed. Furthermore, the water quality problems that<br />
emerged in Pago Pago Harbor during the 1970-80s have greatly improved, based on chl a, TN, and TP levels<br />
(Figure 11.9).<br />
American Samoa<br />
Sidebar<br />
page<br />
321
American Samoa<br />
page<br />
322<br />
The State of Coral Reef Ecosystems of American Samoa<br />
However, the picture is less clear in<br />
other coastal areas of the Territory, as<br />
there are very few data from the near<br />
coastal regions of American Samoa.<br />
This will soon be remedied, as the<br />
National Park of American Samoa<br />
and ASEPA recently finished a<br />
collaborative, comprehensive coastal<br />
water quality survey around Tutuila<br />
and the Manu’a Islands. This survey<br />
used a probabilistic design to sample<br />
the waters from the coastline to onequarter<br />
mile offshore. This study will<br />
provide the first Territory-wide data<br />
on water quality in the near coastal<br />
areas.<br />
The data currently available indicate<br />
that streams in densely populated<br />
areas of Tutuila exhibit higher nutrient<br />
levels (e.g., TN, TP) than streams in<br />
less-populated areas. These streams<br />
transport nutrients to the near shore<br />
and reef flat areas. The effects<br />
of these nutrients on coral reef<br />
ecosystems in American Samoa are<br />
unknown. Weekly beach monitoring<br />
at 16 recreational beaches in 2003<br />
demonstrated that the Territory’s<br />
beaches often exceed the WQS for<br />
Enterococcus (Figure 11.10). Likely<br />
sources of this contamination include<br />
improper treatment and disposal of<br />
both human and animal waste.<br />
Figure 11.9. Water quality in inner Pago Pago Harbor greatly improved after tuna<br />
canneries were required to modify their waste disposal processes in 1991. Source:<br />
ASEPA.<br />
Figure 11.10. Number of local recreational beaches exceeding the American Samoa<br />
WQS as detected by the ASEPA weekly beach monitoring program conducted<br />
throughout 2003. Source: ASEPA.
BENTHIC HABITATS<br />
The State of Coral Reef Ecosystems of American Samoa<br />
Surveys and monitoring have occurred in Tutuila, including Pago Pago Harbor and Fagatele Bay, and in the<br />
smaller Manu’a Islands. Most studies have concentrated on hard corals, but soft corals have been surveyed<br />
as well. Monitoring of coral bleaching events has recently begun. The many disparate studies are brought<br />
together here for the first time to discern trends in coral populations in American Samoa.<br />
HARD <strong>CORAL</strong>S<br />
Very Long-Term Monitoring of Pago Pago Harbor, The Aua Transect<br />
Methods<br />
Transects in Pago Pago Harbor, started in 1917 by Mayor (1924) and Cary (1931) and resurveyed by Cornish<br />
and DiDonato (2004), involved counting colonies of hard and soft corals within large (25 x 25 ft) plots along a<br />
transect line. Most of the sites have been destroyed by dredging and filling, but a few have survived and been<br />
re-surveyed several times. Re-surveys used the same methods with 1 m 2 plots. Green (2002) and Birkeland<br />
et al. (2004) used a point-intercept method along 50 m transects and recorded substrate categories (Green,<br />
2002). Transects were at 10 m depth, except in Fagatele Bay where transects were laid at 3 m, 6 m, and 9<br />
m depths and on the reef flat. At each transect meter mark, substrate was recorded in four categories and<br />
24 subcategories under the tape and 1 m to each side. Fenner (2004) estimated the proportion of bleached<br />
staghorn coral colonies at the Airport Lagoon during a one-hour swim following the same approximate route.<br />
Results and Discussion<br />
Extensive studies by the Carnegie Institute of Washington D.C. between 1917 and 1920 (Mayor, 1924) provide<br />
excellent baseline data from which to determine changes over time for coral reefs in Pago Pago Harbor.<br />
Re-surveys of the 1917 transect have provided quantitative information on trends at the reef at Aua over 83<br />
years, the longest quantitative reef monitoring anywhere (Mayor, 1924; Dahl and Lamberts, 1977; Dahl, 1981;<br />
Birkeland and Green, 1999; Birkeland and Belliveau, 2000). A 28% decline in average number of colonies per<br />
square meter was noted in 1973, with a substantial decline (30%) between 1973 and 1980 (Figure 11.11). A total<br />
decline of 78% in average number of corals per square meter between 1917 and 2001 indicates that natural<br />
and anthropogenic disturbances in Pago Pago Harbor have contributed to degradation in reef conditions.<br />
Eutrophication from tuna cannery discharges between 1954 and 1991 may have been a major factor, as well<br />
as nearby road and other infrastructure construction. The 1978 crown-of-thorns starfish (Acanthaster planci)<br />
outbreak may also have contributed to the sharp decline between 1973 and 1980. The mass coral bleaching<br />
in 1994 might have contributed to<br />
further decline. Cyclones are unlikely<br />
to have caused much damage to<br />
these corals due to their protected<br />
location within the harbor.<br />
Long-Term Monitoring in Tutuila<br />
Long-term monitoring of corals at<br />
selected sites around Tutuila Island<br />
has been ongoing since 1982. While<br />
this is not a holistic, multi-agency driven<br />
effort, the purpose of this survey is to<br />
determine any substantial changes<br />
over the last several decades. Reefs<br />
within the Territory have been heavily<br />
impacted by a series of natural and<br />
anthropogenic events (crown-ofthorns<br />
starfish outbreaks, tropical<br />
cyclones, water quality degradation,<br />
etc.). Recent studies have shown<br />
Figure 11.11. The number of hard coral colonies on the Aua Transect, in Pago Pago<br />
Harbor, American Samoa from 1917 to 2000. Sources: Mayor, 1924; Dahl and Lamberts,<br />
1977; Dahl, 1981; Birkeland and Green, 1999; Birkeland and Belliveau, 2000.<br />
American Samoa<br />
Sidebar<br />
page<br />
323
American Samoa<br />
page<br />
324<br />
The State of Coral Reef Ecosystems of American Samoa<br />
that corals are slowly recovering after massive disturbances in the late 1980s and early 1990s (Birkeland et<br />
al., 2004; Green, 2002).<br />
A series of reef surveys starting in the early 1980s by Fisk and Birkeland (Fisk and Birkeland, 2002) and then<br />
Green (1996, 2002) provides data on the trends in hard coral cover around Tutuila during this period. In the<br />
early to mid-1980s, hard coral cover was increasing on Tutuila. A mass crown-of-thorns outbreak in 1978<br />
killed many corals, so the increases in the early to mid-1980s are likely to be recovery from that event (Figure<br />
11.12). A series of three tropical cyclones followed, and the cyclones in 1990 and 1991 were severe. A mass<br />
bleaching event in 1994 also killed corals. When coral cover was measured again in 1995, coral cover had<br />
been reduced to the lowest levels yet seen. When coral cover was measured in 1996, a small improvement<br />
was seen, and when it was measured again in 2001, strong gains and the highest observed coral cover was<br />
recorded. A slight decline was found in 2003 in a separate survey by Houk et al. (in press). According to the<br />
limited data available, coral cover conditions at previously surveyed sites are currently at good levels.<br />
Figure 11.12. Hard coral cover trends for Tutuila from three studies show periods<br />
of recovery interrupted by events causing mortality. Sources: Birkeland et al., 1997;<br />
Green, 2002; Houk et al., in press.<br />
Figure 11.13. Hard coral cover trends for Fagatele Bay, Tutuila. Source: Birkeland et<br />
al., 2004.<br />
Long-Term Monitoring in Fagatele<br />
Bay (Tutuila)<br />
Hard corals have been monitored<br />
in Fagatele Bay for nearly 20 years.<br />
Figure 11.13 shows trends in live hard<br />
coral cover at four different depths<br />
from 1985 through 2001. Coral cover<br />
was low at 3 m, 6 m, and 9 m depths<br />
from 1985 through 1995, then showed<br />
strong increases, particularly at the<br />
end of this period. The increases in<br />
2002 were strongest in deep water<br />
and weakest in shallow water. Live<br />
coral on the reef flat showed a very<br />
different pattern, having the highest<br />
cover from 1985 to 1995, and then<br />
dropping to low levels in 1997 and<br />
2002. Thus, corals on the reef slope<br />
at 3-9 m show one pattern, and<br />
corals on the reef flat show a different<br />
pattern.<br />
The reef flat and reef slope are very<br />
different habitats and may be exposed<br />
to different events. The fact that coral<br />
on the slope stayed low from 1985 to<br />
1995 suggests that a series of events<br />
may have kept coral cover low. There<br />
were three cyclones during this<br />
period and one bleaching event, and<br />
all of these disturbances may have<br />
combined to suppress coral recovery.<br />
After 1995, coral cover on the reef<br />
slope recovered dramatically, similar<br />
to the recovery observed on Tutuila<br />
as a whole (Figure 11.13). The loss<br />
of live hard corals from the reef flat<br />
after 1995 may be attributable to a<br />
low-tide event that caused massmortality<br />
in reef flat corals in 1998.<br />
The Aua Transect is a reef flat within
The State of Coral Reef Ecosystems of American Samoa<br />
the harbor, showing a similar downward trend (Figure 11.11). Unfortunately, while periodic re-surveying can<br />
reveal trends, it is often unable to pinpoint the causes of those trends.<br />
The data for Tutuila as a whole (Figure 11.12) and Fagatele Bay specifically (Figure 11.13) are consistent in<br />
showing an increase in coral cover from 1996 to 2002 and is supported by informal observations suggesting<br />
that the coral populations are recovering from past events. The most recent data available was gathered<br />
during the 2002 and 2004 PIFSC-CRED surveys. Towed diver surveys were conducted around a large part of<br />
Tutuila, and visual estimates of coral cover recorded. The average live coral cover recorded was 31% in 2002<br />
and 19% in 2004. Measurements from video taken by the same towed divers found 29% cover for 2002, which<br />
is close to the 31% found by visual estimate. This is significantly less than seen in Figures 11.12 and 11.13,<br />
but the area covered was quite different (wide ranging tows along reef versus transects at a few selected<br />
sites, and twice as much area covered by tows in 2004 than in 2002). It is likely that the lower percentages<br />
in the towed-diver surveys were due to the inclusion of areas of low coral cover, while the transects were on<br />
reefs within areas of relatively high coral cover. Thus, the data are not comparable (even the two towed-diver<br />
surveys are not comparable), and indeed these percentages from the towed-diver surveys are lower than data<br />
from transects from other studies conducted at about the same time (Green, 2002; Houk et al., in press).<br />
Short-Term Monitoring of Coral Bleaching<br />
Major events such as tropical cyclones, mass coral bleaching, and crown-of-thorns outbreaks have not<br />
been monitored in the past. However, a new program to monitor corals that are particularly susceptible to<br />
bleaching has begun. The DMWR has begun monitoring bleaching in staghorn corals (Acropora spp.) in the<br />
Airport Lagoon on Tutuila. Water temperatures in enclosed lagoons are higher on sunny days during low<br />
tide when circulation is reduced. Approximately 50% of the staghorn corals in the Airport Lagoon have been<br />
killed by bleaching caused by high temperatures in the summers of 2001 and 2002. A bleaching event also<br />
occurred in 2004, following a period of sea surface temperatures (SST) that nearly reached the bleaching<br />
threshold (Figure 11.14). Lagoon water, however, reached higher temperatures than SST in the adjacent<br />
ocean. Bleaching peaked by March 28, and later subsided. Corals were only partially bleached and bleaching<br />
was confined to enclosed lagoons. This monitoring provided an early warning of the bleaching event and<br />
real-time data on the course of bleaching. Such monitoring of major events will allow the identification of the<br />
causes of some major shifts in reef communities. This mild bleaching might now be expected as the normal<br />
summer bleaching. However, temperature records show that Hurricane Heta (early January 2004) caused a<br />
sharp decrease in water temperature that reset the summer warming process that was underway. The result<br />
was lower temperatures than would otherwise have occurred and less bleaching. The previous two summers<br />
resulted in severe bleaching with some coral deaths; this may be more typical in future summers as well.<br />
In summary, hard corals have declined<br />
significantly in Pago Pago harbor,<br />
particularly in recent years. Outside<br />
the harbor, hard corals have been<br />
impacted by a series of major events,<br />
including a crown-of-thorns outbreak,<br />
several cyclones, and several mass<br />
coral bleaching episodes. These<br />
major events have caused declines<br />
in hard corals, although they have<br />
shown significant recovery. Outside<br />
the harbor, hard corals are considered<br />
to be in their best condition since the<br />
crown-of-thorns outbreak in 1978.<br />
Figure 11.14. The course of a mild bleaching event in 2004, as measured in staghorn<br />
corals in a partly enclosed lagoon on Tutuila. Source: Fenner, 2004.<br />
American Samoa<br />
Sidebar<br />
page<br />
325
American Samoa<br />
page<br />
326<br />
The State of Coral Reef Ecosystems of American Samoa<br />
S<strong>OF</strong>T <strong>CORAL</strong>S<br />
Soft corals were first measured during the 1917 studies in Pago Pago Harbor by Mayor and Cary. This is the<br />
world’s oldest quantitative coral reef transect data. Cary’s transect site at Utulei was re-surveyed by Cornish<br />
and DiDonato (2004). The live soft coral cover drastically declined since 1917 (Figure 11.15). Many activities<br />
have occurred in Pago Pago Harbor during this period, including the construction of two large tuna canneries<br />
in 1954 and 1963. The tuna canneries discharged increasing volumes of wastewater into the harbor, causing<br />
eutrophication until discharges were moved outside the harbor and nutrient levels declined. Tuna cannery<br />
discharges occurred for about a decade before the 1973 measurement. Other events impacting the marine<br />
environment of American Samoa during this time were a major crown-of-thorns outbreak in 1978, a series of<br />
cyclones, and a series of mass coral bleaching events. The crown-of-thorns outbreak would not have affected<br />
soft corals directly, as these starfish do not prey on soft corals. However, the death of many hard corals may<br />
have reduced competition for space. Hurricanes damage both hard and soft corals, and mass coral bleaching<br />
can kill both hard and soft corals. The large number of significant events during this 87-year period does not<br />
allow the identification of the cause of<br />
soft coral decline at this location.<br />
A second series of soft coral studies<br />
focused on Mayor’s 1917 Aua<br />
Transect in Pago Pago Harbor, which<br />
was re-surveyed in 1973, 1980, and<br />
1996 (Figure 11.16). This series of<br />
studies also found a drastic decline<br />
in soft corals in the harbor. However,<br />
the addition of the 1973 and 1980<br />
studies in this series showed that<br />
the drastic decline was restricted to<br />
the period between 1973 and 1980,<br />
because soft coral numbers actually<br />
increased from 1917 to 1973.<br />
Although eutrophication is suspected,<br />
the cause of the drastic decline in soft<br />
corals cannot be determined from this<br />
data. Significant variation in soft coral<br />
abundance may have occurred during<br />
the long gaps between surveys.<br />
Preliminary results from the 2004<br />
PIFSC-CRED cruise indicated that<br />
there were several locations on reef<br />
fronts around Tutuila where soft corals<br />
were common. Thus, soft corals are<br />
not extinct around the Island, and the<br />
drastic decline seen in the harbor may<br />
be restricted to that area. If so, that<br />
would support the suggestion that the<br />
decline was caused by local events,<br />
such as eutrophication related to tuna<br />
cannery wastewater discharge.<br />
Figure 11.15. A 2003 re-survey of Mayor’s 1924 soft coral survey in Utulei, Pago<br />
Pago Harbor, shows that almost no colonies remain at the site. Note the occurrence<br />
of bleaching events before and after the re-survey. Source: Cornish and DiDonato,<br />
2004.<br />
Figure 11.16. Soft coral colony monitoring at Aua Transect. Note cyclone and bleaching<br />
events between second and third data points. Sources: Mayor, 1924; Dahl, 1981;<br />
Green et al., 1997.
The State of Coral Reef Ecosystems of American Samoa<br />
Benthic Habitat Mapping<br />
NOAA’s Center for Coastal Monitoring and Assessment, Biogeography Team (CCMA-BT) initiated a nearshore<br />
benthic habitat mapping program in Guam, American Samoa and the Commonwealth of the Northern<br />
Mariana Islands in 2003. IKONOS satellite imagery was purchased from Space Imaging, Inc. for all three jurisdictions<br />
and used to delineate habitat polygons in a geographic information system (GIS). Habitat polygons<br />
were defined and described according to a hierarchical habitat classification system consisting of 18 distinct<br />
biological cover types and 14 distinct geomorphological structure types. The project, which was completed in<br />
2004, mapped 71.5 km 2 of nearshore habitat in the islands and produced a series of 45 maps that are currently<br />
being distributed via a print atlas, CD-ROM, and on-line at http://biogeo.nos.noaa.gov/products/us_pac_terr/.<br />
A summary map (Figure 11.17), where polygons have been aggregated into major habitat categories, depicts<br />
the geographical distribution of reefs and other types of benthic habitats in American Samoa (NOAA, <strong>2005</strong>).<br />
Figure 11.17. Nearshore benthic habitat maps were developed in 2004 by CCMA-BT based on visual interpretation of IKONOS satellite<br />
imagery. For more info, see: http://biogeo.nos.noaa.gov. Map: A. Shapiro.<br />
American Samoa<br />
Sidebar<br />
page<br />
327
American Samoa<br />
page<br />
328<br />
The State of Coral Reef Ecosystems of American Samoa<br />
ASSOCIATED BIOLOGICAL COMMUNITIES<br />
This section focuses primarily on reef-associated fishes because of their importance as food to the islanders<br />
as well as the significant impact that fishing has had on fish populations. Available information about other<br />
reef-associated communities (macro-invertebrates, marine mammals, sea turtles, seabirds) is limited.<br />
FISH<br />
The coral reef fish fauna in American Samoa was diverse (890 species), amounting to approximately twice the<br />
number of fish species on Hawaiian and Caribbean reefs. Few marine endemic species are thought to exist in<br />
American Samoa due to widespread dispersal of their pelagic larvae.<br />
Reef fish are harvested in both subsistence and artisanal fisheries on the five main islands in the Territory.<br />
Artisanal fishing includes both nighttime free-divers who spear reef fish and small boat fishers who target<br />
deepwater bottomfish. There is currently no export of coral reef fish to off-island markets or the aquarium<br />
trade. Some fishing also occurs at the two small and remote atolls in the Territory: Swains Island and Rose<br />
Atoll. Swains Island is inhabited by about 10 residents. Rose Atoll is uninhabited and a NWR, but anecdotal<br />
evidence indicates that poaching has occurred, at least in past years.<br />
As described below, two trends in these fisheries are: 1) subsistence fishing has been declining steadily over<br />
the past two decades (Coutures, 2003) as villagers shift from a subsistence to cash-based economy; and 2)<br />
coral reef fish and invertebrate resources have declined significantly in abundance and size due most likely<br />
to overfishing. Regarding the latter point, it is important to recognize that coral reefs and the fish populations<br />
they support are quite limited in the Territory due to the small size of the islands and their steeply sloping sides<br />
that drop quickly into water depths of 4-5 km, thus providing relatively limited areas of shallow water habitats.<br />
For example, the five main islands in the Territory (where most fishing occurs) have only 125 km 2 of coral reef<br />
eocsystems in the depth zone of 0-50 m. Another way to visualize this size limitation is that a small boat can<br />
circumnavigate the connected islands of Ofu and Olosega in about one hour.<br />
Two types of monitoring programs in American Samoa document different aspects of the fish community.<br />
Underwater visual surveys (fisheries-independent surveys) describe the kinds of fish observed by divers on<br />
the reef. Extensive underwater visual surveys were conducted throughout the Territory in 1996, 2002, and<br />
2004 (Green, 2002; Schroeder, unpublished data).<br />
Annual surveys of fish harvests or creel surveys (fisheries-dependent surveys) document the actual species<br />
and quantities of fish extracted from the reefs. The DMWR has monitored artisanal bottomfish catches since<br />
1982, but annual harvests by artisanal night-divers and subsistence fisheries have been monitored only<br />
intermittently.<br />
Underwater Visual Surveys<br />
Methods<br />
Fish were counted along three to five replicated belt transects (3 x 50 m) set at 10 m depths on reef slopes<br />
(Green, 2002). These transect dimensions were used because they yield the most precise estimate of abundance<br />
for highly mobile, diurnal species such as wrasses. Fish sizes were estimated visually. A restricted family list<br />
excluded species that were very small, nocturnal, or cryptic in behavior (e.g., gobies, blennies, cardinalfish).<br />
Fishes were surveyed by three passes along each transect, counting different species in each pass. The first<br />
count was of large, highly mobile species which are most likely to be disturbed by the passage of a diver (such as<br />
parrotfishes, snappers, and emperors). The second count was of medium-sized mobile families (including most<br />
surgeonfishes, butterflyfishes, and wrasses) which are less disturbed by the presence of a diver. The third count<br />
was of small, site-attached species (mostly damselfishes) which are least disturbed by the presence of a diver.<br />
Since surveys were conducted throughout the year, these comparisons were made based on adult fishes only<br />
to avoid the temporal effects of recruitment on the data. Adults were defined as individuals that were more than<br />
one-third of the maximum total length (TL) of each species. Individuals less than one-third maximum TL were<br />
considered juveniles that had recruited during the previous year.
Results and Discussion<br />
Territory-wide fish surveys document<br />
that there are few large fish left on the<br />
reefs around the five main islands,<br />
a strong indication that populations<br />
have been overfished (Craig and<br />
Green, 2004). Figure 11.18 shows<br />
the pooled lengths of all surgeonfish,<br />
unicornfish, parrotfish, snappers,<br />
emperors, groupers, jacks, and<br />
sharks sighted during extensive<br />
surveys at 10 m depths on the reef<br />
slope. Few fish were 40 cm or larger<br />
in TL. These data were derived from<br />
belt transects measuring 3 x 50 m.<br />
When wider transects (20 x 50 m)<br />
were used to focus on species that are<br />
wary of divers and/or are particularly<br />
vulnerable to exploitation due to<br />
the large sizes they can attain (70-<br />
200 cm), the same pattern emerges<br />
(Figure 11.19). These include sharks,<br />
maori wrasse, and several large<br />
species of parrotfish, but virtually<br />
none was bigger than 50 cm, despite<br />
a considerable sampling effort (27<br />
sites sampled, 99 transects in total).<br />
This does not represent a sudden<br />
change; comparison of surveys from<br />
1996 (Green, 2002) and 2004 (R.<br />
Schroeder, pers. comm.) indicate that<br />
local reefs have had few large fish for<br />
at least eight years. Birkeland et al.<br />
(1997) note the tremendous loss of<br />
spawning potential this can represent<br />
since one large female red snapper<br />
(61 cm) has the spawning potential of<br />
212 smaller females (42 cm).<br />
Additionally, the 2002 PIFSC-CRED<br />
survey shows that densities of large<br />
fish (≥20 cm TL) in the main islands<br />
(Tutuila and Manu’a) were much<br />
lower than in the remote atolls (Rose<br />
and Swains), which in turn were<br />
much lower than in the unfished<br />
Northwestern Hawaiian Islands<br />
(NWHI; Figure 11.20).<br />
The six-fold decrease in fish densities<br />
between the Territory’s main islands<br />
and remote atolls support the case<br />
that reefs on the main islands are<br />
overfished. While comparisons<br />
The State of Coral Reef Ecosystems of American Samoa<br />
Figure 11.18. Lengths of standing stocks of targeted fishes at 17 sites on Tutuila in<br />
2002. Source: Green, 2002.<br />
Figure 11.19. Lengths of large and vulnerable species (sharks, maori wrasse, large<br />
parrotfish spp.) at 27 sites in American Samoa. Source: Green, 2002.<br />
Figure 11.20. Densities of large fish in American Samoa and the NWHI in 2002.<br />
Source: R. Brainard, pers. comm.<br />
American Samoa<br />
Sidebar<br />
page<br />
329
American Samoa<br />
page<br />
330<br />
The State of Coral Reef Ecosystems of American Samoa<br />
with the unfished NWHI are speculative, they do suggest the potential magnitude of the loss of large fish in<br />
American Samoa.<br />
Despite the low numbers and small sizes of fish, American Samoa is fortunate that the reefs still have an<br />
abundance of small herbivorous surgeonfish and parrotfish, which helps prevent a phase shift from reefs<br />
characterized by a high abundance of crustose coralline algae to reefs with abundant large fleshy algae.<br />
Fish Harvest Surveys (Creel Surveys)<br />
Annual catches of coral reef fish have<br />
declined in both the subsistence and<br />
artisanal fisheries, but for somewhat<br />
different reasons. The subsistence<br />
fishery is primarily a shore-based<br />
effort that harvests numerous fish<br />
and invertebrate species such as<br />
surgeonfish, parrotfish, goatfish,<br />
snappers, groupers, jacks, octopus,<br />
polychaetes (Palolo viridis), and spiny<br />
lobsters (Craig et al., 1993).<br />
Subsistence catches in Tutuila have<br />
declined substantially over the past 25<br />
years (Figure 11.21), primarily due to<br />
lifestyle changes in the Territory. The<br />
necessity for subsistence fishing is<br />
giving way to a cash-based economy<br />
with many villagers now employed in<br />
government offices and canneries.<br />
Although the catch per unit of effort<br />
has not changed greatly, the per<br />
capita catch has declined dramatically<br />
(Figure 11.22). This sentiment was<br />
also expressed by local fishers who<br />
felt that fish abundance had declined<br />
around Tutuila Island (Tuilagi and<br />
Green, 1995). However, in the outer<br />
islands of Manu’a, the per capita<br />
catch was much higher at 73 kg/<br />
person (Craig et al., 2004).<br />
Artisanal fisheries include two<br />
different fishing efforts on coral reefs.<br />
The first is nighttime spear fishing<br />
in shallow waters, and the fish are<br />
sold in local stores. Long-term trends<br />
Figure 11.21. Subsistence harvest on Tutuila Island. Years with no catches were not<br />
monitored. Source: DMWR, unpublished data.<br />
Figure 11.22. Per capita consumption of fish in the subsistence fishery of Tutuila<br />
Island. Source: DMWR, unpublished data.<br />
show a period of low activity in the early 1990s due to hurricanes in 1990 and 1991, and then a buildup in<br />
the mid-1990s as the night divers doubled their catch by switching from free-diving to diving with scuba gear,<br />
which greatly improved their catch rates (Figure 11.23).<br />
This fishery began to decline in 2000 which suggests that it had exceeded a sustainable catch. In 2001, the<br />
DMWR banned the use of scuba gear for fishing, which resulted in a drop in harvest levels to pre-scuba catch<br />
levels.
The second artisanal fishery targets<br />
deepwater snappers and groupers<br />
(bottomfish). Bottomfish fishing<br />
flourished briefly in the early 1980s<br />
when the fishery was subsidized,<br />
but it declined thereafter when the<br />
subsidies were discontinued and the<br />
few available fishing grounds were<br />
fished out (Itano, 1991; Figure 11.24).<br />
In 2001, many of the remaining<br />
bottomfish boats converted to longline<br />
fishing for albacore.<br />
MACROINVERTEBRATES<br />
Limited information about macroinvertebrates<br />
exists for the Territory.<br />
The harvested invertebrates (octopus,<br />
lobster, palolo, etc.) are generally<br />
listed in catch reports for subsistence<br />
and artisanal fisheries. Most show<br />
no clear trends, although giant<br />
clams (Tridacna spp.) are in lowest<br />
abundance around the populated<br />
islands (Green and Craig, 1999).<br />
Spiny and slipper lobsters have<br />
been recently described by Coutures<br />
(2003). Crown-of-thorns starfish have<br />
been rare around Tutuila Island since<br />
their massive invasion in 1978; a low<br />
but persistent population inhabits the<br />
Manu’a Islands.<br />
The State of Coral Reef Ecosystems of American Samoa<br />
Figure 11.23. Catch of reef fish (surgeonfish and parrotfish) by night-divers on Tutuila<br />
Island. Source: DMWR, unpublished data.<br />
SEA TURTLES<br />
Sea turtle populations are in serious<br />
decline, both locally and throughout<br />
the South Pacific due to harvest,<br />
habitat loss of nesting beach habitats<br />
Figure 11.24. Annual catch of bottomfish. Source: DMWR, unpublished data.<br />
and incidental catches in fishing gear<br />
(Craig, 2002). Their depletion has been so significant that coral reef biologists often have to be reminded that<br />
turtles had formerly been an important component of the coral reef ecosystem. The hawksbill turtle is listed<br />
as “threatened” and it is rapidly approaching extinction in the South Pacific, according to the USFWS/NOAA<br />
Fisheries Turtle Recovery Plan Team (RPT). The RPT concluded that the status of this species is clearly of<br />
the highest concern for the Pacific and it was recommended that immediate actions be taken to prevent its<br />
extinction. The RPT further found that green sea turtles (outside Hawaii) have seriously declined and should<br />
probably be listed as “endangered” rather than “threatened.” In American Samoa, a few turtles are still killed or<br />
have their eggs collected for food. In 2003, a sanctuary for sea turtles and marine mammals was established<br />
in the territorial waters of American Samoa (0-3 miles offshore) to help publicize this conservation issue.<br />
MARINE MAMMALS<br />
Southern stocks of humpback whales migrate to American Samoa to calve and mate, primarily in September<br />
and October. Their numbers are low but unknown, and they are listed as “endangered.” Other marine mammals,<br />
such as sperm whales and spinner dolphins, occur here but little is known about them. In 2003, a sanctuary for<br />
sea turtles and marine mammals was established in the territorial waters of American Samoa to help protect<br />
species and publicize this conservation issue.<br />
American Samoa<br />
Sidebar<br />
page<br />
331
American Samoa<br />
page<br />
332<br />
The State of Coral Reef Ecosystems of American Samoa<br />
SEABIRDS<br />
Seabirds that feed in the nearshore coastal waters of American Samoa include Brown boobies and noddies,<br />
while other seabirds may contribute nutrients to coastal waters from their cliffside nests. The first Territory-wide<br />
survey of seabirds was conducted in 2000 (O’Connor and Rauzon, 2003).<br />
CURRENT CONSERVATION MANAGEMENT ACTIVITIES<br />
The American Samoa Government coordinates all of its territorial coral reef management activities through the<br />
Coral Reef Advisory Group (CRAG).<br />
This group comprises both territorial<br />
and Federal agencies including<br />
the American Samoa Government<br />
Department of Commerce (which<br />
includes the ASCMP and Fagatele<br />
Bay National <strong>Marine</strong> Sanctuary,<br />
Figure 11.25), DMWR, ASEPA,<br />
the American Samoa Community<br />
College, and the National Park of<br />
American Samoa. These agencies<br />
collaborate to plan and implement<br />
actions related to the management of<br />
the Territory’s coral reefs.<br />
Each agency within the CRAG has<br />
specific projects and programs<br />
that enhance the quality of marine<br />
habitats, regulate activities on<br />
coral reefs, promote awareness, or<br />
Figure 11.25. Fagatele Bay National <strong>Marine</strong> Sanctuary. Source: K. Evans.<br />
facilitate research into various aspects of coral reef science. Recently, CRAG members adopted a threatbased<br />
approach (as outlined in the U.S Coral Reef Task Force’s Puerto Rico Resolution) to identifying key<br />
problems on American Samoa’s reefs. In tandem with this, the CRAG has also created four three-year action<br />
strategies to address the issues of overfishing, global climate change, land-based sources of pollution, and<br />
population pressure.<br />
The U.S. Coral Reef Initiative has been instrumental in supporting the Territory in its coral reef conservation<br />
activities. The annual Coral Conservation Grant Program has provided managers and scientists in American<br />
Samoa with tools, staff, funds, and equipment with which to accomplish key research and management<br />
projects. Three programs have benefited greatly from this support: the <strong>Marine</strong> GIS Program, MPA Program,<br />
and Coral Reef Monitoring Program.<br />
<strong>Marine</strong> GIS Program<br />
GIS activities range from basic map production for DMWR programs (e.g., Fishery Management Program,<br />
MPAs) and other CRAG agencies, to more complex spatial analysis of fisheries data, spatial data production,<br />
conversion and maintenance, and GIS software customization and development for the above purposes. The<br />
use of GIS and mathematical algorithms for the design of the MPAs Network has been investigated locally<br />
and brought to the attention of American Samoa’s MPA Program. New benthic habitat mapping data and<br />
classification schemes were acquired from the CCMA-BT. In addition, multibeam data collected during the<br />
NOAA survey in selected shallow areas (
<strong>Marine</strong> Protected Areas Program<br />
<strong>Marine</strong> Protected Areas (MPAs)<br />
are increasingly being relied on as<br />
a precautionary form of protection.<br />
Community-based MPAs are also<br />
increasing throughout the Pacific.<br />
In response to the need for a<br />
more coordinated approach, the<br />
importance of regional networking,<br />
and most importantly, the realization<br />
that the existing MPAs are doing very<br />
little to enhance ecosystem function<br />
or protect species, American Samoa<br />
is developing an MPA Program within<br />
the DMWR and supported by the<br />
CRAG. The program focuses on<br />
coordinating existing MPAs (Figure<br />
11.26), developing new ones, and<br />
creating a territorial master plan<br />
to guide MPA management and<br />
development, proper management<br />
of community-based and territorial<br />
MPAs, coordination between local<br />
and federal initiatives (i.e. National<br />
Park, National <strong>Marine</strong> Sanctuary),<br />
and regional networking, primarily<br />
between American Samoa, Samoa,<br />
and Fiji.<br />
The State of Coral Reef Ecosystems of American Samoa<br />
Figure 11.26. The Nu’uuli Pala Special Management Area is a resource that will be<br />
incorporated into the American Samoa MPA Program. Photo: T. Curry.<br />
Table 11.3. Coral reef area contained within MPAs in American Samoa. Only Rose<br />
Atoll is a long-term, no-take MPA. Source: P. Craig, pers. obs.<br />
ISLAND MPA MPA SIZE (km 2 ) POTENTIAL <strong>CORAL</strong><br />
<strong>REEF</strong> AREA (km 2 )<br />
0-150’ 0-300’<br />
Tutuila Fagatele Bay NMS 0.7 0.6 0.7<br />
National Park 6.6 6.1 6.6<br />
Community-based 1 1 1<br />
In 2003, NOAA’s Pacific Services Ofu Vaoto <strong>Marine</strong> Park 0.4 0.4 0.4<br />
Center in Hawaii, collected data for<br />
National Park 1.5 1.5 1.5<br />
the Territory’s section of the <strong>Marine</strong><br />
Community-based 0.1 0.1 0.1<br />
Managed Areas National Inventory Ta’u National Park 4.8 1.9 4.8<br />
(Table 11.3). This effort was assisted<br />
by the American Samoa Department<br />
of Commerce, the DMWR, and the<br />
Rose Atoll<br />
Totals<br />
Rose Atoll NWR 158.1<br />
173.2<br />
9.9<br />
21.5<br />
11.6<br />
26.7<br />
Territory’s Coral Reef Initiative. The data are currently being collated and will be available on-line in the near<br />
future at http://www.mpa.gov.<br />
Coral Reef Monitoring Program<br />
With the recent addition of two staff positions to establish and run the Coral Reef Monitoring Program, American<br />
Samoa will implement an integrated coral reef monitoring plan in <strong>2005</strong>. This program will assist individual<br />
agency monitoring efforts, as well as the Community-based Fisheries Management Program at the DMWR.<br />
For the first time, the Territory will have a single point of reference and contact for monitoring activities, as well<br />
as a centralized database.<br />
American Samoa <strong>Marine</strong> <strong>Laboratory</strong><br />
The American Samoa Government has recently completed a facility plan for a marine laboratory. This plan is<br />
comprehensive, and includes detailed cost estimates for construction, operation, and maintenance, as well<br />
as recommendations for site selection. In addition, a conceptual rendition of the lab has been completed by<br />
a Hawaii-based architect and a business/marketing plan has been developed in partnership with the Small<br />
Business Development Center at the American Samoa Community College.<br />
American Samoa has never had a marine laboratory capable of supporting quality research by local agencies<br />
or visiting scientists and professionals. This has made it difficult to conduct the research that the American<br />
American Samoa<br />
Sidebar<br />
page<br />
333
American Samoa<br />
page<br />
334<br />
The State of Coral Reef Ecosystems of American Samoa<br />
Samoa Government would like to pursue. Without a facility with which to attract qualified scientists, timely and<br />
responsive coral reef management has been hindered.<br />
Though American Samoa is fortunate to receive support from the Federal government for marine and coastal<br />
protection efforts, Pacific islands such as Guam, Palau, and Hawaii have been able to attract numerous high<br />
caliber researchers. In turn, their cumulative body of work has contributed greatly to increased knowledge of<br />
coral reef ecosystems, with increased and jurisdictional management effectiveness as a result.<br />
The proposed marine laboratory would serve three main purposes. First, the American Samoa Government<br />
will have a facility that can be utilized by local agencies with an interest in marine conservation efforts (i.e.,<br />
coral reef science, research, and monitoring). The laboratory will provide wet and dry labs, storage and office<br />
space, tanks for holding marine organisms, and facilities for aquaculture research and development. Second,<br />
the laboratory will serve as an educational institution, ‘ao’aoga o le gataifale’ in Samoan, associated with<br />
the <strong>Marine</strong> Science Program at the American Samoa Community College, to provide students with research<br />
experience and lab facilities for their projects. The marine lab may also be involved in networking with other<br />
marine education initiatives for Pacific Island groups. Third, the laboratory will serve as a research base to<br />
attract scientists that are funded both domestically and internationally, who might not otherwise have considered<br />
American Samoa due to the lack of local facilities. Local agencies are increasingly receiving requests for<br />
support from scientists wishing to conduct marine research in the Territory.<br />
OVERALL CONCLUSIONS AND RECOMMENDATIONS<br />
The status of coral reefs in American Samoa is mixed. There are notable improvements, but other serious<br />
problems persist. Generally, corals are in good condition, having recovered from massive cyclone damage<br />
in 1991. More recent but moderate damage occurred during Hurricane Heta in 2004, but given the observed<br />
resilience of corals in the Territory and the generally low level of anthropogenic stressors (e.g., low recreational<br />
use), regrowth is expected over the next several years. Another noteworthy improvement is the removal of<br />
10 shipwrecks off local reefs. There has also been a marked improvement in water quality in Pago Pago<br />
Harbor.<br />
Local reefs, however, have been seriously overfished and few large fish remain. Genuine consideration needs<br />
to be given to reducing overall catches and developing effective MPAs that provide long-term protection to<br />
harvested species. Despite the resiliency of corals mentioned above, scientists are observing increases in<br />
coral bleaching and mortality, as well as areas heavily impacted by coral diseases, which have historically<br />
been rare.<br />
Management Strategies<br />
Progress in coral reef management has been made in several areas. Significant regulatory action has included<br />
a ban on scuba-assisted fishing, as well as the establishment of a sanctuary for sea turtles and marine<br />
mammals in all territorial waters. Interagency management efforts have been focused more clearly through<br />
local action strategies (LAS) that address overfishing, land-based pollution, population growth, and climate<br />
change. Each LAS includes steps to address the problems and a timeline for doing so. Progress is also<br />
being made to develop both a coordinated territorial monitoring program and a territorial network of MPAs.<br />
Coordinators for both of these projects are now on staff.<br />
Gaps<br />
Funding. A common management problem on small Pacific Islands is how to best balance the limited funding<br />
opportunities. Because a department’s professional staffing may be small, it is often necessary to hire personnel<br />
through coral reef grant programs. The difficulty is twofold. First, the remaining funding may not be adequate<br />
to conduct projects, and more importantly, it is difficult to eventually transfer these positions to local funding,<br />
thus their long-term continuation is not assured.
The State of Coral Reef Ecosystems of American Samoa<br />
Enforcement. Enforcement of regulations that protect coral reefs and associated habitats and fisheries has<br />
not been adequate for several reasons. First, political and judicial support has not been forthcoming. Violators<br />
have historically not been pursued, or if caught, received a ‘slap on the wrist.’ Second, management has<br />
not prioritized this issue until recently, and none of the Territory’s MPAs, from Federal to village level, have<br />
an effective enforcement presence. Third, the lack of a coherent and long-term funding source to create an<br />
adequately sized enforcement staff has yet to be identified. In addition, funding must also be found to ensure<br />
that enforcement operations conducted on boats are safe. While American Samoa does have a U.S. Coast<br />
Guard presence, the USCG station does not possess the capabilities for water-based rescue or assistance,<br />
and there is no radio system in place in the Territory to support patrol activities. Finally the conservation<br />
enforcement officers that American Samoa does have are generally in need of more comprehensive training.<br />
For example, the DMWR Conservation Enforcement Division lacks a formal training program for entry level<br />
conservation enforcement officers.<br />
Training. Coral program staff in American Samoa have improved greatly over the past several years, thanks<br />
largely to the U.S. Coral Reef Task Force. However, as the Territory is an isolated island group, few opportunities<br />
are available for in-service training for these staff. Ensuring that everyone can attend at least one appropriate<br />
conference or training per year is an expensive proposition, given the airfare and per diem costs.<br />
However, its value is manifest.<br />
American Samoa<br />
Sidebar<br />
page<br />
335
American Samoa<br />
page<br />
336<br />
The State of Coral Reef Ecosystems of American Samoa<br />
REFERENCES<br />
Aeby, G. and T. Work. In preparation. A survey of coral disease prevalence in American Samoa. Report to the Coral Reef<br />
Advisory Group.<br />
Barbour, M.T., J. Gerritsen, B.D. Snyder and J.B. Stribling. 1999. Rapid Bioassessment Protocols for Use in Streams and<br />
Wadeable Rivers: Periphyton, Benthic Macroinvertebrates and Fish, Second Edition. EPA 841-B-99-002. U.S. Environmental<br />
Protection Agency, Office of Water, Washington, DC.<br />
Birkeland, C. and S.A. Belliveau. 2000. Resurvey of the Aua transect after the ship removal. Report to NOAA. 4 pp.<br />
Birkeland, C. and A. Green. 1999. Resurvey of the Aua Transect prior to the ship removal. Report to the National Oceanic<br />
and Atmospheric Administration. 10 pp.<br />
Birkeland, C., A. Green, C. Mundy, and K. Miller. 2004. Long term monitoring of Fagatele Bay National <strong>Marine</strong> Sanctuary<br />
and Tutuila Island (American Samoa) 1985 to 2001: summary of surveys conducted in 1998 and 2001. Report to US DOC<br />
and American Samoa Government.<br />
Birkeland, C., R. Randall, A. Green, B. Smith, and S. Wilkins. 1997. Changes in the Coral Reef Communities of Fagatele<br />
Bay National <strong>Marine</strong> Sanctuary and Tutuila Island (American Samoa) Over the Last Two Decades. National Oceanic and<br />
Atmospheric Administration. Silver Spring, MD. 225 pp<br />
Brainard, R. 2004. Pacific Islands Fisheries Science Center, Coral Reef Ecosystem Division, Honolulu. Personal communication.<br />
Cary, L. R. 1931. Studies of the coral reefs of Tutuila, American Samoa with special reference to the Alcyonaria. Papers<br />
from the Tortugas <strong>Laboratory</strong> of Carnegie Institution of Washington, DC. 27: 53-98.<br />
Coles, S., L. Basch, P. Skelton, and P. Reath. 2003. A survey of introduced marine species in Pago Pago Harbor, Fagatele<br />
Bay, and the National Park of American Samoa. Report to the Territory. Bishop Museum, Honolulu. 89 pp.<br />
Cornish, A. and E. DiDonato. 2004. Resurvey of a reef flat in American Samoa after 85 years reveals devastation to a soft<br />
coral (Alcyonacea) community. <strong>Marine</strong> Pollution Bulletin 48: 768 – 777.<br />
Coutures, E. 2003. The shoreline fishery of American Samoa, analysis of 1-yr data and implementation of a new sampling<br />
protocol. Department of <strong>Marine</strong> and Wildlife Biology Report Series 102. 22 pp.<br />
Craig, P. 2002. Rapidly approaching extinction: sea turtles in the central South Pacific. Western Pacific sea turtle cooperative<br />
research and management workshop. Western Pacific Regional Fisheries Management Council.<br />
Craig, P., J. Choat, L. Axe, and S. Saucerman. 1997. Population biology and harvest of the coral reef surgeonfish Acanthurus<br />
lineatus in American Samoa. Fisheries Bulletin 95: 680-693.<br />
Craig, P. and A. Green. 2004. Overfished coral reefs in American Samoa: no quick fix. Rept. to Coral Reef Advisory<br />
Group, American Samoa. 2 pp.<br />
Craig, P., A. Green, and F. Tuilagi. 2004. Subsistence harvest and standing stocks in the outer islands of American Samoa.<br />
Craig, P., B. Ponwith, F. Aitaoto, and D. Hamm. 1993. The commercial, subsistence and recreational fisheries of American<br />
Samoa. <strong>Marine</strong> Fisheries Review 55: 109-116.<br />
Craig, P., S. Saucerman, and S. Wiegman. 2000. Central South Pacific Ocean (American Samoa): an environmental<br />
evaluation. Chapter 103. In: Sheppard (ed.) Seas at the Millennium: an environmental evaluation, Pergamon Press, New<br />
York.<br />
Dahl, A.L. 1981. Monitoring coral reefs for urban impact. Bulletin of <strong>Marine</strong> Science 31: 544-551.<br />
Dahl, A.L. and A.E. Lamberts. 1977. Environmental impact on a Samoan coral reef resurvey of Mayor’s 1917 transect.<br />
Pacific Science 31: 309-319.<br />
Fenner, D. 2004. Summer coral bleaching event, 2004, on Tutuila, American Samoa. Report to Department of <strong>Marine</strong> and<br />
Wildlife Resources, American Samoa. 4 pp.
The State of Coral Reef Ecosystems of American Samoa<br />
Fisk, D. and C. Birkeland. 2002. Status of coral communities on the volcanic islands of American Samoa, a re-survey of<br />
long-term monitoring sites. Report to Department of <strong>Marine</strong> and Wildlife Resources, American Samoa. 135 pp.<br />
Green, A. 1996. Status of the coral reefs of the Samoan Archipelago. Department of <strong>Marine</strong> and Wildlife Resources<br />
(American Samoa). Biological Report Series. 125 pp.<br />
Green, A. 2002. Status of coral reefs on the main volcanic islands of American Samoa: a resurvey of long-term monitoring<br />
sites. No. 96799. Report to Department of <strong>Marine</strong> and Wildlife Resources, Pago Pago, American Samoa. 135 pp.<br />
Green, A., C. Birkeland, R Randall, B. Smith, and S. Wilkins. 1997. 78 years of coral reef degradation in Pago Pago Harbor:<br />
a quantitative record. pp. (2) 1883-1888. In: Proceedings for the 8th Coral Reef Symposium.<br />
Green, A., C. Birkeland, and R. Randall. 1999. Twenty years of disturbance and change in Fagatele Bay National <strong>Marine</strong><br />
Sanctuary, American Samoa. Pacific Science 53: 376-400.<br />
Green, A., J. Burgett, M. Molina, and D. Palawski. 1998. The impact of a ship grounding and associated fuel spill on Rose<br />
Atoll National Wildlife Refuge, American Samoa. US Fish and Wildlife Service, Honolulu. 64 pp.<br />
Green, A. and P. Craig. 1999. Population size and structure of giant clams at Rose Atoll, an important refuge in the Samoan<br />
Archipelago. Coral Reefs 18: 205-211.<br />
Houk, P., G. DiDonato, and J. Iguel. In press. Assessing the effects of non-point source pollution on American Samoa’s<br />
coral reef communities. Environmental Monitoring and Assessment.<br />
Itano, D. 1991. A review of the development of bottomfish fisheries in American Samoa. South Pacific Commission, New<br />
Caledonia, Vol. 1. Inshore Fisheries Research Technical Paper. 22 pp.<br />
Mayor, A., 1924. Structure and ecology of Samoan reefs. Papers from the Department of <strong>Marine</strong> Biology, Carnegie Institution<br />
of Washington 19: 1-25, plates 1-8.<br />
NOAA (National Oceanic and Atmospheric Administration). <strong>2005</strong>. Atlas of the Shallow-water Benthic Habitats of American<br />
Samoa, Guam, and the Commonwealth of the Northern Mariana Islands. NOAA Technical Memorandum NOS NC-<br />
COS 8, Biogeography Team. Silver Spring, MD. 126 pp.<br />
O’Connor, P. and M. Rauzon. 2003. Seabird survey in American Samoa. Report for National Park of American Samoa,<br />
Pago Pago by Hawaii University, Pacific Cooperative Study Unit. 85 pp.<br />
Page, M. 1998. The biology, community structure, growth and artisanal catch of parrotfishes of American Samoa. 1998.<br />
American Samoa Department of <strong>Marine</strong> and Wildlife Resources, Biological Report Series. 87 pp.<br />
Schroeder, R. 2004. Pacific Islands Fisheries Science Center, Coral Reef Ecosystem Division, Honolulu. Personal communication.<br />
Skelton, Posa. 2003. Seaweeds of American Samoa. Report for the Department of <strong>Marine</strong> and Wildlife Resources by<br />
International Ocean Institute and Oceania Research and Development Association, Australia. 103 pp.<br />
Spurgeon, J.P.G., T. Roxburgh, S. O’ Gorman, R. Lindley, D. Ramsey, N. Polunin, and S. Clamp. 2004. Economic Valuation<br />
of Coral Reefs and Adjacent Habitats in American Samoa. A report to the American Samoa Department of Commerce.<br />
109 pp.<br />
Tuilagi, F. and A. Green. 1995. Community perception of changes in coral reef fisheries in American Samoa. Biological<br />
Paper 22. In: Proceedings of the South Pacific Commission - Forum Fisheries Agency Regional Inshore Management<br />
Workshop (New Caledonia), June 1995. Also: Department of <strong>Marine</strong> and Wildlife Resources (American Samoa), Biological<br />
Report Series No. 72. 16 pp.<br />
US EPA (Environmental Protection Agency). 2001. National Coastal Assessment: Field Operations Manual. U.S. EPA,<br />
Office of Research and Development, National Health and Environmental Effects Research <strong>Laboratory</strong>, Gulf Ecology<br />
Division, Gulf Breeze, FL. EPA 620/R-01/003. 72 pp.<br />
Work, T. and R. Raymeyer. 2002. American Samoa reef health survey. Report to US Fish and Wildlife Service by the US<br />
Geological Survey, Hawaii. 41 pp.<br />
American Samoa<br />
Sidebar<br />
page<br />
337
Pacific Remote Island Areas<br />
page<br />
338<br />
The State of Coral Reef Ecosystems of the<br />
U.S. Pacific Remote Island Areas<br />
Rusty Brainard 1 , Jim Maragos 2 , Robert Schroeder 1,3 , Jean Kenyon 1,3 , Peter Vroom 1,3 , Scott Godwin 4 , Ronald Hoeke 1,3 ,<br />
Greta Aeby 5 , Russell Moffitt 1,3 , Marc Lammers 1,6 , Jamison Gove 1,3 , Molly Timmers 1,3 , Stephani Holzwarth 1,3 , Steve<br />
Kolinski 7<br />
INTRODUCTION AND SETTING<br />
The U.S. Pacific Remote Island Areas (PRIAs) are nine sovereign Federal territories that straddle the equator<br />
in the central Pacific. All are single reef ecosystems that are a part of a large central Pacific biogeographic<br />
and geological province consisting mostly of ancient low reef islands and atolls (Figure 12.1; Stoddart, 1992).<br />
Six of the PRIAs are atolls or atoll reefs: Johnston Atoll (16˚N, 169˚W), Palmyra Atoll (5˚53΄N, 162˚05΄W),<br />
Kingman Reef (6˚25΄N, 162˚23΄W), which constitute the three northernmost of the U.S. Line Islands; Rose<br />
Atoll (14˚S, 168˚W), the easternmost of the Samoan Islands; Wake Atoll (20˚N, 155˚W), the northernmost of<br />
the Marshall Islands; and Midway Atoll (28˚N, 177˚W), near the northwestern end of the Hawaiian Archipelago.<br />
The remaining three PRIAs are low reef islands within one degree latitude of the equator: Jarvis Island (00˚S,<br />
160˚W), in the central U.S. Line Islands, Howland Island (00˚18΄S, 160˚01’W); and Baker Island (00˚13΄N,<br />
176˚38΄W), the two northernmost of the U.S. Phoenix Islands. All except Wake and Johnston are National<br />
Wildlife Refuges (NWRs) administered by the U.S. Fish and Wildlife Service (USFWS) and all fall under cojurisdiction<br />
of the U.S. Department of Interior (DOI) and the U.S. Department of Commerce (DOC), except<br />
Johnston, which is managed by the U.S. Department of Defense, and Palmyra, which is under the joint<br />
jurisdiction of DOI, DOC, and The Nature Conservancy.<br />
Although all nine are outside the political jurisdiction of other U.S. Pacific States and Territories (Hawaii,<br />
American Samoa, Guam, and the Commonwealth of the Northern Mariana Islands [CNMI]), Rose and Midway<br />
Atolls are geographically a part of American Samoa and Hawaii, respectively. For organizational purposes,<br />
Midway Atoll is mostly treated in the chapter on the Northwestern Hawaiian Islands (NWHI), and Rose Atoll is<br />
partially covered in the chapter on American Samoa. Swains Island (14˚S, 168˚W), the northernmost island<br />
in American Samoa, is also a remote reef island but it is not technically a PRIA because it falls under the<br />
jurisdiction of the Territory of American Samoa.<br />
All of the PRIAs were uninhabited at the time of their discovery by Americans and Europeans over the past<br />
two centuries, although Polynesians (and Micronesians, in the case of Wake) probably visited all of the islands<br />
periodically over many centuries to harvest fish and wildlife. The U.S. claimed most of the islands via the<br />
Guano Act of 1856. Except for Palmyra, Kingman and Rose, the PRIAs lie within arid zones of the tropical<br />
Pacific, with insufficient groundwater and rainfall to support continuous human habitation. Moreover, Kingman,<br />
lacks vegetated islets, and the land area at Rose is too small and vulnerable to storms to allow habitation.<br />
Although Palmyra is certainly capable of supporting human settlements, it is unclear as to why it remained<br />
uninhabited during recent centuries. The lack of human habitation allowed the coral reef ecosystems of the<br />
PRIAs to remain completely pristine until the early 20th century. Even today all lie beyond the influence of<br />
urban centers, associated pollutants, and major shipping lanes.<br />
Most of the PRIAs were materially modified during the World War II (WWII) era: the U.S. constructed and<br />
occupied military bases at Johnston, Palmyra, Wake, Midway, and Baker, while Kingman, Jarvis, and Howland<br />
were also briefly occupied or utilized during the war era. With the closure of the military base at Johnston<br />
in early 2004, only Wake Atoll remains an active U.S. military base. The seven NWRs in the PRIAs were<br />
established between 1924-2001, and all are presently no-take island and marine protected areas (MPAs)<br />
except Palmyra, on which limited catch and release sport fishing for bonefish and offshore pelagic catch for<br />
local consumption are allowed.<br />
1 NOAA Fisheries, Pacific Islands Fisheries Science Center<br />
2 U.S. Fish and Wildlife Service<br />
3 University of Hawaii, Joint Institute for <strong>Marine</strong> and Atmospheric Research<br />
4 Bishop Museum<br />
5 Department of Land and Natural Resources, Division of Aquatic Resources<br />
6 University of Hawaii, Hawaii Institute of <strong>Marine</strong> Biology<br />
7 NOAA Fisheries, Pacific Islands Regional Office
Figure 12.1. Locator map for the Pacific Remote Insular Areas (PRIAs). Map: A. Shapiro.<br />
The State of Coral Reef Ecosystems of the Pacific Remote Island Areas<br />
Pacific Remote Island Areas<br />
Sidebar<br />
page<br />
339
Pacific Remote Island Areas<br />
page<br />
340<br />
The State of Coral Reef Ecosystems of the Pacific Remote Island Areas<br />
Ocean currents transport and distribute larvae among and between different atolls and islands, and particularly<br />
in the Pacific equatorial region, define sea surface temperatures (SSTs) and available nutrient regimes. The<br />
North Equatorial Current (NEC), Equatorial Counter Current (ECC), Equatorial Undercurrent or Cromwell<br />
Current (EUC), and South Equatorial Current (SEC) provide the mechanism by which many species are<br />
distributed among the PRIAs, nearby central Pacific islands, the main Hawaiian Islands (MHI), as well as other<br />
distant regions.<br />
ENVIRONMENTAL AND ANTHROPOGENIC STRESSORS<br />
Climate Change and Coral Bleaching<br />
Federally sponsored coral reef surveys conducted between 1979-2004 reveal that all PRIAs have experienced<br />
coral bleaching during the past 25 years. Pre-2000 observations by Maragos (1979, 1994) include reports and<br />
photographs of localized coral bleaching of the ocean reefs at Wake in mid-1979 and mass coral bleaching in<br />
progress at Rose off all reefs to depths of 25 m in April 1994. NOAA and USFWS scientists who visited Wake<br />
in 1998 did not report any bleaching. Several USFWS visits and surveys of Rose between 1995-1999 and<br />
recent surveys of Rose in 2002 and 2004 sponsored by the National Oceanic and Atmospheric Administration<br />
(NOAA) reveal that corals are still recovering from a mass bleaching event of 1994. Coral bleaching was<br />
also reported at Johnston and Kingman in the 1990s (P. Jokiel, pers. comm.). The four NOAA and USFWSsponsored<br />
expeditions to Baker, Howland, Jarvis, Kingman, and Palmyra between 2000-2004 strongly<br />
suggest that mass bleaching occurred within the few years before 2000, and that corals have remained in<br />
recovery phase since then. Additional evidence on recent bleaching at Palmyra reveal that the reefs off the<br />
broad western reef terrace at Palmyra supported thriving Acropora staghorn coral thickets in 1987 (Maragos,<br />
1988) that died and degenerated to rubble deposits by November 1998 (Molina and Maragos, 1998). The<br />
distribution of large Porites heads and numerous small Pocillopora coral heads present on the terrace in late<br />
1998 suggest mass coral bleaching in the mid-1990s rather than coral mortality caused by storm waves at<br />
Palmyra.<br />
During 12 benthic surveys at Johnston Atoll in January 2004, mild bleaching of relatively few coral colonies<br />
were found at eight of the 12 sites.<br />
Mild bleaching was observed on<br />
Montipora patula, M. capitata, and<br />
Acropora cytherea.<br />
During much of June through<br />
December 2002, both remotely<br />
sensed and in situ measurements<br />
of SST around Jarvis Island, Baker<br />
Island, and Howland Island were<br />
extremely high, at times 2˚C or more<br />
above maximum mean conditions,<br />
for prolonged periods (Figure 12.2).<br />
Prolonged temperature anomalies<br />
such as these have been implicated<br />
in most widespread coral bleaching<br />
events. Due to their remote nature,<br />
these reefs were not surveyed during<br />
or immediately after this period of<br />
SST increase. Biological monitoring<br />
by experienced scientists in early<br />
2004 did not yield visual evidence<br />
that widespread coral mortality had<br />
occurred in the wake of a possible<br />
bleaching event in 2002.<br />
Figure 12.2. Satellite and in situ temperatures at Baker and Jarvis Islands during<br />
2002 and 2003 showing anomalously high SST. Both satellite Pathfinder SST (Baker<br />
– thick blue line, Jarvis – thick green line) and in situ temperatures (z~=-15 m) at<br />
Baker (thin blue line) and Jarvis (thin green line) show values significantly exceeding<br />
long-term mean climatological values (Baker–light gray line, Jarvis–dark gray line).<br />
Coral Reef Watch bleaching threshold of maximum monthly mean SST plus 1°C are<br />
included for reference. Source: Brainard et al., 2004.
The State of Coral Reef Ecosystems of the Pacific Remote Island Areas<br />
Diseases<br />
Johnston Atoll<br />
In January 2004, surveys were conducted at 12 sites at Johnston Atoll to quantify and characterize coral<br />
disease. Surveys were limited to sites within the lagoon due to harsh weather conditions. Signs of coral disease<br />
were evident at 92% of the sites surveyed. The average prevalence of disease (no. of diseased colonies/total<br />
no. of colonies) was estimated at 3.1%, which is higher than what has been reported for the NWHI (average<br />
estimated prevalence=0.5%; Aeby, NWHI chapter). Types of diseases included growth anomalies on Acropora<br />
and Montipora, white syndrome on the table coral, Acropora cytherea, Montipora tissue loss syndrome, and<br />
Montipora patchy tissue loss. These diseases have also been observed in the NWHI. One disease that has not<br />
yet been found in the NWHI was Montipora ring syndrome, where affected corals have abnormal growths with<br />
tissue death in the center producing a<br />
ring-like lesion (Figure 12.3). Work et<br />
al. (2001) found similar disease signs<br />
at Johnston Atoll during a qualitative<br />
assessment of coral disease.<br />
Howland and Baker Islands<br />
A qualitative assessment of coral<br />
disease was conducted at six sites<br />
around Howland Island and six sites<br />
around Baker Island during January<br />
2004. The corals were found to be<br />
in good condition with few colonies<br />
having any signs of disease. Small<br />
patches of denuded skeleton were<br />
frequently observed on acroporids<br />
and seemed to be associated with<br />
damselfish (Plectroglyphididon sp.)<br />
activities.<br />
Figure 12.3. Montipora patula from Johnston Atoll with abnormal growths, January<br />
2004. Photo: G. Aeby.<br />
Tropical Storms<br />
In general, the PRIAs of Johnston, Kingman, Palmyra, Jarvis, Howland, and Baker experience low frequencies<br />
of tropical storm events, although occurrences at Johnston are much more common than the other areas.<br />
These islands and atolls are located in between the major eastern and western Pacific tropical storm centers,<br />
which are most active in late summer and early fall (Figure 12.4). Most storms that develop off the coast of<br />
Mexico and head west undergo cyclolysis (storm death) or spin off northwards before reaching the longitude of<br />
the PRIAs. Cyclogenesis (storm formation) to the west/northwest of the PRIAs produces tropical depressions<br />
and storms that head away from the PRIAs toward the western Pacific. Additionally, due to their proximity to<br />
the equator, the U.S. Line and Phoenix Islands are located out of the path of almost all tropical cyclones of any<br />
intensity. No tropical cyclones of any magnitude have been observed within the Exclusive Economic Zones<br />
(EEZs) of Howland, Baker, or Jarvis Island in the past 60 years. Three cyclones have been observed in the<br />
Kingman/Palmyra EEZ. However, only one of these three, Ekeka in 1992, reached wind speeds in excess of<br />
60 knots (Figure 12.4).<br />
Because Johnston is located at a higher latitude than the other areas, it is subjected to a greater degree of<br />
tropical storm activity, catching storm systems out of the eastern Pacific center that travel between 10 and<br />
20 degrees latitude. As a result, Johnston experiences a higher frequency of tropical storm events than both<br />
the U.S. Line and Phoenix Islands to the south and the NWHI to the north. Significant hurricanes that have<br />
passed near Johnston since 1979 include Hurricane John in 1994, Hurricane Keoni in 1993, and Hurricane<br />
Keli in 1984 (Figure 12.4).<br />
While the impacts of these tropical storm events on coral reef ecosystems in the PRIAs are not documented,<br />
any damage to reef habitats associated with these storms would have been caused primarily by extreme<br />
Pacific Remote Island Areas<br />
Sidebar<br />
page<br />
341
Pacific Remote Island Areas<br />
page<br />
342<br />
The State of Coral Reef Ecosystems of the Pacific Remote Island Areas<br />
wave energy events. In summary,<br />
tropical storms represent a<br />
moderately frequent disturbance<br />
event experienced by coral reefs<br />
at Johnston Island, potentially<br />
influencing physical and biological<br />
reef structure, although certainly not<br />
to the degree experienced by reefs<br />
and terrestrial environments in the<br />
western Pacific. Kingman, Palmyra,<br />
Jarvis, Howland, and Baker, on the<br />
other hand, are rarely, if ever, directly<br />
subjected to significant tropical<br />
storms and hurricanes.<br />
Significant Wave Events<br />
While the direct impacts of tropical<br />
storms on the coral reef ecosystems<br />
of most of the PRIAs islands and<br />
atolls are relatively rare, the impacts<br />
of large wave events resulting from<br />
distant tropical and extratropical<br />
storms may be significant. Episodic<br />
events with wave heights around 2-3<br />
m and periods of 15-20 seconds occur<br />
at frequent intervals throughout the<br />
year in the equatorial PRIAs (Baker,<br />
Howland, Jarvis, Palmyra, and<br />
Kingman). Although this is an order of<br />
magnitude less than NWHI wintertime<br />
wave events, the equatorial PRIAs are<br />
much less seasonal in terms of wave<br />
energy and these relatively more<br />
moderate events occur throughout<br />
the year (Figure 12.5). These events<br />
generally approach this area from<br />
the northeast through the northwest<br />
during the boreal winter, from the<br />
southwest in the boreal summer, and<br />
to a smaller extent, from the west<br />
during the northern hemisphere’s<br />
typhoon season. The wave climate<br />
of Johnston Atoll is likely very similar<br />
to that of the NWHI and MHI, with a<br />
large number of extremely energetic<br />
events in the wintertime and very<br />
consistent, moderate waves in the<br />
summer.<br />
These episodic wave events<br />
subject the shallow-water coral reef<br />
communities to a great deal more<br />
energy than the average energy level.<br />
As such, wave climate likely plays a<br />
Figure 12.4. A map showing the paths and intensities of tropical storms passing<br />
near the PRIAs, 1979-2004. Year of storm, storm name and storm strength on the<br />
Saffir-Simpson scale (H1-5) are indicated for each. Map: A. Shapiro. Source: NOAA<br />
Coastal Services Center.<br />
Wave Power (W/m) x 10 4<br />
Month<br />
Figure 12.5. Climatological values of wave power (W/m) derived from NOAA Buoy<br />
#51028 located along the equator at 154°W near Christmas Island from 1997-2004.<br />
Source: NOAA National Data Buoy Center.
The State of Coral Reef Ecosystems of the Pacific Remote Island Areas<br />
fundamental role in forming and maintaining biogeographic (spatial and vertical) distributions of corals, algae,<br />
fishes, and invertebrates of the coral reef ecosystems of the PRIAs.<br />
Coastal Development and Runoff<br />
There has not been any coastal development in the PRIAs since the W.W.II era. An atoll research station at<br />
Palmyra is being proposed and coordinated by The Nature Conservancy and the USFWS that will be funded<br />
by foundations and several participating research institutions and universities. During the past year, all but a<br />
few of the Johnston Atoll buildings and facilities were demolished by the U.S. Department of Defense (DoD)<br />
prior to the closure of the military base there in early 2004.<br />
Surface runoff is nearly non-existent in the PRIAs. Most of the PRIAs lie within the arid zone of the tropical<br />
central Pacific, one (Kingman Reef) lacks permanent land, and all have porous carbonate soils characteristic<br />
of atolls and low reef islands. The paved runways at Wake, Midway, and Johnston are designed as catchments<br />
for collecting rainfall as a source of freshwater. The PRIA runways at Palmyra, Jarvis, Howland, and Baker<br />
have deteriorated or lie within an arid zone, and all are incapable of collecting rainfall and generating surface<br />
runoff.<br />
Coastal Pollution<br />
The military bases at Palmyra, Midway, and Johnston Atolls housed up to several thousand military personnel<br />
for periods exceeding a decade or more, thus generating sewage pollution and various toxic and hazardous<br />
chemicals, and leaving behind abandoned fuels, solvents, and numerous contaminants. The DoD’s Defense<br />
Environmental Restoration Program funded the draining and demolition of underground fuel storage tanks at<br />
Palmyra and some burning of fuel in drums at Howland and Baker in the late 1980s, but many contaminants<br />
remain, especially at Johnston and Palmyra. Johnston was also the site of post-war high atmospheric nuclear<br />
testing, storage of chemical munitions, and stockpiling of Agent Orange defoliants, all of which released<br />
contaminants to the atoll environment. Although the Johnston Atoll Chemical Agent Disposal System<br />
completed the task of destroying all chemical agents and associated fuels and explosives in 2003, nuclear<br />
waste, dioxins, and other chemical contaminants have not been removed. The USFWS is presently urging the<br />
DoD to conduct additional cleanup of military contaminants and toxics at Johnston as part of an acceptable<br />
transfer of the atoll to USFWS management.<br />
Coral monitoring data collected off the northwest coast of Baker in 2000-2004 showed evidence of impacts from<br />
a nearby W.W.II military debris dump,<br />
including periodic dieback of Acropora<br />
corals (Figure 12.6) and proliferation<br />
of cyanobacteria characteristic of<br />
sites generating dissolved iron from<br />
corroding metallic debris. Additional<br />
eco-toxicological studies at the sites<br />
are now being proposed.<br />
The status of military contamination<br />
and pollution at Wake Atoll could not<br />
be assessed at this time.<br />
Tourism and Recreation<br />
The 2004 termination of military<br />
activities at Johnston Atoll<br />
permanently closed all sport-fishing<br />
activity at the atoll. Presently, The<br />
Nature Conservancy sponsors and<br />
promotes compatible ecotourism<br />
activities at Palmyra Atoll, including<br />
Figure 12.6. Evidence of periodic Acropora dieback at USFWS permanent monitoring<br />
site BAK-5P near the abandoned WWII military ocean dump site off the northwestern<br />
coast of Baker Island. Source: Maragos and Veit, 2004.<br />
Pacific Remote Island Areas<br />
Sidebar<br />
page<br />
343
Pacific Remote Island Areas<br />
page<br />
344<br />
The State of Coral Reef Ecosystems of the Pacific Remote Island Areas<br />
a) catch-and-release sport-fishing for lagoon bonefish, b) blue water sport-fishing of offshore pelagic species,<br />
with catch limited to what can be consumed on the island, c) sport diving, d) snorkeling, e) hiking, f) beachgoing,<br />
g) touring historic sites, and h) birding. Aside from Palmyra, all other central Pacific NWRs are closed to<br />
commercial fishing. Access to any NWR requires a Special Use Permit issued by the NWR manager. Permits<br />
are granted only for actions compatible with the conservation and protection of fish, wildlife, and vegetation<br />
inhabiting the refuges. The military facility at Wake Atoll allows sport diving, beach-going, touring historical<br />
sites, and other recreational activities for resident DoD workers and some visitors, although Wake is not a<br />
tourism destination.<br />
Fishing<br />
The islands and surrounding waters of Howland, Baker, and Jarvis; Kingman Reef; and most of Palmyra Atoll<br />
are currently NWRs under the management of the USFWS. Fishing and unauthorized entry in these waters<br />
are prohibited; however, current levels of poaching are largely unknown. Anecdotal evidence of possible fishing<br />
activity includes the presence of fishing lines entangled on the reef >50 m deep, as seen on NOAA’s Pacific<br />
Island Fisheries Science Center-Coral Reef Ecosystem Division’s (PIFSC-CRED) towed-optical assessment<br />
device video surveys in 2004. The Nature Conservancy owns one-third of Palmyra, primarily for ecotourism<br />
(e.g., catch-and-release fishing for bonefish [Albula spp.] in the lagoon). In recent years, occasional trips<br />
have been made by Hawaii-based fishing vessels to Kingman and Palmyra for coastal sharks (fining) and<br />
bottomfish. There is also recent anecdotal evidence of occasional fishing at Kingman and Palmyra (e.g.,<br />
Fijian fishers on tuna boats based out of San Francisco). However, it is presently not possible to quantify<br />
such effort or catch, nor whether by foreign vessels or passing yachts. Johnston Atoll is under the control of<br />
the U.S. military with overlay status as a NWR. Recreational and subsistence fishing is regularly practiced<br />
by the temporary workers on the island. Based on a survey during the late 1980s, catch was dominated<br />
by soldierfish (Holocentridae). Other fish taken included bigeyes (Priacanthidae), flagtails (Kuliidae), mullet<br />
(Mugilidae), goatfish (Mullidae), jacks (Carangidae), parrotfish (Scaridae), and surgeonfish (Acanthuridae).<br />
It was also common for island residents to regularly ship coolers of fish and corals to Hawaii; however, this<br />
practice has recently been prohibited.<br />
Trade in Coral and Live Reef Species<br />
Trade in live reef organisms in the Pacific is primarily for live food fish and ornamental aquarium species,<br />
including colorful fish, corals, other invertebrates, and “live rock.” Total value of the trade exceeds $1 billion<br />
(USD) per year (Barber and Pratt, 1997; Sadovy and Vincent, 2002). Large species of fish, such as humphead<br />
wrasse (Cheilinus undulatus), large groupers (Serranidae) and emperors (Lethrinidae) are captured and<br />
ordered live in upscale restaurants, primarily in Southeast Asia (e.g., Hong Kong), where prices can exceed<br />
$100 (USD) per kg. The practice can be harmful as sodium cyanide is often used to facilitate capture, resulting<br />
in mass mortality of coral reef communities. Targeted large fish are characteristically long-lived and can be<br />
rapidly depleted locally. This results in collection operations moving eastward from Southeast Asia in search<br />
of more productive reefs (e.g., Micronesia and the Marshall Islands). There is no evidence to date that live reef<br />
fish harvesters have reached the PRIAs. Any such take would be illegal as these areas are no-take NWRs,<br />
with one (Wake) under control of the U.S. military. However, the targeted species/sizes do occur at these<br />
islands, which are remote and largely unprotected due to the lack of enforcement. The long transport distance<br />
of live product to Asian markets may render these U.S. islands economically unfeasible for operations, with the<br />
possible exception of Wake Atoll, an active, occupied military base.<br />
There is currently no known live reef ornamental fishing operating in the PRIAs. However, some export of live<br />
corals was documented in the 1980s from Johnston Atoll to Hawaii, though DoD and USFWS cooperatively<br />
eliminated this activity thereafter. The DoD closed its operations at Johnston in 2004, and the atoll is again<br />
an uninhabited NWR. As such it is now vulnerable to unauthorized collection by fishers from nearby Hawaii<br />
(1,500 km to the northwest) because of the present lack of on-site enforcement and surveillance.
The State of Coral Reef Ecosystems of the Pacific Remote Island Areas<br />
Ships, Boats, and Groundings<br />
All the PRIAs are uninhabited except for several caretakers and students at Palmyra and DoD workers at<br />
Wake. Periodic transports call at Wake to offload supplies, food, and fuel. Otherwise, ship traffic is limited<br />
to: a) NOAA oceanographic research vessels every one to two years to all PRIAs except Wake; b) irregularly<br />
scheduled supply vessels to Palmyra; and c) unauthorized fishing vessels near the uninhabited NWRs. Tour<br />
ships do not call at any of the PRIAs except periodically at Palmyra Atoll.<br />
All PRIAs are vulnerable to ship groundings since most are low lying, poorly chartered, and lack beacons<br />
and aids to navigation. Wake suffered a major tanker grounding and fuel spill in the mid-1970s. All of the<br />
PRIAs except Wake, Johnston, and Palmyra are rodent-free, due to the concerted rodent eradication efforts<br />
of the USFWS and specialists over the past three decades. However, ship groundings always run the risk of<br />
re-introducing rodents and other alien species that can decimate native wildlife and vegetation. Fuel spills<br />
from ruptured vessels run the risk of mass kills of nearshore marine life, migratory shore birds, sea turtles,<br />
and resident seabirds. Dissolved iron from corroding wreckage can also fuel localized outbreaks of invasive<br />
cyanobacteria that can displace native species and smother reef building organisms.<br />
<strong>Marine</strong> Debris<br />
Fishing nets and anthropogenic objects were recorded during towed-diver surveys by the PIFSC-CRED in<br />
2001, 2002, and 2004 in the U.S. Line and Phoenix Islands. During the 2004 season, there was no notable<br />
debris accumulation at Howland, Baker, Jarvis, Palmyra, and Kingman. Several anchors and chains are<br />
present off the northwestern anchorage of Baker, which served as a temporary forward Allied Forces air base<br />
during the W.W.II assault on Tarawa Atoll. After the battle, Baker was abandoned and military debris and<br />
material was dumped off the northwestern anchorage.<br />
Long-line gear was encountered at all sites. The majority of the noted debris from Howland, Baker, and Jarvis<br />
during all three survey years consisted of encrusted anchors and chains, probable remnants from their guano<br />
mining past. In 2004, one large fishing net was found along a previously surveyed 2002 track on the southern<br />
forereef zone of Kingman Reef. This net, with an estimated size of 6 m by 12 m, was not noted during the<br />
2002 season. Although the density of nets encountered during towed-diver surveys is low, nets have been<br />
seen during each survey year.<br />
Having served as a Pacific military base for refueling during WWII, nuclear testing in the 1960s, and chemical<br />
storage and disposal in the 1970s and 1980s, Johnston Atoll contained the majority of marine debris noted<br />
during towed-diver surveys in the U.S. Line and Phoenix Islands. Over 200 anthropogenic objects were<br />
seen and recorded. Documented items include tires, bottles, metal racks, barrels, steel pipes, frames, and<br />
cables.<br />
Aquatic Invasive Species<br />
The efforts by the PIFSC-CRED and the USFWS sponsored Pacific Biological Survey performed by the<br />
Bishop Museum, both based in Hawaii, have provided information concerning marine alien species in the<br />
PRIAs. Documentation of marine alien species occurred through regular survey and monitoring activities by<br />
the PIFSC-CRED in 2002 and 2004. These surveys involved 27 sites at the U.S. Phoenix Islands, 33 sites at<br />
the U.S. Line Islands, and 12 at Johnston Atoll. An intensive inventory focusing on marine alien species was<br />
conducted at 11 sites at Johnston Atoll by the Bishop Museum.<br />
Compiled data from these efforts reveal that marine alien species exist in these remote islands and that 85%<br />
are at either Johnston or Palmyra Atoll. Both of these sites were active military installations with many of the<br />
alien species reaching the atolls via the hulls and ballast waters of arriving vessels. These two remote atolls<br />
have experienced the greatest physical alteration historically and the majority of alien species documented<br />
are associated with these altered habitats. A compiled list from the combined efforts is provided in Table<br />
12.1, including species name, native range (if determined) and a status of either alien or cryptogenic. The<br />
cryptogenic term refers to species of unknown status that are most likely introduced. Comparable data for<br />
Wake Island, an active military base, are not available.<br />
Pacific Remote Island Areas<br />
Sidebar<br />
page<br />
345
Pacific Remote Island Areas<br />
page<br />
346<br />
The State of Coral Reef Ecosystems of the Pacific Remote Island Areas<br />
Table 12.1. List of marine alien species reported from the PRIAs since 2000. Source: Godwin and Vroom, unpublished data.<br />
SPECIES NATIVE RANGE STATUS IN PRIAs<br />
Sponge species 1 (Unidentified) Undetermined Cryptogenic, Palmyra Atoll only<br />
Sponge species 2 (Unidentified) Undetermined Cryptogenic, Palmyra Atoll only<br />
Pennaria disticha (hydroid) W. Atlantic Alien<br />
Branchiomma nigromaculata (polychaete) Undetermined Cryptogenic, Johnston Atoll only<br />
Armandia intermedia (polychaete) Indo-west Pacific, Atlantic Cryptogenic, Johnston Atoll only<br />
Balanus amphitrite amphitrite (barnacle) SW Pacific, Indian Ocean Alien<br />
Bugula vectifera (bryozoan) Undetermined Cryptogenic, Johnston Atoll only<br />
Caulibugula dendrograpta (bryozoan) Undetermined Alien, Johnston Atoll only<br />
Didymozoum triseriale (bryozoan) Indo-Pacific Cryptogenic, Johnston Atoll only<br />
Halysis diaphana (bryozoan) Undetermined Cryptogenic, Johnston Atoll only<br />
Ascidia sydneiensis (tunicate) Undetermined Alien, Johnston Atoll only<br />
Diplosoma listerianum (tunicate) Undetermined Alien, Palmyra and Johnston Atolls<br />
Microcosmus exasperatus (tunicate) Undetermined Alien, Johnston Atoll only<br />
<strong>Marine</strong> alien species in these remote areas have just recently become an issue of interest, due to survey<br />
efforts in other parts of the tropical Pacific. Efforts should be focused on minimizing the likelihood of coral reef<br />
habitats being exposed to marine alien species through the spread of organisms already established in altered<br />
habitats and transport of new species from outside of the PRIAs. This can be achieved by management efforts<br />
directed towards all activities that have the potential for acting as mechanisms of transport, especially visiting<br />
ships and airplanes as well as the shoes and clothing of visitors.<br />
Security Training Activities<br />
Security training activities are not practiced at any of the NWRs in the PRIAs. Data are not available for Wake<br />
Atoll, which is currently an active military installation.<br />
Offshore Oil and Gas Exploration<br />
Offshore oil and gas exploration has never occurred, is not being contemplated, nor would it currently be<br />
feasible in the PRIAs. All are small low-lying atolls and reef islands surrounded by deep oceanic waters. The<br />
possibility of any commercial oil and natural gas formations is highly unlikely.<br />
Other<br />
Crown-of Thorns Starfish<br />
Counts of the crown-of-thorns starfish (COTS), Acanthaster planci, were conducted around the U.S. Line<br />
and Phoenix Islands in 2001, 2002, and 2004 in conjunction with 50-minute towed-diver habitat surveys (see<br />
towed-diver method in the ‘Benthic Habitat’ section).<br />
All 2001 and 2002 tows at Palmyra were resurveyed in 2004, and four new tows were added. Surprisingly,<br />
COTS were not observed at Palmyra in 2004, even though the survey efforts increased and they were<br />
recorded in 2001 and 2002 (Table 12.2). Aggregations of COTS were recorded by the USFWS and The Nature<br />
Conservancy divers in mid-2001 and 2002 off the southwestern terrace, but these apparently disappeared by<br />
2004. COTS have yet to be observed by towed-divers at Baker, Jarvis, and Howland Islands.
The State of Coral Reef Ecosystems of the Pacific Remote Island Areas<br />
Table 12.2. Total number of COTS recorded during towed-diver surveys and the total distance (km) surveyed in 2001, 2002, and<br />
2004. Source: PIFSC-CRED, unpublished data.<br />
LOCATION<br />
2001 2002 2004<br />
TOWED KM COTS TOWED KM COTS TOWED KM COTS<br />
Johnston Atoll N/A N/A N/A N/A 63.2 182<br />
Howland Island 10.1 0 10.8 0 20.8 0<br />
Baker Island 9.9 0 5.4 0 17 0<br />
Jarvis Island 11.3 0 11.1 0 19.9 0<br />
Palmyra Atoll 17.8 4 31 28 41.7 0<br />
Kingman Atoll 26.6 140 27.4 378 37.8 752<br />
In the 2004 survey year, COTS<br />
were recorded at Johnston Atoll and<br />
Kingman Reef (Table 12.2). For<br />
the 63.2 km of surveyed habitat at<br />
Johnston, divers recorded 2.9 COTS/<br />
km. The COTS were most noticeable<br />
at Kingman Reef where recorded<br />
sightings in 2004 increased 44% from<br />
2002 and 160% from 2001. Toweddivers<br />
surveyed 26.6 km of habitat<br />
in 2001 and recorded 5.3 COTS/<br />
km. In 2002, 27.4 km of habitat<br />
was surveyed with 13.8 COTS/km<br />
and in 2004, 37.8 km of habitat was<br />
surveyed with 19.9 COTS/km (Figure<br />
12.7). In addition to resurveying all<br />
2001 and 2002 tows, two additional<br />
towed-diver surveys recorded 162<br />
COTS, 21.5% of all recorded COTS<br />
at Kingman in 2004. The towed-diver<br />
Figure 12.7. Recorded COTS per towed kilometer (km) at Kingman Reef in 2001,<br />
2002, and 2004. Source: PIFSC-CRED, unpublished data.<br />
estimating habitat reported that 13% of the coral habitat along those two tows appeared white due to COTS<br />
predation. Counts of COTS from towed-diver surveys typically underestimate abundance since juvenile and<br />
adult COTS may hide underneath plate corals and other structures.<br />
Pacific Remote Island Areas<br />
Sidebar<br />
page<br />
347
Pacific Remote Island Areas<br />
page<br />
348<br />
The State of Coral Reef Ecosystems of the Pacific Remote Island Areas<br />
<strong>CORAL</strong> <strong>REEF</strong> ECOSYSTEMS—DATA GATHERING ACTIVITIES AND RESOURCE CONDITION<br />
WATER QUALITY AND OCEANOGRAPHIC CONDITIONS<br />
The health, functioning, and biogeography of the coral reef ecosystems of the PRIAs are primarily controlled<br />
by the oceanographic conditions to which fish, algae, corals, and other invertebrates of the ecosystem are<br />
exposed. This broad and diverse biological community is heavily influenced by time-varying ocean currents,<br />
waves, temperature, salinity, turbidity, nutrients, and other measures of water quality and oceanographic<br />
conditions. As these conditions change, so do the health, distribution, and species diversity of each reef<br />
community. Table 12.3 provides a list of long-term oceanographic and water quality monitoring programs in<br />
place in the central equatorial Pacific. Figure 12.8 shows the locations of many of these monitoring sites.<br />
Table 12.3. Oceanographic monitoring systems in the PRIAs.<br />
SYSTEM VARIABLES MONITORED DATES AGENCY<br />
Deepwater CTDs* at select temperature, salinity, dissolved oxygen, Feb. 1999 - present PIFSC-CRED<br />
locations near the islands and chlorophyll versus depth to a depth<br />
of 500 m<br />
Shallow-water CTD* -<br />
multiple sites each island/atoll<br />
Coral Reef Early Warning<br />
System (CREWS) Buoys - 1<br />
Enhanced – (Palmyra)<br />
Sea Surface Temperature<br />
(SST) Buoys – 4 (Johnston,<br />
Howland, Jarvis, Kingman)<br />
Subsurface Temperature<br />
Recorders (STR) – 24<br />
Ocean Data Platforms (ODP)<br />
– 2 (Baker, Jarvis)<br />
Wave and Tide Recorders<br />
(WTR) – 1 (Johnston)<br />
temperature, salinity, turbidity Feb. 2001 - present PIFSC-CRED<br />
Enhanced: temperature (1 m), salinity,<br />
wind, atmospheric pressure, ultraviolet<br />
radiation, photosynthetic active<br />
radiation<br />
Feb. 2002 - present PIFSC-CRED<br />
Temperature at 0.5 m Feb. 2002 - present PIFSC-CRED<br />
Temperature at depths between 0.5 m<br />
and 5 m<br />
temperature, salinity, spectral<br />
directional wave motion, current<br />
profiles<br />
spectral wave motion, tides,<br />
temperature<br />
Feb. 2002 - present PIFSC-CRED<br />
Oct. 2002 - present PIFSC-CRED<br />
July 2003 - present PIFSC-CRED<br />
Tide Gauges tidal fluctuations, sea level ? NOAA Ocean Service, Pacific<br />
Tides Branch<br />
Wave Monitoring Buoys – SE<br />
of Kiritami (Christmas) Island<br />
wave height & period, wind speed<br />
& direction, atmospheric pressure,<br />
temperature<br />
Satellite Remote Sensing sea surface temperature, winds, sea<br />
surface height, ocean color<br />
1997 - present NOAA National Weather<br />
Service, National Data Buoy<br />
Center<br />
SST -1981<br />
SSH – 1992<br />
Wind – 1995<br />
Ocean Color - 1994<br />
NOAA Satellites and<br />
Information, Hawaii Coastwatch<br />
Model Fields waves / surface circulation NOAA National Weather<br />
Service, Wave Watch 3<br />
Naval Research Laborator, Navy<br />
Coastal Ocean Model<br />
* CTD: Conductivity, Temperature, and Depth
Figure 12.8. Monitoring locations in the PRIAs. Map: A. Shapiro. Source: PIFSC-CRED.<br />
The State of Coral Reef Ecosystems of the Pacific Remote Island Areas<br />
Pacific Remote Island Areas<br />
Sidebar<br />
page<br />
349
Pacific Remote Island Areas<br />
page<br />
350<br />
The State of Coral Reef Ecosystems of the Pacific Remote Island Areas<br />
Ocean currents transport and distribute larvae among and between different atolls and islands, as well as<br />
define SSTs and available nutrient regimes. The equatorial region is home to several well-defined, though<br />
variable, currents: the NEC, ECC, EUC, and SEC. These currents are highly influential to the ecosystems of<br />
these islands and atolls: the ECC is the major pathway of larval transport and connectivity to regions of high<br />
biodiversity to the west; the deeper flowing EUC brings colder water and nutrient enrichment to islands nearest<br />
the equator (Figure 12.9); and the NEC and SEC are generally well mixed and nutrient poor. The magnitude<br />
and mean position of these current systems are highly dependent on El Niño/Southern Oscillation (ENSO),<br />
and ENSO-related changes to oceanographic conditions in this region are generally much greater than annual<br />
changes. Figure 12.10 shows this<br />
dependence; SST at all central Pacific<br />
PRIAs exhibit greater interannual<br />
variability and dependence on ENSO<br />
than seasonal changes, with the<br />
exception of Johnston Atoll which<br />
exhibits a more annual cycle similar<br />
to that experienced by the Hawaiian<br />
Archipelago.<br />
Starting in 1999, hydrographic<br />
measurements and oceanographic<br />
parameters near these island and<br />
atoll environments have been<br />
measured using shipboard acoustic<br />
Doppler current profilers (ADCP),<br />
deep and shallow water conductivity,<br />
temperature, and depth device<br />
(CTDs), and an array of instrument<br />
moorings aboard the NOAA ships<br />
Townsend Cromwell (1999, 2000, and<br />
2001) and Oscar Elton Sette (2002<br />
and 2004) during regular scientific<br />
cruises for the PIFSC-CRED. Based<br />
on data from these cruises, as well as<br />
other satellite derived and in situ data<br />
sources listed in Table 12.4, a number<br />
of physical/biological linkages have<br />
been observed:<br />
• A link between areas of upwelling<br />
EUC water with benthic habitat<br />
composition and distribution of reef<br />
fishes, especially planktivores, at<br />
Jarvis and Baker islands;<br />
• Extreme interannual variability of<br />
water temperatures, upwelling, and<br />
other mixing phenomena (connected<br />
with nutrient supply and primary<br />
productivity) at Jarvis and Baker and<br />
the dependence of this variability on<br />
the ENSO cycle;<br />
Figure 12.9. Upwelling of cooler, nutrient rich waters originating from the Equatorial<br />
Undercurrent near Jarvis Island. Upwelled waters influence fish assemblages<br />
and distributions, coral growth rates, and a number of other components of the local<br />
coral reef ecosystem. Source: Gove, <strong>2005</strong>.<br />
Figure 12.10. Relationship of NOAA Pathfinder derived SST with ENSO Multivariate<br />
Index (MEI) at the PRIAs of the central Pacific. Note Jarvis extreme dependence on<br />
ENSO contrasting with Johnston’s annual cycle. Source: PIFSC-CRED, unpublished<br />
data.<br />
• Evidence of weak but consistent upwelling along Palmyra Atoll’s southern side and its connection to high<br />
biomass measured with bioacoustics; and
• Poor water circulation within<br />
Palmyra Lagoon and backreef areas<br />
and associated large diel variations<br />
in water temperature (Figure 12.11).<br />
Continued monitoring and analysis<br />
of oceanographic conditions and<br />
ecological assessments are required<br />
to establish quantitative linkages<br />
between ecosystem health and the<br />
ever-changing physical environment.<br />
BENTHIC HABITATS<br />
Methods<br />
Rapid Ecological Assessments<br />
REAs are concurrently conducted<br />
by algal, coral, other invertebrate,<br />
and fish specialists along three 25 m<br />
transects (Figure 12.12). Between<br />
2000 and 2002, 98 REA surveys at<br />
78 sites were conducted to assess<br />
coral populations in the U.S. Phoenix<br />
and Line Islands. During these years,<br />
REA protocols focused on visually<br />
inventorying species and estimating<br />
their relative abundance in broader<br />
areas surrounding the transect<br />
lines using the DACOR (Dominant,<br />
Abundant, Common, Occasional,<br />
Rare) system. Assessment activities<br />
were initiated at Johnston Atoll in<br />
2004, and 29 sites were resurveyed<br />
in the U.S. Phoenix and Line Islands<br />
(Table 12.4). Sites were selected so<br />
Degrees °C<br />
The State of Coral Reef Ecosystems of the Pacific Remote Island Areas<br />
Figure 12.11. Water temperatures recorded by in situ STR and shallow water CTDs<br />
in a Palmyra backreef (commonly know as the Coral Gardens) as compared to pelagic,<br />
NOAA pathfinder SST. Black arrow on overview of CTD temperature track at<br />
right indicates position of the STR. Highly elevated daytime temperatures and spatial<br />
variation in water temperatures indicate poor circulation and a potentially greater risk<br />
of coral bleaching. Source: PIFSC-CRED, unpublished data.<br />
<strong>CORAL</strong>S<br />
Several techniques have been used since 2000 by PIFSC-CRED and USFWS to assess and monitor coral<br />
biodiversity, distribution, abundance, population structure, and condition in the PRIAs including the U.S.<br />
Phoenix Islands (Howland and Baker); U.S. Line Islands (Jarvis Island, Johnston Atoll, Palmyra Atoll, and<br />
Kingman Reef); and American Samoa (Rose Atoll). These techniques include towed-diver surveys each<br />
averaging about 2 km in length, rapid ecological assessments (REA) each covering between 1,000-5,000 m 2<br />
per site, photo-quadrat/video surveys at permanently marked 50-100 m transects, and recruitment studies at<br />
three of the islands/atolls.<br />
Date<br />
Figure 12.12. A USFWS coral biologist and two NOAA fish biologists survey along<br />
the same transect lines at Kingman Reef. Photo: J. Kenyon.<br />
Pacific Remote Island Areas<br />
Sidebar<br />
page<br />
351
Pacific Remote Island Areas<br />
page<br />
352<br />
The State of Coral Reef Ecosystems of the Pacific Remote Island Areas<br />
as to initiate monitoring in locations<br />
for which previous qualitative and/or<br />
quantitative data were available. In<br />
2004, protocols were revised to shift<br />
towards in situ quantitative coral<br />
population data collection. At each<br />
site, two of the three 25 m transect<br />
lines were videotaped for use in<br />
analyzing percent cover of primary<br />
benthic components and as a record<br />
of condition of the benthos. Each<br />
coral whose center fell within 1 m<br />
of the first two transect lines was<br />
Table 12.4. Summary of coral assessment and monitoring activities conducted by<br />
PIFSC-CRED and USFWS in the PRIAs from 2000-2004. REA = rapid ecological assessment,<br />
TDS = towed-diver survey. Source: PIFSC-CRED, unpublished data.<br />
2000 2001 2002 2004<br />
LOCATION REA TDS REA TDS REA TDS REA TDS<br />
Johnston Atoll NA NA NA NA NA NA 12 27<br />
Howland Island 5 8 7 6 6 4 3 9<br />
Baker Island 6 6 6 6 6 2 3 8<br />
Jarvis Island 6 9 4 4 5 4 5 11<br />
Palmyra Atoll 8 12 5 8 11 13 9 21<br />
Kingman Reef 5 10 9 11 9 11 9 18<br />
identified to genus and assigned to one of seven size classes based on the estimated length (cm) of its<br />
longest diameter: 160 cm. In addition, digital photographs were<br />
taken of coral species, including those within a broader area beyond the transect lines, to provide a more<br />
complete inventory of coral biodiversity at each site. The revised REA protocols are described in Maragos et<br />
al. (2004).<br />
Towed-diver Surveys<br />
Broad-scale assessment of the shallow-water (
a subsurface ocean data platform<br />
at Baker Island to assess larval<br />
recruitment by calcareous organisms.<br />
Their deployment in physical<br />
association with the instrumented<br />
moorings will enable coupling<br />
of biological data with physical<br />
data collected by the instruments.<br />
Biennial collections and deployments<br />
of these plates will address levels of<br />
larval recruitment as well as spatial<br />
and temporal differences among the<br />
sampled areas.<br />
Results and Discussion<br />
Coral community structure from REA<br />
surveys<br />
Following surveys conducted in<br />
2000–2002, the coral fauna tallied<br />
for the U.S. Phoenix and Line<br />
Islands included: Baker (80 species),<br />
Howland (91 species), Jarvis Island<br />
(49 species), Palmyra Atoll (170<br />
species), and Kingman Reef (155<br />
species). Relative abundances of<br />
cnidarians occurring within belttransects<br />
at sites surveyed in the<br />
U.S. Line Islands in 2004 is reflected<br />
in Table 12.5. Genera comprising<br />
more than 10% of colony abundance<br />
in each location are highlighted in<br />
bold type.<br />
The State of Coral Reef Ecosystems of the Pacific Remote Island Areas<br />
Table 12.5. Relative abundance of cnidarian colonies in the U.S. Line Islands, based<br />
on REA surveys at 23 sites conducted by PIFSC-CRED and USFWS in 2004. All<br />
cnidarian genera for which at least one colony was tallied in at least one location are<br />
listed.<br />
PERCENT <strong>OF</strong> CNIDARIAN FAUNA<br />
JARVIS PALMYRA KINGMAN<br />
GENERA<br />
ISLAND ATOLL ATOLL<br />
Acropora 0.10% 3.60% 1.10%<br />
Alveopora 0.00% 0.00% 0.00%<br />
Astreopora 0.00% 0.40% 0.80%<br />
Cladiella 0.00% 0.00% 1.30%<br />
Chryptodendrum 0.00% 0.10% 0.00%<br />
Coscinaraea 0.10% 0.00% 0.00%<br />
Dendronephthya 0.00% 0.40% 0.00%<br />
Echinophyllia 0.00% 0.10% 0.40%<br />
Favia 0.30% 5.60% 6.70%<br />
Favites 0.90% 1.90% 1.60%<br />
Fungia 2.70% 5.10% 41.9%<br />
Gardineroseris 0.00% 0.00% 0.20%<br />
Goniastrea 0.00% 0.20% 0.10%<br />
Halomitra 0.00% 0.10% 0.00%<br />
Herpolitha 0.00% 0.20% 0.40%<br />
Heteractis/Stichodactyla 0.00% 0.10% 0.20%<br />
Hydnophora 0.00% 2.00% 0.40%<br />
Leptastrea 0.00% 0.20% 0.40%<br />
Leptoseris/Pachyseris 0.80% 0.60% 0.10%<br />
Lobophyllia/Symphyllia 0.00% 1.20% 0.10%<br />
Merulina 0.00% 0.00% 0.10%<br />
Millepora 1.50% 0.10% 0.00%<br />
Montastraea 0.00% 1.00% 0.80%<br />
Montipora 20.0% 4.70% 3.70%<br />
Palythoa 0.00% 1.80% 0.10%<br />
Pavona 9.90% 11.0% 1.10%<br />
Platygyra 0.00% 1.40% 0.40%<br />
Pocillopora 50.4% 24.4% 4.40%<br />
Porites 1.00% 16.9% 22.7%<br />
Psammocora 0.80% 0.40% 0.50%<br />
Rhodactis 0.00% 0.00% 0.10%<br />
Sandalolitha 0.00% 0.10% 0.00%<br />
Sarcophyton 0.00% 5.90% 3.20%<br />
Scapophyllia 0.00% 0.00% 0.10%<br />
Sinularia/Lobophytum 9.90% 6.10% 5.80%<br />
Stylaster/Distichopora 0.70% 0.80% 0.00%<br />
Stylocoeniella 0.00% 0.00% 0.00%<br />
Stylophora 0.00% 0.40% 0.10%<br />
Tubastraea 0.80% 0.00% 0.00%<br />
Turbinaria 0.00% 3.30% 1.40%<br />
Total cnidarians<br />
counted<br />
1061 3684 5896<br />
Area surveyed (m2 ) 600 750 725<br />
Pacific Remote Island Areas<br />
Sidebar<br />
page<br />
353
Pacific Remote Island Areas<br />
page<br />
354<br />
The State of Coral Reef Ecosystems of the Pacific Remote Island Areas<br />
Size class distributions of cnidarians<br />
for three of these locations in<br />
American Samoa are shown in Figure<br />
12.14. Analyses of coral colony sizefrequency<br />
distributions can reveal<br />
important characteristics of reef<br />
populations, and can be used as a<br />
tool to estimate the response of coral<br />
populations to the reef environment.<br />
These data will serve as a baseline to<br />
which future size class determinations<br />
at the same sites can be compared.<br />
The total number of cnidarian corals<br />
and anemone species reported<br />
historically at the PRIAs and adjacent<br />
atolls are shown in Figure 12.15. The<br />
pattern clearly shows that coral and<br />
anemone species diversity is higher<br />
at Palmyra and Kingman, both in the<br />
path of the ECC. The ECC travels<br />
through much of the higher marine<br />
biodiversity region of the western<br />
Pacific and may be transporting larvae<br />
of additional species to the two reefs.<br />
The ECC and the two reefs may serve<br />
as important pathways and stepping<br />
stones for species dispersal to the<br />
atolls and reef islands of the central<br />
Pacific. The total number of cnidarian<br />
corals and anemone species reported<br />
at the PRIAs and adjacent atolls are<br />
shown in Figure 12.15.<br />
Figure 12.14. Size class distributions of cnidarians surveyed in REA belt-transects in<br />
the U.S. Line Islands during 2004. Source: PIFSC-CRED, unpublished data.<br />
Figure 12.15. Coral and anemone species totals reported at all surveyed central<br />
Pacific reefs. Blue arrow shows the direction of the equatorial countercurrent (ECC).<br />
Sources: Maragos, 1974, 1995, 1997, 2004; Maragos and Jokiel, 1978, 1986; Maragos<br />
et al., 2003; Coles et al., 2000; J. Kenyon and S. Godwin, pers. comm.
Shift in coral community structure<br />
from 1999 to 2004<br />
Forty permanent 50 m or 100 m<br />
transects were gradually established<br />
in the PRIAs, American Samoa, and<br />
the Marshall Islands between 1999<br />
and 2004. These transects include<br />
nine sites each at Johnston and<br />
Rose; five sites at Palmyra; three<br />
sites each at Baker, Howland, Jarvis,<br />
Kingman, and Swains; and two sites<br />
at Ailinginae Atoll in the Republic of<br />
the Marshall Islands. Many of the<br />
older PRIA sites at Baker, Howland,<br />
Jarvis, Kingman, Johnston, Rose,<br />
and Palmyra have now been<br />
resurveyed up to three times through<br />
early 2004, providing an opportunity<br />
to track changes in coral community<br />
structure over a two to five year<br />
period at specific sites. Figure 12.16<br />
documents the decline of Acropora,<br />
Montipora, and Pocillopora and the<br />
concomitant increase of Porites<br />
between 2000-2004.<br />
The State of Coral Reef Ecosystems of the Pacific Remote Island Areas<br />
Figure 12.16. Coral size and abundance at Kingman Reef site 5P from 2000-2004.<br />
Acropora, Montipora and Pocillopora corals have declined, while Porites coral has<br />
shifted from small and numerous to large colonies. Source: Maragos and Veit,<br />
2004.<br />
Pacific Remote Island Areas<br />
Sidebar<br />
page<br />
355
Pacific Remote Island Areas<br />
page<br />
356<br />
The State of Coral Reef Ecosystems of the Pacific Remote Island Areas<br />
Figure 12.17. Summary of trends in mean coral diameter, mean coral frequency,<br />
generic diversity, coral percent cover, and Tridacna clam frequency at Kingman Reef<br />
site 5P (upper panel) and at Baker site 5P (lower panel) between 2000-2004. Source:<br />
Maragos and Veit, 2004.<br />
Figure 12.17 provides representative<br />
examples of changes at two of the<br />
older monitoring sites, KIN-5P in the<br />
east shallow lagoon of Kingman Reef<br />
and BAK-5P at Baker Island, over the<br />
same time period. At the Kingman<br />
Reef site, the 2002 photoquadrats<br />
along the permanent transect showed<br />
numerous COTS (Acanthaster)<br />
feeding scars and two of the starfish<br />
actively feeding on corals. The photos<br />
and other observations show that<br />
many types of corals are potential prey<br />
for the starfish at Kingman but that<br />
incidence of predation was higher on<br />
Pocillopora, Montipora and Acropora<br />
than on Porites when all four groups<br />
are present (as was the case at site<br />
KIN-5P). The data show a gradual<br />
shift to larger more abundant Porites<br />
over the four years of monitoring,<br />
with COTS predation on the other<br />
coral groups likely contributing to this<br />
trend.<br />
These examples represent the<br />
preliminary findings at just two of 40<br />
permanent monitoring sites in the<br />
PRIAs and neighboring reefs. The<br />
findings are also consistent with those<br />
of Timmers (this report) that document<br />
the movement of COTS towards the<br />
eastern lagoon of Kingman Reef in<br />
2002, based on towed-diver surveys<br />
at Kingman Reef, and illustrate<br />
the value of multiple strategies in<br />
assessing and monitoring coral reef<br />
life at remote sites where dive time<br />
and dive days per locale are extremely limited. Monitoring corals and conspicuous macroinvertebrates at<br />
permanently marked sites has the advantage of isolating temporal trends in a set area. Analyses of all<br />
permanent monitoring data will allow comparison to coral data collected at adjacent REA sites at each of the<br />
PRIAs and help elucidate larger-scale geographic and temporal trends for coral population dynamics in the<br />
PRIAs. The findings should help NWR managers focus on assessing and eliminating anthropogenic stressors<br />
at these vulnerable reefs.
ALGAE<br />
The State of Coral Reef Ecosystems of the Pacific Remote Island Areas<br />
Methods<br />
Quantitative algal sampling performed by the PIFSC-CRED in the Pacific has been limited by four factors: short<br />
visits to each site (40-50 minutes/year), the inability of phycologists to work away from the “fish transects,”<br />
only having one phycologist per benthic team, and the lack of expertise in the field. The techniques presented<br />
here were written by phycologists with first-hand experience from previous research missions, and give divers<br />
the ability to sample on and slightly away from the fish transect line, quickly record percent cover using<br />
photoquadrats, and sample species without the aid of trained phycologists. Advantages to these techniques<br />
include:<br />
• One person analyzes all images for analytical consistency, which minimizes error associated with having<br />
multiple divers with varying levels of expertise subjectively determining percent cover in the field;<br />
• Fish transects are usually laid at a constant depth. Previous phycologists have been frustrated by seeing<br />
large amounts of algae growing in shallower water a short distance away from the fish transect, and being<br />
unable to sample those areas because of sampling constraints placed on the benthic team. This method<br />
allows phycologists to move off the main transect into shallower water; and<br />
• Specimens collected from each photoquadrat will allow for easier species determination, including analysis<br />
of epiphytes.<br />
Because no quantitative algal sampling has ever occurred on the PRIAs before the PIFSC-CRED research<br />
expeditions, it is impossible to tell how the present state of the reefs compares to past conditions. However,<br />
the lack of obvious algal blooms or alien species on the reefs combined with high percent covers of crustose<br />
coralline algae and moderate abundance of macroalgae suggests that these reef systems are very healthy.<br />
Results and Discussion<br />
Historically, algal collections from the U.S. Line and Phoenix Islands were solely qualitative, intermittent, and<br />
often biased towards large, macroscopic species (Dawson et al., 1955; Dawson, 1959; Tsuda and Trono,<br />
1968). South et al. (2001) added considerable detail to our knowledge of microscopic turf and epiphyte<br />
species of islands relatively close to the U.S. Phoenix Islands; however, the paucity of algal collections from<br />
U.S. equatorial islands undoubtedly underrepresents the true algal diversity present in these ecosystems. To<br />
ameliorate this problem, PIFSC-CRED expeditions to American Samoa over the past four years have focused<br />
on in situ sampling of algal diversity. Most data have not been thoroughly analyzed and are stored at the<br />
PIFSC-CRED office in Honolulu.<br />
From an algal perspective, the US equatorial islands contain many unique habitats and are likely to contain<br />
endemic species new to science. Expeditions during 2001-2004 addressed ecologically-based algal questions<br />
for common species in the PRIAs for the first time. Additionally, quantitative baseline assessments of algal<br />
cover using a protocol devised specifically for remote tropical reef ecosystems (Preskitt et al., 2004) were<br />
conducted. Detailed photoquadrat analysis combined with voucher specimens and field notes will allow<br />
for percent cover determination of algae and invertebrates at the species level. Oceanographic monitoring<br />
studies conducted concurrently with algal sampling will aid in defining algal distributional patterns throughout<br />
the US equatorial islands. Baseline assessment data for all of the U.S. Line and Phoenix Islands are in-hand<br />
and available for future analyses.<br />
Algal monitoring in the U.S. equatorial islands is still in its infancy. Biannual visits to established sites throughout<br />
the U.S. Line and Phoenix Islands will enable long-term data sets to be established that may reveal change<br />
over years or decades if environmental or anthropogenic changes occur. Preliminary monitoring results have<br />
helped determine the relative abundance of algal genera (Table 12.6).<br />
Pacific Remote Island Areas<br />
Sidebar<br />
page<br />
357
Pacific Remote Island Areas<br />
page<br />
358<br />
The State of Coral Reef Ecosystems of the Pacific Remote Island Areas<br />
Table 12.6. Algae of Johnston Atoll, Howland Island, Baker Island, Jarvis Island, Palmyra Atoll, and Kingman Atoll. Bold numbers<br />
indicate the number of photo-quadrats in which an alga occurred; italicized numbers indicate the alga’s relative abundance (rank) in<br />
relation to other algae occurring in the same photo-quadrat. Standard deviation of island averages are given in parentheses. Asterisks<br />
indicate algae found during the random swim that did not occur in photo-quadrats sampled. Source: Page and Preskitt, 2004.<br />
JOHNSTON<br />
ATOLL<br />
AVERAGE<br />
HOWLAND<br />
ISLAND<br />
AVERAGE<br />
BAKER<br />
ISLAND<br />
AVERAGE<br />
JARVIS<br />
ISLAND<br />
AVERAGE<br />
GREEN ALGAE<br />
Avrainvillea 8.33 (11.79)<br />
4.17 (0.24)<br />
Bryopsis * 11.11 (16.39)<br />
3.9 (0.36)<br />
Caulerpa 12.50 (19.62) 6.25 (7.98)<br />
3.15 (1.30)<br />
5 (0)<br />
Codium 1.39 (3.4)<br />
5<br />
Dictyosphaeria 2.77 (4.10) 2.08 (4.17) 5.56 (6.8) 5.56 (8.61)<br />
4.75 (1.26)<br />
5<br />
4 (1) 4.75 (0.35)<br />
Halimeda 10.42 (17.81) 33.33 (19.25) 26.39 (38.16) 27.78 (12.55)<br />
3.08 (0.44) 3.21 (0.57) 3.17 (0.58) 3.65 (0.38)<br />
PALMYRA<br />
ATOLL<br />
AVERAGE<br />
11.46 (14.04)<br />
4.68 (0.8)<br />
3.13 (6.20)<br />
5 (1.41)<br />
KINGMAN<br />
<strong>REEF</strong><br />
AVERAGE<br />
9.26 (19.30)<br />
4.88 (0.99)<br />
*<br />
3.70 (4.39)<br />
4.25 (0.96)<br />
26.04 (23.75) 9.26 (12.11)<br />
4.05 (1.03) 5 (0.41)<br />
70.83 (26.35) 71.3 (28.29)<br />
2.82 (0.61) 2.72 (0.47)<br />
Microdictyon 34.26 (28.7)<br />
4.01 (0.68)<br />
Neomeris 1.04 (2.95) 29.63 (22.86)<br />
4 4.38 (0.59)<br />
Valonia 5.56 (13.61) 3.13 (4.31) 5.56 (8.33)<br />
3.5 4.67 (0.58) 4.33 (0.58)<br />
Ventricaria 4.17 (9.73)<br />
0.93 (2.78)<br />
RED ALGAE<br />
Amphiroa<br />
2.67 (1.15)<br />
7<br />
Chrysymenia 0.69 (2.41)<br />
5<br />
Dasya *<br />
Galaxaura 4.17 (10.21)<br />
12.5 (35.36)<br />
4.67<br />
3.58<br />
Haloplegma<br />
Halymenia<br />
Hypnea<br />
*<br />
Jania 1.39 (3.4)<br />
3.7 (8.45)<br />
3<br />
5.83 (0.24)<br />
Laurencia 16. 67 (16.67)<br />
3.63 (1.03)<br />
Peyssonnelia 4.17 (6.97) 2.78 (4.3) 5.21 (6.2) 11.11 (16.67)<br />
3.75 (1.77) 3 (1.41) 3.75 (0.96) 3.83 (0.82)<br />
Wrangelia 37.5 (19.84)<br />
3.73 (0.36)<br />
branched coralline 11.81 (23.42)<br />
5.56 (10.09) 12.5 (23.42) 1.04 (2.95) 16.67 (23.94)<br />
2.17 (0.58)<br />
2.67 (0.94) 3.32 (0.25)<br />
3 3.33 (0.84)<br />
crustose coralline 48.61 (29.69) 97.92 (4.17) 81.94 (20.01) 91.67 (7.45) 93.75 (9.71) 83.33 (20.83)<br />
BROWN ALGAE<br />
2.25 (0.50) 1.54 (0.32) 1.97 (0.79) 1.87 (0.47) 1.7 (0.24) 2.15 (0.35)<br />
Dictyota 2.27 (7.54) * 36.11 (33.61) 5.56 (13.61) *<br />
2.67 (1.89)<br />
3.15 (0.6)<br />
4.25<br />
Lobophora 11.81 (20.56) 64.58 (28.36) 66.67 (39.09) 69.44 (25.09)<br />
3.08 (0.67) 2.62 (0.54) 2.24 (0.99) 2.86 (0.89)<br />
orange crust 65.63 (34.05) 13.89 (18.63)<br />
2.99 (0.63) 4.02 (0.99)<br />
Turbinaria *<br />
CYANOPHYTES 13.19 (18.96) 6.25 (7.98) 23.61 (26.57)<br />
5.21 (8.84) 10.19 (10.02)<br />
2.53 (0.98) 3.25 (0.35) 2.6 (0.25)<br />
4.33 (0.58) 3.94 (0.14)<br />
TURF 92.36 (6.61) 93.75 (4.17) 79.17 (15.59) 94.44 (13.61) 94.79 (4.31) 97.22 (8.33)<br />
1.21 (0.46) 1.87 (0.21) 2.18 (0.45) 1.51 (0.34) 2.31 (0.57) 1.32 (0.43)
ASSOCIATED BIOLOGICAL COMMUNITIES<br />
The State of Coral Reef Ecosystems of the Pacific Remote Island Areas<br />
Virtually all monitoring and assesement activities conducted in the PRIAs are accomplished by scientists from<br />
the USFWS and PIFSC-CRED, working in collaboration with the University of Hawaii’s Joint Institute for <strong>Marine</strong><br />
and Atmospheric Research (JIMAR). Their protocols involve various methods and are similar to methods<br />
used in many other jurisdictions across the Pacific.<br />
FISH<br />
Quantitative assessment and monitoring of shallow reef fish assemblages were conducted around the U.S.<br />
Pacific Islands as an integral part of PIFSC-CRED’s mission to improve the scientific understanding of these<br />
fish resources. Fish are the primary sustainable living resource on Pacific coral reefs, and survey results<br />
contribute to the scientific basis essential for sound management. Related objectives include: creating a<br />
baseline to measure MPA effectiveness; monitoring size-frequency assemblages; assessing the status of<br />
target, indicator or keystone species; assessing fish community response to possible ecosystem impacts<br />
(e.g., overfishing, habitat damage, sedimentation, prey size changes); assessing species composition and<br />
diversity by area; and assessing effectiveness of temporal monitoring of managed areas.<br />
Field surveys were conducted in 2000, 2001, 2002, and 2004 in the U.S. Line (Jarvis, Palmyra Atoll, Kingman<br />
Reef) and Phoenix (Baker, Howland) Islands, and in 2004 at Johnston Atoll (Figure 12.8). Fish data from<br />
2000 were largely qualitative with the primary focus on site selection. An initial species inventory was a<br />
prerequisite for comprehensive assessment of reef fish assemblages in each area. Subsequent biennial<br />
monitoring surveys are planned for each geographic sub-region to document temporal variability in reef fish<br />
assemblages. Habitat types surveyed included mainly outer reef slopes around most islands, but also included<br />
lagoon patch reefs, bays, backreefs, and shallow oceanic banks where present.<br />
Inventories and assessments of shallow reef fishes have now been completed by the PIFSC-CRED at all<br />
U.S. Pacific Islands (except Wake Island and Farallon de Mendinilla [CNMI] which are restricted areas), and<br />
monitoring has begun. Ongoing analysis of this growing database will enable species-specific numerical and<br />
biomass densities to be calculated, fish assemblage structure to be described at various spatial and temporal<br />
scales, and statistical correlations to be determined. Further analysis of PIFSC-CRED’s oceanographic and<br />
biological data will aid in understanding patterns of fish distribution and abundance as well as ecosystem<br />
associations.<br />
Methods<br />
Several complementary, non-invasive underwater surveys were used to enumerate the diverse components<br />
of diurnally active shallow-water reef fish assemblages. Survey types included: 1) REA to document simple<br />
species presence at a station or reef/bank; 2) Belt transects to quantify relatively small-bodied and abundant<br />
fishes; 3) Stationary point counts (SPC) to quantify relatively larger (>25 cm total length [TL]) and more<br />
mobile fish species; 4) Towed-diver/video surveys (TDVS) to quantify relatively large-bodied (>50 cm TL),<br />
wide-ranging fishes over a broad-spatial scale, in conjunction with towed-diver/habitat video; and 5) Sound<br />
scattering layer echo-sounds (SSL) to identify patterns of migration in pelagic communities using sonar. Each<br />
method was replicated at sites within and/or among the various habitat types present around each island,<br />
atoll, or reef. Fish length-class was estimated for all quantified fish to provide an estimate of numerical size<br />
structure and biomass densities by taxa.<br />
REA Protocol<br />
A pair of diver-observers conducted an arbitrary swim at each site, recording fish presence and identifying<br />
them to the lowest recognizable taxon. This method was typically used at deeper, time-limited sites or where<br />
the current was too strong to conduct transects. The REA protocol was also used following completion of a<br />
belt-transect or SPC, dive time permitting. The REA data complement the other visual protocols to assemble<br />
more complete reef-and archipelago-specific fish species inventories at each island, atoll, or reef.<br />
Belt Transect Protocol<br />
A pair of scuba diver-observers conducted parallel swims along three 25 m long transect lines, recording size-<br />
Pacific Remote Island Areas<br />
Sidebar<br />
page<br />
359
Pacific Remote Island Areas<br />
page<br />
360<br />
The State of Coral Reef Ecosystems of the Pacific Remote Island Areas<br />
class specific counts of all fishes encountered (using TL) and identifying them to the lowest possible taxon,<br />
within visually estimated belt-transects: 4 m wide for fishes ≥20 cm TL (100 m 2 area) on the initial swim-out,<br />
and 2 m wide for fishes 20 cm TL, all species pooled) in the U.S. Line<br />
and Phoenix Islands from belt-transects, compared to the NWHI in 2002. Source:<br />
PIFSC-CRED (R. Schroeder), unpublished data.
The State of Coral Reef Ecosystems of the Pacific Remote Island Areas<br />
(241), and Kingman (225). Many new records for species presence at these islands were found: over 96% at<br />
Kingman (where very few previous surveys were conducted), 78% at Baker, 72% at Jarvis, 60% at Howland,<br />
and 35% at Palmyra (where most earlier sampling focused). Inter-island differences in species patterns were<br />
also found. These islands include a significant component of south-central Pacific endemic species not found<br />
at other U.S. reefs. The U.S. Line and Phoenix Islands appear to be at the junction of two biogeographic areas,<br />
one centered in French Polynesia and a larger one centered in Micronesia. This is exemplified by the contribution<br />
of the PIFSC-CRED data to a recent revision of the surgeonfish genus Ctenochaetus, which demonstrated<br />
that the U.S. Phoenix Islands are the only area of co-occurrence for a western-central Pacific species and<br />
an otherwise French Polynesian species. A few fish specimens were collected (by permit) in 2002 and 2004<br />
from each of these islands for genetic study to further clarify taxonomic relationships and to help understand<br />
dispersal patterns. A collaborative study with ecological geneticists at the University of California-Santa Cruz<br />
evaluated species differentiation in<br />
one group of Indo-Pacific fishes (the<br />
three-spot damselfish, Dascyllus<br />
trimaculatus, species complex) that<br />
includes the recently described goldfinned<br />
domino, Dascyllus auripinnis,<br />
found in the U.S. Line and Phoenix<br />
Islands. The distribution of mtDNA<br />
genotypes within the group was<br />
consistent with geographic separation<br />
but incongruent with external<br />
characteristics that define some<br />
of the nominal species, indicating<br />
that more work on the systematics<br />
of this group and likely many other<br />
central Pacific fishes is needed. The<br />
occurrence of south-central Pacific<br />
Ocean species in the U.S. Line and<br />
Phoenix Islands is unique among<br />
U.S. coral reef ecosystems and adds<br />
to the exceptional conservation value<br />
of these five islands.<br />
Preliminary analysis of the toweddiver<br />
fish data for the U.S. Line<br />
and Phoenix Islands focused<br />
on trends within four families of<br />
carnivorous fish. Jacks (Carangidae),<br />
snappers (Lutjanidae), sharks<br />
(Carcharhinidae, Sphyrnidae), and<br />
grouper (Serranidae) were recorded<br />
in substantially higher numerical<br />
densities in the U.S. Line and Phoenix<br />
Islands than in American Samoa or<br />
in most other U.S. Pacific Islands<br />
surveyed by the PIFSC-CRED. This<br />
phenomenon of consistently high<br />
densities of top carnivores may be a<br />
result of the remoteness of the islands<br />
and oceanic conditions conducive to<br />
enhanced productivity. Within the<br />
U.S. Line and Phoenix Islands, jacks<br />
and snappers were recorded in the<br />
Figure 12.19. Density of common large fish (>50 cm TL, all species pooled) by family<br />
from towed-diver surveys conducted in the U.S. Line and Phoenix Islands (2001,<br />
2002, 2004) and Johnston Atoll (2004 only). Source: PIFSC-CRED (S. Holzwarth),<br />
unpublished data.<br />
Pacific Remote Island Areas<br />
Sidebar<br />
page<br />
361
Pacific Remote Island Areas<br />
page<br />
362<br />
The State of Coral Reef Ecosystems of the Pacific Remote Island Areas<br />
greatest densities, followed by sharks and then groupers (Figure 12.19). When the data were grouped by<br />
island, it was evident that the abundance of large predators fluctuated considerably between years and sites<br />
(Figure 12.20). In general, large fish densities appeared to increase at Howland and Baker from 2002 to 2004,<br />
while decreasing at Kingman and, to a lesser degree, Palmyra (for three of the four families).<br />
Howland and Baker Islands (U.S. Phoenix Islands)<br />
Baker Island is characterized by a subsurface eastward flowing EUC that lies beneath the westward surface<br />
flowing SEC. This causes an upwelling of cooler, nutrient- and plankton-rich waters along the west side of the<br />
island, which contributes to enhanced ecosystem productivity. In 2002, the density of planktivorous fishes was<br />
higher along the west side (Figure 12.21).<br />
Fish were resurveyed at Howland and Baker Islands from January 21-24, 2004. Observations from 11 belttransects<br />
and SPCs (five at Howland and six at Baker) yielded the following preliminary results: 164 and 166<br />
fish species were documented at Howland and Baker, respectively, compared to 126 and 127 species seen<br />
in 2002. Species richness averaged 118 and 117 species (median among stations) at the respective islands.<br />
Figure 12.20. Density of common large fish (>50 cm TL, all species pooled) by family<br />
from towed-diver surveys conducted in the U.S. Line and Phoenix Islands (2001,<br />
2002, 2004) and Johnston Atoll (2004 only). Source: PIFSC-CRED (S. Holzwarth),<br />
unpublished data.<br />
Together with observations from<br />
other dive teams (e.g., towboard<br />
fish team), a grand total of about<br />
210 fish species were recorded<br />
at Howland and Baker. Both<br />
numerical and biomass densities of<br />
resident reef fish species remained<br />
high (as observed on the 2001<br />
and 2002 surveys). A trophically<br />
diverse fish fauna, representative<br />
of healthy coral reef ecosystems,<br />
contributed to the high biomass.<br />
The body size distributions of fishes<br />
spanned a broad range of sizes,<br />
further indicative of a healthy fish<br />
assemblage. Three species of smallbodied<br />
(
trevally [C. melampygus]). A half<br />
dozen species of grouper (primarily<br />
the peacock grouper [Cephalopholis<br />
argus], blacktip grouper [Epinephelus<br />
fasciatus], coral hind [C. miniata],<br />
flagtail grouper [C. urodeta], and<br />
slenderspine grouper [Gracilla<br />
albomarginata]), also contributed to<br />
fish biomass near reefs.<br />
The density of groupers at both<br />
Howland and Baker Islands appeared<br />
substantially higher than at sites<br />
in American Samoa and CNMI,<br />
particularly where substantial fishing<br />
occurs (e.g., Tutuila, Guam, Saipan).<br />
In 2002, two- to four-fold differences<br />
were found between Howland and<br />
Baker Islands in terms of mean<br />
densities of epinepheline groupers<br />
and pygmy angelfishes.<br />
The State of Coral Reef Ecosystems of the Pacific Remote Island Areas<br />
Figure 12.21. Relative distribution of planktivorous fishes from belt-transect surveys<br />
around Baker Island (2002), indicating higher densities along the western upwelling<br />
side (size of circle proportional to density of planktivores at that station; mean 8-161<br />
fish/100 m 2 ). Source: PIFSC-CRED (R. Schroeder), unpublished data.<br />
Quantitative surveys of large fish were completed by towed-divers in 2001, 2002, and 2004 at the U.S. Phoenix<br />
Islands. Snapper and shark numerical densities appeared to increase in 2004 at Howland and Baker Islands,<br />
while decreasing at most of the U.S. Line Islands. This could reflect differences in illegal fishing pressure (e.g.,<br />
undocumented shark fining), or simply natural population fluctuations. The majority of sharks observed were<br />
gray reef sharks (Carcharhinus amblyrhynchos), but there were also galapagos sharks (C. galapagensis),<br />
blacktip and whitetip reef sharks (C. melanopterus and Triaenodon obesus), and hammerhead sharks (Family<br />
Sphyrnidae). Twinspot snapper (Lutjanus bohar) were very abundant at both islands. Bigeye jacks (Caranx<br />
sexfasciatus) were found in large schools at Howland, and black jacks (C. lugubris) were very common at both<br />
islands. In 2004, the towed-diver fish team saw one large humphead wrasse (Chelinus undulatus) at Howland<br />
and three in deep water at Baker, while none were encountered by the fish REA team. Overall, large fish<br />
remained abundant at the U.S. Phoenix Islands (Figures 12.19 and 12.20).<br />
Jarvis Island (U.S. Line Islands)<br />
Fish were surveyed at Jarvis Island from March 26-27, 2004. Preliminary observations from six belt-transects<br />
and six SPCs, all re-surveys of sites established by the PIFSC-CRED in February of 2001 or 2002, indicated<br />
that stock abundances appeared relatively unchanged from the high levels recorded in previous years,<br />
including a significant apex predator presence. The total number of coral reef fish species documented at<br />
Jarvis by PIFSC-RED was 148 in 2002 and 171 (from 34 families) in 2004. Planktivores remained abundant,<br />
especially along the west side; in 2004 they were also found to be abundant on the southeast reef terrace in<br />
2004. Jarvis, like Howland and Baker, is in line with the EUC, resulting in enhanced upwelling and productivity<br />
on the west side of the island. The density of large fish remained high at all sites. Sharks, mostly gray reef<br />
(Carcharinus amblyrhynchos) and white tips (Triaenodon obesus), were common (typically >10 individuals<br />
from 130-180 cm TL per site), but seemed to be slightly less common along the west side than in earlier<br />
years. Groupers were very abundant at all sites surveyed in 2004. The most common species were flagtail<br />
grouper (Cephalopholis urodeta), coral hind (C. miniata), and peacock grouper (C. argus). Lyretail grouper<br />
(Variola louti) were also somewhat common and quite large (>50 cm TL). Jacks were common at all sites,<br />
including the black jack (Caranx lugubris) and the bluefin trevally (C. melampygus). Snappers were rare at<br />
Jarvis, except for the twinspot snapper (Lutjanus bohar); some individuals were >70 cm TL. Only six species<br />
of parrotfish were observed; most common were the bridled parrotfish (Scarus frenatus), redlip parrot (S.<br />
rubroviolaceus), and Pacific steephead parrot (Chlororus microrhinos), some of which exceeded 60 cm TL.<br />
Density of surgeonfishes was relatively low and primarily represented by whitecheek surgeonfish (Acanthurus<br />
nigricans) and spotted bristletooth (Ctenochaetus marginatus).<br />
Pacific Remote Island Areas<br />
Sidebar<br />
page<br />
363
Pacific Remote Island Areas<br />
page<br />
364<br />
The State of Coral Reef Ecosystems of the Pacific Remote Island Areas<br />
Towed-diver fish data from Jarvis Island suggest that densities of jacks were lower in 2004 compared to<br />
previous years, groupers and snappers were of similar range, and sharks were higher (Figure 12.19). Sharks<br />
were represented by gray reefs (Carcharhinus amblyrhnchos), blacktips (C. melanopterus), and whitetips<br />
(Triaenodon obesus). In addition, a school of 15 large (400-500 cm TL) great hammerhead sharks (Sphyrna<br />
mokarran) were encountered in deep water on the edge of the southeast terrace. A relatively high number<br />
of manta rays and a single whale shark (Rhincodon typus) were also seen in this area of the reef. Turtles<br />
were also abundant, with over 60 recorded during tow surveys in 2004. With the exception of jacks, large fish<br />
remained abundant at Jarvis in 2004.<br />
Palmyra Atoll (U.S. Line Islands)<br />
Fish were surveyed around Palmyra Atoll from March 29 to April 1, 2004. No surveys were conducted in the<br />
heavily dredged, sediment-laden lagoon. Preliminary observations from 10 belt-transects and 10 SPCs, all<br />
re-surveys of sites established by PIFSC-CRED in February of 2001 or 2002, indicate that stock abundances<br />
appeared relatively unchanged from the high levels recorded in previous years. The total number of coral reef<br />
fish species documented at Palmyra by PIFSC-CRED was 193 in 2002 and 209 (from 34 families) in 2004.<br />
Large fish were common but not as abundant as at Jarvis. Sharks (mostly blacktip, followed by gray reef<br />
and white tip) were small (130-160 cm TL), and occasionally seen, but seemed to be slightly less common<br />
than two years earlier. About 16 species of grouper were seen at Palmyra, with most common being the<br />
peacock grouper (Cephalopholis argus; 15-35 cm TL) which were present at every site. The flagtail grouper<br />
(C. urodeta) and the camouflage grouper (Epinephelus polyphekadion) were somewhat less common. Jacks<br />
were common at all sites, including large giant trevally (Caranx ignobilis; about 100 cm TL), bluefin trevally<br />
(C. melampygus), and black jacks (C. lugubris). Snappers were very common at Palmyra, with the twinspot<br />
snapper (Lutjanus bohar), humpback snapper (L. gibbus), smalltooth jobfish (Aphareus furca), and onespot<br />
snapper (L. monostigma) observed at every survey site. Most twinspot snapper ranged from 30-40 cm TL,<br />
smaller than those seen at Jarvis Island. Humpback snappers were observed in loose aggregations of up to<br />
50 individuals.<br />
Preliminary results from towed-diver fish surveys indicated differences in mean counts (numerical density)<br />
between fish families and years (Figure 12.20). Snappers were most abundant in 2001. Densities of jacks<br />
were least abundant in 2002. Shark abundance was fairly consistent between years, although a predominance<br />
of juvenile gray reef sharks (85% were less than 150 cm TL) may be indicative of fishing pressure. Most reef<br />
whitetip and blacktip sharks appeared to be mature size. Pooled grouper species at Palmyra varied in number<br />
among the three surveyed years. Most of the grouper >50 cm TL recorded were lyretail grouper (Variola louti),<br />
but relatively large individuals of the genera Epinephalus and Cephalopholis were also counted.<br />
Kingman Reef (U.S. Line Islands)<br />
Fish were surveyed at Kingman Reef from April 2-4, 2004. Preliminary observations from nine belt-transects<br />
and nine SPCs, all re-surveys of sites established by PIFSC-CRED in February of 2001 or 2002, indicate<br />
that stock abundances appeared relatively unchanged from the high levels recorded in previous years.<br />
However, overall fish density for both small and large fish appeared to be lower than in previous years, with<br />
the possible exception of fish assemblages along the outer reef slopes. The total number of coral reef fish<br />
species documented at Kingman was 165 in 2002 and 187 (from 35 families) in 2004. Sharks were less<br />
abundant and smaller at Kingman than at either Jarvis or Palmyra. An average of only one or two sharks<br />
was seen at most sites (none at some sites), compared to approximately 12 sharks observed on a typical<br />
dive in 2002. The same three shark species–reef whitetip (most common), blacktip, and grey reef–were most<br />
abundant. Groupers were not as abundant at Kingman compared to Palmyra or Jarvis. The peacock grouper<br />
(C. argus) was most common, observed at every survey site. Also relatively common were the flagtail grouper<br />
(Cephalopholis urodeta) and the camouflage grouper (Epinephelus polyphekadion). Six species of jacks were<br />
observed at Kingman but were generally less abundant than at Palmyra or Jarvis. Most common were bluefin<br />
trevally (Caranx melampygus) and black jacks (C. lugubris). The twinspot snapper (Lutjanus bohar), observed<br />
at every survey site, was the only common large snapper at Kingman, although most were smaller than those<br />
observed at Palmyra or Jarvis. Humpback snapper (L. gibbus) and smalltooth jobfish (Aphareus furca) were<br />
present in lesser numbers. No maori wrasse (Cheilinus undulatus) or bumphead parrotfish (Bolbometopon<br />
muricatum) were observed by any dive team, consistent with previous years. Like Palmyra and Jarvis, Kingman<br />
is a NWR and levels of historical or recent fishing are unknown. There are, however, occasional unconfirmed
The State of Coral Reef Ecosystems of the Pacific Remote Island Areas<br />
reports of fishing, especially at Kingman and Palmyra. The lower densities of sharks and large fish found in<br />
2004, compared to earlier survey years, may suggest possible recent poaching activity. The USFWS may<br />
need to increase its enforcement presence at Kingman.<br />
Preliminary results of the 2004 towed-diver fish surveys suggest that snapper, shark, jack and grouper densities<br />
all declined at Kingman, compared to previous years (Figure 12.20). No large schools of bigeye jacks (Caranx<br />
sexfasciatus) were seen, as in previous years, and black jacks (Caranx lugubris) were mostly smaller than 50<br />
cm TL. Gray reef sharks were rare in 2004, however reef whitetip density increased. Parrotfish, especially<br />
steephead parrots (Chlorurus microrhinos), were more abundant in 2004 than in past years. Milkfish (Chanos<br />
chanos) were also more common in 2004. The large fish data from towed-diver surveys suggest a shift or<br />
disturbance may have taken place at Kingman Reef between 2002 and 2004. The PIFSC-CRED biennial<br />
monitoring surveys planned for the U.S. Line Islands will document long-term (e.g., annual to decadal) trends<br />
in large fish densities and, together with comprehensive PIFSC-CRED data on the coral reef ecosystem,<br />
should help reveal causative factors.<br />
Johnston Atoll (U.S. Line Islands)<br />
Fish were surveyed at Johnston Atoll for the first time by the PIFSC-CRED from January 12-16, 2004.<br />
Preliminary observations from belt-transects and SPCs at each of 12 stations indicate that reef fish diversity<br />
was low; many abundant Hawaiian species, including endemics, were either absent or rare, and several widely<br />
distributed Indo-Pacific species (abundant in Hawaii, the closest neighbor islands) were conspicuously absent<br />
(e.g., bigeye emperor, Monotaxis grandoculis; bluespine unicornfish, Naso unicornis). Overall, numerical<br />
densities of reef resident species appeared low, possibly due to the general scarcity of juvenile fishes.<br />
Standing biomass also appeared relatively low, mostly due to few large-bodied species. Carangids like the<br />
bluefin trevally (Caranx melampygus) were infrequently observed and often small in size; no giant trevally<br />
(C. ignobilis) were encountered. Grey reef sharks (Carcharhinus amblyrhynchos) appeared to be in robust<br />
body condition but uncommonly observed. The observed scarcity of both jacks and reef sharks likely reflects<br />
the location of survey sites within lagoons. Due to a large northwest storm swell, surveys were restricted to<br />
within the atoll (11 were conducted in the lagoon and one on the backreef). Conclusions are therefore limited<br />
because of the near or total lack of data for backreef and forereef habitats, respectively. It is very possible<br />
that the dearth of juvenile life-stages, including older young-of-year-sized fish, is a reflection of the infrequent,<br />
low-intensity recruitments that occur at a very isolated atoll inhabited by substantively self-seeding reef fish<br />
populations.<br />
At Johnston Atoll, towed-divers completed 26 surveys during the initial baseline assessment in 2004. During<br />
the survey period there was a large northwest swell that complicated the surveying the exposed fore-reef and<br />
generated sub-optimal survey conditions with decreased visibility. Although the large swell hampered diving<br />
operations in general, the tow team was able to tow over a variety of habitats throughout the atoll, covering<br />
areas that were inaccessible to the other dive teams. Fish assemblages at Johnston are more similar to<br />
Hawaii than to the U.S. Line and Phoenix Islands. Johnston had almost no shallow-water large groupers or<br />
large snappers (Figure 12.20). Jack and shark densities appeared low at Johnston compared to other islands,<br />
due in part to the difficult survey conditions encountered there in 2004. The shallow backreef and submerged<br />
terrace, areas with fewer large fish, received comparatively more of the survey time than the forereef, because<br />
of safety considerations. The tow team was able to dive on the forereef, but not extensively, and this is where<br />
most jacks and sharks were seen. Solitary large jacks were mostly bluefin trevally (Caranx melampygus)<br />
and a school of about 200 bigeye jacks (C. sexfasciatus) were recorded. In addition to a number of small to<br />
medium-sized sharks, several very large Galapagos sharks (Carcharhinus galapagensis) and gray reefs (C.<br />
amblyrhychos) were seen, as well as a 2.5 m tiger shark (Galeocerdo cuvier).<br />
SSL Protocol<br />
Methods<br />
SSLs are comprised of pelagic communities of small fish, shrimp, and squid that occur in waters deeper than<br />
300 m during the day and rise into the photic zone at night. SSLs are common in pelagic waters and along<br />
coastlines, where they form the mesopelagic boundary community. In Hawaii, boundary community SSLs are<br />
thought to play an important role in the coastal ecosystem as a major link between zooplankton and higher<br />
Pacific Remote Island Areas<br />
Sidebar<br />
page<br />
365
Pacific Remote Island Areas<br />
page<br />
366<br />
The State of Coral Reef Ecosystems of the Pacific Remote Island Areas<br />
trophic levels. The observed horizontal migration towards shore at night of the Hawaiian community also<br />
suggests SSLs may play a significant role in the coral reef ecosystem through input of biomass and nutrient<br />
cycling. Little is known about the character of boundary community SSLs associated with islands outside of<br />
the main Hawaiian Archipelago. To improve our understanding of these communities, island-associated SSLs<br />
were investigated using ship-based echo-sounders during a PIFSC-CRED cruise to Jarvis Island, Palmyra<br />
Atoll, and Kingman Reef in 2004.<br />
Results and Discussion<br />
Jarvis Island<br />
Echo-sounder surveys were conducted along the southern and western shores of Jarvis Island during afternoon<br />
and night/morning hours on March 26 and 27, 2004. Survey lines were run approximately 400-600 m from<br />
shore in waters 300-600 m deep. Each line was conducted at approximately 00:00, 02:30, 05:00, and 14:00<br />
hours.<br />
The surveys revealed a clear diurnal trend in the occurrence of a layer of surface-associated biomass. At<br />
night, the layer is generally concentrated in the top 130 m, just above the thermocline and centered on the<br />
chlorophyll maximum observed during CTD casts (Figure 12.22). The layer’s nighttime density was more or<br />
less constant along both transect lines. During the day, the layer was absent from the southern transect, but<br />
was very dense towards the northern end of the western transect. Because trawling for samples was not<br />
feasible during this cruise, the biological composition of the layer is presently unknown.<br />
Palmyra Atoll<br />
Echo-sounder surveys were<br />
conducted along six transect lines<br />
around Palmyra Atoll between March<br />
30 and April 1, 2004. Transect line<br />
lengths ranged from 4 to 9 km. Two<br />
lines were run along the edge and on<br />
the southwestern bank of the atoll,<br />
one along the southern shore, one<br />
along the edge of the southeastern<br />
bank, one along the northeastern<br />
edge of the bank, and one along the<br />
northern shore. All but the northern<br />
and northeastern transects were run<br />
multiple times during the same and/or<br />
successive nights, as well as during<br />
the day.<br />
The data revealed that a dense SSL<br />
exists around the entire perimeter of<br />
the atoll at night. This community<br />
resides primarily along the atoll’s<br />
steep slopes at a depth 120-180 m<br />
and is centered on the thermocline<br />
(Figure 12.23). A secondary, less<br />
dense layer of organisms occurs<br />
above the thermocline in patches.<br />
Opportunistic observations made<br />
during transits perpendicular to the<br />
atoll’s edges indicate that both layers<br />
extend well offshore (4-6 km) along<br />
the southwestern side of the atoll, but<br />
that they are restricted to less than 2<br />
Figure 12.22. Echogram of the SSL at Jarvis Island. Depth is plotted on the yaxis,<br />
horizontal distance on the x-axis (2.6 km). Red regions represent the bottom.<br />
Source: M. Lammers, unpublished data.<br />
Figure 12.23. Echogram of the SSL at Palmyra Atoll. Depth is plotted on the yaxis,<br />
horizontal distance on the x-axis (2.6 km). Red regions represent the bottom.<br />
Source: M. Lammers, unpublished data.
The State of Coral Reef Ecosystems of the Pacific Remote Island Areas<br />
km offshore along the other sides. A tentative explanation for this observation is that the southwestern side is<br />
enriched by nutrients flowing out of the lagoon. The main channel into the lagoon lies on the southwest corner<br />
and the prevailing tradewinds blow from the northeast, probably creating a net movement of water towards<br />
the southwest. Coincidentally, several observations of melon headed whales (Peponocephala electra) were<br />
made along this side of the atoll. This species is known to feed primarily on squid.<br />
Kingman Reef<br />
Echo-sounder surveys were conducted along four transect lines along the southern and eastern sides of<br />
the atoll between April 2-4, 2004. Two transect lines were run parallel to the atoll’s slopes and two were<br />
perpendicular. The two parallel transects were conducted at 18:00, 21:00, 0:00, and once towards the middle<br />
of the day. The perpendicular transects were run at 19:00 and at 01:00. Echo-sounder data were also<br />
collected opportunistically on one occasion while transiting along the southwestern corner of the atoll.<br />
An assessment of the data collected indicates that a SSL is conspicuously missing along most parts of the<br />
eastern and southern sides of the atoll. Both night and daytime transects revealed only dispersed patches of<br />
mid-water organisms. These patches were very localized and ranged in depth between 80 m and 130 m. The<br />
most prominent patch was observed along the southwestern corner of the atoll. This again coincided with the<br />
primary channel into and out of the atoll, similiar to that seen at Palmyra.<br />
The echo-sounder data collected at the three sites reveal that each location is quite distinct in the density and<br />
distribution of the mid-water biomass occurring there. Jarvis and Palmyra appear to be much more productive<br />
than Kingman. Furthermore, Palmyra supports a dense, thermocline-associated community that was not<br />
observed at either Jarvis or Kingman.<br />
It is interesting to note that three locations are quite distinct oceanographically and ecologically. Jarvis Island<br />
is the top of a steep pinnacle rising from the ocean floor. It is located almost at the equator and is fed by<br />
upwelling from the EUC and is also a major seabird colony. Nutrient inputs from these two sources probably<br />
contribute to the mid-water productivity observed there. Palmyra, on the other hand, is a forested network<br />
of islets that also supports a significant seabird population. Nitrogenous and organic outflows from the<br />
terrestrial ecosystem are likely a contributing factor behind the productivity observed there, particularly along<br />
the southwestern side where the lagoon’s waters flow out. Finally, Kingman Reef is influenced by neither the<br />
EUC nor any terrestrial-based ecosystem. A minimal or reduced influx of nutrients at Kingman may explain<br />
the lack of a well-defined SSL there.<br />
MARINE MAMMALS<br />
Very little is presently known about the marine mammal populations in the U.S. PRIAs. Although no systematic<br />
marine mammal surveys have ever been conducted in these areas, recent visits during the PIFSC-CRED<br />
operations revealed that all sites visited do have cetacean populations associated with local island or atoll<br />
ecosystems. Of the odontocetes encountered, bottlenose dolphins (Tursiops truncatus) were by far the most<br />
common species sighted. Populations of 50 to 100 or more animals occur at Johnston, Howland, Baker, Jarvis,<br />
Palmyra and Kingman. Repeated sightings made during consecutive days suggest that these populations are<br />
resident. Palmyra also supports a population of melon-headed whales (Peponocephala electra). These were<br />
seen on successive days over a three-day period and were consistently located near the southwest side of the<br />
atoll. Anecdotal accounts from USFWS staff familiar with Palmyra (J. Maragos, pers. obs.) report having seen<br />
both T. truncatus and P. electra on past visits. Similarly, USFWS staff familiar with Jarvis Island (M. Rauzon,<br />
pers. comm.) report having seen T. truncatus and sperm whales (Physeter macrocephalus) there previously.<br />
Although not directly observed, beaked whales may also be present at some PRIA sites. A skeleton<br />
tentatively identified as Cuvier’s beaked whale (Ziphius cavirostris) was found at Kingman Reef. In addition,<br />
the oceanographic and bathymetric conditions (upwelling, deep waters) found at Jarvis are characteristic of<br />
habitat known to be exploited by beaked whales.<br />
Mysticetes were reported only for one location visited by the PIFSC-CRED cruises. Humpback whales<br />
(Megaptera novaeagliae) were observed at Johnston Atoll. This finding is rather significant as there are no<br />
Pacific Remote Island Areas<br />
Sidebar<br />
page<br />
367
Pacific Remote Island Areas<br />
page<br />
368<br />
The State of Coral Reef Ecosystems of the Pacific Remote Island Areas<br />
modern records of this endangered species there. According to observer accounts, all social roles typically<br />
found on winter mating grounds are present at Johnston, including mothers and calves with male escorts,<br />
competitive groups, and singers. It is speculative, but Johnston Atoll may represent a relatively newly<br />
established or re-established mating ground of the north Pacific humpback whale population.<br />
The role that marine mammals play in the ecosystems of PRIA sites is presently not well understood. The high<br />
metabolic needs characteristic of mammals suggest that their role is probably not trivial. Recent modeling<br />
work on the impacts of great whales (including sperm whales) on global primary productivity has revealed that<br />
up to 62% of the ocean’s primary production may have gone to sustaining whales during pre-whaling times<br />
(D. Croll, unpublished data). Although similar estimates are not presently available for smaller cetaceans, this<br />
does suggest that a more detailed assessment of the composition and abundance of marine mammals in the<br />
PRIAs is warranted.<br />
MARINE INVERTEBRATES OTHER THAN <strong>CORAL</strong>S<br />
Historically, biodiversity assessments and monitoring programs for coral reefs have focused on cnidarians<br />
and fish, so less information is available for other invertebrates. However, the sponge, mollusk, echinoderm,<br />
crustacean, annelid, bryozoan, and tunicate fauna associated with coral reefs are also integral components<br />
to the overall biodiversity.<br />
Most data collection efforts in the PRIAs have focused on fish, ciguatera, algae, and corals, but some information<br />
on non-coral invertebrates is available from baseline faunal surveys conducted in the mid-1960s (Brock et<br />
al., 1966; Amerson and Shelton, 1976). A presentation of the species richness of non-coral invertebrates<br />
for the PRIAs will be a compilation of studies conducted since the early 1900s and collections held at the<br />
Bishop Museum. The information<br />
reported here will only provide data<br />
for porifera, hydroids (Cnidaria; Order<br />
Hydroida), anemones (Cnidaria; Order<br />
Actiniaria), selected mollusks, and<br />
echinoderms. To date, the data for all<br />
invertebrate groups are preliminary<br />
but these particular species have<br />
the most complete species richness<br />
data. Only species recorded from<br />
coral reef and associated shoreline<br />
areas will be included in the species<br />
richness data provided in this section<br />
in Table 12.7.<br />
Table 12.7. Species richness data for selected non-coral invertebrates. Sources:<br />
Godwin, 2004, 2002; Coles et al., 2000; Brock, 1979; Amerson and Shelton, 1976;<br />
Brock et al., 1966; Kay, unpublished data.<br />
PHYLUM PORIFERA<br />
PHYLUM CNIDARIA<br />
20<br />
Order Hydroida 5<br />
Order Actiniaria<br />
PHYLUM MOLLUSCA<br />
9<br />
Class Gastropoda 247<br />
Class Bivalvia 47<br />
PHYLUM ECHINODERMATA 67<br />
The PRIAs possess marine invertebrate diversity and richness contained in habitats with a broad spectrum of<br />
anthropogenic influence. Locations such as Kingman Reef in the northern U.S. Line Islands represent locations<br />
with very little anthropogenic influence, while the coral reef habitats at Johnston Atoll are heavily impacted<br />
by alterations. Despite this vast difference, each of the PRIAs provides a refuge for marine invertebrate<br />
communities that recruit from a variety of source locations. For example, the giant clams Tridacna maxima<br />
and Tridacna squamosa can be found commonly in most of the PRIAs, with Kingman Reef possessing the<br />
most abundant communities. These clams have been heavily depleted in other parts of their range and the<br />
PRIAs represent a refuge for these species, if existing management and protection remains in place there.
The State of Coral Reef Ecosystems of the Pacific Remote Island Areas<br />
Overall Conditions and Summary of Analytical Results<br />
NOAA, USFWS, Bishop Museum, and other scientists and volunteers have now completed species inventories<br />
(including many new records) and assessments and initiated monitoring of reef fishes and corals using several<br />
complementary underwater survey techniques at most of the PRIAs: the U.S. Line and Phoenix Islands,<br />
Johnston Atoll, and Rose Atoll. Based on the inventories, assessments, and monitoring thus far, several<br />
summary statements can be made:<br />
• Based on the fish assemblage composition surveyed from 2000-2004, coral reef ecosystems of the PRIAs<br />
appear to remain quite healthy and productive.<br />
• Levels of unauthorized fishing around the U.S. Line and Phoenix Islands are unknown, but believed to be<br />
negligible to light. Overall, reef fish assemblages at these islands appear to be basically healthy, with large<br />
apex predators common.<br />
• There is presently no known harvesting for the coral and live reef fish/species trades in these islands.<br />
• Substantial COTS predation on corals has been observed at Kingman and Palmyra but appears low<br />
elsewhere in the PRIAs.<br />
• High densities of small planktivorous fishes found along the west side of the equatorial islands (Jarvis,<br />
Baker, Howland) were associated with upwellings caused by impingement of the EUC.<br />
• Coral larvae transported in ECC from the western Pacific may be responsible for the substantially higher<br />
levels of coral species diversity at Palmyra and Kingman.<br />
• Surveys conducted at Kingman in 2004 suggest an apparent decline in large fish densities (e.g., gray reef<br />
sharks, jacks, groupers) from earlier years.<br />
• Abandoned WWII material, military construction, occupation, and ship groundings continue to be sources of<br />
stress, alien species, and perhaps coral disease to resident reef ecosystems.<br />
• Although uninhabited atolls and islands serve as important minimally-disturbed refuges, they are also<br />
vulnerable to unauthorized fishing and collecting due to the lack of on-site surveillance and enforcement.<br />
CURRENT CONSERVATION MANAGEMENT ACTIVITIES<br />
The USFWS and NOAA will continue to collaborate on research expeditions to the 10 NWRs with coral<br />
reefs that are co-managed in the U.S. Line Islands, U.S. Phoenix Islands, Guam, American Samoa, and<br />
Hawaii. The USFWS and NOAA will continue to monitor fish and wildlife resources, assess impacts of residual<br />
anthropogenic stress to these ecosystems, and work with partners to restore ecosystems. As part of a new<br />
initiative, the USFWS will prepare and coordinate the development of comprehensive conservation plans for all<br />
of its NWRs beginning in 2004. The USFWS will work with partners to improve surveillance and enforcement<br />
and discourage unauthorized access and poaching of fish and wildlife. All but two of the NWRs in the PRIAs<br />
will continue to be managed as no-take MPAs, and catch-and-release fishing at the remaining two NWRs will<br />
be adjusted accordingly to protect resident fish and seabird stocks. The USFWS will vigorously defend all of<br />
its refuges against commercial fishing, destructive fishing, and unauthorized fishing.<br />
Pacific Remote Island Areas<br />
Sidebar<br />
page<br />
369
Pacific Remote Island Areas<br />
page<br />
370<br />
The State of Coral Reef Ecosystems of the Pacific Remote Island Areas<br />
OVERALL CONCLUSIONS AND RECOMMENDATIONS<br />
Cooperative biennial surveys should continue at these remote islands to: 1) improve the scientific understanding<br />
of these fish and wildlife resources as a basis for sound management; 2) monitor spatial and temporal changes<br />
in fish and wildlife assemblages in response to natural and anthropogenic forces; 3) help elucidate associations<br />
between fish (the primary resource of interest) and other components of the coral reef ecosystem; and 4)<br />
assist the USFWS and other resource managers to improve the scientific basis for protecting fish and wildlife<br />
within NWRs and other MPAs.
REFERENCES<br />
The State of Coral Reef Ecosystems of the Pacific Remote Island Areas<br />
Amerson, A.B. and P.C. Shelton. 1976. The natural history of Johnston Atoll, Central Pacific Ocean. Atoll Research<br />
Bulletin 192: 1-477.<br />
Barber, C.V. and V.R. Pratt. 1997. Sullied Seas: strategies for combating cyanide fishing in Southeast Asia and beyond.<br />
World Resources Institute and International <strong>Marine</strong>life Alliance, Washington, D.C. 215 pp.<br />
Brainard, R.E., E. DeMartini, J. Kenyon, P. Vroom, J. Miller, R. Hoeke, J. Rooney, R. Schroeder, and M. Lammers.<br />
2004. Multi-disciplinary spatial and temporal monitoring of reef ecosystems of the US-affiliated Pacific Islands. In:<br />
Proceedings, International Coral Reef Symposium, Okinawa.<br />
Brock, R.E. 1979. A statistical study of Cypraea tigris in the Central Pacific. Veliger 22: 166-170.<br />
Brock, R.E., W. Van Heukelem and P. Helfrich. 1966. On ecological reconnaissance of Johnston Island and the effects<br />
of dredging. University of Hawaii, Hawaii <strong>Marine</strong> <strong>Laboratory</strong> technical report 11.<br />
Coles, S.L., R.C. DeFelice and D. Minton. 2000. <strong>Marine</strong> species survey of Johnston Atoll, Central Pacific Ocean, June<br />
2000. Bishop Museum Technical Report 19, Honolulu.<br />
Dawson, E.Y. 1959. Changes in Palmyra Atoll and its vegetation through activities of man, 1913-1958. Pacific Naturalist<br />
2: 1-51.<br />
Dawson, E.Y., A.A. Aleem and B.W. Halstead. 1955. <strong>Marine</strong> algae from Palmyra Island with special reference to the<br />
feeding habits and toxicology of reef fishes. Allan Hancock Foundation Publications 17: 1-39.<br />
Godwin, L.S. 2002. Rapid ecological assessment of the marine invertebrate fauna of American Samoa and the U.S.<br />
Equatorial and Line Islands. National Oceanic and Atmospheric Administration, Pacific Islands Fisheries Center, Coral<br />
Reef Ecosystem Division, Honolulu.<br />
Godwin, L.S. 2004. Bishop Museum, Honolulu. Personal communication.<br />
Godwin, L.S. 2004. Cruise Report OES-04-01,02,04. Rapid ecological assessment of the marine invertebrate fauna<br />
of American Samoa and the U.S. Equatorial Islands, U.S. Line Islands and Johnston Atoll. National Oceanic and<br />
Atmospheric Administration, Pacific Islands Fisheries Center, Honolulu.<br />
Gove, J.M., <strong>2005</strong>. Upwelling variability at Jarvis Island. MS thesis, University of Hawaii.<br />
Jokiel, P.L. University of Hawaii at Manoa. Honolulu, HI. Personal communication.<br />
Kay, E.A. Unpublished. List of marine mollusks reported from Johnston Atoll. University of Hawaii at Manoa.<br />
Kenyon, J. 2004. NOAA Fisheries, Honolulu, HI. Personal communication.<br />
Maragos J.E. 1974. Reef Corals of Fanning Atoll. Pacific Science 28 (3): 247-255.<br />
Maragos, J.E. 1979. Environmental assessment and field survey, Wake Atoll. Unpublished manuscript. U.S. Army<br />
Engineer Division, Pacific Ocean.<br />
Maragos, J.E. 1988. Notes on the abundance and distribution of reef corals and reef features at Palmyra Atoll, Line<br />
Islands. Unpublished manuscript. U.S. Army Corps of Engineers, Pacific Ocean Division, Defense Environmental<br />
Restoration Program, Fort Shafter, HI. 16 pp plus 11 plates and map.<br />
Maragos, J.E. 1994. Reef and coral observations on the impact of the grounding of the longliner Jin Shiang Fa at Rose<br />
Atoll, American Samoa. Review draft. Program on Environment, East-West Center, Honolulu. 21 pp. plus tables.<br />
Maragos, J.E. 1995. Revised checklist of extant shallow-water stony coral species from Hawaii (Cnidaria: Anthozoa:<br />
Scleractinia). Bishop Museum Occasional Papers 42: 54 - 55.<br />
Maragos, J.E. 1997. Ecological surveys of corals and reef environments at Kiritimati Atoll for the proposed HOPE-X<br />
Landing Site Project. Dames and Moore, Honolulu. 21 pp.<br />
Maragos, J.E. 2004. Diversity of corals and anemones at eleven remote atolls and reef islands in the central Pacific. In:<br />
Proceedings, 10th International Coral Reef Symposium.<br />
Pacific Remote Island Areas<br />
Sidebar<br />
page<br />
371
Pacific Remote Island Areas<br />
page<br />
372<br />
The State of Coral Reef Ecosystems of the Pacific Remote Island Areas<br />
Maragos, J.E. and P.L. Jokiel. 1978. Reef Corals of Canton Atoll: I. Zoogeography. Atoll Research Bulletin 221: 57-70.<br />
Maragos J.E. and P.L. Jokiel. 1986. Reef corals of Johnston Atoll: One of the world’s most isolated reefs. Coral Reefs<br />
4: 141-150.<br />
Maragos, J., D. Potts, G. Aeby, D. Gulko, J. Kenyon, D. Siciliano and D. VanRavenswaay. 2003. 2000-2002 rapid<br />
ecological assessment of corals on the shallow reefs of the Northwestern Hawaiian Islands. Part 1: Species and<br />
distribution. Pacific Science 58(2): 211-230.<br />
Maragos J. and A. Veit. 2004. Monitoring corals and other macro-invertebrates at fixed sites at U.S. Pacific remote<br />
islands and atolls. Poster presentation. In: Proceedings of the10th International Coral Reef Symposium Okinawa.<br />
Molina, M. and J. Maragos. 1998. List of coral species at Palmyra Atoll, November 1998. Unpublished manuscript. U.S.<br />
Fish and Wildlife Service Pacific Islands Ecoregion, Honolulu.<br />
Page, K.N. and L.B. Preskitt. 2004. Appendix C: Benthic-Algae REA Team Activity Summary. National <strong>Marine</strong> Fisheries<br />
Service. Cruise Report No. OES-04-04. 21 March - 9 April, 2004. NOAA ship Oscar Elton Sette. Pacific Islands<br />
Fisheries Science Center, Honolulu, HI. 70 pp.<br />
Preskitt, L.B., P.S. Vroom and C.M. Smith. 2004. A Rapid Ecological Assessment (REA) Quantitative Survey Method for<br />
Benthic Algae using Photo Quadrats with SCUBA. Pacific Science 58: 201-209.<br />
Rauzon, M.J. Volunteer, U.S. Fish and Wildlife Service, Honolulu, HI. Personal communication.<br />
Sadovy, Y.J. and A.C.M. Vincent. 2002. Ecological issues and the trades in live reef fishes. pp. 391-420. In: P.F. Sale<br />
(ed.) Coral reef fishes: dynamics and diversity in a complex ecosystem. Academic Press, San Diego.<br />
South, G.R., P.A. Skelton and A. Yoshinaga. 2001. Subtidal benthic marine algae of the Phoenix Islands, Republic of<br />
Kiribati, Central Pacific. Botanica Marina 44: 559 - 570.<br />
Stoddart, D.R. 1992. Biogeography of the tropical Pacific. Pacific Science 46 (2): 276-293.<br />
Tsuda, R.T. and G. Trono. 1968. <strong>Marine</strong> benthic algae from Howland Island and Baker Island, Central Pacific. Pacific<br />
Science 12: 194-197.<br />
Work, T., S. Coles and R. Rameyer. 2001. Johnston Atoll reef health survey. US Geological Survey, National Wildlife<br />
Health Center, Hawaii Field Station. 28 pp.
The State of Coral Reef Ecosystems of the Marshall Islands<br />
Silvia Pinca 1 , Maria Beger 2 , Dean Jacobson 1 , Terry Keju 3<br />
INTRODUCTION AND SETTING<br />
The reefs of the Marshall Islands are among the most pristine in the Indo-Pacific, having suffered minimal<br />
damage from bleaching, destructive fishing techniques, and sedimentation. However, signs of unsustainable<br />
resource exploitation are apparent, including the earlier extirpation of the largest giant clams, and the ongoing<br />
reduction of reef shark, grouper, and Napoleon wrasse populations. In addition, localized outbreaks of crownof-thorns<br />
starfish (COTS) and coral disease, principally on the capital atoll of Majuro, are ongoing. Another<br />
concern is the growing, unregulated exploitation of reef fish for the local markets.<br />
The Republic of the Marshall Islands (RMI) encompasses approximately 1,225 individual islands and islets<br />
with 29 atolls and five solitary low coral islands (Figure 13.1). Land makes up less than 0.01% of the area of<br />
the Marshall Islands, with a total dry land area of approximately 181.3 km 2 . Most of the country is open ocean<br />
with a seafloor that reaches 4.6 km deep. Including the Exclusive Economic Zone (EEZ; shoreline to 200<br />
miles offshore), the RMI covers 1,942,000 km 2 of ocean within the larger Micronesian region. Furthermore,<br />
there are 11,670 km 2 of semi-enclosed water within the lagoons of the atolls.<br />
Scattered throughout the country are nearly one hundred isolated submerged volcanic seamounts. Seamounts<br />
with flattened tops, or guyots, are thought to have formed millions of years ago but were unable to<br />
keep pace with subsidence or persist as islands or atolls.<br />
The average elevation of the Marshall Islands is about 2 m above sea level. Humidity is around 80% with considerable<br />
salt spray. The air temperature averages 27.8ºC with an annual range of 24-32ºC. Rainfall tends<br />
to be seasonal, ranging from 4 m a year in the south to as little as 0.6 m a year in the north. In extremely dry<br />
years, there may be no precipitation on some atolls. Tropical storms (typhoons) are relatively rare, but can<br />
be devastating when they occur.<br />
The atolls vary in size from Kwajalein, the world’s largest atoll with 16.4 km 2 of dry land and a lagoon of 2,174<br />
km 2 , to Bikar with 0.5 km 2 of land and 37.4 km 2 of lagoon, and Namdrik with 2.7 km 2 of land and 8.4 km 2 of<br />
lagoon. Individual islands range from tiny sand-spits and vegetated islets that are inundated during storms<br />
and extreme high tides to much larger islands such as Kaben Island at Maloelap Atoll, and Wotho Island, the<br />
main island at Wotho Atoll, both of which are over 8 km 2 . Lagoons within the atolls typically have at least one<br />
deep-pass access; however, some, such as Namdrik Atoll, have no natural passes.<br />
The atolls and islands of the Marshalls formed when fringing reefs began to establish and grow around emergent<br />
volcanoes. The ancient volcanic peaks then gradually sank and shrank, while fringing reefs continued<br />
to grow, eventually becoming coral atolls after the volcanoes disappeared entirely beneath the sea. The five<br />
solitary islands of the RMI were formed in much the same way, but the peaks were small enough that no interior<br />
lagoon developed.<br />
For the most part, the atolls of the Marshalls are not circular, nor do they have uniform islets. They are much<br />
larger than those in the Indian Ocean and are surrounded by more numerous islets. The islets are more<br />
prevalent on the windward side and encircle a deep lagoon. The lagoons of RMI atolls also differ from others<br />
in that they are typically deeper (to about 60 m) and have greater circulation.<br />
1 Department of <strong>Marine</strong> Science, College of the Marshall Islands<br />
2 The Ecology Centre, University of Queensland, Australia<br />
3 Marshall Islands <strong>Marine</strong> Resources Authority<br />
Sidebar<br />
Marshall Islands<br />
page<br />
373
Marshall Islands<br />
page<br />
374<br />
The State of Coral Reef Ecosystems of the Marshall Islands<br />
Figure 13.1. Locator map for the Marshall Islands. Map: A. Shapiro.<br />
The islets are extremely young geologically and likely formed when sea level dropped about 2 m to its present<br />
level around 4,000 years ago, with more recent land creation resulting from the action of large waves which<br />
cast large reef blocks, coral rubble, and sand on top of shallow reefs. Vegetation, birds, crabs, and other<br />
animals then colonized the emergent islands, and eventually the Micronesian ancestors of the present day<br />
Marshall Islanders arrived on sailing canoes. In contrast, the atoll reefs are 50 million years old or more, and<br />
up to 1.5 km thick atop their volcanic foundation.
ENVIRONMENTAL AND ANTHROPOGENIC STRESSORS<br />
The State of Coral Reef Ecosystems of Marshall Islands<br />
Climate Change and Coral Bleaching<br />
Low lying coral reef islands, such as the Marshalls, are at great risk from climate change, particularly from sea<br />
level rise, which could result in total submergence. It was suggested during an inter-governmental meeting<br />
that such countries could be considered for United Nations Environmental Programme protection as ‘endangered<br />
species’ (South Pacific Regional Environmental Programme, 1989).<br />
It has been projected that air temperatures in the Marshall Islands will continue to rise on all atolls, with the<br />
highest increases in the northern areas (Crisostoma, 2000). This could decrease total rainfall, causing severe<br />
droughts while also impacting freshwater supplies. A slight change in temperature would increase both the<br />
intensity and frequency of storm events, which have a greater impact on low-lying islands.<br />
The average sea temperature around the Marshall Islands is about 29°C, near the upper limit for coral survival<br />
of about 31°C. An increase of just 1°C could trigger massive coral bleaching. Some of the very shallow flat<br />
reefs on the lagoon side of Majuro Atoll bleached during a time of particularly elevated temperatures and calm<br />
conditions, coinciding with the period of spring tide; this occurred during the new moons of Sept-Nov 2002 and<br />
resulted in high reef flat mortality. Similar anecdotal observations for the same time period (in 2002) came<br />
from local inhabitants in Jaluit Atoll. Considerable bleaching, restricted to certain species of Acropora, was<br />
later seen on Jaluit, both in 2003 and 2004. However, local residents did not recall any other similar reef flat<br />
events in the RMI. No sign of coral bleaching was recorded during recent surveys of several atolls (Pinca,<br />
2001; Beger and Pinca, 2003a; Pinca et al., 2004a,b), but reef flat bleaching was recorded in February <strong>2005</strong>.<br />
Diseases<br />
Coral disease is visible on some<br />
reefs of the Marshall Islands (Figure<br />
13.2), most notably a rapidly<br />
spreading “white” syndrome affecting<br />
Acropora spp. (see below). Two<br />
rare diseases also occur: a single<br />
Favid colony showing signs of red<br />
band disease was located on Arno,<br />
and some Platygira sinensis colonies<br />
have slowly progressing lesions bordered<br />
by a bright green algal margin.<br />
Coralline lethal orange disease, or<br />
CLOD, which is caused by an orange<br />
bacterium fatal to coralline algae,<br />
is common along the southern and<br />
eastern shores of Majuro.<br />
The white syndrome affecting table<br />
corals (Acropora spp.) is ubiquitous,<br />
particularly on the leeward shore of<br />
Figure 13.2. The rapid progression of a coral disease on a table coral in the Marshall<br />
Islands. Photo: D. Jacobson.<br />
Majuro; this is a region with high human population density and where a shallow outfall bathes the reef shelf<br />
with untreated sewage. This disease is typically found on A. cytherea, A. clathrata and similar species; small<br />
digitate or caespitose species as well as branching colonies are not affected. Disease signs usually progress<br />
steadily at a rate of 2 cm per day. This disease can kill a 2 m colony in 10 months, as a narrow white band<br />
sweeping radially along the colony edge like the hand of a clock. Disease mortality on Majuro has been quantified<br />
at a leeward ocean site near the airport over a 12-month period. Based on surface area, 16% annual<br />
mortality occurs, in contrast to approximately 20% of annual growth. Mortality is density-dependent; in a local<br />
patch of particularly dense A. cytherea tables, mortality exceeded 30% over a 7 month interval as the disease<br />
spread to neighboring colonies. 2003-2004 mortality was much higher than in the few previous years, sug-<br />
Sidebar<br />
Marshall Islands<br />
page<br />
375
Marshall Islands<br />
page<br />
376<br />
The State of Coral Reef Ecosystems of the Marshall Islands<br />
gesting this disease outbreak had a recent inception (i.e., the year 2000). A disease “hot spot” is located far to<br />
the west at Laura, which experienced at least 50% mortality. Microbiological characterization of pathogens is<br />
ongoing (B. Willis, pers. comm.) and involves at least one virulent bacterium and a large histophagous ciliate<br />
whose aggregations appear as macroscopic yet minute spots within corallites. This disease is rare on outer<br />
atolls: barely detectable on Jaluit, and uncommon on the western shore of Arno, nearest to Majuro. It is also<br />
absent on the pristine northern shore of Majuro. Identical disease signs have been sighted on Pohnpei and<br />
Kosrae as well. Disease vectors are<br />
unknown, and new infections appear<br />
in every season and month.<br />
Tropical Storms<br />
Although major typhoons are not common<br />
in the Marshall Islands (Figure<br />
13.3), they can be devastating when<br />
they hit. In 1991, Typhoon Zelda hit<br />
the southern atolls. It was quickly followed<br />
in early 1992 by Typhoon Axel,<br />
which scoured the south-facing reefs<br />
of Majuro, covering the land, including<br />
the airport, with coral debris and<br />
rubble. Shortly thereafter, Typhoon<br />
Gaye ravaged much of the northern<br />
atolls, including Wotho. In late 1997,<br />
Paka changed from a tropical storm<br />
to a typhoon while in the Marshalls<br />
and caused considerable damage to<br />
Ailinglaplap (N. Vander Velde, pers.<br />
comm.).<br />
Coastal Development and Runoff<br />
The human population has increased<br />
significantly in the Marshall Islands<br />
over the past century (Figure 13.4),<br />
doubling in size between 1973 and<br />
1999 (RMI Embassy, http://rmiembassyus.org/statistics/statistics.<br />
html, Accessed 01/31/05). Although<br />
little data on the extent or impact of<br />
coastal development exists, population<br />
density on the heavily populated<br />
islands of Kili and Majuro in 1999 was<br />
2,150 and 6,314 people per mi 2 respectively<br />
(1999 Census of Population,<br />
RMI).<br />
In Majuro and other outer atolls, such<br />
as Likiep, eutrophication has been<br />
observed near human settlements.<br />
Figure 13.3. The path and intensity of typhoons passing near the Marshall Islands<br />
from 1979-2004. Many Pacific typhoons are not named or the names are not recorded<br />
in the typhoon database. Map: A Shapiro. Data: Unisys, http://weather.unisys.<br />
com/hurricane.<br />
Figure 13.4. The population in the Marshall Islands doubled between 1973 and<br />
1999. Source: RMI Embassy, http://rmiembassyus.org/statistics/statistics.html, Accessed<br />
01/31/05.
The State of Coral Reef Ecosystems of Marshall Islands<br />
Coastal Pollution<br />
Little information on this threat is available, but obvious biotic affects appear down-current from the sewage<br />
outfall on Majuro. Table corals are unusually fragile, and the substrate is dominated by a slimy black encrusting<br />
algae, a eukaryotic red form. The more typical Halimeda spp. of algae are entirely absent. Such a biotic<br />
shift will reduce coral recruitment. Within the lagoon, a correlation between a eutrophic algae, Dictyota spp.,<br />
and the most populated regions of Majuro is apparent. A particular Zooanthus spp. is also restricted to this<br />
eastern lagoon region where eutrophication is apparent.<br />
Tourism and Recreation<br />
The number of visitors to the Marshall Islands has fluctuated in the past two decades, but is generally fairly<br />
modest. The highest number of visitors to Majuro occurred in 1996, when arrivals totaled 7,563 persons; in<br />
2003, there were 7,195 visitors (Marshall Islands Visitors Authority, http://www.spc.int/prism/country/mh/stats/<br />
toutism/travelers.htm, Accessed 01/31/05). Despite the low numbers of visitors, visitor expenditures did contribute<br />
an estimated $4 million to the Marshall Islands’ economy in 2000 (U.N. Economic and Social Commission<br />
for Asia and the Pacific database, http://unescap.org/stat/data/apif/index.asp, Accessed 01/31/05) when<br />
5,246 people visited.<br />
Fishing<br />
Subsistence and artisanal fishing play an important role in the Marshall Islands, especially in the outer atolls,<br />
where they provide the local population with a major source of animal protein. According to RMI Embassy statistics,<br />
nearly 3,400 households were engaged in subsistence fishing in 1999 (RMI Embassy, http://rmiembassyus.org/statistics/<strong>pdf</strong>/demographics/SubActbyAtoll99.<strong>pdf</strong>,<br />
Accessed 01/31/05). In most places, fishing was<br />
the most common subsistence activity, with more households participating in fishing than other subsistence<br />
activities such as growing food, producing copra, breeding livestock, or making handicrafts.<br />
In addition to the subsistence harvest, a major commercial fishery exists in the RMI, and sale of fishing rights in<br />
the EEZ generates between $1-3 million per year. The Marshall Islands <strong>Marine</strong> Resources Authority (MIMRA)<br />
maintains statistics on total annual catch and method of catch, which are shown in Figure 13.5 (http://www.<br />
spc.int/prism/country/mh/stats/economic/fish_catch.htm, Accessed 01/31/05). However, most of the commercial<br />
fishing activity is focused on offshore tuna stocks and is not likely to impact reef ecosystems. MIMRA also<br />
operates the National Fisheries and Nautical Training Center, which educates approximately 75 Marshallese<br />
students per year, providing skills that<br />
prepare them to work in commercial<br />
fisheries enterprises.<br />
Little information was available to<br />
characterize the threat to reef ecosystems<br />
from fishing. However,<br />
some industrial fishing impacts were<br />
noted in Rongelap in the form of longlines<br />
that were found entangled on<br />
corals at four outer reef sites at the<br />
leeward site of the atoll. Long-line<br />
shark fishing activities were occurring<br />
in RMI at the time, but were permitted<br />
only 5 miles off the coast. The lines<br />
may have been evidence of illegal<br />
shark fishing on the reefs, as longline<br />
shark fishing is no longer allowed<br />
nearshore.<br />
Figure 13.5. Total annual catch and method of capture in the Marshall Islands’ commercial<br />
fishery, which targets offshore tuna stocks. Data on reef species and subsistence<br />
catch were not available. Source: MIMRA database.<br />
Sidebar<br />
Marshall Islands<br />
page<br />
377
Marshall Islands<br />
page<br />
378<br />
The State of Coral Reef Ecosystems of the Marshall Islands<br />
Trade in Coral and Live Reef Species<br />
Harvesting live rock and other coral<br />
reef products can have serious implications<br />
for reef communities. In<br />
the Marshall Islands, many species<br />
are exported for the aquarium trade<br />
(Figure 13.6), and seashells are<br />
frequently used in handicrafts, but<br />
little quantitative information on the<br />
amount of material removed from the<br />
reefs is available. However, a clam<br />
and live coral farm and a pearl farm<br />
are exporting sustainably-produced<br />
organisms for the aquarium market.<br />
Ships, Boats, and Groundings<br />
No information on this threat is available.<br />
Figure 13.6. The value of ‘pet fish’ exported for the aquarium trade from 1979-2000.<br />
Source: RMI Division of Statistics; MIMRA database.<br />
<strong>Marine</strong> Debris<br />
Plastic, glass and metal trash and fishing and packaging debris are found along both lagoon and ocean shores<br />
on Majuro. Human-produced debris is found on outer atolls as well, but the amount produced by human<br />
settlement is much higher at the capital atoll and around its city. The most common pieces of debris produced<br />
by the city are plastic diapers, plastic bags, glass bottles and metal cans that accumulate on the bottom of the<br />
lagoon around town or remain trapped in coral branches.<br />
Aquatic Invasive Species<br />
Invasive and non-native species are a subtle, but potentially more permanent threat, especially on land.<br />
Many terrestrial invasive species have been documented and some of these, such as ironwood (Casuarina<br />
equisetifolia), can impact coastal areas by out-competing the native vegetation that protects the shoreline.<br />
Fouling marine invertebrates have been introduced, especially in ports where they probably arrived on ship<br />
hulls. Non-native algae and fishes have been documented, but the full impact of their presence has not been<br />
studied. Indications are that invasive species have a high potential to damage coral reefs (NBTRMI, 2000; N.<br />
Vander Velde, pers. comm.).<br />
Security Training Activities<br />
The most destructive series of anthropogenic events involving RMI islands, atolls, and lagoons occurred half<br />
a century ago. On March 1, 1954, a thermonuclear test bomb, code-named “Bravo,” was detonated on Bikini<br />
Atoll. Within seconds, a mile-wide 15-megaton blast vaporized entire islands and created a huge crater in the<br />
reef. Fish, corals, and other marine and terrestrial animals were destroyed when millions of tons of water and<br />
debris were thrown high into the air and then fell back to the lagoon (Simon, 1997; Walker et al., 1997; Robison<br />
and Noshkin, 1999; Niederthal, 2001). This test was part of a series of thermonuclear and hydrogen bomb<br />
tests that were conducted from 1946–1958 on Bikini and nearby Enewetak Atolls. Winds spread the airborne<br />
radiation to nearby atolls, including inhabited Rongelap and Utrik and uninhabited Rongerik and Ailinginae.<br />
Unfortunately, the complete picture of nuclear testing on the Marshalls’ biodiversity is neither simple, nor necessarily<br />
what it seems to casual observers. For example, Delgado (1999) observed in his book Ghost Fleet<br />
that there was “no tangible evidence of the testing” on Bikini. Maragos (pers. comm.) counters, stating that<br />
“the 2 km wide and 50 m deep crater in the reef at the Bravo test site is certainly evidence of lasting impacts<br />
along with the islands that were evaporated by the Bravo blast.” Although a half-century has passed, the full
The State of Coral Reef Ecosystems of Marshall Islands<br />
extent of the impact on the biota from radioactive materials introduced during the nuclear testing program is<br />
unknown (NBTRMI, 2000). Analysis to compare fish diversity data between two surveys in 1984 and 2002<br />
produced no clear results because of the ambiguous nature of the old data (Beger et al., 2003). As Kenchington<br />
and Salvat (1988) stated, “radioactive wastes may have long-term and largely unpredictable effects upon<br />
the genetic nature of the biological community.” Risks from the consumption of large amounts of locally grown<br />
food are still acknowledged to exist, even though returning residents are again eating the crabs.<br />
Offshore Oil and Gas Exploration<br />
Oil and gas exploration activities are not known to occur.<br />
Other<br />
Evidence of damage from COTS, Acanthaster planci,<br />
is apparent on the reefs of the Marshall Islands (Figure<br />
13.7), with densities along the south western lagoon<br />
shore of Majuro exceeding 1000 per km 2 . Acropora<br />
species (tabulate and branching) have been decimated<br />
(over 90% mortality) in 2004 and <strong>2005</strong>. Currently (Spring<br />
<strong>2005</strong>) slow-growing massive species, particularly Porites<br />
lobata, Pavona duerdeni, and Lobophyllia sp., as well as<br />
Pocillopora eydouxi, are being killed in an area previously<br />
targeted by starfish eradication dives. The only unaffected<br />
species is Porites rus, which is clearly increasing<br />
its dominance. Smaller reef flat Acropora spp. are also<br />
unaffected. Following a wave of Acropora mortality, dead<br />
coral surfaces have become colonized by a thick carpet<br />
of Dictyota algae, even in regions previously dominated<br />
by Halimeda and lacking Dictyota. Another COTS ‘hot<br />
spot’ at Majuro Atoll is in Calelin Pass near Irooj Island.<br />
Feeding scars on Porites colonies are also evident in the<br />
far eastern lagoon, near Rita. Along the southern ocean<br />
fringing reef, COTS are abundant only in the far western<br />
district of Laura.<br />
This COTS outbreak may be the first to occur since a<br />
major eradication effort in 1970. A major outbreak also<br />
occurred 15-20 years ago on Enewetak atoll. Even now,<br />
Acropora is entirely absent on the ocean side of the inhabited<br />
Enewetak island, although luxuriant stands of<br />
Acropora survive in a small refugium in a reef flat quarry<br />
pool on the north end of the island.<br />
Figure 13.7. Crown-of-thorns starfish, Acanthaster planci,<br />
damage Acropora corals in Majuro lagoon, a region where<br />
Acropora mortality is over 70%. Photo: D. Jacobson.<br />
Another predator of coral, the corallivorous gastropod, Drupella spp., is locally common (especially near the<br />
densely populated district of Delap) and can cause large feeding scars on Acropora spp. Several dozen snails<br />
can be found hiding during the day under the base of a single colony.<br />
Sidebar<br />
Marshall Islands<br />
page<br />
379
Marshall Islands<br />
page<br />
380<br />
The State of Coral Reef Ecosystems of the Marshall Islands<br />
<strong>CORAL</strong> <strong>REEF</strong> ECOSYSTEMS—DATA GATHERING ACTIVITIES AND RESOURCE CONDITION<br />
In addition to the outer island surveys on Rongelap, Bikini, Ailininae, Mili, Arno, Namu and Likiep scientists<br />
at the College of the Marshall Islands (CMI) have been paying close attention to local ecosystem indicators in<br />
the capital atoll of Majuro (i.e., bleaching, coral and coralline algal disease, COTS outbreaks, and pollutionassociated<br />
changes in macroalgae). Permanently-marked transects are being installed in transitional sites to<br />
photographically monitor long-term changes. One of these sites has been extensively photo-mapped (over a<br />
15 x 130 m area) to closely monitor the incidence of coral disease. In addition, a project involving manta tows<br />
over several km of leeward shore on Majuro is planned to map the distribution and abundance of schooling<br />
food fish species (i.e., rabbitfish, parrotfish, and surgeonfish).<br />
WATER QUALITY<br />
Coastal construction of ports, docks, airfields, causeways, and roads has affected water quality in the RMI,<br />
most notably in the capital atoll, Majuro. Development projects often require sources of fill material and expansion<br />
of land areas that lead to dredging and filling of adjacent reef areas (Maragos, 1993). While underway,<br />
construction along the shoreline introduces sediments, increases turbidity, and can change the circulation<br />
patterns in lagoons.<br />
BENTHIC HABITATS<br />
Pioneering studies on coral reefs in the Marshall Islands encompassed several atolls before 1955 (Tracey et<br />
al., 1948; Hiatt, 1950; Ladd et al., 1950; Wells, 1951 and 1954; Emery et al., 1954). A two-volume report on<br />
the natural and biological resources of Enewetak Atoll is perhaps the most comprehensive treatment of any of<br />
the Marshall Islands (Devaney et al., 1987). In 1988, Maragos coordinated coastal resource inventories and<br />
atlases of Arno, Kwajalein, and Majuro Atolls. There were additional marine biodiversity surveys of the northern<br />
RMI islands and atolls involving marine biologists and cultural specialists (Titgen et al., 1988; Thomas et<br />
al., 1988; AAA Engineering and Drafting and University of Hawaii Sea Grant Program, 1989; AAA Engineering<br />
and Drafting et al., 1989; Manoa Mapworks, 1989; Maragos, 1994.<br />
In 2001, Pinca led a systematic survey of coral reef resources at Likiep Atoll with community support through<br />
the CMI and MIMRA (Pinca, 2001). Similar surveys followed at Rongelap and Bikini in the summer of 2002<br />
(Pinca et al., 2002) and at Milli, Rongelap, and Ailininae Atolls in the summer of 2003 (Beger and Pinca,<br />
2003a,b; Pinca et al., 2004a,b). Surveys of Majuro and Namu Atolls occurred in November 2004 (S. Pinca,<br />
pers. obs.).<br />
During these systematic surveys, four transects parallel to the shoreline were laid at four different depths (5,<br />
10, 15, and 20 m) and divers on each transect recorded data on percentage cover of substrate type, coral<br />
life-forms and target species of corals, seaweed groups, abundance and size of target fish species, and<br />
abundance of commercial invertebrates. In addition, the 15 m transect was replicated three times to give<br />
an indication of the variability at this depth. Sites were selected on both the ocean and lagoon side of atolls,<br />
including pinnacles and patch reefs. Biodiversity of fish and corals were recorded during 60-minute vertical<br />
swims from 30 m to the surface. In 2001 in Likiep, and in 2004 in Arno, manta tows were also used to assess<br />
broad changes in the benthic communities of coral reefs.<br />
The results of these assessments confirm that coral cover is generally high in the Marshall Islands (Figure<br />
13.8), with peak areas at the leeward ocean sides of the atolls. High values of hard coral cover vary between<br />
57 and 68% (calculated as an average across sites in all four depth categories). Local coral cover at a single<br />
site reached as high as 79% of total substrate cover in Rongelap. Although coral cover was generally lower at<br />
lagoonal sites, a very high concentration of rare branching Acropora species were found in these environments.<br />
The lowest coral cover was generally recorded on the leeward lagoon side. However, many patch reefs and<br />
pinnacles with high coral cover and diversity are present inside the lagoons. The most common coral species<br />
or species groups are Porites lobata-australiensis, Isopora palifera/cuneata, and Porites rus. Acropora spp.<br />
were predominantly found inside the lagoon, as branching and tabulate growth forms, while non-Acropora en-
crusting, foliose, and Millepora spp.<br />
were more common at the oceanic<br />
sites. At some sites, blue corals (Heliopora<br />
coerulea) represented more<br />
than 20% of total coral cover (e.g., on<br />
the west side of Likiep Atoll). On the<br />
windward ocean side, where the mechanical<br />
energy of the wave action is<br />
much stronger than on the leeward<br />
side, the most abundant corals were<br />
the encrusting forms and Millepora<br />
spp. (fire coral). Fire coral was growing<br />
here in smaller colonies and was<br />
predominantly an encrusting form,<br />
compared to the fire coral on the leeward<br />
side, which grew in a branching<br />
and taller form.<br />
Range extensions (when a species<br />
is found that had not been previously<br />
The State of Coral Reef Ecosystems of Marshall Islands<br />
Figure 13.8. The upper forereef at Rongelap Atoll is an area of high coral cover and<br />
diversity in the Marshall Islands. Photo: S. Pinca.<br />
recorded at RMI) for several species of corals and fish were established during the 2002 and 2003 expeditions.<br />
A new species of coral (Acropora rongelapensis) was described in 2003 from Rongelap (Richards and<br />
Wallace, 2004).<br />
Soft corals were rare in most atolls in the RMI. However, in Mili, Sarcophyton spp. and Lobophyton spp. were<br />
relatively abundant, as were gorgonians of the genus Melithea.<br />
Fleshy seaweeds (especially Microdyction spp. and Halimeda spp.) and coralline algae were abundant and<br />
coexisted with healthy hard corals. Seaweed cover was higher at the west ocean and south ocean sites in<br />
Mili and east, south, and north ocean sites in Rongelap. Coralline algae dominated west ocean sites in Likiep.<br />
Two hundred and twenty-two species of macroalgae, three species of seagrass, and five species of mangroves<br />
have been identified in the Marshall Islands.<br />
In 2001, a total of 18 sites around the six islands of Likiep Atoll were sampled by Pinca (2001). The general<br />
ecological health of coral reefs in Likiep Atoll was very good, although there are sharp differences among the<br />
six islands surveyed. The islands differ both ecologically (associations of different species of organisms, both<br />
corals and fish), as well as in the degree of integrity (status of corals, quantity and structure of fish populations).<br />
Some inhabited islands show initial signs of eutrophication by the presence of blue-green algae on the<br />
lagoon sand bottom in front of the villages. Also, a live-fish fishing enterprise that catches groupers and other<br />
reef fish was present in fall 2001, although its impacts have not been quantified.<br />
ASSOCIATED BIOLOGICAL COMMUNITIES<br />
In 2002 and 2003, a total of 45 sites in Rongelap Atoll were surveyed (Pinca et al., 2002; Beger and Pinca,<br />
2003a; Pinca et al., 2004b), including sites at pinnacles and patch reefs inside the lagoon, as well as ocean<br />
and pass sites. A very high diversity and richness of fauna exist in Rongelap atoll, with particularly abundant<br />
and large fish, abundant megafauna such as sea turtles, rays, and sharks, as well as large and abundant giant<br />
clams. This atoll has been uninhabited for the past 50 years due to the evacuation of local people following<br />
radioactive fallout from the nuclear tests at Bikini Atoll. Coastal managers and marine biologists analyzed the<br />
results from the 2003 surveys and recommended specific sites to be preserved for their pristine health and<br />
high biodiversity.<br />
A total of 20 sites were surveyed at Mili Atoll during a two-week period in 2003 (Pinca et al., 2004a), including<br />
nine sites on the ocean side of the atoll, two pass sites, and nine lagoon and pinnacle sites. The team<br />
Sidebar<br />
Marshall Islands<br />
page<br />
381
Marshall Islands<br />
page<br />
382<br />
The State of Coral Reef Ecosystems of the Marshall Islands<br />
worked directly with local landowners<br />
and government officials to propose<br />
that a few islands be dedicated as<br />
a marine sanctuary in the northeast<br />
corner of the atoll. The reefs were<br />
found in mostly pristine condition,<br />
with a large number of fish, coral, soft<br />
corals, and algae present. Sharks<br />
were not very abundant, and local<br />
anecdotal evidence suggested<br />
that illegal shark fishing by foreign<br />
large-scale fishing operations was to<br />
blame (Figure 13.9). Beaked whales,<br />
spinner dolphins, sharks, and largesize<br />
fish were found in the area proposed<br />
for a marine sanctuary. The<br />
proposed sanctuary area includes a<br />
variety of important habitats, such as<br />
ocean walls, passes, pinnacles, and<br />
lagoonal reef habitats.<br />
Figure 13.9. Fins harvested from hundreds of sharks lay drying in the sun. While<br />
fishing for sharks is not illegal for Marshallese fishers, illegal shark fishing is suspected<br />
in some areas of the Marshall Islands, such as at Mili Atoll. Photo: S. Pinca.<br />
The highest abundance of fish was found at the northern and southern ocean sides of the atolls of Likiep and<br />
Mili, and at the southeast lagoon, pass and slope areas of Rongelap (Pinca, 2001; Beger and Pinca, 2003a;<br />
Pinca et al., 2004a,b). Surgeonfish, snapper, wrasse, fusilier, parrotfish, and grouper are the most abundant<br />
food fish families. Seven of the 860 species of reef fishes recorded in the Marshall Islands are endemic. A<br />
total of 373 fish species were recorded at Mili Atoll in 2003. The richest areas were the central pinnacles in<br />
the southern lagoon and the ocean area that is being considered for designation as a marine protected area<br />
(MPA). The number of fish species at each site varied from 95 to 162 with an average of 124 fishes. Rongelap<br />
Atoll had a total of 397 species with the richest area being the tip of Jabwan at Rongelap Island, on the main<br />
pass, where the highest fish species numbers were counted both in 2002 (179 species) and in 2003 (205 species).<br />
The number of fish species counted at each site during a single visit varied from 91 to 205. On average,<br />
sites harbored 124 species of fish.<br />
Passes generally support more species of fishes, since they combine aspects of outer and lagoonal habitats.<br />
Sheltered sites in the lagoon support lower fish abundances, but they harbor many unusual species. Humphead<br />
wrasses (Cheilinus undulatus) were observed in the eastern part of Rongelap Atoll, where they were<br />
found at the edge of the drop-off and on lagoon pinnacles near and in passes. They were slightly less abundant<br />
in Likiep, and least abundant in Mili Atoll.<br />
The after-effects of some of the 67 nuclear tests in the northern Marshalls between 1946-1958 on fish have<br />
also been studied. Noshkin and Robison (1997) summarized the results from all available data on the radionuclide<br />
concentrations in flesh samples of reef and pelagic fish collected from Bikini and Enewetak Atolls<br />
between 1964 and 1995. Although they found that 239 + 240Pu (plutonium) and 241Am (americium) had<br />
not significantly accumulated in the muscle tissue of any species of fish, a variety of other radionuclides had<br />
accumulated in all species of fish (Noshkin et al., 1986). Over the years, many of those radionuclides have<br />
diminished by radioactive decay and natural processes (Noshkin and Robison, 1997). The authors report that<br />
fish collected in the 1980s and 1990s show only low concentrations of a few remaining long-lived radionuclides.<br />
By the 1990s, 207Bi (bismuth) remained below detection limits in muscle tissue of all reef fish except<br />
goatfish. Levels of 137Cs (cesium) diminished to detection limits in mullet and goatfish at many islands, and<br />
60Co (cobalt) was undetected or at low concentrations.<br />
Giant clams (Tridacna spp.) are significantly more abundant at leeward ocean sites. Four species of giant<br />
clams were recorded for Mili, where the highest total number is found at the south pass. Five species were<br />
recorded in Rongelap, where the highest numbers were represented by Tridacna maxima at the west pass.
The State of Coral Reef Ecosystems of Marshall Islands<br />
Similarly, all five species of giant clam were recorded at pinnacles inside the lagoon. Sea urchins are most<br />
abundant at the windward ocean sites and relatively in low abundance elsewhere. Sea cucumbers are present<br />
in very high numbers on the lagoon side of the East Likiep Atoll.<br />
RMI atolls support substantial populations of megafauna such as green sea turtles, whales, rays, and sharks.<br />
A high number of sharks are often observed around RMI atolls, on the reef flat and slope, and inside and outside<br />
the lagoon. Every dive is accompanied by either gray reef sharks (Carcharhinus amblyrhynchos), the<br />
most abundant species overall, or white tip sharks (Triaenodon obesus), and silvertip sharks (Carcharhinus<br />
albimarginatus) in deeper waters. Nurse sharks (Nebrius ferrugineus) appear to be rare and were only seen at<br />
three sites in Rongelap Atoll. A tiger shark was also observed by the main pass of this atoll, in shallow water.<br />
A few black tip sharks (Carcharhinus melanopterus) are also encountered, especially in shallow waters. Zebra<br />
sharks (Stegastoma varium) were seen in Rongelap and Namu atoll.<br />
Manta rays (Manta birostris) were spotted in Rongelap, including at patch reef sites inside the lagoon; and<br />
eagle rays (Aetobatus narinari) are frequent in Majuro, as well as in all outer atolls visited.<br />
CURRENT CONSERVATION MANAGEMENT ACTIVITIES<br />
The primary agencies involved in protecting coral reef ecosystems are MIMRA and RMI Environmental Protection<br />
Authority (RMI-EPA). In 2000, the National Biodiversity Strategy and Action Plan (NBSAP, http://www.<br />
biodiv.org/doc/world/mh/mh-nbsap-01-en.<strong>pdf</strong>, Accessed 01/25/05) and the National Biodiversity Report (NB-<br />
TRMI, 2000) were approved by the Cabinet. Both address the need for conservation and management of<br />
natural resources. The NBSAP recommends strengthening the concept of ‘mo’, a traditional system of taboo<br />
identifying certain areas as ‘pantries’ that could be harvested only periodically. The NBSAP also addressed<br />
the need for sustainable fishing practices and retention of local knowledge.<br />
The <strong>Marine</strong> Science Program at the CMI (MSP-CMI) is studying the status of marine resources to help each<br />
atoll population manage its resources and plan fishing and other activities in a sustainable manner, with the<br />
specific purpose of conserving particularly rich or threatened zones (Pinca, 2003a). The MSP-CMI collaborates<br />
with MIMRA, RMI-EPA, Marshall Islands Visitor Authority, and Ministry of Internal Affairs to design community-based<br />
fishery management plans (Pinca, 2003b). During the past outer atoll surveys, MSP-CMI, together<br />
with the Natural Resources Assessment Surveys (NRAS, http://www.nras-conservation.org, Accessed<br />
3/15/05) team, combined local marine survey expertise with international scientific expertise to conduct underwater<br />
surveys assessing reef health and fishing impacts.<br />
The need to protect Marshallese marine resources stems from both a precautionary effort to conserve pristine<br />
reefs and a direct demand from local fishers who report a decline in target species for both commercial and<br />
local use. Lower abundance of clams, fish, lobsters, and cowry shells have been reported by local populations<br />
from the outer atolls. <strong>Marine</strong> reserves and other management measures are still in their infancy, but several<br />
atolls (Jaluit, Arno, Likiep, Mili, and Rongelap) are spearheading this effort. Selection of conservation sites<br />
and practices is based on biodiversity and conservation theories. Ecological observations like the ones collected<br />
by NRAS indicate where healthy and productive ecosystems are, where conservation is more urgent<br />
and more efficient for repopulation of scarce species, and where the recruitment of important species takes<br />
place, since it is important to protect both nursery and spawning areas. To help identifying source and sink<br />
areas of propagules, a study that models the water circulation at Rongelap Atoll is underway (Peterson et al.,<br />
in review). The processes for MPA designation involve consulting with the community, identifying their expectations<br />
and preferences, and incorporating the results of research conducted by local and foreign scientists.<br />
Conservation will hopefully also help protect fishing grounds from illegal fishing operations. With outstanding<br />
diversity and coral cover, Likiep, Rongelap, and Mili Atolls provide refuge for a suite of marine organisms. Because<br />
of the difficulty of enforcing fishing regulations in remote locations, these atolls and other atolls such as<br />
Ailinginae, Bikini, and Jaluit are likely to experience illegal fishing.<br />
Sidebar<br />
Marshall Islands<br />
page<br />
383
Marshall Islands<br />
page<br />
384<br />
The State of Coral Reef Ecosystems of the Marshall Islands<br />
Proposed MPA sites near Likiep include Jeltonet (east of the atoll), Liklal (north), and Lukonor (west) on the<br />
ocean side. In Mili, the northeast area around Reiher’s Pass was proposed as a sanctuary by the community.<br />
In order to conserve the high biodiversity of this area, a reserve network in Mili Atoll has also been discussed.<br />
In Rongelap, Jabwan Point is recommended for sanctuary designation.<br />
OVERALL CONCLUSIONS AND RECOMMENDATIONS<br />
In general, the reefs of the Marshall Islands are in good condition. While the two atolls used for the nuclear<br />
testing program have experienced unique stresses, the reefs of the RMI as a whole have escaped the extensive<br />
damage seen in other parts of the world. Reefs surveyed at various locations in 2001, 2002, and 2003<br />
were found to be in a very healthy condition, with a large number of fish, healthy corals, and algae. One could<br />
argue that because no humans inhabit atolls affected directly or indirectly by nuclear testing, the reefs at these<br />
atolls have recovered to support seemingly natural equilibrium populations that largely remain unexploited to<br />
date. Abundant megafauna such as sea turtles, whales, rays, and Napoleon wrasses were also recorded.<br />
Training for local personnel to manage and monitor the reef areas is essential to the success of any community-based<br />
solution to conservation and sustainable development. Training and capacity building activities<br />
for local people are being undertaken at CMI, and conservation and management workshops are planned for<br />
the future. Local inhabitants are demonstrating interest in becoming park rangers and are requesting specific<br />
training. A certificate program in marine resource management, which includes reef ecology and monitoring<br />
techniques, was offered by RMI in 2004 and will be replicated in <strong>2005</strong>.
REFERENCES<br />
The State of Coral Reef Ecosystems of Marshall Islands<br />
AAA Engineering and Drafting Inc. and University of Hawaii Sea Grant College Program. 1989a. Kwajalein Atoll Coastal<br />
Resource Atlas. U.S. Army Corps of Engineers, Pacific Ocean Division, Honolulu. 123 pp.<br />
AAA Engineering and Drafting Inc., University of Hawaii Sea Grant College Program and Environmental Resources Program.<br />
1989b. Arno Atoll Coastal Resource Inventory. U.S. Army Corps of Engineers, Pacific Ocean Division, Honolulu.<br />
41 pp.<br />
Beger, M. and S. Pinca. 2003a. Coral reef biodiversity community-based assessment and conservation planning in the<br />
Marshall Islands: Baseline surveys, capacity building and natural protection and management of coral reefs of the atolls<br />
of Rongelap and Mili. Final Report to National Fishery and Wildlife Foundation.<br />
Beger, M. and S. Pinca. 2003b. Surveying Coral Reefs to help establish <strong>Marine</strong> Reserves in the Marshall Islands. Australian<br />
Ecological Society Newsletter.<br />
Beger, M., S. Pinca, G. Trimble and A. Suzumoto. 2003. Where did all the fish go at Bikini Atoll? Species diversity, habitat<br />
choice and assemblage rules for coral reef fishes after 50 years undisturbed existence. Abstract. In: Australian Coral Reef<br />
Society, 80th Annual Conference, Understanding and Protecting Coral Reefs.<br />
Crisostoma, Y.N. 2000. Convention on Climate Change. Initial communication under the United Nations framework.<br />
Delgado, J.D. 1999. Ghost Fleet: The Sunken Ships of Bikini Atoll. University of Hawaii Press, Honolulu. 204 pp.<br />
Devaney, D.M., E.S. Reese, B.L. Burch and P. Helfrich (eds.). 1987. The Natural History of Enewetak Atoll (2 volumes).<br />
Report no. DOE/EV/007-03-TI. U.S. Department of Energy, Washington, DC.<br />
Emery, K.O., J.I. Tracey and H.S. Ladd. 1954. Geology of Bikini and Nearby Atolls. U.S. Geological Survey (USGS) Professional<br />
Paper 260-A. Washington, DC.<br />
Hiatt, R.W. 1950. <strong>Marine</strong> and zoology study of Arno Atoll, Marshall Islands. Atoll Research Bulletin 4: 1-13.<br />
Kenchington, R.A. and B. Salvat. 1988. Man’s threat to coral reefs. In: Coral Reef Management Handbook, Unesco Regional<br />
Office for Science and Technology for Southeast Asia. UNESCO, New York.<br />
Ladd, H.S., J.I. Tracey, J.W. Wells and K.O. Emery. 1950. Organic growth and sedimentation on an atoll. Journal of Geology<br />
58 (4): 410-425.<br />
Manoa Mapworks, University of Hawaii Sea Grant Extension Service and Honolulu Engineer District Environmental<br />
Resources Section. 1989. Majro Atoll Coastal Resource Atlas. U.S. Army Corps of Engineers, Pacific Ocean Division,<br />
Honolulu. 53 pp.<br />
Maragos, J.E. 1993. Impact of coastal construction on coral reefs in the U.S.-Affiliated Pacific Islands. Coastal Management<br />
21: 235-369.<br />
Maragos, J.E. 1994. Description of the reefs and corals for the 1988 protected area survey of the northern Marshall Islands.<br />
Atoll Research Bulletin 419: 1-88.<br />
Maragos, J.E. 2004. U.S. Fish and Wildlife Service, Honolulu. Personal communication.<br />
NBTRMI (National Biodiversity Team of the Republic of the Marshall Islands). 2000. The Marshall Islands – Living Atolls<br />
Amidst the Living Sea. National Biodiversity Report. Government of the Marshall Islands. 201 pp.<br />
Niederthal, J. 2001. For the Good of Mankind: A History of the People of Bikini and Their Islands. Microniter/Bravo Publishers.<br />
300 pp.<br />
Noshkin, V.E., K.M. Wong, R.J. Eagle, T.A. Jokela and J.A. Brunk. 1986. Concentrations of Radionuclides in Fish collected<br />
from Bikini Atoll Between 1977 and 1984. U.S. Department of Energy. 56 pp.<br />
Noshkin, V.E. and W.L. Robison. 1997. Assessment of a radioactive waste disposal site at Enewetak Atoll Health Physics<br />
73 (1): 234-247.<br />
Peterson E.L., M. Beger and S. Pinca. In review. Three dimensional model of atoll hydrodynamics. In: M. HuHang (ed.)<br />
Proceedings of the 10th International Coral Reef Symposium. Japanese Coral Reef Society, Okinawa.<br />
Sidebar<br />
Marshall Islands<br />
page<br />
385
Marshall Islands<br />
page<br />
386<br />
The State of Coral Reef Ecosystems of the Marshall Islands<br />
Pinca, S. 2001. <strong>Marine</strong> Resources Assessment: Likiep Atoll 2001, final report. Marshall Islands <strong>Marine</strong> Resources Authority,<br />
Republic of the Marshall Islands.<br />
Pinca, S., M. Beger, E. Peterson, Z. Richards and E. Reeves. 2002. Coral reef biodiversity community-based assessment<br />
and conservation planning in the Marshall Islands: baseline surveys, capacity building and natural protection and<br />
management of coral reefs of the atoll of Rongelap. Rongelap Atoll Local Government.<br />
Pinca, S. 2003a. Experiment of community-based conservation in the Marshall Islands. In: Proceedings, International<br />
Tropical <strong>Marine</strong> Ecosystems Management Symposium.<br />
Pinca, S. 2003b. Marshall Islands surveys to support a national effort towards reef conservation. SPC Women in Fisheries<br />
Information Bulletin 13.<br />
Pinca, S., M. Beger and A. Hengeveld. (eds.). 2004a. NRAS-Conservation. Mili Atoll <strong>Marine</strong> Surveys.<br />
Pinca, S., M. Beger and A. Hengeveld. (eds.). 2004b. NRAS-Conservation. Rongelap Atoll <strong>Marine</strong> Surveys.<br />
Richards, Z.T. and C.C. Wallace. 2004. Acropora rongelapensis sp. nov., a new species of Acropora from the Marshall<br />
Islands (Scleractinia: Astrocoeniina: Acroporidae). Zootaxa 590: 1-5.<br />
Robison, W.L. and V.E. Noshkin. 1999. Radionuclide characterization and associated dose from long-lived radionuclides<br />
in close-in fallout delivered to the marine environment at Bikini and Enewetak Atolls. Science of the Total Environment<br />
238: 311-327.<br />
Simon, S.L. 1997. A brief history of people and events related to atomic weapons testing in the Marshall Islands. Health<br />
Physics 73 (6): 962.<br />
South Pacific Regional Environmental Program (SPREP). 1989. Report on the SPC/UNDPP/ASPEI Intergovernmental<br />
Meeting on Climatic Change and Sea Level Rise in the South Pacific, Majuro, Marshall Islands, July 17-20, 1989. SPREP,<br />
Noumea, New Caledonia.<br />
Thomas, P.E.J., F.R. Fosberg, L.S. Hamilton, D.R. Herbst, J.O. Juvik, J.E. Maragos, J.J. Naughton and C.F. Streck. 1988.<br />
The Northern Marshall Islands Natural Diversity and Protected Area Survey. East-West Center and the South Pacific<br />
Regional Environment Programme, Noumea, New Caledonia. East West Center, Honolulu. 133 pp.<br />
Titgen, R.H., A.M. Orcutt and P.J. Rappa. 1988. <strong>Marine</strong> Environmental Assessment Report on United States Army Leased<br />
Islands at Kwajalein Atoll. NOAA Grant NA85AA-D-SG082. U.S. Army Corps of Engineers, Pacific Ocean Division, Honolulu.<br />
266 pp.<br />
Tracey, J.E. Jr., H.S. Ladd and J.E. Hoffmeister. 1948. Reefs of Bikini, Marshall Islands. Bulletin of the Geologic Society<br />
of America 59: 861-878.<br />
Vander Velde, N. National Biodiversity Team of the Republic of the Marshall Islands. Majuro, Marshall Islands. Personal<br />
communication.<br />
Walker, R.B., S.P. Gessel, and E.E. Held. 1997. The ecosystem study of Rongelap Atoll. Health Physics 73 (1): 223-<br />
233.<br />
Wells, J.W. 1951. The coral reefs of Arno Atoll, Marshall Islands. Atoll Research Bulletin 5: 1-56.<br />
Wells, J.W. 1954. Recent Corals of the Marshall Islands, Bikini and Nearby Atolls, Part 2, Oceanography (Biologic). pp.<br />
385- 486 + plates 94-187. In: U.S. Geological Survey Professional Paper 260-i. U.S. Government Printing Office, Washington,<br />
D.C.<br />
Willis, B. 2004. James Cook University, Townsville, Australia. Personal communication.
The State of Coral Reef Ecosystems of the<br />
Federated States of Micronesia<br />
Mike Hasurmai 1 , Eugene Joseph 2 , Steve Palik 3 , Kerat Rikim 4<br />
INTRODUCTION AND SETTING<br />
From east to west, the Freely Associated States include the Republic of the Marshall Islands (RMI), the Federated<br />
States of Micronesia (FSM), and the Republic of Palau. The FSM and Palau are known as the Caroline<br />
Islands, which span 2,500 km and are among the longest island chains in the world. All of these Micronesian<br />
islands were formerly a part of the Trust Territory of the Pacific Islands administered by the United States after<br />
World War II (WWII). All three countries achieved independence within the past 25 years but retain close<br />
economic and strategic ties to the U.S. (Hezel, 1995). Although the process was initiated as early as 1979,<br />
the Compact of Free Association between the U.S. and the RMI and FSM did not go into effect until 1986; the<br />
Compact of Free Association between the U.S. and the Republic of Guam was effective in 1995.<br />
The FSM is comprised of four states, from east to west; Kosrae, Pohnpei, Chuuk, and Yap (Figure 14.1). Each<br />
island or group has its own language, customs, local government, and traditional system for managing marine<br />
resources. The FSM has both high islands and atolls, and islanders have a strong dependence on coral reefs<br />
and marine resources, both economically and culturally. The islands support three basic reef formations:<br />
fringing reefs, barrier reefs, and atolls, which correspond to the stage of reef development at each island.<br />
Kosrae is a single volcanic island with a land mass of 109 km 2 and a maximum elevation of 629 m. It is among<br />
the least developed of the U.S. Territories and Freely Associated States, with approximately 7,700 people<br />
residing there. Kosrae is surrounded by a fringing reef and has a single harbor. In areas where the reef flat<br />
is wide, there are a number of large solution holes, some of which support extensive coral development. The<br />
reef is narrow along the east and south coasts, but wide enough along the west and north coasts to nearly be<br />
considered a barrier reef. The island is surrounded by coastal mangrove forest and extensive fringing reefs.<br />
Kosrae’s reefs and mangroves are considered some of the healthiest in Micronesia and support a small but<br />
growing diving and ecotourism industry (currently about 1000 visitors per year). However, recent coastal development<br />
and land use patterns have resulted in coastal erosion and degradation of the coastal mangrove<br />
ecosystem, placing the health of Kosrae’s reefs at risk.<br />
The volcanic island of Pohnpei, the site of the FSM capital, is the largest island in the FSM (345 km 2 ) and along<br />
with eight smaller island and atolls, makes up the state of Pohnpei. Pohnpei Island has a well-developed<br />
barrier reef and associated lagoon.<br />
Chuuk State (formerly known as Truk) is made up of 15 inhabited islands and atolls, and is famous for the<br />
Japanese wrecks that were sunk in the lagoon during WWII. Chuuk Lagoon is the largest atoll in the FSM and<br />
serves as the population and political center of Chuuk State.<br />
Yap State has a main island with a land area of approximately 100 km 2 , and includes an additional 15 islands<br />
and atolls. The lifestyle of Yap islanders is among the most traditional in the FSM, with a highly sophisticated<br />
marine tenure and marine resource management system.<br />
1 Yap <strong>Marine</strong> Resource Management Division<br />
2 Conservation Society of Pohnpei<br />
3 Kosrae Fisheries Department<br />
4 Chuuk Department of <strong>Marine</strong> Resources<br />
Sidebar<br />
Federated States of Micronesia<br />
page<br />
387
Federated States of Micronesia<br />
page<br />
388<br />
Figure 14.1. Locator map for the Federated States of Micronesia. Map: A. Shapiro.
ENVIRONMENTAL AND ANTHROPOGENIC STRESSORS<br />
The State of Coral Reef Ecosystems of the Federated States of Micronesia<br />
Climate Change and Coral Bleaching<br />
There have been a few cases of localized bleaching in some areas around Pohnpei’s lagoon but these have<br />
been associated with unusually heavy rain events.<br />
Diseases<br />
No information on this threat is available.<br />
Tropical Storms<br />
Tropical storms frequently pass through or near the FSM (Figure 14.2). In 1990, a destructive typhoon passed<br />
over remote reefs in Pohnpei State (Holthus et al., 1993). Large waves at Minto Reef caused massive coral<br />
heads to be transported from the lagoon to the reef flat, killing a variety of associated wildlife. In early 2004,<br />
another large destructive typhoon passed by Chuuk and Yap, causing structural damage to reef areas.<br />
Coastal Development and Runoff<br />
Figure 14.2. The path and intensity of typhoons passing near the FSM from 1979-2004. Many Pacific typhoons are not named or the<br />
names are not recorded in the typhoon database. Map: A Shapiro. Data: Unisys, http://weather.unisys.com/hurricane.<br />
The population of the FSM has increased in the past several decades (Figure 14.3), with 50% of the population<br />
residing in Chuuk State (FSM Division of Statistics, 2002). By 2000, the average population density reached<br />
395 persons per mi 2 in 2000 (FSM Division of Statistics, 2002). However, since the signing of the Compact<br />
of Free Association with the U.S. in 1986, the effect of the population increase has been mitigated by emigration<br />
of Micronesians to pursue education and employment opportunities in U.S. states and territories. Guam,<br />
Hawaii, and the Commonwealth of the Northern Mariana Islands (CNMI), and are the primary destinations for<br />
Micronesians who leave to live and work abroad.<br />
Sidebar<br />
Federated States of Micronesia<br />
page<br />
389
Federated States of Micronesia<br />
page<br />
390<br />
The State of Coral Reef Ecosystems of the Federated States of Micronesia<br />
Reefs in Kosrae have been impacted<br />
by coastal development, and one of<br />
the most noteworthy projects was the<br />
construction of the airport on the reef<br />
flat at Okat. Sedimentation, caused<br />
by dredging and road construction<br />
projects, has resulted in the destruction<br />
of reefs in Okat and Lelu (M.<br />
Tupper, pers. comm.). A new road<br />
is being constructed to connect the<br />
villages of Utwe and Walung on the<br />
south coast, and this will likely lead to<br />
increased soil erosion and sedimentation<br />
in the Utwe-Walung <strong>Marine</strong> Park.<br />
A large solution hole in Lelu, named<br />
“the Blue Hole”, is a popular snorkel<br />
and dive site, but has been impacted<br />
by the construction of a causeway<br />
across the lagoon to Lelu village. The<br />
Blue Hole now suffers from high turbidity<br />
and macroalgal overgrowth (M.<br />
Tupper, pers. comm.).<br />
Figure 14.3. Human population growth in the FSM, 1973-2000. Slightly more than<br />
half of the population resides in the islands of Chuuk State. Source: FSM Division of<br />
Statistics, 2004.<br />
Coastal Pollution<br />
Increased population is a concern for the future of some islands as they come to terms with the need for associated<br />
infrastructure, including sewage treatment plants and waste disposal facilities.<br />
Tourism and Recreation<br />
Tourism and recreation have increased in the FSM, with a peak in visitor arrivals of 20,501 in 2000 (FSM Division<br />
of Statistics, 2004). According to the FSM Division of Statistics, total international visitors to FSM in 2003<br />
was 18,168 people. Approximately 72% of visitors were citizens of the U.S. (41%) or Japan (31%).<br />
The FSM Visitors Board maintains an informative and attractive website (FSM Visitors Board, http://www.visitfsm.org,<br />
Accessed 1/31/05) to help guide potential visitors to the country and has established Visitors Bureau<br />
offices in each state. Overseas tourism offices are co-located with Embassy or Consul offices in Guam, Honolulu,<br />
Tokyo, Fiji, and Washington, D.C.<br />
Each of the four states in the FSM have deep draft harbors and modern jet airfields served by Continental<br />
Airlines, a major U.S. carrier. A range of accomodations, from simple traditional huts to fancy hotels and luxury<br />
resorts, can be found in each state with online booking often available. In addition, three live aboard dive<br />
vessels are offering cruises in Chuuk in <strong>2005</strong>. Diving is one of the most popular activities for visitors who are<br />
drawn to the abundant marine life in the FSM and the numerous planes and ships that were sunk, especially<br />
in Chuuk Lagoon, during WWII.
Fishing<br />
Commercial fishing in the FSM is focused<br />
primarily on the offshore tuna<br />
and billfish stocks, which contribute<br />
$14-24 million to the national government<br />
annually from the sale of fishing<br />
rights to foreign vessels (FSM<br />
Division of Statistics, 2004). In addition,<br />
the value of exports of marine<br />
products in 2002 was over $9 million,<br />
which represents a decrease of about<br />
25% over the export value in the previous<br />
two years. Only a fraction of<br />
this total value is represented by reef<br />
fish (1.2% or less) and other inshore<br />
species (Figure 14.4); the majority of<br />
reef-associated products exported for<br />
sale originate in Chuuk (Figure 14.5).<br />
The commercial fishing industry employed<br />
between 280 and 340 people<br />
per year between 1999 and 2002<br />
(FSM Division of Statistics, 2004).<br />
Reef fish species are primarily exploited<br />
for subsistence purposes, but<br />
little information exists to characterize<br />
subsistence or artisinal catch by<br />
species or method of capture. The<br />
FSM Division of Statistics reports that<br />
of total GDP, approximately one-third<br />
can be attributed to subsistence activities<br />
such as fishing, agriculture,<br />
and copra production (FSM Division<br />
of Statistics, 2004), so it is likely that<br />
the harvest of reef-associated organisms<br />
is substantial. There have<br />
been numerous anecdotal reports of<br />
destructive fishing practices in the<br />
past, but little published information<br />
is available.<br />
Trade in Coral and Live Reef Species<br />
No information on this threat is available.<br />
The State of Coral Reef Ecosystems of the Federated States of Micronesia<br />
Figure 14.4. Fisheries resources contribute siignificantly to FSM exports, though<br />
only a small fraction are from reef fish. Source: FSM Division of Statistics, 2004.<br />
Figure 14.5. The majority of exports of reef fish and other reef-associated species<br />
originates in Chuuk. Source: FSM Division of Statistics, 2004.<br />
Ships, Boats, and Groundings<br />
Ship groundings have been a problem for both the high islands and atolls in the FSM. Foreign long-line vessels<br />
have been abandoned on numerous FSM reefs, and virtually no funds are available to clean up associated<br />
oil spills or remove the ships. Large shipping vessels have also run aground, most recently in Satawal,<br />
Yap and on the island of Pohnpei. Maragos and Fagolimul (1996) reported extensive direct (13,000 m 2 ) and<br />
indirect (300,000 m 2 ) impacts of the 1994 grounding and subsequent removal of a large freighter from a reef<br />
Sidebar<br />
Federated States of Micronesia<br />
page<br />
391
Federated States of Micronesia<br />
page<br />
392<br />
The State of Coral Reef Ecosystems of the Federated States of Micronesia<br />
at Satawal Island, Yap. Sediments generated by the erosion at the reef site migrated to other reef areas more<br />
than a kilometer away, smothering corals, burying reef flats, creating new beaches on the island, and damaging<br />
reef life in a fish reserve. The people of Satawal reached an out-of-court settlement with the ship owners<br />
for more than $2 million (J.E. Maragos, pers. comm.).<br />
<strong>Marine</strong> Debris<br />
No information on this threat is available.<br />
Aquatic Invasive Species<br />
No information on this threat is available.<br />
Security Training Activities<br />
No information on this threat is available.<br />
Offshore Oil and Gas Exploration<br />
No information on this threat is available.<br />
<strong>CORAL</strong> <strong>REEF</strong> ECOSYSTEMS—DATA GATHERING ACTIVITIES AND RESOURCE CONDITION<br />
The Government of the FSM has two regulatory agencies that manage coral reef ecosystems. Each state has<br />
a <strong>Marine</strong> Resources Management office and an Environmental Protection Agency (EPA) office. Cooperation<br />
among regional institutions, formalized under the <strong>Marine</strong> Resources Pacific Consortium and funded by the<br />
U.S. Department of the Interior, is intended to increase the local and regional capacity for assessment and<br />
monitoring. In addition, the College of Micronesia-FSM has faculty and staff trained in marine resource assessment<br />
and monitoring. Non-governmental organizations (NGOs)active in the FSM, such as The Nature<br />
Conservancy, offer technical and financial assistance for reef-related programs. The Conservation Society<br />
of Pohnpei (CSP) is playing a large role in spearheading the development of a statewide coral reef monitoring<br />
program and promoting public awareness programs. CSP also assists local communities in designating<br />
and monitoring local marine protected areas. The Peace Corps has a presence in the FSM, and some of its<br />
volunteers have been involved in monitoring programs.<br />
WATER QUALITY<br />
Kosrae is a steep volcanic island with high annual rainfall. Erosion and sedimentation are problems wherever<br />
land clearing and road construction activities occur. Turbidity is quite high in Okat, Utwe Bay, and Lelu Harbor,<br />
particularly in the vicinity of streams and river mouths. Dredging in Okat also periodically increases turbidity in<br />
the area. However, pollutants such as pesticides and fertilizers do not appear to have a large impact.<br />
Students from Xavier High School in Chuuk, in conjunction with the Chuuk State EPA, surveyed the water<br />
quality of Chuuk Lagoon from 1998-2000. Water quality testing included measurements of water clarity, temperature,<br />
turbidity, salinity, pH, dissolved oxygen, and coliform bacteria counts. Although the water quality<br />
data collected in Chuuk Lagoon was not available for inclusion in this reporting effort, more information about<br />
the students’ monitoring efforts can be found at: http://www.xaviermicronesia.org (Accessed 02/02/05).
The State of Coral Reef Ecosystems of the Federated States of Micronesia<br />
BENTHIC HABITATS<br />
Coral reef biodiversity and complexity is high within the reefs of the FSM and this diversity decreases in scale<br />
from west to east away from the center of marine diversity in Southeast Asia. It is estimated that the FSM has<br />
more than 300 species of corals (200 in Yap, 300 in Chuuk, 200 in Pohnpei, and 150 in Kosrae). A total of 143<br />
species of algae were reported from Yap. In Pohnpei, the most recent report documented 74 species of algae.<br />
FSM has 14 documented species of mangroves.<br />
<strong>Marine</strong> Resource Monitoring in<br />
Kosrae<br />
In Kosrae, the status of the reefs is<br />
monitored annually by the Kosrae<br />
Conservation and Safety Organization<br />
(KCSO), a local NGO, to detect<br />
changes in benthic cover and fish<br />
abundance.<br />
Methods<br />
Reef Check methods and protocols<br />
are used by the government agencies<br />
in Kosrae to carry out monitoring.<br />
Details on the Reef Check methods<br />
can be found at:<br />
http://www.reefcheck.org.<br />
Results and Discussion<br />
Kosrae’s coral reefs are generally<br />
in good to excellent condition, but<br />
some reefs have been impacted by<br />
coastal development. Unregulated<br />
mangrove clearing over the past two<br />
decades has resulted in shoreline<br />
erosion all along the coast and has<br />
caused sedimentation to occur on<br />
the adjacent reef flats and seagrass<br />
beds. Data has been collected annually<br />
from five permanent monitoring<br />
sites around the island for the past<br />
three years (Figure 14.6). Surveys<br />
conducted within and adjacent to the<br />
Utwe-Walung <strong>Marine</strong> Park indicated<br />
healthy coral cover, ranging from<br />
80% at Hiroshi Point to 50% at the<br />
mouth of Utwe Bay. In contrast, live<br />
coral cover around the airport at Okat<br />
was less than 10% (M. Tupper, pers.<br />
comm.).<br />
Data on hard coral cover were collected<br />
at five monitoring sites around<br />
Kosrae by University of Guam scientist,<br />
Laurie Raymundo, and are<br />
presented in Figure 4.7. From left<br />
to right, the bars correspond to sites<br />
near Malem Reef Shelf, Hiroshi<br />
Figure 14.6. Locator map of monitoring sites and mooring buoys around Kosrae.<br />
Map: A. Shapiro. Data: Palau International Coral Reef Center, unpublished data.<br />
Figure 14.7. Percent cover of hard coral at Kosrae monitoring sites in 2002 at 10 m<br />
depth. Source: L. Raymundo, unpublished data.<br />
Sidebar<br />
Federated States of Micronesia<br />
page<br />
393
Federated States of Micronesia<br />
page<br />
394<br />
The State of Coral Reef Ecosystems of the Federated States of Micronesia<br />
Point, Walung Drop-off, Shark Island,<br />
and the Trochus Sanctuary, which is<br />
located near the airport on the northwest<br />
coast.<br />
Conservation Society of Pohnpei<br />
(CSP) <strong>Marine</strong> Resource Monitoring<br />
The CSP has been conducting monitoring<br />
activities in Pohnpei since<br />
2001. This program monitors has<br />
several ecosystem components: 1)<br />
grouper spawning aggregations; 2)<br />
MPA effectiveness; and 3) changes<br />
in benthic communities over time.<br />
Methods<br />
The Australian Institute of <strong>Marine</strong> Science<br />
(AIMS) line-intercept method<br />
was used to record benthic communities<br />
at monitoring sites. At four of<br />
the MPA sites (Figure 14.8), 50 m<br />
belt-transects were used to assess<br />
fish and invertebrate abundance.<br />
The monitoring of the large grouper<br />
aggregations occurs during the peak<br />
spawning seasons during the first<br />
half of the year. They are monitored<br />
from 10 m to 30 m depths over several<br />
days each month in the spawning<br />
season.<br />
Results and Discussion<br />
The reefs around the island of Pohnpei<br />
vary in condition. Surveys performed<br />
adjacent to Sokehs Channel<br />
after a ship grounding found the average<br />
coral cover above 20%, and limited<br />
surveys around the main island<br />
show coral cover ranging from 10%<br />
to more than 80% at selected monitoring<br />
sites (Figure 14.9). Due to high<br />
annual rainfall and steep volcanic topography,<br />
erosion and sedimentation<br />
rates can be high. Upland clearing of<br />
forested areas to grow sakau (kava)<br />
has resulted in landslides and other<br />
impacts to coastal villages and resources.<br />
Figure 14.8. Several MPAs have been established in coastal areas of Pohnpei.<br />
Map: A. Shapiro. Source: Conservation Society of Pohnpei, unpublished map.<br />
Figure 14.9. Limited surveys conducted at 3 m and 10 m sites around Pohnpei found<br />
hard coral cover percentages ranging from about 10% to 80%. Source: Conservation<br />
Society of Pohnpei, unpublished data.
The State of Coral Reef Ecosystems of the Federated States of Micronesia<br />
Chuuk<br />
The coral cover in Chuuk is indicative of generally high water quality, although overfishing has been observed<br />
as a result of foreign commercial activities. Destructive fishing practices, including the use of explosives<br />
taken from the wrecks, have caused localized damage in certain areas. Surveys conducted in 1998 at two<br />
sites showed that hard coral cover averaged around 25% on inshore reefs. Typhoon events in 2002 and 2003<br />
caused structural damage to large sections of coral reefs, particularly in the lagoons.<br />
Yap<br />
Surveys of 18 sites around the island of Yap conducted in 1995 and repeated 16 months later found mean<br />
coral cover at 28.8% and 28.7% respectively (Richmond, 1997), even though a typhoon hit the island between<br />
surveys. Crustose coralline algae was also abundant on the reefs. Typhoon Sudal hit Yap in April 2004 causing<br />
widespread damage on the island as well as on the adjacent reefs. The potential damage to coral reefs in<br />
Yap has not yet been quantified.<br />
FSM is increasing coral reef ecosystem monitoring efforts, focusing on coral cover, commercially important<br />
fish abundance, and the occurrence of reef fish spawning aggregations. The capacity to monitor coral reefs<br />
has improved since the 2002 status report (Turgeon et al., 2002). Since that time, all state marine resource<br />
agencies have received training in monitoring reef fish spawning aggregations and efforts are currently underway<br />
to identify and monitor any existing large aggregations of commercially important reef fish species.<br />
Kosrae State is continuing its annual coral reef monitoring program examining benthic cover and fish populations.<br />
In Pohnpei State, governmental and private environmental organizations have collaborated to develop<br />
a statewide coral reef monitoring program focusing on four permanent sites.<br />
ASSOCIATED BIOLOGICAL COMMUNITIES<br />
Recent surveys were undertaken by the Kosrae Fisheries Department to assess stocks of bumphead parrotfish,<br />
humphead wrasse, and groupers. Bumphead parrotfish, in particular, were once very important to<br />
Kosraean fisheries, but have since declined. The results of this survey were very disturbing. Not one commercially<br />
valuable grouper of any species was seen in 75 dives (M. Tupper, pers. comm.). This includes the<br />
squaretail coral grouper (Plectropomus areolatus) and camouflage grouper (Epinephelus polyphekadion).<br />
These species are known to form spawning aggregations at Kosrae, but much deeper than elsewhere in Micronesia<br />
(i.e., 100-120 m as opposed to 40 m in Pohnpei or 10-15 m in Palau). However, no catches of these<br />
species were recorded in the Kosrae reef fishery this year. The survey also recorded only three bumphead<br />
parrotfish and seven humphead wrasse in 75 dives. When interviewed, fishers suggested that Taiwanese<br />
and Hong Kong long-liners have been fishing the shelf edge illegally at night and have removed most of the<br />
groupers, humphead wrasse, and bumphead parrotfish. Unfortunately, fisheries officers could not confirm or<br />
deny this. Healthy spawning aggregations of snappers, surgeonfishes, and rabbitfishes are still known to occur<br />
at Kosrae.<br />
Over 1,000 species of fish and over 1,200 species of mollusks are thought to be found in the FSM. 873 of<br />
the 1,125 marine fish species recorded for the FSM are reef-associated (FishBase, 2002). Overall catch and<br />
export data are limited, but some market information suggests the scale of the fisheries operation may be<br />
substantial. While commercial export has the greatest impact on FSM fisheries, overfishing by foreign vessels<br />
has also been documented. Yap and Kosrae have recently limited the export of reef organisms except<br />
for personal and family use, such as shipping coolers of fish to relatives on Guam and in the CNMI. Chuuk<br />
had the largest commercial export. Commercial export of fish and crab from Pohnpei occurred until a recent<br />
cholera outbreak caused it to shut down. Destructive fishing practices, including the use of explosives taken<br />
from the wrecks, have caused localized damage. Better quantitative assessments of fisheries resources<br />
within the FSM are needed.<br />
Sidebar<br />
Federated States of Micronesia<br />
page<br />
395
Federated States of Micronesia<br />
page<br />
396<br />
The State of Coral Reef Ecosystems of the Federated States of Micronesia<br />
CURRENT CONSERVATION MANAGEMENT ACTIVITIES<br />
Over the past several years, Kosrae has begun to develop a MPA program that involves co-management of<br />
coastal resources between local communities and state resource management agencies. Non-governmental<br />
organizations active in Kosrae include the Peace Corps and KCSO.<br />
Kosrae has an extensive system of 54 mooring buoys around the island (Figure 14.6) designed to minimize<br />
anchor damage to corals at popular dive sites. Currently, Kosrae has four MPAs that are managed by government<br />
agencies and/or local communities. These are the Utwe-Walung <strong>Marine</strong> Park and three Areas of Special<br />
Concern: the Tukasungai (Trochus niloticus) Sanctuary (commonly referred to as the “Trochus Sanctuary”),<br />
the Giant Clam (Tridacna spp.) Sanctuary, and the Okat-Yela Mangrove Reserve. The Utwe-Walung <strong>Marine</strong><br />
Park was created in 1996 to protect extensive mangrove and coral reef ecosystems along the undeveloped<br />
southern shore of Kosrae. The <strong>Marine</strong> Park is a community-based project managed by a Board of Directors<br />
that includes the park manager, private landowners, and directors and senior technical staff of several resource<br />
management agencies including the Kosrae Island Resource Management Program and Department<br />
of Land, Agriculture, and Fisheries-Division of <strong>Marine</strong> Resources. The Board is responsible for developing<br />
and revising the marine park management strategy, and plans to use the results of the community-based project<br />
to revise and improve the strategy. The stated objectives of the <strong>Marine</strong> Park are: to maintain and manage<br />
an area with ecologically valuable, undisturbed, and highly scenic features; to provide a variety of benefits,<br />
from the protection of natural habitat to enhancing the tourism and recreational appeal of Kosrae; and to provide<br />
opportunities for public education and scientific research.<br />
Limited traditional and subsistence<br />
harvesting activities are permitted<br />
within the <strong>Marine</strong> Park. The Trochus<br />
and Giant Clam Sanctuaries are legislated<br />
under Kosrae State Code and<br />
managed by government agencies.<br />
The objective of the sanctuaries is to<br />
protect species of Trochus and Tridacna<br />
from overfishing, in addition to<br />
preventing logging and coastal development<br />
along the sanctuary shorelines.<br />
Unfortunately, Kosrae’s MPAs<br />
are not strictly enforced, and surveys<br />
of reef fish and invertebrate biomass<br />
within and adjacent to protected areas<br />
show no difference in biomass of<br />
commercial species (Figure 14.10).<br />
Chiefs and other traditional leaders<br />
usually control protection of specific<br />
areas. In Yap, the villages own the<br />
Figure 14.10. Biomass of commercially valuable parrotfish and surgeonfish in MPAs<br />
and adjacent fished areas in Kosrae, FSM. Source: M. Tupper, unpublished data.<br />
reefs and have authority over resource use. A number of the islands have areas set aside for reef protection<br />
and limited resource extraction, but currently the FSM lacks the enforcement capacity to protect the MPAs (A.<br />
Edward, pers. comm.).
The State of Coral Reef Ecosystems of the Federated States of Micronesia<br />
OVERALL CONCLUSIONS AND RECOMMENDATIONS<br />
A number of conservation programs are in place for Kosrae’s reefs. Mapping of coastal reefs and reef resources<br />
is ongoing. Unfortunately, the Kosraean government does not possess extensive finances, manpower,<br />
or technical expertise. Thus, it is important that both institutional and community capacity be strengthened<br />
and integrated to ensure sound management of Kosrae’s coastal resources.<br />
The coral reefs of Kosrae are in relatively good condition, but the effects of land use practices and reef fishing<br />
are cause for concern. The greatest need for Kosrae is an integrated watershed management program<br />
that will address both terrestrial (pollution and habitat destruction) and marine (overfishing) issues. In order to<br />
meet this need, more funding and support for resource management agencies are necessary.<br />
Reef fisheries on some islands have been overexploited. Damaging blast fishery practices have been documented<br />
in Chuuk Lagoon as late as 1994 (J.E. Maragos, pers. comm.).<br />
Improved coordination of management activities among the states is recommended. Educational programs<br />
involving the community need to be expanded. Ship groundings need to be addressed at the state and national<br />
level, possibly requiring vessels to post bonds to cover any damage to the reefs. Additional support for<br />
the resource agencies is necessary if they are to meet their mandates.<br />
Sidebar<br />
Federated States of Micronesia<br />
page<br />
397
Federated States of Micronesia<br />
page<br />
398<br />
The State of Coral Reef Ecosystems of the Federated States of Micronesia<br />
REFERENCES<br />
Edward, A. College of Micronesia. Pohnpei, Federated States of Micronesia. Personal communication.<br />
FishBase. 2002. on-line FishBase: A Global Information System on Fishes. Available from the internet URL: http://www.<br />
fishbase.org.<br />
FSM (Federated States of Micronesia), Division of Statistics, Department of Economic Affairs. 2002. The FSM 2000 Census<br />
of Population and Housing, National Census Report. FSM National Government. Palikir, Pohnpei.<br />
FSM (Federated States of Micronesia), Division of Statistics, Department of Economic Affairs. 2004. Key Statistics for the<br />
FSM. Microsoft Excel workbook. Available from the internet URL: http://www.spc.int/prism/country/fm/stats/index.htm<br />
Hezel, F.X. 1995. Strangers in Their Own Land. University of Hawaii Press, Honolulu. 81 pp.<br />
Holthus, P.F., J.E. Maragos, J. Naughton, C. Dahl, D. David, A .Edward, M. Gawel and S. Liphei. 1993. Oroluk Atoll and<br />
Minto Reef Resource Survey. East West Center Program on the Environment. East West Center, Honolulu. 94 pp.<br />
Maragos, J.E. U.S. Fish and Wildlife Service, Honolulu. Personal communication.<br />
Maragos, J.E. and J.O. Fagolimul. 1996. Impact of the grounding and removal of the bulk carrier M/V Oceanus on the<br />
coastal resources of Satawal Island (Yap State, Federated States of Micronesia). Prepared for Paul, Johnson, Park, and<br />
Niles on behalf of the People of Satawal. East-West Center, Honolulu and the Environmental Protection Authority, Yap.<br />
23 pp.<br />
Richmond, R.H. 1997. Reproduction and recruitment in corals: critical links in the persistence of reefs. pp. 175 - 197. In:<br />
C.E. Birkeland (ed.) Life and Death of Coral Reefs. Chapman and Hall Publishers, New York.<br />
Tupper, M. Palau International Coral Reef Center. Koror, Palau. Personal communication.<br />
Turgeon, D.D., R.G. Asch, B.D. Causey, R.E. Dodge, W. Jaap, K. Banks, J. Delaney, B.D. Keller, R. Speiler, C.A. Matos,<br />
J.R. Garcia, E. Diaz, D. Catanzaro, C.S. Rogers, Z. Hillis-Starr, R. Nemeth, M. Taylor, G.P. Schmahl, M.W. Miller, D.A.<br />
Gulko, J.E. Maragos, A.M. Friedlander, C.L. Hunter, R.S. Brainard, P. Craig, R.H. Richond, G. Davis, J. Starmer, M. Trianni,<br />
P. Houk, C.E. Birkeland, A. Edward, Y. Golbuu, J. Gutierrez, N. Idechong, G. Paulay, A. Tafileichig and N. Vander<br />
Velde. 2002. The State of Coral Reef Ecosystems of the United States and Pacific Freely Associated States: 2002.<br />
National Oceanic and Atmospheric Administration/National Ocean Service/National Centers for Coastal Ocean Science,<br />
Silver Spring, MD. 265 pp.
The State of Coral Reef Ecosystems of the<br />
Commonwealth of the Northern Mariana Islands<br />
Edited by John Starmer 1<br />
Contributors: Clarissa Bearden 2 , Russell Brainard 3 , Tina de Cruz 4 , Ronald Hoeke 3,5 , Peter Houk 2 , Stephani Holzwarth 3,5 ,<br />
Steve Kolinski 6 , Joyce Miller 3,5 , Robert Schroeder 3,5 , John Starmer 1 , Molly Timmers 3,5 , Michael Trianni 4 , Peter Vroom 3,5<br />
INTRODUCTION AND SETTING<br />
The 290 km long Mariana Islands Archipelago encompasses 14 islands of the U.S. Commonwealth of the<br />
Northern Mariana Islands (CNMI), the U.S. Territory of Guam, and numerous offshore banks (Figure 15.1).<br />
From a geological perspective, the islands can be divided into two groups: a southern and a northern island<br />
arc region. Although the islands of the older southern arc, which includes Rota, Tinian, Saipan, and Farallon<br />
de Mendinilla (FDM), are volcanic in origin, they are nearly all covered with uplifted limestone derived from<br />
coral reefs. The West Mariana Ridge (WMR) is a series of seamounts, lying 145 to 170 km west of and parallel<br />
to the main island chains. Some of these mounts rise to within 13 m of the surface. The WMR is intermediate<br />
in age, as it is being younger than the southern island arc and older than the northern island arc. The southern<br />
arc islands have the oldest and most developed reefs in the CNMI, which are predominantly located along the<br />
western (leeward) sides. The majority of the CNMI’s residents live on Rota, Tinian, and Saipan, the capital.<br />
Southern Mariana Islands<br />
Rota is 117 km southwest of Saipan and 76 km north of Guam, is the southernmost island in the Mariana<br />
Island Chain (Figures 15.1 and 15.2). It has a land area of 85.5 km 2 and is approximately 17 km long and 5<br />
km wide. The principal communities are Sinapalo and SongSong. As Rota was neither developed extensively<br />
by the Japanese nor invaded during World War II (WWII), it still has much of its native vegetation. However,<br />
the island is becoming more of a tourist destination and development is increasing, which may impact the<br />
existing fringing reefs. Fringing reef surrounds the island and modern reef development is most significant on<br />
the northwest coast, west of Teteto Beach, and in the Sasanhaya Bay on the southwest coast. Continuous<br />
reef is found inside Sasanhaya Bay and an area along the western shore. Erosion along the Talakaya cliffline<br />
on the southern coast is causing sedimentation problems on adjacent reefs.<br />
Aguijan (Goat Island) is an uplifted limestone island with a land area of 7.3 km 2 (Figure 15.1). It is presently<br />
uninhabited, although it was populated during WWII. The island is now under the management of the Tinian<br />
Municipal Council. The neighboring islet, Naftan Rock, was used as a bombing target prior to the U.S. Navy’s<br />
use of FDM and unexploded ordnance remains in the surrounding waters. The island is now home to nesting<br />
seabirds. The reefs just off the northwest coast are the largest and most developed.<br />
Tinian, with a land area of 102 km 2 , lies 4.4 km south of Saipan, across the Saipan Channel (Figures 15.1 and<br />
15.2). The principal community is San Jose. Nearly two-thirds of Tinian is leased to the U.S. Military. Tinian’s<br />
coral reefs are more developed on the western side, most notably in the vicinity of the Tinian Harbor, an area<br />
likely to be negatively affected by future development.<br />
Saipan, the largest of the Northern Mariana Islands, has a land area of 122 km 2 and is approximately 20 km long<br />
and 9 km wide (Figures 15.1 and 15.2). The island consists of a volcanic core enveloped by younger coral reefderived<br />
limestone formations. The island has the most diverse types of coral reefs and associated habitats in<br />
the Commonwealth. A fringing and barrier reef system protects the majority of the beaches along the western<br />
and coastal plains. The western side of the island is the most populated and the coral reefs along these areas<br />
are negatively affected by human activity. Continuing sediment and nutrient pollution combined with sporadic<br />
stressors such as outbreaks of crown-of–thorns starfish (COTS) (Acanthaster planci) and temperature-induced<br />
bleaching affect many of Saipan’s western and southeastern reefs. Furthermore, coral habitat on two large<br />
1 Pacific <strong>Marine</strong> Resource Institute, Inc.<br />
2 CNMI, Division of Environmental Quality<br />
3 NOAA Fisheries, Pacific Islands Fisheries Science Center<br />
4 CNMI, Division of Fish and Wildlife<br />
5 University of Hawaii, Joint Institute for <strong>Marine</strong> and Atmospheric Research<br />
6 NOAA Fisheries, Pacific Islands Regional Office<br />
Sidebar<br />
Commonwealth of the Northern Marianas<br />
page<br />
399
Commonwealth of the Northern Marianas<br />
page<br />
400<br />
Figure 15.1. Locations in the CNMI mentioned in this chapter. Top left panel shows the spatial distribution of islands and banks in<br />
the chain; additional panels provide a closer view of the individual islands and banks. Map: A. Shapiro.
offshore banks (18 km x 22 km) in<br />
water depths between 30 m and 60<br />
m on the western side of Saipan are<br />
negatively affected by the anchorage<br />
of commercial and naval vessels.<br />
The State of Coral Reef Ecosystems of the Commonwealth of the Northern Marianas<br />
FDM is a steep-sided, raised limestone<br />
island with a land area of 0.8 km<br />
to that of the windward side of the island.<br />
2<br />
(Figure 15.1). The island supports<br />
one of the largest breeding colonies of<br />
Masked Boobies (Sula dactylatra) in<br />
the western Pacific along with several<br />
other species of seabirds. The island<br />
is surrounded by a fringing reef.<br />
Deeper habitat consists of pavement<br />
dotted with various sized boulders,<br />
some spur and groove formation, and<br />
sandy flats. A submerged platform<br />
reef with high coral cover exists off<br />
the center island lee. Shoal reefs,<br />
with a minimum depth of 6 m, occur<br />
approximately 1-2 km north of the<br />
northern tip of FDM. These reefs<br />
consist of complex channels and Figure 15.2. Detailed bathymetric map of Saipan, Tinian and Rota in the CNMI.<br />
Source: PIFSC-CRED, unpublished data.<br />
ridges with a biotic structure similar<br />
FDM is presently leased to the U.S. Military as a bombing range. A significant amount of controversy has<br />
arisen, especially in the past 10 years, with regard to the U.S. Navy’s use of this island. The effects of bombing<br />
are causing accelerated erosion of the landmass.<br />
A variety of fish species that have become uncommon around the populated islands of Saipan and Tinian are<br />
more abundant around FDM. Over 350 species of fish have been identified. In addition, survey teams have<br />
observed numerous sea turtles (including green and hawksbill) and numerous pods of whitebelly spinner<br />
dolphins. In addition, terrestrial wildlife surveys following military live-fire exercises have observed species of<br />
whale including Brydes, Sperm, and Humpback whales in the vicinity of FDM.<br />
Northern Mariana Islands<br />
Anatahan is a small volcanic island (32.4 km 2 ; Figures 15.1 and 15.4). Prior to this island’s eruption on May<br />
6, 2003, feral goats were creating severe erosion problems and the resulting sediment runoff was impacting<br />
the nearshore environment. A feral animal control program was started by the U.S. Fish and Wildlife Service<br />
(USFWS) and the Northern Island Mayor’s Office, with financial support from the U.S. Navy. Ash fallout from<br />
the 2003 eruption caused extensive damage to nearshore reef habitats, especially on the northern side (Figure<br />
15.3). Although all surveyed locations during the 2003 National Oceanic and Atmospheric Administration<br />
(NOAA) Marianas Research and Monitoring Program (MARAMP) cruise contained a layer of ash covering<br />
the substrate (Figure 15.3), portions of the south shore and southeastern corner had only a veneer layer.<br />
Anatahan provides a unique opportunity to observe recovery and development of reef communities over the<br />
next several decades.<br />
Sarigan is an uninhabited volcanic cone with a land area of 4.9 km 2 (Figures 15.1 and 15.4). Sarigan has<br />
experienced no terrestrial impacts since the removal of feral animals, although fishery resources continue to<br />
be harvested. Since the elimination of feral animals on this island (1997-1998), the vegetation has dramatically<br />
recovered, presumably reducing sediment runoff. According to the NOAA MARAMP towed-diver surveys,<br />
continuous reef areas along the east and south shores contained roughly 50% live coral cover. The MARAMP<br />
dive at Sarigan revealed a layer of sediment that had been deposited from the 2003 Anatahan eruption.<br />
Sidebar<br />
Commonwealth of the Northern Marianas<br />
page<br />
401
Commonwealth of the Northern Marianas<br />
page<br />
402<br />
The State of Coral Reef Ecosystems of the Commonwealth of the Northern Marianas<br />
Figure 15.3. Left panel shows Anatahan Volcano eruption, May 11, 2003. Photo: CNMI Emergency Management Office. Right panel<br />
shows an ash covered habitat at Anatahan. Photo: S. Holzwarth.<br />
Guguan has a land area of 4.1 km 2<br />
(Figure 15.1) and is an active volcano<br />
with two cones, one of which is dormant.<br />
It is protected from development by<br />
the CNMI Constitution as it has been<br />
declared a wildlife conservation area,<br />
with large seabird colonies of Sooty<br />
Terns (Sterna fuscata), Gray-backed<br />
Terns (S. lunata), Brown Noddies<br />
(Anous stolidus), Black Noddies (A.<br />
minutus), and Red-footed Boobies<br />
(Sula sula). The reef communities<br />
observed around most of Guguan are<br />
as well developed as any seen in the<br />
northern islands, except for Maug.<br />
Unlike the exposed southeast shores<br />
of other northern islands, Guguan’s<br />
southeast shore has developed reef<br />
communities.<br />
Alamagan, with a land area of 11.2<br />
km 2 , is an active volcano (Figure<br />
15.1). Feral pigs, goats, and cattle<br />
are causing extensive damage to<br />
terrestrial ecosystems (T. de Cruz,<br />
pers. obs.). These terrestrial effects<br />
are likely linked to the marine<br />
environment through runoff and<br />
sedimentation. The reef communities<br />
at Alamagan are noticeably less<br />
developed than those observed at<br />
Guguan Island, which lies only 26 km<br />
to the south.<br />
Pagan has a land area of 48.2 km 2<br />
Figure 15.4. Map showing the volcanic islands of Sarigan and Anatahan. Zealandia<br />
Bank is also shown approximately 20 km north of Sarigan Island. The bathymetry<br />
data are a combination of satellite bathymetry overlaid with EM300 multibeam bathymetry,<br />
collected aboard the R/V Thomas G. Thompson in 2003 and 2004. Source:<br />
R. Embley and NOAA Ocean Exploration.<br />
(Figure 15.1) and a volcanically active northern portion that is connected to a dormant southern portion by<br />
a narrow isthmus. A major eruption in 1981 caused the evacuation of residents and the ashfall negatively
The State of Coral Reef Ecosystems of the Commonwealth of the Northern Marianas<br />
affected reefs (Eldredge and Kropp, 1985). Continuing erosion of unconsolidated ash is having unknown<br />
effects on the near shore environment. Large numbers of feral pigs and cattle are present. Cattle have been<br />
observed walking on the eastern fringing reef flats (T. de Cruz, pers. obs.). Fish surveys conducted by the<br />
CNMI Division of Fish and Wildlife (DFW) in the late 1990s found the nearshore fish resources to be in good<br />
condition.<br />
Agrihan is a dormant volcanic cone, with a land area of 47.4 km 2 (Figure 15.1). The impact of feral goats and<br />
pigs is most evident on the eastern side of the island where resulting sedimentation and runoff is thought to<br />
have a significant effect on the marine environment. This is presently the only northern island that supports a<br />
permanent population, which currently stands at seven people.<br />
Ascuncion Island is an active volcanic cone and has a land area of 7.3 km 2 , which is protected from development<br />
by the CNMI Constitution, as it has been declared a wildlife conservation area (Figure 15.1). It is home to<br />
nesting colonies of Sooty and Gray-backed Terns (Sterna fuscata and S. lunata, respectively).<br />
Maug consists of three small islands (Higashi, Kita, and Nishi), with a total land area of 2.1 km 2 (Figure 15.1)<br />
surrounding a flooded caldera that is considered to be a dormant volcano (Figure 15.5). The presence of<br />
countless seabirds on the three pinnacles that form the island of Maug provides a steady source of nutrients<br />
and organic matter into the caldera waters (Embley, 2004).<br />
Maug is uninhabited and is protected from development by the CNMI Constitution. It has been declared<br />
a wildlife conservation area. Fisheries resources are currently harvested, although there has been some<br />
interest within the CNMI government to extend conservation to the coastal areas. Results from the 2003 and<br />
2004 NOAA surveys (MARAMP and Ring of Fire) show that Maug, with 73 species recorded, is the most coralrich<br />
island in the northern islands.<br />
Farallon de Pajaros (Uracas) is an active volcano, with a land area of 2.1 km 2 (Figures 15.1 and 15.5). A<br />
major eruption and lava flow in 1943 affected coastal habitats. Very steep, sloping, boulder habitats surround<br />
Uracas, but provide little suitable<br />
habitat for corals. The reef is most<br />
developed on the southwest (leeward)<br />
side. Uracas was found to have the<br />
highest density of large predatory fish<br />
in the northern islands based on the<br />
MARAMP surveys.<br />
Uracas is protected from development<br />
by the CNMI Constitution and has<br />
been declared a wildlife conservation<br />
area. Although Farallon de Pajaros<br />
translates to “the Island of Birds,” only<br />
those Terns and Noddies that can<br />
nest on bare lava have established<br />
colonies. Seabird colonies were last<br />
surveyed in 1992.<br />
Offshore Banks and Reefs<br />
Figure 15.5. NOAA Ship Oscar Elton Sette at Uracas Island during the MARAMP<br />
cruise in 2003. Photo: R. Schroeder.<br />
Tatsumi Reef<br />
Tatsumi Reef is a steep-sided, flat-topped submerged bank approximately 2 km southeast of southern Tinian<br />
Island and is oriented in a northeast to southwest alignment. It is approximately 5.5 km long by 2 km wide,<br />
with a small secondary peak about 1.5 km to the west-southwest (Figure 15.6). The shallowest point on<br />
Tatsumi is approximately 6 m. In 2003, Tatsumi was surveyed using multibeam sonar and the R/V Acoustic<br />
Habitat Investigator (AHI; Figure 15.6). Two towed-diver surveys during the NOAA MARAMP cruise showed<br />
Sidebar<br />
Commonwealth of the Northern Marianas<br />
page<br />
403
Commonwealth of the Northern Marianas<br />
page<br />
404<br />
The State of Coral Reef Ecosystems of the Commonwealth of the Northern Marianas<br />
Figure 15.6. Multibeam bathymetric map of Tatsumi Reef, (~2 km southeast of southern Tinian Island; left panel) and Marpi Bank (~28<br />
km north of Saipan; right panel). These field maps were created during the 2003 MARAMP surveys using R/V AHI. Source: PIFSC-<br />
CRED, unpublished data.<br />
carbonate pavement to be the dominant habitat with low to moderate coral cover. Tatsumi is a popular fishing<br />
location, easily accessible from Tinian.<br />
Esmeralda Bank<br />
Esmeralda Bank is located approximately 37 km west of Tinian. There are two shallow banks plotted near<br />
Esmeralda Bank and NOAA’s Nautical Chart 81004 shows four soundings less than 80 m in depth. One of<br />
these is a kidney-shaped area labeled “Active Sulphur Boil (1945)” with a depth of 30 fathoms (55 m) indicated<br />
on the chart. This bank does not exist, while the other bank and Esmeralda Bank are smaller than indicated<br />
on the chart. A multibeam survey of Esmeralda Bank was carried out during the NOAA Ring of Fire cruise in<br />
April 2004 (NOAA, 2003, 2004). Esmeralda Bank appears to have experienced recent volcanic activity and<br />
shows signs of current hydrothermal circulation (Embley, 2004).<br />
Marpi Bank<br />
Marpi Bank is a steep-sided, flat-topped submerged bank approximately 28 km north of Saipan. It is<br />
approximately 9 km long by 4 km wide and is oriented in a northeast to southwest alignment similar to Tatsumi<br />
Reef; the shallowest point shown on NOAA’s Nautical Chart 81067 is 26 fathoms (53 m). Marpi Bank is also<br />
a popular fishing location. In 2003, Marpi Bank was surveyed using multibeam sonar and the R/V AHI (Figure<br />
15.6).<br />
Arakane Bank<br />
Arakane Bank is located approximately 325 km west-northwest of Saipan. On NOAA’s Nautical Chart 81004,<br />
it is identified by a single sounding of 5 fm (9 m). It is smaller than indicated on the chart and its true center<br />
is approximately 1 km southeast of the center of the charted bank. It was mapped in September 2003<br />
using single-beam sonar and an underwater video camera (Figure 15.7) during the NOAA MARAMP cruise.<br />
Encrusting and fleshy algae, hard and soft corals, and sand were seen on hard substrate ridges.<br />
Pathfinder Bank<br />
Pathfinder Bank is located approximately 275 km west of Anatahan in the West Mariana Arc. Pathfinder Bank<br />
is 3 km southeast of its plotted position on NOAA’s Nautical Chart 81004 and includes areas shallower than 10<br />
m, rather than the 8 fathoms (15 m) shown on the chart. It was mapped in September 2003 using single-beam<br />
sonar and an underwater video camera during the NOAA MARAMP cruise (Figure 15.7). Hard and soft corals<br />
were found on ridges of carbonate pavement, separated by channels containing rubble.<br />
Zealandia Bank<br />
Zealandia Bank is located approximately 20 km north of Sarigan Island (Figure 15.4). This flat-topped bank<br />
with two pinnacles is surrounded by vertical walls. Rhodoliths, calcareous nodular bodies produced by algal<br />
accretion, and Halimeda algae beds were seen by video camera at depths of 115 m.
The State of Coral Reef Ecosystems of the Commonwealth of the Northern Marianas<br />
Figure 15.7. Bathymetric maps of Arakane Bank (left) and Pathfinder Bank (right) were made from single-beam soundings taken<br />
aboard the NOAA ship Oscar Elton Sette in September 2003. Source: PIFSC-CRED, unpublished data.<br />
Supply Reef<br />
Supply Reef is located approximately 18.5 km northwest of Maug Island and identified as two 5 fathom (9 m)<br />
soundings on NOAA’s Nautical Chart 81004. Brief surveys were conducted from the NOAA ship Oscar Elton<br />
Sette in 2003. Hard and soft corals and rock were seen at this volcanic pinnacle during a video camera tow.<br />
Stingray Shoals<br />
Stingray Shoals is located approximately 275 km west of Uracas in the West Mariana Ridge. Stingray Shoals<br />
is a steep-sided pinnacle that has well-developed continuous reef on the small summit (~300 m x 500 m).<br />
Evidence of fishing activity is present, including anchors and long-line gear on the reef.<br />
Socioeconomic Context<br />
Population levels (Figure 15.8), habitation patterns, and the related impacts on reefs have varied tremendously<br />
over time. There is evidence of at least temporary settlement on all of the southern Mariana Islands, from<br />
Guam to FDM (Fritz, 1986).<br />
In the 17 th century, the entire population of the Mariana Islands was removed to Guam and Rota during the<br />
Spanish domination of the archipelago. It was not until the end of the 19 th and beginning of the 20 th century<br />
that the foundations of the modern communities in the CNMI returned from Guam and Rota (Spoehr, 2000).<br />
Although some of the islands north<br />
of Saipan have held small permanent<br />
and seasonal communities, most<br />
permanent residents were evacuated<br />
in 1981 after the eruption of Pagan.<br />
A volcanic eruption also resulted in<br />
the evacuation of a small community<br />
on Anatahan in 2003. A community<br />
of seven individuals remains on<br />
Agrihan.<br />
As the population of the CNMI<br />
continues to grow and diversify, its<br />
effects on adjacent reefs become<br />
more pronounced and complex.<br />
Fishing appears to have been at<br />
subsistence levels until at least the<br />
1950s (Spoehr, 2000). More recently,<br />
Figure 15.8. Yearly population growth in the CNMI from 1989-2004. Gaps indicate<br />
that no data was available. Source: various sources, compiled by J. Starmer.<br />
Sidebar<br />
Commonwealth of the Northern Marianas<br />
page<br />
405
Commonwealth of the Northern Marianas<br />
page<br />
406<br />
The State of Coral Reef Ecosystems of the Commonwealth of the Northern Marianas<br />
fishing has grown in importance as a commercial venture with numerous permanent and roadside vendors<br />
evident around Saipan.<br />
Tourism experienced a period of explosive growth in the late 1980s. The majority of tourism-related development<br />
has occurred along the western Saipan Lagoon. The importance of coral reefs as both a scenic backdrop and<br />
a focal point for recreational activities has grown along with the tourism industry. There is a clear recognition<br />
of the importance of the marine environment for tourism. However, negative effects have occurred in the<br />
adjacent marine ecosystems. Understanding the problems faced by CNMI’s coral reefs is the first step in<br />
effective management.<br />
ENVIRONMENTAL AND ANTHROPOGENIC STRESSORS<br />
Climate Change and Coral Bleaching<br />
Coral bleaching has been noted in the CNMI several times since 1994. However, there has been no quantitative<br />
assessment of these events. In 1994, bleached corals were observed in water depths of 16 m at Akino Reef,<br />
at the eastern end of the western barrier reef in Saipan, and to a lesser extent in 1995 and 1997 at Unai Bapot<br />
in Lau Lau Bay, Saipan and at the site of a vessel grounding in Pagan (Tomokane, 1997). Over the summer<br />
of 2001, most shallow water areas (
Tropical Storms<br />
Typhoons are a routine part of the<br />
annual seasonal cycles in the CNMI<br />
(Figure 15.9). These storms can<br />
affect coral reefs even when they<br />
do not pass directly over an island.<br />
Increased swells can cause coral<br />
damage through direct wave impact<br />
and by shifting loose objects (e.g.,<br />
coral, debris, grounded vessels)<br />
around the reef. The precipitation<br />
associated with typhoons also tends<br />
to increase sedimentation and nutrient<br />
inputs from polluted runoff.<br />
Coastal Development and Runoff<br />
The boom in rapid urban development<br />
in the late 1980s and early 1990s has<br />
led to overburdened and failing waste<br />
management systems, increased<br />
negative effects from sedimentation,<br />
and added fishing pressures.<br />
Coastal Pollution<br />
As a whole, CNMI’s marine waters<br />
meet the high water quality standards<br />
designated by the CNMI Division of<br />
Environmental Quality (DEQ). The<br />
majority of CNMI’s marine waters are<br />
designated “Class AA” which reflects<br />
the highest water quality. Five areas<br />
in the CNMI have been designated<br />
“Class A” to allow for industrial<br />
activities (Table 15.1).<br />
The State of Coral Reef Ecosystems of the Commonwealth of the Northern Marianas<br />
Figure 15.9. The path and intensity of typhoons passing near the CNMI from 1979-<br />
2004. Many Pacific typhoons are not named or the names are not recorded in the<br />
typhoon database. Map: A Shapiro. Data: UNISYS, http://weather.unisys.com/hurricane.<br />
Table 15.1. Class A waters in the CNMI. Source: Houk, 2004.<br />
WATER BODY REASON FOR CLASS A DESIGNATION<br />
Puerto Rico Industrial, Saipan Commercial port and municipal waste outfall<br />
Agingan Point, Saipan Municipal waste outfall<br />
Nonpoint Source Pollution<br />
East Harbor, Rota Commercial port<br />
The beach warnings posted by the West Harbor, Rota Commercial port<br />
DEQ are, perhaps, one of the most<br />
constant reminders of the direct<br />
San Jose Harbor, Tinian Commercial port<br />
effects of human actions on marine water quality through nonpoint source pollution. In recent years, most<br />
microbiological violations occurred in areas with heavy stormwater runoff. Many of these sites were within<br />
the highly developed Garapan district, where drainage issues are in the process of being addressed. Other<br />
frequent violations occur within Saipan’s marinas or in waters surrounding docks.<br />
CNMI’s three major inhabited islands have unpaved secondary roads that funnel soil and sediment into<br />
nearshore waters during periods of heavy rain, thereby increasing turbidity of nearshore waters. There have<br />
been several reports of sedimentation events associated with major construction projects (e.g., the Nikko Hotel,<br />
Lau Lau Bay Resort, and Bird Island Road) that were deleterious to nearshore corals. Treatment of secondary<br />
roads with crushed limestone without addressing drainage problems created chronic sedimentation problems<br />
along Lau Lau Bay and Obyan Beach. On several of the northern islands, deforestation and overgrazing has<br />
led to increased nearshore sedimentation. Deforestation from illegal burning has also created an area of<br />
eroding badlands on the southern coast of Rota.<br />
Sidebar<br />
Commonwealth of the Northern Marianas<br />
page<br />
407
Commonwealth of the Northern Marianas<br />
page<br />
408<br />
The State of Coral Reef Ecosystems of the Commonwealth of the Northern Marianas<br />
Aerial photographs of FDM indicated that the island was eroding at an unprecedented rate. No quantitative<br />
studies have been conducted to determine whether bombing has resulted in increased sediment runoff from<br />
the island. However, reports of persistent areas of low visibility on the windward side of the island are not<br />
reported elsewhere in the CNMI.<br />
Point Source Pollution<br />
Only two sewage outfalls (Agingan and Sadog Tasi, Saipan) exist in the CNMI. Both sewage treatment<br />
plants are operated by the Commonwealth Utilities Corporation (CUC) and are designed to provide secondary<br />
treatment for an average daily flow of 3 and 4.8 million gallons per day, respectively. The Sadog Tasi’s treated<br />
effluent is discharged through a marine outfall, approximately 365 m offshore into the Class A receiving waters<br />
off Tanapag Harbor, Saipan Lagood at a depth of 15 m. The Agingan plant’s treated effluent is discharged at<br />
the surf line through an intertidal outfall into the Class A receiving waters of Tinian Channel. Individual National<br />
Pollutant Discharge Elimination System permits are issued to each plant. Both plants are presently in violation<br />
of local water quality standards (WQS). The U.S. Environmental Protection Agency (EPA) has been working<br />
with the CUC to address this. While progress is being made, there is no set deadline for these plants to come<br />
into compliance.<br />
Reverse osmosis units used by hotels and other tourist-related facilities to improve the quality of the public<br />
water supply are discharged into the lagoon in several locations. These discharges contain nitrate and<br />
phosphate at up to 100 times above DEQ’s accepted limits. The EPA issued Administrative Orders to all CNMI<br />
dischargers in 2002, resulting in the decision to allow discharges into injection wells. Injection wells have been<br />
installed at four of the reverse osmosis facilities, and plans were underway for the remaining facilities to be in<br />
compliance before the end of 2004. Once accomplished, all reverse osmosis discharges to Commonwealth<br />
waters will cease.<br />
Tourism and Recreation<br />
The Coastal Resources Management<br />
Office (CRM) regulates commercial<br />
marine sports through its permitting<br />
process. Scuba diving, personal<br />
watercraft (jet skis), banana boats,<br />
parasailing, submarine tours, and<br />
other motorized marine sports<br />
activities must receive permits from<br />
CRM (Table 15.2). The CRM has<br />
further designated jet-ski exclusion<br />
zones near hotels, shallow reefs and<br />
seagrass areas.<br />
Table 15.2. Number of marine sports activity permits issued by CRM in 2003. CRM<br />
has implemented a zoning plan and permitting program for several recreational and<br />
tourism activities. Source: CNMI, CRM.<br />
PERMITTED ACTIVITY SAIPAN ROTA TINIAN TOTAL<br />
Jet ski 12 0 2 14<br />
Banana Boat 17 0 2 19<br />
Parasailing 10 0 1 11<br />
Sea/Aqua Walker 4 0 0 4<br />
Scuba 27 1 2 29<br />
Snorkel Tours 2 0 0 2<br />
Misc. <strong>Marine</strong> Sports 10 0 0 10<br />
Fishing<br />
Coral reef fisheries are difficult to manage, as these fisheries are typically multi-species and harvested by a<br />
wide variety of gear types. In the CNMI, conventional controls on catch are hard to justify socially while gear<br />
restrictions and size limits are virtually impossible to administer. Human pressures on coral reef fisheries<br />
combined with developmental perturbations have been detrimental to reef habitats and subsequently to reef<br />
fish resources. In short, management of coral reef fisheries in the CNMI has not provided protection against<br />
the overexploitation of reef fish resources and degradation of marine habitat by human-induced activities.<br />
The DFW Fisheries Data Section collects commercial landings data through a voluntary vendor invoice system.<br />
These data list the pounds sold and the corresponding value, with reef fish typically lumped together under the<br />
general heading of “Reef Fish.” A confounding factor with this system is that many reef-associated species,<br />
such as Lethrinids and Serranids are grouped under “Assorted Bottomfish,” and Lutjanids are grouped with<br />
“Assorted Reef Fish.” The commercial landings of reef fish have been fairly constant over time, averaging
about 143,400 lbs, (65,000 kg)<br />
although catch per unit effort (CPUE)<br />
has steadily decreased from a peak<br />
in 1994 (Figure 15.10).<br />
In general, CNMI fisheries are in good<br />
condition, although local depletion was<br />
determined to exist in the southern<br />
islands, especially on the lee aspect<br />
of Saipan. Surveys conducted by<br />
the University of Guam in 1979 and<br />
in collaboration with DFW in 1996<br />
revealed that considerable changes<br />
had occurred for some major food fish<br />
groups in Saipan Lagoon (Amesbury<br />
et al., 1979; Duenas and Associates,<br />
Inc., 1997; Figure 15.11).<br />
Additionally, the DFW conducted<br />
a sampling program of the reef fish<br />
scuba-spear fishery from 1993 to<br />
1996. Data from these surveys<br />
resulted in two DFW technical reports<br />
(Graham, 1994; Trianni, 1998b) that<br />
indicated local depletion for some<br />
species of commercially important<br />
reef fish. Comparitive analyses of<br />
parrotfish landings from a scubaspear<br />
fishery in the northern islands<br />
with a scuba-spear fishery in the<br />
southern islands revealed a decrease<br />
in the percentage of terminal phase<br />
males both spatially and temporally<br />
(Trianni, 1998b; Table 15.3). Reef<br />
fish scuba-spear CPUE was noted<br />
to have declined between 1993 and<br />
1996.<br />
The State of Coral Reef Ecosystems of the Commonwealth of the Northern Marianas<br />
Figure 15.10. Reef fish CPUE, commercial landings and value in USD as estimated<br />
from the voluntary invoice system. Source: CNMI DFW, unpublished data.<br />
Figure 15.11. Changes in estimated abundance of some commercial reef fish between<br />
1979 and 1996 surveys in Saipan Lagoon. Source: CNMI DFW, unpublished<br />
data.<br />
Table 15.3. Percentages of terminal phase parrotfish from the Northern Islands and<br />
Southern Islands for two sampling periods. ND = no data. Source: CNMI DFW, unpublished<br />
data.<br />
PERIOD/ DATES NORTHERN<br />
ISLANDS<br />
SOUTHERN<br />
ISLANDS<br />
SAIPAN TINIAN<br />
Period 1 (1993-1994) 78 52 48 53<br />
Period 2 (1995-1996) ND 66 61 68<br />
Sidebar<br />
Commonwealth of the Northern Marianas<br />
page<br />
409
Commonwealth of the Northern Marianas<br />
page<br />
410<br />
The State of Coral Reef Ecosystems of the Commonwealth of the Northern Marianas<br />
Over the past several years, the<br />
DFW noticed a major increase in the<br />
numbers of imported reef fish into the<br />
CNMI (Figure 15.12). As a result of<br />
these findings, the CNMI Department<br />
of Lands and Natural Resources<br />
(DLNR) and DFW initiated regulatory<br />
changes that restricted the use of<br />
gill, drag, and surround-nets, and<br />
scuba and hookah spear fishing in<br />
the CNMI. Reef fish abundance will<br />
be monitored closely over the next<br />
several years for signs of recovery in<br />
areas where localized depletion was<br />
observed.<br />
DFW regulation prohibits the use<br />
of explosives, chemicals, poisons,<br />
and electronic shocking devices.<br />
The extent of such illegal practices<br />
is unclear. There exists no evidence that explosives or electronic shocking devices are currently used for<br />
harvesting fish. The use of rotenone, a poison extracted from a plant (Derris spp.) has been reported by DFW<br />
conservation officers, although the use of other poisons or chemicals has not been verified.<br />
Invertebrate fisheries<br />
A historical fishery for sea cucumbers targeting Actinopyga mauritiana, with incidental captures of the black<br />
teatfish, Holothuria whitmaei, was active from 1995-1996 on Rota and Saipan (Trianni, 2002). The fishery<br />
was closed in 1997 due to declining catch. In 1998, a 10-year moratorium was placed on the harvest of sea<br />
cucumbers in the CNMI, creating the largest no-take zone for these invertebrates in the world.<br />
The introduced topshell Tectus niloticus has been placed in a harvest moratorium since 1981. Although this<br />
moratorium is continual, the DLNR Secretary can lift the moratorium and declare an open season following<br />
consultation with the DFW Director. This was done in 1996 and a two-month open season ensued (Trianni,<br />
2002). In addition to the state of moratorium, two protected areas for Tectus were also established in 1981<br />
- one at Tank Beach on the windward side of Saipan, and the other along a one-mile section of the barrier reef<br />
at Saipan Lagoon.<br />
Trade in Coral and Live Reef Species<br />
DFW regulation prohibits the export of live fish for consumption and restricts the export of live fish for the<br />
aquarium trade. The collection of reef fish for commercial and personal display is also regulated by the DFW.<br />
The number of commercial or personal display permits has been low since 1996, never exceeding five per<br />
year. The DFW issues a limited number of permits for the production of slaked lime (locally known as afuk)<br />
from dead coral for cultural purposes. Lime is traditionally chewed with betel nut (Arecia sp.). Much of the lime<br />
for this purpose is now being imported from Yap, Federated States of Micronesia, or the Republic of Palau.<br />
The number of permits granted from 1996-2004 has ranged from none to four per year.<br />
Ships, Boats and Groundings<br />
Figure 15.12. Reef fish imports into the CNMI between 1989–2001. Source: CNMI<br />
DFW, unpublished data.<br />
Anchoring<br />
Anchor damage is noticeable at some popular fishing and dive sites in the Mariana Islands. At present,<br />
there are no restrictions on recreational anchoring outside of marine protected areas (MPAs). Concern<br />
over anchoring effects prompted the installation of moorings at most commercial dive sites around Saipan,<br />
Tinian, and Rota. The Northern Marianas Dive Operators Association (NMDOA) reports that the installation of
The State of Coral Reef Ecosystems of the Commonwealth of the Northern Marianas<br />
these moorings has resulted in noticeable improvement in the corals at these sites and the organization has<br />
continued to independently maintain the moorings. U.S. Coral Reef Initiative funds have allowed the purchase<br />
of additional mooring maintenance and installation materials. New moorings were installed on Rota thanks to<br />
the local efforts of Dive Rota and will be installed with the assistance of NMDOA at sites on Saipan and Tinian<br />
in the coming year.<br />
The anchoring of large commercial vessels on the extensive shallow (25-40 m) reef platform to the west of<br />
Saipan has been impacting reef coral habitat since the mid-1990s. DFW has obtained some data on vessel<br />
anchorage behavior. The number of days at anchor from December 1999 to March 2001 ranged from 3-42.<br />
For the same period, the number of pre-positioned vessels at anchorage at any one time ranged from 1-5,<br />
with the effective range being 2-4.<br />
DFW Anchoring Study<br />
The DFW Fisheries Research Section<br />
undertook dive surveys in May and<br />
June 2002 to obtain preliminary data<br />
on fish and benthic habitat in high use<br />
anchorage zones and control sites<br />
(Table 15.4). The sample sizes were<br />
relatively small at each site, given the<br />
average survey depth of 30 m and<br />
the restricted available bottom time.<br />
Table 15.4. Differences in ecological parameters at commercial anchorage and control<br />
sites off the west coast of Saipan. Source: CNMI DFW, unpublished data.<br />
ANCHORAGE (n=6) CONTROL (n=2)<br />
Fish Density 2.3 2.4<br />
Density Range 0.6 - 4.8 1.1 - 4.5<br />
# Species Range 14 - 29 16 - 31<br />
% Live Coral Cover 9.2 6.3<br />
% Algal Cover 40 35.6<br />
% Abiotic Benthos 50.2 56.6<br />
Methods<br />
Fish stationary point counts (SPCs) involved the identification of all species within 5 m circular areas. Benthic<br />
sampling (n=30; n=20), involved documenting 16 random points inside a 0.5 m 2 quadrat.<br />
Results and Discussion<br />
Results from the preliminary fish surveys indicated very little difference between the sites, although the sample<br />
size was small. Terminal phase parrotfish, however, were more abundant at control sites (mean of 5.5/5 m<br />
diameter) than at anchorage sites (mean of 0.7/5 m diameter). Large snapper and wrasse, as well as schools<br />
of fusiliers and unicornfish were observed in the vicinity of a control site.<br />
Benthic surveys indicated a greater percentage of live coral cover and lesser percentage of abiotic benthos at<br />
control sites. The overall results of the preliminary survey showed lower fish abundance and diversity as well<br />
as lower coral cover. It is noteworthy that recreational fishing activity occurs in this general area.<br />
During the August and September 2003 MARAMP cruise, the R/V AHI, used a combination of multibeam<br />
echosounder and side-scan sonar to survey the pre-positioned vessel anchorage near Saipan Lagoon.<br />
The NOAA ship Oscar Elton Sette conducted some underwater video and photographic observations in the<br />
anchorage zone during the same period using a tethered optical assessment device (TOAD). In November<br />
2004, NOAA Fisheries, DFW, and DEQ conducted an extensive TOAD survey of the pre-positioned anchorage<br />
zone. Following this survey and development of the resulting products, the U.S. Navy plans to expand the<br />
number of pre-positioned vessels in the anchorage area.<br />
Abandoned and Grounded Vessels<br />
Nineteen vessels, ranging in size from commercial steamers to canoes, are recorded to have been lost in the<br />
CNMI between 1600 and 1940 (Carrell, 1991). Between 1940 and 1946, numerous vessels are recorded to<br />
have been sunk in the vicinity of the Mariana Islands (e.g., 38 around Saipan), but only 15 of them appear<br />
to have sunk or grounded in nearshore waters (Carrell, 1991). Wreckage of tanks, landing craft, airplanes,<br />
and pontoons from WWII are also visible on coral reefs. These craft are considered an important part of the<br />
historical record and are unlikely to be removed.<br />
Sidebar<br />
Commonwealth of the Northern Marianas<br />
page<br />
411
Commonwealth of the Northern Marianas<br />
page<br />
412<br />
The State of Coral Reef Ecosystems of the Commonwealth of the Northern Marianas<br />
In the past two decades, more than 20 commercial vessels have grounded in the CNMI. The majority of these<br />
groundings were typhoon-related and two were the result of operator error. Some of these vessels have since<br />
been removed, but nearly half remain in the water. Although these vessels were reportedly cleaned of fuel<br />
and oil, they still pose a threat to coral reef habitat as they break apart and their parts are moved across reefs<br />
during storms.<br />
Salvage operations of various kinds have also resulted in further disturbance to the marine environment.<br />
Salvage operations on Spanish galleons in the CNMI, including the Nuestra Señora de la Concepción on<br />
Saipan and the Santa Margarita on Rota, have caused negative impacts to coral reef environments during the<br />
excavation activities.<br />
In addition, small vessels cause damage to the marine environment. One area of seagrass habitat in the<br />
Saipan Lagoon was recently discovered by the MMT to contain a mosaic of propeller scars.<br />
CRM intends to coordinate the development of a CNMI Vessel Grounding Action Plan that will guide the<br />
CNMI in closing communication gaps, creating or revising laws and regulations, strengthening enforcement,<br />
developing preventative measures, and addressing funding and resources limitations. NOAA has provided<br />
technical assistance and nominal monetary assistance for grounded vessel inventory and removal.<br />
<strong>Marine</strong> Debris<br />
While some marine debris washes in from offshore and is deposited on beaches, most of the Southern<br />
Mariana Islands have cliffs and limited reef development along the windward (eastern) shores. This limits the<br />
opportunity for oceanic marine debris to end up on reefs. A greater problem is debris originating from local,<br />
land-based activities. Both the DEQ and CRM have active anti-litter education programs. In addition, the DEQ<br />
and several civic groups sponsor monthly beach cleanups. Annual reef cleanups have also been sponsored<br />
by local resource management agencies. As a result, marine debris does not generally accumulate on or near<br />
local reefs and is considered a minor concern in the CNMI.<br />
Aquatic Invasive Species<br />
Mollusks<br />
The only successful intentional introduction of a marine species in the CNMI has been that of Tectus niloticus<br />
(locally known as aliling tulumpo). T. niloticus was introduced as a commercial venture by the Japanese in 1938.<br />
Its harvest was essentially unregulated after WWII, prior to the formation of the CNMI. A continual moratorium<br />
is presently in effect, although the DLNR Secretary can lift it when the resource is deemed exploitable. Two<br />
no-take reserves are established: one at Tank Beach, and the other along the western barrier reef of Saipan<br />
Lagoon, called the “Lighthouse Reserve.” As an industry, harvests of Tectus shells were limited by availability<br />
of suitable habitat (Adams et al., 1994). The effects of its introduction on other marine organisms are not<br />
known.<br />
The giant clam species, Tridacna derasa, was imported from the Micronesian Mariculture Demonstration<br />
Center (MMDC) in Palau and released in Saipan in 1988. In 1991, 2,000 Tridacna derasa and 2,000 T. gigas,<br />
as well as some Hippopus hippopus and Tridacna squamosa, from MMDC were placed in cages in Saipan<br />
Lagoon as part of a regional growth study. These introductions failed to produce desired economic benefits<br />
and the growth study was hampered by poaching. In 2001, several species of Hippopus were found in Saipan<br />
Lagoon during surveys by the MMT, although it appears unlikely that the few surviving individuals comprised a<br />
reproductively viable population. Currently, there are plans to commence with another aquaculture venture in<br />
the CNMI using the same four giant clam species from the renamed Palau Mariculture Demonstration Center.<br />
This project is expected to commence in early <strong>2005</strong>.
The State of Coral Reef Ecosystems of the Commonwealth of the Northern Marianas<br />
Fish<br />
Red tilapia (Oreochromis mossambica) was intentionally introduced to brackish lakes on Saipan, Pagan,<br />
Tinian, and Anatahan between 1955 and 1957. It is currently cultivated at the Northern Marianas College<br />
(NMC) Aquaculture Center, and is also provided by the NMC as an outreach product for use in private ponds.<br />
This species is currently being kept in open-system pools next to the Saipan Lagoon in fully marine water.<br />
There is a distinct possibility that these animals could enter the Saipan Lagoon and become established.<br />
Ballast Water<br />
The potential for the introduction of invasive species through the discharge of ballast water exists in the<br />
CNMI, but the threat has not been evaluated. As the CNMI is primarily a destination rather than a source of<br />
goods, most vessels are more likely to take in rather than discharge ballast. Commonwealth Ports Authority<br />
regulations prohibit discharge of ballast water within the commercial port areas.<br />
Security Training Activities<br />
FDM<br />
In 1998, the U.S. Navy completed an environmental impact statement (EIS) as required by Section 102(2)(C) of<br />
the National Environmental Policy Act of 1969 (P.L. 91-190). As a result of that process, it was determined that<br />
an annual marine survey must be conducted for a three-year period from 1999 through 2001. Subsequently,<br />
the Navy decided to continue annual surveys as long as FDM was being used for training activities. The DFW<br />
requested that the U.S. Navy continue to fund surveys even after cessation of training activities. The yearly<br />
reports stemming from these surveys indicated that damage to the nearshore coral reef environment was<br />
minimal. However, it appears that use of live explosives has resulted in accelerated erosion at FDM.<br />
The FDM area serves as prime fishing grounds for large and small vessels from Saipan. The distance from<br />
FDM to Saipan (roughly 80 km) makes it relatively inaccessible to boaters except during favorable seas. In<br />
addition, the U.S. Navy claims a three-mile exclusion zone around FDM, which is extended to 10 miles during<br />
live-fire military training activities, thus further limiting annual fishing effort.<br />
Tinian<br />
During WWII, the island was almost entirely a military base. Waste disposal in the northern part of the island<br />
has resulted in several formerly-used defense sites that are awaiting cleanup. Leaching of materials into<br />
groundwater is a concern. Debris from both WWII invasions and later dumping activities remains embedded<br />
in the reef along the west coast of Tinian.<br />
The U.S. Navy presently leases approximately two-thirds of the northern portion of Tinian for training exercises<br />
and maneuvers. Results of qualitative surveys reveal very little damage to the reef structure from these<br />
activities. In general, recent military activities on Tinian have been conducted with a high level of sensitivity to<br />
the potential impact on the environment. However, because of the large number of personnel and equipment<br />
involved in some of the Navy’s exercises, the CNMI should continue to monitor these activities.<br />
Offshore Oil and Gas Exploration<br />
Offshore oil and gas exploration are currently not an issue of concern in the CNMI.<br />
Other<br />
COTS<br />
Outbreaks of COTS (Acanthaster planci) have occurred in the late 1960s, 1984, and 1990s. Control programs<br />
during the 1969-1970 period removed nearly 14,000 of the animals from Rota, Saipan, and Tinian (Tsuda, 1971).<br />
An outbreak also occurred at Putan Taipingot, Rota in 1995 (M. Michael, pers. comm.). Presently, the starfish<br />
has been noted in low numbers on most surveyed reefs in Aguiguan, Rota, Saipan, and Tinian. Three areas<br />
with apparently persistent and dense populations have been identified by the MMT: the eastern side of Puntan<br />
Sidebar<br />
Commonwealth of the Northern Marianas<br />
page<br />
413
Commonwealth of the Northern Marianas<br />
page<br />
414<br />
The State of Coral Reef Ecosystems of the Commonwealth of the Northern Marianas<br />
Naftan (near Boy Scout Beach), Lau<br />
Lau Bay Site 2 on Saipan, and Unai<br />
Babui on the eastern side of Tinian.<br />
At Boy Scout Beach, A. planci does<br />
not appear to have a significant effect<br />
on coral cover (Figure 15.13), but<br />
may be the causal agent for changes<br />
in coral community structure (Figure<br />
15.13).<br />
During the 2003 NOAA MARAMP<br />
cruise, towed-divers observed few<br />
COTS in the northern islands (Table<br />
15.5). A. planci were more prevalent<br />
in the southern island arc. Toweddivers<br />
recorded 2.2 COTS per km at<br />
Tatsumi Reef, 4.2 COTS per km at<br />
Saipan, 1.8 COTS per km at Tinian,<br />
6.4 COTS per km at Aguijan, and<br />
10.5 COTS per km at Rota(Figure<br />
15.14).<br />
Volcanic Eruptions<br />
Volcanic eruptions have been sporadic<br />
(Table 15.6), but appear to have great<br />
influence on the coral communities<br />
on some of the geologically active<br />
northern islands (Eldredge and Kropp,<br />
1985). Monitoring the recovery of<br />
reefs affected by the 2003 eruption<br />
of Anatahan will allow an improved<br />
understanding of the abilities of coral<br />
reefs to recover from these events<br />
and the role that volcanic disturbance<br />
has played in shaping the reef<br />
ecosystems in the northern islands.<br />
Figure 15.13. Change in benthic cover (A) and coral cover (B) at Boy Scout Beach<br />
between 2001 and 2004. Source: CNMI MMT (P. Houk), unpublished data.<br />
Table 15.5. The number and density of COTS recorded during MARAMP 2003 toweddiver<br />
surveys. Source: PIFSC-CRED (M. Timmers), unpublished data.<br />
REGION COTS TOW LENGTH<br />
(KM)<br />
COTS/KM<br />
Northern Islands 18 201.14 0.09<br />
Southern Islands 421 62.88 6.7<br />
TOTAL 439 264.02 6.79<br />
Figure 15.14. Crown-of-thorns densities from towed diver surveys. Source: PIFSC-<br />
CRED, (M. Timmers), unpublished data.
The State of Coral Reef Ecosystems of the Commonwealth of the Northern Marianas<br />
Table 15.6. Records of volcano eruptions in the CNMI. * denotes uncertainy of volcano eruption date. Source: Adapted from Siggurdsson<br />
et al., 2000.<br />
NAME TYPE ELEVATION (m) ERUPTION DATES<br />
Farallon de Pajaros<br />
(Uracas)<br />
Stratovolcano 360 1967, 1952-53, 1951, 1947, 1943, 1941, 1939, 1936, 1934, 1932,<br />
1928, 1925, 1912, 1900-01*, 1874-76*, 1864-76*, 1864<br />
Supply Reef Submarine Volcano -8 1989, 1985*, 1969<br />
Ascuncion Stratovolcano 857 1924*, 1906, 1775*, 1690*<br />
Agrigan Stratovolcano 965 1917<br />
Pagan Stratovolcanoes 570 1998, 1998*, 1987, 1993, 1992, 1981-85, 1929-30*, 1925, 1923,<br />
1917, 1909, 1873*, 1864, 1825, 1669<br />
Alamagan Stratovolcano 744 1887*, 1864*<br />
Guguan Stratovolcano 287 1883<br />
Anatahan Stratovolcano 788 <strong>2005</strong>, 2004<br />
Ruby Submarine Volcano -230 1996, 1995<br />
Esmerelda Bank Submarine Volcano -43 1987*, 1982*, 1975*, 1970*, 1964*, 1944*<br />
Unexploded Ordnance<br />
The CNMI was a major battlefield<br />
during WWII, and war debris<br />
and unexploded ordnance is still<br />
common in the near shore waters. A<br />
moderate, but locally concentrated<br />
amount of ordnance has been noted<br />
by the MMT south of Agingan Point<br />
and the southern end of Lau Lau<br />
Bay. Unexploded ordnance was also<br />
recorded near Aguijan using toweddiver<br />
surveys during the NOAA<br />
MARAMP cruise (Figure 15.15).<br />
The effects of chemical leaching<br />
of ordnance materials, including<br />
explosive chemicals and structural<br />
metals (e.g., copper, lead, tin, etc.),<br />
upon marine life have not been<br />
evaluated.<br />
Figure 15.15. Unexploded ordinance observed during NOAA MARAMP towed-diver<br />
Modern use of explosives for blast survey. Photo: S. Holzwarth.<br />
fishing occurred until recently<br />
(Johannes, 1979). Education regarding long-term environmental effects and enforcement efforts appear to<br />
have been effective. Blast fishing is not considered a concern in the CNMI at present, though the practice is<br />
difficult to detect near less inhabited parts of the CNMI. In 1996, through the CNMI Governor, the Director of<br />
the CNMI Emergency Management Office requested that the U.S. Navy detonate depth charges on a WWII<br />
subchaser wreck at the popular Coral Gardens dive site in the Sasanhaya Bay Fish Reserve (SBFR) as it was<br />
felt that the charges posed a hazard to recreational divers and fishermen (Worthington and Michael, 1996).<br />
The force of the detonation caused significant damage to the SBFR, the oldest of CNMI’s MPAs. The blast<br />
killed numerous fish, decimated coral, and killed an endangered hawksbill turtle (Trianni, 1998a).<br />
In addition, considerable secondary damage was caused by an extensive sediment plume that resulting<br />
from the blast, which blanketed a large area including in and around the Coral Gardens site. Two typhoons<br />
subsequently caused further damage, which expanded the impacted area to approximately 29,000 m 2 .<br />
Estimates based on a value of $2,833/m 2 resulted in a total economic impact of $82 million (Richmond and<br />
Romano, 1997).<br />
Sidebar<br />
Commonwealth of the Northern Marianas<br />
page<br />
415
Commonwealth of the Northern Marianas<br />
page<br />
416<br />
The State of Coral Reef Ecosystems of the Commonwealth of the Northern Marianas<br />
<strong>CORAL</strong> <strong>REEF</strong> ECOSYSTEM—DATA GATHERING EFFORTS AND RESOURCE CONDITION<br />
Three main programs within the CNMI currently collect marine monitoring data. The DEQ monitors nearshore<br />
marine water quality for bacterial contaminants and a range of standard physical water quality parameters.<br />
The DFW Fisheries Research Section monitors fish and benthic parameters in marine preserves. The MMT,<br />
which includes staff from DEQ, DFW, and the CRM, monitors fish, invertebrates, and benthic parameters<br />
cooperatively at sites around the southern four islands of the CNMI.<br />
In addition, NOAA has been actively involved in geological and ecosystem-based research around the CNMI.<br />
NOAA’s Office of Ocean Exploration funded two geological cruises in 2003 and 2004 aboard the R/V Thomas<br />
J. Thompson to study active volcanism and hydrothermal activity in the Marianas Archipelago. These cruises<br />
provided invaluable baseline bathymetric data. Results from these cruises can be accessed on-line (NOAA’s<br />
Office of Ocean Exploration, http://oceanexplorer.noaa.gov/explorations, Accessed 01/07/05).<br />
NOAA’s Coral Reef Conservation Program and Pacific Island Fisheries Science Center (PIFSC) funded the<br />
first MARAMP cruise on the NOAA ship Oscar Elton Sette in 2003. Extensive baseline studies of coral, fish,<br />
algae, oceanography, benthic habitats, and bathymetry were conducted from Uracas to Guam. These cruises<br />
are planned to continue biennially.<br />
DEQ Activities<br />
The DEQ Surveillance <strong>Laboratory</strong> was established to provide monitoring data required by the Federal Safe<br />
Drinking Water Act (P.L. 93-523) and other environmental programs. The data generated by the laboratory<br />
are used to evaluate the quality of drinking water and recreational waters in the Commonwealth. The DEQ<br />
has been testing water quality at a number of sites adjacent to the high population centers on Saipan since<br />
1980. More recently, water quality testing has been extended to Tinian and Rota. DEQ posts warnings at local<br />
beaches when water quality parameters exceed the acceptable limits for public health.<br />
DFW Activities<br />
The DFW Fisheries Research Section established a <strong>Marine</strong> Sanctuaries Program (MSP) in 1998 and has been<br />
surveying MPAs in the CNMI since 1999. The primary goal of the survey is to monitor annual trends in reef<br />
fish abundance and diversity. Secondary goals include monitoring changes in benthic habitat composition,<br />
macroinvertebrate abundance, and habitat heterogeneity.<br />
MMT Activities<br />
The MMT - consisting of staff from the DEQ, CRM, and DFW - has also included participation from NMC<br />
staff. The MMT was initially established in 1997 to help the CNMI understand the current condition of its<br />
coral reefs and coral reef resources. DEQ prepared the first State of the Reef Reports for Rota and Saipan<br />
(Houk, 2000 and 2001, respectively). These reports documented baseline conditions and will be used for<br />
future assessments and regional management recommendations. It is the goal of the MMT to carry out this<br />
long-term monitoring program to continually assess our reefs as the CNMI grows. Monitoring locations for the<br />
MMT are shown in Figure 15.16.<br />
The DEQ plays a major role in the MMT through its <strong>Marine</strong> Monitoring Program, Nonpoint Source Pollution<br />
Program, and Surveillance <strong>Laboratory</strong>. Since the previous report on water quality required by Section 305(b)<br />
of the Federal Clean Water Act, the DEQ and MMT have initiated two large-scale biocriteria monitoring<br />
programs. Both of these are very different from EPA-funded biocriteria monitoring programs in the U.S.<br />
mainland. Tropical marine systems are much more dynamic and harbor very different organisms. Biocriteria<br />
programs set forth in the U.S. mainland fail to provide useful techniques for the CNMI. One monitoring effort<br />
is the Saipan Lagoon Monitoring Program (DEQ and CRM), and the other is the CNMI Nearshore Reef<br />
Monitoring Program (DEQ, CRM, and DFW). The goal of these programs is to gather continuous data from<br />
marine systems that are affected by water quality concerns (e.g., watershed drainages, sewage pump failures<br />
and outfalls, and other sources of point and nonpoint source pollution).
Figure 15.16. Monitoring site locations in the CNMI. Map: A. Shapiro.<br />
The State of Coral Reef Ecosystems of the Commonwealth of the Northern Marianas<br />
Irregular sources of information about the marine environment are site surveys conducted to satisfy local<br />
or regional requirements, such as EISs. These surveys provide snapshots of CNMI reefs and can be very<br />
informative, but are usually limited to a single reef area. For example, two sites in Lau Lau Bay were surveyed<br />
in 1991 and recently re-surveyed in 2001 by the MMT (Houk, 2001). Turf algae was the single most abundant<br />
component of benthic cover (47% and 52%). Coral cover represented 28% and 42% on these two reefs. The<br />
second site showed a long-term decrease in mean coral diameter and relative frequencies of large branching<br />
corals, attributed to the 1983 COTS outbreak. Between 1991 and 2001, the abundance of macroinvertebrates,<br />
such as sea urchins and sea cucumbers, decreased at both sites (Houk, 2001).<br />
Sidebar<br />
Commonwealth of the Northern Marianas<br />
page<br />
417
Commonwealth of the Northern Marianas<br />
page<br />
418<br />
The State of Coral Reef Ecosystems of the Commonwealth of the Northern Marianas<br />
NOAA MARAMP Cruise<br />
The MARAMP research cruise aboard the NOAA ship Oscar Elton Sette from August 22 to September 29,<br />
2003 was led by the PIFSC-Coral Reef Ecosystem Division (CRED) in collaboration with scientists and<br />
resource managers from the DFW, DEQ, CRM, Guam Division of Aquatic and Wildlife Resources, NOAA<br />
Ocean Service (NOS)-National Geodetic Survey, University of Guam <strong>Marine</strong> <strong>Laboratory</strong>, University of Hawaii’s<br />
Joint Institute for <strong>Marine</strong> and Atmospheric Research and Hawaii Mapping Research Group, University of<br />
Florida, and National Park Service. Other key collaborators assisting and supporting the cruise included NOS’<br />
Special Projects Office, NOAA’s Center for Coastal Monitoring and Assessment-Biogeography Team (CCMA-<br />
BT), NOAA Satellites and Information’s Office of Applied Research, NOAA Research-Atlantic Oceanographic<br />
and Meteorological <strong>Laboratory</strong>, Western Pacific Regional Fishery Management Council, USFWS, Bishop<br />
Museum, Guam Fisherman’s Cooperative, and R/V Oscar Elton Sette crew and officers. The cruise was<br />
designed to provide an archipelago-wide baseline assessment of the living marine resources, including fish,<br />
coral, other invertebrates, and algae, in the context of their benthic and oceanographic habitats. It was the<br />
most comprehensive, multi-disciplinary study ever conducted of the coral reef ecosystems in the Marianas<br />
Archipelago.<br />
During the cruise, rapid ecological assessments (REAs), benthic habitat mapping, and oceanographic research<br />
were conducted at 14 islands (Guam, Rota, Aguijan, Tinian, Saipan, Anatahan, Sarigan, Guguan, Alamagan,<br />
Pagan, Agrihan, Asuncion, Maug, and Uracas) and at many oceanic reefs and banks (Santa Rosa Reef,<br />
Galvez Bank, 11 Mile Bank, Esmeralda Bank, Tatsumi Reef, Marpi Reef, Arakane Reef, Pathfinder Bank,<br />
Zealandia Bank, Supply Reef, Stingray Shoals, and an unknown bank southeast of Uracas Island). During 29<br />
days of operations in CNMI waters, specialized teams of scientists performed 76 REAs of reef fishes, coral,<br />
other invertebrates, and algae; 138 towed diver habitat and fish surveys covering about 265 km of habitat;<br />
76 towed diver turtle and fish surveys covering an estimated 178 km of habitat; 45 bioacoustic surveys of<br />
biomass in the water column; 338 oceanographic station visits (using conductivity, temperature, and depth<br />
instruments [CTDs]); ocean current profiles along over 664 km of transects; 100 TOAD deployments; 106<br />
single-beam and bottom classification surveys; and high resolution multibeam acoustic mapping of 244.2<br />
km 2 of benthic habitats using the R/V AHI. Many of these locations are shown in Figure 15.16. In addition,<br />
an array of surface and subsurface oceanographic moorings were deployed as part of NOAA’s Coral Reef<br />
Watch Program to monitor ocean conditions influencing reef health and to provide resource managers and<br />
researchers with coral bleaching and other alerts using the Coral Reef Early Warning System (CREWS).<br />
The MARAMP cruise has provided researchers with a tremendous baseline data set about each of the principal<br />
components of these complex coral reef ecosystems. The simultaneous information about the status and<br />
diversity of the marine resources along the entire Marianas Archipelago, including their spatial and habitat<br />
distributions, provides an opportunity for researchers and resource managers to better understand how these<br />
complex ecosystems function. This baseline data set will be used to evaluate temporal changes of these<br />
ecosystems as the MARAMP evolves to biennial monitoring cruises. By monitoring the spatial and temporal<br />
variability of the marine resources and oceanographic conditions, local and national resource managers will<br />
be better equipped to make and apply ecosystem-based management principles to conserve and protect<br />
these coral reef ecosystems.<br />
WATER QUALITY<br />
Standard water quality parameters are regularly monitored in nearshore marine waters on Saipan, Tinian, and<br />
Rota by the DEQ Surveillance <strong>Laboratory</strong>. Full information on methods and results are available in the CNMI<br />
Integrated 305(b) and 303(d) Water Quality Assessment Report (Houk, 2004; online at: http://www.deq.gov.<br />
mp/305b%202004%20Final.<strong>pdf</strong>, Accessed 01/06/05).<br />
The collaborative efforts of NOAA MARAMP cruises promise to expand the quantity and variety of oceanographic<br />
data being collected in the future. PIFSC-CRED deploys oceanographic monitoring systems throughout the<br />
archipelago. Information on ocean currents, water temperatures, salinity, and turbidity were collected during<br />
the 2003 NOAA MARAMP cruise and will be collected biennially during future cruises.
DEQ Beach Water Quality Monitoring Program<br />
The goal of the DEQ’s Surface<br />
Water Quality Monitoring Program<br />
is to assess CNMI’s waterbodies for<br />
compliance with recreational uses<br />
and aquatic life uses. EPA guidance<br />
material was used to classify each<br />
waterbody as 1) non-supportive,<br />
2) partially supportive, or 3) fully<br />
supportive for use (Table 15.7).<br />
The State of Coral Reef Ecosystems of the Commonwealth of the Northern Marianas<br />
Methods<br />
The DEQ Surveillance <strong>Laboratory</strong> was established by the CNMI to provide monitoring data required by the Safe<br />
Drinking Water Act, and other environmental programs. Salinity (‰), dissolved oxygen (% DO), temperature<br />
(°C), pH, turbidity (NTU), orthophosphate (PO 4 ), nitrates (NO 3 ), and Enterococci spp. bacteria (cfu/100ml)<br />
are monitored weekly at 84 fixed sites around Saipan, Rota, and Tinian. The data collected by this program<br />
comprise the longest consistently-collected set of marine water quality data available for the CNMI.<br />
Development of the CNMI WQS was largely based upon the review of WQS from other tropical islands (Houk,<br />
2004). Due to the potential important influence of water quality on coral reef ecosystems and the lack of existing<br />
data, stringent WQS for nutrients were adopted for the CNMI. DEQ recently initiated the collection of nutrient<br />
data. It has not yet been determined whether the nutrient concentrations recorded are due to anthropogenic<br />
sources. At all islands, PO 4 levels exceeded WQS more than 50% of the time, with the exception of Managaha<br />
Island, which has no major sources of terrestrial input (Houk, 2004).<br />
Table 15.7. Criteria for waterbody classification. Source: Houk, 2004.<br />
DEGREE <strong>OF</strong> AQUATIC<br />
CRITERIA<br />
LIFE USE SUPPORT<br />
Fully Supporting For any one pollutant,<br />
WQS was exceeded in ≤10% of measurements<br />
Partially Supporting For any one pollutant,<br />
WQS was exceeded in 11-25% of measurements<br />
Not Supporting For any one pollutant,<br />
WQS was exceeded in >25% of measurements<br />
Results and Discussion<br />
Recreational use classifications were based upon elevated counts of Enterococcus bacteria. Saipan Island<br />
has the largest number of waterbodies that were classified as non-supportive for recreational use. Rota,<br />
Tinian, and Managaha Islands each had only one non-supportive waterbody. For Saipan Island, regression<br />
analysis was used to examine the relationship between rainfall and Enterococcus bacteria counts. Rainfall<br />
explained a significant amount (p
Commonwealth of the Northern Marianas<br />
page<br />
420<br />
The State of Coral Reef Ecosystems of the Commonwealth of the Northern Marianas<br />
Table 15.8. Summary of DEQ beach monitoring locations for which data were available for regression analysis of rainfall (Y) on Enterococcus<br />
levels (X). Waterbody ranking of 1= non-supportive, 2= partially supportive, and 3= fully supportive based on WQS for<br />
recreational and aquatic life uses. Regression analysis results are presented as p-values at a significance level of * p
The State of Coral Reef Ecosystems of the Commonwealth of the Northern Marianas<br />
CRM <strong>Marine</strong> Temperature Monitoring<br />
A shallow-water bleaching event in 2001 prompted the CRM to reinstate its Temperature Monitoring Pogram,<br />
which began and ceased operation in 1999.<br />
Methods<br />
Continuous data on temperature were<br />
recorded using data loggers installed<br />
at 6 m depths at the Lau Lau #2,<br />
Outside Grand, and Sasanhaya MMT<br />
reef monitoring sites. In addition, a<br />
recorder was placed at a 1 m depth<br />
in the Saipan Lagoon just north of the<br />
Outside Grand site.<br />
Results and Discussion<br />
Temperature data collected for this<br />
project, such as those presented in<br />
Figure 15.17, will assist managers<br />
in understanding the causes of<br />
differential bleaching phenomena<br />
among the lagoon and reef sites in<br />
the southern Mariana Islands.<br />
Figure 15.17. Hourly water temperature data within the Saipan Lagoon (1 m) and<br />
the adjacent fore reef (6 m) over five months, illustrating the differences in temperature<br />
changes. Source: CNMI CRM, unpublished data.<br />
Sidebar<br />
Commonwealth of the Northern Marianas<br />
page<br />
421
Commonwealth of the Northern Marianas<br />
page<br />
422<br />
The State of Coral Reef Ecosystems of the Commonwealth of the Northern Marianas<br />
NOAA MARAMP, Study of Water Quality and Oceanographic Conditions<br />
The volcanic island arc/subduction zone topography and associated extremely steep slopes of the Marianas<br />
Archipelago greatly modify the oceanography of the nearshore waters of the islands. Localized upwelling and<br />
the associated nutrient enrichment of surface waters, nutrient enrichment and seawater chemistry changes<br />
due to volcanic seeps and vents, freshwater inputs, and anthropogenic impacts all have poorly understood<br />
effects on the nearshore ecosystems. The effects of seasonal and climatic changes on the islands’ marine<br />
ecosystems, as well as changes due to episodic events such as typhoons and volcanic eruptions, are also<br />
poorly understood. In order to better understand the linkages between oceanography and ecology, NOAA’s<br />
PIFSC-CRED is taking a two-pronged approach: 1) intensive assessment of oceanographic conditions<br />
and ecological assessments at each island and 2) establishment of long-term oceanographic monitoring.<br />
Intensive oceanographic assessments at each island are accomplished by continuous recording of water<br />
temperatures as a function of depth during all towing operations, shallow-water CTDs (e.g., turbidity and<br />
chlorophyll measurements) at regular intervals around the islands, and deep water CTDs and acoustic doppler<br />
current profiler (ADCP) transects. During the 2003 MARAMP cruise, 40 deep-water (500 m) CTD casts and<br />
271 shallow-water (30 m) CTD casts were deployed along with four surface velocity profile (SVP) drifters, one<br />
CREWS buoy, 11 subsurface temperature recorders (STRs), two SST buoys, and two wave and tide recorders<br />
(WTRs; Figure 15.16).<br />
Methods<br />
Long-term oceanographic monitoring is accomplished by deploying a variety of both internally recording and<br />
near-real-time telemetered instrument platforms and oceanic drifters. These instruments include CREWS<br />
buoys, SST buoys, WTR buoys, ocean data platforms (ODPs), STRs, and satellite drifters. Telemetered data<br />
is being recorded and analyzed by PIFSC-CRED, but the WTR, ODP, and STR data will only be available after<br />
recovery of the instruments during the MARAMP cruise scheduled for <strong>2005</strong>.<br />
Results and Discussion<br />
A number of generalizations can be made about the oceanographic conditions of the Marianas Archipelago<br />
from preliminary analysis of 2003 MARAMP cruise data. All measured SSTs were 0.5-0.8°C degrees warmer<br />
than NOAA’s Pathfinder SST monthly climatology data for the region. Relatively strong cross-island chain<br />
currents exist, and they accelerated at the northern and southern tips of the islands, presumably due to<br />
tides. Oxygen concentrations appear to increase at deeper depths towards the northern end of the chain.<br />
Several areas of hydrothermal seeps have been noted. CTD measurements of these areas at Maug have<br />
shown temperature increases of up to 3°C from surrounding waters, as well as large salinity and other (e.g.,<br />
transmissometry) anomalies. Large plumes of extremely turbid water were noted at Anatahan. These plumes<br />
may be associated with hydrothermal vents, or with volcanic ash runoff from Anatahan’s recent eruption.<br />
Transmissometry values within these plumes are several orders of magnitude greater than other locations<br />
surveyed. Depending on their number and distribution, these features may contribute significantly to local<br />
circulation, nutrient loading, and, particularly in the case of Anatahan, are likely to have deleterious effects,<br />
such as increased sedimentation and runoff, on reef ecosystems.
BENTHIC HABITATS<br />
The State of Coral Reef Ecosystems of the Commonwealth of the Northern Marianas<br />
DEQ Lagoon and Coral Reef Biocriteria Monitoring Programs<br />
Methods<br />
The CNMI’s biocriteria monitoring programs assess marine community shifts in response to nutrient loads,<br />
sediment loads, temperature, turbidity, and other water quality parameters (Rogers, 1990; Telesnicki and<br />
Goldberg, 1995). The CNMI uses weekly water quality data combined with other benthic community data<br />
to evaluate waterbodies. Biocriteria monitoring occurs at the Saipan Lagoon and at various nearshore coral<br />
reefs. Information on methods and results is available in the CNMI Integrated 305(b) and 303(d) Water Quality<br />
Assessment Report (DEQ, http://www.deq.gov.mp/305b%202004%20Final.<strong>pdf</strong>, Accessed 01/12/05).<br />
Ecological surveys were completed to evaluate each waterbody’s ability to support aquatic life in comparison<br />
to a control site. Based on EPA guidance each site was given an aquatic life use support (ALUS) classification<br />
of: 1) non-supportive, 2) partially supportive, or 3) fully supportive. All waterbodies assessed are adjacent to<br />
areas with development on land, and have experienced anthropogenic pollution. As a result, there is no ideal<br />
reference or control site. Biocriteria<br />
monitoring programs, however, were<br />
designed to sample sites along a<br />
disturbance gradient. A degree of<br />
measure was established for each<br />
variable based upon relative site<br />
comparisons (mean and standard<br />
deviations) (Table 15.9).<br />
Table 15.9. A description of how relative measures were used to assign appropriate<br />
Aquatic Life Use Support designations. Source: Houk, 2004.<br />
BIOLOGICAL COMMUNITY MEASURE AQUATIC LIFE USE<br />
SUPPORT DESIGNATION<br />
Less than one standard deviation below the mean Not Supporting<br />
Not different from the mean Partially Supporting<br />
Greater than one standard deviation above the mean Fully Supporting<br />
Results and Discussion<br />
There were three regions in the Saipan Lagoon identified as non-supportive for aquatic life use. The largest is<br />
in the vicinity of Garapan, with high levels of bacteria and nutrients, and low DO associated with urban runoff.<br />
As a result, macroalgae (Caulerpa spp.) dominates benthic communities. Another large, non-supportive<br />
waterbody in the lagoon is adjacent to Beach Road, at the southern end of Garapan. These waters receive<br />
large inputs of stormwater during rainfall events due to adjacent topography, and are also associated with<br />
relatively high bacteria and nutrient levels. The last small, non-supportive waterbody is located adjacent to<br />
Chalan Kanoa village, presumably due to frequent sewage lift station failures. Water quality results agree with<br />
benthic data showing high bacteria and nutrient levels.<br />
Twenty coral reef monitoring locations were used for waterbody evaluation (Table 15.10). Only sites with<br />
appropriate reef development can be used to evaluate water quality, since at other locations, environmental<br />
factors such as exposure, reef slope, and prior geological development have a larger influence on the benthic<br />
community than water quality.<br />
Of the 20 locations surveyed, one was non-supportive, five were fully supportive, and the remaining 14 were<br />
partially supportive of aquatic life use (Table 15.10). Rankings were calculated using two measures: the benthic<br />
community and the coral community. The final ALUS ranking is based upon EPA guidance stating if any one<br />
measure of the community is non-supportive, it is classified as such, and both must be fully supportive for such<br />
a classification. The suggested explanation for most sites resulting in a partially supportive classification is<br />
the larger distances that impaired waters would have to travel to reach the reef monitoring locations compared<br />
with the lagoon monitoring locations.<br />
Fully supportive reefs are present only in relatively unpopulated watersheds or barrier reef locations not<br />
heavily influenced by stormwater runoff. In general, the results of REAs based upon relative measures are<br />
less desirable than data analysis from long-term studies and monitoring programs, which better elucidate<br />
small changes with greater statistical power. However, the present evaluation serves to fill an important role<br />
for regulatory agencies.<br />
Sidebar<br />
Commonwealth of the Northern Marianas<br />
page<br />
423
Commonwealth of the Northern Marianas<br />
page<br />
424<br />
The State of Coral Reef Ecosystems of the Commonwealth of the Northern Marianas<br />
Table 15.10. Results from the CNMI coral reef biocriteria monitoring program for aquatic life use support (ALUS): a ranking of 1=<br />
non-supportive, 2= partially supportive, and 3= fully supportive. The final ALUS ranking is based on EPA guidance material where if<br />
any one measure of the community is non-supportive, it is classified as such, and both must be fully supportive for such classification.<br />
Source: Adapted from Houk, 2004.<br />
SITE NAME <strong>CORAL</strong> COMMUNITY DATA BENTHIC<br />
COMMUNITY DATA<br />
Coral<br />
Community<br />
Evenness<br />
(Margalef’s<br />
D-Statistic)<br />
Rank Coral<br />
Species<br />
Richness<br />
Rank Average<br />
Coral<br />
Geometric<br />
Diameter<br />
Rank Coral<br />
Community<br />
Ranking<br />
Ratio of<br />
Benthic<br />
Substrate<br />
Health<br />
Benthic<br />
Community<br />
Ranking<br />
Aguijan - 2 10.6 3 82 3 9.1 3 3 1.28 3 Fully<br />
Akino 7.3 2 53 2 7.4 2 2 0.93 2 Partially<br />
Barcinas Bay 4.6 1 45 2 8.7 3 2 0.3 1 Partially<br />
Boy Scout 9.7 2 74 2 5.8 2 2 0.81 2 Partially<br />
Coral Gardens 4.4 1 42 1 5.2 2 1 0.75 2 Partially<br />
Coral Ocean Point 8.8 2 72 2 9.2 3 2 0.68 2 Partially<br />
Iota N 4.6 1 21 1 6.5 2 1 0.84 2 Partially<br />
Iota S 5.7 1 28 1 4.6 1 1 0.39 1 Non<br />
Lau Lau Bay #1 8.9 2 50 2 7.3 2 2 0.29 1 Partially<br />
Lau Lau Bay #2 6.6 2 59 2 5 2 2 0.77 2 Partially<br />
Obyan 11.7 3 76 3 8 2 3 0.97 2 Fully<br />
Outside Garapan 8 2 66 2 5.3 2 2 0.17 1 Partially<br />
Outside Grand 8.4 2 79 3 8.8 3 3 1.18 3 Fully<br />
Outside Managaha 8.5 2 77 3 6.1 2 2 1.32 3 Fully<br />
Rota - 6 6.9 2 61 2 3.9 2 2 no data no data Partially<br />
Rota - 5 7.3 2 69 2 5.4 2 2 no data no data Partially<br />
Saipan - 1 9.2 2 47 2 8.7 3 2 0.84 2 Partially<br />
Tinian - 1 11.4 3 65 2 6 2 2 no data no data Partially<br />
West Harbor 8.5 2 49 2 4.5 1 2 0.32 1 Partially<br />
Wing Beach 7.7 2 73 2 6 2 2 1.41 3 Fully<br />
Average 7.9 59.4 6.6 0.78<br />
Standard<br />
Deviation<br />
2 16.7 1.7 0.37<br />
MMT Nearshore Coral Reef Monitoring Program<br />
Methods<br />
This program complements to the DEQ Biocriteria Monitoring Program discussed above. In many cases, sites<br />
and methods show close overlap. However, the primary goal of this data collection program is to understand<br />
the ecological condition of coral reefs in regions that are associated with potential water quality disturbances<br />
(e.g., runoff, sewage outfalls, urban development) as well as reference sites with low anthropogenic influence.<br />
Three to five 50-m transects were used based on standard coral reef survey techniques. Methods are described<br />
in detail in Houk (2000, 2001).<br />
Results and Discussion<br />
The majority of MMT survey sites showed no significant differences within sites over the two to four years of<br />
monitoring (Figure 15.18). When combined with available historical data, however, differences become much<br />
more obvious.<br />
Lau Lau Bay was the location of some of the oldest scientifically valid coral reef surveys using methods<br />
comparable to those of current MMT survey protocols (PBEC, 1984; Randall, 1991). It thus serves as an<br />
exemplar for the utility of monitoring to understand long-term trends in ecological trajectories. Unlike most other<br />
MMT sites, variation in yearly surveys at Lau Lau #1 (southeastern Lau Lau Bay) and Lau Lau #2 (northeastern<br />
ALUS
The State of Coral Reef Ecosystems of the Commonwealth of the Northern Marianas<br />
Figure 15.18. Percent cover of the benthos recorded between 2000 and 2004 at selected long-term monitoring sites on Tinian, Rota,<br />
and Saipan. Source: CNMI MMT (P. Houk), unpublished data.<br />
Sidebar<br />
Commonwealth of the Northern Marianas<br />
page<br />
425
Commonwealth of the Northern Marianas<br />
page<br />
426<br />
The State of Coral Reef Ecosystems of the Commonwealth of the Northern Marianas<br />
Lau Lau Bay recreational dive site)<br />
was clearly present. However, after<br />
four years of surveys, it is still not<br />
apparent if the data are depicting<br />
clear trends in population trajectories<br />
for coral taxa. In comparison to<br />
decadal changes, year-to-year<br />
changes from 2000-2004 at either<br />
site are minimal (Figure 15.19). The<br />
implications of these results are<br />
that continued negative effects from<br />
sedimentation, Acanthaster planci<br />
predation, bleaching, recreational<br />
use, and storm damage have<br />
significantly changed the composition<br />
of the coral community at Lau Lau<br />
Bay. Information on community<br />
change allows regulatory agencies<br />
to more effectively target ecological<br />
baseline conditions for restoring such<br />
environments.<br />
While recent surveys have not<br />
detected major changes in<br />
community composition, comparison<br />
of community evenness between<br />
1991 and 2003-2004 provides<br />
additional information. Evenness is a<br />
measure of how equitably coral cover<br />
is distributed among taxa sampled<br />
within a transect. The decrease in<br />
evenness over this time period is the<br />
result of an increased dominance of<br />
disturbance-resistant taxa such as<br />
Porites spp. (Figure 15.20).<br />
Figure 15.19. Changes in relative abundance of corals over a four year period at two<br />
long term monitoring sites in Lau Lau Bay, Saipan. Source: CNMI MMT (P. Houk),<br />
unpublished data.<br />
Figure 15.20. Change in community evenness at two long-term monitoring sites.<br />
Source: CNMI MMT (P. Houk), unpublished data.
The State of Coral Reef Ecosystems of the Commonwealth of the Northern Marianas<br />
NOAA MARAMP Coral Community Structure Study<br />
Methods<br />
Coral abundance, distribution, condition, biodiversity, and population structure in the CNMI were surveyed at<br />
53 sites during the 2003 MARAMP cruise. Several techniques were used: towed-diver video surveys each<br />
averaging about 2 km in length; REAs each covering between 1000-5000 m 2 and consisting of a quadratbased<br />
coral community survey; direct observations for species diversity, coral disease, and bleaching; and<br />
video benthic surveys at three 50-m transects.<br />
Results and Discussion<br />
A moderately high prevalence (30-50%) of mild coral bleaching was found at the islands north of Pagan,<br />
while a lower prevalence was found at more southerly islands. The highest percentages of coral bleaching<br />
were observed at the two northernmost sites surveyed, Uracas Island and Stingray Shoals. Coral species<br />
diversity was greatest in the southern islands and lowest in the northern islands. The coral cover of oceanic<br />
banks varied along the extent of the archipelago. Stingray Shoals in the north had high coral cover. Arakane,<br />
Pathfinder, and Santa Rosa Banks primarily exhibited spur and groove and carbonate formations. Species<br />
diversity of corals, algae, and fishes was generally low at the oceanic banks due to limited habitat diversity.<br />
NOAA MARAMP Algae Community Structure Study<br />
Methods<br />
Algal surveys using photoquadrats, field observations, and specimen collection were conducted along the<br />
same transect lines used for fish surveys (Vroom, in review).<br />
Results and Discussion<br />
Over 45 genera, representing up to 198 species, were recorded. Macroalgae, with the exception of algal<br />
turf, contained 60% of the total number of algal species known for the Marianas Archipelago (198 out of 332;<br />
Vroom, in review). Large standard deviations of prevalence for most genera indicated that algal composition<br />
differed substantially among individual islands.<br />
BENTHIC HABITAT MAPPING<br />
NOAA CCMA-BT Benthic Habitat Atlas<br />
Methods<br />
NOAA’s CCMA-BT initiated a nearshore benthic habitat mapping program for Guam, American Samoa, and the<br />
CNMI in 2003. IKONOS satellite imagery was purchased from Space Imaging, Inc. for all three jurisdictions, and<br />
used to delineate habitat polygons in a geographic information system (GIS). Habitat polygons were defined<br />
and described according to a hierarchical habitat classification system consisting of 18 distinct biological cover<br />
types and 14 distinct geomorphological structure types.<br />
Results and Discussion<br />
The project was completed in 2004 and resulted in maps of 158.5 km 2 of nearshore habitat in the CNMI. A<br />
series of 96 maps are currently being distributed as a print atlas, on a CD-ROM, and are available on-line<br />
(CCMA-BT, http://biogeo.nos.noaa.gov/products/us_pac_terr/, Accessed 01/12/05). The benthic habitat maps<br />
are depicted in Figure 15.21.<br />
CNMI DEQ and CRM Mapping of the Saipan Lagoon<br />
Detailed habitat maps for the Saipan Lagoon have been developed through a collaborative project between<br />
the DEQ and CRM. Cross-lagoon transects were used to delineate habitats, which were validated using video<br />
transect data. Habitats were mapped in a GIS using orthorectified aerial photography. GIS-based spatial<br />
analysis of maps using IKONOS imagery is also being tested. As this method is refined, prior habitat maps<br />
are being revised for consistency. Preliminary results of this project are currently available (CNMI DEQ, http://<br />
www.deq.gov.mp/mmt/lagoon.htm, Accessed 01/10/05).<br />
Sidebar<br />
Commonwealth of the Northern Marianas<br />
page<br />
427
Commonwealth of the Northern Marianas<br />
page<br />
428<br />
The State of Coral Reef Ecosystems of the Commonwealth of the Northern Marianas<br />
Figure 15.21. Nearshore benthic habitat maps were developed in 2004 by CCMA-BT based on visual interpretation of IKONOS<br />
satellite imagery. For more info, see: http://biogeo.nos.noaa.gov. Map: A. Shapiro.<br />
NOAA MARAMP Benthic Habitat and Multibeam Mapping<br />
During the 2003 MARAMP cruise, PIFSC-CRED scientists conducted numerous benthic habitat mapping<br />
activities including multibeam bathymetric surveys, drop video camera surveys, Quester-Tangent bottom<br />
classification surveys, and diver surveys in water depths to 30 m. All but the last method are discussed<br />
below.<br />
Multibeam Mapping Methods<br />
The R/V AHI, a new PIFSC-CRED vessel, was deployed in the southern islands of the CNMI and Guam in<br />
August and September 2003. The 8 m launch was equipped with a RESON multibeam echosounder and a<br />
POS/MV motion sensor, and produced high resolution depth and backscatter data across a 150 degree swath
The State of Coral Reef Ecosystems of the Commonwealth of the Northern Marianas<br />
of the seafloor. These data have been used to develop many of the high resolution bathymetric maps and<br />
images shown in the ‘Introduction’ section of this chapter; approximately 120 km were surveyed in southern<br />
CNMI. With tremendous support from the DFW, including use of the DFW research vessel, high quality<br />
surveys were completed in water depths ranging from 20 m to greater than 250 m in almost all areas visited.<br />
Backscatter imagery from the multibeam data is being processed and will be combined with other data to<br />
create benthic habitat maps.<br />
Results and Discussion<br />
Multibeam data collected by the R/V AHI were used to prepare gridded bathymetric maps and images of<br />
Rota, Tatsumi Reef, Tinian, Saipan, and Marpi Bank. Bathymetric data processing has been completed,<br />
and the 5-m resolution grids with comprehensive metadata are available on-line (PIFSC-CRED, http://pifsc.<br />
noaa.gov/cred/hmapping/datadownload.html#mariana Accessed: 01/10/05). All gridded data sets are also<br />
being submitted to the NOAA Coral Reef Information System, and multibeam data will be submitted to the<br />
NOAA’s National Geophysical Data Center for general distribution when all processing has been completed.<br />
Processed backscatter imagery, seafloor texture, and video from the towboard and TOAD vehicle surveys will<br />
be integrated in a geographic information system GIS to further characterize benthic habitats.<br />
Integration of multibeam data and other information from the NOAA Ring of Fire cruises with data from the 2003<br />
MARAMP cruise is underway and is scheduled to be complete before the MARAMP cruise in fall <strong>2005</strong>. This<br />
collaborative work will synthesize deep and shallow bathymetric data into a coherent ecosystem-wide view<br />
of the Marianas Archipelago. PIFSC-CRED scientists are also working closely with scientists from CCMA-<br />
BT and Analytical Labs of Hawaii (ALH) to integrate shallow-water benthic habitat information derived from<br />
visually interpreted IKONOS imagery with the extensive multibeam and video data collected during MARAMP<br />
cruises.<br />
As a top priority, PIFSC-CRED scientists are working to synthesize data collected at the Saipan anchorage<br />
site near Saipan Lagoon for use by CNMI resource managers as well as and commercial and military users<br />
of the anchorage. Bathymetric data processing is complete; backscatter imagery processing, seafloor texture<br />
analysis, and analyses of 10 existing video tapes are underway. Scientists from PIFSC-CRED and ALH<br />
returned to Saipan in fall 2004 to collect hundreds of additional video clips that will be used to refine the benthic<br />
habitat maps in this and other important anchorage areas and to develop a method to integrate and crossreference<br />
the map products being developed independently by PIFSC-CRED, CCMA-BT, and ALH scientists.<br />
It is important that analyses of potential impacts to the anchorage areas be completed and evaluated prior to<br />
increasing either the size of the designated anchorage or the number of vessels permitted to use the area.<br />
TOAD Optical Data and Quester Tangent Corp. Bottom Classification<br />
The TOAD is an undersea tethered vehicle that is deployed from the R/V Oscar Elton Sette during night<br />
operations in depths ranging from 20 m to 140 m. Still images and video footage collected via the TOAD are<br />
used to ground-truth data and produce benthic habitat maps. Ninety-five TOAD deployments have resulted<br />
in 69 photographs, 93 video segments, and 109 Quest Tangent Corp. (QTC) files. Analyses of the video data<br />
are underway by the PIFSC-CRED.<br />
Bioacoustics Surveys<br />
During the 2003 MARAMP expedition, a 38-kHz Simrad echosounder was used to record water column<br />
scattering data for bioacoustics surveys. Sound scattering layers (SSLs) are vertically migrating communities<br />
of small fish, shrimp, and squid that occur in waters deeper than 300 m during the day and rise into the photic<br />
zone at night. The observed horizontal migration of the Hawaiian community towards shore at night also<br />
suggests SSLs may play a significant role in the coral reef ecosystem through input of biomass and nutrient<br />
cycling.<br />
These bioacoustic surveys indicate that the SSL off Rota Island is present during both daylight and nighttime<br />
hours at depths between approximately 50 m and 100 m. Aside from Maug Island, which features a persistent<br />
SSL inside the crater, all of the islands surveyed in the CNMI presented an active mesopelagic community<br />
which exhibited diurnal migration.<br />
Sidebar<br />
Commonwealth of the Northern Marianas<br />
page<br />
429
Commonwealth of the Northern Marianas<br />
page<br />
430<br />
The State of Coral Reef Ecosystems of the Commonwealth of the Northern Marianas<br />
ASSOCIATED BIOLOGICAL COMMUNITIES<br />
FISH<br />
DFW <strong>Marine</strong> Sanctuaries Program<br />
Methods<br />
The DFW MSP conducts annual<br />
surveys to assess reef fish abundance<br />
within designated marine sanctuaries.<br />
Using a habitat-based stratified<br />
sampling method, data are collected<br />
along 25 m by 4 m transects located<br />
haphazardly within habitat types.<br />
Methods are described in detail<br />
in DFW technical reports (Trianni,<br />
1999a,b).<br />
Results and Discussion<br />
Abundance results for select foodfish<br />
groups from the Managaha <strong>Marine</strong><br />
Conservation Area (MMCA) are<br />
presented in Figure 15.22. These<br />
data indicate a general decline in<br />
abundance for most of the depicted<br />
fish groups from 2000-2002. The one<br />
exception is for Labridae which shows<br />
a spike in 2001, a trend that was also<br />
observed in other parts of the CNMI<br />
for some groupers. Although the<br />
MMCA was enacted into law in 2000,<br />
enforcement of regulations did not<br />
commence until 2002. Enforcement<br />
benefited significantly from the use of<br />
U.S. Coral Reef Initiative Management<br />
Grant funds, and has been successful<br />
in the past two years. Therefore, the<br />
first three years of the survey are<br />
viewed as preliminary results.<br />
Data collected from 2000-2002<br />
from the SBFR in Rota are depicted<br />
for a range of abundant select<br />
reef fish groups in Figure 15.22.<br />
The abundance estimates for the<br />
SBFR show mostly insignificant<br />
variability among all three years<br />
for the groups depicted. The most<br />
notable exceptions are decreases<br />
in the Lethrinidae and Nasinae, and<br />
increases in the Labridae (Figure<br />
15.22) and terminal phase Scaridae<br />
(Figure 15.23).<br />
Figure 15.22. Abundance estimates from the MMCA (upper panel) and SBFR (lower<br />
panel) for various reef fish families. Source: Trianni, in prep.<br />
Figure 15.23. Abundance of initial and terminal phase Scaridae in the MMCA and<br />
SBFR, 2000-2002. Source: Trianni, in prep.
The State of Coral Reef Ecosystems of the Commonwealth of the Northern Marianas<br />
NOAA MARAMP<br />
Methods<br />
REAs, belt transects (BLTs), SPCs, and towed-diver/video surveys (TDVSs) were used to census diurnally<br />
active shallow-water reef fish assemblages. Each method was replicated at sites within or among the various<br />
habitat types. Fish length-class was estimated for all fish to provide an estimate of numerical size structure<br />
and biomass densities by taxa.<br />
Results and Discussion<br />
Preliminary results from the CNMI are presented here because full analysis of the data from these assessments<br />
is ongoing.<br />
In general, all three methods (BLT, SPC, and TDVS) recorded the highest densities of large fish (all taxa<br />
pooled) at the northernmost islands (Asuncion, Maug, and Uracas) and banks (Stingray Shoals and Supply<br />
Reef; Figure 15.24). High to moderate densities occurred throughout the central part of the chain (to Sarigan).<br />
Densities of the largest jacks (Figure 15.25) and groupers (Figure 15.25) were highest at the northern end of<br />
the archipelago, as observed by TDVSs. Moderate densities occurred through the central part of the chain,<br />
a pattern supported when smaller fish were measured using the SPC (>25 cm total lenght [TL]) and BLT (>20<br />
cm TL) methods. The largest (i.e.,>50 cm TL) snappers occurred at the northernmost islands, with high to<br />
moderate densities south to Anatahan (Figure 15.26). The largest surgeonfish occurred at Stingray Shoals<br />
in the far northwest, with moderate densities extending from the northern islands to the central part of the<br />
chain (Figure 15.26). Other target families (e.g., parrotfish, wrasses, and emperors) also exhibited the same<br />
trends found in surgeonfish. However, there were some exceptions, such as shark which occurred in low<br />
densities in the north. Overall, the 2003 PIFSC-CRED fish surveys found that common fishery target species<br />
in the Marianas Archipelago were most abundant in the northern islands, although less abundant than about a<br />
decade ago, particularly around the southern populated islands. However, these results, together with REAs<br />
surveys, found highest fish diversity at the southern islands (especially for emperors, wrasses, squirrelfish, and<br />
parrotfish), moderate fish diversity at the western banks, and lowest fish diversity at the northern islands.<br />
High densities of recently recruited young juveniles were present for a number of species at many of the<br />
northern reefs, with very high densities of the red-toothed triggerfish (Odonus niger) at Rota. In contrast, fish<br />
at Anatahan were nearly absent along some transect lines due to the major volcanic eruption of this island only<br />
four months earlier. Visibility was very poor (average 1-2 m) around much of the island due to suspended ash<br />
in the water column, which also buried much of the reef.<br />
Figure 15.24. All three fish survey methods used during the NOAA MARAMP cruise documented a high abundance of large fish<br />
(all taxa pooled) at the northern islands and banks in the Marianas Archipelago. Source: PIFSC-CRED (R. Schroeder), unpublished<br />
data.<br />
Sidebar<br />
Commonwealth of the Northern Marianas<br />
page<br />
431
Commonwealth of the Northern Marianas<br />
page<br />
432<br />
The State of Coral Reef Ecosystems of the Commonwealth of the Northern Marianas<br />
Figure 15.25. Number and biomass of Jacks and Groupers observed in the CNMI by sampling method. Source: PIFSC-CRED (R.<br />
Schroeder), unpublished data.
The State of Coral Reef Ecosystems of the Commonwealth of the Northern Marianas<br />
Figure 15.26. Number and biomass of Snappers and Surgeonfish observed in the CNMI by sampling method. Source: PIFSC-CRED<br />
(R. Schroeder), unpublished data.<br />
Sidebar<br />
Commonwealth of the Northern Marianas<br />
page<br />
433
Commonwealth of the Northern Marianas<br />
page<br />
434<br />
The State of Coral Reef Ecosystems of the Commonwealth of the Northern Marianas<br />
INVERTEBRATES<br />
NOAA MARAMP Invertebrate Surveys<br />
Methods<br />
Surveys focusing on marine invertebrates other than corals were performed in conjunction with surveys of coral<br />
and macroalgae, collectively termed the benthic survey. Two types of data on the benthic macroinvertebrate<br />
fauna of the CNMI were obtained: 1) quantitative data on the abundance of conspicuous species using BLTs<br />
and 2) qualitative information on the occurrence of other invertebrate species at each site.<br />
Results and Discussion<br />
The dominant invertebrate groups observed throughout the CNMI were sponges and echinoids. All sites had<br />
a diverse assemblage of encrusting and boring species of sponges. Terpios hoshinota, a coral killing sponge,<br />
was observed in Guguan and Uracas. The most common echinoid throughout the northern Mariana Islands<br />
was the small black-spined sea urchin, Echinostrephus aciculatus, with densities of up to 2-3/m 2 . The most<br />
abundant sea star observed was the fissiparous Linckia multifora, with high densities that reached up to 0.75/<br />
m 2 . The coral-predatory COTS, acanthaster planci, was present in Agrihan, Pagan, Anatahan, Saipan, and<br />
Rota but was not observed at densities more than 0.06/m 2 .<br />
The dominant genera of alcyoniid soft corals were Sarcophyton, Lobophytum, Sinularia, and Cladiella; soft<br />
corals were present at all of the islands and shoals, except in Uracas, where soft corals were almost completely<br />
absent. Among the mollusks, the giant clam Tridacna maxima was present at all CNMI islands and was<br />
especially abundant in Guguan and Maug Islands. The maximum density recorded was along the interior<br />
slope of the eastern end of the northern island, where densities reached 0.5-1/m 2 .<br />
MMT Nearshore Coral Reef Monitoring Program<br />
Methods<br />
This program was previously described in this chapter and the data presented here are based on replicate 50<br />
m by 2 m transects. Methods are described in detail in Houk (2000, 2001).<br />
Results and Discussion<br />
Variables measured at the majority of MMT monitoring sites showed no significant within-site differences in<br />
invertebrate abundances during the two to four years of monitoring. Several sites showed significant variation<br />
in sea urchin abundance (Figure 15.27). Despite the magnitude of these changes, they are not consistent<br />
among or within sites. These data are being further analyzed to examine relationships with other parameters<br />
monitored by the MMT. It is more likely that an understanding of this variation will depend on the collection of<br />
additional, long-term data to clarify the nature of the population dynamics for these animals.
The State of Coral Reef Ecosystems of the Commonwealth of the Northern Marianas<br />
Figure 15.27. Invertebrate abundance at selected long-term monitoring sites at Tinian, Rota, and Saipan. Source: CNMI MMT (P.<br />
Houk), unpublished data.<br />
Sidebar<br />
Commonwealth of the Northern Marianas<br />
page<br />
435
Commonwealth of the Northern Marianas<br />
page<br />
436<br />
The State of Coral Reef Ecosystems of the Commonwealth of the Northern Marianas<br />
TURTLES<br />
Methods<br />
Sea turtles have been surveyed in the nearshore waters of CNMI southern arc islands (Kolinski et al., 2001,<br />
2004). During the 2003 MARAMP cruise, methods were modified for use in the northern arc islands (Kolinski<br />
et al., in prep.) and at isolated bank and reef systems (Kolinski et al., in press). A combination of towed-diver,<br />
dive, and surface surveys were employed to assess turtle presence.<br />
Results and Discussion<br />
Resident Turtles<br />
Previous surveys suggest roughly 1,000 to 2,000 mainly immature green turtles (Chelonia mydas) reside in<br />
CNMI southern arc waters (Kolinski et al., 2004; Figure 15.28). Hawksbill turtles (Eretmochelys imbricata)<br />
have been infrequently sighted in these waters, and transitory visits by leatherbacks (Dermochelys coriacea)<br />
and olive ridleys (Lepidochelys olivacea) are known. Extensive examination of seven shallow-water (≤ 40 m)<br />
isolated reef systems within the Marianas Archipelago identified only two immature and one juvenile/adult green<br />
turtles, suggesting that these habitats support minimal numbers of this species, perhaps for transitory periods<br />
of time (Kolinski et al., in press). Data analysis of turtle observations from northern arc waters is in progress.<br />
For the nine surveyed islands (Figure<br />
15.28), 166 green, four hawksbill, and<br />
three unidentified turtle observations<br />
were made. A projected upper<br />
boundary for the resident green turtle<br />
population size throughout the CNMI<br />
portion of the Marianas Archipelago<br />
is not likely to exceed 2,700 turtles<br />
(Kolinski et al., in prep). Hawksbill<br />
numbers likely do not exceed 50<br />
individuals.<br />
Nesting<br />
Small numbers of green turtles<br />
are known to nest on the southern<br />
arc islands of the CNMI (Wiles et<br />
al., 1989, 1990; Pultz et al., 1999;<br />
McCoy, 1997; Kolinski et al., 2001; Ilo<br />
and Manglona, 2001). There are no<br />
reports of turtles nesting at northern<br />
arc island locations. Available<br />
northern arc beach substrate is<br />
limited and consists mainly of black<br />
volcanic sands and ash, although<br />
beaches at Maug and Pagan also<br />
include calcareous sands (Kolinski,<br />
pers. obs.).<br />
Figure 15.28. Upper panel shows projected population structures of Chelonia mydas<br />
at surveyed CNMI southern-arc islands. Source: Kolinski et al., 2004. Lower panel<br />
shows the numbers of observations of Chelonia mydas at surveyed CNMI northernarc<br />
islands. Source: Kolinski et al., in prep.
The State of Coral Reef Ecosystems of the Commonwealth of the Northern Marianas<br />
Overall Condition and Summary of Analytical Results<br />
Coral reef ecosystems in the CNMI are, on the whole, reasonably healthy. However, it must be recognized<br />
that coral reef ecosystems in the CNMI cannot be realistically treated as a single entity since the geology,<br />
oceanography, ecological history, and human activities vary widely across the 14 islands and associated reef<br />
shoals and banks. Biological diversity, across coral reef taxa, is variable among islands and isolated reefs,<br />
with limited data indicating that offshore banks and reefs support lower diversity, probably due to lower habitat<br />
diversity.<br />
Anthropogenic effects, such as nonpoint source pollution and fishing pressure, have clearly affected areas<br />
in proximity to the populated southern islands. While these stressors are actively being managed by local<br />
government agencies, some solutions, such as the replacement of sewer infrastructure, exceed locally<br />
available funding. From a fisheries perspective, the northern islands and more distant banks and reefs appear<br />
to be in better condition than those closer to population centers.<br />
Environmental stressors such as volcanic ashfall, elevated SST, and Acanthaster predation have clearly had<br />
localized negative effects on coral reefs in the Marianas. Anthropogenic stressors also create an additive, if<br />
not synergistic, increase in coral reef degradation. It is imperative to support and expand monitoring programs<br />
that provide information to managers which helps them address both natural and anthropogenic sources of<br />
coral reef degradation.<br />
CURRENT CONSERVATION MANAGEMENT ACTIVITIES<br />
Saipan Lagoon and Tinian <strong>Marine</strong> Management Areas<br />
Activities within the Saipan Lagoon fall under the general jurisdiction of several CNMI government agencies.<br />
The CRM has designated the lagoon as part of an Area of Particular Concern and is involved in protecting<br />
the lagoon’s environment by preventing and reducing user conflicts. One of CRM’s primary activities in the<br />
lagoon is the regulation of commercial marine sports. The Commonwealth Ports Authority further regulates<br />
the Tanapag Harbor and Harbor Channel. Management of these areas also falls under the jurisdiction of<br />
DFW, DEQ, and Marianas Public Lands Authority.<br />
<strong>Marine</strong> Protected Areas<br />
Current opinion supports the need for permanent spatial and temporal reef fish sanctuaries in the hope that<br />
they will act as insurance against fishery “collapse.” Setting aside MPA to serve as spawning stock areas and<br />
to ensure habitat integrity, not only for coral reef fish but for food organisms as well, may be the most effective<br />
management tool available to maintain levels of spawning stock biomass necessary to replenish or sustain<br />
coral reef fisheries.<br />
In 1985, the concept of the establishment of marine parks in the CNMI was explored when the CRM studied<br />
whether to propose marine parks on the populated southern islands of Saipan, Tinian, and Rota to promote<br />
and enhance tourism (PBEC, 1985). More recently, concern over declining catch rates around Saipan, Tinian,<br />
and Rota raised concern over management protocols for coral reef fisheries (Trianni, 1998b).<br />
In 1998, the DFW MSP commenced a project with funding from the Sportfish Restoration Act (16 USC § 777-<br />
777k) administered by the USFWS. The goal of the project was to provide funding for the monitoring and<br />
assessment of coral reef fish in existing no-take MPAs (nMPAs) in the CNMI, as well as to conduct surveys of<br />
all CNMI islands for the designation of additional nMPAs. When the project commenced, the SBFR in Rota<br />
was the only nMPA in existence, as it was designated in 1994. Shortly after the DFW MSP project commenced,<br />
a bill was introduced to create the Tinian <strong>Marine</strong> Sanctuary (TMS; Tinian Island) and MMCA (Saipan Lagoon).<br />
Geographic placement of these nMPAs generally followed the suggestions of the 1985 CRM-funded study,<br />
although the ”no-take” provisions were added. The MMCA was subsequently passed into law in August 2000,<br />
while the TMS has yet to be enacted. Law enforcement of the SBFR did not begin until late 2000, while<br />
MMCA rules and regulations are being developed. DFW enforcement activities have increased over the<br />
past two years with the increased funding provided by a Coral Reef Initiative Management Grant. The funds<br />
have provided for two boats, dive gear, dive training, and workshops and support two conservation officer<br />
Sidebar<br />
Commonwealth of the Northern Marianas<br />
page<br />
437
Commonwealth of the Northern Marianas<br />
page<br />
438<br />
The State of Coral Reef Ecosystems of the Commonwealth of the Northern Marianas<br />
positions. Monitoring of the MMCA has resulted in several arrests for illegal spearfishing and use of rotenone,<br />
a poison derived from the naturalized plant Derris sp. In addition to enforcement activities, DFW has initiated<br />
an education and outreach program to promote compliance with MPA and fisheries regulations.<br />
Education and Outreach<br />
Support for educational efforts is increasing with recognition that education has an important role in marine<br />
conservation. The DFW has a dedicated education specialist to visit schools and educate students about<br />
endangered species issues. MPA pamphlets were produced and distributed by DFW on Rota and Saipan, and<br />
these pamphlets are currently being updated and translated into Chammoro, Carolinian, Mandarin, Tagalog,<br />
Japanese, and Korean in an attempt to educate all CNMI population sectors about MPAs. In addition, the<br />
Saipan DLNR erected educational signs at entrances to the Bird and Forbidden Island MPAs.<br />
The DEQ has a strong education program targeting nonpoint source pollution and coral reef water quality<br />
issues. DEQ’s Nonpoint Source Program also coordinates with EPA, NOAA, and CRM to implement the<br />
requirements of EPA’s Coastal NonPoint Source Pollution Control Program (pursuant to Section 6217 of the<br />
Coastal Zone Reauthorization Amendments of 1990). NOAA funding recently supported the short-term hiring<br />
of a coral reef education specialist to assist DEQ, DFW, and CRM to build the coral reef education components<br />
of their outreach programs.<br />
OVERALL CONCLUSIONS AND RECOMMENDATIONS<br />
The recent expansion of coral reef assessment, mapping, and monitoring in the CNMI is, in part, driven by<br />
funding from the U.S. Coral Reef Initiative to provide important baseline data. Without a firm understanding of<br />
the actual condition and ecological trends on local coral reefs, CNMI managers are forced to follow precautionary<br />
measures, rather than base decisions on locally reliable data. While this is changing with the maturation of<br />
local monitoring and assessment programs and the initiation of the NOAA MARAMP, understanding of Mariana<br />
Island coral reefs is far from complete. Long-term monitoring of fisheries, water quality, and other ecological<br />
parameters will be necessary to support management efforts.<br />
Through an extensive process of stakeholder meetings, the CNMI has developed local action strategies that<br />
identify those areas of greatest concern for the continued effective management of local coral reefs. These<br />
strategies provide a blueprint for how the CNMI hopes to address the identified areas of concern. Nonpoint<br />
source pollution, fishing pressure, and improvement of reef-related education and outreach were identified<br />
as the three areas of highest priority. While these areas have been the management focus even before the<br />
formation of the Commonwealth, the boom in development and concomitant population growth have outpaced<br />
the ability of local government to effectively manage them. The U.S. Coral Reef Initiative, through NOAA,<br />
EPA, USFWS, and other organizations, has provided tremendous support to build local capacity to effectively<br />
manage coral reef ecosystems.
REFERENCES<br />
The State of Coral Reef Ecosystems of the Commonwealth of the Northern Marianas<br />
Adams, A.T., C.V. Alfred, B.L. Bukurrou, A.J. Cruz, T. Ilo, L. Rasa, R. Seman, Taitano, J. Taman, T. Mendiola, D. Santos<br />
and H. King. 1994. Assessment of the Northern Marianas Trochus resource and recommendations for management of<br />
the fishery. Draft report of the CNMI/SPC Fisheries Survey Team to the Chief of the Division of Fish and Wild Life, Saipan.<br />
36 pp.<br />
Amesbury, S.S., D.R. Lassuy, R.F. Myers and V. Tyndzik. 1979. A survey of the fish resources of Saipan Lagoon. <strong>Marine</strong><br />
Lab Technical Report 52. University of Guam. 58 pp.<br />
Carrell, T. 1991. Submerged Cultural Resources Assessment of Micronesia. Southwestern Cultural Resources Center<br />
Professional Papers 36. Southwestern Cultural Resources Center, Santa Fe, New Mexico. 624 pp.<br />
Duenas and Associates, Inc. 1997. Saipan lagoon use management plan, Survey of sea cucumbers and fish in the<br />
Saipan lagoon, Northern Mariana Islands (NMI). Duenas and Associates, Inc. Report 97-6F. Prepared for NMI Coastal<br />
Resources Management Office.<br />
Eldredge, L.G and R.K. Kropp. 1985. Volcanic ashfall effects on intertidal and shallow-water coral reef zones at Pagan,<br />
Mariana Islands. pp. 4: 195-200. In: Proceedings of 5th International Coral Reef Congress.<br />
Embley, R.W. 2004. Explorations of Mariana Arc Volcanoes Reveal New Hydrothermal Systems. EOS Transactions<br />
American Geophysical Union 85 (4): 37-44.<br />
Fritz, G. 1986. The Chamorro: A history and ethnography of the Marianas. Translation by E. Craddock. CNMI Division of<br />
Historic Preservation, Saipan. 59 pp.<br />
Gochfeld, D. 2004. University of Mississippi, School of Pharmacy. Personal communication.<br />
Graham, T. 1994. Biological Analysis of the Nearshore Reef Fish Fishery of Saipan and Tinian. CNMI Department of Fish<br />
and Wildlife, Saipan, CNMI. DFW Tech. Report. 98-02. 64 pp.<br />
Houk, P. 2000. State of the reef report for five sites on Rota Island, CNMI. CNMI Division of Environmental Quality.<br />
Houk, P. 2001. State of the reef report for Saipan Island, Commonwealth of the Northern Mariana Islands. CNMI Division<br />
of Environmental Quality. 59 pp.<br />
Houk, P. (ed.) 2004. Commonwealth of the Northern Mariana Islands Integrated 305(b) and 303(d) Water Quality Assessment<br />
Report. Commonwealth of the Northern Mariana Islands, Division of Environmental Quality. 60 pp.<br />
Ilo, L.I. and J.M. Manglona. 2001. Rota turtle assessment report. Report prepared for the Division of Fish and Wildlife,<br />
Commonwealth of the Northern Mariana Islands. 22 pp.<br />
Johannes, R.E. 1979 Improving shallow water fisheries in the Northern Mariana Islands. Unpublished Report. 25 pp.<br />
Kolinski, S.P., D.M. Parker, L.I. Ilo and J.K. Ruak. 2001. An assessment of the sea turtles and their marine and terrestrial<br />
habitats at Saipan, Commonwealth of the Northern Mariana Islands. Micronesica 34: 55-72.<br />
Kolinski, S.P., L.I. Ilo and J.M. Manglona. 2004. Green turtles and their marine habitats at Tinian and Aguijan, with projections<br />
on resident turtle demographics in the southern arc of the Commonwealth of the Northern Mariana Islands. Micronesica<br />
37: 95-116.<br />
Kolinski, S.P., R.K. Hoeke, S.R. Holzwarth and P.S. Vroom. In press. Sea turtle abundance at isolated reefs of the Mariana<br />
Archipelago. Micronesica 37: 287-296.<br />
Kolinksi, S.P., S.R. Holzwarth, R.K. Hoeke and R. O’Conner. In preparation. Sea turtle demographics in the northern-arc<br />
islands of the Mariana Archipelago.<br />
Littler, D. S. and M.M. Littler. 2003. South Pacific Reef Plants: A Divers’ Guide to the Plant Life of South Pacific Coral<br />
Reefs. OffShore Graphics Inc., Washington, D.C. 331 pp.<br />
McCoy, M.A. 1997. The traditional and ceremonial use of the green turtle (Chelonia mydas) in the Northern Mariana<br />
Islands with recommendations for its use in cultural events and education. Unpublished Report for the Western Pacific<br />
Regional Fishery Management Council and the University of Hawaii Sea Grant College Program. 87 pp.<br />
Sidebar<br />
Commonwealth of the Northern Marianas<br />
page<br />
439
Commonwealth of the Northern Marianas<br />
page<br />
440<br />
The State of Coral Reef Ecosystems of the Commonwealth of the Northern Marianas<br />
Michael, M. 2004. Dive Rota. Rota, CNMI. Personal communication. NOAA. 2003. Submarine Ring of Fire 2003. Available<br />
from the internet URL: http://oceanexplorer.noaa.gov/explorations/03fire/welcome.html.<br />
NOAA (National Oceanic and Atmospheric Administration). 2004. Submarine Ring of Fire 2004. Available from the internet<br />
URL: http://oceanexplorer.noaa.gov/explorations/04fire/welcome.html.<br />
PBEC (Pacific Basin Environmental Consultants, Inc.) 1984. Final Report: Biological and physical survey of Bahia Laulau,<br />
Saipan. CNMI Planning/Energy Office. 159 pp.<br />
PBEC (Pacific Basin Environmental Consultants, Inc.). 1985. CNMI <strong>Marine</strong> Parks Management Plan. CNMI Coastal Resource<br />
Management Office. 88 pp.<br />
Pultz, S., D. O’Daniel, S. Krueger, H. McSharry and G. Balazs. 1999. <strong>Marine</strong> turtle survey on Tinian, Marianas Islands.<br />
Micronesia 32: 85-94.<br />
Randall, R.H. 1991. Community structure of the corals along the fringing reefs bordering Unai Laolao Kattan, Unai Baput,<br />
and Unai Laolao, Saipan, CNMI. Cheenis Pacific Company.<br />
Richmond, R.H. and S. Romano. 1997. Survey of the Coral Gardens, Rota, CNMI. Report to the CNMI Coastal Resources<br />
Management Office. 12 pp.<br />
Rogers, C.S. 1990. Responses of coral reefs and reef organisms to sedimentation. <strong>Marine</strong> Ecology Progress Series 62:<br />
185-202.<br />
Sigurdsson, H., B. Houghton, S. McNutt, H. Rymer and J. Stix (eds.). 2000. Encyclopedia of volcanoes. Academic Press,<br />
San Diego. 1417 pp.<br />
Spoehr, A. 2000. Saipan: Ethnology of a War-Devastated Island, Second Edition. CNMI Division of Historic Preservation,<br />
Saipan. 365 pp.<br />
Telesnicki, G.J. and W.M. Goldberg. 1995. Effects of turbidity on the photosynthesis and respiration of two South Florida<br />
reef species. Bulletin of <strong>Marine</strong> Science 57(2): 527-539.<br />
Tomokane, J. 1997. <strong>Marine</strong> Monitoring Team Survey Report: Nago 16 Vessel Grounding Unpublished Report. Coastal<br />
Resources Management Office. 3 pp.<br />
Trianni, M.S. 1998a. Qualitative Assessment Surveys of World War II Ordinance Sites in Coral Reef Habitats at the Island<br />
of Rota: A Historical Record. Division of Fish and Wildlife Technical Report 98-02. Commonwealth of the Northern<br />
Mariana Islands, Saipan. 17 pp.<br />
Trianni, M.S. 1998b. Summary and further analysis of the nearshore reef fishery of the Northern Mariana Islands. Commonwealth<br />
of the Northern Mariana Islands, Division of Fish and Wildlife Technical Report 98-03, Saipan. 64 pp.<br />
Trianni, M.S. 1999a. Estimation of reef fish abundance and benthic habitat composition in the proposed Managaha <strong>Marine</strong><br />
Conservation Area. Commonwealth of the Northern Marinan Islands, Saipan. Division of Fish and Wildlife Technical<br />
Report 99-03. Commonwealth of the Northern Mariana Islands, Saipan. 16 pp.<br />
Trianni, M.S. 1999b. Estimation of reef fish abundance and benthic habitat characteristics in the proposed Tinian <strong>Marine</strong><br />
Sanctuary. Commonwealth of the Northern Marinan Islands, Saipan. Commonwealth of the Northern Mariana Islands,<br />
Division of Fish and Wildlife Technical Report 99-02, Saipan. 21 pp.<br />
Trianni, M.S. 2002. Summary of data collected from the sea cucumber fishery on Rota, CNMI. SPC Beche-de-mer Information<br />
Bulletin 16: 5-11.<br />
Trianni, M.S. In preparation. Determining Reef Fish Abundance in <strong>Marine</strong> Protected Areas in the Northern Marinana<br />
Islands.<br />
Tsuda, R.T. (ed.) 1971. Status of Acanthaster planci and Coral Reefs in the Mariana and Caroline Islands, June 1970 to<br />
May 1971. Technical Report No. 2. University of Guam <strong>Marine</strong> Lab.<br />
UNISYS. 2004. Typhoon data for the Western Pacific Ocean. Available from the internet URL: http://weather.unisys.<br />
com/hurricane.<br />
Wiles, G.J, A.B. Amerson, Jr. and R.E. Beck, Jr. 1989. Notes on the herpetofauna of Tinian, Mariana Islands. Micronesica<br />
22: 107-118.
The State of Coral Reef Ecosystems of the Commonwealth of the Northern Marianas<br />
Wiles, G.J., G.H. Rodda, T.H. Fritts and E.M. Taisacan. 1990. Abundance and habitat use of reptiles on Rota, Mariana<br />
Islands. Micronesica 23: 153-166.<br />
Worthington, D. and M. Michael. 1996. An assessment of the unexploded ordinance operations conducted on Rota by the<br />
Department of the Navy and the CNMI Emergency Management Office in May and June 1996. Report for the Administrative<br />
Record of the CNMI Emergency Management Office, Saipan. 9 pp.<br />
Sidebar<br />
Commonwealth of the Northern Marianas<br />
page<br />
441
Guam<br />
page<br />
442<br />
The State of Coral Reef Ecosystems of Guam<br />
Val Porter 1 , Trina Leberer 2 , Mike Gawel 3 , Jay Gutierrez 1 , David Burdick 4 , Victor Torres 5 , and Evangeline Lujan 4<br />
INTRODUCTION AND SETTING<br />
This report is an assessment of the status of coral reef ecosystems in Guam from 2002 to 2004. Data on<br />
coral reef ecosystems were synthesized from assessments and monitoring programs conducted by local and<br />
federal organizations. Included in the report are assessments of the environmental and anthropogenic stressors<br />
affecting coral reefs, information on data gathering activities and the condition of coral reef ecosystem<br />
resources, a description of current conservation management activities, and overall conclusions and recommendations<br />
to monitor and manage coral reef ecosystems better in the future.<br />
Guam, a U.S. territory located at 13 o 28΄N, 144 o 45΄E, is the southernmost island in the Mariana Archipelago.<br />
It is the largest island in Micronesia, with a land mass of 560 km 2 and a maximum elevation of approximately<br />
405 m (Figure 16.1). It is also the most heavily populated island in Micronesia, with a population of about<br />
164,000 people (July 2003 estimate). The northern portion of the island is relatively flat and consists primarily<br />
of uplifted limestone. The island’s principle source aquifer “floats” on denser sea water within the limestone<br />
plateau. It is recharged from rainfall percolating through surface soils (Guam Water Planning Committee,<br />
1998). The average annual rainfall is 218 cm (NOAA National Weather Service, http://www.prh.noaa.gov/<br />
guam/normal.html, Accessed 4/17/04). The southern half of the island is primarily volcanic, with more topographic<br />
relief and large areas of highly erodible lateritic soils (SCS, 1988). This topography creates a number<br />
of watersheds throughout the southern areas which are drained by 96 rivers (Best and Davidson, 1981).<br />
The island possesses fringing reefs, patch reefs, submerged reefs, offshore banks, and barrier reefs surrounding<br />
Cocos Lagoon in the south and part of Apra Harbor (Randall and Eldredge, 1976). However, only Apra<br />
Harbor has substantial lagoonal habitats deeper than 10 m (Paulay, 2003a). The reef margin varies in width,<br />
from tens of meters along some of the windward areas, to over 781 m in Pago Bay (Randall and Eldredge,<br />
1976). The combined area of coral reef and lagoon is approximately 69 km 2 in nearshore waters between 0-3<br />
nmi (5.5 km), and an additional 110 km 2 in U.S. waters greater than 3 nmi offshore (Hunter, 1995). Sea surface<br />
temperatures (SSTs) range from about 27-30°C, with higher temperatures measured on the reef flats and<br />
in portions of the lagoons (Paulay, 2003a). Although Guam’s marine life is not as diverse as the neighboring<br />
islands to the south (Palau and the Federated States of Micronesia), it lies relatively close to the Indo-Pacific<br />
center of coral reef biodiversity (Veron, 2000). Table 16.1 includes the number of currently documented species<br />
for major coral reef taxa on Guam or in some cases for the Mariana Islands as a whole.<br />
Guam’s coral reefs are an important component of the island’s tourism industry. The reefs and the protection<br />
that they provide make Guam a popular tourist destination for Asian travelers. According to the Guam<br />
Economic Development Authority, the tourism industry accounts for up to 60% of the government’s annual<br />
revenues and provides more than 20,000 direct and indirect jobs. Guam’s primary tourist market is Asia, with<br />
the majority (70-80%) of tourists arriving from Japan. As such, Guam’s economy is tied to that of Asia, which<br />
has suffered a series of setbacks starting in the early 1990s involving the Asian economic crisis, a massive<br />
earthquake and several devastating typhoons, the terrorist attacks on September 11, 2001, the severe acute<br />
respiratory syndrome outbreak, and the war in Iraq that began in 2003. Despite these events, Guam still<br />
hosted nearly one million visitors in 2003 (GVB, 2004), and expects to host over one million in 2004 (GHRA,<br />
2004).<br />
Traditionally, coral reef fishery resources formed a substantial part of the local Chamorro community’s diet<br />
and included finfish, invertebrates, and sea turtles (Amesbury and Hunter-Anderson, 2003). Today coral reef<br />
resources are both economically and culturally important. Although somewhat displaced from the diet by<br />
westernization and declining stocks, reef fish are still found at the fiesta table and at meals during the Catholic<br />
Lenten season. Many of the residents from other islands in Micronesia continue to include reef fish as a staple<br />
of their diet (Amesbury and Hunter-Anderson, 2003). Sea cucumbers, sea urchins, a variety of crustaceans,<br />
1 Division of Aquatic and Wildlife Resources, Guam Department of Agriculture, Mangilao, Guam<br />
2 The Nature Conservancy, Asia/Pacific Region, Micronesia Program, Kolonia, Pohnpei FM<br />
3 Guam Environmental Protection Agency, Government of Guam, Barrigada, Guam<br />
4 Guam Coastal Management Program, Bureau of Statistics and Plans, Government of Guam, Hagatna, Guam<br />
5 Bureau of Statistics and Plans, Government of Guam, Hagatna, Guam
Figure 16.1. Locator map for Guam. Map: A. Shapiro.<br />
The State of Coral Reef Ecosystems of Guam<br />
Sidebar Guam<br />
page<br />
443
Guam<br />
page<br />
444<br />
The State of Coral Reef Ecosystems of Guam<br />
Table 16.1. A recent compendium of over 5,000 species of marine organisms documented in Guam. Source: various authors,<br />
Micronesica 35-36, 2003.<br />
GROUP NUMBER <strong>OF</strong> SPECIES SOURCES<br />
Seagrasses 3 Lobban and Tsuda, 2003<br />
Benthic Macroalgae 237 Lobban and Tsuda, 2003<br />
Sponges 110 Kelly et al., 2003<br />
Foraminiferan 303 Richardson and Clayshulte, 2003<br />
Platyhelminthes 59 Newman et al., 2003<br />
Hydroids 42 Kirkendale and Calder, 2003<br />
Polychaetes 104 Bailey-Brock, 2003<br />
Non-scleractinian Corals 119 Paulay et al., 2003b<br />
Scleractinian Coral 377 * Randall, 2003<br />
Hydrozoan Corals 26 * Randall, 2003<br />
Bivalves 339 Paulay, 2003c<br />
Prosobranch Gastropods 895 Smith, 2003<br />
Opistobranch Gastropods 467 Carlson and Hoff, 2003<br />
Cephalopods 21 Ward, 2003<br />
Cirripedia 24 Paulay and Ross, 2003<br />
Crustaceans 663 Ahyong and Erdmann, 2003; Paulay et al., 2003a; Castro, 2003;<br />
Tan and Ng, 2003; Kensley, 2003<br />
Echinodermata 196 Paulay, 2003b; Starmer, 2003; Kirkendale and Messing, 2003<br />
Ascidians 117 Lambert, 2003<br />
Sea Turtles 3 Eldredge, 2003b<br />
<strong>Marine</strong> Mammals 13 Eldredge, 2003b<br />
Shorefishes 1019 * Myers and Donaldson, 2003<br />
Total Species 5137<br />
* Number of species is for the entire Mariana Archipelago. The actual number for Guam may be lower.<br />
molluscs, and marine algae are also eaten locally. In addition to the cash and subsistence value of edible<br />
fish and invertebrates, reef-related fisheries are culturally important as family and group fishing is a common<br />
activity in Guam’s coastal waters.<br />
Over 10% of Guam’s coastline has been set aside in five marine preserves: Tumon Bay, Piti Bomb Holes,<br />
Sasa Bay, Achang Reef Flat, and Pati Point. The preserves were established in 1997 as a response to decreasing<br />
reef fish stocks, but were not fully enforced until 2001. Fishing activity is restricted in the preserves<br />
with limited cultural take permitted in three of the five areas. The preserves are complemented by the War in<br />
the Pacific National Historical Park, Ritidian National Wildlife Refuge, Guam Territorial Seashore Park, Orote<br />
Penisula Ecological Reserve Area (ERA), and Haputo ERA. While management practices are enforced in the<br />
five marine preserves, there is currently limited management and enforcement in the other areas.<br />
The health of Guam’s coral reefs varies considerably, depending on a variety of factors including geology, human<br />
population density, level of coastal development, level and types of uses of marine resources, oceanic<br />
circulation patterns, and frequency of natural disturbances, such as typhoons and earthquakes. Many of<br />
Guam’s reefs have declined in health over the past 40 years. The average live coral cover on forereef slopes<br />
was approximately 50% in the 1960s (Randall, 1971), but dwindled to less than 25% live coral cover by the<br />
1990s with only a few having over 50% live cover (Birkeland, 1997). In the past, however, Guam’s reefs have<br />
recovered after drastic declines. For example, an outbreak of the crown-of-thorns starfish (COTS) in the early<br />
1970s reduced coral cover in some areas from 50-60% to less than 1%. Twelve years later, greater than<br />
60% live coral cover was recorded in these areas (Colgan, 1987). A more distressing indicator of the health<br />
of Guam’s coral reefs is the marked decrease in rates of coral recruitment. In 1979, Birkeland et al. (1982)<br />
obtained 0.53 coral recruits per plexiglass fouling panel. The use of similar materials and experimental design<br />
in 1989 and 1992 resulted in just 0.004 and 0.009 coral recruits per plexiglass fouling plates, respectively<br />
(Birkeland, 1997).
ENVIRONMENTAL AND ANTHROPOGENIC STRESSORS<br />
The State of Coral Reef Ecosystems of Guam<br />
Climate Change and Coral Bleaching<br />
Large-scale coral bleaching events and associated coral mortality are not common on Guam. Since the establishment<br />
of the University of Guam <strong>Marine</strong> <strong>Laboratory</strong> (UOGML) in 1970, there have been only two recorded<br />
large-scale bleaching events. In 1994, 68% of surveyed taxa bleached on Guam (Paulay and Benayahu,<br />
1999). The event was characterized by considerable inter-species variation in bleaching response and little<br />
mortality, and did not appear to be associated with above-average SSTs. In 1996, about half of Acropora species<br />
showed moderate to heavy bleaching, similar to the response of Acropora species to the 1994 bleaching<br />
event (G. Paulay, pers. comm.). There was also little mortality, except for a localized die-off on Piti Reef Flat<br />
due to extreme tidal conditions (G. Davis, pers. comm.). A recent bleaching event in Pago Bay appears to<br />
be linked to freshwater influx from the record rainfall associated with Tropical Storm Tingting in June 2004 (P.<br />
Schupp, pers. comm.). Bonito and Richmond (submitted) reported that a UOGML scientist observed cases of<br />
coral bleaching on Guam every year for at least the past seven years, but again, they were not accompanied<br />
by mass mortality. However, as SSTs continue to rise, coral bleaching events may become more frequent and<br />
more deleterious on Guam.<br />
Diseases<br />
Although many common coral diseases have been identified on Guam’s reefs, no systematic survey specifically<br />
addressing disease has been undertaken. In general, coral disease appears to be much more problematic<br />
in the Caribbean and Atlantic than in the Pacific Ocean to date.<br />
Tropical Storms<br />
In the last decade, Guam has been<br />
hit directly by four typhoons with sustained<br />
winds of greater than 150 miles<br />
per hour and suffered high waves and<br />
winds from large systems passing<br />
close to Guam (Figure 16.2; Guard et<br />
al., 2003). These systems have had<br />
a tremendous impact on the island.<br />
In 2002, Guam was hit with two tropical<br />
storms, Typhoon Chata’an and<br />
Super Typhoon Pongsona. At Typhoon<br />
Chata’an’s closest approach,<br />
wind speeds of 100-120 mph were<br />
recorded. Six months later, Super<br />
Typhoon Pongsona passed directly<br />
over the island, with wind speeds<br />
reaching super typhoon strength at<br />
150 mph (Guard et al., 2003). These<br />
types of storms cause considerable<br />
damage on land and also impacted<br />
the marine environment, especially<br />
Guam’s coral reefs (Figure 16.3).<br />
According to Guam’s Bureau of Statistics<br />
and Plans (2002), 175 sites<br />
were surveyed by damage assessment<br />
teams after Typhoon Chata’an.<br />
The surveyors identified problems<br />
with erosion, turbidity at river mouths,<br />
debris accumulation and debris stag-<br />
Figure 16.2. The path and intensity of typhoons passing near Guam from 1979-2004.<br />
Four major storms (sustained winds >150 mph) have hit Guam in the past 10 years.<br />
Many Pacific typhoons are not named or the names are not recorded in the typhoon<br />
database. Map: A Shapiro. Data: UNISYS, http://weather.unisys.com/hurricane.<br />
Sidebar Guam<br />
page<br />
445
Guam<br />
page<br />
446<br />
The State of Coral Reef Ecosystems of Guam<br />
ing sites. Of the sites identified as<br />
beach/shore, river, inland, reef, or infrastructure<br />
(bridge, drain, road, seawall),<br />
76% showed signs of erosion.<br />
Beach and shore erosion were highest<br />
in the southern part of Guam with<br />
over 20 eroded sites identified.<br />
The assessment teams identified<br />
many types of debris including a<br />
combination of metallic and household<br />
trash, natural wood, lumber,<br />
bamboo, coconut leaves, coconuts,<br />
dead animals, vegetation, tires, and<br />
rubber materials. The survey report<br />
indicated that the southern part of<br />
Guam had the highest concentration<br />
of medium to heavy debris from the<br />
10 sites surveyed. A total of 69 pieces<br />
of debris were collected from ten<br />
Figure 16.3. In 1997, Super Typhoon Paka scattered debris across the island, including<br />
the reef flats. Photo: Guam Coastal Management Program.<br />
sites. The Guam Diving Industry Association assisted with the water/ocean assessment portion of the study.<br />
Dive groups observed debris at six popular dive sites and reported that excess trash and debris were believed<br />
to be typhoon-related. The debris included cans, leaves, tree fronds, and pieces of plastics. The assessment<br />
after Super Typhoon Pongsona suggested that the debris from Typhoon Chata’an was moved off the reef and<br />
placed farther offshore by Super Typhoon Pongsona.<br />
The effects of tropical storms are not limited to debris and erosion. Typhoon Chata’an caused waste oil to spill<br />
from a U.S. Navy storage waste oil barge into Apra Harbor in July 2002. In December 2002, Super Typhoon<br />
Pongsona caused three large fuel storage tanks to catch on fire and burn for six days at the Guam Commercial<br />
Port. This fire deposited a large amount of soot in the adjacent harbor. In addition, fire retardants applied to<br />
control this fire may have entered the adjacent marine environment.<br />
Coastal Development and Runoff<br />
The resident population of Guam increased 16.3% from 1990 (133,152) to 2000 (154,805) with an associated<br />
population density increase from 634.5 to 737.7 individuals/mi 2 (U.S. Census Bureau, 2003). This rate was<br />
lower than the population increases observed between 1980 and 1990 (25.6%) and between 1970 and 1980<br />
(24.7%). The population growth rate in 1990 was 2.3 compared to 1.51 in 2000, and predictions estimate<br />
the growth rate to steadily decrease over the next 50 years. Nevertheless, the population is expected to<br />
reach 203,000 by 2020 and 242,000 by 2050 (U.S. Census Bureau International Programs Center Database,<br />
2003).<br />
Slow economic growth since 2001 has limited new development on Guam. During this time, development<br />
has primarily been residential or other small-scale construction. No major building construction projects (e.g.,<br />
hotels, large office buildings) requiring review by Guam’s Application Review Committee (ARC) were undertaken<br />
and no new applications for large development were submitted to the ARC in 2003 (DPW, 2004a).<br />
However, a small number of large developments that did not require review by the ARC (i.e., proposals that<br />
met all of the requirements set forth by Guam’s existing rules and regulations) have been completed or are<br />
currently underway (DPW, 2004a).<br />
In a recent report to the U.S. Congress on Guam’s water quality (GEPA, 2003) the major causes of decline in<br />
water quality to marine bays were development (paving and creation of impervious surfaces), encroachment<br />
onto the shoreline without the use of pollution management measures, marine debris, mechanical beach sand<br />
raking, and construction without the use of management measures. Increased urban runoff associated with<br />
greater impervious surface cover and reduced vegetation cover is of particular concern for reefs fringing near
The State of Coral Reef Ecosystems of Guam<br />
the more densely populated and urbanized northern portion of Guam. Road construction has decreased<br />
considerably since the early 1990s and has remained relatively constant over the past six years. Three major<br />
road construction projects, totaling approximately 14 km of roadway, have been ongoing during the past two<br />
years and are expected to be completed in 2004 (DPW, 2004b). Two of the projects (Rt. 14 in Tumon and Rt.<br />
4 in Yona) are located near the coastline and involve a total of 5 miles of heavily traveled roads. The required<br />
use of siltation fences has occurred at the Tumon site, but fences initially installed at the Yona site have not<br />
been properly maintained (T. Leberer, pers. comm.). The third project, involving the reconstruction of a section<br />
of Rt. 1 in Dededo, is farther from the coastline and is believed to be less of a threat to coral reef systems. In<br />
addition to these on-going projects, 17.4 km of highway have been constructed or repaired since 2000. This<br />
figure is approximately equal to the miles of road construction/repair that occurred between 1996 and 1999<br />
(17.5 km) and much lower than occurring between 1992 and 1995 (42.25 km) (DPW, 2004b).<br />
Sedimentation, resulting from construction projects and accelerated rates of upland erosion, is commonly<br />
considered one of the primary nonpoint source pollution threats to Guam’s reefs. In southern Guam, sedimen-<br />
tation is exacerbated by steep slopes<br />
and underlying volcanic rock, which<br />
allow significant surface water flow<br />
and enhanced transport of sediments<br />
to coastal waters (Figure 16.4). For<br />
example, a road construction project<br />
along the southern shores of the island<br />
in the early 1990s resulted in the<br />
particularly heavy sedimentation of<br />
a 10 km section of fringing reef, killing<br />
much of the coral (R. Richmond,<br />
pers. comm.). A study conducted<br />
by the Natural Resources Conservation<br />
Service (NRCS; U.S. Department<br />
of Agriculture, 1995) examined<br />
four types of habitat within the Ugum<br />
Watershed in southern Guam. Using<br />
the Revised Universal Soil Loss<br />
Equation, the NRCS estimated that<br />
sediment yield at the mouth of the<br />
watershed totaled 5.5 tons per acre.<br />
According to the NRCS average esti-<br />
mates ravine forests eroded 12 tons<br />
Figure 16.4. Sediment plumes due to upland erosion and heavy rainfall lead to serious<br />
problems for Guam’s coral reef ecosystems. Photo: Guam Forestry and Soil<br />
Resources Division.<br />
per acre per year (t/a/yr), agricultural lands eroded 20 t/a/yr, savannah grasslands eroded 31 t/a/yr, and<br />
unvegetated badlands eroded 243 t/a/yr. Findings indicated that inappropriate road construction, off-road<br />
vehicle traffic, and wild land fires accelerated the erosion processes.<br />
A recent study by Wolanski et al. (2003) suggested that land erosion in the La Sa Fua River catchment area<br />
caused significant sedimentation in Fouha Bay. This problem was exacerbated by the formation of muddy<br />
marine snow which has a much higher settling velocity than the unconsolidated clay particles in the river<br />
discharge. Wolanski et al. (2003) estimated that approximately 75% of the riverine sediments settle in the<br />
receiving bay and may smother juvenile corals. This sediment can become resuspended by storm swells a<br />
few times each year, causing high suspended sediment concentrations (1000 mgl/L) in the upper few meters<br />
of the bay.<br />
Accelerated rates of upland erosion due to wildfires, clearing and grading forested land, recreational off-road<br />
vehicle use, and wild populations of introduced mammals continue to result in increased rates of sedimentation<br />
in southern Guam. Estimates suggest that between 1975 and 1999, Guam lost nearly a quarter of its<br />
tree cover, while increases in the acreage of badlands (bare soil with extremely high erosion rates) and other<br />
erosion-prone surface cover types have been observed (FSRD, 1999). The numerous fires set each year and<br />
the popular use of off-road vehicles are believed to be major contributors to the development and persistence<br />
Sidebar Guam<br />
page<br />
447
Guam<br />
page<br />
448<br />
The State of Coral Reef Ecosystems of Guam<br />
of these erosion-prone surface cover<br />
types. According to the Guam Department<br />
of Agriculture’s Forestry and<br />
Soil Resources Division (FSRD), an<br />
average of over 750 fires have been<br />
reported annually between 1979 and<br />
2001, burning over 404 km 2 during<br />
this time period (Figure 16.5). Considering<br />
Guam’s area is comprised<br />
of 560 km 2 and the amount of vegetated<br />
land is even less (Table 16.2),<br />
the impact of these fires is of great<br />
concern.<br />
It is difficult to regulate the pollution in<br />
runoff and infiltration from the many<br />
small-scale agricultural activities on<br />
Guam. A study by Duenas and Associates<br />
(2003) stated that in 1998,<br />
only about 262 ha of land were under<br />
cultivation and the average farm<br />
size was 1.5 ha. Pig and poultry<br />
farms (commercial and non-commercial)<br />
censused prior to the severe typhoons<br />
of 2002 totaled 75 (averaging<br />
30 pigs each) and 42 (with a total of<br />
11,500 birds), respectively. The more<br />
significant use of fertilizers and pesticides<br />
on Guam’s nine golf courses<br />
is carefully controlled through requiring<br />
GEPA approved turf management<br />
plans approved by Guam’s Environmental<br />
Protection Agency (GEPA)<br />
and continuous monitoring through<br />
monitoring wells (Figure 16.6). Excluding<br />
the two military golf courses<br />
for which there are no available data<br />
the civilian courses cover over 567<br />
ha (Duenas and Associates, 2003).<br />
Coastal Pollution<br />
The primary pollutants to most waters,<br />
and specifically recreational<br />
beaches, are microbial organisms,<br />
petroleum hydrocarbons, and sediment.<br />
The GEPA administers the<br />
Water Quality Certification (Federal<br />
Clean Water Act Section 401) and<br />
National Pollutant Discharge Elimination<br />
System (NPDES) permits locally<br />
for the U.S. Environmental Protection<br />
Agency (EPA). Presently there are<br />
Figure 16.5. The frequency and acreage of wildfires in Guam from 1979-2001 (data<br />
unavailable for 1994-1995). Source: D. Limtiaco, unpublished data.<br />
Table 16.2. The current land and water resources of Guam. Source: D. Limtiaco,<br />
unpublished data.<br />
RESOURCE TOTAL ACREAGE<br />
Crop Land 14,227<br />
Pasture Land 11,826<br />
Range Land 21,454<br />
Forest Land 51,058<br />
Urban Areas 36,919<br />
Freshwater 196<br />
Total 135,680<br />
Figure 16.6. Over 560 ha of land in Guam, such as this coastal area in Mangilao,<br />
have been converted to golf courses, and chemical run-off is a pressing concern.<br />
Source: Guam Division of Aquatic and Wildlife Resources.<br />
19 active NPDES-permitted on Guam (Table 16.3.) The permitted discharges include treated wastewater from<br />
sewage treatment plants (STPs), thermal effluent from the Guam Power Authority power plants, and a number
The State of Coral Reef Ecosystems of Guam<br />
Table 16.3. Guam EPA currently enforces nineteen NPDES permits on Guam. Facilities include wastewater treatment plants, power<br />
plants, and fuel facilities. Source: GEPA, 2003.<br />
VOLUME<br />
(millions of RECEIVING MIXING<br />
FACILITY PERMITTEE TYPE<br />
gallons/day) WATER ZONE<br />
Northern District WWTP Guam Waterworks<br />
Authority (GWA)<br />
Municipal Wastewater 12 Philippine Sea -<br />
Tanguisson Steam Power Plant Hawaiian Electric, Inc. Cooling/ Low Volume<br />
Wastewater<br />
97.92 Philippine Sea -<br />
Hagatna WWTP GWA Municipal Wastewater 12 Philippine Sea -<br />
Cabras Power Plant (Units 1-4) Guam Power Authority<br />
(GPA)<br />
ESSO Eastern Cabras Terminal ESSO Eastern, Inc.<br />
(Guam)<br />
Mobil Cabras Terminal Mobil Oil Guam, Inc. Stormwater/ Tank<br />
Bottom Draws<br />
Shell Cabras Island Docking<br />
Facility (F-1 Pier)<br />
Shell Guam, Inc. Stormwater/ Tank<br />
Bottom Draws<br />
Cooling Water 1) 173<br />
2) 65.2<br />
Piti Chanel Yes<br />
Stormwater Varies Apra Harbor -<br />
Varies Apra Harbor -<br />
Varies Apra Harbor -<br />
Unitek Unitek Stormwater Varies Piti Channel -<br />
Dry Dock Guam Shipyard Industrial Wastewater/<br />
Balast<br />
GPA Piti Bulk Storage GPA Stormwater/Tank Bottom<br />
Draws<br />
Naval Station WWTP Navy Public Works<br />
Center<br />
Varies Inner Apra<br />
Harbor<br />
-<br />
Varies Piti Channel -<br />
Municipal Wastewater 4.3 Philippine Sea<br />
(Tipalao Bay)<br />
Agat-Santa Rita WWTP GWA Municipal Wastewater 1.5 Philipine Sea<br />
(Tipalao Bay)<br />
Umatac-Merizo WWTP GWA Municipal Wastewater 0.391 Toguan River &<br />
Philippine Sea<br />
Leo Palace WWTP Leo Palace Resort Municipal Wastewater 0.100 Irrigation<br />
(Yona)<br />
GIAA Parking Aprons Guam International<br />
Airport Authority<br />
Continental Aprons Continental Micronesia<br />
Airlines<br />
Stormwater Varies Harmon Sink<br />
(Tamuning)<br />
Stormwater/Tank Bottom<br />
Draws<br />
Varies Harmon Sink<br />
(Tamuning)<br />
Baza Gardens WWTP GWA Municipal Wastewater 0.600 Togcha River<br />
(Talofofo)<br />
-<br />
UOG <strong>Marine</strong> Lab. University of Guam<br />
<strong>Marine</strong> <strong>Laboratory</strong><br />
Sea Water 0.216 Pacific Ocean -<br />
Shell Agat Terminal Shell Guam, Inc. Stormwater/Tank Bottom<br />
Draws<br />
Varies Big Guatali<br />
River (Piti)<br />
of discharges that could contain minor amounts of oil and other toxic or biological materials. The guidelines<br />
for effluent limitations are based on Guam’s water quality standards which underwent major revision in 2001<br />
(GEPA, 2001). All permittees are routinely monitored by GEPA staff to verify compliance with applicable permit<br />
requirements and compliance schedules.<br />
The 2003 NPDES monitoring reports indicate that shoreline monitoring stations at the Northern and Hagatna<br />
STPs did not register fecal coliform counts above the permit standard of 400 fecal coliform units/100 ml. Offshore<br />
monitoring stations for these STPs were not sampled. Water samples taken at the shoreline stations<br />
at the mouth of the Togcha River, downstream from the Baza Gardens STP, were within the orthophosphates<br />
and fecal coliform standards, but exceeded the nitrate-nitrogen standard of 0.10 mg/L half the time. Turbidity<br />
at these shoreline stations regularly exceeds water quality standards, but ambient turbidity measured upstream<br />
from the discharge likewise exceeded the current permit standards. Monitoring at the Umatac-Merizo<br />
(Toguan) STP showed orthophosphates and nitrate levels below standards, but turbidity was usually above<br />
Yes<br />
Yes<br />
-<br />
-<br />
-<br />
-<br />
-<br />
Sidebar Guam<br />
page<br />
449
Guam<br />
page<br />
450<br />
The State of Coral Reef Ecosystems of Guam<br />
the standard of 1.0 nephelometric turbidity unit (NTU). Turbidity levels were related to rainfall and of 27 recent<br />
samples, most registered turbidity less than 2.0 NTU; there were only four samples over 3.0 NTU - two<br />
at about 7 NTU, one at 13.6 NTU, and one at 14.2 NTU. It should be noted that when the five-year NPDES<br />
permits are renewed in 2006, the new 2001 Guam water quality standards will apply, but these permits are<br />
currently monitored according to standards in place when they were issued (GEPA, 2003).<br />
Three of the island’s outfall pipes discharge within 200 m of the shallow reef crest, in depths of 20-25 m and in<br />
areas where corals are found. These outfalls can be problematic as stormwater leaks into aging sewer lines.<br />
During heavy rain, this additional water forces the sewage treatment plants to divert wastewater directly into<br />
the ocean outfall pipes. In addition, during 2003 the effluent from the Hagatna STP was partly discharging into<br />
a shallow coral reef area due to a break in the outfall line caused by Super Typhoon Pongsona.<br />
Nonpoint source pollutants in the north, such as nutrients from septic tank systems and agricultural or chemical<br />
pollutants from urban runoff and illegal dumping, infiltrate basal groundwater, and discharges in springs<br />
along the seashore and subtidally on the reefs. A two-year study of spring water discharges from the Northern<br />
Guam Aquifer into the marine preserve of Tumon Bay has recently been completed (PCR Environmental,<br />
2002a, 2002b, 2002c). The springs discharge an estimated 64,350 m 3 per day. Chemicals detected in the discharges<br />
above GEPA water quality standards included perchloroetene (PCE), trichloroethene (TCE), aluminum,<br />
antimony, arsenic, magnesium, sulfate, oil and grease, total coliform bacteria and fecal coliform bacteria.<br />
The pesticides dieldrin, alpha-chlordane, and gamma chlordane were also detected in discharges. A recent<br />
dye study on water flows from Harmon Sink indicates that the stormwater was drained from the Guam International<br />
Airport and surrounding industrial areas, entered a karst formation sinkhole, and discharged through<br />
the aquifer to Tumon Bay and East Agana Bay coastal waters (Moran, 2002). Some of the flows reached<br />
East Agana Bay within four days of dye injection (traveling 360 to 645 m/day) and Tumon Bay within 17 days<br />
(80 to 175 m/day). A new dye study will determine the relation of stormwater discharges from Tiyan, south of<br />
Harmon Sink to East Agana Bay and Tumon Bay.<br />
Recent studies of the heavy metals polychlorinated biphenyls (PCBs) and polyaromatic hydrocarbons (PAHs)<br />
in newly formed marine sediments and associated food chains in the four main harbor areas of Guam showed<br />
a moderate enrichment of contaminants in the harbors, especially Apra Harbor (Denton, et al., 1997; Denton<br />
et al., 1999). Sponges, soft corals, sea cucumbers, and fish from Apra Harbor were enriched with PCBs, while<br />
invertebrates showed concentrations of arsenic. Oysters showed copper and zinc contamination in Apra Harbor<br />
and Hagatna Boat Basin, but none of the fish or shellfish exceeded U.S. Food and Drug Administration<br />
food standards or guidance limits (GEPA, 2000b).<br />
The U.S. Navy has been assessing and restoring 15 Comprehensive Environmental Response, Compensation,<br />
and Liability Act and Resource Conservation and Recovery Act sites, which could potentially impact coral<br />
reefs in Apra Harbor or Agat Bay. In 2001, it was determined that PCBs had entered the food chain offshore<br />
from the Orote Landfill site and off Gabgab Beach. The source of the PCBs has yet to be determined. However,<br />
PCBs as well as other chemicals are present in buried material at the landfill, which makes the site a<br />
potential source, even though it has been capped and contained by a restoration project costing over $15 million.<br />
Monitoring wells and other sampling techniques are being used to determine if the Orote Landfill was the<br />
source of the contamination. Seafood monitoring has detected PCBs in deep and shallow water reef fishes<br />
in the Philippine Sea off Orote Point and the public have been advised on the danger of consuming seafood<br />
from this area.<br />
The public landfill located in the village of Ordot has been a source of leachate tentatively entering the Pago<br />
Bay reefs via the Lonfit/Pago Watershed. Baseline monitoring of the Pago Bay marine environment is planned<br />
by the Water and Environmental Research Institute of the UOG in <strong>2005</strong> to reflect changes related to the closing<br />
and capping of the landfill.
The State of Coral Reef Ecosystems of Guam<br />
Tourism and Recreation<br />
A total of 909,506 people visited Guam in 2003, representing a decrease of 14% from the number of visitors<br />
in 2002 (GVB, 2004). Based on visitor data collected from the first two months of 2004, visitor arrivals are<br />
expected to exceed one million (GHRA, 2004). According to the December 2003 Visitor’s Arrival Statistical<br />
Report, 77% of the visitors came to the island for pleasure. A previous exit survey of Japanese visitors noted<br />
that the highest rated optional tourism categories were: parasailing, health spas, underwater observation, and<br />
jet-skiing (GVB, 2001). This suggests that marine resources are very important to Guam’s tourism industry.<br />
There are a number of recreational activities that utilize or impact coral reefs, including snorkeling and scuba<br />
diving, charter fishing, and jet skiing.<br />
Scuba diving and snorkeling are popular activities for tourists and residents. The Pacific Association of Dive Industry<br />
estimates that over 5,000 entry level certifications were issued in Guam last year (J. Bent, pers. comm.).<br />
This indicates that there are a large number of newly certified divers visiting Guam’s reefs. One of the sites<br />
often visited by newly certified divers is the Piti Bomb Holes <strong>Marine</strong> Preserve. This has led to some negative<br />
impacts on the reefs in this area. Tsuda and Donaldson (2004) noted that snorkelers and scuba divers have<br />
caused considerable disturbances to<br />
the seagrass bed at this site. These<br />
disturbances include physical impacts,<br />
an increase in turbidity, and<br />
decreases in fish abundance and diversity.<br />
Other signs of impacts are<br />
broken pieces of coral and obviously<br />
worn or damaged coral heads (Figure<br />
16.7). A number of other popular<br />
sites, including Gun Beach, Tumon<br />
Bay, and Ritidian, may also be impacted<br />
by reef walking activities.<br />
Charter bottomfishing may also impact<br />
the coral reefs. According to an<br />
unpublished survey of fishing vessels<br />
by the Western Pacific Regional<br />
Fisheries Management Council (J.<br />
Calvo, unpublished data), there are<br />
approximately 10 locally-based charter<br />
fishing boats consistently operat-<br />
ing in Guam. Most of these have little<br />
Figure 16.7. Guam certifies a large number of new divers each year, and even more<br />
people try snorkeling in Guam’s clear tropical waters. Unfortunately, these new divers<br />
and snorkelers often damage the environment by stepping on coral. Photo: D.<br />
Burdick.<br />
effect on the reefs as they target pelagic species. However, there are a few operations that offer bottomfishing<br />
targeting reef species on a regular, but infrequent basis. One operation offers bottomfishing charters on a<br />
daily basis out of the Agat Marina. Such charters normally work in depths of 18 to 110 m. There are an estimated<br />
800 charter trips targeting the shallow water complex each year (Flores, 2003). In 2003, 2.1 metric tons<br />
of bottomfish were harvested, up from 1.3 metric tons in 2002, despite the decrease in the number of people<br />
participating in this sport (Flores, 2003).<br />
Jet skiing is a popular tourist activity in Guam which may have several impacts on the reef due to jet ski use<br />
within the reef margin. These devices are loud, leak fuel, and may damage seagrass beds and corals, especially<br />
during low tides. Due to these impacts, jet ski use is limited to four locations within the reef margin: East<br />
Agana Bay, Apra Harbor, Cocos Lagoon, and Tumon Bay on a limited scale. A quantitative study on jet ski<br />
impacts is scheduled to begin in <strong>2005</strong> to determine the damage these watercraft may cause.<br />
As a tourist destination, the stability and cleanliness of Guam’s beaches is an important consideration. Although<br />
no known beach nourishment projects occurred in 2003, several of these projects occurred after Typhoon<br />
Yuri in 1992 in Cocos Island Resort, Tumon Bay, and Jeff’s Pirates Cove in Ypan, Talofofo (G. Davis,<br />
pers. comm.). There are also ongoing mechanical beach cleaning operations in Tumon Bay and East Agana<br />
Bay.<br />
Sidebar Guam<br />
page<br />
451
Guam<br />
page<br />
452<br />
The State of Coral Reef Ecosystems of Guam<br />
Fishing<br />
Guam’s coral reef fisheries are economically and culturally important. The threat of overfishing is a serious<br />
concern that became more apparent in the 1980s. At that time, inshore fisheries data indicated that the number<br />
of hours spent fishing almost doubled, from 161,602 hours in 1984 to 300,861 hours in 1987, while the<br />
average catch per hour for reef fish declined (Sherwood, 1989). Data from recent creel surveys suggest that<br />
Guam’s fisheries have not recovered<br />
from this decrease in the 1980s (Figure<br />
16.8). In addition, in situ visual<br />
surveys have indicated that large reef<br />
fish are conspicuously absent from<br />
many of Guam’s reefs (Figure 16.9;<br />
Paulay et al., 2001; Amesbury et al.,<br />
2001; R. Schroeder, in review).<br />
<strong>Marine</strong> Preserves<br />
Guam established five marine preserves<br />
in 1997 to address this concern.<br />
The size of the preserves varies,<br />
but all preserves extend from 10<br />
m above the mean high tide mark to<br />
the 600 ft (183 m) depth contour. The<br />
following activities are prohibited in all<br />
five marine preserves: dip netting, gill<br />
netting, drag netting, surround netting,<br />
spear fishing, the use of gaffs,<br />
shell collecting, gleaning, and removal<br />
of sand or rocks. Trolling may be<br />
conducted from the reef margin seaward,<br />
but only for pelagic fish. Bottomfishing<br />
may be conducted seaward<br />
of the 100 ft (30 m) contour in<br />
Tumon Bay <strong>Marine</strong> Preserve.<br />
Limited fishing is allowed in Tumon<br />
Bay, Pati Point, and Achang Reef Flat<br />
<strong>Marine</strong> Preserves. In Tumon Bay,<br />
hook-and-line fishing from shore and<br />
cast net (talaya) fishing from shore<br />
and along the reef margin are permitted<br />
for certain species. All other<br />
fishing methods are prohibited. From<br />
shore, catch is limited to rabbitfish<br />
(sesyon, mañahak), juvenile goatfish<br />
(ti’ao), juvenile jacks (i‘e‘), and con-<br />
Figure 16.8. Catch per unit of effort (CPUE) declined sharply in the 1980s. Source:<br />
Guam Division of Aquatic and Wildlife Resources.<br />
Figure 16.9. Large fish are rarely seen on Guam’s coral reefs. This 55-cm yellowlip<br />
emperor (Lethrinus xanthochilus) has taken up residence in Tumon Bay <strong>Marine</strong> Preserve.<br />
Photo: D. Burdick.<br />
vict tangs (kichu). All other fish must be released immediately. Cast net fishing along the reef margin is allowed<br />
for rabbitfish and convict tangs only. There are no species restrictions for fishing in Pati Point <strong>Marine</strong><br />
Preserve, although fishing methods are limited to hook-and-line from shore. Limited cultural takes are permitted<br />
in Achang Reef Flat <strong>Marine</strong> Preserve for seasonal runs of juvenile rabbitfish (mañahak) and scads (atulai).<br />
No fishing is allowed in Piti Bomb Holes and Sasa Bay <strong>Marine</strong> Preserves.<br />
Despite these laws, Guam Department of Agriculture conservation officers arrest over 40 people per year for<br />
fishing illegally in the marine preserves. Infractions range from buckets of sea cucumbers gleaned from the<br />
reef flat to large catches of parrotfish, surgeonfish, and other commercially important species taken from the<br />
forereef slope (DAWR, unpublished data). Despite these infractions, visual surveys suggest that the marine<br />
preserves are functioning as expected. Increases in fish density at Piti Bomb Holes and Achang Reef Flat
The State of Coral Reef Ecosystems of Guam<br />
<strong>Marine</strong> Preserves of 113% and 115%, respectively, indicate that fish stocks are recovering in the preserves.<br />
Surveys at unprotected sites have shown decreases of 29% (Asan/Cocos) and 4% (Cocos/Pago) during the<br />
same period (Gutierrez, 2004).<br />
Reef Fisheries<br />
A number of fishing methods are used on Guam including traditional methods such as hook-and-line, talaya<br />
(cast nets), spearfishing, and surround nets (chenchulu), as well as more controversial methods such as the<br />
use of mono-filament “throw-away” gill-nets and nighttime scuba spearfishing. Fishing is a popular activity<br />
in Guam and is monitored by the Guam Division of Aquatic and Wildlife Resources (DAWR). Creel surveys<br />
have been conducted since the early 1970s, with expanded data available for the past two decades. Creel<br />
surveys provide valuable insight into fishing activities on Guam and allow the DAWR to estimate total harvest,<br />
total time spent fishing, and catch per unit effort (CPUE), which provides insight into the status of fish stocks.<br />
Creel surveys are divided into two categories, inshore fisheries and offshore fisheries. Inshore fisheries include<br />
shore-based fishing activities, usually involving nearshore casting, netting, and spearfishing. Offshore<br />
fisheries include boat-based fishing activities from small boats (3-15 m) such as trolling, bottomfishing, and<br />
boat-supported spearfishing (Flores, 2003).<br />
Table 16.4 shows the estimated inshore and offshore coral reef fisheries harvest and CPUE for 2002 and<br />
2003. Among the inshore methods, hook-and-line fishing resulted in the highest harvest for 2002, accounting<br />
for 33% of the total harvest. In 2003, snorkel spearing was ranked as the top method for 2003, with 41% of<br />
the overall harvest. Although the overall hook-and-line harvest is high, this method had the lowest CPUE of<br />
Table 16.4. Estimated reef fish harvest and CPUE for all inshore and offshore methods from 2002-2003. Reef fish harvest exceeded<br />
100 mt in 2002 and 2003. Inshore data excludes seasonal runs of juvenile siganids and bigeye scads. *CPUE measures for bottom<br />
and trolling methods were calculated based on total catch including pelagic and deepwater species. Sources: Gutierrez, 2003; Flores,<br />
2003; DAWR, unpublished data.<br />
2002 2003<br />
INSHORE <strong>OF</strong>FSHORE TOTAL INSHORE <strong>OF</strong>FSHORE TOTAL<br />
Harvest CPUE Harvest CPUE Harvest Harvest CPUE Harvest CPUE Harvest<br />
METHOD<br />
(kg) (kg/gr-hr) (kg) (kg/gr-hr) (kg) (kg) (kg/gr-hr) (kg) (kg/gr-hr) (kg)<br />
Snorkel Spear 12,808 0.81 9,982 1.37 22,790 25,844 1.5 10,201 1.96 36,045<br />
Hook and Line 20,714 0.1 - - 20,714 20,449 0.12 - - 20,449<br />
Bottom - - 18,840 0.44* 18,840 - - 30,087 0.69* 30,087<br />
Gill Net 6,053 0.41 11,553 6.45 17,606 5,875 0.42 8,924 5.7 14,799<br />
Scuba Spear 445 2 15,718 3.01 16,163 88 0.24 18,205 5.72 18,293<br />
Cast Net 12,015 0.28 711 2.39 12,726 8,704 0.18 155 0.65 8,859<br />
Surround Net 8,037 3.4 - - 8,037 1,660 2.3 - - 1,660<br />
Trolling - - 2,136 1.55* 2,136 - - 5,675 1.97* 5,675<br />
Drag Net 1,643 3.3 - - 1,643 - - - - 0<br />
Hooks and Gaffs 974 0.34 - - 974 302 0.16 - - 302<br />
Jigging - - 757 1.1 757 - - 905 1.1 905<br />
Mix Spear - - 673 2.58 673 - - 0 0 0<br />
Spincasting - - 476 0.62 476 - - 495 0.88 495<br />
Atulai Jigging - - 227 0.99 227 - - 802 0.99 802<br />
Other Methods 431 0.14 - - 431 712 0.16 - - 712<br />
Total 63,120 0.21 61,073 1.34* 124,193 63,634 0.24 75,449 1.67* 139,083<br />
all inshore methods for both years. In 2002, surround net and drag net methods produced the highest CPUE<br />
of all methods with 3.4 kg/gear-hour (gr-hr) and 3.3 kg/gr-hr, respectively, despite a relatively low amount of<br />
effort (2,354 gear-hours and 501 gear-hours, respectively). In 2003, the CPUE for surround nets decreased<br />
by 32%. Harvest estimates for drag nets could not be determined for 2003, as no interviews for this method<br />
were conducted.<br />
Sidebar Guam<br />
page<br />
453
Guam<br />
page<br />
454<br />
The State of Coral Reef Ecosystems of Guam<br />
The total harvest of reef fish using offshore methods was similar to the inshore harvest for 2002, but exceeded<br />
the inshore harvest for 2003. The top three methods for 2002 harvesting over 75% of the total offshore reef<br />
fish catch, were bottomfishing, scuba spearfishing, and gill netting. In 2003, snorkel spearing took over the<br />
third spot, followed closely by gill netting. The top three methods for 2003 brought in 77% of the total offshore<br />
reef fish catch. Although bottomfishing had the highest harvest, this method had the lowest CPUE of<br />
all offshore coral reef fisheries for both 2002 and 2003. In 2002, gill netting produced the highest CPUE with<br />
6.45kg/gr-hr, despite a relatively low amount of effort (1,790 gear-hours). This level decreased slightly in 2003<br />
to a CPUE of 5.7 kg/gr-hr with a slight drop in effort (1,566 gear-hours). Scuba spearfishing produced the<br />
highest CPUE of all offshore methods in 2003 with a CPUE of 5.72 kg/gr-hr. This method was very effective,<br />
and produced approximately a quarter of the total offshore reef fish catch, while using a relatively low amount<br />
of effort (5,225 hours in 2002 and 5,205 hours in 2003).<br />
The top 10 families harvested in 2002 and 2003 are shown in Table 16.5. Harvest composition varied from<br />
year to year; for example, Kyphosidae (rudderfish) accounted for 15% of the inshore catch for 2002, but was<br />
not a major component of the catch for 2003. Acanthuridae (surgeonfishes) were the most heavily fished<br />
inshore family in 2003, as 20% of the total inshore catch. Most of these families were targeted by hook-andline,<br />
however, Kyphosidae were harvested primarily with cast nets. Offshore harvest was dominated by Lethrinidae<br />
(emperors) in both 2002 and 2003, with approximately 20% of the catch harvested primarily through<br />
bottomfishing. Other key target fish harvested primarily through bottomfishing techniques included Lutjanidae<br />
(snappers) and Serranidae (groupers). Acanthuridae, Scaridae (parrotfishes), and Labridae (wrasses) were<br />
often harvested using either Scuba spears or snorkel spears. It is interesting to note that scuba spears were<br />
used to capture nearly 70% of the scarid harvest. Also, of special concern is the harvest of humphead wrasse<br />
(Cheilinus undulatus). This valuable species, now listed on Appendix II of the Convention on International<br />
Trade in Endangered Species is targeted by fishers using scuba spearfishing methods with 789 kg harvested<br />
by this method in 2002 and 1826 kg in 2003. This species made up nearly 60% of the total offshore Labridae<br />
catch in 2002 and over 75% of the total offshore Labridae catch in 2003.<br />
Table 16.5. Estimated harvest of top 10 families for inshore and offshore fisheries during 2002-2003. Inshore data excludes seasonal<br />
runs of juvenile siganids and bigeye scads. Sources: Gutierrez, 2003; Flores, 2003; DAWR unpublished data.<br />
INSHORE <strong>OF</strong>FSHORE<br />
2002 2003 2002 2003<br />
Family Harvest (kg) Family Harvest (kg) Family Harvest (kg) Family Harvest (kg)<br />
Kyphosidae<br />
(Rudderfishes)<br />
Siganidae<br />
(Rabbitfishes)<br />
Acanthuridae<br />
(Surgeonfishes)<br />
Carangidae<br />
(Jacks)<br />
Lethrinidae<br />
(Emperors)<br />
Mullidae<br />
(Goatfishes)<br />
Lutjanidae<br />
(Snappers)<br />
Serranidae<br />
(Groupers)<br />
Mugilidae<br />
(Mullets)<br />
Belonidae<br />
(Needlefishes)<br />
9,465 Acanthuridae<br />
(Surgeonfishes)<br />
8,773 Carangidae<br />
(Jacks)<br />
7,786 Siganidae<br />
(Rabbitfishes)<br />
6,790 Mullidae<br />
(Goatfishes)<br />
4,480 Scaridae<br />
(Parrotfishes)<br />
3,945 Lethrinidae<br />
(Emperors)<br />
2,712 Diodontidae<br />
(Porcupinefishes)<br />
2,166 Scombridae<br />
(Mackerels)<br />
1,990 Serranidae<br />
(Groupers)<br />
1,968 Carcharhinidae<br />
(Requiem Sharks)<br />
12,691 Lethrinidae<br />
(Emperors)<br />
9,699 Acanthuridae<br />
(Surgeonfishes)<br />
5,640 Scaridae<br />
(Parrotfishes)<br />
5,372 Carangidae<br />
(Jacks)<br />
4,302 Serranidae<br />
(Groupers)<br />
2,352 Mullidae<br />
(Goatfishes)<br />
1,649 Sphyraenidae<br />
(Barracudas)<br />
1,307 Lutjanidae<br />
(Snappers)<br />
1,284 Labridae<br />
(Wrasses)<br />
1,258 Siganidae<br />
(Rabbitfishes)<br />
13,598 Lethrinidae<br />
(Emperors)<br />
9,329 Serranidae<br />
(Groupers)<br />
7,472 Carangidae<br />
(Jacks)<br />
5,542 Acanthuridae<br />
(Surgeonfishes)<br />
2,983 Scaridae<br />
(Parrotfishes)<br />
2,341 Scombridae<br />
(Mackerels)<br />
1,587 Sphyraenidae<br />
(Barracudas)<br />
1,509 Lutjanidae<br />
(Snappers)<br />
1,391 Labridae<br />
(Wrasses)<br />
1,389 Carcharhinidae<br />
(Requiem Sharks)<br />
11,632<br />
10,737<br />
9,599<br />
8,464<br />
8,246<br />
3,431<br />
3,339<br />
3,087<br />
2,377<br />
1,632
The State of Coral Reef Ecosystems of Guam<br />
Invertebrates<br />
The invertebrate harvest varied considerably during 2002 and 2003 for both inshore and offshore fisheries.<br />
The top five harvested invertebrate species for 2002 and 2003 are listed in Table 16.6. Inshore invertebrate<br />
harvest in 2003 increased 188% from the 2002 harvest. The increase in invertebrate harvest in 2003 correlates<br />
with a shift in method; snorkel spear gear-hours and CPUE increased by 11% and 85%, respectively.<br />
Although octopus comprised the majority of the top five invertebrate species harvested in 2002 and 2003, harvest<br />
of the spiny lobster (Panulirus pencillatus) increased 245% between 2002 and 2003. The offshore invertebrate<br />
harvest decreased from 2002 to 2003, with catches of the top shell (Trochus niloticus) and Panulirus<br />
pencillatus decreasing 40% and 14%, respectively, over this time period. The conch harvest also decreased<br />
over this time period, with over 1,400 kg of conch (Lambis lambis and L. truncata) harvested in 2002 and no<br />
catch recorded in 2003. However, the harvest of venus clams (Veneridae), reef crab (Zosimus aeneus), and<br />
octopus did increase during this period.<br />
Table 16.6. Estimated harvest of top five invertebrate species during 2002-2003. Sources: Gutierrez, 2003; DAWR, unpublished<br />
data.<br />
INSHORE <strong>OF</strong>FSHORE<br />
2002 2003 2002 2003<br />
SPECIES HARVEST SPECIES HARVEST SPECIES HARVEST SPECIES HARVEST<br />
(kg)<br />
(kg)<br />
(kg)<br />
(kg)<br />
Octopus cyanea 1,052 Octopus cyanea 4,772 Trochus niloticus 1,525 Trochus niloticus 902<br />
Panulirus penicillatus 572 Octopus other 3,105 Lambis lambis 1,224 Veneridae 635<br />
Scylla serrata 508 Panulirus penicillatus 1,973 Panulirus penicillatus 289 Panulirus penicillatus 249<br />
Octopus ornatus 383 Carpilus maculatus 145 Lambis truncata 218 Zosimus aeneus 235<br />
Octopus other 359 Octopus ornatus 111 Zosimus aeneus 152 Octopus cyanea 219<br />
Trade in Coral and Live Reef Species<br />
Guam does not currently export coral or live reef species, but collection for local use does occur. Local pet<br />
shops collect approximately 250 ornamental fish per month for Guam’s aquarium trade (B. Tibbatts, pers.<br />
comm.). In addition, two local aquaria collect approximately 450 local reef fish each month for display in their<br />
facilities (L. Goldman, pers. comm.). Guam’s corals and live rock are protected by the island’s Public Law<br />
24-21. The UOGML is the only entity on the island permitted to harvest coral and live rock. UOGML’s permit<br />
only allows harvesting in areas not designated as marine preserves and all surviving specimens must be returned<br />
to the area from which they were harvested. The UOGML collected 1,008 coral colonies in 2002 and<br />
455 colonies in 2003 for research purposes. Harvested colonies included species of Acropora, Alveopora,<br />
Favia, Goniastrea, Goniopora, Leptoria, Lobophyllia, Platygyra, Pocillopora, Porites, and Psammocora. The<br />
colonies collected ranged in size from 2 cm x 2 cm to 40 cm x 20 cm (Amesbury, 2002, 2003; Smith, 2004).<br />
Ships, Boats, and Groundings<br />
Guam’s Apra Harbor is the largest U.S. deepwater port in the Western Pacific and the busiest port in Micronesia.<br />
The harbor is shared by the Port Authority of Guam and the U.S. Navy. According to Guam’s Port<br />
Authority (http://www.netpci.com/~pag4, Accessed 8/26/04), the port handled approximately two million tons<br />
of cargo and serviced over 2000 vessels in 2002. These vessels are primarily fishing vessels, as well as fuel<br />
ships, container ships, tender ships, barges, and cruise ships. The U.S. Naval installation is home to a number<br />
of naval vessels including submarines, a submarine tender ship, and two U.S. Coast Guard cutters, and is<br />
visited by numerous other vessels including aircraft carriers. The harbor also contains reefs with some of the<br />
highest coral cover on the island. Some reef areas have been dredged in the past and other areas (including<br />
patch reefs) may be dredged in the future as their growth impedes ship traffic and naval operations. The coral<br />
reefs can be damaged not only by such ship traffic and naval operation, but also by anchors, groundings, and<br />
illegal vessel discharges.<br />
Commercial ships are not the only concern. According to the boating law administrator in the Guam Police<br />
Department’s Special Programs Division, there are an estimated 3,000 recreational vessels and an estimated<br />
5,000 commercial vessels under 20 m on Guam. Anchor damage from these ships is a concern due to the<br />
lack of operational mooring buoys around the island.<br />
Sidebar Guam<br />
page<br />
455
Guam<br />
page<br />
456<br />
The State of Coral Reef Ecosystems of Guam<br />
Ship groundings are inevitable due to the frequency of typhoon’s affecting Guam. At this time, over 130 vessels<br />
are listed in the National Oceanic and Atmospheric Administration’s (NOAA) Abandoned Vessel Inventory<br />
database for Guam (http://response.restoration.noaa.gov/dac/vessels/vess_main.html, Accessed 4/17/04).<br />
During a recent NOAA study, nine of the 31 vessels surveyed (29%) were located on coral reef, hardbottom,<br />
or lagoonal fauna (Helton et al., 2004). As these vessels deteriorate or are moved by storms, they may impact<br />
the surrounding habitat. Because of limited funding for the removal of these vessels, most of them will<br />
remain a threat to the reefs. Navigational buoys also pose a problem as storm swells can drag them onto the<br />
reefs, thereby damaging coral and other reef habitat. Such an incidence of this occurred in August 2004 when<br />
the storm surge from Typhoon Chaba displaced the navigational buoys outside of Agat Marina (KUAM TV,<br />
http://66.129.67.220/news/11022.aspx, Accessed 9/28/2004).<br />
<strong>Marine</strong> Debris<br />
<strong>Marine</strong> debris continues to impact Guam’s reefs. According to the Guam Coastal Management Program<br />
(GCMP), the 2003 International Coastal Cleanup resulted in the collection of 924 bags of debris that weighed<br />
19,640 kg from Guam’s beaches and reefs, an increase from 3,252 kg of debris collected in 2002. Additionally,<br />
the Micronesian Divers Association, and Guam <strong>Marine</strong> Awareness Foundation remove 5-10 bags of debris<br />
from local reefs each month (M. Barnett, pers. comm.).<br />
Beverage containers are the most common items collected, but other items include appliances, batteries, car<br />
parts, and abandoned fishing gear. Over 100 nets were collected during the 2003 cleanup event, along with<br />
fishing line, crab and fish traps, buoys, and lures. The DAWR reported that 35 additional nets were removed<br />
from coastal waters in 2002-2003. Typhoons are an additional source of debris and can blow objects as large<br />
as roofs onto the reefs. Although two powerful typhoons hit Guam in 2002, the debris from these storms<br />
appeared to be limited to smaller items such as beverage containers and palm fronds. In contrast, over 14<br />
tons of debris, including tin roofing, auto parts, and dumpsters, were deposited on the reef in 1997 by Super<br />
Typhoon Paka (GCMP, 1998).<br />
Aquatic Invasive Species<br />
Although Guam has spent considerable time and resources studying terrestrial invasive species, such as the<br />
brown treesnake, little work has been done on invasive marine species (Paulay et al., 2002). Paulay et al.<br />
(2002) attempted the first systematic survey of nonindigenous marine species in three study sites on Guam:<br />
Apra Harbor, Orote Penisula ERA, and Haputo ERA. They found a total of 85 nonindigenous species on<br />
Guam, recognizing that many taxa have yet to be surveyed. Forty-one of those 85 species were catagorized<br />
as introduced and 44 as cryptogenic. They found the majority of these species to be sessile (76%) and surmise<br />
that they primarily arrived via vessel hulls into Apra Harbor. While further study is warranted, these nonindigenous<br />
marine species do not appear to be negatively impacting native species yet. Paulay et al. (2002)<br />
found that, although nonindigenous species were abundant on artificial substrates, they were relatively rare<br />
on natural reef bottoms.<br />
Security Training Activities<br />
The U.S. Department of Defense regularly carries out military training on Guam, often involving Navy and <strong>Marine</strong><br />
exercises that impact coastal waters and adjacent reefs (U.S. Department of the Navy, 1998) Although<br />
attempts are made to minimize impacts by locating operations away from living corals, the explosions related<br />
to marine mine detection and demolition and the stress from landing craft have killed a limited amount of fish<br />
and invertebrates, and could threaten marine mammals and endangered sea turtles (DAWR, unpublished<br />
incident reports).<br />
Offshore Oil and Gas Exploration<br />
There are currently no oil or gas prospects identified near Guam.
The State of Coral Reef Ecosystems of Guam<br />
Other<br />
Guam continues to be affected by the COTS (Acanthaster planci). While Guam has not had any large outbreaks<br />
of A. planci, aggregations of about 500 individuals have been documented (Randall, 1973). Bonito<br />
(2002) suggests that the feeding behavior of these aggregations may modify the coral community composition<br />
on Guam, as they prefer to feed on Acropora, Montipora, and Pocillopora species. The coral community at<br />
Tanguisson Reef was documented in 1981 and again in 2001; comparison of the data suggests that preferential<br />
feeding on these species may have created a shift in the reef community towards Porites, Favia, and other<br />
non-preferred species.<br />
Sidebar Guam<br />
page<br />
457
Guam<br />
page<br />
458<br />
The State of Coral Reef Ecosystems of Guam<br />
<strong>CORAL</strong> <strong>REEF</strong> ECOSYSTEM MONITORING EFFORTS AND RESOURCE CONDITION<br />
A number of monitoring, research, and assessment activities are conducted on Guam. These include monitoring<br />
programs for communities associated with coral reefs, assessment of benthic habitat, and water quality.<br />
Table 16.7 describes all recent or ongoing studies related to Guam’s coral reefs. Some of these studies are<br />
ongoing, while others have just started producing quantitative data. The studies with sufficient data will be<br />
discussed further in the next section.<br />
Table 16.7. Summary information for Guam’s coral reef monitoring, research, and assessment activities.<br />
ACTIVITY AGENCY NO. <strong>OF</strong> FUNDING OBJECTIVE DATA FIT IN LARGER<br />
YEARS<br />
COLLECTION EFFORT<br />
<strong>Marine</strong> DAWR 2 NOAA Assess the effectiveness of Guam’s Every 1-2 Provides assessment<br />
Preserve<br />
Coral Reef <strong>Marine</strong> Preserves on Food Fish years of fisheries<br />
Monitoring<br />
Monitoring populations. Visual transects and<br />
Grant, interval counts are used to assess fish<br />
Sportfish species. Some benthic baseline data<br />
Restoration has been collected but full-scale benthic<br />
monitoring is scheduled to start in 2004.<br />
Univ. of 2 Assess the effectiveness of Guam’s<br />
Guam<br />
<strong>Marine</strong> Preserves by looking at focal<br />
species abundance, population<br />
structure, and recruitment in preserves<br />
and adjacent control sites.<br />
Sedimentation National
The State of Coral Reef Ecosystems of Guam<br />
Table 16.7 (con’t). Summary information for Guam’s coral reef monitoring, research, and assessment activities (continued).<br />
ACTIVITY AGENCY NO. <strong>OF</strong> FUNDING OBJECTIVE DATA FIT IN LARGER<br />
YEARS<br />
COLLECTION EFFORT<br />
Fisheries DAWR >20 Sportfish Conduct creel, participation, and Semi-weekly<br />
Monitoring<br />
Restoration boat-based surveys to obtain<br />
information including boating activity,<br />
fishermen participation, catch per<br />
unit effort, and species composition<br />
in order to monitor the health of the<br />
fisheries resources<br />
(on average)<br />
Associated Univ. of 6 Coral Reef Reef Check Annually Provides some long-<br />
Biological Guam<br />
Initiative<br />
term monitoring at a<br />
Communities<br />
Management/<br />
Monitoring<br />
Grants<br />
very broad level<br />
Univ. of<br />
Assessment of Acanthaster planci One time Repeated survey<br />
Guam<br />
from 1980s to assess<br />
change over time of<br />
benthic community<br />
Recreational Univ. of 1 Coastal Zone Assessment of recreational impacts One time Provides an initial<br />
Impacts Guam<br />
Management of underwater activities in Cocos and<br />
assessment of<br />
Grant Piti<br />
recreational impacts<br />
and suggests future<br />
courses of action<br />
In addition to Guam’s efforts, NOAA initiated the Marianas Archipelago Reef Assessment and Monitoring<br />
Program (MARAMP) aboard its research vessel Oscar Elton Sette in 2003. The cruise lasted 39 days from<br />
August 21 to September 28, 2003. The goals of the MARAMP include improving the understanding of coral<br />
reef ecosystems, evaluating and reducing adverse impacts, enhancing coral reef ecosystem-based fisheries<br />
management and conservation through cooperation with partners (Federal and local agencies and non-governmental<br />
organizations), and providing scientific information needed to establish, strengthen, and manage<br />
marine protected areas (MPAs; NOAA Pacific Islands Fisheries Science Center - Coral Reef Ecosystem Division,<br />
http://www.nmfs.hawaii.edu/crd). The science team for the Guam leg of the cruise (September 23-28)<br />
was comprised of staff from the NOAA Coral Reef Ecosystem Investigation Program, DAWR, U.S. National<br />
Park Service, and UOGML. The team conducted a variety of ecological and oceanographic assessments,<br />
including (Figure 16.10):<br />
• Benthic habitat mapping: multi-beam surveys, single beam QTC surveys, geodetic control, towed diver<br />
surveys, and TOAD towed camera surveys;<br />
• Fish, turtle, and marine mammal surveys: belt transects, stationary point counts (SPCs), towed diver surveys,<br />
roving diver surveys, and hydroacoustic surveys;<br />
• Benthic surveys (corals, other invertebrates, algae): belt transects, towed diver surveys, roving diver surveys,<br />
and TOAD towed camera surveys; and<br />
• Oceanography: closely-spaced conductivity-temperature-depth measurements, drifters, subsurface temperature,<br />
acoustic Doppler current profiler transects, CREWS/SST buoys, and current/wave moorings.<br />
The MARAMP is intended to be a long-term monitoring program with research cruises scheduled bi-annually.<br />
The next cruise is scheduled to occur in <strong>2005</strong> (R. Brainard, pers. comm.).<br />
Sidebar Guam<br />
page<br />
459
Guam<br />
page<br />
460<br />
The State of Coral Reef Ecosystems of Guam<br />
Figure 16.10. The locations of monitoring sites around Guam. Map: A. Shapiro. Sources: DAWR; PIFSC-CRED.
WATER QUALITY<br />
The State of Coral Reef Ecosystems of Guam<br />
Limited studies have been conducted on water quality indicators important to coral reefs. GEPA regularly<br />
monitors point source pollution and tests for Enterrococcus indicator bacteria on Guam’s beaches, but there is<br />
limited information on parameters such as nutrient loads, turbidity, or contaminants. However, this is expected<br />
to change in the near future with the implementation of GEPA’s Environmental Monitoring and Assessment<br />
Program (EMAP).<br />
GEPA Water Quality Sampling<br />
According to U.S. EPA requirements, the GEPA samples coastal recreational waters at 39 stations around the<br />
island every week for Enterococcus bacteria. A public advisory is issued when an instantaneous measurement<br />
of bacterial levels exceeds 104 units per 100 ml of water. In fiscal year 2003, 27% of 2,028 samples<br />
exceeded this standard, resulting in 551 advisories. In 2002, GEPA weekly monitoring of the 39 stations resulted<br />
in 1,055 advisories (Table 16.8). Despite the apparent improvement in recreational water quality from<br />
2002 to 2003, it is important to consider that water quality in 2002 was unusually poor, with 51% of samples<br />
resulting in advisories. Previous years had rates similar to those observed in 2003. However, the validity of<br />
basing advisories on Enterococcus as a bacterial indicator of sewage pollution is questionable, as it exists in<br />
the tropical soils of Guam, independent of sewage pollution. Following rains and stormwater runoff, Enterococcus<br />
readings always increase in Guam’s coastal recreational waters, as the bacteria wash out of the soil<br />
(Collins, 1995).<br />
Table 16.8. Water quality advisories issued for recreational areas due to unacceptable Enterococcus levels in 2002-2003. Quarters<br />
are by fiscal year. Source: GEPA.<br />
REGION NUMBER <strong>OF</strong> ADVISORIES PER QUARTER TOTAL NUMBER <strong>OF</strong><br />
1<br />
ADVISORIES<br />
ST 2ND 3RD 4TH 2002 Northern Guam Subtotal 117 124 66 128 435<br />
2002 Southern Guam Subtotal 83 70 98 369 620<br />
2002 Total 200 194 164 497 1055<br />
2003 Northern Guam Subtotal 76 29 63 78 246<br />
2003 Southern Guam Subtotal 81 26 77 121 305<br />
2003 Total 157 55 140 199 551<br />
According to PCR Environmental Inc. (2002a, b, c), freshwater springs in Tumon Bay discharge an estimated<br />
64,350 m 3 of freshwater each day. In 2002, samples from eight of these springs were tested for a broad<br />
range of pollutants. Of the 35 volatile organic compounds that were measured only methylene chloride was<br />
present in amounts exceeding drinking water standards (5 μ/L). Eight different organophosphate pesticide<br />
compounds and 25 carbamate pesticide compounds were not detected or were below standards. Of 23 metals<br />
tested including mercury, only one metal in one sample exceeded drinking water standards (selenium at<br />
0.0957mg/l, with the standard at 0.05 mg/l). Despite meeting the drinking water standards, the contaminants<br />
discharged by the freshwater springs may affect organisms found in the shallow marine waters of Tumon Bay<br />
(PCR Environmental, 2002a, b, c).<br />
Other chemical and physical parameters of coastal waters were not tested regularly during 2002 and 2003 due<br />
to a shift to the new EMAP system, impacts from typhoons to the GEPA laboratory, and the need to prioritize<br />
increased testing of drinking water following the disasters. Sampling results of marine water quality from previous<br />
years by GEPA provided the following results.<br />
From June 1997 to November 1998, 57 surface marine water quality samples were tested from San Vitores<br />
Beach, Dai Ichi Beach and Ypao Beach in the shallow waters of Tumon Bay (Table 16.9). In the rainy season<br />
of 2001 from July to October, GEPA took 89 surface water samples from sites throughout Tumon Bay (Table<br />
16.10). In addition, 30 samples from four surface water stations in Tumon Bay were tested in the rainy season<br />
and the dry season from July to December 2001 (Table 16.11).<br />
Sidebar Guam<br />
page<br />
461
Guam<br />
page<br />
462<br />
The State of Coral Reef Ecosystems of Guam<br />
Table 16.9. Summary of 57 water quality samples from Tumon Bay, 1997-98. Source: GEPA.<br />
Temp<br />
( o C)<br />
Table 16.10. Summary of 89 water quality samples from Tumon Bay, July to October 2001. Source: GEPA.<br />
Table 16.11. Summary of 30 water quality samples from four locations in Tumon Bay, 2001. Source: GEPA.<br />
Temp<br />
( o C)<br />
DO<br />
(mg/<br />
L)<br />
DO<br />
(mg/<br />
L)<br />
pH Sal.<br />
(ppt)<br />
pH Sal.<br />
(ppt)<br />
Secchi<br />
Disc<br />
- Horiz.<br />
(meters)<br />
Enterococ.<br />
(CFU/<br />
100mL)<br />
SiO2 Turb.<br />
(NTU)<br />
Ttl<br />
Susp.<br />
Solids<br />
(mg/L)<br />
Cond.<br />
(mmho)<br />
Turb.<br />
(NTU)<br />
NO2-N<br />
(mg/<br />
L)0.000<br />
Cond.<br />
(mmho)<br />
NO3-N<br />
(mg/<br />
L)0.000<br />
NO 2 -N<br />
(mg/L<br />
0.000)<br />
NH4-N<br />
(mg/<br />
L)0.000<br />
NO 3 -N<br />
(mg/L<br />
0.000)<br />
O-P<br />
(mg/L)<br />
P-Tot<br />
(mg/L)<br />
O-P<br />
(mg/L)<br />
N P-Tot<br />
(mg/L)S<br />
Mean 29.82 6.55 8.19 34.8 0.104 0.998 50.78 0.003 0.0376 0.002 0 0.003 0.007<br />
Med 29.75 6.29 8.21 35 0.093 0.425 52 0.003 0.0155 0.002 0 0.002 0.007<br />
Max 32 9.14 8.39 35 0.18 16 53.2 0.008 0.155 0.002 0 0.025 0.017<br />
Min 28 4.57 7.91 33 0.061 0.21 43.4 0.003 0.002 0.002 0 0 0<br />
Mode 29.5 5.9 8.15 35 0.078 0.35 52 0.003 0.004 N/A 0 0.002 0<br />
O-P<br />
(mg/<br />
L)<br />
N P-Tot<br />
(mg/L)S<br />
Mean 28.4 7.08 8.29 34 11.7 11.1 19.7 0.54 43.7 0.002 0.102 0.007 0.003 0.007<br />
Med 28.4 7.35 8.3 35 11 1 20 0.41 42.7 0.001 0.046 0.007 0.002 0.007<br />
Max 30.7 12.08 8.68 37 27 264 40 1.7 65.8 0.006 0.98 0.017 0.025 0.017<br />
Min 26 2.76 7 30 3 1 4 0.15 33.2 0 0.003 0 0 0<br />
Mode 27 7.4 8.5 35 11 1 20 0.3 #N/A 0 0.036 0 0.002 0<br />
Temp<br />
( o C)<br />
DO<br />
(mg/<br />
L)<br />
pH Sal.<br />
(ppt)<br />
Secchi<br />
Disc<br />
- Horiz.<br />
(meters)<br />
Enterococ.<br />
(CFU/<br />
100mL)<br />
Ttl<br />
Susp.<br />
Solids<br />
(mg/L)<br />
Turb.<br />
(NTU)<br />
Cond.<br />
(mmho)<br />
NO 2 -N<br />
(mg/L)<br />
0.000<br />
NO 3 -N<br />
(mg/L)<br />
0.000<br />
P-Tot<br />
(mg/L)<br />
O-P<br />
(mg/<br />
L)<br />
N P-Tot<br />
(mg/L)S<br />
Mean 30.5 6.63 8.20 34.4 0.120 0.33 48.70 0.003 0.077 0.037 0.003 0.003 0.007 0.003<br />
Med 30.5 6.0 8.22 35.0 0.105 0.28 44.70 0.003 0.026 0.013 0.003 0.002 0.007 0.002<br />
Max 32.5 11.8 8.71 35.0 0.463 1.50 431 0.008 0.99 0.321 0.011 0.025 0.017 0.025<br />
Min 28.5 4.6 7.83 23.0 0.027 0.15 30.9 0.001 0.001 0.001 0.001 0 0 0<br />
Mode 31.0 5.5 8.26 35.0 0.064 0.20 45.4 0.003 0.007 N/A 0.002 0.002 0 0.002<br />
BENTHIC HABITATS<br />
A number of studies have looked at benthic habitats in Guam’s nearshore waters. These studies include studies<br />
sponsored by the U.S. Navy at two compensatory mitigation sites, Orote Peninsula ERA and Haputo ERA<br />
(Amesbury et al., 2001; Paulay et al., 2001), a thesis study on the effects of Acanthaster planci infestations on<br />
coral community structure (Bonito, 2002), and the initial interpretation of the macroalgae surveyed during the<br />
2003 Oscar Elton Sette cruise to Guam (Vroom, in review).<br />
Orote Peninsula Ecological Reserve Area<br />
The Orote Peninsula ERA contains a diverse assemblage of habitats, including a highly exposed, currentswept<br />
point; a silty bay; intertidal fringing reefs; and deep, steep dropoffs and caves. To capture this diversity,<br />
the area was divided into 58 representative sub-zones (Figure 16.11). The area was examined using a manta<br />
tow and divided into 17 zones based on topography and bottom-type. These zones were then sub-divided<br />
based on depth. For the qualitative diversity surveys, divers surveyed each sub-zone and recorded all visible<br />
fish, macroinvertebrate, and coral species (Paulay et al., 2001).
Methods<br />
For the quantitative surveys, 10 permanent<br />
monitoring stations were<br />
established representing the main<br />
habitat types found in the ERA. Due<br />
to the steep forereef topography in<br />
most of the study area, eight stations<br />
were located at the 15 m depth contour<br />
where the forereef slope is less<br />
steep. The other two stations were<br />
located in Agat Bay, which has a<br />
more traditional forereef slope which<br />
allowed for two stations at a depth<br />
of 5 m. At each monitoring station,<br />
five 50-m transects laid end to end<br />
(5-10 m apart) were used to survey<br />
an area approximately 270-290 m<br />
long. Four types of surveys were<br />
conducted along each transect: 1) a<br />
benthic cover survey, 2) a coral population<br />
survey, 3) a fish survey, and 4)<br />
a macroinvertebrate survey.<br />
Quantitative surveys used both the<br />
video protocol recommended by<br />
English et al. (1997) and point quarter<br />
methods used by Birkeland and<br />
Lucas (1990). For the video transects,<br />
the camera was held 25 cm<br />
away from the bottom to record a 25<br />
cm swath along each transect. Five<br />
points from 60 equally spaced frames<br />
were analyzed for each transect, providing<br />
a total of 1,500 points per station.<br />
The point quarter method was<br />
used to survey one to three transects<br />
at each station. Sixteen points were<br />
haphazardly selected on each transect.<br />
The distance to the center of<br />
the closest coral colony center, the<br />
length and width of the colony, and<br />
the species were recorded in each<br />
quadrant.<br />
The State of Coral Reef Ecosystems of Guam<br />
Figure 16.11. Macrohabitat zones, transect sites, and survey sites in the Orote Peninsula<br />
ERA. Map: A. Shapiro. Source: Paulay et al., 2001.<br />
Figure 16.12. The relative composition of each coral cover class at 10 stations in<br />
Orote ERA. Coral cover was relatively, with percent coral cover ranging from 4-19%,<br />
except at one site dominated by Porites rus, which had 32% cover. Other cover types<br />
included turf algae, macroalgae, Halimeda, and coralline algae. Source: Paulay et<br />
al., 2001.<br />
Results and Discussion<br />
During these surveys, 1,252 species of marine animals were reported, including 156 species of scleractinian<br />
corals. Two of the coral species documented (Leptoseris spp. and Favia rotundata) were new records for<br />
Guam. Coral cover was relatively low at most Orote Point stations surveyed, ranging between 4 and 19%.<br />
One site dominated by Porites rus had 32% coverage. Bottom cover varied across the study area (Figure<br />
16.12), and included coral, coralline algae, the green algae Halimeda, other macroalgae, turf algae, other invertebrates<br />
and sand. Coral demographics also varied by site, with colony size exceeding colony density at<br />
only the site dominated by Porites rus (Figure 16.13).<br />
Sidebar Guam<br />
page<br />
463
Guam<br />
page<br />
464<br />
The State of Coral Reef Ecosystems of Guam<br />
Haputo Ecological Reserve Area<br />
The Haputo ERA is located along the<br />
northwest coast of Guam, from just<br />
south of Haputo Beach to just north<br />
of Double Reef. This area is bounded<br />
by narrow, supratidal benches or<br />
unprotected rock faces, although the<br />
study area contains two small, localized<br />
reef flats near Haputo Beach and<br />
Double Reef. Double Reef, an incipient<br />
barrier reef, is a unique feature<br />
in this area that creates highly heterogeneous<br />
habitat, including a distinct<br />
backreef community. Unlike the<br />
Orote Peninsula ERA, this study area<br />
lacked large-scale transitions along<br />
the shore, thus 31 sites were distributed<br />
evenly along the coast and along<br />
the depth gradient for the qualitative<br />
surveys (Figure 16.14). The fauna at<br />
each site were surveyed for at least<br />
one hour by a team of four or five divers.<br />
Two divers focused on corals<br />
and fish, which were surveyed during<br />
30 minute diversity surveys. Two to<br />
three divers surveyed both exposed<br />
and cryptic macroinvertebrates.<br />
Methods<br />
For the quantitative surveys, six permanent<br />
monitoring stations were<br />
established in areas that provided<br />
relatively homogeneous benthic<br />
communities and maximal geographic<br />
coverage within the study area.<br />
Three stations were set at 8 m and<br />
three were set at 15 m. At each station,<br />
five 50-m transects were laid<br />
end to end (5-10 m apart), covering<br />
an area 270-290 m long. If there<br />
was not sufficient homogeneity for<br />
250+ m of transects, two groups of<br />
2-3 transects were laid, with the second<br />
group placed 10 m seaward of<br />
the first. Four types of surveys were<br />
conducted along each transect: 1) a<br />
benthic cover survey, 2) a coral population<br />
survey, 3) a fish survey, and 4)<br />
a macroinvertebrate survey. Quantitative<br />
surveys followed the same<br />
protocols discussed in the previous<br />
section.<br />
Figure 16.13. Coral demographics at 10 stations in the Orote ERA. Colony density<br />
was greater than colony size at all but one site. Source: Paulay et al., 2001.<br />
Figure 16.14. Macrohabitat zones, transect sites, and survey sites in the Haputo<br />
ERA. Map: A. Shapiro. Source: Amesbury et al., 2001.
Results and Discussion<br />
During these surveys, 944 species<br />
of marine animals, including 154<br />
species of scleractinian corals, were<br />
recorded. The quantitative studies<br />
indicated that coral cover was relatively<br />
high at most Haputo stations<br />
surveyed, ranging between 37% and<br />
64%. This is higher than most locations<br />
in Guam’s waters. Montipora<br />
and Porites were the dominant corals<br />
at all stations (Figure 16.15). Montipora<br />
was common at the shallow<br />
stations (1-3), but Porites dominated<br />
in deeper stations (4-6). Station 1<br />
had 64% coral coverage, which was<br />
dominated by a diverse assemblage<br />
of Montipora colonies. In general,<br />
the data from this area suggest that<br />
the coral communities are thriving.<br />
Bottom cover varied across the study<br />
area (Figure 16.16), and included coral,<br />
coralline algae, macroalgae, turf<br />
algae, other invertebrates, and sand/<br />
pavement. Corals were the dominant<br />
cover, followed by turf algae. It is interesting<br />
to note that the coral killing<br />
sponge, Terpios hoshinota, was an<br />
important cover at Station 6 (coded<br />
as other invertebrates).<br />
Effects of Acanthaster planci on<br />
Coral Community Structure<br />
Tanguisson Reef has been studied<br />
since the early 1970s, when Randall<br />
(1973) monitored the recovery from a<br />
1967 outbreak of COTS (Acanthaster<br />
planci). The study indicated that coral<br />
coverage increased after the infestation<br />
through new coral recruitment<br />
and growth of existing corals. By<br />
1980-81, the coverage of corals had<br />
The State of Coral Reef Ecosystems of Guam<br />
Figure 16.15. Over 150 species of scleractinian coral were documented in the Haputo<br />
ERA. Coral cover was dominated by Montipora and Porites at most of the six<br />
sites. Source: Amesbury et al., 2001.<br />
Figure 16.16. Bottom cover within the Haputo ERA. Corals emcompass 37-64% of<br />
bottom coer at the six sites. Other cover included turf algae, macroalgae, and coralline<br />
algae. There was a high incidence of Terpios hoshinota, the coral-killing sponge<br />
at site six. Source: Amesbury et al., 2001.<br />
increased until it was similar to neighboring reefs unaffected by the outbreak (Colgan 1981a,b; Colgan, 1987).<br />
This study also indicated that the community was dominated by Acropora and Montipora species. Since that<br />
time, a number of smaller A. planci outbreaks have been reported. Bonito and Richmond (submitted) studied<br />
the community again in 2001 to determine if the community structure had changed since the 1980s.<br />
Methods<br />
Tanguisson Reef is located on the northwest coast of Guam and can be divided into three physiographic<br />
zones. The reef front is a well-developed spur and groove system in depths of 1-6 m and ranges in width from<br />
50-70 m. Relief in this area can be greater than 3 m, but tapers off at the end of this zone. The submarine<br />
terrace covers areas that are 6-18 m in depth. This zone has lower relief and ranges from 40-110 m in width.<br />
It is followed by the seaward slope, which ranges from 18-40 m in depth. This zone has an intermediate relief<br />
of 1-2 m.<br />
Sidebar Guam<br />
page<br />
465
Guam<br />
page<br />
466<br />
The State of Coral Reef Ecosystems of Guam<br />
Transects in the 1970s and 1980s were laid perpendicular to shore across the reef to a depth of 10 m. In<br />
1970, 1971, and 1974, Randall (1973) used a quadrat method at 10 m intervals along each transect (Jones<br />
et al., 1976). This method measured the width and length of each colony at least 50% within the quadra, and<br />
recorded the growth form of each colony. This information was used to determine the live coral cover, colony<br />
abundance, small colony abundance, and species frequency. Colgan resurveyed the transects in 1980 using<br />
the point-quarter method at 2 m intervals and in 1981 using the quadrat method. The most recent study in<br />
2000 and 2001 used the quadrat method used by Randall in the 1970s; however, the original transects could<br />
not be located. Twenty stations were sampled on the reef front, 22 on the submarine terrace, and 15 on the<br />
seaward slope. Three additional dives were conducted in each zone to assess overall species richness.<br />
The researchers also studied the feeding preferences of A. planci on northwestern reefs. Twelve sites were<br />
chosen on the western side of the island. At each site, coral species abundance was surveyed and the site<br />
was searched for A. planci. Researchers recorded the number of A. planci present and the number of freshly<br />
eaten colonies of each coral species.<br />
Results and Discussion<br />
The researchers found that A. planci preferentially feed on Acropora, Montipora, and Pocillopora species.<br />
Astreoopora, Cyphastrea, Goniastrea, Pavona, and Stylophora were considered medium-preference corals.<br />
Acanthastrea, Favia, Favites, Galaxea, Goniopora, Leptastrea, Leptoseris, Millepora, Platygyra, Porites,<br />
Psammocora, and Stylocoeniella were considered non-preferred corals. They observed that diet depended<br />
on relative abundance of corals. If the preferred species were relatively abundant, they were the predominant<br />
food source, while medium-preference corals were eaten when preferred species were not abundant. Nonpreferred<br />
corals were only eaten when the others were relatively rare.<br />
Colgan’s study in 1980-81 found that the submarine terrace was dominated by several species of Montipora.<br />
Acropora and Montipora species were the second and third most dominant species in the reef front and seaward<br />
slope. The newest survey of this area found that Porites is now the dominant genus on the submarine<br />
terrace and seaward slope, with only negligible contributions from Montipora and Acropora. The reef front is<br />
now dominated by other genera and Acropora is only an insignificant contributor. This study found no change<br />
in total percent coral cover on the submarine terrace and a slight decrease on the seaward slope. The researchers<br />
suggest that this change in community composition may be due to feeding by A. planci, as non-preferred<br />
corals had significantly greater cover than preferred or medium-preference corals on the seaward slope<br />
and submarine terrace. Non-preferred corals are the most abundant in all zones. Preferred corals increased<br />
slightly in cover and abundance on the reef front, but not as much as the other preference groups.<br />
This study suggests that large-scale changes in the coral communities at Tanguisson Reef over the last 20<br />
years may have been driven by selective feeding by A. planci. The study also identifies seasonal algal blooms<br />
as an additional stressor that may impact the settling of larvae produced by Acropora, Montipora, and Pocillopora<br />
species that spawn in the summer. This combination of effects seems to be exacerbated by nutrient<br />
influx into Guam’s coastal waters and depletion of herbivorous fish stocks due to overfishing. Nutrient influx<br />
may be directly affecting the survivorship of A. planci larvae, which are dependent on planktonic food supply<br />
and can directly assimilate dissolved organic matter. Declines in the herbivorous fish stocks may impact larval<br />
settling of corals as algal blooms cover most of the suitable substrate during the summer months when these<br />
species spawn. Better land management is suggested as the best means to protect Guam’s reefs from future<br />
shifts in coral communities.<br />
Algal Communities<br />
Guam’s algal communities were surveyed as a part of the MARAMP in September 2003 using a rapid ecosystem<br />
assessment (REA) protocol developed specifically for remote island ecosystems (Preskitt et al., 2004).<br />
One component of this protocol, a rapid method of analysis using presence/absence and ranked data, was<br />
employed for this preliminary assessment (Vroom, in review). These data provide information on prevalence<br />
and relative abundance of algae in Guam at the genus level. Prevalence was defined as the percentage of<br />
quadrats in which a genus occurs at each site and relative abundance was defined as the abundance of a<br />
genus (i.e., the rank) in relation to other algal genera occurring in the same quadrat (Vroom, in review).
The State of Coral Reef Ecosystems of Guam<br />
Methods<br />
Benthic REAs were conducted at nine sites around Guam, including one site on Santa Rosa Bank, just southeast<br />
of Guam. Three 25-m transect lines were set in a single-file row at a constant depth, with each transect<br />
separated by 10 m. Ranked abundance of algal genera was collected from a total of 12 quadrats (0.18 m 2 )<br />
at each site (1 being the most abundant, 2 being the next most abundant, etc.; Vroom et al., in review). Additionally,<br />
samples of macroalgae present within each quadrat were collected as voucher specimens (Preskitt<br />
et al., 2004).<br />
Results and Discussion<br />
According to Vroom (in review), algae from 28 genera or functional groups (i.e., crustose coralline algae, upright<br />
branched coralline algae, turf algae, cyanophytes) were found in quadrats at sites sampled around Guam<br />
and Santa Rosa Bank. In addition to the functional groups of turf, cyanophytes, branched coralline algae,<br />
and crustose coralline algae, the most prevalent genera found around Guam included green algae (Halimeda<br />
and Neomeris), brown algae (Padina), and red algae (Trichleocarpa and an unknown gelid rhodophyte). At<br />
the Santa Rosa Bank site, species in the genera Dictyosphaeria, Halimeda, Udotea, and the green algal species<br />
Microdicyton okamurai Setchell were most prevalent. Turf and the gelid rhodophyte were also extremely<br />
prevalent. Relative abundance of genera was similar among sites.<br />
Benthic Habitat Mapping<br />
NOAA’s Center for Coastal Monitoring<br />
and Assessment - Biogeography<br />
Team initiated a nearshore benthic<br />
habitat mapping project for Guam,<br />
American Samoa, and the Commonwealth<br />
of the Northern Mariana<br />
Islands (CNMI) in 2003. IKONOS<br />
satellite imagery was purchased from<br />
Space Imaging, Inc. for all three jurisdictions<br />
and used to delineate habitat<br />
polygons in a geographic information<br />
system (GIS). Habitat polygons were<br />
defined and described according to a<br />
hierarchical habitat classification system<br />
consisting of 18 distinct biological<br />
cover types and 14 distinct geomorphological<br />
structure types. The project,<br />
which was completed in 2004,<br />
mapped 104.7 km 2 of nearshore habitat<br />
in these islands and produced a<br />
series of 42 maps that are currently<br />
being distributed via a print atlas, CD-<br />
ROM, and on-line at: http://biogeo.<br />
nos.noaa.gov/products/us_pac_terr/.<br />
The benthic habitat maps for Guam<br />
are depicted in Figure 16.17.<br />
Figure 16.17. Nearshore benthic habitat maps were developed in 2004 by CCMA-<br />
BT based on visual interpretation of IKONOS satellite imagery. For more info, see:<br />
http://biogeo.nos.noaa.gov. Map: A. Shapiro.<br />
Sidebar Guam<br />
page<br />
467
Guam<br />
page<br />
468<br />
The State of Coral Reef Ecosystems of Guam<br />
ASSOCIATED BIOLOGICAL COMMUNITIES<br />
Many recent studies on Guam have examined the biological communities associated with coral reefs. The<br />
most detailed studies have examined the fish communities. These include the marine preserve monitoring<br />
by the DAWR (Gutierrez, in prep.) and UOGML (Tupper, in prep.). The U.S. Navy-sponsored studies at<br />
Orote Peninsula and Haputo ERAs discussed in the previous section also examined fish communities and<br />
macroinvertebrate populations at the survey sites. Preliminary data for fish communities collected during the<br />
MARAMP are included below, although data for other communities are not yet available.<br />
DAWR <strong>Marine</strong> Preserve Monitoring<br />
In 1997, Guam established five marine preserves around the island, covering 11.8% of the island’s shoreline.<br />
DAWR sampled the fish populations in two of the preserve areas and suitable control sites prior to the start of<br />
full enforcement on January 1, 2001, and has since monitored the fish communities at these sites to determine<br />
the effectiveness of the preserve system. These studies focus on fish species targeted for consumption and<br />
indicator species such as butterflyfish.<br />
Methods<br />
The Piti Bomb Holes and Achang Reef Flat <strong>Marine</strong> Preserves are the experimental sites for the stock assessment<br />
surveys. Cocos Lagoon and the Asan forereef slope serve as the control sites for the Piti Bomb Holes<br />
<strong>Marine</strong> Preserves, while Pago Bay reef flat and Cocos forereef slope serve as the control sites for the Achang<br />
Reef Flat <strong>Marine</strong> Preserve.<br />
Prior to full enforcement in 2001, 66 permanent belt transects (50 m x 5 m) were surveyed on the reef flats and<br />
forereef slopes of two preserve sites, Piti Bomb Holes and Achang Reef Flat <strong>Marine</strong> Preserves, and three control<br />
sites, Asan Bay, Cocos Lagoon, and Pago Bay. Two sets of transects were placed on the forereef slope<br />
at the 6, 9, 12 and 15 m depth contours. Eight transects were placed on the reef flat at each site, representing<br />
distinct microhabitats (seagrass, coral/algal/rubble, and sandy bottom).<br />
Fish communities were surveyed using two different visual survey techniques along each transect. Density<br />
was assessed using a visual fish census along a strip transect. Two fish counters followed the 50 m long permanent<br />
transect, each counting all target fish within 2.5 m of the side of the transect. All target fish within this<br />
250 m 2 area were scored on data sheets based on their species and size class. Three size classes were used<br />
based on the fork length of the fish (30 cm). The strip transect method was complemented<br />
by a timed visual survey in the same area. At each site, fish counters recorded the species and size<br />
class of all fish encountered in the area during a 30-minute interval.<br />
Fish surveys were conducted at all sites prior to full enforcement of the preserves and then repeated within<br />
two years. Because of poor weather conditions and lack of a boat, only four transects on the forereef slope<br />
of Achang Reef Flat <strong>Marine</strong> Preserve were repeated (one at each depth of 6, 9, 12 and 15 m). Data were<br />
analyzed using Statview 4.5 for PC published by Abacus Concepts Inc. A two-tailed paired t-test was used<br />
to compare fish densities and diversity over time within each study site (Sokal and Rohlf, 1995). The Shannon-Weiner<br />
diversity index was used to calculate an index number for species diversity and evenness at each<br />
site for both pre- and post-implementation data. A higher index number indicated greater diversity. When the<br />
assumptions of analysis of variance (ANOVA) were not met, even after transformations, a nonparametric test<br />
was conducted (Sokal and Rohlf, 1995).<br />
Results and Discussion<br />
The data from the belt transect surveys suggest that fish stocks in the preserve areas are starting to recover,<br />
while some non-preserve areas are still declining. Data also indicate that within the Piti Bomb Holes and<br />
Achang Reef Flat <strong>Marine</strong> Preserves, there were significant increases of 113% (p
138% within the Piti Bomb Holes <strong>Marine</strong><br />
Preserve (p
Guam<br />
page<br />
470<br />
The State of Coral Reef Ecosystems of Guam<br />
Focal Species Abundance<br />
Focal species abundance was determined for four species: bullethead parrotfish (Chlorurus sordidus), yellowstripe<br />
goatfish (Mulloidichthys flavolineatus), orangespine unicornfish (Naso lituratus), and bluespine unicornfish<br />
(Naso unicornis). Two sites were chosen within each of the three marine preserves and the three control<br />
sites. All sites were near the edge of the reef flat at depths of 2-5 m. Four replicate 50 m x 2 m transects were<br />
surveyed at each site to determine the density of each species per 100 m 2 area. The results were analyzed<br />
using a nested ANOVA. Location and status were used as model factors with location nested within status.<br />
Densities for all four species were significantly higher in the MPAs than in the control sites, and in some<br />
cases, density was an order of magnitude<br />
higher in the preserves (Figure<br />
16.20). Further analysis indicated<br />
that there were also significant differences<br />
among the preserve sites and<br />
among the control sites. Density of<br />
Chlorurus sordidus was highest at<br />
Piti Bomb Holes <strong>Marine</strong> Preserve,<br />
possibly due to fish feeding by divers<br />
and snorkelers. Mulloidichthys<br />
flavolineatus density was five to nine<br />
times higher in the preserves than<br />
in the control sites, with the highest<br />
density documented in Tumon Bay.<br />
Achang Reef Flat <strong>Marine</strong> Preserve<br />
had the highest densities of Naso lituratus<br />
and Naso unicornis.<br />
Population Structure<br />
Population size structure was determined<br />
by counting fish and estimating<br />
their fork length in situ. As de-<br />
Figure 16.20. Density of commercially valuable food fishes along a 50 m transect<br />
at preserve and non-preserve sites following two years of enforcement at preserve<br />
areas. Food fish density was noticeably greater in preserve sites. Source: Tupper,<br />
in prep.<br />
scribed in the previous section, fish were surveyed on four replicate 50 m x 2 m transects. Eight size classes<br />
were used for size estimation: 10-12.5 cm, 12.5-15 cm, 15-17.5 cm, 17.5-20 cm, 20-22.5 cm, 22.5-25 cm,<br />
25-27.5 cm, and 27.5-30 cm. Fish less than 10 cm were not counted. As these small transects did not provide<br />
enough data, the method was modified to use a single 100 m x 4 m transect. However, this prevented statistical<br />
comparison between sites. The results indicated that C. sordidus, particularly the larger size classes, were<br />
more abundant at all preserve sites than control sites. M. flavolineatus were more abundant in the preserves<br />
than the control sites; however, small-medium sized M. flavolineatus were less abundant in Achang Reef Flat<br />
<strong>Marine</strong> Preserve than at the control sites in Cocos Lagoon.<br />
The length and abundance data were used to determine the spawning biomass (the weight of the spawning<br />
adult fishes per unit area). The length data were used to estimate weight values using published length-weight<br />
regressions. Biomass for C. sordidus and M. flavolineatus was significantly higher in the preserve sites than<br />
the control sites (nested ANOVA, F=8.49, p=0.006, F=15.7, p
The State of Coral Reef Ecosystems of Guam<br />
Transects were revisited three months later to determine the survival rates of the settled fish. On the second<br />
visit, the expected length for the previously recorded settlers was recorded: C. sordidus at 25-50 mm long and<br />
M. flavolineatus at 90-120 mm long. The pattern of recruitment changed during the three months that elapsed<br />
between surveys. Despite the high settlement in Cocos Lagoon, the second survey indicated that recruitment<br />
success was 50% less than in the Achang Reef Flat <strong>Marine</strong> Preserve. In general, C. sordidus recruitment in<br />
the marine preserves was significantly higher than in the control sites (nested ANOVA, F=64.8, p
Guam<br />
page<br />
472<br />
The State of Coral Reef Ecosystems of Guam<br />
(3.8%), Scaridae (3.2%), and Balistidae<br />
(2.2%), while all other fish species<br />
comprised 7.2% (Figure 16.22).<br />
During the quantitative surveys, a<br />
total of 26 species of macroinvertebrates<br />
were identified. This included<br />
19 echinoderms, six mollusks, and<br />
one crustacean. The maximum number<br />
of species observed at a single<br />
station was 13, with the highest diversity<br />
occurring towards Agat Bay<br />
(Figure 16.23). These surveys only<br />
captured the large, diurnal, exposed<br />
species and did not capture the many<br />
cryptic and nocturnal species resident<br />
at these areas. The most commonly<br />
encountered species were: echinoids<br />
(Echinostrephus aciculatus and Echinothrix<br />
spp.), the giant clam (Tridacna<br />
maxima), and the sea cucumber<br />
(Holothuria edulis).<br />
The study indicates that diversity and<br />
species composition of Orote Peninsula<br />
reefs are strongly influenced<br />
by physical factors such as wave exposure,<br />
currents, riverine influence,<br />
and bottom topography. A number<br />
of unique microhabitates and macrohabitats<br />
exist in this area, with very<br />
different assemblages found within<br />
each of them. The researchers indicate<br />
that the Blue Hole, Orote Boulder<br />
Fields, and Orote Point reef slope<br />
were biologically important due to<br />
unique species and high biodiversity.<br />
Haputo ERA Fish and Macroinvertebrate<br />
Surveys<br />
As described above in the ‘Benthic<br />
Habitat’ section the U.S. Navy sponsored<br />
biodiversity studies and baseline<br />
reef monitoring surveys at Haputo<br />
ERA (Amesbury et al., 2001).<br />
Both qualitative biodiversity surveys<br />
and quantitative baseline monitoring<br />
were conducted for fish and macroinvertebrates.<br />
Figure 16.21. 1252 species were recorded during a survey in the Orote Peninsula<br />
ERA. Richness varied greatly between subzones. Source: Paulay et al., 2001.<br />
Figure 16.22. Fish family composition in the Orote Peninsula ERA. Source: Paulay<br />
et al., 2001.<br />
Figure 16.23. Number of macroinvertebrate species at 10 sites in the Orote Peninsula<br />
ERA. Macroinvertebrate communities varied greatly over the study sites. Cryptic<br />
species were not included in the survey. Source: Paulay et al., 2001.
The State of Coral Reef Ecosystems of Guam<br />
Methods<br />
Fish and macroinvertebrates were qualitatively surveyed at each of the sites identified in the study using timed<br />
surveys (30 minutes) to assess fish diversity and abundance and a timed search (one hour) for large macroinvertebrates.<br />
The survey team followed the same methodology for fish as described above in the Orote Point<br />
section, but used 2 m-wide transects for macroinvertebrates.<br />
Results and Discussion<br />
This survey recorded 944 species of marine animals. This included only the exposed macrofauana identified<br />
during the limited dives. Fish recorded included 207 species, approximately 22% of the 920 known species<br />
from Guam. Macroinvertebrates accounted for 583 species encountered during the qualitative surveys. A<br />
comparison of surveyed biodiversity<br />
between Orote Peninsula and Haputo<br />
ERAs showed some interesting<br />
results (Table 16.12). Researchers<br />
identified a similar number of corals<br />
at the two sites; however, they<br />
found more species of fish and invertebrates<br />
at Orote Peninsula than<br />
at Haputo sites. The researchers<br />
noted that while the corals are thriving<br />
at Haputo, the fish community is<br />
not. Large piscivores and herbivores<br />
were rare.<br />
The researchers also noted differences<br />
among the six macrohabitats<br />
identified in the survey. The forereef<br />
sites are more diverse than the shallow<br />
sites. The shallow sites had fewer<br />
coral, fish, and other invertebrate<br />
species than the medium to deep<br />
macrohabitats (Figure 16.24).<br />
The quantitative surveys were conducted<br />
at six stations. Twenty-one<br />
fish families were recorded during the<br />
quantitative studies. The most abundant<br />
family was the Pomacentridae<br />
(74%), followed by the Acanthuridae<br />
(10.1%), Labridae (6.7%), Lethrinidae<br />
(3.1%, Gnathodentex aurolineatusa<br />
only), Gobiidae (2.7%), Scaridae<br />
(1.2%) and Chaetodontidae (1.1%),<br />
while all other fish species comprised<br />
3.4% (Figure 16.25).<br />
Table 16.12. A comparison of coral species in the Orote and Haputo ERAs indicated<br />
that both areas exhibited similar coral species richness, but different levels of fish and<br />
invertebrate species richness. Source: Amesbury et al., 2001.<br />
SURVEY AREA <strong>CORAL</strong>S OTHER INVERTEBRATES FISHES<br />
Orote-Agat 156 757 339<br />
Haputo-Double Reef 154 583 207<br />
Ratio 1.01 1.3 1.64<br />
Figure 16.24. Mean number of species in six microhabitats in the Haputo ERA: Exposed<br />
Bench (EB), Protected Reef Flat (PRF), Double Reef Top (DRT), Back Reef<br />
(BR), Shallow Fore Reef (SFR), and Deep Fore Reef (DFR). Note the large variation<br />
in species richness among the six sites. Source: Amesbury et al., 2001.<br />
Figure 16.25. Fish family composition in the Haputo ERA. Source: Amesbury et<br />
al., 2001.<br />
Sidebar Guam<br />
page<br />
473
Guam<br />
page<br />
474<br />
The State of Coral Reef Ecosystems of Guam<br />
During the quantitative surveys a<br />
total of 24 species of macroinvertebrates<br />
were identified. This included<br />
16 echinoderms and eight mollusks.<br />
The maximum number of species<br />
observed at a single station was 13,<br />
with the highest diversity occurring<br />
in the shallow stations (1-3) (Figure<br />
16.26). The most commonly encountered<br />
species were sea urchins in<br />
the genera Echinometra and Echinostrephus.<br />
Giant clams (Tridacna<br />
maxima), were found at five of the<br />
six sites, but were less common than<br />
sea urchins.<br />
The study indicated that while corals<br />
were thriving, the fish targeted by the<br />
local fisheries were less diverse and<br />
less abundant than expected. The<br />
Figure 16.26. Number of macroinvertebrate species in the Haputo ERA. Macrovertebrate<br />
communities varied greatly and included 16 echinoderms and eight mollusks.<br />
Cryptic species were not included in the survey. Source: Amesbury et al., 2001.<br />
low abundance of large individuals of these species suggests that overfishing may also be a problem in this<br />
area.<br />
MARAMP Fish Surveys<br />
Fish surveys were directed in September 2003 as part of the Guam leg of the MARAMP. Objectives of the<br />
surveys included: 1) creating a fish baseline to measure MPA effectiveness; 2) monitoring size-frequency<br />
assemblages; 3) assessing the status of target, indicator or keystone species; 4) assessing response by the<br />
fish community to possible ecosystem impacts (e.g., overfishing, habitat damage, sedimentation, prey size<br />
changes); and 5) assessing species composition and diversity by area and effectiveness of temporal monitoring<br />
of managed areas (R. Schroeder, unpublished data).<br />
Methods<br />
Fish were surveyed around the island of Guam and at Santa Rosa Bank. Several types of surveys were<br />
conducted, including: 1) REAs to document species diversity at a site; 2) belt transects to estimate densities<br />
of relatively small-bodied and abundant fishes; 3) SPCs to estimate densities of relatively larger (≥25 cm total<br />
length (TL)) and more mobile fish species; and 4) towed-diver/video surveys to estimate densities of relatively<br />
large-bodied (≥50 cm TL), wide-ranging fishes over a broad-spatial scale, in conjunction with a towed-diver/<br />
habitat video. Fish length-class was estimated for all quantified fishes to provide an estimate of numerical size<br />
structure and biomass density by taxa.<br />
Results and Discussion<br />
Schroeder (unpublished report) provided the following preliminary results. Data from 11 belt transects showed<br />
that large fish (≥20 cm) were not abundant, averaging about 2/100 m 2 (compared with over 14/100 m 2 at Uracas<br />
and Maug, the two northernmost islands in the Mariana Archipelago). Results from 11 SPC surveys were<br />
similar. Medium-sized fish were only common along the north and northeast sides of the island. Densities of<br />
larger fish (>50 cm TL) from towboard surveys were also quite low for both Guam and Santa Rosa (less than<br />
0.1/100 m 2 ). No sharks were observed by the fish census team, although the fish tow-team did see black-tip<br />
and white-tip sharks. About 232 species were sighted during the five-day survey. Few juvenile fish were present,<br />
unlike the northernmost Mariana Islands, where recruitment for several species was higher. The highest<br />
diversity of fish was found at Jinapsan Beach on the northern tip of Guam. Common species observed included<br />
brown surgeonfish (Acanthurus nigrofuscus), red ribbon wrasse (Thalassoma quinquevittatum), bullethead<br />
parrotfish (Chlorurus sordidus), and orangespine unicornfish (Naso lituratus).
The State of Coral Reef Ecosystems of Guam<br />
Guam sustains a large human population and its waters are heavily fished. Habitat damage and loss may<br />
also contribute to these preliminary findings on the status of coral reef fish assemblages. Ongoing analysis of<br />
the 2003 data, together with planned biennial monitoring, should help determine the effectiveness of Guam’s<br />
recently established MPAs, as well as provide the scientific basis for other management initiatives.<br />
Overall Condition/Summary of Analytical Results<br />
Guam’s northern reefs are generally in better condition than those affected by erosion and sedimentation in<br />
the south, due to the primarily limestone composition of northern Guam. Coral cover and diversity are generally<br />
highest in an area beginning roughly at Falcona Beach on the northwest coast, continuing clockwise<br />
around the northern coast, and extending down to Pagat Point on the eastern side of the island (Figure 16.27).<br />
The areas between Tanguisson Point and Falcona Beach also have high coral cover and diversity; however,<br />
they are heavily fished and have higher recreational use than the reefs to the north (Amesbury et al., 2001).<br />
The eastern reefs along the central and southern portions of the island are heavily affected by sedimentation<br />
and freshwater runoff near the mouths of rivers that drains Guam’s largest watersheds, especially during<br />
the rainy season. However, some very diverse and relatively healthy reefs lie adjacent to these heavily<br />
impacted spots, especially the forereef slopes off of Achang Reef Flat <strong>Marine</strong> Preserve and the south side of<br />
Cocos Lagoon. Most of the fringing reefs along the southwestern shores are in poor to fair condition, again<br />
depending on their proximity to river mouths. Water quality impacts caused by coastal development, wildland<br />
arson, and runoff are a serious concern in these areas; however, there are limited water quality data available.<br />
GEPA, DAWR, and UOGML hope to address this issue through future monitoring efforts such as increasing<br />
water quality monitoring and studying<br />
sedimentation of southern reefs in<br />
conjunction with upland restoration<br />
projects.<br />
Although Apra Harbor is home to the<br />
busiest port in Micronesia, a large<br />
U.S. Navy base, and numerous recreational<br />
facilities, it contains both<br />
patch and fringing reefs with some of<br />
the highest coral cover on the island<br />
(i.e., Jade Shoals, Western Shoals,<br />
and Finger Reef). Both hawksbill<br />
and green sea turtles frequently forage<br />
in the protected waters of the<br />
harbor, and the extensive mangroves<br />
of Sasa Bay <strong>Marine</strong> Preserve are<br />
also located there. However, corals<br />
and reefs near the northeastern part<br />
of the harbor have been impacted by<br />
thermal discharges from the Guam’s<br />
main power generation facilities (G.<br />
Davis, pers. comm.). The reefs from<br />
Orote Point south to Agat include<br />
many different microhabitats for a diverse<br />
assemblage of reef organisms.<br />
The fishing advisory for the areas<br />
near the Orote Dump has resulted in<br />
a de facto fishing preserve, allowing<br />
some stocks to rebound from fishing<br />
pressure. Chemicals leaching from<br />
the dumpsite do not appear to have<br />
significantly impacted the resources<br />
(Paulay et al., 2001).<br />
Figure 16.27. Summary map showing the overall condition of Guam’s coral reef<br />
ecosystems. Map: A. Shapiro. Source: DAWR.<br />
Sidebar Guam<br />
page<br />
475
Guam<br />
page<br />
476<br />
The State of Coral Reef Ecosystems of Guam<br />
Several large bays - Piti, Asan, West and East Agana, and Tumon - are located along the central western<br />
coastline an area that experiences calm conditions for most of the year. According to Gutierrez (in prep.) and<br />
Tupper (in prep.), Asan Bay is heavily impacted by fishing, and fish stocks have decreased in this area since<br />
monitoring began in 2001. Piti and Tumon Bays were selected to be marine preserves due to their wide diversity<br />
of habitat types. Since full implementation of the preserves in January 2001, increases in herbivorous fish<br />
densities appear to have better controlled the growth of palatable macroalgae in the two preserves, resulting<br />
in healthier looking reefs (T. Leberer, pers. obs.). A study to assess algal abundance and composition in relation<br />
to herbivore stocks inside and outside the marine preserves has been proposed for funding in fiscal year<br />
<strong>2005</strong>.<br />
The overall scarcity of reef fish, especially larger individuals, despite the persistence of some relatively healthy<br />
and diverse coral communities around the island, is a serious concern (Schroeder, unpublished report). The<br />
exceptions to this are within the marine preserves, where significant increases in fish density and diversity<br />
have been observed (Gutierrez, in prep.). Continued fish and habitat assessment surveys within Guam’s marine<br />
preserves will provide an effective means to monitor their status. In addition, two recently funded projects<br />
will assess the amount of spillover - both from larval recruitment and adult migration - occurring into areas<br />
adjacent to the marine preserves. This information is crucial to help Guam’s resource managers determine<br />
whether current MPAs are an effective management tool for restoring depleted coral reef fishery resources<br />
island-wide.<br />
CURRENT CONSERVATION MANAGEMENT ACTIVITIES<br />
Guam recognizes the important benefits that coral reefs provide, and has developed a diverse assortment of<br />
laws, regulations, permits, policies, plans and education programs to serve as mechanisms for the management<br />
of human activities that impact Guam’s coral reefs (Gawel, 1999). Many of these, such as the environmental<br />
impact assessment requirements, were not created specifically to protect coral reef ecosystems, but<br />
now serve that purpose. Guam continues to expand and improve its management activities to address the<br />
threats identified above.<br />
This process has been facilitated by the creation of the Guam Coral Reef Initiative Coordinating Committee<br />
(GCRICC) in 1997 by Executive Order 97-10. This committee prioritized the 13 threats identified in the National<br />
Coral Reef Action Strategy and selected the top five on which to focus for the next three years. By February<br />
2003, the GCRICC had identified local navigators and drafted local action strategies (LAS) regarding for<br />
the prioritized focus areas of land-based sources of pollution, fisheries management, outreach and education,<br />
recreational area misuse and overuse, and climate change and coral bleaching. These LAS have provided a<br />
guiding framework for local resource agencies and have facilitated improved management and coordination<br />
among agencies. Current conservation management activities can be grouped according to the threat that<br />
they address (Figure 16.28).<br />
The LAS process has also served to broaden the network of stakeholder groups working on coral reef issues.<br />
Members of the Guam Watershed Planning Committee (WPC), a group of local, Federal, and non-governmental<br />
agencies involved primarily with watershed restoration, have become involved in LAS development;<br />
members of the GCRICC now participate in the WPC as well. In addition, the UOGML and UOG’s Water and<br />
Environmental Research Institute, guided by the needs of the local natural resource agencies, have shifted<br />
much of their focus toward management-driven research. Recently, another crucial stakeholder group has<br />
been engaged. The Guam Visitors Bureau (GVB) and Guam’s tourism industry are now working with natural<br />
resources agencies to market Guam’s coral reefs, and in particular the marine preserves, to the one million<br />
visitors that come to the island annually. This new awareness of the economic value of Guam’s coral reef<br />
resources is beginning to create a sense of stewardship which was absent during the economic boom of the<br />
1980s and recession of the 1990s.<br />
Land-Based Sources of Pollution<br />
Guam identified land-based sources of pollution as its number one priority focus area in 2002 and local and<br />
Federal stakeholders have developed a three-year LAS to address this threat. This is the most difficult threat
Local Action Strategies in Guam<br />
*)<br />
The State of Coral Reef Ecosystems of Guam<br />
Figure 16.28. The Local Action Strategies developed by Guam’s Coral Reef Initiative Coordinating Committee include: Land-Based<br />
Sources of Pollution, Lack of Public Awareness, Recreational Misuse and Overuse, Fisheries Management. The fifth, Coral Bleaching/Global<br />
Warming, is still under development. *Guam Department of Agriculture.<br />
to address as it involves a large number of stakeholders and is complicated by the lack of cooperation from<br />
some key Guam governmental agencies.<br />
One of the most effective outlets has been the WPC which was recently strengthened by Executive Order<br />
2004-04. This committee is carrying out a comprehensive watershed planning process to address pollution<br />
in each Guam watershed by assessing pollution, determining the total maximum daily loads of particular pollutants<br />
that the watershed can withstand and still meet water quality standards, identifying potential pollution<br />
sources, and then initiating projects to control or prevent the pollution. In addition, Guam’s Clean Marina<br />
Advisory Committee has developed an action plan identifying specific projects to manage nonpoint source<br />
pollution in Guam’s marinas.<br />
This is complemented by recent revisions to Guam’s soil erosion and sediment control regulations in 2000.<br />
These are applied through clearing and grading permits, which are processed through Guam’s Department of<br />
Public Works and GEPA. These permits provide protection during coral spawning periods by limiting activities<br />
during these times. One of the major topics of Guam’s upcoming <strong>2005</strong> land use conference will be the<br />
control of pollution, especially stormwater runoff, through better land use planning. A manual for stormwater<br />
management is being produced for Guam in 2004, and recently the GCMP funded a workshop for contractors<br />
and builders on Guam’s soil erosion and sediment control regulations, under GEPA oversight. To address the<br />
illegal burning of natural grasslands on mountain slopes carried out by deer hunters, an anti-arson campaign<br />
coordinator will be funded in <strong>2005</strong>. In the meantime, the FSRD, NRCS, and UOG are working to restore badlands<br />
using erosion control fabric and nitrogen-fixing plants and trees such as acacia (Figure 16.30).<br />
The GEPA has a number of permit processes to limit the impacts of nonpoint source pollution. Landfills,<br />
including construction material hardfills, must receive GEPA permits and be designed to protect all waters<br />
from polluting discharges. A new landfill for public solid waste is being planned and its site will be determined<br />
soon, with its construction following an accelerated schedule determined by a Federal court-ordered consent<br />
Sidebar Guam<br />
page<br />
477
Guam<br />
page<br />
478<br />
The State of Coral Reef Ecosystems of Guam<br />
decree. Baseline monitoring is being<br />
performed to assess the impacts of<br />
leachate that pollutes coastal and river<br />
waters below Guam’s old landfill,<br />
which must be closed when the new<br />
one is operable. In addition, injection<br />
of stormwater runoff through dry wells<br />
is regulated by GEPA underground<br />
injection control permits to prevent<br />
pollution from entering groundwater<br />
and subsequently being discharged<br />
to beaches and reefs. The GEPA<br />
Water Resources staff also requires<br />
golf courses to monitor the quality of<br />
their groundwater through monitoring<br />
wells. GEPA also locally administers<br />
the Water Quality Certification (Federal<br />
Clean Water Act Section 401)<br />
and NPDES permits for the U.S. EPA.<br />
Through its Water Pollution Control<br />
Figure 16.30. Erosion control fabric and nitrogen-fixing acacia trees shown here are<br />
being used to re-vegetate nutrient depleted, highly erodible lands damaged by wildfires<br />
in southern Guam. Source: Forestry and Soil Resources Division.<br />
Program and in coordination with its Environmental Planning and Review Division, GEPA is responsible for<br />
certifying all permit applications, recommending the conditions and abatement schedules for each permit, and<br />
providing oversight for the implementation and compliance with the conditions. All permittees are routinely<br />
monitored by the GEPA staff to verify compliance with applicable permit requirements and compliance schedules.<br />
The Guam Waterworks Authority (GWA), responsible for Guam’s public water supply and wastewater<br />
systems, is restructuring and improving its facilities and operations in response to U.S. District Court stipulated<br />
orders. Required activities include improving the Northern and Agana STPs and building new, deeper outfalls<br />
in order for both STPs to meet NPDES requirements.<br />
These improvements to Guam’s sewage systems involve major expenses - well over $40 million - that are far<br />
beyond GWA’s current budget. These costs and similar high unbudgeted costs for public facilities for stormwater<br />
management and solid waste pollution control are not only a problem for Guam, but also are shared<br />
with other U.S. island territories and commonwealths that are members of the U.S. Coral Reef Task Force.<br />
At its October 2003 meetings, the Task Force passed a Pacific Islands Water Quality Resolution, directing its<br />
attention to seeking a solution to funding the capital improvement needs to provide the infrastructure necessary<br />
to manage water pollution in order to protect the islands’ coral reefs. Guam’s estimate for basic funding<br />
for these projects is close to a $100 million. Pacific Islands members of the Task Force await urgent action<br />
on this resolution.<br />
The Guam Seashore Protection Commission (GSPC) has review and approval authority over construction<br />
projects proposed within the area from 10 m inland of the mean high tide mark out to a depth of 18 m (an area<br />
defined in law as the “seashore reserve”). The Application Review Committee, comprised of a large number<br />
of Guam’s governmental agencies, reviews all project applications, to identify potential impacts. The Committee’s<br />
comments are submitted to a seven-member commission appointed by the Governor for consideration<br />
of approval or rejection.<br />
Presently, the Guam Seashore Reserve Plan Task Force, comprised of several of Guam’s governmental agencies,<br />
is developing the Guam Seashore Reserve Plan to better guide the decisions of the GSPC. The plan will<br />
limit development in the areas designated as the seashore reserves. Zones were designated to identify what<br />
types of development, if any, are allowed. The zones were determined based on sensitivity of areas adjacent<br />
to the shoreline and the effects of development on the coral reefs. While this task is taking longer than desired,<br />
the end product should help Guam make good decisions about future development along its coasts.
The State of Coral Reef Ecosystems of Guam<br />
In addition to local activities, the U.S. Department of Defense (DoD) has started restoration activities on DoD<br />
base sites, cleaning up scores of old dumps and hazardous or toxic pollutants with impacts on the coastal<br />
waters of Guam. Contaminated sites, including ammunition dumps on coral reefs that were formerly used<br />
by the military but are not on current DoD property, are being identified through the DoD and State/Territorial<br />
Memorandum of Agreement program with GEPA, which is the first step to their cleanup.<br />
Fisheries Management<br />
A three-year LAS for coral reef fishery management that focuses on increasing the effectiveness of Guam’s<br />
marine preserves was developed by DAWR and reviewed by fishers, resource managers, and other stakeholders.<br />
The strategy addressed three main issues: the lack of enforcement and prosecution, lack of public<br />
awareness and support, and need to assess the effectiveness of the preserves in increasing reef fish stocks.<br />
Specific management actions proposed to address these issues include the purchase of vehicles, a vessel,<br />
and equipment for conservation officers; implementing a reserve officer program to expand enforcement coverage;<br />
hiring of a natural resource prosecutor; implementing a multi-media education and outreach campaign;<br />
and funding studies that focus on assessing fish biomass increases and spillover effects.<br />
This has been one of the more successful strategies for Guam. A number of the tasks have been accomplished:<br />
the conservation officers have purchased new vehicles and equipment to facilitate better enforcement;<br />
the GCRICC has continued education efforts at all levels, from elementary to the territorial legislature<br />
and administration; monitoring programs are underway in three preserves; and Guam’s legislature recently<br />
passed Public Law 27-87 which requires a permit for certain non-fishing activities in the preserves. In addition,<br />
the GCRICC is in the process of hiring a natural resource prosecutor to be based in the Office of the Attorney<br />
General and DAWR is working on a citation system for marine preserve violators.<br />
Guam has laws (5 GCA, Chapter 63) that regulate the taking of coral and identify penalties for damages<br />
inflicted on corals during fishing activities. Coral can only be taken with a permit issued by the Guam Department<br />
of Agriculture. The law has provisions for both personal and commercial take, but limits such permits<br />
to five days and requires that specific collecting locations be identified. However, no personal or commercial<br />
permits have been issued since 1982. The UOGML has been issued a collection permit for scientific research.<br />
This law also regulates fishing net mesh sizes used in coastal waters and the use of illegal chemicals and<br />
explosives for fishing. In addition, Guam’s legislature also delegated the authority and responsibility of management<br />
and oversight for all aquatic and wildlife resources to the Guam Department of Agriculture. In 1997,<br />
Guam’s Department of Agriculture’s DAWR used its regulatory authority to amend and expand the existing<br />
fishing regulations. Title 16 of the law includes size and gear restrictions for aquatic fauna. Also contained in<br />
these regulations is the creation of marine preserves. The penalty for violating both the law and associated<br />
regulations is a petty misdemeanor, with a fine of up to $500. The DAWR is currently in the process of converting<br />
to a magistrate court system in which citations can be issued rather than requiring a court hearing to<br />
collect misdemeanor penalties.<br />
Lack of Public Awareness<br />
In 2003, as part of its Education and Outreach LAS, the GCRICC launched a multi-media coral reef awareness<br />
campaign featuring a clownfish character in an educational video and shown on incoming flights, movie<br />
theater slides, hotel room tent cards, coloring books, advertisements, and streetside banners (Figure 16.31).<br />
An island-wide contest seeking a name from children for the clownfish character was held in conjunction with<br />
Earth Week activities from April 17-24, 2004. The Environmental Education Committee selected the top 10<br />
entries from over 600 entries. On April 24, at the Earth Week Island Pride Festival, the public selected ‘Professor<br />
Kika Clearwater’ as the character’s name.<br />
GCRICC members have also teamed up for the Island Pride Campaign. This program combines educational<br />
and environmental activities with fun events to teach children to love the island’s resources and instill a sense<br />
of stewardship. Events have included the 2004 Earth Week festival, a trash collection and snorkel tour at<br />
Tumon Bay <strong>Marine</strong> Preserve, a trash collection and kid’s fishing derby at the War in the Pacific National Park,<br />
and a tree-planting at Paseo combined with the Fishermen’s Festival at the Guam Fishermen’s Cooperative.<br />
The events have been a great success, attracting families from all over the island. The campaign has also<br />
Sidebar Guam<br />
page<br />
479
Guam<br />
page<br />
480<br />
The State of Coral Reef Ecosystems of Guam<br />
strengthened ties among the GCRICC<br />
and GVB as well as the private sector<br />
which have helped sponsor these<br />
events.<br />
Recreational Misuse and Overuse<br />
The GCRICC decided that recreational<br />
misuse and overuse were serious<br />
threats to Guam’s coral reefs. With<br />
jet ski users, recreational boaters,<br />
scuba divers and snorkelers all using<br />
the reef zone, the impacts can multiply.<br />
The Committee decided that it<br />
is important to address these issues<br />
before they cause severe damage<br />
to the reefs. While this strategy is<br />
still being developed through meetings<br />
with stakeholders, positive steps<br />
have already been taken to limit rec-<br />
reational impacts in the marine pre-<br />
Figure 16.31. Guam’s new multimedia Coral Reef Awareness Campaign includes<br />
billboards, print ads, public service announcements, tourism literature, and an upcoming<br />
video to be shown on all flights to Guam. Source: GEPA.<br />
serves. Public Law 27-87, which was passed in May 2004, creates a marine preserve eco-permitting system<br />
to be administered by DAWR, to address non-fishing activities in Guam’s marine preserves. The DAWR is<br />
currently working with a large group of stakeholders to draft the rules and regulations for this new permitting<br />
system.<br />
Other actions have worked to limit the impact of recreational watercraft. The impacts of jet skis have been<br />
addressed through the Recreational Water Use Master Plan, which currently limits these watercraft to three<br />
locations within reef areas: East Agana Bay, Apra Harbor, and Cocos Lagoon. A study to examine the impacts<br />
of jet skis is underway. In 1999, DAWR installed 35 shallow water mooring (SWM) buoys at popular sites on<br />
the western side of the island and in Apra Harbor. While the goal of these buoys was to avoid anchor damage<br />
from recreational boaters and fishers only seven of these buoys are still in the water due to storms, theft, and<br />
age. DAWR did not have the staff to replace these buoys, so they have teamed up with the Guam <strong>Marine</strong><br />
Awareness Foundation (GMAF) to replace the missing buoys. DAWR will acquire the buoys and GMAF will<br />
use volunteer divers to install them.<br />
GVB, in association with GCMP, is launching a new campaign to educate tourists about Tumon Bay’s unique<br />
habitat and diverse assemblage of marine creatures. The project will include three educational kiosks placed<br />
in northern, central, and southern Tumon Bay and accompanied by underwater guides. The goal is to reduce<br />
the impacts of recreational activities by educating divers about the resources and how they can prevent damage.<br />
GVB has also assisted with the incorporation of changes for beach cleaning permits in the tourist areas<br />
of Tumon and East Agana Bays. These included: 1) requiring contractors to find ways to shake out as much<br />
sand and dead coral as possible from algae and place the sand and dead coral back onto the beach and 2)<br />
implementing an adopt-a-beach program, in which hotels manually rake the algae from the beach in front of<br />
their property. Unfortunately, not all of these changes have currently been implemented. However, GVB is<br />
again consulting with DAWR in developing a new request for proposals for beach cleaning and maintenance<br />
of Tumon and Agana Bays.<br />
Climate Change and Coral Bleaching<br />
This LAS has had the least development, as it is the most difficult to solve at the local level. Addressing the<br />
issue of climate change requires policy decisions at the national and international levels. Locally, current<br />
management efforts are focusing on addressing additional anthropogenic stresses on coral reefs such as<br />
overfishing and land-based sources of pollution through the development and implementation of the threeyear<br />
LAS. Outreach and education efforts include the development of posters, pamphlets, public service<br />
announcements, and videos addressing the importance of coral reefs and ways to better protect them. One<br />
of the greatest challenges facing resource managers in Guam is the reality that, given current regulatory pro-
The State of Coral Reef Ecosystems of Guam<br />
cesses, management decisions cannot happen in as timely a manner as that dictated by a bleaching event.<br />
At the 10th U.S. Coral Reef Task Force Meeting in CNMI and Guam, the steering committee was directed to<br />
consider the opportunities to include mass coral bleaching in natural disaster relief efforts. Task Force members<br />
endorsed a resolution to address emergency response for environmental impacts of natural disasters.<br />
Federal members of the Task Force were also directed to engage the states, territories, and commonwealths<br />
of the U.S. and the Freely Associated States, as appropriate, in developing partnership response plans for<br />
environmental impacts to coral reef ecosystems following natural disasters, and developing strategies to support<br />
implementation of the plans.<br />
While natural disasters can not be managed, responses can be. A hazard mitigation plan is currently being<br />
developed for Guam. The intent of the plan is not only to reduce the damages caused by natural disasters to<br />
buildings and infrastructure, but also to protect the environment by limiting the effects of flooding on property<br />
and subsequent depositing of debris on Guam’s coral reefs. Better protection of coral reefs and other natural<br />
resources from impacts of Guam’s frequent natural disasters is also being sought through development of an<br />
environmental emergency response plan. This plan will provide appropriate steps for government agencies<br />
to take following a natural disaster, in terms of conducting both damage assessments and debris removal efforts.<br />
OVERALL <strong>STATE</strong>/TERRITORIAL CONCLUSIONS AND RECOMMENDATIONS<br />
The health of Guam’s coral reefs vary significantly. Reefs unaffected by sediment and nutrient loading, such<br />
as those in the northern part of the island and in between river outflows in the south, have healthy coral communities.<br />
Guam’s reefs have been spared from large-scale bleaching events and coral diseases which are<br />
prevalent in so many parts of the world. Unfortunately, a number of Guam’s reefs are impacted by land-based<br />
sources of pollution and heavy fishing pressure. Sedimentation, algal overgrowth due to decreased fish<br />
stocks, and low recruitment rates of both corals and fish are important issues that must be addressed.<br />
The GCRICC has made great strides in identifying ways to understand and address these issues, from funding<br />
watershed restoration efforts, to conducting innovative education and outreach efforts, expanding monitoring,<br />
and increasing support for the five marine preserves. Working groups have been created for each of the<br />
five LAS (land-based sources of pollution, fisheries management, outreach and education, recreational area<br />
misuse and overuse, and climate change and coral bleaching).<br />
Although Guam has made a great deal of progress in the past two years in terms of coral reef protection,<br />
monitoring, and public outreach, many challenges still remain. Wildland arson is still a problem in many<br />
watersheds in Southern Guam. STPs in Toguan, West Agana, and Tanguisson discharge primary treated<br />
wastewater into coastal waters of 18 m or less. Leaks from aging infrastructure and an increase in impervious<br />
surfaces, especially near the coast, have exacerbated the problem of stormwater runoff. In response to the<br />
Pacific Water Quality Resolution passed by the U.S. Coral Reef Task Force at its 10th Meeting in CNMI and<br />
Guam in October 2003, the GCRICC asked the GEPA to compile a list of priority capital improvement projects<br />
that would have direct implications for improved water quality and subsequent coral reef ecosystem health.<br />
The estimated cost of the eight identified projects totals more than $90 million and includes such infrastructure<br />
improvements as closing the island’s municipal dump and replacing it with a fully functioning landfill, renovating<br />
and expanding several STPs (including extending their ocean outfalls), and eliminating the discharge of<br />
stormwater into Tumon and Agana Bays.<br />
Gaps in Guam’s monitoring efforts have been identified and will begin to be addressed in the next few years.<br />
However, despite the presence of the UOG (in particular the <strong>Marine</strong> <strong>Laboratory</strong> and Water and Environmental<br />
Research Institute), Guam still suffers from a lack of capacity to fully implement all of the monitoring gaps. The<br />
lack of capacity is not entirely due to a lack of available staff. For example, Guam would benefit greatly from<br />
a more streamlined and stable Federal grant process for coral reef effort, in order to secure contractual monitoring<br />
assistance (i.e., three year block grants). Local resource agencies would also be better served in their<br />
partnerships with valuable Federal programs, such as NOAA’s REA research cruises, by a faster turnaround<br />
time on data availability and analysis. In addition, although Federal sources of funding have been utilized to<br />
Sidebar Guam<br />
page<br />
481
Guam<br />
page<br />
482<br />
The State of Coral Reef Ecosystems of Guam<br />
support enforcement efforts, local support for additional full-time conservation officers is still nonexistent. To<br />
rectify this, local resource agencies have recently spent a great deal of time escorting local policymakers and<br />
members of the private sector on snorkel tours of the marine preserves in order to show them the island-wide<br />
value of the reef resources. A new economic valuation study commencing in fiscal year <strong>2005</strong> will also provide<br />
an effective means to garner support for coral reef protection. With successes like the recently launched Island<br />
Pride Campaign, there is certainly reason to hope for an increased awareness of the value of coral reefs<br />
to the people of Guam.
REFERENCES<br />
The State of Coral Reef Ecosystems of Guam<br />
Ahyong, S. and M.V. Erdmann. 2003. The stomatopod Crustacea of Guam. Micronesica 35-36: 315-352<br />
Amesbury, S. 2002. Annual Report for Coral Collection Permit for University of Guam <strong>Marine</strong> <strong>Laboratory</strong>. Guam Division<br />
of Aquatic and Wildlife Resources.<br />
Amesbury, S. 2003. Annual Report for Coral Collection Permit for University of Guam <strong>Marine</strong> <strong>Laboratory</strong>. Guam Division<br />
of Aquatic and Wildlife Resources.<br />
Amesbury, S., V. Bonito, R. Chang, L. Kirkendale, C. Meyer, G. Paulay, R. Ritson-Williams and T. Rongo. 2001. <strong>Marine</strong><br />
biodiversity resource survey and baseline reef monitoring survey of the Haputo Ecological Reserve Area, COMNAV-<br />
MARIANAS. U.S. Dept. of the Navy.<br />
Amesbury, J.R. and R.L. Hunter-Anderson. 2003. Review of archaeological and historical data concerning reef fishing in<br />
the U.S. flag islands of Micronesia: Guam and the Northern Mariana Islands. Western Pacific Regional Fishery Management<br />
Council. Final Report. 147 pp.<br />
Bailey-Brock, J.H. 2003. Coral reef polychaetes of Guam and Saipan, Mariana Islands. Micronesica 35-36: 200-217<br />
Barnett, M. 2004. Guam <strong>Marine</strong> Awareness Foundation, Micronesian Divers Association. Piti, Guam. Personal communication.<br />
Bent, J. 2004. Pacific Association of Dive Industry, Guam Tropical Dive Station. Anigua, Guam. Personal communication.<br />
Best, B.R. and C.E. Davidson. 1981. Inventory and atlas of the inland aquatic ecosystems of the Marianas Archipelago.<br />
University of Guam <strong>Marine</strong> <strong>Laboratory</strong>, Technical Report 75. 226 pp.<br />
Birkeland, C. 1997. Status of coral reefs in the Marianas. pp. 91-100. In: Dollar, R., and C. Birkeland. (eds.) Status of coral<br />
reefs in the Pacific. Hawaii: Sea Grant College Program, School of Ocean and Earth Science and Technology, University<br />
of Hawaii.<br />
Birkeland, C., D. Rowley and R.H. Randall. 1982. Coral recruitment patterns at Guam. pp. 2: 339-344. In: Proceedings<br />
of the Fourth International Coral Reef Symposium, Manila.<br />
Birkeland, C. and J. Lucas, 1990. Acanthaster planci: Major management problem of coral reefs. CRC Press, Boca Raton.<br />
257 pp.<br />
Bonito, V. 2002. Tanguisson reef: Changes in coral community structure driven by Acanthaster planci predation? Masters<br />
Thesis. University of Guam, Mangilao, Guam. 82 pp.<br />
Bonito, V and R. Richmond. Submitted. Long-term changes in coral community structure and correlations with Acanthaster<br />
planci feeding preferences on Guam. 29 pp.<br />
Brainard, R. National Oceanic and Atmospheric Administraion, National <strong>Marine</strong> Fisheries Center, Pacific Islands Fisheries<br />
Science Center, Coral Reef Ecosystem Division, Honolulu. Personal communication.<br />
Calvo, J. 2004. Western Pacific Regional Fisheries Management Council. Tamuning, Guam. Personal communication.<br />
Carlson, C., and P.J. Hoff. 2003. The opisthobranchs of the Mariana Islands. Micronesica 35-36: 271-293<br />
Castro, P. 2003. The trapeziid crabs (Brachyura) of Guam and Northern Mariana Islands, with the description of a new<br />
species of Trapezia latreille, 1828. Micronesica 35-36: 440-455<br />
Colgan, M. 1981a. Succession and recovery of a coral reef after predation by Acanthaster planci. pp. 333 -- 338. In: Proceedings<br />
of the Fourth International Coral Reef Symposium, Volume 2, Manila.<br />
Colgan, M. 1981b. Long-term recovery process of a coral community after a catastrophic disturbance. University of<br />
Guam <strong>Marine</strong> Lab Technical Report 76.<br />
Colgan, M. 1987. Coral reef recovery on Guam (Micronesia) after catastrophic predation by Acanthaster planci. Ecology<br />
68(6): 1592-1605<br />
Sidebar Guam<br />
page<br />
483
Guam<br />
page<br />
484<br />
The State of Coral Reef Ecosystems of Guam<br />
Collins, J.M. 1995. Occurrence and fate of fecal pollution indicator bacteria in sediments of Tumon Bay, Guam. Masters<br />
Thesis for the University of Guam <strong>Marine</strong> <strong>Laboratory</strong>. 75 pp.<br />
Davis, G. Guam Department of Agriculture, Division of Aquatic and Wildlife Resources. Mangilao, Guam. Personal communication.<br />
Denton, G.R.W., H.R.Wood, L.P. Concepcion, H.G. Siegrist, Jr., V.S. Eflin, D.K. Narcis and G.T. Pangelinan. 1997.<br />
Analysis of in-place contamination in marine sediments from four harbor locations on Guam. Water and Environmental<br />
Research Institute, University of Guam. Technical Report 81. 120 pp.<br />
Denton, G.R.W., H.R.Wood, L.P. Concepcion, V.S. Eflin and G.T. Pangelinan. 1999. Heavy metals, PCBs and PAHs in<br />
marine organisms from four harbor locations on Guam. Water and Environmental Research Institute, University of Guam.<br />
Technical Report 87. 158 pp.<br />
DPW (Department of Public Works). 2004a. Building permits and inspections. 2003 Annual Report. Department of Public<br />
Works, Government of Guam.<br />
DPW (Department of Public Works). 2004b. Completed highway projects report: 2003. Government of Guam, Department<br />
of Public Works, Highway Planning Section.<br />
Duenas and Associates. 2003. Guam Nonpoint Source Pollution Management Program (Draft). Guam Coastal Management<br />
Program.<br />
Eldredge, L.G. 2003a. A retrospective look at Guam’s marine biodiversity. Micronesica 35-36: 26-37<br />
Eldredge, L.G. 2003b. The marine reptiles and mammals of Guam. Micronesica 35-36: 653-660<br />
English, S., C. Wilkinson and V. Baker. 1997. Survey manual for tropical marine resources. 2nd Edition. Australian Institute<br />
of <strong>Marine</strong> Science, Townsville.<br />
Flores, T. 2003. Offshore Fisheries Survey. 2003. Annual Report. Government of Guam, Department of Agriculture, Division<br />
of Aquatic and Wildlife Resources. Annual Report. 11 pp.<br />
FSRD (Forestry and Soil Resources Division). 1999. Five Year Plan. Department of Agriculture, FSRD.<br />
Gawel, M.J. 1999. Protection of marine benthic habitats in the Pacific Islands. A case study of Guam. Oceanologica Acta<br />
22: 721-726<br />
Goldman, L. Guam Department of Agriculture, Division of Aquatic and Wildlife Resources. Mangilao, Guam. Personal<br />
communication.<br />
GCMP (Guam Coastal Management Program). 1998. Super Typhoon Paka: Deep Water Clean-Up. Governement of<br />
Guam, Bureau of Planning, Guam Coastal Management Program. Final Report. 30 pp.<br />
GEPA (Guam Environmental Protection Agency). 2000a. Guam Soil Erosion and Sediment Control Regulations. Public<br />
Law 25-152. 39 pp.<br />
GEPA (Guam Environmental Protection Agency). 2000b. Management of contaminated harbor sediments of Guam.<br />
CZMA Section 309, Guam Harbor Sediment Project Phase III Final Report. 57 pp.<br />
GEPA (Guam Environmental Protection Agency). 2001. Revised Guam Water Quality Standards. Public Law 26-32. 122<br />
pp.<br />
GEPA (Guam Environmental Protection Agency). 2003. Water Quality Report to Congress, Section 305b. 56 pp.<br />
GHRA (Guam Hotel and Restaurant Association). 2004. Hospitality Guahan monthly. Pacific Daily News insert (March).<br />
12 pp.<br />
Guam Bureau of Statistics and Plans. 2002. Coastal environmental damage-a preliminary survey of impacts of Typhoon<br />
Chata’an on Guam’s natural environment. Government of Guam, Technical Report.<br />
Guam Water Planning Committee. 1998. Clean water action plan for Guam: unified watershed assessment. 28 pp.
The State of Coral Reef Ecosystems of Guam<br />
Guard, C., A.N.L. Chiu and M.A. Lander. 2003. National Oceanic and Atmospheric Administration, National Weather Service<br />
meteorological assessment for Typhoon Pongsona in: Pohnpei State, FSM; Chuuk State, FSM; Guam; and Rota,<br />
CNMI. NOAA/NWS, Tiyan, Guam. 59 pp.<br />
Gutierrez, J.T. 2003. Fisheries participation, effort, and harvest surveys. Government of Guam, Department of Agriculture,<br />
Division of Aquatic and Wildlife Resources. 24 pp.<br />
Gutierrez, J.T. 2004. In preparation. Visual Stock Assessment Surveys of <strong>Marine</strong> Preserves and Control Sites. Government<br />
of Guam, Department of Agriculture, Division of Aquatic and Wildlife Resources.<br />
GVB (Guam Visitors Bureau). 2001. Japanese Exit Survey August 2001.<br />
GVB (Guam Visitors Bureau). 2004. Guam Visitors Arrival Monthly Statistic Report, January 2002 – Present.<br />
Helton, G., I. Zelo, C. Lord and C. Plank. 2004. Surveys of Abandoned Vessels: Guam and the Commonwealth of the<br />
Northern Mariana Islands.<br />
Hunter, C.L. 1995. Review of coral reefs around American flag Pacific islands and assessment of need, value, and<br />
feasibility of establishing a coral reef fishery management plan for the western Pacific region. Western Pacific Regional<br />
Fishery Management Council. Final Report. 30 pp.<br />
Jones, R.S., R.H. Randall, and M.J. Wilder. 1976. Biological impact caused by changes on a tropical reef. U.S. Environmental<br />
Protection Agency, US EPA-600/3-76-027.<br />
Kelly, M., J. Hooper, V. Paul, G. Paulay, R. van Soest and R. de Weerdt. 2003. Taxonomic inventory of the sponges (Porifera)<br />
of the Mariana Islands. Micronesica 35-36: 100-120.<br />
Kensley, B. 2003. Axioid shrimps from Guam (Crustacea, Decapoda, Thalassinidea). Micronesica 35-36: 359-384.<br />
Kirkendale, L. and D.R. Calder. 2003. Hydroids (Cnidaria: Hydrozoa) from Guam and the Commonwealth of the Northern<br />
Marianas Islands (CNMI). Micronesica 35-36: 159-188.<br />
Kirkendale, L. and C.G. Messing. 2003. An annotated checklist and key to the Crinoidea of Guam and the Commonwealth<br />
of the Northern Marianas Islands. Micronesica 35-36: 523-546.<br />
Lambert, G. 2003. <strong>Marine</strong> biodiversity of Guam: the Ascidiacea. Micronesica 35-36: 584-593.<br />
Leberer, T. Guam Department of Agriculture, Division of Aquatic and Wildlife Resources. Mangilao, Guam. Personal communication.<br />
Lobban, C.S. and R.T. Tsuda. 2003. Revised checklist of benthic marine macroalgae and seagrasses of Guam and Micronesia.<br />
Micronesica 35-36: 54-99.<br />
Moran, D. C. 2002. Qualitative groundwater dye trace of the Harmon Sink and Guam International Airport Authority. M.S.<br />
Thesis for the University of Guam. 55 pp.<br />
Myers, R.F. and T.J. Donaldson. 2003. The fishes of the Mariana Islands. Micronesica 35-36: 594-648.<br />
Newman, L.J., G. Paulay and R. Ritson-Williams. 2003. Checklist of polyclad flatworms (Platyhelminthes) from Micronesian<br />
coral reefs. Micronesica 35-36: 189-199.<br />
Paulay, G. 2003a. <strong>Marine</strong> Biodiversity of Guam and the Marianas: overview. Micronesica 35-36: 3-25.<br />
Paulay, G. 2003b. The Asteroidea, Echinoidea, and Holothuroidea (Echinodermata) of the Mariana Islands. Micronesica<br />
35-36: 563-583.<br />
Paulay, G. 2003c. The Bivalvia (Mollusca) of Guam. Micronesica 35-36: 218-243<br />
Paulay, G. 2004. University of Guam <strong>Marine</strong> <strong>Laboratory</strong>. Mangilao, Guam. Personal communication.<br />
Paulay, G. and Y. Benayahu. 1999. Patterns and consequences of coral bleaching in Micronesia (Majuro and Guam) in<br />
1992-1994. Micronesica 32 (1): 109-124.<br />
Sidebar Guam<br />
page<br />
485
Guam<br />
page<br />
486<br />
The State of Coral Reef Ecosystems of Guam<br />
Paulay, G., L. Kirkendale, C. Meyer, P. Houk, T. Rongo and R. Chang. 2001. <strong>Marine</strong> biodiversity resource survey and<br />
baseline reef monitoring survey of the Southern Orote Peninsula and North Agat Bay area. Commander Naval Forces<br />
Marianas.<br />
Paulay, G., L. Kirkendale, G. Lambert and C. Meyer. 2002. Anthropogenic biotic interchange in a coral reef ecosystem: a<br />
case study from Guam. Pacific Science 56 (4): 403-422.<br />
Paulay, G., R. Kropp, P.K.L. Ng and L.G. Eldredge. 2003a. The crustaceans and pycnogonids of the Mariana Islands.<br />
Micronesica 35-36: 456-513.<br />
Paulay, G., M.P. Puglisi, and J.A. Starmer. 2003b. The non-scleractinian Anthozoa (Cnidaria) of the Mariana Islands.<br />
Micronesica 35-36: 138-155.<br />
Paulay, G., and A. Ross. 2003. An annotated checklist of the shallow water Cirripedia of Guam. Micronesica 35-36: 303-<br />
314.<br />
PCR Environmental, Inc. 2002a. Sampling of Tumon Bay springs for chemical analysis. Guam Environmental Protection<br />
Agency. 125 pp.<br />
PCR Environmental, Inc. 2002b. Sampling of Tumon Bay springs for chemical and bacterial analysis. Guam Environmental<br />
Protection Agency. 145 pp.<br />
PCR Environmental, Inc. 2002c. Summary Report of Tumon Bay springs sampling for chemical analysis. Guam Environmental<br />
Protection Agency. 141 pp.<br />
Preskitt, L.B., P.S. Vroom and C.M. Smith. 2004. A rapid ecological assessment (REA) quantitative survey method for<br />
benthic algae using photoquadrats with scuba. Pacific Science 58: 201-209.<br />
Randall, R.H. 1971. Tanguisson-Tumon, Guam coral reefs before, during and after the crown-of-thorns starfish (Acanthaster)<br />
predation. M.S. Thesis for the University of Guam, Department of Biology. 119 pp.<br />
Randall, R.H. 1973. Distribution of corals after Acanthaster planci infestation at Tanguisson Point, Guam. Micronesica.<br />
9 (2): 213-222.<br />
Randall, R.H. 2003. An annotated checklist of hydrozoan and scleractinian corals collected from Guam and other Mariana<br />
Islands. Micronesica 35-36: 121-137.<br />
Randall, R.H., and L.G. Eldredge. 1976. Atlas of the reefs and beaches of Guam. University of Guam <strong>Marine</strong> <strong>Laboratory</strong>.<br />
Technical Report 19: 1-191.<br />
Richardson, S.L. and R.N. Clayshulte. 2003. An annotated checklist of Foraminifera of Guam. Micronesica 35-36: 38-<br />
53.<br />
Richmond, R. Professor, University of Hawaii, Kewalo <strong>Marine</strong> Lab. Former professor, University of Guam. Personal communication.<br />
Schroeder, R., M. Triani, K. Moots, B. Zgliczynski, J. Laughlin, B. Tibbatts and M. Capone. In Review. Status of the<br />
Fishery Target Species on Coral Reefs of the Marinas Archipelago. In: Proceedings of the 10th International Coral Reef<br />
Symposium, Okinawa.<br />
Schupp, P. University of Guam <strong>Marine</strong> <strong>Laboratory</strong>. Mangilao, Guam. Personal communication.<br />
SCS (Soil Conservation Service). 1988. Soil Survey of Territory of Guam. United States Department of Agriculture May<br />
1988. Washington, DC. 166 pp.<br />
Sherwood, T. 1989. Establishing Permanent <strong>Marine</strong> Conservation Areas in Guam. pp. 110-118. In: Project Progress Report.<br />
Division of Aquatic and Wildlife Resources Annual Report Fiscal Year 1989.<br />
Sokal, R. and F. Rolff. 1995. Biometry. Third Edition, W.H. Freeman and Company, New York.<br />
Smith, B.D. 2003. Prosobranch gastropods of Guam. Micronesica 35-36: 244-270<br />
Smith, B.D. 2004. Annual Report for Coral Collection. Permit for the University of Guam <strong>Marine</strong> <strong>Laboratory</strong>. Government<br />
of Guam, Department of Agriculture, Division of Aquatic and Wildlife Resources.
The State of Coral Reef Ecosystems of Guam<br />
Starmer, J.A. 2003. An annotated checklist of ophiuroids (Echinodermata) from Guam. Micronesica 35-36: 547-562<br />
Tan, S.H. and P.K.L. Ng. 2003. The Parthenopinae of Guam (Crustacea: Decapoda: Brachyura: Parthenopidae). Micronesica<br />
35-36: 385-416<br />
Tibbatts, B. Guam Department of Agriculture, Division of Aquatic and Wildlife Resources. Mangilao, Guam. Personal<br />
communication.<br />
Tsuda, R. and T. Donaldson. 2004. Cumulative and Secondary Impacts: Seawalker, Scuba Bob and the Fish Eye Underwater<br />
Observatory, Piti and Cocos Lagoon, Guam. University of Guam <strong>Marine</strong> <strong>Laboratory</strong>. Technical Report 108. 85 pp.<br />
Tupper, M. In preparation. Piti Bomb Holes Preserve, Achang Reef Flat Preserve, and Tumon Bay <strong>Marine</strong> Preserve<br />
WCPA-<strong>Marine</strong> / WWF MPA Management Effectiveness Initiative Draft Preliminary Report<br />
UNISYS. 2004. Typhoon data for the Western Pacific Ocean. Available from the internet URL: http://weather.unisys.<br />
com/hurricane.<br />
U.S. Census Bureau (USCB). 2003. 2000 Census of population and housing: social, economic, and housing characteristics<br />
PHC-4-GUAM, Guam. USCB, Washington, D.C.<br />
U.S. Census Bureau International Program Center Database. 2003. U.S. Census Bureau population predictions for<br />
Guam. Available from the internet URL: http://www.census.gov/ipc/www/idbnew.html.<br />
U.S. Department of Agriculture (USDA), Natural Resources Conservation Service, Pacific Basin, Guam. 1995. DeMeo,<br />
R.A., Z.R. Sims, R.W. Wescom, and R. White (eds.). Draft Resource Assessment, Ugum Watershed, Guam. USDA,<br />
Guam. 92 pp. + appendices.<br />
U.S. Department of the Navy. 1998. Draft Environmental Impact Statement for Military Training in the Marianas. 306 pp.<br />
+ Appendices.<br />
Veron, J.E.N. 2000. Corals of the world, Volume 3. Australian Institute of <strong>Marine</strong> Science and CRR Qld Pty Ltd. Queensland,<br />
Australia. 490 pp.<br />
Vroom, P.S. In review. Rapid Ecological Assessments of Algal Genera on reefs in the Mariana archipelago (Guam and<br />
CNMI).<br />
Vroom, P.S., K.N. Page, K.A. Peyton and J.K. Kukea-Shultz. In review. <strong>Marine</strong> algae of the French Frigate Shoals, Northwestern<br />
Hawaiian Islands: a multivariate analysis of benthic cover on a relatively unpolluted tropical atoll.<br />
Ward, L. 2003. The cephalopods of Guam. Micronesica 35-36: 294-302.<br />
Wolanski, E., R.H. Richmond, G. Davis and V. Bonito. 2003. Water and fine sediment dynamics in transient river plumes<br />
in a small, reef-fringed bay, Guam. Estuarine Coastal Shelf Science 56: 1029-1043.<br />
Sidebar Guam<br />
page<br />
487
Palau<br />
page<br />
488<br />
The State of Coral Reef Ecosystems of Palau<br />
Yimnang Golbuu 1 , Andrew Bauman 2 , Jason Kuartei 1 , Steven Victor 1<br />
INTRODUCTION AND SETTING<br />
The Republic of Palau, part of the Caroline Islands group, is the westernmost archipelago in Oceania located<br />
741 km east of Mindanao in the southern Philippines and about 1,300 km southwest of Guam. Palau is<br />
composed of 12 inhabited islands and 700+ islets, stretching 700 km from Ngeruangel Atoll in the Kayangel<br />
Islands in the north to Helen Reef in the south (Figure 17.1). The archipelago consists of a clustered island<br />
group (including Babeldaob, Koror, Peleiu, Angaur, Kayangel, Ngeruangel, and the Rock Islands; Figure 17.2)<br />
and six isolated islands (Helen Reef, Tobi, Merir, Pulo Anna, Sonsorol, and Fana) that lie approximately 339 to<br />
599 km to the southwest. Babeldaob, the second largest island in Micronesia after Guam, is the biggest island<br />
in the Palauan chain; however, the country’s capital and greatest population is located on Koror. The volcanic<br />
island of Babeldaob and its reefs are<br />
separated from Koror and the southern<br />
islands of the group by a deep<br />
(30-40 m), east-west pass called Toachel<br />
El Mid.<br />
Figure 17.1. The nation of Palau is an archipelago in the Caroline Islands. Most<br />
Palauans reside in the cluster of northern islands (see Figure 17.2 for detail of main<br />
island group). Map: A. Shapiro.<br />
1 Palau International Coral Reef Center, Koror, Palau<br />
2 Office of Environmental Response and Coordination, Koror, Palau<br />
Palau has numerous island and reef<br />
types, including volcanic islands,<br />
atolls, raised limestone islands, and<br />
low coral islands. A barrier reef surrounds<br />
much of the main island cluster,<br />
from the northern tip of Babeldaob<br />
down to the southern lagoon, merging<br />
into the fringing reef with Peleliu in the<br />
south. The barrier reef is well-developed<br />
on the west and less developed<br />
and discontinuous on the east. For<br />
example, Babeldoab has a barrier<br />
reef in the southeast, a submerged<br />
barrier reef (5-10 m below sea level)<br />
on the central east coast and no barrier<br />
reef in the northeast. The southern<br />
lagoon has a much more extensive<br />
barrier reef, lacking passages<br />
on the west side, while the southeast<br />
side has numerous gaps and passes<br />
that extend into the lagoon.<br />
Palau has the most diverse coral<br />
fauna of Micronesia and the highest<br />
density of tropical marine habitats of<br />
comparable geographic areas around<br />
the world. In addition to coral reefs,<br />
mangroves, and seagrass beds, Palau<br />
has deep algal beds, mud basins,<br />
current swept lagoon bottoms,<br />
rich tidal channels, and anoxic basins<br />
within the rock islands. Many<br />
of these environments contain corals.<br />
Additionally, there are more than<br />
70 marine lakes on Palau, many of
The State of Coral Reef Ecosystems of Palau<br />
Figure 17.2. A detailed map of Palau’s main island cluster, showing the locations referenced in this chapter. Map: A. Shapiro.<br />
Palau<br />
Sidebar<br />
page<br />
489
Palau<br />
page<br />
490<br />
The State of Coral Reef Ecosystems of Palau<br />
which contain scleractinian corals and associated fauna and flora. This high concentration of marine lakes on<br />
Palau is unique in the world, and as such, represents a biological treasure which rivals that of the remaining<br />
marine environments of Palau.<br />
While no corals are endemic to Palau, the archipelago’s coral diversity is comparable to the highest coral diversity<br />
areas of the Philippines, Indonesia and Australia. Maragos et al. (1994) estimated Palau’s coral diversity<br />
at 425 species belonging to 78 genera. Randall (1995) reported a lower number of coral species for Palau<br />
at 385 species belonging to 66 genera. The higher estimation by Maragos et al. included observations and<br />
a species list, while Randall’s lower estimation was based on collections and specimens. Randall noted that<br />
greater collecting efforts in Palau are expected to reveal more species since only a relatively small percentage<br />
of coral habitats were surveyed.<br />
In addition to corals, fish and other invertebrate groups are highly diverse in Palau. More than 300 species of<br />
sponges were documented in Palau (Kelly-Borges and Valentine, 1995), although the total fauna may be as<br />
high as 500 if small and burrowing species are included. About 200 species of Cnidarians, other than Scleractinia,<br />
are known to exist on Palau, with many smaller species remaining to be documented. The molluscan<br />
fauna is not entirely known, but at least 185 species of Opisthobranchs are present on Palau (T. Gosliner,<br />
unpublished). Echinoderms are not well documented, but there are at least 21 species of crinoid fauna (Meyer<br />
and Macurda, 1980). The ascidian fauna is well over 100 species (P. Colin, pers. comm.). Within Micronesia,<br />
Palau has the highest diversity of reef fish with a total of 1,278 known species. Data gaps suggest that reef<br />
fish in Palau may number closer to 1,449 species (Myers, 1999).<br />
Endemism is low among Palauan marine organisms. However, true levels of endemism are difficult to estimate<br />
because many groups are not well documented. The nautilus, Nautilus belauensis, is endemic to Palau<br />
and has been the subject of numerous biological studies.<br />
ENVIRONMENTAL AND ANTHROPOGENIC STRESSORS<br />
Climate Change and Coral Bleaching<br />
During the 1997-1998 El Niño event, Palau experienced massive coral bleaching and mortality. Six years<br />
after the event, the reefs in Palau have still not fully recovered. The 1997-1998 bleaching event in Palau was<br />
widespread and variable among different sites (Bruno et al., 2001). Approximately one-third of Palau’s corals<br />
died, with coral mortality as high as 90% in some areas. It devastated Acroporid corals, which suffered the<br />
highest mortality compared to other coral species. Corals that were found in estuaries closer to shore survived<br />
better than corals farther from shore (Golbuu, 2000). Impacts of the elevated water temperature were seen<br />
in other habitats such as the famous “Jellyfish Lake,” which experienced a complete mortality of the medusa<br />
stage of Mastigias spp. Presently, coral bleaching is considered one of the greatest threats to Palau’s coral<br />
reef ecosystems.<br />
Since 1997-1998, Palau has not had a major bleaching event. Localized episodes of coral bleaching have occurred<br />
periodically at various sites in Palau, but none as severe or widespread as the 1997-1998 event. The<br />
localized bleaching events are probably due to disease or other localized stress at the microhabitat level.<br />
Diseases<br />
In the past few decades, worldwide increases in coral diseases have become one of the major threats challenging<br />
the resilience of coral reef communities (Harvell et al., 1999; Willis et al., 2004). Coral disease impacts<br />
have increased on reefs worldwide and are emerging as one of the major causes of coral reef deterioration in<br />
the Caribbean. Although the Indo-Pacific encompasses more than 80% of the world’s coral reefs, very little is<br />
known about the ecology and pathology of coral disease in this region (Bryant et al., 1998).<br />
The first assessment of coral disease prevalence on Palau’s reefs was conducted in January 2004 as part of<br />
the Targeted Coral Reef Research Project by the World Bank/Global Environment Facility . The purpose of
The State of Coral Reef Ecosystems of Palau<br />
these surveys was to identify and establish baseline information for coral disease at sites representative of<br />
the major habitat and community types. Results from this initial study indicate that the mean prevalence of<br />
coral disease was relatively low, affecting between 1% and 5.28% of colonies at six sites representative of<br />
protected, moderately exposed, and exposed communities on Palauan reefs. A total of twelve diseases and<br />
syndromes were recorded across thirteen reefs surveyed during preliminary site-selection visits or disease<br />
prevalence surveys (Table 17.1). Eight of these syndromes have been previously observed on Indo-Pacific<br />
reefs, in particular on the Great Barrier Reef (Willis et al., 2004). However, four syndromes have not been<br />
previously recorded: bleached patches, bleached spots, bleached stripe, and yellow spot. At each of the six<br />
survey sites, approximately five to nine diseases or syndromes were observed, with the greatest number being<br />
recorded at Malakal Harbour (B. Willis, pers. comm.). A more quantitative assessment of coral disease<br />
prevalence within Palau requires further research.<br />
Table 17.1. Diseases and syndromes recorded near six transects in Palau in January 2004. Source: B. Willis, unpublished data.<br />
NIKKO BAY<br />
SPAWNING<br />
Disease States Recorded on Transects<br />
Black Band Disease<br />
NIKKO BAY<br />
XXIX<br />
MALAKAL<br />
HARBOUR<br />
SPAWNING<br />
Brown Band Disease x x<br />
BITAL<br />
RIRS<br />
WESTERN<br />
BARRIER<br />
NGATBANG<br />
WESTERN BARRIER<br />
NGEREMLENGUI<br />
Skeletal Eroding Band x x x x x x<br />
Other Cyanobacterial Infections x x x x x x<br />
Bleached Spots x x x x x x<br />
Bleached Patches x x x x x x<br />
Bleached Stripe x<br />
White Syndrome x x x x<br />
Patchy Necrosis x x x<br />
Yellow Spot x<br />
Tumors x x x<br />
Disease States Recorded off Transects<br />
Black Band Disease x<br />
Other Cyanobacterial infections x (red)<br />
Yellow Spot x x<br />
Prevalence of Coral Disease<br />
Mean prevalence of disease varied<br />
considerably across the six sites<br />
surveyed, ranging between 1.16<br />
± 0.62% of coral colonies at the<br />
Western Barrier Ngeremlengui site<br />
and 5.28 ± 0.97% of colonies at<br />
the Malakal Harbour Spawning site<br />
(Figure 17.3). Mean prevalence of<br />
bleached colonies was much lower<br />
at the Nikko Bay Spawning site and<br />
the Bital Rirs site, varying between<br />
0.9 ± 0.09% of coral colonies to 1.24<br />
± 0.47% of colonies, respectively (B.<br />
Willis, pers. comm.).<br />
Figure 17.3. Mean prevalence of bleached and diseased coral colonies at six sites<br />
surveyed in January 2004. Source: B. Willis, unpublished data.<br />
Palau<br />
Sidebar<br />
page<br />
491
Palau<br />
page<br />
492<br />
The State of Coral Reef Ecosystems of Palau<br />
Tropical Storms<br />
Typhoons, tropical storms, and large<br />
waves can affect coral cover. Large<br />
waves generated by storms can<br />
cause breakage and physical damage.<br />
Storm waves can also have<br />
beneficial effects on reefs by removing<br />
sediments and algae on the reef,<br />
thereby making space available for<br />
coral recruitment. Palau is outside<br />
the typhoon belt and is therefore less<br />
likely to experience typhoons compared<br />
to other places in Micronesia<br />
(Figure 17.4). Areas in Palau that are<br />
commonly subjected to high wave energy<br />
generally do not have high coral<br />
cover and diversity, but the corals<br />
that do inhabit these large wave areas<br />
are well-adapted to their environment.<br />
Encrusting Montipora, Porites,<br />
digitate Acropora and massive corals<br />
typically dominate the coral fauna in<br />
areas exposed to high wave energy.<br />
Figure 17.4. The paths and intensities of typhoons passing near Palau from 1979-<br />
2004. Many Pacific typhoons are not named or the names are not recorded in the<br />
typhoon database. Map: A Shapiro. Data: UNISYS, http://weather.unisys.com/hurricane.<br />
Coastal Development and Runoff<br />
Increased sedimentation is another major threat to coral reef ecosystems worldwide (McCook et al., 2001;<br />
Wolanski and Spagnol, 2000; Wolanski et al., 2003), and Palau is no exception. Sedimentation associated<br />
with runoff from coastal development poses a serious threat to reefs around Babeldaob, the largest island in<br />
the Palau Archipelago.<br />
A study in the Ngerikiil watershed (Figure 17.2) showed an alarming rate of sedimentation (exceeding 1500<br />
mg/L during flood events) which is likely the result of development activities such as road construction and<br />
agriculture (Golbuu et al., 2003b). Current sediment monitoring activity in the Ngerdorch watershed shows a<br />
direct link between the level of water clarity and runoff from the Compact Road Project (S. Victor, pers. obs.).<br />
By comparing the level of activity in the two watersheds (Ngerikiil and Ngerdorch), it is possible to observe a<br />
direct correlation between the level of human activity in the area and the observed rate of sedimentation. The<br />
Ngerikiil watershed area has experienced an increase in development activity and has a sedimentation rate<br />
that is 10 to 19 times higher than Ngerdorch watershed, which is relatively pristine (Victor et al., 2004). These<br />
studies also showed that the mangrove systems fringing the estuaries in each watershed can only trap about<br />
30% of the sediment. Increased sedimentation can smother seagrass and coral habitats, causing mortality in<br />
some cases (Figure 17.5). Furthermore, sedimentation has the potential to affect coral recovery in Palau by<br />
blocking recruitment of coral larvae.
Figure 17.5. Seagrass (left) and corals (right) that are being smothered by sediment. Photos: S. Victor.<br />
The State of Coral Reef Ecosystems of Palau<br />
Coastal Pollution<br />
The population in Palau is small and pollution is relatively low; however, the potential for increased pollution<br />
exists as population and development rises in Palau. Sewage can become a source of pollution to the marine<br />
environment if proper waste treatment plants are not in place to handle the increase in population and visitation.<br />
In Koror, Palau’s hub of population and commerce, raw sewage has been observed on the reefs when<br />
sewer substations are not able to handle their loads. A new sewage treatment plant is being constructed in<br />
Koror to accommodate the increase in population and tourists. Babeldaob, however, has no sewage treatment<br />
plants and many of the households use septic tanks. There is a great need for a sewerage treatment<br />
plant in Babeldaob to accommodate the expected rise in development that will occur when the capitol is relocated<br />
to this island.<br />
Other potential sources of pollution to the marine environment in Palau are animal wastes, pesticides, herbicides,<br />
oil spills, and other chemicals. Many of these potential sources are minimal but if left unchecked, they<br />
can potentially become major threats to the fragile marine environment in Palau.<br />
Tourism and Recreation<br />
Palau has limited income generation potential. The government provides strong support for tourism development<br />
in hopes that it will generate income<br />
and provide a stimulus for other<br />
economic activities in Palau. In 1996,<br />
Palau derived $67 million or 47% of<br />
the Gross Domestic Product (GDP)<br />
from its tourism industry. From 1992<br />
to 1997 tourist arrivals doubled from<br />
nearly 30,000 to 60,000. However,<br />
in 1998 Palau experienced a 3.3%<br />
decrease in GDP, which may be attributed<br />
to the decline in Palau’s coral<br />
reef health due to the 1997-1998 coral<br />
bleaching event. The numbers of<br />
visitors to Palau between 1995 and<br />
2001 are given in Figure 17.6. With<br />
the efforts and emphasis placed on<br />
tourism development, there is a growing<br />
concern that Palau does not have<br />
the proper infrastructure to support Figure 17.6. Numbers of visitors to Palau from 1995-2001. VFR is ‘Visiting Friends<br />
or Relatives.’ Source: Palau Visitors Authority.<br />
increased tourism.<br />
Palau<br />
Sidebar<br />
page<br />
493
Palau<br />
page<br />
494<br />
The State of Coral Reef Ecosystems of Palau<br />
Fishing<br />
Fishing is a popular activity in Palau. In 2001, 835 people (16% of Palau’s population) sold their catch to local<br />
fish markets at least once during the year (Republic of Palau, <strong>Marine</strong> Resources Database, 2004). A 2003 survey<br />
of subsistence fisheries indicated that 87% of households have someone that fishes either for subsistence<br />
or commercial purposes, and often both. Only 13% of Palauan households were not involved in any type of<br />
fishing (Palau International Coral Reef Center, unpublished data).<br />
The total annual inshore fisheries production for Palau averaged 1,800 metric tons (mt) over the past 20 years<br />
(TEI, 1999). Approximately 360 mt of this total is sold at the local markets, 250 mt is exported, and 1,200 mt<br />
is used for direct consumption. Commercial landings data exhibit no significant trend in the amount of catch<br />
from 1998 to 2001 (A. Kitalong, pers. comm.). Field surveys (Maragos et al., 1994), fish aggregation studies<br />
(Johannes et al., 1999), and observations by fishers all indicate a decline in fish populations (TEI, 1999). In<br />
2002, 31% of fishers and prominent community members perceived that the inshore fisheries were being harvested<br />
at unsustainable levels and communities perceived their catch to be at least three times smaller than<br />
a decade ago (A. Kitalong, pers. comm.).<br />
Trade in Coral and Live Reef Species<br />
The trade in marine ornamental fish has been rapidly growing worldwide over the past several years. The<br />
growing popularity of home aquaria that mimic coral reef ecosystems has made the live fish and marine invertebrate<br />
trade a profitable venture in many tropical islands. Many are concerned that this industry can cause<br />
reef degradation by targeting important juvenile food fish or species that are ecologically important. The 1994<br />
Palau <strong>Marine</strong> Act regulates ornamental fisheries through restrictions on the collection of marine resources for<br />
aquaria and research, including a prohibition on the export of hard corals, live rock, sponges, and tridacnid<br />
clams.<br />
The first ornamental trade company started operation in 1990, changed management in 1994, and went out of<br />
business in 1996 due to an unstable market and strict regulation by the Palau Government (Graham, 2001).<br />
Prior to 1994, the company traded finfish, tridacnid clams, starfish, rare shrimp, sea slugs, sea urchins, hermit<br />
crab with anemone, hard and soft corals, and live rocks. For two years, there was no business in the trade of<br />
marine ornamentals until 1998 when Belau Aquaculture was launched. The company originally specialized in<br />
the trade of marine invertebrates. In 1999, the company changed management and started trading finfishes<br />
as well. In 2000, the company exported 58,000 finfish and 12,000 invertebrates. The top selling finfishes are<br />
species of damselfish (Pomacentridae) and the top selling invertebrate is the blue starfish (Linckia laevigata;<br />
Graham, 2001). Belau Aquaculture is still in operation today, although there are no available statistics on their<br />
current export of finfish and invertebrates.<br />
Ships, Boats, and Groundings<br />
In the last several years, there have been several ship groundings on the reefs surrounding Palau. Many of<br />
these ship groundings occur on the western barrier reefs and in the southern lagoons. In 2001, the container<br />
ship Falcon ran aground on the western barrier reef and caused extensive damage to the reef. In 2002, the<br />
live-aboard dive vessel Big Blue Explorer ran aground and damaged the Bailechesengel Reef, a fringing reef<br />
in the Ngemelis complex that is a world renowned dive site (Golbuu et al., 2002). No restoration effort has<br />
been undertaken to reclaim these damaged reefs.<br />
Boating is a major recreational activity in the Republic of Palau. Many tourism activities in Palau, including<br />
diving, snorkeling, and tours of the Rock Islands, require boat travel. At-sea fishing is a popular activity by<br />
locals. The Koror State Government has installed mooring buoys at many dive sites in order to reduce anchor<br />
damage to reefs.
The State of Coral Reef Ecosystems of Palau<br />
The potential effects of motorboat fuel on marine animals have not been studied in Palau. Studies elsewhere<br />
have shown that gametes and larvae of many marine animals are susceptible to low levels of pollutants, such<br />
as copper, oil, and tributyltin (Heyward, 1988; Negri and Heyward, 2000; Reichelt-Brushett and Harrison,<br />
1999). Many local fishers have complained that increased boating activities around seagrass and mangrove<br />
areas may have contributed to the low number of sea urchins (Tripneustus spp.) and fish in those areas.<br />
<strong>Marine</strong> Debris<br />
The impact of marine debris on reefs in Palau has not been documented or studied. The Koror State Government<br />
has a regular cleanup program around the Rock Islands to collect marine debris. Currents bring debris<br />
originating outside of Palau to the atolls of Ngeruangel and Helen Reef, but these areas do not have a regularly<br />
scheduled cleanup. The impact of marine debris on nesting bird and turtle populations in these areas is<br />
not known.<br />
Aquatic Invasive Species<br />
Introduction of non-indigenous species is one of the most pervasive and irreversible impacts of human activity<br />
on natural ecosystems. In the marine environment, invasive species have been rated as one of the four<br />
greatest threats to the world’s oceans. <strong>Marine</strong> ecosystems are particularly vulnerable to alien species invasions.<br />
Organisms can spread rapidly in marine environments and are difficult to detect. In addition, control<br />
and eradication options used in terrestrial ecosystems often cannot be used in marine environments.<br />
Several marine invasive species have been identified in Palau (Table 17.2; P. Colin, pers. comm.). At present,<br />
it appears that none of these invasive species are having a quantifiable effect on fisheries or the marine tourism<br />
industry, but marine invasive species do have the potential to become a serious problem in Palau. Relatively<br />
little baseline information exists for the groups of marine invertebrates that are invasive species in Palau. Most<br />
marine invasive species in Palau belong to a small group of marine invertebrates likely introduced as fouling<br />
on ship’s hulls or from ballast water pumped out in harbors. The major groups of marine invasive species in<br />
Palau are the ascidians or tunicates<br />
(Phylum Chordata, Subphylum Urochordata),<br />
hydroids and other cnidarians<br />
(Phylum Cnidaria), molluscs<br />
(Phylum Mollusca), sponges (Phylum<br />
Porifera), bryozoans (Phylum Ectoprocta),<br />
and other small groups (P.<br />
Colin, pers. comm.).<br />
Presently only one marine invasive<br />
species, the hydroid, Eudendrium<br />
cameum, has the potential for becoming<br />
a “pest” organism in Palau.<br />
This hydroid is a rapid growing species<br />
and has been found growing in<br />
at least three channels of Palau. E.<br />
carneum prefers rocky bottom substrates<br />
with particularly high currents,<br />
and often forms a tangle of branches<br />
that tends to accumulate sediment,<br />
making it a fairly unattractive “weed.”<br />
The masses of E. carneum tend to<br />
make rocky surfaces on the reef less<br />
visible, and make the reef look “dirty.”<br />
As with any marine invasive species,<br />
E. carneum has the potential to<br />
Table 17.2. <strong>Marine</strong> species introduced in Palau. Source: P. Colin, pers. comm.<br />
PHYLUM CLASS SPECIES<br />
Cnidaria Hydrozoa Eudendrium carneum<br />
Thyroscyphus fruticosus<br />
Chordata<br />
Ascidiacea Didemnum perlucidum<br />
(Subphylum Urochordata)<br />
Diplosoma listerianum<br />
Lissoclinum fragile<br />
Ascidia aperta<br />
Ascidia archaia<br />
Botryllus tyreus<br />
Ecteinascidia diaphanis<br />
Eusynstyela hartmeyeri<br />
Herdmania insolita<br />
Herdmania momus<br />
Microcosmus helleri<br />
Microcosmus pupa<br />
Perophora mutliclathrata<br />
Phallusia philippinensis<br />
Polyclinum nudum<br />
Pyura curvigona<br />
Pyura honu<br />
Pyura vittata<br />
Palau<br />
Sidebar<br />
page<br />
495
Palau<br />
page<br />
496<br />
The State of Coral Reef Ecosystems of Palau<br />
spread throughout the marine environments (e.g., rocky bottoms) of Palau. E. carneum could potentially interfere<br />
with the feeding of grazers, such as parrotfishes and surgeonfishes, which scrape algae from rock surfaces.<br />
At present, the current knowledge on the status and distribution of E. carneum in Palau is unknown.<br />
Security Training Activities<br />
Security training activities do not occur in Palau.<br />
Offshore Oil and Gas Exploration<br />
Offshore oil and gas exploration activities do not occur in Palau.<br />
<strong>CORAL</strong> <strong>REEF</strong> ECOSYSTEM—DATA GATHERING ACTIVITIES AND RESOURCE CONDITION<br />
Various data gathering efforts have contributed to the general understanding of coral reef ecosystems in<br />
Palau. Table 17.3 provides a tabular summary of the monitoring and assessment activities that have been<br />
undertaken in recent years.<br />
Table 17.3. Monitoring and assessment activities occurring in Palau.<br />
AGENCY<br />
Bureau of Natural Resources<br />
and Development<br />
Coral Reef Research<br />
Foundation<br />
Environmental Quality<br />
Protection Board<br />
Koror State Department<br />
of Conservation and Law<br />
Enforcement<br />
PLANNING/<br />
MANAGEMENT<br />
X X<br />
RESEARCH MONITORING EDUCATION/<br />
OUTREACH<br />
X<br />
X X<br />
exports and<br />
fish markets<br />
temperature,<br />
marine lakes<br />
TRAINING ENFORCEMENT<br />
water quality X X<br />
marine lakes,<br />
rock islands<br />
Palau Conservation Society MPAs X<br />
Palau International Coral<br />
Reef Center X<br />
fish, coral,<br />
MPAs,<br />
watersheds<br />
X X X<br />
X X<br />
The Nature Conservancy X X X
WATER QUALITY<br />
The State of Coral Reef Ecosystems of Palau<br />
Methods<br />
The Environmental Quality Protection Board of Palau (EQPB) conducts monthly water quality monitoring of<br />
marine waters around most of Palau. Turbidity, pH, salinity, dissolved oxygen, fecal coliform, and temperature<br />
are collected monthly at 32 permanent sites (Table 17.4). Sampling sites were selected because they<br />
Table 17.4. Water quality parameters measured by the EQPB of Palau.<br />
PARAMETER UNITS COLLECTION METHOD<br />
Fecal Coliform bacteria/100 ml Obtain near surface water sample for laboratory analysis<br />
Turbidity NTU In situ hydrolab multi parameter meter: near surface<br />
pH scale of 1-14 In situ hydrolab multi parameter meter: near surface<br />
Temperature o C In situ hydrolab multi parameter meter: near surface<br />
Dissolved Oxygen mg/L In situ hydrolab multi parameter meter: near surface<br />
Salinity parts per thousand (ppt) In situ hydrolab multi parameter meter: near surface<br />
are either a popular recreational site<br />
or in close proximity to a drinking water<br />
station. Results from the monitoring<br />
program are added to a database<br />
that dates back to the early 1980s.<br />
Results and Discussion<br />
EQPB issues an ‘unsafe for swimming’<br />
warning for when the fecal coliform<br />
count at a site exceeds 20 bacteria<br />
per 100 mL. Most of the sites<br />
sampled had fecal coliform counts<br />
less than this threshold (Figure 17.7).<br />
However, in April, May, and August<br />
of 2002, at least one-quarter of the<br />
monitoring sites had fecal coliform<br />
counts over 20 bacteria per 100 mL.<br />
In 2002, the average turbidity was<br />
below 4 Nepholometric Turbidity<br />
Units (NTU), except in April and September<br />
when it exceeded 5 NTU (Figure<br />
17.8). The increase in turbidity<br />
in April and September could be the<br />
result of increased land earth moving<br />
activities or more rain during those<br />
months.<br />
Figure 17.7. Fecal coliform sampling in 2002 at 32 sites around Palau. Source<br />
EQPB.<br />
Figure 17.8. Mean turbidity in 2002 at 32 permanent sites around Palau. No samples<br />
were collected in March or July 2002. Source: EQPB.<br />
Palau<br />
Sidebar<br />
page<br />
497
Palau<br />
page<br />
498<br />
The State of Coral Reef Ecosystems of Palau<br />
BENTHIC HABITATS<br />
Methods<br />
The Palau International Coral Reef Center (PICRC) launched a nationwide coral reef monitoring program for<br />
Palau in 2001. The objectives of the program are to: (1) establish permanent monitoring sites; (2) determine<br />
status of Palau’s reefs; (3) assess changes to the benthic and fish communities at each site over time; and<br />
(4) examine the recovery process from the 1997-1998 bleaching event at each site. The program consists of<br />
a rapid assessment of reef habitats using the spot check method and a detailed monitoring survey of benthic<br />
organisms, fish size and abundance, and coral recruitment.<br />
The spot check method is a rapid qualitative assessment of bottom substrates, coral cover, and dominant<br />
life forms. In 2001-2002, 217 spot checks were performed in Palau (Figure 17.9). Spot check surveys were<br />
conducted by making qualitative observations during a 15-minute snorkel survey at each site. Two to three<br />
representative pictures of the site were also taken during the survey. Estimated coral cover was classified<br />
Figure 17.9. Locations of spot checks (orange dots) and permanent monitoring sites<br />
(purple dots). Map: A. Shapiro.<br />
as Acropora or “other” and grouped<br />
into one of four density categories:<br />
0-5%, 6-25%, 26-50%, and >50%.<br />
Spot check sites were chosen haphazardly<br />
along the reef front every<br />
few kilometers. While the spot check<br />
method provides a good qualitative<br />
overview of the condition of Palau’s<br />
reef, it cannot be used for quantitative<br />
analysis.<br />
In addition to the spot checks, a<br />
quantitative assessment examining<br />
temporal and spatial changes was<br />
conducted at 14 permanent monitoring<br />
sites around Palau (Figure 17.9).<br />
The monitoring sites utilized in these<br />
detailed surveys were representative<br />
of Palau’s geomorphologic reef types<br />
and localities, ranging from sheltered<br />
fringing reefs to oceanic atolls. The<br />
potential level of human impacts on<br />
the health of coral reefs was also<br />
taken into account in the selection of<br />
sites. Currently the permanent sites<br />
are stratified and replicated within<br />
habitats, sites, depths and transects.<br />
Four sites were surveyed on the<br />
western barrier reefs and Rock Island<br />
fringing reefs, two sites on the east<br />
coast fringing reefs and patch reefs,<br />
and one site at the atoll and east<br />
coast barrier reefs, for a total of 14<br />
permanent monitoring sites around<br />
Palau.<br />
Detailed surveys of benthic communities<br />
were conducted using video<br />
transects. At each site, five replicate<br />
benthic cover surveys were conduct-
The State of Coral Reef Ecosystems of Palau<br />
ed at 3 m and 10 m depths along a 50 m transect. The observer swam approximately 70 cm above the transect<br />
line at a constant speed and videotaped the transect for approximately five minutes. Recruitment surveys<br />
were conducted using a belt transect (0.30 m wide x 10 m long) along the same transects. Any coral that<br />
was smaller than 5 cm in diameter was considered a recruit and its size was recorded. A minimum of three<br />
transects were completed for the recruitment surveys; additional transects were surveyed at sites with few<br />
recruits.<br />
Results and Discussion<br />
Spot check results shows that 87% of the sites surveyed had low Acropora cover in the range of 0-5% (Figure<br />
17.10). 68% of the sites surveyed<br />
had coral other than Acropora covering<br />
less than 25%. Overall, percent<br />
coral cover was generally low to moderate;<br />
only 1% of spot check sites had<br />
Acropora cover greater than 50% and<br />
only 9% of the sites had non-Acropora<br />
coral cover greater than 50%.<br />
The quantitative surveys at the permanent<br />
monitoring sites show that<br />
coral cover was highest along the 3<br />
m depth belt transect at Nikko Bay, a<br />
fringing reef site within the Rock Islands<br />
(Figure 17.11). Nikko Bay and<br />
Ngemelis western barrier reef exhibited<br />
the highest coral cover at the 10 m<br />
depth. Airai fringing reef on the east<br />
coast of Palau and Ngaremlengui<br />
patch reef on the west coast had the<br />
lowest coral cover at both 3 m and 10<br />
m depths (Figure 17.11). Both Airai<br />
and Ngaremlengui are dominated by<br />
sandy bottom substrates and experience<br />
high levels of sediment resuspension<br />
during windy conditions.<br />
Figure 17.10. Coral cover of reefs at 217 sites around Palau that were surveyed by<br />
spot checks. Source: Golbuu et al., 2003a.<br />
Figure 17.11. Coral cover at established permanent monitoring sites at 3 m and 10<br />
m depths. Source: Golbuu et al., 2003a.<br />
Palau<br />
Sidebar<br />
page<br />
499
Palau<br />
page<br />
500<br />
The State of Coral Reef Ecosystems of Palau<br />
Figure 17.12. Mean coral cover and coral recruitment by reef type at 3 m and 10 m<br />
depths. Source: Golbuu et al., 2003a.<br />
Figure 17.13. Coral cover and recruitment rate at the permanent monitoring sites.<br />
Source: Golbuu et al., 2003a.<br />
The monitoring sites were selected to<br />
represent the various types of Palauan<br />
reefs: Atoll; east coast barrier (east<br />
barrier); patch reefs (patch); west<br />
coast barrier (west barrier); fringing<br />
reefs that are not protected by other<br />
reef or land (fringing exposed); fringing<br />
reefs that are protected by reef or<br />
island (fringing sheltered). There are<br />
significant differences in coral cover<br />
among reef types and depths. At 10<br />
m depth, coral cover on patch reefs<br />
was significantly lower than all other<br />
reef types except for east barrier (Figure<br />
17.12). In contrast, at 3 m, both<br />
exposed and sheltered fringing reefs<br />
had coral cover that was significantly<br />
higher than other reef types (Figure<br />
17.12).<br />
Mean coral recruitment varied significantly<br />
among the different reef types<br />
at both 3 m and 10 m depths (Figure<br />
17.12). West barrier reefs had the<br />
highest number of recruits at both 3<br />
m and 10 m depths. At the 3 m depth,<br />
the number of recruits at west barrier<br />
reefs was significantly different than<br />
the number of recruits at both exposed<br />
and sheltered fringing reefs.<br />
The only significant difference in coral<br />
recruitment among reef types at the<br />
10 m depth was between west barrier<br />
reefs and sheltered fringing reefs<br />
(Figure 17.12).<br />
There was no correlation between<br />
coral cover and recruitment at 10 m<br />
depths (Figure 17.13). For example,<br />
Nikko Bay and Taoch had high coral<br />
cover, but low coral recruitment. In contrast, Ngemelis and Kayangel have high coral cover and high recruitment.<br />
Airai and Ngeremlengui had low coral cover and low coral recruitment. Other sites, such as Ngerchelong,<br />
had low coral cover, but a high number of recruits.<br />
Recruitment patterns can be better explained by the characteristics specific to each of the monitoring sites.<br />
In Nikko Bay, low recruitment was due to the lack of available substrates since all suitable substrate was covered<br />
by benthic organisms. Even though Ngemelis and Kayangel had high coral cover, there was still suitable<br />
substrate available for recuitment. Airai and Ngaremlengui sites have low coral cover and low recruitment<br />
because both sites are dominated by sandy bottoms and rubble, which are not suitable for coral recruitment.<br />
The presence of recruits and young juvenile corals at many of the monitoring sites suggests that reefs are<br />
recovering. However, percent cover and species diversity remain lower than reef conditions prior to 1998.
ASSOCIATED BIOLOGICAL COMMUNITIES<br />
The State of Coral Reef Ecosystems of Palau<br />
Methods<br />
Detailed surveys of fish communities were conducted by visual census at each permanent monitoring site.<br />
The surveys were conducted at 3 m and 10 m depths along five 50 m transects at each site. An observer<br />
swam along the transect line, counting the number of fish within 2.5 m of each side of the transect. Size was<br />
also estimated for each observed fish.<br />
Results and Discussion<br />
At the 3 m depth, the greatest number<br />
of fish (mean of 80 fish per 250 m 2 )<br />
was observed at Ngerdiluches (Figure<br />
17.14). Surgeonfishes (Acanthuridae)<br />
were the most common fish at<br />
all monitoring sites (Figure 17.15).<br />
Parrotfish, rabbitfish, and snappers<br />
were also found in high abundance.<br />
The lowest number of fish was recorded<br />
at Nikko for both the 3 m and<br />
10 m depths (Figure 17.14).<br />
Figure 17.14. Average number of fish at the permanent monitoring sties around<br />
Palau. Source: PICRC, unpublished data.<br />
Palau<br />
Sidebar<br />
page<br />
501
Palau<br />
page<br />
502<br />
The State of Coral Reef Ecosystems of Palau<br />
Figure 17.15. Abundance of Acanthuridae, Lutjanidae, Siganidae and Scaridae at<br />
the permanent monitoring sites around Palau. Source: PICRC, unpublished data.<br />
Figure 17.15 shows the abundance<br />
of four main fish families observed at<br />
the permanent monitoring sites in Palau.<br />
Sites were grouped by reef type<br />
to demonstrate the differences in<br />
fish communities at different habitat<br />
types. Surgeonfish (Acanthuridae)<br />
are the most abundant fish found at<br />
the monitoring sites. Sites that are<br />
exposed, such as barrier reefs (i.e.,<br />
Ngaremlengui, Ngemelis, Ngerdiluches,<br />
Siaes, and Uchelbeluu) and<br />
exposed fringing reefs (i.e., Ngerchong,<br />
Melekeok, and Peleliu) have<br />
high numbers of surgeonfish, while<br />
sheltered fringing reefs (i.e., Nikko<br />
and Taoch) have lower numbers (Figure<br />
17.15).<br />
Barrier reefs have high numbers of<br />
snappers (Lutjanidae), but few were<br />
found on sheltered fringing reefs and<br />
patch reefs (i.e., Ngerchelong and<br />
Ngaremlengui patch; Figure 17.15).<br />
Rabbitfish of the family Siganidae<br />
show a pattern opposite to that of<br />
snappers. Fringing and patch reefs<br />
had high numbers of rabbitfish but<br />
none were found on barrier reefs<br />
(Figure 17.15). Parrotfishes (Scaridae)<br />
were evenly distributed at all<br />
sites (Figure 17.15).<br />
Kayangel, the only atoll site, had<br />
moderate concentrations of all four of<br />
the main fish families surveyed.
CURRENT CONSERVATION MANAGEMENT ACTIVITIES<br />
The State of Coral Reef Ecosystems of Palau<br />
The Palau Ministry of Resources and Development has overlapping jurisdiction with each of Palau’s 16 state<br />
governments for all marine areas within 12 nm of the hightide watermark. Various governmental and non-governmental<br />
organizations have conducted research and monitoring projects to aid in the management of Palau’s<br />
coral reef ecosystems. National and state agencies, in coordination with locally based non-governmental<br />
organizations, have put a variety of management tools in place to address issues such as fishing, recreational<br />
use, and land-based sources of pollution in order to protect the marine resources of Palau.<br />
<strong>Marine</strong> Protected Areas<br />
Several marine protected areas (MPAs) have been established throughout Palau to provide measures of<br />
protection for marine resources tailored to the management goals and intended purpose of the individual<br />
MPAs (Table 17.5). Several more of these protected areas have been designated over the years, thereby<br />
providing protection for a greater percentage of coral reef ecosystems (Figure 17.1).<br />
Most of Palau’s MPAs have been designated by the states and management of these areas falls under the<br />
authority of the local governments. In addition, there are MPAs designated by the national government for the<br />
purpose of protecting biodiversity and significant habitats. The designation of a MPA by the local governments<br />
is initiated by the implementation of a traditional moratorium, or ‘bul’, on the area, prohibiting all use for a restricted<br />
time period (usually one to three years). The majority of these MPAs were designated to address local<br />
concerns of decreased commercial reef fish populations. The Palau Conservation Society and The Nature<br />
Conservancy have been working in partnership with these state governments to implement community-level<br />
monitoring programs within the MPAs and to produce management plans for these areas which will be in effect<br />
after the moratorium period has expired. In the last several years, more of these MPAs have also been<br />
designated through legislation by the state governments to provide a legal basis for management action.<br />
Table 17.5. <strong>Marine</strong> Protected Areas of Palau.<br />
MARINE<br />
PROTECTED AREAS<br />
OBJECTIVES MANAGEMENT<br />
AUTHORITY<br />
PROTECTED HABITATS<br />
Ngerukeuid Preserve Preservation of marine habitat biodiversity National government Rock islands, inner reef flats,<br />
lagoon, patch reefs<br />
Ngerumkaol Protection of reef fish aggregations State government Outer reef wall, reef flat, reef<br />
channel<br />
Ngemelis Protection of marine habitat diversity State government Rock island, inner reef flats, lagoon,<br />
patch reefs<br />
Sardine Sanctuary Protection of sardine aggregations State government Inner patch and fringing reefs<br />
Ngederrak Protection of commercial reef fish and<br />
invertebrate species populations<br />
State government Reef flats, inner reef slope,<br />
seagrass beds, lagoon<br />
Ngermeduu Bay Protection of marine habitat biodiversity State government Mangroves, mudflats, seagrass<br />
beds, fringing reefs, reef channel,<br />
inner reef flats, reef slope<br />
Ngelukes Protection of locally important fish and<br />
invertebrate species populations<br />
State government Patch reef, seagrass beds<br />
Ngermasech Protection of important nursery areas for<br />
fish and invertebrate species<br />
State government Seagrass beds, fringing reefs<br />
Ebiil Channel Preservation of grouper spawning<br />
aggregations<br />
Ngaruangel Protection of marine habitats and locally<br />
important marine species populations<br />
State government Reef slopes, reef flats, channel,<br />
patch reefs, lagoons<br />
State government Atoll<br />
Palau<br />
Sidebar<br />
page<br />
503
Palau<br />
page<br />
504<br />
The State of Coral Reef Ecosystems of Palau<br />
Protected Area Network Act<br />
The Protected Areas Network Act of 2003 aims to support Palauan state government efforts directed at protecting<br />
marine resources. This law creates a nationally sanctioned framework by which non-governmental<br />
organizations and local governments can coordinate marine reserve conservation initiatives through a system<br />
of protected areas, which collectively preserve marine biodiversity. It is hoped that the Act will encourage the<br />
designation of new MPAs by state governments. Until recently, state governments have designated MPAs,<br />
but there was no system for collaboration and support from the national government in identifying appropriate<br />
areas, as well as designating and maintaining these resources. The Protected Area Network Act was seen as<br />
the necessary tool to ensure that areas representative of the full range of biodiversity in Palau are preserved.<br />
A Protected Areas Network coordinator will be appointed to facilitate the implementation of this law. With<br />
technical assistance from The Nature Conservancy in the form of a Protected Area Network counterpart, the<br />
state governments will have access to technical expertise and financial resources that are often lacking at the<br />
local level to properly develop MPAs.<br />
MPA Effectiveness<br />
The Palau International Coral Reef Center (PICRC) is currently conducting research to assess the efficacy of<br />
several MPAs in Palau. MPAs will be selected based on the level of management, geographic distribution,<br />
size, the protection timeframe, and willingness of managers and community members to be evaluated. The<br />
main objective is to improve the management of MPAs in Palau, thereby making MPAs more effective in meeting<br />
their goals and objectives.<br />
The Palau Conservation Society, in partnership with The Nature Conservancy, has also established several<br />
monitoring sites in four community-designated MPAs in Babeldaob. The monitoring program tracks the abundance<br />
of locally important fish and invertebrate species (Table 17.6).<br />
Table 17.6. Community-designated Conservation Areas.<br />
MARINE PROTECTED AREA <strong>STATE</strong> GOVERNMENT INDICATORS<br />
Ngelukes Conservation Area Ngchesar State Reef fish and invertebrate species abundance (rabbitfish,<br />
snappers, surgeonfish, giant clams, and sea cucumbers)<br />
Ngermasech Conservation Area Ngardmau State Reef fish and invertebrate species abundance (rabbitfish,<br />
snappers, surgeonfish, giant clams, and sea cucumbers)<br />
Ebiil Channel Conservation Area Ngarchelong State Abundance of groupers at spawning aggregation sites<br />
Ngaruangel Reserve Kayangel State Fish abundance, occurrence of nesting sea turtle and sea bird<br />
poplulations<br />
Other Management Tools<br />
The Palau Bureau of <strong>Marine</strong> Resources has deployed fish aggregating devices in territorial waters around<br />
Palau in order to take fishing pressure off the reefs and promote a shift to pelagic fishes. Mooring buoys have<br />
been installed throughout the state of Koror as a management tool to decrease recreational impacts on coral<br />
reefs. Mooring buoys are well used by dive operators, recreational fishers and boaters. Outside the MPAs<br />
and other managed areas with very specific regulations, fishing is nationally regulated. Size restrictions exist<br />
for the humphead wrasse, bumphead parrotfish, and lobster. The harvest of grouper is restricted to non-peak<br />
spawning months and the season is well established. Additionally, the commercial export of reef fish and<br />
crustaceans is prohibited. Other restrictions are in place such as a closed season on harvesting sea turtles<br />
and full protection for the dugongs in Palau.
The State of Coral Reef Ecosystems of Palau<br />
OVERALL CONCLUSIONS AND RECOMMENDATIONS<br />
Collaboration and coordination among the different agencies and groups involved in coral reef monitoring,<br />
management and conservation are important. Interagency working groups (e.g., National Environmental Protection<br />
Council, <strong>Marine</strong> Resources Pacific Consortium, etc.) should be strengthened to ensure the inclusion of<br />
local agencies and interest groups and to increase communication and cooperation when addressing priorities<br />
and actions outlined in nationally adopted strategies (e.g., National Biodiversity Strategy Action Plan). Information<br />
beginning to emerge from studies of important watersheds in Palau suggests that collaboration between<br />
land management authorities, legislative bodies, and traditional leadership will be required to develop<br />
effective land use regulations. An integrated and transparent approach that recognizes the complexities of<br />
managing the coastal zone is considered crucial to this effort. In addition, the incorporation of coral reef ecosystem<br />
issues into local education programs will further promote marine conservation. Forming partnerships<br />
among relevant agencies that deal with outreach and education in Palau should be initiated to maximize the<br />
use of limited resources. The main objective of this effort should be to raise public awareness and appreciation<br />
for coral reef ecosystems through targeted and focused communication campaigns.<br />
Specialized advice, technical assistance, and additional data are required in several areas. Most of the work<br />
being done in Palau has focused on biological and physical aspects of coral reefs and marine resources. Social,<br />
cultural, economic, and political factors, however, are also extremely important to the success of management<br />
strategies. Currently, Palau has limited expertise and capacity to address socio-economic issues, and<br />
therefore technical assistance and expertise in this area are needed.<br />
Palau recently passed the Protected Areas Network Act which provides a framework for the establishment<br />
of an MPA network in Palau. Much of the work on the design, criteria, and regulations are under development,<br />
and expertise and technical assistance are needed to assist in implementation. Furthermore, in order<br />
to ensure efficiency in resource management, managers require accurate information on ecosystem change.<br />
Activities such as monitoring of coral reefs, as well as site selection and monitoring of MPAs require detailed<br />
habitat maps. Currently, Palau does not have maps of sufficient detail to support the necessary research<br />
and monitoring work. However, nearshore benthic habitat mapping has been initiated by NOAA’s Center for<br />
Coastal Monitoring and Assessment, Biogeography Team, and preliminary products for approximately 75% of<br />
the main island cluster will be available by the end of <strong>2005</strong>. In addition, fisheries managers in Palau urgently<br />
need reliable information on catch per unit of effort and trends in the population structure of target fish.<br />
Palau<br />
Sidebar<br />
page<br />
505
Palau<br />
page<br />
506<br />
The State of Coral Reef Ecosystems of Palau<br />
REFERENCES<br />
Bruno, J.F., C.E. Siddon, J.D. Witman, and P.L. Colin. 2001. El Nino related bleaching in Palau, Western Caroline Islands.<br />
Coral Reefs 20: 127-136.<br />
Bryant, D., L. Burke, J. McManus and M. Spalding. 1998. Reefs at risk: a map-based indicator of threats to the world’s<br />
coral reefs. World Resources Institute, Washington, DC.<br />
Colin, P. Coral Reef Research Foundation. Koror, Palau. Personal communication.<br />
Golbuu, Y. 2000. Status of the coral reefs of Palau. PCC-CRE Publication 19/00.<br />
Golbuu, Y., D. Idip Jr., S. Victor, J. Kloulechad, and K. Okaji. 2002. Environmental Assessment for the Big Blue Explorer<br />
Grounding, Koror State, Republic of Palau. PICRC Publication 02-001.<br />
Golbuu, Y., S. Victor, E. Wolanski, and R.H. Richmond. 2003a. Trapping of fine sediment in a semi-enclosed bay, Palau,<br />
Micronesia. Estuarine, Coastal and Shelf Science 57: 941-949.<br />
Golbuu, Y., L. Penland, D. Idip, S. Victor, C. Emaurois, J Kloulechad, and K. Okaji. 2003b. Status of Palau’s Coral Reefs.<br />
In: Proceedings of Palau coral reef conference, Koror, Palau. PICRC Publication 04-001.<br />
Gosliner, T. California Academy of Sciences, San Francisco. Personal communication.<br />
Graham, T. 2001. The live reef fisheries of Palau: history and prospect for management. Asia Pacific Coastal <strong>Marine</strong><br />
Program Report 0103. The Nature Conservancy, Hawaii. 85 pp.<br />
Harvell, C., K. Kim, J. Burkholder, R. Colwell, P. Epstein, D. Grimes, E. Hofmann, E. Lipp, A. Osterhaus, R. Overstreet,<br />
J. Porter, G. Smith, and G. Vasta. 1999. Emerging marine diseases: Climate links and anthropogenic factors. Science<br />
5433: 1505-1510.<br />
Heyward, A.J. 1988. Inhibitory effects of cooper and zinc on fertilization in corals. pp. 2: 299-303. In: Proceedings of the<br />
6th International Coral Reef Symposium.<br />
Johannes, R.E., L. Squire, T. Graham, Y. Sadovy, and H. Renguul. 1999. Spawning aggregations of groupers (Serranidae)<br />
in Palau. The Nature Conservancy <strong>Marine</strong> Research Series Publication No.1, 144 pp. Available from the internet<br />
URL: http://www.tnc.org/asiapacific.<br />
Kelly-Borges, M. and C. Valentine. 1995. The sponges of the tropical island region of Oceania: A taxonomic status review.<br />
pp. (1) 83-120. In: J. Maragos, M.N.A. Peerson, L.G. Eldredge, J.E. Bardach, and H.F. Takeuchi (eds.) <strong>Marine</strong> and<br />
Coastal Biodiversity in the Tropical Island Pacific Region. Species Systematics and Information Management Priorities.<br />
East-West Center, Honolulu. 424 pp.<br />
Kitalong, A. The Environmental, Inc. Airai, Palau. Personal communication.<br />
Maragos, J.E., C. Birkeland, C. Cook, K. Des Rochers, R. Di Rosa, T.J. Donaldson, S.H. Geermans, M. Guilbeaux, H.<br />
Hirsh, L. Honigman, N. Idechong, P.S. Lobel, E.Matthews, K.J. McDermid, K.Z. Meier, R. Myers, D. Otobed, R.H. Richmond,<br />
B. Smith, and R. Smith. 1994. <strong>Marine</strong> and coastal areas survey of the main Palau Islands: Part 2. Rapid Ecological<br />
Assessment Synthesis Report. Republic of Palau, Ministry of Resources and Development.<br />
McCook, L., E. Wolanski, and S. Spagnol. 2001. Modelling and visualizing interactions between natural disturbances and<br />
eutrophication as causes of coral reef degradation. pp. 113-125. In: E. Wolanski (ed.), Oceanic processes of coral reefs,<br />
Physical and biological links in the Great Barrier Reef. CRC Press, Boca Raton, FL. 356 pp.<br />
Meyer, D.L. and D.B. Macurda, Jr. 1980. Ecology and Distribution of the Shallow-Water Crinoids of Palau and Guam.<br />
Micronesica 16: 59-99.<br />
Myers, R.F. 1999. Micronesian reef fishes: a comprehensive guide to the coral reef fishes of Micronesia. Coral Graphics,<br />
Barrigada, Guam. 330 pp.<br />
Negri, A.P. and A.J. Heyward. 2000. Inhibition of coral fertilization and larval metamorphosis by tributyltin and cooper.<br />
<strong>Marine</strong> Environmental Research 51: 17-27.<br />
Randall, R.H. 1995. Biogeography of reef-building corals in the Mariana and Palau Islands in relation to back-arc rifting<br />
and the formation of the eastern Philippine Sea. Natural History Research 3 (2): 193-210.
The State of Coral Reef Ecosystems of Palau<br />
Reichelt-Brushett, A.J. and P.L. Harrison. 1999. The effects of cooper, zinc, and cadmium on fertilization success of gametes<br />
from scleractinian reef corals. <strong>Marine</strong> Pollution Bulletin 38 (3): 182-187.<br />
Republic of Palau. 2004. <strong>Marine</strong> Resources Database. Bureau of <strong>Marine</strong> Resources.<br />
TEI (The Environment, Inc.). 1999. Palau Inshore Fisheries Profile. A report submitted to: Palau Conservation Society.<br />
UNISYS. 2004. Typhoon data for the Western Pacific Ocean. Available on-line at: http://weather.unisys.com/hurricane.<br />
Victor, S. Palau International Coral Reef Center, Koror, Palau. Personal communication.<br />
Victor, S., Y. Golbuu, E. Wolanski, and R.H. Richmond. 2004. Wetland Ecology and Management. 12: 277 - 283.<br />
Willis, B. 2004. James Cook University, Townsville, Australia. Personal communication.<br />
Willis, B.L., C.A. Page, and E.A. Dinsdale. 2004. Coral disease on the Great Barrier Reef. pp. 69 – 104. In: E. Rosenberg<br />
and Y. Loya (eds.) Coral Health and Disease. Springer-Verlag, Berlin.<br />
Wolanski, E. and S. Spagnol. 2000. Environmental degradation by mud in tropical estuaries. Regional Environmental<br />
Change 1 (3-4): 152-162.<br />
Wolanski, E., R.H. Richmond, G. Davis, and V. Bonito. 2003. Water and fine sediment dynamics in transient river plumes<br />
in a small reef-fringed bay, Guam. Estuarine, Coastal and Shelf Science 56: 1029-1040.<br />
Palau<br />
Sidebar<br />
page<br />
507
National Summary<br />
page<br />
508<br />
NATIONAL SUMMARY<br />
Overview<br />
The purpose of the national summary is to catalogue results of the preceding jurisdictional chapters into a<br />
common assessment framework and provide a broad measure of ecosystem status and response. In addition,<br />
this summary identifies key research, monitoring, and management needs that must be addressed in the future<br />
to ensure continued refinement of a robust and accurate assessment of the status of coral reef ecosystems.<br />
In order to incorporate the diverse information from mapping, monitoring, research, and management efforts,<br />
the framework provided here is qualitative. This summary data will form a basis for comparison with future<br />
assessments of coral reef ecosystem status. It is important to note that this information has not been developed<br />
for interjurisdictional comparisons; rather, it has been designed to track the status of coral reef ecosystems<br />
over time. To develop the jurisdiction chapters, writing teams were tasked with identifying, interpreting and<br />
summarizing the results of ongoing mapping, monitoring, research, and management activities. Although each<br />
team cast a broad net to gather such information, it is likely that some important activities were not identified<br />
and therefore are not represented in this report. Much of the information and all of the examples used in this<br />
summary chapter are drawn from the content of the jurisdictional chapters.<br />
Background<br />
In June 2002, the National Oceanic and Atmospheric Administration (NOAA) and its U.S. Coral Reef Task<br />
Force (USCRTF) partners crafted the National Coral Reef Action Strategy (NCRAS, 2002). This strategy was<br />
developed to fulfill the requirements of the Coral Reef Conservation Act of 2000 (CRCA; 16 U.S.C. § 6401 et<br />
seq.) and to help track implementation of the National Action Plan to Conserve Coral Reefs that was adopted<br />
by the USCRTF in 2000 (USCRTF, 2000). The strategy was divided into two main themes aimed to: (1) provide<br />
a better understanding of coral reef ecosystems, and (2) reduce the adverse impacts of human activities. The<br />
goals for theme 1 include such objectives as the development of habitat maps of U.S. coral reef ecosystems;<br />
assessment, monitoring and research related to ecosystem status; and an increased understanding of social<br />
and economic factors relevant to the conservation of coral reef ecosystems. Theme 2 goals focus on, among<br />
other things, improving the use of marine protected areas (MPAs) in coral reef ecosystems, reducing adverse<br />
impacts of fishing and other extractive activities, and improving education and outreach. The following sections<br />
outline some of the many initiatives underway within U.S. jurisdictions and on a national level to address a<br />
selection of the goals defined in the NCRAS.<br />
Mapping U.S. coral reef ecosystems<br />
Accurate benthic habitat (e.g., corals, seagrass, sand) maps are necessary for resource managers to make<br />
informed decisions about the protection and management of a wide range of marine resources (Monaco et<br />
al., 2001; Kendall et al., 2004). Several initiatives are currently underway in the U.S. to map shallow-water<br />
benthic habitats to provide an inventory of resources and support ecosystem assessment and monitoring<br />
programs (NOAA, 2002). NOAA’s Ocean Service (NOS) initiated a coral reef research program in 1999 to<br />
map, assess, inventory, and monitor U.S. coral reef ecosystems (Monaco et al., 2001). The mapping activities<br />
were outlined by the USCRTF Mapping and Information Synthesis Working Group (MISWG) in the Coral<br />
Reef Mapping Implementation Plan (USCRTF, 1999), which charged NOS with leading the production of<br />
comprehensive digital coral reef ecosystem maps for shallow-water areas of all U.S. states, territories, and<br />
commonwealths. In response to Executive Order 13089 and the CRCA, NOS and its partners are conducting<br />
research to digitally map biotic resources and coordinate a long-term monitoring program that can detect and<br />
predict change in U.S. coral reefs, as well as their associated habitats and biological communities. This work<br />
involves partnerships within NOS and NOAA, as well as with other Federal agencies, states, territories, and<br />
commonwealths, universities, research institutes, and the private sector.<br />
The primary outcomes have included: (1) comprehensive and detailed benthic habitat maps for many areas<br />
of coral reef in U.S. waters (see Table 18.1); (2) hierarchical habitat classification schemes and methods<br />
manuals; (3) advancement of research methods for the digital classification of remotely sensed data for coral<br />
reef mapping; and (4) utilization of the map-based data in ecological studies. Products and methods are readily<br />
accessible online (http://biogeo.nos.noaa.gov/products, Accessed 02/28/05) and are designed to provide a
The State of Coral Reef Ecosystems of the United States and Freely Associated States: <strong>2005</strong><br />
Table 18.1. Status of NOS’s shallow-water coral reef ecosystem mapping activities that use satellite and aerial imagery to delineate<br />
benthic habitats in tropical and subtropical U.S. waters as of January <strong>2005</strong>.<br />
REGION<br />
AREA (km 2 ) <strong>OF</strong><br />
SHALLOW-WATER<br />
(≤ 10 FM) *<br />
AREA (km 2 ) <strong>OF</strong><br />
SHALLOW-WATER<br />
MAPPED PROJECT STATUS<br />
U.S. Virgin Islands 344 318 Completed 2001<br />
Puerto Rico 2,302 1,837 Completed 2001<br />
Navassa 3 0 Planned<br />
Florida 30,801 5,023; 0<br />
Flower Garden Banks 0 0 In progress<br />
Florida Keys maps completed in 1998; larger effort<br />
to map South Florida planned for 2006-2009<br />
Main Hawaiian Islands 1,231 681; 0 Initial effort completed 2003; larger effort in progress<br />
Northwestern Hawaiian Islands 1,595 1,238 Completed 2003<br />
American Samoa 55 39 Completed 2004<br />
Pacific Remote Island Areas 252 0 Planned<br />
Marshall Islands 13,456 0 Planned<br />
Federated States of Micronesia 14,517 0 Planned<br />
Northern Mariana Islands 124 111 Completed 2004<br />
Guam 108 84 Completed 2004<br />
Palau 2,529 0 In progress<br />
* Estimate of shallow-water area from Rohmann et al., in press.<br />
spatial framework with which to implement and integrate research programs and provide the capability to<br />
effectively communicate information and results to coral reef ecosystem managers (Figure 18.1).<br />
The digital shallow-water benthic habitat maps described above were primarily created through visual<br />
interpretation of aerial photographs and satellite imagery. However, some coral reef ecosystems, such as<br />
those in areas of high turbidity or deeper than about 30 m, do not lend themselves to a method based on visual<br />
interpretation. In such cases, efforts have been undertaken to map benthic habitats utilizing complementary<br />
methods, often through the use of multibeam sonar technology. For example, NOS and its partners have<br />
undertaken two mapping missions (in 2004 and <strong>2005</strong>) to characterize deeper areas in the U.S. Virgin Islands<br />
(USVI) near Buck Island Reef National Monument in St. Croix and along the mid-shelf reef south of St. John<br />
and St. Thomas. The cumulative result of these and other efforts will be continuous map coverage of benthic<br />
cover and bathymetry from the shoreline to deep water areas beyond the insular shelf.<br />
In the Pacific Islands region, significant<br />
efforts are also underway to integrate<br />
shallow-water maps with multibeam<br />
sonar data in areas deeper than 20<br />
m (Figure 18.1). Since 2000, NOAA’s<br />
Pacific Islands Fisheries Science<br />
Center’s Coral Reef Ecosystem<br />
Division (PIFSC-CRED) has been<br />
conducting benthic habitat mapping<br />
in the Northwestern Hawaiian Islands<br />
(NWHI), Main Hawaiian Islands<br />
(MHI), Territory of American Samoa,<br />
Territory of Guam, Commonwealth<br />
of the Mariana Islands (CNMI), and<br />
Pacific Remote Island Areas (PRIAs)<br />
of Baker, Howland, Jarvis, Kingman,<br />
Palmyra, and Wake Islands. Benthic<br />
habitat mapping activities in 20-200<br />
m include the use of single-beam and<br />
Figure 18.1. Multibeam shaded bathymetry maps (5 m resolution) of areas of American<br />
Samoa will facilitate better resource management. Source: PIFSC-CRED.<br />
National Summary<br />
page<br />
509
National Summary<br />
page<br />
510<br />
The State of Coral Reef Ecosystems of the United States and Freely Associated States: <strong>2005</strong><br />
multibeam sonar instruments and bottom camera towing. In <strong>2005</strong>, two multibeam sonars were installed on<br />
the recently commissioned NOAA vessel Hi’ialakai. These sonars will increase NOAA’s Pacific multibeam<br />
mapping capabilities to waters deeper than 200 m; multibeam mapping in the MHI and PRIAs will commence<br />
in <strong>2005</strong>. Table 18.2 provides a summary of Pacific benthic habitat mapping activities conducted by PIFSC-<br />
CRED.<br />
Table 18.2. Status of PIFSC-CRED multibeam mapping activities in the Pacific Islands from 2002-<strong>2005</strong>. Source: PIFSC-CRED.<br />
REGION<br />
ESTIMATED AREA<br />
WITH WATER<br />
DEPTHS <strong>OF</strong><br />
20-200 M (km 2 )<br />
AREA WITH<br />
WATER DEPTHS <strong>OF</strong><br />
20-200 M<br />
MAPPED (km 2 )<br />
Main Hawaiian Islands 36,261 * *Synthesis Underway<br />
Northwestern Hawaiian Islands 58,602 13,640<br />
American Samoa 1,556 271<br />
Guam and the Commonwealth<br />
of the Northern Mariana Islands<br />
30,464 244<br />
MULTIBEAM PROJECT STATUS<br />
Mapping cruises undertaken in 2002 and 2004;<br />
+25,727 km 2 mapped;<br />
Approximately 100 mapping days planned in <strong>2005</strong>.<br />
Mapping cruise undertaken in 2004;<br />
Approximately 45 mapping days planned in 2006.<br />
Mapping cruise undertaken in 2003;<br />
Saipan anchorage analysis and report expected in<br />
May <strong>2005</strong>;<br />
Approximately 45 mapping days planned in 2006.<br />
Assessing, monitoring, and forecasting coral reef ecosystem condition<br />
As part of the National Action Plan to Conserve Coral Reefs, USCRTF members solicited extensive input<br />
from government agencies, non-governmental organizations, academic scientists, resource managers, and<br />
other stakeholders to identify key threats (see ‘Threats and Stressors’ chapter) to coral reef ecosystems. The<br />
perceived level of each of these key threats was then evaluated for all jurisdictions (Turgeon et al., 2002).<br />
Results of this effort were also published in the inaugural State of the Coral Reef Ecosystems of the United<br />
States and Pacific Freely Associated States report (Turgeon et al., 2002). In this report, threats were again<br />
evaluated to allow comparison with the 2002 information (Table 18.3). This current information provides an<br />
overview of the suite of key threats for each jurisdiction, their relative importance, and the direction of change,<br />
if any, since 2002.<br />
According to expert opinion, 74% of all threats across all jurisdictions remain unchanged from 2002 to 2004, of<br />
which 24% remain a high level threat, 24% remain a medium level threat, and 52% remain a low level threat.<br />
Twenty-six percent of all threats were perceived to have changed since 2002, of which 18% decreased in threat<br />
level and 8% increased in threat level. High level threats to coral reef ecosystems, across all jurisdictions, were<br />
considered to have decreased by approximately 6% since 2002 (Table 18.3). Fifty percent of all decreases<br />
were changes from a medium to a low threat and 15% were changes from high to low threat levels. The<br />
majority (60%) of increases was from a low to medium threat, and 26% increased from a medium to a high<br />
threat. Only one jurisdiction, Guam, exhibited a change in threat level from low to high, although this appeared<br />
to represent an anticipated increase in climate change-related coral bleaching.<br />
Across all jurisdictions, eight of 14 threat categories were perceived to have decreased in severity since<br />
2002: coastal pollution; trade in coral and live reef species; marine debris; security training activities; and<br />
ships, boats, and groundings. Four threat categories were perceived to have increased in severity since 2002:<br />
fishing; climate change and coral bleaching; tropical storms; and diseases. Across all jurisdictions, there was<br />
no net change in the perceived threat for oil and gas exploration or tourism and recreation. Within jurisdictions,<br />
Table 18.3. A comparison of the 2002 and 2004 perceived levels of threat to coral reef ecosystems in the U.S. and FAS, based on<br />
expert opinion. Red squares represent high threat (2 points), orange represents moderate threat (1 point), and yellow represents little<br />
or no threat (0 points). Scores were tallied horizontally to calculate the level of threat from individual stressors across jurisdictions and<br />
vertically to calculate overall threat by jurisdiction for all stressors combined. Red arrows indicate a net increase in threat level,and<br />
green arrows indicate a net decrease in threat level. Horizontal bars indicate no change. Only data for 2004 are available for Navassa.<br />
*Following the 2000 census, population growth emerged as a major issue in American Samoa; although this issue is highlighted in<br />
the ‘Other’ section of that chapter, the high threat rating was assigned to the Coastal Development and Runoff threat to be consistent<br />
within the table. **For CNMI, 2002 data were based on the southern islands only, while 2004 data include the northern islands; the<br />
perceived threat for the southern islands did not change from 2002 to 2004. Note: The actual impacts of each threat category will likely<br />
vary widely within and among regions.
USVI<br />
Puerto Rico<br />
Navassa<br />
Florida<br />
Flower Gardens Banks<br />
MHI<br />
NWHI<br />
American Samoa<br />
PRIAs<br />
Marshall Islands<br />
Federated States of Micronesia<br />
CNMI<br />
Guam<br />
Palau<br />
**<br />
Stressor Change Assessment<br />
The State of Coral Reef Ecosystems of the United States and Freely Associated States: <strong>2005</strong><br />
Climate change & coral bleaching<br />
Diseases<br />
Tropical storms<br />
Coastal development and runoff<br />
Coastal pollution<br />
Tourism and recreation<br />
Fishing<br />
2002 � � � � � � � � � � � � � � 14<br />
2004 � � � � � � � � � � � � � � 16<br />
2002 � � � � � � � � � � � � � � 18<br />
2004 � � � � � � � � � � � � � � 11<br />
2002<br />
2004 � � � � � � � � � � � � � � 4<br />
2002 � � � � � � � � � � � � � � 17<br />
2004 � � � � � � � � � � � � � � 18<br />
2002 � � � � � � � � � � � � � � 3<br />
2004 � � � � � � � � � � � � � � 4<br />
2002 � � � � � � � � � � � � � � 17<br />
2004 � � � � � � � � � � � � � � 17<br />
2002 � � � � � � � � � � � � � � 9<br />
2004 � � � � � � � � � � � � � � 5<br />
2002 � � � � � � � � � � � � � � 11<br />
2004 � � � � � � � � � � � � � �* 9<br />
2002 � � � � � � � � � � � � � � 7<br />
2004 � � � � � � � � � � � � � � 5<br />
2002 � � � � � � � � � � � � � � 8<br />
2004 � � � � � � � � � � � � � � 7<br />
2002 � � � � � � � � � � � � � � 11<br />
2004 � � � � � � � � � � � � � � 6<br />
2002 � � � � � � � � � � � � � � 14<br />
2004 � � � � � � � � � � � � � � 9<br />
2002 � � � � � � � � � � � � � � 8<br />
2004 � � � � � � � � � � � � � � 13<br />
2002 � � � � � � � � � � � � � � 11<br />
2004 � � � � � � � � � � � � � � 6<br />
2002 12 6 7 19 17 9 18 9 17 10 10 5 1 8<br />
2004 16 7 8 18 11 9 20 5 13 7 5 2 1 4<br />
∆ (2002 to 2004) � � � � � - � � � � � � - �<br />
Temporal Composite Threat � � � � � � � � � � � � � �<br />
Trade in coral and live reef species<br />
Ships, boats, and groundings<br />
<strong>Marine</strong> debris<br />
Aquatic invasive species<br />
Security training activities<br />
Offshore oil and gas exploration<br />
Other<br />
Jurisdictional Composite Trend<br />
∆ (2002 to 2004)<br />
�<br />
�<br />
N/A<br />
�<br />
�<br />
-<br />
�<br />
�<br />
�<br />
�<br />
�<br />
�<br />
�<br />
�<br />
National Summary<br />
page<br />
511
National Summary<br />
page<br />
512<br />
The State of Coral Reef Ecosystems of the United States and Freely Associated States: <strong>2005</strong><br />
eight of 14 jurisdictions perceived an overall decline in the severity of threats since 2002; four perceived<br />
an overall increase in threat; and two jurisdictions were perceived no net change. Threats decreased most<br />
for Puerto Rico, where coastal pollution, disease, trade in coral and live reef species, and security training<br />
activities were considered less severe in 2004. The Federated States of Micronesia (FSM), NWHI, PRIAs,<br />
CNMI, Palau, American Samoa, and the Marshall Islands also reported overall decreases in threats to coral<br />
reef ecosystems for 2004.<br />
Perceived threats have increased the most in Guam and USVI, followed by Florida and Flower Garden Banks.<br />
In Guam, threats from climate change-related bleaching events, tourism and recreation, fishing, and marine<br />
debris are perceived to have increased since 2002. In the USVI, threats from tourism and recreation as well<br />
as marine debris are perceived to have increased since 2002. In Florida, the increase was represented solely<br />
by a perceived increase in threat from human activity in the “Other” category, which included cable laying<br />
operations. In both the MHI and American Samoa, high threat levels remained unchanged since 2002.<br />
Of particular concern was the impact of fishing on coral reef ecosystems. Fishing was reported as a high<br />
level threat for eight jurisdictions and a medium level threat for the other six jurisdictions, thereby supporting<br />
conclusions in several other international reports that have highlighted fishing as a major threat to coral reef<br />
ecosystems (Burke and Maidens, 2004; Turgeon et al., 2002; Wilkinson, 2002, 2004). Furthermore, experts<br />
who contributed to this report perceived that the threat from fishing has increased since 2002. In addition, for<br />
all jurisdictions except the most remote islands, land-based human activity (coastal development and runoff,<br />
coastal pollution) was a medium to high level threat, which also supported the conclusions of other reports<br />
(Bryant et al., 1998; Turgeon et al., 2002; Wilkinson 2002, 2004). However, in contrast to nonpoint source<br />
pollution from runoff, the threat of coastal pollution from point sources was considered to have decreased<br />
overall since 2002, especially in Puerto Rico, American Samoa, Palau, and CNMI.<br />
Perceived threat levels were designated through the expert opinion of writing teams with extensive local<br />
knowledge. However, interpretations of the perceived threat levels must be undertaken with some knowledge<br />
of the caveats associated with this type of information. For instance, the number of threats impacting a region<br />
may not accurately reflect the magnitude of the combined threats. Trade in coral and live reef species may have<br />
less overall impact on the coral reef ecosystems of the MHI than does the impact of fishing, yet they are both<br />
tabulated equally as a high threat. Furthermore, it is difficult to make a definitive assessment accounting for<br />
the combined impacts of multiple stressors, as each has a variety of manifestations in coral reef environments.<br />
As such, it also is important to interpret the perceived impact change for each threat independently, and to look<br />
for context and corroborating evidence in each of the jurisdictional chapters. In addition, while most perceived<br />
threat levels were based on data from rigorous monitoring programs, some were based on more casual and<br />
infrequent observations. Also, many of the jurisdictions included in this report are comprised of a number of<br />
islands, ranging in population density and human activity. Therefore, assessments of perceived threat may, in<br />
fact, refer only to a region within a jurisdiction. For example, American Samoa is comprised of six islands, yet<br />
most of the population resides on one island.<br />
Monitoring through a continued program of surveys, systematically undertaken to provide a series of observations<br />
over time, is an important process in understanding and reducing threats to coral reef ecosystems. Monitoring<br />
can also be used to evaluate the effectiveness of specific management strategies, evaluate restoration<br />
projects, and serve as an early warning system for identifying declines in ecosystem health. The USCRTF<br />
National Action Plan to Conserve Coral Reefs calls for a coordinated national program to assess, inventory,<br />
and monitor the health of U.S. coral reef ecosystems.<br />
For this report, monitoring programs across jurisdictions were characterized using a checklist of biotic and<br />
abiotic variables including indicators of water quality, indicators of the condition of the benthos, and abundance<br />
patterns of ecologically and economically important marine animals (Table 18.4). This selection represents a<br />
wide range of variables that are: (1) well-documented as indicators of specific stressors; (2) likely to be of<br />
concern if levels change markedly; (3) can be used to define a desired biological condition; and (4) may<br />
contribute to the development of an index of biotic integrity. These variables are also easily quantified and<br />
widely used in marine monitoring programs, thereby facilitating comparisons through time and space. Many<br />
other variables were also measured; however, these 15 were the most widely used across the jurisdictions.
The State of Coral Reef Ecosystems of the United States and Freely Associated States: <strong>2005</strong><br />
Table 18.4. Key biotic and abiotic variables included within marine monitoring programs across jurisdictions. Circles indicate variables<br />
reported in this report. Data collection may occur at a single location on a single occasion or multiple locations on multiple occasions.<br />
Turbidity<br />
WATER QUALITY BENTHOS ASSOCIATED BIOTA<br />
DO<br />
Chlorophyll<br />
Nutrients<br />
Bacteria<br />
Live coral % cover<br />
USVI � � � � � � � � � � � � � � 93<br />
Puerto Rico � � � � � � � � � � � � 80<br />
Navassa � � � � � � � � � � � 73<br />
Florida � � � � � � � � � � � � � � 93<br />
Flower Gardens Banks � � � � � � � � � � � � � 87<br />
MHI � � � � � � � � � � � � � � 93<br />
NWHI � � � � � � � � � � � � � 87<br />
American Samoa � � � � � � � � � � � � � � 93<br />
PRIAs � � � � � � � � � � � � 80<br />
Marshall Islands � � � � � � � � � 60<br />
FSM � � � � � � � � � 60<br />
CNMI � � � � � � � � � � � � � � 93<br />
Guam � � � � � � � � � � � � � 87<br />
Palau � � � � � � � � � � 67<br />
% of jurisdictions currently monitoring<br />
each key variable<br />
86 86 50 64 57 100 50 100 86 86 100 100 93 86 79<br />
Examination of the monitoring programs detailed in this report indicates that water quality variables were less<br />
widely monitored than benthic variables and associated biota. For example, fewer than half of the jurisdictions<br />
measured chlorophyll concentrations, but all monitored percentage live coral cover and all but one measured<br />
percentage algal cover and fish abundance. Overall, remote islands (excluding the MHI) were monitored less<br />
frequently than other regions. For example, Navassa and the Marshall Islands did not report monitoring of water<br />
quality variables, while the MHI reported monitoring most of the water quality, benthic, and associated biotic<br />
variables. Importantly, the frequency of sampling, which in some regions was sporadic, has been identified as<br />
a major limitation in the interpretation of monitoring data. Furthermore, this suite of variables (Table 18.4) will<br />
form the basis for more detailed analyses in future assessments of the status of coral reef ecosystems.<br />
Coral recruitment<br />
Algal % cover<br />
Coral disease<br />
Coral bleaching<br />
FIsh abundance<br />
Commercially important fish<br />
Ecologically important macroinvertebrates<br />
Commercially important macroinvertebrates<br />
Protected species<br />
% of key variables currently being monitored<br />
National Summary<br />
page<br />
513
National Summary<br />
page<br />
514<br />
The State of Coral Reef Ecosystems of the United States and Freely Associated States: <strong>2005</strong><br />
Improving the use of marine protected areas in coral reef ecosystems<br />
MPAs are being used nationally and internationally as management tools to protect, maintain, or restore<br />
natural and cultural resources in coastal and marine waters (Salm et al., 2000). Examples of MPAs in the U.S.<br />
include national marine sanctuaries, parks and wildlife refuges, national seashores, historical monuments,<br />
marine reserves, fish reserves, ecosystem reserves, conservation areas, sanctuaries, research reserves,<br />
spawning sites, and other critical habitats. Executive Order 13158 defines a MPA as “any area of the marine<br />
environment that has been reserved by Federal, State, tribal, territorial, or local laws or regulations to provide<br />
lasting protection for part or all of the natural and cultural resources therein” (Federal Register, 2000). As such,<br />
the term MPA encompasses a wide variety of approaches to place-based management ranging from complex<br />
multi-use strategies, to areas with restrictions on specific types of fishing gear and research reserves with no<br />
public access. Most MPAs in the U.S. have one or more conservation goals that focus on natural heritage,<br />
cultural heritage, and/or sustainable production of marine resources. These conservation goals are generally<br />
derived from the site’s statutory mandate and are reflected in the implementing regulations and management<br />
plan (National MPA Center, http://mpa.gov/mpa_center/about_mpa_center.html, Accessed 01/10/05). The two<br />
primary approaches to protection are multiple-use or no-take. Typically, a multiple-use approach requires<br />
zoning, with each zone varying in<br />
the types of activities permitted.<br />
<strong>Marine</strong> zoning is being implemented<br />
in the Florida Keys National <strong>Marine</strong><br />
Sanctuary (FKNMS) to assist in the<br />
protection of ecologically important<br />
areas by ensuring that human activity<br />
is dispersed in a way that avoids<br />
concentrating impacts on the heavily<br />
used coral reefs and minimizes<br />
user conflicts (Figure 18.2). Zone<br />
types include wildlife management<br />
areas to minimize disturbance to<br />
sensitive wildlife and their habitats;<br />
ecological reserves to protect diverse<br />
habitats that are both large and<br />
contiguous; sanctuary preservation<br />
areas to protect heavily used reefs;<br />
and special-use areas for scientific<br />
research, education, restoration, or<br />
monitoring.<br />
Figure 18.2. A marine zoning plan is being implemented in the FKNMS to protect sensitive<br />
habitats and minimize conflicts among various user groups. Source: FKNMS,<br />
http://www.floridakeys.noaa.gov/regs/zoning.html, Accessed 02/28/05.<br />
A very small portion of U.S. waters are currently designated as no-take areas (National MPA Center, http://mpa.<br />
gov/information_tools/<strong>pdf</strong>/Factsheets/mpamisconceptions2.<strong>pdf</strong>, Accessed 04/04/05). In Guam, approximately<br />
11.8% of the coastline has been designated as no-take to protect habitat and allow fish populations, particularly<br />
fisheries species, to recover. In these preserves, fishing is either prohibited or restricted to certain cultural use<br />
practices that do not threaten restoration goals. No-take zones have often proven successful in protecting<br />
and enhancing reef fish populations within protected areas, and in some cases, significant spillover effects in<br />
neighboring areas have also been reported (Gell and Roberts, 2002; Halpern and Warner, 2002, 2003; Russ<br />
and Alcala, 2004; Williamson et al., 2004).<br />
The National MPA Center is compiling a reference database of marine managed areas (MMA) under U.S.<br />
jurisdiction. MMAs encompass a broader spectrum of management purposes, including protection of<br />
geological, cultural, or recreational resources that may not fall under the official U.S. definition of MPAs (MMA<br />
Inventory Database, http://mpa.gov/inventory/about_inventory.html, Accessed 04/20/05). MMAs exist in all of<br />
the jurisdictions containing coral reef ecosystems and are the subject of a forthcoming NOAA report. Individual<br />
protected areas in coral reef ecosystems range in size from the 0.05 km 2 national wildlife refuge at Green<br />
Cay near St. Croix, USVI to the NWHI Coral Reef Ecosystem Reserve, which covers an area of more than<br />
347,000 km 2 . Although several areas are large, many are less than 10 km 2 (MMA Inventory Database, http://<br />
mpa.gov/inventory/about_inventory.html, Accessed 04/20/05). The size of a MPA is important in relation to the
The State of Coral Reef Ecosystems of the United States and Freely Associated States: <strong>2005</strong><br />
diversity and quantity of habitat types protected and the life cycle movement patterns of the species of interest<br />
(Botsford et al., 2003; Halpern and Warner, 2003; Pittman and McAlpine, 2003).<br />
Executive Order 13158 requires relevant agencies to “develop a national system of MPAs” and to “strengthen<br />
the management, protection, and conservation of existing marine protected areas and establish new or<br />
expanded MPAs.” Central to the success of a MPA network is sustained participation by key stakeholder groups,<br />
particularly local communities, in all phases of the design, implementation, and evaluation of the system. In<br />
response to the Executive Order, work is underway in the U.S. to ensure representation of major coral reef<br />
habitat types and communities in a national system of MPAs. Traditionally, MPAs have not been established<br />
specifically to function as part of a network, although in some areas they may already provide connectivity and<br />
adequately represent the full range of habitat types. The National Research Council’s review of 32 studies<br />
estimating the area of marine reserves required to achieve a wide range of conservation or management<br />
objectives found that 26 studies recommended areas in the range of 10-40% of all marine habitats (NRC,<br />
2001). Interconnected networks that protect the same species and habitat types through replication in several<br />
different sites are likely to increase their resilience to disturbance and boost subsequent recovery through<br />
the provision of new recruits. Furthermore, it has been acknowledged that adaptive management, a process<br />
for continually improving management policies and practices by incorporating the results of past actions, is<br />
needed to monitor and evaluate the adequacy of the design of MPAs for the level of protection provided and<br />
efficacy with regard to protecting and improving ecosystem structure and function (USCRTF Working Group<br />
on Ecosystem Science and Conservation, http://www.coralreef.gov/whycare/ecowg/marinepro.html, Accessed<br />
05/02/05).<br />
To coordinate its implementation, the Executive Order directed NOAA to create the National MPA Center in<br />
collaboration with the U.S. Department of the Interior. The MPA Center, headquartered in Silver Spring, Maryland,<br />
is responsible for consultation, coordination, outreach, and education related to MPAs. The headquarters<br />
staff also support the MPA Federal Advisory Committee, which consists of 30 stakeholder representatives<br />
appointed by the Secretary of the U.S. Department of Commerce. MPA Center regional liaisons are located<br />
in Boston, Massachusetts; Monterey, California; and Honolulu, Hawaii. The MPA Center’s Science Institute,<br />
with offices in Santa Cruz and Monterey, California, focuses on bringing sound science into the MPA policy<br />
arena. It fosters targeted research, assessment, and policy analysis on aspects of the design, management,<br />
and evaluation of MPAs. The MPA Center’s Training and Technical Assistance Institute in Charleston, South<br />
Carolina provides training, needs assessments, and technical support to managers and stakeholders involved<br />
in MPAs. Information on individual MMAs, including a general description and site characteristics such as<br />
location, purpose, and type of site, as well as detailed information on natural and cultural resources, legal<br />
authorities, site management, regulations, and restrictions, are available through the MPA Center’s on-line<br />
database (MMA Inventory Database, http://mpa.gov/inventory/about_inventory.html, Accessed 01/10/05).<br />
The USCRTF has also called for strengthening and expanding the Nation’s existing networks of coral reef<br />
MPAs and increasing the effectiveness of existing MPAs as part of the National Action Plan to Conserve Coral<br />
Reefs (USCRTF 2000) and NCRAS (2002). Since 2000, USCRTF members have made progress towards<br />
these goals. Between 2000-2003, for example, 26 new MPAs and reserves have been established in several<br />
jurisdictions including the USVI, Hawaii, Puerto Rico, American Samoa, and CNMI. USCRTF members have<br />
also conducted activities to strengthen effectiveness of existing coral reef MPAs, including the creation or<br />
revision of management plans for coral reef MPAs in Florida, Hawaii, and Puerto Rico.<br />
Reducing adverse impacts of fishing and other extractive uses<br />
In almost all jurisdictions, fishing is an important activity often with a long history and strongly integrated<br />
into the culture. Fishing provides food, supplemental income, recreation, and full-time employment for many<br />
people. In Palau, for example, surveys showed that 87% of households had someone that fishes either for<br />
subsistence or commercial purposes. However, catches from recreational and subsistence fishing are rarely<br />
reported or factored into estimates of total catch and in many locations are thought to exceed the commercial<br />
reef fisheries catch (F. Magron, pers. comm.).<br />
Experts across all 14 jurisdictions perceived fishing as a medium (6) or high (8) threat to coral reef ecosystems.<br />
Reducing the adverse impacts of fishing, therefore, is critical to reducing the overall threat to coral reef<br />
National Summary<br />
page<br />
515
National Summary<br />
page<br />
516<br />
The State of Coral Reef Ecosystems of the United States and Freely Associated States: <strong>2005</strong><br />
ecosystems. Adverse impacts<br />
include the alteration of the faunal<br />
community structure and composition<br />
through direct removal of fauna<br />
and the physical damage to benthic<br />
habitats through various methods of<br />
extraction. Abandoned fishing gear<br />
is also of major concern in some<br />
jurisdictions, as derelict traps and nets<br />
continue to capture fish, mammals,<br />
and turtles over time (Figure 18.3).<br />
Significant declines, low abundance,<br />
or a conspicuous absence of largebodied<br />
species, specifically of species<br />
targeted by fisheries, were reported<br />
in many regions, even in relatively<br />
remote areas. For instance, largebodied<br />
and commercially valuable<br />
groupers that were once considered<br />
an important component of the fishery<br />
catch around Kosrae in the FSM are<br />
Figure 18.3. A derelict fish trap encountered on the bank shelf south of St. John in<br />
<strong>2005</strong>. Photo: M. Kendall.<br />
no longer seen in the area. Declines in large-bodied target species were also reported in areas where the<br />
fisheries were considered to be in good condition overall. In some areas, however, no baseline data exist to<br />
adequately evaluate their status. At Navassa Island, commercial and recreational fisheries are unmanaged<br />
despite its status as a national wildlife refuge.<br />
A wide range of management activities and tools have been developed and implemented to address the impacts<br />
of fishing, and preliminary results presented in this report suggest that many have been effective in providing<br />
protection for coral reef ecosystems and promoting recovery in local fisheries. For example, in response to<br />
substantial declines in its fishery, the Puerto Rico government enacted new regulations, such as improving<br />
licensing; prohibiting spearfishing using scuba equipment; eliminating beach seining; and establishing size<br />
limits and daily quotas on several species. Elsewhere, closures have been used with measurable success.<br />
For example, in the USVI, an important red hind (Epinephelus guttatus) spawning aggregation site south of<br />
St. Thomas was closed in 1990, and by 2003 the average length of red hind landed had increased by 8 cm.<br />
Recent observations in the USVI also reveal that several species of grouper including the Nassau grouper (E.<br />
striatus) are re-establishing spawning aggregations, although these currently occur in unprotected areas and<br />
are being targeted by local fishers.<br />
Reserves have been established in most jurisdictions and measures to reduce fishing pressure have been<br />
implemented on several levels, ranging from closures to limits on fish size or abundance. The FKNMS has<br />
numerous management zones, some of which restrict or prohibit fishing. Fisheries for Nassau grouper (E.<br />
striatus), goliath grouper (E. itajara), queen conch (Strombus gigas), and stony corals (Scleractinia spp.) are<br />
closed there. Enforcement and effectiveness of MPAs are the major concerns in most jurisdictions. Reserves<br />
have enhanced recovery of local fish communities in Hawaii, Puerto Rico, and the USVI, and are currently being<br />
assessed in Guam and Palau. A broad consensus of expert opinion across jurisdictions highlights the need<br />
for greater measures of enforcement to improve MPA effectiveness. In Hawaii, for example, a major concern<br />
of fishers is a perceived lack of adequate enforcement of fishing and marine resource laws. However, despite<br />
illegal fishing in no-take preserves of Guam, significant increases in fish abundance have been recorded.<br />
Mitigation activities, such as stock enhancement, artificial reef deployment, and installation of fish aggregating<br />
devices (FADs), have also been used to address fishing impacts. Stock enhancement and artificial reefs were<br />
used to improve catch at specific locations, while FADs were used to encourage a shift in fishing pressure from<br />
sensitive, overexploited reef fish populations to pelagic non-reef species. These and other opportunities to<br />
reduce adverse impacts of fishing and other extractive uses on coral reefs should be explored and monitored<br />
for efficacy.
The State of Coral Reef Ecosystems of the United States and Freely Associated States: <strong>2005</strong><br />
To restrict the harvesting of coral and live reef species, regulations have been passed in the CNMI, Flower<br />
Garden Banks, Hawaii, PRIAs, Palau, and USVI, while Puerto Rico plans to design management strategies<br />
to address the high exportation of aquarium trade target species. Catch and export data for the trade in live<br />
reef animals are limited, often with no monitoring even in areas with a significant industry. Where data are<br />
collected, catch is often considered to be underreported. After analyzing the results of several surveys, Puerto<br />
Rico is proposing a stock assessment and management strategy to address export of live reef species. In<br />
Hawaii, a network of fish replenishment areas established to ensure sustainability of the aquarium fishery has<br />
demonstrated success, with increases in the abundance of several targeted species.<br />
Restoring damaged coral reef ecosystems<br />
Coral reefs worldwide are experiencing increasing pressure from a multitude of stressors that have resulted<br />
in adverse changes to ecosystem structure and function. Although protection and conservation of coral reef<br />
habitats are the preferred approaches, restoration of damaged habitats is an additional tool that may be utilized<br />
in cases of physical damage (e.g., ship groundings) to enhance coral ecosystem recovery. Efforts to increase<br />
protection of coral reef ecosystems need to be supported by strategies designed to restore functionality<br />
and structural integrity to damaged and disturbed habitats. Restoration can be defined as “the process<br />
of reestablishing a self-sustaining habitat that closely resembles a natural condition in terms of structure<br />
and function” (NOAA, 2003) and must include consideration of the integrity of the surrounding landscape.<br />
Restoration of habitats in a coral reef ecosystem is a multidisciplinary effort that includes managers and<br />
policymakers and must be supported with hypothesis-driven ecological studies and quantitative long-term<br />
monitoring programs.<br />
Clearly defined goals are essential for restoration. Key restoration goals that have been used in wetlands are<br />
applicable to the restoration of coral reef ecosystems (as well as rocky intertidal, mangrove, and seagrass<br />
ecosystems). These include attempting to restore essential ecological processes, integrating the project<br />
with its surroundings, and creating a persistent and resilient system. Generally, restoration should result in<br />
the historic ecosystem type, but it may not always result in the historic biological community and structure.<br />
Therefore, development of structural and functional objectives and performance standards for achievement<br />
should include consideration of these potential departures from pre-injury conditions (SWS, 2000).<br />
Despite the broad scope of stressors that a coral reef ecosystem can encounter, restoration efforts have<br />
focused more on physical injuries of anthropogenic origin and of a clearly defined nature, such as vessel<br />
groundings. One example of a resource injury documentation and restoration process is in the FKNMS, where<br />
vessel groundings have damaged<br />
over 12,000 ha and pose a major<br />
threat to coral reefs and seagrass<br />
beds (FKNMS, 1996). In the FKNMS,<br />
depending on the extent of the injury,<br />
a vessel grounding can initiate a<br />
sequence of restoration activities<br />
that includes injury assessment,<br />
emergency triage and/or stabilization,<br />
possible litigation between the<br />
trustee (or primary management<br />
entity) and the responsible party, and<br />
a restoration project (Figure 18.4;<br />
Precht et al., 2003). Acting as trustees<br />
for the FKNMS, NOAA and the State<br />
of Florida have the legal authority to<br />
seek monetary damages for injury to<br />
these resources under the National<br />
<strong>Marine</strong> Sanctuaries Act (16 U.S.C. §<br />
1441 et seq.). This Act charges the<br />
national marine sanctuaries with a<br />
Figure 18.4. Restoration of seagrass beds damaged by a vessel grounding required<br />
the addition of gravel substrate at Calda Bank off Key West, Florida. Photo: A. Farrer.<br />
National Summary<br />
page<br />
517
National Summary<br />
page<br />
518<br />
The State of Coral Reef Ecosystems of the United States and Freely Associated States: <strong>2005</strong><br />
“strong legal mandate to procure compensatory restoration and an established economic process to calculate<br />
damages” (16 U.S.C.§ 1443). The process now entails: 1) collection of a monetary damage claim (Shutler<br />
et al., in review) to restore damaged natural resources to a condition as close as possible to their pre-injury<br />
condition (i.e., primary restoration), and 2) public compensation for the lost use of those resources until such<br />
time as those resources have fully recovered (i.e., compensatory restoration). NOAA has adopted a protocol<br />
called the Habitat Equivalency Analysis (HEA) to determine the amount of compensation required for such<br />
injuries. HEA combines biological and economic principles to calculate ecosystem services lost in the interim<br />
between the time of the injury and return to baseline conditions (NOAA, 2000b). Losses are calculated in<br />
perpetuity if no recovery is expected (NOAA, 2000b). The HEA calculation requires an estimate of the time it<br />
takes for the injured services to recover, as well as the shape of that recovery function (Fonseca et al., 2000,<br />
2004).<br />
Computer models have been used successfuly to generate recovery horizons for use with the HEA method<br />
to prosecute injury cases in Federal courts. A recovery model can also be used as a null model for habitat<br />
restoration. In this way, projected recovery horizons can be used to evaluate the effectiveness of a no-action<br />
restoration alternative. Recovery prediction models could also be adapted to project recovery from other<br />
types of environmental stressors. To date, this type of model has been used for predictions of seagrass injury<br />
recovery (Fonseca et al., 2000), and is under development for application to coral reefs (Whitfield et al., 2001;<br />
Fonseca et al., 2003).<br />
Restoration techniques for physical injuries of anthropogenic origin on coral reefs, seagrass meadows, and<br />
mangrove forests are based on the<br />
same general concepts: assessment<br />
and mapping of the injury, site<br />
stabilization, structural replacement<br />
or enhancement if necessary,<br />
transplanting, and monitoring. The<br />
preferred and selected restoration<br />
actions are extremely dependent on<br />
the type and scale of injury as well as<br />
specific environmental factors (e.g.<br />
current, sediment type). A large-scale<br />
coral reef injury can not only damage<br />
living coral, but also remove physical<br />
reef structure, causing habitat loss<br />
and reduction in substrate for new<br />
recruitment. Some techniques that<br />
have been used to replace biotic<br />
structure after an injury include<br />
the use of artificial structures such<br />
as limestone boulders, concrete<br />
revetment mats, or structures of<br />
various custom designs (NOAA,<br />
2000a, 2002). Materials that have<br />
been used to stabilize loose coral<br />
include epoxy, concrete, wire ties,<br />
or cable ties (Figure 18.5). Coral<br />
colonies may be transplanted onto<br />
the artificial structures. Effective<br />
seagrass restoration techniques<br />
include filling the injury to grade<br />
(Figure 18.6), transplanting seagrass<br />
into the injured area, and increasing<br />
nutrient availability to enhance<br />
species succession in the area using Figure 18.5. Living coral fragments are attached to a reef by a diver using wire ties.<br />
Photo: NOAA Restoration Center.
ird stakes. The generally accepted<br />
technique for mangrove habitat<br />
restoration is seedling planting<br />
(Ellison, 2000). Because the driving<br />
factor for mangrove ecosystem<br />
structure and function is the hydrologic<br />
regime, site stabilization may also be<br />
incorporated into a restoration project<br />
(Ellison, 2000).<br />
The implementation of restoration<br />
projects would be incomplete without<br />
a process to monitor and evaluate<br />
their effectiveness. Restoration<br />
monitoring has been defined<br />
by Thayer et al. (2003) as “the<br />
systematic collection and analysis of<br />
data that provides information useful<br />
for measuring project performance at<br />
a variety of scales (locally, regionally,<br />
The State of Coral Reef Ecosystems of the United States and Freely Associated States: <strong>2005</strong><br />
Figure 18.6. The addition of gravel to a grounding site in the Florida Keys levels the<br />
injury area to grade and provides a substrate conducive to seagrass recovery. Photo:<br />
A. Farrer.<br />
nationally), determining when modification of efforts is necessary, and building long-term public support<br />
for habitat protection and restoration.” Quantitative long-term monitoring of restoration projects provides a<br />
unique opportunity to evaluate current projects, improve future projects, and validate and refine the predictive<br />
recovery and HEA models being developed. The consistent execution of such evaluative monitoring of coral<br />
reef restoration projects remains an important goal.<br />
To improve socioeconomic valuation of injured natural resources and build public support, NOAA has also<br />
initiated a Community-Based Restoration Program (NOAA Restoration Center, http://restoration.noaa.gov/<br />
welcome.html, Accessed 02/09/05). Conservation and habitat restoration projects, such as those supported by<br />
this program, are intended to enhance partnerships at local, regional, and national levels. Projects in tropical<br />
coral reef ecosystems have included training volunteers to help recognize and stabilize vessel grounding injuries;<br />
establishing a community rapid biotic assessment team; establishing coral nurseries; removing commercial trap<br />
debris and derelict fishing gear from<br />
seagrass, coral reefs, and mangroves;<br />
and replanting mangroves (NOAA<br />
Restoration Center, http://restoration.<br />
noaa.gov/welcome.html, Accessed<br />
02/09/05).<br />
Improving outreach and education<br />
Many outreach and education<br />
initiatives are reported in the<br />
jurisdictional chapters, often with<br />
specific personnel employed to<br />
increase public awareness of coral<br />
reef ecology and issues affecting the<br />
condition of coral reefs. Activities are<br />
largely aimed at visitors, local school<br />
children, and legislators, but also<br />
extend to fishing communities and<br />
other users of coral reef ecosystems<br />
(Figure 18.7).<br />
Figure 18.7. Hands-on learning about nearshore organisms with high school students<br />
in St. Thomas, USVI. Photo: N. Sbeih.<br />
National Summary<br />
page<br />
519
National Summary<br />
page<br />
520<br />
The State of Coral Reef Ecosystems of the United States and Freely Associated States: <strong>2005</strong><br />
NOAA’s Coral Reef Conservation Program (CRCP) also continues to develop a collection of outreach and<br />
educational resources that are available on-line (CRCP, http://www.coralreef.noaa.gov/outreach/welcome.<br />
html, Accessed 02/04/05; Coral Health and Monitoring Program, http://www.coral.noaa.gov/cleo, Accessed<br />
02/04/05).<br />
Local action strategies<br />
In 2002, the USCRTF adopted the Puerto Rico Resolution which calls for the development of three-year local<br />
action strategies (LAS) by each of the seven member states, territories, and commonwealths. These LAS<br />
are locally-driven roadmaps for collaborative and cooperative action among Federal, state, territory and nongovernmental<br />
partners to identify and implement priority actions needed to reduce key threats to valuable<br />
coral reef resources.<br />
The goals and objectives of the LAS are linked to those found in the U.S. National Action Plan to Conserve<br />
Coral Reefs. From the 13 goals identified in the Plan, the USCRTF prioritized six threat areas as the focus<br />
for immediate local action: overfishing, land-based sources of pollution, recreational overuse and misuse,<br />
lack of public awareness, climate change and coral bleaching, and disease. Additional focus areas were<br />
identified in some jurisdictions. Florida, Hawaii, Guam, the USVI, American Samoa, Puerto Rico, and the<br />
CNMI created specific LAS for locally relevant threats, using the six priority focus areas as a guide. Applying<br />
a collaborative decision-making process based on local needs, concerns, and capacities, each jurisdiction<br />
developed strategies containing a variety of projects to be implemented over a three-year period (Fiscal Years<br />
<strong>2005</strong>-2007). For example, Guam has initiated a LAS for coral reef fishery management focusing on increasing<br />
the effectiveness of Guam’s marine preserves.<br />
The USCRTF is currently working with each jurisdiction to finalize and implement their LAS by inventorying<br />
opportunities; identifying resources, gaps, and needs; and seeking ways to increase funding and capacity<br />
support. (USCRTF, http://www.coralreef.gov/taskforce/las.html, Accessed 02/04/05).<br />
Looking ahead<br />
This report is the result of a tremendous amount of effort and coordination by the jurisdictional writing teams<br />
and attests to their dedication to conserving and protecting coral reef ecosystems throughout the United States<br />
and Pacific Freely Associated States. The information contained in the jurisdictional chapters demonstrates<br />
the considerable progress that has been made toward the major goals outlined in the NCRAS (2002) of better<br />
understanding coral reef ecosystems and reducing the adverse impacts of human activities.<br />
Plans are to continue to improve the quality of future reports in this series through greater incorporation of<br />
quantitiative data and peer-reviewed publications. Many jurisdictions are now in position to track changes<br />
over time, using metrics that quantify coral reef ecosystem parameters associated with water quality, benthic<br />
habitats, and associated biological communities. The timing on development and publication of the next<br />
report in this series is under discussion between the USCRTF All Islands Committee and NOAA. In addition,<br />
discussions are underway on how to continue to improve the quality of the reports, increase efficiency of report<br />
production, and improve communications on the state of coral reef ecosystems based on the experience<br />
gained in the development of this report. For now, The State of Coral Reef Ecosystems of the United States<br />
and Pacific Freely Associated States: <strong>2005</strong> provides the most comprehensive summary of the condition of<br />
coral reef ecosystems in the U.S. and Pacific Freely Associated States available, based on the collective<br />
efforts of the jurisdictional partners.
REFERENCES<br />
The State of Coral Reef Ecosystems of the United States and Freely Associated States: <strong>2005</strong><br />
Botsford, L.W., F. Micheli and A. Hastings. 2003. Principles for the design of marine reserves. Ecological Applications 13 (1):<br />
S25-S31.<br />
Bryant, D., L. Burke, J. McManus and M. Spalding, 1998. Reefs at Risk: A map-based indicator of threats to the world’s coral<br />
reefs. World Resources Institute. 56 pp.<br />
Burke, L. and J. Maidens. 2004. Reefs at Risk in the Caribbean. World Resources Institute.<br />
Ellison, A.M. 2000. Mangrove Restoration: Do We Know Enough? Restoration Ecology 8(3): 219-229.<br />
Federal Register 2000. Presidential Documents. Executive Order 13158. 65 (105). US Government Printing Office. Washington,<br />
DC.<br />
FKNMS (Florida Keys National <strong>Marine</strong> Sanctuary). 1996. Final Management Plan/Environmental Impact Statement, Volume<br />
III Appendices. Available from the internet URL: http://www.fknms.nos.noaa.gov/regs/fmp3.<strong>pdf</strong>.<br />
Fonseca, M.S., B.E. Julius and W.J. Kenworthy. 2000. Integrating biology and economics in seagrass restoration: How much<br />
is enough and why? Ecological Engineering 15: 227.<br />
Fonseca, M.S., W.J. Kenworthy, B.E. Julius, S. Shutler, and S. Fluke. 2002. Seagrasses. pp. 149-170. In: M.R. Perrow and A.J.<br />
Davy (eds.) Handbook of Ecological Restoration: Restoration in Practice, volume 2. Cambridge University Press, New York.<br />
Fonseca, M.S., G.A. Piniak, W.J. Kenworthy, P.E. Whitfield and G. Fisher. 2003. Report on application and sensitivity of the<br />
coral injury recovery model. Project report to National Centers for Coastal and Ocean Science, Silver Spring, MD. 25 pp.<br />
Fonseca, M.S., P.E. Whitfield, W.J. Kenworthy, D.R. Colby, and B.E. Julius. 2004. Modeling the effect of injury geometry on<br />
seagrass recovery. Aquatic Conservation 14(3) 281-298.<br />
Gell, F.R. and C.M. Roberts. 2002. The fishery effects of marine reserves and fishery closures. World Wildlife Fund. Washington,<br />
DC.<br />
Halpern, B.S. and R.R. Warner. 2002. <strong>Marine</strong> reserves have rapid and lasting effects. Ecology Letters 5: 361-366.<br />
Halpern, B.S. and R.R. Warner. 2003. Matching marine reserve design to reserve objectives. pp. 270: 1871-1878. In: Proceedings<br />
of the Royal Society of London.<br />
Kendall, M.S., K.R. Buja, J.D. Christensen, C.R. Kruer, and M.E. Monaco. 2004. The seascape approach to coral ecosystem<br />
mapping: an integral component of understanding the habitat utilization patterns of reef fish. Bulletin of marine science 75(2):<br />
225-237.<br />
Magron, F. 2004. Secretariat of the Pacific Community, Reef Fisheries Observatory. Noumea Cedex, New Caledonia. Personal<br />
communication.<br />
Monaco, M.E., J.D. Christensen, and S.O. Rohmann. 2001. Mapping and monitoring of US coral reef ecosystems. Earth<br />
System Monitor 12: 1-7.<br />
NCRAS (National Coral Reef Action Strategy). 2002. A National Coral Reef Action Strategy: Report to Congress on implementation<br />
of the Coral Reef Conservation Act of 2002 and the National Action Plan to Conserve Coral Reefs in 2002-2003.<br />
NOAA. Silver Spring, Maryland. 120 pp. + appendix.<br />
NOAA (National Oceanic and Atmospheric Administration). 2000a. Columbus Iselin Coral Reef Restoration Project. Available<br />
from the internet URL: http://sanctuaries.noaa.gov/special/columbus/columbus.html.<br />
NOAA (National Oceanic and Atmospheric Administration) Damage Assessment and Restoration Program. 2000b. Habitat<br />
Equivalency Analysis: an overview. Policy and Technical Paper Series. 23 pp. Available from the internet URL: http://www.<br />
darp.noaa.gov/library/<strong>pdf</strong>/heaoverv.<strong>pdf</strong>.<br />
NOAA (National Oceanic and Atmospheric Administration). 2002. A National Coral Reef Action Strategy: Report to Congress<br />
on implementation of the Coral Reef Conservation Act of 2002 and the National Action Plan to Conserve Coral Reefs in 2002-<br />
2003. NOAA. Silver Spring, Maryland.<br />
NOAA (National Oceanic and Atmospheric Administration). 2002. Wellwood coral reef restoration project. Available from the<br />
internet URL: http://sanctuaries.noaa.gov/special/ wellwood/restoration.html.<br />
National Summary<br />
page<br />
521
National Summary<br />
page<br />
522<br />
The State of Coral Reef Ecosystems of the United States and Freely Associated States: <strong>2005</strong><br />
NOAA (National Oceanic and Atmospheric Administration). 2003. What is Restoration? Available from the internet URL:<br />
http://www.nmfs.noaa.gov/ habitat/restoration/about/whatisrestoration.html.<br />
NRC (National Research Council). 2001. <strong>Marine</strong> Protected Areas: Tools for Sustaining Ocean Ecosystems. National Academy<br />
Press. Washington, DC.<br />
Piniak G.A., M.S. Fonseca, W.J. Kenworthy, P.E. Whitfield, G. Fisher and B. Julius. (in review). Spatially explicit modeling of<br />
coral reef ecosystem function and recovery. In: Precht W.F. (ed). In press. Coral Reef Restoration Handbook- The Rehabilitation<br />
of an Ecosystem Under Siege. CRC Press. Boca Raton, FL.<br />
Pittman, S.J. and C.A. McAlpine. 2003. Movements of marine fish and decapod crustaceans: Process, theory and application.<br />
Advances in <strong>Marine</strong> Biology 44: 205-294.<br />
Precht, W.F., D.R. Deis, and A.R Gelber. 2003. Damage assessment protocol and restoration of coral reefs injured by vessel<br />
groundings. p. (2): 963. In: Proceedings of the Ninth International Coral Reef Society.<br />
Rohmann, S.O., J.J. Hayes, R.C. Newhall, M.E. Monaco, and R.W. Grigg. In press. The Area of Potential Shallow-water<br />
Tropical and Subtropical Coral Ecosystems in the United States. Coral Reefs.<br />
Russ, G.R. and A.C. Alcala. 2004. <strong>Marine</strong> reserves: long-term protection is required for full recovery of predatory fish populations.<br />
Oecologia 138(4): 622-627.<br />
Salm, R.V., J. Clark, and E. Siirila. 2000. <strong>Marine</strong> and Coastal Protected Areas. A Guide for Planners and Managers. Third<br />
Edition. IUCN. Washington, DC. 371 pp.<br />
Shutler et al. (in review) Coral restoration: how much is enough? In: Coral reef restoration handbook- the rehabilitation of an<br />
ecosystem under siege, Precht, W.F., Ed., CRC Press, Boca Raton, FL, 2004, chap. 10.<br />
SWS (Society of Wetland Scientists. 2000. Position Paper on the Definition of Wetland Restoration. Available from the internet<br />
URL: http:/www.sws.org/wetlandconcerns/restoration.html.<br />
Thayer, G.W., T.A. McTigue, R.J. Bellmer, F.M. Burrows, D.H. Merkey, A.D. Nickens, S.J. Lozano, P.F. Gayaldo, P.J. Polmateer,<br />
and P.T. Pinit. 2003. Science-based restoration monitoring of coastal habitats. Volume I: A framework for monitoring<br />
plans under the Estuaries and Clean Waters Act of 2000 (Public Law 160-457). Coastal Ocean Program. Decision Analysis<br />
Series 23, Volume 1. National Oceanic and Atmospheric Administration, National Centers for Coastal Ocean Science. Silver<br />
Spring, MD.<br />
Turgeon, D.D., R.G. Asch, B.D. Causey, R.E. Dodge, W. Jaap, K. Banks, J. Delaney, B.D. Keller, R. Speiler, C.A. Matos, J.R.<br />
Garcia, E. Diaz, D. Catanzaro, C.S. Rogers, Z. Hillis-Starr, R. Nemeth, M. Taylor, G.P. Schmahl, M.W. Miller, D.A. Gulko, J.E.<br />
Maragos, A.M. Friedlander, C.L. Hunter, R.S. Brainard, P. Craig, R.H. Richond, G. Davis, J. Starmer, M. Trianni, P. Houk, C.E.<br />
Birkeland, A. Edward, Y. Golbuu, J. Gutierrez, N. Idechong, G. Paulay, A. Tafileichig, and N. Vander Velde. 2002. The State of<br />
Coral Reef Ecosystems of the United States and Pacific Freely Associated States: 2002. National Oceanic and Atmospheric<br />
Administration, National Ocean Service, National Centers for Coastal Ocean Science. Silver Spring, MD. 265 pp.<br />
USCRTF (United States Coral Reef Task Force). Mapping and Information Synthesis Working Group. 1999. Coral Reef Mapping<br />
Implementation Plan. Second draft. National Oceanic and Atmospheric Administration, National Air and Space Agencey,<br />
and US Geological Survey. Washington DC. 17 pp.<br />
USCRTF (United States Coral Reef Task Force). 2000. The National Action Plan to Conserve Coral Reefs. USCRTF. Washington,<br />
D.C. 33 pp. + appendices.<br />
Whitfield, P.E., M.S. Fonseca, W.J. Kenworthy. 2001 Coral damage assessment and restoration tools for small vessel groundings<br />
(extension of seagrass mini-312 program to coral reefs). Project Report to NOAA Damage Assessment Center, Silver<br />
Spring, MD. 15 pp. Available from the internet URL: http://shrimp.ccfhrb.noaa.gov/~mfonseca/reports.html.<br />
Wilkinson, C.R. (ed.). 2002 Status of coral reefs of the world: 2002. Global Coral Reef Monitoring Network Report, Australian<br />
Institute of <strong>Marine</strong> Science, Townsville. 378 p.<br />
Wilkinson CR., (ed.), 2004 Status of coral reefs of the world: 2004. Global Coral Reef Monitoring Network Report. Australian<br />
Institute of <strong>Marine</strong> Science, Townsville. 557 pp.<br />
Williamson, D.H., G.R. Russ and A.M. Ayling. 2004. No-take marine reserves increase abundance of reef fish on inshore<br />
fringing reefs of the Great Barrier Reef. Environmental Conservation 31(2): 149-159.
United States Department of Commerce<br />
Carlos M. Gutierrez<br />
Secretary<br />
National Oceanic and Atmospheric Administration<br />
Vice Admiral Conrad C. Lautenbacher, Jr. USN (Ret.)<br />
Under Secretary of Commerce for Oceans and Atmosphere<br />
NOAA’s Ocean Service<br />
Richard W. Spinrad, Ph.D.<br />
Assistant Administrator for Ocean Service and Coastal Zone Management