Monthly Index Chart Book
Monthly Index Chart Book
Monthly Index Chart Book

You also want an ePaper? Increase the reach of your titles
YUMPU automatically turns print PDFs into web optimized ePapers that Google loves.
Comment & The <strong>Chart</strong> of the Month February 2011<br />
Introduction<br />
This <strong>Index</strong> <strong>Chart</strong> <strong>Book</strong> is intended to run in parallel with the EPRA<br />
Statistical Bulletin and <strong>Monthly</strong> Review . While the bulletin focuses on<br />
performance, this index chart book will use the same data in an effort to<br />
identify historical trends and indicators on the index series.<br />
Example<br />
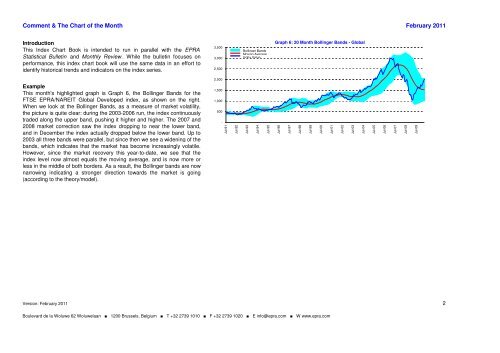
This month's highlighted graph is Graph 6, the Bollinger Bands for the<br />
FTSE EPRA/NAREIT Global Developed index, as shown on the right.<br />
When we look at the Bollinger Bands, as a measure of market volatility,<br />
the picture is quite clear: during the 2003-2006 run, the index continuously<br />
traded along the upper band, pushing it higher and higher. The 2007 and<br />
2008 market correction saw the index dropping to near the lower band,<br />
and in December the index actually dropped below the lower band. Up to<br />
2003 all three bands were parallel, but since then we see a widening of the<br />
bands, which indicates that the market has become increasingly volatile.<br />
However, since the market recovery this year-to-date, we see that the<br />
index level now almost equals the moving average, and is now more or<br />
less in the middle of both borders. As a result, the Bollinger bands are now<br />
narrowing indicating a stronger direction towards the market is going<br />
(according to the theory/model).<br />
28-2-11<br />
Version: February 2011<br />
February<br />
Boulevard de la Woluwe 62 Woluwelaan ■ 1200 Brussels, Belgium ■ T +32 2739 1010 ■ F +32 2739 1020 ■ E info@epra.com ■ W www.epra.com<br />
3,500<br />
3,000<br />
2,500<br />
2,000<br />
1,500<br />
1,000<br />
500<br />
-<br />
Jul-91<br />
Jul-92<br />
Bollinger Bands<br />
Moving Average<br />
<strong>Index</strong> Value<br />
Jul-93<br />
Jul-94<br />
Jul-95<br />
Graph 6: 20 Month Bollinger Bands - Global<br />
Jul-96<br />
Jul-97<br />
Jul-98<br />
Jul-99<br />
Jul-00<br />
Jul-01<br />
Jul-02<br />
Jul-03<br />
Jul-04<br />
Jul-05<br />
Jul-06<br />
Jul-07<br />
Jul-08<br />
Jul-09<br />
2