Anuario Estadístico de los Estados Unidos Mexicanos 1992 - Inegi
Anuario Estadístico de los Estados Unidos Mexicanos 1992 - Inegi
Anuario Estadístico de los Estados Unidos Mexicanos 1992 - Inegi

Create successful ePaper yourself
Turn your PDF publications into a flip-book with our unique Google optimized e-Paper software.
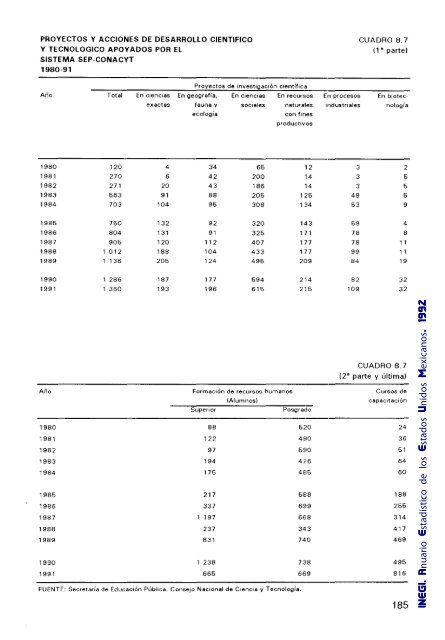
PROYECTOS Y ACCIONES DE DESARROllO CIENTlFICO<br />
y TECNOlOGICO APOYADOS POR El<br />
SISTEMA SEP-CONACYT<br />
1980-91<br />
Proyectos <strong>de</strong> investigación científica<br />
CUADRO 8.7<br />
11" parte)<br />
Año Total En ciencias En geografía, En CienCias En recursos En procesos En biotec<br />
exactas fauna y socialf'!s naturales Industriales nologia<br />
ecología<br />
con fines<br />
productivos<br />
1980 120 4<br />
1981 270 6<br />
1982 271 20<br />
1983 563 91<br />
1984 703 104<br />
1985 750 132<br />
1986 804 131<br />
1987 905 120<br />
1988 1012 188<br />
1989 136 205<br />
1990 1 286 187<br />
1991 1 360 193<br />
Año<br />
1980<br />
1981<br />
1982<br />
1983<br />
1984<br />
1985<br />
1986<br />
1987<br />
1988<br />
1989<br />
1990<br />
1991<br />
34<br />
42<br />
43<br />
88<br />
95<br />
92<br />
91<br />
112<br />
104<br />
124<br />
177<br />
196<br />
65<br />
200<br />
186<br />
205<br />
308<br />
320<br />
325<br />
407<br />
433<br />
495<br />
594<br />
615<br />
12<br />
14<br />
14<br />
125<br />
134<br />
143<br />
171<br />
177<br />
177<br />
209<br />
214<br />
215<br />
FormaCión <strong>de</strong> recursos humanos<br />
(Alumnos)<br />
Superior Posgrado<br />
88 520<br />
122 490<br />
97 590<br />
194 41'6<br />
175 485<br />
217 588<br />
337 699<br />
1 197 668<br />
237 343<br />
831 740<br />
1238 738<br />
665 669<br />
FUENTE: Secretaría <strong>de</strong> EducaCión Pública. Consejo NaCional <strong>de</strong> Ciencia y Tecnología.<br />
2<br />
3 5<br />
3 5<br />
49 5<br />
53 9<br />
59 4<br />
78 8<br />
78 11<br />
99 11<br />
84 19<br />
82 32<br />
109 32<br />
CUADRO 8.7<br />
12" parte y última)<br />
Cursos <strong>de</strong><br />
capacitación<br />
<strong>1992</strong><br />
<strong>Mexicanos</strong>. <strong>Unidos</strong><br />
24<br />
36<br />
51 <strong>Estados</strong><br />
64<br />
<strong>los</strong><br />
60<br />
<strong>de</strong><br />
188<br />
255<br />
314<br />
417<br />
<strong>Estadístico</strong><br />
469<br />
495<br />
816 <strong>Anuario</strong><br />
185 INEGI.
PROYECTOS Y ACCIONES DE DESARROllO CIENTIFICO<br />
Y TECNOLOGICO APOYADOS POR EL SECTOR<br />
AGROPECUARIO Y FORESTAL<br />
1980-91<br />
Año Asesorías<br />
y consultas<br />
técnicas<br />
1980 4<br />
1981 2<br />
1982<br />
1983<br />
1984 3<br />
1985 2<br />
1986<br />
1987 8<br />
1988 8<br />
1989 10<br />
1990 94<br />
1991 132<br />
Año<br />
1980<br />
1981<br />
1982<br />
1983<br />
1984<br />
1986<br />
1986<br />
1987<br />
1988<br />
1989<br />
1990<br />
1991<br />
Proyectos <strong>de</strong> <strong>de</strong>sarrollo tecnológico<br />
Colegio <strong>de</strong> posgraduados<br />
Agroindustrial<br />
Aplicación <strong>de</strong><br />
tecnologías en<br />
lotes<br />
1<br />
2<br />
4<br />
6<br />
6<br />
8<br />
8<br />
16<br />
19<br />
13<br />
400<br />
423<br />
410<br />
390<br />
321<br />
286<br />
268<br />
273<br />
240<br />
286<br />
262<br />
240<br />
Experimental<br />
306<br />
312<br />
2!l4<br />
31)1<br />
2132<br />
241<br />
1'39<br />
1136<br />
158<br />
1 !57<br />
1153<br />
212<br />
CUADRO 8.8<br />
(3' parte)<br />
Asesorías<br />
y consultas<br />
técnicas el<br />
97 171<br />
101 760<br />
84612<br />
76764<br />
84133<br />
66463<br />
88222<br />
69601<br />
76131<br />
81 296<br />
63983<br />
43636<br />
CUADRO 8.8<br />
(4' parte y última)<br />
Proyectos <strong>de</strong> <strong>de</strong>sarrollo tecnológico Formación <strong>de</strong> recursos humanos (alumnos)<br />
Colegio <strong>de</strong> Medio, Superior Posgrado<br />
posgraduados<br />
UAAAN<br />
superior<br />
Otros no<br />
Innovación y<br />
clasificados dI transferencia <strong>de</strong><br />
tecnología,<br />
asesoría y<br />
capacitación<br />
310960<br />
315420<br />
262300<br />
208332<br />
218013<br />
154 378<br />
160 307<br />
166422<br />
173 269<br />
222 867<br />
141 222<br />
92983<br />
26<br />
56<br />
26<br />
37<br />
19<br />
29<br />
22<br />
22<br />
36<br />
41<br />
60<br />
2392 6860 637<br />
2600 7568 684<br />
2906 7523 544<br />
2735 7396 692<br />
2768 6840 761<br />
2617 7640 790<br />
2731 7 113 886<br />
2621 7029 841<br />
2861 6742 877<br />
2731 6324 818<br />
2883 6366 767<br />
2980 6094 786<br />
a/ De 1980 a 1986 se refiere a las investigaciones <strong>de</strong>l Instituto Nacional <strong>de</strong> Investigaciones Agrícolas. Por <strong>de</strong>creto<br />
publicado en el Diario Oficial <strong>de</strong> la Fe<strong>de</strong>ración el 23 <strong>de</strong> agosto <strong>de</strong> 1986, se crea ellntituto Nacional <strong>de</strong><br />
Investigaciones Forestales y Agropecuarias, el cual asume las activida<strong>de</strong>s <strong>de</strong>llntituto Nacional <strong>de</strong> Capacitación <strong>de</strong>l<br />
Sector Agropecuario, A.C., Instituto Nacional <strong>de</strong> Investigaciónes Pecuarias e Instituto Nacional <strong>de</strong> Investigaciónes<br />
Forestales. A partir <strong>de</strong> 1986 las activida<strong>de</strong>s correspon<strong>de</strong>n al Instituto Nacional <strong>de</strong> Investigaciones Forestales y<br />
Agropecuarias.<br />
bl Hasta 1990, la Universidad Autónoma <strong>de</strong> Chapingo reportó proyectos Integrales, en <strong>los</strong> que se incluía un número<br />
<strong>de</strong>terminado <strong>de</strong> parcela. A partir <strong>de</strong> 1991, esta operando por unida<strong>de</strong>s <strong>de</strong> producción, por le que el número que<br />
reporta equivale 8 <strong>los</strong> proyectos que <strong>de</strong>sarrolla en ellas.<br />
cl Se refiere a consultas <strong>de</strong> asistencia técnica proporcionada a productores.<br />
dI Número <strong>de</strong> hectáreas atendidas con asistencia técnica.<br />
FUENTE: Secretaría <strong>de</strong> Agricultura y Recursos Hidráulicos.<br />
187 INEGI. <strong>Anuario</strong> <strong>Estadístico</strong> <strong>de</strong> <strong>los</strong> <strong>Estados</strong> <strong>Unidos</strong> <strong>Mexicanos</strong>. <strong>1992</strong>
INEGI. <strong>Anuario</strong> <strong>Estadístico</strong> <strong>de</strong> <strong>los</strong> <strong>Estados</strong> <strong>Unidos</strong> <strong>Mexicanos</strong>. <strong>1992</strong><br />
PROYECTOS Y ACCIONES DE DESARROLLO CIENTlFICO CUADRO 8.9<br />
Y TECNOLOGICO APOYADOS POR EL SECTOR<br />
(1" parte)<br />
COMUNICACIONES Y TRANSPORTES<br />
1980-91<br />
Formación <strong>de</strong> recursos humanos (Alumnos)<br />
Medio superior Superior Posgrado<br />
Sector Instituto Sector Instituto Instituto Sector Instituto Instituto<br />
Año Central Mexicano Central Mexicano Mexicano Central Mexicano Mexicano<br />
a' <strong>de</strong> Comu- a' <strong>de</strong> Comu- <strong>de</strong> Trans- a' <strong>de</strong> Comu- <strong>de</strong>l Trensnicaciones<br />
nicaciones porte nicaciones porte<br />
1980 27 120 27<br />
1981 28 190 39<br />
1982 26 182 60<br />
1983 20 183 378<br />
1984 26 191 691<br />
1986 23 184 1663<br />
1986 31 184 1684<br />
1987 27 209 1329<br />
1988 30 176 1 162<br />
1989 34 210 890 2<br />
1990 18 498 180 806 6<br />
1991 P 21 603 382 890 134<br />
Proyectos <strong>de</strong> <strong>de</strong>sarrollo tecnológico<br />
CUADRO 8.9<br />
(2" parte y última)<br />
Año Sector Central al Instituto Mexicano Instituto Mexicano Teléfonos<br />
<strong>de</strong> Comunicaciones <strong>de</strong>l Transporte <strong>de</strong> México<br />
1980 6 3<br />
1981 6 3<br />
1982 166 2<br />
1983 238 46<br />
1984 320 45<br />
1986 228 46<br />
1986 648 62<br />
1987 648 41<br />
1988 767 6 21<br />
1989 831 8 44<br />
1990 976 60 19 82<br />
1991 P 1 162 58 18 23<br />
a/ Incluye información <strong>de</strong>: Dirección General <strong>de</strong> Planeación; Puertos <strong>Mexicanos</strong>; Proyectos Servicios Técnicos y<br />
Concesiones; Fomento <strong>de</strong> las Telecomunicaciones e Informática; y Fi<strong>de</strong>icomiso <strong>de</strong> Formación y Capacitación para<br />
Personal <strong>de</strong> la Marina Mercante. Para educación superior incluye alumnos <strong>de</strong> nivel técnico.<br />
FUENTE: Secretaría <strong>de</strong> Comunicaciones y Transportes.<br />
188
CAPITULO 9<br />
CULTURA,<br />
RECREACION y<br />
TURISMO<br />
INEGI. <strong>Anuario</strong> <strong>Estadístico</strong> <strong>de</strong> <strong>los</strong> <strong>Estados</strong> <strong>Unidos</strong> <strong>Mexicanos</strong>. <strong>1992</strong>
INEGI. <strong>Anuario</strong> <strong>Estadístico</strong> <strong>de</strong> <strong>los</strong> <strong>Estados</strong> <strong>Unidos</strong> <strong>Mexicanos</strong>. <strong>1992</strong><br />
BIBLIOTECAS, VOLUMEN ES, USUARIOS y OBRAS CONSULTADAS<br />
1980-91<br />
CUADRO 9.1<br />
Año Bibliotecas Volúmenes Usuarios Obras consultadas<br />
1980 2389 14677 866 27839106 29726042<br />
1981 2784 16129147 34220016 39476627<br />
1982 2972 17009 133 3B 126 B03 47622386<br />
1983 3261 18803427 41377074 61 995462<br />
1984 3262 18370630 49396940 46863269<br />
1986 3321 14362401 44 002 460 62070 774<br />
1986 4862 22 237 981 68448347 87407692<br />
1987 6 117 23776 233 84068 745 104010897<br />
19B8 6672 27443465 94423624 117294843<br />
1989 6631 31 367 758 96017686 106436414<br />
1990 7463 31 793151 104641436 120060 126<br />
1991 8188 38301414 118232967 137463 132<br />
NOTA: Se actualizan <strong>los</strong> datos <strong>de</strong> obras consultadas publicados en 1982·1984 y el número <strong>de</strong> bibliotecas en 1986,<br />
conforme 8 la información proporcionada por la fuente.<br />
FUENTE: Instituto Nacional <strong>de</strong> Estadística. Geografía e Informática, con base en cifras proporcionadas por la<br />
Secretaría <strong>de</strong> Educación Pública, Subsecretaría <strong>de</strong> Coordinación Educativa. Dirección General <strong>de</strong> Planeación.<br />
Programación y Presupuesto.<br />
MUSEOS Y VISITANTES A MUSEOS CUADRO 9.2<br />
1980-90<br />
Museos Visitantes<br />
Año Total Nacionales Extranjeros<br />
1980 72 7 726366 6646627 1 180738<br />
1981 71 6852144 6406124 1 447020<br />
1982 69 7281 348 6439 339 1 842009<br />
1983 86 7 666 793 6940 842 1 624961<br />
1984 76 7660062 6071761 1 678301<br />
1986 71 6140173 4 978 843 1 161 330<br />
1986 87 7 937 842 6240328 697614<br />
1987 114 10023771 8316971 707800<br />
1988 149 16 190780 13110217 2080663<br />
1989 163 15919869 13426469 2493390<br />
1990 161 16673886 13776481 2898404<br />
NOTA: A parti, <strong>de</strong> 1987. se observa un Incremento s'lgnificativo en el número <strong>de</strong> visitantes <strong>de</strong>bido a que se incluyen<br />
<strong>los</strong> datos correspondientes a <strong>los</strong> establecimientos que están bajo custodia <strong>de</strong>l Instituto Nacional <strong>de</strong><br />
Antropología e Historia ONAH), así como <strong>de</strong> <strong>los</strong> museos, galerias, jardines botánicos y zoológicos <strong>de</strong>pendientes<br />
<strong>de</strong> otras instituciones gubernamentales y <strong>de</strong>l sector privado.<br />
FUENTE: Instituto Nacional <strong>de</strong> Estadística. Geografía e Informática, Dirección <strong>de</strong> Estadísticas Demográficas y Sociales.<br />
194
ZONAS ARQUEOLOGICAS y VISITANTES A ZONAS ARQUEOLOGICAS CUADRO 9.3<br />
1980-90<br />
Zonas Visitantes<br />
Año arqueológicas Total Nacionales Extranjeros<br />
1980 97 3628455 2242820 1 385635<br />
1981 93 3467136 2016061 1 449057<br />
1982 96 3383 175 1 991 204 1 391 971<br />
1963 99 4883617 3205436 1678181<br />
1984 98 4454264 2781 765 1 672499<br />
1985 88 3260366 2037588 242 778<br />
1986 84 2278640 1 479230 799610<br />
1987 94 2 103202 1 264959 838243<br />
1988 96 5060384 2982251 2078133<br />
1989 104 6329498 3977 146 2352352<br />
1990 112 5258603 3442447 1816156<br />
FUENTE: Instituto Nacional <strong>de</strong> Estadística. Geografía e Informática. Dirección <strong>de</strong> Estadísticas Demográficas y Sociales.<br />
Instituto Nacional <strong>de</strong> Antropología e Historia.<br />
GASTO FEDERAL EJERCIDO EN CULTURA y DEPORTE CUADRO 9.4<br />
1980-91<br />
(Millones <strong>de</strong> nuevos pesos)<br />
Total Publicaciones DifUSión y Difusión y Atención cultural<br />
Año y bibliotecas preservación promoción <strong>de</strong>l y recreativa<br />
<strong>de</strong> la cultura al <strong>de</strong>porte bl 8 la juventud<br />
1980 5.5 0.6 2.7 2.0 0.2<br />
1981 7.9 0.9 3.8 2.6 004<br />
1982 12.0 lA 6.5 3.6 0.5<br />
1983 17.5 1.8 10.6 4.2 0.7<br />
1984 34.5 5.9 20.2 6.5 1.9<br />
1985 45.9 10.3 29.0 2.1 4.5<br />
1986 67.3 14.0 44.6 3.1 5.6<br />
1987 168.3 39.3 111.6 6.3 11.1<br />
1988 348.0 73.7 24004 13.6 20.3<br />
1989 389.5 66.6 213.7 69.1 19.9<br />
1990 590.0 77.0 287.7 206.9 1804<br />
1991 901.3 104.3 430.1 346.5 2004<br />
al En 1990 incluye la educación artística para la educación básica.<br />
bl De 1989 en a<strong>de</strong>lante incluye la educación física para la educación báSica.<br />
FUENTE: Secretaría <strong>de</strong> Educación Pública.<br />
195 INEGI. <strong>Anuario</strong> <strong>Estadístico</strong> <strong>de</strong> <strong>los</strong> <strong>Estados</strong> <strong>Unidos</strong> <strong>Mexicanos</strong>. <strong>1992</strong>
INEGI. <strong>Anuario</strong> <strong>Estadístico</strong> <strong>de</strong> <strong>los</strong> <strong>Estados</strong> <strong>Unidos</strong> <strong>Mexicanos</strong>. <strong>1992</strong><br />
PRINCIPALES ESPECTACULOS PUBlICOS CUADRO 9.5<br />
1980-90 (1' parte)<br />
Cinematógrafos<br />
Año Número <strong>de</strong> Localida<strong>de</strong>s Importe Días Número <strong>de</strong><br />
establecí· vendidas (Nuevos trabajados funciones<br />
mientes al (miles) pesos) acumulados<br />
1980 1 832 264046 5778410 443781 874 908<br />
1981 1 789 273 716 6910 107 426666 868417<br />
1982 1 789 278 140 9641460 430486 882593<br />
1983 1 711 211479 11 834509 319746 688655<br />
1984 1790 252233 22 763 582 450 365 939 943<br />
1985 1 775 212 582 34261 596 425 904 831 885<br />
1986 1512 113484 68179052 312432 791 048<br />
1987 1 694 205955 133210035 396499 1 055774<br />
1988 1054 76397 94 362052 206397 541517<br />
1989 1 517 149181 244442923 364456 902266<br />
1990 1 387 142517 319247311 351 356 886800<br />
Teatros bl<br />
CUADRO 9.5<br />
(2' parte)<br />
Año Número <strong>de</strong> Localida<strong>de</strong>s Importe Días Número <strong>de</strong><br />
establecí· vendidas {Nuevos trabajados funciones<br />
mientes al (milesl pesos) acumulados<br />
1980 80 6679 533 685 10521 18029<br />
1981 74 6063 707 745 9521 16642<br />
1982 70 5480 810804 7676 12003<br />
1983 90 5291 1 567 067 7946 12266<br />
1984 97 7316 3746219 11469 18341<br />
1985 105 6986 4089680 8332 12616<br />
1986 107 6683 6964236 9961 15491<br />
1987 108 4735 18422317 9686 14434<br />
1988 86 5053 31 704076 10769 16388<br />
1989 90 4124 72203267 11 923 18207<br />
1990 103 3923 96312679 14623 20674<br />
Deportes<br />
CUADRO 9.5<br />
(3' parte)<br />
Año Número <strong>de</strong> Localida<strong>de</strong>s Importe Días Número <strong>de</strong><br />
estableci- vendidas (Nuevos trabajados funciones<br />
mientes al (miles) pesos) acumulados<br />
1980 126 14147 474 643 6446 6761<br />
1981 117 12490 682931 5936 6247<br />
1982 110 13106 807066 6066 6493<br />
1983 100 11 366 1 023638 4363 4638<br />
1984 113 13692 2239841 6617 6924<br />
1985 106 11 504 3006290 6270 6637<br />
1986 114 12937 6301 841 6074 6413<br />
1987 104 9182 11 184 647 6427 6387<br />
1988 65 5238 17 235119 4203 6737<br />
1989 67 6611 34372123 4136 4439<br />
1990 55 6469 42673116 5707 6441<br />
196
PRINCIPALES ESPECTACULOS PUBLICO!; CUADRO 9.5<br />
1980-90 (4" parte)<br />
Taurinos<br />
Año Número <strong>de</strong> Localida<strong>de</strong>s Importe Días Número <strong>de</strong><br />
establecl- vendidas (Nuevos trabajados funciones<br />
mIentes al (miles) pesos) acumulados<br />
1980 38 1 139 112092 337 356<br />
1981 37 1496 177 193 379 381<br />
1982 31 1512 217 256 330 341<br />
1983 29 1045 291 364 22.3 223<br />
1984 33 794 412088 281, 293<br />
1985 27 113 799376 29!5 296<br />
1986 31 936 1 382603 287 291<br />
1987 28 967 4572786 246 248<br />
1988 18 426 6 307 609 16H 169<br />
1989 14 272 5211748 17H 190<br />
1990 22 574 12238093 3613 381<br />
RecreatIvos el<br />
CUADRO 9.S<br />
(S8 parte y última)<br />
Año Numero <strong>de</strong> Localida<strong>de</strong>s Importe Días Número <strong>de</strong><br />
establect- vendidas (Nuevos trabajado';) funCiones<br />
mientas al (mIles) pesos) acumulado:s<br />
1988 29 522 2901401 674 1 281<br />
1989 18 951 5 698 172 832 2860<br />
1990 14 1 359 9381135 940 3237<br />
al Se contabilIzaron únicamente <strong>los</strong> establecimientos que reportan datos.<br />
bl Se Incluyen en teatros a<strong>de</strong>más <strong>de</strong> éstos, aquel<strong>los</strong> establecImientos corno: Auditorios, salas <strong>de</strong> conciertos y casas<br />
<strong>de</strong> cultura que presentan espectácu<strong>los</strong> teatrales. danza y mUSicales.<br />
el No se tienen datos disponibles <strong>de</strong> espectácu<strong>los</strong> recreativos para el periodo 1980-87. Los establecimientos<br />
recreativos, correspon<strong>de</strong>n a todos aquel<strong>los</strong> en <strong>los</strong> cuales se presentan en forma esporádica espectácu<strong>los</strong> como<br />
charreadas, Jatlpeos y algunas funCIOnes <strong>de</strong> Circo, sin incluir datos <strong>de</strong> €'spectácu<strong>los</strong> en cines <strong>de</strong> la Compañia<br />
Operadora <strong>de</strong> Teatros, S.A. (COTSA).<br />
FUENTE: Instituto Nacional <strong>de</strong> Estadística, Geografía e Informática. Direcdón <strong>de</strong> Estadísticas [)emográficas y Sociales.<br />
197 INEGI. <strong>Anuario</strong> <strong>Estadístico</strong> <strong>de</strong> <strong>los</strong> <strong>Estados</strong> <strong>Unidos</strong> <strong>Mexicanos</strong>. <strong>1992</strong>
INEGI. <strong>Anuario</strong> <strong>Estadístico</strong> <strong>de</strong> <strong>los</strong> <strong>Estados</strong> <strong>Unidos</strong> <strong>Mexicanos</strong>. <strong>1992</strong><br />
PElICULAS EXHIBIDAS POR NACIONALIDAD CUADRO 9.6<br />
1980·90<br />
(1' parte)<br />
Año Total al Mexicana Alemana Americana Argentina Brasileña Española Francesa<br />
1980 358039 193380 183 121880 1206 170 2883 6142<br />
1981 333291 178158 936 117677 984 126 3266 4367<br />
1982 326091 169626 910 116316 1206 166 4664 4314<br />
1983 302316 147049 896 116742 1365 240 4065 3764<br />
1984 294906 138061 1089 119326 1063 214 3390 3436<br />
1986 271 699 130666 833 109107 861 337 2862 3087<br />
1986 220 139 106409 668 90183 687 342 1 972 2668<br />
1987 284337 134 763 963 114383 1004 267 3223 3316<br />
1988 94389 44243 153 44617 119 72 303 628<br />
1989 101993 47478 166 49498 66 87 336 460<br />
1990 87028 39664 92 43463 129 66 166 370<br />
CUADRO 9.6<br />
(2' parte y última)<br />
Año Hindú Inglesa Italiana Japonesa Rusa Sueca Coproducción Otras<br />
1980 73 3625 17961 6260 211 289 3876<br />
1981 76 3042 14463 6606 199 224 3391<br />
1982 29 2839 13660 7821 322 198 6032<br />
1983 63 2794 12361 8466 186 264 6093<br />
1984 69 2874 11 379 8462 224 361 4969<br />
1986 56 2286 9432 7164 196 183 4660<br />
1986 67 1710 6743 5736 194 162 2798<br />
1987 60 2604 10618 7878 205 265 4799<br />
1988 19 332 1500 1455 110 36 902<br />
1989 8 398 1 447 1 337 108 60 214 371<br />
1990 8 281 1 221 961 63 52 106 408<br />
al No se tIene disponible para el periodo 1988·90, la Información sobre películas exhibidas según nacionalidad <strong>de</strong><br />
<strong>los</strong> cinematógrafos <strong>de</strong> la Compañía Operadora <strong>de</strong> Teatros. S.A. ICOTSA)<br />
FUENTE: Instituto Nacional <strong>de</strong> Estadística. Geografía e Informátic8. Dirección <strong>de</strong> <strong>Estadístico</strong>s Demográficas y Sociales.<br />
198
ESTABLECIMIENTOS HOTELEROS POR CATEGORIA TURISTlCA<br />
1980-91<br />
CUADRO 9.7<br />
Total Clase Gran Cinco Cuatro Tres Dos Una Clnse Sin Ampa-<br />
Año especial tUrismo estrellas estrellas estrellas estrellas estrella econó- cate- rados<br />
1980<br />
1981<br />
1982<br />
1983<br />
1984<br />
1985<br />
1986<br />
1987<br />
1988<br />
1989<br />
1990<br />
1991 P<br />
7838<br />
8049<br />
5310<br />
6761<br />
6822<br />
7507<br />
7600<br />
7 721<br />
7 984<br />
8239<br />
ND<br />
ND<br />
ND<br />
ND<br />
26<br />
23<br />
26<br />
24<br />
26<br />
27<br />
FUENTE: Secretaría <strong>de</strong> Turismo.<br />
ND<br />
ND<br />
24<br />
26<br />
12<br />
12<br />
13<br />
18<br />
32<br />
36<br />
266<br />
274<br />
100<br />
104<br />
94<br />
90<br />
105<br />
132<br />
141<br />
146<br />
556<br />
571<br />
359<br />
415<br />
442<br />
302<br />
333<br />
375<br />
395<br />
422<br />
1 262<br />
·1296<br />
860<br />
931<br />
958<br />
679<br />
693<br />
749<br />
775<br />
854<br />
1 677 4076 ND<br />
722 4185<br />
221<br />
1295<br />
1299<br />
991<br />
1084<br />
1 144<br />
1 185<br />
1269<br />
mica goría<br />
ND<br />
ND<br />
ND<br />
1555 191 ND<br />
1 850 1 462 678<br />
1 851 1 462 678<br />
1 009 ,584 2439<br />
974 1 733 2375<br />
996 1 713 2306<br />
1 027 1 710 2 510<br />
1 120 1 762 2 420<br />
<strong>1992</strong><br />
CUARTOS DE HOTEL POR CATEGORIA TURISTICA<br />
CUADRO 9.8<br />
1980-91<br />
Total Clase Gran Cinco Cuatro Tres Dos Una Clase Sin Ampa-<br />
Año<br />
especial turismo estrellas estrellas estrellas estrellas estrella eGonó- cate- rados<br />
mica goría<br />
<strong>Mexicanos</strong>.<br />
1980 237 554 NO NO 28031 29694 47611 4'5085 86994 NO NO NO<br />
1981 249 328 NO ND 29421 31 166 49866 48370 90257 NO ND NO<br />
<strong>Unidos</strong><br />
1982<br />
1983 229475 NO 9307 21 620 38476 48482 43621 42573 21,397 NO ND<br />
1984<br />
<strong>Estados</strong> <strong>los</strong><br />
1985 300500 NO 10363 22938 43891 52746 46013 60459 29078 15012 NO<br />
1986 305543 4962 5204 24131 46873 63700 46109 50474 29078 15012 NO <strong>de</strong><br />
1987 305567 4099 6209 22722 34340 42151 39763 33603 42130 65278 16272<br />
1988 310470 4356 5490 26206 39161 40461 43304 31634 43268 65053 12557<br />
1989 321765 3756 8045 33067 42699 42966 44378 32257 42827 59213 12557<br />
<strong>Estadístico</strong><br />
1990 333547 3861 12644 32991 44827 43433 44875 32896 42685 67229 8106<br />
1991 P 345159 3869 13597 34345 46418 47583 46675 35243 43792 65531 8106<br />
<strong>Anuario</strong><br />
FUENTE: Secretaría <strong>de</strong> Turismo.<br />
199 INEGI.<br />
ND<br />
ND<br />
NO<br />
NO<br />
NO<br />
278<br />
264<br />
264<br />
183<br />
183
INEGI. <strong>Anuario</strong> <strong>Estadístico</strong> <strong>de</strong> <strong>los</strong> <strong>Estados</strong> <strong>Unidos</strong> <strong>Mexicanos</strong>. <strong>1992</strong><br />
1\) NUMERO DE CUARTOS EN CENTROS SELECCIONADOS DEl PAIS al CUADRO 9.9<br />
O 1981-91 (1' parte)<br />
O<br />
Total Integralmente planeados TradiCionales<br />
Total Cancún, Ixtapa Loreto, Los Total Acapulco, Cozumel, La Paz, Manza· Mazatlán, Puerto Veracruz,<br />
Año Q. Roo Zihuata- S.C.S. Cabos, Gro. Q. Roo S.C.S. njlja, Sin. Vallarta, Ver.<br />
nejo, Gro. S.C.S. Col. Jal.<br />
1981 91 403 9108 6226 2486 454 943 32816 14212 1 725 1444 1 723 6622 4783 3307<br />
1982 99240 10374 6268 3343 464 1 319 36636 16064 1 816 1484 1780 6 124 6695 3683<br />
1983 102214 11386 6709 3840 617 1 319 36706 16162 1800 1423 1666 6048 6700 3907<br />
1984 104666 11 670 6106 3949 397 1218 38402 16431 1 873 1660 2169 6180 6224 3976<br />
1986 100667 12234 6691 4008 416 1219 38937 16290 1 910 1668 2322 6 173 6617 4167<br />
1986 105667 12626 7028 3940 416 1 243 40328 16747 1941 1601 2431 6677 6804 4 127<br />
1987 109032 14415 8910 3814 422 1 269 41 188 16729 2183 1 667 2426 7 160 6958 4186<br />
1988 112847 17803 11891 3827 413 1672 40789 16607 1877 1538 2123 7468 7036 4141<br />
1989 118760 21 962 16310 4007 459 2186 42139 16649 2492 1666 2264 7734 7271 4 173<br />
1990 126 272 24625 17470 4169 455 2631 45126 17001 2876 1412 2987 7936 8646 4269<br />
1991 127 171 26473 17971 4271 386 2846 46195 16669 3034 1608 2922 7997 8848 4227<br />
CUADRO 9.9<br />
(2' parte y última)<br />
Gran<strong>de</strong>s ciuda<strong>de</strong>s Centros turísticos <strong>de</strong>l Interior Centros fronterizos<br />
Total Distrlto Guada- M'onterrey, Total Guena- Mérida, More/la, Oaxaca, Zacatecas, Total Tijuana, Cd. Reynosa<br />
Año Fe<strong>de</strong>ral Jajara, N.L. Juato, Yuc. Mich. Oax. Zac. S.C. Juárez, Tamps.<br />
bl Jal. Gto. Chih.<br />
1981 34218 19036 12063 3119 9463 1 647 3138 2163 1 963 662 6798 4503 1 296<br />
1982 36419 19278 12799 3342 9974 1 769 3131 2433 1 978 663 7938 4490 2193 1266<br />
1983 36308 19494 12987 3827 10101 1 627 3170 2467 2146 691 7 716 4230 2193 1292<br />
1984 36666 19673 13143 3939 9946 1663 3141 2460 2000 681 7893 4266 2362 1 276<br />
1986 30934 13829 13203 3902 10186 1 722 3140 2463 2 176 684 8367 4674 2379 1314<br />
19S6 33649 16400 13226 3923 10198 1663 3200 2394 2266 686 8866 4917 2626 1423<br />
1987 34066 16948 13164 3964 10696 1 721 3160 2743 2460 621 8678 4706 2638 1434<br />
1988 34780 17698 13164 3918 10739 1 707 3222 2727 2432 661 8736 4704 2600 1432<br />
1989 34988 18128 13096 3766 10862 1 721 3078 2726 2441 897 8809 4742 2634 1433<br />
1990 36218 18138 13092 3988 11286 1 717 3188 2678 2672 1031 9018 4733 2794 1491<br />
1991 36839 18234 13148 4467 11 670 1 736 3388 2679 2734 1033 9094 2781 1496 4817<br />
al Cuartos <strong>de</strong> hotel <strong>de</strong> categoría <strong>de</strong> uno a cinco estrellas, Gran Turismo y Clase EspeCIal. Se excluyen estableCImientos <strong>de</strong> clase económica, sin clasificación hotelera, establecimientos<br />
<strong>de</strong> tiempo compartido y similares.<br />
b! Se incluye muestras <strong>de</strong> hoteles <strong>de</strong> categoría dos y una estrella.<br />
FUENTE: Secretaría <strong>de</strong> Turismo. Fondo Nacional <strong>de</strong> Fomento al Turismo. Aeropuertos y Servicios Auxiliares.
VISITANTES EXTRANJEROS HOSPEDADOS EN CENTROS SELECCIONADOS DEL PAIS CUADRO 9.12<br />
1981-91 (1' parte)<br />
IMiles)<br />
Total Integralmente planeados TradicIOnales<br />
Total Cancún, Ixtapa Loreto, Los Total Acapulco, Cozumel, La Paz, Manza- Mazatlán, Puerto Veracruz,<br />
Año Q. Roo Z¡huata- S.C.S. Cabos, Gro. a, Roo S.C.S. nll10, Sin. VaUarta, Ver.<br />
neJo, Gro. B.C.S. Col. Jal.<br />
1981 3 535.9 382.0 276.8 49.9 18.3 37.0 1309.2 614.4 121.4 59.6 24.4 188.3 253.1 48.0<br />
1982 3 625.2 480.3 336.4 69.5 19.1 66.3 1 374.8 685.0 107.1 66.6 26.3 236.8 316.2 48.8<br />
1983 4312.0 762.2 510.2 139.5 27.8 84.7 1668.3 634.7 141.5 53.7 26.9 272.0 496.6 43.0<br />
1984 4 234.4 783.2 499.6 149.3 31.1 103.2 1560.2 624.9 134.2 47.7 45.4 240.0 442.3 25.7<br />
1985 3403.3 751.6 503.0 114.7 28.4 105.5 1277.0 522.2 128.6 38.9 44.0 194.0 330.0 19.3<br />
1986 3582.3 903.0 641.9 109.8 30.7 120.6 1 253.2 514.8 141.4 45.7 37.2 199.8 295.8 18.6<br />
1987 4476.4 1088.0 760.6 145.6 34.4 147.5 1648.6 682.3 169.9 59.0 50.8 271.0 396.8 19.7<br />
1988 4 206.5 983.1 667.5 157.8 29.6 138.3 1 494.4 638.5 129.3 61.8 47.8 285.7 321.4 19.9<br />
1989 4 17 2.3 1 173.3 867.1 128.6 22.4 166.2 1412.0 617 .7 130.1 47.1 46.0 261.8 290.2 19.1<br />
1990 4572.3 1 643.9 180.6 109.3 26.1 228.0 1 254.3 417.1 170.3 45.9 60.2 243.9 307.1 19.8<br />
1991 4 720.9 1 841.4 432.4 114.6 28.6 266.0 1 130.5 329.0 162.6 44.2 50.0 229.3 308.7 16.8<br />
CU."'.DRO 9.12<br />
(2' parte y última)<br />
Gran<strong>de</strong>s ciuda<strong>de</strong>s Centros turístIcos <strong>de</strong>l Interior Centros hontenzos<br />
Total LJlstrlto lJuada- ivlonterrey, Total Guana- Ménda, Morella, Osxaca. Zacatecas, Total T1Juana, Cd. Reynosa<br />
Año Fe<strong>de</strong>ral lajara, N.L. Juato, Yuc. Mich. Oax. Zac. B.C. Juárez, Tamps.<br />
a' Jal. Gto. Chih.<br />
1981 1 261.7 1019.8 179.1 62.8 323.1 27.4 131.5 44.8 101.9 17.6 269.9 239.4 20.6<br />
1982 1 130.8 904.3 168.7 57.8 320.9 30.7 128.6 42.8 106.9 12.9 318.4 239.3 61.3 17.8<br />
1983 1 204.7 924.7 225.3 54.7 319.3 33.2 123.8 38.5 113.1 10.7 357.6 273.4 65.1 19.0<br />
1984 1 262.2 960.1 246.7 55.4 304.0 35.3 112.4 36.5 108.3 11.6 324.8 243.6 66.7 14.6<br />
i986 872.2 662.0 146.4 63.8 216.2 23.8 97.2 18.7 69.4 7.1 286.3 205.0 66.9 14.4<br />
1986 872.4 634.5 142.6 95.4 226.7 21.7 112.0 13.8 74.7 4.6 327.0 241.0 73.2 12.8<br />
1987 1040.4 812.4 137.0 91.0 319.5 26.1 163.3 17.8 106.3 6.0 379.0 280.4 86.7 11.9<br />
1988 1 066.2 823.2 134.3 98.7 330.0 27.7 160.0 20.3 124.2 7.8 341.8 259.9 71.8 10.1<br />
1989 914.6 687.9 132.6 94.1 296.4 26.3 138.2 18.0 104.4 9.6 377.1 295.9 72.4 8.8<br />
1990 1048.1 793.8 167.3 97.0 331.2 27.3 164.0 17.3 110.6 12.1 394.8 316.2 72.4 7.2<br />
1991 1 015.2 786.7 136.7 92.8 373.3 33.0 190.9 16.0 121.4 12.0 360.6 70.0 7.1 283.4<br />
t\)<br />
al Se incluye muestras <strong>de</strong> hoteles <strong>de</strong> categoría dos y una estrella.<br />
O<br />
W FUENTE: Secretaría <strong>de</strong> Turismo. Fondo Nacional <strong>de</strong> Fomento al Turismo. Aeropuertos y Servicios AUXiliares. <strong>1992</strong><br />
<strong>Mexicanos</strong>. <strong>Unidos</strong> <strong>Estados</strong> <strong>los</strong> <strong>de</strong> <strong>Estadístico</strong> <strong>Anuario</strong> INEGI.
TURISMO Y TRANSACCIONES FRONTERIZAS EN El PAIS CUADRO 9.13<br />
1980-91 (3' parte)<br />
Turismo e§lres,vo<br />
Año Número <strong>de</strong> tUristas (miles) Gasto medio (dólares) Gasto medio d"larlo (dólares)<br />
Total Vía Vía Total Vía Vía Total Vía Vía<br />
aérea terrestre aérea terrestre aérea terrestre<br />
1980 3 322.8 966.0 2366.8 314.1 667.3 171.4 46.9 67.4 31.2<br />
1981 3 969.0 239.9 2719.1 396.9 769.0 227.2 66.7 76.1 40.6<br />
1982 2671.2 776.6 1 895.6 294.9 628.2 168.6 46.1 66.4 31.1<br />
1983 1 970.6 490.2 1 480.4 223.9 569.6 109.6 35.5 66.9 21.6<br />
1984 2697.1 716.9 1 981.2 240.5 562.3 124.2 33.2 56.8 24.8<br />
1985 2730.5 739.0 1 991.6 243.3 660.2 126.7 34.3 67.2 20.6<br />
1986 2469.5 656.5 1813.0 251.1 562.3 138.5 34.4 62.1 22.7<br />
1987 2881 .7 789.3 2092.4 272.1 628.9 175.3 37.1 61 .1 28.3<br />
1988 3351 .2 938.6 2412.6 329.1 663.6 199.8 42.6 61 .2 30.4<br />
1989 3 862.9 1 112.0 2 760.9 399.9 87004 209.7 4H.9 68.1 34.6<br />
1990 4 321.2 1 272.3 3048.9 448.1 946.9 240.0 60.4 81.2 42.4<br />
1991 P 4 172.9 1 219.3 2 963.6 450.2 902.8 263.3 62.5 80.2 47.7<br />
CUADRO 9.13<br />
14' parte y última)<br />
TUrismo e2resivo Saldo turístiCO Transacciones frontenzas<br />
Año Permanencia media (días) (Ingresos - Egresos) (millones <strong>de</strong> dólares)<br />
Total Via Vía Ingresos Egresos Saldo<br />
aérea terrestre<br />
1980 6.7 9.9 6.6 627.6 3722.1 3129.6 692.6<br />
1981 7.0 10.1 6.6 188.6 4770.1 4 584.3 185.8<br />
1982 6.4 9.6 5.1 618.2 237.0 1420.6 - 183.6<br />
1983 6.3 10.0 6.1 1 183.2 10404 141.7 - 37.3<br />
1984 6.3 9.9 6.0 1 304.1 329.0 620.0 - 191.0<br />
1985 7.1 9.8 6.1 1 05604 1 180.6 1 694.4 - 413.8<br />
1986 7.3 10.8 6.1 1 171.6 1 191.9 1493.1 ·301.2<br />
1987 7.3 10.3 6.2 1490.2 1 226.0 1681.6 ·366.6<br />
1988 7.8 10.8 6.6 1439.5 1466.9 2096.7 - 640.8<br />
1989 8.0 12.8 6.1 1409.3 18122 2 702.6 - 890.3<br />
1990 704 11.7 6.6 1464.4 2066.1 3682.2 -1 619.1<br />
1991 P 7.2 11.3 5.6 1 906.2 2149.8 3862.1 -1 712.3<br />
NOTA: Las Cifras parciales pue<strong>de</strong>n no cOincidir con el total, <strong>de</strong>bido al redon<strong>de</strong>o.<br />
FUENTE: Banco <strong>de</strong> MéXICO. Dirección <strong>de</strong> Investigación Económica.<br />
INEGI. <strong>Anuario</strong> <strong>Estadístico</strong> <strong>de</strong> <strong>los</strong> <strong>Estados</strong> <strong>Unidos</strong> <strong>Mexicanos</strong>. <strong>1992</strong><br />
205
INEGI. <strong>Anuario</strong> <strong>Estadístico</strong> <strong>de</strong> <strong>los</strong> <strong>Estados</strong> <strong>Unidos</strong> <strong>Mexicanos</strong>. <strong>1992</strong><br />
TURISMO RECEPTIVO POR OBJETO DEL VIAJE<br />
1980-91<br />
(Miles <strong>de</strong> personas)<br />
Año<br />
1980<br />
1981<br />
1982<br />
1983<br />
1984<br />
1985<br />
1986<br />
1987<br />
1988<br />
1989<br />
1990<br />
1991 P<br />
Año<br />
1980<br />
1981<br />
1982<br />
1983<br />
1984<br />
1985<br />
1986<br />
1987<br />
1988<br />
1989<br />
1990<br />
1991 P<br />
Año<br />
1980<br />
1981<br />
1982<br />
1983<br />
1984<br />
1985<br />
1986<br />
1987<br />
1988<br />
1989<br />
1990<br />
1991 P<br />
Total<br />
4144<br />
4038<br />
3767<br />
4749<br />
4655<br />
4207<br />
4625<br />
5407<br />
5692<br />
6186<br />
6393<br />
6372<br />
Total<br />
3626<br />
3483<br />
3234<br />
4236<br />
4135<br />
3676<br />
4070<br />
4806<br />
4707<br />
4906<br />
4922<br />
4922<br />
Total<br />
618<br />
656<br />
533<br />
514<br />
619<br />
631<br />
555<br />
601<br />
985<br />
280<br />
1471<br />
1460<br />
Placer<br />
2736<br />
2886<br />
2657<br />
3557<br />
3375<br />
3095<br />
3462<br />
4300<br />
4395<br />
4317<br />
4178<br />
4454<br />
Placer<br />
2611<br />
2732<br />
2476<br />
3372<br />
3151<br />
2873<br />
3237<br />
4032<br />
3916<br />
3986<br />
3936<br />
4047<br />
Placer<br />
125<br />
153<br />
181<br />
186<br />
224<br />
223<br />
225<br />
268<br />
479<br />
332<br />
243<br />
407<br />
Turismo receptivo total<br />
Negocios Estudios Tránsito<br />
395<br />
314<br />
291<br />
265<br />
354<br />
294<br />
328<br />
288<br />
353<br />
326<br />
366<br />
324<br />
Negocios<br />
376<br />
294<br />
272<br />
249<br />
329<br />
272<br />
302<br />
264<br />
313<br />
282<br />
342<br />
306<br />
Negocios<br />
20<br />
20<br />
19<br />
16<br />
25<br />
23<br />
26<br />
24<br />
40<br />
44<br />
22<br />
19<br />
12<br />
16<br />
18<br />
17<br />
23<br />
18<br />
23<br />
21<br />
19<br />
26<br />
21<br />
43<br />
61<br />
20<br />
22<br />
28<br />
28<br />
23<br />
26<br />
18<br />
26<br />
26<br />
61<br />
79<br />
Extranjeros<br />
Estudios Tránsito<br />
11<br />
14<br />
16<br />
16<br />
20<br />
16<br />
21<br />
19<br />
16<br />
23<br />
21<br />
41<br />
50<br />
19<br />
21<br />
27<br />
27<br />
22<br />
24<br />
17<br />
23<br />
24<br />
60<br />
78<br />
Nacionales a/<br />
Estudios TránsitJ;l:<br />
NOTA: Las cifras parciales pue<strong>de</strong>n no coincidir con el total, <strong>de</strong>bido al redon<strong>de</strong>o.<br />
a/ Se refiere a 10$ nacionales que resi<strong>de</strong>n en el exterior.<br />
FUENTE: Secretaría <strong>de</strong> Turismo, con base en cifras <strong>de</strong>l Banco <strong>de</strong> México.<br />
206<br />
1<br />
2<br />
2<br />
2<br />
2<br />
2<br />
3<br />
3<br />
1<br />
2<br />
4<br />
CUADRO 9.14<br />
(1" parte)<br />
Visita 8 Visita 8 Otros<br />
familiares amista<strong>de</strong>s<br />
736<br />
702<br />
667<br />
698<br />
571<br />
576<br />
660<br />
664<br />
796<br />
1294<br />
1646<br />
1216<br />
172<br />
70<br />
66<br />
96<br />
140<br />
109<br />
69<br />
71<br />
69<br />
155<br />
161<br />
141<br />
43<br />
31<br />
46<br />
88<br />
164<br />
92<br />
68<br />
65<br />
36<br />
44<br />
72<br />
116<br />
CUADRO 9.14<br />
(2" parte)<br />
Visita 8 Visita 8 Otros<br />
familiares amista<strong>de</strong>s<br />
384<br />
339<br />
360<br />
403<br />
344<br />
326<br />
366<br />
368<br />
349<br />
433<br />
380<br />
263<br />
168<br />
67<br />
67<br />
85<br />
119<br />
92<br />
61<br />
67<br />
57<br />
126<br />
124<br />
120<br />
37<br />
27<br />
42<br />
84<br />
146<br />
76<br />
60<br />
49<br />
34<br />
33<br />
69<br />
77<br />
CUADRO 9.14<br />
(3" parte y última)<br />
Visita 8 Visita 8 Otros<br />
familiares amista<strong>de</strong>s<br />
351<br />
363<br />
316<br />
296<br />
227<br />
261<br />
286<br />
286<br />
446<br />
861<br />
1 164<br />
962<br />
14<br />
13<br />
9<br />
11<br />
21<br />
17<br />
8<br />
14<br />
12<br />
29<br />
27<br />
20<br />
6<br />
4<br />
6<br />
4<br />
19<br />
15<br />
8<br />
6<br />
10<br />
13<br />
38
TURISMO EGRESIVO POR OBJETO DEL VIAJE<br />
1980-91<br />
(Miles <strong>de</strong> personas)<br />
CUADRO 9.15<br />
(1' parte)<br />
Turismo epresiyo total<br />
Año Total Placer Negocios EstudIOS Visita a Visita a Atención Compras Otros<br />
familiares amista<strong>de</strong>s médica<br />
1980<br />
1981<br />
1982<br />
1983<br />
1984<br />
1985<br />
1986<br />
1987<br />
1988<br />
1989<br />
1990<br />
1991 P<br />
Año<br />
1980<br />
1981<br />
1982<br />
1983<br />
1984<br />
1985<br />
1986<br />
1987<br />
1988<br />
1989<br />
1990<br />
1991 P<br />
Año<br />
1980<br />
1981<br />
1982<br />
1983<br />
1984<br />
1985<br />
1986<br />
1987<br />
1988<br />
1989<br />
1990<br />
1991 P<br />
3323<br />
3969<br />
2671<br />
1 971<br />
2697<br />
2731<br />
2469<br />
2882<br />
3351<br />
3863<br />
4321<br />
4 173<br />
Total<br />
956<br />
1240<br />
776<br />
511<br />
716<br />
739<br />
656<br />
789<br />
939<br />
112<br />
1 272<br />
1 219<br />
Total<br />
2367<br />
2719<br />
1 896<br />
1460<br />
1981<br />
1 992<br />
1 813<br />
2093<br />
2412<br />
2751<br />
3049<br />
2964<br />
1 666<br />
2033<br />
1 218<br />
936<br />
1286<br />
1073<br />
1049<br />
1275<br />
1 311<br />
1 606<br />
1435<br />
1530<br />
333<br />
273<br />
226<br />
185<br />
222<br />
244<br />
223<br />
239<br />
331<br />
321<br />
382<br />
256<br />
Placer Negocios<br />
491<br />
821<br />
426<br />
260<br />
403<br />
387<br />
308<br />
392<br />
457<br />
598<br />
668<br />
683<br />
312<br />
241<br />
209<br />
163<br />
210<br />
241<br />
216<br />
225<br />
309<br />
303<br />
330<br />
228<br />
Placer Negocios<br />
1076<br />
1213<br />
792<br />
675<br />
883<br />
686<br />
741<br />
883<br />
864<br />
1007<br />
777<br />
846<br />
21<br />
32<br />
17<br />
22<br />
11<br />
3<br />
14<br />
21<br />
18<br />
61<br />
28<br />
19<br />
26<br />
20<br />
22<br />
10<br />
16<br />
24<br />
23<br />
20<br />
29<br />
31<br />
22<br />
878<br />
808<br />
741<br />
569<br />
729<br />
1016<br />
927<br />
926<br />
1 238<br />
1 317<br />
1 596<br />
1 561<br />
168<br />
164<br />
101<br />
71<br />
80<br />
71<br />
53<br />
75<br />
83<br />
146<br />
205<br />
174<br />
1:30<br />
163<br />
141<br />
85<br />
110<br />
129<br />
123<br />
135<br />
69<br />
216<br />
156<br />
116<br />
235<br />
255<br />
364<br />
491<br />
459<br />
195<br />
430<br />
33<br />
73<br />
90<br />
35<br />
44<br />
5<br />
19<br />
32<br />
27<br />
26<br />
52<br />
48<br />
CUADRO 9.15<br />
(2' parte)<br />
Estudios<br />
Vía aérea<br />
Visita a Visita a Atención Compras Otros<br />
familiares nmista<strong>de</strong>s<br />
11 68 18<br />
313<br />
12<br />
16 80 20 41<br />
16<br />
13 61 12 34<br />
6 17<br />
6 44<br />
6 19<br />
1 13<br />
57<br />
9<br />
17<br />
5<br />
8 62<br />
6 30 o<br />
3<br />
22<br />
11<br />
19<br />
54<br />
89<br />
87<br />
10<br />
11<br />
16<br />
27<br />
2
GASTO DEL TURISMO EGRESIVO POR OBJETO DEL VIAJE<br />
1980-91<br />
(Millones <strong>de</strong> dólares)<br />
CUADRO 9.17<br />
(1· parte)<br />
Turismo egresivo total<br />
Año Total Placer Negocios Estudios Visita 8 Visita a Atención Compras Otros<br />
familiares amista<strong>de</strong>s médica<br />
1980<br />
1981<br />
1982<br />
1983<br />
1984<br />
1985<br />
1986<br />
1987<br />
1988<br />
1989<br />
1990<br />
1991 P<br />
Año<br />
1980<br />
1981<br />
1982<br />
1983<br />
1984<br />
1985<br />
1986<br />
1987<br />
1988<br />
1989<br />
1990<br />
1991 P<br />
Año<br />
1980<br />
1981<br />
1982<br />
1983<br />
1984<br />
1985<br />
1986<br />
1987<br />
1988<br />
1989<br />
1990<br />
1991 P<br />
1043.6<br />
1 571.1<br />
787.7<br />
441.3<br />
648.6<br />
664.3<br />
620.2<br />
784.3<br />
1 104.8<br />
1544.8<br />
936.5<br />
878.0<br />
Total<br />
637.9<br />
953.4<br />
487.1<br />
280.8<br />
402.6<br />
414.0<br />
369.1<br />
417.5<br />
622.8<br />
967.8<br />
204.7<br />
100.7<br />
Total<br />
406.6<br />
617.7<br />
300.5<br />
160.6<br />
246.0<br />
250.4<br />
261.1<br />
366.8<br />
482.0<br />
677.0<br />
731.8<br />
777.3<br />
636.6<br />
990.6<br />
435.6<br />
214.9<br />
322.1<br />
318.6<br />
277.4<br />
396.8<br />
616.6<br />
789.0<br />
868.4<br />
932.2<br />
229.8<br />
206.0<br />
145.0<br />
104.3<br />
149.3<br />
143.7<br />
146.2<br />
126.6<br />
222.4<br />
246.6<br />
363.6<br />
206.8<br />
Placer Negocios<br />
328.0<br />
638.2<br />
267.9<br />
136.2<br />
204.8<br />
207.8<br />
157.0<br />
209.5<br />
306.1<br />
638.0<br />
614.1<br />
617.8<br />
224.3<br />
197.0<br />
142.4<br />
101.4<br />
147.1<br />
143.1<br />
143.0<br />
124.0<br />
216.7<br />
239.6<br />
340.3<br />
192.9<br />
Placer Negocios<br />
208.6<br />
362.4<br />
167.7<br />
78.7<br />
117.3<br />
110.8<br />
120.3<br />
186.3<br />
209.4<br />
261.0<br />
264.3<br />
314.3<br />
6.6<br />
8.9<br />
2.6<br />
2.9<br />
2.1<br />
0.6<br />
2.1<br />
2.6<br />
6.8<br />
7.1<br />
23.3<br />
13.8<br />
12.2<br />
20.8<br />
11.3<br />
7.6<br />
4.3<br />
12.9<br />
16.6<br />
10.6<br />
20.8<br />
60.0<br />
38.2<br />
37.9<br />
139.7<br />
166.4<br />
90.3<br />
64.6<br />
87.3<br />
123.2<br />
112.8<br />
144.9<br />
202.6<br />
239.8<br />
290.7<br />
329.6<br />
30.3<br />
31.8<br />
15.6<br />
8.2<br />
11.8<br />
7.7<br />
9.7<br />
11.4<br />
17.9<br />
42.0<br />
60.0<br />
61.2<br />
40.7<br />
56.7<br />
43.5<br />
26.7<br />
29.2<br />
36.4<br />
28.4<br />
34.0<br />
38.3<br />
46.6<br />
73.1<br />
78.2<br />
37.9<br />
87.3<br />
28.3<br />
9.3<br />
31.8<br />
20.9<br />
23.1<br />
43.6<br />
72.8<br />
116.3<br />
197.6<br />
187.2<br />
16.6<br />
22.5<br />
18.4<br />
6.8<br />
12.7<br />
1.9<br />
8.2<br />
17.5<br />
14.6<br />
16.3<br />
46.0<br />
45.0<br />
CUADRO 9.17<br />
(2" parte)<br />
Estudios<br />
Vía aérea<br />
Visita a Visita a Atención Compras Otros<br />
familiares amista<strong>de</strong>s médica<br />
8.4<br />
14.6<br />
9.4<br />
3.9<br />
4.3<br />
11.7<br />
16.0<br />
8.3<br />
20.7<br />
48.9<br />
36.3<br />
36.6<br />
38.3<br />
48.5<br />
24.7<br />
16.1<br />
25.4<br />
29.6<br />
19.0<br />
30.1<br />
33.9<br />
69.8<br />
86.6<br />
90.7<br />
7.6<br />
11.9<br />
5.6<br />
2.1<br />
4.1<br />
2.7<br />
3.6<br />
3.9<br />
6.6<br />
17.8<br />
16.4<br />
23.6<br />
18.6<br />
26.8<br />
24.4<br />
14.6<br />
10.7<br />
17.0<br />
22.5<br />
22.7<br />
20.1<br />
28.3<br />
47.1<br />
61.8<br />
2.7<br />
3.4<br />
2.8<br />
0.9<br />
2.3<br />
0.2<br />
0.8<br />
2.6<br />
7.7<br />
19.1<br />
20.0<br />
43.3<br />
10.2<br />
13.1<br />
10.1<br />
6.6<br />
4.0<br />
1.9<br />
8.2<br />
16.6<br />
11.1<br />
16.4<br />
43.9<br />
44.2<br />
CUADRO 9.17<br />
(3" parte y última)<br />
Estudios<br />
Vía terrestre<br />
Visita a ViSita 8 Atención Compras Otros<br />
familiares amista<strong>de</strong>s médica<br />
3.8<br />
6.2<br />
1.9<br />
3.7<br />
0.1<br />
1.3<br />
0.6<br />
2.2<br />
0.1<br />
1.1<br />
1.9<br />
1.4<br />
101.4<br />
106.9<br />
66.7<br />
48.4<br />
62.0<br />
93.6<br />
93.8<br />
114.8<br />
168.6<br />
179.9<br />
204.1<br />
238.9<br />
NOTA: Las cifras parciales pue<strong>de</strong>n no coincidir con el total, <strong>de</strong>bido al redon<strong>de</strong>o.<br />
FUENTE: Secretaria <strong>de</strong> Turismo, con base en cifras <strong>de</strong>l Banco <strong>de</strong> México.<br />
22.7<br />
20.0<br />
10.1<br />
6.1<br />
7.6<br />
6.0<br />
6.1<br />
7.6<br />
11.3<br />
24.3<br />
43.6<br />
37.7<br />
22.2<br />
29.9<br />
19.0<br />
11.1<br />
18.6<br />
18.4<br />
6.9<br />
11.3<br />
18.2<br />
17.3<br />
26.9<br />
26.4<br />
36.2<br />
84.0<br />
26.4<br />
8.4<br />
29.6<br />
20.6<br />
22.4<br />
41.1<br />
66.1<br />
96.2<br />
177.7<br />
144.0<br />
6.4<br />
9.4<br />
8.3<br />
1.2<br />
8.7<br />
0.0<br />
0.0<br />
1.0<br />
3.6<br />
0.1<br />
1.1<br />
0.8<br />
209<br />
INEGI. <strong>Anuario</strong> <strong>Estadístico</strong> <strong>de</strong> <strong>los</strong> <strong>Estados</strong> <strong>Unidos</strong> <strong>Mexicanos</strong>. <strong>1992</strong>
INEGI. <strong>Anuario</strong> <strong>Estadístico</strong> <strong>de</strong> <strong>los</strong> <strong>Estados</strong> <strong>Unidos</strong> <strong>Mexicanos</strong>. <strong>1992</strong><br />
TURISMO RECEPTIVO Y EGRESIVO POR LUGAR DE<br />
ORIGEN Y DESTINO<br />
1980-91<br />
IMiles <strong>de</strong> personas)<br />
CUADRO 9.18<br />
Turismo receptivo según lugar <strong>de</strong> origen<br />
TUrismo egresivo según lugar <strong>de</strong> <strong>de</strong>stino<br />
Total Esta- Ca- fu- Amé- Otros Total Esta· Ca· Amé- Amé- Eu- Asia Otros<br />
Año dos nadá ropa rica<br />
dos nadá rica rica ropa<br />
Uní- Latina<br />
Ur central <strong>de</strong>l<br />
dos<br />
dos<br />
sur<br />
1980<br />
1981<br />
1982<br />
1983<br />
1984<br />
1985<br />
1986<br />
1987<br />
1988<br />
1989<br />
4144 3443<br />
4038 3448<br />
3767 3241<br />
4 749 4093<br />
4654 3935<br />
4207 3541<br />
4626 3895<br />
5407 4620<br />
6692 5016<br />
6 186 5385<br />
1990 6 393 5 598<br />
1991 P 6372 5346<br />
170 240 254<br />
125 170 267<br />
85 173 241<br />
170 180 279<br />
187 214 289<br />
193 146 301<br />
247 149 318<br />
336 219 205<br />
313 112 225<br />
361 157 261<br />
294 189<br />
260 328<br />
276<br />
398<br />
37<br />
28<br />
27<br />
27<br />
29<br />
26<br />
16<br />
27<br />
26<br />
22<br />
36<br />
40<br />
3323 3026<br />
3969 3568<br />
2671 2476<br />
1 971 1 846<br />
2697 2518<br />
2 731 2 642<br />
2470 2303<br />
2 882 2 687<br />
33513116<br />
3863 3587<br />
4321 4005<br />
4 173 3866<br />
FUENTE: Secretaria <strong>de</strong> Turismo, con base en cifras <strong>de</strong>l Banco <strong>de</strong> México.<br />
FINANCIAMIENTO DE LA ACTIVIDAD TURISTICA al<br />
1980-91<br />
Año<br />
1980<br />
1981<br />
1982<br />
1983<br />
1984<br />
1986 di<br />
1986 di<br />
1987<br />
1988 di<br />
1989<br />
OperacIones<br />
<strong>de</strong><br />
crédito<br />
185<br />
196<br />
127<br />
66<br />
110<br />
183<br />
209<br />
165<br />
141<br />
151<br />
M anta aprobado b/<br />
(MIles <strong>de</strong> (Millones<br />
nuevos<br />
pesos)<br />
6684<br />
11 198<br />
8352<br />
6704<br />
30596<br />
46210<br />
86842<br />
181034<br />
23031<br />
284 106<br />
<strong>de</strong> dólares)<br />
16<br />
127<br />
Inversión generada el<br />
(Miles <strong>de</strong> (Millones<br />
nuevos <strong>de</strong><br />
pesos) dólares}<br />
13158<br />
21 887<br />
16542<br />
lO 409<br />
61 218<br />
60640<br />
143004<br />
327784<br />
31846<br />
764445<br />
12<br />
16<br />
lO<br />
6<br />
9<br />
lO<br />
9<br />
11<br />
12<br />
14<br />
17<br />
16<br />
63<br />
79<br />
39<br />
26<br />
34<br />
41<br />
34<br />
39<br />
45<br />
51<br />
59<br />
60<br />
29 164<br />
39 219<br />
17 107<br />
11 68<br />
16 99<br />
16 102<br />
14 91<br />
16 106<br />
21 130<br />
25 154<br />
28<br />
27<br />
176<br />
168<br />
11 18<br />
15 23<br />
7 16<br />
4 lO<br />
14<br />
7 13<br />
6 13<br />
8 16<br />
8 19<br />
lO 22<br />
11<br />
11<br />
26<br />
25<br />
CUADRO 9.19<br />
1990 124 177 484 14 439 143 63 3947 9868 3479 1 156<br />
1991 P 128 378929 33 1 106672 96 4563 11 401 4666 1823<br />
al Incluye únicamente lo autorizado por el Fondo Nacional <strong>de</strong> Fomento al Turismo, <strong>de</strong>l Programa <strong>de</strong> Egresos<br />
<strong>de</strong> la Fe<strong>de</strong>ración.<br />
b/ Crédito autorizado por FONATUR. A partir <strong>de</strong> 1988 se realizaron operaciones con dólares.<br />
el Inversión realizada por el sector privado más crédito autorizado por FONATUR. A partir <strong>de</strong> 1988 se realizaron<br />
operaciones con dólares.<br />
dI Incluye <strong>los</strong> montos asignados al Programa Especial <strong>de</strong> Reconstrucción a instalaciones hoteleras.<br />
FUENTE: Secretaría <strong>de</strong> Turismo. Fondo Nacional <strong>de</strong> Fomento al TUrismo.<br />
210<br />
21<br />
327<br />
Empleo<br />
generadodirecto<br />
lO 035<br />
12320<br />
3846<br />
929<br />
4958<br />
5572<br />
3746<br />
4067<br />
263<br />
5191<br />
Empleo<br />
generadoindirecto<br />
25088<br />
30800<br />
9613<br />
2323<br />
12395<br />
Cuartos<br />
nuevos<br />
13606<br />
15244<br />
4745<br />
868<br />
5275<br />
13930 6002<br />
9363 6545<br />
lO 168 5058<br />
706 403<br />
12796 6794<br />
Cuartos<br />
remo<strong>de</strong>lados<br />
y rehabilitados<br />
1521<br />
2092<br />
2001<br />
356<br />
3196<br />
7574<br />
7962<br />
1864<br />
3427<br />
4444
CAPITULO "10<br />
CUENTAS<br />
NACIONALES<br />
INEGI. <strong>Anuario</strong> <strong>Estadístico</strong> <strong>de</strong> <strong>los</strong> <strong>Estados</strong> <strong>Unidos</strong> <strong>Mexicanos</strong>. <strong>1992</strong>
INEGI. <strong>Anuario</strong> <strong>Estadístico</strong> <strong>de</strong> <strong>los</strong> <strong>Estados</strong> <strong>Unidos</strong> <strong>Mexicanos</strong>. <strong>1992</strong><br />
PRODUCTO Y GASTO INTERNO BRUTO<br />
1980-91<br />
(Millones <strong>de</strong> nuevos pesos corrientes)<br />
Producto interno bruto<br />
CUADRO 10.1<br />
(1" parte)<br />
Año Total Remunera- Exce<strong>de</strong>nte Consumo Impuestos Menos:<br />
cíón <strong>de</strong> <strong>de</strong> <strong>de</strong> capital indirectos Subsidios<br />
asalariados operación fijo<br />
1980 4470.1 1610.9 2132.7 383.5 432.0 -89.1<br />
1981 6 127.6 2 296.4 2847.4 527.2 579.3 -121.7<br />
1982 9 797.8 3460.2 4633.4 966.3 1 135.3 -277.3<br />
1983 17878.7 6247.7 9128.9 2 176.3 1924.1 -598.3<br />
1984 29471.6 8444.8 15 292.6 3368.7 3164.1 -788.6<br />
1986 47391.7 13 589.8 24043.2 6331.2 5 688.2 -1 260.7<br />
1986 79 191.3 22 606.2 39 396.4 lO 870.9 8 540.9 -2222.0<br />
1987 193311.5 51 878.4 97420.7 25 284.4 23 523.1 -4 795.0<br />
1988 390451.3 102178.8 205898.3 46762.7 42 548.3 -6 936.8<br />
1989 507618.0 130490.4 275701.3 53637.0 66 244.6 -8455.4<br />
1990 686405.7 171416.6 382538.0 66 238.8 74873.4 -8 660.0<br />
1991 865 165.7 222959.7 473661.6 82435.7 93861.5 -7742.8<br />
Gasto interno bruto<br />
CUADRO 10.1<br />
(2" parte y última)<br />
Total Consumo Gasto Variación Formación Exportación Menos:<br />
Año final privado <strong>de</strong> <strong>de</strong> bruta <strong>de</strong> <strong>de</strong> bienes y Importación<br />
administración consumo existencias capital fijo servicios <strong>de</strong> bienes y<br />
pública final servicios<br />
1980 4470.1 448.7 2908.8 107.2 1 106.8 478.6 -680.0<br />
1981 6 127.6 660.0 3944.9 60.7 1616.8 637.7 ·792.6<br />
1982 9 797.8 1026.8 6036.1 -4.4 2248.8 1502.1 -1010.7<br />
1983 17 878.7 1673.7 10881.7 673.3 3137.0 3 397 A -1 684.4<br />
1984 29471.6 2721.7 18689.9 666.6 5 287.2 5122.4 -2816.3<br />
1985 47391.7 4 374.0 30674.9 986.5 9048.3 7 305.3 -4897.3<br />
1986 79 191.3 7 208.2 54208.9 -734.1 16414.7 13732.4 -10638.8<br />
1987 193311.6 16995.6 127267.6 1665.9 36666.8 37 692.4 -25876.6<br />
1988 390461.3 33 740.9 270997.7 4501.3 75 199.0 66567.0 -69 556.3<br />
1989 507618.0 42914.6 36690004 16479.8 92219.7 81 148.1 -82044.7<br />
1990 686405.7 67 798.6 486 364.4 22544.2 127727.6 108299.0 -116317.9<br />
1991 866166.7 77 971.4 620216.4 25468.8 168014.0 120681.7 -147 176.6<br />
FUENTE: Instituto Nacional <strong>de</strong> Estadística Geografía e Informática. Sistema <strong>de</strong> Cuentas Nacionales <strong>de</strong> México. Cuenta.<br />
Consolidadas <strong>de</strong> la Nación. <strong>1992</strong>.<br />
214
INEGI. <strong>Anuario</strong> <strong>Estadístico</strong> <strong>de</strong> <strong>los</strong> <strong>Estados</strong> <strong>Unidos</strong> <strong>Mexicanos</strong>. <strong>1992</strong><br />
ACUMULACION y FINANCIAMIENTO DEL CAPITAL CUADRO 10.3<br />
1980-91<br />
(Miles <strong>de</strong> nuevos pesos corrientes)<br />
(1' parte)<br />
Acumulación bruta<br />
Total Variación Formación Préstamo<br />
Año <strong>de</strong> bruta <strong>de</strong> neto al<br />
existencias capital fijo resto <strong>de</strong>l<br />
mundo<br />
1980 990 196 107226 1 106768 -223 789<br />
1981 1312663 60701 1616819 -364867<br />
1982 2 194282 -4378 2248806 -60146<br />
1983 4413766 673269 3136967 703630<br />
1984 6618263 565644 5 287 211 765408<br />
1986 10649847 986644 9048296 616007<br />
1986 14389763 -734070 16414711 -290878<br />
1987 42531019 1 666903 36 666 849 6298267<br />
1988 76443647 4601 346 76199042 -4256741<br />
1989 96437166 16479840 92219706 -13262389<br />
1990 131806677 22644196 127727621 ·18466140<br />
1991 163767 832 26468843 168013961 -39704972<br />
Financiamiento <strong>de</strong> la acumulación bruta<br />
CUADRO 10.3<br />
(2' parte y última)<br />
Año Total Ahorro Consumo <strong>de</strong><br />
capital fijo<br />
1980 990196 606669 383636<br />
1981 1312663 785461 627202<br />
1982 2194282 1 237984 966298<br />
1983 4413766 2237609 2176267<br />
1984 6618263 3 269 670 3368693<br />
1986 10649847 6318661 6331 186<br />
1986 14389763 3618892 10870871<br />
1987 42531019 17246648 26284371<br />
1988 76443647 28680911 46762736<br />
1989 96437166 41800133 63637023<br />
1990 131 806677 66666837 66238840<br />
1991 163 767 832 71 332 137 82436696<br />
FUENTE: Instituto Nacional <strong>de</strong> Estadística Geograf1e e Informática. Sistema <strong>de</strong> Cuentas Nacionales <strong>de</strong> México, Cuentas<br />
Consolidadas <strong>de</strong> la Nación, <strong>1992</strong>.<br />
216
OFERTA Y UTllIZACION DE BIENES Y SERVICIOS CUADRO 10.6<br />
1980-91 (1' parte)<br />
(Millones <strong>de</strong> nuevos pesos, a precios comprador <strong>de</strong> 1980)<br />
Oferta Utilización<br />
Total Producción Importa- Derechos Márgenes Total Demanda<br />
bruta 8 ciones <strong>de</strong> <strong>de</strong> <strong>de</strong> intermedia<br />
Año precios <strong>de</strong> bienes y importa- comercia-<br />
productor servicios ción ¡ización y<br />
CIF distribución<br />
1980 7686.2 5598.1 580.0 41.8 1 466.4 7686.2 2 636.2<br />
1981 8421.8 6050.1 682.7 45.2 1643.8 8421.8 2 876.9<br />
1982 8077.5 6001.4 424.3 30.7 1621.1 8077 .5 2821.5<br />
1983 7 502.6 5 700.5 280.9 12.3 1508.9 7 502.6 2 592.7<br />
1984 7 826.6 5 905.3 330.9 14.3 1 576.1 7826.6 2 699.6<br />
1985 8083.9 6097.9 367.3 23.2 1 595.5 8083.9 2 796.2<br />
1986 7771.2 5 902.5 339.4 20.7 1 508.5 7 771.2 2696.0<br />
1987 7 939.9 6046.3 356.9 21.9 1 514.7 7 939.9 2 759.3<br />
1988 8 174.7 6124.1 487.9 31.1 1531.5 8 174.7 2803.1<br />
1989 8584.5 6 379.7 591.7 61.9 1 551.3 8 584.5 2945.6<br />
1990 9 117.5 6 715.4 708.5 81.6 612.0 9117.5 3 137.4<br />
1991 9575.8 6 972.9 824.9 115.0 1 663.0 9 575.8 3288.2<br />
Utilización<br />
Demanda final<br />
CUADRO 10.6<br />
(2' parte y última)<br />
Año Total Consumo FormacIón Variación Exporta-<br />
Total Privado De bruta <strong>de</strong> <strong>de</strong> ciones<br />
gobierno capital fijo existencias<br />
1980 5050.0 3 357.5 2 908.8 448.7 1 106.8 107.2 478.5<br />
1981 5544.9 3618.0 3123.2 494.8 1 286.4 106.6 533.9<br />
1982 5 256.0 3550.9 3046.0 504.9 1 070.4 -15.5 650.3<br />
1983 4909.8 3401.4 2 882.8 518.6 767.7 2.3 738.5<br />
1984 5127.0 3529.4 2976.6 552.8 817.0 ·0.1 780.6<br />
1985 5287.7 3 640.4 3082.6 557.8 881.2 20.3 746.9<br />
1986 5075.2 3 561.3 2995.3 566.1 777.2 ·51.0 787.7<br />
1987 5180.5 3550.5 2991.2 559.2 776.2 ·8.6 862.4<br />
1988 5371.6 3601.9 3045.5 556.4 821.1 36.5 912.1<br />
1989 5638.9 3807.7 3252.1 556.6 873.6 24.8 932.8<br />
1990 59UO.l 4018.4 3449.9 568.5 988.3 6.6 966.8<br />
1991 62117.6 4200.8 3610.0 690.8 1067.9 -0.2 1019.1<br />
FUENTE: Instituto '.Dcional <strong>de</strong> Estadí.tica Geografía e Informática. Si.teml. <strong>de</strong> Cuentas Naciontlles <strong>de</strong> México, Cuentas<br />
Consolidodas <strong>de</strong> la Nación. <strong>1992</strong>.<br />
219 INEGI. <strong>Anuario</strong> <strong>Estadístico</strong> <strong>de</strong> <strong>los</strong> <strong>Estados</strong> <strong>Unidos</strong> <strong>Mexicanos</strong>. <strong>1992</strong>
INEGI. <strong>Anuario</strong> <strong>Estadístico</strong> <strong>de</strong> <strong>los</strong> <strong>Estados</strong> <strong>Unidos</strong> <strong>Mexicanos</strong>. <strong>1992</strong><br />
PRODUCCION BRUTA POR ACTIVIDAD ECONOMICA DE ORIGEN CUADRO 10.7<br />
DE LOS BIENES Y SERVICIOS (1' parte)<br />
1980-91<br />
(Miles <strong>de</strong> nuevos pesos corrientes)<br />
Total 2 3 4<br />
Año Agropecuario, Minería Industria Construcción<br />
silvicultura manufacturera<br />
y pesca<br />
1980 7106236 610624 191998 2 386 193 608287<br />
1981 9663083 690420 204 173 3162696 887916<br />
1982 16223608 1 006222 389710 4800971 1 324661<br />
1983 27777 936 1 983236 1486196 8 806 887 1826118<br />
1984 46886486 3691018 1 989336 16676826 3001 667<br />
1986 75706918 6069924 2 786 706 25868851 4897862<br />
1986 129872274 10618416 3992373 46314 121 8040308<br />
1987 317677 796 24043908 12641666 114134462 18911464<br />
1988 666663 106 46966690 18297070 243746 734 38781 508<br />
1989 824882699 69148096 19776860 289684466 46645226<br />
1990 1 098401 668 79040058 25462508 366 176420 61 902203<br />
1991 1 376946934 95314626 26221 661 447 122291 80427249<br />
CUADRO 10.7<br />
(2' parte y última)<br />
6 6 8 9<br />
Electricidad, Comercio, Transporte, Servicios Servicios<br />
Año gas yagua restaurantes almacenamiento financieros, comunales,<br />
y hoteles y comunIca· seguros y sociales y<br />
ciones bienes personales<br />
Inmuebles<br />
1980 78923 1486036 404829 434370 1 006076<br />
1981 88469 2034423 668911 607280 1 438906<br />
1982 146131 3456606 866364 939406 2 295 737<br />
1983 276261 6139369 1 692078 1618219 3960682<br />
1984 612107 10163772 2930761 2613494 6617 606<br />
1986 832061 16014146 4696322 4161929 10600128<br />
1986 1887182 26184366 8623933 7463173 17768413<br />
1987 4162674 64763724 20920129 17016132 41 193748<br />
1988 9404698 133108660 43664329 37749007 84846619<br />
1989 12686020 169338398 64499 242 61 707296 111 498006<br />
1990 16868220 223487423 81 142447 93 166088 162167301<br />
1991 21876167 269082600 108324964 126368637 203207869<br />
FUENTE: Instituto Nacional <strong>de</strong> Estadística Geografía e Informática. Sistema <strong>de</strong> Cuental Nacionales <strong>de</strong> México. Cuentas<br />
Consolidadas <strong>de</strong> la Nación. <strong>1992</strong>.<br />
220
INEGI. <strong>Anuario</strong> <strong>Estadístico</strong> <strong>de</strong> <strong>los</strong> <strong>Estados</strong> <strong>Unidos</strong> <strong>Mexicanos</strong>. <strong>1992</strong><br />
DEMANDA INTERMEDIA POR ACTIVIDAD ECONOMICA<br />
DE ORIGEN<br />
1980-91<br />
(Miles <strong>de</strong> nuevos pesos corrientes)<br />
CUADRO 10.9<br />
(1" parte)<br />
Total 2 3 4<br />
Año Agropecuario, Minería Industria Construcción<br />
silvicultura manufacturera<br />
y pesca<br />
1980 2636 169 142476 47964 1 396293 321 123<br />
1981 3636461 187299 67069 1 826328 461 126<br />
1982 6426 817 286618 88176 2 768000 690012<br />
1983 9899216 691 089 212890 6034460 1 022646<br />
1984 17414911 1 067 676 326916 8968634 1 703431<br />
1986 28315216 1763316 668192 14800217 2827 736<br />
1986 60680927 3161964 1 093286 26868446 4667184<br />
1987 124366268 7218480 2731 988 64683268 11 024673<br />
1988 266101 806 16264843 6643716 138343963 23066338<br />
1989 317264600 19902627 6182216 166697666 26967 673<br />
1990 411996944 24229668 7766770 208996703 34672212<br />
1991 611 780210 28632309 8101 206 264696767 44210684<br />
CUADRO 10.9<br />
(2" parte y última)<br />
6 6 7 8 9 Rama 728.<br />
Electricidad, Comercio, Transporte, Servicios Servicios Servicios<br />
Año gas yagua restaur antes almacenamiento financieros, comunales, bancarios<br />
y hoteles y comunica· seguros y sociales y imputados<br />
ciones bienes personales<br />
inmuebles<br />
1980 34648 236464 119228 60624 239267 48183<br />
1981 32373 339094 163648 69613 333010 66901<br />
1982 67760 663989 268896 119462 617 606 86398<br />
1983 109014 1 066210 619682 221 498 976886 146961<br />
1984 230679 1 792143 926698 379734 1 683964 366436<br />
1986 383 190 2707691 1431 196 620734 2669246 663701<br />
1986 893681 4999409 2916726 1 236002 4840210 1026121<br />
1987 2062766 12338296 7163271 3266278 11 468899 2 629449<br />
1988 4446288 26486864 14136931 7086606 26006698 6733681<br />
1989 6899999 33 900 374 16889484 8902943 30026191 3006628<br />
1990 7 378666 44704626 24637023 12193014 39866660 7661 903<br />
1991 8808114 64932263 31 780073 16969104 62746714 11 016097<br />
FUENTE: Instituto Nacional <strong>de</strong> Estadística Geografía e Informática. Sistema <strong>de</strong> Cuentas Nacionales <strong>de</strong> México. Cuentas<br />
Consolidadas <strong>de</strong> la Nación. <strong>1992</strong>.<br />
222
DEMANDA INTERMEDIA POR ACTIVIDAD ECONOMICA CUADRO 10.10<br />
DE ORIGEN (1" parte)<br />
1980-91<br />
(Miles <strong>de</strong> nuevos pesos, a precios <strong>de</strong> 1980)<br />
Total 2 3 4<br />
Año Agropecuario, Minería Industria Construcción<br />
silvicultura manufacturera<br />
y pesca<br />
1980 2636 169 142476 47964 1 396293 321 123<br />
1981 2 876 866 161232 64181 149'5318 363 676<br />
1982 2821 477 164231 66707 1 464 317 341 863<br />
1983 2692713 166349 69411 1367117 262033<br />
1984 2699616 160 397 60317 1 429791 268268<br />
1986 2796177 166063 61 196 1 604668 269433<br />
1986 2696043 166662 60742 1432412 242242<br />
1987 2 769 338 164766 64679 1 473 067 246140<br />
1988 2803 108 162 B04 66447 1619260 239736<br />
1989 2946616 160022 64169 1618704 260330<br />
1990 3 137430 164096 66096 1 720 938 269471<br />
1991 3 288 228 167786 64200 1 799337 279 663<br />
CUADRO 10.10<br />
(2" parte y última)<br />
6 6 7 8 9 Rama 728.<br />
Electricidad, Comercio, Transporte, Servicios Servicios Servicios<br />
Año gas yagua restaurantes almace· financieros, comunales, bancarios<br />
y hoteles namiento seguros y sociales y imputados<br />
y comunlca- bienes personajes<br />
clones inmuebles<br />
1980 34648 236464 119228 50624 239 267 48183<br />
1981 35366 270464 131 B60 66432 266 296 64061<br />
1982 35448 277 070 129070 66412 269 166 67 193<br />
1983 33947 268920 116 B08 63746 246070 69313<br />
1984 33696 264636 126126 64811 249433 62262<br />
1986 31 620 260733 123 997 66118 2E.9619 62830<br />
1986 31 760 263 602 128002 68904 248416 64421<br />
1987 33834 271 622 133109 64973 242489 66770<br />
1988 34312 274686 132763 70643 n6866 67 612<br />
1989 36123 290824 142949 74262 n8811 69432<br />
1990 38776 321 860 163496 78840 24.9 908 73961<br />
1991 40647 347016 161 '164 84886 263064 79887<br />
FUENTE: Instituto Nacional <strong>de</strong> Estadistica Geografía e Informática. Sistema <strong>de</strong> Cuentas Nacionales <strong>de</strong> México. Cuentas<br />
Consolidadas <strong>de</strong> la Nación. <strong>1992</strong>.<br />
223 INEGI. <strong>Anuario</strong> <strong>Estadístico</strong> <strong>de</strong> <strong>los</strong> <strong>Estados</strong> <strong>Unidos</strong> <strong>Mexicanos</strong>. <strong>1992</strong>
INEGI. <strong>Anuario</strong> <strong>Estadístico</strong> <strong>de</strong> <strong>los</strong> <strong>Estados</strong> <strong>Unidos</strong> <strong>Mexicanos</strong>. <strong>1992</strong><br />
PRODUCTO INTERNO BRUTO POR GRAN DIVISION CUADRO 10.11<br />
DE ACTIVIDAD ECONOMICA 11' parte)<br />
1980-91<br />
IMiles <strong>de</strong> nuevos pesos corrientes)<br />
Total 2 4<br />
Año Agropecuario, Minería Industria Construcción<br />
silvicultura manufacturera<br />
y pesca<br />
1980 4470077 368049 144044 988900 287 164<br />
1981 6127 632 603121 147114 1 326268 426 790<br />
1982 9797791 719604 301 634 2032971 634 649<br />
1983 17878720 392147 1 272306 3772437 803672<br />
1984 29471575 2533442 1 662420 6618292 1 298 136<br />
1986 47391702 4306608 2217514 11 068634 2070127<br />
1986 79191347 7466461 2899087 19445676 3383124<br />
1987 193311 638 16825428 9809577 49551 194 7886881<br />
1988 390451 299 30690747 12763355 105402781 15726 170<br />
1989 507 617 999 39246669 13594644 124086891 19687662<br />
1990 686406724 64810490 17696738 166179717 27229991<br />
1991 866 166724 66682317 18 120446 192526534 36216666<br />
CUADRO 10.11<br />
12' parte y última)<br />
6 6 8 9 Rama 728.<br />
Electricidad, ComercIo, Transporte, Servicios ServicIos Servicios<br />
Año gas yagua restaur antes almace- financieros, comunales, bancarios<br />
y hoteles namiento y seguros y sociales y imputados<br />
comunica- bienes personajes<br />
ciones inmuebles<br />
1980 44275 1 249672 285601 383846 766809 ·48183<br />
1981 56086 1 695329 396263 537 667 106895 ·65901<br />
1982 88371 2902617 606468 819944 778231 ·86398<br />
1983 167 247 6073 149 172 396 396 721 2 974 696 ·145961<br />
1984 281 528 8361 629 2004 163 2 233 760 4833641 -355436<br />
1986 448 861 13306454 3165127 3531 195 7830883 ·553701<br />
1986 993601 21 184947 5708208 6218 171 12918203 ·1026121<br />
1987 2089918 52425428 13766868 13760854 29724849 ·2 629 449<br />
1988 4959410 106621 696 29628398 30663402 59838921 ·6733681<br />
1989 6785021 136438024 37609758 62 804 353 81471815 ·3 005 628<br />
1990 9479554 178 782 898 56505424 80973074 112300741 ·7551903<br />
1991 13068043 214 160247 76644881 108409633 160462155 ·11016097<br />
FUENTE: Instituto Nacional <strong>de</strong> Estadistica Geografía e Informática. Sistema <strong>de</strong> Cuentas Nacionales <strong>de</strong> México. Cuentas<br />
Consolidadas <strong>de</strong> la Nación. <strong>1992</strong>.<br />
224
PRODUCTO INTERNO BRUTO POR GRAN DIVISION CUADRO 10.12<br />
DE ACTIVIDAD ECONOMICA (1· parte)<br />
1980-91<br />
(Miles <strong>de</strong> nuevos pesos, a precios <strong>de</strong> 1980)<br />
Total 2 3 4<br />
Año Agropecuélrio, Minería Industria Construcción<br />
silvicultura manufac:turera<br />
y pesca<br />
1980 4470077 368049 144044 988900 287 164<br />
1981 4862219 390 !;59 165140 1 062660 328555<br />
1982 4831 689 382 872 179478 1 023811 305354<br />
1983 4 628 937 390605 177 917 943549 246 762<br />
1984 4 796050 401 120 181769 990856 260003<br />
1985 4 920430 416 -163 181674 1061 109 267 076<br />
1986 4735721 404841 174198 995 848 239521<br />
1987 4 823 604 410405 183439 1026136 246213<br />
1988 4 883 679 394909 184120 1 068 959 245215<br />
1989 5047209 386015 182927 1135087 250420<br />
1990 5271533 408807 188028 1 203 924 267 834<br />
1991 5462 729 412 742 189491 262 246 274308<br />
CUADRO 10.12<br />
(2' parte y última)<br />
6 6 8 9 Rama 728.<br />
Electricidad, ComercIo, Transporte, Servicios ServIcIos Servicios<br />
Año gas yagua restaur antes alm':lce- financieros, comunales, bancarios<br />
y hoteles narnlenl0 y seguros y sociales y Imputados<br />
comunlca- bienes personales<br />
clones inmuebles<br />
1980 44275 249 572 285601 383 846 766 809 -48183<br />
1981 49416 382 116 314393 408 123 825318 -54061<br />
1982 64191 1 369598 290928 428470 864 180 -57193<br />
1983 54806 266 538 283419 445040 879614 -59313<br />
1984 57548 1298133 297 922 469763 901 188 -62252<br />
1985 62331 1312451 306204 486818 899434 -62830<br />
1986 64598 1 226 676 296437 505027 892996 -64421<br />
1987 67014 233 855 305092 523 382 893 838 -65770<br />
1988 71049 254808 312143 532005 898083 -67612<br />
1989 76486 302093 325081 547539 910994 ·69432<br />
1990 78713 1 355 138 346699 568 570 927 787 -73961<br />
1991 80817 1413622 366 H49 590417 962024 -79887<br />
FUENTE: Instituto Nocional <strong>de</strong> Estadística Geografia e Informtitic8. Sistema <strong>de</strong> Cuentas Nacionales <strong>de</strong> México, Cuentas<br />
Consolidadas <strong>de</strong> la Noción, <strong>1992</strong>.<br />
225<br />
INEGI. <strong>Anuario</strong> <strong>Estadístico</strong> <strong>de</strong> <strong>los</strong> <strong>Estados</strong> <strong>Unidos</strong> <strong>Mexicanos</strong>. <strong>1992</strong>
INEGI. <strong>Anuario</strong> <strong>Estadístico</strong> <strong>de</strong> <strong>los</strong> <strong>Estados</strong> <strong>Unidos</strong> <strong>Mexicanos</strong>. <strong>1992</strong><br />
PRODUCTO INTERNO BRUTO DE LA INDUSTRIA MANUFACTURERA<br />
POR DIVISION DE ACTIVIDAD ECONOMICA<br />
1980-91<br />
(Miles <strong>de</strong> nuevos pesos corrientes)<br />
CUADRO 10.13<br />
11" parte)<br />
Total 111 IV<br />
Año Alimentos, Textiles y Industria <strong>de</strong> Papel,<br />
bebidas prendas la ma<strong>de</strong>ra imprenta y<br />
y tabaco <strong>de</strong> vestIr editoriales<br />
1980 988900 243129 136146 42186 64094<br />
1981 1 326 268 321 886 176 220 53761 73986<br />
1982 2032971 621 703 267 036 80496 112966<br />
1983 3772437 979424 491361 140992 213807<br />
1984 6618292 1719228 770292 244660 378916<br />
1985 11 068634 2883676 1 237424 428962 638 718<br />
1986 19445676 5 574 684 2096 278 728704 1 164273<br />
1987 49661194 12808278 6143640 1 743 746 3169143<br />
1988 105402781 26049264 10678266 3 882 706 6668043<br />
1989 124086891 31 408 396 12369232 4369771 8090649<br />
1990 166179717 40696 147 14927814 6180427 9772267<br />
1991 192626634 60 106060 17673104 5918950 11 662636<br />
CUADRO 10.13<br />
(2" parte y última)<br />
V VI VII VIII IX<br />
Sustancias Productos Industrias Productos Otras Industrias<br />
Año químicas, minerales no metálicas metálicos, manufactureras<br />
caucho y metálicos básicas maquinaria y<br />
plásticos equipo<br />
1980 147267 69062 60796 210639 25604<br />
1981 199368 96304 79606 291 936 36306<br />
1982 329786 146246 113393 416072 66276<br />
1983 696079 269003 214371 670928 96482<br />
1984 1172206 461410 443337 1 266361 171884<br />
1985 1 933070 BOl 184 638 367 2220667 286696<br />
1986 3490237 1 407 626 1 086297 3416846 492732<br />
1987 9 702 489 3662571 3108741 9082217 1 140370<br />
1988 20 974 907 7493439 7276364 20036894 2363908<br />
1989 23740080 8647566 8 181 969 24369905 2909323<br />
1990 29210690 11 278 607 9644627 31716888 3862260<br />
1991 36291 766 14604709 10138701 42382 179 4768441<br />
FUENTE: Instituto Nacional ele Estadística Geografía e Informática. Sistema <strong>de</strong> Cuentas Nacionales <strong>de</strong> México. Cuenta<br />
Consolidadas <strong>de</strong> l. Nación, <strong>1992</strong>.<br />
226
INEGI. <strong>Anuario</strong> <strong>Estadístico</strong> <strong>de</strong> <strong>los</strong> <strong>Estados</strong> <strong>Unidos</strong> <strong>Mexicanos</strong>. <strong>1992</strong><br />
IMPUESTOS INDIRECTOS MENOS SUBSIDIOS POR<br />
GRAN DIVISION DE ACTIVIDAD ECONOMICA<br />
1980-91<br />
(Miles <strong>de</strong> nuevos pesos corrientes)<br />
CUADRO 10.15<br />
(1' parte)<br />
2 3 4<br />
Ano Total Agropecuario, Minería Industria Construcci6n<br />
silvicultura manufacturera<br />
y pesca<br />
1980 342870 -3219 3908 70126 1218<br />
1981 467 698 -6182 2896 81798 836<br />
1982 867936 -8331 4410 91608 2604<br />
1983 1 326804 -6698 10678 263747 2644<br />
1984 2376499 -11648 17 730 478626 6140<br />
1986 4427661 -20 738 11813 768 186 9724<br />
1986 6318836 -40089 42800 386 921 12216<br />
1987 18728136 ·72281 90838 3498806 33297<br />
1988 35611612 -119466 348667 8476860 62117<br />
1989 47789266 -166633 316133 9941310 81 906<br />
1990 66213377 -144772 322624 13494200 122944<br />
1991 86108715 -176214 34782 16620684 161000<br />
CUADRO 10.15<br />
(2' parte y última)<br />
5 6 7 9<br />
Electricidad, Comercio, Transporte, Servicios Servicios<br />
Ano gas yagua restaurantes almace· financieros, comunales,<br />
y hoteles namiento y seguros y sociales y<br />
comunica· bienes personales<br />
ciones inmuebles<br />
1980 369 263574 -7783 9696 6081<br />
1981 -10266 373 132 -8378 14971 7783<br />
1982 -27916 816082 -42302 6099 16880<br />
1983 -82836 1 187786 -80666 10641 30696<br />
1984 -109246 1 926703 -36602 49636 64960<br />
1986 -136807 3709970 -77 036 79219 83230<br />
1986 ·168248 4941 309 -142767 133933 142761<br />
1987 -619 137 16464892 -231 786 206 106 368401<br />
1988 -679109 26 248 974 861016 602376 830078<br />
1989 491036 34 111 646 1430412 623892 1 049666<br />
1990 797 693 43977 039 3698090 2430211 1 616448<br />
1991 1 379667 66864466 6640482 3433899 2160170<br />
FUENTE: Instituto Nacional <strong>de</strong> Estadistica Geografía e Informática. Sistema <strong>de</strong> Cuentas Nacionales <strong>de</strong> México. Cuentas<br />
Consolidadas <strong>de</strong> la Nación, <strong>1992</strong>.<br />
228
INEGI. <strong>Anuario</strong> <strong>Estadístico</strong> <strong>de</strong> <strong>los</strong> <strong>Estados</strong> <strong>Unidos</strong> <strong>Mexicanos</strong>. <strong>1992</strong><br />
FORMACION BRUTA DE CAPITAL POR TIPO DE BIENES CUADRO 10.17<br />
1980-91 (1' parte)<br />
(Miles <strong>de</strong> nuevos pesos corrientes, a precios comprador)<br />
Año Total Formación bruta <strong>de</strong> capita' fijo<br />
Tota'<br />
Construcción<br />
Total Edificios Edificios no<br />
resi<strong>de</strong>nciales resi<strong>de</strong>nciales<br />
1980 1213984 1 106768 621 038 19B 610 144066<br />
1981 1 677 620 1616819 906413 275731 208644<br />
1982 2244428 2248806 1 362642 430991 321891<br />
1983 3710236 3 136967 1 877 802 744014 396782<br />
1984 6862866 6287211 3089932 1 230649 713451<br />
1986 10034840 9048296 5045766 2078900 1080318<br />
1986 14680641 16414711 8316404 3638083 1614410<br />
1987 37232762 35666849 19666779 8792253 4201 736<br />
1988 79 700 388 76199042 40132238 18338270 9174326<br />
1989 108699646 92219706 48076806 22618420 11060211<br />
1990 160271817 127727621 63846712 28273642 15296488<br />
1991 193472804 168013961 82863 764 37790198 18974349<br />
CUADRO 10.17<br />
(2" parte y última)<br />
Año Formación bruta <strong>de</strong> capital fijO Variación <strong>de</strong><br />
Construcción Maquinaria y equipo existencias<br />
Otras Mejoras <strong>de</strong> Total Equipo <strong>de</strong> Maquinaria y<br />
construcciones tierra y transporte equipo bl<br />
al <strong>de</strong>sarrollo <strong>de</strong><br />
plantaciones y<br />
huertos<br />
1980 274913 3649 486720 145010 340710 107226<br />
1981 416978 6160 710406 229 146 481 260 60701<br />
1982 591418 8242 896264 277 398 618866 -4378<br />
1983 721 235 15771 1259166 458347 800818 673269<br />
1984 1 118138 27794 2197279 822640 1 374639 665644<br />
1986 1 839020 47617 4002641 1441 186 2561 366 986644<br />
1986 3069037 94874 7098307 2392914 4706393 -734070<br />
1987 6360732 211069 16101070 6386969 lO 716 111 1 566903<br />
1988 12191830 427813 36066804 11619168 23547636 4601 346<br />
1989 14017 618 479667 44 143899 13496004 30647896 16479840<br />
1990 19642 112 634470 63881 909 20954409 42927600 22644196<br />
1991 26 261 001 838206 86160207 29067551 56082666 25458843<br />
al Incluye la construcción por cuenta propia realizada por activida<strong>de</strong>s económicas distintas <strong>de</strong> la construcción.<br />
bl Incluye ganado reproductor <strong>de</strong> origen importado.<br />
FUENTE: Instituto Nacional <strong>de</strong> Estadística Geografi'a e Informática. Sistema <strong>de</strong> Cuentas Nacionales <strong>de</strong> México,<br />
Cuentas Consolidada. <strong>de</strong> la Nación. <strong>1992</strong>.<br />
230
INEGI. <strong>Anuario</strong> <strong>Estadístico</strong> <strong>de</strong> <strong>los</strong> <strong>Estados</strong> <strong>Unidos</strong> <strong>Mexicanos</strong>. <strong>1992</strong><br />
FORMACION BRUTA DE CAPITAL FIJO POR ACTIVIDAD<br />
ECONOMICA DE ORIGEN<br />
1980-91<br />
(Miles <strong>de</strong> nuevos pesos corrientes, a precios comprador)<br />
CUADRO 10.19<br />
2 3 4 9<br />
Año Total Agropecuario. Minería Industria Construcción Servicios<br />
silvicultura manufacturera comunales,<br />
y pesca<br />
sociales y<br />
personales<br />
1980 1106768 7981 746 487026 608287 2720<br />
1981 1616819 12703 840 711684 887 916 3676<br />
1982 2248806 19323 1390 898 762 1 324 661 4780<br />
1983 3 136 967 31941 2900 1 268569 1 826 118 7439<br />
1984 6 287 211 61 123 4608 2204681 3001 667 16332<br />
1986 9048296 132634 7130 3992168 4897862 18602<br />
1986 16414711 217 017 14886 7119176 8040308 23326<br />
1987 36666849 466000 38600 16216166 18911 464 44740<br />
1988 76199042 1 362988 79741 34889696 38781 608 96110<br />
1989 92219706 1 180904 92383 44310726 46646226 90468<br />
1990 127727621 1 424689 108998 64198332 61 902203 93399<br />
1991 168013961 2136466 116662 86263613 80427249 80081<br />
FUENTE: Instituto Nacional <strong>de</strong> Estadística Geografía e Informática, Sistema <strong>de</strong> Cuentas Nacionales <strong>de</strong> México. Cuentas<br />
Consolidadas <strong>de</strong> la Nación, <strong>1992</strong>.<br />
FORMACION BRUTA DE CAPITAL FIJO POR ACTIVIDAD CUADRO 10.20<br />
ECONOMICA DE ORIGEN<br />
1980-91<br />
(Miles <strong>de</strong> nuevos pesos, a precios comprador <strong>de</strong> 1980)<br />
2 3 4 9<br />
Año Total Agropecuario, Minería Industria Construcción Servicios<br />
silvicultura manufacturera comunales,<br />
y pesca sociales y<br />
personales<br />
1980 1 106768 7981 746 487026 608287 2720<br />
1981 1 286 376 lO 312 823 680083 692231 2927<br />
1982 1070371 9619 799 410 202 647217 2634<br />
1983 767 667 8474 823 267486 498796 2089<br />
1984 817 006 lO 311 860 284873 618261 2711<br />
1986 881 160 13233 870 328479 636509 2069<br />
1986 777 198 11607 866 281 660 481 763 1612<br />
1987 776 246 lO 650 926 272 187 491 353 1230<br />
1988 821 117 15768 957 318144 484950 1 298<br />
1989 873699 12149 924 358749 500760 1027<br />
1990 988266 12334 969 436812 637306 846<br />
1991 1 067 668 16913 919 496477 663961 688<br />
FUENTE: Instituto Nacional <strong>de</strong> Estadística Geografía e Informática. Sistema <strong>de</strong> Cuentas Nacionales <strong>de</strong> México. Cuentas<br />
Consolidadas <strong>de</strong> la Nación. <strong>1992</strong>.<br />
232
FORMACION BRUTA DE CAPITAL FIJO POR ORIGEN CUADRO 10.21<br />
NACIONAL E IMPORTADO Y TIPO DE BIEN (1" parte)<br />
1980-91<br />
(Miles <strong>de</strong> nuevos pesos corrientes, 8 precios comprador)<br />
Total Nacional<br />
Total Construcción Maqulnsrlu y equipo<br />
Año Total EquIpo <strong>de</strong> Maqumarla<br />
tUlnsporte y equipo<br />
1980 106758 881 828 621 038 260 790 109626 151 164<br />
1981 1 616819 1 275 225 906413 368812 165128 203 684<br />
1982 2 248806 1 859322 352 10,42 506 780 217910 288 870<br />
1983 3 136 967 2612079 877 802 734277 283 157 451 120<br />
1984 5287211 4494487 3089932 1 404555 627 331 777 224<br />
1985 9048296 7 584 888 5 045 755 2539 133 1189724 1 349409<br />
1986 15414711 12238933 8316404 :¡ 922 529 1 744283 2178246<br />
1987 35 666 849 29122439 19565779 H 556 660 4061959 5494701<br />
1988 75199042 60752481 40 132238 20 620 243 8880364 11739879<br />
1989 92219705 73550636 48075 806 2E; 474 830 11714925 13759905<br />
1990 127 727 621 98224381 63845712 341 378 669 17190631 17 188038<br />
1991 168013961 129286401 82 863 754 46422647 25 2.29 464 21193183<br />
Importado<br />
CUADRO 10.21<br />
(2" parte y última)<br />
Total Maqulnalla y equipo Ganado<br />
Año Total EqUipo <strong>de</strong> Maquinaria reproductor<br />
transporte y equipo 81<br />
1980 224 930 224 123 35384 1138739 807<br />
1981 341 594 339 716 64018 275698 878<br />
1982 389484 386497 59488 327 009 2987<br />
1983 524888 523314 175190 348 124 1574<br />
1984 792 724 782 254 195 '309 5U6 945 10470<br />
1985 1 463408 1416693 251461 1 165232 46715<br />
1986 3175778 3 126644 648631 2478013 49134<br />
1987 6544410 6474307 324000 51E;0307 70103<br />
1988 14446561 13871891 2 638 804 11 2:130'07 574 670<br />
1989 18669069 18345428 1 781 079 16564349 323 641<br />
1990 29 503 240 29 171 805 3 763 778 25408027 331 436<br />
1991 38727 660 38000 172 3838087 34 162086 727 388<br />
al El ganado reproductor <strong>de</strong> origen nacional se incluye en la variación <strong>de</strong> ¡existenCias.<br />
FUENTE: Instituto Nacional <strong>de</strong> Estadística Geografía e InformlÍftic8. Sistema <strong>de</strong> Cuentas Nacionales <strong>de</strong> México. Cuentas<br />
Consolidadas <strong>de</strong> la Noción, <strong>1992</strong>.<br />
233 INEGI. <strong>Anuario</strong> <strong>Estadístico</strong> <strong>de</strong> <strong>los</strong> <strong>Estados</strong> <strong>Unidos</strong> <strong>Mexicanos</strong>. <strong>1992</strong>
INEGI. <strong>Anuario</strong> <strong>Estadístico</strong> <strong>de</strong> <strong>los</strong> <strong>Estados</strong> <strong>Unidos</strong> <strong>Mexicanos</strong>. <strong>1992</strong><br />
FORMACION BRUTA DE CAPITAL FIJO POR ORIGEN CUADRO 10.22<br />
NACIONAL E IMPORTADO Y TIPO DE BIEN<br />
(1· parte)<br />
1980-91<br />
(Miles <strong>de</strong> nuevos pesos, a precios comprador <strong>de</strong> 1980)<br />
Total Nacional<br />
Total Construcción Maquinana V equipo<br />
Año Total Equipo <strong>de</strong> Maquinaria<br />
transporte y equipo<br />
1980 1 106768 881 828 621038 260790 109626 161 164<br />
1981 1 286376 1000133 706701 293432 131078 162 364<br />
1982 1070371 909607 661 191 248 316 106300 142016<br />
1983 767 667 690661 612462 178199 68463 109746<br />
1984 817 006 730267 632616 197 762 86036 112717<br />
1986 881 160 779629 651 736 227 893 103337 124666<br />
1986 777 198 686 150 496869 188281 77 684 110697<br />
1987 776 246 692878 606344 186634 77 706 108828<br />
1988 821 117 706953 600021 206932 93087 113846<br />
1989 873699 744314 615890 228424 106433 121991<br />
1990 988265 817 492 563433 264059 132124 131936<br />
1991 1 067858 862167 670 706 291 462 150 742 140720<br />
Importado<br />
CUADRO 10.22<br />
(2' parte y última)<br />
Total Maquinaria y equipo Ganado<br />
Año Total Equipo <strong>de</strong> Maquinaria reproductor<br />
transporte y equipo a/<br />
1980 224930 224123 35384 188 739 807<br />
1981 286243 284272 54232 230040 1971<br />
1982 160864 159259 26450 132809 1605<br />
1983 77006 76758 25177 61581 248<br />
1984 86739 84994 19569 65425 1745<br />
1986 101531 97661 16100 82461 3970<br />
1986 92048 90062 15712 74350 1 986<br />
1987 83368 82057 13986 68071 1311<br />
1988 114164 107 630 18161 89369 6634<br />
1989 129286 126116 10743 116373 3169<br />
1990 170773 168006 18440 149666 2768<br />
1991 206691 199776 16879 182896 6916<br />
al El ganado reproductor <strong>de</strong> origen nacional se incluye en la variación <strong>de</strong> existencias.<br />
FUENTE: Instituto Nacional <strong>de</strong> Estadística Geografía e Infonnátic8. Sistema <strong>de</strong> Cuentas Nacionales <strong>de</strong> México, Cuentas<br />
Consolidada. <strong>de</strong> la Nación, <strong>1992</strong>.<br />
234
FORMACION BRUTA DE CAPITAL FWO POR TIPO DE<br />
BIENES Y COMPRADOR<br />
1980-91<br />
(Millones <strong>de</strong> nuevos pesos corrientes, a precios comprador)<br />
Total Construcci6n<br />
Año Total Privada Pública Total Privada Pública<br />
1980<br />
1981<br />
1982<br />
1983<br />
1984<br />
1986<br />
1986<br />
1987<br />
1988<br />
1989<br />
1990<br />
1991<br />
107 630<br />
617 876<br />
2249 1 262<br />
3137 1961<br />
62873341<br />
9048 6 901<br />
16416 10239<br />
36667 26696<br />
76199 66482<br />
92 220 67 745<br />
127728 94211<br />
168014 128613<br />
476<br />
741<br />
996<br />
176<br />
1946<br />
3147<br />
6176<br />
10071<br />
19717<br />
24474<br />
33617<br />
39401<br />
621<br />
906<br />
1363<br />
1 878<br />
3090<br />
6046<br />
8316<br />
19666<br />
40132<br />
48076<br />
63846<br />
82864<br />
286<br />
392<br />
603<br />
990<br />
1 661<br />
2771<br />
4636<br />
11764<br />
24286<br />
29663<br />
37381<br />
61 360<br />
336<br />
614<br />
760<br />
888<br />
1439<br />
2276<br />
a 681<br />
i' 802<br />
Hi847<br />
113422<br />
CUADRO 10.23<br />
Maquinaria y Equipo<br />
Total Privada Pública<br />
486<br />
710<br />
896<br />
1 269<br />
2 197<br />
4003<br />
7098<br />
16101<br />
36067<br />
44144<br />
63882<br />
86160<br />
344<br />
484<br />
649<br />
971<br />
1690<br />
3131<br />
6604<br />
13833<br />
31 197<br />
38092<br />
66830<br />
77 263<br />
142<br />
226<br />
247<br />
288<br />
607<br />
872<br />
1494<br />
2269<br />
3870<br />
6062<br />
7062<br />
7887<br />
FUENTE: Instituto Nacional <strong>de</strong> Estadística Geografía e Informático. Sistemfl <strong>de</strong> Cuentas Nacionflles <strong>de</strong> México. Cuentas<br />
Consolidod89 <strong>de</strong> la Nación. <strong>1992</strong>.<br />
<strong>1992</strong><br />
FORMACION BRUTA DE CAPITAL FIJO POR TIPO DE<br />
CUADRO 10.24<br />
BIENES Y COMPRADOR<br />
1980-91<br />
(Millones <strong>de</strong> nuevos pesos, a precios comprador <strong>de</strong> 1980)<br />
<strong>Mexicanos</strong>.<br />
Total Construcción<br />
Ml¡quinaria y Equipo<br />
Año Total Privada Pública Total Privada Pública Total Privada Pública<br />
<strong>Unidos</strong><br />
1980 107 630 476 621 286 336 486 344 142<br />
1981 286 703 683 707 306 401 680 398 182<br />
1982 1070 697 474 661 303 369 409 294 116<br />
1983 768 465 303 612 269 244<br />
26,5 196 59 <strong>Estados</strong><br />
1984 817 602 316 633 283 249<br />
2EI4 218 66<br />
<strong>los</strong><br />
1985 881 663 318 652 306 246 329 268 72 <strong>de</strong><br />
1986 777 604 273 497 286 212<br />
2130 219 61<br />
1987 776 637 239 606 311 196 270 226 44<br />
1988 821 692 229 600 307 193 3:21 286 36<br />
1989 874 636 238 516 328 188 3'58 308 50 <strong>Estadístico</strong><br />
1990 988 720 268 663 334 219 436 386 49<br />
1991 1068 812 266 671 361 210 497 451 46<br />
<strong>Anuario</strong><br />
FUENTE: Instituto Nacional <strong>de</strong> Estadística Geografía e Informática. Sistema <strong>de</strong> Cuentas Naci,onales <strong>de</strong> México, Cuentas<br />
Consolidadas <strong>de</strong> la Nación. <strong>1992</strong>.<br />
235 INEGI.
INEGI. <strong>Anuario</strong> <strong>Estadístico</strong> <strong>de</strong> <strong>los</strong> <strong>Estados</strong> <strong>Unidos</strong> <strong>Mexicanos</strong>. <strong>1992</strong><br />
CONSTRUCCION PUBLICA POR TIPOS GENERICOS<br />
DE OBRAS<br />
1980-91<br />
(Miles <strong>de</strong> nuevos pesos corrientes)<br />
CUADRO 10.25<br />
Total Agua, Transporte Electricidad Edificios Petróleo y Otras<br />
Año riego y y comun;- petroquí- construc-<br />
saneamiento caciones mica clones<br />
1980 334631 60940 47380 48246 68920 101 293 17863<br />
1981 614433 73214 103317 61437 110792 142651 23022<br />
1982 749712 83409 149401 90821 178033 199683 48366<br />
1983 887 818 118671 183616 103827 202496 231 370 47939<br />
1984 1 439014 206084 312417 207 962 381 448 243233 88870<br />
1986 2 274 990 331961 608892 366272 636346 426022 117 497<br />
1986 3681 412 429251 860249 687684 793 697 769442 261 289<br />
1987 7802093 878 669 2048186 1216005 1 884627 1 388437 387 169<br />
1988 16847189 1 692 763 2928182 2366217 4 678 276 3866860 624911<br />
1989 18422426 1 808276 2671 627 2444679 6466832 5466074 676938<br />
1990 26464719 2949482 4390164 4902 117 8131646 6812236 279074<br />
1991 31 614022 3718330 6364224 6076910 7861 320 8399983 114266<br />
FUENTE: Instituto Nacional <strong>de</strong> Estadística Geografía e Informática. Sistema <strong>de</strong> Cuentas Nacionales <strong>de</strong> México.<br />
Cuentas Consolidadas <strong>de</strong> la Nación. <strong>1992</strong>.<br />
CONSTRUCCION PUBLICA POR TIPOS GENERICOS CUADRO 10.26<br />
DE OBRAS<br />
1980-91<br />
(Miles <strong>de</strong> nuevos pesos, a precios <strong>de</strong> 1980)<br />
Total Agua, Transporte Electricidad Edificios Petróleo y Otras<br />
Año riego y y comuni- petroquí- construc-<br />
saneamiento caciones mIca ciones<br />
1980 334 631 60940 47380 48246 68920 101293 17863<br />
1981 401213 67273 80373 48644 86779 110131 18113<br />
1982 368666 41 193 72377 44006 87983 89946 23063<br />
1983 243669 38243 67403 26867 62773 64640 13643<br />
1984 249242 43947 60784 33228 62168 32639 16476<br />
1985 246471 44522 57323 38107 57207 35232 14080<br />
1986 211 818 29969 62662 33632 46303 33176 16286<br />
1987 194 974 26853 64431 29480 46895 26777 10538<br />
1988 193403 24400 39635 28702 66696 37926 7244<br />
1989 187 709 23448 30196 26367 66294 46369 7046<br />
1990 219 285 30639 38881 40181 68200 38891 2693<br />
1991 210163 30086 44409 33613 63002 48204 860<br />
FUENTE: Instituto Nacional <strong>de</strong> Estadística Geografía e Informática. Sistema <strong>de</strong> Cuentas Nacionales <strong>de</strong> México.<br />
Cuentas Consolidadas <strong>de</strong> la Nación, <strong>1992</strong>.<br />
236
CAPITULO 11<br />
AGRICUL TURA,<br />
GANADERI.A,<br />
SILVICULTURA y PESCA<br />
INEGI. <strong>Anuario</strong> <strong>Estadístico</strong> <strong>de</strong> <strong>los</strong> <strong>Estados</strong> <strong>Unidos</strong> <strong>Mexicanos</strong>. <strong>1992</strong>
INEGI. <strong>Anuario</strong> <strong>Estadístico</strong> <strong>de</strong> <strong>los</strong> <strong>Estados</strong> <strong>Unidos</strong> <strong>Mexicanos</strong>. <strong>1992</strong><br />
SUPERFICIE SEMBRADA DE LOS PRINCIPALES CULTIVOS AGRICOLAS<br />
1980-91<br />
(MiI"s <strong>de</strong> hectáreas)<br />
Año<br />
1980<br />
1981<br />
1982<br />
1983<br />
1984<br />
1986<br />
1986<br />
1987<br />
1988<br />
1989<br />
1990<br />
1991<br />
Granos básIcos<br />
Arroz<br />
palay<br />
Frijol Maíz Trigo<br />
164 1967 7697 777<br />
193 2408 8700 940<br />
207 2439 8668 106<br />
165 2205 8449 900<br />
146 2028 7932 1079<br />
270 2080 8366 1 274<br />
197 2322 8077 1282<br />
186 2323 8294 1041<br />
176 2344 8029 966<br />
193 1 737 7 664 1 206<br />
120 2 272 7 918 969<br />
96 2 199 7 730 1 007<br />
FUENTE: Secretaría <strong>de</strong> Agricultura y Recursos Hidráulicos.<br />
Véase mapa 7<br />
Oleaginosas<br />
Ajonjolí Semilla Cártamo<br />
<strong>de</strong><br />
algodón<br />
291<br />
160<br />
132<br />
183<br />
156<br />
161<br />
117<br />
130<br />
103<br />
91<br />
131<br />
90<br />
366<br />
360<br />
201<br />
237<br />
333<br />
208<br />
161<br />
226<br />
303<br />
190<br />
224<br />
271<br />
436<br />
474<br />
226<br />
469<br />
259<br />
303<br />
258<br />
328<br />
226<br />
180<br />
203<br />
98<br />
SUPERFICIE COSECHADA DE LOS PRINCIPALES CULTIVOS AGRICOLAS<br />
1980-91<br />
(Miles <strong>de</strong> hectáreas)<br />
Año<br />
1980<br />
1981<br />
1982 . 1983<br />
1984<br />
1986<br />
1986<br />
1987<br />
1988<br />
1989<br />
1990<br />
1991<br />
Arroz<br />
palay<br />
Granos básicos<br />
Frijol Maíz Trigo<br />
127 1651 6766 724<br />
176 1991 7669 860<br />
166 1 606 6824 1009<br />
133 1968 7421 857<br />
126 1679 6893 1034<br />
216 1782 7590 1217<br />
168 1820 6417 1201<br />
166 1 787 6801 988<br />
126 1947 6606 912<br />
161 1321 6470 1 144<br />
106 2094 7339 933<br />
86 1 989 6947 984<br />
FUENTE: Secretaría <strong>de</strong> Agricultura y Recursos Hidráulicos.<br />
240<br />
Oleaginosas<br />
Ajonjolí Semilla Cártamo<br />
264<br />
143<br />
89<br />
166<br />
133<br />
142<br />
102<br />
89<br />
77<br />
79<br />
110<br />
72<br />
<strong>de</strong><br />
algodón<br />
355<br />
349<br />
197<br />
233<br />
316<br />
197<br />
167<br />
222<br />
298<br />
178<br />
220<br />
249<br />
416<br />
399<br />
190<br />
349<br />
227<br />
234<br />
204<br />
277<br />
200<br />
149<br />
167<br />
94<br />
Soya<br />
160<br />
379<br />
420<br />
416<br />
426<br />
606<br />
405<br />
498<br />
166<br />
608<br />
297<br />
348<br />
Soya<br />
164<br />
362<br />
383<br />
391<br />
389<br />
476<br />
381<br />
470<br />
139<br />
490<br />
286<br />
342<br />
CUADRO 11.1<br />
Otros granos<br />
Cebada Sorgo<br />
348 1 671<br />
312 1867<br />
302 1 836<br />
326 1 989<br />
312 1 899<br />
296 2060<br />
314 1914<br />
324 2066<br />
298 1941<br />
294 1 810<br />
268 1916<br />
296 1 609<br />
CUADRO 11.2<br />
Otros granos<br />
Cebada Sorgo<br />
319<br />
271<br />
228<br />
304<br />
283<br />
281<br />
264<br />
286<br />
247<br />
264<br />
263<br />
284<br />
1643<br />
1684<br />
1434<br />
1 628<br />
1636<br />
1862<br />
1633<br />
1863<br />
1 800<br />
1621<br />
1818<br />
1381
SUPERFICIE COSECHADA DE PRINCIPALES LOS<br />
C:UL TIVOS FRUTlCOLAS<br />
1980-91<br />
(Miles <strong>de</strong> hectáreas)<br />
CUADRO 11.5<br />
Agua· Duraz- Fresa limón Mango Man- Man- Melón N 8- Nuez Perón Piña Plá- Uva<br />
Año cate no mexr- darina zana ranja encar-<br />
tano<br />
cano<br />
celada<br />
1980<br />
1981<br />
1982<br />
1983<br />
1984<br />
1986<br />
1986<br />
1987<br />
1988<br />
1989<br />
1990<br />
1991<br />
64<br />
66<br />
66<br />
67<br />
57<br />
73<br />
63<br />
64<br />
68<br />
67<br />
77<br />
83<br />
24<br />
26<br />
28<br />
27<br />
27<br />
29<br />
28<br />
27<br />
28<br />
32<br />
35<br />
38<br />
6<br />
4<br />
4<br />
6<br />
6<br />
4<br />
4<br />
4<br />
6<br />
6<br />
6<br />
8<br />
67<br />
62<br />
70<br />
73<br />
70<br />
64<br />
66<br />
72<br />
69<br />
78<br />
70 106<br />
69 94<br />
66 90<br />
69 90<br />
73 108<br />
72 108<br />
74 115<br />
10<br />
14<br />
19<br />
13<br />
20<br />
10<br />
10<br />
12<br />
13<br />
FUENTE: Secretaría <strong>de</strong> Agricultura y Recursos Hidráulicos.<br />
6<br />
46<br />
56<br />
46<br />
47<br />
54<br />
62<br />
49<br />
46<br />
67<br />
67<br />
58<br />
58<br />
27 162<br />
22 167<br />
26 170<br />
23 188<br />
27 150<br />
26 128<br />
24 131<br />
28 164<br />
33 164<br />
39 174<br />
40 176<br />
52 183<br />
PRODUCCION DE LOS PRINCIPALES CULTIVOS FRUTlCOLAS<br />
1980-91<br />
(Miles <strong>de</strong> toneladas)<br />
Año<br />
1980<br />
1981<br />
1982<br />
1983<br />
1984<br />
1985<br />
1986<br />
1987<br />
1988<br />
1989<br />
1990<br />
1991<br />
26<br />
29<br />
27<br />
26<br />
25<br />
24<br />
26<br />
26<br />
27<br />
34<br />
40<br />
36<br />
2 16<br />
10<br />
9<br />
9<br />
10<br />
9<br />
10<br />
9<br />
8<br />
9<br />
73<br />
76<br />
74<br />
72<br />
75<br />
79<br />
72<br />
80<br />
71<br />
81<br />
76<br />
74<br />
46<br />
64<br />
67<br />
66<br />
63<br />
62<br />
69<br />
69<br />
63<br />
60<br />
47<br />
46<br />
CUADRO 11.6<br />
Agua- Duraz- Fresa LImón Mango Man- Man- Melón Na- Nuez Perón Piña Plá- Uva<br />
cate no<br />
danna lana<br />
ranJ8 encar<br />
tano<br />
cano<br />
celada<br />
442 189<br />
461 191<br />
481 177<br />
448 133<br />
439 164<br />
566 173<br />
448 176<br />
623 173<br />
540 178<br />
473 146<br />
686 161<br />
780 132<br />
78 665 638 120 249 320 1 743 21<br />
64 629 661 149 386 322 1 820 28<br />
63 755 761 241 371 323 2083 23<br />
78 675 685 128 294 315 2113 28<br />
70 826 851 200 461 329 1 657 29<br />
57 686 1 109<br />
46 743 1010<br />
71 682 1 007<br />
78 660 998<br />
85 779 111<br />
107 685 1 074<br />
88 717 1118<br />
FUENTE: Secretaría <strong>de</strong> Agricultura y Recursos Hidráulicos.<br />
85 423 332 1 770<br />
88 448 394 1 909<br />
90 486 339 1 934<br />
89 507 426 2 099<br />
90 506 496 2372<br />
80 467 523 2 220<br />
88 627 646 2 369<br />
28<br />
27<br />
28<br />
28<br />
30<br />
40<br />
41<br />
13 623 1438 441<br />
13 473 606 616<br />
8 424 1673 612<br />
6 430 622 603<br />
4 454 2 093 639<br />
6 320 1 996 693<br />
340 1473 669<br />
343 1 770 556<br />
6 318 1666 563<br />
435 1 824 502<br />
455 1 986 429<br />
299 889 630<br />
243 INEGI. <strong>Anuario</strong> <strong>Estadístico</strong> <strong>de</strong> <strong>los</strong> <strong>Estados</strong> <strong>Unidos</strong> <strong>Mexicanos</strong>. <strong>1992</strong>
INEGI. <strong>Anuario</strong> <strong>Estadístico</strong> <strong>de</strong> <strong>los</strong> <strong>Estados</strong> <strong>Unidos</strong> <strong>Mexicanos</strong>. <strong>1992</strong><br />
POBLACION y PRODUCCION GANADERA y AVICOLA<br />
1980-91<br />
Año<br />
1980<br />
1981<br />
1982<br />
1983<br />
1984<br />
1985<br />
1986<br />
1987<br />
1988<br />
1989<br />
1990<br />
1991<br />
PoblacIón (Miles <strong>de</strong> cabezas)<br />
BovIno Porcino Caprino OVino Aves<br />
34590 16890 9638<br />
35689 17562 10004<br />
37 191 18096 10290<br />
37622 19364 9809<br />
30374 19393 9553<br />
31489 17233 10981<br />
35237 18397 10079<br />
34 565 18 722 10 442<br />
33756 15884 10086<br />
33 068 16 157 10 241<br />
32054 15203 10439<br />
31 823 15902 10722<br />
6482 178135<br />
6567 185187<br />
6642 190259<br />
6270 193506<br />
6120 202965<br />
7373 218883<br />
5699 214760<br />
5926 223915<br />
5761 234069<br />
5 863 238 309<br />
5 846 234055<br />
6003 246961<br />
FUENTE: Secretaría <strong>de</strong> Agricultura y Recursos Hidráulicos.<br />
PRODUCCION y VALOR DE LA PRODUCCION PECUARIA<br />
1980-91<br />
Año<br />
1980<br />
1981<br />
1982<br />
1983<br />
1984<br />
1985<br />
1986<br />
1987<br />
1988<br />
1989<br />
1990<br />
1991<br />
Leche<br />
ProdUCCión<br />
IT eneladas)<br />
Huevo Miel<br />
7 021 246 644 427<br />
7150615 663759<br />
7224133 690310<br />
7 057 004 715 259<br />
7 140 504 740 365<br />
7474405 826440<br />
6538519 997802<br />
6349741 975029<br />
6280896 1090164<br />
5703959 1047019<br />
6 265 936 1 009 795<br />
6847772 1141381<br />
65245<br />
70557<br />
49928<br />
68000<br />
47000<br />
41 728<br />
74613<br />
62931<br />
57803<br />
61 757<br />
66493<br />
69495<br />
FUENTE: Secretaría <strong>de</strong> Agricultura y Recursos HidráuliCOS.<br />
244<br />
Lana<br />
6564<br />
6656<br />
6760<br />
6415<br />
5526<br />
7058<br />
6656<br />
6760<br />
6415<br />
6526<br />
4517<br />
5168<br />
CUADRO 11.7<br />
Animales sacrificados (Miles <strong>de</strong> toneladas)<br />
Bovino Porcino Caprino OVIno Aves<br />
1 065.1 1 250.8 30.3 22.3 399.2<br />
163.5 1 306.6 32.6 23.0 426.3<br />
200.5 1 365.4 33.7 23.7 449.9<br />
1 030.2 1 486.9 32.2 22.6 468.6<br />
962.8 1 456.3 31.2 21.1 489.9<br />
979.6 1 293.2 36.3 24.2 688.6<br />
247.9 959.3 37.7 24.3 672.6<br />
272.6 914.6 35.5 22.1 672.9<br />
217.3 861.2 38.5 23.6 627 A<br />
162.8 726.7 37.0 24.8 611.0<br />
113.9 76704 36.1 24.7 75004<br />
1188.7 811.9 39.3 26.3 857.9<br />
Valor <strong>de</strong> la producción<br />
(Miles <strong>de</strong> nuevos pesos)<br />
Leche Huevo Miel<br />
58193 15776 523<br />
7903320311 2064<br />
110832 31451 4184<br />
194 259 66 634 9432<br />
406110 102462 12846<br />
666431 174776 16585<br />
984674 481 938 126842<br />
2019265 1011105 126303<br />
3570300 2014623 206530<br />
51204012303442 292852<br />
7357033 3168737 392043<br />
9244492 3581 654 421 140<br />
CUADRO 11.8<br />
Lana<br />
223<br />
279<br />
401<br />
684<br />
1 147<br />
2321<br />
2495<br />
8315<br />
24698<br />
25889<br />
24414<br />
32920
GANADO SACRIFICADO EN LOS RASTROS MUNICIPALES<br />
PARA CONSUMO<br />
1980-91<br />
Año<br />
Númelo <strong>de</strong><br />
cabezas<br />
1980 3137248<br />
1981 3501866<br />
1982 3726973<br />
1983 3778085<br />
1984 3187180<br />
1985 3169965<br />
1986 3109045<br />
1987 3196435<br />
19883015297<br />
1989 2 956 434<br />
'990 3 046 255<br />
1991P 3101052<br />
Año<br />
NlHnero <strong>de</strong><br />
cabezas<br />
1980 645 223<br />
1981 709014<br />
1982 709484<br />
1983 1178726<br />
1984 951709<br />
1985 860181<br />
1986 944 996<br />
1987 968 322<br />
1988 850 970<br />
1989 799 355<br />
1990 733148<br />
1991 P 657134<br />
Ganado bovino<br />
Peso en<br />
canal<br />
(Toneladas)<br />
Valor<br />
(Miles <strong>de</strong><br />
nuevos<br />
pesos)<br />
590 277 25499<br />
644031 37351<br />
666 600 68 702<br />
735546 153075<br />
599718 235320<br />
587 465 364 886<br />
582 691 532 430<br />
604481 305743<br />
581953 2941716<br />
560450 3498013<br />
584214 4204927<br />
609471 5021100<br />
Ganado caprino<br />
Peso en Valor<br />
canal<br />
(T anelad as)<br />
10819<br />
11 371<br />
12097<br />
15702<br />
14 816<br />
14220<br />
16598<br />
16003<br />
12543<br />
12431<br />
12 134<br />
11 332<br />
(MlIes <strong>de</strong><br />
·luevos<br />
pesos}<br />
516<br />
739<br />
1 463<br />
4141<br />
6425<br />
9346<br />
15265<br />
34883<br />
59268<br />
84014<br />
96974<br />
103704<br />
PrecIo<br />
mediO<br />
por<br />
kllo-<br />
gramo<br />
{Nuevos<br />
pesos}<br />
0.04<br />
0.06<br />
0.10<br />
0.21<br />
0.39<br />
0.62<br />
0.91<br />
2.16<br />
5.05<br />
6.24<br />
7.20<br />
8.24<br />
PrecIo<br />
medio<br />
por<br />
kilo<br />
gramo<br />
(Nuevos<br />
pesos)<br />
0.05<br />
0.06<br />
0.12<br />
0.26<br />
0.43<br />
0.66<br />
0.92<br />
2.18<br />
4.73<br />
6.76<br />
7.99<br />
9.1 1:5<br />
Nllmero <strong>de</strong><br />
cabezas<br />
57:17372<br />
6 HI1 701<br />
551'3315<br />
5 6;'5 984<br />
5 4f12 033<br />
5 705 540<br />
5919753<br />
5 309 287<br />
4 8E,9 329<br />
4503473<br />
4 39,5 279<br />
4452485<br />
Número <strong>de</strong><br />
cabezas<br />
730 178<br />
792 933<br />
753 070<br />
419 629<br />
451 299<br />
496909<br />
347 914<br />
288 935<br />
312234<br />
345426<br />
349 703<br />
394 177<br />
Ganado porcino<br />
Peso en Valor<br />
canal (Miles <strong>de</strong><br />
(T aneladas) nuevas<br />
pesos)<br />
416777 18832<br />
44560E, 27 222<br />
404 496 41 505<br />
416963 83961<br />
390476 148802<br />
417036248082<br />
41424E 362209<br />
38286E 1 036 123<br />
349694 1 780 786<br />
328647 2093373<br />
312848 2328757<br />
316269 2669226<br />
Ganado oVino<br />
CUADRO 11.9<br />
(1' parte)<br />
PrecIo<br />
medio<br />
por<br />
kilogramo<br />
(Nuevos<br />
pesos)<br />
0.05<br />
0.06<br />
0.10<br />
0.20<br />
0.38<br />
0.59<br />
0.87<br />
2.71<br />
5.09<br />
6.37<br />
7.44<br />
8.44<br />
CUADRO 11.9<br />
(2' parte y última)<br />
Peso er Valor<br />
canal<br />
(T aneladas)<br />
12 333<br />
13407<br />
13 168<br />
8270<br />
9098<br />
9828<br />
7021<br />
5472<br />
5971<br />
6968<br />
6503<br />
7 351<br />
(Miles <strong>de</strong><br />
nuevos<br />
pesos)<br />
823<br />
1 293<br />
1 908<br />
2401<br />
4061<br />
7 947<br />
8054<br />
13986<br />
33045<br />
46931<br />
52444<br />
68450<br />
Precio<br />
medio<br />
por<br />
kt1o-<br />
gramo<br />
(Nuevos<br />
FUENTE: Instituto Nacional <strong>de</strong> Estadística, Geografía e Informática, con base en información <strong>de</strong> Rastros Municipales.<br />
pesos)<br />
0.07<br />
0.10<br />
0.14<br />
0.29<br />
0.45<br />
0.81<br />
1.15<br />
2.56<br />
5.53<br />
6.74<br />
8.06<br />
9.31<br />
245<br />
INEGI. <strong>Anuario</strong> <strong>Estadístico</strong> <strong>de</strong> <strong>los</strong> <strong>Estados</strong> <strong>Unidos</strong> <strong>Mexicanos</strong>. <strong>1992</strong>
INEGI. <strong>Anuario</strong> <strong>Estadístico</strong> <strong>de</strong> <strong>los</strong> <strong>Estados</strong> <strong>Unidos</strong> <strong>Mexicanos</strong>. <strong>1992</strong><br />
VOLUMEN DE LA PRODUCCION FORESTAL POR<br />
PRINCIPALES ESPECIES SILVICOLAS<br />
1980-91<br />
(Miles <strong>de</strong> metros cúbicos rollo)<br />
Año<br />
1980<br />
1981<br />
1982<br />
1983<br />
1984<br />
1986<br />
1986<br />
1987<br />
1988<br />
1989<br />
1990<br />
1991 P<br />
Total<br />
9048<br />
8954<br />
8997<br />
8748<br />
9449<br />
9946<br />
8969<br />
9791<br />
9314<br />
8888<br />
8166<br />
7683<br />
Pino<br />
7466<br />
7328<br />
7469<br />
7 182<br />
7 720<br />
8130<br />
7339<br />
7873<br />
7661<br />
7462<br />
6866<br />
6437<br />
Oyamel<br />
319<br />
294<br />
273<br />
296<br />
364<br />
360<br />
320<br />
463<br />
369<br />
238<br />
227<br />
232<br />
Otras<br />
coníferas<br />
14<br />
24<br />
16<br />
18<br />
70<br />
60<br />
46<br />
101<br />
69<br />
73<br />
FUENTE: Secretaría <strong>de</strong> Agricultura y Recursos Hidráulicos.<br />
Véase mapa 8<br />
VALOR DE LA PRODUCCION FORESTAL POR<br />
PRINCIPALES ESPECIES SILVICOLAS<br />
1980-91<br />
IMiles <strong>de</strong> nuevos pesos)<br />
Año<br />
1980<br />
1981<br />
1982<br />
1983<br />
1984<br />
1986<br />
1986<br />
1987<br />
1988<br />
1989<br />
1990<br />
1991 P<br />
Total<br />
9660<br />
12394<br />
18770<br />
22204<br />
62798<br />
Pino<br />
7878<br />
10204<br />
16691<br />
17862<br />
44610<br />
99866 83904<br />
180 984 161 769<br />
393 369 296 062<br />
668266 618227<br />
961 326 776048<br />
1 027 643 836 171<br />
1 036 963 863 880<br />
Oyamel<br />
264<br />
303<br />
422<br />
627<br />
619<br />
2866<br />
6248<br />
9082<br />
11380<br />
11662<br />
23906<br />
31 128<br />
77<br />
71<br />
Otras<br />
coníferas<br />
17<br />
36<br />
33<br />
37<br />
273<br />
468<br />
644<br />
4737<br />
3726<br />
7692<br />
9406<br />
8840<br />
FUENTE: Secretaría <strong>de</strong> Agricultura y Recursos Hidráulicos.<br />
246<br />
CUADRO 11.10<br />
Encino Otras Preciosas Corrientes Otras<br />
latifoliadas<br />
tropicales<br />
394<br />
411<br />
389<br />
443<br />
638<br />
496<br />
401<br />
394<br />
469<br />
438<br />
408<br />
383<br />
67<br />
89<br />
62<br />
64<br />
178<br />
204<br />
169<br />
203<br />
179<br />
170<br />
190<br />
164<br />
Encino Otras<br />
latifoliadas<br />
302<br />
440<br />
476<br />
696<br />
2024<br />
3271<br />
6298<br />
30749<br />
48776<br />
67816<br />
63079<br />
49761<br />
64<br />
97<br />
97<br />
116<br />
669<br />
889<br />
1967<br />
6662<br />
11849<br />
16830<br />
22021<br />
18484<br />
116<br />
83<br />
116<br />
126<br />
117<br />
110<br />
87<br />
104<br />
79<br />
74<br />
40<br />
39<br />
670<br />
717<br />
668<br />
614<br />
468<br />
696<br />
697<br />
663<br />
688<br />
433<br />
369<br />
367<br />
3<br />
8<br />
14<br />
14<br />
CUADRO 11.11<br />
Preciosas Corrientes Otras<br />
tropicales<br />
396<br />
368<br />
1088<br />
1688<br />
1368<br />
2681<br />
4461<br />
8840<br />
16940<br />
22274<br />
13969<br />
14661<br />
728<br />
943<br />
979<br />
1366<br />
2341<br />
6788<br />
11617<br />
38237<br />
68368<br />
69104<br />
68992<br />
49219<br />
3<br />
84<br />
13<br />
114
247<br />
, ,<br />
• •<br />
-j ,<br />
j<br />
I ¡<br />
ID<br />
\<br />
, ,<br />
INEGI. <strong>Anuario</strong> <strong>Estadístico</strong> <strong>de</strong> <strong>los</strong> <strong>Estados</strong> <strong>Unidos</strong> <strong>Mexicanos</strong>. <strong>1992</strong>
INEGI. <strong>Anuario</strong> <strong>Estadístico</strong> <strong>de</strong> <strong>los</strong> <strong>Estados</strong> <strong>Unidos</strong> <strong>Mexicanos</strong>. <strong>1992</strong><br />
PRODUCCION FORESTAL MADERABLE<br />
1980-91<br />
(Miles <strong>de</strong> metros cúbicos rollo)<br />
CUADRO 11. 1 2<br />
Año Total Escuadría Celu<strong>los</strong>a Chapa y Postes. Combus· Durmientes<br />
tri play pilotes y tibies<br />
moril<strong>los</strong><br />
1980 9048 4975 2637 333 256 485 362<br />
1981 8954 5060 2479 248 214 551 402<br />
1982 8997 5227 2458 245 239 520 308<br />
1983 8748 5211 2393 189 223 516 216<br />
1984 9449 4965 2860 646 271 468 260<br />
1985 9946 5339 2866 742 237 484 279<br />
1986 8969 4766 2410 764 173 464 413<br />
1987 9791 5371 2664 766 149 492 349<br />
1988 9314 6128 2691 712 164 496 224<br />
1989 8888 6163 2349 643 166 443 134<br />
1990 8166 4967 1966 648 139 466 82<br />
1991 P 7683 4748 1631 643 98 446 118<br />
FUENTE: Secretaría <strong>de</strong> Agricultura y Recursos Hidráulicos.<br />
PRODUCCION FORESTAL NO MADERABLE CUADRO 11.13<br />
1980-91<br />
(Toneladas)<br />
Año Total Resinas Rizomas h
INEGI. <strong>Anuario</strong> <strong>Estadístico</strong> <strong>de</strong> <strong>los</strong> <strong>Estados</strong> <strong>Unidos</strong> <strong>Mexicanos</strong>. <strong>1992</strong><br />
VOLUMEN DE LA CAPTURA EN PESO VIVO SEGUN DESTINO Y PRINCIPALES ESPECIES CUADRO 11.14<br />
1980-91<br />
(Toneladas)<br />
Destino y espeCie 1980 1981 1982 1983 1984 1985 1986 1987 1988 1989 1990 1991<br />
Totol 257148 1 566466 1356306 1075647 134692 1255888 1367000 1464841 1394175 1619882 1461117 1483604<br />
Consumo humano di recto 634491 913298 761 282 662 766 784261 836728 816763 897 438 906 776 935454 1066984 1000219<br />
Almeja 11 430 10964 12 769 8957 9550 9366 14458 13661 20684 27583 30073 29798<br />
Atún 20417 46747 22 997 24532 57420 85535 96367 102 566 113607 116812 118928 119561<br />
Bagre 2287 4540 3265 3 957 3422 3094 3556 3367 3660 3469 5538 4836<br />
Ban<strong>de</strong>ra 1 435 1 820 1 185 1 750 2970 2898 4481 5896 6409 NO NO NO<br />
Barrtlete 13263 25811 18228 12591 20750 7 478 6621 9380 9508 15127 5845 9 967<br />
Bonito 2 140 1 230 1 358 2992 2768 1 364 680 538 6275 12459 10744 1 130<br />
Camarón 77 458 72010 78657 76895 76 114 74599 73215 83882 73200 74804 62747 70580<br />
Caracol 3856 6777 10648 5 109 5926 5693 5229 5119 5 185 6 742 5945 3825<br />
Carpa 4432 11 134 8747 7235 10088 16549 20921 26 170 27056 22504 27 214 28079<br />
Cazón 11 689 14683 13 120 lO 703 12485 12338 9992 9715 10711 12378 16082 12848<br />
Charal 4027 7 257 8255 5590 7 980 7395 7728 7 800 7522 7898 8579 7821<br />
Corvina 3420 4298 4009 3923 4028 3 769 4377 4422 4074 3822 3909 3033<br />
Erizo 132 476 498 445 1 243 2777 6229 4145 3512 NO NO NO<br />
Guachinango 4841 7 378 6607 4317 8 125 6 130 7569 7 637 6400 6 160 8887 8 726<br />
Jaiba 6 176 8656 11 089 7533 6968 6881 6618 7 999 8932 10156 12028 11 183<br />
Jurel 3688 4549 4276 5318 6318 3650 3 729 3934 4346 3700 3 125 2580<br />
Langosta 2531 2997 2876 2281 2303 1 828 2386 2451 2351 NO NO NO<br />
Langostino 1 930 3 799 3328 2306 3788 3370 3094 3224 3667 NO NO NO<br />
Lebrancha 3278 4646 2756 4046 6 135 2304 4406 3285 2829 2206 3050 2885<br />
Lisa 9803 14602 13087 11 187 12677 11 473 14147 14260 13 947 12876 12612 10128<br />
Macarela 5212 3832 9582 1 307 2245 3829 3445 2497 4602 NO NO NO<br />
Mero 9959 9950 9553 7093 8042 9324 9027 11 794 13440 11 717 13641 14883<br />
Mojarra 28 130 59369 75602 68910 75273 66994 74972 86731 87020 85274 95522 86625<br />
Ostión 43915 41 950 34906 36544 42807 42667 42375 50715 56 118 56599 52614 38799<br />
Pargo 2008 7027 4212 3305 2862 2876 3618 3266 3 612 3423 3615 3472<br />
Pulpo 6509 7 231 6607 8587 5834 6658 9836 8417 8346 13436 16 387 16809<br />
Rebale 2695 3822 5482 5536 6388 4339 4429 4619 5 196 4370 2799 2530<br />
Ronco 1 850 1 845 2441 3025 2 577 2416 3024 2932 2934 2324 1404 1 105<br />
Sardina 126 159 116851 111018 86760 106918 167756 110 505 123 77 2 107521 110335 115236 95246<br />
Sierra 9062 11 574 11 999 8528 8 791 9621 9194 9569 7831 10773 15555 13764<br />
Tiburón 14600 20646 21 610 19618 20488 19043 18318 16662 21 267 NO NO NO<br />
Tortuga 2447 2766 2863 2918 2144 1 682 876 873 1 122 NO NO NO<br />
Otras 88517 200 426 75511 59502 61 710 62643 51444 64622 63 131 117368 208891 191 670<br />
Captura sin registro ofICial al 105 195 171 635 152 141 149455 179 124 178 389 179 897 191 518 190761 181 140 196014 208 336<br />
Consumo humano indirecto 686097 620966 668 917 400344 318139 378876 489 88.2 619 606 466 628 627 6S7 33S SOS 427 948<br />
Anchoveta industria! 322 180 365 587 214 886 96872 125 884 147074 115877 159 132 113 386 104 748 1 11 026<br />
Fauna <strong>de</strong> acompañamIento 15 132 13059 10805 406 6 138 1 897 2026 3822 1 833 3062 5444 5281<br />
Pescado no empacable 40026 11 221 16668 5551 7 831 12141 10 144 2452 2234 18879 14693 39031<br />
Sardina IndUStria! 208 769 231 089 326 558 297 515 178 286 217763 361 835 354 199 339 175 401 008 319 671 372610<br />
Uso industrial 36660 31 211 36106 12448 32 192 40286 60356 47798 30771 66731 64324 66437<br />
Algas y sargazos 34700 29588 35 277 11 118 30685 39220 48702 46309 29 120 54744 62602 53826<br />
Mosco 1616 1 312 511 191 450 520 890 511 648 NO NO NO<br />
Otras 344 311 318 1 139 1 157 545 763 978 1003 1 987 1 722 1 611<br />
1\)<br />
.¡::.. al A partir <strong>de</strong> 1978, se incluye una estimación <strong>de</strong> la captura sin registro oficial, en base a una investigación <strong>de</strong> campo realizada por la Secretaría <strong>de</strong> Pesca .<br />
c.o FUENTE: Secretaria <strong>de</strong> Pesca.
PRODUCCION ACUICOlA POR GRUPO Y ESPECIE CUADRO 11.16<br />
1980-91 (1' parte)<br />
(Toneladas en peso vivo)<br />
Total Peces <strong>de</strong> Crustáceos Moluscos al<br />
Año agua dulce Total Langostino Camarón Total Ostión<br />
1980 80591 32797 1 930 1 930 45443 43915<br />
1981 130 776 82419 3799 3799 43451 41 950<br />
1982 132 774 91 742 3328 3328 36974 34906<br />
1983 122148 79039 2306 2306 37 787 36544<br />
1984 144039 92941 3788 3788 45227 42807<br />
1985 133 309 84349 3405 3370 35 43485 42667<br />
1986 151 124 102 284 3137 3094 43 43608 42375<br />
1987 174 385 117494 3510 3224 286 51082 50715<br />
1988 184339 121 314 4218 3667 551 56577 56118<br />
1989 181 697 117 165 5997 3151 2846 57894 56599<br />
1990 190065 128156 6839 1 879 4960 54261 62614<br />
1991 P 171409 123 829 6210 1241 4969 40474 38799<br />
Moluscos al Animales acuátiCOS<br />
CUADRO 11.16<br />
(2' parte y última)<br />
Año Almeja Callo <strong>de</strong> Total Tortuga bl Rana Pulga Gusano<br />
hacha<br />
1980 183 346 421 74 189 4 154<br />
1981 1 360 141 1 107 144 368 429 176<br />
1982 1 766 302 730 262 296 46 127<br />
1983 1048 195 3016 1 662 476 723 155<br />
1984 1 942 478 2083 1 140 370 441 132<br />
1985 678 140 2070 1020 946 27 77<br />
1986 711 622 2095 876 953 224 42<br />
1987 122 246 2299 873 1 207 172 47<br />
1988 196 264 2230 1 122 917 106 85<br />
1989 244 1051 641 421 112 107<br />
1990 220 1427 809 580 115 114<br />
1991 P 216 1460 896 643 128 125<br />
al La suma <strong>de</strong> <strong>los</strong> parciales pue<strong>de</strong> no coincidir con el total <strong>de</strong>bido al redcln<strong>de</strong>o <strong>de</strong> cifras.<br />
b/ A partir <strong>de</strong> 1990 se establece la veda permanente para su captura.<br />
FUENTE: Secretaría <strong>de</strong> Pesca.<br />
251 INEGI. <strong>Anuario</strong> <strong>Estadístico</strong> <strong>de</strong> <strong>los</strong> <strong>Estados</strong> <strong>Unidos</strong> <strong>Mexicanos</strong>. <strong>1992</strong>
INEGI. <strong>Anuario</strong> <strong>Estadístico</strong> <strong>de</strong> <strong>los</strong> <strong>Estados</strong> <strong>Unidos</strong> <strong>Mexicanos</strong>. <strong>1992</strong><br />
PRODUCCION ACUICOLA DE PECES DE AGUA<br />
DULCE POR ESPECIE<br />
1980-91<br />
(Toneladas en peso vivo)<br />
Año<br />
1980<br />
1981<br />
1982<br />
1983<br />
1984<br />
1985<br />
1986<br />
1987<br />
1988<br />
1989<br />
1990<br />
1991 P<br />
Mojarra<br />
18068<br />
46601<br />
65118<br />
57568<br />
63669<br />
63724<br />
66568<br />
75093<br />
74843<br />
73766<br />
83815<br />
76 174<br />
FUENTE: Secretaria <strong>de</strong> Pesca.<br />
Carpa<br />
4432<br />
11 134<br />
8747<br />
7236<br />
10088<br />
16549<br />
20921<br />
26170<br />
27056<br />
22604<br />
27214<br />
28220<br />
Charal<br />
4028<br />
7267<br />
8266<br />
6690<br />
7980<br />
7396<br />
7728<br />
7800<br />
7622<br />
7898<br />
8601<br />
7821<br />
Bagre<br />
1058<br />
3269<br />
1904<br />
1317<br />
1 793<br />
1566<br />
2786<br />
2366<br />
2764<br />
2947<br />
3264<br />
3427<br />
EMBARCACIONES POR SECTOR Y PESQUERIA<br />
1980-91<br />
Año<br />
1980<br />
1981<br />
1982<br />
1983<br />
1984<br />
1986<br />
1986<br />
1987<br />
1988<br />
1989<br />
1990<br />
1991 P<br />
Total<br />
36041<br />
41 147<br />
43957<br />
46196<br />
48422<br />
51903<br />
58292<br />
66044<br />
69631<br />
73686<br />
74619<br />
74767<br />
FUENTE: Secretaría <strong>de</strong> Pesca.<br />
252<br />
Público<br />
Sector<br />
Privado Social<br />
284 16656 19101<br />
414 17 738 22996<br />
487 19 663 23 807<br />
611 21 228 24467<br />
612 23157 24763<br />
526 25 632 26 745<br />
443 27 760 30089<br />
449 32063 33532<br />
468 36 839 33 334<br />
482 37992 36212<br />
298 38 688 35 633<br />
240 38777 35740<br />
Lobina Pescado<br />
blanco<br />
867<br />
1230<br />
1 193<br />
1 324<br />
1746<br />
1664<br />
1 224<br />
1290<br />
1466<br />
1414<br />
1824<br />
1612<br />
273<br />
887<br />
666<br />
290<br />
230<br />
286<br />
333<br />
127<br />
96<br />
143<br />
160<br />
147<br />
Trucha<br />
44<br />
71<br />
168<br />
97<br />
162<br />
393<br />
426<br />
387<br />
929<br />
840<br />
1 113<br />
1669<br />
Pesquería<br />
Mayores<br />
Total Camarón Atún Sardina<br />
3531<br />
3684<br />
3708<br />
3798<br />
3611<br />
3472<br />
3336<br />
3271<br />
3223<br />
3288<br />
3213<br />
3287<br />
2713<br />
2866<br />
2836<br />
2880<br />
2627<br />
2664<br />
2417<br />
2387<br />
2337<br />
2351<br />
2286<br />
2339<br />
51<br />
62<br />
70<br />
85<br />
69<br />
79<br />
98<br />
86<br />
84<br />
86<br />
86<br />
86<br />
123<br />
126<br />
140<br />
141<br />
125<br />
129<br />
125<br />
117<br />
116<br />
118<br />
103<br />
116<br />
CUADRO 11.17<br />
eatán<br />
409<br />
676<br />
162<br />
89<br />
100<br />
77<br />
61<br />
69<br />
62<br />
34<br />
45<br />
49<br />
Otros<br />
3088<br />
11304<br />
4640<br />
5639<br />
7283<br />
2797<br />
3248<br />
4202<br />
6697<br />
7619<br />
2130<br />
5820<br />
CUADRO 11.18<br />
Otras<br />
Menores<br />
644 32610<br />
631 37463<br />
662 40249<br />
692 42398<br />
690 44911<br />
710 48431<br />
696 54956<br />
682 62773<br />
687 66408<br />
734 70398<br />
740 71 406<br />
747 71470
MA HRIA PRIMA PROCESADA PESQUERA CUADRO 11.19<br />
1980-91<br />
(Toneladas'<br />
Año Total Enlatado Congelado Reducción a/ Otros<br />
procesos b/<br />
1980 791 966 122 766 138 993 626 '161 4767<br />
1981 986 117 218036 168 697 686 :122 13062<br />
1982 894956 162608 1 la 262 617 709 4377<br />
1983 579839 139024 83119 355 '119 2277<br />
1984 604832 140035 133527 326023 5247<br />
1985 703 246 155884 139421 402 '186 5454<br />
1986 717 476 142 292 120399 449 ¡¡50 6134<br />
1987 764846 147 666 114165 487 :149 6766<br />
1988 703 870 149461 121 112 425 "158 8149<br />
1989 767 630 147 424 118028 493 173 9005<br />
1990 693064 198037 149737 341 :395 3896<br />
1991 P 778 397 187 786 170464 413 {¡60 6507<br />
al Proceso medIante el cual las especies se someten a altas temperaturas pata su <strong>de</strong>shidratación; posteriormente se<br />
muelen para obtener harina y aceite.<br />
bl Se refieren al tratamiento que se le da a algunas espeCies, en hornos () al sol <strong>de</strong>spués <strong>de</strong> ser impregnados <strong>de</strong> sal<br />
o salmuera, para su conservación o preservación.<br />
FUENTE: Secretaria <strong>de</strong> Pesca.<br />
PRODUCCION INDUSTRIAL PESQUERA CUADRO 11.20<br />
1980-91<br />
(Toneladas'<br />
Año Total Enlatado Congel.éldo Reducción al Otros<br />
procesos bl<br />
1980 273 170 90619 66366 1141553 1 732<br />
1981 353 193 148607 82580 117 :164 4742<br />
1982 293 936 108831 53349 129 !l45 1 811<br />
1983 207 254 99701 37 138 69 !394 821<br />
1984 220 148 97790 58530 62.384 1444<br />
1985 253 397 102713 60750 88 199 1 736<br />
1986 257943 99116 69695 97 748 1 384<br />
1987 265009 103690 66810 104300 1 309<br />
1988 267 120 101 331 69372 94716 1 701<br />
1989 271 101 106 367 67 202 106 664 1 868<br />
1990 279472 128069 74015 76063 1 325<br />
1991 P 311 615 123 798 93 9154 92 161 1 702<br />
al Proceso mediante el cual les especies se someten a altas temperaturas para su <strong>de</strong>shidratación; posteriormente se<br />
mlJelen para obtener harina y aceite.<br />
b/ Se refieren al tratamiento que se le da a algunas espeCIes, en hornos o al sol <strong>de</strong>spués <strong>de</strong> ser impregnados <strong>de</strong> sal<br />
o salmuera, para su conservación o preservación.<br />
FUENTE: Secretaría <strong>de</strong> Pesca.<br />
253 INEGI. <strong>Anuario</strong> <strong>Estadístico</strong> <strong>de</strong> <strong>los</strong> <strong>Estados</strong> <strong>Unidos</strong> <strong>Mexicanos</strong>. <strong>1992</strong>
GAPITUL012<br />
INDUSTRIA<br />
INEGI. <strong>Anuario</strong> <strong>Estadístico</strong> <strong>de</strong> <strong>los</strong> <strong>Estados</strong> <strong>Unidos</strong> <strong>Mexicanos</strong>. <strong>1992</strong>
INEGI. <strong>Anuario</strong> <strong>Estadístico</strong> <strong>de</strong> <strong>los</strong> <strong>Estados</strong> <strong>Unidos</strong> <strong>Mexicanos</strong>. <strong>1992</strong><br />
PRINCIPALES CARACTERISTICAS DEL SECTOR CUADRO 12.1<br />
INDUSTRIAL NACIONAL POR ESTRATOS<br />
1970-1988<br />
Unida<strong>de</strong>s Personal (Millones <strong>de</strong> nuevos pesos)<br />
Estrato censadas ocupado Remunera- Producción Valor <strong>de</strong> la Insumos Valor<br />
y año (promedio) ciones al bruta total producción totales a/ agregado<br />
Total nacional<br />
personal industrial censal<br />
ocupado bruto bl<br />
1970 125407 1 749 392 41 243 215 145 98<br />
1975 123934 1 895929 102 554 489 321 233<br />
1980 136030 2898 201 379 2242 2077 30B" 935<br />
1986 137216 3381 304 3648 27246 25003 15141 12104<br />
1988 149192 3393672 28461 240802 222 178 141876 98926<br />
Micro y pequeña<br />
1970 122477 732652 11 57 63 35 22<br />
1976 120 779 708662 23 111 103 70 41<br />
1980 131606 901 164 76 376 376 241 136<br />
1985 131929 1016224 795 5078 4671 3223 1856<br />
1988 143620 1 079336 5072 39232 35941 26257 12975<br />
Mediana<br />
1970 1 796 283 163 6 42 39 26 16<br />
1975 1875 289307 14 90 83 57 33<br />
1980 2481 389541 43 270 260 174 96<br />
1985 3031 476198 459 3440 3188 2469 971<br />
1988 3133 491 088 3372 29797 26986 19732 lO 065<br />
Gran<strong>de</strong><br />
1970 1 134 733677 24 144 124 84 60<br />
1976 1280 898060 66 362 303 193 159<br />
1980 1943 1 607496 260 1697 1442 893 704<br />
1985 2266 1 888882 2394 18727 17 143 9450 9277<br />
1988 2439 1 823 148 20016 171772 159250 95887 75885<br />
a/ Los insumos totales se obtuvieron por la diferencia <strong>de</strong> la producción bruta total y el valor agregado censal bruto.<br />
bl El valor agregado censal bruto se obtuvo por la diferencia <strong>de</strong> la producción bruta total menos insumos totales.<br />
FUENTE: Instituto Nacional <strong>de</strong> Estadistica. Geografía e Informática. Censos Industriales.<br />
258
PRINCIPALES CARACTERISTlCAS DE LA INDUSTRIA MANUFACTURERA CUADRO 12.2<br />
POR ESTRATOS<br />
1970-1988<br />
Unida<strong>de</strong>s Personal (Millones <strong>de</strong> nuevos pesos,'<br />
Estrato censadas ocupado Remunera- Producción Valor <strong>de</strong> la Insumas Valor<br />
y año (promedio) clones al bruta total producción totales di agregado<br />
Total nacional<br />
al personal bl Industrial el censal<br />
ocupado bruto fl<br />
1970 118983 1 520661 32 207 190 128 79<br />
1975 118634 1 654381 77 461 425 285 176<br />
1980 126 072 2109009 259 1 672 1 550 1078 594<br />
1985 129380 2 504 759 2545 17 993 16569 12214 5779<br />
1988 138813 2570159 <strong>1992</strong>5 172 872 157 230 109 825 63047<br />
Micro y pequeña<br />
1970 116250 653 282 8 56 52 35 21<br />
1975 115648 630 667 17 109 100 69 40<br />
1980 122 421 732824 52 352 326 232 120<br />
1985 125018 836441 492 3464 3192 2445 1018<br />
1988 134 229 895 712 3587 34017 31 195 22872 11 145<br />
Mediana<br />
1970 1 724 272 281 6 41 38 25 16<br />
1975 1823 281 599 13 89 82 57 32<br />
1980 2 138 335515 39 253 235 168 85<br />
1985 2565 403 297 411 3161 2920 2307 853<br />
1988 2641 414 309 3020 27562 24963 18272 9290<br />
Gran<strong>de</strong><br />
1970 1009 595098 17 110 101 67 42<br />
1975 1 163 742 115 46 264 243 159 104<br />
1980 1 513 1 040 670 169 1067 989 678 389<br />
1985 1 797 1 265021 642 11 369 10458 7462 3907<br />
1988 1943 1 260 138 13319 111 293 101071 68681 42612<br />
al Para 1985 datos al 30 <strong>de</strong> Junio.<br />
bl Cifras estimadas para 1960 y 1980, <strong>de</strong> acuerdo con la proporCión que tiene la producción bruta total respecto al<br />
valor <strong>de</strong> la producción Industrial <strong>de</strong> 1985.<br />
el Para 1965, 1970 Y 1975 las cifras consignadas se estimaron calculando la partiCipaCión <strong>de</strong>l valor <strong>de</strong> la producción<br />
Industrial respecto a la prodUCCión bruta total <strong>de</strong> 1985.<br />
di Los insumas totales se obtUVieron por la diferencia <strong>de</strong> la prodUCCión bruta total y el valor ugregado censal bruto.<br />
fl El valor agregado censal bruto se obtuvo por la dIferencia <strong>de</strong> la producción bruta total menos Insumas totales.<br />
FUENTE: Instituto Nacional <strong>de</strong> Estadística. Geografía e Informatica. Censos Industriales.<br />
259<br />
INEGI. <strong>Anuario</strong> <strong>Estadístico</strong> <strong>de</strong> <strong>los</strong> <strong>Estados</strong> <strong>Unidos</strong> <strong>Mexicanos</strong>. <strong>1992</strong>
INEGI. <strong>Anuario</strong> <strong>Estadístico</strong> <strong>de</strong> <strong>los</strong> <strong>Estados</strong> <strong>Unidos</strong> <strong>Mexicanos</strong>. <strong>1992</strong><br />
PRODUCCION DE GAS NATURAL POR REGIONES Y DISTRITOS CUADRO 12.7<br />
1980-91<br />
(Millones <strong>de</strong> pies cúbicos diarios)<br />
(1" parte)<br />
Total Re§l,ón Sur<br />
Año Total Agua El Plan Nanchltal Ciudad Comal- Vlllaher-<br />
Dulce Pemex calco<br />
1980 3648 2481 63 60 4 429 20 1 916<br />
1981 4061 2774 69 63 6 606 19 2132<br />
1982 4246 2676 66 56 6 426 16 2 117<br />
1983 4054 2471 54 54 4 330 14 2016<br />
1984 3753 2210 46 48 4 276 20 1 816<br />
1986 3604 2144 39 41 3 218 20 823<br />
1986 3431 2077 43 49 196 23 763<br />
1987 3498 2064 67 55 2 163 16 761<br />
1988 3478 2061 71 48 3 164 13 1 762<br />
1989 3572 2046 67 45 2 175 14 742<br />
1990 3652 2059 71 47 3 213 16 1709<br />
1991 3633 2000 79 46 198 19 1656<br />
CUADRO 12.7<br />
(2" parte y última)<br />
Re21ón Norte Reglón Marina<br />
Año Total Frontera Norte Sur Poza Cuenca <strong>de</strong>l (Golfo <strong>de</strong><br />
Noreste Rica Papaloapan Campeche)<br />
1980 809 525 55 20 173 36 258<br />
1981 758 460 57 25 166 51 629<br />
1982 712 401 64 23 172 62 859<br />
1983 681 393 42 26 157 63 902<br />
1984 691 348 38 21 124 60 962<br />
1986 606 297 36 20 92 61 964<br />
1986 486 288 45 19 77 67 868<br />
1987 465 271 47 22 68 67 969<br />
1988 415 239 46 21 63 57 1002<br />
1989 448 238 41 19 49 101 1079<br />
1990 476 246 42 20 46 122 1 118<br />
1991 473 233 42 24 49 126 160<br />
FUENTE: Petróleos <strong>Mexicanos</strong>. <strong>Anuario</strong>s <strong>Estadístico</strong>s (Varios años).<br />
264
CAPACIDAD INSTALADA PARA LA DESTlLACION PRIMARIA DE CUADRO 12.8<br />
CHUDO y lIQUIDOS DEl. GAS NATURAL POR REFINERIA (1" parte)<br />
1!l80-91<br />
IBarriles por día)<br />
Total 18 <strong>de</strong> Francisco Lázaro Poza Rica, Reynosa, Antonio M.<br />
Marzo 1. Ma<strong>de</strong>ro Cár<strong>de</strong>nas Ver. Tamps. AmOr<br />
Ario (Azcapotzal- led. (Mlnatltlán, (Salamanca,<br />
ca,D.F.) Ma<strong>de</strong>ro. Ver.) Gto)<br />
Tamps.l<br />
1980 1 270000 105000 185000 200000 16000 9000 200000<br />
1981 270000 105000 185000 200000 16000 9000 200000<br />
1982 1 620500 105000 186000 290000 38000 20500 200000<br />
1983 1 630500 105000 216000 270000 38000 20500 200000<br />
1984 1 679500 105000 196000 270 000 72000 20500 235 000<br />
1985 1 789500 105000 196000 270 000 72000 20500 235000<br />
1986 789500 105000 196000 270 000 72000 20500 235000<br />
1987 954 500 105000 196000 270 000 72000 20500 235000<br />
1988 1 954 500 105000 196000 270 000 72000 20500 235000<br />
1989 2 119500 105000 196 000 270 000 72000 20500 235000<br />
1990 2 235 500 105 000 196 000 270 000 72000 20500 235000<br />
1991 2 080 500 al 196 000 270000 22000 bl 20500 235000<br />
CUADRO 12.8<br />
(2" parte y última)<br />
Miguel Héctor Lata AntoniO Cactus, La Cangre- Nuevo More<strong>los</strong>,<br />
Arw Hidalgo Sosa Dovalí ChIs. Jera, Ver. Pemex, Ver.<br />
!Tula, Hgo.) le a<strong>de</strong>reyta, (Salina Ver.<br />
N.L.) Cruz, Oax.)<br />
1980 150000 235000 170000<br />
1981 150000 235000 170 000<br />
1982 150000 235000 170 000 113000 113000<br />
1983 150000 235000 170 000 113000 113000<br />
1984 155000 235000 165000 113000 113000<br />
1985 155000 235000 165000 113000 113000 110000<br />
1986 155000 235000 165000 113000 113000 110000<br />
1987 320000 235000 165000 113000 113000 110000<br />
1988 320000 235000 165000 113000 113000 110000<br />
1989 320000 235000 330 000 113000 113000 110000<br />
1990 320000 235000 330 000 113000 113000 113000 113000<br />
1991 320000 235000 330 000 113000 113000 113000 113000<br />
al Esta refinería se cerró a partir <strong>de</strong>l 18 <strong>de</strong> marzo <strong>de</strong> 1991.<br />
b/ Se redujo la capacIdad <strong>de</strong>bido a que el 4 <strong>de</strong> marzo <strong>de</strong> 1991, se cerraron las instalaciones <strong>de</strong> <strong>de</strong>stilación pnmarla <strong>de</strong><br />
crudo.<br />
FUENTE: Petróleos MeXicanos, MemOria <strong>de</strong> Labores (Varios años),<br />
265 INEGI. <strong>Anuario</strong> <strong>Estadístico</strong> <strong>de</strong> <strong>los</strong> <strong>Estados</strong> <strong>Unidos</strong> <strong>Mexicanos</strong>. <strong>1992</strong>
INEGI. <strong>Anuario</strong> <strong>Estadístico</strong> <strong>de</strong> <strong>los</strong> <strong>Estados</strong> <strong>Unidos</strong> <strong>Mexicanos</strong>. <strong>1992</strong><br />
CONSUMO NACIONAL APARENTE DE PRODUCTOS CUADRO 12.11<br />
PETROLlFEROS<br />
(1" parte)<br />
1980-91<br />
(Miles <strong>de</strong> barriles diarios)<br />
Año Total Gas licuado Gasolinas Turbosln8<br />
1980 107.8 113.6 326.7 28.2<br />
1981 1204.0 138.5 359.7 29.5<br />
1982 203.6 153.2 345.9 31.8<br />
1983 181.7 161.0 333.6 26.0<br />
1984 1 246.8 175.8 326.5 30.3<br />
1985 1 294.7 184.4 340.4 29.7<br />
1986 1 297.2 190.8 347.3 29.0<br />
1987 1 378.5 193.5 364.4 29.8<br />
1988 1 363.3 196.3 363.4 26.5<br />
1989 1498.1 209.9 416.9 33.0<br />
1990 553.9 216.4 453.8 36.2<br />
1991 622.0 234.8 486.7 45.0<br />
Año querosenos<br />
CUADRO 12.11<br />
(2" parte y última)<br />
Otros Diesel Combustóleo Lubricantes al Otros<br />
1980 41.0 243.9 279.7 12.0 62.7<br />
1981 40.6 261.6 294.8 12.1 67.1<br />
1982 45.0 228.2 314.0 11.0 74.5<br />
1983 38.5 199.5 324.3 12.0 86.8<br />
1984 31.8 222.4 362.8 9.9 87.3<br />
1985 30.9 230.8 3R2.4 Ih7 86.5<br />
1986 26.8 217.6 396.9 9.9 79.9<br />
1987 30.2 221.4 438.2 7.4 S3.6<br />
1988 27.2 198.7 438.7 7.6 104.9<br />
1989 24.9 222.8 471.5 7.5 111.6<br />
1990 15.8 227.5 479.2 7.3 117.7<br />
1991 9.8 258.4 453.1 7.7 126.5<br />
al Sólo incluye comercIO exterior <strong>de</strong> Pemex; excluye otras empresas.<br />
FUENTE: Petróleos <strong>Mexicanos</strong>. <strong>Anuario</strong>s <strong>Estadístico</strong>s (Varios años).<br />
268
VOLUMEN DE VENTAS INTERNAS DE<br />
PETROllFEROS y GAS NA TURAl<br />
1980-91<br />
(Miles <strong>de</strong> barriles diarios)<br />
Año<br />
1980<br />
1981<br />
1982<br />
1983<br />
1984<br />
1986<br />
1986<br />
1987<br />
1988<br />
1989<br />
1990<br />
1991<br />
ArlO<br />
1980<br />
1981<br />
1982<br />
1983<br />
1984<br />
1985<br />
1986<br />
1987<br />
1988<br />
1989<br />
1990<br />
1 170.7<br />
263.2<br />
291.2<br />
1 236.4<br />
292.0<br />
1 329.0<br />
1 299.4<br />
357.8<br />
355.5<br />
1 449.9<br />
541.8<br />
1 618.2<br />
Querosenos<br />
Total Turboslna<br />
65.4<br />
66.9<br />
65.2<br />
55.9<br />
53.5<br />
50.3<br />
48.4<br />
51. 1<br />
46.5<br />
46.9<br />
44.8<br />
27.5<br />
28.8<br />
28.3<br />
27.6<br />
28.5<br />
29.8<br />
28.6<br />
29.5<br />
26.4<br />
31.4<br />
35.5<br />
968.2<br />
1 053.3<br />
1 080.3<br />
1030.2<br />
1 098.2<br />
1 137.8<br />
1 126.8<br />
1 184.3<br />
187.0<br />
274.1<br />
1 343.8<br />
1 401.9<br />
Otros<br />
37.9<br />
38.1<br />
36.9<br />
28.3<br />
25.0<br />
20.5<br />
19.8<br />
21.6<br />
20.1<br />
15.5<br />
9.3<br />
101.3<br />
114.8<br />
130.4<br />
141.4<br />
167.5<br />
179.0<br />
176.1<br />
175.1<br />
178.2<br />
186.6<br />
197.3<br />
212.9<br />
314.2<br />
357.8<br />
360.9<br />
316.8<br />
324.2<br />
324.0<br />
332.7<br />
347.9<br />
361.2<br />
405.6<br />
445.5<br />
479.8<br />
Petrolíferos<br />
Diesel Combustólea<br />
Asfaltos<br />
1991 44.4 37.0 7.4 223.9 408.7 21.3<br />
al A partir <strong>de</strong> septiembre <strong>de</strong> 1990 la gasolina Magna Sin, sustituyó a la gasolina Extra.<br />
b/lncluye allcos, coque, naftas pe.sadas, parafinas y gasóleo Industrial.<br />
cl EqUivalente a cornbustóleo.<br />
FUENTE: Petróleos MeXicanos, AnuariOS <strong>Estadístico</strong>s (VariOs años).<br />
CUADRO 12.12<br />
(1° parte)<br />
Total Peuolíferos<br />
Total Gas<br />
Gasolinas<br />
licuado Total Nova Extra.' Gasavlón Indus<br />
MagnQ<br />
Sin 81<br />
triales<br />
215.0<br />
232.9<br />
222.5<br />
192.6<br />
201.4<br />
201.4<br />
187.8<br />
189.5<br />
184.4<br />
194.0<br />
210.1<br />
243.1<br />
249.6<br />
269.2<br />
295.2<br />
318.0<br />
348.2<br />
355.9<br />
396.4<br />
394.3<br />
419.6<br />
421.4<br />
284.5<br />
339.8<br />
348.5<br />
308.7<br />
317.2<br />
316.3<br />
322.2<br />
332.5<br />
339.2<br />
360.9<br />
390.2<br />
428.9<br />
16.1<br />
17.7<br />
18.6<br />
16.2<br />
20.9<br />
22.1<br />
14.9<br />
16.7<br />
14.1<br />
12.9<br />
14.8<br />
26.3<br />
14.4<br />
9.0<br />
5.4<br />
4.1<br />
4.8<br />
7.8<br />
12.6<br />
19.4<br />
42.0<br />
52.7<br />
48.6<br />
Lubncantes<br />
10.6<br />
11.3<br />
1 1. 1<br />
9.8<br />
10.4<br />
10.3<br />
8.7<br />
5.7<br />
6.6<br />
6.5<br />
7.1<br />
1.8<br />
1.9<br />
1.7<br />
1.2<br />
1.3<br />
11<br />
1.1<br />
1.1<br />
1.1<br />
1.0<br />
1.0<br />
0.9<br />
.6<br />
1.7<br />
.7<br />
1.5<br />
.6<br />
1.8<br />
1.6<br />
1.7<br />
1.5<br />
1.7<br />
1.6<br />
1.4<br />
CUADRO 12.12<br />
(2' parte y última)<br />
Otros<br />
bl<br />
2.5<br />
2.3<br />
2.6<br />
2.3<br />
2.3<br />
2.5<br />
2.3<br />
.9<br />
1.7<br />
2.0<br />
2.8<br />
3.8<br />
Gas<br />
natural<br />
el<br />
202.5<br />
209.9<br />
210.9<br />
206.2<br />
193.8<br />
191.2<br />
172.6<br />
173.6<br />
168.5<br />
175.8<br />
198.0<br />
216.3<br />
269 INEGI. <strong>Anuario</strong> <strong>Estadístico</strong> <strong>de</strong> <strong>los</strong> <strong>Estados</strong> <strong>Unidos</strong> <strong>Mexicanos</strong>. <strong>1992</strong>
INEGI. <strong>Anuario</strong> <strong>Estadístico</strong> <strong>de</strong> <strong>los</strong> <strong>Estados</strong> <strong>Unidos</strong> <strong>Mexicanos</strong>. <strong>1992</strong><br />
VOLUMEN DE PRODUCCION PETROQUIMICA SECUNDARIA CUADRO 12.16<br />
POR SUBRAMA DE ACTIVIDAD<br />
1981-90<br />
(Millones <strong>de</strong> toneladas)<br />
Total Fertilizantes Fibras Elastómeras Resinas Productos Especialida<strong>de</strong>s<br />
Año nitrogenados químicas y negro sintéticas intermedios petroquímlcas<br />
<strong>de</strong> humo<br />
1981 4990 2642 264 181 441 1286 176<br />
1982 6686 3219 264 188 436 1421 168<br />
1983 6721 2968 294 214 457 617 172<br />
1984 6304 3265 318 247 538 1 742 195<br />
1986 6894 3717 343 270 675 1 789 201<br />
1986 6755 3550 345 251 696 1 791 222<br />
1987 7929 3829 382 276 647 2589 206<br />
1988 12496 3786 407 281 1050 6603 al 369<br />
1989 13448 4227 408 262 1 133 7012 al 406<br />
1990 14368 4133 414 260 1305 7820 al 437<br />
NOTA: Debido al redon<strong>de</strong>o <strong>de</strong> las cifras la suma <strong>de</strong> <strong>los</strong> parciales pue<strong>de</strong> no coincidir con el total.<br />
a/lncluye productos básicos<br />
FUENTE: Secretada <strong>de</strong> Energía, Minas e Industria Paraestatal. Comisión Petroquímica Mexicana, Petroquírnica (Varios<br />
años)'<br />
VALOR DE LA PRODUCCION PETROQUIMICA SECUNDARIA CUADRO 12.17<br />
POR SUBRAMA DE ACTIVIDAD<br />
1981-90<br />
(Miles <strong>de</strong> nuevos pesos)<br />
Año Total Fertilizantes Fibras Elastómeros Resinas Productos Especialida<strong>de</strong>s<br />
nitrogenados químicas y negro sintéticas intermedios petroquímlcas<br />
<strong>de</strong> humo<br />
1981 92407 7498 22446 3376 16180 33870 9037<br />
1982 154688 10 651 32175 7676 25540 63638 15008<br />
1983 394423 21 892 77059 24264 74677 153 174 43358<br />
1984 612472 38436 94049 46327 123019 243820 67619<br />
1986 996637 73376 224 627 82047 168230 328362 119996<br />
1966 1 765049 120215 427613 137073 316867 569411 193971<br />
1987 4 146523 313679 661 538 362621 876907 1 527 458 414320<br />
1988 8691498 771 201 1 790 110 486579 673019 2 982 943 987 646<br />
1989 11889210 974610 2020059 381 480 2 786 304 4 396 697 1 330 160<br />
1990 13205745 212 303 2 307 335 443483 2978 620 4 766 969 1 497 035<br />
NOTA: Debido al redon<strong>de</strong>o <strong>de</strong> las cifras, la suma <strong>de</strong> <strong>los</strong> parciales pue<strong>de</strong> no coincidir con el total.<br />
Los cambios súbitos que se presentaron en la producción a part.r <strong>de</strong> 1988, en lo referente a las resinas, se<br />
<strong>de</strong>ben 8 una mayor respuesta en el número <strong>de</strong> empresas encuestadas.<br />
FUENTE: Secretaría <strong>de</strong> Energía. Minas e Industria Paraestatal. Comisión Petroquimica Mexicana, Petroqufmica (Varios<br />
años),<br />
274
INEGI. <strong>Anuario</strong> <strong>Estadístico</strong> <strong>de</strong> <strong>los</strong> <strong>Estados</strong> <strong>Unidos</strong> <strong>Mexicanos</strong>. <strong>1992</strong><br />
VOLUMEN DE LA PRODUCCION MINEROMETALURGICA<br />
1980-91<br />
IToneladas)<br />
Metales y minerales si<strong>de</strong>rúrgicos<br />
Año Total Carbón Coque b/ Fierro a/ Mangamineral<br />
bicI neso &/<br />
CUADRO 12.18<br />
(3' parte)<br />
Mmerales no metálicos b/<br />
Total Azufre dI Barita Caolín<br />
1980 15209730 7009716 2951687 5087361 160966 7621557 2102301 269322271041<br />
1981 97117611237201297374862926092081938030639 2077117 317738207824<br />
1982 9336862 786948 2985546 6382239 183120 7058970 1815447 363753 172390<br />
1983 10263962 1818489 2996126 6306343 133004 6586108 1602029 367043 20149<br />
1984 10260819 2215056 2375480 6489343 180940 7467086 1825729 426096 14745<br />
1986 10142112 2440360 2389971 6161 144 160647 8041674 2019753 467693 37976<br />
198610719456367761820500124817410 17441678603782060736 321186 10067<br />
1987 11703620 4261715 2340266 4965133 146407 8047698 2303775 401336 12826<br />
1988122751524210842233124556644921685738261884 2138240 53495411633<br />
1989 12027 244 4243838 2260480 5373051 149875 8494841 2086333 324739 15693<br />
1990127904714135319232443461940121367068293265 2135646 310606 5403<br />
1991 13412944 4790185 2153117 6390436 79206 6882614 1791841 191 962 12 209<br />
CUADRO 12.18<br />
(4' parte y última)<br />
Minerales no metálicos bl<br />
Año Celestits Dolomita Fel<strong>de</strong>spato Fluorita Fosforita Grafito Sílice fi Yeso Wollas'<br />
tonita<br />
1980<br />
1981<br />
1982<br />
1983<br />
1984<br />
1986<br />
1986<br />
1987<br />
1988<br />
1989<br />
1990<br />
1991<br />
al ContenIdo metálico.<br />
b/ Volumen <strong>de</strong>l mineral.<br />
40761 378 316 117214 916455396646<br />
41344 371027 130 826 924 854 603 252<br />
31 676 353265 115559 631 386 653050<br />
37506 285151 117518 556977 498112<br />
31 991 329694 395046 627433 518293<br />
32320 318111 432031 697410 645299<br />
24042 376223 85019 766768 660426<br />
32407 361 721 90 908 723 694 633 204<br />
38794 340671 86 258 756096 666 763<br />
37 841 469 664 113438 779357 625386<br />
40 130 406 649 124497 672786 604818<br />
38835 435214 138732 324320416426<br />
el Las cifras se refieren al carbón mineral no coqu!zable<br />
44 854 892 963 2 170 779 20 905<br />
42294 1009330 2390431 14602<br />
36174 828187 2042484 15599<br />
44327 929059 2 127 453 10784<br />
41620 936876 2300413 9261<br />
35378 9761732366019 13612<br />
37780 893699 2626 178 9356<br />
37946 9921712457810<br />
43831 996018 2649290<br />
40246 103005 2898603<br />
25387 162371 2804542<br />
30 165 1 184 1 13 2 318 166<br />
dI Incluye la extracción minera y el obtenido en la refinación <strong>de</strong> petróleo crudo.<br />
f/lncluye arena para VIdriO y cuarzo.<br />
FUENTE: Instituto Nacional <strong>de</strong> Estadística. Geogrofía e Informática. con base en cifras <strong>de</strong> 1ft Secretaría <strong>de</strong> Energía.<br />
Minas e Industria Pareest8tal.<br />
276<br />
346<br />
636<br />
531<br />
632
INEGI. <strong>Anuario</strong> <strong>Estadístico</strong> <strong>de</strong> <strong>los</strong> <strong>Estados</strong> <strong>Unidos</strong> <strong>Mexicanos</strong>. <strong>1992</strong><br />
VALOR DE LA PRODUCCION MINEROMETALURGICA<br />
1980-91<br />
(Miles <strong>de</strong> nuevos pesos)<br />
Año<br />
1980<br />
1981<br />
1982<br />
1983<br />
1984<br />
1986<br />
1986<br />
1987<br />
1988<br />
1989<br />
Metales y minerales si<strong>de</strong>rúrgicos<br />
Total Carbón Coque bl Fierro al Mangamineral<br />
bicI<br />
neso a/<br />
8276<br />
7360<br />
8499<br />
17939<br />
27030<br />
38284<br />
68517<br />
119067<br />
398240<br />
468 197<br />
2874<br />
198<br />
126<br />
291<br />
364<br />
390<br />
588<br />
680<br />
63163<br />
63658<br />
1668<br />
1680<br />
1 687<br />
1 370<br />
1342<br />
3160<br />
4630<br />
6284<br />
13969<br />
21078<br />
674<br />
842<br />
1402<br />
2318<br />
4266<br />
1 360 31768 4776<br />
1 158 54172 12599<br />
1322 93720 23334<br />
123539 157738 53800<br />
119738 218289 66514<br />
1990 634607 62030 123195 325232 124149<br />
1991 1 700720 421 296 605405 615226 58793<br />
CUADRO 12.19<br />
(3" parte)<br />
Minerales no metálicos b/<br />
Total Azufre dI Barita Caolín<br />
6686<br />
8767<br />
12625<br />
22493<br />
46684<br />
3442<br />
4612<br />
6232<br />
12677<br />
31 373<br />
86364 63412<br />
192234 148407<br />
458 829 355 133<br />
783229 566471<br />
759088 538 376<br />
787 170 569 203<br />
139 298 674496<br />
271<br />
394<br />
756<br />
1966<br />
3367<br />
5061<br />
6723<br />
18513<br />
42931<br />
28099<br />
30874<br />
40309<br />
47<br />
46<br />
72<br />
2<br />
3<br />
35<br />
47<br />
16<br />
1 917<br />
CUADRO 12.19<br />
(4" parte y última)<br />
Minerales no metálicos bl<br />
Año Celestita Dolomita Fel<strong>de</strong>spato Fluorita Fosforita Grafito Yeso Wollastonit8<br />
1980<br />
1981<br />
1982<br />
1983<br />
1984<br />
1985<br />
1986<br />
1987<br />
1988<br />
1989<br />
71<br />
109<br />
83<br />
369<br />
398<br />
388<br />
194<br />
189<br />
23<br />
22<br />
21<br />
17<br />
20<br />
19<br />
23<br />
187<br />
1703<br />
2348<br />
189<br />
237<br />
245<br />
495<br />
823<br />
1630<br />
46<br />
431<br />
567<br />
1 921<br />
2554<br />
3217<br />
6103<br />
8449<br />
14258 329<br />
34418 337<br />
78036 556<br />
144695 3334<br />
161764 3127<br />
1990 201 2033 623 159353 3024 7616 5812 8414 3<br />
1991 lO 360 61381 12541 87747 41240 22212 63094 123 745 256<br />
NOTA: Los valores están calculados con base en <strong>los</strong> precios oficiales utilizados para el cobro <strong>de</strong>l <strong>de</strong>recho sobre<br />
minería, excepto oro y plata cuyos precios <strong>los</strong> proporciona el Banco <strong>de</strong> México.<br />
al Contenido metálico.<br />
bl Volumen <strong>de</strong>l mineral.<br />
el Las cifras se refieren al carbón mineral no coquizable.<br />
dI Incluye la extracción minera y el obtenido en la refinación <strong>de</strong> petróleo crudo.<br />
f/lncluye arena para vidrio y cuarzo.<br />
FUENTE: Instituto Nacional <strong>de</strong> Estadística, Geografía e Informática. con base en cifras <strong>de</strong> 18 Secretaría <strong>de</strong> Energía,<br />
Minas e Industria Paraestatal.<br />
278<br />
383<br />
490<br />
980<br />
264<br />
264<br />
79<br />
97<br />
219<br />
437<br />
574<br />
843<br />
2195<br />
5175<br />
lO 510<br />
lO 358<br />
137<br />
163<br />
124<br />
139<br />
141<br />
116<br />
138<br />
668<br />
106<br />
115<br />
146 118<br />
131<br />
505 676<br />
4975 7948<br />
5615 8696<br />
6<br />
6<br />
9<br />
28<br />
58<br />
157<br />
2<br />
3
INEGI. <strong>Anuario</strong> <strong>Estadístico</strong> <strong>de</strong> <strong>los</strong> <strong>Estados</strong> <strong>Unidos</strong> <strong>Mexicanos</strong>. <strong>1992</strong><br />
VOLUMEN DE LA PRODUCCION DE PRODUCTOS<br />
SIDERURGICOS DERIVADOS POR TIPO<br />
1981-90<br />
(Toneladas)<br />
Año<br />
CUADRO 12.23<br />
(l'parte)<br />
Total Alambre al Lámina Hojalata<br />
galvanizada b/<br />
19B1 , 618546 519679 266 622 99226<br />
1982 147696, 666766 189881 ,26960<br />
1983 1 482706 66, 688 197 952 ,37 325<br />
1984 1 4835,3 647 039 172049 16266,<br />
,986 1 522334 641 982 242 200 ,452,7<br />
,986 1443726 64498, 264 183 19613B<br />
,987 16,9350 740821 303191 173793<br />
1988 1 594468 716400 330898 172 837<br />
1989 1319401 275 630 320069 143628<br />
1990 P 1627613 461728 393 391 82467<br />
CUADRO 12.23<br />
(2" parte y última)<br />
lámina con otros Productos Tornil<strong>los</strong>, pernos Tubos con<br />
Año recubnmientos el <strong>de</strong> alambre y remaches costura<br />
,981 104617 638303<br />
1982 30348 563007<br />
1963 28732 457009<br />
1984 22 560 479 204<br />
1966 23,06 469829<br />
1966 339424<br />
,987 401 546<br />
1988 374 333<br />
1989 2, 1 617 1528 367 ,39<br />
1990 P 237 794 1 300 450933<br />
NOTA: Para el año 1981. el concepto <strong>de</strong> lámina con otros recubrimientos incluye lámina emplomada.<br />
a/ De 1986 a 1988 son estimaciones con base en la producción <strong>de</strong> alambron para trefilación. Para 1989 y 1990 se<br />
reftere a <strong>los</strong> datos <strong>de</strong> las empresas y 8 estimaciones <strong>de</strong> CANACERO.<br />
bl Incluye la producción <strong>de</strong> lámina galvanizada-pintada.<br />
el A partir <strong>de</strong> 1986 la fuente no reporta cifras para este producto.<br />
FUENTE; CANACERO. Gerencia <strong>de</strong> Análisis y Evaluación Económica. Circulares.<br />
282
INEGI. <strong>Anuario</strong> <strong>Estadístico</strong> <strong>de</strong> <strong>los</strong> <strong>Estados</strong> <strong>Unidos</strong> <strong>Mexicanos</strong>. <strong>1992</strong><br />
VOLUMEN DE VENTAS DE PRODUCTOS SIDERURGICOS CUADRO 12.25<br />
1981-90<br />
(Toneladas)<br />
(1' parte)<br />
Plancha Lámina Lámina Lámma Lámina Hojalata Láminas Alambrón<br />
al en en frío galvanl- con <strong>de</strong> acero<br />
Año caliente bl zada el otros Inoxidable<br />
bl recubri-<br />
mientos<br />
1981 766420 446924 1310768 257 863 109643 100 648 14222 284 316<br />
1982 619667 406387 1016103 193281 30348 124 777 11 667 324773<br />
1983 420028 468058 920007 193 169 20293 138453 12 196 469 403<br />
1984 514630 556545 947 328 206 826 25035 161510 15553 476 824<br />
1985 538 704 575 080 1038 962 192130 23 106 139 892 28090 471 026<br />
1986 414 089 532 929 831 402 232911 29152 189 537 24666 459648<br />
1987 489 266 610 770 927 116 280 179 180183 34766 594018<br />
1988 489036 603615 769 944 324 538 179361 40030 557 429<br />
1989 460577 627 097 703022 280730 144881 44038 492 286<br />
1990 517 164 784 241 836 150 375711 77 825 50563 508 732<br />
CUADRO 12.25<br />
(2' parte y última)<br />
Perfiles Barras Varilla Perfiles Alambre Productos Tubos Tubos<br />
Año estruc- macizas corrugada comerciales <strong>de</strong> su"! con<br />
turales II gl alambre y costura costura<br />
di alambrón hl<br />
1981 267 003 148668 1381373 267 339 86618 39603 247 127 666 206<br />
1982 203 870 97 174 1261 463 284208 156997 22 564 250794 486061<br />
1983 189495 193022 245 870 149 338 154215 277 749 401 667<br />
1984 208 534 224923 271 759 160369 150 974 318748 469026<br />
1985 210 860 317 336 299 930 198 236 169 345 298 884 499 595<br />
1986 189 270 376 556 259 080 218 344 166 786 208 221 318 336<br />
1987 237 270 265414 1635758 290 142 266 370 483274<br />
1988 198 839 236 750 1579423 243 392 345 525 369666<br />
1989 232 135 238480 1427 161 215313 322 377 313064<br />
1990 251 112 252 243 1769 379 310 807 317 696 417 379<br />
NOTA: Incluye exportaciones.<br />
al Espesor mayor <strong>de</strong> 4.76 milímetros.<br />
b/ Hasta 4.76 milímetros <strong>de</strong> espesor.<br />
e/Incluye lámina galvanizada-pintada.<br />
dI Más <strong>de</strong> 76 milímetros <strong>de</strong> peralte. Incluye perfiles laminados, soldados y formados en frío.<br />
tI Incluye lamlmados en caliente, terminados en frío y forjados.<br />
gl Hasta 76 milímetros <strong>de</strong> peralte.<br />
h/lncluye tubos menores y mayores <strong>de</strong> 115 milímetros.<br />
FUENTE: CANACERO. Gerencia <strong>de</strong> Análisis y EvaluaCión Econór(,\lca. Clrcul.:?:res.<br />
284
INEGI. <strong>Anuario</strong> <strong>Estadístico</strong> <strong>de</strong> <strong>los</strong> <strong>Estados</strong> <strong>Unidos</strong> <strong>Mexicanos</strong>. <strong>1992</strong><br />
VALOR DE LA PRODUCCION EN LA INDUSTRIA CUADRO 12.27<br />
MANUFACTURERA POR DIVISION<br />
(1' parte)<br />
DE ACTIVIDAD ECONOMICA<br />
(129 CLASES DE ACTIVIDAD)<br />
1980-91<br />
(Miles <strong>de</strong> nuevos pesos)<br />
Total 111 IV<br />
Productos Textiles, prendas Industria <strong>de</strong> la Papel, productos<br />
Año alimenticios, <strong>de</strong> vestir e industria ma<strong>de</strong>ra y pro- <strong>de</strong> papel, imprenbebidas<br />
y tabaco <strong>de</strong>l cuero dusctos <strong>de</strong> tas y editoriales<br />
ma<strong>de</strong>ra<br />
1980 al 708 667 168170 32472 3957 41 336<br />
1981 al 934506 227563 41080 4 153 51 271<br />
1982 al 1 315 123 360296 67 919 5086 72838<br />
1983 al 2308341 625 991 107568 9453 151814<br />
1984 al 4201 569 1 085543 161500 16450 270433<br />
1986 al 6887464 1829610 252941 28854 452 170<br />
1986 al 11 496 398 3326 997 404496 41609 713960<br />
1987 61956477 10473201 2624401 271 387 2767618<br />
1988 108838760 21317671 6115736 566131 6804448<br />
1989 133352231 27106404 6084605 696 123 6741160<br />
1990 166095280 34 657 328 7286465 846910 7444445<br />
1991 202144217 44891619 8 223 393 950032 8366246<br />
CUADRO 12.27<br />
(2' parte y última)<br />
V VI VII VIII IX<br />
Substancias Productos Industrias Productos Otras industrias<br />
químicas, <strong>de</strong>rivados minerales no metálicas metálicos, manufactureras<br />
Año <strong>de</strong>l petróleo, metálicos. básicas maquinaria<br />
productos <strong>de</strong> exceptuando y equipo<br />
caucho y plástico <strong>de</strong>rivados <strong>de</strong>l<br />
petróleo y carbón<br />
1980 al 87552 49602 142434 182 240 904<br />
1981 al 108073 63259 183072 254 755 1280<br />
1982 al 169 343 92409 251 508 303 785 1941<br />
1983 al 374 823 169 882 475 233 389 664 3913<br />
1984 al 624 876 305 849 967 215 764 436 5267<br />
1985 al 988258 636 170 1 398590 1 392 161 8710<br />
1986 al 1 734639 912608 2240393 2 105823 16073<br />
1987 11661893 3057 235 7473387 13537462 188893<br />
1988 23442613 6016629 16 270 118 29917337 399 277<br />
1989 28467657 6772607 18526440 38467 649 499 786<br />
1990 34198207 8849 107 21812045 60418947 581 826<br />
1991 40241 144 11769531 21960164 64992062 760036<br />
al 57 Clases <strong>de</strong> actividad<br />
FUENTE: Instituto Nocional <strong>de</strong> Estadística. Geografía e Informática. Encuesto Industrial Mensual.<br />
286
VALOR DE LAS VENTAS EN LA INDUSTRIA MANUFACTURERA CUADRO 12.28<br />
POFl DIVISION DE ACTIVIDAD ECONOMICA (1" parte)<br />
(12'9 CLASES DE ACTIVIDAD)<br />
198:0-91<br />
(Mile's <strong>de</strong> nuevos pesos)<br />
Total III IV<br />
Productos Textiles, prendas Industria d,e la Papel, productos<br />
alimenticIOS, <strong>de</strong> vestIr e indus- ma<strong>de</strong>ra y pro- <strong>de</strong> papel, Impren-<br />
bebidas y tria <strong>de</strong>l cuero duetos. <strong>de</strong> tas y editoriales<br />
tabaco ma<strong>de</strong>ra<br />
1980 al 690 992 167 457 31 365 3 ti38 38406<br />
1981 al 913 626 217 153 39283 4152 52100<br />
1982 al 1 301 290 358 086 56 182 4721 72248<br />
1983 al 2 279 293 617413 104 783 8 E;43 148 550<br />
1984 al 4114075 1 075705 161 147 15206 249 167<br />
1985 al 6746926 1816528 252 890 28 ()1O 426304<br />
1986 al 11 281 544 3272118 398 889 40 '!51 707614<br />
1987 51 159217 10255616 2517828 265 202 2771712<br />
1988 106 862 889 20 893 946 4951 951 535677 5 743 305<br />
1989 130451499 26752432 5924361 672 ;>03 6711924<br />
1990 163615270 34 398 428 7167477 827 H06 7 489 386<br />
1991 197 922468 44281762 8114815 933 Bal 8 297 598<br />
CUADRO 12.28<br />
(2" parte y última)<br />
V VI VII VIII IX<br />
Substancias Productos Industnas Productos Otras industrias<br />
químicas, <strong>de</strong>rivados minerales no metálicas metálicos, m anuf acturer as<br />
<strong>de</strong>l petróleo, metáltcos. báSIcas maquinaria<br />
Año productos <strong>de</strong> exceptuando y equIpo<br />
caucho y plástIco <strong>de</strong>rivados <strong>de</strong>l<br />
petróleo y carbón<br />
, 980 al 84915 44671 142887 1761349 904<br />
1981 al 107 895 62100 178 835 250 1383 225<br />
1982 ai 166301 90718 248 678 302 359 1 997<br />
1983 al 367 469 168917 469059 390 687 3872<br />
1984 al 6163:12 299 167 932036 760 126 5189<br />
1985 al 944203 519867 1310024 1 440 '070 8530<br />
1986 al 698456 906045 2150521 2093 784 13966<br />
1987 11 445 713 3067 336 7 286086 13361 '527 188 197<br />
1988 22734615 5914373 16027306 29687791 373925<br />
1989 27321 342 6577315 18082556 37941 362 468004<br />
1990 33 238 448 8 656 224 21 273 308 49999 251 564842<br />
1991 39027 774 11681277 21 714610 63163804 706 847<br />
al 57 Clases <strong>de</strong> actividad<br />
FUENTE: Instituto Nacional <strong>de</strong>o Estadística. Geografía e Informática. Encuesta Industrial Mensual.<br />
287 INEGI. <strong>Anuario</strong> <strong>Estadístico</strong> <strong>de</strong> <strong>los</strong> <strong>Estados</strong> <strong>Unidos</strong> <strong>Mexicanos</strong>. <strong>1992</strong>
INEGI. <strong>Anuario</strong> <strong>Estadístico</strong> <strong>de</strong> <strong>los</strong> <strong>Estados</strong> <strong>Unidos</strong> <strong>Mexicanos</strong>. <strong>1992</strong><br />
HUSOS, ROTORES Y TELARES INSTALADOS<br />
EN LA INDUSTRIA TEXTIL POR RAMA<br />
1981-90<br />
(Unida<strong>de</strong>s)<br />
Año Total Algodón<br />
CUADRO 12.31<br />
(1' parte)<br />
Husos Rotores Telares Husos Telares<br />
1981 3977 146 86457 2 865035 52472<br />
1982 4 122 871 87773 2 893 179 53225<br />
1983 4 124 871 87916 2 887 410 53101<br />
1984 3 293 117 29993 40319 1765154 13150<br />
1985 3427373 33723 46698 2401 865 18116<br />
1986 3494476 36694 43832 2 403 689 17458<br />
1987 3570242 39638 44857 2470400 18393<br />
1988 3586126 45782 45161 2452 240 18559<br />
1989 3 583 174 45382 45015 2425452 21680<br />
1990 3 596 334 45716 44857 2434776 21539<br />
CUADRO 12.31<br />
(2' parte y última)<br />
Año Lana FIbras quim!C3S<br />
Husos Telares Husos Telares<br />
1981 311 120 3649 800 990 30336<br />
1982 330894 3714 898 798 30834<br />
1983 321 739 3693 915722 31 122<br />
1984 166 794 1 393 1 361 169 25776<br />
1985 115045 920 910463 27 662<br />
1986 114434 1 110 976 353 25264<br />
1987 116949 1086 982 893 25378<br />
1988 119097 1 079 10147S9 25523<br />
1989 123621 154 1034101 22 181<br />
1990 125621 154 1 035937 22 164<br />
FUENTE: CANAINTEX, Memoria Estadística (Varios años).<br />
290
INEGI. <strong>Anuario</strong> <strong>Estadístico</strong> <strong>de</strong> <strong>los</strong> <strong>Estados</strong> <strong>Unidos</strong> <strong>Mexicanos</strong>. <strong>1992</strong><br />
PRODUCCION DE FIBRAS BLANDAS PARA USO TEXTIL POR TIPO CUADRO 12.33<br />
1981-90<br />
(Toneladas)<br />
(1" parte)<br />
Total Algodón Lana bJ Fibras químicas el<br />
aí Total Artificiales celulóslcas<br />
Año Total Acetato Acetato Rayón<br />
filamento fibra filamento<br />
textil corta textil<br />
1981 587 698 320400 1949 265349 33780 8327 8661 6240<br />
1982 435689 182 620 2040 251 029 24654 6547 7506 5307<br />
1983 500568 219 140 2356 279072 17 100 5786 6726 4588<br />
1984 571 359 273050 2586 295 723 15060 5828 6133 3099<br />
1985 521 281 210780 3 128 307 373 17608 7028 7506 3074<br />
1986 452 131 139930 2800 309401 16617 6834 6645 3138<br />
1987 579867 223 100 3200 353567 17577 5903 8325 3349<br />
1988 666 698 308470 2565 355663 18772 6170 9102 3500<br />
1989 529 354 168060 1800 359 494 21 049 6458 10896 3695<br />
1990 507 595 150589 2341 354665 21 903 6014 12448 3441<br />
Fibras químicas el<br />
Artificiales Sintéticas<br />
CUADRO 12.33<br />
(2" parte y última)<br />
celulósicas no celulósicas<br />
Año Rayón Total Acrílica Nylon Nylon Poliéster Poliéster Poli pro-<br />
fibra fibra fllarnento fibra filamento fibra pileno<br />
corta dI corta textil corta textil corta filamento<br />
1981 10552 231 569 62771 29 122 3901 78573 47571 9631<br />
y fibra<br />
corta<br />
1982 5294 226 375 62643 29211 2963 73296 49762 8500<br />
1983 261 972 70300 27925 4532 81000 69878 8337<br />
1984 280 663 74380 28 157 4672 93821 71 733 7900<br />
1985 289 765 82896 20445 3731 98401 75491 8801<br />
1986 292 784 96424 25615 5 171 84 122 73549 7903<br />
1987 335990 107 662 26606 4424 92570 95735 8993<br />
1988 336891 112246 20627 1 471 95278 100165 7 104<br />
1989 338445 107935 28470 794 92420 99104 9722<br />
1990 332762 97392 33058 1 148 90269 103 775 7 120<br />
al Producción <strong>de</strong> <strong>los</strong> cic<strong>los</strong> 85/86 • 90/91<br />
bl Equivalente a Lana limpia<br />
el Excluye las fibras para uso Industrial<br />
di Se suspendió la prodUCCión en Septiembre <strong>de</strong> 1982<br />
FUENTE: Para algod6n y lana: CANAINTEX, MemOria Estadistica ¡Vanos años)<br />
Para fibras químicas. ANtQ, AnuariO Estadistlco <strong>de</strong> la Industria Química MeXIcana, 1991<br />
292
CONSUMO NACIONAL APARENTE DE PRODUCTOS CUADFW 12
INEGI. <strong>Anuario</strong> <strong>Estadístico</strong> <strong>de</strong> <strong>los</strong> <strong>Estados</strong> <strong>Unidos</strong> <strong>Mexicanos</strong>. <strong>1992</strong><br />
VOLUMEN DE LA PRODUCCION DE AUTOMOVILES, AUTOBUSES CUADRO 12.35<br />
INTEGRALES, CAMIONES Y TRACTOCAMIONES<br />
(1' parte)<br />
1981-90<br />
(Unida<strong>de</strong>s)<br />
Año Total Automóviles Autobuses<br />
Total Populares Compactos De lUJo Deportivos integrales<br />
1981 697118 366497 191632 111 933 38 117 13916 1441<br />
1982 472 637 300679 196439 76746 18930 8464 1 323<br />
1983 286486 207 137 137 603 40620 19906 9009 366<br />
1984 343698 231 678 144 277 61348 18300 7663 121<br />
1986 398 192 246960 139819 74643 23390 9208 1 651<br />
1986 272 168 169 667 97683 64741 12765 4488 223<br />
1987 232515 142436 85895 42024 11 904 2613 209<br />
1988 338020 208781 109 343 78310 17 260 3868 603<br />
1989 446813 27 3 738 146261 103864 19919 3694 680<br />
1990 641 999 346651 214310 108606 18131 4604 1621<br />
CUADRO 12.35<br />
(2' parte y última)<br />
CamIones Tractoca-<br />
Año Total Comerciales ligeros Medianos Pesados Chasis miones<br />
coraza<br />
1981 231 963 149030 36701 46232 al 8217<br />
1982 167430 116261 29259 22910 al 3306<br />
1983 77 413 66348 11 890 9 176 al 679<br />
1984 109346 76095 17232 106 16914 al 663<br />
1986 146841 103 131 26716 686 14023 2385 3740<br />
1986 100099 75871 19660 194 3643 831 279<br />
1987 88478 69713 14680 518 2704 863 392<br />
1988 126438 97966 24219 668 2809 796 2198<br />
1989 167 897 122584 37441 1030 5265 1677 3498<br />
1990 191083 131468 48124 448 8964 2089 3844<br />
a/lncluye Chasis Coraza.<br />
FUENTE: AMIA, A.C. Boletín Mensual (Vanos años).<br />
294
VENTAS AL MAYOREO DE AUTOMOVILES, CAMIONES, AUTOBUSES CUADRO 12.36<br />
INTEGRALES, TRACTOCAMIONES y TRACTORES AGRICOLAS (1" parte)<br />
1981-90<br />
(Unida<strong>de</strong>s)<br />
Total Automóviles CamIOnes<br />
Año Total Popu- Com- De lUlO Depor- Impar- Total Comer-<br />
lares pactos tivos tados clales<br />
1981 589082 340 363 179 852 109506 37410 13595 220886 139 233<br />
1982 480056 286 761 179 928 78669 20088 8076 174861 120100<br />
1983 280696 192052 124741 38590 19740 8981 80037 57513<br />
1984 341421 217650 132 974 57480 18731 8465 110195 78353<br />
1985 404 424 242 187 135489 74028 23549 9 121 144 038 101 396<br />
1986 266 849 160 670 93446 51 197 11 567 4460 95647 72046<br />
1987 254 287 154152 92939 45237 13230 2746 92089 67802<br />
1988 351 329 210 066 110053 78916 17209 3888 129102 100575<br />
1989 455886 274505 146591 104 322 19936 3656 167409 122 648<br />
1990 559 164 352 608 213590 110213 19569 5431 3805 192050 131083<br />
1991 642981 392110 226 264 132488 24308 3859 5191 240211 147 216<br />
al<br />
CUADRO 12.36<br />
(2" parte y última)<br />
Camiones Auto- Tracto- Trac-<br />
A/io Ligeros Medla- Pesa- ChaSIS Impor- buses camiones tores<br />
nos dos coraza tados Inte- agrí-<br />
al grales colas<br />
1981 35 192 46461 bl 1 762 8002 18069<br />
1982 30 738 24023 bl 1430 3611 13393<br />
1983 13100 9424 bl 275 451 7881<br />
1984 17 609 14233 bl 1066 1 376 11 134<br />
1985 25605 546 13902 2589 1 824 3600 12775<br />
1986 18731 373 3582 915 1 220 1 298 8014<br />
1987 20050 549 2825 863 217 1 504 6325<br />
1988 24 167 669 2877 814 608 2 143 9410<br />
1989 37516 860 5390 995 680 3269 10023<br />
1990 47 610 573 9219 1 994 1 571 1 511 4146 8849<br />
1991 71 317 546 13631 3321 4180 2404 8256 NO<br />
al Importados a partir <strong>de</strong>l mes <strong>de</strong> noviembre.<br />
b/lncluye chaSIS Coraza<br />
FUENTE: AMIA, A.C. Bo!etín Mensual (Varios años).<br />
295 INEGI. <strong>Anuario</strong> <strong>Estadístico</strong> <strong>de</strong> <strong>los</strong> <strong>Estados</strong> <strong>Unidos</strong> <strong>Mexicanos</strong>. <strong>1992</strong>
VENTAS, NUMERO DE USUARIOS, CONSUMO PROMEDIO POR<br />
USUARIO Y NUMERO DE POBLACIONES CON SERVICIO<br />
DIE ENERGIA ELECTRICA al<br />
1981-90<br />
Ventas Miles <strong>de</strong> usuarios Consumo promedio<br />
Af,o IGwhl por usuario<br />
IMwhl<br />
HI81 67466 10391 6.63<br />
lB82 61457 11067 6.66<br />
lH83 62217 11667 6.34<br />
lB84 66233 12230 6.42<br />
lB85 70614 12852 6.49<br />
lB86 72828 13475 6.40<br />
lB87 77 449 14102 6.49<br />
lB88 81886 14773 6.64<br />
1 'l89 88637 16470 6.72<br />
1990 92 123 16286 6.66<br />
CUADRO 12.39<br />
Número <strong>de</strong> poblaciones<br />
con serVICIO eléctrico<br />
22682<br />
23828<br />
24921<br />
26 180 bl<br />
30650 bl<br />
33239 el<br />
36227<br />
36671<br />
37946<br />
39608<br />
al Excluye ventas y usuarios en proceso <strong>de</strong> facturación, Intercambios Institucionales, entregan a eL y Fe. las ventas<br />
en bloque y ventas <strong>de</strong> exportación.<br />
b/ Con base en el archivo <strong>de</strong> facturación <strong>de</strong> la eFE.<br />
el Con base en el X Censo General <strong>de</strong> Población y VIvienda 1980.<br />
FUENTE: eFE, Resultados <strong>de</strong> Explotación (Varios añosl.<br />
297 INEGI. <strong>Anuario</strong> <strong>Estadístico</strong> <strong>de</strong> <strong>los</strong> <strong>Estados</strong> <strong>Unidos</strong> <strong>Mexicanos</strong>. <strong>1992</strong>
<strong>1992</strong><br />
<strong>Mexicanos</strong>. <strong>Unidos</strong> <strong>Estados</strong> <strong>los</strong> <strong>de</strong><br />
CAPITULO 13<br />
<strong>Estadístico</strong><br />
COMUNICACIONES<br />
<strong>Anuario</strong><br />
(------------------ INEGI.
SERVICIO INTERNACIONAL DE CORRESPONDENCIA CUADRO 13.3<br />
1985-91 (1' parte)<br />
(Miles <strong>de</strong> piezas)<br />
Ordinaria expedida Reglstrélda expedida<br />
Año Total Cartas y Impre- Enca- Con Total Cartas y Impre- Pe· Con<br />
tarjetas sos miendas fran- tarjetas sos queños fran-<br />
pos- qUICI8 pa- qUICI8<br />
tales quetes<br />
1985 133713 114004 19257 95 357 4174 1 777 2362 28<br />
1986 141 291 120462 20347 102 380 4407 1825 2543 30 9<br />
1987 116227 104668 11 174 124 261 3551 2815 714 18 4<br />
1988 r 126300 113739 12143 134 284 4716 3906 785 20 5<br />
1989 133560 120 276 12841 143 300 4487 3556 902 23 6<br />
1990 137 856 133 667 4023 101 65 4865 4447 139 72 207<br />
1991 147644 146060 1 282 206 96 3665 3210 162 56 237<br />
CUADRO 13.3<br />
(2' parte y última)<br />
Ordinaria recibida Registrada recibida<br />
Año Total Cartas y Impre- Enca- Pe· Con Total Cartas y Impre- Pe· Con<br />
tarJetas m.endas queños fran- tarjetas queños fran-<br />
postales pa· qUlela pa- qUICI8<br />
quetes quetes<br />
1985 150015 122 970 24926 1536 18 565 3676 3512 145 16 3<br />
1986 169 779 139175 28208 1 738 19 639 4166 3969 173 19 5<br />
1987 185745 154895 30159 605 23 63 4392 4215 161 12 4<br />
1988 r 196419 163 796 31 892 640 25 66 4009 3847 147 11 4<br />
1989 186191 155 267 30232 606 23 63 6254 6003 228 17 6<br />
1990 193199 176320 14998 934 29 918 6441 6263 129 22 27<br />
1991 194 532 179 247 12475 390 781 1 639 6 630 6092 297 211 30<br />
FUENTE: Instituto Nacional <strong>de</strong> Estadística. Geografía e Informñtica, con bnse en cifras <strong>de</strong>l Sen,icio Postal Mexicano.<br />
Dirección Comercial y <strong>de</strong> Servicios.<br />
303 INEGI. <strong>Anuario</strong> <strong>Estadístico</strong> <strong>de</strong> <strong>los</strong> <strong>Estados</strong> <strong>Unidos</strong> <strong>Mexicanos</strong>. <strong>1992</strong>
VALOR DEL SERVICIO TELEGRAFICO NACIONAL E INTERNACIONAL CUADRO 13.6<br />
EFECTUADO A TRAVES DE LA RED NACIONAL DE TELEGRAFOS<br />
1980-91<br />
(Miles <strong>de</strong> nuevos pesos)<br />
Servicio Nacional SerVicio Internacional<br />
Año Telegramas Giros Telegramas Telegram.as Giros pagados<br />
pagados libres <strong>de</strong> pago pagado:ls<br />
(Servicio interno) (ordinarios)<br />
1980 233 26468 100 :19 4160<br />
1981 264 36140 112 41 8086<br />
1982 291 68489 119 ¡;7 8704<br />
1983 1010 101660 639 107 14909<br />
1984 1 868 160760 1426 Hi3 27468<br />
1986 2448 267 139 1 886 329 42619<br />
1986 3216 492 749 2912 623 92940<br />
1987 6703 1 123876 6984 14B4 246 616<br />
1988 10782 2 329 302 10836 31B8 396373<br />
1989 19196 2879474 17806 3749 744 426<br />
1990 24462 3211604 26697 3642 1 263 740<br />
1991 32736 3656867 47060 3240 1 499991<br />
FUENTE: Instituto Nocional <strong>de</strong> Estadística. Geografía e Informática. con base en cifras <strong>de</strong> Telecomunicaciones <strong>de</strong><br />
México, Dirección <strong>de</strong> Servicios Telegráficos.<br />
MENSAJES RADIOTELEGRAFICOS CURSADOS POR CIRCUITOS CUADRO 13.7<br />
RADlOELECTRICOS<br />
1980-91<br />
Año Servicio radiomaritimo Transmitidos Recibidos<br />
Cantidad Palabras Cantidad Palabras Cantidad Palabras<br />
1980 32716 986646 3247 71 661 29468 908086<br />
1981 34913 1 094 no 3746 163902 31 168 930868<br />
1982 31 184 1193399 3092 127 313 28092 1 066086<br />
1983 28483 1 092 388 3177 168671 26306 933717<br />
1984 27066 1 056685 3136 156921 23921 899 764<br />
1986 24064 960299 2890 144629 21 174 816670<br />
1986 21979 896724 2863 167646 19116 729 179<br />
1987 17118 689289 2194 113093 14924 676 196<br />
1988 16118 668 168 2047 103294 14071 664 874<br />
1989 16 175 927 146 1367 63612 14818 863633<br />
1990 13333 678 282 1 221 66976 12112 622 306<br />
1991 6477 161 320 637 23434 4940 127886<br />
FUENTE: Instituto Nacional <strong>de</strong> Estadistica, Geografía e Informática. con base en cifra. <strong>de</strong> Telecomunicaciones <strong>de</strong><br />
México. Subdirección <strong>de</strong> Phmeación.<br />
305 INEGI. <strong>Anuario</strong> <strong>Estadístico</strong> <strong>de</strong> <strong>los</strong> <strong>Estados</strong> <strong>Unidos</strong> <strong>Mexicanos</strong>. <strong>1992</strong>
INEGI. <strong>Anuario</strong> <strong>Estadístico</strong> <strong>de</strong> <strong>los</strong> <strong>Estados</strong> <strong>Unidos</strong> <strong>Mexicanos</strong>. <strong>1992</strong><br />
SISTEMAS ESPECIALES DE TElECOMUNICACION CUADRO 13.8<br />
1980-91<br />
Año Televisión por cable Localización <strong>de</strong> personas Música continua<br />
Concesionarios Suscriptores Concesionarios Suscriptores Concesionarios Suscriptores<br />
1980 66 236000 29 23000 11 636<br />
1981 66 225052 29 25692 14 671<br />
1982 66 292033 29 29947 lB BBl<br />
1983 76 296119 34 31 597 lB 292<br />
1984 76 296119 34 31 697 18 292<br />
1985 78 297 338 34 26707 18 924<br />
1986 79 341615 36 26274 20 935<br />
1987 87 407945 38 32944 20 969<br />
1988 83 408035 40 35617 24 2573<br />
1989 89 506360 40 41 207 21 2491<br />
1990 84 601 839 41 67526 21 2486<br />
1991 133 133049 41 57526 23 3798<br />
FUENTE: Instituto Nacional <strong>de</strong> Estadística. Geografía e Informática, con base en cifras <strong>de</strong> la Secretaría <strong>de</strong><br />
Comunicaciones y Transpones, Dirección General <strong>de</strong> Políticas y Normas <strong>de</strong> Comunicaciones.<br />
LOCALIDADES CON SERVICIO TELEFONICO CUADRO 13.9<br />
Y DEMANDA DE SERVICIO<br />
1980-91<br />
Localida<strong>de</strong>s Demanda <strong>de</strong> servicio<br />
Año con servicio Solicitu<strong>de</strong>s pendientes Solicitu<strong>de</strong>s atendidas<br />
telefónico Urbana Rural Urbana Rural<br />
1980 3519 372177 36718 342001 5948<br />
1981 3694 617994 31762 431 929 4827<br />
1982 3907 583662 26074 424869 6066<br />
1983 4148 800496 29097 482809 4539<br />
1984 4348 890962 26360 506766 3890<br />
1986 4621 1288617 29103 600046 3258<br />
1986 4781 741 997 14803 204997 2066<br />
1987 4910 742271 27701 427 630 4369<br />
1988 5473 822517 40644 350046 14795<br />
1989r 6613 1 008282 49929 392721 18225<br />
1990 6980 1 023604 146803 410611 44304<br />
1991 7738 938799 97572 668620 46313<br />
NOTA: La Información correspon<strong>de</strong> 8 las empresas <strong>de</strong> concesión fe<strong>de</strong>ral: Teléfonos <strong>de</strong> México. S. A. y Teléfonos <strong>de</strong>l<br />
Noroeste, S.A. <strong>de</strong> C.V. (Telefónica Nacional, S.A. se fusionó a Telmex en 1988J ubicadas en el Distrito<br />
Fe<strong>de</strong>ral y Baja California, respectivamente.<br />
FUENTE: Instituto Nacional <strong>de</strong> Estadística. Geograña e Informática. con base en cifras <strong>de</strong> la Secretaría <strong>de</strong><br />
Comunicaciones y Transportes. Dirección General <strong>de</strong> Políticas y Normas <strong>de</strong> Comunicaciones.<br />
306
INEGI. <strong>Anuario</strong> <strong>Estadístico</strong> <strong>de</strong> <strong>los</strong> <strong>Estados</strong> <strong>Unidos</strong> <strong>Mexicanos</strong>. <strong>1992</strong><br />
SERVICIO DE TELEX<br />
1980-91<br />
Año<br />
1980<br />
1981<br />
1982<br />
1983<br />
1984<br />
1985<br />
1986<br />
1987<br />
1988<br />
1989 E<br />
1990 E<br />
1991 E<br />
Nú- Con- Líneas <strong>de</strong> conexión<br />
mero centra- Insta- Ocupa<strong>de</strong>centrales<br />
dores ladas das al<br />
64<br />
64<br />
64<br />
66<br />
65<br />
61<br />
53<br />
62<br />
61<br />
49<br />
44<br />
34<br />
NO 11 477 9909<br />
NO 16886 10638<br />
60 22012 12347<br />
61 23066 13863<br />
61 22669 16436<br />
67 23319 16114<br />
30 23916 16961<br />
30 24 626 17 606<br />
30 24621 17 666<br />
33 24671 17 064<br />
37 24 718 13 682<br />
38 24 186 11 118<br />
64<br />
64<br />
64<br />
66<br />
66<br />
61<br />
36<br />
36<br />
37<br />
34<br />
39<br />
4<br />
NO<br />
NO<br />
NO<br />
NO<br />
NO<br />
NO<br />
18<br />
19<br />
20<br />
22<br />
33<br />
38<br />
NO<br />
NO<br />
NO<br />
NO<br />
NO<br />
NO<br />
2<br />
2<br />
2<br />
2<br />
2<br />
2<br />
NO<br />
NO<br />
NO<br />
NO<br />
NO<br />
NO<br />
8<br />
6<br />
7<br />
6<br />
3<br />
CUADRO 13.15<br />
Número <strong>de</strong> localida<strong>de</strong>s con servicio <strong>de</strong> abonados remotos<br />
Con Caneen- Con Con Con Abonados<br />
central tractor central y central central remotos<br />
electró- concen- semi- electronico<br />
tradar electró- mecánica<br />
electró- nica y y concennlco<br />
concen- trador<br />
trador electróelectróniconico<br />
a/ El <strong>de</strong>cremento que se observa en número <strong>de</strong> abonados (líneas ocupadas). se <strong>de</strong>be a que <strong>los</strong> usuarios han venido<br />
sustituyendo este servicio por el uso <strong>de</strong> aparatos <strong>de</strong> comunicación Fax, mismos que se instalan simplemente 8 <strong>los</strong><br />
aparatos telefónicos.<br />
FUENTE: Instituto Nacional <strong>de</strong> Estadistica, Geoorafia e Informática con base en cifras <strong>de</strong> Telecomunicaciones <strong>de</strong><br />
México. Subdirección <strong>de</strong> Planeación. A partir <strong>de</strong> 1991. Teléfonos <strong>de</strong> México. S.A. <strong>de</strong> C.V.<br />
NUMERO DE ABONADOS EN EL SERVICIO DE TElEX POR<br />
ACTIVIDAD ECONOMICA al<br />
1980-91<br />
CUADRO 13.16<br />
Total Industria Comer- Institu- $ecre- Trans- Institu- Turismo Agencias Agencias Otros<br />
cio ciones tarías portes ciones Informa- Adua- serVICIOS<br />
Año <strong>de</strong> <strong>de</strong>scen- tivas nales<br />
crédito<br />
trahladas<br />
1980<br />
1981<br />
1982<br />
1983<br />
1984<br />
1986<br />
1986<br />
1987<br />
1988<br />
1989 E<br />
1990 E<br />
1991 E<br />
9909<br />
10638<br />
12347<br />
13863<br />
16436<br />
16114<br />
16961<br />
17606<br />
17666<br />
17064<br />
13682<br />
11 118<br />
2361<br />
2666<br />
3028<br />
3387<br />
3780<br />
3938<br />
4146<br />
4278<br />
4290<br />
4167<br />
3339<br />
3112<br />
2014<br />
2144<br />
2683<br />
2903<br />
3269<br />
3336<br />
3610<br />
3623<br />
3634<br />
3630<br />
2832<br />
2639<br />
1067<br />
1 168<br />
1447<br />
1677<br />
1769<br />
1810<br />
1906<br />
1966<br />
1972<br />
1916<br />
1532<br />
780<br />
897<br />
861<br />
836<br />
934<br />
1051<br />
1 208<br />
1272<br />
1313<br />
1317<br />
1279<br />
1026<br />
346<br />
668<br />
821<br />
1111<br />
1261<br />
1408<br />
1 320<br />
1389<br />
1433<br />
1437<br />
1396<br />
1 122<br />
1046<br />
446<br />
491<br />
682<br />
641<br />
730<br />
748<br />
787<br />
812<br />
814<br />
791<br />
629<br />
211<br />
421<br />
462<br />
663<br />
634<br />
706<br />
712<br />
760<br />
774<br />
776<br />
764<br />
602<br />
661<br />
331<br />
334<br />
409<br />
448<br />
603<br />
624<br />
662<br />
670<br />
672<br />
666<br />
462<br />
421<br />
NO<br />
NO<br />
NO<br />
NO<br />
NO<br />
NO<br />
2<br />
2<br />
1<br />
2<br />
2<br />
2<br />
246<br />
249<br />
277<br />
301<br />
338<br />
369<br />
388<br />
400<br />
401<br />
389<br />
316<br />
294<br />
47<br />
72<br />
79<br />
71<br />
93<br />
99<br />
100<br />
100<br />
110<br />
116<br />
127<br />
123<br />
1669<br />
1462<br />
1621<br />
1 767<br />
1883<br />
2160<br />
2263<br />
2336<br />
2343<br />
2276<br />
1833<br />
1710<br />
al El <strong>de</strong>cremento que se observa en número <strong>de</strong> abonados (líneas ocupadas), se <strong>de</strong>be 8 que <strong>los</strong> usuarios han venido<br />
sustituyendo este servicio por el uso <strong>de</strong> aparatos <strong>de</strong> comunicación Fax. mismos que se instalan simplemente a <strong>los</strong><br />
aparatos telefónicos.<br />
FUENTE: Instituto Nacional <strong>de</strong> Estadística. Geografía e Informática; con base en cifras <strong>de</strong> Telecomunicaciones <strong>de</strong><br />
México. Subdirección <strong>de</strong> "aneación.<br />
310
CAPITULO 14<br />
TRANSPORTES<br />
INEGI. <strong>Anuario</strong> <strong>Estadístico</strong> <strong>de</strong> <strong>los</strong> <strong>Estados</strong> <strong>Unidos</strong> <strong>Mexicanos</strong>. <strong>1992</strong>
INEGI. <strong>Anuario</strong> <strong>Estadístico</strong> <strong>de</strong> <strong>los</strong> <strong>Estados</strong> <strong>Unidos</strong> <strong>Mexicanos</strong>. <strong>1992</strong><br />
CARRETERAS POR CLASE, LONGITUD Y CAPA DE RODAMIENTO<br />
1980-91<br />
(Kilómetros)<br />
e arreter as principales al<br />
Año Longitud Capa <strong>de</strong> rodamiento<br />
Terracería Revestidas<br />
1980 43453 767 2063<br />
1981 44230 861 1971<br />
1982 44593 966 1861<br />
1983 45110 966 1872<br />
1984 45565 1096 2151<br />
1985 45282 360 2499<br />
1986 45661 246 2796<br />
1987 46143 147 2638<br />
1988 46777 326 1796<br />
1989 46939 326 1795<br />
1990 47604 326 1 796<br />
1991 48485 137 1 796<br />
Carreteras secundarias el<br />
Año Longitud Capa <strong>de</strong> rodamiento<br />
Terracería Revestidas<br />
1980 49302 7831 17176<br />
1981 60884 7737 17664<br />
1982 61772 7608 16846<br />
1983 61990 7638 16918<br />
1984 66420 6874 21 127<br />
1986 66295 2376 23487<br />
1986 68429 2836 23600<br />
1987 59622 2901 23284<br />
1988 60020 2694 23134<br />
1989 60488 2694 23166<br />
1990 61 108 2631 22443<br />
1991 61 108 2468 21767<br />
Caminos vecinales, locales o rurales<br />
Año Longitud Capa <strong>de</strong> rodamiento<br />
Terracería fl Revestidas<br />
1980 119871 49566 68323<br />
1981 118267 46787 70016<br />
1982 117337 42612 73796<br />
1983 117370 42523 73814<br />
1984 120018 38646 80678<br />
1986 122648 32178 89398<br />
1986 126901 33788 90878<br />
1987 127 574 33937 91249<br />
1988 128243 33981 91854<br />
1989 129633 33981 93244<br />
1990 130623 33981 94234<br />
1991 131369 32816 96058<br />
CUADRO 14.1<br />
(1" parte)<br />
Pavimentadas bl<br />
40633<br />
41408<br />
41787<br />
42273<br />
42318<br />
42423<br />
42620<br />
43468<br />
44666<br />
44816<br />
46383<br />
46653<br />
CUADRO 14.1<br />
(2" parte)<br />
Pavimentadas dI<br />
24296<br />
26683<br />
27418<br />
27634<br />
28419<br />
30432<br />
32093<br />
33437<br />
34292<br />
34738<br />
36134<br />
36883<br />
CUADRO 14.1<br />
(3" parte y última)<br />
Pavimentados<br />
<strong>1992</strong><br />
1464<br />
1029<br />
1033<br />
894<br />
1072<br />
2235<br />
2388<br />
2408<br />
2408<br />
2408<br />
2496<br />
al Compren<strong>de</strong> caminos fe<strong>de</strong>rales en proceso, fe<strong>de</strong>rales en servicio y directos o <strong>de</strong> cuota <strong>de</strong>nominados carreteras<br />
troncales.<br />
bl Compren<strong>de</strong> dos, cuatro o más carriles.<br />
el Considérese como las carreteras estatales o alimentadoras.<br />
dI Carreteras con dos carriles solamente.<br />
f/lncluye caminos <strong>de</strong> brecha mejorados.<br />
FUENTE: Instituto Nacional <strong>de</strong> Estadística, Geografía e Informática. con base en cifras <strong>de</strong> la Secretaría <strong>de</strong> ComuniC8*<br />
ciones V Transportes, Dirección General <strong>de</strong> Planeación.<br />
Véase mapa 9<br />
316
INEGI. <strong>Anuario</strong> <strong>Estadístico</strong> <strong>de</strong> <strong>los</strong> <strong>Estados</strong> <strong>Unidos</strong> <strong>Mexicanos</strong>. <strong>1992</strong><br />
VEHICULOS REGISTRADOS POR TIPO Y USO al<br />
1980-91<br />
CUADRO 14.2<br />
(1" parte)<br />
Año Autom6viles Motocicletas<br />
Oficiales De alquiler Particulares Oficiales De alquiler Particulares<br />
1980 16164 117112 4124279 660 801 340693<br />
1981 19282 136847 4691 379 762 880 380664<br />
1982 11812 136329 4624611 716 1 166 289777<br />
1983 14997 147896 4663343 714 664 249216<br />
1984 18732 162907 4802130 774 663 246806<br />
1986 21906 167870 6102434 817 623 248941<br />
1986 23628 178686 6000708 831 621 231 240<br />
1987 23786 194746 6117 696 819 693 219647<br />
1988 23613 214349 6669122 791 677 216 839<br />
1989 27399 249267 6942448 860 633 222673<br />
1990 r 32132 283609 6623696 1 172 724 247826<br />
1991 34637 291 428 6726976 1223 766 260377<br />
Año Camiones para pasajeros Camiones para carga<br />
CUADRO 14.2<br />
(2" parte y última)<br />
Oficiales De alquiler Particulares Oficiales De alquiler Particulares<br />
1980 1079 66641 19099 6414 60613 1 439633<br />
1981 1036 69812 18193 6287 64077 1 660074<br />
1982 1 166 60168 26230 4746 69303 1 737 878<br />
1983 1261 69011 10362 8369 66847 1 819000<br />
1984 1606 61627 10693 8922 70201 1 933096<br />
1986 1661 67096 10290 9397 72287 2033476<br />
1986 1788 71360 10226 10068 81903 2121064<br />
1987 1820 72266 10289 10288 83960 2197830<br />
1988 1867 73967 10732 10680 86928 2338444<br />
1989 2386 77786 11293 14681 99132 2690202<br />
1990 r 2864 79199 12622 16397 114706 2860979<br />
1991 3117 82684 12308 18026 119084 3110463<br />
al Registrados al 31 <strong>de</strong> diciembre <strong>de</strong> cada año.<br />
FUENTE: Instituto Nacional <strong>de</strong> estadística. Geografía e Informática. con base en cifras <strong>de</strong>l Departamento <strong>de</strong>l Distrito<br />
Fe<strong>de</strong>ral. Coordinación General <strong>de</strong> Transporto. Direccione. <strong>de</strong> PoIlcla y Tránolto &tatole. y Preol<strong>de</strong>nciaa<br />
Municipales.<br />
318
INEGI. <strong>Anuario</strong> <strong>Estadístico</strong> <strong>de</strong> <strong>los</strong> <strong>Estados</strong> <strong>Unidos</strong> <strong>Mexicanos</strong>. <strong>1992</strong><br />
PASAJEROS TRANSPORTADOS POR El SERVICIO PUBLICO FEDERAL CUADRO 14.5<br />
DE AUTOTRANSPORTE DE PASAJEROS POR TIPO DE VEHICULO<br />
1980-91<br />
(Millones)<br />
Año Omnibus Automóvil Camioneta<br />
1980 1 132 4 15<br />
1981 1 221 4 16<br />
1982 1313 4 15<br />
1983 1366 4 15<br />
1984 1424 4 16<br />
1985 1 517 4 16<br />
1986 1590 4 17<br />
1987 1660 5 18<br />
1988 1 736 5 20<br />
1989 1826 6 21<br />
1990 r 1932 9 26<br />
1991 P 2036 9 28<br />
FUENTE: Instituto Nacional <strong>de</strong> Estadística. Geografía e Informática. con base en cifras <strong>de</strong> la Secretaría <strong>de</strong><br />
Comunicaciones y Transpones, Dirección General <strong>de</strong> Transporte Terrestre.<br />
Microbús<br />
UNIDADES DEL SERVICIO PUBLICO FEDERAL DE AUTOTRANSPORTE CUADRO 14.6<br />
DE PASAJEROS POR CLASE DE SERVICIO<br />
1980-91<br />
Primera Segunda Mixto Transporte Exclusivo Guía <strong>de</strong> Especializado<br />
Año <strong>de</strong> pasajeros<br />
<strong>de</strong> puertos y<br />
aeropuertos<br />
<strong>de</strong> turismo turistas<br />
1980 4906 14204 1480 1230 1 100 1 970 20<br />
1981 6200 15080 570 1 260 120 2030 20<br />
1982 5660 16000 1 770 1260 1360 2200 21<br />
1983 6876 16224 1818 1 287 393 2196 21<br />
1984 6885 16252 1821 1289 396 2200 21<br />
1985 6 152 16927 1 887 1339 1396 2278 21<br />
1986 6286 17263 1920 1892 1406 2313 21<br />
1987 6412 17426 2037 2177 1474 2653 21<br />
1988 6690 18177 2124 2266 1539 2727 22<br />
1989 7023 19081 2230 2379 1 616 2860 22<br />
1990 r 7 176 19379 2319 2937 1706 3077 NO<br />
1991 P 8986 19860 2494 3060 1 807 3198 NO<br />
FUENTE: Instituto Nacional <strong>de</strong> Estadística. Geografíft e Informática. con base en cifras <strong>de</strong> la Secretaría <strong>de</strong><br />
Comunicaciones y Transportes. Dirección General <strong>de</strong> Transporte Terrestre.<br />
320<br />
NO<br />
NO<br />
NO<br />
NO<br />
NO<br />
NO<br />
NO<br />
NO<br />
NO<br />
NO<br />
NO<br />
NO
PASAJEROS TRANSPORTADOS POR EL SERVICIO PUBLICO FEDERAL<br />
DE AUTOTRANSPORTE DE PASAJEROS POR CLASE DE SERVICIO<br />
1980-91<br />
(Millones)<br />
Año<br />
1980<br />
1981<br />
1982<br />
1983<br />
1984<br />
1985<br />
1986<br />
1987<br />
1988<br />
1989<br />
1990 r<br />
1991 P<br />
Primera Segunda<br />
':?36<br />
258<br />
280<br />
291<br />
305<br />
328<br />
330<br />
332<br />
347<br />
367<br />
380<br />
460<br />
756<br />
814<br />
860<br />
894<br />
931<br />
995<br />
1061<br />
1 121<br />
169<br />
1 228<br />
1 309<br />
319<br />
Mixto Transporte<br />
87<br />
94<br />
106<br />
112<br />
116<br />
119<br />
122<br />
128<br />
137<br />
142<br />
149<br />
158<br />
<strong>de</strong> pasajerOS<br />
<strong>de</strong> puertos y<br />
aeropuertos<br />
16<br />
15<br />
15<br />
15<br />
16<br />
16<br />
17<br />
19<br />
20<br />
21<br />
26<br />
27<br />
ExcluSIVO<br />
<strong>de</strong> tunsmo<br />
FUENTE: Instituto Nacional <strong>de</strong> Estadística. Geogntfía e Informótica, COn base en cifras <strong>de</strong> 18 S,ecretaría <strong>de</strong><br />
Comunicaciones V Transportes. Dirección Generol <strong>de</strong> Trtlllsporte Terrestre.<br />
UNIDADES DEL SERVICIO PUBLICO FEDERAL<br />
DE AUTOTRANSPORTE DE CARGA<br />
1980-91<br />
Año<br />
1980<br />
1981<br />
1982<br />
1983<br />
1984<br />
1985<br />
1986<br />
1987<br />
1988<br />
1989<br />
1990 r<br />
1991 P<br />
Total<br />
Camión<br />
<strong>de</strong> 2 ejes<br />
141930 60910<br />
153 850 62560<br />
157525 63216<br />
159341 63226<br />
15934163226<br />
156273 60693<br />
150 500 58 650<br />
152 337 1,8 727<br />
153403 69137<br />
164010 62748<br />
222 983 89 493<br />
276925 100375<br />
Camión<br />
<strong>de</strong> 3 ejes<br />
23 110<br />
24768<br />
25441<br />
26188<br />
26188<br />
25924<br />
25110<br />
25219<br />
25396<br />
27428<br />
39135<br />
43842<br />
Tractocamión<br />
<strong>de</strong> 2 ejes<br />
4190<br />
4231<br />
4235<br />
4239<br />
4239<br />
3775<br />
3450<br />
3369<br />
2798<br />
3597<br />
5130<br />
6744<br />
Tractocamión<br />
<strong>de</strong> 3 ejes<br />
¿'2600<br />
25531<br />
26417<br />
27049<br />
27049<br />
27564<br />
26790<br />
27777<br />
28566<br />
31 124<br />
44372<br />
58099<br />
Semlrremolque<br />
<strong>de</strong> 1 eje<br />
780<br />
789<br />
796<br />
810<br />
810<br />
702<br />
604<br />
619<br />
623<br />
649<br />
692<br />
1018<br />
53<br />
55<br />
67<br />
69<br />
72<br />
75<br />
77<br />
79<br />
83<br />
88<br />
94<br />
97<br />
Semlrre<br />
molque<br />
<strong>de</strong> 2 eles<br />
29980<br />
33204<br />
33976<br />
34341<br />
34341<br />
34124<br />
27565<br />
27832<br />
28027<br />
29227<br />
30484<br />
46148<br />
CUADRO 14.7<br />
GUia <strong>de</strong> Especlallzado<br />
tUristas<br />
4<br />
4<br />
4<br />
4<br />
4<br />
4<br />
4<br />
4<br />
5<br />
5<br />
9<br />
9<br />
NO<br />
NO<br />
NO<br />
NO<br />
NO<br />
NO<br />
NO<br />
NO<br />
NO<br />
NO<br />
NO<br />
NO<br />
CUADRO 14.8<br />
Semlrre Remolque<br />
molque<br />
<strong>de</strong> 3 ejes<br />
<strong>de</strong> 2 ejes<br />
2400<br />
3069<br />
3102<br />
3102<br />
3102<br />
8073<br />
8510<br />
8570<br />
8943<br />
13375<br />
20224<br />
FUENTE: Instituto Nacional <strong>de</strong> EstadísticH. Geografía e Informática, con base en cifras <strong>de</strong> la Secretaria <strong>de</strong><br />
Comunicaciones y Transportes, Dirección General <strong>de</strong> Transporte Terrestre.<br />
360<br />
367<br />
375<br />
386<br />
386<br />
389<br />
258<br />
284<br />
286<br />
294<br />
302<br />
475<br />
321<br />
INEGI. <strong>Anuario</strong> <strong>Estadístico</strong> <strong>de</strong> <strong>los</strong> <strong>Estados</strong> <strong>Unidos</strong> <strong>Mexicanos</strong>. <strong>1992</strong>
INEGI. <strong>Anuario</strong> <strong>Estadístico</strong> <strong>de</strong> <strong>los</strong> <strong>Estados</strong> <strong>Unidos</strong> <strong>Mexicanos</strong>. <strong>1992</strong><br />
TONELADAS TRANSPORTADAS POR EL SERVICIO PUBLICO CUADRO 14.9<br />
FEDERAL DE AUTOTRANSPORTE DE CARGA<br />
1980-91<br />
(Miles <strong>de</strong> toneladas)<br />
Total Camión Camión Tracto- Tracto-<br />
Año <strong>de</strong> 2 eíes <strong>de</strong> 3 ejes camión camión<br />
<strong>de</strong> 2 ejes <strong>de</strong> 3 ejes<br />
1980 263 169 114611 62136 10044 76478<br />
1981 276 293 117613 66877 10142 92661<br />
1982 277 363 117688 66084 9828 93763<br />
1983 278081 117932 66107 9996 94046<br />
1984 282 183 118720 67064 10092 96317<br />
1986 293409 123 374 69608 9681 100946<br />
1986 290669 122 678 60829 8849 98303<br />
1987 296088 122 739 61093 8551 103705<br />
1988 298870 123696 61622 7102 106650<br />
1989 309803 126339 64466 9129 110879<br />
1990 r 314675 126006 66216 10835 111 618<br />
1991 P 327773 103687 67867 13919 142400<br />
NOTAS: En el cálculo <strong>de</strong> toneladas transportadas. se consi<strong>de</strong>ran las combinaciones <strong>de</strong> las unida<strong>de</strong>s motrices con las <strong>de</strong><br />
arrastre (semirremolques <strong>de</strong> 1,2 Y 3 ejes, remolques <strong>de</strong> 2 ejes>.<br />
FUENTE: Instituto Nacional <strong>de</strong> Estadística. Geografía e Informática. con base en cifras <strong>de</strong> In Secretaría <strong>de</strong><br />
Comunicaciones y Transportes. Dirección General <strong>de</strong> Transporte Terrestre.<br />
UNIDADES DEL SERVICIO PUBLICO FEDERAL DE CUADRO 14.10<br />
AUTOTRANSPORTE DE CARGA ESPECIALIZADA<br />
1980-91<br />
Total Camión Camión Tracto- Tracto- Semirre- Semirre- Semirre- Remolque<br />
Año <strong>de</strong> 2 ejes <strong>de</strong> 3 ejes camión camión molque molque molque <strong>de</strong> 2 ejes<br />
<strong>de</strong> 2 ejes <strong>de</strong> 3 ejes <strong>de</strong> 1 eje <strong>de</strong> 2 ejes <strong>de</strong> 3 ejes<br />
1980 74270 42600 10 780 1 375 8405 320 10600 190<br />
1981 79996 43915 11826 1392 9633 328 11576 132 194<br />
1982 82364 44492 12302 1396 10179 332 11945 1 517 201<br />
1983 83871 44497 12783 1398 10802 338 12303 1645 206<br />
1984 83871 44497 12783 1 398 10802 338 12303 1 545 205<br />
1985 81943 42670 12665 1301 10973 300 12284 1545 206<br />
1986 77 951 41 380 11685 1096 10182 358 9023 4059 168<br />
1987 78772 41416 11 734 1086 10591 370 9159 4238 180<br />
1988 79358 41 704 11816 901 10892 373 9223 4268 181<br />
1989 84589 44063 12690 1399 11890 389 9618 4454 186<br />
1990 r 117 017 62826 17956 1996 16940 422 10032 6666 191<br />
1991 P al 20669 674 620 818 6972 49 6690 5829 117<br />
NOTA: Se hace la <strong>de</strong>sagregación para carga especializada por consi<strong>de</strong>rarse importante, pero está incluida en el Servicio<br />
Público Fe<strong>de</strong>ral <strong>de</strong> Carga.<br />
al A partir <strong>de</strong> 1991 yen razón <strong>de</strong>l proceso <strong>de</strong> <strong>de</strong>sregulanzaclón, se conSI<strong>de</strong>ran únicamente siete especialida<strong>de</strong>s, las<br />
<strong>de</strong>más especialida<strong>de</strong>s pasaron 8 ser <strong>de</strong>finidas como parte <strong>de</strong> carga general.<br />
FUENTE: Instituto Nacional <strong>de</strong> Estadística. Geografía e Informática. con base en cifras <strong>de</strong> la Secretflría <strong>de</strong><br />
Comunicaciones y Transportes, Dirección General <strong>de</strong> Transporte Terrestre.<br />
322
INEGI. <strong>Anuario</strong> <strong>Estadístico</strong> <strong>de</strong> <strong>los</strong> <strong>Estados</strong> <strong>Unidos</strong> <strong>Mexicanos</strong>. <strong>1992</strong><br />
VIAS FERREAS y EQUIPO MOTOR DE LOS FERROCARRILES<br />
1980-91<br />
Longitud <strong>de</strong> las<br />
Año vías-kilómetro a/ Locomotoras<br />
diesel<br />
1980 25610.3 1668<br />
1981 25498.3 1750<br />
1982 26474.5 1809<br />
1983 25799.3 1 815<br />
1984 26840.1 1877<br />
1986 25907.8 1814<br />
1986 26240.8 1797<br />
1987 26287.1 1816<br />
1988 r 26398.8 1742<br />
1989 26390.6 1 737<br />
1990 26 360.5 1677<br />
1991 26334.1 1700<br />
Equipo motor<br />
CUADRO 14.13<br />
Fuerza tractiva<br />
(H.P.)<br />
3649650<br />
4121220<br />
4 367 460<br />
4341 100<br />
4547370<br />
4397560<br />
4396800<br />
4883080<br />
4341 320<br />
4324220<br />
4220960<br />
4311490<br />
al A<strong>de</strong>más <strong>de</strong> la vía principal se incluye la secundaria y la particular.<br />
FUENTE: Instituto Nacional <strong>de</strong> Estadística. Geografía e Informática. con base en cifras <strong>de</strong> Ferrocarriles Nacionales <strong>de</strong><br />
México. Subdirección General <strong>de</strong> Ptaneación y Sistemas. Departamento <strong>de</strong> Estadisticas.<br />
Véase mapa 10<br />
EQUIPO DE TRANSPORTE DE CARGA DE LOS FERROCARRILES CUADRO 14.14<br />
1980-91<br />
Furgones Góndolas, jaulas y tolvas Tanques Refrigeradores Otras<br />
Año Unida<strong>de</strong>s Capacidad Unida<strong>de</strong>s Capacidad Unida<strong>de</strong>s Capacidad Unida<strong>de</strong>s Capacidad unida<strong>de</strong>s<br />
(toneladas) (toneladasl (toneladas) (toneladas) al<br />
1980 34005 1 958688 14612 947634 1703 128 577 250 12760 2381<br />
1981 30690 1 748800 16909 1 038857 1 912 144356 379 19310 3193<br />
1982 27446 1618300 17086 2223700 1 729 117800 379 19300 3142<br />
1983 27970 1 812300 17 747 1319800 1 718 116800 378 19300 3164<br />
1984 28469 1 848000 17365 1 291 200 1669 112812 371 18902 3234<br />
1985 28103 1 707 100 17892 1 326800 1666 116900 427 19984 3359<br />
1986 27636 1 691 400 17853 1 344400 1699 104900 351 17883 3231<br />
1987 31 372 2130200 18468 1 243800 1980 97900 326 16609 4311<br />
1988 25859 1 765860 17761 196184 1 672 82671 339 17271 3337<br />
1989 24402 1 656896 17419 172995 1650 81576 339 17269 3376<br />
1990 23947 1672818 17344 170352 1638 74300 339 16960 3334<br />
1991 21 793 1 481 924 17002 156136 1606 96360 336 17 136 3266<br />
a/lncluye cabuses, plataformas y 949 remolques <strong>de</strong> carretera.<br />
FUENTE: Instituto Nacional <strong>de</strong> Estadística. Geografía e Informática. con base en cifras <strong>de</strong> Ferrocnrriles Nacionmes <strong>de</strong><br />
México. Subdirección GenernJ <strong>de</strong> Plnneación y Sistemas. Departamento <strong>de</strong> Estadistica.<br />
324
INEGI. <strong>Anuario</strong> <strong>Estadístico</strong> <strong>de</strong> <strong>los</strong> <strong>Estados</strong> <strong>Unidos</strong> <strong>Mexicanos</strong>. <strong>1992</strong><br />
RED PORTUARIA SEGUN LITORAL CUADRO 14.18<br />
1980-91<br />
Año y Ubicación geográfica Tráfico<br />
litoral Marítimo Fluvial Intenor Altura Cabotaje<br />
1980 144 34 36 26 110<br />
Litoral <strong>de</strong>l Pacífico 93 3 21 14 60<br />
litoral <strong>de</strong>l Golfo y Mar Caribe 51 31 7 11 50<br />
Entida<strong>de</strong>s sin litoral 7<br />
1981 144 34 36 26 110<br />
litoral <strong>de</strong>l Pacífico 93 3 21 14 60<br />
litoral <strong>de</strong>l Golfo y Mar Caribe 51 31 7 11 50<br />
Entida<strong>de</strong>s sin litoral 7<br />
1982 144 34 36 26 110<br />
Litoral <strong>de</strong>l Pacífico 93 4 20 14 60<br />
litoral <strong>de</strong>l Golfo y Mar Caribe 51 30 8 11 50<br />
Entida<strong>de</strong>s sin litoral 7<br />
1983 164 36 26 26 111<br />
Litoral <strong>de</strong>l Pacífico 105 5 12 14 61<br />
Litoral <strong>de</strong>l Golfo y Mar Caribe 59 31 7 11 50<br />
Entida<strong>de</strong>s sin litoral 7<br />
1984 163 36 26 26 110<br />
Litoral <strong>de</strong>l Pacífico 105 5 12 14 61<br />
Litoral <strong>de</strong>l Golfo y Mar Caribe 58 30 7 12 49<br />
Entida<strong>de</strong>s sin litoral 7<br />
1986 133 27 28 27 104<br />
Litoral <strong>de</strong>l Pacífico 81 2 13 16 61<br />
Litoral <strong>de</strong>l Golfo y Mar Caribe 62 25 8 12 63<br />
Entida<strong>de</strong>s sin litoral 7<br />
1986 137 29 28 23 68<br />
Litoral <strong>de</strong>l Pacífico 84 2 12 13 41<br />
Litoral <strong>de</strong>l Golfo y Mar Caribe 63 27 9 10 27<br />
Entida<strong>de</strong>s sin litoral 7<br />
1987 137 29 28 23 68<br />
Litoral <strong>de</strong>l Pacífico 84 2 12 13 41<br />
Litoral <strong>de</strong>l Golfo y Mar Caribe 53 27 9 10 27<br />
Entida<strong>de</strong>s sin litoral<br />
1988 138 29 29 27 80<br />
Litoral <strong>de</strong>l Pacífico 85 2 12 16 43<br />
Litoral <strong>de</strong>l Golfo y Mar Caribe 63 27 10 11 37<br />
Entida<strong>de</strong>s sin litoral 7<br />
1989 r 138 29 29 27 79<br />
Litoral <strong>de</strong>l Pacífico 85 2 12 16 42<br />
Litoral <strong>de</strong>l Golfo y Mar Caribe 63 27 10 11 37<br />
Entida<strong>de</strong>s sin ¡itoral 7<br />
1990 140 29 29 31 90<br />
Litoral <strong>de</strong>l Pacífico 86 2 12 18 51<br />
Litoral <strong>de</strong>t Golfo y Mar Caribe 64 27 10 13 39<br />
Entida<strong>de</strong>s sin titoral 7<br />
1991 140 30 29 32 90<br />
Litoral <strong>de</strong>l Pacífico 86 2 12 19 61<br />
Litoral <strong>de</strong>l Golfo y Mar Caribe 54 28 10 13 39<br />
Entida<strong>de</strong>s sin litoral 7<br />
NOTA: <strong>los</strong> <strong>de</strong>crementos que se observan en el universo <strong>de</strong> <strong>los</strong> puertos nacionales, se <strong>de</strong>ben al análisis y <strong>de</strong>puraci6n<br />
que continúa· realizando la fuente informante <strong>de</strong> aquellas zonas que se consi<strong>de</strong>ran como puertos, pero que<br />
carecen <strong>de</strong> una infraestructura apropiada para clasificar<strong>los</strong> como tales.<br />
FUENTE: Instituto Nacional <strong>de</strong> Estadística, Geografía e Informática con base en cifras <strong>de</strong> Puertos <strong>Mexicanos</strong>,<br />
Vocalía <strong>de</strong> Planeacíón, Gerencia <strong>de</strong> Desarrollo Portuario.<br />
Véase mapa 11<br />
328
CONSTRUCCION DE OBRAS PORTUARIAS DE A TRAQUE CUADRO 14.19<br />
SEGUN LITORAL a/<br />
1980-91<br />
IMetros lineales)<br />
Año y litofal Altura Cabotaje Pesca Turismo Pemex Armada<br />
1980 12776 7670 11246 6339 7016 1919<br />
Litoral <strong>de</strong>l Pacífico 5866 2454 4403 4292 1260 1 335<br />
Litoral <strong>de</strong>l Golfo y Mar Caribe 6909 5216 6842 2047 5756 584<br />
1981 14266 7611 13734 6339 7416 1919<br />
Litoral <strong>de</strong>l Pacífico 6916 2295 6926 4292 1660 1 335<br />
Litoral <strong>de</strong>l Golfo y Mar Caribe 7350 5216 7809 2047 5756 684<br />
1982 17760 10024 23730 11248 8396 1919<br />
Litoral <strong>de</strong>l Pacífico 8279 3006 9839 7419 2311 1335<br />
Litoral <strong>de</strong>l Golfo y M sr Caribe 9481 7018 13891 3829 6084 684<br />
1983 18846 10104 24302 11248 8396 1919<br />
Litoral <strong>de</strong>l Pacífico 9114 3086 10411 7419 2311 335<br />
Litoral <strong>de</strong>l Golfo y Mar Caribe 9731 7018 13891 3829 6084 584<br />
1984 18036 9168 29460 13377 10770 2003<br />
Litoral <strong>de</strong>l Pacífico 8124 4221 12290 7895 1680 1 328<br />
Litoral <strong>de</strong>l Golfo y Mar Caribe 9912 4947 17 170 5482 9090 675<br />
1986 19386 7840 28736 17797 11390 2241<br />
Litoral <strong>de</strong>l Pacífico 9691 3156 11 109 11314 2675 1673<br />
Litoral <strong>de</strong>l Golfo y Mar Caribe 9694 4684 17627 6483 8715 668<br />
1986 19483 8288 28336 17869 11390 3787<br />
Litoral <strong>de</strong>l Pacífico 9789 3143 11 109 11380 2675 1686<br />
Litoral <strong>de</strong>l Golfo y Mar Caribe 9694 5145 17 226 6489 8715 2101<br />
1987 16936 6841 29709 22348 14391 4192<br />
Litoral <strong>de</strong>l Pacifico 9269 3116 12475 13433 2958 1 897<br />
Litoral <strong>de</strong>l Golfo y Mar Caribe 7667 3725 17 234 8916 11433 2296<br />
1988 17699 6749 29209 22196 12979 3617<br />
Litoral <strong>de</strong>l Pacífico 9072 3215 13342 13433 2958 1897<br />
Litoral <strong>de</strong>l Golfo y Mar Caribe 8527 3534 15867 8763 10021 1 720<br />
1989 18120 6749 19209 22467 12979 3617<br />
Litoral <strong>de</strong>l Pacífico 9072 3215 13342 13643 2958 1897<br />
Litoral <strong>de</strong>l Golfo y Mar Caribe 9048 3634 16867 8914 10021 1 720<br />
1990 18890 6869 29209 22667 12979 3617<br />
Litoral <strong>de</strong>l Pacífico 9702 3215 13342 13653 2958 1897<br />
Litoral <strong>de</strong>l Golfo y Mar Caribe 9188 3654 15867 8914 10021 1720<br />
1991 19134 6866 27747 22016 13476 3666<br />
Litoral <strong>de</strong>l Pacifico 9796 3215 12623 13613 3650 1891<br />
Litoral <strong>de</strong>l Golfo y Mar Caribe 9338 3640 16124 8402 9825 1776<br />
a/ Las variaciones <strong>de</strong> las cifras en comparación con el informe <strong>de</strong>l año anterior, se <strong>de</strong>ben .El las modificaciones<br />
y clasificaciones <strong>de</strong> las obras portuarias, sustentadas en la <strong>de</strong>l Catastro Portuario.<br />
FUENTE: Instituto Nacional <strong>de</strong> Estadistica. Geografía e Informática, con base en cifras dE! Puertos <strong>Mexicanos</strong>.<br />
Vocalía <strong>de</strong> P'taneación, Gerencia <strong>de</strong> Desarrollo Portuerio.<br />
329 INEGI. <strong>Anuario</strong> <strong>Estadístico</strong> <strong>de</strong> <strong>los</strong> <strong>Estados</strong> <strong>Unidos</strong> <strong>Mexicanos</strong>. <strong>1992</strong>
INEGI. <strong>Anuario</strong> <strong>Estadístico</strong> <strong>de</strong> <strong>los</strong> <strong>Estados</strong> <strong>Unidos</strong> <strong>Mexicanos</strong>. <strong>1992</strong><br />
CONSTRUCCION DE OBRAS PORTUARIAS EXTERIORES SEGUN LITORAL a/ CUADRO 14.20<br />
1980-91<br />
Obras exteriores Areas <strong>de</strong> tierra y superficie<br />
Año y litoral (Metros lineales) (Metros cuadrados)<br />
Rompeolas Escolleras Espigones Patios Cobertizos Bo<strong>de</strong>ga.<br />
1980 11617 27416 10797 1 206663 64737 239944<br />
litoral <strong>de</strong>l Pacífico 8294 10684 6124 604064 41067 94062<br />
Litoral <strong>de</strong>l Golfo y Mar Caribe 3223 16831 4673 701 609 13680 145892<br />
1981 12720 27416 11061 2167963 64737 241 664<br />
Litoral <strong>de</strong>l Pacífico 9497 10584 6378 1 398354 41057 96672<br />
Litoral <strong>de</strong>l Golfo y Mar Catibe 3223 16831 4673 769 609 13680 146892<br />
1982 13686 29611 12361 2497316 68426 267462<br />
litoral <strong>de</strong>l Pacífico 10362 10819 7235 1 444 107 41067 104900<br />
litoral <strong>de</strong>l Golfo y Mar Caribe 3223 18692 5126 1 063209 17369 162552<br />
1983 14230 30231 12666 2662696 60134 267462<br />
Litoral <strong>de</strong>l Pacífico 10927 10819 7326 1471451 41057 104900<br />
litoral <strong>de</strong>l Golfo y Mar Caribe 3303 19412 5231 1 191 244 19077 162552<br />
1984 23260 24944 16060 2611886 68174 263762<br />
Litoral <strong>de</strong>l Pacífico 16481 6618 9859 1461 213 41 139 108849<br />
Litoral <strong>de</strong>l Golfo y Mar Caribe 6779 19326 6201 1 060673 17035 154903<br />
1986 24000 27268 16723 2624 141 60181 274780<br />
Litoral <strong>de</strong>l Pacífico 17603 6138 9049 1 498366 42865 119896<br />
litoral <strong>de</strong>l Golfo y Mar Caribe 6497 21 130 6674 1 025 776 17316 164886<br />
1986 24066 27653 16744 2624141 60373 281 180<br />
Litoral <strong>de</strong>l Pacífico 17559 6497 9070 1 498366 42865 119896<br />
Litoral <strong>de</strong>l Golfo y Mar Caribe 6497 21 166 6674 1 026776 17608 161285<br />
1987 24938 27686 18190 1993926 63019 162122<br />
Litoral <strong>de</strong>l Pacífico 15119 6303 8827 986861 43906 134167<br />
Litoral <strong>de</strong>l Golfo y Mar Caribe 9819 21383 9363 1 007064 19113 17 965<br />
1988 23323 28960 18323 1993926 61941 311200<br />
Litoral <strong>de</strong>l Pacífico 16119 6303 8827 986861 42828 136236<br />
Litoral <strong>de</strong>l Golfo y Mar Caribe 8204 22667 9496 1 007064 19113 175966<br />
1989 27823 29070 18323 1993926 61941 311200<br />
litoral <strong>de</strong>l Pacífico 15119 6303 8827 986861 42828 136236<br />
Litoral <strong>de</strong>l Golfo y Mar Caribe 12704 22767 9496 1 007064 19113 176966<br />
1990 27823 29077 18323 1993926 61941 311200<br />
Litoral <strong>de</strong>l Pacífico 16119 6303 8827 986 861 42828 136236<br />
Litoral <strong>de</strong>l Golfo y Mar Caribe 12704 22 774 9496 1 007064 19113 176966<br />
1991 27823 29266 121069 2060 148 61941 319280<br />
Litoral <strong>de</strong>l Pacífico 16119 6501 111564 1 043084 42828 143316<br />
Litoral <strong>de</strong>l Golfo y Mar Caribe 12704 22764 9495 1 007064 19113 176966<br />
al Las variaciones dE; las cifras en comparación con el informe <strong>de</strong>l año anterior, se <strong>de</strong>ben a las modificaciones<br />
y clasificaciones <strong>de</strong> las obras portuarias, sustentadas en la publicación <strong>de</strong> Catastro Portuario.<br />
FUENTE: Instituto Nacional <strong>de</strong> Estadística. Geografía e Informática. con base en cifras <strong>de</strong> Puertos <strong>Mexicanos</strong>.<br />
Vocalía <strong>de</strong> Planeación, Gerencia <strong>de</strong> Desanollo Portuario.<br />
330
INEGI. <strong>Anuario</strong> <strong>Estadístico</strong> <strong>de</strong> <strong>los</strong> <strong>Estados</strong> <strong>Unidos</strong> <strong>Mexicanos</strong>. <strong>1992</strong><br />
MOVIMIENTO DE CARGA EN LOS PUERTOS SEGUN LITORAL CUADRO 14.22<br />
1980-91<br />
(Toneladas)<br />
Año y Internacional el Cabotaje<br />
litoral Total Desembarcada Embarcada Desembarcada Embarcada<br />
1980 64987340 14556913 50430427 34040774 34040774<br />
Litoral <strong>de</strong>l Pacífico 11 868460 6227634 6 640 926 16623036 16777 101<br />
litoral <strong>de</strong>l Golfo y Mar Caribe 63 118880 9329379 43789601 17617 739 18263673<br />
1981 78212091 15656322 62555 769 33048977 33048977<br />
Litoral <strong>de</strong>l Pacífico 12347008 4781 677 7666431 14868098 14373236<br />
Litoral <strong>de</strong>l Golfo y Mar Caribe 66866083 10874746 64990338 18190879 18676741<br />
1982 86420794 12820974 73699821 28394348 28394348<br />
Litoral <strong>de</strong>l Pacífico 13 14"1 462 3666198 9675 264 15428762 13738046<br />
litoral <strong>de</strong>l Golfo y Mar Caribe 73279343 9 264 776 64024667 12966697 14666302<br />
1983 87648260 11 146536 76501724 25222398 25222398<br />
Litoral <strong>de</strong>l Pacífico 16836400 2987490 12847910 16107216 14119031<br />
Litoral <strong>de</strong>l Golfo y Mar Caribe 71812860 8169046 63653816 9115183 11 103366<br />
1984 83395258 11008 167 72387091 25944227 25944227<br />
Litoral <strong>de</strong>l Pacífico 17779962 2901 887 14878066 16463092 13981 333<br />
litoral <strong>de</strong>l Golfo y Mar Caribe 66616306 8 106280 67 609026 9491136 11 962894<br />
1985 95712497 10 670 660 86 141 947 31 127267 31127267<br />
litoral <strong>de</strong>l Pacífico 17970139 3653 162 14316987 17339029 16669792<br />
Litoral <strong>de</strong>l Golfo y Mar Caribe 77742368 6 917 398 70824960 13788238 16467476<br />
1986 91806310 9009294 82796016 27 196781 27 196 781<br />
Litoral <strong>de</strong>l Pacífico 19289086 3812794 16476291 16666760 14231 980<br />
litoral <strong>de</strong>l Golfo y Mar Caribe 72 616 226 6196600 67319726 11 630031 12963801<br />
1987 99830018 10880694 88949324 27940918 27940918<br />
Litoral <strong>de</strong>l Pacífico 21 266676 4766668 16499108 17434967 16707362<br />
litoral <strong>de</strong>l Golfo y Mar Caribe 78674342 6 124 126 72460216 10606961 12233666<br />
1988 104693952 14262241 90431 711 28781523 28781 623<br />
litoral <strong>de</strong>l PacífiCO 24662488 7168896 17493693 17668683 16966608<br />
Litoral <strong>de</strong>l Golfo y Mar Caribe 80041464 7 103346 72938118 11 122940 11814916<br />
1989 101894090 17318625 84576565 31164601 31 164601<br />
Litoral <strong>de</strong>l Pacifico 24671953 8 258 459 16413494 18136461 17870323<br />
Litoral <strong>de</strong>l Golfo y Mar Caribe 77 222 137 9060066 68162071 13028040 13294178<br />
1990 108386671 19274203 89 111 468 33624051 33624061<br />
Litoral <strong>de</strong>l Pacífico 28149764 7 779092 20370672 20 279028 20131818<br />
Litoral <strong>de</strong>l Golfo y Mar Caribe 80235907 11496111 68 740 796 13345023 13492233<br />
1991 111 889000 18 209 003 93679997 34331000 34331 000<br />
litoral <strong>de</strong>l Pacífico 29069642 7349174 21 710468 20705397 20555091<br />
Litoral <strong>de</strong>l Golfo y Mar Caribe 82 829 358 10869829 71 969529 13626603 13776909<br />
al Se cambiaron <strong>los</strong> términos "importación" y "exportación" <strong>de</strong>l transporte marítimo internacional por <strong>los</strong> <strong>de</strong> <strong>de</strong>sem·<br />
barcada y embarcada respectivamente, por carecer <strong>de</strong> información en <strong>los</strong> documentos <strong>de</strong> captación que<br />
permitan constatar que la carga transportada por las embarcaciones correspon<strong>de</strong> realmente a <strong>los</strong> países <strong>de</strong> origen<br />
y <strong>de</strong>stino.<br />
FUENTE: Instituto Nacional <strong>de</strong> Estadística, Geografía e Informática, con base en cifras <strong>de</strong> la Secretaría <strong>de</strong> Comunicaciones<br />
y Transportes. Dirección General <strong>de</strong> Puertos y Marina Mercante. Capitanías <strong>de</strong> Puerto.<br />
332
INEGI. <strong>Anuario</strong> <strong>Estadístico</strong> <strong>de</strong> <strong>los</strong> <strong>Estados</strong> <strong>Unidos</strong> <strong>Mexicanos</strong>. <strong>1992</strong><br />
NUMERO DE EMBARCACIONES, TONELAJE DE REGISTRO Y CUADRO 14.25<br />
SU CAPACIDAD DE LA MARINA MERCANTE DE<br />
PETROLEOS MEXICANOS<br />
19BO-91<br />
Año Número <strong>de</strong> Tonelaje <strong>de</strong> registro Capacidad<br />
embarcaciones Bruto Neto Ibarrilesl<br />
1980 217 639869 407710 7 322 769<br />
1981 227 642462 40B 2B4 7 30B 707<br />
1982 267 668766 428890 7033179<br />
1983 280 699643 461 469 7846113<br />
1984 290 706167 466662 7267726<br />
1986 290 706167 466662 7179447<br />
1986 262 687 149 449601 7232966<br />
1987 270 791078 626896 6810161<br />
1988 232 766768 648611 7088866<br />
1989 206 801 112 634020 7762660<br />
1990 209 824960 646757 7801 546<br />
1991 211 817 570 466039 8646860<br />
FUENTE: Instituto Nacional <strong>de</strong> Estadística, Geografía e Informática, con base en cifras <strong>de</strong> Petróleos Mexicano •.<br />
Subdlrecci6n <strong>de</strong> Planeaci6n y Coordineción.<br />
RED DE LOS DUCTOS NACIONALES al CUADRO 14.26<br />
1980-91<br />
(Kilómetros)<br />
Total Oleo- G"so- Poli- Petroquí· Combusto- Varios Duetos <strong>de</strong><br />
Año duetos duetos duetos micos leoductos recolección<br />
y servicios<br />
1980 21 055.6 5134.2 9046.4 5199.0 1676.0<br />
1981 24 912.9 6684.6 11269.6 6056.0 2002.8<br />
1982 41 320.3 13360.8 19248.4 6190.0 2521.1<br />
1983 42213.6 11916.2 21 983.8 6777.0 2637.6<br />
1984 32366.8 8336.4 16666.6 6863.0 1610.9<br />
1986 60422.8 4381.0 14268.0 8176.0 1404.7 170.7 74.0 21 948.4<br />
1986 61 842.4 4381.0 13642.1 8901.9 1404.7 170.7 74.0 23368.0<br />
1987 61 990.4 4440.0 13496.1 8996.6 1440.4 176.4 74.0 23368.0<br />
1988 62396.3 4817 .0 13166.7 9662.1 1414.2 222.0 224.3 22900.0<br />
1989 69861.4 6142.0 13166.7 9662.1 1414.2 222.0 224.3 30031.1<br />
1990 69828.7 6049.0 12963.7 9623.3 1349.1 166.3 224.3 30664.0<br />
1991 68 139.2 6142.0 13086.7 9962.1 1367.1 196.3 28396.0<br />
a/ A partir <strong>de</strong> 1986 <strong>los</strong> datos que se consignan son captados <strong>de</strong>l Censo Institucional <strong>de</strong> Duetos.<br />
FUENTE: Instituto Nacional <strong>de</strong> Estadística, Geografía e Informática. con base en cifras <strong>de</strong> Petróleos <strong>Mexicanos</strong>.<br />
Subdirecdón <strong>de</strong> Planeación y Coordinación.<br />
334
AEROPUERTOS, AEROOROMOS y AERONAVES CUADRO 14.27<br />
1980-91 (1" parte)<br />
Aereopuertos y aeródromos<br />
Año Total Aeropuertos al Aeródromos<br />
I nternaciunaJ Nacional<br />
1980 312 32 36 244<br />
1981 :320 32 40 248<br />
1982 320 32 40 248<br />
1983 1 327 32 40 255<br />
1984 1 344 32 40 1 272<br />
1985 :144 32 40 272<br />
1986 :145 32 41 272<br />
1987 1 756 35 40 681<br />
1988 1 854 36 42 776<br />
1989 2065 38 45 1 982<br />
1990 2168 42 40 2086<br />
1991 2426 44 38 2344<br />
Aeronaves<br />
CUADRO 14.27<br />
(2' parte y última)<br />
Año Total Comerciales Particulares Oficiales<br />
(XAI (XBI (XCI<br />
1980 4 !l59 799 3431 629<br />
1981 5146 882 3602 662<br />
1982 5172 859 :3616 697<br />
1983 5176 728 3755 693<br />
1984 5132 660 3787 685<br />
1985 4820 493 3754 573<br />
1986 4860 515 3765 580<br />
1987 5116 535 4031 550<br />
1988 5 164 541 4088 535<br />
1989 5401 59é, 4282 524<br />
1990 5874 847 4442 585<br />
1991 6 123 1020 4492 611<br />
a/lncluye a <strong>los</strong> Aeropuertos contratados por Aeropuertos y ServICIOS Auxiliares y la Secretaría <strong>de</strong> Comunicaciones<br />
y Transportes.<br />
FUENTE: Instituto Nacional <strong>de</strong> Estadística, Geografía e Informática. con base en cifras <strong>de</strong> 1ft Secretaría <strong>de</strong> Comunicaciones<br />
y Transportes, Dirección General <strong>de</strong> Aeronáutica Civil.<br />
Véase mapa 11<br />
335 INEGI. <strong>Anuario</strong> <strong>Estadístico</strong> <strong>de</strong> <strong>los</strong> <strong>Estados</strong> <strong>Unidos</strong> <strong>Mexicanos</strong>. <strong>1992</strong>
MOVIMIENTO DE VUELOS Y PASAJEROS DE LA AVIACIONI CUADRO 14.28<br />
CIVIL NACIONAL (1' parte)<br />
1980-91<br />
ComerCial Particular<br />
Año Llegada <strong>de</strong> Llegada <strong>de</strong> Sahda <strong>de</strong> Salida <strong>de</strong> Llegada <strong>de</strong> llegada <strong>de</strong><br />
vue<strong>los</strong> pasajeros vue<strong>los</strong> pasajeros vue<strong>los</strong> pasajeros<br />
1980 254 299 10739089 255 030 10176503 220304 550046<br />
1981 268 035 11 714 352 268990 11 207 493 257 769 631 316<br />
1982 240 203 11 152440 242 880 10798834 2315 925 558333<br />
1983 227 700 12047567 229416 11474657 192 885 435445<br />
1984 222 808 11 977 387 223 982 11 331414 159551 368 904<br />
1985 219402 13054664 221 161 12503524 148 517 349 413<br />
1986 213436 11 595 969 216424 11148290 150386 355 955<br />
1987 201 277 10504742 203895 9 956 026 155462 364744<br />
1988 176442 9162769 177 964 8621474 1 E3 184 374303<br />
1989 195807 10924125 196 430 10383 154 1 E,5 995 400 796<br />
1990 223 163 11766933 228 780 11 291061 148 304 409073<br />
1991 276427 13034425 282 17 3 12362114 160 438 403 235<br />
Particular OfiCial<br />
CUADRO 14.28<br />
(2' parte y última)<br />
Año Salida <strong>de</strong> Salida <strong>de</strong> llegada <strong>de</strong> Llegada <strong>de</strong> Salida <strong>de</strong> Salida <strong>de</strong><br />
vue<strong>los</strong> pasajeros vue<strong>los</strong> pasajeros vue<strong>los</strong> pasajeros<br />
1980 222 872 557 363 75304 294 926 75042 303493<br />
1981 256 673 629 610 96797 331 124 95521 330 709<br />
1982 233 898 550445 106 602 360 735 106 386 349 278<br />
1983 191 385 428 483 79493 272 158 79350 270473<br />
1984 157839 359 731 78106 240627 78310 241001<br />
1985 147468 345629 72623 225 584 • 72719 225 706<br />
1986 149 999 356317 68 119 211 917 68479 213497<br />
1987 154 264 372 314 73524 206085 73613 204715<br />
1988 161 747 382 088 69382 182251 69494 186500<br />
1989 154 124 398 221 67469 204 873 67 949 200 828<br />
1990 146 157 375392 69742 203 935 70095 186821<br />
1991 158465 368 862 79583 195781 71 704 181445<br />
NOTA: En el transcurso <strong>de</strong>l año se consignan datos en algunos aeropuertos referentes a pa58JerO$ y/o carga sin que<br />
se registren vue<strong>los</strong>, esto se <strong>de</strong>be a que fueron transbordados <strong>de</strong> aeronaves en serVICIO internacional a<br />
aeronaves en serVICIO nacional. El mOVimiento <strong>de</strong> pasajeros particulares y ofiCiales, se estima <strong>de</strong>s<strong>de</strong> el año<br />
1987, <strong>de</strong>bido a que la fuente <strong>de</strong>jó <strong>de</strong> suministrar <strong>los</strong> datos por cambiOS en sus metodos <strong>de</strong> captación.<br />
FUENTE: Instituto Necional <strong>de</strong> Est6dística. Geografía e Informático, con base en cifras <strong>de</strong> Aeropuertos y Servicios<br />
Auxiliares, Subgere-ncia <strong>de</strong> Estadística y Estudios Corporativos.<br />
337 INEGI. <strong>Anuario</strong> <strong>Estadístico</strong> <strong>de</strong> <strong>los</strong> <strong>Estados</strong> <strong>Unidos</strong> <strong>Mexicanos</strong>. <strong>1992</strong>
MOVIMIENTO DE CORREO, EQUIPAJE Y CARGA DE LA CUADRO 14.30<br />
AVIACION CIVIL (1· parte)<br />
1980-91<br />
(Toneladas)<br />
Nacional<br />
Año llegada Salida<br />
Correo Equipaje Carga Correo Equipaje Carga<br />
1980 2062 102386 76626 2332 101 688 80160<br />
1981 2089 106399 80482 2643 lOE; 384 82129<br />
1982 2076 96497 66462 2487 97 230 66962<br />
1983 1 923 112299 61 662 2666 112631 64498<br />
1984 2096 111 868 72968 2629 1 lO 960 76802<br />
1986 2364 118412 86126 2626 113631 84647<br />
1986 2702 1 lO 693 82467 2846 107006 83226<br />
1987 2872 103867 81 296 2849 91l 916 80412<br />
1988 2813 94977 63749 2826 90446 63847<br />
1989 2897 116826 61 701 3072 11:3 447 63396<br />
1990 4736 126 789 63880 6094 12:3 410 70639<br />
1991 4387 136268 74967 4948 131097 81 241<br />
Internacional<br />
CUADRO 14.30<br />
(2° parte y última)<br />
Año Llegada Salida<br />
Correo Equipaje Carga Correo Equipaje Carga<br />
1980 2106 67604 44639 947 48232 23149<br />
1981 2216 62660 60862 1006 49019 20193<br />
1982 1 969 60460 29606 972 39620 17680<br />
1983 1 722 63841 16718 822 48630 18390<br />
1984 1 836 69196 27638 761 61 761 21 319<br />
1986 1 981 67984 34624 747 46621 20093<br />
1986 2027 60671 29109 839 60016 23648<br />
1987 1 887 73236 32522 773 EO 849 30172<br />
1988 1 980 76800 41 782 766 60292 32483<br />
1989 2424 82166 63426 846 68418 34713<br />
1990 2043 98794 56466 762 78637 38118<br />
1991 1 947 82154 66129 897 J'2 206 37078<br />
NOTA: Debido a que la fuente Informativa modificó su procedimiento <strong>de</strong> captación y registro, sólo es posible<br />
presentar la información en toneladas.<br />
FUENTE: Instituto Nacional <strong>de</strong> Estadística. Geografía e Informática, con base en datos <strong>de</strong> Aeropuertos y Servicios<br />
Auxili8res. Subgerencia <strong>de</strong> Phmeación Corporativa.<br />
339 INEGI. <strong>Anuario</strong> <strong>Estadístico</strong> <strong>de</strong> <strong>los</strong> <strong>Estados</strong> <strong>Unidos</strong> <strong>Mexicanos</strong>. <strong>1992</strong>
INEGI. <strong>Anuario</strong> <strong>Estadístico</strong> <strong>de</strong> <strong>los</strong> <strong>Estados</strong> <strong>Unidos</strong> <strong>Mexicanos</strong>. <strong>1992</strong><br />
AEROPUERTOS Y SERVICIOS AUXILIARES<br />
INGRESOS<br />
1980-91<br />
(Miles <strong>de</strong> nuevos pesos)<br />
CUADRO 14.31<br />
(1" parte)<br />
Total Servicios Servicios Venta <strong>de</strong><br />
Año aeropor- auxiliares combustibles<br />
tuaríos y lubricantes<br />
1980 6122 851 440 4661<br />
1981 13658 1263 738 11027<br />
1982 24893 1 693 909 21060<br />
1983 68568 2778 1302 62770<br />
1984 85734 3883 2362 76143<br />
1985 98096 5699 4719 82433<br />
1986 174 583 10204 B 547 135013<br />
1987 487 046 19697 17444 317 254<br />
1988 718 389 60071 38075 453712<br />
1989 1 085 785 182 953 47293 586087<br />
1990 1 BOl 071 314095 93251 992488<br />
1991 2036 112 391213 129449 1099151<br />
CUADRO 14.31<br />
(2' parte y última)<br />
Productos Otros Otros<br />
Año financieros productos Ingresos<br />
1980 101 17 52<br />
1981 266 44 320<br />
1982 216 168 847<br />
1983 1 612 43 63<br />
1984 2787 465 94<br />
1985 4991 108 146<br />
1986 15310 885 4624<br />
1987 48 B1B 38773 45060<br />
1988 56764 19516 90251<br />
1989 82037 2393 185022<br />
1990 94697 4134 302406<br />
1991 63125 16389 346 785<br />
NOTA: La estructura conceptual <strong>de</strong> este cuadro, se <strong>de</strong>be a la clasificación, <strong>de</strong> las cuentas proporcionadas por la fuente<br />
informativa en sus estados financieros.<br />
FUENTE: Instituto Nacional <strong>de</strong> Estadistica, Geografía e Informática. con base en cifras <strong>de</strong> Aeropuertos y Servicios<br />
Auxiliares. Subdirección <strong>de</strong> Administración.<br />
340
AEROPUERTOS Y SERVICIOS AUXILIARES CUADRO 14.32<br />
EGRESOS (1· parte)<br />
1980-91<br />
(Miles <strong>de</strong> nuevos pesos)<br />
Gastos y costos <strong>de</strong> operación<br />
Total Servicios Otras Conservación Depreciación Adquisición<br />
Año personales <strong>de</strong> erogaciones y amortización <strong>de</strong> bienes <strong>de</strong><br />
operación <strong>de</strong> oper aei ón mantenimiento operación<br />
1980 1817 1100 237 170 250 60<br />
1981 3225 1 725 392 506 302 300<br />
1982 E,356 2651 741 1 339 425 200<br />
1983 7288 3770 1306 1023 521 668<br />
1984 13035 6858 2 117 2129 743 188<br />
1985 26419 10558 3721 1 777 7 191 2 172<br />
1986 41 749 18708 8348 3005 9002 2686<br />
1987 76088 43646 11039 12324 2048 7031<br />
1988 148601 81 866 26713 20910 4971 14141<br />
1989 191939 99190 37596 30290 7314 17549<br />
1990 28.3382 138415 67788 38802 11956 26421<br />
1991 423941 187 172 112756 58855 18463 46695<br />
CUADRO 14.32<br />
(2· parte y última)<br />
Gastos y costos <strong>de</strong> operación Resultado<br />
Costos <strong>de</strong> Impuestos Gastos Otros Resultado por Depreciación neto <strong>de</strong><br />
Año combU$- y <strong>de</strong>rechos financieros gastos composición po, operación<br />
tibie y monetaria re valuación<br />
lubricantes<br />
al<br />
1980 4192 15 72 8 18<br />
1981 10190 27 57 20 139<br />
1982 19300 38 87 77 35<br />
1983 59766 81 101 75 257<br />
1984 72 446 144 78 36 -4<br />
1986 72962 314 8 57 ·664<br />
1986 121 101 748 2687 1 685 6613<br />
1987 298698 787 42536 1436 61 335<br />
1988 417 740 2940 19656 3057 44602 81 793<br />
1989 523 940 5392 1 189 600 14980 84660 263 296<br />
1990 887 416 17 668 1213 1 841 64323 136 161 409067<br />
1991 984791 12461 1697 3697 67008 160626 392092<br />
a/ Descontadas las fluctuaciones y re valuaciones.<br />
FUENTE: Instituto Nacional <strong>de</strong> Estadística. Geografía e Informática, con base en cifras <strong>de</strong> Aeropuertos y Servicios<br />
Auxiliares. Subdirección <strong>de</strong> Administración.<br />
341 INEGI. <strong>Anuario</strong> <strong>Estadístico</strong> <strong>de</strong> <strong>los</strong> <strong>Estados</strong> <strong>Unidos</strong> <strong>Mexicanos</strong>. <strong>1992</strong>
INEGI. <strong>Anuario</strong> <strong>Estadístico</strong> <strong>de</strong> <strong>los</strong> <strong>Estados</strong> <strong>Unidos</strong> <strong>Mexicanos</strong>. <strong>1992</strong><br />
AEROPUERTOS, AERODROMOS y SERVICIO DE TRANSPORTE CUADRO 14.33<br />
AEREO DE EMPRESAS NACIONALES<br />
1980-91<br />
(1· parte)<br />
Aeropuertos Aeródromos Empresas nacionales<br />
Año Categoría Categoría Vue<strong>los</strong> Kilómetros Tiempo<br />
Nacional Internacional (Miles) recorridos empleado<br />
(Millones) (Miles <strong>de</strong> horas)<br />
1980 36 32 1244 291 223 392<br />
1981 40 32 1248 328 230 402<br />
1982 40 34 1248 284 216 394<br />
1983 40 32 1266 296 226 408<br />
1984 40 32 1272 337 237 416<br />
1986 40 32 1272 270 236 449<br />
1986 41 32 1 272 269 226 399<br />
1987 40 36 1681 244 213 367<br />
1988 42 36 1776 247 161 266<br />
1989 46 38 1982 247 161 304<br />
1990 40 42 2086 168 192 260<br />
1991 38 44 216 242 323<br />
CUADRO 14.33<br />
(2· parte y última)<br />
Empresas nacionales<br />
Año Pasajeros Pasajeros- Carga transportada<br />
(Mile.) Kil6metro Correspon- Mercancías bl Equipaje<br />
(Millones) <strong>de</strong>ne;. a/ (Toneladas) (Toneladas)<br />
(Toneladas)<br />
1980 16169 14669 6646 119849 160141<br />
1981 16461 16011 6062 124420 174779<br />
1982 16724 13734 6049 101046 141308<br />
1983 16870 16140 6620 96020 112631<br />
1984 17 126 17778 6478 113646 111868<br />
1986 17 942 18418 6022 127487 118412<br />
1986 16092 17606 6206 119313 80337<br />
1987 14440 18041 3661 119838 163330<br />
1988 12286 16448 3337 83911 186423<br />
1989 14186 17 230 3644 81220 116097<br />
1990 16344 19664 7674 94827 199061<br />
1991 16987 20226 7232 106096 212666<br />
l/Incluye paquetes aeropostales.<br />
b/lncluye <strong>los</strong> servicios <strong>de</strong> express y carga.<br />
FUENTE: InaUtuto Necional <strong>de</strong> Eatadístice. Geogreffe e Inform6Uce. con baH en cifres <strong>de</strong> la Secretarra <strong>de</strong><br />
Comunicacionea y Trenlportel; Direcci6n General <strong>de</strong> Aeronáutica Civil.<br />
342
INEGI. <strong>Anuario</strong> <strong>Estadístico</strong> <strong>de</strong> <strong>los</strong> <strong>Estados</strong> <strong>Unidos</strong> <strong>Mexicanos</strong>. <strong>1992</strong><br />
MOVIMIENTO DE VEHICUlOS DE MOTOR REGISTRADOS EN CAMINOS CUADRO 14.35<br />
Y PUENTES FEDERALES DE INGRESOS Y SERVICIOS CONEXOS<br />
1980-91<br />
(1· parte)<br />
Total Caminos Puentes<br />
Año Total Automó- Autobuses Camiones Motoei- Total Automóviles<br />
<strong>de</strong> carga <strong>de</strong>tas viles<br />
1980 128 223 68741 47101 7400 14141 99 59482 47068<br />
1981 146088 78961 64740 7636 16466 121 66137 62491<br />
1982 160963 86669 69982 7849 17706 122 66304 61691<br />
1983 131566 73663 63084 7269 13263 67 67902 46034<br />
1984 127 738 70242 60433 7214 12668 37 67496 46624<br />
1986 131 427 74170 64106 7 138 12893 34 67267 46163<br />
1986 129413 73728 66080 6816 11 732 100 66686 44390<br />
1987 128359 74916 68028 6108 10740 39 63444 42638<br />
1988 132063 78806 61613 6961 11 211 30 53258 42406<br />
1989 137 146 82620 63336 6644 12524 16 54626 43730<br />
1990 131 104 78638 60809 6108 11 709 12 52466 42020<br />
1991 149 659 96162 73753 6663 16837 63497 42769<br />
CUADRO 14.35<br />
(2" parte y última)<br />
Puentes Ingresos (Miles <strong>de</strong> nuevos pesos)<br />
Año Autobuses Camiones Motoei· Tricic<strong>los</strong> al Total bl En caminos En puentes<br />
<strong>de</strong> carga <strong>de</strong>tes<br />
1980 2730 9296 388 1936 1676 361<br />
1981 2861 10321 464 2405 1966 460<br />
1982 2856 10384 473 3239 2681 568<br />
1983 2706 8823 339 10566 8361 220e;<br />
1984 2790 8798 284 21 327 16982 4346<br />
1986 2805 9062 237 34652 27343 7309<br />
1986 2837 8236 223 63269 48082 16 178<br />
1987 2716 7973 118 166273 130613 34660<br />
1988 2825 7964 64 326006 266780 68226<br />
1989 2791 8063 62 490616 382680 107937<br />
1990 2769 7639 38 1 152071 893696 268376<br />
1991 2246 8430 34 18 1476716 142216 334600<br />
al Este tipo <strong>de</strong> vehícu<strong>los</strong> transitan por el puente <strong>de</strong>nominado Rodolfo Robles Domínguez, localizado en el estado <strong>de</strong><br />
Chiapas.<br />
b/ La suma <strong>de</strong> <strong>los</strong> parciales pue<strong>de</strong> no cOincidir con el total, <strong>de</strong>bido al redon<strong>de</strong>o <strong>de</strong> cifras.<br />
FUENTE: Instituto Nncional <strong>de</strong> Estadística. Geografín e Informática. con base en cifras <strong>de</strong> Caminos y Puentes Fe<strong>de</strong>rales<br />
<strong>de</strong> Ingresos y Servicios Conexos; Dirección <strong>de</strong> Administración y Finanzas.<br />
344
CAMINOS Y PUENTES FEDERALES DE INGRESOS Y SERVICIOS CUADRO 14.36<br />
CONEXOS INGRESOS Y EGRESOS 11" partel<br />
1980·91<br />
(Miles <strong>de</strong> nuevos pesos)<br />
Ingresos y productos<br />
Total Ingresos Renta <strong>de</strong> Alquiler Venta <strong>de</strong> Venta <strong>de</strong> Venta <strong>de</strong> Otros Resultado<br />
Año por locales <strong>de</strong> ma- emulslo- pinturas gasolmas Ingresos monetario<br />
<strong>de</strong>recho comercla- qUlnarl8 nes y prO- operacional<br />
les duetos<br />
1980 2408 1 940 9 149 48 225 36<br />
1981 2968 2406 5 201 83 254 18<br />
1982 3954 3268 5 268 60 330 22<br />
1983 12648 10565 5 792 184 053 48<br />
1984 25414 21 327 3 4 842 480 696 62<br />
1985 40756 34200 2838 752 2841 121<br />
1986 72 673 63000 5 2810 917 5708 233<br />
1987 187 816 169619 5 4190 1065 12 122 815<br />
1988 367946 290 E;64 5 18 3469 502 27000 46388<br />
1989 633 108 501 a73 17 124 5161 863 31 660 93910<br />
1990 1 409 638 1 106 E¡43 10 9363 5144 68287 157276 62915<br />
1991 1 657247 1599841 14 37 8279 3 168 93029 96065 -143 186<br />
CUADRO 14.36<br />
12" parte y última)<br />
Gastos y costos <strong>de</strong> operación Resultado<br />
Total Gastos <strong>de</strong> Gastos <strong>de</strong> Gastos <strong>de</strong> Gastos Costos Costos Oescuen- neto <strong>de</strong><br />
Afio conserva- operaCión admlnls- flnan- <strong>de</strong> <strong>de</strong> ventas tos y operación<br />
clón traclón canser- rebajas<br />
vaclón sobre<br />
ventas<br />
1988 206 837 96768 41 159 19417 20151 1 482 27860 161 109<br />
1989 309 468 85860 136 186 27 210 24605 2423 33 126 58 323 640<br />
1990 762 252 154 838 387904 90797 51480 4 559 72666 647 386<br />
1991 1003130 133 288 654 140 76308 33996 7439 97952 654 117<br />
NOTA: Ya que no se cuenta con Información antenor, el cuadro <strong>de</strong> egresos <strong>de</strong> este organIsmo se empIeza a elaborar<br />
a partir <strong>de</strong> 1988.<br />
FUENTE: Instituto N6cion6/ <strong>de</strong> Est6dísticft, Geogr6fí8 e Inforrnótic8, con base en cifrfts <strong>de</strong> Caminos y PtJentes<br />
Fe<strong>de</strong>rales <strong>de</strong> Ingresos y Servicios Conexos, GerenciH <strong>de</strong> Cont6bilidad y PreSUplJesto.<br />
345 INEGI. <strong>Anuario</strong> <strong>Estadístico</strong> <strong>de</strong> <strong>los</strong> <strong>Estados</strong> <strong>Unidos</strong> <strong>Mexicanos</strong>. <strong>1992</strong>
INEGI. <strong>Anuario</strong> <strong>Estadístico</strong> <strong>de</strong> <strong>los</strong> <strong>Estados</strong> <strong>Unidos</strong> <strong>Mexicanos</strong>. <strong>1992</strong><br />
PRINCIPALES CARACTERISTlCAS DEL AUTOMOTOR CUADRO 14.37<br />
URBANO DE PASAJEROS EN LA CIUDAD DE MEXICO (1' parte)<br />
1983-91<br />
Personal ocupado Unida<strong>de</strong>s automotrices<br />
Año Administrativo a/ Operadores Obreros y En módu<strong>los</strong> Reconstruidas Programas<br />
técnicos bl el especiales<br />
1983 4204 11490 4162 6716 1082<br />
1984 6809 11 673 4791 9219 1 373 382<br />
1986 6636 12123 4768 9271 1002 220<br />
1986 6479 11 664 6331 8817 1 263 112<br />
1987 6162 12471 6727 8809 619 69<br />
1988 4683 13012 6123 7731 334 36<br />
1989 3868 10773 6374 6041 380 8<br />
1990 2994 8940 6897 6642 2700 8<br />
1991 P 2942 8788 6780 6213 2639 8<br />
CUADRO 14.37<br />
(2' parte y última)<br />
Autobuses en operación (promedio) Pasajeros Recaudación Kilómetros Rutas<br />
Lunes a Viernes Sábados y transportados por venta <strong>de</strong> recorridos directas<br />
Año Domingos dI (Millones) boletos fl (Millones)<br />
(Miles <strong>de</strong><br />
nuevos pesos)<br />
1983 4262 ND 1698 6093 368 216<br />
1984 4 133 2518 1903 5707 314 219<br />
1986 4203 2767 1976 6924 322 220<br />
1986 4621 2614 2063 16616 323 224<br />
1987 4343 2668 2141 62168 326 227<br />
1988 4096 2481 2011 146382 326 227<br />
1989 3161 2027 1406 129916 274 236<br />
1990 3301 1928 1212 173 120 236 246<br />
1991 P 3106 1813 1090 261 396 245 246<br />
a/ Personal <strong>de</strong> confianza adscrito a módu<strong>los</strong> y oficinas centrales.<br />
bl Personal que se <strong>de</strong>dica exclusivamente al mantenimiento <strong>de</strong> las unida<strong>de</strong>s automotrices.<br />
e/Incluye a <strong>los</strong> autobuses que pertenecieron 8 <strong>los</strong> expermisionarios (servicio <strong>de</strong> origen) y que fueron transferidos a<br />
Ruta·'OO con la estatización <strong>de</strong>l transporte.<br />
d/ Se consi<strong>de</strong>ra como <strong>los</strong> viajes·personas durante el año.<br />
f/ Considérese como la recaudación directa <strong>de</strong>l cobro por pasaje en efectivo y la participación proporcional <strong>de</strong>l abono<br />
multimodal que entró en operación en agosto <strong>de</strong> 1986 con las otras modalida<strong>de</strong>s <strong>de</strong> transporte urbano <strong>de</strong> pasajeros,<br />
metro, trolebús y tren ligero.<br />
FUENTE: Instituto Nacional <strong>de</strong> Estadística, Geografía e Informática. con base en cifras <strong>de</strong>l Departamento <strong>de</strong>l Distrito<br />
Fe<strong>de</strong>ral; Coordinación General <strong>de</strong> Transporte, Autotransporte Urbano <strong>de</strong> Pasajeros Ruta-lOO.<br />
346
PRINCIPALES CARACTERISTlCAS DEl SISTEMA DE TRANSPORTE CUADRO 14.38<br />
COLECTIVO (METRO) (1' parte)<br />
1980-91<br />
Uneas en Estaciones Longitud <strong>de</strong> Unida<strong>de</strong>s <strong>de</strong><br />
Año seiVlcio serVICIO servicio al<br />
(Kilómetros)<br />
1980 3 67 61.6 88<br />
1981 5 71 68.3 98<br />
1982 6 79 78.2 1 í3<br />
1983 6 90 93.1 129<br />
1984 99 102.8 146<br />
1986 106 110.2 161<br />
1986 109 119.4 168<br />
1987 8 118 131.5 169<br />
1988 8 126 141.0 180<br />
1989 8 126 141.0 180<br />
1990 9 126 141.0 216<br />
1991 9 136 158.0 216<br />
CUADRO 14.38<br />
(2" parte y última)<br />
Pasajeros Kilómetros Energía<br />
Año transportados recorridos eléctrica<br />
(Miles) IMilesl consumida<br />
(Miles <strong>de</strong> Kwh.\<br />
1980 909606 11 165 377 792<br />
1981 987 432 12484 390396<br />
1982 1 037482 14937 398890<br />
1983 116739 18017 617 246<br />
1984 242 219 21 718 620064<br />
1985 1 324 484 23782 719 193<br />
1986 1 361 936 26620 720064<br />
1987 414117 26824 766721<br />
1988 1476066 28774 861 470<br />
1989 1 638246 28864 868662<br />
1990 1447674 28289 857000<br />
1991 1 433668 29064 844368<br />
NOTA: Se Incluye en el año 1991 la línea A, que se refiere al transporte <strong>de</strong>nominado Metro Férreo, cuyas operaciones<br />
Iniciaron en agosto <strong>de</strong> ese año.<br />
a! Las unida<strong>de</strong>s <strong>de</strong> serVICIO son trenes integrados por 9 carros.<br />
FUENTE: Instituto Nacional <strong>de</strong> Estadística. Geografía e Informática, con base en cifras <strong>de</strong>l ()epartamento <strong>de</strong>l Distrito<br />
Fe<strong>de</strong>rel; Sistema <strong>de</strong> Transporte Colectivo (Metro), Gerencia <strong>de</strong> Presupuesto.<br />
347 INEGI. <strong>Anuario</strong> <strong>Estadístico</strong> <strong>de</strong> <strong>los</strong> <strong>Estados</strong> <strong>Unidos</strong> <strong>Mexicanos</strong>. <strong>1992</strong>
INEGI. <strong>Anuario</strong> <strong>Estadístico</strong> <strong>de</strong> <strong>los</strong> <strong>Estados</strong> <strong>Unidos</strong> <strong>Mexicanos</strong>. <strong>1992</strong><br />
PRINCIPALES CARACTERISTICAS DEl TRANSPORTE ElECTRICO<br />
EN lA CIUDAD DE MEXICO<br />
1980-91<br />
Año<br />
1980<br />
1981<br />
1982<br />
1983<br />
1984<br />
1985<br />
1986<br />
1987<br />
1988<br />
1989<br />
1990<br />
1991<br />
Año<br />
1980<br />
1981<br />
1982<br />
1983<br />
1984<br />
1985<br />
1986<br />
1987<br />
1988<br />
1989<br />
1990<br />
1991<br />
3<br />
3<br />
3<br />
2<br />
2<br />
2<br />
CUADRO 14.39<br />
(1' parte)<br />
Tranvías al<br />
Líneas en Longitud en Unida<strong>de</strong>s en Carro-día Kilómetros Pasajeros Pasajeros Ingresos<br />
serVICIO servicIo operación<br />
recorridos transpor· por por pasaje<br />
(Kifómetro)<br />
(Milesl tados kilómetro (Nuevos<br />
(Milesl (Milesl<br />
pesos)<br />
31<br />
31<br />
31<br />
31<br />
31<br />
31<br />
11<br />
11<br />
25<br />
25<br />
25<br />
25<br />
30<br />
28<br />
28<br />
27<br />
25<br />
14<br />
9<br />
17<br />
17<br />
6<br />
908<br />
844<br />
847<br />
817<br />
798<br />
830<br />
ND<br />
ND<br />
282<br />
272<br />
172<br />
177<br />
2913<br />
2597<br />
2475<br />
2217<br />
1 740<br />
235<br />
156<br />
860<br />
676<br />
541<br />
725<br />
736<br />
27215<br />
25213<br />
22732<br />
21 799<br />
17968<br />
3501<br />
413<br />
11 122<br />
14332<br />
6746<br />
4677<br />
4 197<br />
9.3<br />
9.7<br />
9.2<br />
9.8<br />
10.3<br />
Trolebús<br />
Lineas en longitud en Unida<strong>de</strong>s en Carro·día Kilómetros Pasajeros Pasajeros Ingresos<br />
servicio serVICIO operación<br />
reCOrridos transpor- por por pasaje<br />
(Kilómetro)<br />
(Miles) tados kilómetro (Nuevos<br />
(Miles) (Miles)<br />
pesos)<br />
16<br />
16<br />
14<br />
14<br />
14<br />
14<br />
22<br />
22<br />
26<br />
27<br />
27<br />
19<br />
294<br />
294<br />
294<br />
302<br />
302<br />
302<br />
302<br />
302<br />
510<br />
510<br />
510<br />
440<br />
324<br />
345<br />
352<br />
300<br />
266<br />
265<br />
282<br />
297<br />
317<br />
312<br />
300<br />
254<br />
9869<br />
10503<br />
10698<br />
9152<br />
8371<br />
8403<br />
8742<br />
9207<br />
12399<br />
12399<br />
7783<br />
7705<br />
28448<br />
23091<br />
22940<br />
19461<br />
18963<br />
17008<br />
21463<br />
25739<br />
19689<br />
24081<br />
17772<br />
14 197<br />
194281<br />
202370<br />
226685<br />
207384<br />
203310<br />
186430<br />
175828<br />
169371<br />
241 189<br />
188442<br />
115362<br />
127110<br />
14.9<br />
3.0<br />
13.0<br />
21.2<br />
12.5<br />
6.4<br />
5.7<br />
16256<br />
15075<br />
13524<br />
13079<br />
10781<br />
2114<br />
8256<br />
417 857<br />
1 009580<br />
530651<br />
1 043459<br />
936 369<br />
CUADRO 14.39<br />
(2' parte y última)<br />
6.8 115354<br />
8.8 120332<br />
9.9 134 877<br />
10.7 124441<br />
10.7 122018<br />
11.0 111839<br />
8.2 1091846<br />
7.0 6196028<br />
12.2 14223520<br />
7.8 13357846<br />
6.5 21 977 503<br />
8.9 25617531<br />
a/ A parti, <strong>de</strong> 1985 empezaron a <strong>de</strong>saparecer <strong>los</strong> tranvías para que entrara en funcionamiento a partIr <strong>de</strong> agosto <strong>de</strong><br />
1986 el servicio <strong>de</strong>l tren ligero.<br />
FUENTE: Instituto Nacional <strong>de</strong> Estadística, Geografía e Informática, con bnse en cifras <strong>de</strong>l Departamento <strong>de</strong>l Distrito<br />
Fe<strong>de</strong>ral: Sistema <strong>de</strong> Transporte EJéctrico, Dirección <strong>de</strong> Administración y Finanzas.<br />
348
PRINCIPALES CARACTERISTlCAS DEL TRANSPORTE ELECTRICO CUADRO 14.40<br />
EN LA CIUDAD DE GUADALAJARA 11' parte)<br />
1980-91<br />
Tren eléctrico al<br />
Líneas en LonQltud en Unida<strong>de</strong>s en Carro-día Kilómetros Pasajeros Pasajeros Ingresos<br />
Año serVICIO serVICIO operación recorridos transpor- por por pasaje<br />
(Kilómetro) (Miles) tados kilómetro (Nuevos<br />
(Miles) (Miles) pesos)<br />
1989 31 16 NO 533 6332 11.9 3991 226<br />
1990 31 16 485 574 21 173 13.4 12861 039<br />
1991 31 16 487 1 661 23319 14.0 14606666<br />
Trolebús<br />
CUADRO 14.40<br />
12' parte y última)<br />
Líneas en Longitud en Unida<strong>de</strong>s en Carro-día Kilómetros Pasajeros Pasajeros Ingresos<br />
Año serVICIO serVICIO operación recorridos transpor- por por pasaje<br />
(Kilómetro) (Miles) tados kilómetro (Nuevos<br />
(Miles) (Miles) pesos)<br />
1980 78 29 62 3068 19689 6.4 41 873<br />
1981 2 77 31 76 3282 26878 8.2 42884<br />
1982 74 37 130 4199 42 ó36 10.1 78954<br />
1983 4 112 68 151 6236 41 644 6.7 358236<br />
1984 4 112 70 135 6752 40705 6.0 567 221<br />
1985 5 115 64 123 6730 35097 5.2 703 656<br />
1986 5 115 ND NO 10077 34383 3.4 614556<br />
1987 5 115 NO NO 10226 39771 3.8 8362341<br />
1988 4 94 NO NO 9136 36909 4.0 7 346 606<br />
1989 4 93 37 NO 6 157 31 565 5.1 6561366<br />
1990 4 93 53 608 3307 29347 7.9 9005465<br />
1991 4 93 53 612 3131 25048 8.0 10060508<br />
al IniCió sus operaciones en septiembre <strong>de</strong> 19S9.<br />
FUENTE: Instituto Nocional <strong>de</strong> Estadística. Geografía e Informtitica. con base en cifras <strong>de</strong>l Sistema <strong>de</strong> Transporte<br />
Electrico. Dirección <strong>de</strong> Administración y Finanzas y Sistemas <strong>de</strong> Transporte Colec'[ivo <strong>de</strong> la Zona<br />
Metropolitana <strong>de</strong> Guadalajara. Gerencia <strong>de</strong> Administración y Finanzas.<br />
349 INEGI. <strong>Anuario</strong> <strong>Estadístico</strong> <strong>de</strong> <strong>los</strong> <strong>Estados</strong> <strong>Unidos</strong> <strong>Mexicanos</strong>. <strong>1992</strong>
CAPITULO 15<br />
FINANZAS<br />
INEGI. <strong>Anuario</strong> <strong>Estadístico</strong> <strong>de</strong> <strong>los</strong> <strong>Estados</strong> <strong>Unidos</strong> <strong>Mexicanos</strong>. <strong>1992</strong>
CAPITULO lS<br />
FINANZAS<br />
Dura"te la <strong>de</strong>cltda <strong>de</strong> lo. ochentas l e t ullO una importante .ctividad IInancler • . En ella<br />
Ifmt'do. las medida. <strong>de</strong> jlolltica ecooómica ,mjllementadas por el Gobierno le vieron<br />
,eflejada. en el <strong>de</strong>unollo <strong>de</strong> 101 mercltdOI financiero •.<br />
En particular. las te .. , <strong>de</strong> Inte,6, fueron un,ible' a la politica <strong>de</strong> ....... miento financiero<br />
<strong>de</strong>l l ector público. a l. di sciplina monet.ria y .1 comb.te a la infla-ción. mostrando a p.rtir<br />
<strong>de</strong> , 988. un luerte <strong>de</strong>'cenl O.<br />
P.r. Integ'al el p'esente capitulo le contó con Inlormación <strong>de</strong> l. Casa <strong>de</strong> Moneda <strong>de</strong><br />
M';xico. <strong>de</strong>l aanco da M6xico. <strong>de</strong> Nacional Financiera. dal Na-cional Monte <strong>de</strong> Piedad.<br />
<strong>de</strong> l. Comi.ión Na-cional 8aneari. y <strong>de</strong> Segurol. y d e la Bol .. Muicana <strong>de</strong> Valore •.<br />
Cit, .. lobre tasas <strong>de</strong>l mercado <strong>de</strong> dinero. agreg.dos mo"elariol. primas da segu,ol.<br />
tipoI <strong>de</strong> cambio. entre OUU le incluyen e" esta l ección.<br />
CERTIFICADOS DE LA TESORERIA DE LA FEDERA CION<br />
¡PLAZO A 91 Ol AS1<br />
IPoreanl.¡'1<br />
1980 1981 11182 1983 1984 1996 In6 11181 1988 \&89 lnO 1&&1 19&2<br />
INEGI. <strong>Anuario</strong> <strong>Estadístico</strong> <strong>de</strong> <strong>los</strong> <strong>Estados</strong> <strong>Unidos</strong> <strong>Mexicanos</strong>. <strong>1992</strong><br />
353
INEGI. <strong>Anuario</strong> <strong>Estadístico</strong> <strong>de</strong> <strong>los</strong> <strong>Estados</strong> <strong>Unidos</strong> <strong>Mexicanos</strong>. <strong>1992</strong><br />
ACUÑACION DE MONEDA METALlCA CUADRO 15.1<br />
1980-92 (1' parte)<br />
Total Acero inoxidable<br />
Piezas Pesos Piezas Pesos<br />
Año IMiles) (Millones IMiles) (Millones<br />
1980 1 369000<br />
1981 1 476000<br />
1982 1 194000<br />
1983 669000<br />
1984 1 460000<br />
1986 2233000<br />
<strong>de</strong> nuevos <strong>de</strong> nuevos<br />
pesos) pesos)<br />
1986 1 306600 31 701 132100 4661<br />
1987 1 191900 120710 666000 3300<br />
1988 2308000 671 779 863670 22668<br />
1989 1016213 268 237 338263 3383<br />
1990 704020 87312 281 000 10010<br />
1991 303 144 124 233<br />
<strong>1992</strong> 466 227 124654 84619 4231<br />
CUADRO 15.1<br />
(2' parte y última)<br />
Cuproníquel Bronce al aluminio<br />
Piezas Pesos Piezas Pesos<br />
Año IM.les} (MIllones (MIles) (Millones<br />
1980<br />
1981<br />
1982<br />
1983<br />
1984<br />
1986<br />
<strong>de</strong> nuevos <strong>de</strong> nuevos<br />
pesos) pesos)<br />
1986 120000 22600 63400 4640<br />
1987 390000 100600 246900 16910<br />
1988 360 192 369010 1 094238 280101<br />
1989 40000 20000 636950 234 866<br />
1990 423020 77302<br />
1991 303 144 124233<br />
<strong>1992</strong> 20000 10000 361 608 110423<br />
FUENTE: Casa <strong>de</strong> Moneda <strong>de</strong> México.<br />
354
AGREGADOS MONETARIOS al CUADRO 15.2<br />
1980-92 11" parte)<br />
IMillones <strong>de</strong> nuevos pesos)<br />
M1 M2<br />
M1 Billetes Cuenta M21M1 Instrume'ntos bancanos a<br />
<strong>de</strong> + Instru- corto plazo<br />
Monedas cheques mentas Total lnstru- Acepta-<br />
Año nacional y bancanos mentas Clones<br />
extranjera a corto con ven- bancarias<br />
plazo) cimiento<br />
hasta un<br />
año <strong>de</strong><br />
plazo<br />
1980 492 195 297 1 246 754<br />
1981 656 282 374 1 907 1 251<br />
1982 1010 503 507 3264 2254<br />
1983 1430 678 752 5276 3846<br />
1984 2 321 119 1 202 8971 6650 6444 206<br />
1985 3570 1 732 1 839 13128 9558 8976 583<br />
1986 6 145 3059 3085 25525 19380 16704 2676<br />
1987 14 116 7318 6798 61 505 47 389 42514 4875<br />
1988 22312 13159 9 153 87454 65142 29410 35732<br />
1989 31 392 17992 13400 125030 93638 64150 29488<br />
1990 51048 24603 26445 182779 131 731 122 582 9149<br />
1991 112 183 32416 79768 269 120 156 937 148358 8579<br />
<strong>1992</strong> 131 221 38044 93177 324 287 193066 177 357 15708<br />
M3 M4<br />
CUAORO 15.2<br />
12" parte y última)<br />
M31M2 lnstru- M41M3 Instrumentos a larQo plazo I Flcorca<br />
+ Instru- mentos Instru- Total Instru- Instru- Flcorca<br />
Año mentes mentos a mentas mentas<br />
bancanos largo bancarios no<br />
bancariOs a corto plazo -+ B largo bancarios<br />
a corto plazo Flcorca) plazo a largo<br />
plazo) plazo<br />
1980 1 285 39 1 399 114<br />
1981 1 975 68 2076 101<br />
1982 3526 262 3649 122<br />
1983 5691 416 6096 404<br />
1984 9695 724 10390 694 134 291 270<br />
1985 14222 1094 15789 1 567 288 562 718<br />
1986 28472 2947 32638 4166 691 1 497 1 977<br />
1987 73869 12364 84529 10660 2028 3426 5206<br />
1988 122 247 34792 134317 12071 25"10 2357 7 204<br />
1989 182721 57 691 202 539 19818 5782 6336 7 699<br />
1990 258 030 75 251 296 419 38390 11 573 18238 8578<br />
1991 318 223 49103 387 982 69759 20971 44 101 4687<br />
<strong>1992</strong> 376 428 52 141 466 112 89684 30663 53522<br />
NOTA: Las suma <strong>de</strong> <strong>los</strong> parCiales pue<strong>de</strong> no COinCidir con el total, <strong>de</strong>bido al redon<strong>de</strong>o.<br />
A partn <strong>de</strong>l mes <strong>de</strong> mayo <strong>de</strong> <strong>1992</strong>, se Incluyen <strong>los</strong> <strong>de</strong>pÓSitos <strong>de</strong>l Sistema <strong>de</strong> Ahorro para el Retiro (SARl como<br />
un componente rnás <strong>de</strong> <strong>los</strong> agregados monetarios. Debido a que alguna pElfte <strong>de</strong> dichos <strong>de</strong>pÓSitos se ha<br />
<strong>de</strong>stinado a la adquisIción <strong>de</strong> valores <strong>de</strong>l gobierno, <strong>los</strong> cuales ya están en <strong>los</strong> referidos agregados, a fin <strong>de</strong><br />
eVltar duplicaciones el saldo neto <strong>de</strong> éstos excluye dlcha inverSión.<br />
Estas cifras por <strong>los</strong> procedrrnlentos <strong>de</strong> elaboraCión, están sujetas a cambiOS ulteriores, en particular <strong>los</strong> más<br />
recientes.<br />
al Saldos COrrientes al final <strong>de</strong> cada periodo.<br />
FUENTE: Banco <strong>de</strong> MéXICO. DireCCión <strong>de</strong> Investigación Económica.<br />
355 INEGI. <strong>Anuario</strong> <strong>Estadístico</strong> <strong>de</strong> <strong>los</strong> <strong>Estados</strong> <strong>Unidos</strong> <strong>Mexicanos</strong>. <strong>1992</strong>
INEGI. <strong>Anuario</strong> <strong>Estadístico</strong> <strong>de</strong> <strong>los</strong> <strong>Estados</strong> <strong>Unidos</strong> <strong>Mexicanos</strong>. <strong>1992</strong><br />
usos y FUENTES DE LA BASE MONETARIA al CUADRO 15.3<br />
1980-92<br />
(Millones <strong>de</strong> nuevos pesos)<br />
(1' parte)<br />
Base Usos Fuentes<br />
monetaria Silletes Depósitos bancarios b/ Activos Financiamien-<br />
Total De la De la Interna- to neto al<br />
Año monedas banca banca clonales sector público<br />
en po<strong>de</strong>r <strong>de</strong> comer- Total<br />
<strong>de</strong>l <strong>de</strong>sa- cial<br />
público rrollo<br />
1980 718 195 523 22 502 93 559<br />
1981 1042 282 760 37 723 132 828<br />
1982 1 983 503 1480 48 1432 176 1 990<br />
1983 3136 678 2458 66 2392 708 2980<br />
1984 4858 1 119 3739 119 3619 1561 3746<br />
1985 5745 1 732 4013 178 3835 2138 5735<br />
1986 8636 3059 6476 409 6067 6214 9863<br />
1987 14764 7318 7436 860 6686 30306 9866<br />
1988 20751 13159 7692 902 6689 16027 31466<br />
1989 22960 17992 4968 817 4162 18116 38063<br />
1990 31 134 24603 6632 988 6643 30260 40070<br />
1991 39797 32416 7381 1038 6342 55670 21413<br />
<strong>1992</strong> 46636 38044 7492 1 603 6889 69992 16460<br />
Fuentes<br />
CUADRO 15.3<br />
(2' parte y última)<br />
Financlsmlen- Posición<br />
to neto al Financiamiento a intermediarios neta <strong>de</strong><br />
Año sector público financieros otros<br />
GobIerno Organis- Total Banca Banca Fi<strong>de</strong>ico- concep-<br />
Fe<strong>de</strong>ral mas y <strong>de</strong> comer- mlsos tos<br />
empresas <strong>de</strong>s a- cial oficiales<br />
1980 674 -15 69 27 13 29 -4<br />
1981 861 -23 83 34 9 40 ·1<br />
1982 2039 -48 381 67 229 85 -664<br />
1983 3178 -198 103 67 48 -12 ·666<br />
1984 4121 -376 97 126 60 -77 -646<br />
1986 6300 -665 -312 71 43 -426 -1816<br />
1986 10236 -372 -1400 94 49 -1643 -6141<br />
1987 11 216 -1360 -4166 126 46 -4338 -21 262<br />
1988 32667 -1 193 -4476 863 163 -6493 -21266<br />
1989 38696 -643 -4618 142 22 -4682 -28691<br />
1990 40904 -834 -2370 668 37 -2966 -36826<br />
1991 21 797 -383 6604 1223 34 4247 -42692<br />
<strong>1992</strong> 16978 -628 13656 2404 13 11 139 -43462<br />
NOTA: La suma <strong>de</strong> <strong>los</strong> parciales pu<strong>de</strong> no coincidir con el total <strong>de</strong>bido al redon<strong>de</strong>o.<br />
Estas cifras por <strong>los</strong> procedimientos <strong>de</strong> elaboración, están sujetas a cambios ulteriores, en particular las más<br />
recientes.<br />
a/ Saldos corrientes al final <strong>de</strong>l periodo.<br />
b/ Excluye <strong>los</strong> <strong>de</strong>pósitos <strong>de</strong>l Programa Especial y Depósitos Especiales.<br />
FUENTE: Banco <strong>de</strong> Mé)(ico. Dirección <strong>de</strong> Investigación Económica.<br />
356<br />
rrollo
INEGI. <strong>Anuario</strong> <strong>Estadístico</strong> <strong>de</strong> <strong>los</strong> <strong>Estados</strong> <strong>Unidos</strong> <strong>Mexicanos</strong>. <strong>1992</strong><br />
RECURSOS Y OBLIGACIONES DE LA BANCA COMERCIAL al CUADRO 15.6<br />
1980-92<br />
(Millones <strong>de</strong> nuevos pesos)<br />
(1" parte)<br />
Recursos<br />
Total Dlspo- lnver- Crédito Otros<br />
Año nibles Slones recursos<br />
valores<br />
1980 1433 681 60 761 41<br />
1981 2118 824 103 116 76<br />
1982 3973 1694 191 1996 192<br />
1983 6689 2966 261 3369 304<br />
1984 10611 4098 257 6722 436<br />
1985 16330 4289 1 226 9997 818<br />
1986 33636 630.1 4234 21 172 1 927<br />
1987 78666 9489 11 274 63070 4734<br />
1988 105460 10915 24 173 64864 6608<br />
1989 166 854 10166 33762 104092 7845<br />
1990 238 261 12267 47634 164 726 13724<br />
1991 367 653 14446 86297 249 803 18108<br />
<strong>1992</strong> 463544 13966 60378 354 707 24494<br />
CUADRO 15.6<br />
(2" parte y última)<br />
Obligaciones<br />
Total PasIvos PasIvos Otros Capital,<br />
Año mone- no concep- reservas<br />
tarJos mane- tos<br />
tanos <strong>de</strong> resul-<br />
pasIvo tados<br />
1980 1433 260 1099 36 39<br />
1981 2 118 316 1706 43 63<br />
1982 3973 469 3318 118 68<br />
1983 6589 696 5672 226 96<br />
1984 10611 1 106 8912 330 163<br />
1986 16330 1643 13711 696 281<br />
1986 33636 2634 29146 1 324 632<br />
1987 78566 6060 68303 3098 2106<br />
1988 106460 7384 87889 6103 4084<br />
1989 166864 10498 130012 9303 6041<br />
1990 238 261 22466 192497 14358 8931<br />
1991 367 653 73291 261 068 20842 12462<br />
<strong>1992</strong> 463 644 82889 323 163 28756 18737<br />
NOTA: La suma <strong>de</strong> <strong>los</strong> parciales pue<strong>de</strong> no coincidir con el total <strong>de</strong>bIdo al redon<strong>de</strong>o.<br />
A nivel <strong>de</strong> bancos se incluyen las operaciones practicadas con todo tipo <strong>de</strong> banca.<br />
Elaboraciones con base en el resumen <strong>de</strong> <strong>los</strong> estados analíticos que se reciben <strong>de</strong> cada Institución <strong>de</strong> crédito.<br />
Estas cifras por las procedimientos <strong>de</strong> elaboración, están sujetas a cambios ulteriores, en particular las más<br />
recientes.<br />
al Saldos corrientes al final <strong>de</strong>l penodo.<br />
FUENTE: Banco <strong>de</strong> MéXICO. DireCCión <strong>de</strong> Investigación Económica.<br />
358
PASIVOS DEL SISTEMA BANCARIO CONSOLIDADO al<br />
1980-92<br />
(Millones <strong>de</strong> nuevos pesos)<br />
Tota! <strong>de</strong> Moneda Nacional<br />
pasIvos Total Internos<br />
Año Total Captación Obllg8-<br />
clones<br />
diversas<br />
1980 2192 1 427 1416 1 135 250<br />
1981 3296 2025 1 999 1593 349<br />
1982 7498 4048 3908 3126 719<br />
1983 12067 6721 6483 5 139 263<br />
1984 18614 11 265 10726 8587 2025<br />
1985 31 963 17 623 16477 12 175 40Ei5<br />
1986 70913 34332 30612 21 485 8696<br />
1987 176 117 82919 71 405 51007 19471<br />
1988 216919 113013 101 650 44352 54147<br />
1989 275 595 154 292 140 465 88470 45376<br />
1990 351 690 221474 201 872 163 395 3001,9<br />
1991 466 323 310 739 289 490 245 390 33983<br />
<strong>1992</strong> 545 104 379378 360480 301 378 50374<br />
Moneda Extranjera<br />
Total Internos<br />
Año Total Captación OblIQa-<br />
Clones<br />
diversas<br />
1980 765 251 188 63<br />
1981 271 381 332 49<br />
1982 3450 248 137 111<br />
1983 6347 374 92 281<br />
1984 7348 643 162 482<br />
1985 14340 235 444 791<br />
1986 36580 2852 532 3:'0<br />
1987 93198 10294 5886 4408<br />
1988 103 906 17 694 6327 11 366<br />
1989 121 304 21 829 9446 12381<br />
1990 130216 23830 10321 13506<br />
1991 155 584 22 729 11 912 10814<br />
<strong>1992</strong> 165 726 20 151 12901 7 250<br />
NOTA: La suma <strong>de</strong> <strong>los</strong> parciales pue<strong>de</strong> no cOincidir con el total <strong>de</strong>bido al redon<strong>de</strong>o.<br />
En el Sistema Bancario Consolidado se excluyen las operaciones Interbancanas.<br />
Capital<br />
CUADRO 15.7<br />
(1· parte)<br />
Excluye otros conceptos <strong>de</strong> pasIvo, reservas <strong>de</strong> capital y resultados.<br />
ElaboraclOnes <strong>de</strong>rivadas <strong>de</strong> las estadísticas <strong>de</strong> recursos y obligacIOnes.<br />
Estas cifras por <strong>los</strong> procedimientos <strong>de</strong> elaboración, están sUjetas a cambios ulteriores, en particular las más<br />
reCientes.<br />
al Saldos comentes al fInal <strong>de</strong>l penado.<br />
FUENTE: Banco <strong>de</strong> MéXICO. DireCCión <strong>de</strong> Investigación Económica.<br />
Externos<br />
31 12<br />
57 26<br />
63 140<br />
81 237<br />
114 539<br />
247 146<br />
431 3721<br />
928 11 514<br />
3150 11 364<br />
6618 13827<br />
8408 19601<br />
10117 21 248<br />
8729 18898<br />
CUADRO 15.7<br />
12" parte y última)<br />
Capital<br />
<strong>1992</strong><br />
Externos<br />
514 <strong>Mexicanos</strong>.<br />
890<br />
3202<br />
4973 <strong>Unidos</strong><br />
6704<br />
13105<br />
33728<br />
<strong>Estados</strong><br />
82904<br />
86212 <strong>los</strong><br />
99474<br />
<strong>de</strong><br />
106 386<br />
132 855<br />
145575<br />
<strong>Estadístico</strong> <strong>Anuario</strong><br />
359 INEGI.
INEGI. <strong>Anuario</strong> <strong>Estadístico</strong> <strong>de</strong> <strong>los</strong> <strong>Estados</strong> <strong>Unidos</strong> <strong>Mexicanos</strong>. <strong>1992</strong><br />
PASIVOS DEL BANCO DE MEXICO al<br />
1980-92<br />
(Millones <strong>de</strong> nuevos pesos)<br />
Año<br />
Total <strong>de</strong><br />
pasivos Total<br />
1980 766 601<br />
1981 1098 847<br />
1982 2326 2236<br />
1983 3929 3756<br />
1984 6222 6884<br />
1986 8622 8062<br />
1986 16661 14947<br />
1967 34916 32 219<br />
1968 41639 34346<br />
1989 46863 36066<br />
1990 62786 62209<br />
1991 70027 63042<br />
<strong>1992</strong> 71 140 67243<br />
Moneda Nacional<br />
Internos<br />
Total Pasivos<br />
moneta-<br />
ríos<br />
601 212<br />
847 306<br />
2136 637<br />
3667 724<br />
6418 1 192<br />
6977 1888<br />
11318 3366<br />
20906 6066<br />
23332 14622<br />
24460 19660<br />
33039 27078<br />
42286 36 172<br />
48663 42016<br />
Moneda Nacional Moneda Extranjera<br />
Año Internos Externos Total<br />
Capital<br />
1980 164<br />
1981 260<br />
1982 101 91<br />
1983 189 173<br />
1984 466 338<br />
1986 48 1065 460<br />
1986 48 3630 613<br />
1987 46 11 311 2697<br />
1988 48 11014 7293<br />
1989 46 13596 8798<br />
1990 48 19170 10 676<br />
1991 48 20767 6986<br />
<strong>1992</strong> 66 18660 3897<br />
Internos<br />
CUADROS 15.B<br />
(1" parte)<br />
Obllga-<br />
ciones<br />
diversas<br />
389<br />
641<br />
1698<br />
2843<br />
4226<br />
6041<br />
7666<br />
12796<br />
8762<br />
4762<br />
6913<br />
6066<br />
6613<br />
CUADROS 15.8<br />
(2" parte y última)<br />
NOTA: La suma <strong>de</strong> <strong>los</strong> parciales pue<strong>de</strong> no coincidir con el total <strong>de</strong>bido al redon<strong>de</strong>o.<br />
Excluye otros conceptos <strong>de</strong> pasivo, reservas <strong>de</strong> capital y resultados.<br />
Elaboraciones <strong>de</strong>rivadas <strong>de</strong> las estadísticas <strong>de</strong> recursos y obligaciones.<br />
Estas cifras por <strong>los</strong> procedimientos <strong>de</strong> elaboración, están sujetas a cambios ulteriores, en particular las más<br />
recientes.<br />
a/ Saldos corrientes al final <strong>de</strong>l periodo.<br />
FUENTE: Banco <strong>de</strong> MéXICO. DireCCión <strong>de</strong> Investigación EcOnÓrTIlC8.<br />
360<br />
164<br />
249<br />
84<br />
166<br />
337<br />
468<br />
610<br />
2667<br />
6960<br />
7742<br />
9726<br />
6749<br />
2309<br />
Externos<br />
7<br />
2<br />
4<br />
10<br />
313<br />
1066<br />
646<br />
1236<br />
1667
PASIVOS DE LA BANCA DE DESARROLLO al CUADRO 15.9<br />
1980-92 (1' parte)<br />
(Millones <strong>de</strong> nuevos pesos)<br />
Total <strong>de</strong> Moneda Nacional<br />
pasivos Total Internos<br />
Total Captación<br />
Total Pasivos Instru- Menos<br />
Año mentas opera-<br />
taf<strong>los</strong> <strong>de</strong> clones<br />
ahorro con el<br />
exterior<br />
1980 726 296 294 124 8 116<br />
1981 1093 415 414 168 14 154<br />
1982 3334 887 885 294 21 276 3<br />
1983 4919 1 324 1 323 532 29 505 1<br />
1984 6889 1 913 1 908 821 63 764 6<br />
1985 13238 3026 3021 144 83 1066 5<br />
1986 31 513 4729 4720 877 92 1 795 9<br />
1987 80356 9963 9944 4268 172 4114 18<br />
1988 92164 21044 20932 7567 268 7412 112<br />
1989 98675 20520 20519 2867 353 2515<br />
1990 90835 22034 22032 6285 447 5839<br />
1991 103 960 25981 25979 9646 1092 8554<br />
<strong>1992</strong> 121 966 34510 34508 10859 1 162 9697<br />
Moneda Nacional Moneda Extranjera<br />
CUADRO 15.9<br />
(2' parte y última)<br />
Internos Externos Total Internos Externos<br />
Obllga- Capital Total Captación Obllga-<br />
Año clones (1nstru- ciones<br />
diversas mentas diversas<br />
<strong>de</strong> ahorro)<br />
1980 160 10 2 430 91 17 75 339<br />
1981 215 32 679 86 29 59 592<br />
1982 556 34 3 2447 141 27 116 2306<br />
1983 743 47 3595 157 35 122 3438<br />
1984 1011 76 6 4976 237 80 158 4739<br />
1985 1 725 153 5 10212 603 232 371 9609<br />
1986 2519 324 9 26784 134 570 601 25650<br />
1987 4927 749 18 70393 3328 775 1554 67065<br />
1988 10504 2860 112 71 120 4662 1 790 2872 66458<br />
1989 11481 6 171 2 78155 6264 2162 3102 72890<br />
1990 8155 7592 1 68802 5163 2644 2509 63649<br />
1991 7 839 8495 2 77 979 5266 2790 2476 72713<br />
<strong>1992</strong> 17623 6026 2 87456 5646 3044 2603 81 809<br />
NOTA: La suma <strong>de</strong> <strong>los</strong> parciales pue<strong>de</strong> no coincidir con el total <strong>de</strong>bido al redon<strong>de</strong>o.<br />
Excluye otros conceptos <strong>de</strong> paSIVO, reservas <strong>de</strong> capital y resultados.<br />
Excluye las operaciones practicadas en el mismo tipO <strong>de</strong> banca.<br />
Estas cifras pOr <strong>los</strong> procedimientos <strong>de</strong> elaboración, están sUJetas a cambios ulteriores, en partIcular las más<br />
reCIentes.<br />
a/ Saldos corrientes al final <strong>de</strong>l periodo.<br />
FUENTE: Banco <strong>de</strong> México. DireCCión <strong>de</strong> InvestIgación Económica.<br />
361 INEGI. <strong>Anuario</strong> <strong>Estadístico</strong> <strong>de</strong> <strong>los</strong> <strong>Estados</strong> <strong>Unidos</strong> <strong>Mexicanos</strong>. <strong>1992</strong>
FINANCIAMIENTO OTORGADO POR EL SISTEMA BANCARIO<br />
CONSOLIDADO a/<br />
1980-92<br />
(Millones <strong>de</strong> nuevos pesos)<br />
Año<br />
1980<br />
1981<br />
1982<br />
1983<br />
1984<br />
1986<br />
1986<br />
1987<br />
1988<br />
1989<br />
1990<br />
1991<br />
<strong>1992</strong><br />
Año<br />
1980<br />
1981<br />
1982<br />
1983<br />
1984<br />
1985<br />
1986<br />
1987<br />
1988<br />
1989<br />
1990<br />
1991<br />
<strong>1992</strong><br />
Total<br />
1 987<br />
2995<br />
6 787<br />
10 472<br />
16646<br />
27862<br />
60101<br />
138 266<br />
196674<br />
267 341<br />
332863<br />
430 213<br />
625416<br />
Total<br />
1 470<br />
1 984<br />
3788<br />
6816<br />
9412<br />
16462<br />
28200<br />
63946<br />
113228<br />
169 283<br />
219962<br />
299 677<br />
378 170<br />
Total<br />
517<br />
1011<br />
2999<br />
4656<br />
6133<br />
12401<br />
31 901<br />
74311<br />
82346<br />
98058<br />
112912<br />
130637<br />
147 246<br />
Total<br />
1466<br />
1 977<br />
3784<br />
5809<br />
9406<br />
16468<br />
28189<br />
63942<br />
113226<br />
159206<br />
219772<br />
299675<br />
378 170<br />
Total<br />
473<br />
921<br />
2919<br />
4417<br />
6778<br />
11 673<br />
30098<br />
68696<br />
78026<br />
93416<br />
106021<br />
120899<br />
134666<br />
Moneda Nacional<br />
Interno<br />
Otros A sectores<br />
Interme- no<br />
diarios financieros<br />
financieros<br />
53 1 398<br />
73 1 886<br />
135 3620<br />
194 6633<br />
281 9006<br />
384 14882<br />
641 27079<br />
676 60899<br />
3182 106461<br />
5559 148845<br />
14096 197 947<br />
26006 264411<br />
36348 327 141<br />
Moneda Extranjera<br />
Interno<br />
Otros A sectores<br />
Interme- no<br />
dlanos financieros<br />
financieros<br />
29 444<br />
20 901<br />
61 2858<br />
91 4320<br />
163 5622<br />
349 11 307<br />
872 29 171<br />
2660 66821<br />
2651 76 226<br />
2878 90269<br />
2713 102 930<br />
4378 116357<br />
5866 128 487<br />
No<br />
sectonzado<br />
CUADRO 15.11<br />
(1" parte)<br />
NOT A: La suma <strong>de</strong> <strong>los</strong> parciales pue<strong>de</strong> no comcldlr con el total <strong>de</strong>bido al redon<strong>de</strong>o.<br />
En el sistema Bancano Consolidado se excluyen las operaciones InterbanC8r1as.<br />
Se Incluye el financiamiento canalizado por <strong>los</strong> bancos a través <strong>de</strong> valores, <strong>de</strong> crédlla y cartera <strong>de</strong> crédito<br />
cedida en re<strong>de</strong>scuento.<br />
Excluye las operaciones practicadas en el mismo tIpO <strong>de</strong> banca.<br />
Estas cifras por <strong>los</strong> procedlmiento5 <strong>de</strong> elaboración, están SUjetas a cambios ulteriores, en partlcular las más<br />
reCientes.<br />
al Saldos comentes al final <strong>de</strong>l periodo.<br />
FUENTE: Banco <strong>de</strong> MéxIco. DireCCión <strong>de</strong> InvestigacIón Económica.<br />
Externo<br />
16 4<br />
17 7<br />
29 4<br />
82<br />
119<br />
192 4<br />
469 11<br />
1 368 3<br />
3683 2<br />
4802 77<br />
7 730 180<br />
10158<br />
14681<br />
CUADRO 15.11<br />
(2" parte y última)<br />
No<br />
sectorizado<br />
Externo<br />
44<br />
90<br />
1 80<br />
5 239<br />
3 356<br />
17 727<br />
55 1 803<br />
124 5716<br />
148 4321<br />
269 4643<br />
379 6890<br />
164 9737<br />
314 12580<br />
363 INEGI. <strong>Anuario</strong> <strong>Estadístico</strong> <strong>de</strong> <strong>los</strong> <strong>Estados</strong> <strong>Unidos</strong> <strong>Mexicanos</strong>. <strong>1992</strong>
INEGI. <strong>Anuario</strong> <strong>Estadístico</strong> <strong>de</strong> <strong>los</strong> <strong>Estados</strong> <strong>Unidos</strong> <strong>Mexicanos</strong>. <strong>1992</strong><br />
FINANCIAMIENTO OTORGADO POR EL BANCO DE MEXICO al<br />
1980-92<br />
(Millones <strong>de</strong> nuevos pesos)<br />
Año<br />
1980<br />
1981<br />
1982<br />
1983<br />
1984<br />
1986<br />
1986<br />
1987<br />
1988<br />
1989<br />
1990<br />
1991<br />
<strong>1992</strong><br />
Total<br />
669<br />
961<br />
2461<br />
3484<br />
4666<br />
6821<br />
11 097<br />
12912<br />
36069<br />
42776<br />
48207<br />
34069<br />
34432<br />
Total<br />
644<br />
714<br />
1828<br />
3066<br />
4261<br />
6106<br />
9363<br />
16202<br />
33062<br />
38632<br />
41831<br />
36610<br />
36813<br />
Moneda Nacional<br />
A interme<br />
diarios<br />
financieros<br />
66<br />
67<br />
187<br />
240<br />
372<br />
402<br />
667<br />
1036<br />
2746<br />
3277<br />
6368<br />
11 131<br />
16772<br />
A sectores<br />
no finan<br />
CIeros<br />
489<br />
647<br />
1639<br />
2826<br />
3879<br />
6703<br />
8797<br />
14167<br />
30317<br />
36266<br />
36463<br />
24379<br />
19042<br />
Total<br />
114<br />
237<br />
633<br />
419<br />
316<br />
716<br />
1 734<br />
-2290<br />
2997<br />
4243<br />
6376<br />
-1461<br />
-1 382<br />
Moneda Extranjera<br />
CUADRO 15.12<br />
Interno Externo<br />
112 2<br />
234 3<br />
618 16<br />
394 26<br />
277 38<br />
636 80<br />
1611 223<br />
-2839 660<br />
2466 631<br />
3616 628<br />
6666 719<br />
-2214 763<br />
-2330 948<br />
NOTA: La suma <strong>de</strong> <strong>los</strong> parciales pue<strong>de</strong> no coincidir con el total <strong>de</strong>bido al redon<strong>de</strong>o.<br />
Se incluye el financiamiento canalizado por <strong>los</strong> bancos a través <strong>de</strong> valores, <strong>de</strong> crédito y cartera <strong>de</strong> crédito<br />
cedida en re<strong>de</strong>scuento.<br />
Elaboraciones <strong>de</strong>rivadas <strong>de</strong> las estadístIcas <strong>de</strong> recursos y obligaciones.<br />
Estas cifras por <strong>los</strong> procedimientos <strong>de</strong> elaboración, están sujetas a cambios ulteriores, en particular las más<br />
recientes.<br />
al Saldos corrientes al final <strong>de</strong>l penodo.<br />
FUENTE: Banco <strong>de</strong> México. Dirección <strong>de</strong> Investigación Económica.<br />
FINANCIAMIENTO OTORGADO POR LA BANCA DE DESARROllO al CUADRO 15.13<br />
1980-92<br />
(Millones <strong>de</strong> nuevos pesos)<br />
Año Total Moneda Nacional Moneda Extranjera<br />
Total Interno Externo Total Interno Externo<br />
1980 626 372 371 254 261 3<br />
1981 962 482 482 470 467 3<br />
1982 2675 896 895 1 679 1 674 6<br />
1983 3787 1 100 1099 1 2687 2670 17<br />
1984 6649 1813 1809 4 3736 3695 42<br />
1986 10493 2666 2666 7837 7771 66<br />
1986 26160 4263 4246 20907 20689 317<br />
1987 66344 9349 9349 66996 66476 621<br />
1988 76638 20793 20793 66746 66040 706<br />
1989 83663 21698 21698 61966 61 100 866<br />
1990 86926 24446 24446 62480 61 678 802<br />
1991 99016 29388 29388 69627 68450 1 177<br />
<strong>1992</strong> 122966 41032 41032 81933 79748 2186<br />
NOTA; La suma <strong>de</strong> <strong>los</strong> parCiales pue<strong>de</strong> no coincidir con el total <strong>de</strong>bido al redon<strong>de</strong>o.<br />
Se incluye el financiamiento canalizado por 10$ bancos a través <strong>de</strong> valores, <strong>de</strong> crédito y cartera <strong>de</strong> crédito<br />
cedida en re<strong>de</strong>scuento.<br />
Excluye las operaciones practicadas en el mismo tipo <strong>de</strong> banca.<br />
Estas cifras por <strong>los</strong> procedimientos <strong>de</strong> elaboración, están sujetas a cambios ulteriores, en particular las más<br />
recientes.<br />
al Saldos corrientes al fina/ <strong>de</strong>l periodo.<br />
FUENTE: Banco <strong>de</strong> México. Dirección <strong>de</strong> Investigación Económica.<br />
364
FINANCIAMIENTO OTORGADO POR LA BANCA COMERCIAL al<br />
1980-92<br />
(Millones <strong>de</strong> nuevos pesos)<br />
Año<br />
1980<br />
1981<br />
1982<br />
1983<br />
1984<br />
1985<br />
1986<br />
1987<br />
1988<br />
1989<br />
1990<br />
1991<br />
<strong>1992</strong><br />
Total<br />
788<br />
198<br />
2168<br />
3583<br />
5939<br />
11 176<br />
25299<br />
63769<br />
88275<br />
137093<br />
210048<br />
318263<br />
396345<br />
Moneda NacIonal<br />
Total Interno<br />
601 598<br />
847 840<br />
1 220 1 217<br />
1920 1 905<br />
3723 3720<br />
7099 7096<br />
15473 15469<br />
41970 41967<br />
62748 62746<br />
101969 101 893<br />
159051 158871<br />
246 351 246 350<br />
314276 314276<br />
CUADRO 15.14<br />
(1" parte)<br />
Externo<br />
CUADRO 15.14<br />
(2" parte y última)<br />
<strong>1992</strong><br />
Año<br />
Moneda ExtranJera<br />
Total Interno<br />
Externo<br />
1980<br />
187 148<br />
39<br />
1981<br />
351 267<br />
84<br />
1982<br />
949 889<br />
60 <strong>Mexicanos</strong>.<br />
1983<br />
1 672 1476<br />
197<br />
1984<br />
2216 1941<br />
276<br />
<strong>Unidos</strong><br />
1985<br />
4077 3496<br />
581<br />
1986<br />
9826 8564<br />
1262<br />
1987<br />
21 799 17 153<br />
4645 <strong>Estados</strong><br />
1988<br />
25527 22443<br />
3085<br />
<strong>los</strong><br />
1989<br />
35124 31 964<br />
3159<br />
<strong>de</strong><br />
1990<br />
50997 45627<br />
5370<br />
1991<br />
71 912 64 114<br />
7798<br />
<strong>1992</strong><br />
82069 72623<br />
9446<br />
NOTA: La suma <strong>de</strong> <strong>los</strong> parciales pue<strong>de</strong> no coincidir con el total <strong>de</strong>bido al redon<strong>de</strong>o.<br />
<strong>Estadístico</strong><br />
Se incluye el financiamiento canalizado por <strong>los</strong> bancos a través <strong>de</strong> valores, <strong>de</strong> crédito y cartera <strong>de</strong> crédito<br />
cedida en re<strong>de</strong>scuento.<br />
Excluye las operaciones practicadas en el mismo tipO <strong>de</strong> banca.<br />
Estas cifras por <strong>los</strong> procedimientos <strong>de</strong> elaboración, están sujetas a cambios ulteriores, en particular las más<br />
reCientes.<br />
<strong>Anuario</strong><br />
a/ Saldos corrientes al final <strong>de</strong>l periodo.<br />
FUENTE: Banco <strong>de</strong> MéxIco. Dirección <strong>de</strong> InvestigacIón Económica.<br />
365 INEGI.<br />
3<br />
3<br />
6<br />
4<br />
3<br />
4<br />
3<br />
2<br />
77<br />
180<br />
2
INEGI. <strong>Anuario</strong> <strong>Estadístico</strong> <strong>de</strong> <strong>los</strong> <strong>Estados</strong> <strong>Unidos</strong> <strong>Mexicanos</strong>. <strong>1992</strong><br />
FUENTE Y DESTINO DE RECURSOS CANALIZADOS POR NACIONAL<br />
FINANCIERA<br />
1980-91<br />
(Millones <strong>de</strong> nuevos pesos)<br />
Fuente<br />
Año Total Capital CaptacIón Financla- Obligaciones<br />
contable interna al mIento <strong>de</strong>l por aval<br />
exterior bl o endoso<br />
1980 340 68 147 68<br />
1981 416 6 114 176 64<br />
1982 926 164 623 129<br />
1983 2086 295 1262 314<br />
1984 3649 37 622 2 122 418<br />
1986 6879 66 956 4380 757<br />
1986 17002 166 760 11383 956<br />
1987 43125 340 3906 30364 4575<br />
1988 45906 898 7 147 29534 2743<br />
1989 47732 3 197 4 137 30744 2256<br />
1990 50257 2985 4574 32632 1 798<br />
1991 59338 3781 5638 36704 2714<br />
Total Ramas Industrias<br />
Año <strong>de</strong> básicas<br />
Infraes-<br />
tructura<br />
1980 340 72 161<br />
1981 416 76 189<br />
1982 926 145 361<br />
1983 2085 389 792<br />
1984 3649 731 1 348<br />
1986 6879 1676 2422<br />
1986 17002 1644 3036<br />
1987 43126 3405 10072<br />
1988 45906 3608 7004<br />
1989 47732 3841 5640<br />
1990 50257 6260 1 762<br />
1991 59338 5131 3367<br />
Destino<br />
NOTA: Saldos al 31 <strong>de</strong> diciembre <strong>de</strong> cada año<br />
e/ Incluye Aceptaciones Bancarias, Bondi y Depósitos en Garantía.<br />
b/lncluye emisiones <strong>de</strong> bonos colocados en el extranjero.<br />
e/Incluye obligaCiones subordinadas.<br />
dI Incluye Turismo, Transporte, Comunicaciones, ServIcIos FInancieros, Gobierno Fe<strong>de</strong>ral y Fondos <strong>de</strong> Fomento.<br />
f/lncluye disponibilida<strong>de</strong>s y otroS actIvos.<br />
FUENTE: Nacional Financiera S.N.C. Subdirección <strong>de</strong> ProgramacIón FInanCiera.<br />
366<br />
Otras<br />
industnas<br />
<strong>de</strong> transfor-<br />
mación<br />
61<br />
69<br />
113<br />
247<br />
438<br />
698<br />
2631<br />
3968<br />
6851<br />
5535<br />
5880<br />
6098<br />
CUADRO 15.15<br />
(1" parte)<br />
Fl<strong>de</strong>lco- Otras<br />
misas <strong>de</strong> fuentes<br />
inverSión el<br />
25 27<br />
35 22<br />
44 59<br />
80 126<br />
186 264<br />
238 482<br />
334 1424<br />
715 3226<br />
399 4186<br />
1083 6316<br />
1 574 6694<br />
2341 8260<br />
CUADRO 15.15<br />
(2" parte y última)<br />
Otras Otros<br />
activida<strong>de</strong>s usos<br />
di fl<br />
44 12<br />
67 26<br />
239 68<br />
605 162<br />
918 214<br />
1837 346<br />
9186 706<br />
24819 861<br />
27464 979<br />
29510 3206<br />
33901 3464<br />
39466 5276
INEGI. <strong>Anuario</strong> <strong>Estadístico</strong> <strong>de</strong> <strong>los</strong> <strong>Estados</strong> <strong>Unidos</strong> <strong>Mexicanos</strong>. <strong>1992</strong><br />
COLOCACION DE DEUDA INTERNA DEL SECTOR PUBLICO<br />
A TRAVES DE VALORES POR INSTRUMENTOS<br />
1980-92<br />
(Saldos corrientes en millones <strong>de</strong> nuevos pesos, valor <strong>de</strong> mercado)<br />
Total al Certificados Petrobonos Bonos <strong>de</strong><br />
<strong>de</strong> la bl Deuda<br />
Año Tesorería <strong>de</strong> Pública<br />
la Fe<strong>de</strong>raCión el<br />
al<br />
1980 618.0 64.3 13.7 660.0<br />
1981 948.3 96.6 11.9 839.9<br />
1982 2462.1 319.8 20.9 2106.2<br />
1983 3486.0 617.8 31.2 2 726.4<br />
1984 4862.7 796.2 70.0 3866.3<br />
1986 6047.0 2360.3 433.1 3114.8<br />
1986 10462.2 8148.7 886.6 1 199.0<br />
1987 31 723.3 28006.2 2668.0 341.0<br />
1988 72 971.4 41 993.9 1267.1 6996.0<br />
1989 gl 122 742.8 63973.1 866.6 6 639.6<br />
1990 161 432.8 72001.0 843.3 6604.2<br />
1991 170314.6 72 374.6<br />
<strong>1992</strong> 133403.0 69337.6<br />
Bonos <strong>de</strong> Bonos <strong>de</strong> Obligaciones<br />
Desarrollo al Recons· <strong>de</strong> Empresas<br />
Ano trucción Públicas dI<br />
Urbana fl<br />
1980<br />
1981<br />
1982 6.3<br />
1983 6.0<br />
1984 6.6<br />
1986 11.7<br />
1986 7.0 14.6<br />
1987 368.6 14.9 136.0<br />
1988 20186.7 17.6 160.4<br />
1989 gl 66676.6 18.2 193.6<br />
1990 64613.1 20.4 474.8<br />
1991 67 962.9 23.3<br />
<strong>1992</strong> 36847.6 23.3<br />
Bonos <strong>de</strong><br />
In<strong>de</strong>mní·<br />
lación<br />
Bancaria dI<br />
106.6<br />
124.6<br />
127.1<br />
109.4<br />
91.6<br />
82.6<br />
48.6<br />
33.0<br />
0.4<br />
0.6<br />
CUADRO 15.17<br />
(1' parte)<br />
Pagarés <strong>de</strong> la<br />
Tesorería <strong>de</strong><br />
la Fe<strong>de</strong>ración<br />
al<br />
97.0<br />
117.9<br />
2289.2<br />
677.4<br />
1629.6<br />
48.3<br />
CUADRO 15.17<br />
(2' parte y última)<br />
80nos Bonos <strong>de</strong> la<br />
Ajustables <strong>de</strong> Tesorería <strong>de</strong><br />
la Tesorería la Fe<strong>de</strong>ración<br />
<strong>de</strong> la al<br />
Fe<strong>de</strong>ración al<br />
3226.1 198.1<br />
14311.1 1 202.3<br />
38 988.3 926.8<br />
36271.3 922.6<br />
NOTA: Debido al redon<strong>de</strong>o la suma <strong>de</strong> las cifras parciales pue<strong>de</strong> no coincidir con <strong>los</strong> totales.<br />
Estas cifras por <strong>los</strong> procedimientos <strong>de</strong> elaboración, están sujetas a cambios ulteriores, en particular las más<br />
recientes.<br />
al Excluye 10$ <strong>de</strong>pósitos constituidos por el Gobierno Fe<strong>de</strong>ral en el Banco <strong>de</strong> México para la adquisición <strong>de</strong> valores con<br />
propósitos <strong>de</strong> regUlación monetaria.<br />
b/<strong>los</strong> petrobonos se presentan <strong>de</strong> enero a diciembre <strong>de</strong> 1984 a valor <strong>de</strong> colocación, ya que así reportan <strong>los</strong> bonos en<br />
sus estados analíticos y <strong>de</strong> enero <strong>de</strong> 1986 8 noviembre <strong>de</strong> 1986. a valor en curva. En este cuadro para homogenej·<br />
zar <strong>los</strong> datos se calcularon a valor <strong>de</strong> mercado a partir <strong>de</strong> 1986.<br />
el Los bonos <strong>de</strong> <strong>de</strong>uda pública <strong>de</strong> la Banca Múltiple y <strong>de</strong> la Banca <strong>de</strong> Desarrollo presentados en informes anteriores se<br />
ajustan más 8 la <strong>de</strong>finición <strong>de</strong> crédito al sector público y no 8 la <strong>de</strong> valores <strong>de</strong> <strong>de</strong>uda pública, por lo que se incluyen<br />
en esta presentación.<br />
dI <strong>los</strong> saldos son presentados a valor <strong>de</strong> colocación.<br />
f/ Bonos <strong>de</strong> Reconstrucción Urbana emitidos por e/ Gobierno <strong>de</strong>l Departamento <strong>de</strong>l Distrito Fe<strong>de</strong>ral.<br />
g/la suma <strong>de</strong> <strong>los</strong> parciales no coinci<strong>de</strong> con el total reportado por la fuente. (Suma: 121 416.7 millones <strong>de</strong> nuevos<br />
pesos, total reportado: 122 742.8 millones <strong>de</strong> nuevos pesos, diferencia: 1 326.1 millones <strong>de</strong> nuevos pesos)<br />
FUENTE: Banco <strong>de</strong> México. Dirección <strong>de</strong> Investigación Económica.<br />
368
INEGI. <strong>Anuario</strong> <strong>Estadístico</strong> <strong>de</strong> <strong>los</strong> <strong>Estados</strong> <strong>Unidos</strong> <strong>Mexicanos</strong>. <strong>1992</strong><br />
CREDITO RECIBIDO POR ACTIVIDAD PRINCIPAL DEL PRESTATARIO<br />
A TRAVES DE LAS BANCAS DE DESARROLLO Y COMERCIAL a/<br />
1980-92<br />
(Millones <strong>de</strong> nuevos pesos)<br />
Organismos, empresas y particulares<br />
Total Total Agrope· Industria Vivienda Servicios ComercIO<br />
Año cuan 0, energética, <strong>de</strong><br />
1980<br />
1981<br />
1982<br />
1983<br />
1984<br />
1985<br />
1986<br />
1987<br />
1988<br />
1989<br />
1990<br />
1991<br />
<strong>1992</strong><br />
570<br />
922<br />
2499<br />
3651<br />
5382<br />
10227<br />
45626<br />
115840<br />
137 007<br />
180646<br />
249019<br />
337 354<br />
467320<br />
450<br />
696<br />
1 327<br />
1 973<br />
2960<br />
5234<br />
24819<br />
58837<br />
80496<br />
122486<br />
188 563<br />
274 139<br />
399968<br />
minería, <strong>de</strong> Interés otras<br />
silvicultura transtor- social activida<strong>de</strong>s<br />
y<br />
pesca<br />
mación<br />
construc·<br />
ción<br />
112<br />
122<br />
222<br />
361<br />
673<br />
1299<br />
3726<br />
9011<br />
14594<br />
19638<br />
26219<br />
30048<br />
38 193<br />
203<br />
292<br />
734<br />
1036<br />
1 427<br />
2523<br />
10562<br />
24234<br />
29388<br />
40702<br />
66620<br />
79693<br />
112851<br />
12<br />
13<br />
7<br />
13<br />
39<br />
20<br />
241<br />
2834<br />
6128<br />
8523<br />
12453<br />
15484<br />
18569<br />
NOTA: La suma <strong>de</strong> <strong>los</strong> parciales pue<strong>de</strong> no COincidir con el total <strong>de</strong>bido al redon<strong>de</strong>o.<br />
a/ Saldos comentes al final <strong>de</strong>l penodo.<br />
FUENTE: Banco <strong>de</strong> MéxIco. Dirección <strong>de</strong> Investigación Económica.<br />
INSTITUCIONES DE SEGUROS AUTORIZADAS EN EL PAIS POR RAMOS<br />
1980-91<br />
Año<br />
1980<br />
1981<br />
1982<br />
1983<br />
1984<br />
1986<br />
1986<br />
1987<br />
1988<br />
1989<br />
1990<br />
1991<br />
116<br />
159<br />
344<br />
548<br />
753<br />
329<br />
6923<br />
17430<br />
21 753<br />
33291<br />
62360<br />
99585<br />
164761<br />
CUADRO 15.19<br />
6<br />
9<br />
20<br />
16<br />
68<br />
63<br />
2378<br />
5327<br />
8634<br />
20332<br />
31 911<br />
49431<br />
76684<br />
Gobierno<br />
120<br />
326<br />
172<br />
1678<br />
2421<br />
4992<br />
20806<br />
57003<br />
66611<br />
68060<br />
60466<br />
63216<br />
67362<br />
CUADRO 15.20<br />
Total <strong>de</strong> Operaciones y ramos<br />
Institu- Operacío- Operacía- _________ -'O;.,p;;.:e;;.r;:.ac;;..o"n.;;e;.;:s.;;d;;.:e;..d;;.a::.ñ;.:o"'s __ -". ______ _<br />
clones nes <strong>de</strong> nes <strong>de</strong> Ramo <strong>de</strong> Ramo <strong>de</strong> Ramo <strong>de</strong> Ramo <strong>de</strong> Ramo <strong>de</strong> Ramo <strong>de</strong> Ramo <strong>de</strong><br />
vida acci<strong>de</strong>n- responsa- marítImo Incendio agrícola automó- crédito diversos<br />
tes y bilidad y <strong>de</strong> viles<br />
enferme civil y transporda<strong>de</strong>snesgosprofesIOnales<br />
tes<br />
57 31 33 34 37 48 14 40 40 36<br />
67 31 33 36 38 49 14 40 40 36<br />
62 30 32 34 37 44 14 39 35 36<br />
62 30 32 34 37 44 14 39 35 35<br />
48 31 32 36 38 41<br />
6 38 28 36<br />
47<br />
46<br />
72<br />
72<br />
72<br />
74<br />
ND<br />
29<br />
28<br />
29<br />
30<br />
30<br />
33<br />
33<br />
33<br />
31<br />
29<br />
29<br />
29<br />
31<br />
33<br />
FUENTE: Comisión NacIonal Bancaria y <strong>de</strong> Seguros, <strong>Anuario</strong> <strong>Estadístico</strong> <strong>de</strong> Seguros 1991.<br />
370<br />
36<br />
36<br />
36<br />
36<br />
36<br />
36<br />
36<br />
38<br />
37<br />
36<br />
36<br />
36<br />
36<br />
37<br />
41<br />
40<br />
38<br />
38<br />
38<br />
38<br />
38<br />
6<br />
6<br />
6<br />
6<br />
9<br />
11<br />
38<br />
37<br />
36<br />
36<br />
36<br />
36<br />
36<br />
26<br />
26<br />
26<br />
24<br />
24<br />
22<br />
19<br />
36<br />
36<br />
36<br />
36<br />
36<br />
36<br />
36
INEGI. <strong>Anuario</strong> <strong>Estadístico</strong> <strong>de</strong> <strong>los</strong> <strong>Estados</strong> <strong>Unidos</strong> <strong>Mexicanos</strong>. <strong>1992</strong><br />
MOVIMIENTO DE SINIESTROS Y VENCIMIENTOS SEGUN TIPO DE OPERACION CUADRO 15.22<br />
1980-91<br />
(Miles <strong>de</strong> nuevos pesos)<br />
OCLlrridos Recuperado Neto a cargo <strong>de</strong><br />
Tipo <strong>de</strong> operación Total Sobre primas Sobre primas <strong>de</strong> lo cedido las inStltuciones<br />
yaño directas al tomadas al extranjero meXicanas<br />
<strong>de</strong>l extranjero<br />
Total <strong>de</strong> la8 operaciones<br />
1980 20380 19549 831 6114 14266<br />
1981 29816 28894 923 8625 21 191<br />
1982 44884 42788 2096 12285 32688<br />
1983 74026 68425 5601 21 172 52854<br />
1984 bl 120434 113674 6760 35796 84638<br />
1986 327668 319 788 7880 169875 167 792<br />
1986 467800 464 617 13284 142642 326 269<br />
1987 1 211 127 1 190969 20158 234027 977 100<br />
1988 3117744 3066670 61 174 673364 2644390<br />
1989 3656 112 3490 601 66611 449462 3106661<br />
1990 5148089 5077 961 70128 724602 4423 487<br />
1991 7312001 7230680 81 321 1318842 5993169<br />
Operaciones <strong>de</strong> vida<br />
1980 3064 3036 28 389 2676<br />
1981 4236 4214 22 479 3768<br />
1982 5644 6599 46 493 6160<br />
1983 8082 7908 174 934 7 148<br />
1984 b/ 22062 21779 273 1 517 20636<br />
1985 40981 40689 392 4 307 36676<br />
1986 101377 101080 298 6154 96224<br />
1987 308032 306991 1041 13353 294 679<br />
1988 970 866 968668 2188 29627 941 229<br />
1989 1410037 1407162 2876 28618 1 381 420<br />
1990 1 816612 1 814056 2656 66326 1 760 286<br />
1991 2329691 .7 327 265 2426 68947 2260 744<br />
Operaciones <strong>de</strong> acci<strong>de</strong>ntes y enfermeda<strong>de</strong>s<br />
1980 455 454 1 78 377<br />
1981 746 727 19 102 644<br />
1982 1 194 1 165 29 140 1064<br />
1983 1846 1 793 53 172 1 675<br />
1984 b/ 3443 3385 58 245 3199<br />
1986 6429 6327 103 366 6063<br />
1986 14625 14626 100 633 13993<br />
1987 44227 43966 262 2095 42132<br />
1988 156684 155134 650 2655 153 129<br />
1989 266653 266324 329 6304 260349<br />
1990 439266 438981 285 10774 428492<br />
1991 646146 644493 663 13686 631 460<br />
Operaciones <strong>de</strong> daños<br />
1980 16861 16069 802 6647 11 214<br />
1981 24834 23962 882 8046 16789<br />
1982 38046 36024 2022 11662 26484<br />
1983 64098 68724 6374 20066 44032<br />
1984 bl 94939 88610 6428 34034 60904<br />
1986 280267 272 872 7386 166203 116064<br />
1986 351 798 338912 12886 136 766 215042<br />
1987 868868 840013 18866 218679 640289<br />
1988 1991 204 1 932 768 68436 641 172 1 450032<br />
1989 1 890422 1 828 115 62307 416530 1 474892<br />
1990 2892213 2824 926 67288 657 602 2234711<br />
1991 4337 164 4 258922 78242 1 236209 3100966<br />
NOTA: Los totales pue<strong>de</strong>n no coincidir con la suma <strong>de</strong> <strong>los</strong> parciales <strong>de</strong>bido al redon<strong>de</strong>o.<br />
s/Incluye rentas vitalicias.<br />
b/las cifras presentadas a partir <strong>de</strong> 1984 correspon<strong>de</strong>n al costo <strong>de</strong> siniestralidad.<br />
FUENTE: Comisión Nacional Bancaria y <strong>de</strong> Seguros, <strong>Anuario</strong> <strong>Estadístico</strong> <strong>de</strong> Seguros 1991.<br />
372
REASEGURO CEDIDO Y TOMADO DEL EXTRANJERO<br />
1980-91<br />
(Miles <strong>de</strong> nuevos pesos)<br />
Año<br />
Primas<br />
1980 9217<br />
1981 13883<br />
1982 25842<br />
1983 50855<br />
1984 73256<br />
1985 117414<br />
1986 206458<br />
1987 456 108<br />
1988 843491<br />
1989 1 004 130<br />
1990 1 216659<br />
1991 1 635733<br />
Año<br />
Primas<br />
1980 1 204<br />
1981 1 344<br />
1982 2929<br />
1983 5983<br />
1984 6360<br />
1985 8796<br />
1986 16727<br />
1987 37 112<br />
1988 72 201<br />
1989 84460<br />
1990 94802<br />
1991 105161<br />
Cedido al extranjero<br />
Ingresos<br />
9474<br />
13438<br />
20843<br />
37346<br />
58926<br />
203528<br />
200023<br />
352018<br />
796448<br />
724 212<br />
1074817<br />
1 777819<br />
Tomado <strong>de</strong>l extranjero<br />
Ingresos<br />
12<br />
25<br />
100<br />
733<br />
491<br />
448<br />
392<br />
313<br />
555<br />
517<br />
1652<br />
NOTA: Compren<strong>de</strong> las operaciones <strong>de</strong> vida, daños, acci<strong>de</strong>ntes)' enfermeda<strong>de</strong>s.<br />
FUENTE: Comisión Nacional Bancaria y <strong>de</strong> Seguros, <strong>Anuario</strong> Estadistica <strong>de</strong> Seguros 1991.<br />
979<br />
CUADRO 15.25<br />
(1' parte)<br />
Egresos<br />
146<br />
206<br />
280<br />
900<br />
1469<br />
3504<br />
6933<br />
65266<br />
120 927<br />
149 905<br />
171 567<br />
187 616<br />
CUADRO 15.25<br />
(2' parte y última)<br />
Egresos<br />
228<br />
368<br />
3121<br />
7701<br />
9498<br />
11 512<br />
20105<br />
34825<br />
90906<br />
98711<br />
103426<br />
122 970<br />
375 INEGI. <strong>Anuario</strong> <strong>Estadístico</strong> <strong>de</strong> <strong>los</strong> <strong>Estados</strong> <strong>Unidos</strong> <strong>Mexicanos</strong>. <strong>1992</strong>
INEGI. <strong>Anuario</strong> <strong>Estadístico</strong> <strong>de</strong> <strong>los</strong> <strong>Estados</strong> <strong>Unidos</strong> <strong>Mexicanos</strong>. <strong>1992</strong><br />
TASAS DE INTERES NETAS SOBRE INSTRUMENTOS DE AHORRO<br />
BANCARIOS EN MONEDA NACIONAL a/<br />
1980-92<br />
(Porcentaje)<br />
Depósitos Inter- Depósitos a plazo fIjo<br />
Ano <strong>de</strong> ahorro bancaria De 30. De 90 a De 180 • De 270. De 360 a<br />
86 días 176 días 266 días 366 días 636 días<br />
1980 4.60 26.20 26.16 26.46 26.96<br />
1981 4.60 37.89 26.28 31.82 33.42 34.29<br />
1982 20.00 46.89 49.90 62.64 62.14 49.84<br />
1983 20.00 56.07 64.70 64.70 64.02 53.66 48.71<br />
1984 20.00 67.74 45.60 44.90 44.40 42.10 39.60<br />
1986 20.00 80.01 65.29 70.41 70.26 43.25 40.10<br />
1986 20.00 110.35 90.20 96.25 96.65 43.26 40.10<br />
1987 20.00 121.30 116.73 112.79 111.73 43.26 40.10<br />
1988 20.00 57.33 31.06 29.90 28.96 28.10 27.16<br />
1989 20.00 70.02 32.45 31.18 29.18 SIC SIC<br />
1990 20.00 22.58 23.12 21.78 SIC SIC<br />
1991 8.00 14.70 16.67 14.59 SIC SiC<br />
<strong>1992</strong> 8.00 17.83 18.04 17.60 SIC SIC<br />
CUADRO 15.26<br />
(1· parte)<br />
De 640 • De 720 a<br />
716 días 726 días<br />
27.36 27.86<br />
34.29 34.44<br />
60.00 60.00<br />
48.71 48.71<br />
39.60 39.60<br />
40.10 40.10<br />
40.10 40.10<br />
40.10 40.10<br />
26.66 26.66<br />
SIC SIC<br />
SIC SIC<br />
SIC SIC<br />
SIC SIC<br />
CUADRO 15.26<br />
(2' parte y última)<br />
Depósitos retirables en días preestablecidos Pagarés con rendImIento liqUidable al vencimiento<br />
Ano 2 días a la 1 día 8 la 2 días al 1 día al De 1 De 3 De 6 De 9 D. 1 2<br />
semana semana mes mes mes meses meses meses meses<br />
1980 19.16 19.66 21.86 23.25<br />
1981 16.94 17.69 20.49 23.33<br />
1982 20.60 22.00 24.40 27.80<br />
1983 20.60 20.60 22.60 26.00 67.16 60.37 63.27 69.80<br />
1984 20.60 20.60 22.60 46.35 47.45 48.60 47.80 47.80<br />
1986 20.50 20.60 22.60 67.81 71.92 74.86 51.00 60.00<br />
1986 20.50 20.60 22.60 93.26 94.30 95.65 51.00 60.00<br />
1987 20.60 20.60 22.60 116.58 120.36 120.73 51.00 60.00<br />
1988 20.60 20.60 22.60 38.25 31.75 31.76 31.76 31.76<br />
1989 20.50 20.60 22.60 37.33 34.79 28.98 SIC SIC<br />
1990 20.50 20.60 22.60 22.73 22.65 21.34 SIC SIC<br />
1991 14.76 16.23 14.07 SIC SIC<br />
<strong>1992</strong> 19.20 18.96 18.29 SIC SIC<br />
NOTAS: Promedio mensual <strong>de</strong> las tasas netas <strong>de</strong>spués <strong>de</strong> impuestos paga<strong>de</strong>ros a personas físicas. A partir <strong>de</strong> abril <strong>de</strong><br />
1989, se conSIgnan tasas <strong>de</strong> ventanilla que correspon<strong>de</strong>n al promedio <strong>de</strong> las <strong>de</strong>terminadas por las instituciones<br />
<strong>de</strong> crédito a la apertura. La diferencia entre las tasas brutas y las tasas netas es <strong>de</strong> 2.62 puntos porcentuales<br />
hasta el 31 <strong>de</strong> diciembre <strong>de</strong> 1990. A partir <strong>de</strong> 1991, la diferenCia es <strong>de</strong> 1.4 puntos porcentuales. Constituidas<br />
para una tasa gravable sobre el impuesto sobre la renta <strong>de</strong>l 12 % y una sobre tasa exenta <strong>de</strong> dicho impuesto,<br />
hasta el 31 <strong>de</strong> diciembre <strong>de</strong> 1990. A partir <strong>de</strong>l primero <strong>de</strong> enero <strong>de</strong> 1991, la tasa sujeta <strong>de</strong> impuesto es <strong>de</strong>l<br />
20 % sobre 10$ diez primeros puntos porcentuales <strong>de</strong> intereses pagados, el 24 <strong>de</strong> enero se modifica esta disposición<br />
y se establece que la retención <strong>de</strong>l impuesto sea <strong>de</strong>l 1.4 % sobre el monto <strong>de</strong> <strong>los</strong> intereses pagados.<br />
8/ Promedio <strong>de</strong> cotizaciones diarias <strong>de</strong>l mes <strong>de</strong> diciembre <strong>de</strong> cada año.<br />
FUENTE: Banco <strong>de</strong> MéXICO, Dirección <strong>de</strong> Investigación Económica.<br />
376
INEGI. <strong>Anuario</strong> <strong>Estadístico</strong> <strong>de</strong> <strong>los</strong> <strong>Estados</strong> <strong>Unidos</strong> <strong>Mexicanos</strong>. <strong>1992</strong><br />
COSTO PORCENTUAL PROMEDIO DE CAPTACION EN MONEDA NACIONAL al CUADRO 15.28<br />
Tasas anuales<br />
(1' parte)<br />
1980-92<br />
(Porcentaje)<br />
Año Enero Febrero Marzo Abril Mayo Junio<br />
1980 17.90 18.39 19.20 19.83 20.39 20.47<br />
1981 25.46 25.98 26.59 26.91 27.22 27.66<br />
1982 32.34 33.43 33.67 34.39 36.26 39.69<br />
1983 60.29 64.24 66.16 67.21 68.14 68.63<br />
1984 66.96 66.16 63.11 61.10 60.12 60.38<br />
1986 47.17 47.33 49.36 61.93 53.76 64.92<br />
1986 68.66 70.30 71.79 73.48 75.02 76.97<br />
1987 96.89 96.20 96.26 96.79 94.79 93.76<br />
1988 122.54 135.88 117.16 81.03 60.69 46.76<br />
1989 49.37 48.70 47.30 46.91 49.16 61.97<br />
1990 42.08 44.87 47.16 47.20 42.62 36.16<br />
1991 27.14 26.71 24.29 23.62 23.10 21.79<br />
<strong>1992</strong> 18.98 18.22 16.60 16.75 16.56 16.01<br />
CUADRO 15.26<br />
(2' parte y última)<br />
Año Julio Agosto Septiembre Octubre NOVIembre Diciembre<br />
1980 20.63 20.82 21.61 22.42 22.77 24.26<br />
1981 28.42 29.60 30.46 31.22 31.77 31.81<br />
1982 43.23 46.42 47.88 45.99 46.61 46.12<br />
1983 68.73 68.23 57.78 67.14 66.82 66.44<br />
1984 60.69 50.93 60.60 49.34 48.31 47.54<br />
1986 67.00 69.06 60.98 62.29 63.39 66.66<br />
1986 81.36 84.40 87.72 91.48 94.19 96.33<br />
1987 92.91 92.15 91.02 90.30 92.37 104.29<br />
1988 40.72 39.90 39.90 40.03 41.65 46.48<br />
1989 61.60 38.12 36.24 37.40 39.51 40.11<br />
1990 33.06 31.27 31. " 31.62 29.66 29.23<br />
1991 20.99 20.56 21.72 21 .29 20.62 19.96<br />
<strong>1992</strong> 18.07 19.64 20.16 21.86 21.79 22.76<br />
NOTA: En atención a las nuevas disposiciones que regulan a las aceptaciones bancarias y el papel comercial con aval<br />
bancario, a partir <strong>de</strong>l dato estimado para noviembre <strong>de</strong> 1988, en adición <strong>de</strong> <strong>los</strong> <strong>de</strong>pósitos bancarios a plazo<br />
y <strong>los</strong> pagarés con rendimiento liquidable al vencimiento cotizados originalmente, se incorporan al cálculo <strong>de</strong>l<br />
CPP las aceptaciones bancarias y el papel comercial con aval bancario.<br />
a/ Costos promedios pon<strong>de</strong>rados <strong>de</strong>l conjunto <strong>de</strong> bancos múltiples.<br />
FUENTE: Banco <strong>de</strong> México, Dirección <strong>de</strong> Investigación Económica.<br />
378
INEGI. <strong>Anuario</strong> <strong>Estadístico</strong> <strong>de</strong> <strong>los</strong> <strong>Estados</strong> <strong>Unidos</strong> <strong>Mexicanos</strong>. <strong>1992</strong><br />
INDICE DE PRECIOS Y COTIZACIONES DE LA BOLSA MEXICANA<br />
DE VALORES POR SECTOR DE ACTIVIDAD ECONOMICA<br />
19BO-92<br />
(1978 = 100) al<br />
CUADRO 15.30<br />
(1' parte)<br />
Indlce general Sector <strong>de</strong> actividad económica bl<br />
Año Máximo Mínimo UltImo Industria Industria <strong>de</strong><br />
extractiv8 transformación<br />
1980 1.43 1.11 1.43 3.38 1.46<br />
1981 1.49 0.77 0.96 1.69 1.12<br />
1982 1.00 0.48 0.68 1.98 0.63<br />
1983 2.45 0.66 2.45 5.80 2.28<br />
1984 4.46 2.39 4.04 7.29 3.86<br />
1985 11.44 3.49 11.19 11.37 10.60<br />
1986 47.10 10.83 47.10 88.88 40.74<br />
1987 373.22 47.22 105.67 235.98 107.81<br />
1988 230.09 86.61 211.53 411.87 199.67<br />
1989 443.03 203.72 418.93 807.36 376.76<br />
1990 683.64 417.43 628.79 797.25 528.03<br />
1991 1 459.28 667.09 1 431.46 854.01 770.55<br />
<strong>1992</strong> 1 907.36 252.10 1 759.44 1 346.25 813.43<br />
Sector <strong>de</strong> actiVidad económica bJ<br />
CUADRO 15.30<br />
(2' parte y última)<br />
Año ConstruccIón ComercIo Comunicaciones Servicios Varros el<br />
1980 3.48 1.34 0.77 1.09 1. 11<br />
1981 4.57 0.98 0.81 0.83 0.68<br />
1982 1.75 0.82 1.44 0.62 0.45<br />
1983 6.68 2.67 6.34 1.72 1.37<br />
1984 9.12 4.99 4.64 3.15 3.19<br />
1985 36.18 13.51 5.57 8.36 5.81<br />
1986 181.38 35.80 17.93 23.36 26.40<br />
1987 320.67 108.02 84.92 34.88 67.56<br />
1988 677.13 176.67 192.50 32.46 177 .45<br />
1989 908.42 370.34 632.86 78.20 334.96<br />
1990 1052.72 1 196.64 1 269.76 153.28 369.11<br />
1991 3 363.64 2057.43 4 340.00 298.86 674.94<br />
<strong>1992</strong> 3621.82 3 277 .03 5612.28 391.64 715.49<br />
al Base 0.78 puntos <strong>de</strong> octubre <strong>de</strong> 1978.<br />
b/ Indices <strong>de</strong> fin <strong>de</strong> periodo.<br />
e/Incluye principalmente empreSaS controladoras.<br />
FUENTE: Bolsa Mexicana <strong>de</strong> Valores, S.A. <strong>de</strong> C.V. , Indicadores Bursátiles.<br />
380
INEGI. <strong>Anuario</strong> <strong>Estadístico</strong> <strong>de</strong> <strong>los</strong> <strong>Estados</strong> <strong>Unidos</strong> <strong>Mexicanos</strong>. <strong>1992</strong><br />
MERCADO DE VALORES POR TIPO DE INSTRUMENTO CUADRO 15.32<br />
1983-91 (1' parte)<br />
(Saldos al final <strong>de</strong>l peñodo en millones <strong>de</strong> nuevos pesos)<br />
Total Valores Valores <strong>de</strong> renta fija <strong>de</strong> corto plazo (vencimientos hasta <strong>de</strong> un añol<br />
Año <strong>de</strong> renta Total Cetes Son<strong>de</strong>s Pagafes Tesobonos<br />
variable 1365 días<br />
al <strong>de</strong> plazo)<br />
1983 1260.9 435.9 668.1 617.8<br />
1984 1941.8 705.0 1011.5 796.2<br />
1986 5 151.9 1 547.4 2966.9 2360.4<br />
1986 17966.5 5496.8 11247.6 8148.7 97.0<br />
1987 55656.1 18415.5 34 040.5 28006.2 358.6 117.9<br />
1988 137633.2 31977.7 100331.2 41 993.9 17 559.2 2 289.3<br />
1989 214065.9 60513.7 105373.4 53973.1 16 502.5 577.3 198.1<br />
1990 337 965.0 96472.0 168966.6 72001.0 19102.3 1529.6 1202.3<br />
1991 586576.1 303271.3 162334.0 72374.0 2996.2 48.3 926.8<br />
CUADRO 15.32<br />
(2' parte)<br />
Valores <strong>de</strong> renta f'18 <strong>de</strong> corto plazo {vencimientos hasta <strong>de</strong> un añol Valores <strong>de</strong> largo plazo<br />
Año Acepta- Pagaré Papel Otros Total Son<strong>de</strong>s Ajusta-<br />
clones bancario comercial el bonos<br />
bancarias bursátil bl<br />
1983 41.3 9.0 156.9<br />
1984 205.7 9.6 225.3<br />
1985 582.5 24.0 637.6<br />
1986 2676.3 67.9 257.7 222.1<br />
1987 48H.9 159.6 523.3 3200.1<br />
1988 35732.3 694.6 2061.9 5 324.3 2 626.5<br />
1989 29487.7 4 629.2 5.5 48 178.8 39 174.1 3226.1<br />
1990 9149.0 69173.1 6809.3 72526.4 45410.8 14 311.1<br />
1991 8394.2 70720.3 4 587.0 2287.2 120970.8 54 956.7 38 988.3<br />
Valores <strong>de</strong> largo plazo<br />
CUADRO 15.32<br />
(3' parte y última)<br />
Año Petro- Bonos <strong>de</strong> Bonos <strong>de</strong> Bonos Obllga- Certificados Pagarés <strong>de</strong><br />
bonos in<strong>de</strong>mini- renOV8- bancariOs clones <strong>de</strong> mediano<br />
z8ción ción di participacIón plazo<br />
bancaria urbana<br />
1983 31.2 105.6 20.1<br />
1984 70.0 124.5 30.8<br />
1986 433.1 127.1 13.5 63.9<br />
1986 886.6 109.4 7.0 16.5 202.6<br />
1987 2 658.0 91.6 14.9 9.6 423.7 2.4<br />
1988 1 257.1 82.5 17.5 80.8 1 217.5 42.4<br />
1989 866.6 48.6 18.2 2112.1 2569.7 174.6<br />
1990 843.3 33.0 20.4 6640.1 4786.2 481.5<br />
1991 0.4 23.3 10774.8 10 388.0 3 590.8 2 248.0<br />
a/ El saldo <strong>de</strong> las accIones no incluye a las SOCIeda<strong>de</strong>s <strong>de</strong> inverSión.<br />
b/ Compren<strong>de</strong> papel comercial avalado por la banca.<br />
e/Incluye papel comercial extrabursáril y certificados <strong>de</strong> <strong>de</strong>pÓSIto.<br />
dI Incluye la operación con bonos <strong>de</strong> prenda.<br />
FUENTE: Bolsa MeXIcana <strong>de</strong> Valores S.A. <strong>de</strong> C.V. y Banco <strong>de</strong> MéXICO.<br />
382
CAPITULO 16<br />
PRECIOS<br />
INEGI. <strong>Anuario</strong> <strong>Estadístico</strong> <strong>de</strong> <strong>los</strong> <strong>Estados</strong> <strong>Unidos</strong> <strong>Mexicanos</strong>. <strong>1992</strong>
INEGI. <strong>Anuario</strong> <strong>Estadístico</strong> <strong>de</strong> <strong>los</strong> <strong>Estados</strong> <strong>Unidos</strong> <strong>Mexicanos</strong>. <strong>1992</strong><br />
INDICE NACIONAL DE PRECIOS Al CONSUMIDOR<br />
1980-92<br />
(1978= 100)<br />
CUADRO 16.1<br />
(1" parte)<br />
Año Promedio Enero Febrero Marzo Abril Mayo Junio<br />
anual<br />
1980 149.3 133.8 136.9 139.7 142.1 144.4 147.3<br />
1981 191.1 171.0 175.2 178.9 182.9 185.7 188.3<br />
1982 303.6 223.7 232.5 241.0 254.1 268.4 281.3<br />
1983 612.9 469.9 495.1 519.1 562.0 575.9 597.7<br />
1984 1014.1 814.8 857.8 894.5 933.2 964.1 999.0<br />
1985 1599.7 1309.8 1364.2 1417.1 1460.7 1495.3 1532.8<br />
1986 2 979.2 2173.3 2269.9 2375.4 2499.4 2638.3 2807.6<br />
1987 6906.6 4440.9 4 761.3 6076.0 5520.1 5 936.2 6 365.7<br />
1988 14791.2 12293.5 13318.9 14000.9 14431.9 14 711.1 15011.2<br />
1989 17 750.7 16642.6 16767.1 16948.8 17202.3 17439.1 17 LoO.9<br />
1990 22481.6 20260.7 20719.6 21 084.8 21406.7 21 779.2 22 268.9<br />
1991 27676.3 25762.8 26 202.3 26576.0 26864.4 27116.9 27401.5<br />
<strong>1992</strong> 31 862.8 30374.7 30 734.6 31047.4 31324.1 31 630.7 31 744.1<br />
CUADRO 16.1<br />
(2" parte y última)<br />
Año Julio Agosto Septiembre Octubre Noviembre Diciembre<br />
1980 161.4 164.6 166.3 168.6 161.4 166.6<br />
1981 191.6 196.6 199.2 203.6 207.5 213.1<br />
1982 296.8 329.0 346.6 364.6 382.9 423.8<br />
1983 627.3 661.6 671.7 694.0 734.7 766.1<br />
1984 1031.8 1061.1 1092.7 1 130.9 169.7 1219.4<br />
1986 1686.2 1666.6 1721.6 1 787.0 1869.5 1 996.7<br />
1986 2947.7 3 182.7 3373.7 3566.6 3 807.6 4108.2<br />
1987 6881.3 7443.7 7934.1 8696.2 9277 .0 10647.2<br />
1988 16261.8 16402.2 16490.2 16608.2 16817.3 16147.3<br />
1989 17 827.4 17997.3 18169.4 18438.1 18696.9 19327.9<br />
1990 22664.8 23051.0 23379.6 23716.7 24345.4 25112.7<br />
1991 27 643.6 27 836.0 28113.3 28440.3 29 146.4 29832.6<br />
<strong>1992</strong> 31 944.5 32 140.8 32420.4 32653.8 32925.1 33393.9<br />
NOTA: El Sistema Nacional <strong>de</strong>l Indico <strong>de</strong> Precios al Consumidor recopíl.¡ durante ceda mel, 140000 cotizaciones<br />
directas en treinta y cinco ciuda<strong>de</strong>s. sobre <strong>los</strong> precios <strong>de</strong> aproximadamente 1 200 .rt(cu<strong>los</strong> V servicios<br />
espec/ficos. Los promedios <strong>de</strong> dichas cotizaciones dan lugar a <strong>los</strong> (ndicas <strong>de</strong> <strong>los</strong> 302 conceptos genéricos<br />
sobre bienes y servicios que forman l. canasta <strong>de</strong>l Ir'ldjce Gener.' en cada una <strong>de</strong> ras ciuda<strong>de</strong>s y • nivel<br />
nacional. La estructura <strong>de</strong> pon<strong>de</strong>raciones está basada, fundamentalmente, en <strong>los</strong> resultados <strong>de</strong> l. "Encuesta<br />
Nacional <strong>de</strong> Ingresos y Gastos <strong>de</strong> <strong>los</strong> Hogares, 1977" elaborada por ,. Secretaría <strong>de</strong> Programación y<br />
Presupuesto. La fórmula utilizada para la elaboración <strong>de</strong> estos (ndices es la <strong>de</strong> pon<strong>de</strong>raciones fijas <strong>de</strong><br />
Laspeyres.<br />
FUENTE: Banco <strong>de</strong> Milxico. Direcci6n <strong>de</strong> Investigaci6n Económica.<br />
386
INDICE NACIONAL DE PRECIOS AL CONSUMIDOR POR<br />
DURABILIDAD DE LOS BIENES Y ESTRATO DE<br />
INGRESO al<br />
1980-92<br />
(1978=100)<br />
Año<br />
1980<br />
1981<br />
1982<br />
1983<br />
1984<br />
1986<br />
1986<br />
1987<br />
1988<br />
1989<br />
1990<br />
1991<br />
<strong>1992</strong><br />
Año<br />
1980<br />
1981<br />
1982<br />
1983<br />
1984<br />
1986<br />
1986<br />
1987<br />
1988<br />
1989<br />
1990<br />
1991<br />
<strong>1992</strong><br />
Indlce<br />
general<br />
149.3<br />
191."1<br />
303.6<br />
612.9<br />
1014.1<br />
1 699.7<br />
2 979.2<br />
6 906.6<br />
14791.2<br />
17760.E;<br />
22481.6<br />
27676.:<<br />
31 852.8<br />
Bienes no<br />
dura<strong>de</strong>ros<br />
148.2<br />
187.1<br />
297.6<br />
615.6<br />
1045.8<br />
1 662.9<br />
3116.8<br />
7 330.4<br />
16 620.6<br />
17 642.1<br />
21 384.4<br />
26 677.6<br />
29086.0<br />
BaJo el<br />
148.8<br />
191.2<br />
296.1<br />
683.3<br />
980.4<br />
645.8<br />
2 961.8<br />
6754.8<br />
14249.5<br />
17446.4<br />
22 977.0<br />
28677.6<br />
32671.0<br />
Durabilidad <strong>de</strong> <strong>los</strong> bit'nes<br />
Bienes<br />
dura<strong>de</strong>ros<br />
147.5<br />
181.4<br />
299.2<br />
685.4<br />
100.4<br />
739.3<br />
3321.5<br />
8388.1<br />
16 896.2<br />
17339.2<br />
19226.7<br />
21 734.1<br />
23576.2<br />
Estrato <strong>de</strong> ingreso tI<br />
MediO di<br />
148.2<br />
190.6<br />
299.6<br />
696.0<br />
990.4<br />
562.3<br />
2931.7<br />
6777.4<br />
14459.2<br />
17 338.4<br />
22 123.9<br />
27 099.3<br />
284¡¡2.8<br />
CUADRO 16.4<br />
(1" parte)<br />
SerVicios<br />
151.3<br />
198.3<br />
311.6<br />
583.6<br />
925.4<br />
1435.8<br />
2 620.0<br />
5729.1<br />
12831.4<br />
17 813.1<br />
24 885.2<br />
31927.9<br />
37 436.3<br />
CUADRO 16.4<br />
(2" parte y última)<br />
Alto fl<br />
147.9<br />
190.6<br />
307.3<br />
628.6<br />
034.4<br />
1 631.9<br />
3016.6<br />
7016.9<br />
16082.7<br />
18081.4<br />
22 708.6<br />
27867.8<br />
32368.8<br />
NOTA: El Sistema Nacional <strong>de</strong>llndice <strong>de</strong> Precios al Consumidor recopila. durante cada mes, 140000 cotizaCiones<br />
directas en treinta y cinco ciuda<strong>de</strong>s, sobre <strong>los</strong> preCIos <strong>de</strong> aproximadamente 1 200 artícu<strong>los</strong> y serVICIOS<br />
específicos. Los promedios <strong>de</strong> dichas cotizaCIones dan lugar a <strong>los</strong> índices <strong>de</strong> <strong>los</strong> 302 :onceptos genéticos sobre<br />
bienes y serVICIOS que forman la canasta <strong>de</strong>l Indlce General en cada una <strong>de</strong> las Ciuda<strong>de</strong>s y a nivel nacionaL<br />
La estructura <strong>de</strong> pon<strong>de</strong>raciones está basada, fundamentalmente, en <strong>los</strong> resultados <strong>de</strong> la "Encuesta NaCional<br />
<strong>de</strong> Ingresos y Gastos <strong>de</strong> <strong>los</strong> Hogares, 1977" el abur ada por la Secretaria <strong>de</strong> Programación y Presupuesto.<br />
La fórmula utilizada para la elaboración <strong>de</strong> estos índices es la <strong>de</strong> pon<strong>de</strong>rac"lones fijas ce Laspeyres.<br />
al PromediO aritmétiCO en el año.<br />
bl El número <strong>de</strong> familias que pertenecen a estos estratos, la canasta <strong>de</strong> consumo y la eStructdra <strong>de</strong> pon<strong>de</strong>raCiones,<br />
están basadas fundamentalmente en <strong>los</strong> resultados <strong>de</strong> la "Encuesta NaCional <strong>de</strong> Ingresos y Gastos <strong>de</strong> <strong>los</strong> Hogares,<br />
1977".<br />
cl Estrato baJO Incluye a las familias con Ingresos hasta un salariO mínimo.<br />
dI Estrato mediO Inctuye a las familias con ingresos entre una y tres veces el salarla mínimo.<br />
ti Estrato alto Incluye a las familias con ingresos mayores a tres veces el salarla mínimo.<br />
FUENTE: Banco <strong>de</strong> MéXICO. Dirección <strong>de</strong> Investioación Económica.<br />
389<br />
INEGI. <strong>Anuario</strong> <strong>Estadístico</strong> <strong>de</strong> <strong>los</strong> <strong>Estados</strong> <strong>Unidos</strong> <strong>Mexicanos</strong>. <strong>1992</strong>
INDICE GENERAL DE PRECIOS AL CONSUMIDOR POR CIUDADES a/<br />
1980·92<br />
(1980 = 100)<br />
Año<br />
1980<br />
1981<br />
1982<br />
1983<br />
1984<br />
1986<br />
1986<br />
1987<br />
1988<br />
1989<br />
1990<br />
1991<br />
<strong>1992</strong><br />
Año<br />
1980<br />
1981<br />
1982<br />
1983<br />
1984<br />
Aguascallentes, Chlhua- Chetu-<br />
Ags. hua, mal,<br />
Ch,h. a.R.<br />
La Paz,<br />
B.C.<br />
100.0<br />
123.5<br />
218.3<br />
464.1<br />
791.3<br />
100.0 100.0 100.0<br />
128.6 122.4 130.4<br />
197.6 201.9 208.9<br />
406.9 429.4 440.1<br />
684.9 717.9 747.2<br />
Colima, Córdoba, Cortezar.<br />
Col. Ver. Gto.<br />
100.0 100.0 100.0<br />
127.9 133.4 129.2<br />
200.7 214.1 204.6<br />
400.9 420.8 420.8<br />
691.7 697.9 721.8<br />
Fresnillo,<br />
ZaG,<br />
lOO O<br />
1296<br />
201.8<br />
413.9<br />
702.6<br />
CUADRO 16.6<br />
(1' parte)<br />
Hermosillo,<br />
Son.<br />
100.0<br />
124.3<br />
194.8<br />
396.6<br />
664.6<br />
Iguala,<br />
Gro.<br />
100.0<br />
131.6<br />
211.7<br />
420.0<br />
702.3<br />
1 099.8 1 134.3 1 164.9 1 106.0 1095.0 1118.6 1 128.6 1040.2 1 133.0<br />
2030.1 2 136.3 2 193.6 2072.6 2021.8 2048.4 2160.8 1 932.6 2 197.2<br />
4787.0 4969.8 4987.7 4818.3 4666.4 4666.0 4939.1 4 391.0 6168.3<br />
lO 369.8 lO 662.6 lO 627.4 lO 678.9 lO 380.4 lO 106.3 10 440.1 9271.3 lO 993.6<br />
12624.6 12641.1 12807.0 12716.3 12204.6 12128.6 12623.7 11101.9 13316.1<br />
16848.615690.4 15954.4 16981.116053.916528.616564.113767.216622.6<br />
19907.2 19233.9 19749.1 19428.0 18461.5 19064.0 19010.6 17 041.2 20128.0<br />
23085.0 22034.7 22771.4 22146.1 21088.822 385.421 56B.4 19512.523166.3<br />
moros,<br />
Tamps.<br />
100.0<br />
124.4<br />
212.5<br />
467.0<br />
803.4<br />
Monclava,<br />
Coah.<br />
100.0<br />
126.8<br />
201.0<br />
438.4<br />
722.1<br />
Navajos,<br />
Son.<br />
100.0<br />
126.2<br />
204.3<br />
407.3<br />
709.2<br />
Parral, Tampico,<br />
Chih. Tamps.<br />
100.0<br />
126.6<br />
197.7<br />
416.4<br />
709.0<br />
100.0<br />
123.2<br />
198.6<br />
401.2<br />
673.1<br />
Tijuana.<br />
B.C.<br />
100.0<br />
119.6<br />
212.6<br />
471.6<br />
757.7<br />
Tulanclngo,<br />
Hgo.<br />
10).0<br />
131.2<br />
204.8<br />
406.0<br />
659.7<br />
CUADRO 16.6<br />
(2' parte y última)<br />
Villahermasa,<br />
Tab.<br />
100.0<br />
126.8<br />
198.9<br />
399.4<br />
667.0<br />
Zamora,<br />
Mich.<br />
100.0<br />
126.6<br />
200.4<br />
410.4<br />
686.8<br />
1985 1 255.8 1 301.7 1 144.4 1 127.6 1 109.6 1060.7 1 207.8 1 036.3 1056.4 1084.6<br />
1986 2454.2 2461.8 2 117.8 2104.6 2 118.2 1 987.4 2287.1 1 922.3 1 919.6 2013.9<br />
1987 6839.2 5 850.6 4 901.5 4 883.5 5005.7 4597.2 6456.0 4443.2 4 448.7 4743.6<br />
1988 12954.013128.210579.910523.710767.59600.6 11753.t, 96:13.0 9787.210129.8<br />
1989 16;60.216196.812270.212593.712649.211234.3 13883.711410.911736.212409.2<br />
1990 20170.2 19869.1> 15521.5 15608.9 15971.5 13979.5 17300.:3 148H4.3 14659.0 15639.0<br />
1991 24849.0 24127.6 19180.3 19221.3 19502.0 16928.0 20971.0 18 lH9.6 17 962.0 19240.6<br />
<strong>1992</strong> 29187.4 27316.1 21990.821930.922232.019309.4 23891.2 206!l3.8 20521.3 22271.0<br />
al Promedio arttmétlco en el año.<br />
FUENTE: Banco <strong>de</strong> MéXICO. DireCCión <strong>de</strong> Investigación EconómIca.<br />
391 INEGI. <strong>Anuario</strong> <strong>Estadístico</strong> <strong>de</strong> <strong>los</strong> <strong>Estados</strong> <strong>Unidos</strong> <strong>Mexicanos</strong>. <strong>1992</strong>
INEGI. <strong>Anuario</strong> <strong>Estadístico</strong> <strong>de</strong> <strong>los</strong> <strong>Estados</strong> <strong>Unidos</strong> <strong>Mexicanos</strong>. <strong>1992</strong><br />
INDICE DE PRECIOS AL CONSUMIDOR EN LA CIUDAD DE<br />
MEXICO POR OBJETO Del GASTO a/<br />
1980-92<br />
(1978=100)<br />
CUADRO 16.7<br />
(1' parte)<br />
Indice general Alimentos. Ropa, calzado y Vivienda Muebles.<br />
Año bebidas accesorios aparatos y<br />
y tabaco<br />
accesorios<br />
domésticos<br />
1980 149.0 150.2 161.7 161.6 153.5<br />
1981 191.9 190.0 198.5 209.0 186.2<br />
1982 302.4 284.2 308.8 332.4 285.6<br />
1983 598.0 533.8 668.4 586.8 624.7<br />
1984 972.7 929.0 1057.3 887.1 1020.2<br />
1985 1530.5 1 481.6 1 727.6 1 298.6 1539.2<br />
1986 2 830.4 2 674.3 3269.8 2 296.5 2883.1<br />
1987 6497.6 6144.6 7450.5 4445.0 6 997.7<br />
1988 13814.9 12977.2 16170.0 10361.6 14 386.3<br />
1989 16 629.9 16 696.6 16313.3 16622.2 14703.6<br />
1990 21 306.6 19366.3 17 640.8 23 685.1 16497.9<br />
1991 26069.7 22914.3 20819.0 30 764.4 19132.6<br />
<strong>1992</strong> 30287.9 26716.4 22 760.6 36 793.9 20861.7<br />
CUADRO 16.7<br />
(2' parte y última)<br />
Salud y cuidado Transporte Educación y Otl"05<br />
Año personal esparcimiento servicios<br />
1980 140.4 123.9 166.3 163.4<br />
1981 191.6 163.3 197.3 202.7<br />
1982 302.9 271.3 300.1 329.3<br />
1983 616.6 627.8 591.1 629.2<br />
1984 1023.8 974.6 907.6 1098.0<br />
1986 1661.2 1 604.0 1 397.6 1 942.8<br />
1986 3048.9 2969.7 2611.0 3630.4<br />
1987 7 617.1 7562.0 6023.9 8028.1<br />
1988 14146.1 16058.1 13 349.8 17711.0<br />
1989 16102.4 16 933.4 16316.2 22619.0<br />
1990 20 349.6 22 209.4 20925.4 29 239.6<br />
1991 26074.1 27 224.7 26638.6 35173.6<br />
<strong>1992</strong> 29 872.0 34201.1 32683.2 39923.0<br />
NOTA: El Sistema <strong>de</strong>llndice <strong>de</strong> PrecIos al Consumidor en la Cd. <strong>de</strong> MéXICO recopita, durante cada mes, 23000<br />
cotizaciones directas sobre <strong>los</strong> precios <strong>de</strong> aproximadamente 1200 artícu<strong>los</strong> y servicIos específicos. Los<br />
promedios <strong>de</strong> dichas cotizaciones dan lugar 8 <strong>los</strong> índices <strong>de</strong> 10$ 302 conceptos genéricos sobre bienes y<br />
servicios que forman la canasta <strong>de</strong>l Indíce General. La estructura <strong>de</strong> pon<strong>de</strong>raciones está basada<br />
fundamentalmente en <strong>los</strong> resultados <strong>de</strong> la "Encuesta Nacional <strong>de</strong> Ingresos y Gastos <strong>de</strong> <strong>los</strong> Hogares, 1977"<br />
elaborada por la Secretaría <strong>de</strong> Programación y Presupuesto. La fórmula utilizada para 18 elaboración <strong>de</strong> estos<br />
índices es la <strong>de</strong> pon<strong>de</strong>raciones fijas <strong>de</strong> laspeyres.<br />
al Promedio aritmético en el año.<br />
FUENTE: Banco <strong>de</strong> México. Dirección <strong>de</strong> Investigación Económica.<br />
392
INDlCE DE PRECIOS AL CONSUMIDOR EN LA CIUDAD DE MEXICO CUADRO 16.8<br />
POR SECTOR DE ORIGEN a/ (1" parte)<br />
1980·92<br />
(1978=100)<br />
Indlce AgrIcultura, Petróleo y Productos Fabricación Productos<br />
Año general gana<strong>de</strong>ría, <strong>de</strong>rivados alimenticios, <strong>de</strong> textiles <strong>de</strong> ma<strong>de</strong>ra<br />
sIlvicultura bebidas<br />
y pesca y tabaco<br />
1980 149.0 155.7 104.7 148.0 154.6 153.6<br />
1981 191.9 201.8 115.9 186.8 193.2 186.9<br />
1982 302.4 266.7 277.5 291.7 295.8 291.6<br />
1983 598.0 497.0 763.6 550.4 621.9 618.3<br />
1984 972.7 791.7 181.8 983.1 020.2 961.7<br />
1985 1 530.5 141.4 1 819.9 1572.9 .\ 701.0 1553.3<br />
1986 2 830.4 2 238.5 3702.6 2 850.3 :3209.3 2931.9<br />
1987 6497.6 4889.7 8 277.4 6621.8 ., 304.0 7 821.8<br />
1988 13814.9 10610.5 17 770.0 13 825.0 115 100.2 15891.3<br />
1989 16 629.9 14459.3 18048.1 15984.9 15141.3 16448.7<br />
1990 21 306.6 18 534.6 21 800.7 19647.3 17067.4 18875.2<br />
1991 26069.7 20405.2 27 601.1 23789.2 20444.1 22713.4<br />
<strong>1992</strong> 30287.9 23 786.1 37 004.1 26461.7 22 121.0 24751.2<br />
CUADRO 16.8<br />
(2" parte V "Itima)<br />
FabricaCión Fabricación ElectriCidad T r nnsportes Otros<br />
Año <strong>de</strong> productos y reparación y comunl- serVICIOS<br />
químicos <strong>de</strong> productos caclones<br />
metáhcos<br />
1980 137.9 151.3 140.4 122.7 155.6<br />
1981 169.8 175.4 167.9 158.3 209.7<br />
1982 261.1 293.3 231.7 230.4 331.3<br />
1983 614.7 713.7 505.8 376.7 595.9<br />
1984 1053.3 119.7 895.5 535.0 936.9<br />
1985 1 618.6 1749.5 1 251.5 748.1 1 461.0<br />
1986 3069.5 3382.7 2 608.6 824.5 2532.9<br />
1987 7 702.6 8629.0 4746.9 5 600.2 5 183.2<br />
1988 14873.8 16 993.5 9788.6 12 562.9 11 792.1<br />
1989 15003.7 17247.5 10 992.5 14011.8 17 520.0<br />
1990 17 143.8 19095.1 14 644.H 23 960.2 24 137.3<br />
1991 20424.8 21 483.3 20 978.9 29676.1 30 781.3<br />
<strong>1992</strong> 23002.5 23 308.9 24610.7 37 783.4 36 382.4<br />
NOTA: El SIstema <strong>de</strong>llndlce <strong>de</strong> PrecIos al Consumidor en la ed. <strong>de</strong> Mexlco recopda, durante cada mes, 23000<br />
cotizaCiones dIrectas sobre <strong>los</strong> precIos <strong>de</strong> aproximadamente 1200 artícu<strong>los</strong> y servicios especiflcos. Los<br />
promedIOS <strong>de</strong> dichas cotizaCIones dan lugar a <strong>los</strong> ¡ndLces <strong>de</strong> <strong>los</strong> 302 conceptos Qeroéncos sobre bienes y<br />
serVLCIOS que forman la canasta <strong>de</strong>l Indlce General. La estructura <strong>de</strong> pon<strong>de</strong>raCiones está basada<br />
fundamentalmente en <strong>los</strong> resultados <strong>de</strong> la "Encuesta NaCional <strong>de</strong> Ingresos 1/ GastO!i <strong>de</strong> <strong>los</strong> Hogares, 1977"<br />
elaborada por la Secretaria <strong>de</strong> Programación y Presupuesto. La fórmula utilizada para la elaboraCión <strong>de</strong> estos<br />
índices es la <strong>de</strong> pon<strong>de</strong>raciones fijas <strong>de</strong> Laspeyres.<br />
al PromediO aritmétiCO en el año.<br />
FUENTE: Banco <strong>de</strong> Mexlcc,. Dirección <strong>de</strong> Investigación Económica.<br />
393 INEGI. <strong>Anuario</strong> <strong>Estadístico</strong> <strong>de</strong> <strong>los</strong> <strong>Estados</strong> <strong>Unidos</strong> <strong>Mexicanos</strong>. <strong>1992</strong>
INEGI. <strong>Anuario</strong> <strong>Estadístico</strong> <strong>de</strong> <strong>los</strong> <strong>Estados</strong> <strong>Unidos</strong> <strong>Mexicanos</strong>. <strong>1992</strong><br />
INDICE DE PRECIOS AL CONSUMIDOR EN LA CIUDAD DE<br />
MEXICO POR DURABILIDAD DE LOS BIENES al<br />
1980-92<br />
(1978=100)<br />
Año I ndi ce gener al<br />
1980 149.0<br />
1981 191.9<br />
1982 302.4<br />
1983 698.0<br />
1984 972.7<br />
1986 1630.6<br />
1986 2830.4<br />
1987 6497.6<br />
1988 13814.9<br />
1989 16629.9<br />
1990 21 306.6<br />
1991 26069.7<br />
<strong>1992</strong> 30287.9<br />
Ano Bienes dura<strong>de</strong>ros<br />
1980 163.6<br />
1981 176.9<br />
1982 293.1<br />
1983 691.0<br />
1984 1086.0<br />
1986 1 716.1<br />
1986 3 330.6<br />
1987 8467.6<br />
1988 16492.9<br />
1989 16669.2<br />
CUADRO 16.9<br />
(1· parte)<br />
Bienes no dura<strong>de</strong>ros<br />
146.9<br />
183.8<br />
287.1<br />
691.3<br />
994.7<br />
1686.2<br />
2944.5<br />
6866.9<br />
14332.8<br />
16016.3<br />
19296.3<br />
23100.1<br />
26 376.9<br />
CUADRO 16.9<br />
(2· parte y última)<br />
Servicios<br />
160.9<br />
202.0<br />
316.8<br />
664.4<br />
879.0<br />
1 361.2<br />
2445.1<br />
6 280.3<br />
11934.7<br />
16912.8<br />
1990 18510.8<br />
24116.2<br />
1991 20663.7<br />
30711.8<br />
<strong>1992</strong> 22042.7<br />
36812.6<br />
NOTA: El Sistema <strong>de</strong>llr1dice <strong>de</strong> Precios a/ Consumidor en la Cd. <strong>de</strong> México recopila, durante cada mes, 23000<br />
cotizaciones directas sobre <strong>los</strong> precios <strong>de</strong> aproximadamente 1200 artícu<strong>los</strong> y servicios específicos. Los<br />
promedios <strong>de</strong> dichas cotizaciones dan lugar a <strong>los</strong> índices <strong>de</strong> <strong>los</strong> 302 conceptos genéricos sobre bienes y<br />
servicios que forman la canasta <strong>de</strong>llndice General. la estructura <strong>de</strong> pon<strong>de</strong>raciones está basada fundamentalmente<br />
en <strong>los</strong> resultados <strong>de</strong> /a "Encuesta Nacional <strong>de</strong> Ingresos y Gastos <strong>de</strong> Jos Hogares, 1977" elaborada por<br />
La Secretaría <strong>de</strong> Programación y Presupuesto. La fórmula utilizada para la elaboración <strong>de</strong> estos índices es la <strong>de</strong><br />
pon<strong>de</strong>raciones fijas <strong>de</strong> laspeyres.<br />
a/ Promedio aritmético en el año.<br />
FUENTE: Banco <strong>de</strong> México. Dirección <strong>de</strong> Investigación EconómIca.<br />
394
INDICE NACIONAL DE PRECIOS PRODUCTOR POR ORIGEN DE LOS CUADRO 16.·10<br />
BIENES FINALES A NIVEL DE GRUPOS DE RAMAS al (1" parte)<br />
1980-92<br />
11980 = 100)<br />
Año<br />
1980<br />
1981<br />
1982<br />
1983<br />
1984<br />
1985<br />
1986<br />
1987<br />
1988<br />
1989<br />
1990<br />
1991<br />
<strong>1992</strong><br />
Año<br />
1980<br />
1981<br />
1982<br />
1983<br />
1984<br />
1985<br />
1986<br />
1987<br />
1988<br />
1989<br />
1990<br />
1991<br />
<strong>1992</strong><br />
Indlce Sector ptllnario Sector secunds'lo<br />
gener al A.gncul- Minería Industna Allmen- Textiles, Produc- Indus-<br />
tUta,<br />
petrolera tos, prendas tos <strong>de</strong> trias quígana<strong>de</strong>bebidas<br />
<strong>de</strong> vestir ma<strong>de</strong>ra, micas y<br />
tí':l,sdvl- y tabaco e tndus- papel, 11n- produccultura<br />
y<br />
tria <strong>de</strong>l prenta, y tos <strong>de</strong><br />
pesca<br />
cuero editoriales hule y<br />
plástico<br />
100.0<br />
125.0<br />
197.0<br />
394.1<br />
644.8<br />
001.2<br />
1 796.7<br />
4 407.2<br />
8783.7<br />
9904.8<br />
12 157.4<br />
14477.4<br />
16221.1<br />
100.0 100.0<br />
137.0 84.7<br />
186.7 146.3<br />
380.7 380.7<br />
624.9 547.2<br />
987.8 978.3<br />
1 925.9 2 194.8<br />
4 550.8 5375.6<br />
9119.8 9469.9<br />
12429.1 10 433.2<br />
17 804.9 12040.4<br />
21 865.2 12700.9<br />
26797.5 12 137.2<br />
Fabrica- Industrias<br />
ctón <strong>de</strong> metálicas,<br />
produc- muebles,<br />
tos mlne- estrucrales<br />
no turas y<br />
metálicos otros<br />
100.0 100.0<br />
125.6 126.3<br />
217.8 208.9<br />
433.9 437.4<br />
678.6 804.6<br />
·1 006.4 1 114.9<br />
1 941.1 2052.0<br />
4946.8 5074.5<br />
10585.1 11 316.5<br />
11 313.4 12080.7<br />
12577 .0 13 565.3<br />
14052.7 15310.7<br />
15 844.9 15518.7<br />
100.0 100.0 100.0 100.0 100.0<br />
115.5 126.1 128.3 128.4 120.6<br />
221.9 194.7 196.6 201.8 189.5<br />
490.9 371.8 411.3 391.3 418.2<br />
713.6 654.3 642.0 593.0 692.8<br />
1036.6 1061.8 1 027.1 912.6 1 039.4<br />
1 337.4 1 982.7 1 858.8 1 728.5 1999.8<br />
3717.2 4 591.6 4896.8 4 280.5 5217.5<br />
5503.9 9 378.4 10020.6 9042.5 10 556.8<br />
6 869.0 10455.2 10664.0 10082.5 11 134.5<br />
9165.9 12 966.8 11 894.6 11 877.3 12651.0<br />
8735.4 16271.3 13 903.6 14703.2 15 178.0<br />
10106.6 18006.6 14701.8 16337.9 16720.1<br />
CUADRO 16.10<br />
12" parte y última)<br />
Sector secundario<br />
Sector<br />
terCiariO<br />
Maqul- Vehícu<strong>los</strong>, Otras Cons- Electrinarla,<br />
ref acclo- indus- trucclón cldad<br />
apata- nes y trias<br />
tos y otros ma- manufacrefac-<br />
terlales tureras<br />
clones <strong>de</strong> transporte<br />
100.0 100.0 100.0 100.0 100.0<br />
120.3 123.9 110.0 129.7 117.6<br />
192.6 195.3 184.8 200.0 164.5<br />
412.7 424.6 455.2 353.9 349.1<br />
656.6 726.3 596.3 556.2 613.2<br />
955.1 1 089.4 903.0 866.0 925.0<br />
1 760.9 2049.7 1 789.1 1 538.4 1 939.7<br />
4 400.2 5 291.2 4300.3 3714.2 3 518.4<br />
8 922.9 10284.6 7 690.4 7954.5 7 464.7<br />
9252.2 10621.8 8040.7 8503.4 8688.3<br />
10397.2 11 770.5 9 250.0 9897.5 11 319.2<br />
11 944.5 13439.8 10227.5 12076.5 15885.7<br />
12434.0 14144.1 11 064.8 13 608.6 18 605.6<br />
NOTA: El Sistema <strong>de</strong>llndlce NaCional <strong>de</strong> Precios Productor recopila, durante cada mes, 6000 cotizaCiones directas en<br />
1 500 empresas localizadas en todo el territOriO nacional. Los promedios <strong>de</strong> dichas cotlzaClOnes dan lugar a <strong>los</strong><br />
índices <strong>de</strong> <strong>los</strong> 692 artícu<strong>los</strong> genéricos que forman la canasta <strong>de</strong>llndlce General. La estructura <strong>de</strong> pon<strong>de</strong>raCIOnes<br />
está basada en <strong>los</strong> resultados <strong>de</strong>l "Sistema <strong>de</strong> Cuentas NaCionales <strong>de</strong> MéXICO, Cuadro Insumo Producto<br />
1970", elaborado por la Secretaría <strong>de</strong> Programación y Presupuesto. La fórmula utlluada par a la elaboraCión <strong>de</strong><br />
estos índices es la <strong>de</strong> pon<strong>de</strong>raCiones fijas <strong>de</strong> Laspeyres.<br />
a/ Promedio aritmético en el año.<br />
FUENTE: Banco <strong>de</strong> MéXICO. DireCCión <strong>de</strong> Investigación Económica.<br />
INEGI. <strong>Anuario</strong> <strong>Estadístico</strong> <strong>de</strong> <strong>los</strong> <strong>Estados</strong> <strong>Unidos</strong> <strong>Mexicanos</strong>. <strong>1992</strong><br />
395
INEGI. <strong>Anuario</strong> <strong>Estadístico</strong> <strong>de</strong> <strong>los</strong> <strong>Estados</strong> <strong>Unidos</strong> <strong>Mexicanos</strong>. <strong>1992</strong><br />
INDICE DE PRECIOS AL MA VOREO EN LA CIUDAD DE MEXICO CUADRO 16.14<br />
DE LOS ARTICULOS DE PRODUCCION POR CONCEPTOS<br />
(1· parte)<br />
GENERICOS SELECCIONADOS a/<br />
1980-91<br />
(1978= 100)<br />
Año Indice Algodón Trigo Lana Acero Cemento<br />
gener.al<br />
1980 147.2 137.3 131.6 130.8 165.3 174.7<br />
1981 183.3 134.3 146.7 140.3 218.5 243.2<br />
1982 286.1 229.3 182.9 268.7 371.7 388.1<br />
1983 593.2 486.3 371.2 779.0 750.7 806.6<br />
1984 1 010.4 616.6 701.1 1074.0 1 453.4 287.0<br />
1985 1 651.6 674.8 1028.7 1 762.0 1 872.6 2008.6<br />
1986 2 923.0 1476.9 1569.7 3612.3 3506.1 3396.7<br />
1987 6 887.5 4 560.6 3143.8 9 947.7 7 926.8 8 275.0<br />
1988 14314.2 6450.9 8094.1 21 366.1 17 135.2 16873.5<br />
1989 16613.8 8326.8 10507.5 24461.7 17 674.9 17373.9<br />
1990 20492.8 10461.4 12975.7 26 969.1 19 652.9 21 203.2<br />
1991 24700A 11 282.7 14833.0 27 628.2 20910.8 28 622.1<br />
CUADRO 16.14<br />
12" parte y última)<br />
VarIlla Fuerza Gas natural Gasolina Automóvil<br />
Año eléctrica<br />
Industria!<br />
1980 166.2 141.3 103.0 100.8 150.7<br />
1981 185.2 165.3 132.1 109.9 189.9<br />
1982 278.0 234.9 259.8 306.5 332.7<br />
1983 604.7 513.4 138.9 875.8 627.2<br />
1984 1028.6 915.8 2 869.9 1 350.7 1077.8<br />
1986 1 353.4 1 418.3 4929.9 2032.9 1 643.9<br />
1986 2 459.5 2972.1 13982.3 3163.0 3083.6<br />
1987 6 686.3 6866.9 28 784.3 8035.1 8163.9<br />
1988 13095.1 15121.8 61 868.6 17272.3 15673.6<br />
1989 13507.5 20230.9 62 188.3 17 350.0 16064.5<br />
1990 20 156.0 25327.1 70194.1 20 583.7 17 549.4<br />
1991 16612.9 31 305.4 78 743.2 25626.6 19230.1<br />
a/ El sistema <strong>de</strong> este indlce recopila durante cada mes 600 cotIzaciones directas sobre <strong>los</strong> precios <strong>de</strong> aproxImadamente<br />
300 articulas especiflcos. Los promedios <strong>de</strong> dIchas cotizaciones dan lugar a <strong>los</strong> índIces <strong>de</strong> <strong>los</strong> 210 conceptos<br />
genériCOS sobre <strong>los</strong> bienes <strong>de</strong> producción y ccnsumo que forman la canasta <strong>de</strong>l índice general. La fórmula utl!Jzada<br />
para elaborar el índice es la <strong>de</strong> pon<strong>de</strong>raciones fijas <strong>de</strong> Laspeyres.<br />
FUENTE: Banco <strong>de</strong> México. Dirección <strong>de</strong> Investigación Económica.<br />
398