Plan Estratégico de la Patata de Castilla y León 2010-2013
Plan Estratégico de la Patata de Castilla y León 2010-2013
Plan Estratégico de la Patata de Castilla y León 2010-2013

Create successful ePaper yourself
Turn your PDF publications into a flip-book with our unique Google optimized e-Paper software.
<strong>P<strong>la</strong>n</strong> Estratégico <strong>de</strong> <strong>la</strong> <strong>Patata</strong> <strong>de</strong> Castil<strong>la</strong> y León <strong>2010</strong>-<strong>2013</strong><br />
El <strong>P<strong>la</strong>n</strong> Estratégico <strong>de</strong> <strong>la</strong> <strong>Patata</strong> <strong>de</strong> Castil<strong>la</strong> y León tiene como finalidad dar apoyo al sector <strong>de</strong> <strong>la</strong><br />
patata a través <strong>de</strong> 6 ejes o líneas <strong>de</strong> actuación en <strong>la</strong>s que se enmarcan actuaciones como<br />
<strong>la</strong>s ayudas a <strong>la</strong> formación, mejoras tecnológicas, controles sanitarios, certificación <strong>de</strong> <strong>la</strong>s<br />
producciones, mejora <strong>de</strong> <strong>la</strong>s condiciones <strong>de</strong> arranque y manipu<strong>la</strong>ción, potenciar <strong>la</strong> inversión<br />
privada... y muchas otras que se incluyen <strong>de</strong>ntro los 6 ejes estratégicos<br />
• Agentes <strong>de</strong>l sector<br />
• Producción<br />
• Control <strong>de</strong> <strong>la</strong> producción<br />
• Infraestructuras y transformación<br />
• Comercialización y Consumo<br />
• I+D+i<br />
Justificación <strong>de</strong>l p<strong>la</strong>n<br />
El sector <strong>de</strong> <strong>la</strong> patata es un sector sin una Organización Común <strong>de</strong> Mercado (OCM) y con varios<br />
intentos fallidos <strong>de</strong> creación <strong>de</strong> una interprofesional a nivel nacional. Ello provoca que esté<br />
sometido a gran<strong>de</strong>s fluctuaciones tanto en los niveles <strong>de</strong> producción como <strong>de</strong> precios,<br />
provocadas por <strong>la</strong> situación <strong>de</strong> los mercados tanto a nivel nacional como internacional, <strong>la</strong> no<br />
regu<strong>la</strong>ción <strong>de</strong> <strong>la</strong> oferta y <strong>la</strong> <strong>de</strong>manda, <strong>la</strong> estacionalidad <strong>de</strong> <strong>la</strong>s producciones, los condicionantes<br />
agro climáticos y <strong>la</strong> inexistencia, en <strong>la</strong> mayoría <strong>de</strong> <strong>la</strong>s ocasiones, <strong>de</strong> elementos contractuales que<br />
aseguren <strong>la</strong> rentabilidad <strong>de</strong> <strong>la</strong>s explotaciones.<br />
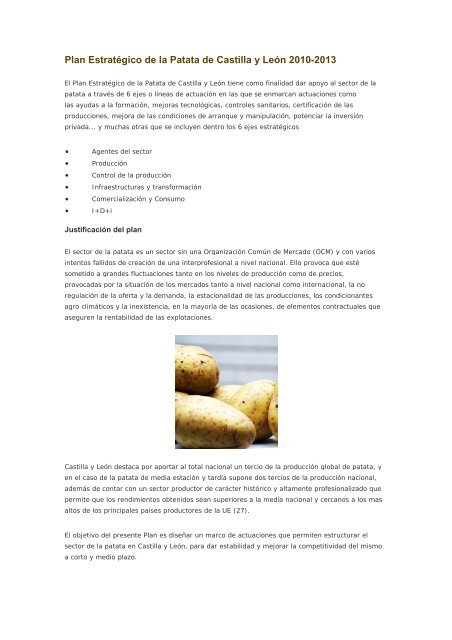
Castil<strong>la</strong> y León <strong>de</strong>staca por aportar al total nacional un tercio <strong>de</strong> <strong>la</strong> producción global <strong>de</strong> patata, y<br />
en el caso <strong>de</strong> <strong>la</strong> patata <strong>de</strong> media estación y tardía supone dos tercios <strong>de</strong> <strong>la</strong> producción nacional,<br />
a<strong>de</strong>más <strong>de</strong> contar con un sector productor <strong>de</strong> carácter histórico y altamente profesionalizado que<br />
permite que los rendimientos obtenidos sean superiores a <strong>la</strong> media nacional y cercanos a los mas<br />
altos <strong>de</strong> los principales países productores <strong>de</strong> <strong>la</strong> UE (27).<br />
El objetivo <strong>de</strong>l presente <strong>P<strong>la</strong>n</strong> es diseñar un marco <strong>de</strong> actuaciones que permiten estructurar el<br />
sector <strong>de</strong> <strong>la</strong> patata en Castil<strong>la</strong> y León, para dar estabilidad y mejorar <strong>la</strong> competitividad <strong>de</strong>l mismo<br />
a corto y medio p<strong>la</strong>zo.
Posteriormente, y como resultado <strong>de</strong> un <strong>de</strong>tal<strong>la</strong>do análisis y diagnóstico global <strong>de</strong>l sector, se<br />
enmarcarán <strong>la</strong>s estrategias concretas <strong>de</strong>rivadas <strong>de</strong> <strong>la</strong> situación y perspectivas sectoriales y <strong>de</strong>l<br />
posicionamiento <strong>de</strong> los agentes que lo componen, i<strong>de</strong>ntificando objetivos específicos y líneas <strong>de</strong><br />
actuación concretas.<br />
Se i<strong>de</strong>ntificarán los retos a los que se enfrenta el sector, objetivos a alcanzar y <strong>la</strong>s <strong>de</strong>cisiones<br />
estratégicas que se p<strong>la</strong>smarán en <strong>la</strong> ejecución <strong>de</strong> unas líneas <strong>de</strong> actuación, tanto para los<br />
agentes <strong>de</strong>l sector como para <strong>la</strong> Administración regional, que será preciso aplicar<strong>la</strong>s para<br />
alcanzar el mo<strong>de</strong>lo diseñado.<br />
También se establecerán mecanismos <strong>de</strong> seguimiento <strong>de</strong>l <strong>P<strong>la</strong>n</strong>, que permitan evaluar los<br />
resultados que se vayan obteniendo periódicamente al aplicar <strong>la</strong>s medidas propuestas o <strong>la</strong> puesta<br />
en práctica <strong>de</strong> <strong>la</strong>s recomendaciones seña<strong>la</strong>das. Estos mecanismos <strong>de</strong> seguimiento o indicadores<br />
se evaluarán en <strong>la</strong>s reuniones que periódicamente celebre <strong>la</strong> Mesa Regional <strong>de</strong> <strong>la</strong> <strong>Patata</strong> <strong>de</strong><br />
Castil<strong>la</strong> y León, que será el órgano que habrá <strong>de</strong> ve<strong>la</strong>r por el cumplimiento y <strong>la</strong> aplicación <strong>de</strong>l<br />
presente <strong>P<strong>la</strong>n</strong>.<br />
El calendario <strong>de</strong> ejecución se e<strong>la</strong>boró estructurando <strong>la</strong> redacción <strong>de</strong>l <strong>P<strong>la</strong>n</strong> en tres gran<strong>de</strong>s<br />
apartados:<br />
1º Análisis y diagnóstico <strong>de</strong>l sector:<br />
Para realizar un análisis <strong>de</strong>l sector se p<strong>la</strong>nificaron reuniones tanto con <strong>la</strong>s mesas técnicas <strong>de</strong> <strong>la</strong><br />
patata como con diversos especialistas y profesionales <strong>de</strong>l sector (Appacale, Centro <strong>de</strong> control <strong>de</strong><br />
<strong>la</strong> patata <strong>de</strong> Albillos, ITACYL, Industrias y operadores <strong>de</strong>l sector, Cooperativas, etc.). A <strong>la</strong>s mesas<br />
técnicas asistieron representantes con perfil técnico <strong>de</strong> <strong>la</strong>s principales organizaciones agrarias,<br />
cooperativas <strong>de</strong> productores y <strong>de</strong> <strong>la</strong>s principales industrias procesadoras, tanto para consumo en<br />
fresco como para patata <strong>de</strong> uso industrial.<br />
2º Preparación <strong>de</strong>l Diagrama DAFO (Debilida<strong>de</strong>s, amenazas, fortalezas y oportunida<strong>de</strong>s).<br />
3º E<strong>la</strong>boración <strong>de</strong> <strong>la</strong>s medidas concretas <strong>de</strong>l <strong>P<strong>la</strong>n</strong>:<br />
En esta última fase se han <strong>de</strong>sarrol<strong>la</strong>do dos líneas <strong>de</strong> trabajo: Una línea ha consistido en diseñar<br />
una estrategia que, aplicándose mediante medidas concretas y perfectamente alcanzables<br />
consiga mejorar <strong>la</strong> competitividad <strong>de</strong>l sector productor y transformador <strong>de</strong> patatas. La otra línea<br />
ha consistido en incluir <strong>de</strong>terminadas recomendaciones y aportaciones que los miembros <strong>de</strong> <strong>la</strong><br />
Mesa <strong>de</strong> <strong>la</strong> <strong>Patata</strong> consi<strong>de</strong>raron necesario tener en cuenta para disponer <strong>de</strong> un análisis <strong>de</strong>l sector<br />
lo más completo posible.<br />
Castil<strong>la</strong> y León uno <strong>de</strong> los productores con mayores rendimientos a nivel mundial<br />
• A nivel mundial el conjunto <strong>de</strong> los países que forman <strong>la</strong> UE <strong>de</strong> los 27 son los mayores<br />
productores <strong>de</strong> patata seguidos <strong>de</strong> un país asiático como es China y siendo este último el que<br />
más superficie <strong>de</strong>dica a este cultivo seguido <strong>de</strong> Rusia.
• Los mayores rendimientos por hectárea los obtienen países como Nueva Ze<strong>la</strong>nda, EEUU y<br />
<strong>de</strong>ntro <strong>de</strong> <strong>la</strong> UE, Bélgica o Francia, si bien Castil<strong>la</strong> y León estaría entre <strong>la</strong>s regiones con<br />
mayores rendimientos a nivel mundial. Cabe <strong>de</strong>stacar que países con gran<strong>de</strong>s producciones<br />
como son China, Rusia o India tienen rendimientos muy bajos y no llegan ni a 20 t/ha.<br />
• La producción <strong>de</strong> patata en <strong>la</strong> U.E, al igual que <strong>la</strong> superficie <strong>de</strong>stinada a este cultivo, han<br />
<strong>de</strong>scendido progresivamente en <strong>la</strong> última década, siendo Polonia el principal país productor<br />
seguido <strong>de</strong> países referentes en este sector como son Alemania, Francia, Ho<strong>la</strong>nda y Reino<br />
Unido. España ocupa <strong>la</strong> octava posición en producción <strong>de</strong> patata y <strong>la</strong> séptima en superficie<br />
La patata <strong>de</strong> consumo en Castil<strong>la</strong> y León<br />
• La patata es uno <strong>de</strong> los principales cultivos en valor <strong>de</strong> producción en el regadío <strong>de</strong> <strong>la</strong><br />
Comunidad Castil<strong>la</strong> y León <strong>de</strong>spués <strong>de</strong>l maíz y el cuarto <strong>de</strong>l conjunto total (secano más<br />
regadío).<br />
• La producción <strong>de</strong> patatas en Castil<strong>la</strong> y León en el año 2008 fue <strong>de</strong> 773.000 tone<strong>la</strong>das y en<br />
el año 2009, se estiman unas 976.000 tone<strong>la</strong>das. Siguiendo <strong>la</strong> ten<strong>de</strong>ncia nacional, Castil<strong>la</strong> y<br />
León también ha sufrido una disminución en número <strong>de</strong> hectáreas y tone<strong>la</strong>das <strong>de</strong> patatas en<br />
<strong>la</strong> última década.<br />
• Val<strong>la</strong>dolid es <strong>la</strong> principal provincia productora seguida <strong>de</strong> Sa<strong>la</strong>manca y Burgos (esta<br />
última con un gran peso en <strong>la</strong> patata <strong>de</strong> siembra). Los mayores rendimientos en <strong>la</strong> última<br />
década se han obtenido en provincias como Val<strong>la</strong>dolid, Segovia, Soria y Zamora (por encima<br />
<strong>de</strong> 35 t/ha).<br />
• En Castil<strong>la</strong> y León <strong>la</strong> producción <strong>de</strong> patata <strong>de</strong> secano es anecdótica situándose por <strong>de</strong>bajo<br />
<strong>de</strong>l 2%. En cuanto a <strong>la</strong> época <strong>de</strong> recolección toma enorme importancia <strong>la</strong> patata tardía (es <strong>la</strong><br />
que mayormente se produce en esta Comunidad por encima <strong>de</strong>l 60 %) seguida <strong>de</strong> <strong>la</strong> patata<br />
<strong>de</strong> media estación.<br />
• Sa<strong>la</strong>manca es <strong>la</strong> provincia que más producción tiene <strong>de</strong> patata <strong>de</strong> media estación y<br />
Val<strong>la</strong>dolid ocupa este lugar para <strong>la</strong> patata tardía.<br />
• La Producción Integrada como sistema <strong>de</strong> cultivo contro<strong>la</strong>do, es poco representativo en<br />
Castil<strong>la</strong> y León; siendo un reto importante para esta Comunidad, <strong>la</strong> imp<strong>la</strong>ntación <strong>de</strong> estos<br />
métodos <strong>de</strong> producción certificada
PLAN ESTRATÉGICO<br />
DEL SECTOR DE LA PATATA<br />
EN CASTILLA Y LEÓN <strong>2010</strong>-<strong>2013</strong>
JUSTIFICACIÓN DEL PLAN<br />
El sector <strong>de</strong> <strong>la</strong> patata es un sector sin una Organización Común <strong>de</strong> Mercado (OCM) y con varios<br />
intentos fallidos <strong>de</strong> creación <strong>de</strong> una interprofesional a nivel nacional. Ello provoca que esté<br />
sometido a gran<strong>de</strong>s fluctuaciones tanto en los niveles <strong>de</strong> producción como <strong>de</strong> precios,<br />
provocadas por <strong>la</strong> situación <strong>de</strong> los mercados tanto a nivel nacional como internacional, <strong>la</strong> no<br />
regu<strong>la</strong>ción <strong>de</strong> <strong>la</strong> oferta y <strong>la</strong> <strong>de</strong>manda, <strong>la</strong> estacionalidad <strong>de</strong> <strong>la</strong>s producciones, los<br />
condicionantes agro climáticos y <strong>la</strong> inexistencia, en <strong>la</strong> mayoría <strong>de</strong> <strong>la</strong>s ocasiones, <strong>de</strong> elementos<br />
contractuales que aseguren <strong>la</strong> rentabilidad <strong>de</strong> <strong>la</strong>s explotaciones.<br />
Castil<strong>la</strong> y León <strong>de</strong>staca por aportar al total nacional un tercio <strong>de</strong> <strong>la</strong> producción global <strong>de</strong><br />
patata, y en el caso <strong>de</strong> <strong>la</strong> patata <strong>de</strong> media estación y tardía supone dos tercios <strong>de</strong> <strong>la</strong><br />
producción nacional, a<strong>de</strong>más <strong>de</strong> contar con un sector productor <strong>de</strong> carácter histórico y<br />
altamente profesionalizado que permite que los rendimientos obtenidos sean superiores a <strong>la</strong><br />
media nacional y cercanos a los mas altos <strong>de</strong> los principales países productores <strong>de</strong> <strong>la</strong> UE (27).<br />
El objetivo <strong>de</strong>l presente <strong>P<strong>la</strong>n</strong> es diseñar un marco <strong>de</strong> actuaciones que permiten estructurar el<br />
sector <strong>de</strong> <strong>la</strong> patata en Castil<strong>la</strong> y León, para dar estabilidad y mejorar <strong>la</strong> competitividad <strong>de</strong>l<br />
mismo a corto y medio p<strong>la</strong>zo.<br />
Posteriormente, y como resultado <strong>de</strong> un <strong>de</strong>tal<strong>la</strong>do análisis y diagnóstico global <strong>de</strong>l sector, se<br />
enmarcarán <strong>la</strong>s estrategias concretas <strong>de</strong>rivadas <strong>de</strong> <strong>la</strong> situación y perspectivas sectoriales y <strong>de</strong>l<br />
posicionamiento <strong>de</strong> los agentes que lo componen, i<strong>de</strong>ntificando objetivos específicos y líneas<br />
<strong>de</strong> actuación concretas.<br />
Se i<strong>de</strong>ntificarán los retos a los que se enfrenta el sector, objetivos a alcanzar y <strong>la</strong>s <strong>de</strong>cisiones<br />
estratégicas que se p<strong>la</strong>smarán en <strong>la</strong> ejecución <strong>de</strong> unas líneas <strong>de</strong> actuación, tanto para los<br />
agentes <strong>de</strong>l sector como para <strong>la</strong> Administración regional, que será preciso aplicar<strong>la</strong>s para<br />
alcanzar el mo<strong>de</strong>lo diseñado.<br />
También se establecerán mecanismos <strong>de</strong> seguimiento <strong>de</strong>l <strong>P<strong>la</strong>n</strong>, que permitan evaluar los<br />
resultados que se vayan obteniendo periódicamente al aplicar <strong>la</strong>s medidas propuestas o <strong>la</strong><br />
puesta en práctica <strong>de</strong> <strong>la</strong>s recomendaciones seña<strong>la</strong>das. Estos mecanismos <strong>de</strong> seguimiento o<br />
indicadores se evaluarán en <strong>la</strong>s reuniones que periódicamente celebre <strong>la</strong> Mesa Regional <strong>de</strong> <strong>la</strong><br />
<strong>Patata</strong> <strong>de</strong> Castil<strong>la</strong> y León, que será el órgano que habrá <strong>de</strong> ve<strong>la</strong>r por el cumplimiento y <strong>la</strong><br />
aplicación <strong>de</strong>l presente <strong>P<strong>la</strong>n</strong>.<br />
El calendario <strong>de</strong> ejecución se e<strong>la</strong>boró estructurando <strong>la</strong> redacción <strong>de</strong>l <strong>P<strong>la</strong>n</strong> en tres gran<strong>de</strong>s<br />
apartados:
1) Análisis y diagnóstico <strong>de</strong>l sector:<br />
Para realizar un análisis <strong>de</strong>l sector se p<strong>la</strong>nificaron reuniones tanto con <strong>la</strong>s mesas<br />
técnicas <strong>de</strong> <strong>la</strong> patata como con diversos especialistas y profesionales <strong>de</strong>l sector<br />
(Appacale, Centro <strong>de</strong> control <strong>de</strong> <strong>la</strong> patata <strong>de</strong> Albillos, ITACYL, Industrias y operadores<br />
<strong>de</strong>l sector, Cooperativas, etc.). A <strong>la</strong>s mesas técnicas asistieron representantes con<br />
perfil técnico <strong>de</strong> <strong>la</strong>s principales organizaciones agrarias, cooperativas <strong>de</strong> productores<br />
y <strong>de</strong> <strong>la</strong>s principales industrias procesadoras, tanto para consumo en fresco como para<br />
patata <strong>de</strong> uso industrial.<br />
2) Preparación <strong>de</strong>l Diagrama DAFO (Debilida<strong>de</strong>s, amenazas, fortalezas y oportunida<strong>de</strong>s).<br />
3) E<strong>la</strong>boración <strong>de</strong> <strong>la</strong>s medidas concretas <strong>de</strong>l <strong>P<strong>la</strong>n</strong>:<br />
En esta última fase se han <strong>de</strong>sarrol<strong>la</strong>do dos líneas <strong>de</strong> trabajo: Una línea ha consistido<br />
en diseñar una estrategia que, aplicándose mediante medidas concretas y<br />
perfectamente alcanzables consiga mejorar <strong>la</strong> competitividad <strong>de</strong>l sector productor y<br />
transformador <strong>de</strong> patatas. La otra línea ha consistido en incluir <strong>de</strong>terminadas<br />
recomendaciones y aportaciones que los miembros <strong>de</strong> <strong>la</strong> Mesa <strong>de</strong> <strong>la</strong> <strong>Patata</strong><br />
consi<strong>de</strong>raron necesario tener en cuenta para disponer <strong>de</strong> un análisis <strong>de</strong>l sector lo más<br />
completo posible.<br />
En <strong>la</strong> página siguiente se refleja el cronograma que <strong>de</strong>scribe <strong>la</strong>s actuaciones llevadas a cabo<br />
para <strong>la</strong> redacción y e<strong>la</strong>boración <strong>de</strong>l presente <strong>P<strong>la</strong>n</strong>.
ANÁLISIS Y DIAGNÓSTICO DEL SECTOR<br />
oct-09 nov-09 dic-09 ene-10 feb-10<br />
mar-10<br />
abr-10<br />
TAREAS 42 43 44 45 46 47 48 49 50 51 52 1 2 3 4 5 6 7 8 9 10 11 12 13 14 15 16 17 18<br />
Reunión con Directivos <strong>de</strong> <strong>la</strong> Consejería.<br />
Formación <strong>de</strong>l grupo <strong>de</strong> trabajo <strong>de</strong>l <strong>P<strong>la</strong>n</strong>.<br />
Presentación <strong>de</strong> los objetivos <strong>de</strong>l p<strong>la</strong>n a <strong>la</strong> Mesa <strong>de</strong> <strong>la</strong> <strong>Patata</strong><br />
Co<strong>la</strong>boración con mesas técnicas <strong>de</strong> <strong>la</strong> patata<br />
Toma <strong>de</strong> datos y recopi<strong>la</strong>ción <strong>de</strong> información<br />
Entrevistas con profesionales y expertos<br />
Redacción <strong>de</strong>l Análisis <strong>de</strong>l sector<br />
Redacción <strong>de</strong>l DAFO<br />
MEDIDAS CONCRETAS DEL PLAN<br />
Presentación <strong>de</strong>l borrador a <strong>la</strong> Mesa <strong>de</strong> <strong>la</strong> <strong>Patata</strong><br />
Definición <strong>de</strong> objetivos específicos y líneas <strong>de</strong> actuación <strong>de</strong>l p<strong>la</strong>n.<br />
Revisión <strong>de</strong>l borrador, incluyendo modificaciones propuestas.<br />
Presentación <strong>de</strong>l documento <strong>de</strong>finitivo
ÍNDICE<br />
1 CONDICIONANTES LEGALES DEL SECTOR DE LA PATATA .................................... 9<br />
1.1 LEGISLACIÓN A NIVEL COMUNITARIO .............................................................9<br />
1.2 LEGISLACIÓN A NIVEL NACIONAL ................................................................ 10<br />
1.3 LEGISLACIÓN A NIVEL AUTONÓMICO............................................................ 11<br />
2 ANÁLISIS DE LA PRODUCCIÓN DE PATATA A NIVEL MUNDIAL Y DE LA UNIÓN EUROPEA<br />
..........................................................................................................13<br />
2.1 PRODUCCIÓN, SUPERFICIE Y RENDIMIENTO DE PATATA EN EL MUNDO ................... 13<br />
2.2 PRODUCCIÓN, SUPERFICIE Y RENDIMIENTOS DE PATATA EN LA UE........................ 18<br />
3 ANÁLISIS DE LA PRODUCCIÓN DE PATATA EN ESPAÑA.......................................25<br />
3.1 PRODUCCIÓN, SUPERFICIE Y RENDIMIENTOS DE PATATA EN ESPAÑA ..................... 25<br />
3.2 CALENDARIO Y ESTRUCTURA DE LA PRODUCCIÓN DE PATATA EN ESPAÑA ............... 31<br />
3.3 DESTINO, USO DE LA PRODUCCIÓN Y BALANCE DE UTILIZACIÓN DE PATATA EN ESPAÑA.<br />
........................................................................................................ 40<br />
4 ANÁLISIS DE LA PRODUCCIÓN DE PATATA DE CONSUMO EN CASTILLA Y LEÓN ........43<br />
4.1 PRODUCCIÓN, SUPERFICIE Y RENDIMIENTOS DE PATATA EN CASTILLA Y LEÓN.......... 44<br />
4.2 LA PRODUCCIÓN INTEGRADA EN CASTILLA Y LEÓN........................................... 56<br />
5 ANÁLISIS DEL COMERCIO EXTERIOR DE PATATA EN LA UNIÓN EUROPEA................61<br />
5.1 ANALISIS DE LAS IMPORTACIONES DE PATATA DE LA UE..................................... 61<br />
5.2 ANALISIS DE LAS EXPORTACIONES DE PATATA DE CONSUMO DE LA UE ................... 63<br />
6 ANÁLISIS DEL COMERCIO EXTERIOR DE PATATA EN ESPAÑA ...............................67<br />
6.1 ANÁLISIS DE LAS IMPORTACIONES DE PATATA EN ESPAÑA Y EN CASTILLA Y LEÓN...... 67<br />
6.2 ANÁLISIS DE LAS EXPORTACIONES DE PATATA DE ESPAÑA Y DE CASTILLA Y LEÓN...... 74<br />
6.3 COMPARACIÓN DE LAS IMPORTACIONES Y EXPORTACIONES DE PATATA DE ESPAÑA Y DE<br />
CASTILLA Y LEÓN................................................................................... 81<br />
7 ESTIMACIÓN DE LOS COSTES DE PRODUCCIÓN DE PATATA EN CASTILLA Y LEÓN Y<br />
VIABILIDAD DEL ALMACENAMIENTO .....................................................................85<br />
7.1 ESTIMACIÓN DE COSTES........................................................................... 85<br />
7.2 VIABILIDAD DEL ALMACENAMIENTO ............................................................. 86<br />
8 ESTUDIO DE LOS PRECIOS DE PATATA DE CONSUMO EN ESPAÑA .........................89<br />
9 ANALISIS DEL CONSUMO DE PATATA ............................................................99<br />
9.1 CONSUMO DE PATATA EN LA UE ................................................................. 99<br />
9.2 CARACTERISTICAS DE LOS HOGARES EN CUANTO AL CONSUMO DE PATATAS DURANTE<br />
EL AÑO 2008 .......................................................................................100<br />
9.3 HÁBITOS DE CONSUMO ...........................................................................105<br />
9.4 COMPORTAMIENTOS EN EL ACTO DE COMPRA DE PATATAS................................106<br />
9.5 CANTIDAD CONSUMIDA Y GASTO DE DE PATATA EN ESPAÑA ..............................106<br />
10 ANALISIS DE LA COMERCIALIZACION DE PATATA ........................................... 111<br />
10.1 COMERCIALIZACION EN ORIGEN ................................................................113<br />
10.2 EMPRESAS COMERCIALIZADORAS EN ORIGEN Y DESTINO (ALMACENES DE SELECCIÓN,<br />
CLASIFICADO Y ENVASADO)......................................................................118<br />
10.3 COMERCIALIZACION EN DESTINO ...............................................................122<br />
10.4 CANALES DE COMERCIALIZACIÓN ...............................................................126<br />
10.5 DIFERENCIAS EN LA COMERCIALIZACION DE PATATA DE CASTILLA Y LEON Vs FRANCIA...<br />
...........................................................................................................<br />
.......................................................................................................128<br />
11 SITUACIÓN DE LA PATATA DE SIEMBRA ....................................................... 135<br />
11.1 PRODUCCIÓN DE PATATA DE SIEMBRA.........................................................135<br />
11.2 PATATA DE SIEMBRA EN LA UE..................................................................136<br />
11.3 COMERCIO DE LA PATATA DE SIEMBRA. .......................................................140<br />
7
11.4 LA PATATA DE SIEMBRA EN ESPAÑA Y EN CASTILLA Y LEÓN ...............................146<br />
11.5 ANÁLISIS DEL SECTOR PRODUCTOR ............................................................149<br />
11.6 VARIEDADES CULTIVADAS Y SUS SUPERFICIES ................................................151<br />
11.7 PRECIOS.............................................................................................154<br />
11.8 IMPORTACIONES ...................................................................................155<br />
11.9 ENSAYOS DE POST CONTROL ....................................................................155<br />
11.10 ZONAS DE VENTA DE LAS PRODUCCIONES DE SEMILLA DE CASTILLA Y LEÓN............157<br />
ANEXO I: ......................................................................................................163<br />
12 ANÁLISIS DE LOS PRINCIPALES PAÍSES PRODUCTORES DE LA UNIÓN EUROPEA ...... 171<br />
12.1 EL SECTOR DE LA PATATA EN FRANCIA........................................................171<br />
12.2 SITUACIÓN DEL CULTIVO DE LA PATATA EN EL REINO UNIDO. ............................187<br />
12.3 ESTUDIO DE LOS COSTES DE PRODUCCIÓN EN EL CULTIVO DE LA PATATA EN EUROPA...<br />
.......................................................................................................195<br />
12.4 LA PATATA EN PORTUGAL .......................................................................203<br />
13 SITUACIÓN Y ACTUACIONES DE LA I+D+i EN PATATA EN ESPAÑA....................... 209<br />
13.1 BREVE RESEÑA SOBRE LA HISTORIA DE LA INVESTIGACIÓN DEL CULTIVO DE LA PATATA<br />
EN ESPAÑA .........................................................................................209<br />
13.2 RED NACIONAL DE INNOVACIÓN EN PATATA (RED PAPATA)................................210<br />
13.3 NEIKER-TECNALIA (Instituto Vasco <strong>de</strong> Investigación y Desarrollo Agrario) .............212<br />
13.4 OTROS GRUPOS DE INVESTIGACIÓN EN ESPAÑA .............................................214<br />
13.5 DESARROLLO DE VARIEDADES DE PATATA TRANSGÉNICA ..................................216<br />
14 SITUACIÓN Y ACTUACIONES DE LA I+D+i EN PATATA EN CASTILLA Y LEÓN .......... 219<br />
14.1 CENTRO DE CONTROL DE LA PATATA DE ALBILLOS (BURGOS).............................219<br />
14.2 CENTRO REGIONAL DE DIAGNÓSTICO DE ALDEARRUBIA (SALAMANCA) ..................220<br />
14.3 INSTITUTO TECNOLÓGICO AGRARIO DE CASTILLA Y LEÓN (ITACYL) .....................221<br />
14.4 AGRUPACIÓN DE PRODUCTORES DE PATATA DE SIEMBRA DE CASTILLA Y LEÓN<br />
(APPACALE) ........................................................................................229<br />
15 COMPOSICIÓN QUÍMICA Y VALOR NUTRITIVO DE LA PATATA ............................ 235<br />
15.1 LA PATATA: RIQUEZA IGNORADA. ..............................................................235<br />
15.2 COMPOSICIÓN QUÍMICA DE LA PATATA ........................................................236<br />
15.3 CALIDAD NUTRITIVA ..............................................................................237<br />
16 ANÁLISIS DEL SECTOR: DAFO ................................................................... 241<br />
17 PLAN DE ACTUACIÓN Y PROPUESTAS DE TRABAJO ........................................ 247<br />
18 ANEXO I: ENCUESTA A AGRICULTORES……………………………………………………………….....255<br />
19 ANEXO II: ENCUESTA A OPERADORES.……………………………………………………………………..275<br />
20 BIBLIOGRAFÍA Y DOCUMENTACIÓN……………………………………………………………………………285<br />
21 ÍNDICE DE TABLAS Y GRÁFICOS…………………………………………………………………………………287<br />
8
1 CONDICIONANTES LEGALES DEL SECTOR DE LA PATATA<br />
El sector <strong>de</strong> <strong>la</strong> patata tradicionalmente ha carecido <strong>de</strong> regu<strong>la</strong>ción en materia <strong>de</strong> mecanismos<br />
<strong>de</strong> actuación sobre los mercados. Sólo existen <strong>de</strong>terminadas actuaciones administrativas en<br />
este sentido para <strong>la</strong> patata <strong>de</strong>stinada a <strong>la</strong> industria feculera.<br />
1.1 LEGISLACIÓN A NIVEL COMUNITARIO<br />
Como es conocido, <strong>la</strong> patata es <strong>de</strong> los pocos productos agroalimentarios que no cuentan con<br />
una OCM (Organización Común <strong>de</strong> Mercado) que le brin<strong>de</strong> <strong>de</strong>terminados mecanismos<br />
regu<strong>la</strong>dores <strong>de</strong> su producción y comercialización que contribuyan a una estabilidad <strong>de</strong> los<br />
mercados y <strong>de</strong> <strong>la</strong>s rentas <strong>de</strong> los agricultores; aunque también existen productos que estando<br />
amparados por una OCM no están exentos <strong>de</strong> estar en situación <strong>de</strong> cierta inestabilidad en <strong>la</strong><br />
actualidad (Leche, vino, cereales, etc.).<br />
A nivel <strong>de</strong> ayudas comunitarias so<strong>la</strong>mente caben medidas <strong>de</strong> apoyo en el caso <strong>de</strong> patatas<br />
<strong>de</strong>stinadas a <strong>la</strong> industria feculera, que se exponen a continuación:<br />
• Ayudas para patatas <strong>de</strong>stinadas a <strong>la</strong> industria feculera:<br />
Tiene importancia capital el REGLAMENTO (CE) 1234/2007 DEL CONSEJO, por el que se crea<br />
una organización común <strong>de</strong> mercados agríco<strong>la</strong>s y se establecen disposiciones específicas para<br />
<strong>de</strong>terminados productos agríco<strong>la</strong>s (Reg<strong>la</strong>mento único para <strong>la</strong>s OCM). En este Reg<strong>la</strong>mento se<br />
establece un sistema <strong>de</strong> ayudas para el mercado <strong>de</strong> fécu<strong>la</strong> <strong>de</strong> patata, que consisten<br />
básicamente en restituciones a <strong>la</strong> exportación <strong>de</strong> este producto (primas <strong>de</strong> exportación), si<br />
bien para proce<strong>de</strong>r al cobro <strong>de</strong> esa prima se exige un precio mínimo pagado al productor <strong>de</strong><br />
patata.<br />
España tiene asignada una cuota <strong>de</strong> 1.943 tone<strong>la</strong>das, que se distribuyen entre <strong>la</strong>s empresas<br />
productoras <strong>de</strong> fécu<strong>la</strong>. El importe total asignado a España para esta medida es <strong>de</strong> 43.000 €.<br />
Por otra parte, el REGLAMENTO (CE) 73/2009 DEL CONSEJO, por el que se establecen<br />
disposiciones comunes aplicables a los regímenes <strong>de</strong> ayuda directa a los agricultores en el<br />
marco <strong>de</strong> <strong>la</strong> política agríco<strong>la</strong> común y se instauran <strong>de</strong>terminados regímenes <strong>de</strong> ayuda a los<br />
agricultores. En sus artículos 77 y 78 se <strong>de</strong>termina un régimen <strong>de</strong> apoyo a los productores <strong>de</strong><br />
patata <strong>de</strong> fécu<strong>la</strong>, que se traduce en una ayuda que ascen<strong>de</strong>rá a 66,32 € para <strong>la</strong> cantidad <strong>de</strong><br />
patatas necesaria para <strong>la</strong> fabricación <strong>de</strong> una tone<strong>la</strong>da <strong>de</strong> fécu<strong>la</strong>; abonándose exclusivamente<br />
<strong>la</strong> ayuda por <strong>la</strong>s cantida<strong>de</strong>s <strong>de</strong> patatas por <strong>la</strong>s cuales el agricultor y el fabricante <strong>de</strong> fécu<strong>la</strong> <strong>de</strong><br />
9
patata hayan suscrito un contrato <strong>de</strong> cultivo, <strong>de</strong>ntro <strong>de</strong> los límites <strong>de</strong> <strong>la</strong> cuota asignada a<br />
dicho fabricante.<br />
El importe total asignado a España es <strong>de</strong> 129.000 €.<br />
1.2 LEGISLACIÓN A NIVEL NACIONAL<br />
A nivel nacional no se han implementado ayudas para <strong>la</strong> producción, transformación y/o<br />
comercialización <strong>de</strong> patata <strong>de</strong> manera directa; si bien si que se han convocado otras<br />
actuaciones puntuales para intentar regu<strong>la</strong>r el mercado <strong>de</strong> <strong>la</strong> patata.<br />
Ejemplo <strong>de</strong> ello es <strong>la</strong> Or<strong>de</strong>n <strong>de</strong> 17 <strong>de</strong> septiembre <strong>de</strong> 1999 por <strong>la</strong> que se regu<strong>la</strong> una<br />
intervención en el mercado <strong>de</strong> <strong>la</strong> patata <strong>de</strong> consumo <strong>de</strong> <strong>la</strong> campaña 1999. (BOE 21/09/1.999).<br />
Mediante esta Or<strong>de</strong>n, el FEGA disponía <strong>la</strong> inmovilización <strong>de</strong> hasta 100.000 tone<strong>la</strong>das <strong>de</strong> patata<br />
<strong>de</strong> consumo producida, no <strong>de</strong>stinada a <strong>la</strong> industria feculera. Esta cantidad <strong>de</strong> inmovilización<br />
ascendió posteriormente hasta 250.000 tone<strong>la</strong>das por el elevado número <strong>de</strong> solicitu<strong>de</strong>s<br />
presentadas. La inmovilización se realizó por un máximo <strong>de</strong> 2 meses y <strong>la</strong> cuantía <strong>de</strong> <strong>la</strong> ayuda<br />
fue <strong>de</strong> hasta 2 pts/kg/mes.<br />
Por otra parte está el Real Decreto 970/2002, <strong>de</strong> 24 <strong>de</strong> septiembre, por el que se regu<strong>la</strong> el<br />
reconocimiento <strong>de</strong> <strong>la</strong>s agrupaciones <strong>de</strong> productores <strong>de</strong> patatas <strong>de</strong> consumo no <strong>de</strong>stinadas a <strong>la</strong><br />
industria feculera. Este Real Decreto conce<strong>de</strong> ayudas a <strong>la</strong>s APAs (Agrupaciones <strong>de</strong><br />
Productores Agrarios). Las ayudas concedidas pue<strong>de</strong>n ser:<br />
1.-A <strong>la</strong> constitución y funcionamiento <strong>de</strong> <strong>la</strong>s agrupaciones.<br />
2.-A <strong>la</strong> mejora <strong>de</strong> <strong>la</strong>s estructuras productivas y <strong>de</strong> comercialización <strong>de</strong> <strong>la</strong>s<br />
agrupaciones.<br />
Estas ayudas han supuesto en muchos casos <strong>la</strong> construcción <strong>de</strong> <strong>la</strong>s insta<strong>la</strong>ciones necesarias<br />
para el almacenaje, selección, calibración y conservación <strong>de</strong> patata. Se trata <strong>de</strong> ayudas<br />
cofinanciadas entre <strong>la</strong> Administración General <strong>de</strong>l Estado y <strong>la</strong> Administración Autonómica, a<br />
partes iguales. La cuantía pagada por ayudas en este concepto ascendía hasta el año 2009 a<br />
casi 13 millones <strong>de</strong> euros.<br />
También es necesario <strong>de</strong>stacar otras tres disposiciones que han repercutido en <strong>la</strong><br />
comercialización <strong>de</strong> <strong>la</strong> patata; por un <strong>la</strong>do el Real Decreto 31/2009 que establece <strong>la</strong> norma <strong>de</strong><br />
calidad comercial para patatas <strong>de</strong> consumo en el mercado nacional. Todas <strong>la</strong>s patatas <strong>de</strong><br />
consumo que se comercialicen y vayan <strong>de</strong>stinadas al consumidor final han <strong>de</strong> estar sometidas<br />
a dicha norma.<br />
Por otro <strong>la</strong>do es importante <strong>la</strong> Ley 2/2000, <strong>de</strong> 7 <strong>de</strong> enero, regu<strong>la</strong> los contratos tipo <strong>de</strong><br />
productos agroalimentarios, ya que al amparo <strong>de</strong> dicha Ley se homologan los contratos tipo<br />
10
que se celebren entre productores y transformadores <strong>de</strong> patata. Este instrumento es una<br />
garantía <strong>de</strong> rentas para el productor en <strong>la</strong> compraventa <strong>de</strong> patata <strong>de</strong>dicada a <strong>la</strong> industria <strong>de</strong><br />
transformación. Este mecanismo ha sido uno <strong>de</strong> los más eficaces para estabilizar el mercado,<br />
pero está limitado a <strong>la</strong>s patatas <strong>de</strong> industria.<br />
También hay que <strong>de</strong>stacar que en los últimos años se puso en marcha una experiencia piloto<br />
<strong>de</strong> seguro <strong>de</strong> rentas en patata. Este seguro cubría el riesgo <strong>de</strong> precios bajos en origen; y no se<br />
mantuvo en el tiempo por el bajo número <strong>de</strong> pólizas contratadas. Si hubiese tenido éxito,<br />
situaciones como <strong>la</strong> <strong>de</strong>l año 2009 no se repetirían. No obstante, sí que son asegurables otros<br />
riesgos más comunes (pedrisco, inundación, he<strong>la</strong>da, etc.).<br />
1.3 LEGISLACIÓN A NIVEL AUTONÓMICO<br />
A<strong>de</strong>más <strong>de</strong> <strong>la</strong> gestión y cofinanciación <strong>de</strong> <strong>la</strong>s ayudas a agrupaciones <strong>de</strong> productores <strong>de</strong> patatas<br />
<strong>de</strong> consumo comentadas en el apartado anterior, es <strong>de</strong>stacable <strong>la</strong> Or<strong>de</strong>n AYG/1213/2005, <strong>de</strong><br />
22 <strong>de</strong> septiembre, por <strong>la</strong> que se regu<strong>la</strong> una intervención en el mercado <strong>de</strong> <strong>la</strong> patata <strong>de</strong><br />
consumo <strong>de</strong> <strong>la</strong> campaña 2005-2006 (BOCYL 23/09/2005); se proponía conce<strong>de</strong>r ayudas a <strong>la</strong>s<br />
agrupaciones <strong>de</strong> productores <strong>de</strong> patata para consumo, para <strong>la</strong> inmovilización <strong>de</strong> hasta 80.000<br />
tone<strong>la</strong>das <strong>de</strong> patata no <strong>de</strong>stinada a <strong>la</strong> industria feculera, concediéndose ayudas tanto para el<br />
almacenamiento como para <strong>la</strong> conservación.<br />
A<strong>de</strong>más <strong>de</strong> ayudas específicas para patata, están otras ayudas <strong>de</strong> carácter general para el<br />
sector primario en <strong>la</strong>s que <strong>de</strong> una u otra manera, se apoya al sector; tanto en <strong>la</strong> fase <strong>de</strong><br />
producción (ayuda a mejora <strong>de</strong> explotaciones agrarias, nuevas tecnologías, ayuda<br />
agroambiental, etc.) como en <strong>la</strong> fase <strong>de</strong> transformación y comercialización (ayudas a<br />
cooperativismo, ayudas a industrias agrarias, etc.). Estas ayudas están basadas en medidas<br />
concretas <strong>de</strong>l Programa <strong>de</strong> Desarrollo Rural <strong>de</strong> Castil<strong>la</strong> y León (PDR) 2007-<strong>2013</strong>. Para <strong>la</strong>s<br />
inversiones en <strong>la</strong> mejora <strong>de</strong> <strong>la</strong>s estructuras productivas <strong>de</strong> <strong>la</strong>s explotaciones agrarias, <strong>la</strong>s<br />
Medidas 112 y 121 <strong>de</strong>l mencionado Programa y para <strong>la</strong>s inversiones en mejora <strong>de</strong><br />
transformación y comercialización <strong>de</strong> productos agrarios, <strong>la</strong> Medida 123.<br />
También figuran apartados específicos para patata en otras disposiciones <strong>de</strong> carácter<br />
horizontal como <strong>la</strong> Producción Integrada o como <strong>la</strong> Agricultura Ecológica.<br />
En el capítulo <strong>de</strong>dicado a <strong>la</strong> patata <strong>de</strong> siembra se seña<strong>la</strong> también <strong>la</strong> legis<strong>la</strong>ción que afecta a<br />
los productores <strong>de</strong> semil<strong>la</strong>, que es muy diversa y distinta a <strong>la</strong> <strong>de</strong> consumo.<br />
11
CONCLUSIONES<br />
o<br />
o<br />
o<br />
La patata es un cultivo caracterizado por <strong>la</strong> ausencia <strong>de</strong> regu<strong>la</strong>ción en su<br />
producción y en su comercialización.<br />
A nivel europeo <strong>la</strong> regu<strong>la</strong>ción afecta a <strong>la</strong> patata <strong>de</strong> fécu<strong>la</strong>. En España, <strong>la</strong><br />
producción <strong>de</strong> patata <strong>de</strong> fécu<strong>la</strong> prácticamente no existe.<br />
A nivel nacional y autonómico no se ha establecido ninguna medida <strong>de</strong><br />
carácter estructural.<br />
12
2 ANÁLISIS DE LA PRODUCCIÓN DE PATATA A NIVEL MUNDIAL Y DE LA<br />
UNIÓN EUROPEA<br />
En este capítulo se <strong>de</strong>scribe <strong>la</strong> situación productiva <strong>de</strong>l sector <strong>de</strong> <strong>la</strong> patata, tanto en el<br />
ámbito mundial como en el <strong>de</strong> <strong>la</strong> Europa comunitaria <strong>de</strong> los 27.<br />
2.1 PRODUCCIÓN, SUPERFICIE Y RENDIMIENTO DE PATATA EN EL MUNDO<br />
Consi<strong>de</strong>rando <strong>la</strong> serie <strong>de</strong> años 1998-2008, <strong>la</strong> producción mundial <strong>de</strong> patata ha estado<br />
comprendida entre los algo más <strong>de</strong> 331,2 millones <strong>de</strong> tone<strong>la</strong>das <strong>de</strong> 2004 como límite máximo<br />
y los 300,6 millones <strong>de</strong> 1999 como límite mínimo. En <strong>la</strong> tab<strong>la</strong> 2.1 y en el gráfico 2.1 se<br />
muestran los principales países productores.<br />
GRÁFICO 2.1. PRODUCCIÓN MUNDIAL DE PATATA EN EL AÑO 2008, EXPRESADA EN MILLONES DE TONELADAS.<br />
70<br />
60<br />
50<br />
40<br />
30<br />
20<br />
10<br />
0<br />
UE (27)<br />
China<br />
India<br />
Rusia<br />
Ucrania<br />
EE.UU<br />
Bielorrusia<br />
Bang<strong>la</strong><strong>de</strong>sh<br />
Irán<br />
Canadá<br />
Fuente: E<strong>la</strong>boración propia a partir <strong>de</strong> datos <strong>de</strong> FAOSTAT.<br />
En el año 2008, <strong>la</strong> UE (27) fue <strong>la</strong> principal zona productora, con un 19,60% <strong>de</strong> <strong>la</strong> producción<br />
mundial (6,16 millones <strong>de</strong> t), seguido <strong>de</strong> China (18,20%), India (11%), Rusia (9,2%) y Ucrania<br />
(6,2%).<br />
En lo referente a <strong>la</strong> superficie, el cultivo <strong>de</strong> <strong>la</strong> patata ocupó alre<strong>de</strong>dor <strong>de</strong> 18,2 millones <strong>de</strong><br />
hectáreas a nivel mundial en el año 2008. Tal y como se pue<strong>de</strong> observar en el gráfico 2.2, <strong>la</strong><br />
lista <strong>de</strong> países con mayor superficie está encabezada por China con 4,45 millones <strong>de</strong><br />
hectáreas (que representa un 24,48% <strong>de</strong>l total), seguido <strong>de</strong> <strong>la</strong> Unión Europea (27) (11,77%),<br />
Rusia (11,53%), India (9,82%) y Ucrania (7,74%). En <strong>la</strong> tab<strong>la</strong> 2.2 se muestran los países con<br />
mayor superficie mundial.<br />
Consi<strong>de</strong>rando que <strong>la</strong> UE es <strong>la</strong> principal zona productora y <strong>la</strong> tercera en superficie, resulta<br />
evi<strong>de</strong>nte que los rendimientos obtenidos en este cultivo son superiores a <strong>la</strong> media mundial.<br />
13
TABLA 2.1. PRODUCCIÓN MUNDIAL DE PATATA POR PAÍSES EN LOS AÑOS 1998-2008, EXPRESADA EN DECENAS DE MILES DE TONELADAS.<br />
1998 1999 2000 2001 2002 2003 2004 2005 2006 2007 2008 2008% 1 %Var. 98/08 2<br />
MUNDO 30.081,0 30.067,1 32.874,5 31.263,5 31.711,4 31.397,8 33.121,1 31.986,5 29.933,7 30.934,4 31.414,0 100 +4,43<br />
UE (27) 7.986,4 7.980,2 8.358,9 7.396,9 7.206,1 6.356,3 7.111,3 6.247,0 5.696,7 6.418,8 6.158,3 19,60 -22,89<br />
China 6.461,8 5.614,1 6.631,8 6.459,6 7.022,3 6.813,9 7.225,6 7.090,7 5.407,6 5.619,6 5.706,0 18,16 -11,70<br />
India 1.764,8 2.361,1 2.471,3 2.248,8 2.392,0 2.326,9 2.306,0 2.363,1 2.390,5 2.209,0 3.446,3 10,97 +95,28<br />
Rusia 3.141,8 3.134,4 3.398,0 3.496,5 3.287,1 3.674,7 3.591,4 3.728,0 3.857,3 3.678,4 2.887,4 9,19 -8,10<br />
Ucrania 1.540,5 1.272,3 1.983,8 1.734,4 1.662,0 1.845,3 2.075,5 1.946,2 1.946,7 1.910,2 1.954,5 6,22 +26,88<br />
EE.UU 2.158,1 2.169,2 2.329,8 1.986,2 2.085,6 2.076,6 2.068,6 1.922,9 1.971,3 2.037,3 1.872,2 5,96 -13,25<br />
Bielorrusia 757,4 749,1 871,8 776,8 742,1 865,0 990,2 818,5 832,9 874,4 874,9 2,78 +15,51<br />
Bang<strong>la</strong><strong>de</strong>sh 155,3 276,2 293,3 321,6 299,4 338,6 390,7 485,5 416,1 516,7 664,8 2,12 +328,07<br />
Irán 343,0 343,3 365,8 348,6 375,6 421,1 445,4 483,0 421,9 524,0 550,0 1,75 +60,35<br />
Canadá 432,9 426,8 456,7 422,0 470,5 528,2 523,5 443,4 509,1 497,1 472,4 1,50 +9,14<br />
Turquía 525,0 600,0 537,0 500,0 520,0 530,0 480,0 409,0 439,7 424,6 422,5 1,34 -19,52<br />
Brasil 278,4 290,5 256,1 284,9 312,6 308,9 304,7 313,0 315,2 355,1 367,6 1,17 +32,04<br />
Egipto 198,4 180,9 177,0 190,3 198,5 203,9 254,7 316,7 231,3 276,1 356,7 1,14 +79,79<br />
Perú 263,2 306,5 327,5 269,1 329,8 314,4 300,8 329,0 324,8 338,3 338,3 1,08 +28,53<br />
Ma<strong>la</strong>wi 155,3 184,0 203,7 285,2 140,4 188,4 218,3 148,6 230,9 285,9 299,4 0,95 +92,78<br />
Japón 307,3 296,3 289,8 295,9 307,4 293,9 288,4 274,9 263,5 280,0 280,0 0,89 -8,88<br />
Pakistán 142,6 181,0 186,8 166,6 172,2 194,6 193,8 202,5 156,8 258,2 253,9 0,81 +78,05<br />
Colombia 254,7 277,5 288,3 287,4 283,5 179,2 184,7 175,4 217,3 238,0 237,3 0,76 -6,84<br />
Kazajistán 126,3 169,5 169,3 218,5 226,9 230,8 226,1 252,1 236,2 241,5 235,4 0,75 +86,41<br />
Sudáfrica 166,7 166,9 172,1 179,3 164,7 149,6 180,0 176,8 186,3 197,2 209,9 0,67 +25,89<br />
Nepal 93,5 109,1 118,3 131,4 147,3 153,1 164,3 173,9 197,5 194,3 205,5 0,65 +119,77<br />
Argentina 341,2 270,0 222,1 249,7 226,2 209,5 202,1 178,9 194,4 195,0 195,0 0,62 -42,85<br />
Argelia 110,0 99,6 120,8 96,7 133,4 188,0 189,6 215,7 218,1 200,0 180,0 0,57 +63,64<br />
México 128,1 147,7 162,7 162,9 148,4 166,2 150,7 163,5 152,3 175,1 167,0 0,53 +30,40<br />
Marruecos 111,4 114,1 109,0 115,5 133,4 140,2 148,2 147,9 156,9 143,7 153,7 0,49 +37,93<br />
Corea <strong>de</strong>l N. 126,9 147,3 187,0 226,8 188,4 202,3 205,2 207,0 200,0 190,0 152,0 0,48 +19,80<br />
Fuente: E<strong>la</strong>boración propia a partir <strong>de</strong> datos <strong>de</strong> FAOSTAT; 1 : Porcentaje sobre el total en el año 2008; 2 : Variación <strong>de</strong>s<strong>de</strong> 1998 hasta 2008 consi<strong>de</strong>rando 1998 como 100%.<br />
14
TABLA 2.2. SUPERFICIE MUNDIAL DE PATATA POR PAÍSES EN LOS AÑOS 1998-2008, EXPRESADA EN MILES DE HECTÁREAS.<br />
1998 1999 2000 2001 2002 2003 2004 2005 2006 2007 2008 2008% 1 %Var. 98/08 2<br />
MUNDO 18.789,0 19.700,9 20.128,0 19.731,5 19.148,7 19.030,4 18.928,3 19.003,5 18.262,8 18.531,2 18.192,4 100 -3,20<br />
China 4.064,0 4.420,7 4.725,4 4.720,5 4.669,2 4.524,4 4.598,2 4.882,7 4.216,6 4.436,7 4.452,6 24,48 +9,60<br />
UE (27) 3.321,2 3.350,0 3.265,6 3.094,7 2.683,4 2.557,1 2.485,0 2.301,1 2.272,5 2.240,7 2.140,8 11,77 -35,50<br />
Rusia 3.235,6 3.226,7 3.229,1 3.216,2 3.198,1 3.175,0 3.130,0 3.070,5 2.962,4 2.851,7 2.098,0 11,53 -35,20<br />
India 1.206,0 1.320,5 1.340,0 1.221,9 1.210,0 1.345,0 1.289,2 1.318,5 1.401,4 1.480,0 1.786,1 9,82 +48,10<br />
Ucrania 1.513,2 1.551,1 1.631,0 1.604,7 1.592,3 1.586,9 1.556,0 1.515,9 1.461,5 1.453,3 1.408,9 7,74 -6,90<br />
EE.UU 561,6 539,2 545,5 494,6 514,1 505,3 472,2 439,9 451,4 456,9 423,2 2,33 -24,60<br />
Bang<strong>la</strong><strong>de</strong>sh 136,3 244,8 243,2 249,0 237,6 245,3 270,7 326,3 301,0 345,0 402,0 2,21 +194,90<br />
Bielorrusia 695,0 661,0 661,0 636,0 550,0 526,3 506,6 461,7 433,9 412,6 396,3 2,18 -43,00<br />
Egipto 88,9 77,7 75,0 79,7 82,6 82,9 104,2 126,3 92,5 108,0 327,4 1,80 +268,30<br />
Perú 268,9 272,4 284,7 234,2 270,9 258,0 246,8 264,1 260,9 268,2 268,2 1,47 -0,30<br />
Nigeria 23,0 205,0 212,0 212,0 224,0 235,0 246,0 260,0 266,0 269,0 263,0 1,45 +1.043,50<br />
Irán 162,7 164,0 168,9 174,6 166,0 173,3 183,9 189,7 163,8 210,0 230,0 1,26 +41,40<br />
Ma<strong>la</strong>wi 148,2 164,0 177,8 210,7 110,7 143,9 180,6 164,4 173,1 188,2 205,0 1,13 +38,40<br />
Corea <strong>de</strong>l N. 120,0 187,0 188,0 187,7 198,0 187,2 189,0 190,0 190,0 190,0 180,7 0,99 +50,60<br />
Kazajistán 164,7 157,6 159,1 164,4 162,9 166,0 168,1 167,9 153,5 155,0 163,1 0,90 -1,00<br />
Nepal 110,4 117,8 122,6 129,0 135,1 140,2 143,0 146,8 150,9 153,5 156,7 0,86 +42,00<br />
Canadá 156,4 156,6 159,2 166,7 170,9 180,9 171,7 156,3 158,2 158,9 151,4 0,83 -3,20<br />
Turquía 203,0 220,0 205,0 200,0 198,0 195,0 179,0 154,3 159,3 153,6 149,3 0,82 -26,40<br />
Brasil 178,0 176,5 150,5 154,0 161,1 151,9 142,7 142,2 140,8 147,7 144,8 0,80 -18,60<br />
Ruanda 28,3 29,8 109,0 117,4 125,0 134,0 133,4 135,6 139,8 133,0 140,0 0,77 +394,70<br />
Bolivia 131,8 127,0 133,6 128,5 129,6 130,5 132,6 134,4 135,4 137,0 137,0 0,75 +3,90<br />
Colombia 164,8 171,7 170,7 172,4 163,8 109,1 107,0 100,3 144,1 140,1 134,8 0,74 -18,20<br />
Paquistán 104,7 109,5 110,5 101,5 105,2 115,8 109,7 112,0 117,5 131,9 133,4 0,73 +27,40<br />
Tanzania 36,0 37,0 50,0 67,0 77,2 48,2 89,3 126,0 126,0 125,0 125,0 0,69 +247,20<br />
Ango<strong>la</strong> 3,5 3,5 8,9 11,5 13,8 20,0 20,0 22,5 115,0 120,0 120,0 0,66 +3.328,60<br />
Fuente: E<strong>la</strong>boración propia a partir <strong>de</strong> datos <strong>de</strong> FAOSTAT; 1 : Porcentaje sobre el total en el año 2007; 2 : Variación <strong>de</strong>s<strong>de</strong> 1998 hasta 2008 consi<strong>de</strong>rando 1998 como 100%.<br />
15
GRÁFICO 2.2. PAÍSES CON MAYOR SUPERFICIE DEDICADA AL CULTIVO DE PATATA EN 2008, EXPRESADA EN MILES DE<br />
HECTÁREAS.<br />
5.000<br />
4.000<br />
3.000<br />
2.000<br />
1.000<br />
0<br />
China<br />
UE (27)<br />
Rusia<br />
India<br />
Ucrania<br />
EE.UU<br />
Bang<strong>la</strong><strong>de</strong>sh<br />
Bielorrusia<br />
Egipto<br />
Perú<br />
Fuente: E<strong>la</strong>boración propia a partir <strong>de</strong> datos <strong>de</strong> FAOSTAT.<br />
Las referencias en lo re<strong>la</strong>tivo al rendimiento <strong>de</strong>l cultivo a nivel mundial muestran unas<br />
gran<strong>de</strong>s diferencias. En <strong>la</strong> tab<strong>la</strong> 2.3 y en el gráfico 2.3 se muestran los países con mejores<br />
rendimientos. Nueva Ze<strong>la</strong>nda, que es un país residual en producción, alcanzó en el año 2008<br />
los mejores rendimientos con 50,25 t/ha. Le siguen EEUU (44,24 t/ha), Israel (37,19 t/ha),<br />
Suiza (36,69 t/ha) y Australia (35,55 t/ha). La Unión Europea <strong>de</strong> los 27 se sitúa en el puesto<br />
16 con una media <strong>de</strong> 27,56 T/ha aunque, como se verá más a<strong>de</strong><strong>la</strong>nte, hay unas importantes<br />
diferencias entre los países miembros estando algunos <strong>de</strong> ellos entre los que mejores<br />
rendimientos obtienen a nivel mundial. A modo <strong>de</strong> ejemplo se pue<strong>de</strong> mostrar que el<br />
rendimiento medio <strong>de</strong> España en 2008 fue <strong>de</strong> 27,8 t/ha, <strong>de</strong>stacando en este país Castil<strong>la</strong> y<br />
León con 36,34 t/ha. Un hecho importante es el bajo rendimiento que obtienen algunos <strong>de</strong> los<br />
principales países productores como India (19,29 t/ha), Rusia (13,76 t/ha) y China (12,81<br />
t/ha).<br />
GRÁFICO 2.3. PAÍSES CON MAYORES RENDIMIENTOS DE PATATA EN 2008 EXPRESADOS EN t/ha.<br />
60<br />
50<br />
40<br />
30<br />
20<br />
10<br />
0<br />
Nueva Ze<strong>la</strong>nda<br />
EE.UU<br />
Israel<br />
Suiza<br />
Australia<br />
Sudáfrica<br />
Canadá<br />
Japón<br />
Palestina<br />
España<br />
UE (27)<br />
Fuente: E<strong>la</strong>boración propia a partir <strong>de</strong> datos <strong>de</strong> FAOSTAT.<br />
16
TABLA 2.3. RENDIMIENTO MUNDIAL DE PATATA POR PAÍSES EN LOS AÑOS 1998-2008, EXPRESADO EN t/ha.<br />
1998 1999 2000 2001 2002 2003 2004 2005 2006 2007 2008 %Var. 98/08 1<br />
Nueva Ze<strong>la</strong>nda 35,21 41,67 42,32 44,59 47,12 45,75 45,13 45,33 42,76 50,25 50,25 +42,71<br />
EE.UU 38,43 40,23 42,71 40,16 40,57 41,1 43,8 43,72 43,67 44,59 44,24 +15,12<br />
Israel 38,72 36,83 34,43 34,76 32,74 25,72 35,49 34,96 35,37 36,4 37,19 -3,94<br />
Suiza 40,39 35,23 42,45 37,57 39,1 33,73 39,5 38,77 32,36 41,72 36,69 -9,16<br />
Australia 32,23 32,13 28,45 32,55 35,14 34,74 36,28 34,41 35,43 35,55 35,55 +10,29<br />
Sudáfrica 30,94 29,45 32,1 32,02 34,31 29,92 34,61 33,35 33,27 34,01 34,98 +13,05<br />
Canadá 27,68 27,25 28,68 25,33 27,53 29,2 30,49 28,38 32,18 31,28 31,21 +12,74<br />
Japón 30,76 30,33 30,63 31,82 33,41 33,25 33,07 31,63 30,43 31,11 31,11 +1,14<br />
Palestina 27,38 31,39 30,44 31,14 30,21 29,77 29,89 33,4 29,58 30,96 30,96 +13,06<br />
Corea <strong>de</strong>l Sur 24,17 24,53 23,95 24,45 27 24,65 25,56 27,32 26,34 28,13 29,43 +21,78<br />
Argentina 29,37 23,89 27,76 28,38 25,13 27,93 28,87 28,39 28,58 28,68 28,68 -2,36<br />
Omán 25 30 26,1 32,62 30,91 30,91 27,7 28,46 28,37 28,42 28,42 +13,69<br />
Turquía 25,86 27,27 26,2 25 26,26 27,18 26,82 26,51 27,61 27,64 28,29 +9,41<br />
México 20,5 22,35 23,94 23,78 23,76 25,43 24,24 25,97 24,86 27,06 27,73 +35,25<br />
Kuwait 27,32 27,16 27,2 41,26 24,95 27,35 27,29 27,29 27,29 27,65 27,65 +1,20<br />
UE (27) 21,75 23,07 23,07 22,59 24,67 22,89 25,22 24,78 22,81 24,67 27,56 +26,71<br />
Panamá 16,17 16,07 15,82 20,62 22,51 22,93 22,47 20,05 27,67 26,46 25,71 +58,98<br />
Líbano 20 19,03 21,32 21,6 23,5 21,73 25,55 25,96 20 25,6 25,60 +28,01<br />
Emiratos Árabes 18,94 19,47 18,14 22,5 20,29 26,27 26,26 26,26 26,26 25,48 25,48 +34,55<br />
Brasil 15,64 16,46 17,02 18,5 19,4 20,34 21,35 22,01 22,38 24,04 25,38 +62,29<br />
Costa Rica 23,29 21,89 23,12 26,52 26,17 25,35 24,44 24,36 23,58 23,53 24,58 +5,55<br />
Marruecos 19,04 18,34 18,02 18,77 23,2 21,78 24,17 23,81 26,33 24,8 24,47 +28,51<br />
Mali 18,33 18,33 18,33 18,57 18,57 18,57 16,4 19,5 23,9 24,06 24,00 +30,93<br />
Jordania 21,96 25,9 26,43 26,92 30,08 32,23 36,55 35,49 30,32 27,49 23,92 +8,94<br />
Irán 21,08 20,93 21,66 19,97 22,63 24,3 24,22 25,47 25,75 24,95 23,91 +13,44<br />
Fuente: E<strong>la</strong>boración propia a partir <strong>de</strong> datos <strong>de</strong> FAOSTAT; 1 : Variación <strong>de</strong>s<strong>de</strong> 1998 hasta 2008 en %.<br />
17
2.2 PRODUCCIÓN, SUPERFICIE Y RENDIMIENTOS DE PATATA EN LA UE<br />
2.2.1 ANÁLISIS DE LA PRODUCCIÓN DE PATATAS DE LA UE: PRODUCCIONES, SUPERFICIES Y<br />
RENDIMIENTOS<br />
La producción total <strong>de</strong> patata en <strong>la</strong> Unión Europea (27) entre los años 1998 y 2008 ha estado<br />
comprendida entre 57 y 79,9 millones <strong>de</strong> tone<strong>la</strong>das. En el año 2008 se produjeron alre<strong>de</strong>dor<br />
<strong>de</strong> 61,6 millones <strong>de</strong> tone<strong>la</strong>das. En el gráfico 2.4 se muestra como hemos tenido una<br />
disminución continua <strong>de</strong> <strong>la</strong> producción <strong>de</strong> patata en el conjunto <strong>de</strong> estados miembros que<br />
actualmente forman <strong>la</strong> UE (27).<br />
GRÁFICO 2.4. PRODUCCIÓN DE PATATAS EN LA UE (27) EN LOS AÑOS 1998-2008, EXPRESADA EN MILLONES DE<br />
TONELADAS.<br />
90<br />
80<br />
70<br />
60<br />
50<br />
40<br />
30<br />
20<br />
10<br />
0<br />
1998 1999 2000 2001 2002 2003 2004 2005 2006 2007 2008<br />
Fuente: E<strong>la</strong>boración propia a partir <strong>de</strong> datos <strong>de</strong> FAOSTAT y EUROSTAT.<br />
Como se pue<strong>de</strong> observar en <strong>la</strong> tab<strong>la</strong> 2.4 y en el gráfico 2.5 el principal país productor <strong>de</strong><br />
patatas en <strong>la</strong> UE en el año 2008 fue Alemania con 11,3 millones <strong>de</strong> tone<strong>la</strong>das (18,46% <strong>de</strong>l<br />
total), seguido <strong>de</strong> cerca por Polonia (17%), luego está Ho<strong>la</strong>nda (11,2%), Francia (11,06%) y<br />
Reino Unido (9,74%). España se sitúa en <strong>la</strong> octava posición, con una producción en 2008 <strong>de</strong><br />
cerca <strong>de</strong> 2,4 millones <strong>de</strong> tone<strong>la</strong>das, que representa el 3,84% <strong>de</strong>l total. En el gráfico 2.4 pue<strong>de</strong><br />
observarse como <strong>la</strong> ten<strong>de</strong>ncia en <strong>la</strong> producción <strong>de</strong> patata en los últimos años, en el conjunto<br />
<strong>de</strong> <strong>la</strong> UE, es a <strong>la</strong> baja.<br />
Toda esta producción <strong>de</strong> <strong>la</strong> UE se cultivó en un total <strong>de</strong> 2,14 millones <strong>de</strong> hectáreas en 2008,<br />
que se reparte como se indica en <strong>la</strong> tab<strong>la</strong> 2.5. Po<strong>de</strong>mos ver en esa tab<strong>la</strong> que hay una<br />
disminución en <strong>la</strong> superficie cultivada <strong>de</strong> patata en todos los países miembros a excepción <strong>de</strong><br />
Ho<strong>la</strong>nda, Bélgica y Dinamarca.<br />
18
TABLA 2.4. PRODUCCIÓN DE PATATAS EN LA U.E. POR ESTADOS MIEMBROS EN LOS AÑOS 1998-2008, EXPRESADA EN MILES DE TONELADAS.<br />
1998 1999 2000 2001 2002 2003 2004 2005 2006 2007 2008 2008% 1 % Var. 98/08 2<br />
UE (27) 79.864 79.802 83.589 73.969 72.060 63.563 71.113 62.470 56.967 64.188 61.583 100 -23<br />
Alemania 11.712 12.031 13.694 11.917 11.492 9.916 13.044 11.624 10.031 11.644 11.369 18,46 -3<br />
Polonia 25.949 19.927 24.232 19.379 15.524 13.732 13.999 10.369 8.982 11.791 10.462 16,99 -60<br />
Ho<strong>la</strong>nda 5.249 8.331 8.227 7.115 7.363 6.469 7.488 6.777 6.240 7.200 6.923 11,24 +32<br />
Francia 6.053 6.645 6.434 6.078 6.874 6.348 7.255 6.605 6.354 7.206 6.808 11,06 +12<br />
Reino Unido 6.422 7.131 6.636 6.649 6.966 5.918 6.317 5.979 5.864 5.635 5.999 9,74 -7<br />
Rumania 3.319 3.957 3.470 3.997 4.078 3.947 4.230 3.739 4.016 3.712 3.649 5,93 +10<br />
Bélgica 3 2.456 3.007 2.922 2.564 2.909 2.522 3.230 2.781 2.593 3.190 2.804 4,55 +14<br />
España 3.129 3.367 3.078 2.992 3.078 2.665 2.774 2.563 2.515 2.518 2.365 3,84 -24<br />
Dinamarca 1.456 1.502 1.645 1.543 1.504 1.412 1.629 1.576 1.361 1.626 1.705 2,77 +17<br />
Italia 2.194 2.069 2.053 1.957 1.855 1.610 1.822 1.754 1.783 1.838 1.604 2,60 -27<br />
Suecia 1.199 991 980 925 914 857 979 947 773 790 853 1,39 -29<br />
Grecia 994 978 1.012 960 901 955 948 819 896 930 848 1,38 -15<br />
Rep. Checa 1.520 1.407 1.476 1.130 1.106 683 862 1.013 692 821 770 1,25 -49<br />
Austria 647 712 695 695 684 560 693 763 655 669 757 1,23 +17<br />
Lituania 1.849 1.708 1.792 1.054 1.531 1.445 1.021 895 457 576 716 1,16 -61<br />
Fin<strong>la</strong>ndia 591 791 785 733 780 617 619 743 576 702 684 1,11 +16<br />
Letonia 694 796 747 615 768 739 628 658 551 642 673 1,09 -3<br />
Hungría 1.148 1.199 864 908 752 582 784 657 564 563 658 1,07 -43<br />
Portugal 1.225 949 743 694 781 736 770 576 611 639 567 0,92 -54<br />
Ir<strong>la</strong>nda 482 559 455 478 519 488 552 409 383 399 372 0,60 -23<br />
Bulgaria 478 566 398 600 627 450 573 375 386 299 353 0,57 -26<br />
Eslovaquia 412 384 419 323 484 392 382 301 263 288 245 0,40 -40<br />
Chipre 138 162 117 121 145 125 132 153 128 156 132 0,21 -5<br />
Estonia 317 404 472 343 211 244 167 210 153 192 125 0,20 -61<br />
Eslovenia 196 194 186 148 166 108 171 145 107 131 100 0,16 -49<br />
Luxemburgo 23 23 20 18 22 19 16 20 22<br />
Malta 36 36 35 25 28 23 23 20 18 14 19 0,03 -47<br />
Fuente: E<strong>la</strong>boración propia a partir <strong>de</strong> datos FAOSTAT; 1 : valor promedio <strong>de</strong> cada país en 2008 respecto al total; 2 : Variación <strong>de</strong>s<strong>de</strong> 1998 hasta 2008 en %; 3 : Incluye Luxemburgo en 1998 y 1999.<br />
19
TABLA 2.5. SUPERFICIE DE PATATA EN LA U.E. POR ESTADOS MIEMBROS EN LOS AÑOS 1998-2007, EXPRESADA EN MILES DE HECTÁREAS.<br />
1998 1999 2000 2001 2002 2003 2004 2005 2006 2007 2008 2008% 1 %Var. 98/08 2<br />
UE (27) 3.321,2 3.350,0 3.265,6 3.094,7 2.683,4 2.557,1 2.485,0 2.301,1 2.272,5 2.240,7 2.140,8 -35,5<br />
Polonia 1.295,00 1.267,90 1.250,60 1.194,20 803,4 765,8 713,3 588,2 597,2 569,6 548,9 25,64 -57,6<br />
Alemania 297,3 309 304,4 282,1 284,1 287,3 295,3 276,9 274,3 275 259,8 12,14 -12,6<br />
Rumania 261,3 273,7 282,7 276,7 283,2 281,9 254 285,3 283,1 272,6 259,7 12,13 -0,6<br />
Francia 164 170,5 162,6 162,2 162,2 157,3 159,8 156,4 158,1 158,8 156,2 7,30 -4,8<br />
Ho<strong>la</strong>nda 126,5 180 180,2 163,9 165,2 158,6 163,9 156 155,8 161 151,9 7,10 +20,1<br />
Reino Unido 164,1 177,6 166 165 158 145 148,7 137,4 141 140,2 144,0 6,73 -12,3<br />
España 133,5 136,1 118,8 115,1 110,2 101,1 102,1 95 87,2 89,2 85,1 3,98 -36,3<br />
Italia 90,1 85,5 81,9 78 77 74 72,4 69,9 72,5 72 70,6 3,30 -21,7<br />
Bélgica 3 59,4 66,6 65,8 62,2 61,7 59,3 66,7 65 67,3 67,9 63,5 2,97 +6,9<br />
Lituania 136,3 121,1 109,3 102,5 99,2 93,6 79,3 74 57,8 52,8 48,4 2,26 -64,5<br />
Dinamarca 36 38 38,7 38,2 37,7 36,1 41 40 38,6 41,2 40,7 1,90 +13,0<br />
Portugal 86 62,2 57,4 49,8 52,6 48,1 47,9 41,8 41,4 41,4 38,9 1,82 -54,8<br />
Letonia 58,8 50,1 51,3 55,1 53,6 54,6 48,9 45,1 45,1 40,3 37,8 1,77 -35,7<br />
Grecia 49 49,2 48,8 46,8 46,5 46,2 45,7 44,4 45,2 46,6 33,5 1,56 -31,6<br />
Rep. Checa 72,6 71,9 69,2 54,1 46,9 36 36 36,1 30 31,9 29,8 1,39 -59,0<br />
Suecia 33,7 32,8 32,9 32,2 31,7 30,5 31,7 30,5 28 28,5 26,9 1,26 -20,2<br />
Fin<strong>la</strong>ndia 32,8 32,3 32,2 30 29,8 28,7 27,3 28,9 28 27,3 26,2 1,22 -20,1<br />
Hungría 52,6 56,4 46,7 36,3 34 31,3 31 25,4 22,6 25,4 25,3 1,18 -51,9<br />
Austria 22,9 23,2 23,7 23,1 22,5 21,1 21,9 22,2 21,9 22,7 22,8 1,07 -0,4<br />
Bulgaria 50,9 52,2 52,8 48,5 51,9 29,8 30,7 24 24,5 22,4 21,7 1,01 -57,4<br />
Eslovaquia 28,8 26,8 27,1 26,2 26,1 25,7 24,2 19,1 18,4 17,8 14,3 0,67 -50,5<br />
Ir<strong>la</strong>nda 18,5 17,5 13,5 14,3 15,4 14,2 13,3 11,8 11,5 11,7 12,0 0,56 -35,1<br />
Estonia 32,6 31,1 30,9 22,1 16 17 16,1 14 11,5 11,2 11,4 0,53 -65,0<br />
Chipre 7,5 6,7 6,5 5,7 5,6 5,4 5,4 6,2 4,3 6,3 5,7 0,26 -24,5<br />
Eslovenia 9,2 9,8 9 7,8 7,1 6,8 6,8 6,3 5,9 5,7 4,4 0,21 -51,9<br />
Malta 1,8 1,8 1,8 1,8 1,2 1,2 1,1 0,8 0,8 0,7 0,7 0,03 -61,1<br />
Luxemburgo 0 0 0,8 0,7 0,7 0,6 0,6 0,6 0,6 0,6 0,6 0,03<br />
Fuente: E<strong>la</strong>boración propia a partir <strong>de</strong> datos FAOSTAT; 1 : valor promedio <strong>de</strong> cada país en 2008 respecto al total; 2 : Variación <strong>de</strong>s<strong>de</strong> 1998 hasta 2008 en %; 3 : Incluye Luxemburgo en 1998 y 1999.<br />
20
GRÁFICO 2.5. PRINCIPALES PAÍSES PRODUCTORES DE PATATA EN LA UE (27) EN 2008, EXPRESADO EN MILES DE<br />
TONELADAS.<br />
12.000<br />
10.000<br />
8.000<br />
6.000<br />
4.000<br />
2.000<br />
0<br />
Alemania<br />
Polonia<br />
Ho<strong>la</strong>nda<br />
Francia<br />
Reino Unido<br />
Rumania<br />
Bélgica<br />
España<br />
Dinamarca<br />
Italia<br />
Fuente: E<strong>la</strong>boración propia a partir <strong>de</strong> datos <strong>de</strong> FAOSTAT.<br />
En el gráfico 2.6 se aprecia una ten<strong>de</strong>ncia regresiva <strong>de</strong> <strong>la</strong> superficie sembrada en <strong>la</strong> UE en los<br />
últimos 10 años.<br />
GRÁFICO 2.6. SUPERFICIE CULTIVADA DE PATATA EN UE (27) EN 1998-2008, EXPRESADA EN MILES DE HECTÁREAS.<br />
4.000,0<br />
3.500,0<br />
3.000,0<br />
2.500,0<br />
2.000,0<br />
1.500,0<br />
1.000,0<br />
500,0<br />
0,0<br />
1998 1999 2000 2001 2002 2003 2004 2005 2006 2007 2008<br />
Fuente: E<strong>la</strong>boración propia a partir <strong>de</strong> datos <strong>de</strong> FAOSTAT y EUROSTAT.<br />
Las mayores extensiones en 2008 se localizaron en Polonia, Alemania, Rumania, Francia y<br />
Ho<strong>la</strong>nda (ver gráfico 2.7). En España, <strong>la</strong> superficie <strong>de</strong>dicada al cultivo en 2008 rondó <strong>la</strong>s<br />
85.100 has (3.98% <strong>de</strong>l total <strong>de</strong> <strong>la</strong> UE). Se constata una ten<strong>de</strong>ncia <strong>de</strong> disminución <strong>de</strong> <strong>la</strong><br />
superficie tanto a nivel <strong>de</strong> <strong>la</strong> UE como en casi todos los países miembros.<br />
21
GRÁFICO 2.7. PAÍSES DE LA UE (27) CON MAYOR SUPERFICIE DE PATATA EN 2008, EXPRESADA EN MILES DE HECTÁREAS.<br />
600<br />
500<br />
400<br />
300<br />
200<br />
100<br />
0<br />
Polonia<br />
Alemania<br />
Rumania<br />
Francia<br />
Países Bajos<br />
Reino Unido<br />
España<br />
Italia<br />
Bélgica<br />
Lituania<br />
Fuente: E<strong>la</strong>boración propia a partir <strong>de</strong> datos <strong>de</strong> FAOSTAT y EUROSTAT.<br />
En lo que se refiere a los rendimientos productivos, nos encontramos que en 2008 los más<br />
altos estuvieron en Ho<strong>la</strong>nda (45,56 t/ha), Bélgica (44,14 t/ha), Alemania (43,76 t/ha), Francia<br />
(43,59 t/ha), Dinamarca (41,94 t/ha) y Reino Unido (41,66 t/ha) (ver tab<strong>la</strong> 2.6 y gráfico 2.8).<br />
Es muy <strong>de</strong>stacable el caso <strong>de</strong> Ho<strong>la</strong>nda, ya que es un país eminentemente productor <strong>de</strong> patata<br />
<strong>de</strong> siembra y los rendimientos para este cultivo son menores que para <strong>la</strong> <strong>de</strong> consumo.<br />
Existen unas importantes diferencias entre los estados miembros registrándose, a modo <strong>de</strong><br />
ejemplo en el año 2008, diferencias <strong>de</strong> más <strong>de</strong>l 400% entre Ho<strong>la</strong>nda (47 t/ha) y Estonia (10,9<br />
t/ha). España ha experimentado un notable incremento en <strong>la</strong>s últimas 2 décadas, pasando <strong>de</strong><br />
18,8 t/ha en 1987 a 27,8 t/ha en 2008 (118,58% <strong>de</strong>l rendimiento medio <strong>de</strong> <strong>la</strong> UE), estando<br />
situada en el puesto número 12 <strong>de</strong>l ranking <strong>de</strong> <strong>la</strong> UE. Dentro <strong>de</strong> España es <strong>de</strong>stacable el<br />
rendimiento alcanzado en Castil<strong>la</strong> y León, 36,37 t/ha en 2008, que se acerca a los mejores<br />
países <strong>de</strong> Europa. Este dato sería más elevado si no se consi<strong>de</strong>rara <strong>la</strong> patata <strong>de</strong> siembra<br />
producida en Palencia y Burgos.<br />
GRÁFICO 2.8. PAÍSES DE LA UE (27) CON MAYORES RENDIMIENTOS DE PATATA EXPRESADOS EN 2008, EN t/ha.<br />
50<br />
40<br />
30<br />
20<br />
10<br />
0<br />
Ho<strong>la</strong>nda<br />
Bélgica<br />
Alemania<br />
Francia<br />
Dinamarca<br />
Reino Unido<br />
Castil<strong>la</strong> y León<br />
Luxemburgo<br />
España<br />
UE (27)<br />
Fuente: E<strong>la</strong>boración propia a partir <strong>de</strong> datos <strong>de</strong> FAOSTAT y EUROSTAT.<br />
22
TABLA 2.6. RENDIMIENTO DE PATATA EN LA U.E. EN LOS AÑOS 1998-2008, EXPRESADO EN TONELADAS/HECTÁREA. SE INCLUYE CASTILLA Y LEÓN PARA COMPARAR CON OTROS PAÍSES.<br />
1998 1999 2000 2001 2002 2003 2004 2005 2006 2007 2008 %Var. 98/08 2<br />
Media UE (27) 23,97 25,15 23,07 22,59 24,67 22,89 25,22 24,78 22,81 24,67 27,562 +15,0<br />
Ho<strong>la</strong>nda 41,49 46,28 45,66 43,41 44,57 40,78 45,68 43,44 40,05 44,72 45,574 +9,8<br />
Bélgica 1 41,34 45,14 44,41 41,23 47,15 42,53 48,4 42,81 38,55 46,98 44,137 +6,8<br />
Alemania 39,4 38,94 44,99 42,24 40,45 34,52 44,18 41,98 36,57 42,35 43,761 +11,1<br />
Francia 36,91 38,97 39,56 37,46 42,38 40,36 45,42 42,22 40,2 45,38 43,586 +18,1<br />
Dinamarca 40,44 39,55 42,49 40,38 39,91 39,12 39,74 39,41 35,26 39,46 41,939 +3,7<br />
Reino Unido 39,14 40,15 39,98 40,3 44,09 40,81 42,48 43,52 41,59 40,19 41,66 +6,4<br />
Castil<strong>la</strong> y León 34 36,39 36,3 37,59 38,41 36,03 38,99 39,16 39,46 38,01 36,37 +7,0<br />
Luxemburgo 28,26 31,02 29,92 29,42 35,03 31,79 27,65 31,85 36,02<br />
Austria 28,31 30,7 29,26 30,04 30,38 26,53 31,61 34,4 29,86 29,49 33,199 +17,3<br />
Suecia 35,58 30,2 29,79 28,7 28,79 28,07 30,92 31,11 27,59 27,7 31,717 -10,9<br />
Ir<strong>la</strong>nda 26,05 31,94 33,7 33,43 33,68 34,38 41,52 34,68 33,29 34,1 30,992 +19,0<br />
España 23,44 24,74 25,92 25,99 27,95 26,36 27,16 26,98 28,84 28,23 27,796 +18,6<br />
Malta 20,26 20,34 19,61 14,21 23,9 20,2 20,71 23,8 22,5 20,21 27,143 +34,0<br />
Fin<strong>la</strong>ndia 18,01 24,49 24,39 24,43 26,18 21,51 22,69 25,7 20,56 25,7 26,122 +45,0<br />
Hungría 21,8 21,24 18,47 25,05 22,12 18,59 25,32 25,88 24,99 22,17 26,008 +19,3<br />
Checa, Rep 20,93 19,58 21,33 20,88 23,57 18,97 23,96 28,08 23,05 25,72 25,835 +23,4<br />
Grecia 20,29 19,88 20,74 20,51 19,38 20,67 20,78 18,43 19,84 19,95 25,313 +24,8<br />
Chipre 18,41 24,2 18 21,17 25,83 23,19 24,47 24,64 29,72 24,72 23,264 +26,4<br />
Italia 24,34 24,18 25,07 25,09 24,1 21,77 25,15 25,08 24,61 25,54 22,724 -6,6<br />
Eslovenia 21,27 19,74 20,8 19,05 23,33 15,75 25,1 22,95 18,14 23 22,661 +6,5<br />
Polonia 20,04 15,72 19,38 16,23 19,32 17,93 19,63 17,63 15,04 20,7 19,061 -4,9<br />
Letonia 11,8 15,88 14,56 11,17 14,34 13,54 12,85 14,59 12,22 15,93 17,815 +51,0<br />
Eslovaquia 14,33 14,33 15,47 12,34 18,59 15,27 15,76 15,77 14,31 16,19 17,188 +19,9<br />
Bulgaria 9,4 10,85 7,53 12,39 12,09 15,13 18,69 15,65 15,78 13,32 16,262 +73,0<br />
Lituania 13,57 14,11 16,39 10,29 15,44 15,44 12,88 12,1 7,91 10,91 14,802 +9,1<br />
Portugal 14,24 15,27 12,95 13,94 14,85 15,29 16,07 13,79 14,77 15,43 14,566 +2,3<br />
Rumania 12,7 14,46 12,27 14,45 14,4 14 16,65 13,1 14,19 13,62 14,049 +10,6<br />
Estonia 9,72 12,98 15,27 15,53 13,16 14,39 10,34 15,03 13,26 17,2 10,982 +13,0<br />
Fuente: E<strong>la</strong>boración propia a partir <strong>de</strong> datos <strong>de</strong> FAOSTAT; 1 : Incluye Luxemburgo en 1998 y 1999; 2 : Variación <strong>de</strong>s<strong>de</strong> 1998 hasta 2008 en %.<br />
23
CONCLUSIONES<br />
o<br />
o<br />
o<br />
A nivel mundial el conjunto <strong>de</strong> los países que forman <strong>la</strong> UE <strong>de</strong> los 27 son los<br />
mayores productores <strong>de</strong> patata seguidos <strong>de</strong> un país asiático como es China y<br />
siendo este último el que más superficie <strong>de</strong>dica a este cultivo seguido <strong>de</strong><br />
Rusia.<br />
Los mayores rendimientos por hectárea los obtienen países como Nueva<br />
Ze<strong>la</strong>nda, EEUU y <strong>de</strong>ntro <strong>de</strong> <strong>la</strong> UE, Bélgica o Francia, si bien Castil<strong>la</strong> y León<br />
estaría entre <strong>la</strong>s regiones con mayores rendimientos a nivel mundial. Cabe<br />
<strong>de</strong>stacar que países con gran<strong>de</strong>s producciones como son China, Rusia o India<br />
tienen rendimientos muy bajos y no llegan ni a 20 t/ha.<br />
La producción <strong>de</strong> patata en <strong>la</strong> U.E, al igual que <strong>la</strong> superficie <strong>de</strong>stinada a este<br />
cultivo, han <strong>de</strong>scendido progresivamente en <strong>la</strong> última década, siendo Polonia<br />
el principal país productor seguido <strong>de</strong> países referentes en este sector como<br />
son Alemania, Francia, Ho<strong>la</strong>nda y Reino Unido. España ocupa <strong>la</strong> octava<br />
posición en producción <strong>de</strong> patata y <strong>la</strong> séptima en superficie.<br />
24
3 ANÁLISIS DE LA PRODUCCIÓN DE PATATA EN ESPAÑA<br />
Una vez enmarcado el sector <strong>de</strong> <strong>la</strong> patata en su contexto mundial y europeo, se <strong>de</strong>dica el<br />
siguiente capítulo a un análisis <strong>de</strong>tal<strong>la</strong>do <strong>de</strong> <strong>la</strong> producción en España. En primer lugar se<br />
aportan datos globales <strong>de</strong>l sector y a continuación se pasa a una <strong>de</strong>scripción más <strong>de</strong>tal<strong>la</strong>da <strong>de</strong><br />
<strong>la</strong>s principales regiones productoras, teniendo en cuenta <strong>la</strong>s particu<strong>la</strong>rida<strong>de</strong>s <strong>de</strong> cada una <strong>de</strong><br />
el<strong>la</strong>s.<br />
3.1 PRODUCCIÓN, SUPERFICIE Y RENDIMIENTOS DE PATATA EN ESPAÑA<br />
En <strong>la</strong> tab<strong>la</strong> 3.1. se refleja <strong>la</strong> producción <strong>de</strong> patata españo<strong>la</strong> en los últimos años, siendo el año<br />
2008, según los últimos avances <strong>de</strong>l MARM, cerca <strong>de</strong> 2,37 millones <strong>de</strong> tone<strong>la</strong>das. Los avances<br />
para el año 2009 cifran esta producción en 2,45 millones <strong>de</strong> tone<strong>la</strong>das. Tal y como se pue<strong>de</strong><br />
observar en el gráfico 3.1 <strong>la</strong> producción <strong>de</strong> este tubérculo en España ha seguido una evolución<br />
c<strong>la</strong>ramente <strong>de</strong>scen<strong>de</strong>nte en <strong>la</strong>s dos últimas décadas, produciéndose en 2008 un 55,63% menos<br />
que en 1990.<br />
TABLA 3.1. EVOLUCIÓN DE LA PRODUCCIÓN DE PATATA EN ESPAÑA, EXPRESADA EN MILES DE TONELADAS.<br />
EXTRATEMPRANA TEMPRANA MEDIA ESTACIÓN TARDÍA TOTAL<br />
1990 63,6 731,5 2.936,9 1.598,7 5.330,7<br />
1991 96,9 707,8 2.862,6 1.514,9 5.182,2<br />
1992 86,9 761,5 2.790,2 1.541,9 5.180,5<br />
1993 82 606,7 2.040,7 1.091,9 3.821,3<br />
1994 66,2 586,1 2.236,6 970,8 3.859,7<br />
1995 63,3 536,2 2.262,9 1.051,4 3.913,8<br />
1996 63,7 593,1 2.074,8 1.124,1 3.855,7<br />
1997 38,7 516,1 1.743,8 955,2 3.253,8<br />
1998 49,5 467,9 1.637,3 974,1 3.128,8<br />
1999 65,1 682,5 1.598,9 1.022,3 3.368,8<br />
2000 71,2 525,1 1.578,1 903,7 3.078,1<br />
2001 49,6 462,0 1.509,7 970,2 2.992,4<br />
2002 66,5 486,7 1.474,7 1.050,2 3.078,1<br />
2003 67,6 477,8 1.323,3 921,3 2.790,0<br />
2004 91,9 518,1 1.238,5 924,9 2.773,6<br />
2005 69,6 393,8 1.302,0 797,1 2.563,5<br />
2006 90,7 430,3 1.266,3 727,6 2.515,0<br />
2007 82,1 439,3 1.182,6 775,6 2.479,6<br />
2008 75,5 356,4 1.176,8 756,7 2.365,4<br />
2009 (P) 76,1 359,9 1.227,2 783,5 2.446,7<br />
% (90/08) 1 +18,71 -51,28 -59,93 -52,67 -55,63<br />
Fuente MARM; (P): datos provisionales; 1 : Variación en % <strong>de</strong>s<strong>de</strong> 1990 hasta 2008 consi<strong>de</strong>rándose 1990 como 100%.<br />
Se pue<strong>de</strong> observar en <strong>la</strong> tab<strong>la</strong> 3.1 y en el gráfico 3.1 como <strong>la</strong> evolución <strong>de</strong> <strong>la</strong> producción ha<br />
sido diferente en función <strong>de</strong> <strong>la</strong> estacionalidad <strong>de</strong> <strong>la</strong> patata. El mayor <strong>de</strong>scenso <strong>de</strong> <strong>la</strong><br />
producción ha ocurrido en <strong>la</strong> patata <strong>de</strong> media estación, seguida <strong>de</strong> <strong>la</strong> tardía y <strong>la</strong> temprana.<br />
25
Sin embargo, <strong>la</strong> patata extratemprana ha registrado un incremento <strong>de</strong>s<strong>de</strong> 1990 <strong>de</strong>l 18,71%,<br />
aunque no es importante en términos absolutos <strong>de</strong> producción.<br />
GRÁFICO 3.1. EVOLUCIÓN DE LA PRODUCCIÓN DE PATATA EN ESPAÑA EN LOS AÑOS 1990-2009, EXPRESADA EN MILES<br />
DE TONELADAS.<br />
6000<br />
5000<br />
4000<br />
3000<br />
2000<br />
1000<br />
0<br />
1990<br />
1991<br />
1992<br />
26<br />
Extratemprana<br />
Temprana<br />
Media estación<br />
Tardía<br />
TOTAL<br />
1993<br />
1994<br />
1995<br />
1996<br />
1997<br />
1998<br />
1999<br />
2000<br />
2001<br />
2002<br />
2003<br />
2004<br />
2005<br />
2006<br />
2007<br />
2008<br />
2009*<br />
Fuente: E<strong>la</strong>boración propia a partir <strong>de</strong> datos <strong>de</strong> MARM. *: Datos provisionales.<br />
La primera Comunidad Autónoma productora <strong>de</strong> patata en 2008 fue Castil<strong>la</strong> y León (ver<br />
gráfico 3.2.), que representa un 34,9% <strong>de</strong> <strong>la</strong> producción nacional, seguida <strong>de</strong> Andalucía con un<br />
20,94%, y Galicia con un 14,56%. A mayor distancia se encuentran Castil<strong>la</strong> La Mancha, La<br />
Rioja, Canarias y País Vasco.<br />
GRAFICO 3.2. PRODUCCIÓN DE PATATA EN ESPAÑA POR CC.AA. EN 2008, EXPRESADA EN MILES DE TONELADAS.<br />
900<br />
800<br />
700<br />
600<br />
500<br />
400<br />
300<br />
200<br />
100<br />
0<br />
Castil<strong>la</strong> y León<br />
Andalucía<br />
Galicia<br />
Castil<strong>la</strong> - Mancha<br />
La Rioja<br />
Canarias<br />
País Vasco<br />
Extremadura<br />
Asturias<br />
Cataluña<br />
Fuente: e<strong>la</strong>boración propia a partir <strong>de</strong> datos <strong>de</strong>l MARM.<br />
Baleares<br />
Valencia<br />
Murcia<br />
Navarra<br />
Aragón<br />
Madrid<br />
Cantabria
En <strong>la</strong> tab<strong>la</strong> 3.2 se observa que Andalucía es <strong>la</strong> gran productora <strong>de</strong> patata extratemprana y<br />
temprana, <strong>de</strong>stinando una parte importante a <strong>la</strong> exportación, mientras que Galicia y Castil<strong>la</strong><br />
y León son <strong>de</strong> patata <strong>de</strong> media estación, y Castil<strong>la</strong> y León es <strong>la</strong> mayor productora <strong>de</strong> patata<br />
tardía.<br />
TABLA 3.2. PRODUCCIÓN DE PATATA EN ESPAÑA EN 2007 POR CC.AA, EXPRESADA EN MILES DE TONELADAS.<br />
EXTRATEMPRANA TEMPRANA MEDIA ESTACIÓN TARDÍA TOTAL<br />
Castil<strong>la</strong> y León 0 1,30 307,14 533,37 841,81<br />
Andalucía 45,59 264,72 181,98 58,37 550,66<br />
Galicia 0,40 23,50 324,62 24,25 372,78<br />
Castil<strong>la</strong> - Mancha 0 5,82 74,36 21,92 102,10<br />
La Rioja 0 0 65,19 31,74 96,93<br />
Canarias 20,29 48,68 4,27 12,41 85,65<br />
País Vasco 0 2,43 33,82 36,75 73,00<br />
Extremadura 0 0 59,50 0,00 59,50<br />
Asturias 0 1,00 51,75 2,50 55,25<br />
Cataluña 0,42 10,75 30,69 11,10 52,96<br />
Baleares 11,13 33,82 0 5,50 50,45<br />
Valencia 0,45 26,11 13,87 8,17 48,60<br />
Murcia 3,83 21,14 5,30 5,66 35,94<br />
Navarra 0 0 11,86 10,33 22,19<br />
Aragón 0 0 3,91 8,67 12,58<br />
Madrid 0 0 10,30 0,75 11,05<br />
Cantabria 0 0 4,08 4,09 8,16<br />
España 2009 (P) 76,1 359,9 1.227,2 783,5 2446,7<br />
España 2008 75,50 356,40 1.176,80 756,70 2.365,40<br />
España 2008% 3,19 15,07 49,75 31,99 100,00<br />
España 2007 82,10 439,26 1.182,64 775,58 2.479,58<br />
España 2006 90,70 430,36 1.266,35 727,60 2.515,00<br />
España 2005 69,62 393,79 1.302,98 797,07 2.563,47<br />
España 2004 91,95 518,15 1.238,53 924,94 2.773,57<br />
España 2003 67,60 477,80 1.323,30 921,30 2.790,00<br />
España 2002 66,49 486,73 1.474,69 1.050,23 3.078,14<br />
España 2001 49,55 462,99 1.509,65 970,23 2.992,42<br />
España 2000 71,20 525,10 1.578,10 903,70 3.078,10<br />
Fuente: MARM; (P): datos provisionales.<br />
La disminución <strong>de</strong> <strong>la</strong> producción españo<strong>la</strong> es consecuencia <strong>de</strong> <strong>la</strong> regresión <strong>de</strong> <strong>la</strong> superficie <strong>de</strong><br />
patata cultivada, que ha pasado <strong>de</strong> 271,3 miles <strong>de</strong> has en 1990 a 85,1 miles <strong>de</strong> has en 2008, lo<br />
que supone una disminución <strong>de</strong>l 68,6%. Esta disminución es común a toda <strong>la</strong> patata cultivada<br />
en nuestro país (ver tab<strong>la</strong> 3.3 y gráfico 3.3), siendo <strong>la</strong> extratemprana <strong>la</strong> que menos ha<br />
<strong>de</strong>scendido con un 10,26%. La mayor bajada en superficie ha ocurrido en patata tardía con<br />
71,50%, seguido <strong>de</strong> <strong>la</strong> <strong>de</strong> media estación, con 70,70%. Por su parte, <strong>la</strong> superficie <strong>de</strong>dicada a <strong>la</strong><br />
patata temprana ha caído un 60%.<br />
27
GRÁFICO 3.3. EVOLUCIÓN DE LA SUPERFICIE DE PATATA EN ESPAÑA, EXPRESADA EN MILES DE HECTÁREAS.<br />
300,0<br />
250,0<br />
200,0<br />
150,0<br />
100,0<br />
50,0<br />
0,0<br />
1990<br />
1991<br />
1992<br />
1993<br />
1994<br />
1995<br />
1996<br />
1997<br />
1998<br />
1999<br />
2000<br />
2001<br />
2002<br />
2003<br />
2004<br />
2005<br />
2006<br />
2007<br />
2008<br />
2009*<br />
Fuente: e<strong>la</strong>boración propia a partir <strong>de</strong> datos <strong>de</strong>l MARM; *: Datos provisionales.<br />
Extratemprana<br />
Temprana<br />
Media estación<br />
Tardía<br />
TOTAL<br />
TABLA 3.3. EVOLUCIÓN DE LA SUPERFICIE DE PATATA EN ESPAÑA, EXPRESADA EN MILES DE HECTÁREAS.<br />
EXTRATEMPRANA TEMPRANA MEDIA ESTACIÓN TARDÍA TOTAL<br />
1990 3,9 36,5 149,5 81,4 271,3<br />
1991 5,1 37,5 150,5 73,1 266,2<br />
1992 4,3 38,9 146,9 67,1 257,2<br />
1993 4,3 32,9 118,7 52,0 207,9<br />
1994 3,9 30,4 118,8 47,6 200,7<br />
1995 4,8 33,2 118,8 49,2 206,0<br />
1996 4,3 30,6 98,8 46,4 180,1<br />
1997 3,4 27,3 79,4 39,9 150,0<br />
1998 3,8 23,5 69,1 37,1 133,5<br />
1999 3,7 30,2 62,9 36,6 133,4<br />
2000 3,8 24,0 59,4 31,4 118,6<br />
2001 2,8 22,8 57,4 32,2 115,1<br />
2002 3,1 21,1 53,7 32,3 110,1<br />
2003 3,1 20,3 50,8 29,4 103,6<br />
2004 4,2 21,8 44,9 31,2 102,1<br />
2005 3,7 17,4 48,7 25,2 95,0<br />
2006 4,2 16,8 44,4 21,8 87,2<br />
2007 3,5 15,9 42,7 23,5 85,7<br />
2008 3,5 14,6 43,8 23,2 85,1<br />
2009 (P) 3,7 14,1 44,7 22,6 85,1<br />
% (90/08) 1 -10,26 -60,00 -70,70 -71,50 -68,63<br />
Fuente: MARM; (P): datos provisionales; 1 : Variación en % <strong>de</strong>s<strong>de</strong> 1990 hasta 2008 consi<strong>de</strong>rando 1990 como 100%.<br />
28
Un factor <strong>de</strong>cisivo en <strong>la</strong> reducción <strong>de</strong> <strong>la</strong> superficie <strong>de</strong> patata en España fue su ingreso en <strong>la</strong><br />
Comunidad Económica Europea. En 1985 <strong>la</strong> superficie <strong>de</strong>dicada a este cultivo era <strong>de</strong> 330,9<br />
miles <strong>de</strong> ha, mientras que en 2008 ha sido <strong>de</strong> 85,1 miles <strong>de</strong> ha, una reducción <strong>de</strong>l 74,28%. La<br />
caída más brusca se produce entre 1985 y 1995, año en el que <strong>la</strong> superficie era <strong>de</strong> 206 mil ha.<br />
Des<strong>de</strong> entonces <strong>la</strong> ten<strong>de</strong>ncia <strong>de</strong> disminución ha continuado aunque no ha sido tan drástica<br />
como <strong>la</strong> <strong>de</strong>scrita anteriormente.<br />
La superficie y rendimiento en patata tanto en secano como en regadío se refleja en <strong>la</strong> tab<strong>la</strong><br />
3.4. Aquí se pue<strong>de</strong> observar como <strong>de</strong> <strong>la</strong>s 85.728 ha <strong>de</strong>dicadas al cultivo en 2007, 21.750 se<br />
cultivaron en secano (25,37% <strong>de</strong>l total) y 63.978 en regadío (74,63%). El 64,3% <strong>de</strong> <strong>la</strong> superficie<br />
<strong>de</strong> patata en secano correspon<strong>de</strong> a Galicia, siendo <strong>la</strong> <strong>de</strong> <strong>la</strong>s restantes comunida<strong>de</strong>s muy<br />
pequeña (le siguen Asturias, Canarias y Castil<strong>la</strong> y León), aunque los mejores rendimientos en<br />
secano los tuvo Castil<strong>la</strong> y León con 23,6 t/ha. Es <strong>de</strong> <strong>de</strong>stacar que <strong>la</strong> gran mayoría <strong>de</strong> <strong>la</strong><br />
producción gallega <strong>de</strong> patata (tercera comunidad productora) se realiza en secano, ya que su<br />
climatología hace que el aporte <strong>de</strong> agua para el cultivo esté asegurado.<br />
TABLA 3.4. SUPERFICIE, PRODUCCIÓN Y RENDIMIENTO DE PATATA EN SECANO Y REGADÍO EN ESPAÑA EN 2007.<br />
Superficie (Hectáreas) Rendimiento (Kg/ha) Producción<br />
Secano Regadío Total Secano Regadío (Tone<strong>la</strong>das)<br />
Galicia 13.979 4.034 18.013 18.689 27.647 372.776<br />
Asturias 2.400 0 2.400 23.021 0 55.250<br />
Cantabria 494 0 494 16.520 0 8.161<br />
País Vasco 493 1.768 2.261 21.959 35.167 73.000<br />
Navarra 370 512 882 18.963 29.630 22.186<br />
La Rioja 0 2.044 2.044 0 47.420 96.926<br />
Aragón 124 295 419 15.000 36.332 12.578<br />
Cataluña 604 1.747 2.351 13.846 25.525 52.955<br />
Baleares 0 1.510 1.510 0 33.411 50.450<br />
Castil<strong>la</strong> y León 604 21.541 22.145 23.648 38.416 841.807<br />
Madrid 0 442 442 0 25.000 11.050<br />
Castil<strong>la</strong> - Mancha 98 3.787 3.885 4.980 26.831 102.100<br />
Valencia 325 1.858 2.183 8.942 25.579 48.598<br />
Murcia 0 2.057 2.057 0 17.470 35.936<br />
Extremadura 0 1.800 1.800 0 33.056 59.500<br />
Andalucía 706 17.873 18.579 9.284 30.443 550.663<br />
Canarias 1.553 2.710 4.263 13.621 23.798 85.646<br />
TOTAL 21.750 63.978 85.728 18.304 32.563 2.479.582<br />
Fuente: MARM.<br />
El rendimiento medio <strong>de</strong> <strong>la</strong>s explotaciones <strong>de</strong> secano en 2007 alcanzó los 18,304 t/ha<br />
mientras que en regadío fue <strong>de</strong> 32,563 t/ha. El rendimiento más bajo en secano lo tuvo<br />
Castil<strong>la</strong> La Mancha con 4,980 t/ha, mientras que <strong>la</strong> Rioja registró el más alto con 23,648 t/ha.<br />
En cuanto a <strong>la</strong> superficie <strong>de</strong> regadío, el rendimiento más alto lo tuvo La Rioja con 47,420<br />
t/ha, mientras que Murcia se quedó con el más bajo (17,470 t/ha), <strong>de</strong>bido a que esta región<br />
es productora <strong>de</strong> patata temprana y los rendimientos obtenidos son inferiores.<br />
29
El rendimiento medio en producción <strong>de</strong> patata en España fue <strong>de</strong> 26,06 t/ha en el 2008, un<br />
38,3% más que en 1990. Como se pue<strong>de</strong> observar en el gráfico 3.4 <strong>la</strong> evolución <strong>de</strong> los<br />
rendimientos ha sido positiva en todos los grupos <strong>de</strong> patata, siendo el mayor en patata tardía<br />
(66% <strong>de</strong>s<strong>de</strong> 1990 a 2008). La inestabilidad en <strong>la</strong> evolución <strong>de</strong> los rendimientos es más notable<br />
en <strong>la</strong> patata extratemprana y temprana. En cuanto a <strong>la</strong> patata <strong>de</strong> media estación el aumento<br />
<strong>de</strong>l rendimiento con respecto a 1990 es <strong>de</strong> 36,8%.<br />
GRÁFICO 3.4. EVOLUCIÓN DE LOS RENDIMIENTOS MEDIOS DE PATATA EN ESPAÑA, EXPRESADOS EN TONELADAS POR<br />
HECTÁREA.<br />
40000<br />
35000<br />
30000<br />
25000<br />
20000<br />
15000<br />
10000<br />
5000<br />
0<br />
1990<br />
1991<br />
1992<br />
1993<br />
1994<br />
1995<br />
1996<br />
1997<br />
1998<br />
1999<br />
2000<br />
2001<br />
2002<br />
2003<br />
2004<br />
2005<br />
2006<br />
2007<br />
Extratemprana<br />
Temprana<br />
Media estación<br />
Tardía<br />
TOTAL<br />
Fuente: e<strong>la</strong>boración propia a partir <strong>de</strong> datos <strong>de</strong>l MARM; *: Datos provisionales.<br />
2008<br />
2009*<br />
TABLA 3.5. EVOLUCIÓN DE LOS RENDIMIENTOS MEDIOS DE PATATA EN ESPAÑA, EXPRESADOS EN TONELADAS POR<br />
HECTÁREA.<br />
Extratemprana Temprana Media estación Tardía TOTAL<br />
1990 16,31 20,04 19,64 19,64 18,84<br />
1991 19,00 18,87 19,02 20,72 19,39<br />
1992 20,21 19,58 18,99 22,98 20,38<br />
1993 19,07 18,44 17,19 21,00 18,88<br />
1994 16,97 19,28 18,83 20,40 18,83<br />
1995 13,19 16,15 19,05 21,37 17,16<br />
1996 14,81 19,38 21,00 24,23 19,55<br />
1997 11,38 18,90 21,96 23,94 18,34<br />
1998 13,03 19,91 23,69 26,26 20,04<br />
1999 17,59 22,60 25,42 27,93 23,05<br />
2000 18,74 21,88 26,57 28,78 23,66<br />
2001 17,97 20,34 26,31 30,11 23,19<br />
2002 21,63 23,07 27,48 32,51 25,84<br />
2003 21,81 23,54 26,05 31,34 25,44<br />
2004 22,09 23,79 27,57 29,60 25,59<br />
2005 18,95 22,59 26,74 31,69 24,54<br />
2006 21,80 25,60 28,52 33,33 26,99<br />
2007 23,18 27,58 27,67 32,97 27,64<br />
2008 21,57 24,41 26,87 32,62 26,06<br />
2009 (P) 20,33 25,51 27,48 34,60 26,50<br />
% (90/08) 1 +32,25 +21,81 +36,81 +66,09 +38,32<br />
Fuente: MARM; (P): datos provisionales, 1 : Variación en % <strong>de</strong>s<strong>de</strong> 1990 hasta 2008 consi<strong>de</strong>rando 2008 como 100%.<br />
30
Los datos <strong>de</strong> rendimiento que se exponen en <strong>la</strong> tab<strong>la</strong> 3.5 <strong>de</strong>muestran c<strong>la</strong>ramente una<br />
evolución positiva <strong>de</strong>l rendimiento, a pesar <strong>de</strong> <strong>la</strong> drástica disminución <strong>de</strong> <strong>la</strong> superficie<br />
<strong>de</strong>dicada al cultivo, por lo que <strong>la</strong> producción no ha caído en <strong>la</strong> misma proporción.<br />
3.2 CALENDARIO Y ESTRUCTURA DE LA PRODUCCIÓN DE PATATA EN ESPAÑA<br />
Con re<strong>la</strong>ción a <strong>la</strong> estacionalidad y a <strong>la</strong> época <strong>de</strong> recolección se c<strong>la</strong>sifica <strong>la</strong> patata en 4 gran<strong>de</strong>s<br />
grupos:<br />
GRUPO<br />
<strong>Patata</strong> extratemprana<br />
ÉPOCA DE RECOLECCIÓN<br />
15 <strong>de</strong> enero – 15 <strong>de</strong> abril<br />
PRINCIPALES ZONAS<br />
PRODUCTORAS<br />
Andalucía, Canarias, Baleares y<br />
Murcia<br />
<strong>Patata</strong> temprana 16 <strong>de</strong> abril – 15 <strong>de</strong> junio Andalucía, Canarias y Murcia<br />
<strong>Patata</strong> <strong>de</strong> media estación 16 <strong>de</strong> junio- 30 <strong>de</strong> septiembre Castil<strong>la</strong> y León y Galicia<br />
<strong>Patata</strong> tardía 1 <strong>de</strong> octubre- 15 <strong>de</strong> enero Castil<strong>la</strong> y León<br />
Sin embargo, según <strong>la</strong> norma <strong>de</strong> calidad comercial para <strong>la</strong>s patatas <strong>de</strong> consumo en el mercado<br />
nacional (Real Decreto 31/2009) se <strong>de</strong>finen los siguientes tres tipos comerciales <strong>de</strong> patata:<br />
- De primor: <strong>la</strong>s que a<strong>de</strong>más <strong>de</strong> ser cosechadas antes <strong>de</strong> su completa maduración<br />
natural, <strong>de</strong> modo que su epi<strong>de</strong>rmis o piel pueda <strong>de</strong>spren<strong>de</strong>rse fácilmente por<br />
frotamiento, <strong>de</strong>ben comercializarse en los días inmediatos a su recolección.<br />
- Nuevas: <strong>la</strong>s cosechadas en su completa maduración natural y comercializadas en<br />
<strong>la</strong>s semanas inmediatas a su recolección sin más almacenamiento y/o conservación<br />
que el necesario para garantizar el <strong>de</strong>sarrollo normal <strong>de</strong> su proceso comercializador.<br />
- De conservación: <strong>la</strong>s cosechadas en su plena madurez, aptas para su<br />
comercialización <strong>de</strong>spués <strong>de</strong> pasar por un período <strong>de</strong> almacenamiento y/o<br />
conservación más o menos prolongado, sin mermas <strong>de</strong> sus cualida<strong>de</strong>s organolépticas.<br />
En el gráfico 3.5 se refleja <strong>la</strong> distribución <strong>de</strong> patata en función <strong>de</strong> su estacionalidad en el año<br />
2008, y se muestra como el mayor peso lo acaparan <strong>la</strong> patata <strong>de</strong> media estación y <strong>la</strong> tardía,<br />
con el 49,8% y 32,0% <strong>de</strong>l total respectivamente.<br />
31
GRÁFICO 3.5. PORCENTAJE QUE REPRESENTAN LOS GRUPOS DE PATATA, EN FUNCIÓN DE LA ÉPOCA DE RECOLECCIÓN,<br />
CON RESPECTO AL TOTAL EN EL AÑO 2008.<br />
32<br />
3,2<br />
15,1<br />
Extratemprana<br />
Temprana<br />
Media estación<br />
Tardía<br />
49,7<br />
Fuente: e<strong>la</strong>boración propia a partir <strong>de</strong> datos <strong>de</strong>l MARM.<br />
A continuación, en el gráfico 3.6, se expone <strong>la</strong> evolución <strong>de</strong> <strong>la</strong> representatividad <strong>de</strong> los<br />
diferentes tipos <strong>de</strong> patata en función <strong>de</strong> <strong>la</strong> fecha <strong>de</strong> recolección <strong>de</strong>s<strong>de</strong> 1990 a 2009 expresado<br />
en porcentaje re<strong>la</strong>tivo <strong>de</strong> <strong>la</strong> producción total. Se constata una disminución <strong>de</strong>l peso <strong>de</strong> <strong>la</strong><br />
patata <strong>de</strong> media estación, y un ligero aumento <strong>de</strong>l peso <strong>de</strong> <strong>la</strong> patata temprana y <strong>de</strong> <strong>la</strong> tardía.<br />
La patata extratemprana también ha aumentado levemente manteniéndose estable en un<br />
nivel bajo en el contexto <strong>de</strong>l conjunto nacional.<br />
GRÁFICO 3.6. EVOLUCIÓN DE CADA GRUPO DE PATATA, EXPRESADA EN PORCENTAJE DE LA PRODUCCIÓN TOTAL EN<br />
LOS AÑOS 1990-2009.<br />
70,00<br />
Extratemprana Temprana Media estación Tardía<br />
60,00<br />
50,00<br />
40,00<br />
30,00<br />
20,00<br />
10,00<br />
0,00<br />
1990<br />
1991<br />
1992<br />
1993<br />
1994<br />
1995<br />
1996<br />
1997<br />
1998<br />
1999<br />
2000<br />
2001<br />
2002<br />
2003<br />
2004<br />
2005<br />
2006<br />
2007<br />
2008<br />
2009*<br />
Fuente: e<strong>la</strong>boración propia a partir <strong>de</strong> datos <strong>de</strong>l MARM; *: Datos provisionales.<br />
32
3.2.1 SUPERFICIE Y PRODUCCIÓN DE PATATA EN ESPAÑA POR CC.AA. EN FUNCIÓN DE SU<br />
ESTACIONALIDAD<br />
<strong>Patata</strong> extratemprana<br />
Según los últimos datos <strong>de</strong> 2008, Andalucía y <strong>la</strong>s Is<strong>la</strong>s Canarias son <strong>la</strong>s Comunida<strong>de</strong>s que mayor<br />
superficie <strong>de</strong>dican al cultivo <strong>de</strong> patata extratemprana, y <strong>la</strong>s máximas productoras (48% y 30%<br />
respectivamente <strong>de</strong> <strong>la</strong> producción total), seguidas <strong>de</strong> Baleares (13,75%) y Murcia (6,25%) (ver<br />
gráfico 3.7). El mayor rendimiento correspondió en 2008 a Baleares (26,2 t/ha) y a Murcia<br />
(23,8 t/ha).<br />
GRÁFICO 3.7. IMPORTANCIA, EXPRESADA EN PORCENTAJE DE PRODUCCIÓN, DE LAS CC.AA. PRODUCTORAS DE PATATA<br />
EXTRATEMPRANA, EN EL AÑO 2008.<br />
60<br />
50<br />
40<br />
30<br />
20<br />
10<br />
0<br />
Andalucía Canarias Baleares Murcia Resto<br />
regiones<br />
Fuente: e<strong>la</strong>boración propia a partir <strong>de</strong> datos <strong>de</strong>l MARM.<br />
Como ya hemos visto anteriormente, <strong>la</strong> patata extratemprana es <strong>la</strong> única cuya producción<br />
aumenta (un 19,7% <strong>de</strong>s<strong>de</strong> 1990 hasta 2008). Por el contrario, en este mismo periodo, <strong>la</strong><br />
superficie se ha reducido un 10,3%, aunque es <strong>la</strong> menor disminución <strong>de</strong> todos los tipos <strong>de</strong><br />
patata. El <strong>de</strong>stino <strong>de</strong> <strong>la</strong> producción es mayoritariamente el mercado nacional <strong>de</strong>bido a que<br />
son producciones muy locales y con cantida<strong>de</strong>s limitadas <strong>de</strong> manera discontinua.<br />
<strong>Patata</strong> temprana<br />
Andalucía, Canarias, Murcia y Galicia fueron <strong>la</strong>s Comunida<strong>de</strong>s Autónomas que mayor<br />
superficie <strong>de</strong>dicaron al cultivo <strong>de</strong> patata temprana en 2008. Las mayores producciones se<br />
registran en Andalucía, Canarias y Murcia (ver gráfico 3.8), estando los mejores rendimientos<br />
en Baleares, Andalucía y Valencia (35,4, 30,3 y 24,8 t/ha respectivamente). Galicia, que<br />
presenta una importante superficie cultivada, tiene unos rendimientos muy bajos.<br />
33
GRÁFICO 3.8. IMPORTANCIA, EXPRESADA EN PORCENTAJE DE PRODUCCIÓN, DE LAS CC.AA. PRODUCTORAS DE PATATA<br />
TEMPRANA, EN EL AÑO 2008.<br />
70<br />
60<br />
50<br />
40<br />
30<br />
20<br />
10<br />
0<br />
Andalucía<br />
Canarias<br />
Murcia<br />
Baleares<br />
C. Valenciana<br />
Galicia<br />
Cataluña<br />
C.-La Mancha<br />
Otras regiones<br />
Fuente: e<strong>la</strong>boración propia a partir <strong>de</strong> datos <strong>de</strong>l MARM.<br />
Des<strong>de</strong> el punto <strong>de</strong> vista <strong>de</strong> <strong>la</strong> comercialización, también marca <strong>la</strong> diferencia <strong>la</strong> temporalidad<br />
<strong>de</strong>l producto con respecto a <strong>la</strong> patata <strong>de</strong> media estación o tardía: en el momento <strong>de</strong><br />
recogerse <strong>la</strong> patata, existe una <strong>de</strong>manda importante en el mercado <strong>de</strong> patata nueva, <strong>de</strong>bido a<br />
que venimos <strong>de</strong> una campaña <strong>de</strong> patata <strong>de</strong> conservación o “vieja” que culinariamente no<br />
cumple con los criterios óptimos para este producto y con calida<strong>de</strong>s muy discutibles e<br />
inestables. El producto recibe así un valor añadido mayor e inmediato <strong>de</strong>bido también a que<br />
<strong>la</strong> oferta es limitada y no hay concurrencia en el mercado <strong>de</strong> este tipo <strong>de</strong> patata. El<br />
almacenamiento no tiene sentido <strong>de</strong>bido a <strong>la</strong>s características <strong>de</strong> esta patata que no <strong>la</strong> hacen<br />
idónea para conservar.<br />
Últimamente, <strong>la</strong>s producciones extratempranas y tempranas están sufriendo los efectos <strong>de</strong> <strong>la</strong><br />
prolongación <strong>de</strong>l almacenamiento <strong>de</strong> <strong>la</strong>s producciones francesas que llega en algunos casos<br />
hasta marzo y/o abril. Por lo tanto existe un periodo <strong>de</strong> tiempo don<strong>de</strong> esta "patata vieja" se<br />
so<strong>la</strong>pa con <strong>la</strong> recogida <strong>de</strong> <strong>la</strong> patata extratemprana y temprana, lo cual reduce <strong>la</strong> <strong>de</strong>manda <strong>de</strong><br />
éstas ya que el diferencial <strong>de</strong> precios es muy significativo, aunque como se ha dicho<br />
anteriormente cualitativamente y culinariamente no son comparables.<br />
Para esta patata existe un mercado <strong>de</strong> exportación muy importante <strong>de</strong>bido a <strong>la</strong> falta <strong>de</strong><br />
cosechas en <strong>la</strong> UE durante el periodo <strong>de</strong> tiempo que se recolectan y existe una<br />
especialización por parte <strong>de</strong> los productores en cuanto a varieda<strong>de</strong>s, protocolos <strong>de</strong><br />
producción, técnicas <strong>de</strong> cultivo, etc. para adaptarse a <strong>la</strong>s exigencias <strong>de</strong> los mercados<br />
comunitarios.<br />
34
<strong>Patata</strong> <strong>de</strong> media estación.<br />
La importancia re<strong>la</strong>tiva <strong>de</strong> esta producción ha disminuido, ya que llegó a representar el 55%<br />
<strong>de</strong> <strong>la</strong> producción total <strong>de</strong> patata españo<strong>la</strong>, constituyendo sólo el 49,6% y el 48,1% <strong>de</strong> <strong>la</strong><br />
producción total en los años 2008 y 2009 respectivamente. Sólo Castil<strong>la</strong> y León y Galicia<br />
aglutinan el 51,76% <strong>de</strong> <strong>la</strong> producción <strong>de</strong> media estación en España. La Comunidad Autónoma<br />
que mayor superficie <strong>de</strong>dicó al cultivo <strong>de</strong> patata <strong>de</strong> media estación en 2008 fue Galicia,<br />
seguida <strong>de</strong> Castil<strong>la</strong> y León y Andalucía. Sin embargo, <strong>la</strong>s CCAA mayores productoras son<br />
Castil<strong>la</strong> y León, <strong>de</strong>spués Galicia y luego Andalucía, <strong>de</strong>bido a los mejores rendimientos <strong>de</strong><br />
Castil<strong>la</strong> y León.<br />
Galicia registra un rendimiento por <strong>de</strong>bajo <strong>de</strong> <strong>la</strong> media nacional, y Andalucía se sitúa<br />
ligeramente por encima <strong>de</strong> dicha media. La Rioja y Castil<strong>la</strong> y León son <strong>la</strong>s Comunida<strong>de</strong>s con<br />
mayores rendimientos productivos, mientras que Murcia, Cantabria y Canarias son los que<br />
menores rendimientos tienen. En <strong>la</strong> tab<strong>la</strong> 3.6 se muestra <strong>la</strong> superficie, producción y<br />
rendimientos <strong>de</strong> <strong>la</strong> patata <strong>de</strong> media estación por CCAA.<br />
TABLA 3.6. SUPERFICIE, PRODUCCIÓN Y RENDIMIENTO DE PATATA DE MEDIA ESTACIÓN POR CC.AA.<br />
SUPERFICIE (ha) PRODUCCIONES (t) RENDIMIENTO (t/ha)<br />
2006 2007 2008 2006 2007 2008 2006 2007 2008<br />
Galicia 15.271 15.438 14.715 358.388 324.620 291.300 23,47 21,03 19,80<br />
Asturias 2.550 2.250 2.000 57.500 51.750 19.500 22,55 23,00 9,75<br />
Cantabria 75 247 272 1.358 4.076 8500 18,11 16,50 31,25<br />
País Vasco 1.025 1.045 1.066 34.400 33.822 25.700 33,56 32,37 24,11<br />
Navarra 438 439 428 10.648 11.861 11.400 24,31 27,02 26,64<br />
La Rioja 1.300 1.432 1.404 58.728 65.186 59.200 45,18 45,52 42,17<br />
Aragón 166 123 84 5.040 3.906 2.900 30,36 31,76 34,52<br />
Cataluña 1.607 1.305 1.345 37.096 30.693 30.000 23,08 23,52 22,30<br />
Baleares 0 0 300 0 0 12.600 0 0 42,00<br />
Castil<strong>la</strong> y León 9.022 8.263 8.639 343.387 307.139 317.900 38,06 37,17 36,34<br />
Madrid 665 412 1.700 16.625 10.300 51.000 25,00 25,00 30,00<br />
Castil<strong>la</strong> - Mancha 2.560 2.740 2.621 72.312 74.358 73.600 28,25 27,14 28,08<br />
Valencia 760 713 715 14.050 13.865 12.400 18,49 19,45 17,34<br />
Murcia 302 266 240 5.738 5.304 5.500 19,00 19,94 22,92<br />
Extremadura 1.700 1.800 1.650 54.750 59.500 63.500 32,21 33,06 38,48<br />
Andalucía 6.642 6.010 6.249 191082 181.984 187.300 28,77 30,28 29,97<br />
Canarias 312 252 250 5.250 4.272 4.400 16,83 16,95 17,60<br />
España 44.395 42.735 43.788 1.266352 1.182.636 1.177.000 28,52 27,67 26,88<br />
Fuente: E<strong>la</strong>boración propia a partir <strong>de</strong> los datos <strong>de</strong>l MARM.<br />
35
En el gráfico 3.7 se expone <strong>la</strong> producción <strong>de</strong> patata <strong>de</strong> media estación por CCAA. Aquí se<br />
muestra como Castil<strong>la</strong> y León fue <strong>la</strong> Comunidad que más patatas <strong>de</strong> media estación produjo<br />
en 2008, con un total <strong>de</strong> casi 318 mil tone<strong>la</strong>das.<br />
GRÁFICO 3.7. PRODUCCIÓN DE PATATA DE MEDIA ESTACIÓN POR CC.AA, EN EL AÑO 2008 EXPRESADO EN TONELADAS.<br />
350000<br />
300000<br />
250000<br />
200000<br />
150000<br />
100000<br />
50000<br />
0<br />
Castil<strong>la</strong> y León<br />
Galicia<br />
Andalucía<br />
Castil<strong>la</strong> - Mancha<br />
Extremadura<br />
La Rioja<br />
Madrid<br />
Cataluña<br />
País Vasco<br />
Asturias<br />
Baleares<br />
Valencia<br />
Fuente: e<strong>la</strong>boración propia a partir <strong>de</strong> datos <strong>de</strong>l MARM.<br />
Estructura <strong>de</strong> <strong>la</strong> producción en Castil<strong>la</strong> y León, Galicia y La Rioja<br />
Navarra<br />
Cantabria<br />
Murcia<br />
Canarias<br />
Aragón<br />
Dentro <strong>de</strong> Castil<strong>la</strong> y León, <strong>la</strong>s mayores provincias productoras <strong>de</strong> patata <strong>de</strong> media estación en<br />
2008 fueron, por este or<strong>de</strong>n, Sa<strong>la</strong>manca, Val<strong>la</strong>dolid y Segovia, que aglutinaron juntas el 67%<br />
<strong>de</strong> <strong>la</strong> producción total. La tab<strong>la</strong> 3.7 muestra <strong>la</strong> superficie y producción <strong>de</strong> patata <strong>de</strong> media<br />
estación <strong>de</strong> Castil<strong>la</strong> y León por provincias entre los años 2006-2008.<br />
TABLA 3.7. SUPERFICIE Y PRODUCCIÓN DE PATATA DE MEDIA ESTACIÓN EN CASTILLA Y LEÓN.<br />
SUPERFICE (ha)<br />
PRODUCCIÓN (t)<br />
2006 2007 2008 2006 2007 2008 2008% 1<br />
Ávi<strong>la</strong> 625 801 507 18.730 23.890 22.815 6,61<br />
Burgos 732 1.000 1.000 32.693 42.817 40.000 11,58<br />
León 61 60 50 1.708 1.920 1.600 0,46<br />
Palencia 346 111 300 16.100 3.482 9.900 2,87<br />
Sa<strong>la</strong>manca 3.738 2.579 2.801 135.604 90.836 108.452 31,41<br />
Segovia 1.028 929 1.400 41.120 33.444 46.200 13,38<br />
Soria 27 1.160 13.230 3,83<br />
Val<strong>la</strong>dolid 1.918 2.125 2.006 74.802 85.255 77.254 22,37<br />
Zamora 547 658 575 21.470 25.495 25.831 7,48<br />
Castil<strong>la</strong> y León 9.022 8.263 8639 343.387 307.139 345.282<br />
Fuente: e<strong>la</strong>boración propia a partir <strong>de</strong> datos <strong>de</strong>l MARM.<br />
1 : % <strong>de</strong> <strong>la</strong> producción total <strong>de</strong> Castil<strong>la</strong> y León que representa cada provincia.<br />
Las provincias productoras <strong>de</strong> Castil<strong>la</strong> y León <strong>de</strong>muestran diferencias en cuanto a su<br />
estructura <strong>de</strong> producción. Mientras que Sa<strong>la</strong>manca presentan suelos que hacen más difícil el<br />
cultivo <strong>de</strong> varieda<strong>de</strong>s aptas para el <strong>la</strong>vado, en <strong>la</strong> zona <strong>de</strong> Segovia, Zamora y Val<strong>la</strong>dolid sí que<br />
36
se han podido cultivar esas varieda<strong>de</strong>s, y por lo tanto <strong>la</strong> oferta se ha podido adaptar a <strong>la</strong>s<br />
<strong>de</strong>mandas <strong>de</strong> los clientes (operadores <strong>de</strong> <strong>de</strong>stino y gran distribución). De este modo, en<br />
Sa<strong>la</strong>manca se emplean varieda<strong>de</strong>s como Jaer<strong>la</strong> o Fabu<strong>la</strong>, y en <strong>la</strong>s otras provincias<br />
mencionadas anteriormente se utilizan varieda<strong>de</strong>s como Monalisa, Agata, Vivaldi, Carrera,<br />
etc. en lo que se refiere a varieda<strong>de</strong>s para consumo en fresco. Las varieda<strong>de</strong>s <strong>de</strong>stinadas<br />
mayoritariamente a industria son por este or<strong>de</strong>n, Agria y Hermes.<br />
En el caso <strong>de</strong> <strong>la</strong> Comunidad <strong>de</strong> La Rioja, se pue<strong>de</strong> hab<strong>la</strong>r <strong>de</strong> un proceso <strong>de</strong> "expulsión" <strong>de</strong> <strong>la</strong><br />
patata para consumo en fresco, <strong>de</strong>bido a <strong>la</strong>s necesida<strong>de</strong>s <strong>de</strong>l mercado. Las condiciones<br />
agronómicas <strong>de</strong> esta región confieren al producto dos características -tamaño e irregu<strong>la</strong>ridadrechazadas<br />
por el consumidor, lo cual explica que los agentes que operan en el sector hayan<br />
tenido que reorientar su actividad, y dirigirse casi exclusivamente al mercado <strong>de</strong> <strong>la</strong> patata<br />
para industria.<br />
En lo re<strong>la</strong>tivo a Galicia, los datos <strong>de</strong>l MARM <strong>de</strong>muestran que <strong>la</strong>s provincias gallegas cultivan<br />
patata <strong>de</strong> media estación en proporciones consi<strong>de</strong>rables, siendo Orense <strong>la</strong> provincia con<br />
mayor producción (44,5% <strong>de</strong>l total <strong>de</strong> Galicia en el año 2007). El cultivo <strong>de</strong> patata en Galicia<br />
está <strong>de</strong>stinado al mercado local, y su comercialización se apoya mucho en <strong>la</strong> figura <strong>de</strong> calidad<br />
“<strong>Patata</strong> Gallega”, empleando para ello <strong>la</strong> variedad Kennebec.<br />
<strong>Patata</strong> tardía<br />
La región que más superficie <strong>de</strong> patata tardía cultiva y que obtiene mayores producciones es<br />
Castil<strong>la</strong> y León, que junto a La Rioja y el País Vasco registran los mejores rendimientos. El<br />
gráfico 3.8 muestran <strong>la</strong> producción <strong>de</strong> patata tardía en <strong>la</strong>s diferentes CCAA.<br />
GRÁFICO 3.8. PRODUCCIÓN DE PATATA TARDÍA POR CC.AA, EN EL AÑO 2008 EXPRESADA EN TONELADAS.<br />
600000<br />
500000<br />
400000<br />
300000<br />
200000<br />
100000<br />
0<br />
Castil<strong>la</strong> y León<br />
Andalucía<br />
Castil<strong>la</strong> - Mancha<br />
Galicia<br />
La Rioja<br />
País Vasco<br />
Canarias<br />
Navarra<br />
Aragón<br />
Cataluña<br />
Valencia<br />
Cantabria<br />
Fuente: e<strong>la</strong>boración propia a partir <strong>de</strong> datos <strong>de</strong>l MARM.<br />
37<br />
Murcia<br />
Baleares<br />
Asturias<br />
Madrid<br />
Extremadura
Por su parte, <strong>la</strong> tab<strong>la</strong> 3.8 muestra <strong>la</strong> superficie, producción y rendimientos <strong>de</strong> patata tardía<br />
por CCAA.<br />
TABLA 3.8. SUPERFICIE, PRODUCCIÓN Y RENDIMIENTO DE PATATA TARDÍA, POR CC.AA.<br />
Superficie (ha) Producciones (1.000 t) Rendimiento (t/ha)<br />
2006 2007 2008 2006 2007 2008 2006 2007 2008<br />
Galicia 1.362 1.305 1.815 27,0 24,3 36,9 19,80 18,59 20,33<br />
Asturias 100 100 100 2,5 2,5 1,5 25,00 25,00 15,00<br />
Cantabria 350 247 250 6,3 4,1 5,6 17,98 16,54 22,40<br />
País Vasco 1.172 1.111 922 40,9 36,8 23,9 34,88 33,08 25,92<br />
Navarra 474 443 481 10,5 10,3 10,0 22,15 23,31 20,79<br />
La Rioja 550 612 567 27,8 31,7 25,8 50,50 51,86 45,50<br />
Aragón 287 296 301 6,2 8,7 9,0 21,72 29,30 29,90<br />
Cataluña 306 531 373 6,7 11,1 8,4 21,81 20,90 22,52<br />
Baleares 190 200 200 5,2 5,5 5,5 27,50 27,50 27,50<br />
Castil<strong>la</strong> y León 11.683 13.828 12.915 474,6 533,3 512,7 40,62 38,57 39,70<br />
Madrid 44 30 – 1,1 0,8 – 25,00 25,00 –<br />
Castil<strong>la</strong> - Mancha 1.137 881 1.614 29,1 21,9 44,3 25,55 24,88 27,45<br />
Valencia 510 498 441 8,7 8,2 7,4 17,15 16,41 16,78<br />
Murcia 358 353 350 5,9 5,7 5,6 16,44 16,05 16,00<br />
Extremadura – – – – – – – – –<br />
Andalucía 2.537 2.367 2.229 61,8 58,4 51,1 24,34 24,66 22,93<br />
Canarias 770 724 760 13,4 12,4 12,5 17,41 17,14 16,45<br />
España 21.830 23.526 23.230 727,6 775,7 756,6 33,33 32,97 32,57<br />
Fuente: E<strong>la</strong>boración propia a partir <strong>de</strong> datos <strong>de</strong>l MARM; -: Datos no disponibles.<br />
La patata tardía ha registrado un ligero aumento en términos <strong>de</strong> peso re<strong>la</strong>tivo con respecto a<br />
<strong>la</strong> producción <strong>de</strong> patata total españo<strong>la</strong> a lo <strong>la</strong>rgo <strong>de</strong> <strong>la</strong> última década. Sin embargo, <strong>de</strong>s<strong>de</strong><br />
1992 (fecha <strong>de</strong> <strong>la</strong> imp<strong>la</strong>ntación <strong>de</strong> <strong>la</strong> Reforma <strong>de</strong> <strong>la</strong> PAC), se ha producido un <strong>de</strong>scenso <strong>de</strong> <strong>la</strong><br />
producción <strong>de</strong> patata <strong>de</strong> media estación y tardía, <strong>de</strong>bido a su <strong>de</strong>sp<strong>la</strong>zamiento por cultivos con<br />
mayor protección pública (cereales, forrajes, etc.). Gran parte <strong>de</strong> los agricultores <strong>de</strong> patata<br />
<strong>de</strong> media estación y tardía consi<strong>de</strong>raban el cultivo <strong>de</strong> patata como un elemento "secundario"<br />
<strong>de</strong> su rotación, que queda supeditado a <strong>la</strong>s <strong>de</strong>cisiones re<strong>la</strong>tivas <strong>de</strong> otros cultivos más<br />
rentables, visión que sobre todo en los dos últimos años ha cambiado.<br />
Estructura <strong>de</strong> <strong>la</strong> producción <strong>de</strong> patata tardía <strong>de</strong> Castil<strong>la</strong> y León<br />
Castil<strong>la</strong> y León produce el 67,3% <strong>de</strong>l total nacional <strong>de</strong> <strong>la</strong> patata tardía. La provincia que más<br />
patata tardía produjo en 2008 fue Val<strong>la</strong>dolid, con el 38,5% <strong>de</strong>l total regional, estando el resto<br />
<strong>de</strong> <strong>la</strong> producción más repartida en <strong>la</strong>s restantes provincias, como indica <strong>la</strong> tab<strong>la</strong> 3.9.<br />
38
TABLA 3.9. SUPERFICIE Y PRODUCCIÓN DE PATATA TARDÍA EN CASTILLA Y LEÓN.<br />
Superficie (ha)<br />
Producción (t)<br />
2006 2007 2008 2006 2007 2008 2008%<br />
Ávi<strong>la</strong> 145 123 76 6.873 5.535 3.192 0,65<br />
Burgos 2.476 2.151 1.900 96.510 66.932 64.000 13,18<br />
León 1.939 2.040 1.850 83.862 82.620 73.075 14,91<br />
Palencia 711 1.071 900 27.189 37.022 27.900 5,09<br />
Sa<strong>la</strong>manca 1.015 2.303 1.887 37.277 85.656 58.398 11,92<br />
Segovia 807 1.019 1.400 33.894 40.760 50.400 10,29<br />
Soria 320 360 315 14180 12.572 – –<br />
Val<strong>la</strong>dolid 3808 4.276 4.012 154.986 182.970 188.600 38,47<br />
Zamora 462 485 575 19.834 19.301 24.210 4,94<br />
Castil<strong>la</strong> y León 11.683 13.828 12.915 474.605 533.368 490.375 100,00<br />
Fuente: e<strong>la</strong>boración propia a partir <strong>de</strong> datos <strong>de</strong>l MARM y <strong>de</strong> <strong>la</strong> Junta <strong>de</strong> Castil<strong>la</strong> y León;<br />
(-): Datos no disponibles.<br />
3.2.2 CALENDARIO DE PRODUCCIÓN<br />
Las zonas que primeramente sacan sus cosechas a <strong>la</strong> venta son Granada y Má<strong>la</strong>ga con <strong>la</strong><br />
patata extratemprana o <strong>de</strong> primor (ver gráfico 3.8), que se comercializan para mercados<br />
locales o regionales ya que son producciones pequeñas y sin continuidad, seguidas <strong>de</strong> Murcia,<br />
Sevil<strong>la</strong> y Valencia. Estas producciones se están so<strong>la</strong>pando en los últimos años en el mercado<br />
con patata "vieja" proce<strong>de</strong>nte <strong>de</strong> <strong>la</strong> UE, sobre todo francesa. Mucha <strong>de</strong> <strong>la</strong> patata temprana o<br />
nueva se exporta a países <strong>de</strong> <strong>la</strong> UE como Reino Unido, Bélgica, Alemania o Francia.<br />
Posteriormente, <strong>la</strong>s zonas que abastecen al mercado son <strong>la</strong>s zonas <strong>de</strong> Extremadura, Cataluña,<br />
Castil<strong>la</strong> y León, y Á<strong>la</strong>va. Estas producciones están abasteciendo al mercado por sí so<strong>la</strong>s hasta<br />
noviembre y diciembre, periodo en el que se empieza a competir con <strong>la</strong>s producciones<br />
europeas, principalmente francesas, ya que los costes logísticos son más competitivos y<br />
tienen una gran cantidad <strong>de</strong> patata conservada que hay que dar salida.<br />
Lo que está c<strong>la</strong>ro es que España pue<strong>de</strong> potencialmente, <strong>de</strong>s<strong>de</strong> el punto <strong>de</strong> vista agroclimático,<br />
suministrar patata durante todo el año al mercado nacional. Las razones por <strong>la</strong>s<br />
cuales esto no ocurre se encuentran en <strong>la</strong>s <strong>de</strong>ficiencias existentes sobre todo en <strong>la</strong> estrategia<br />
comercial <strong>de</strong>l sector y en <strong>la</strong> falta <strong>de</strong> patata <strong>de</strong> conservación <strong>de</strong> calidad.<br />
A este respecto cabe seña<strong>la</strong>r que algunos países <strong>de</strong> <strong>la</strong> UE, particu<strong>la</strong>rmente Francia, están<br />
ampliando el periodo <strong>de</strong> abastecimiento <strong>de</strong>l mercado español <strong>de</strong> patata en los últimos años y<br />
se prevé que en pocos años lleguen a cerrar su ciclo anual <strong>de</strong> abastecimiento. Ese hecho ya<br />
está empezando a traer repercusiones negativas para <strong>la</strong> venta <strong>de</strong> patata "nueva" que pue<strong>de</strong><br />
disminuir su valor y peso en el mercado, y por extensión pue<strong>de</strong> influir en <strong>la</strong> <strong>de</strong> media estación<br />
y tardía.<br />
39
GRÁFICO 3.8. CALENDARIO DE COMERCIALIZACIÓN Y PRODUCCIÓN DE PATATA, DE LAS DIFERENTES ZONAS<br />
PRODUCTORAS DE ESPAÑA Y PRINCIPALES PAÍSES ABASTECEDORES DEL MERCADO ESPAÑOL.<br />
ORIGEN<br />
ENERO<br />
FEBRERO<br />
MARZO<br />
ABRIL<br />
MAYO<br />
JUNIO<br />
JULIO<br />
AGOSTO<br />
SEPTIEMBRE<br />
OCTUBRE<br />
NOVIEMBRE<br />
DICIEMBRE<br />
PAÍS VASCO<br />
CASTILLA Y LEÓN * * * *<br />
FRANCIA<br />
BÉLGICA<br />
HOLANDA<br />
INGLATERRA<br />
GRANADA<br />
MÁLAGA<br />
MURCIA<br />
VALENCIA<br />
SEVILLA<br />
BADAJOZ<br />
TARRAGONA<br />
CÁCERES<br />
NAVARRA<br />
Fuente: e<strong>la</strong>boración propia a partir <strong>de</strong> diferentes fuentes;<br />
(*): Durante este periodo se comercializan fundamentalmente varieda<strong>de</strong>s <strong>de</strong> para industria <strong>de</strong> transformación<br />
como Agria y Hermes. Pue<strong>de</strong>n comercializarse pequeñas cantida<strong>de</strong>s <strong>de</strong> patata para consumo fresco que se han<br />
almacenado, pero que no suelen cumplir los criterios mínimos para ven<strong>de</strong>r<strong>la</strong>s <strong>de</strong>ntro <strong>de</strong> <strong>la</strong> Categoría I.<br />
3.3 DESTINO, USO DE LA PRODUCCIÓN Y BALANCE DE UTILIZACIÓN DE PATATA EN<br />
ESPAÑA<br />
Des<strong>de</strong> el punto <strong>de</strong> vista <strong>de</strong> su <strong>de</strong>stino final, <strong>la</strong> patata se pue<strong>de</strong> c<strong>la</strong>sificar en:<br />
• <strong>Patata</strong> para siembra. Es aquel<strong>la</strong> que sirve <strong>de</strong> semil<strong>la</strong> para los productores.<br />
• <strong>Patata</strong> para alimentación animal. Es <strong>la</strong> que no cumple los criterios mínimos <strong>de</strong> calidad para<br />
consumo humano. También pue<strong>de</strong>n ser los <strong>de</strong>stríos <strong>de</strong> <strong>la</strong> industria o los almacenes.<br />
• <strong>Patata</strong> con <strong>de</strong>stino a industria. Es <strong>la</strong> que su fin es <strong>la</strong> transformación en chips, prefrita,<br />
copos o purés, conge<strong>la</strong>da, tortil<strong>la</strong>, IV y V Gama.<br />
• <strong>Patata</strong> para consumo en fresco <strong>de</strong>stinada al autoconsumo y consumo comercializado.<br />
40
TABLA 3.10. BALANCE DE UTILIZACIÓN DE PATATA EN ESPAÑA, EXPRESADO EN MILES DE TONELADAS.<br />
CONCEPTOS<br />
Campaña 2003/2004<br />
<strong>Patata</strong> total <strong>Patata</strong> temprana<br />
Otras <strong>Patata</strong>s<br />
PRODUCCIÓN UTILIZABLE 2.665 471,7 2.193,3<br />
IMPORTACIONES 1.554 224,7 1.329,3<br />
De <strong>la</strong> U.E. 1.509,1 182,7 1.326,4<br />
EXPORTACIONES 319,5 105,7 213,9<br />
A <strong>la</strong> U.E. 307,6 103,9 203,7<br />
VARIACIÓN DE EXISTENCIAS 0 0 0<br />
UTILIZACIÓN INTERIOR TOTAL 3.899,4 590,8 3.308,6<br />
Semil<strong>la</strong>s 139,7 33 106,7<br />
Pérdidas 189,9 29,2 160,7<br />
Alimentación animal 99,9 6,9 93<br />
Transformación 0,8 0 0,8<br />
Consumo humano 3.469,1 521,7 2.947,5<br />
Fuente: MARM.<br />
Atendiendo a esta distribución y según el Anuario <strong>de</strong> Estadística Agraria <strong>de</strong> 2008 <strong>de</strong>l Ministerio<br />
<strong>de</strong> Medio Ambiente, Medio Rural y Marino, en <strong>la</strong> campaña 2003/04 el ba<strong>la</strong>nce <strong>de</strong> utilización<br />
<strong>de</strong> patata en España, registra un déficit en todas sus facetas (ver tab<strong>la</strong> 3.10). Por lo tanto, el<br />
consumo nacional (humano, animal, industria, etc.) es mayor que <strong>la</strong> producción, ya que<br />
España consume 3,9 millones <strong>de</strong> tone<strong>la</strong>das y únicamente produce cerca <strong>de</strong> 2,7 millones <strong>de</strong><br />
tone<strong>la</strong>das, importando <strong>de</strong> otros países <strong>la</strong> diferencia (fundamentalmente <strong>de</strong> Francia <strong>la</strong> patata<br />
<strong>de</strong> consumo o <strong>de</strong> industria, y <strong>de</strong> Ho<strong>la</strong>nda <strong>la</strong> patata <strong>de</strong> siembra). La importación no sólo cubre<br />
el déficit productivo sino que también <strong>de</strong>sp<strong>la</strong>za a una parte importante <strong>de</strong> <strong>la</strong> producción<br />
españo<strong>la</strong>, que no es capaz <strong>de</strong> romper <strong>la</strong> estacionalidad propia <strong>de</strong>bida a <strong>la</strong>s fechas <strong>de</strong><br />
producción, y que en muchas ocasiones no se adapta a los criterios comerciales <strong>de</strong>mandados.<br />
41
CONCLUSIONES<br />
o<br />
o<br />
o<br />
o<br />
o<br />
o<br />
La producción estimada <strong>de</strong> patatas en España fue <strong>de</strong> 2,45 millones <strong>de</strong><br />
tone<strong>la</strong>das durante el año 2009 y <strong>de</strong> 2,37 millones durante el año 2008. Cabe<br />
<strong>de</strong>stacar <strong>la</strong> caída importante en <strong>la</strong> última década tanto en producción <strong>de</strong><br />
patata como en superficie <strong>de</strong>stinada a este cultivo. La patata <strong>de</strong> media<br />
estación es <strong>la</strong> que más ha acusado esta disminución en <strong>la</strong> producción siendo <strong>la</strong><br />
patata extratemprana <strong>la</strong> única que ha reflejado un ligero ascenso.<br />
Castil<strong>la</strong> y León es <strong>la</strong> primera comunidad productora <strong>de</strong> patata y representa el<br />
35 % <strong>de</strong> <strong>la</strong> producción nacional, seguida <strong>de</strong> Andalucía y Galicia.<br />
En patata extratemprana y temprana Andalucía es <strong>la</strong> Comunidad con mayor<br />
peso específico, mientras que en patata <strong>de</strong> media estación tanto Galicia como<br />
Castil<strong>la</strong> y León son <strong>la</strong>s que tienen <strong>la</strong> mayor cuota <strong>de</strong>l mercado, quedando esta<br />
última como única referencia para <strong>la</strong> patata tardía.<br />
El rendimiento medio nacional en el período 2006-2008, fue <strong>de</strong> 26,90 t/ha,<br />
siendo La Rioja <strong>la</strong> comunidad que mas patatas obtiene por hectárea, seguida<br />
<strong>de</strong> Castil<strong>la</strong> y León. En los últimos 4 años hemos tenido un aumento importante<br />
en los rendimientos <strong>de</strong>bido a <strong>la</strong> mejora <strong>de</strong> <strong>la</strong>s varieda<strong>de</strong>s y los métodos <strong>de</strong><br />
cultivo.<br />
Según el calendario <strong>de</strong> producción y comercialización, Castil<strong>la</strong> y León es <strong>la</strong><br />
Comunidad que más meses al año tiene posibilidad <strong>de</strong> comercializar este<br />
producto. Aún así, Todavía podía captar más cuota <strong>de</strong> mercado como Francia,<br />
Ho<strong>la</strong>nda, Bélgica o Reino Unido si hubiera una vocación c<strong>la</strong>ra enfocada a <strong>la</strong><br />
conservar patata <strong>de</strong> calidad.<br />
España no produce suficiente patata como para cubrir <strong>la</strong>s necesida<strong>de</strong>s <strong>de</strong><br />
consumo que tiene el mercado nacional, con lo cual tiene que recurrir a <strong>la</strong><br />
importación.<br />
42
4 ANÁLISIS DE LA PRODUCCIÓN DE PATATA DE CONSUMO EN CASTILLA Y<br />
LEÓN<br />
En los dos capítulos anteriores se ha ubicado el sector <strong>de</strong> <strong>la</strong> patata a nivel mundial, europeo y<br />
español. En el presente capítulo se presenta una <strong>de</strong>scripción <strong>de</strong>tal<strong>la</strong>da <strong>de</strong> <strong>la</strong> situación <strong>de</strong> este<br />
cultivo en Castil<strong>la</strong> y León. Se preten<strong>de</strong> que este capítulo sirva <strong>de</strong> base para compren<strong>de</strong>r <strong>la</strong><br />
importancia <strong>de</strong> <strong>la</strong> patata en esta Comunidad: <strong>la</strong>s principales zonas productoras y sus<br />
características, <strong>de</strong> modo que partamos <strong>de</strong> este análisis para diagnosticar sus puntos fuertes y<br />
débiles, y hacia don<strong>de</strong> <strong>de</strong>berían ser dirigidas <strong>la</strong>s líneas <strong>de</strong> actuación que permitan potenciar<br />
el cultivo <strong>de</strong> <strong>la</strong> patata en Castil<strong>la</strong> y León.<br />
En <strong>la</strong> tab<strong>la</strong> 4.1 se muestra el valor económico <strong>de</strong> <strong>la</strong> producción vegetal <strong>de</strong> Castil<strong>la</strong> y León,<br />
don<strong>de</strong> pue<strong>de</strong> observarse <strong>la</strong> gran importancia <strong>de</strong> este sector para Castil<strong>la</strong> y León ya que en<br />
2008 ha sido el cuarto cultivo en importancia económica. Asimismo es <strong>de</strong>stacable que ocupa<br />
<strong>la</strong> segunda posición <strong>de</strong> los cultivos <strong>de</strong> regadío, tras el maíz.<br />
TABLA 4.1. PRODUCCIÓN TOTAL DEL SUBSECTOR AGRÍCOLA EN EL PERÍODO 1996-2008, EXPRESADA EN MILLONES DE €.<br />
2002 2003 2004 2005 2006 2007 2008<br />
Cebada 341 411 545,01 278,91 475,54 884,94 921,6<br />
Trigo 274 251 313,03 198,84 250,36 485,03 416,02<br />
Maíz 164 167 199,68 140,43 170,38 185,77 192,02<br />
<strong>Patata</strong> 69 122 94,24 89,55 214,08 138,61 121,59<br />
Remo<strong>la</strong>cha 217 223 239,38 229,32 137,24 139,65 103,24<br />
Vino 98 133 133,43 122,01 170,94 123,62 98,35<br />
Alfalfa 45 51 60,44 55,75 53,42 59,21 77,31<br />
Avena 32 32 33,23 31,17 33,12 63,86 70,04<br />
Girasol 35 41 44,52 20,88 41,27 87,35 59,11<br />
Centeno 14 15 14,71 12,96 16,65 31,04 34,29<br />
Fuente: Servicio <strong>de</strong> Estadística. Consejería <strong>de</strong> Agricultura y Gana<strong>de</strong>ría. Junta <strong>de</strong> Castil<strong>la</strong> y León.<br />
En lo que se refiere a <strong>la</strong> producción total en tone<strong>la</strong>das en 2008, <strong>la</strong> patata fue el quinto cultivo<br />
<strong>de</strong> <strong>la</strong> comunidad:<br />
- Cebada: 5.655.000 t.<br />
- Remo<strong>la</strong>cha: 3.000.000 t.<br />
- Trigo: 2.979.000 t.<br />
- Maíz: 1.052.000 t.<br />
- <strong>Patata</strong>: 827.000 t.<br />
- Girasol: 223.000 t.<br />
- Guisante: 76.000 t.<br />
43
La renta agraria en Castil<strong>la</strong> y León registro en el año 2008 una reducción <strong>de</strong>l 1.6 % y alcanzo<br />
un valor <strong>de</strong> 3.114,7 millones <strong>de</strong> euros a precios constantes. Por su parte, <strong>la</strong> producción final<br />
agraria (PFA) alcanzó un valor <strong>de</strong> 4.659,14 millones <strong>de</strong> euros en 2008, frente a los 4.466<br />
millones que alcanzo en el año 2007. El valor <strong>de</strong> <strong>la</strong> producción agraria equivale al 6,1 % <strong>de</strong> <strong>la</strong><br />
producción total <strong>de</strong> <strong>la</strong> comunidad autónoma, y <strong>de</strong>ntro <strong>de</strong> <strong>la</strong> producción agraria,<br />
aproximadamente el 45% correspon<strong>de</strong> al sector agríco<strong>la</strong>. En el pasado 2008, <strong>la</strong> pob<strong>la</strong>ción<br />
agraria ocupada ascendió a 75.900 personas, según datos <strong>de</strong>l Instituto Nacional <strong>de</strong> Estadística.<br />
4.1 PRODUCCIÓN, SUPERFICIE Y RENDIMIENTOS DE PATATA EN CASTILLA Y LEÓN<br />
Según el Anuario <strong>de</strong> Estadística Agraria <strong>de</strong> 2008 <strong>de</strong>l MARM, Castil<strong>la</strong> y León produjo en el año<br />
2007 un total <strong>de</strong> 842.000 tone<strong>la</strong>das <strong>de</strong> patata, el 34% <strong>de</strong>l total nacional. Los datos <strong>de</strong>l año<br />
2008 <strong>de</strong> los Avances <strong>de</strong> superficies y producciones <strong>de</strong>l MARM (diciembre 2009) indican una<br />
producción <strong>de</strong> 827.200 tone<strong>la</strong>das. Para el año 2009 se estima que <strong>la</strong> producción sea algo<br />
mayor, alre<strong>de</strong>dor <strong>de</strong> 960.100 tone<strong>la</strong>das. En <strong>la</strong> tab<strong>la</strong> 4.2 se muestra <strong>la</strong> producción <strong>de</strong> patatas<br />
en Castil<strong>la</strong> y León y en España en <strong>la</strong> serie <strong>de</strong> años 1998-2009, don<strong>de</strong> pue<strong>de</strong> observarse como a<br />
lo <strong>la</strong>rgo <strong>de</strong> esos años <strong>la</strong> producción total ha sufrido una disminución progresiva, aunque al<br />
mismo tiempo Castil<strong>la</strong> y León ha ido cobrando una mayor importancia en <strong>la</strong> producción total<br />
nacional. En el gráfico 4.1 se muestra <strong>la</strong> evolución <strong>de</strong> <strong>la</strong> producción en los años 1998-2009.<br />
GRÁFICO 4.1. PRODUCCIÓN DE PATATA EN ESPAÑA Y EN CASTILLA Y LEÓN, EN LOS AÑOS 1998-2009, EXPRESADA EN<br />
TONELADAS.<br />
4.000.000<br />
3.500.000<br />
3.000.000<br />
Castil<strong>la</strong> y León<br />
España<br />
2.500.000<br />
2.000.000<br />
1.500.000<br />
1.000.000<br />
500.000<br />
0<br />
1998 1999 2000 2001 2002 2003 2004 2005 2006 2007 2008 2009*<br />
Fuente: E<strong>la</strong>boración propia a partir <strong>de</strong> datos <strong>de</strong>l MARM y <strong>de</strong>l Servicio <strong>de</strong> Estadística, Estudios y<br />
<strong>P<strong>la</strong>n</strong>ificación Agraria (Junta <strong>de</strong> Castil<strong>la</strong> y León).<br />
En Castil<strong>la</strong> y León, en <strong>la</strong> serie <strong>de</strong> años 1998 – 2009, <strong>la</strong> principal provincia productora ha sido<br />
Val<strong>la</strong>dolid, seguida <strong>de</strong> Sa<strong>la</strong>manca y Burgos (ver gráfico 4.2 y tab<strong>la</strong> 4.2). Así, en el año 2008<br />
Val<strong>la</strong>dolid produjo el 30,48% <strong>de</strong>l total regional, y <strong>la</strong> que más superficie <strong>de</strong>dica.<br />
44
GRÁFICO 4.2. PRODUCCIÓN DE PATATA EN LAS PROVINCIAS DE CASTILLA Y LEÓN, EN LOS AÑOS 1998-2009, EXPRESADA<br />
EN TONALADAS.<br />
300.000<br />
250.000<br />
200.000<br />
150.000<br />
100.000<br />
50.000<br />
Ávi<strong>la</strong><br />
Burgos<br />
León<br />
Palencia<br />
Sa<strong>la</strong>manca<br />
Segovia<br />
Soria<br />
Val<strong>la</strong>dolid<br />
Zamora<br />
0<br />
1998<br />
1999<br />
2000<br />
2001<br />
2002<br />
2003<br />
2004<br />
2005<br />
2006<br />
2007<br />
2008<br />
2009*<br />
Fuente: E<strong>la</strong>boración propia a partir <strong>de</strong> datos <strong>de</strong>l MARM y <strong>de</strong>l Servicio <strong>de</strong> Estadística, Estudios y <strong>P<strong>la</strong>n</strong>ificación<br />
Agraria (Junta <strong>de</strong> Castil<strong>la</strong> y León).<br />
En el gráfico 4.3 se muestra <strong>la</strong> distribución <strong>de</strong> <strong>la</strong> producción en tanto por ciento durante el<br />
año 2008.<br />
GRÁFICO 4.3. PRODUCCIÓN Y SUPERFICIE DE PATATA EN LAS PROVINCIAS DE CASTILLA Y LEÓN, EN EL AÑO 2008,<br />
EXPRESADAS EN PORCENTAJE RESPECTO AL TOTAL DE LA COMUNIDAD.<br />
PRODUCCIÓN<br />
SUPERFICIE<br />
4,77 4,15 1,71 5,36 4,14 1,49<br />
Val<strong>la</strong>dolid<br />
6,38<br />
5,67<br />
30,48<br />
29,28<br />
9,66<br />
8,94<br />
9,96<br />
10,50<br />
20,28<br />
21,08<br />
12,61<br />
13,54<br />
Sa<strong>la</strong>manca<br />
Burgos<br />
Segovia<br />
León<br />
Zamora<br />
Palencia<br />
Ávi<strong>la</strong><br />
Soria<br />
Fuente: E<strong>la</strong>boración propia a partir <strong>de</strong> datos <strong>de</strong>l Servicio <strong>de</strong> Estadística, Estudios y <strong>P<strong>la</strong>n</strong>ificación Agraria<br />
(Junta <strong>de</strong> Castil<strong>la</strong> y León).<br />
45
TABLA 4.2. PRODUCCIÓN (t), SUPERFICIE (ha) Y RENDIMIENTOS (t/ha) EN CASTILLA Y LEÓN EN LOS AÑOS 1998-2009, Y COMPARACIÓN CON EL TOTAL NACIONAL.<br />
PRODUCCIÓN<br />
SUPERFICIE<br />
RENDIMIENTO<br />
Ávi<strong>la</strong> Burgos León Palencia Sa<strong>la</strong>manca Segovia Soria Val<strong>la</strong>dolid Zamora Castil<strong>la</strong> y León España % CyL<br />
1998 15.212 159.673 164.318 46.058 177.339 81.796 13.934 182.110 70.001 910.441 3.128.800 29,10<br />
1999 17.306 168.602 162.239 57.269 227.875 102.573 14.294 203.597 52.500 1.006.255 3.368.800 29,87<br />
2000 20.578 147.994 108.805 52.811 229.356 89.527 15.700 219.135 59.470 943.376 3.078.059 30,65<br />
2001 35.882 159.316 127.958 50.813 234.424 95.574 13.252 240.656 42.985 1.000.860 2.992.422 33,45<br />
2002 29.961 155.079 124.388 49.504 227.272 102.001 15.498 271.622 41.465 1.016.790 3.078.140 33,03<br />
2003 18.682 129.001 74.267 39.913 179.303 71.852 12.815 232.554 34.620 793.007 2.665.000 29,76<br />
2004 24.083 127.245 80.580 41.094 178.538 81.888 11.490 256.082 52.016 853.016 2.773.567 30,76<br />
2005 26.138 136.752 72.450 39.755 200.073 78.014 13.620 239.739 39.022 845.563 2.563.464 32,99<br />
2006 27.068 129.203 85.570 43.289 172.881 75.014 15.575 229.788 41.304 819.692 2.515.001 32,59<br />
2007 30.690 109.749 84.540 40.504 176.527 74.204 12.572 268.225 44.796 841.807 2.479.582 33,95<br />
2008 32.086 97.480 74.675 36.858 156.785 77.004 13.194 235.677 49.335 773.093 2.365.500 32,68<br />
2009* 39.080 121.000 92.050 38.190 220.000 122.000 15.760 272.254 56.005 976.339 2.510.100 38,90<br />
1998 728 5.102 4.835 1.608 5.441 2.422 417 4.225 2.000 26.778 133.500 20,06<br />
1999 629 5.223 4.718 1.554 5.844 2.781 396 5.004 1.500 27.649 133.500 20,71<br />
2000 636 4.788 3.480 1.541 5.771 2.502 383 4.956 1.931 25.988 118.754 21,88<br />
2001 1.047 4.852 3.310 1.579 5.788 2.459 336 5.992 1.265 26.628 115.126 23,13<br />
2002 889 4.578 2.996 1.430 6.178 2.344 374 6.494 1.189 26.472 110.146 24,03<br />
2003 520 4.223 2.007 1.273 4.932 2.007 375 5.781 894 22.012 101.101 21,77<br />
2004 608 3.571 2.052 1.169 4.898 2.082 330 6.048 1.120 21.878 102.120 21,42<br />
2005 611 3.596 1.900 1.120 5.143 2.053 351 5.847 973 21.594 94.998 22,73<br />
2006 831 3.208 2.000 1.057 4.753 1.835 354 5.726 1.009 20.773 87.199 23,82<br />
2007 977 3.151 2.100 1.182 4.883 1.948 360 6.401 1.143 22.145 85.728 25,83<br />
2008 881 2.878 1.900 1.139 4.480 2.232 317 6.224 1.205 21.256 85.100 24,98<br />
2009* 773 3.050 2.200 1.145 5.900 2.400 394 6.300 1.169 23.331 90.270 25,85<br />
1998 20,90 31,30 33,99 28,64 32,59 33,77 33,41 43,10 35,00 34,00 23,44 145,07<br />
1999 27,51 32,28 34,39 36,85 38,99 36,88 36,10 40,69 35,00 36,39 25,23 144,22<br />
2000 32,36 30,91 31,27 34,27 39,74 35,78 40,99 44,22 30,80 36,30 25,92 140,05<br />
2001 34,27 32,84 38,66 32,18 40,50 38,87 39,44 40,16 33,98 37,59 25,99 144,61<br />
2002 33,70 33,87 41,52 34,62 36,79 43,52 41,44 41,83 34,87 38,41 27,95 137,44<br />
2003 35,93 30,55 37,00 31,35 36,36 35,80 34,17 40,23 38,72 36,03 26,36 136,67<br />
2004 39,61 35,63 39,27 35,15 36,45 39,33 34,82 42,34 46,44 38,99 27,16 143,56<br />
2005 42,78 38,03 38,13 35,50 38,90 38,00 38,80 41,00 40,10 39,16 26,98 145,11<br />
2006 32,57 40,28 42,79 40,95 36,37 40,88 44,00 40,13 40,94 39,46 28,84 136,81<br />
2007 31,41 34,83 40,26 34,27 36,15 38,09 34,92 41,90 39,19 38,01 28,92 131,43<br />
2008 36,42 33,87 39,30 32,36 35,00 34,50 41,62 37,87 40,94 36,37 27,80 130,84<br />
2009* 50,56 39,67 41,84 33,35 37,29 50,83 40,00 43,21 47,91 41,85 27,81 150,48<br />
Fuente: MARM y Servicio <strong>de</strong> Estadística, Estudios y <strong>P<strong>la</strong>n</strong>ificación Agraria (Junta <strong>de</strong> Castil<strong>la</strong> y León); *: datos provisionales.<br />
46
La información re<strong>la</strong>tiva a <strong>la</strong> superficie sembrada <strong>de</strong> patata en <strong>la</strong> serie <strong>de</strong> años 1998-2009 está<br />
presentada en <strong>la</strong> tab<strong>la</strong> 4.2, y refleja una disminución continúa <strong>de</strong>l cultivo tanto en España<br />
como en Castil<strong>la</strong> y León (ver gráfico 4.4), aunque en esta comunidad el <strong>de</strong>scenso no ha sido<br />
tan pronunciado como a nivel nacional. En 2007, 2008 y 2009 se cultivaron en Castil<strong>la</strong> y León<br />
entre 22.145 y 23.331 ha <strong>de</strong> patata (alre<strong>de</strong>dor <strong>de</strong>l 25% <strong>de</strong>l total nacional). Los datos por<br />
provincias reflejan que <strong>la</strong>s que más superficie <strong>de</strong>dicaron en <strong>la</strong> serie <strong>de</strong> años 1998-2009 fueron<br />
Val<strong>la</strong>dolid, Sa<strong>la</strong>manca y Burgos (Ver gráfico 4.5), y <strong>de</strong>staca el importante <strong>de</strong>scenso que ha<br />
habido en León <strong>de</strong>s<strong>de</strong> 1998.<br />
GRÁFICO 4.4. SUPERFICIE DE PATATA EN ESPAÑA Y EN CASTILLA Y LEÓN, EN LOS AÑOS 1998-2009, EXPRESADA EN<br />
HECTÁREAS.<br />
160.000<br />
140.000<br />
120.000<br />
Castil<strong>la</strong> y León<br />
España<br />
100.000<br />
80.000<br />
60.000<br />
40.000<br />
20.000<br />
0<br />
1998<br />
1999<br />
2000<br />
2001<br />
2002<br />
2003<br />
2004<br />
2005<br />
2006<br />
2007<br />
2008<br />
2009*<br />
Fuente: E<strong>la</strong>boración propia a partir <strong>de</strong> datos <strong>de</strong>l MARM y <strong>de</strong>l Servicio <strong>de</strong> Estadística, Estudios y<br />
<strong>P<strong>la</strong>n</strong>ificación Agraria (Junta <strong>de</strong> Castil<strong>la</strong> y León).<br />
GRÁFICO 4.5. SUPERFICIE DE PATATA EN LAS PROVINCIAS DE CASTILLA Y LEÓN EN LOS AÑOS 1998-2009, EXPRESADA EN<br />
HECTÁREAS.<br />
7.000<br />
6.000<br />
5.000<br />
4.000<br />
3.000<br />
2.000<br />
1.000<br />
Ávi<strong>la</strong><br />
Burgos<br />
León<br />
Palencia<br />
Sa<strong>la</strong>manca<br />
Segovia<br />
Soria<br />
Val<strong>la</strong>dolid<br />
Zamora<br />
0<br />
1998<br />
1999<br />
2000<br />
2001<br />
2002<br />
2003<br />
2004<br />
2005<br />
2006<br />
2007<br />
2008<br />
2009*<br />
Fuente: E<strong>la</strong>boración propia a partir <strong>de</strong> datos <strong>de</strong>l MARM y <strong>de</strong>l Servicio <strong>de</strong> Estadística, Estudios y<br />
<strong>P<strong>la</strong>n</strong>ificación Agraria (Junta <strong>de</strong> Castil<strong>la</strong> y León).<br />
47
El rendimiento medio <strong>de</strong> patata en Castil<strong>la</strong> y León y en España en <strong>la</strong> serie <strong>de</strong> años 1998-2009<br />
se muestra en el gráfico 4.6, y los datos para estos años individualmente se muestran en <strong>la</strong><br />
tab<strong>la</strong> 4.2. Se pue<strong>de</strong> observar que Castil<strong>la</strong> y León siempre ha tenido unos rendimientos medios<br />
notablemente superiores a <strong>la</strong> media nacional, 37,33 t/ha respecto a 26,82 t/ha. En el gráfico<br />
4.7 se presentan los datos medios <strong>de</strong> rendimiento <strong>de</strong>l cultivo por provincias en los años 1998-<br />
2009, apareciendo que únicamente Ávi<strong>la</strong>, Burgos y Palencia se sitúan por <strong>de</strong>bajo <strong>de</strong> <strong>la</strong> media<br />
regional, aunque este dato es notablemente superior a <strong>la</strong> media nacional. La razón <strong>de</strong> porque<br />
Burgos y Palencia muestran esos bajos rendimientos es porque son productores <strong>de</strong> patata<br />
siembra, don<strong>de</strong> los rendimientos obtenidos son menores.<br />
GRÁFICO 4.6. RENDIMIENTO DE PATATA EN ESPAÑA Y EN CASTILLA Y LEÓN EN LOS AÑOS 1998-2009, EXPRESADO EN<br />
t/ha.<br />
45<br />
40<br />
35<br />
30<br />
25<br />
20<br />
15<br />
10<br />
5<br />
0<br />
Castil<strong>la</strong> y León<br />
España<br />
1998<br />
1999<br />
2000<br />
2001<br />
2002<br />
2003<br />
2004<br />
2005<br />
2006<br />
2007<br />
2008<br />
2009*<br />
Fuente: E<strong>la</strong>boración propia a partir <strong>de</strong> datos <strong>de</strong>l MARM y <strong>de</strong>l Servicio <strong>de</strong> Estadística, Estudios y<br />
<strong>P<strong>la</strong>n</strong>ificación Agraria (Junta <strong>de</strong> Castil<strong>la</strong> y León).<br />
GRÁFICO 4.7. RENDIMIENTO MEDIO DE PATATA EN CASTILLA Y LEÓN EN LOS AÑOS 1998-2009, EXPRESADO EN t/ha.<br />
45<br />
40<br />
35<br />
30<br />
25<br />
20<br />
15<br />
10<br />
5<br />
0<br />
Val<strong>la</strong>dolid<br />
Segovia<br />
Soria<br />
Zamora<br />
León<br />
Sa<strong>la</strong>manca<br />
Burgos<br />
Palencia<br />
Ávi<strong>la</strong><br />
Castil<strong>la</strong> y León<br />
España<br />
Fuente: E<strong>la</strong>boración propia a partir <strong>de</strong> datos <strong>de</strong>l MARM y <strong>de</strong>l Servicio <strong>de</strong> Estadística, Estudios y<br />
<strong>P<strong>la</strong>n</strong>ificación Agraria (Junta <strong>de</strong> Castil<strong>la</strong> y León).<br />
48
Hasta este momento se ha realizado el análisis <strong>de</strong> producción, superficie y rendimiento<br />
consi<strong>de</strong>rando los datos brutos, por lo que ahora se realizará el análisis según épocas <strong>de</strong><br />
recolección y en función <strong>de</strong> forma <strong>de</strong> riego (secano y regadío). Consi<strong>de</strong>rando este último<br />
aspecto, se pue<strong>de</strong> observar en <strong>la</strong> tab<strong>la</strong> 4.3 como <strong>la</strong> gran producción <strong>de</strong> patatas <strong>de</strong> Castil<strong>la</strong> y<br />
León se realiza en regadío, ya que únicamente se <strong>de</strong>dicó en secano en el año 2008 el 2,73% <strong>de</strong><br />
<strong>la</strong> superficie total <strong>de</strong> patata y se produjo el 1,54% <strong>de</strong>l total regional. Las provincias <strong>de</strong><br />
Palencia y Burgos son <strong>la</strong>s que más produjeron patata <strong>de</strong> secano en <strong>la</strong> campaña 2008. En<br />
concreto, en <strong>la</strong> provincia <strong>de</strong> Palencia hubo 287 ha, don<strong>de</strong> <strong>la</strong>s comarcas que más superficie<br />
<strong>de</strong>dicaron fueron Agui<strong>la</strong>r (201 ha) y Boedo – Ojeda (78 ha). En el caso <strong>de</strong> Burgos, <strong>la</strong> superficie<br />
cultivada fue <strong>de</strong> 135 ha, <strong>de</strong> <strong>la</strong>s que 91 ha se situaron en Merinda<strong>de</strong>s y 43 ha en Páramos.<br />
En <strong>la</strong> tab<strong>la</strong> 4.4 se <strong>de</strong>tal<strong>la</strong> <strong>la</strong> superficie y producción <strong>de</strong> patata en <strong>la</strong>s provincias <strong>de</strong> Castil<strong>la</strong> y<br />
León por épocas <strong>de</strong> recolección <strong>de</strong>s<strong>de</strong> 2004 hasta 2008. Como se pue<strong>de</strong> observar en <strong>la</strong> misma,<br />
<strong>la</strong> mayor superficie y producción <strong>de</strong> <strong>la</strong> región correspon<strong>de</strong> a <strong>la</strong> patata tardía (63,41% <strong>de</strong> <strong>la</strong><br />
producción), luego está <strong>la</strong> <strong>de</strong> media estación (36,33%) y por último <strong>la</strong> temprana, cuya<br />
producción es muy escasa restringiéndose casi exclusivamente a <strong>la</strong> provincia <strong>de</strong> Ávi<strong>la</strong>. La<br />
superficie <strong>de</strong>dicada al cultivo sigue una ten<strong>de</strong>ncia simi<strong>la</strong>r a <strong>la</strong> <strong>de</strong> <strong>la</strong> producción. En el caso <strong>de</strong><br />
los rendimientos se pue<strong>de</strong> observar en esa tab<strong>la</strong> como los mejores se sitúan en patata tardía<br />
(37,17 t/ha <strong>de</strong> media en Castil<strong>la</strong> y León en 2008), seguido <strong>de</strong> <strong>la</strong> <strong>de</strong> media estación (35,15<br />
t/ha) y por último <strong>la</strong> temprana (24,25 t/ha). En lo re<strong>la</strong>tivo a <strong>la</strong>s provincias con mejores<br />
rendimientos se observa cierta variabilidad en función <strong>de</strong>l año que se consi<strong>de</strong>re sin que exista<br />
ninguna que <strong>de</strong>staque sobre el resto consi<strong>de</strong>rando los años 2004-2008. En patata tardía, en el<br />
periodo 2004-2008, el rendimiento medio <strong>de</strong> <strong>la</strong> comunidad ha estado comprendido entre<br />
40,62 y 37,17 t/ha. Para <strong>la</strong> patata <strong>de</strong> media estación el rendimiento medio estuvo en torno a<br />
38,84 y 35,15 t/ha.<br />
49
TABLA 4.3. SUPERFICIE, RENDIMIENTO Y PRODUCCIÓN DE PATATA EN CASTILLA Y LEÓN EN 2008, EN CULTIVOS DE SECANO Y REGADÍO.<br />
Superficie<br />
Ávi<strong>la</strong> Burgos León Palencia Sa<strong>la</strong>manca<br />
Hectáreas Secano Regadío Secano Regadío Secano Regadío Secano Regadío Secano Regadío<br />
Temprana 4 65 0 0 0 0 0 0 0 0<br />
Media estación 7 584 5 542 0 50 19 96 31 2.744<br />
Tardía 4 217 130 2.201 0 1.850 268 756 0 1.705<br />
TOTAL 15 866 135 2.743 0 1.900 287 852 31 4.449<br />
Superficie<br />
Segovia Soria Val<strong>la</strong>dolid Zamora<br />
Castil<strong>la</strong>-León<br />
Hectáreas Secano Regadío Secano Regadío Secano Regadío Secano Regadío Secano Regadío<br />
Temprana 0 0 0 0 0 0 0 0 4 65<br />
Media estación 0 1.116 0 11 0 2.076 50 668 112 7.887<br />
Tardía 0 1.116 60 246 0 4.148 2 485 464 12.724<br />
TOTAL 0 2.232 60 257 0 6.224 52 1.153 580 20.676<br />
Rendimiento<br />
Ávi<strong>la</strong> Burgos León<br />
Palencia<br />
Sa<strong>la</strong>manca<br />
t/ha Secano Regadío Secano Regadío Secano Regadío Secano Regadío Secano Regadío<br />
Temprana 12 25 0 0 0 0<br />
Media estación 15 35 20 38 0 32 24,5 39,5 7 35<br />
Tardía 22 45 15 34 0 39,5 21,5 35,5 35,5<br />
Rendimiento<br />
Segovia Soria<br />
Val<strong>la</strong>dolid Zamora<br />
Castil<strong>la</strong>-León<br />
t/ha Secano Regadío Secano Regadío Secano Regadío Secano Regadío Secano Regadío<br />
Temprana 0 0 0 0 0 0 0 0 12 25<br />
Media estación 0 33 20 38 0 32 15 40 14,62 35,44<br />
Tardía 0 36 15 34 0 39,5 20 45 22,07 37,72<br />
Producción<br />
Ávi<strong>la</strong> Burgos León<br />
Palencia<br />
Sa<strong>la</strong>manca<br />
Tone<strong>la</strong>das Secano Regadío Secano Regadío Secano Regadío Secano Regadío Secano Regadío<br />
Temprana 48 1.625 0 0 0 0 0 0 0 0<br />
Media estación 105 20.440 100 20.596 0 1.600 465,5 3.792 217 96.040<br />
Tardía 88 9.765 1.950 74.834 0 73.075 5762 26.838 0 60.527,5<br />
TOTAL 241 31.830 2.050 95.430 0 74.675 6227,5 30.630 217 156.567,5<br />
Producción<br />
Segovia Soria Val<strong>la</strong>dolid Zamora<br />
Castil<strong>la</strong>-León<br />
Tone<strong>la</strong>das Secano Regadío Secano Regadío Secano Regadío Secano Regadío Secano Regadío<br />
Temprana 0 0 0 0 0 0 0 0 48,0 1.625,0<br />
Media estación 0 36.828 0 418 0 66.432 750 26.720 1.637,5 279.553,2<br />
Tardía 0 40.176 900 8.364 0 163.846 40 21.825 10.240,0 479.974,1<br />
TOTAL 0 77.004 900 8.782 0 230.278 790 48.545 11.925,5 761.152,3<br />
Fuente: Servicio <strong>de</strong> Estadística, Estudios y <strong>P<strong>la</strong>n</strong>ificación agraria (Junta <strong>de</strong> Castil<strong>la</strong> y León).<br />
50
TABLA 4.4. SUPERFICIE, PRODUCCIÓN Y RENDIMIENTO DE PATATA EN CASTILLA Y LEÓN, POR ÉPOCAS DE RECOLECCIÓN.<br />
Castil<strong>la</strong> y León<br />
<strong>Patata</strong> temprana <strong>Patata</strong> media estación <strong>Patata</strong> tardía<br />
Sup. (ha) Prod. (t) Rend (t/ha) Sup. (ha) Prod. (t) Rend (t/ha) Sup. (ha) Prod. (t) Rend (t/ha)<br />
Ávi<strong>la</strong> 69 1.673 24,25 591 20.545 34,76 221 9.853 44,58<br />
Burgos 0 0 0 547 20.696 37,84 2.331 76.784 32,94<br />
León 0 0 0 50 1.600 32,00 1.850 73.075 39,50<br />
Palencia 0 0 0 115 4.258 37,03 1.024 32.600 31,84<br />
Sa<strong>la</strong>manca 0 0 0 2.775 96.257 34,69 1.705 60.528 35,50<br />
Segovia 0 0 0 1.116 36.828 33,00 1.116 40.176 36,00<br />
Soria 0 0 0 11 462 42,00 306 12.732 41,61<br />
Val<strong>la</strong>dolid 0 0 0 2.076 73.075 35,20 4.148 162.602 39,20<br />
Zamora 0 0 0 718 27.865 38,81 487 21.865 44,90<br />
TOTAL 69 1.673 24,25 7.999 281.191 35,15 13.188 490.214 37,17<br />
Ávi<strong>la</strong> 53 1.265 23,87 801 23.890 29,83 123 5.535 45,00<br />
Burgos 0 0 0 1.000 42.817 42,82 2.151 66.932 31,12<br />
León 0 0 0 60 1.920 32,00 2.040 82.620 40,50<br />
Palencia 0 0 0 111 3.482 31,37 1.071 37.022 34,57<br />
Sa<strong>la</strong>manca 1 35 35,00 2.579 90.836 35,22 2.303 85.656 37,19<br />
Segovia 0 0 0 929 33.444 36,00 1.019 40.760 40,00<br />
Soria 0 0 0 – – - 360 12.572 34,92<br />
Val<strong>la</strong>dolid 0 0 0 2.125 85.255 40,12 4.276 182.970 42,79<br />
Zamora 0 0 0 658 25.495 38,75 485 19.301 39,80<br />
TOTAL 54 1.300 24,07 8.263 307.139 37,17 13.828 533.368 38,57<br />
Ávi<strong>la</strong> 61 1.465 24,02 625 18.730 29,97 145 6.873 47,40<br />
Burgos 0 0 0 732 32.693 44,66 2.476 96.510 38,98<br />
León 0 0 0 61 1.708 28,00 1.939 83.862 43,25<br />
Palencia 0 0 0 346 16.100 46,53 711 27.189 38,24<br />
Sa<strong>la</strong>manca 0 0 0 3.738 135.604 36,28 1.015 37.277 36,73<br />
Segovia 0 0 0 1.028 41.120 40,00 807 33.894 42,00<br />
Soria 7 235 33,57 27 1.160 42,96 320 14.180 44,31<br />
Val<strong>la</strong>dolid 0 0 0 1.918 74.802 39,00 3.808 154.986 40,70<br />
Zamora 0 0 0 547 21.470 39,25 462 19.834 42,93<br />
TOTAL 68 1.700 25,00 9.022 343.387 38,06 11.683 474.605 40,62<br />
Ávi<strong>la</strong> 63 1.515 24,05 370 14.780 39,95 178 9.843 55,30<br />
Burgos 0 0 0 846 35.427 41,88 2.750 101.325 36,85<br />
León 0 0 0 200 7.000 35,00 1.700 65.450 38,50<br />
Palencia 0 0 0 10 347 34,70 1.110 39.408 35,50<br />
Sa<strong>la</strong>manca 0 0 0 3.146 121.618 38,66 1.997 78.455 39,29<br />
Segovia 0 0 0 1.263 47.994 38,00 790 30.020 38,00<br />
Soria 0 0 0 150 5.845 38,97 201 7.775 38,68<br />
Val<strong>la</strong>dolid 0 0 0 1.945 75.855 39,00 3.902 163.884 42,00<br />
Zamora 0 0 0 314 11.357 36,17 659 27.665 41,98<br />
TOTAL 63 1.515 24,05 8.244 320.223 38,84 13.287 523.825 39,42<br />
Ávi<strong>la</strong> 52 1.092 21,00 365 14.462 39,62 191 8.529 44,65<br />
Burgos 0 0 0 1.139 42.681 37,47 2.432 84.564 34,77<br />
León 0 0 0 250 8.500 34,00 1.802 72.080 40,00<br />
Palencia 0 0 0 278 9.954 35,81 891 31.140 34,95<br />
Sa<strong>la</strong>manca 0 0 0 2.946 106.370 36,11 1.952 72.168 36,97<br />
Segovia 108 3.952 36,59 1.243 47.234 38,00 731 30.702 42,00<br />
Soria 2 56 28,00 164 5.402 32,94 164 6.032 36,78<br />
Val<strong>la</strong>dolid 0 0 0 1.991 81.631 41,00 4.057 174.451 43,00<br />
Zamora 0 0 0 282 12.074 42,82 838 39.942 47,66<br />
TOTAL 162 5.100 31,48 8.658 328.308 37,92 13.058 519.608 39,79<br />
2004 2005 2006 2007 2008<br />
Fuente: E<strong>la</strong>boración propia a partir <strong>de</strong> datos <strong>de</strong>l Servicio <strong>de</strong> Estadística, Estudios y <strong>P<strong>la</strong>n</strong>ificación agraria (Junta <strong>de</strong><br />
Castil<strong>la</strong> y León).<br />
51
Al consi<strong>de</strong>rar <strong>la</strong> patata <strong>de</strong> media estación nos encontramos que <strong>la</strong>s principales provincias<br />
productoras son Sa<strong>la</strong>manca (34,2% <strong>de</strong>l total) y Val<strong>la</strong>dolid (26%). En el gráfico 4.8 se muestra <strong>la</strong><br />
producción <strong>de</strong> patata <strong>de</strong> media estación en Castil<strong>la</strong> y León en <strong>la</strong> serie <strong>de</strong> años 1998-2008.<br />
GRÁFICO 4.8. PRODUCCIÓN DE PATATA DE MEDIA ESTACIÓN EN CASTILLA Y LEÓN, EXPRESADA EN TONELADAS.<br />
180000<br />
160000<br />
140000<br />
120000<br />
100000<br />
80000<br />
60000<br />
40000<br />
20000<br />
0<br />
1998<br />
1999<br />
2000<br />
2001<br />
2002<br />
2003<br />
2004<br />
2005<br />
2006<br />
2007<br />
2008<br />
2009*<br />
Ávi<strong>la</strong><br />
Burgos<br />
León<br />
Palencia<br />
Sa<strong>la</strong>manca<br />
Segovia<br />
Soria<br />
Val<strong>la</strong>dolid<br />
Zamora<br />
Fuente: E<strong>la</strong>boración propia a partir <strong>de</strong> datos <strong>de</strong>l MARM y <strong>de</strong>l Servicio <strong>de</strong> Estadística, Estudios y<br />
<strong>P<strong>la</strong>n</strong>ificación Agraria (Junta <strong>de</strong> Castil<strong>la</strong> y León).<br />
En el caso <strong>de</strong> patata tardía los datos <strong>de</strong> <strong>la</strong> tab<strong>la</strong> 4.4 y <strong>de</strong>l gráfico 4.9 muestran que <strong>la</strong> provincia que<br />
más ha producido <strong>de</strong>s<strong>de</strong> el año 2001 es Val<strong>la</strong>dolid luego, en función <strong>de</strong>l año, están Burgos, León y<br />
Sa<strong>la</strong>manca, estando esas dos primeras en el año 2008 a continuación con una producción parecida.<br />
GRÁFICO 4.8. PRODUCCIÓN DE PATATA TARDÍA EN CASTILLA Y LEÓN, EXPRESADA EN TONELADAS.<br />
250000<br />
200000<br />
150000<br />
100000<br />
50000<br />
0<br />
1998<br />
1999<br />
2000<br />
2001<br />
2002<br />
2003<br />
2004<br />
2005<br />
2006<br />
2007<br />
2008<br />
2009*<br />
52<br />
Ávi<strong>la</strong><br />
Burgos<br />
León<br />
Palencia<br />
Sa<strong>la</strong>manca<br />
Segovia<br />
Soria<br />
Val<strong>la</strong>dolid<br />
Zamora<br />
Fuente: E<strong>la</strong>boración propia a partir <strong>de</strong> datos <strong>de</strong>l MARM y <strong>de</strong>l Servicio <strong>de</strong> Estadística, Estudios y<br />
<strong>P<strong>la</strong>n</strong>ificación Agraria (Junta <strong>de</strong> Castil<strong>la</strong> y León).
En <strong>la</strong> tab<strong>la</strong> 4.5 se muestra <strong>la</strong> superficie cultivada <strong>de</strong> patata en 2008 por comarcas en cada provincia<br />
<strong>de</strong> Castil<strong>la</strong> y León, y por época <strong>de</strong> recolección. Las tres provincias que más superficie <strong>de</strong>dicaron<br />
fueron Val<strong>la</strong>dolid, Sa<strong>la</strong>manca y Burgos. A continuación se <strong>de</strong>scribe <strong>la</strong> situación en cada provincia.<br />
La provincia <strong>de</strong> Ávi<strong>la</strong> cultivó un total <strong>de</strong> 882 ha (15 ha en secano y 867 ha en regadío), <strong>de</strong>dicándose<br />
<strong>la</strong> mayoría (584 ha, 67,4% <strong>de</strong>l total) a media estación. Aquí se encuentra <strong>la</strong> única zona <strong>de</strong> <strong>la</strong><br />
comunidad que produce patata temprana (70 ha), en concreto en <strong>la</strong>s comarcas <strong>de</strong> Valle Bajo<br />
Alberche y Valle <strong>de</strong>l Tiétar. En el resto <strong>de</strong> tipo <strong>de</strong> patatas, encontramos que <strong>la</strong> superficie <strong>de</strong>dicada<br />
es escasa, a excepción <strong>de</strong> “Arévalo – Madrigal” don<strong>de</strong> se sitúan 474 ha <strong>de</strong> patata <strong>de</strong> media estación.<br />
En Burgos se <strong>de</strong>dicó una superficie <strong>de</strong> 2.872 ha <strong>de</strong> patata en el año 2008, <strong>de</strong> <strong>la</strong>s que 135 fueron en<br />
secano y el resto en regadío. Un total <strong>de</strong> 1.378 ha <strong>de</strong>l total se <strong>de</strong>dicaron a producir patata <strong>de</strong><br />
siembra. La gran mayoría <strong>de</strong> <strong>la</strong> superficie se ha empleado para patata tardía (81,16%). La principal<br />
comarca productora fue Páramos, seguida <strong>de</strong> Merinda<strong>de</strong>s, Bureba – Ebro y La Ribera.<br />
En el caso <strong>de</strong> <strong>la</strong> provincia <strong>de</strong> León hubo un total <strong>de</strong> 1.900 ha, todas en regadío, y empleadas casi en<br />
su totalidad para producir patata tardía. Por comarcas <strong>de</strong>staca La Bañeza con 962 ha (50,6% <strong>de</strong>l<br />
total provincial). El resto <strong>de</strong> comarcas con cierta importancia en superficie son, por este or<strong>de</strong>n,<br />
Astorga, El Páramo y Es<strong>la</strong>-Campos.<br />
Palencia <strong>de</strong>dicó un total <strong>de</strong> 1.139 ha al cultivo <strong>de</strong> <strong>la</strong> patata, 267 en secano y 852 en regadío. De<br />
este total, 503 ha se emplearon a <strong>la</strong> producción <strong>de</strong> patata <strong>de</strong> siembra. En esta provincia se<br />
encuentra <strong>la</strong> mayor parte <strong>de</strong> patata secano, en concreto en Agui<strong>la</strong>r y Boedo - Ojeda. La gran<br />
mayoría <strong>de</strong> <strong>la</strong> superficie se emplea para producir patata tardía (90%), siendo <strong>la</strong>s principales<br />
comarcas <strong>la</strong>s siguientes: Agui<strong>la</strong>r, El Cerrato y Boedo – Ojeda.<br />
En <strong>la</strong> provincia <strong>de</strong> Sa<strong>la</strong>manca hubo una superficie <strong>de</strong> 4.466 ha en 2008, estando el 99,3% en regadío.<br />
La mayor superficie está <strong>de</strong>dicada a producir patata <strong>de</strong> media estación (61,8%). Por comarcas, <strong>la</strong><br />
principal productora fue Sa<strong>la</strong>manca, seguida <strong>de</strong> Peñaranda <strong>de</strong> Bracamonte y <strong>de</strong> Alba <strong>de</strong> Tormes.<br />
Segovia cultivó 2.232 ha en 2008, todas en regadío, repartidas a partes iguales entre patata <strong>de</strong><br />
media estación y tardía. La comarca que abarca <strong>la</strong> casi totalidad <strong>de</strong> <strong>la</strong> superficie es Cuél<strong>la</strong>r.<br />
La provincia que menos patata cultivó en 2008 fue Soria, con 317 ha, que se emplearon en su casi<br />
totalidad para producir patata tardía. La comarca que más superficie presentó fue <strong>la</strong> <strong>de</strong> Almazán.<br />
53
TABLA 4.5. SUPERFICIE DE PATATA EN COMARCAS DE CASTILLA Y LEÓN EN 2008, EXPRESADO EN HECTÁREAS.<br />
EXTRATEMPRANA TEMPRANA MEDIA ESTACIÓN TARDÍA<br />
TOTAL<br />
2008<br />
Secano Regadío Secano Regadío Secano Regadío Secano Regadío Secano Regadío<br />
Arévalo-Madrigal 6 474 4 93 10 567<br />
Ávi<strong>la</strong> 5 5<br />
Barco Ávi<strong>la</strong> - Piedrahita 3 85 88<br />
Gredo 17 6 23<br />
Valle Bajo Alberche 12 29 41<br />
Valle <strong>de</strong>l Tietar 1 4 53 1 61 28 5 143<br />
TOTAL ÁVILA 1 4 65 7 584 4 217 15 867<br />
Ar<strong>la</strong>nza 9 112 121<br />
Ar<strong>la</strong>nzón 10 147 157<br />
Bureba - Ebro 232 215 447<br />
Demanda 0 1 11 1 11<br />
La Ribera 174 250 424<br />
Merinda<strong>de</strong>s 15 91 536 91 551<br />
Páramos 5 88 38 824 43 912<br />
Pisuerga 8 106 114<br />
TOTAL BURGOS 5 536 130 2201 135 2737<br />
Astorga 309 309<br />
Bierzo 50 23 73<br />
El Páramo 247 247<br />
Es<strong>la</strong> - Campos 188 188<br />
La Bañeza 962 962<br />
La Cabrera 29 29<br />
La Montaña <strong>de</strong> Luna 20 20<br />
La Montaña <strong>de</strong> Riaño 29 29<br />
Sahagún 9 9<br />
Tierras <strong>de</strong> León 34 34<br />
TOTAL LEÓN 50 1850 1900<br />
Agui<strong>la</strong>r 201 342 201 342<br />
Boedo - Ojeda 19 40 59 126 78 166<br />
Campos 50 50<br />
Cervera 2 3 2 3<br />
El Cerrato 56 213 269<br />
Guardo 1 2 1 2<br />
Saldaña - Valdavia 5 20 5 20<br />
TOTAL PALENCIA 19 96 268 756 287 852<br />
Alba <strong>de</strong> Tormes 202 135 337<br />
Ciudad Rodrigo 3 26 4 3 30<br />
Fuente <strong>de</strong> San Esteban 4 4<br />
La Sierra 9 69 3 9 72<br />
Le<strong>de</strong>sma 8 8<br />
Peñaranda <strong>de</strong> Bracamonte 885 600 1485<br />
Sa<strong>la</strong>manca 1517 963 2480<br />
Vitigudino 19 19 19 19<br />
TOTAL SALAMANCA 31 2730 1705 31 4435<br />
Cuel<strong>la</strong>r 1012 1012 2024<br />
Segovia 4 4 8<br />
Sepúlveda 100 100 200<br />
TOTAL SEGOVIA 1116 1116 2232<br />
Almazán 14 197 14 197<br />
Arcos <strong>de</strong> Jalón 2 2<br />
Burgo <strong>de</strong> Osma 16 7 16 7<br />
Campos <strong>de</strong> Gómara 11 29 32 29 43<br />
Pinares 1 0 1 0<br />
Soria 8 8<br />
TOTAL SORIA 11 60 246 60 257<br />
Centro 386 769 1155<br />
Sur 1211 2420 3631<br />
Sureste 467 937 1404<br />
Tierra <strong>de</strong> Campos 12 22 34<br />
TOTAL VALLADOLID 2076 4148 6224<br />
Aliste 14 5 14 5<br />
Benavente y Los Valles 217 1 151 1 368<br />
Campos-Pan 21 12 33<br />
Duero Bajo 420 322 742<br />
Sanabria 1 2 1 2 2<br />
Sayago 35 3 35 3<br />
TOTAL ZAMORA 50 668 2 485 52 1153<br />
TOTAL CASTILLA Y LEÓN 0 1 4 65 112 7867 464 12724 580 20657<br />
Fuente: E<strong>la</strong>boración propia a partir <strong>de</strong> los datos <strong>de</strong>l Servicio <strong>de</strong> Estadística, Estudios y <strong>P<strong>la</strong>n</strong>ificación Agraria<br />
(Junta <strong>de</strong> Castil<strong>la</strong> y León).<br />
54
Val<strong>la</strong>dolid es <strong>la</strong> provincia <strong>de</strong> Castil<strong>la</strong> y León que más superficie presentó, con 6.224 ha en<br />
regadío, <strong>de</strong> <strong>la</strong>s que 2.076 se emplearon en patata <strong>de</strong> media estación y 4148 en tardía. La tres<br />
comarcas con más superficie fueron <strong>la</strong>s siguientes: Sur (3631 ha), Sureste (1404 ha) y Centro<br />
(1155 ha).<br />
Finalmente, en Zamora se empleó un total <strong>de</strong> 1.205 ha <strong>de</strong> patata, 52 en secano y 1.153 en<br />
regadío. La mayoría <strong>de</strong> <strong>la</strong> superficie se encuentra en patata <strong>de</strong> media estación (55,43%), y el<br />
resto en tardía. Las principales comarcas productoras <strong>de</strong> estos dos tipos <strong>de</strong> patata fueron<br />
Duero Bajo junto a Benavente y Los Valles.<br />
Tras todo lo anteriormente expuesto, es <strong>de</strong>stacable que al consi<strong>de</strong>rar <strong>la</strong> patata media<br />
estación, <strong>la</strong>s comarcas con más superficie fueron en 2008: Sa<strong>la</strong>manca (1.517 ha), Val<strong>la</strong>dolid<br />
Sur (1.211 ha), Cuél<strong>la</strong>r (1.012 ha), Peñaranda <strong>de</strong> Bracamonte (885 ha) y Arévalo-Madrigal (474<br />
ha). En el caso <strong>de</strong> patata tardía están: Val<strong>la</strong>dolid Sur (2.420 ha), Cuél<strong>la</strong>r (1.012 ha),<br />
Sa<strong>la</strong>manca (963 ha), La Bañeza (962 ha) y Páramos (824 ha). Toda esta información se<br />
completa con <strong>la</strong> tab<strong>la</strong> 4.6 don<strong>de</strong> se presentan <strong>la</strong>s varieda<strong>de</strong>s más empleadas en Castil<strong>la</strong> y<br />
León.<br />
TABLA 4.6. VARIEDADES MAYORITARIAMENTE CULTIVADAS EN CASTILLA Y LEÓN Y SUS PROVINCIAS, EN EL AÑO 2009.<br />
ÁVILA<br />
BURGOS<br />
LEÓN<br />
PALENCIA<br />
SALAMANCA<br />
VARIEDAD % DE UTILIZACIÓN VARIEDAD % DE UTILIZACIÓN<br />
Hermes 33,51 Monalisa 66,14<br />
Agria 24,14 Agata 10,25<br />
Monalisa 8,56 SEGOVIA Agria 5,11<br />
Jaer<strong>la</strong> 3,45 Spunta 3,78<br />
Agata 2,93 Red Pontiac 2,4<br />
Agria 31,48 Agria 93,86<br />
Hermes 18 Red Pontiac 1,17<br />
Kennebec 16,3 SORIA Kennebec 0,29<br />
Monalisa 9,82<br />
Asterix 6,73<br />
Agria 38,34 Monalisa 19,15<br />
Hermes 20,26 Hermes 9,61<br />
Asterix 5,85 VALLADOLID Agria 7,16<br />
Kennebec 4,08 Spunta 5,56<br />
Lady C<strong>la</strong>ire 3,16 Agata 5,49<br />
Agria 29,24 Agria 18,51<br />
Hermes 16,03 Monalisa 15,23<br />
Asterix 10,27 ZAMORA Spunta 14,7<br />
Kennebec 8,87 Kennebec 7,49<br />
Jaer<strong>la</strong> 5,1 Hermes 5,64<br />
Jaer<strong>la</strong> 33,76 Agria 16,24<br />
Agria 16,9 Monalisa 15,19<br />
Hermes 8,15 Castil<strong>la</strong> y León Hermes 10,72<br />
Asterix 6,92 Jaer<strong>la</strong> 10,05<br />
Kennebec 1,65 Spunta 4,02<br />
Fuente: Encuesta a productores <strong>de</strong> patata 2009. Junta <strong>de</strong> Castil<strong>la</strong> y León.<br />
55
4.2 LA PRODUCCIÓN INTEGRADA EN CASTILLA Y LEÓN<br />
4.2.1 QUÉ ES LA PRODUCCIÓN INTEGRADA (PI)<br />
La Producción Integrada es un sistema <strong>de</strong> producción agríco<strong>la</strong> que engloba protocolos <strong>de</strong><br />
producción que preten<strong>de</strong>n:<br />
• Obtener productos diferenciados garantizando al consumidor <strong>la</strong> calidad y<br />
seguridad alimentaria, y mediante un distintivo <strong>de</strong> calidad el conocimiento <strong>de</strong><br />
esos productos a los consumidores.<br />
• Proteger el medio ambiente mediante <strong>la</strong> utilización racional <strong>de</strong> los distintos<br />
medios <strong>de</strong> producción (suelo, agua, semil<strong>la</strong>s, abonos, maquinaria,<br />
fitosanitarios, etc...) en todas <strong>la</strong>s fases <strong>de</strong>l cultivo.<br />
• Conseguir los objetivos anteriores mediante técnicas <strong>de</strong> autocontrol<br />
empleadas por parte <strong>de</strong> los productores, que les reportarán un <strong>de</strong>terminado<br />
nivel <strong>de</strong> reconocimiento, fi<strong>de</strong>lización y respuesta comercial.<br />
4.2.2 REQUISITOS PARA EL CULTIVO BAJO LAS NORMAS DE PRODUCCIÓN INTEGRADA<br />
El sistema <strong>de</strong> Producción Integrada en Castil<strong>la</strong> y León recoge en el Decreto 208/2002, los<br />
requisitos básicos para po<strong>de</strong>r realizar este sistema <strong>de</strong> producción. Dichos requisitos son<br />
imprescindibles para po<strong>de</strong>r inscribirse en el Registro <strong>de</strong> Productores y Operadores <strong>de</strong><br />
Producción Integrada <strong>de</strong> Castil<strong>la</strong> y León. El protocolo <strong>de</strong> Producción Integrada, al igual que<br />
otros requisitos <strong>de</strong> calidad alimentaria, exige que el productor y el operador se rijan por unas<br />
Normas <strong>de</strong> Autocontrol, que precisan lo siguiente:<br />
• Anualmente se presenta por los Productores y Operadores un <strong>P<strong>la</strong>n</strong> <strong>de</strong> Actuación <strong>de</strong><br />
Producción Integrada para <strong>la</strong> campaña <strong>de</strong> comercialización correspondiente, que se aprueba<br />
por Resolución <strong>de</strong>l Director General <strong>de</strong> Producción Agropecuaria.<br />
• Tener un acuerdo <strong>de</strong> vincu<strong>la</strong>ción con una Entidad <strong>de</strong> Certificación.<br />
• Realizar todas <strong>la</strong>s <strong>la</strong>bores culturales, acor<strong>de</strong> al Reg<strong>la</strong>mento Técnico Especifico <strong>de</strong>l cultivo.<br />
En el caso concreto <strong>de</strong> <strong>la</strong> “PATATA”: Resolución <strong>de</strong> 18 <strong>de</strong> abril <strong>de</strong> 2.005, <strong>de</strong> <strong>la</strong> Dirección<br />
General <strong>de</strong> Producción Agropecuaria, por <strong>la</strong> que se refun<strong>de</strong> el Reg<strong>la</strong>mento Técnico Específico<br />
<strong>de</strong> Producción Integrada en <strong>Patata</strong> y sus modificaciones posteriores.<br />
• E<strong>la</strong>borar y cumplimentar un cua<strong>de</strong>rno <strong>de</strong> campo, en el que se anoten todas <strong>la</strong>s prácticas<br />
realizadas en <strong>la</strong> explotación.<br />
• La Entidad <strong>de</strong> Certificación, realizará inspecciones <strong>de</strong> <strong>la</strong> explotación cada campaña y<br />
emitirá un informe <strong>de</strong> dichas inspecciones.<br />
• Someterse en su caso, a <strong>la</strong>s inspecciones <strong>de</strong> <strong>la</strong> Administración.<br />
56
• Ven<strong>de</strong>r <strong>la</strong> producción a un operador inscrito como tal en el Registro <strong>de</strong> Producción Integrada<br />
en Castil<strong>la</strong> y León.<br />
Los productos que hayan sido e<strong>la</strong>borados según <strong>la</strong>s normas <strong>de</strong> producción integrada<br />
podrán ser distinguidos con una i<strong>de</strong>ntificación <strong>de</strong> garantía “Producción Integrada <strong>de</strong><br />
Castil<strong>la</strong> y León”.<br />
La concesión <strong>de</strong> <strong>la</strong> autorización para <strong>la</strong> utilización <strong>de</strong> <strong>la</strong><br />
i<strong>de</strong>ntificación <strong>de</strong> garantía se otorga por el Director General <strong>de</strong><br />
Producción Agropecuaria y se conce<strong>de</strong> a los operadores que<br />
cump<strong>la</strong>n <strong>la</strong> normativa <strong>de</strong> Producción Integrada, <strong>de</strong>sarrol<strong>la</strong>n un<br />
sistema <strong>de</strong> autocontrol, asesoramiento técnico y trazabilidad<br />
correcto y obtenga el informe favorable <strong>de</strong> <strong>la</strong> Entidad <strong>de</strong><br />
Certificación y Administración.<br />
4.2.3 EVOLUCIÓN DE LA PRODUCCIÓN INTEGRADA EN<br />
CASTILLA Y LEÓN<br />
Un mecanismo que se ha usado para exten<strong>de</strong>r <strong>la</strong>s prácticas <strong>de</strong><br />
<strong>la</strong> producción integrada han sido <strong>la</strong>s APRIAS (Asociaciones <strong>de</strong> producción integrada en<br />
agricultura). A <strong>la</strong> fecha actual hay 11 en el registro, una <strong>de</strong> el<strong>la</strong>s <strong>de</strong>dicada a <strong>la</strong> producción <strong>de</strong><br />
patata. A continuación se ofrecen, <strong>de</strong> manera gráfica, <strong>la</strong> evolución <strong>de</strong> <strong>la</strong> superficie, número<br />
<strong>de</strong> agricultores y producción certificada, bajo el sistema <strong>de</strong> Producción Integrada <strong>de</strong> patatas.<br />
GRÁFICO 4.2.1. EVOLUCIÓN DE LA SUPERFICIE DE PRODUCCIÓN INTEGRADA DE PATATAS EXPRESADA EN HECTÁREAS.<br />
1200<br />
1000<br />
800<br />
SUPERFICIE TOTAL CyL<br />
BURGOS<br />
SALAMANCA<br />
SEGOVIA<br />
VALLADOLID<br />
ZAMORA<br />
Ha.<br />
600<br />
400<br />
200<br />
0<br />
2004 2005 2006 2007 2008 2009<br />
AÑO<br />
Fuente: E<strong>la</strong>boración propia con datos <strong>de</strong> <strong>la</strong> D.G. Producción Agropecuaria (Junta <strong>de</strong> Castil<strong>la</strong> y León).<br />
57
Como se observa en <strong>la</strong> gráfica, durante los tres últimos años <strong>la</strong> ten<strong>de</strong>ncia es ligeramente<br />
ascen<strong>de</strong>nte, llegando <strong>la</strong> P.I. a representar en Castil<strong>la</strong> y León un 3,2% sobre <strong>la</strong> superficie total<br />
cultivada.<br />
En cuanto al número <strong>de</strong> productores se observa que hay un <strong>de</strong>scenso año tras año en cuanto a<br />
los agricultores que se incorporan a este sistema <strong>de</strong> producción. En el año 2.009 tan sólo un<br />
2% <strong>de</strong> los productores se acoge a <strong>la</strong>s normas <strong>de</strong> <strong>la</strong> Producción Integrada.<br />
GRÁFICO 4.2.2. NÚMERO DE PRODUCTORES ACOGIDOS A LA PRODUCCIÓN INTEGRADA DE PATATAS.<br />
140<br />
Nº PRODUCTORES<br />
120<br />
100<br />
80<br />
60<br />
Nº PRODUCTORES DE PATATA EN CyL<br />
BURGOS<br />
SALAMANCA<br />
SEGOVIA<br />
VALLADOLID<br />
40<br />
20<br />
0<br />
2004 2005 2006 2007 2008 2009<br />
AÑO<br />
Fuente: E<strong>la</strong>boración propia con datos <strong>de</strong> <strong>la</strong> D.G. Producción Agropecuaria (Junta <strong>de</strong> Castil<strong>la</strong> y León).<br />
Respecto a <strong>la</strong>s patatas comercializadas bajo el amparo <strong>de</strong> <strong>la</strong> Producción Integrada, se observa<br />
que hay un incremento pero no obstante supone un 4,6% <strong>de</strong>l volumen comercializado en<br />
Castil<strong>la</strong> y León.<br />
GRÁFICO 4.2.3. PRODUCTO COMERCIALIZADO DE PATATAS EN PRODUCCIÓN INTEGRADA EN TONELADAS.<br />
50.000<br />
45.000<br />
40.000<br />
35.000<br />
30.000<br />
Tm.<br />
25.000<br />
20.000<br />
15.000<br />
10.000<br />
5.000<br />
0<br />
PRODUCTO COMERCIALIZADO<br />
2004 2008 2009<br />
AÑOS<br />
Fuente: E<strong>la</strong>boración propia con datos <strong>de</strong> <strong>la</strong> D.G. Producción Agropecuaria (Junta <strong>de</strong> Castil<strong>la</strong> y León). No<br />
hay datos sobre los años 2005, 2006 y 2007.<br />
58
CONCLUSIONES<br />
o La patata es uno <strong>de</strong> los principales cultivos en valor <strong>de</strong> producción en el regadío <strong>de</strong><br />
<strong>la</strong> Comunidad Castil<strong>la</strong> y León <strong>de</strong>spués <strong>de</strong>l maíz y el cuarto <strong>de</strong>l conjunto total<br />
(secano más regadío).<br />
o La producción <strong>de</strong> patatas en Castil<strong>la</strong> y León en el año 2008 fue <strong>de</strong> 773.000<br />
tone<strong>la</strong>das y en el año 2009, se estiman unas 976.000 tone<strong>la</strong>das. Siguiendo <strong>la</strong><br />
ten<strong>de</strong>ncia nacional, Castil<strong>la</strong> y León también ha sufrido una disminución en número<br />
<strong>de</strong> hectáreas y tone<strong>la</strong>das <strong>de</strong> patatas en <strong>la</strong> última década.<br />
o Val<strong>la</strong>dolid es <strong>la</strong> principal provincia productora seguida <strong>de</strong> Sa<strong>la</strong>manca y Burgos (esta<br />
última con un gran peso en <strong>la</strong> patata <strong>de</strong> siembra). Los mayores rendimientos en <strong>la</strong><br />
última década se han obtenido en provincias como Val<strong>la</strong>dolid, Segovia, Soria y<br />
Zamora (por encima <strong>de</strong> 35 t/ha).<br />
o En Castil<strong>la</strong> y León <strong>la</strong> producción <strong>de</strong> patata <strong>de</strong> secano es anecdótica situándose por<br />
<strong>de</strong>bajo <strong>de</strong>l 2%. En cuanto a <strong>la</strong> época <strong>de</strong> recolección toma enorme importancia <strong>la</strong><br />
patata tardía (es <strong>la</strong> que mayormente se produce en esta Comunidad por encima <strong>de</strong>l<br />
60 %) seguida <strong>de</strong> <strong>la</strong> patata <strong>de</strong> media estación.<br />
o Sa<strong>la</strong>manca es <strong>la</strong> provincia que más producción tiene <strong>de</strong> patata <strong>de</strong> media estación y<br />
Val<strong>la</strong>dolid ocupa este lugar para <strong>la</strong> patata tardía.<br />
o La Producción Integrada como sistema <strong>de</strong> cultivo contro<strong>la</strong>do, es poco<br />
representativo en Castil<strong>la</strong> y León; siendo un reto importante para esta Comunidad,<br />
<strong>la</strong> imp<strong>la</strong>ntación <strong>de</strong> estos métodos <strong>de</strong> producción certificada.<br />
59
5 ANÁLISIS DEL COMERCIO EXTERIOR DE PATATA EN LA UNIÓN EUROPEA<br />
En el presente capítulo se realiza un análisis <strong>de</strong> <strong>la</strong>s importaciones y exportaciones <strong>de</strong> patata en el<br />
seno <strong>de</strong> <strong>la</strong> Unión Europea. Se <strong>de</strong>tal<strong>la</strong>rán cantida<strong>de</strong>s, principales países <strong>de</strong>stinatarios y los periodos<br />
don<strong>de</strong> se dan estas re<strong>la</strong>ciones comerciales y <strong>la</strong>s ten<strong>de</strong>ncias en el comercio exterior.<br />
5.1 ANALISIS DE LAS IMPORTACIONES DE PATATA DE LA UE<br />
Consi<strong>de</strong>rando los últimos años nos encontramos que <strong>la</strong> UE importó unas 555.000 tone<strong>la</strong>das <strong>de</strong> patata<br />
en el año 2007 como límite máximo y algo más <strong>de</strong> 311.000 tone<strong>la</strong>das en el año 2002 como límite<br />
mínimo. En <strong>la</strong> tab<strong>la</strong> 5.1 se muestra <strong>la</strong> evolución <strong>de</strong> <strong>la</strong>s importaciones totales <strong>de</strong> patata <strong>de</strong> <strong>la</strong> UE (27)<br />
a países terceros.<br />
TABLA 5.1. IMPORTACIONES DE PATATA DE LA UE EN LOS AÑOS 1998-2008, EXPRESADAS EN TONELADAS.<br />
AÑO<br />
CANTIDAD<br />
1998 405.000,0<br />
1999 489.000,0<br />
2000 339.898,0<br />
2001 390.570,7<br />
2002 311.275,1<br />
2003 324.991,3<br />
2004 497.260,1<br />
2005 518.739,8<br />
2006 470.947,9<br />
2007 555.211,9<br />
2008 497.089,3<br />
Media 1998-2008 533.331,6<br />
% variación 1998/2008 +22,74<br />
Fuente: DATACOMEX (Ministerio <strong>de</strong> Industria, Turismo y Comercio).<br />
Los principales países suministradores <strong>de</strong> patata a <strong>la</strong> UE durante el año 2008 fueron Egipto, Israel y<br />
Marruecos. Las varieda<strong>de</strong>s más importadas son Liseta, Vivaldi, Spunta, Heros y Lady Christal. La UE<br />
es <strong>de</strong>ficitaria en <strong>de</strong>terminadas épocas <strong>de</strong>l año, especialmente en patata temprana y por eso tiene<br />
que recurrir a <strong>la</strong>s importaciones <strong>de</strong> estos países terceros. A<strong>de</strong>más, éstas son especialmente<br />
importantes en <strong>de</strong>terminados meses don<strong>de</strong> no hay posibilidad <strong>de</strong> obtener continuidad ni cantidad<br />
suficiente para abastecer al mercado.<br />
61
En el gráfico 5.1 se muestra una ten<strong>de</strong>ncia <strong>de</strong> disminución <strong>de</strong> <strong>la</strong>s importaciones <strong>de</strong>s<strong>de</strong> 1999 hasta<br />
2002, año en el que se inicia una ten<strong>de</strong>ncia <strong>de</strong> aumento hasta 2008.<br />
GRÁFICO 5.1. EVOLUCIÓN DE LAS IMPORTACIONES DE PATATA DE LA U.E. EN LOS AÑOS 1998-2008, EXPRESADA EN TONELADAS.<br />
600.000<br />
500.000<br />
400.000<br />
300.000<br />
200.000<br />
100.000<br />
0<br />
1998 1999 2000 2001 2002 2003 2004 2005 2006 2007 2008<br />
Fuente: E<strong>la</strong>boración propia a partir <strong>de</strong> datos <strong>de</strong> DATACOMEX (Ministerio <strong>de</strong> Industria, Turismo y Comercio).<br />
En <strong>la</strong> tab<strong>la</strong> 5.2. se muestran <strong>la</strong>s cantida<strong>de</strong>s importadas por <strong>la</strong> UE en los últimos años dividida por<br />
países <strong>de</strong> origen. Es evi<strong>de</strong>nte que Egipto e Israel son los países a los que más patata se compra,<br />
<strong>de</strong>bido a <strong>la</strong> disponibilidad temporal y económica. La patata <strong>de</strong> Egipto es más barata que <strong>la</strong> <strong>de</strong> Israel<br />
y con mejor calidad culinaria, <strong>de</strong>bido al tipo <strong>de</strong> cultivo, características agronómicas <strong>de</strong> los suelos,<br />
varieda<strong>de</strong>s utilizadas…etc. Luego le siguen, por este or<strong>de</strong>n, Marruecos, Túnez y Turquía. Todos<br />
estos países no son gran<strong>de</strong>s productores <strong>de</strong> patata, pero por <strong>la</strong> proximidad geográfica a <strong>la</strong> UE, y <strong>la</strong><br />
época <strong>de</strong> recolección, hace que <strong>la</strong>s producciones <strong>de</strong> este tubérculo sean <strong>de</strong>mandadas por el<br />
mercado comunitario.<br />
TABLA 5.2. PRINCIPALES IMPORTACIONES DE PATATA DE LA U.E. DESDE PAÍSES TERCEROS EN LOS AÑOS 2003-2008,<br />
EXPRESADAS EN TONELADAS.<br />
2003 2004 2005 2006 2007 2008 Media 2003-2008<br />
Egipto 173.697,30 213.680,10 241.563,20 192.786,00 237.960,30 222.833,40 212.336,52<br />
Israel 108.414,90 223.966,40 227.544,80 234.755,20 260.272,60 207.369,30 203.011,74<br />
Marruecos 38.770,00 49.753,10 44.964,80 33.768,00 42.286,60 55.795,40 43.643,13<br />
Túnez 605,2 7.455,30 3.252,40 6.479,10 8.252,60 8.621,90 4.348,90<br />
Turquía 3.026,10 1.746,10 206,9 2.298,60 5.933,90 1.414,00 1.662,11<br />
Sudáfrica 52,1 91,5 191,5 14 338 52 123,18<br />
OTROS 272 217,1 490,8 664,8 167,9 1.003,3 452,07<br />
Fuente: DATACOMEX (Ministerio <strong>de</strong> Industria, Turismo y Comercio).<br />
Es importante <strong>de</strong>stacar que Marruecos tiene muchas posibilida<strong>de</strong>s <strong>de</strong> crecimiento ya que pue<strong>de</strong>,<br />
potencialmente, comercializar los doce meses <strong>de</strong>l año. El principal obstáculo que tiene este país es<br />
62
que <strong>la</strong>s re<strong>la</strong>ciones comerciales son difíciles por <strong>la</strong> poca transparencia que existe en <strong>la</strong>s mismas y<br />
este hecho es lo que está frenando actualmente a muchos operadores.<br />
En el gráfico 5.2. se exponen <strong>la</strong>s importaciones <strong>de</strong> patata <strong>de</strong> <strong>la</strong> UE entre los años 2006 y 2008. Se<br />
pue<strong>de</strong> observar que los principales meses <strong>de</strong> importación son <strong>de</strong>s<strong>de</strong> febrero hasta junio, que<br />
correspon<strong>de</strong>n a <strong>la</strong> época <strong>de</strong> producción <strong>de</strong> patata temprana <strong>de</strong> los países <strong>de</strong> <strong>la</strong> costa mediterránea<br />
<strong>de</strong>scritos anteriormente. En 2008, el mes que más patata se importó fue marzo (34,18% <strong>de</strong>l total)<br />
seguido <strong>de</strong> abril (25,56%). Es evi<strong>de</strong>nte que estas importaciones se hacen porque son una alternativa<br />
a <strong>la</strong>s patatas <strong>de</strong> conservación, que es principalmente <strong>la</strong> que se comercializa en <strong>la</strong> UE en esas fechas.<br />
GRÁFICO 5.2. IMPORTACIONES DE PATATA DE LA UE EN LOS AÑOS 2006-2008 POR MESES, EXPRESADAS EN TONELADAS.<br />
250.000<br />
200.000<br />
150.000<br />
2006<br />
2007<br />
2008<br />
100.000<br />
50.000<br />
0<br />
Enero<br />
Febrero<br />
Marzo<br />
Abril<br />
Mayo<br />
Junio<br />
Julio<br />
Agosto<br />
Septiembre<br />
Octubre<br />
Noviembre<br />
Diciembre<br />
Fuente: E<strong>la</strong>boración propia a partir <strong>de</strong> datos <strong>de</strong> EUROSTAT.<br />
5.2 ANALISIS DE LAS EXPORTACIONES DE PATATA DE CONSUMO DE LA UE<br />
Las exportaciones <strong>de</strong> patata <strong>de</strong> <strong>la</strong> UE <strong>de</strong>s<strong>de</strong> el año 2000 se muestran en <strong>la</strong> tab<strong>la</strong> 5.3. En el año 2008<br />
<strong>la</strong> UE exportó casi 31 mil tone<strong>la</strong>das <strong>de</strong> este producto a países terceros. El año 2007 ha sido el que<br />
más patata se ha exportado en esta última década con cerca <strong>de</strong> 58 mil tone<strong>la</strong>das.<br />
TABLA 5.3. EXPORTACIONES DE PATATA DE LA U.E. A PAÍSES TERCEROS ENTRE 2000-2008, EXPRESADAS EN TONELADAS.<br />
AÑO<br />
CANTIDAD<br />
2000 46.838,0<br />
2001 38.441,9<br />
2002 43.964,7<br />
2003 35.449,0<br />
2004 28.882,3<br />
2005 29.562,5<br />
2006 30.984,9<br />
2007 57.947,6<br />
2008 30.715,0<br />
Media 2000-2008 38.087,3<br />
% variación 2000/2008 -34,42<br />
Fuente: DATACOMEX (Ministerio <strong>de</strong> Industria, Turismo y Comercio).<br />
63
En el gráfico 5.3 se observa como <strong>la</strong> evolución <strong>de</strong> <strong>la</strong>s exportaciones ha tenido una ten<strong>de</strong>ncia <strong>de</strong><br />
disminución pau<strong>la</strong>tina <strong>de</strong>s<strong>de</strong> el año 2000 hasta 2006. Sorpren<strong>de</strong>ntemente en el año 2007 se<br />
incrementaron <strong>de</strong> una forma vertiginosa <strong>la</strong>s exportaciones, llegando casi a dob<strong>la</strong>r <strong>la</strong> cantidad <strong>de</strong>l<br />
año anterior, aunque en 2008 el volumen se ha mantenido simi<strong>la</strong>r al <strong>de</strong> 2006.<br />
GRÁFICO 5.3. EVOLUCIÓN DE LAS EXPORTACIONES DE PATATA DE LA U.E. EN LOS AÑOS 2000-2008, EXPRESADA EN<br />
TONELADAS.<br />
70.000<br />
60.000<br />
50.000<br />
40.000<br />
30.000<br />
20.000<br />
10.000<br />
0<br />
2000 2001 2002 2003 2004 2005 2006 2007 2008<br />
Fuente: e<strong>la</strong>boración propia a partir <strong>de</strong> datos <strong>de</strong> DATACOMEX (Ministerio <strong>de</strong> Industria, Turismo y Comercio).<br />
En <strong>la</strong> tab<strong>la</strong> 5.4 se indican los países a los que <strong>la</strong> UE <strong>de</strong>stina sus exportaciones. Así se observa que los<br />
principales países <strong>de</strong>stinatarios son Suiza, Noruega, Israel, Albania, Croacia y Rusia. Estos países no<br />
son gran<strong>de</strong>s productores (con <strong>la</strong> excepción <strong>de</strong> Rusia) y es evi<strong>de</strong>nte que estos países importan <strong>de</strong> <strong>la</strong><br />
UE por su cercanía. A<strong>de</strong>más, <strong>la</strong>s necesida<strong>de</strong>s comerciales <strong>de</strong> todos estos países en cuanto a<br />
varieda<strong>de</strong>s, calibres, etc. son simi<strong>la</strong>res a <strong>la</strong>s características <strong>de</strong> <strong>la</strong>s producciones <strong>de</strong> <strong>la</strong> UE.<br />
TABLA 5.4. PRINCIPALES PAÍSES DESTINATARIOS DE LAS EXPORTACIONES DE PATATA DE LA U.E, EXPRESADAS EN TONELADAS.<br />
2002 2003 2004 2005 2006 2007 2008 Media 2002-2008<br />
Noruega 9.631,0 12.719,6 8.784,3 8.570,1 9.081,5 5.963,1 6.198,1 8.706,8<br />
Túnez 7715,8 40601,5 6.902,5<br />
Albania 3.703,9 11.732,7 6.243,0 10.283,5 8.134,6 1.129,7 4.703,2 6.561,5<br />
Croacia 1.526,3 4.053,1 6.213,4 3.089,4 5.396,1 2.662,9 3.301,3 3.748,9<br />
Rusia 10.107,6 1.933,1 340,0 3.964,6 3.794,8 3.334,8 2.149,5 3.660,6<br />
Suiza 2.815,5 1.031,4 4.228,3 1.510,4 2.137,7 2.309,3 6.696,6 2.961,3<br />
Israel 0,1 7,6 5.738,9 820,9<br />
Andorra 568,0 493,1 710,4 407,4 376,5 656,6 373,6 512,2<br />
Argelia 3536,3 505,2<br />
Bosnia 283,2 727,3 631,9 219,9 675,3 244,9 184,5 423,9<br />
Costa <strong>de</strong> Marfil 319,7 824,5 333,5 56,0 153,0 1,0 28,0 245,1<br />
Uzbekistan 1479,4 211,3<br />
Moldavia 507,6 180,4 20,0 60,4 64,4 319,3 262,7 202,1<br />
Is<strong>la</strong>ndia 37,6 112,3 98,2 186,1 147,5 236,6 298,1 159,5<br />
Senegal 132,0 198,0 62,8 256,1 156,8 115,1<br />
Bielorrusia 197,8 135,8 5,0 166,5 94,2 20,0 180,2 114,2<br />
Fuente: DATACOMEX (Ministerio <strong>de</strong> Industria, Turismo y Comercio).<br />
64
Las exportaciones <strong>de</strong> <strong>la</strong> UE se realizan en los primeros meses <strong>de</strong>l año, sobre todo <strong>de</strong>s<strong>de</strong> febrero<br />
hasta junio, alcanzando generalmente su punto más alto entre mayo y junio (ver gráfico 5.4). Es<br />
<strong>de</strong>stacable el gran incremento <strong>de</strong> <strong>la</strong>s exportaciones en agosto, septiembre y octubre <strong>de</strong>l año 2007.<br />
Este hecho fue coyuntural <strong>de</strong>bido a que Túnez importó en ese año algo más <strong>de</strong> 40 mil tone<strong>la</strong>das,<br />
mayoritariamente en esos tres meses.<br />
GRÁFICO 5.4. EXPORTACIONES DE PATATA DE LA U.E. POR MESES EN LOS AÑOS 2006-2008, EXPRESADAS EN TONELADAS.<br />
18.000<br />
16.000<br />
14.000<br />
12.000<br />
10.000<br />
8.000<br />
6.000<br />
4.000<br />
2.000<br />
0<br />
2006<br />
2007<br />
2008<br />
Enero<br />
Febrero<br />
Marzo<br />
Abril<br />
Mayo<br />
Junio<br />
Julio<br />
Agosto<br />
Septiembre<br />
Octubre<br />
Noviembre<br />
Diciembre<br />
Fuente: E<strong>la</strong>boración propia a partir <strong>de</strong> datos <strong>de</strong> EUROSTAT.<br />
65
CONCLUSIONES<br />
o Las importaciones <strong>de</strong> patata <strong>de</strong>s<strong>de</strong> países terceros a <strong>la</strong> UE han osci<strong>la</strong>do entre 311 mil<br />
tone<strong>la</strong>das y 555 mil tone<strong>la</strong>das en los últimos 10 años.<br />
o Israel y Egipto suponen más <strong>de</strong>l 85% <strong>de</strong> <strong>la</strong>s importaciones a <strong>la</strong> U.E, siendo éstas <strong>de</strong><br />
patata temprana, ya que hay un hueco en el mercado (<strong>la</strong>s importaciones se realizan<br />
entre los meses <strong>de</strong> enero y mayo).<br />
o Las exportaciones <strong>de</strong> <strong>la</strong> UE han osci<strong>la</strong>do entre 31.000 t y 58.000 t en los últimos 10<br />
años.<br />
o Los principales <strong>de</strong>stinos <strong>de</strong> <strong>la</strong> patata <strong>de</strong> <strong>la</strong> U.E son Suiza, Noruega, Israel, Albania,<br />
Croacia y Rusia. Estos <strong>de</strong>stinos suponen más <strong>de</strong>l 90% <strong>de</strong> <strong>la</strong>s exportaciones <strong>de</strong>s<strong>de</strong> <strong>la</strong> UE;<br />
realizándose éstas entre los meses <strong>de</strong> Enero a Julio lo que indica que es patata <strong>de</strong><br />
conservación.<br />
66
6 ANÁLISIS DEL COMERCIO EXTERIOR DE PATATA EN ESPAÑA<br />
En este apartado se realiza un estudio <strong>de</strong>l comercio exterior español <strong>de</strong> patata. Para conocer<br />
<strong>la</strong>s repercusiones <strong>de</strong> <strong>la</strong> patata importada y su posicionamiento en el mercado nacional, en<br />
general, y en el <strong>de</strong> Castil<strong>la</strong> y León en particu<strong>la</strong>r, es necesario e<strong>la</strong>borar un análisis <strong>de</strong> <strong>la</strong>s<br />
exportaciones e importaciones españo<strong>la</strong>s <strong>de</strong> patata. Este estudio abarca <strong>la</strong> cuantificación, <strong>la</strong><br />
evolución y los <strong>de</strong>stinos principales que intervienen en estas re<strong>la</strong>ciones comerciales, para<br />
po<strong>de</strong>r conocer con <strong>de</strong>talle cuales son los mayores proveedores y clientes <strong>de</strong>l mercado español<br />
y <strong>de</strong>l castel<strong>la</strong>no y leonés cuando se producen estas operaciones y los volúmenes económicos<br />
que representan.<br />
6.1 ANÁLISIS DE LAS IMPORTACIONES DE PATATA EN ESPAÑA Y EN CASTILLA Y LEÓN<br />
Los volúmenes <strong>de</strong> comercio exterior han aumentado mucho <strong>de</strong>s<strong>de</strong> el ingreso <strong>de</strong> España en <strong>la</strong><br />
CEE, aunque globalmente han sido muy superiores los volúmenes importados. España, que<br />
importó 766.602 t <strong>de</strong> patatas en el 2008, muestra una ten<strong>de</strong>ncia <strong>de</strong> estabilización en <strong>la</strong>s<br />
importaciones <strong>de</strong>s<strong>de</strong> 2003. Según se pue<strong>de</strong> observar en el gráfico 6.1, los años que más<br />
cantidad se importó fueron el 2004 (791.526 t) y el 2006 (785.243 t). También se pue<strong>de</strong><br />
observar que <strong>la</strong> gran mayoría <strong>de</strong> <strong>la</strong>s importaciones se hacen <strong>de</strong>s<strong>de</strong> países <strong>de</strong> <strong>la</strong> UE, por lo que<br />
a continuación se hab<strong>la</strong>rá fundamentalmente <strong>de</strong> estos países.<br />
GRÁFICO 6.1. EVOLUCIÓN DE LAS IMPORTACIONES DE PATATA EN ESPAÑA, EN LOS AÑOS 1999-2008, EXPRESADA EN<br />
TONELADAS.<br />
900.000<br />
800.000<br />
700.000<br />
600.000<br />
500.000<br />
400.000<br />
300.000<br />
200.000<br />
100.000<br />
0<br />
TOTAL<br />
EXTRA UE<br />
INTRA UE<br />
1999 2000 2001 2002 2003 2004 2005 2006 2007 2008<br />
Fuente: E<strong>la</strong>boración propia a partir <strong>de</strong> datos <strong>de</strong> MARM y FEPEX.<br />
En <strong>la</strong> tab<strong>la</strong> 6.1 se exponen los principales países a los que España compra patatas, don<strong>de</strong> se<br />
pue<strong>de</strong> observar como en el año 2008 el principal proveedor fue Francia (70% <strong>de</strong>l total). Esto<br />
es <strong>de</strong>bido a que el país galo tiene una gran capacidad <strong>de</strong> conservación <strong>de</strong> patata y que <strong>la</strong>s<br />
varieda<strong>de</strong>s comercializadas se adaptan muy bien a <strong>la</strong>s necesida<strong>de</strong>s <strong>de</strong>l mercado español. El<br />
67
siguiente país al que más patatas compramos es el Reino Unido (10,9% <strong>de</strong>l total). Las<br />
varieda<strong>de</strong>s propias <strong>de</strong> este país, en general, no “gustan” en España (muchas <strong>de</strong> el<strong>la</strong>s son <strong>de</strong><br />
carne b<strong>la</strong>nca) y <strong>la</strong> patata <strong>de</strong> industria tiene un gran peso en este país. El tercer país en<br />
importancia es Ho<strong>la</strong>nda (9% <strong>de</strong>l total), <strong>de</strong> don<strong>de</strong> adquirimos <strong>la</strong> gran mayoría <strong>de</strong> patata <strong>de</strong><br />
siembra y los sobrantes <strong>de</strong> ésta que se <strong>de</strong>stinan a consumo.<br />
TABLA 6.1. IMPORTACIONES DE ESPAÑA DE PATATA POR PAÍSES EN LOS AÑOS 2002-2009, EXPRESADAS EN TONELADAS.<br />
2002 2003 2004 2005 2006 2007 2008 2009* 2008%<br />
Francia 391.554 551.306 518.352 552.811 544.081 494.294 539.186 394.340 70,33<br />
Reino Unido 79.904 86.234 79.369 81.209 82.992 74.229 83.261 44.137 10,86<br />
Ho<strong>la</strong>nda 73.434 52.910 76.765 62.500 64.324 78.602 69.229 58.335 9,03<br />
Bélgica 26.547 23.454 44.476 36.555 38.837 20.805 21.200 22.649 2,77<br />
Portugal 6.796 7.041 19.876 21.002 15.177 18.782 10.354 10.660 1,35<br />
Dinamarca 2.796 2.618 4.257 8.125 5.958 2.876 6.685 2.444 0,87<br />
Alemania 2.702 4.655 8.594 4.460 4.162 4.545 3.465 2.976 0,45<br />
Chipre 695 444 201 918 960 1.751 594 0,23<br />
Suecia 261 285 130 52 893 1.552 1.094 674 0,14<br />
Otros 6.031 14.615 45.128 35.508 38.955 46.134 30.377 7.767 3,96<br />
TOTAL 590.025 743.813 797.391 802.423 796.297 742.779 766.602 544.576<br />
Fuente: MARM, EUROSTAT y FEPEX. *: Datos <strong>de</strong>s<strong>de</strong> enero hasta septiembre.<br />
El gráfico 6.2 p<strong>la</strong>sma una evolución ascen<strong>de</strong>nte <strong>de</strong> <strong>la</strong>s importaciones <strong>de</strong> patata proce<strong>de</strong>ntes<br />
<strong>de</strong> Francia. Así, se muestra como <strong>la</strong>s importaciones realizadas <strong>de</strong>s<strong>de</strong> otros países casi no han<br />
variado en los últimos años, mientras que <strong>la</strong>s realizadas <strong>de</strong>s<strong>de</strong> el país galo han ido<br />
progresivamente incrementándose <strong>de</strong> una manera vertiginosa <strong>de</strong>s<strong>de</strong> 1997 hasta 2003. Los<br />
datos reflejan que en el año 2008 prácticamente se han duplicado <strong>la</strong>s importaciones a este<br />
país respecto al año 1997. Desgraciadamente, este incremento en <strong>la</strong>s importaciones <strong>de</strong><br />
Francia va en <strong>de</strong>trimento <strong>de</strong> <strong>la</strong> producción Españo<strong>la</strong> en general, y <strong>de</strong> <strong>la</strong> <strong>de</strong> Castil<strong>la</strong> y León en<br />
particu<strong>la</strong>r, ya que esta comunidad produce en un periodo que coinci<strong>de</strong> plenamente con <strong>la</strong>s<br />
cosechas francesas, haciendo que actualmente sólo el 65% <strong>de</strong> <strong>la</strong> patata consumida, se<br />
produzca en España.<br />
GRÁFICO 6.2. EVOLUCIÓN DE LAS IMPORTACIONES DE PATATA EN LOS AÑOS 1997 Y 2008, EXPRESADA EN TONELADAS.<br />
600000<br />
500000<br />
400000<br />
300000<br />
200000<br />
Francia<br />
Reino Unido<br />
Ho<strong>la</strong>nda<br />
Bélgica<br />
Otros<br />
100000<br />
0<br />
1997<br />
1998<br />
1999<br />
2000<br />
2001<br />
2002<br />
2003<br />
2004<br />
2005<br />
2006<br />
2007<br />
2008<br />
Fuente: E<strong>la</strong>boración propia con datos <strong>de</strong>l MARM, EUROSTAT y FEPEX.<br />
68
Antes <strong>de</strong> entrar en <strong>la</strong> UE los principales suministradores <strong>de</strong> España eran Reino Unido y<br />
Ho<strong>la</strong>nda, seguidos a mucha distancia por Francia e Ir<strong>la</strong>nda. En los primeros años <strong>de</strong> adhesión<br />
<strong>de</strong> España a <strong>la</strong> U.E. se incrementaron <strong>la</strong>s importaciones proce<strong>de</strong>ntes <strong>de</strong> Francia, a <strong>la</strong> vez que<br />
se imp<strong>la</strong>ntaban <strong>la</strong>s gran<strong>de</strong>s ca<strong>de</strong>nas <strong>de</strong> distribución francesas en nuestro país. Esto implica<br />
nuevas ten<strong>de</strong>ncias <strong>de</strong> mercado orientadas a <strong>la</strong> patata <strong>la</strong>vada, segmentación <strong>de</strong>l mercado,<br />
formatos pequeños, aspecto visual, etc., conceptos todos ellos que ha ido asumiendo<br />
fundamentalmente <strong>la</strong> gran distribución.<br />
Los países no pertenecientes a <strong>la</strong> UE mayores proveedores <strong>de</strong> patata a España en 2008 fueron<br />
Israel (que registró 19.772 t), Marruecos (7.472 t), Egipto (785 t) y Argelia (14 t). En el gráfico<br />
6.3 se exponen <strong>la</strong>s cantida<strong>de</strong>s importadas en tone<strong>la</strong>das <strong>de</strong> estos países en los últimos años,<br />
pudiendo observarse una ten<strong>de</strong>ncia general <strong>de</strong> aumento <strong>de</strong> <strong>la</strong>s importaciones <strong>de</strong>s<strong>de</strong> el año<br />
2000. Es importante <strong>de</strong>stacar que estos países no son competidores <strong>de</strong> <strong>la</strong> patata <strong>de</strong> Castil<strong>la</strong> y<br />
León ya que ellos producen varieda<strong>de</strong>s extratempranas y tempranas, aunque podrían serlo si<br />
nuestra región conservara patatas <strong>de</strong> calidad hasta los meses <strong>de</strong> abril y mayo.<br />
GRÁFICO 6.3. EVOLUCIÓN DE LAS IMPORTACIONES DE PATATA DE PAÍSES NO PERTENECIENTES A LA U.E EN LOS AÑOS<br />
2000-2008, EXPRESADA EN TONELADAS.<br />
45000<br />
40000<br />
35000<br />
30000<br />
25000<br />
20000<br />
15000<br />
10000<br />
5000<br />
0<br />
Israel<br />
Marruecos<br />
Egipto<br />
2000 2001 2002 2003 2004 2005 2006 2007 2008<br />
Fuente: e<strong>la</strong>boración propia con datos <strong>de</strong> DATACOMEX.<br />
Aunque ya se analizará el sector <strong>de</strong> <strong>la</strong> patata en Francia en otro capítulo más a<strong>de</strong><strong>la</strong>nte, <strong>de</strong><br />
forma general <strong>la</strong>s razones fundamentales <strong>de</strong> este “monopolio” tienen que ver con <strong>la</strong><br />
imp<strong>la</strong>ntación <strong>de</strong> hábitos nuevos <strong>de</strong> consumo en nuestro país, <strong>la</strong> logística, <strong>la</strong> proximidad<br />
geográfica y <strong>la</strong>s estrategias comerciales impuestas por diversas empresas que han ca<strong>la</strong>do muy<br />
hondo en el consumidor español, siendo éste un buen ejemplo <strong>de</strong> como hacer una buena<br />
política <strong>de</strong> segmentación en el mercado <strong>de</strong> <strong>la</strong> patata, <strong>de</strong>l que Castil<strong>la</strong> y León <strong>de</strong>be apren<strong>de</strong>r<br />
para asegurar <strong>la</strong> competitividad en este sector.<br />
69
La intensidad <strong>de</strong> <strong>la</strong>s importaciones <strong>de</strong> patata en España varía en función <strong>de</strong> <strong>la</strong> época <strong>de</strong>l año.<br />
En <strong>la</strong> tab<strong>la</strong> 6.2 se expone el peso expresado en porcentaje <strong>de</strong> patata importada por España en<br />
los meses <strong>de</strong> los años 2007, 2008 y 2009 (<strong>de</strong>s<strong>de</strong> enero hasta septiembre en este último año), y<br />
en el gráfico 6.4 se exponen los valores en tone<strong>la</strong>das. Tradicionalmente, los meses en que se<br />
registra mayor cifra <strong>de</strong> negocio son diciembre, enero y marzo, seguidos <strong>de</strong> febrero, ya que es<br />
<strong>la</strong> época que coinci<strong>de</strong> con el periodo en el que <strong>la</strong> patata <strong>de</strong> media estación y tardía <strong>de</strong> España<br />
(fundamentalmente <strong>de</strong> Castil<strong>la</strong> y León) está en <strong>de</strong>clive por una falta <strong>de</strong> patata <strong>de</strong><br />
conservación <strong>de</strong> calidad. Sólo a partir <strong>de</strong> mayo es cuando se reducen <strong>la</strong>s importaciones, con<br />
<strong>la</strong> entrada <strong>de</strong> <strong>la</strong> patata nueva <strong>de</strong>l sur <strong>de</strong> España. Esta ten<strong>de</strong>ncia se mantiene en <strong>la</strong>s últimas<br />
campañas pero con un problema añadido, y es que pau<strong>la</strong>tinamente se está aumentando el<br />
volumen importado en los meses <strong>de</strong> abril y mayo, lo que repercute muy negativamente en <strong>la</strong><br />
venta <strong>de</strong> <strong>la</strong> patata extratemprana y temprana nacional, <strong>de</strong> modo que está llegando al<br />
consumidor en esos meses más patata vieja <strong>de</strong> conservación y menos patata nueva <strong>de</strong> calidad<br />
<strong>de</strong> producción españo<strong>la</strong>.<br />
TABLA 6.2. PORCENTAJE DE IMPORTACIÓN POR MESES, RESPECTO AL TOTAL.<br />
2007% 2008% 2009% 1<br />
Enero 13,18 11,77 18,10<br />
Febrero 13,90 11,46 16,39<br />
Marzo 14,34 11,88 19,12<br />
Abril 10,79 12,15 16,83<br />
Mayo 5,04 6,65 12,54<br />
Junio 3,57 3,34 3,73<br />
Julio 1,67 2,71 3,14<br />
Agosto 2,93 3,16 4,41<br />
Septiembre 4,55 5,29 5,74<br />
Octubre 7,24 6,21<br />
Noviembre 10,14 12,14<br />
Diciembre 12,64 13,24<br />
Fuente: FEPEX; 1 : Datos <strong>de</strong>s<strong>de</strong> enero hasta septiembre.<br />
GRÁFICO 6.4.IMPORTACIONES DE PATATA EN ESPAÑA POR MESES, ENTRE 2007-2009, EXPRESADAS EN TONELADAS.<br />
120.000<br />
100.000<br />
2007<br />
2008<br />
80.000<br />
2009<br />
60.000<br />
40.000<br />
20.000<br />
0<br />
Enero<br />
Febrero<br />
Marzo<br />
Abril<br />
Mayo<br />
Junio<br />
Julio<br />
Agosto<br />
Septiembre<br />
Octubre<br />
Noviembre<br />
Diciembre<br />
Fuente: FEPEX.<br />
70
En <strong>la</strong> tab<strong>la</strong> 6.3 aparecen los datos <strong>de</strong> <strong>la</strong>s importaciones españo<strong>la</strong>s en los tres últimos años<br />
divididos por Comunida<strong>de</strong>s Autónomas, don<strong>de</strong> se pue<strong>de</strong> observar como Cataluña y <strong>la</strong><br />
Comunidad Valenciana son <strong>la</strong>s principales importadoras, y como Castil<strong>la</strong> y León se sitúa en el<br />
quinto puesto con un 8,7% <strong>de</strong>l total nacional. Cataluña y Valencia tienen una buena<br />
comunicación logística (sobre todo <strong>la</strong> primera) para traer patata importada <strong>de</strong> Francia y esta<br />
circunstancia es una <strong>de</strong> <strong>la</strong>s razones <strong>de</strong> sus altos volúmenes <strong>de</strong> importación.<br />
TABLA 6.3. IMPORTACIONES DE PATATA EN ESPAÑA POR CC.AA EN LOS AÑOS 2006-2008, EXPRESADAS EN TONELADAS.<br />
2006 2007 2008 2008%<br />
Cataluña 184.021 174.919 145.439 19,0<br />
C. Valenciana 118.732 114.873 135.001 17,6<br />
Andalucía 91.381 78.076 85.320 11,1<br />
Canarias 71.959 61.688 82.113 10,7<br />
C. León 52.786 43.055 66.703 8,7<br />
Resto 277.418 270.168 252.025 32,9<br />
TOTAL 796.297 742.779 766.602 100<br />
Fuente: ESTACOM (Ministerio <strong>de</strong> Industria, Turismo y Comercio).<br />
Para ilustrar <strong>la</strong> situación en Castil<strong>la</strong> y León se muestra <strong>la</strong> tab<strong>la</strong> 6.4, don<strong>de</strong> se aprecia que <strong>la</strong><br />
principal provincia importadora <strong>de</strong> <strong>la</strong> Comunidad es Burgos (65,1% <strong>de</strong>l total en 2008) seguido<br />
<strong>de</strong> Val<strong>la</strong>dolid (23,1%). Esto es <strong>de</strong>bido a que Burgos recibe mucha patata para industria y<br />
también <strong>la</strong> mayor cantidad <strong>de</strong> patata <strong>de</strong> siembra. El resto <strong>de</strong> provincias tienen unos<br />
volúmenes <strong>de</strong> importación bastante más bajos.<br />
TABLA 6.4. IMPORTACIONES DE PATATA EN LAS PROVINCIAS DE CASTILLA Y LEÓN, EXPRESADAS EN TONELADAS.<br />
2007 2008 2008%<br />
Burgos 19.945 43.438 65,1<br />
Val<strong>la</strong>dolid 16.135 15.404 23,1<br />
León 1.852 3.061 4,6<br />
Zamora 1.182 2.327 3,5<br />
Sa<strong>la</strong>manca 1.112 1.126 1,7<br />
Soria 1.345 684 1,0<br />
Palencia 219 395 0,6<br />
Segovia 1.266 269 0,4<br />
Ávi<strong>la</strong> - - -<br />
CASTILLA Y LEÓN 43.055 66.703 100<br />
Fuente: DATACOMEX (Ministerio <strong>de</strong> Industria, Turismo y Comercio).<br />
Hasta este momento se han dado datos <strong>de</strong> volúmenes importados en tone<strong>la</strong>das, pero toda<br />
esta información no quedaría completa sino se acompaña <strong>de</strong> los valores económicos que<br />
representan. De este modo, en <strong>la</strong>s tab<strong>la</strong>s 6.5 y 6.6 se traduce <strong>la</strong> información <strong>de</strong> <strong>la</strong>s<br />
importaciones en tone<strong>la</strong>das a su valor económico.<br />
71
En <strong>la</strong> tab<strong>la</strong> 6.5 se muestra como <strong>de</strong> los casi 188 millones <strong>de</strong> euros gastados por España en<br />
2008 en comprar patata, el 46,5% <strong>de</strong> esa cantidad va a parar a <strong>la</strong>s arcas <strong>de</strong> Francia. Otros<br />
países <strong>de</strong> <strong>la</strong> UE a los que pagamos importantes cantida<strong>de</strong>s económicas por este producto son<br />
Ho<strong>la</strong>nda (18,54% <strong>de</strong>l total) y Reino Unido (16,75%).<br />
TABLA 6.5. IMPORTACIONES DE PATATA EN ESPAÑA POR PAÍSES EN LOS AÑOS 2007-2009,EXPRESADAS EN MILLONES DE<br />
EUROS.<br />
2007 2008 2009* 2008%<br />
Francia 127,89 87,28 64,99 46,46<br />
Ho<strong>la</strong>nda 38,96 34,82 29,70 18,54<br />
R. Unido 29,29 31,46 12,76 16,75<br />
Bélgica 6,43 13,64 4,50 7,26<br />
Portugal 6,47 3,51 3,07 1,87<br />
Dinamarca 1,58 2,63 0,78 1,40<br />
Alemania 2,48 1,37 1,12 0,73<br />
Chipre 0,64 1,27 0,31 0,68<br />
Suecia 0,56 0,29 0,12 0,15<br />
Otros 0,85 0,68 0,44 0,36<br />
TOTAL 233,72 187,85 120,18 100<br />
Fuente: MARM y FEPEX. *: Datos <strong>de</strong>s<strong>de</strong> enero hasta septiembre.<br />
Es importante <strong>de</strong>stacar que <strong>la</strong> mayor parte <strong>de</strong> <strong>la</strong>s importaciones ho<strong>la</strong>n<strong>de</strong>sas son en forma <strong>de</strong><br />
patata <strong>de</strong> siembra y sobrantes <strong>de</strong> <strong>la</strong> misma que se emplean para consumo (<strong>de</strong>stinadas<br />
mayoritariamente a <strong>la</strong> Red <strong>de</strong> Mercas). En esta tab<strong>la</strong> también es palpable que en 2007 se<br />
gastó aproximadamente un 20% más que en 2008, aunque curiosamente en ese año se<br />
realizaron más importaciones, en concreto un 3,2% más que en 2007, lo que se traduce en<br />
una importante caída en los precios.<br />
Así, por ejemplo, según diversas fuentes contactadas, el precio medio por tone<strong>la</strong>da <strong>de</strong> <strong>la</strong><br />
variedad Monalisa fue <strong>de</strong> 270 € en 2007 y <strong>de</strong> 152 € en 2008. Al comparar el valor <strong>de</strong> dinero<br />
gastado entre enero-septiembre <strong>de</strong> 2009 y el mismo periodo <strong>de</strong> 2008, nos encontramos que en<br />
el 2009 se gastaron globalmente 11,3 millones <strong>de</strong> euros menos que en 2008 en <strong>la</strong> compra <strong>de</strong><br />
este tubérculo, aunque si nos fijamos en <strong>la</strong>s importaciones a Francia éstas se han<br />
incrementado en 5,2 millones <strong>de</strong> euros.<br />
A pesar <strong>de</strong> que el valor gastado ha sido menor, <strong>la</strong> cantidad ha aumentado consi<strong>de</strong>rablemente,<br />
habiendo incrementado Francia su cuota en unas 20.000 tone<strong>la</strong>das más en el periodo enero –<br />
septiembre <strong>de</strong> 2009 respecto al año anterior. Todo esto vuelve a poner <strong>de</strong> manifiesto <strong>la</strong><br />
hegemonía <strong>de</strong> <strong>la</strong> patata francesa en España.<br />
Los volúmenes gastados en importaciones por meses se muestran en <strong>la</strong> tab<strong>la</strong> 6.6,<br />
observándose que los meses <strong>de</strong> mayor gasto en 2008 fueron, por este or<strong>de</strong>n, diciembre,<br />
marzo, febrero, noviembre, enero, abril y mayo. Si tanto en España, como en Castil<strong>la</strong> y León,<br />
que es <strong>la</strong> principal productora <strong>de</strong> patata <strong>de</strong> media estación y tardía, se <strong>de</strong>dicaran más<br />
tone<strong>la</strong>das a <strong>la</strong> conservación, <strong>la</strong> cifra <strong>de</strong> negocio <strong>de</strong> <strong>la</strong> importación se podría reducir<br />
72
sustancialmente siempre y cuando se trabajara bajo unos criterios o estándares <strong>de</strong> calidad<br />
a<strong>de</strong>cuados.<br />
TABLA 6.6. IMPORTACIONES DE PATATA EN ESPAÑA POR MESES EN LOS AÑOS 2007-2009, EXPRESADAS EN MILLONES DE<br />
EUROS.<br />
2007 2008 2009 1 2008%<br />
Enero 33,64 20,46 25,19 10,89<br />
Febrero 39,42 21,67 18,28 11,54<br />
Marzo 38,96 22,16 24,57 11,80<br />
Abril 29,34 18,71 16,65 9,96<br />
Mayo 12,36 17,35 12,61 9,24<br />
Junio 8,29 7,67 4,91 4,08<br />
Julio 4,23 5,24 3,41 2,79<br />
Agosto 5,79 6,20 6,17 3,30<br />
Septiembre 7,39 12,00 8,40 6,39<br />
Octubre 12,44 11,85 6,31<br />
Noviembre 18,39 21,02 11,19<br />
Diciembre 23,48 23,50 12,51<br />
Total 233,72 187,85 120,18 100<br />
Fuente: FEPEX; 1 : Datos <strong>de</strong>s<strong>de</strong> enero hasta septiembre.<br />
En <strong>la</strong> tab<strong>la</strong> 6.7 se ilustran <strong>la</strong>s cantida<strong>de</strong>s económicas gastadas por Castil<strong>la</strong> y León en <strong>la</strong><br />
importación <strong>de</strong> este tubérculo, siendo c<strong>la</strong>ro que, como a nivel nacional, <strong>la</strong> mayor cuota <strong>la</strong><br />
recibe Francia. Es evi<strong>de</strong>nte que Francia y Ho<strong>la</strong>nda han incrementado sus exportaciones a<br />
Castil<strong>la</strong> y León en más <strong>de</strong> un 50% <strong>de</strong>s<strong>de</strong> el año 2003. Como se ha <strong>de</strong>scrito anteriormente, el<br />
caso <strong>de</strong> Ho<strong>la</strong>nda se centra fundamentalmente en patata <strong>de</strong> siembra.<br />
La conclusión que po<strong>de</strong>mos sacar al respecto es que en esta Comunidad se podría producir<br />
más patata, siempre y cuando fuésemos capaces <strong>de</strong> romper <strong>la</strong> estacionalidad <strong>de</strong> este<br />
tubérculo basándonos en métodos a<strong>de</strong>cuados <strong>de</strong> conservación en base a una buena elección<br />
<strong>de</strong> <strong>la</strong>s varieda<strong>de</strong>s y unas técnicas <strong>de</strong> almacenaje a<strong>de</strong>cuadas específicas para cada una <strong>de</strong><br />
el<strong>la</strong>s.<br />
TABLA 6.7. VALOR DE LAS IMPORTACIONES DE PATATA REALIZADAS EN CASTILLA Y LEÓN EN LOS AÑOS 2003-2008,<br />
EXPRESADO EN MILES DE EUROS.<br />
2003 2004 2005 2006 2007 2008 % sobre total Media 1<br />
Francia 4.540,0 6.061,3 5.211,1 7.831,5 6.638,1 8.200,7 42,11 6.276,5<br />
Ho<strong>la</strong>nda 3.087,1 4.878,6 3.753,2 4.445,4 6.934,9 7.220,5 37,08 4.822,7<br />
Bélgica 304,5 2.210,6 1.987,6 1.187,9 1.847,1 1.178,2 6,05 1.229,7<br />
Portugal 347,0 757,2 597,2 454,3 764,9 940,6 4,83 609,6<br />
Reino Unido 140,7 245,4 261,1 129,8 1.686,9 1.673,6 8,59 385,9<br />
Dinamarca 123,0 346,4 352,9 370,3 248,2 156,3 0,8 245,0<br />
OTROS 30,5 48,2 19,9 194,6 118,6 103,2 0,53 80,5<br />
TOTAL 8.572,8 14.547,8 12.183,0 14.614,0 18.238,6 19.473,1 100 14.108,4<br />
Fuente: ADE (Junta <strong>de</strong> Castil<strong>la</strong> y León); 1 : Media <strong>de</strong> los años 2003-2008.<br />
73
6.2 ANÁLISIS DE LAS EXPORTACIONES DE PATATA DE ESPAÑA Y DE CASTILLA Y LEÓN<br />
España exportó, en año 2008, 274.234 tone<strong>la</strong>das <strong>de</strong> patata, y entre enero y septiembre <strong>de</strong>l<br />
año 2009 217.624 t. El principal <strong>de</strong>stino <strong>de</strong> <strong>la</strong>s exportaciones españo<strong>la</strong>s es Portugal, seguido<br />
<strong>de</strong> Alemania, Reino Unido y Ho<strong>la</strong>nda. Portugal es, sobre todo, el <strong>de</strong>stino <strong>de</strong> <strong>la</strong>s exportaciones<br />
<strong>de</strong> patata <strong>de</strong> media estación y tardía proce<strong>de</strong>nte <strong>de</strong> Castil<strong>la</strong> y León. La proximidad <strong>de</strong>l país<br />
luso reduce los costes logísticos, y <strong>la</strong>s necesida<strong>de</strong>s <strong>de</strong> este mercado son asequibles en lo que<br />
respecta a calidad, formatos, especificaciones y varieda<strong>de</strong>s.<br />
La evolución <strong>de</strong> <strong>la</strong>s exportaciones españo<strong>la</strong>s <strong>de</strong> patata se muestra en el gráfico 6.5. Como se<br />
pue<strong>de</strong> observar, globalmente han <strong>de</strong>scendido <strong>de</strong>s<strong>de</strong> 1999 hasta 2008. Des<strong>de</strong> el año 2003 hasta<br />
el 2008 se ha situado entre 250.000 y 275.000 tone<strong>la</strong>das. En esta gráfica queda c<strong>la</strong>ro como el<br />
principal <strong>de</strong>stino <strong>de</strong> <strong>la</strong>s exportaciones es <strong>la</strong> UE, siendo <strong>la</strong>s realizadas a países no<br />
pertenecientes a <strong>la</strong> UE muy limitadas.<br />
GRÁFICO 6.5. EVOLUCIÓN DE LAS EXPORTACIONES DE PATATA EN LOS AÑOS 1999-2008, EXPRESADA EN TONELADAS.<br />
350.000<br />
300.000<br />
250.000<br />
200.000<br />
150.000<br />
100.000<br />
50.000<br />
0<br />
TOTAL<br />
EXTRA UE<br />
INTRA UE<br />
1999 2000 2001 2002 2003 2004 2005 2006 2007 2008<br />
Fuente: E<strong>la</strong>boración propia a partir <strong>de</strong> datos <strong>de</strong> MARM, EUROSTAT y FEPEX.<br />
TABLA 6.8. EXPORTACIONES DE ESPAÑA DE PATATA POR PAÍSES EN LOS AÑOS 2002-2009, EXPRESADAS EN TONELADAS.<br />
2002 2003 2004 2005 2006 2007 2008 2009* 2008%<br />
Portugal 110.334 117.023 95.947 107.927 110.864 106.307 120.932 57.831 44,10<br />
Alemania 29.523 54.264 84.651 57.005 48.651 53.825 54.850 60.510 20,00<br />
Reino Unido 35.724 26.605 34.663 35.232 31.446 28.831 30.584 16.818 11,15<br />
Ho<strong>la</strong>nda 18.459 20.705 17.175 13.070 19.299 16.588 18.700 19.140 6,82<br />
Francia 19.337 12.946 12.725 11.887 10.085 10.807 10.207 12.213 3,72<br />
Dinamarca 2.456 4.583 6.699 5.758 6.764 6.113 8.634 6.806 3,15<br />
Bélgica 5.058* 7.584* 7.815 8.460 8.169 8.456 7.973 7.557 2,91<br />
Polonia 2.925 6.457 884 11.732 7.061 13.112 6.217 12.611 2,27<br />
Italia 1.194 8.396 2.557 1.581 1.617 3.159 3.800 3.350 1,39<br />
Otros 19.342 25.070 8.405 11.683 13.603 17.283 12.337 20.788 4,50<br />
TOTAL 239.294 276.049 271.521 264.335 257.559 264.481 274.234 217.624 100<br />
Fuente: MARM, EUROSTAT y FEPEX. *: Datos <strong>de</strong>s<strong>de</strong> enero hasta septiembre.<br />
74
De todas <strong>la</strong>s exportaciones españo<strong>la</strong>s <strong>de</strong> patata, Portugal recibió en 2008 el 44,1% seguido <strong>de</strong><br />
Alemania (20%) y Reino Unido (11,15%) según se pue<strong>de</strong> ver en <strong>la</strong> tab<strong>la</strong> 6.8. En el gráfico 6.6 se<br />
expone <strong>la</strong> evolución <strong>de</strong> <strong>la</strong>s exportaciones <strong>de</strong> patata españo<strong>la</strong> por países <strong>de</strong>stinatarios <strong>de</strong> <strong>la</strong>s<br />
mismas. Es importante puntualizar que antes <strong>de</strong> <strong>la</strong> entrada <strong>de</strong> España en <strong>la</strong> U.E. el principal<br />
<strong>de</strong>stino <strong>de</strong> <strong>la</strong> patata españo<strong>la</strong> era el Reino Unido, con más <strong>de</strong>l 30% (don<strong>de</strong> se <strong>de</strong>stinaba<br />
principalmente <strong>la</strong> patata temprana <strong>de</strong> Andalucía y Murcia), seguido a distancia por Alemania y<br />
Francia.<br />
GRÁFICO 6.6. EXPORTACIONES DE PATATA DE ESPAÑA POR PAÍSES EN LOS AÑOS 1997-2008, EXPRESADAS EN<br />
TONELADAS.<br />
140000<br />
120000<br />
100000<br />
80000<br />
60000<br />
40000<br />
20000<br />
0<br />
1997<br />
1998<br />
1999<br />
2000<br />
2001<br />
2002<br />
2003<br />
2004<br />
2005<br />
2006<br />
2007<br />
2008<br />
Fuente: E<strong>la</strong>boración propia con datos <strong>de</strong>l MARM y <strong>de</strong> FEPEX.<br />
Portugal<br />
Alemania<br />
R. Unido<br />
Ho<strong>la</strong>nda<br />
Francia<br />
Otros<br />
La evolución <strong>de</strong> <strong>la</strong>s exportaciones españo<strong>la</strong>s <strong>de</strong> patata presenta gran<strong>de</strong>s fluctuaciones, lo que<br />
indica que este sector no ha encontrado un mercado estable. Sin embargo, <strong>la</strong> ten<strong>de</strong>ncia <strong>de</strong> <strong>la</strong>s<br />
exportaciones a partir <strong>de</strong>l año 1999 consolida al mercado <strong>de</strong> Portugal como el principal<br />
referente, en <strong>de</strong>trimento <strong>de</strong> los <strong>de</strong>más <strong>de</strong>stinos tradicionales, siendo Castil<strong>la</strong> y León <strong>la</strong><br />
principal Comunidad abastecedora. Sería muy interesante conocer con <strong>de</strong>talle que rec<strong>la</strong>ma el<br />
mercado luso <strong>de</strong> cara al futuro para no per<strong>de</strong>r esta cuota <strong>de</strong> exportación, y si es posible<br />
incrementar<strong>la</strong>.<br />
Los meses que España más patata exporta son los comprendidos <strong>de</strong> abril a octubre. Esta<br />
exportación tiene sus picos más altos los meses <strong>de</strong> mayo, junio y julio, que se correspon<strong>de</strong>n<br />
con <strong>la</strong> comercialización <strong>de</strong> patata nueva producida en Andalucía y Murcia, cuyo <strong>de</strong>stino es <strong>la</strong><br />
UE (Alemania recibe el grueso <strong>de</strong> <strong>la</strong>s exportaciones españo<strong>la</strong>s en mayo). A partir <strong>de</strong> agostoseptiembre<br />
<strong>la</strong> venta es <strong>de</strong> patata <strong>de</strong> media estación y tardía con <strong>de</strong>stino a Portugal (<strong>la</strong><br />
mayoría <strong>de</strong> <strong>la</strong>s exportaciones a este país se producen <strong>de</strong> agosto a enero). En <strong>la</strong> tab<strong>la</strong> 6.9 se<br />
expone el porcentaje que representa cada mes en <strong>la</strong> exportación <strong>de</strong> patatas <strong>de</strong> España, y en<br />
el gráfico 6.7 se muestran los valores totales por meses expresados en tone<strong>la</strong>das.<br />
75
TABLA 6.9. PORCENTAJE DE EXPORTACIÓN DE PATATA ESPAÑOLA, POR MESES RESPECTO AL TOTAL.<br />
2007% 2008% 2009% 1<br />
Enero 4,27 4,56 4,52<br />
Febrero 3,50 3,24 3,91<br />
Marzo 6,11 5,70 2,37<br />
Abril 5,93 9,56 11,05<br />
Mayo 17,73 17,76 22,33<br />
Junio 22,47 18,49 20,10<br />
Julio 11,02 7,29 14,93<br />
Agosto 3,84 8,97 11,48<br />
Septiembre 6,78 8,89 9,30<br />
Octubre 7,46 8,34<br />
Noviembre 5,94 4,52<br />
Diciembre 4,94 2,67<br />
Fuente: FEPEX; 1 : Datos <strong>de</strong>s<strong>de</strong> enero hasta septiembre.<br />
GRÁFICO 6.7.EXPORTACIONES DE PATATA EN ESPAÑA POR MESES, EN LOS AÑOS 2007-2009, EXPRESADAS EN<br />
TONELADAS.<br />
70.000<br />
60.000<br />
50.000<br />
2007<br />
2008<br />
2009<br />
40.000<br />
30.000<br />
20.000<br />
10.000<br />
0<br />
Ene Feb Mar Abr May Jun Jul Ago Sep Oct Nov Dic<br />
Fuente: FEPEX.<br />
TABLA 6.10. EXPORTACIONES DE PATATA DE ESPAÑA POR CC.AA ENTRE 2007-2009, EXPRESADAS EN TONELADAS.<br />
2007 2008 2009 1 2008% 2<br />
Andalucía 78.508 86.628 87.758 32<br />
Castil<strong>la</strong> y León 79.874 85.015 41.346 31<br />
Baleares 21.081 25.921 21.394 9<br />
Galicia 20.964 25.556 12.879 9<br />
Comunidad Valenciana 28.582 18.461 24.387 7<br />
Murcia 12.255 9.803 8.936 4<br />
Cataluña 7.394 8.752 6.940 3<br />
La Rioja 5.598 6.335 5.953 2<br />
Madrid 2.041 2.853 2.381 1<br />
Castil<strong>la</strong> La Mancha 2.527 2.250 2.442 1<br />
Extremadura 5.234 1.941 1.799 1<br />
Navarra 3 662 36<br />
País Vasco 287 30 1.086<br />
Canarias 106 24 123<br />
Resto 24 2 164<br />
TOTAL 264.478 274.234 217.624<br />
Fuente: FEPEX; 1 : datos <strong>de</strong> enero hasta septiembre. 2 : porcentaje sobre el total.<br />
76
En <strong>la</strong> tab<strong>la</strong> 6.10 figuran <strong>la</strong>s exportaciones españo<strong>la</strong>s en los últimos años divididas por<br />
Comunida<strong>de</strong>s Autónomas. Po<strong>de</strong>mos <strong>de</strong>stacar que <strong>la</strong>s principales comunida<strong>de</strong>s exportadoras<br />
son Andalucía y Castil<strong>la</strong> y León, <strong>de</strong>stacando que <strong>la</strong> primera trabaja con patata temprana y <strong>la</strong><br />
segunda con <strong>la</strong> <strong>de</strong> media estación y tardía.<br />
En <strong>la</strong> tab<strong>la</strong> 6.11 se muestran <strong>la</strong>s provincias españo<strong>la</strong>s que exportaron más <strong>de</strong> 10 mil tone<strong>la</strong>das<br />
en los años 2006 y 2007. Se aprecia que <strong>la</strong> mayor exportadora es Sevil<strong>la</strong>, con un volumen<br />
aproximado <strong>de</strong> 40.000 tone<strong>la</strong>das, siendo Sa<strong>la</strong>manca, con cerca <strong>de</strong> 30.000 tone<strong>la</strong>das <strong>la</strong><br />
siguiente.<br />
TABLA 6.11. PROVINCIAS ESPAÑOLAS QUE MÁS PATATA EXPORTARON EN LOS AÑOS 2006 Y 2007, EXPRESADO EN<br />
TONELADAS.<br />
PROVINCIA 2006 PROVINCIA 2007<br />
Sevil<strong>la</strong> 40.790 Sevil<strong>la</strong> 38.633<br />
Sa<strong>la</strong>manca 29.679 Sa<strong>la</strong>manca 28.714<br />
Cádiz 25.951 Baleares 23.545<br />
Val<strong>la</strong>dolid 18.996 Val<strong>la</strong>dolid 22.149<br />
Baleares 18.764 Cádiz 21.081<br />
Orense 18.037 Orense 20.726<br />
Valencia 13.692 Zamora 20.008<br />
Córdoba 12.435 Valencia 13.202<br />
Zamora 12.015 Murcia 13.133<br />
Murcia 11.868 Barcelona 12.255<br />
León 10.275 León 11.617<br />
Fuente: FEPEX.<br />
Por último, para tener un mayor conocimiento <strong>de</strong> <strong>la</strong> situación exportadora <strong>de</strong> Castil<strong>la</strong> y León,<br />
<strong>la</strong> tab<strong>la</strong> 6.12 muestra <strong>la</strong> situación <strong>de</strong> <strong>la</strong>s provincias <strong>de</strong> esta Comunidad.<br />
Sa<strong>la</strong>manca es <strong>la</strong> principal exportadora con unas 30.000 tone<strong>la</strong>das, luego le siguen Val<strong>la</strong>dolid,<br />
Zamora y León. En el resto <strong>de</strong> provincias los volúmenes que se <strong>de</strong>dican a <strong>la</strong> exportación son<br />
muy limitados. El principal <strong>de</strong>stino <strong>de</strong> estas exportaciones es, como ya se comentó<br />
anteriormente, el mercado portugués.<br />
TABLA 6.12. EXPORTACIÓN DE PATATA EN LAS PROVINCIAS DE CASTILLA Y LEÓN, EXPRESADA EN TONELADAS.<br />
PROVINCIA 2006 PROVINCIA 2007<br />
Sa<strong>la</strong>manca 29.679 Sa<strong>la</strong>manca 28.714<br />
Val<strong>la</strong>dolid 18.996 Val<strong>la</strong>dolid 22.149<br />
Zamora 13.692 Zamora 13.133<br />
León 10.275 León 11.617<br />
Palencia 2.191 Burgos 1.930<br />
Burgos 1.890 Palencia 1.278<br />
Segovia 1.683 Segovia 945<br />
Ávi<strong>la</strong> 49 Ávi<strong>la</strong> 81<br />
Soria Soria 27<br />
Fuente: FEPEX.<br />
77
En términos <strong>de</strong> valor, <strong>la</strong> tab<strong>la</strong> 6.13 muestra <strong>la</strong> re<strong>la</strong>ción en cifras económicas <strong>de</strong> <strong>la</strong>s<br />
exportaciones por países, don<strong>de</strong> Portugal y Alemania son los que más patata compran a<br />
España, ambos con una cuota alre<strong>de</strong>dor <strong>de</strong>l 26%. En términos <strong>de</strong> volumen en tone<strong>la</strong>das<br />
Portugal dob<strong>la</strong> a Alemania, <strong>de</strong>bido a que <strong>la</strong> patata que va al país germano es temprana, cuyo<br />
valor económico es mayor que <strong>la</strong> tardía y <strong>de</strong> media estación. A<strong>de</strong>más <strong>de</strong> estos dos países,<br />
Reino Unido y Ho<strong>la</strong>nda son <strong>de</strong>stacables. Los datos mostrados para 2009 correspon<strong>de</strong>n al<br />
periodo enero-septiembre, y al compararlos con este mismo intervalo en 2008, nos<br />
encontramos con que <strong>la</strong>s exportaciones en el 2009 han disminuido en un 16%,<br />
fundamentalmente por <strong>la</strong> ma<strong>la</strong> situación que ha vivido <strong>la</strong> patata temprana en España, don<strong>de</strong><br />
se calcu<strong>la</strong> que, aproximadamente, el 15% <strong>de</strong> <strong>la</strong> producción se ha quedado en <strong>la</strong> tierra por los<br />
bajos precios existentes o percibidos por el sector productor.<br />
TABLA 6.13. EXPORTACIONES DE PATATA EN ESPAÑA POR PAÍSES EN LOS AÑOS 2007-2009, EXPRESADAS EN MILLONES<br />
DE EUROS.<br />
2007 2008 2009* 2008%<br />
Portugal 23,59 25,70 12,97 26,65<br />
Alemania 19,32 25,60 24,41 26,54<br />
R. Unido 12,50 14,14 6,44 14,66<br />
Ho<strong>la</strong>nda 6,98 9,68 7,41 10,04<br />
Francia 4,36 4,67 3,29 4,84<br />
Bélgica 3,22 4,40 2,85 4,57<br />
Dinamarca 3,09 4,34 3,25 4,50<br />
Polonia 4,93 2,29 4,05 2,38<br />
R. Checa 1,37 1,06 2,22 1,10<br />
OTROS 3,46 2,21 2,81 2,29<br />
TOTAL UE-27 82,83 94,09 69,71 97,55<br />
EXTRE UE 2,71 2,36 2,20 2,45<br />
TOTAL 85,55 96,45 71,90<br />
Fuente: MARM y FEPEX; *: Datos <strong>de</strong>s<strong>de</strong> enero hasta septiembre.<br />
TABLA 6.14. EXPORTACIONES DE PATATA EN ESPAÑA POR MESES EN LOS AÑOS 2007-2009, EXPRESADAS EN MILLONES<br />
DE EUROS.<br />
2007 2008 2009* 2008%<br />
Enero 3,20 2,28 2,26 2,36<br />
Febrero 3,23 1,91 2,09 1,98<br />
Marzo 6,66 5,10 2,05 5,29<br />
Abril 7,16 9,63 7,93 9,98<br />
Mayo 18,39 21,52 18,84 22,31<br />
Junio 23,58 25,06 15,39 25,98<br />
Julio 8,86 7,54 12,03 7,82<br />
Agosto 2,13 7,65 8,22 7,93<br />
Septiembre 3,77 5,28 3,09 5,47<br />
Octubre 3,16 5,08 5,27<br />
Noviembre 2,42 2,51 2,60<br />
Diciembre 2,99 2,91 3,01<br />
TOTAL 85,55 96,45 71,90<br />
Fuente: MARM y FEPEX; *: Datos <strong>de</strong>s<strong>de</strong> enero hasta septiembre.<br />
78
En <strong>la</strong> tab<strong>la</strong> 6.14 se exponen <strong>la</strong>s cantida<strong>de</strong>s económicas <strong>de</strong> <strong>la</strong>s exportaciones <strong>de</strong> patata<br />
divididas en este caso por meses. Es evi<strong>de</strong>nte que España realiza más <strong>de</strong> <strong>la</strong> mitad <strong>de</strong> sus<br />
ventas entre abril, mayo y junio. Otro dato que también pue<strong>de</strong> ser interesante es que al<br />
comparar el periodo enero-septiembre, se observa que <strong>la</strong>s ventas al exterior en 2009 han sido<br />
menores que en 2007 y 2008 (6,6% y 16,3% menos, respectivamente). Es importante <strong>de</strong>tal<strong>la</strong>r<br />
el bajón ocurrido en junio <strong>de</strong> 2009, por <strong>la</strong>s causas <strong>de</strong>scritas anteriormente, y que ha afectado<br />
muy negativamente a <strong>la</strong> campaña <strong>de</strong> patata temprana en España. En agosto <strong>de</strong> 2009 <strong>la</strong>s<br />
exportaciones aumentaron, lo cual afecta directamente a <strong>la</strong> patata <strong>de</strong> Castil<strong>la</strong> y León.<br />
Los datos referentes a <strong>la</strong> división <strong>de</strong> <strong>la</strong>s exportaciones por Comunida<strong>de</strong>s Autónomas en euros<br />
se muestran en <strong>la</strong> tab<strong>la</strong> 6.15. Aquí <strong>de</strong>staca Andalucía, que representa el<strong>la</strong> so<strong>la</strong> <strong>la</strong> mitad <strong>de</strong> <strong>la</strong><br />
cantidad percibida por España <strong>de</strong> <strong>la</strong>s exportaciones. Castil<strong>la</strong> y León ocupa el segundo puesto,<br />
aunque es importante recordar que <strong>la</strong> cantidad en tone<strong>la</strong>das que vendía al exterior era<br />
prácticamente igual a <strong>la</strong> <strong>de</strong> Andalucía, <strong>de</strong> lo que se <strong>de</strong>duce que <strong>la</strong> patata <strong>de</strong> esta última<br />
comunidad tiene, al menos, el doble <strong>de</strong> valor que <strong>la</strong> castel<strong>la</strong>no y leonesa. Esto es normal ya<br />
que <strong>la</strong> producción en el sur <strong>de</strong> España coinci<strong>de</strong> con una época don<strong>de</strong> no hay una gran oferta,<br />
por lo que el producto tiene más valor.<br />
TABLA 6.15. EXPORTACIONES DE PATATA EN ESPAÑA POR CC.AA EN LOS AÑOS 2007-2009, EXPRESADAS EN EUROS.<br />
2007 2008 2009* 2008%<br />
Andalucía 30.527.751 42.038.618 35.425.925 43,59<br />
Castil<strong>la</strong> y León 16.395.774 18.568.916 9.343.033 19,25<br />
Baleares 10.586.433 12.771.100 9.196.733 13,24<br />
C. Valenciana 10.311.321 7.165.545 7.588.861 7,43<br />
Galicia 5.236.898 4.932.556 2.572.008 5,11<br />
Murcia 4.411.104 3.936.948 2.350.320 4,08<br />
Cataluña 2.917.312 2.653.612 1.651.146 2,75<br />
La Rioja 1.760.403 1.212.377 1.517.419 1,26<br />
Madrid 1.121.038 905.482 723.734 0,94<br />
C. La Mancha 950.933 901.866 711.777 0,94<br />
Extremadura 1.139.635 769.954 624.494 0,80<br />
Navarra 6.892 564.500 19.179 0,59<br />
Canarias 32.988 13.117 41.045 0,01<br />
País Vasco 133.984 12.605 115.826 0,01<br />
Aragón 830 1.208<br />
Asturias 42 471 112<br />
Resto 12.638 41 19.411<br />
TOTAL 85.545.146 96.448.538 71.902.231<br />
Fuente: FEPEX; *: Datos <strong>de</strong>s<strong>de</strong> enero hasta septiembre.<br />
En <strong>la</strong> tab<strong>la</strong> 6.16 se muestran <strong>la</strong>s exportaciones <strong>de</strong> patata en Castil<strong>la</strong> y León en los años 2006 y<br />
2007. Sa<strong>la</strong>manca, Val<strong>la</strong>dolid, Zamora y León, por este or<strong>de</strong>n, son <strong>la</strong>s provincias <strong>de</strong> <strong>la</strong> región<br />
que mayores cantida<strong>de</strong>s reciben por <strong>la</strong> exportación <strong>de</strong> este tubérculo. Es importante <strong>de</strong>stacar<br />
que en el año 2007 <strong>la</strong> exportación <strong>de</strong> patata estuvo incluida en el ranking <strong>de</strong> los 25 productos<br />
79
con mayor valor en <strong>la</strong>s provincias <strong>de</strong> Sa<strong>la</strong>manca (posición 13) y Zamora (posición 8), indicando<br />
<strong>la</strong> gran importancia que tiene este producto en <strong>la</strong> economía <strong>de</strong> estas dos provincias.<br />
TABLA 6.16. EXPORTACIONES DE PATATA EN CASTILLA Y LEÓN, EXPRESADAS EN EUROS.<br />
PROVINCIAS 2006 PROVINCIAS 2007<br />
Sa<strong>la</strong>manca 6.418.468 Sa<strong>la</strong>manca 4.918.665<br />
Val<strong>la</strong>dolid 4.204.003 Val<strong>la</strong>dolid 4.777.494<br />
Zamora 3.360.288 Zamora 3.224.926<br />
León 2.067.760 León 2.341.250<br />
Palencia 487.539 Burgos 726.089<br />
Segovia 420.492 Palencia 215.099<br />
Burgos 371.915 Segovia 150.857<br />
Ávi<strong>la</strong> 7.168 Soria 26.941<br />
Soria Ávi<strong>la</strong> 14.453<br />
Fuente: FEPEX.<br />
Por último, en <strong>la</strong> tab<strong>la</strong> 6.17 se expone el valor <strong>de</strong> <strong>la</strong>s exportaciones en Castil<strong>la</strong> y León.<br />
Se observa como más <strong>de</strong>l 93% <strong>de</strong> <strong>la</strong> cantidad recibida por <strong>la</strong> exportación <strong>de</strong> este producto en<br />
2008 fue pagada por Portugal, apreciándose un incremento en el valor <strong>de</strong> estas exportaciones<br />
en los últimos seis años, existiendo una ten<strong>de</strong>ncia <strong>de</strong> consolidación en este país como <strong>de</strong>stino<br />
principal <strong>de</strong> <strong>la</strong> producción exportada <strong>de</strong> Castil<strong>la</strong> y León. Al país luso le sigue Andorra con<br />
2,67%, y el resto <strong>de</strong> países <strong>de</strong> <strong>de</strong>stino tienen unas cuotas muy discretas.<br />
TABLA 6.17. VALOR DE LAS EXPORTACIONES DE PATATA REALIZADAS EN CASTILLA Y LEÓN EN LOS AÑOS 2003 - 2008,<br />
EXPRESADO EN MILES DE EUROS.<br />
2003 2004 2005 2006 2007 2008 2008% Media 1<br />
Portugal 7440,33 7427,03 8752,68 16119,27 14687,01 17370,89 93,55 11.214,4<br />
Andorra 683,04 69,7 154,22 656,5 223,96 495,28 2,67 284,9<br />
Ho<strong>la</strong>nda 0 0 0 0 670,5 0 111,8<br />
Dinamarca 50,02 0 79,11 322,94 56 115,46 0,62 103,9<br />
Grecia 0 2,78 5,36 77,02 322,86 18,37 0,1 71,1<br />
Bélgica 42,24 12,24 324,45 162,36 26,16 148,96 0,8 68,8<br />
Eslovenia 0 0 0 86,98 196,73 72,7 0,39 59,4<br />
Argelia 0 0 1,35 88,9 77,86 149,05 0,8 52,9<br />
Eslovaquia 0 0 0 42,05 52,49 109,98 0,59 34,1<br />
Francia 42,2 0 3,71 6,13 7,58 69,86 0,38 21,6<br />
Alemania 0 0 0 17,87 104,3 0 20,4<br />
Senegal 13,01 6 0 0 0 0 3,2<br />
Italia 0 0 0 0 0 17,88 0,1 3,0<br />
Rep. Checa 0 0 4,55 0 0 0 0,8<br />
Méjico 0,03 0,61 0,73 0,43 0,93 0,47 0 0,4<br />
Reino Unido 0 0 0 0 0,15 0 0,0<br />
TOTAL 8270,87 7518,36 9326,16 17580,47 16426,52 18568,92 12.081,6<br />
Fuente: ADE (Junta <strong>de</strong> Castil<strong>la</strong> y León); 1: Media <strong>de</strong> los años 2003-2008.<br />
80
6.3 COMPARACIÓN DE LAS IMPORTACIONES Y EXPORTACIONES DE PATATA DE ESPAÑA Y<br />
DE CASTILLA Y LEÓN<br />
El gráfico 6.8 muestra que a partir <strong>de</strong> mediados <strong>de</strong> mayo España se convierte en exportador<br />
neto <strong>de</strong> patatas y este hecho llega hasta principios <strong>de</strong> julio, estando durante ese mes en<br />
equilibrio entre exportaciones e importaciones. Ya en septiembre empiezan a llegar<br />
producciones <strong>de</strong> países <strong>de</strong> <strong>la</strong> UE a <strong>de</strong>terminadas regiones don<strong>de</strong> <strong>de</strong>staca Cataluña, sobretodo<br />
<strong>de</strong> Francia, <strong>de</strong>sviándose <strong>la</strong> ba<strong>la</strong>nza <strong>de</strong> comercial hacia <strong>la</strong>s importaciones, hasta alcanzar su<br />
punto más alto en diciembre.<br />
GRÁFICO 6.8. EVOLUCIÓN MENSUAL DE LAS EXPORTACIONES E IMPORTACIONES ESPAÑOLAS DE PATATA EN 2008,<br />
EXPRESADA EN TONELADAS.<br />
120.000<br />
100.000<br />
80.000<br />
Exportaciones<br />
Importaciones<br />
60.000<br />
40.000<br />
20.000<br />
0<br />
ENE FEB MAR ABR MAY JUN JUL AGO SEP OCT NOV DIC<br />
Fuente: FEPEX.<br />
Las importaciones <strong>de</strong> patata tienen lugar principalmente <strong>de</strong>s<strong>de</strong> octubre hasta mayo, a partir<br />
<strong>de</strong> entonces, con el comienzo <strong>de</strong> <strong>la</strong> campaña <strong>de</strong> patata nueva se producen como se ha<br />
comentado anteriormente, los mayores volúmenes <strong>de</strong> <strong>la</strong>s exportaciones españo<strong>la</strong>s; que se<br />
realizan cuando existe déficit en <strong>la</strong> UE, convirtiéndose España en un exportador neto. Esta<br />
situación se mantiene hasta el mes <strong>de</strong> septiembre, momento en que repunta <strong>de</strong> nuevo <strong>la</strong><br />
importación.<br />
Si analizamos <strong>la</strong> evolución <strong>de</strong> <strong>la</strong> ba<strong>la</strong>nza <strong>de</strong> comercio exterior mensualmente en los tres<br />
últimos años se constata que España pasa <strong>de</strong> ser exportadora neta a importadora neta cada<br />
vez antes. Este factor indica que los principales países proveedores <strong>de</strong> España <strong>de</strong> patata<br />
(sobretodo Francia) están intentando cerrar su ciclo <strong>de</strong> comercialización, llegando a ven<strong>de</strong>r<br />
en meses que antes no lo hacían, cubriendo casi todo el año.<br />
El gráfico 6.9 expone los valores económicos que representa el comercio exterior <strong>de</strong> patata<br />
en España, observando que so<strong>la</strong>mente recibe más dinero <strong>de</strong>l que gasta en <strong>la</strong> compra <strong>de</strong> este<br />
81
tubérculo en los meses <strong>de</strong> mayo, junio, julio y agosto. Aquí también queda patente lo<br />
<strong>de</strong>scrito anteriormente acerca <strong>de</strong>l valor que supone <strong>la</strong> patata temprana para nuestro país.<br />
GRÁFICO 6.9. EVOLUCIÓN MENSUAL DE LAS EXPORTACIONES E IMPORTACIONES ESPAÑOLAS DE PATATA EN 2008,<br />
EXPRESADA EN MILES DE EUROS.<br />
30.000<br />
25.000<br />
Exportaciones<br />
Importaciones<br />
20.000<br />
15.000<br />
10.000<br />
5.000<br />
0<br />
ENE FEB MAR ABR MAY JUN JUL AGO SEP OCT NOV DIC<br />
Fuente: FEPEX.<br />
La información correspondiente a Castil<strong>la</strong> y León para el año 2008 se muestra en el gráfico<br />
6.10. Aquí es palpable que los meses don<strong>de</strong> <strong>la</strong> región compra más patata <strong>de</strong> <strong>la</strong> que ven<strong>de</strong> son<br />
abril, mayo, junio y julio, registrándose en este último periodo el pico más alto <strong>de</strong> compras.<br />
Estas operaciones se refieren a patata nueva proveniente <strong>de</strong>l sur y el levante <strong>de</strong> España. En<br />
los meses <strong>de</strong> diciembre y febrero los volúmenes importados y exportados son simi<strong>la</strong>res,<br />
mientras que en agosto, septiembre, octubre, noviembre y diciembre <strong>la</strong>s ventas superan a <strong>la</strong>s<br />
compras, estando los principales picos <strong>de</strong> exportación en septiembre y octubre.<br />
GRÁFICO 6.10. EVOLUCIÓN MENSUAL DE LAS EXPORTACIONES E IMPORTACIONES DE CASTILLA Y LEÓN DE PATATA EN<br />
2008, EXPRESADA EN TONELADAS.<br />
20.000<br />
18.000<br />
16.000<br />
14.000<br />
12.000<br />
10.000<br />
8.000<br />
6.000<br />
4.000<br />
2.000<br />
0<br />
Exportaciones<br />
Importaciones<br />
Ene Feb Mar Abr May Jun Jul Ago Sep Oct Nov Dic<br />
Fuente: e<strong>la</strong>boración propia a partir <strong>de</strong> datos <strong>de</strong> DATACOMEX.<br />
82
La información anterior sobre Castil<strong>la</strong> y León traducida a términos económicos se ilustra en el<br />
gráfico 6.11. Aquí se muestra como <strong>la</strong> forma <strong>de</strong> <strong>la</strong> gráfica <strong>de</strong> <strong>la</strong>s exportaciones en valor, es<br />
muy simi<strong>la</strong>r a <strong>la</strong> <strong>de</strong> <strong>la</strong> producción en tone<strong>la</strong>das, con <strong>la</strong> salvedad <strong>de</strong> que en diciembre parece<br />
que hubo un aumento en el precio <strong>de</strong> <strong>la</strong> materia prima. Los datos <strong>de</strong> <strong>la</strong>s importaciones<br />
muestran que Castil<strong>la</strong> y León pagó por <strong>la</strong> patata más <strong>de</strong> lo que percibió por sus ventas en los<br />
meses comprendidos <strong>de</strong>s<strong>de</strong> febrero hasta julio.<br />
Asimismo parece que en mayo y en junio hubo una disminución <strong>de</strong>l valor <strong>de</strong> <strong>la</strong>s compras no<br />
acompañado por los volúmenes en tone<strong>la</strong>das compradas, <strong>de</strong> lo que se pue<strong>de</strong> <strong>de</strong>ducir que en<br />
esos meses los productores <strong>de</strong> patata nueva <strong>de</strong>l sur y levante español querían ven<strong>de</strong>r este<br />
producto por <strong>la</strong> situación vivida y originó una importante reducción <strong>de</strong> los precios en origen.<br />
GRÁFICO 6.11. EVOLUCIÓN MENSUAL DE LAS EXPORTACIONES E IMPORTACIONES DE CASTILLA Y LEÓN DE PATATA EN<br />
2008, EXPRESADA EN MILES DE EUROS.<br />
4.000<br />
3.500<br />
3.000<br />
2.500<br />
2.000<br />
1.500<br />
1.000<br />
500<br />
0<br />
Exportaciones<br />
Importaciones<br />
Ene Feb Mar Abr May Jun Jul Ago Sep Oct Nov Dic<br />
Fuente: e<strong>la</strong>boración propia a partir <strong>de</strong> datos <strong>de</strong> DATACOMEX.<br />
83
CONCLUSIONES<br />
o<br />
o<br />
o<br />
o<br />
o<br />
o<br />
o<br />
o<br />
o<br />
o<br />
Las importaciones <strong>de</strong> patata a España se mantienen estables <strong>de</strong>s<strong>de</strong> 2003, osci<strong>la</strong>ndo<br />
entre <strong>la</strong>s 700.000 t y <strong>la</strong>s 800.000 t.<br />
El comercio extracomunitario <strong>de</strong> patatas es muy poco relevante en comparación con<br />
el intracomunitario.<br />
Francia es el gran abastecedor (70%) <strong>de</strong>l volumen importado por España con ten<strong>de</strong>ncia<br />
al alza. Le siguen Reino Unido (10%) y Ho<strong>la</strong>nda (9%). Ho<strong>la</strong>nda supone el 18% <strong>de</strong> los<br />
pagos, pues se trata <strong>de</strong> importaciones <strong>de</strong> patata <strong>de</strong> siembra, que tienen mayor valor<br />
que <strong>la</strong> patata <strong>de</strong> consumo.<br />
Las importaciones <strong>de</strong> patata francesa van en <strong>de</strong>trimento <strong>de</strong> <strong>la</strong> producción españo<strong>la</strong>, y<br />
más en concreto <strong>de</strong> <strong>la</strong> <strong>de</strong> Castil<strong>la</strong> y León; ya que restan cuota <strong>de</strong> mercado a <strong>la</strong> patata<br />
<strong>de</strong> conservación.<br />
En cuanto a <strong>la</strong>s importaciones <strong>de</strong> terceros países, los orígenes más importantes <strong>de</strong> <strong>la</strong>s<br />
mismas son Marruecos, Israel y Egipto. Los meses más representativos son <strong>de</strong>s<strong>de</strong><br />
noviembre a mayo con patata temprana.<br />
Las exportaciones han sido estables en los últimos 10 años, osci<strong>la</strong>ndo entre 250.000 t<br />
y 300.000 t.<br />
Los <strong>de</strong>stinos más importantes son Portugal (44% <strong>de</strong>l volumen exportado), Alemania<br />
(20%) y Reino Unido (11%). A pesar <strong>de</strong> todo, el valor <strong>de</strong> <strong>la</strong>s transferencias <strong>de</strong> Alemania<br />
y Portugal es simi<strong>la</strong>r, pues Alemania adquiere patata temprana que suele tener más<br />
precio que <strong>la</strong> <strong>de</strong> media estación o tardía que compra Portugal.<br />
Castil<strong>la</strong> y León y Andalucía representan cada una el 30% <strong>de</strong>l volumen total <strong>de</strong> patata<br />
exportada, aunque en valor Andalucía recibe el 40% <strong>de</strong>l total y Castil<strong>la</strong> y León no llega<br />
al 20% <strong>de</strong>l total <strong>de</strong> valor <strong>de</strong> <strong>la</strong>s exportaciones españo<strong>la</strong>s <strong>de</strong> patata.<br />
Sa<strong>la</strong>manca exporta unas 30.000 t <strong>de</strong> patata a Portugal cada año, siendo <strong>la</strong> segunda<br />
provincia que más exporta <strong>de</strong> toda España <strong>de</strong>trás <strong>de</strong> Sevil<strong>la</strong>.<br />
Analizando el ba<strong>la</strong>nce <strong>de</strong> comercio exterior <strong>de</strong> patata, se comprueba que año tras<br />
año, España pasa <strong>de</strong> ser exportadora neta a importadora neta cada vez antes, lo que<br />
indica que los proveedores extranjeros, están cerrando su ciclo <strong>de</strong> comercialización,<br />
en <strong>de</strong>trimento <strong>de</strong> <strong>la</strong> patata nacional.<br />
84
7 ESTIMACIÓN DE LOS COSTES DE PRODUCCIÓN DE PATATA EN CASTILLA Y<br />
LEÓN Y VIABILIDAD DEL ALMACENAMIENTO<br />
Uno <strong>de</strong> los principales problemas que presenta el sector <strong>de</strong> <strong>la</strong> patata es que, <strong>de</strong>bido a que <strong>la</strong><br />
oferta y <strong>la</strong> <strong>de</strong>manda no están regu<strong>la</strong>das, existe un importante grado especu<strong>la</strong>tivo. Nos<br />
encontramos años muy dispares en los precios en origen percibidos por los cultivadores.<br />
7.1 ESTIMACIÓN DE COSTES<br />
A continuación se <strong>de</strong>scribe un estudio <strong>de</strong> costes <strong>de</strong> producción, realizado para <strong>la</strong> presente<br />
campaña, don<strong>de</strong> se pue<strong>de</strong>n visualizar los porcentajes <strong>de</strong> reparto <strong>de</strong> gastos para el cultivador<br />
<strong>de</strong> patatas. Estos costes están calcu<strong>la</strong>dos para una producción contro<strong>la</strong>da y certificada <strong>de</strong><br />
patata <strong>de</strong> calidad, con un rendimiento medio <strong>de</strong> 45 t/ha. A partir <strong>de</strong> este escandallo se<br />
pue<strong>de</strong>n sacar costes por kilogramo <strong>de</strong> patata cosechada que permitan obtener conclusiones<br />
sobre <strong>la</strong> rentabilidad <strong>de</strong> <strong>la</strong> producción <strong>de</strong> patata. La estimación realizada sobre los costes <strong>de</strong><br />
producción es <strong>la</strong> siguiente:<br />
€/ha %<br />
1. Selección <strong>de</strong> <strong>la</strong> parce<strong>la</strong> (incluyendo analítica <strong>de</strong> suelo) 30 0,62%<br />
2. Preparación <strong>de</strong>l terreno incluyendo <strong>la</strong>s <strong>la</strong>bores <strong>de</strong> siembra 400 8,29%<br />
3. Siembra (semil<strong>la</strong> certificada calibre 28/35 mm) 1.100 22,79%<br />
4. Tratamiento patata <strong>de</strong> siembra y suelo 65 1,35%<br />
5. Fitotecnia <strong>de</strong>l cultivo<br />
5.1. Fertilización (Fondo + Cobertera + Correctores) 910 18,86%<br />
5.2. Riegos (30 riegos que equivalen a 650 L/m²) 680 14,09%<br />
5.3. Tratamientos fitosanitarios 350 7,25%<br />
6. Recolección mecánica (incluyendo personal <strong>de</strong> cosechadora) 950 19,69%<br />
TOTAL COSTES VARIABLES 4.485 92,93%<br />
7. Gastos <strong>de</strong> personal y seguridad social 160 3,32%<br />
8. Amortizaciones 15 0,31%<br />
9. Seguros 48 0,99%<br />
10. Tributo contribución rústica 12 0,25%<br />
11. Auditorias y certificaciones 106 2,20%<br />
12. Coste <strong>de</strong> Oportunidad y/o renta<br />
TOTAL COSTES FIJOS 341 7,07%<br />
TOTAL COSTES DE PRODUCCIÓN 4.826 100%<br />
El rendimiento en condiciones normales <strong>de</strong>bería ser superior a <strong>la</strong>s 45 t/ha, con lo cual bajaría<br />
el coste por kilogramo.<br />
Estos costes <strong>de</strong> producción han sido calcu<strong>la</strong>dos a nivel general <strong>de</strong> Castil<strong>la</strong> y León, aunque es<br />
evi<strong>de</strong>nte que para <strong>la</strong> producción <strong>de</strong> patata <strong>de</strong> media estación son menores, ya que es un ciclo<br />
más corto y con menores necesida<strong>de</strong>s <strong>de</strong> riego.<br />
85
Estos cálculos se han realizado <strong>de</strong> manera in<strong>de</strong>pendiente a los <strong>de</strong>c<strong>la</strong>rados por los productores<br />
en <strong>la</strong>s encuestas incorporadas al presente <strong>P<strong>la</strong>n</strong> Estratégico. No obstante, se observa que para<br />
un rendimiento <strong>de</strong> 36,32 t/ha el coste <strong>de</strong>c<strong>la</strong>rado es <strong>de</strong> 4.151 €; esto nos da un coste <strong>de</strong><br />
0,11328 €/kg, que está en sintonía con lo obtenido en <strong>la</strong> anterior estimación.<br />
También esta información es <strong>de</strong>pendiente <strong>de</strong> <strong>la</strong> comarca don<strong>de</strong> se cultive. El principal gasto<br />
que tienen que afrontar los agricultores es <strong>la</strong> semil<strong>la</strong>, seguido <strong>de</strong> <strong>la</strong> recolección mecánica, los<br />
riegos, <strong>la</strong> fertilización y los tratamientos fitosanitarios.<br />
Si <strong>la</strong> producción fuera <strong>de</strong> patata común (no <strong>de</strong> calidad) los costes por hectárea disminuirían y<br />
los rendimientos por hectárea subirían, con lo que el coste por kilogramo sería menor.<br />
Los costes <strong>de</strong> producción <strong>de</strong> <strong>la</strong> campaña 2009 se han visto incrementados con respecto a los<br />
<strong>de</strong> 2008, fundamentalmente por el aumento en el coste <strong>de</strong> abonos y fitosanitarios (+370<br />
€/ha), <strong>de</strong> <strong>la</strong> semil<strong>la</strong> (+345 €/ha) y <strong>de</strong> <strong>la</strong> recolección <strong>de</strong> <strong>la</strong> cosecha (+270 €/ha). Todos ellos, a<br />
excepción <strong>de</strong> <strong>la</strong> semil<strong>la</strong>, están sujetos a lo que dicta el mercado <strong>de</strong> productos agroquímicos y<br />
energéticos. El caso <strong>de</strong> <strong>la</strong> semil<strong>la</strong> es diferente, ya que si se potenciara <strong>la</strong> producción <strong>de</strong><br />
semil<strong>la</strong> <strong>de</strong> Castil<strong>la</strong> y León, ésta sería más barata pudiendo situarse entre 0,72 – 0,84 €/Kg.<br />
(<strong>de</strong>pendiendo <strong>de</strong> <strong>la</strong>s varieda<strong>de</strong>s) en vez <strong>de</strong> 1 – 1,3 €/ha <strong>de</strong> <strong>la</strong> importada, lo que podría<br />
representar un ahorro para el agricultor <strong>de</strong> unas cantida<strong>de</strong>s comprendidas entre 160 y 580<br />
€/ha, en función <strong>de</strong> varieda<strong>de</strong>s, y consi<strong>de</strong>rando un calibre <strong>de</strong> 28/35 mm. La parte<br />
correspondiente a <strong>la</strong> producción y problemática <strong>de</strong> <strong>la</strong> patata <strong>de</strong> siembra está tratada en otro<br />
capítulo por lo que será allí don<strong>de</strong> se haga una discusión más <strong>de</strong>tal<strong>la</strong>da <strong>de</strong> esta cuestión.<br />
Como se ha reflejado en <strong>la</strong> tab<strong>la</strong> anterior, consi<strong>de</strong>rando una producción <strong>de</strong> 45 t/ha <strong>de</strong> patata<br />
<strong>de</strong> calidad certificada nos encontramos con que el precio mínimo necesario para cubrir los<br />
costes <strong>de</strong> producción se situaría en unos 0,11€ por kg.<br />
7.2 VIABILIDAD DEL ALMACENAMIENTO<br />
A continuación se va exponer <strong>la</strong> comparación <strong>de</strong> los precios <strong>de</strong> <strong>la</strong> patata importada <strong>de</strong> Francia<br />
en diferentes meses, y esta información se va a contrastar con lo que costaría almacenar<strong>la</strong> en<br />
Castil<strong>la</strong> y León para reflejar <strong>de</strong> este modo si es rentable conservar patata <strong>de</strong> calidad en<br />
Castil<strong>la</strong> y León. En <strong>la</strong> tab<strong>la</strong> 7.1 se muestra una estimación <strong>de</strong> los precios que los envasadores<br />
en fresco han pagando por traer patatas <strong>de</strong> Francia en los últimos años.<br />
Los costes logísticos se han estimado en 57€/t, resultado <strong>de</strong> los 1.300 € que cobra una<br />
empresa <strong>de</strong> transportes por traer un camión <strong>de</strong> 22,5 t con mercancía <strong>de</strong>s<strong>de</strong> el norte <strong>de</strong><br />
Francia hasta Castil<strong>la</strong> y León.<br />
86
TABLA 7.1. PRECIOS DE PATATA IMPORTADA PARA CONSUMO EN FRESCO EN LOS ÚLTIMOS AÑOS EXPRESADO EN €/t.<br />
AÑO VARIEDAD Enero Febrero Marzo Abril Diciembre<br />
2005<br />
2006<br />
2007<br />
Ágata 150 150 160 190<br />
Monalisa 150 140 150 150<br />
Ágata 180 190 190 190 340<br />
Monalisa 190 190 190 190 310<br />
Ágata 330 330 300 170<br />
Monalisa 310 310 280 180<br />
2008<br />
Ágata 170 160 130 100 120<br />
Monalisa 180 170 150 120 140<br />
2009<br />
Ágata 170 160 140 140<br />
Monalisa 170 170 160 140<br />
Valor medio por mes (€/t) 200 197 185 152,5 210<br />
Coste transporte medio (€/t) 57 57 57 57 57<br />
Precio patata en <strong>de</strong>stino (€/t) 257 254 242 209,5 267<br />
Fuente: E<strong>la</strong>boración a partir <strong>de</strong> datos propios y <strong>de</strong> <strong>la</strong> Encuesta a operadores 2009. Junta <strong>de</strong> Castil<strong>la</strong> y León<br />
Si consi<strong>de</strong>ramos que en Castil<strong>la</strong> y León, <strong>de</strong> media, un agricultor que reciba 110 € por tone<strong>la</strong>da<br />
está cubriendo sus costes <strong>de</strong> producción, y que los costes <strong>de</strong> almacenamiento pue<strong>de</strong>n<br />
estimarse en unos 15 €/t por mes, nos encontramos con que se cubrirían los costes <strong>de</strong><br />
producción y almacenamiento con <strong>la</strong>s cifras que se dan en <strong>la</strong> tab<strong>la</strong> 7.2.<br />
TABLA 7.2. COSTES CONJUNTOS DE PRODUCCIÓN Y ALMACENAJE EN €/t, DE PATATA PRODUCIDA EN CASTILLA Y LEÓN<br />
FRENTE AL PRECIO MEDIO DE PATATA IMPORTADA DE FRANCIA (*).<br />
EUROS/TONELADA Diciembre Enero Febrero Marzo Abril<br />
Costes <strong>de</strong> producción 110 110 110 110 110<br />
Costes <strong>de</strong> conservación 30 1 45 60 75 90<br />
Coste transporte medio 20 20 20 20 20<br />
Coste producto en origen 160 175 190 205 220<br />
Precio patata Francesa en<br />
<strong>de</strong>stino<br />
267 257 254 242 209,5<br />
Beneficio Agricultor<br />
(Diferencia con Francia)<br />
107 82 64 37 - 10,5<br />
1 : Incluye los costes <strong>de</strong> almacenaje <strong>de</strong> Octubre y Noviembre.<br />
(*) Estudio Orientativo.<br />
Como se pue<strong>de</strong> observar en <strong>la</strong> tab<strong>la</strong> 7.2, almacenar patata en Castil<strong>la</strong> y León sería rentable<br />
en todos los meses indicados, con márgenes <strong>de</strong> ganancia que estarían entre 97 y 4,5 €/t<br />
<strong>de</strong>pendiendo <strong>de</strong>l mes que se consi<strong>de</strong>re.<br />
De este modo, queda patente que <strong>la</strong> realización <strong>de</strong> estos almacenamientos en origen, o sea<br />
en Castil<strong>la</strong> y León en este caso, sería beneficioso tanto para el envasador como para el<br />
productor, siempre y cuando se almacene una patata <strong>de</strong> calidad, en a<strong>de</strong>cuadas estructuras <strong>de</strong><br />
almacenamiento, y siguiendo unas pautas que permitan un óptimo almacenamiento <strong>de</strong> este<br />
tubérculo.<br />
87
CONCLUSIONES<br />
o Los costes <strong>de</strong> producción <strong>de</strong> patata en una explotación media se sitúan en unos 110<br />
€/t.<br />
o Los costes <strong>de</strong> conservación medios en Castil<strong>la</strong> y León se sitúan en 15 €/t y mes.<br />
o Si se consi<strong>de</strong>ra el precio pagado en origen más los costes logísticos <strong>de</strong> <strong>la</strong> patata<br />
francesa, que es <strong>la</strong> que se importa a España <strong>de</strong> manera mayoritaria, <strong>la</strong>s producciones<br />
<strong>de</strong> Castil<strong>la</strong> y León son competitivas. Lo necesario es producir el mismo tipo <strong>de</strong><br />
producto que el importado <strong>de</strong> Francia y tener capacidad <strong>de</strong> suministrarlo a lo <strong>la</strong>rgo <strong>de</strong><br />
toda <strong>la</strong> campaña.<br />
o Por tanto, el almacenamiento es beneficioso para el productor y para el operador,<br />
siempre que se almacene patata <strong>de</strong> calidad en infraestructuras a<strong>de</strong>cuadas y con<br />
pautas <strong>de</strong> almacenamiento que garanticen una óptima conservación.<br />
88
8 ESTUDIO DE LOS PRECIOS DE PATATA DE CONSUMO EN ESPAÑA<br />
En este capítulo se van a <strong>de</strong>scribir algunas <strong>de</strong> <strong>la</strong>s circunstancias que afectan al sector para<br />
po<strong>de</strong>r <strong>de</strong>tal<strong>la</strong>r así algunas <strong>de</strong> <strong>la</strong>s <strong>de</strong>ficiencias existentes en el mismo, exponiendo los<br />
principales factores que influyen en <strong>la</strong> formación <strong>de</strong> los precios.<br />
Como se ha mostrado en el capítulo correspondiente a <strong>la</strong> situación <strong>de</strong>l cultivo (Capítulo 2), <strong>la</strong><br />
superficie y producción <strong>de</strong> patata se está reduciendo en los últimos años en los principales<br />
productores europeos (Alemania, Bélgica, Francia, Ho<strong>la</strong>nda y Reino Unido), a excepción <strong>de</strong><br />
Polonia. A priori, esta bajada <strong>de</strong> producción comunitaria podría suponer una mejora <strong>de</strong> <strong>la</strong><br />
cotización <strong>de</strong>l tubérculo tanto a nivel europeo como nacional. Sin embargo, varios factores<br />
han hecho que los precios cayeran, como son <strong>la</strong> coyuntura económica mundial, <strong>la</strong> reducción<br />
<strong>de</strong> <strong>la</strong>s exportaciones continentales, <strong>la</strong> necesidad <strong>de</strong> ven<strong>de</strong>r rápidamente para tener<br />
liqui<strong>de</strong>z y <strong>la</strong> disminución <strong>de</strong>l consumo.<br />
En España, los datos también reflejan una importante disminución, en concreto, <strong>de</strong>l 24,4% en<br />
superficie y <strong>de</strong>l 32,4% en producción <strong>de</strong>s<strong>de</strong> 1998 a 2008. La situación en Castil<strong>la</strong> y León para<br />
esos años refleja igualmente un <strong>de</strong>scenso <strong>de</strong> <strong>la</strong> superficie <strong>de</strong>l 20,6% y en <strong>la</strong> producción <strong>de</strong>l<br />
15%, aunque esta disminución no es tan acusada como se muestra en <strong>la</strong> ten<strong>de</strong>ncia a nivel<br />
nacional.<br />
La cosecha total <strong>de</strong> patata en España en 2008 alcanzó <strong>la</strong> cifra <strong>de</strong> 2,37 millones <strong>de</strong> t, lo que<br />
supone un 6% menos respecto al 2007. Los avances para 2009 marcan un ligero ascenso en<br />
torno al 6,3% respecto a 2008. En ese año todos los tipos <strong>de</strong> patata vieron reducido sus<br />
volúmenes <strong>de</strong> producción, siendo importante <strong>la</strong> reducción <strong>de</strong> <strong>la</strong> patata extra-temprana<br />
(-21%), seguida <strong>de</strong> <strong>la</strong> tardía (-12%), <strong>de</strong> media estación (-6%) y temprana (-3%). Este <strong>de</strong>scenso<br />
tan continuado <strong>de</strong> <strong>la</strong> superficie <strong>de</strong>dicada a este cultivo se <strong>de</strong>be a varios factores como son <strong>la</strong><br />
falta <strong>de</strong> estructuración <strong>de</strong>l sector, <strong>la</strong> ausencia <strong>de</strong> organización <strong>de</strong> <strong>la</strong> oferta y <strong>la</strong> falta <strong>de</strong><br />
adaptación a <strong>la</strong> <strong>de</strong>manda. Aquí también entran en juego otras variables como <strong>la</strong> preferencia<br />
<strong>de</strong> los operadores comerciales por <strong>la</strong> patata importada, ya que no encuentran <strong>la</strong> calidad,<br />
los formatos y <strong>la</strong>s varieda<strong>de</strong>s que <strong>de</strong>manda el mercado nacional. En conjunto, todos estos<br />
condicionantes crean un clima que <strong>de</strong>smotivan al agricultor nacional en general, y al<br />
castel<strong>la</strong>no y leonés en particu<strong>la</strong>r.<br />
De forma general, es sabido que el sector <strong>de</strong> <strong>la</strong> patata siempre se ha caracterizado por <strong>la</strong><br />
inestabilidad <strong>de</strong> los precios percibidos por los agricultores. Así, hay años que los productores<br />
tienen unos ingresos re<strong>la</strong>tivamente buenos con otros, como el 2009, en los que los precios<br />
recibidos difícilmente llegan a cubrir los costes <strong>de</strong> producción. Estos perjuicios se agravan por<br />
<strong>la</strong>s dificulta<strong>de</strong>s en comercializar el producto ya que, por un <strong>la</strong>do, se está incrementando el<br />
89
volumen <strong>de</strong> <strong>la</strong>s importaciones <strong>de</strong> una forma muy significativa, a<strong>de</strong><strong>la</strong>ntándose cada vez más en<br />
el tiempo llegándose incluso a comprar patatas <strong>de</strong> otros países <strong>de</strong> <strong>la</strong> UE en los meses <strong>de</strong><br />
septiembre u octubre don<strong>de</strong> el coste logístico es muy significativo.<br />
España tiene recursos para autoabastecerse <strong>de</strong> patata durante casi todo el año, aunque<br />
actualmente <strong>la</strong> producción nacional sólo cubre el 65% <strong>la</strong>s necesida<strong>de</strong>s <strong>de</strong> consumo,<br />
importándose el 35% restante. Por tanto, es evi<strong>de</strong>nte que hay que potenciar una política<br />
comercial capaz <strong>de</strong> regu<strong>la</strong>r el mercado para que <strong>la</strong> cosecha nacional tenga cabida en el<br />
mercado interior y en el <strong>de</strong> <strong>la</strong> exportación.<br />
La recolección <strong>de</strong> patata en España está prácticamente escalonada a lo <strong>la</strong>rgo <strong>de</strong> todo el año<br />
en función <strong>de</strong> <strong>la</strong>s varieda<strong>de</strong>s empleadas y <strong>la</strong> región productora. Así, <strong>la</strong>s varieda<strong>de</strong>s extratempranas<br />
se cultivan en Canarias y Andalucía, recolectándose <strong>de</strong>s<strong>de</strong> enero a marzo. Por su<br />
parte, <strong>la</strong>s varieda<strong>de</strong>s tempranas se recogen en el periodo comprendido entre abril y junio,<br />
cultivándose en <strong>la</strong> zona <strong>de</strong>l litoral mediterráneo (Andalucía, Comunidad Valenciana, Murcia<br />
y Baleares) así como en Canarias. En <strong>la</strong> zona interior y en el norte <strong>de</strong> <strong>la</strong> penínsu<strong>la</strong> se cultivan<br />
<strong>la</strong>s varieda<strong>de</strong>s <strong>de</strong> media estación, que se recogen entre junio y septiembre, y <strong>la</strong>s varieda<strong>de</strong>s<br />
tardías, que son <strong>la</strong>s más importantes cuantitativamente, se recolectan entre octubre y<br />
diciembre. En lo que se refiere a <strong>la</strong>s varieda<strong>de</strong>s que tienen mayor peso comercial <strong>de</strong>staca <strong>la</strong><br />
Monalisa, que ocupa <strong>la</strong> primera posición en importancia en el mercado nacional <strong>de</strong> producto<br />
fresco con un 25% <strong>de</strong>l total comercializado. A continuación le siguen <strong>la</strong>s varieda<strong>de</strong>s Agata<br />
(16%), Liseta (14%) y en menor proporción Caesar (8%), Jaer<strong>la</strong> (7%) y Spunta (5%). En el caso<br />
<strong>de</strong> patata para industria el mayor interés se centra en <strong>la</strong>s varieda<strong>de</strong>s Agria y Hermes. En<br />
Castil<strong>la</strong> y León <strong>la</strong>s varieda<strong>de</strong>s mayoritariamente producidas para el mercado en fresco son<br />
Monalisa y Jaer<strong>la</strong>, y para industria Agria y Hermes. Es importante <strong>de</strong>stacar que <strong>la</strong> variedad<br />
Jaer<strong>la</strong> cuenta con <strong>la</strong> gran ventaja <strong>de</strong> ser <strong>de</strong> ciclo corto, pero tiene poco recorrido comercial,<br />
con lo que no se pue<strong>de</strong> obtener un valor añadido <strong>de</strong> <strong>la</strong> misma salvo por su premura. Sin<br />
embargo, existen muchas varieda<strong>de</strong>s en el mismo ciclo productivo que podrían <strong>de</strong>stinarse a<br />
más canales <strong>de</strong> venta y obtener así mayor rentabilidad.<br />
La patata sigue un comportamiento variable <strong>de</strong>bido a los <strong>de</strong>sajustes entre oferta y <strong>de</strong>manda<br />
que caracteriza al mercado <strong>de</strong> este producto en España. A<strong>de</strong>más, este cultivo no está<br />
regu<strong>la</strong>do por ninguna Organización Común <strong>de</strong> Mercado, lo cual pue<strong>de</strong> predisponer a una<br />
fuerte inestabilidad, ya que no existen precios en origen <strong>de</strong>finidos por normativa comunitaria.<br />
El 2008 se caracterizó por ser un año atípico en cuanto a <strong>la</strong>s cotizaciones <strong>de</strong> patata en<br />
España. Mientras en otras campañas a finales <strong>de</strong> marzo y principios <strong>de</strong> abril los precios<br />
alcanzan su punto más alto (ver gráfico 8.1), por <strong>la</strong> entrada en el mercado <strong>de</strong> <strong>la</strong> patata<br />
nueva, en 2008 esta situación no se dio, siendo los precios más o menos constantes a lo <strong>la</strong>rgo<br />
<strong>de</strong>l año. A<strong>de</strong>más, influye que coinci<strong>de</strong> con <strong>la</strong>s últimas patatas <strong>de</strong> conservación francesas, que<br />
90
suelen ser <strong>la</strong>s <strong>de</strong> más calidad visual, y que se ven<strong>de</strong>n en ocasiones en el mercado nacional<br />
como patata nueva. La política comercial <strong>de</strong> los productores franceses les lleva a guardar<br />
hasta el final <strong>la</strong>s patatas <strong>de</strong> más calidad visual y ven<strong>de</strong>r cuanto antes <strong>la</strong>s <strong>de</strong> menor calidad.<br />
El precio medio nacional percibido por el agricultor en el año 2008 fue <strong>de</strong> 0,23 €/kg, mientras<br />
que en 2007 <strong>la</strong> media fue <strong>de</strong> 0,29 €/kg y en 2006 <strong>de</strong> 0,27 €/kg. A<strong>de</strong>más, el 2008 fue un año<br />
particu<strong>la</strong>r con respecto a los costes <strong>de</strong> producción puesto que aumentaron <strong>de</strong> manera<br />
importante (particu<strong>la</strong>rmente abonos y gasóleo). La situación que se ha vivido en 2009 sigue <strong>la</strong><br />
misma ten<strong>de</strong>ncia que en 2008 pero con precios más a <strong>la</strong> baja (ver tab<strong>la</strong> 8.1 y gráfico 8.2).<br />
Así, <strong>de</strong>s<strong>de</strong> enero hasta abril el precio se situó entre 0,20 y 0,24 €/kg, empezando a disminuir<br />
<strong>de</strong>s<strong>de</strong> entonces hasta 0,15 €/kg en mayo, y llegando hasta 0,07 €/kg en junio. En julio el<br />
precio ascendió hasta 0,19 €/kg, pero en los tres meses siguientes ha <strong>de</strong>scendido hasta el<br />
mínimo <strong>de</strong> 0,05 €/kg <strong>de</strong> octubre.<br />
GRÁFICO 8.1. PRECIOS PERCIBIDOS POR LOS AGRICULTORES ENTRE 2004-2008 EN ESPAÑA, EXPRESADOS EN €/kg.<br />
Fuente: MARM.<br />
De una forma general se podría afirmar que <strong>la</strong> producción y comercialización <strong>de</strong> patata se<br />
divi<strong>de</strong> en función <strong>de</strong> <strong>la</strong>s varieda<strong>de</strong>s cultivadas y <strong>de</strong>stino <strong>de</strong>l producto. Así tendríamos:<br />
A. Varieda<strong>de</strong>s que según <strong>la</strong> norma <strong>de</strong> calidad <strong>de</strong> patata (Real Decreto 31/2009) se<br />
podrían c<strong>la</strong>sificar como patata categoría I ó <strong>de</strong> calidad (Monalisa, Caesar, Cherie,<br />
Ágata, etc.) que suelen ser <strong>la</strong>vadas, presentados en envases pequeños (3-5 kg.) y con<br />
calibres y formatos homogéneos. Este producto se <strong>de</strong>stina generalmente a <strong>la</strong> gran<br />
distribución por medio <strong>de</strong> almacenistas en origen y/o <strong>de</strong>stino, que incorporan al<br />
producto unos costes en materia <strong>de</strong> <strong>la</strong>vado, calibrado, manipu<strong>la</strong>ción, envasado y<br />
expedición. Estas varieda<strong>de</strong>s <strong>de</strong> patata también pue<strong>de</strong>n comercializarse en otros<br />
canales como <strong>la</strong> red <strong>de</strong> Mercas, pero se envasarían sin <strong>la</strong>var o cepil<strong>la</strong>das, y en<br />
91
formatos <strong>de</strong> mayor peso (20-25 kg.). También se incluyen en este apartado<br />
varieda<strong>de</strong>s que culinariamente son muy valoradas por el consumidor por su textura,<br />
sabor, color y aroma, caso <strong>de</strong> Cherie, Charlotte, Kennebec, etc.<br />
B. Varieda<strong>de</strong>s <strong>de</strong> patata que se podrían <strong>de</strong>nominar “comunes” o <strong>de</strong> categoría II,<br />
según <strong>la</strong> norma <strong>de</strong> calidad (Jaer<strong>la</strong>, Fabu<strong>la</strong>, Marfona, etc.), que son comercializadas<br />
en general sin <strong>la</strong>var, cepil<strong>la</strong>das y envasadas en sacos <strong>de</strong> 10 a 25 kg. Estas patatas son<br />
<strong>de</strong>stinadas sobre todo a <strong>la</strong>s tiendas tradicionales o <strong>de</strong>tallistas, a través <strong>de</strong> los<br />
mercados centrales. Estas patatas no incorporan algunos <strong>de</strong> los costes <strong>de</strong> <strong>la</strong> patata <strong>de</strong><br />
calidad en lo referente a <strong>la</strong>vado, calibrado, manipu<strong>la</strong>do y envasado en bolsas <strong>de</strong><br />
plástico <strong>de</strong> mayor coste. A<strong>de</strong>más <strong>de</strong> <strong>la</strong>s varieda<strong>de</strong>s <strong>de</strong>scritas anteriormente, existen<br />
otras como por ejemplo Kennebec y Spunta que son <strong>de</strong> gran calidad culinaria y se<br />
comercializan sin <strong>la</strong>var.<br />
En el caso <strong>de</strong> Castil<strong>la</strong> y León, el gráfico 8.2 muestra <strong>la</strong> información re<strong>la</strong>tiva al precio medio<br />
pagado al productor en función <strong>de</strong> <strong>la</strong> forma <strong>de</strong> venta don<strong>de</strong> <strong>de</strong>staca <strong>la</strong> estabilidad <strong>de</strong> los<br />
precios percibidos por los agricultores cuando contratan sus producciones, y <strong>la</strong> ten<strong>de</strong>ncia <strong>de</strong><br />
<strong>de</strong>scenso <strong>de</strong> precios en el mercado libre <strong>de</strong>s<strong>de</strong> 2006 hasta 2009<br />
GRÁFICO 8.2. PRECIOS MEDIOS PERCIBIDOS POR LOS AGRICULTORES EN CASTILLA Y LEÓN EN LOS AÑOS 1999-2009,<br />
EXPRESADOS EN €/Kg.<br />
0,40<br />
0,35<br />
0,30<br />
0,25<br />
0,20<br />
0,15<br />
0,10<br />
0,05<br />
0,00<br />
Libre<br />
Contrato<br />
Ecológica<br />
1999 2000 2001 2002 2003 2004 2005 2006 2007 2008 2009<br />
Fuente: Junta <strong>de</strong> Castil<strong>la</strong> y León. Encuesta a operadores 2009.<br />
En el gráfico 8.3 se muestra información re<strong>la</strong>tiva a <strong>la</strong>s principales varieda<strong>de</strong>s cultivadas en<br />
Castil<strong>la</strong> y León y que se han vendido sin contrato. Aquí se observa <strong>la</strong> ten<strong>de</strong>ncia <strong>de</strong> disminución<br />
explicada anteriormente <strong>de</strong> los precios <strong>de</strong> <strong>la</strong>s varieda<strong>de</strong>s en el mercado libre.<br />
92
GRÁFICO 8.3. PRECIOS MEDIOS PAGADOS POR COMPRADORES EN LOS AÑOS 2006-2009, EN COMERCIO LIBRE, EXPRESADOS EN<br />
€/Kg.<br />
0,25<br />
0,2<br />
0,15<br />
0,1<br />
0,05<br />
AGRIA<br />
CARRERA<br />
ASTERIX<br />
JAERLA<br />
KENNEBEC<br />
MONALISA<br />
RED PONTIAC<br />
SPUNTA<br />
0<br />
2006 2007 2008 2009<br />
Fuente: Junta <strong>de</strong> Castil<strong>la</strong> y León. Encuesta a operadores 2009.<br />
En el gráfico 8.4 se expone <strong>la</strong> información re<strong>la</strong>tiva a <strong>la</strong>s varieda<strong>de</strong>s más comercializadas<br />
mediante contratos, don<strong>de</strong> se pue<strong>de</strong> ver <strong>la</strong> inexistencia <strong>de</strong> importantes fluctuaciones en los<br />
precios, y como en el año 2009 esas varieda<strong>de</strong>s han tenido un precio medio <strong>de</strong> entre 0,11-<br />
0,13 €/kg. con lo cual siempre hay una rentabilidad para el productor.<br />
GRÁFICO 8.4. PRECIOS MEDIOS PAGADOS POR COMPRADORES EN LOS AÑOS 2006-2009 EN COMERCIO CONTRATADO,<br />
EXPRESADOS EN €/Kg.<br />
0,18<br />
0,16<br />
0,14<br />
0,12<br />
0,1<br />
0,08<br />
0,06<br />
0,04<br />
0,02<br />
0<br />
2006 2007 2008 2009<br />
AGRIA<br />
ASTERIX<br />
HERMES<br />
MONALISA<br />
RED PONTIAC<br />
Fuente: Junta <strong>de</strong> Castil<strong>la</strong> y León. Encuesta a operadores 2009.<br />
Finalmente toda esta información se agrupa conjuntamente en el gráfico 8.5, don<strong>de</strong> queda<br />
patente que mediante <strong>la</strong> realización <strong>de</strong> contratos entre productores y operadores <strong>de</strong> patata<br />
se cubre en todas <strong>la</strong>s varieda<strong>de</strong>s consi<strong>de</strong>radas los costes <strong>de</strong> producción consi<strong>de</strong>rando los datos<br />
<strong>de</strong> precios <strong>de</strong> los diez últimos años<br />
93
GRÁFICO 8.5. PRECIOS MEDIOS PAGADOS POR COMPRADORES EN EL PERIODO 1999-2009. EN €/Kg. (*)<br />
LIBRE<br />
CONTRATO<br />
COSTE MEDIO DE PRODUCCIÓN<br />
0,140<br />
0,120<br />
0,100<br />
0,080<br />
0,060<br />
0,040<br />
0,020<br />
0,000<br />
AGATA AGRIA ASTERIX HERMES JAERLA MONALISA RED PONTIAC SPUNTA<br />
Fuente: Junta <strong>de</strong> Castil<strong>la</strong> y León. Encuesta <strong>de</strong> operadores 2009. (*) El coste <strong>de</strong> producción se ha estimado<br />
como valor medio en <strong>la</strong> serie 1999-2009.<br />
Como se pue<strong>de</strong> observar en <strong>la</strong> medias históricas que se presentan en los gráficos 8.6, 8.7 y<br />
8.8, los agricultores que hayan optado por contratar sus producciones son los que han<br />
disfrutado <strong>de</strong> una mejor rentabilidad.<br />
GRÁFICO 8.6. PRECIOS MEDIOS DE PATATA DE MEDIA ESTACIÓN, PAGADOS POR COMPRADORES EN EL PERIODO 1999 Y<br />
2009. (*)<br />
€/Kg.<br />
PRECIO MEDIO LIBRE<br />
PRECIO CONTRATO<br />
COSTE DE PRODUCCIÓN<br />
0,140<br />
0,120<br />
0,100<br />
0,080<br />
0,060<br />
0,040<br />
0,020<br />
0,000<br />
AGATA JAERLA CARRERA<br />
Fuente: Junta <strong>de</strong> Castil<strong>la</strong> y León. Encuesta <strong>de</strong> operadores 2009. (*) El coste <strong>de</strong> producción se ha estimado<br />
como valor medio en <strong>la</strong> serie 1999-2009.<br />
94
GRÁFICO 8.7. PRECIOS MEDIOS DE PATATA TARDÍA PAGADOS POR COMPRADORES, EN EL PERIODO 1999 - 2009.(*)<br />
€/Kg.<br />
LIBRE<br />
CONTRATO<br />
COSTE MEDIO DE PRODUCCIÓN<br />
0,140<br />
0,120<br />
0,100<br />
0,080<br />
0,060<br />
0,040<br />
0,020<br />
0,000<br />
ASTERIX MONALISA RED PONTIAC SPUNTA<br />
Fuente: Junta <strong>de</strong> Castil<strong>la</strong> y León. Encuesta <strong>de</strong> operadores 2009. (*) El coste <strong>de</strong> producción se ha estimado<br />
como valor medio en <strong>la</strong> serie 1999-2009.<br />
GRÁFICO 8.8. PRECIOS MEDIOS DE PATATA DE INDUSTRIA, PAGADOS POR COMPRADORES EN EL PERIODO 1999-2009.(*)<br />
CONTRATO<br />
€/K g.<br />
COSTE MEDIO DE<br />
PRODUCCIÓN<br />
0,140<br />
0,120<br />
0,100<br />
0,080<br />
0,060<br />
0,040<br />
0,020<br />
0,000<br />
AGRIA<br />
HERMES<br />
Fuente: Junta <strong>de</strong> Castil<strong>la</strong> y León. Encuesta <strong>de</strong> operadores 2009. (*) El coste <strong>de</strong> producción se ha estimado<br />
como valor medio en <strong>la</strong> serie 1999-2009.<br />
Para terminar este capítulo <strong>de</strong>l estudio <strong>de</strong> los precios se adjunta el gráfico 8.9 don<strong>de</strong> se<br />
muestra <strong>la</strong> producción <strong>de</strong> patatas <strong>de</strong> Castil<strong>la</strong> y León en 1999-2009 y los precios medios<br />
calcu<strong>la</strong>dos para esos años en cinco varieda<strong>de</strong>s en comercio libre (Agria, Carrera, Jaer<strong>la</strong>,<br />
Monalisa y Spunta).<br />
95
GRÁFICO 8.9. PRODUCCIÓN DE PATATA EN CASTILLA Y LEÓN, Y PRECIOS PERCIBIDOS POR LOS AGRICULTORES EN LOS<br />
AÑOS 1999-2009, CANTIDADES EXPRESADAS EN TONELADAS Y PRECIOS EN EUROS.<br />
0,20<br />
0,18<br />
0,16<br />
0,14<br />
0,12<br />
0,10<br />
0,08<br />
0,06<br />
0,04<br />
0,02<br />
0,00<br />
Euros<br />
Miles <strong>de</strong> tone<strong>la</strong>das<br />
1999 2000 2001 2002 2003 2004 2005 2006 2007 2008 2009<br />
1.200,00<br />
1.000,00<br />
800,00<br />
600,00<br />
400,00<br />
200,00<br />
0,00<br />
Fuente: E<strong>la</strong>boración propia a partir <strong>de</strong> datos <strong>de</strong>l MARM, Junta <strong>de</strong> Castil<strong>la</strong> y León y Encuesta <strong>de</strong><br />
operadores 2009.<br />
Se pue<strong>de</strong> concluir que hay una re<strong>la</strong>ción directa entre el precio <strong>de</strong> <strong>la</strong> patata en origen y <strong>la</strong><br />
producción obtenida, lógicamente esta vincu<strong>la</strong>ción es mayor porque no se rompe <strong>la</strong><br />
estacionalidad <strong>de</strong>l producto y se concentra <strong>la</strong> oferta en pocos meses.<br />
96
CONCLUSIONES<br />
o<br />
o<br />
o<br />
o<br />
o<br />
La producción y superficie <strong>de</strong> cultivo <strong>de</strong> patata en España ha <strong>de</strong>scendido en el último<br />
<strong>de</strong>cenio (1998-2008). En Castil<strong>la</strong> y León también ha caído, aunque <strong>de</strong> manera menos<br />
acusada.<br />
El motivo <strong>de</strong>l <strong>de</strong>scenso es <strong>la</strong> falta <strong>de</strong> estructuración <strong>de</strong>l sector, pues no hay<br />
organización <strong>de</strong> <strong>la</strong> oferta ni adaptación a <strong>la</strong> <strong>de</strong>manda <strong>de</strong>l mercado. Los operadores<br />
prefieren patata importada porque <strong>la</strong> nacional no se adapta a los formatos, calidad y<br />
varieda<strong>de</strong>s que requieren.<br />
España pue<strong>de</strong> autoabastecerse <strong>de</strong> patatas si se imp<strong>la</strong>ntaran políticas comerciales<br />
orientadas al mercado doméstico y al <strong>de</strong> <strong>la</strong> exportación.<br />
Francia saca al mercado en primer lugar <strong>la</strong>s patatas <strong>de</strong> menor calidad y conserva<br />
como es normal, hasta finales <strong>de</strong> abril <strong>la</strong>s <strong>de</strong> mayor calidad para po<strong>de</strong>r ser<br />
competitivos y obtener un buen precio en el mercado.<br />
De <strong>la</strong>s encuestas realizadas a operadores y productores, se <strong>de</strong>spren<strong>de</strong> que <strong>la</strong> patata<br />
vendida por los agricultores <strong>de</strong> Castil<strong>la</strong> y León bajo <strong>la</strong> modalidad <strong>de</strong> contrato ha<br />
obtenido mejores rentabilida<strong>de</strong>s que <strong>la</strong> vendida a precios <strong>de</strong> libre mercado.<br />
97
9 ANALISIS DEL CONSUMO DE PATATA<br />
Tomaremos este apartado <strong>de</strong>l estudio como parte importante <strong>de</strong>l mismo ya que nos permitirá<br />
visualizar el estado <strong>de</strong>l consumidor <strong>de</strong> patatas tanto en sus hábitos <strong>de</strong> compra como <strong>de</strong><br />
consumo, aspectos c<strong>la</strong>ve para tener un enfoque c<strong>la</strong>ro <strong>de</strong> <strong>la</strong>s necesida<strong>de</strong>s a <strong>la</strong> hora <strong>de</strong><br />
comercializar cualquier producto por parte <strong>de</strong> los diferentes operadores que forman <strong>la</strong><br />
ca<strong>de</strong>na <strong>de</strong> valor.<br />
9.1 CONSUMO DE PATATA EN LA UE<br />
El país que mas patata consumió en <strong>la</strong> UE en el año 2008 fue Letonia con 150,5 kg per cápita<br />
seguido <strong>de</strong> Polonia (121,1 kg per cápita) y Estonia (110 kg per cápita), mientras que España se<br />
sitúa en el puesto 21 con un consumo <strong>de</strong> 45 kg per cápita.<br />
TABLA 9.1. CONSUMO DE PATATA EN LA U.E EN LOS AÑOS 2000-2008, EXPRESADO EN Kg PER CÁPITA.<br />
2000 2001 2002 2003 2004 2005 2006 2007 2008<br />
Letonia 139,0 134,5 115,5 156,5 125,9 126,8 147,4 102,3 150,5<br />
Polonia 131,8 133,2 131,3 131,0 129,9 129,4 126,3 120,7 121,1<br />
Estonia 129,0 130,2 119,7 93,7 102,9 72,0 107,1 109,0 110,0<br />
Malta 115,7 118,8 111,5 108,2 136,5 123,0 95,3 100,1 107,8<br />
Ir<strong>la</strong>nda 139,9 137,9 125,4 128,4 124,5 113,3 123,0 95,9<br />
Lituania 129,3 134,4 103,9 136,4 124,8 118,0 116,0 79,4 90,4<br />
Portugal 91,6 93,3 93,5 92,4 88,4 89,0 89,4<br />
Ho<strong>la</strong>nda 74,7 88,7<br />
Suecia 83,5 83,5 83,5 83,4 83,4 83,4 83,4 82,0 83,3<br />
Fin<strong>la</strong>ndia 84,1 74,1 78,5 85,5 84,9 85,8 82,9 79,1 78,9<br />
Rumanía 86,3 81,8 90,1 91,9 86,5 99,3 85,6 91,2 70,9<br />
Eslovaquia 71,4 68,3 63,3 74,9 68,5 66,9 60,0 54,3 65,3<br />
Alemania 70,0 70,0 68,5 67,0 66,8 66,5 63,0 68,5 60,4<br />
Hungría 91,3 70,0 72,6 66,1 59,0 70,3 65,4 59,4 60,0<br />
Austria 57,0 54,4 55,7 57,5 52,4 54,6 53,6 54,9 55,9<br />
Francia 51,3 50,2 47,2 44,1 43,8 45,8 47,0 50,5 49,9<br />
España 42,2 45,4 46,5 45,4 45,3 45 43,9 44 45<br />
Reino Unido 108,6 112,9 102,0 126,1 110,7 106,3 101,4 96,9<br />
Grecia 87,2 84,8 84,6 97,3 102,7 101,0 93,9 93,5<br />
Bélgica 94,0 94,5 84,8 83,9 85,1 84,4 83,1 87,2<br />
Luxemburgo 75,0 93,6 73,0 80,9 77,2 73,7 79,9 80,6<br />
Italia 43,4 43,8 43,3 43,5 40,3 46,6 43,1 44,7<br />
Rep. Checa 75,9 76,1 76,1 76,2 75,9 75,8 75,1<br />
Dinamarca 56,8 56,8 56,8 56,8 56,7 55,1 55,1<br />
Bulgaria 40,8 34,7 48,8 44,4 37,2 59,9 38,3<br />
Fuente: EUROSTAT.<br />
99
En cuanto al grado <strong>de</strong> autoabastecimiento <strong>de</strong> los diferentes países <strong>de</strong> <strong>la</strong> UE <strong>de</strong>stacan<br />
principalmente Bélgica, Ho<strong>la</strong>nda, Alemania e incluso Austria, ya que producen por encima <strong>de</strong><br />
<strong>la</strong>s necesida<strong>de</strong>s propias <strong>de</strong> consumo. Sin embargo, países como España son <strong>de</strong>ficitarios,<br />
llegando a cubrir so<strong>la</strong>mente el 65% <strong>de</strong> <strong>la</strong>s necesida<strong>de</strong>s, en los últimos años.<br />
TABLA 9.2. NIVEL DE AUTOABASTECIMIENTO DE LOS PAÍSES DE LA UE.<br />
2000 2001 2002 2003 2004 2005 2006 2007 2008<br />
Bélgica 135,4 171,5 190,6 190,4 172,4 208,0 175,7 250,7<br />
Bulgaria 93,7 81,9 90,0 91,9 84,6 89,3 87,0<br />
Rep. Checa 96,7 95,8 89,5 89,6 80,4 87,4 97,8<br />
Dinamarca 92,1 95,1 98,0 97,1 97,9<br />
Alemania 103,5 106,4 107,6 106,9 108,1 109,4 113,5 125,6 131,6<br />
Estonia 97,8 98,7 94,8 93,0 94,6 85,4 91,6 89,2 88,8<br />
Ir<strong>la</strong>nda 72,2 63,9 67,0 64,5 66,1 70,2 57,2 59,2<br />
Grecia 84,7 84,9 83,8 75,4 69,5 71,5 75,4 75,4<br />
España 79,4 74,8 75,8 77,5 68,3 65,1 64,7 66,5 63,3<br />
Francia 104,7 107,1 105,6 110,6 115,5 107,9 110,7 116,2 113,0<br />
Italia 74,6 73,7 71,0 70,3 61,5 62,3 64,1 62,5<br />
Letonia 100,0 99,9 95,2 99,6 94,4 94,4 96,3 96,0 95,8<br />
Lituania 99,0 101,9 98,0 99,5 99,0 98,2 97,8 92,3 97,1<br />
Luxemburgo 65,5 55,6 58,5 48,1 45,5 55,6 45,2 39,2<br />
Hungría 99,0 92,2 96,0 87,9 79,8 91,4 84,3 81,5 80,2<br />
Malta 68,2 54,3 65,9 74,4 64,4 44,3 54,9 6,3 29,3<br />
Ho<strong>la</strong>nda 175,2 189,6 178,8<br />
Austria 89,7 92,5 89,7 88,3 85,8 91,0 95,8 87,8 86,3<br />
Polonia 99,1 99,9 99,3 102,5 102,8 101,8 102,4 100,5 101,5<br />
Portugal 67,6 72,0 56,0 59,7 64,1<br />
Rumanía 102,4 99,7 99,8 97,6 98,8 97,9 94,2 97,7 96,6<br />
Eslovenia 83,3 90,3 81,8<br />
Eslovaquia 84,9 95,7 87,2 90,0 92,4 87,4 78,0 79,7 74,0<br />
Fin<strong>la</strong>ndia 99,6 97,9 94,5 98,7 89,2 87,6 93,1 89,0 89,8<br />
Suecia 77,1 80,8 81,7 77,5 75,6<br />
Reino Unido 88,6 84,5 87,2 83,6 81,8 83,5 83,4 82,4<br />
Fuente: EUROSTAT.<br />
9.2 CARACTERISTICAS DE LOS HOGARES EN CUANTO AL CONSUMO DE PATATAS DURANTE<br />
EL AÑO 2008<br />
Condición Socioeconómica<br />
Los hogares <strong>de</strong> c<strong>la</strong>se alta y media alta cuentan con el consumo más elevado, mientras que los<br />
hogares <strong>de</strong> c<strong>la</strong>se media tienen el consumo más reducido.<br />
100
Presencia <strong>de</strong> Niños<br />
Los hogares sin niños, más concretamente <strong>la</strong>s parejas adultas, son los mayores consumidores<br />
<strong>de</strong> patatas, mientras que los consumos más bajos se registran en los hogares con niños<br />
menores <strong>de</strong> seis años.<br />
Cantidad comprada per cápita Kg. (Hogares)<br />
Parejas con hijos pequeños<br />
Jóvenes in<strong>de</strong>pedientes<br />
Parejas con hijos edad media<br />
Parejas jóvenes sin hijos<br />
Hogares monoparentales<br />
Parejas adultas con hijos mayores<br />
Adultos in<strong>de</strong>pendientes<br />
Retirados<br />
Parejas adultas sin hijos<br />
0 5 10 15 20 25 30 35 40 45<br />
Fuente: E<strong>la</strong>boración propia a partir <strong>de</strong> datos <strong>de</strong>l MARM y revista “Distribución y Consumo”.<br />
Situación Laboral<br />
Si <strong>la</strong> persona encargada <strong>de</strong> realizar <strong>la</strong> compra no trabaja se manifiesta en mayor consumo <strong>de</strong><br />
patatas.<br />
Edad <strong>de</strong>l Comprador<br />
En los hogares que compra una persona con más <strong>de</strong> 65 años, el consumo <strong>de</strong> patatas es más<br />
elevado, mientras que <strong>la</strong> <strong>de</strong>manda en menor esca<strong>la</strong> viene asociada a hogares don<strong>de</strong> <strong>la</strong> compra<br />
<strong>la</strong> hace una persona <strong>de</strong> menos <strong>de</strong> 35 años.<br />
Número <strong>de</strong> Miembros <strong>de</strong>l Hogar<br />
Los hogares formados por una única persona presentan los niveles <strong>de</strong> consumo más elevados,<br />
sin embargo aquellos formados por cuatro miembros son los menos consumidores.<br />
101
Lugar <strong>de</strong> Resi<strong>de</strong>ncia<br />
Aquellos consumidores que resi<strong>de</strong>n en municipios con censos <strong>de</strong> entre 100.000 y 500.000<br />
habitantes cuentan con el mayor consumo per cápita y por el contrario los núcleos con censos<br />
<strong>de</strong> entre 2.000 y 10.000 habitantes son los que menor índice <strong>de</strong> consumo presentan.<br />
Tipología <strong>de</strong>l Hogar<br />
Po<strong>de</strong>mos poner <strong>de</strong> relieve que en el caso <strong>de</strong> parejas adultas sin hijos, retirados y adultos<br />
in<strong>de</strong>pendientes presentan índices <strong>de</strong> consumo por encima <strong>de</strong> <strong>la</strong> media mientras que <strong>la</strong>s<br />
parejas con hijos pequeños, parejas jóvenes sin hijos y jóvenes in<strong>de</strong>pendientes son los que<br />
estarían por <strong>de</strong>bajo <strong>de</strong>l consumo medio.<br />
Estacionalidad<br />
En cuanto a <strong>la</strong> estacionalidad <strong>de</strong> <strong>la</strong> compra en el hogar, los meses <strong>de</strong> mayor consumo son los<br />
previos y posteriores al periodo estival, siendo <strong>la</strong> compra en el resto <strong>de</strong> meses muy simi<strong>la</strong>r.<br />
Comunidad Autónoma <strong>de</strong> Resi<strong>de</strong>ncia<br />
Cantabria y Asturias son <strong>la</strong>s comunida<strong>de</strong>s que tienen los mayores consumos mientras que La<br />
Rioja y Navarra estarían en el vértice opuesto.<br />
Castil<strong>la</strong> y León ocuparía <strong>la</strong> octava posición con un consumo per cápita en el hogar <strong>de</strong> patata<br />
fresca <strong>de</strong> 22,84 kilogramos y <strong>la</strong> undécima posición en el consumo total <strong>de</strong> patatas con 24,02<br />
kilogramos por persona y año.<br />
TABLA 9.3. CONSUMO EN EL HOGAR POR COMUNIDADES AUTÓNOMAS EN EL AÑO 2008.<br />
PRODUCTO Y REGIÓN<br />
Volumen<br />
(miles Kg.)<br />
Valor<br />
(miles <strong>de</strong> €)<br />
Precio medio<br />
€/Kg.<br />
Consumo per<br />
capita<br />
Gasto per<br />
capita<br />
TOTAL NACIONAL<br />
<strong>Patata</strong>s frescas 1.086.365,23 739.621,82 0,68 24,16 16,44<br />
<strong>Patata</strong>s conge<strong>la</strong>das 38.231,69 49.324,11 1,29 0,87 1,09<br />
<strong>Patata</strong>s procesadas 55.816,80 256.804,70 4,6 1,24 5,71<br />
TOTAL PATATAS 1.180.413,72 1.045.750,63 26,27 23,24<br />
Andalucía<br />
<strong>Patata</strong>s frescas 221.738,57 145.748,20 0,66 25,48 16,72<br />
<strong>Patata</strong>s conge<strong>la</strong>das 9.267,02 10.333,18 1,12 1,06 1,18<br />
<strong>Patata</strong>s procesadas 11.813,47 53.942,77 4,57 1,36 6,19<br />
TOTAL PATATAS 242.819,06 210.024,15 27,90 24,09<br />
Aragón<br />
<strong>Patata</strong>s frescas 30.742,66 21.678,65 0,71 22,87 16,15<br />
<strong>Patata</strong>s conge<strong>la</strong>das 933,19 1.408,48 1,51 0,71 1,05<br />
<strong>Patata</strong>s procesadas 1.384,35 6.616,32 4,78 1,04 4,92<br />
TOTAL PATATAS 33.060,20 29.703,45 24,62 22,12<br />
102
Asturias<br />
<strong>Patata</strong>s frescas 38.505,26 23.246,65 0,6 33,23 20,05<br />
<strong>Patata</strong>s conge<strong>la</strong>das 1.061,66 1.507,49 1,42 0,91 1,32<br />
<strong>Patata</strong>s procesadas 1.383,31 6.136,35 4,44 1,18 5,3<br />
TOTAL PATATAS 40.950,23 30.890,49 35,32 26,67<br />
Baleares<br />
<strong>Patata</strong>s frescas 18.491,76 14.192,15 0,77 20,57 15,79<br />
<strong>Patata</strong>s conge<strong>la</strong>das 720,29 851,26 1,18 0,77 0,95<br />
<strong>Patata</strong>s procesadas 1.302,99 6.467,30 4,96 1,45 7,18<br />
TOTAL PATATAS 20.515,04 21.510,71 22,79 23,92<br />
Canarias<br />
<strong>Patata</strong>s frescas 56.807,94 52.575,12 0,93 29,34 27,16<br />
<strong>Patata</strong>s conge<strong>la</strong>das 942,86 1.310,77 1,39 0,5 0,67<br />
<strong>Patata</strong>s procesadas 1.574,92 8.936,03 5,67 0,81 4,63<br />
TOTAL PATATAS 59.325,72 62.821,92 30,65 32,46<br />
Cantabria<br />
<strong>Patata</strong>s frescas 20.760,48 13.535,86 0,65 34,15 22,28<br />
<strong>Patata</strong>s conge<strong>la</strong>das 398,27 509,15 1,28 0,65 0,83<br />
<strong>Patata</strong>s procesadas 671,77 3.025,59 4,5 1,1 4,97<br />
TOTAL PATATAS 21.830,52 17.070,60 35,90 28,08<br />
Castil<strong>la</strong> La Mancha<br />
<strong>Patata</strong>s frescas 47.353,64 30.137,52 0,64 22,78 14,49<br />
<strong>Patata</strong>s conge<strong>la</strong>das 1.900,80 2.385,02 1,25 0,91 1,14<br />
<strong>Patata</strong>s procesadas 2.443,60 11.170,68 4,57 1,17 5,37<br />
TOTAL PATATAS 51.698,04 43.693,22 24,86 21,00<br />
Castil<strong>la</strong> y León<br />
<strong>Patata</strong>s frescas 60.284,72 37.059,71 0,61 22,84 14,06<br />
<strong>Patata</strong>s conge<strong>la</strong>das 818,38 1.236,13 1,51 0,31 0,47<br />
<strong>Patata</strong>s procesadas 2.299,29 10.038,77 4,37 0,87 3,8<br />
TOTAL PATATAS 63.402,39 48.334,61 24,02 18,33<br />
Cataluña<br />
<strong>Patata</strong>s frescas 152.371,25 108.801,24 0,71 23 16,43<br />
<strong>Patata</strong>s conge<strong>la</strong>das 7.733,32 11.537,67 1,49 1,17 1,73<br />
<strong>Patata</strong>s procesadas 10.674,40 49.086,26 4,6 1,6 7,4<br />
TOTAL PATATAS 170.778,97 169.425,17 25,77 25,56<br />
Extremadura<br />
<strong>Patata</strong>s frescas 21.054,06 14.202,07 0,67 17,51 11,81<br />
<strong>Patata</strong>s conge<strong>la</strong>das 1.033,14 1.102,82 1,07 0,85 0,93<br />
<strong>Patata</strong>s procesadas 1.066,59 4.929,44 4,62 0,89 4,11<br />
TOTAL PATATAS 23.153,79 20.234,33 19,25 16,85<br />
Galicia<br />
<strong>Patata</strong>s frescas 105.674,09 71.615,63 0,68 32,31 21,89<br />
<strong>Patata</strong>s conge<strong>la</strong>das 1.366,53 1.465,29 1,07 0,42 0,46<br />
<strong>Patata</strong>s procesadas 2.496,99 11.510,65 4,61 0,76 3,53<br />
TOTAL PATATAS 109.537,61 84.591,57 33,49 25,88<br />
La Rioja<br />
<strong>Patata</strong>s frescas 4.729,95 3.306,09 0,7 14,64 10,23<br />
<strong>Patata</strong>s conge<strong>la</strong>das 206,15 226,68 1,1 0,63 0,69<br />
<strong>Patata</strong>s procesadas 342,90 1.268,49 3,7 1,06 3,93<br />
TOTAL PATATAS 5.279,00 4.801,26 16,33 14,85<br />
103
Madrid<br />
<strong>Patata</strong>s frescas 115.846,26 72.265,23 0,62 21,41 13,36<br />
<strong>Patata</strong>s conge<strong>la</strong>das 5.116,58 6.838,14 1,34 0,95 1,26<br />
<strong>Patata</strong>s procesadas 7.275,74 31.236,41 4,29 1,35 5,78<br />
TOTAL PATATAS 128.238,58 110.339,78 23,71 20,40<br />
Murcia<br />
<strong>Patata</strong>s frescas 31.801,40 21.908,02 0,69 24,14 16,62<br />
<strong>Patata</strong>s conge<strong>la</strong>das 986,40 1.284,17 1,3 0,74 0,97<br />
<strong>Patata</strong>s procesadas 1.312,88 6.123,14 4,66 1 4,65<br />
TOTAL PATATAS 34.100,68 29.315,33 25,88 22,24<br />
Navarra<br />
<strong>Patata</strong>s frescas 9.503,03 6.755,26 0,71 16,14 11,49<br />
<strong>Patata</strong>s conge<strong>la</strong>das 183,61 279,61 1,52 0,3 0,47<br />
<strong>Patata</strong>s procesadas 548,69 2.603,34 4,74 0,94 4,41<br />
TOTAL PATATAS 10.235,33 9.638,21 17,38 16,37<br />
País Vasco<br />
<strong>Patata</strong>s frescas 47.667,20 33.793,69 0,71 22,36 15,86<br />
<strong>Patata</strong>s conge<strong>la</strong>das 1.051,03 1.507,58 1,43 0,47 0,72<br />
<strong>Patata</strong>s procesadas 2.368,64 10.905,05 4,6 1,1 5,12<br />
TOTAL PATATAS 51.086,87 46.206,32 23,93 21,70<br />
Valencia<br />
<strong>Patata</strong>s frescas 103.032,38 68.800,98 0,67 21,75 14,52<br />
<strong>Patata</strong>s conge<strong>la</strong>das 4.512,47 5.540,64 1,23 0,94 1,19<br />
<strong>Patata</strong>s procesadas 6.856,19 32.808,08 4,79 1,46 6,92<br />
TOTAL PATATAS 114.401,04 107.149,70 24,15 22,63<br />
Fuente: MARM – base <strong>de</strong> datos <strong>de</strong> consumo en hogares.<br />
CONSUMO POR CCAAs<br />
40<br />
35<br />
30<br />
25<br />
20<br />
15<br />
10<br />
Cantabria<br />
Asturias<br />
Galicia<br />
Canarias<br />
Andalucía<br />
Murcia<br />
Cataluña<br />
Castil<strong>la</strong> La<br />
Mancha<br />
Aragon<br />
Valencia<br />
Castil<strong>la</strong> y<br />
León<br />
País Vasco<br />
Madrid<br />
Baleares<br />
Extremadura<br />
Navarra<br />
La Rioja<br />
TOTAL PATATAS<br />
PATATAS FRESCAS<br />
Fuente: E<strong>la</strong>boración propia a partir <strong>de</strong> datos <strong>de</strong>l MARM.<br />
104
9.3 HÁBITOS DE CONSUMO<br />
Los consumidores consi<strong>de</strong>ran <strong>la</strong>s patatas naturales como un alimento indispensable en <strong>la</strong><br />
dieta, hábito que está a<strong>de</strong>más afianzado en <strong>la</strong>s diferentes opciones que presenta el producto<br />
que lo convierten en versátil. La tradición culinaria y un precio consi<strong>de</strong>rado asequible traen<br />
también como resultado una alta frecuencia <strong>de</strong> consumo <strong>de</strong> este alimento entre consumidores<br />
<strong>de</strong> todas <strong>la</strong>s eda<strong>de</strong>s (siendo consumidas incluso varias veces al día). Sin embargo a pesar <strong>de</strong> lo<br />
cotidiano <strong>de</strong>l consumo <strong>de</strong> patatas naturales, se conoce poco acerca <strong>de</strong> los beneficios <strong>de</strong> <strong>la</strong><br />
patata más allá <strong>de</strong> <strong>la</strong>s creencias popu<strong>la</strong>res <strong>de</strong> ser un alimento con gran aporte calórico o que<br />
“engorda” y esto es <strong>de</strong>bido a que el uso más común es para freír (60-65% <strong>de</strong>l consumo total).<br />
En lo referente a <strong>la</strong>s patatas conge<strong>la</strong>das hay una contradicción entre <strong>la</strong> imagen asociada <strong>de</strong><br />
producto poco natural, poca consistencia <strong>de</strong>spués <strong>de</strong> fritas, poco saludables en general con<br />
los hábitos <strong>de</strong> compra que nos indican que hay una evolución positiva en el consumo <strong>de</strong> este<br />
tipo <strong>de</strong> productos.<br />
Por otro <strong>la</strong>do también podríamos <strong>de</strong>stacar el consumo <strong>de</strong> <strong>la</strong>s patatas “CHIPS” ya que ha<br />
sufrido una evolución favorable sobre todo en <strong>de</strong>terminados grupos <strong>de</strong> pob<strong>la</strong>ción como son los<br />
adolescentes y los niños.<br />
La sociedad en general está cambiando constantemente en cuanto a sus hábitos <strong>de</strong> consumo y<br />
más en <strong>la</strong> última década, dado <strong>la</strong>s características <strong>de</strong> <strong>la</strong> propia sociedad y <strong>la</strong> rápida evolución<br />
a <strong>la</strong> que está sometida. Po<strong>de</strong>mos <strong>de</strong>cir que el consumidor cada vez más está buscando:<br />
Optimizar el tiempo <strong>de</strong>l que dispone; esto lleva implícito menor tiempo para realizar <strong>la</strong>s<br />
compras y por supuesto menor tiempo para cocinar. Se requieren alimentos <strong>de</strong> fácil<br />
preparación y si es posible, adaptados a uno <strong>de</strong> los electrodomésticos más utilizados en <strong>la</strong><br />
actualidad, como es el microondas.<br />
Preocupación por el culto al cuerpo; esto <strong>de</strong>termina <strong>la</strong> predilección por alimentos<br />
saludables con bajo índice <strong>de</strong> calorías, grasas saturadas etc.<br />
Alimentación segura; dadas <strong>la</strong>s noticias que están constantemente en todos los medios y <strong>la</strong>s<br />
alertas sanitarias ocurridas en los últimos años cada vez más se valora <strong>la</strong> seguridad<br />
alimentaria <strong>de</strong> los productos que consumimos.<br />
Responsabilidad Social Corporativa; entramos en <strong>la</strong> era <strong>de</strong> nuevas estrategias empresariales<br />
don<strong>de</strong> hay una contribución activa al mejoramiento social, <strong>la</strong>boral, económico y ambiental,<br />
responsabilizándose <strong>la</strong>s organizaciones <strong>de</strong> <strong>la</strong>s consecuencias e impactos <strong>de</strong> sus acciones.<br />
105
Vincu<strong>la</strong>ción al origen <strong>de</strong>l producto y a <strong>la</strong> forma <strong>de</strong> prepararlo o presentarlo; nos <strong>de</strong>jamos<br />
llevar por alimentos artesanales, tradicionales, e<strong>la</strong>borados en zonas rurales, en nuestro<br />
entorno etc.<br />
Búsqueda <strong>de</strong> <strong>la</strong> satisfacción en <strong>la</strong> compra, lo cual <strong>de</strong>riva en adaptarse a lo que los clientes<br />
<strong>de</strong>mandan <strong>de</strong> una manera ágil y flexible (en formatos porción consumidor, envases<br />
funcionales, etc).<br />
Aportar valor añadido a los productos, sobre todo los <strong>de</strong>stinados a cubrir necesida<strong>de</strong>s<br />
básicas como el caso <strong>de</strong> <strong>la</strong> patata, lo cual implica dar un giro comercial y estratégico<br />
buscando formatos más reducidos, segmentar <strong>la</strong> oferta, dar facilida<strong>de</strong>s al consumidor (IV y V<br />
gama), etc.<br />
9.4 COMPORTAMIENTOS EN EL ACTO DE COMPRA DE PATATAS<br />
En cuanto a <strong>la</strong> elección <strong>de</strong>l producto siguen siendo los criterios <strong>de</strong> compra más extendidos <strong>la</strong><br />
apariencia visual (<strong>la</strong> que mejor aspecto tenga unido a <strong>la</strong> firmeza <strong>de</strong> <strong>la</strong> patata) el uso culinario<br />
más habitual <strong>de</strong>ntro <strong>de</strong>l hogar (normalmente se compran patatas <strong>de</strong>l segmento <strong>de</strong> freír ya que<br />
es el principal uso dado por <strong>la</strong> mayoría <strong>de</strong> consumidores o en su lugar alguna referencia valida<br />
para todos los usos culinarios). También hay una diferenciación entre patata nueva y vieja<br />
asociando a <strong>la</strong> primera criterios más elevados <strong>de</strong> calidad.. También hay una diferenciación<br />
importante entre patata roja y b<strong>la</strong>nca siendo <strong>la</strong> roja asociada a mayor calidad. Tenemos que<br />
<strong>de</strong>stacar que algunas regiones <strong>de</strong> origen <strong>de</strong> <strong>la</strong> patata son reconocidas por una parte<br />
importante <strong>de</strong> consumidores como sinónimo <strong>de</strong> buena calidad. Las más <strong>de</strong>stacadas son <strong>la</strong>s<br />
patatas gallegas y riojanas a <strong>la</strong>s cuales se les atribuyen características únicas <strong>de</strong> sabor y<br />
textura, aunque es <strong>de</strong>stacable que en general se prefieren <strong>la</strong>s patatas nacionales con<br />
respecto a <strong>la</strong>s <strong>de</strong> otros orígenes (hecho que choca con <strong>la</strong> gran cantidad <strong>de</strong> patata importada<br />
que se comercializa en el territorio español).<br />
9.5 CANTIDAD CONSUMIDA Y GASTO DE DE PATATA EN ESPAÑA<br />
El volumen <strong>de</strong> consumo <strong>de</strong> patata en España ascien<strong>de</strong> a 1.686.280 tone<strong>la</strong>das. El 70 % <strong>de</strong> este<br />
volumen se consume en el hogar mientras que el 30% restante se correspon<strong>de</strong> con consumo<br />
extradoméstico (hostelería e instituciones).<br />
En <strong>la</strong> tab<strong>la</strong> 9.4. po<strong>de</strong>mos observar como se divi<strong>de</strong> el consumo y el gasto en patatas a nivel<br />
nacional.<br />
106
TABLA 9.4. CONSUMO Y GASTO DE PATATAS EN ESPAÑA.<br />
CONSUMO<br />
(MILL.<br />
KILOS)<br />
HOGARES<br />
GASTO<br />
(MILL.<br />
EUROS)<br />
RESTAURACION<br />
COMERCIAL<br />
CONSUMO<br />
(MILL.<br />
KILOS)<br />
GASTO<br />
(MILL.<br />
EUROS)<br />
RESTAURACIÓN<br />
COLECTIVA Y SOCIAL<br />
CONSUMO GASTO<br />
(MILL. (MILL.<br />
KILOS) EUROS)<br />
CONSUMO<br />
(MILL.<br />
KILOS)<br />
TOTAL<br />
GASTO<br />
(MILL.<br />
EUROS)<br />
TOTAL<br />
PATATAS 1.180,42 1.045,75 415,60 447,46 90,26 62,86 1.686,28 1.556,07<br />
<strong>Patata</strong>s<br />
frescas 1.086,37 739,62 227,32 139,55 76,13 41,39 1.389,82 920,56<br />
<strong>Patata</strong>s<br />
conge<strong>la</strong>das 38,23 49,32 173,83 199,19 11,85 13,80 223,91 262,31<br />
<strong>Patata</strong>s<br />
procesadas 55,82 256,80 14,45 108,72 2,26 7,67 72,53 373,19<br />
Fuente: MARM 2009 (Panel <strong>de</strong> Consumo alimentario) y revista “Distribución y Consumo”.<br />
Fuente: E<strong>la</strong>boración propia a partir <strong>de</strong> datos <strong>de</strong>l MARM.<br />
Durante el año 2008, el consumo total <strong>de</strong> patatas ascendió a cerca <strong>de</strong> 1.686,3 millones <strong>de</strong><br />
kilos y supuso un gasto próximo a 1.556,1 millones <strong>de</strong> euros. El mayor porcentaje <strong>de</strong>l consumo<br />
se concentra en los hogares (cerca <strong>de</strong>l 70 %), mientras que <strong>la</strong> restauración comercial supone<br />
el 24,6 % y <strong>la</strong> restauración social y colectiva, el 5,4% restante.<br />
En cuanto al gasto, el mayor porcentaje se registro en los hogares (67,2 %), mientras que <strong>la</strong><br />
restauración comercial supuso el 28,7 % y <strong>la</strong> restauración social y colectiva, el 4,1 % restante.<br />
En <strong>la</strong> estructura <strong>de</strong> consumo <strong>de</strong> los hogares, <strong>la</strong>s patatas frescas tienen una presencia notable<br />
(92 %), <strong>la</strong>s patatas procesadas alcanzan el 4,7 % y <strong>la</strong>s patatas conge<strong>la</strong>das representan el 3,3 %<br />
restante. En <strong>la</strong> restauración comercial, <strong>la</strong>s patatas frescas suponen un 54,7 %, <strong>la</strong>s patatas<br />
conge<strong>la</strong>das el 41,8 % y <strong>la</strong>s patatas procesadas el 3,5 % restante. En <strong>la</strong> restauración colectiva y<br />
social, <strong>la</strong>s patatas frescas representan un 84,3 %, <strong>la</strong>s patatas conge<strong>la</strong>das el 13,1 % y <strong>la</strong>s<br />
patatas procesadas suponen el 2,6 % restante.<br />
107
Durante el año 2008, Castil<strong>la</strong> y León registró un gasto per cápita en alimentación <strong>de</strong> 1.651,3<br />
euros (un 12,2 % superior a <strong>la</strong> media nacional). En el caso <strong>de</strong> <strong>la</strong> patata, el gasto per cápita fue<br />
<strong>de</strong> 18,3 euros y el consumo <strong>de</strong> 24,02 Kg.<br />
En <strong>la</strong> siguiente tab<strong>la</strong> po<strong>de</strong>mos observar el gasto per cápita en patatas en comparación con<br />
otros tipos <strong>de</strong> productos y su <strong>de</strong>sviación con respecto a <strong>la</strong> media nacional.<br />
TABLA 9.5 ESTRUCTURA DE GASTO EN LA ALIMENTACIÓN DE CASTILLA Y LEÓN.<br />
GASTO PER<br />
CÁPITA (EUROS)<br />
PARTICIPACIÓN SOBRE<br />
EL GASTO TOTAL (%)<br />
DESVIACION CON LA MEDIA<br />
NACIONAL (%)<br />
PATATAS 18,3 1,1 -21,5<br />
HORTALIZAS FRESCAS 98,5 6,0 6,1<br />
FRUTAS FRESCAS 163,7 9,9 22,7<br />
FRUTAS Y HORTALIZAS<br />
TRANSFORMADAS<br />
27,9 0,8 1,4<br />
PAN 123,1 7,5 21,4<br />
Fuente: E<strong>la</strong>boración propia a partir <strong>de</strong> datos <strong>de</strong>l MARM.<br />
9.5.1 HOGARES<br />
Durante el año 2008, los hogares españoles consumieron 1.180,4 millones <strong>de</strong> kilos <strong>de</strong> patatas<br />
y gastaron 1.054,7 millones <strong>de</strong> euros en este producto. En términos per cápita se llego a<br />
26,25 kilos <strong>de</strong> consumo y 23,25 euros <strong>de</strong> gasto. El consumo más notable se asocia a <strong>la</strong>s patatas<br />
frescas (24,16 kilos por persona y año), seguido <strong>de</strong> <strong>la</strong>s patatas procesadas (1,24 kilos per<br />
cápita) y <strong>de</strong> <strong>la</strong>s patatas conge<strong>la</strong>das (0,85 kilos per cápita). Aunque en los últimos años el<br />
consumo en el hogar <strong>de</strong> patatas frescas se ha mantenido estable, es importante seña<strong>la</strong>r que<br />
este producto viene presentando una evolución <strong>de</strong>sfavorable <strong>de</strong>s<strong>de</strong> principios <strong>de</strong> <strong>la</strong> década <strong>de</strong><br />
los noventa, perdiendo <strong>de</strong>s<strong>de</strong> entonces hasta nuestros días cerca <strong>de</strong> un 40% <strong>de</strong>l consumo<br />
doméstico. Sin embargo, en los últimos años parece existir cierta estabilidad.<br />
En términos <strong>de</strong> gasto, <strong>la</strong>s patatas frescas concentran el 70,7% <strong>de</strong> total gastado, con un valor<br />
<strong>de</strong> 16,45 euros por persona; <strong>la</strong>s patatas procesadas el 24,6%, con un total <strong>de</strong> 5,71 euros por<br />
persona, y <strong>la</strong>s patatas conge<strong>la</strong>das, un porcentaje <strong>de</strong>l 4,7 % y 1,1 euros por persona.<br />
108
TABLA 9.6 CONSUMO Y GASTO EN PATATAS DE LOS HOGARES EN 2008.<br />
CONSUMO<br />
GASTO<br />
TOTAL (MILL. KILOS)<br />
PER CÁPITA<br />
(KILOS)<br />
TOTAL MILL. EUROS)<br />
PER CÁPITA<br />
(EUROS)<br />
TOTAL PATATAS 1.180,42 26,25 1.045,75 23,25<br />
<strong>Patata</strong>s frescas 1.086,37 24,16 739,62 16,45<br />
<strong>Patata</strong>s<br />
conge<strong>la</strong>das 38,23 0,85 49,32 1,10<br />
<strong>Patata</strong>s<br />
procesadas 55,82 1,24 256,80 5,71<br />
Fuente: MARM 2009 (Panel <strong>de</strong> Consumo Alimentario) y revista “Distribución y Consumo”.<br />
9.5.2 RESTAURACIÓN, COLECTIVIDADES E INSTITUCIONES<br />
Durante el año 2008, los establecimientos <strong>de</strong> restauración comercial y restauración colectiva<br />
y social adquirieron cerca <strong>de</strong> 505,9 millones <strong>de</strong> kilos <strong>de</strong> patatas y gastaron 510,3 millones <strong>de</strong><br />
euros en este producto.<br />
En <strong>la</strong> <strong>de</strong>manda extradoméstica <strong>de</strong> patatas, <strong>la</strong>s patatas frescas representan un 60 % <strong>de</strong>l<br />
consumo y un 35,4 % <strong>de</strong>l gasto, <strong>la</strong>s patatas conge<strong>la</strong>das el 36,7 % <strong>de</strong>l consumo y el 41,7 % <strong>de</strong>l<br />
gasto, y <strong>la</strong>s patatas procesadas el 3,3 % <strong>de</strong>l consumo y el 22,9 % <strong>de</strong>l gasto.<br />
La restauración comercial utiliza al mayorista como principal fuente <strong>de</strong> aprovisionamiento <strong>de</strong><br />
patatas (alcanzando una cuota <strong>de</strong>l 56 %), seguido <strong>de</strong>l fabricante (con una cuota <strong>de</strong>l 36 %). El<br />
cash & carry, el libre servicio (hipermercado y supermercado), el establecimiento<br />
especializado y <strong>la</strong>s otras formas comerciales alcanzan un 2% para cada uno <strong>de</strong> los casos.<br />
109
CONCLUSIONES<br />
o<br />
o<br />
o<br />
o<br />
Ten<strong>de</strong>ncia <strong>de</strong>scen<strong>de</strong>nte <strong>de</strong>l consumo <strong>de</strong> patata fresca, en general, frente a un<br />
aumento <strong>de</strong> patatas conge<strong>la</strong>das y procesadas<br />
España no tiene capacidad <strong>de</strong> producir toda <strong>la</strong> patata que consume siendo el<br />
porcentaje <strong>de</strong> autoabastecimiento <strong>de</strong>l 65%.<br />
Hay cambios en <strong>la</strong>s tipologías <strong>de</strong>l hogar y hábitos <strong>de</strong> consumo, lo cual exige adaptarse<br />
a <strong>la</strong>s nuevas <strong>de</strong>mandas <strong>de</strong>l mercado.<br />
El consumidor en <strong>la</strong> actualidad cada vez esta más preocupado por una alimentación<br />
sana y natural.<br />
110
10 ANÁLISIS DE LA COMERCIALIZACION DE PATATA<br />
Este capítulo viene a ser uno <strong>de</strong> lo más complejos e importantes <strong>de</strong>l presente <strong>P<strong>la</strong>n</strong> ya que<br />
vamos a analizar cuáles son los canales por los que atraviesa <strong>la</strong> patata hasta llegar al<br />
consumidor final, y el valor que aporta cada uno <strong>de</strong> los agentes intervinientes al producto<br />
final, con el objetivo <strong>de</strong> dar algo <strong>de</strong> luz a <strong>la</strong> comercialización <strong>de</strong> este producto.<br />
Como aspectos generales a <strong>la</strong> comercialización <strong>de</strong> patata en España y más concretamente en<br />
Castil<strong>la</strong> y León hay que <strong>de</strong>stacar <strong>la</strong> <strong>de</strong>sorganización y <strong>la</strong> <strong>de</strong>sconexión <strong>de</strong> los operadores <strong>de</strong> <strong>la</strong><br />
ca<strong>de</strong>na <strong>de</strong> suministro. Esto se pone <strong>de</strong> manifiesto en que cada es<strong>la</strong>bón <strong>de</strong> <strong>la</strong> ca<strong>de</strong>na <strong>de</strong> valor<br />
no tenga c<strong>la</strong>ramente <strong>de</strong>finidos los criterios comerciales y <strong>de</strong>manda <strong>de</strong> cada uno <strong>de</strong> ellos. Esto<br />
es más notable en <strong>la</strong> fase primaria <strong>de</strong> <strong>la</strong> ca<strong>de</strong>na que choca con <strong>la</strong> concentración y<br />
especialización sobre todo <strong>de</strong> los operadores.<br />
Para entrar a <strong>de</strong>scribir <strong>la</strong> comercialización <strong>de</strong> patata para consumo en fresco, hay que<br />
distinguir entre los diferentes tipos <strong>de</strong> patatas en función <strong>de</strong> <strong>la</strong> época <strong>de</strong> recolección <strong>de</strong> <strong>la</strong>s<br />
mismas;<br />
- <strong>Patata</strong> temprana y extratemprana <strong>de</strong>bido a <strong>la</strong> precocidad <strong>de</strong>l producto y a <strong>la</strong> no<br />
concurrencia con otro tipo <strong>de</strong> orígenes suele ir asociada a una buena rentabilidad,<br />
sin necesidad <strong>de</strong> un gran esfuerzo comercial dado que el mercado esta receptivo y<br />
con ganas <strong>de</strong> cambiar <strong>de</strong> patata <strong>de</strong> conservación a patata nueva. Es muy<br />
<strong>de</strong>stacable <strong>la</strong> importancia que tiene <strong>la</strong> exportación para este tipo <strong>de</strong> patata a<br />
países como Alemania, Ing<strong>la</strong>terra Bélgica, Francia etc… lo que también ha<br />
ayudado a <strong>la</strong> mayor profesionalización <strong>de</strong> <strong>la</strong> producción <strong>de</strong>bido a <strong>la</strong>s exigencias <strong>de</strong><br />
calidad <strong>de</strong> estos <strong>de</strong>stinos.<br />
- <strong>Patata</strong> <strong>de</strong> media estación y tardía ( Castil<strong>la</strong> y León ), don<strong>de</strong> ya existen en primer<br />
lugar necesida<strong>de</strong>s <strong>de</strong> almacenamiento para po<strong>de</strong>r adaptar <strong>la</strong> oferta a <strong>la</strong>s<br />
necesida<strong>de</strong>s <strong>de</strong>l mercado y esto implica mayor participación en <strong>la</strong><br />
comercialización <strong>de</strong>l producto porque a<strong>de</strong>más compite con el resto <strong>de</strong><br />
producciones <strong>de</strong> <strong>la</strong> U.E. El agricultor da salida a su producción, bien a través <strong>de</strong><br />
<strong>la</strong>s cooperativas (según datos recogidos por encuestas solo un 20 % están<br />
asociados), bien a través <strong>de</strong> almacenistas o bien <strong>de</strong> agentes comercializadores<br />
“intermediarios”. El siguiente es<strong>la</strong>bón <strong>de</strong> <strong>la</strong> ca<strong>de</strong>na <strong>de</strong> suministro <strong>de</strong> fresco se<br />
sitúa en los mayoristas quienes ven<strong>de</strong>n a mercadillos, fruterías o tiendas<br />
especializadas (por medio <strong>de</strong> <strong>la</strong> red <strong>de</strong> Mercas) o a <strong>la</strong> gran distribución, si bien es<br />
cierto que también se pue<strong>de</strong> surtir <strong>de</strong> almacenistas.<br />
111
El acceso <strong>de</strong> <strong>la</strong>s cooperativas a <strong>la</strong> gran distribución es minoritario <strong>de</strong>bido a su escasa visión<br />
comercial: no se adaptan a <strong>la</strong> <strong>de</strong>manda, ni en varieda<strong>de</strong>s ni en calida<strong>de</strong>s, no tienen capacidad<br />
<strong>de</strong> suministro anual, no han evolucionado en presentaciones, formatos, envases, marketing,<br />
etc…<br />
La imagen o figura <strong>de</strong>l “corredor intermediario” está muy extendida y realiza una <strong>la</strong>bor<br />
comercial <strong>de</strong> venta <strong>de</strong> patatas tanto a operadores en origen como en <strong>de</strong>stino. Esta figura hoy<br />
en día dispone también <strong>de</strong> estructuras <strong>de</strong> almacenamiento que pue<strong>de</strong> hacer uso o no <strong>de</strong> el<strong>la</strong>s,<br />
si bien es cierto que mucha <strong>de</strong> <strong>la</strong> producción <strong>la</strong> ven<strong>de</strong> directamente <strong>de</strong>s<strong>de</strong> el campo sin pasar<br />
previamente por almacén con lo cual no confiere ningún valor añadido al producto.<br />
Fundamentalmente hacen una <strong>la</strong>bor comercial <strong>de</strong> concentración <strong>de</strong> <strong>la</strong> oferta.<br />
En lo que se refiere a <strong>la</strong> comercialización <strong>de</strong> patata para industria, <strong>la</strong> comercialización es mas<br />
sencil<strong>la</strong> y tiene dos vías fundamentales; almacenes en origen o <strong>de</strong>stino y cooperativas.<br />
A continuación po<strong>de</strong>mos ver gráficamente lo <strong>de</strong>scrito anteriormente;<br />
FLUJOS COMERCIALES DE PATATA PARA CONSUMO EN CASTILLA y LEÓN<br />
AGRICULTOR<br />
INTERMEDIARIO<br />
COOPERATIVA<br />
ALMACENISTA<br />
MAYORISTA<br />
EXPORTACIÓN<br />
GRAN DISTRIBUCIÓN /<br />
DETALLISTA<br />
CONSUMIDOR<br />
112
FLUJOS COMERCIALES DE PATATA PARA INDUSTRIA EN CASTILLA y LEÓN<br />
AGRICULTOR<br />
INTERMEDIARIO<br />
ALMACENISTA<br />
COOPERATIVA<br />
INDUSTRIA<br />
EXPORTACIÓN<br />
GRAN DISTRIBUCIÓN / DETALLISTA<br />
CONSUMIDOR<br />
10.1 COMERCIALIZACIÓN EN ORIGEN<br />
Vamos a analizar los agentes que se encargan <strong>de</strong> realizar <strong>la</strong> comercialización en origen don<strong>de</strong><br />
principalmente tenemos al agricultor in<strong>de</strong>pendiente, a <strong>la</strong> cooperativa y a los almacenes que<br />
no son cooperativas.<br />
10.1.1 AGRICULTOR INDEPENDIENTE<br />
Po<strong>de</strong>mos hab<strong>la</strong>r <strong>de</strong> aquel productor individual que comercializa su producción directamente a<br />
almacenistas en origen o <strong>de</strong>stino y a corredores (en Castil<strong>la</strong> y León existen un porcentaje<br />
mayoritario <strong>de</strong> productores que comercializan así su producción).<br />
Existen un número muy elevado <strong>de</strong> productores in<strong>de</strong>pendientes <strong>de</strong> carácter histórico que no<br />
están dotados <strong>de</strong> estructuras <strong>de</strong> almacenamiento ni c<strong>la</strong>sificación, que inestabilizan el<br />
mercado ya que al no disponer <strong>de</strong> ninguna estructura que <strong>de</strong> valor añadido a su producción<br />
tienen que dar salida inmediatamente a su producto <strong>de</strong>s<strong>de</strong> el campo, lo cual crea exceso <strong>de</strong><br />
oferta en <strong>de</strong>terminadas épocas don<strong>de</strong> confluyen todas <strong>la</strong>s producciones. A<strong>de</strong>más en <strong>la</strong><br />
mayoría <strong>de</strong> <strong>la</strong>s ocasiones no tienen contratada su producción, con lo cual es una manera un<br />
tanto “especu<strong>la</strong>tiva” <strong>de</strong> trabajar. En algunas ocasiones se siembran varieda<strong>de</strong>s <strong>de</strong> industria y<br />
113
<strong>de</strong> consumo en fresco lo cual permite tener un ingreso asegurado con <strong>la</strong> producción <strong>de</strong> patata<br />
para industria (ya que esta contratada) y el resto se <strong>de</strong>ja a mercado libre para ver que<br />
suce<strong>de</strong>. La elección <strong>de</strong> <strong>la</strong>s varieda<strong>de</strong>s se realiza por diferentes criterios (precio semil<strong>la</strong>,<br />
producción <strong>de</strong> <strong>la</strong> variedad, acuerdos con distribuidores, etc.) que casi nunca correspon<strong>de</strong>n a<br />
criterios agronómicos ni a necesida<strong>de</strong>s <strong>de</strong>l mercado, lo cual dificulta <strong>la</strong> comercialización <strong>de</strong><br />
<strong>la</strong> cosecha y <strong>la</strong> verda<strong>de</strong>ra rentabilidad <strong>de</strong> <strong>la</strong> misma. En Castil<strong>la</strong> y León, como ya se ha<br />
comentado, <strong>de</strong>l total <strong>de</strong> productores <strong>de</strong> patata sólo un 20 % están asociados y suele ser a<br />
través <strong>de</strong> cooperativas.<br />
10.1.2 AGRUPACIONES DE PRODUCTORES (APP)<br />
Castil<strong>la</strong> y León tiene reconocidas once Agrupaciones <strong>de</strong> Productores <strong>de</strong> <strong>Patata</strong> (APP). Suelen<br />
ser empresas <strong>de</strong> gran tamaño con un número <strong>de</strong> socios elevado, una media <strong>de</strong> 55 socios. Del<br />
conjunto <strong>de</strong> agrupaciones, 6 se <strong>de</strong>dican principalmente a <strong>la</strong> patata con <strong>de</strong>stino a industria, 4<br />
<strong>de</strong>stinan su mercancía principalmente a fresco y una a patata <strong>de</strong> siembra. Durante el año<br />
2.009 <strong>la</strong>s agrupaciones <strong>de</strong> productores <strong>de</strong> patata fueron:<br />
Aranpino S. Coop.<br />
La Carpeña, S. Coop.<br />
Tierra <strong>de</strong> Pinares S. Coop.<br />
Indycons, S. Coop.<br />
APP Tierras <strong>de</strong> Castil<strong>la</strong> y León, S. Coop.<br />
Pro<strong>de</strong>leco, S. Coop.<br />
Sociedad Cooperativa <strong>de</strong>l Campo Glus-I<br />
S. Coop San Isidro.<br />
Sociedad Cooperativa Campo Segoviano 2.<br />
Gexvall S. Coop.<br />
Copanor, S.Coop. (<strong>Patata</strong> <strong>de</strong> siembra).<br />
También se constituyó en 1997 otra cooperativa, Las Vil<strong>la</strong>s <strong>de</strong>l Tormes S. Coop., que se<br />
<strong>de</strong>c<strong>la</strong>ró en concurso <strong>de</strong> acreedores en el año 2006 y se liquidó.<br />
La característica común a estas agrupaciones <strong>de</strong> productores es que todas el<strong>la</strong>s se han dotado<br />
<strong>de</strong> insta<strong>la</strong>ciones para el procesado, almacenamiento y conservación <strong>de</strong> patata gracias a <strong>la</strong>s<br />
subvenciones a <strong>la</strong> inversión y el funcionamiento convocadas por el Real Decreto 970/2002 por<br />
el que se regu<strong>la</strong> el reconocimiento <strong>de</strong> <strong>la</strong>s agrupaciones <strong>de</strong> productores <strong>de</strong> patatas <strong>de</strong> consumo<br />
no <strong>de</strong>stinadas a <strong>la</strong> industria feculera. Estas ayudas han supuesto unas transferencias <strong>de</strong> casi<br />
13 millones <strong>de</strong> euros, cofinanciadas al 50% entre <strong>la</strong> Junta <strong>de</strong> Castil<strong>la</strong> y León y <strong>la</strong><br />
Administración General <strong>de</strong>l Estado, gracias a <strong>la</strong>s que se han dotado <strong>de</strong> equipamiento mo<strong>de</strong>rno<br />
para po<strong>de</strong>r conservar patatas en un periodo <strong>de</strong> tiempo más amplio, contribuyendo así a<br />
regu<strong>la</strong>r los mercados.<br />
114
A pesar <strong>de</strong> disponer <strong>de</strong> este apoyo público, no se ha conseguido <strong>la</strong> finalidad pretendida <strong>de</strong><br />
regu<strong>la</strong>r el mercado. Las capacida<strong>de</strong>s <strong>de</strong> almacenamiento <strong>de</strong> estas agrupaciones se <strong>de</strong>tal<strong>la</strong>n en<br />
el cuadro siguiente:<br />
ALMACENAMIENTO EN CÁMARA FRIGORÍFICA<br />
Nº Dimensión<br />
DESTINO cámaras (m2)<br />
Capacidad<br />
(T)<br />
APP<br />
Formato<br />
SDAD. COOP LA CARPEÑA Industria 1 482 900 Cajones<br />
SDAD. COOP SAN ISIDRO Industria 1 459 850 Cajones<br />
SDAD. COOP. ARANPINO Fresco 3 981 2.340 Cajones<br />
SDAD. COOP. CAMPO SEGOVIANO<br />
Fresco<br />
2<br />
2 1.200 2.000 Cajones<br />
SDAD. COOP. GLUS I Fresco 1 500 1.300 Cajones<br />
SDAD. COOP. PRODELECO Industria 5 1.700 3.500 Cajones<br />
SDAD. COOP. TIERRA DE PINARES Fresco 2 1.000 1.400 BIG-BAG<br />
SDAD. COOP. TIERRA DE PINARES Fresco 3 1.500 3.000 Cajones<br />
SDAD. COOP. GEXVALL<br />
Fresco/<br />
Industria 1 400 900 Cajones<br />
8.222 16.190<br />
ALMACENAMIENTO EN ALMACEN VENTILADO<br />
APP<br />
Nº Dimensión Capacidad<br />
DESTINO cámaras (m2)<br />
(T)<br />
Formato<br />
SDAD. COOP. LA CARPEÑA Fresco 2 600 800 Cajones<br />
SDAD. COOP. LA CARPEÑA Industria 4 2.468 6.000 A granel<br />
SDAD. COOP. SAN ISIDRO Industria 1 703 1.800 A granel<br />
SDAD. COOP. ARANPINO Fresco 2 648 1.560 Cajones<br />
SDAD. COOP. APP TIERRAS DE<br />
CASTILLA Y LEÓN<br />
Fresco/<br />
Industria 3 2.600 8.112 Cajones<br />
SDAD. COOP. APP TIERRAS DE<br />
CASTILLA Y LEÓN<br />
Fresco/<br />
Industria 2 2.000 5.200 A granel<br />
SDAD. COOP. CAMPO SEGOVIANO<br />
Fresco<br />
2<br />
2 1.200 2.000 Cajones<br />
SDAD. COOP. GLUS I Fresco 3 1.415 3.900 A granel<br />
SDAD. COOP. INDYCONS Industria 6 3.000 9.750 A granel<br />
SDAD. COOP. PRODELECO Industria 7 2.331 8.000 A granel<br />
SDAD. COOP. GEXVALL<br />
Fresco/<br />
Industria 3 1.500 4.500 A granel<br />
18.465 58.790<br />
ALMACENAMIENTO EN ALMACEN<br />
APP<br />
Nº Dimensión Capacidad<br />
DESTINO cámaras (m2)<br />
(T)<br />
Formato<br />
Fresco/<br />
SDAD. COOP. LA CARPEÑA Industria 1 1.100 4.500 A granel<br />
SDAD. COOP. SAN ISIDRO<br />
Fresco/<br />
Industria 3 2.408 4.600 BIG-BAG<br />
SDAD. COOP. ARANPINO Fresco 1 1.485 4.000 A granel<br />
SDAD. COOP. ARANPINO Fresco 4 5.653 5.073 BIG-BAG<br />
SDAD. COOP. PRODELECO Industria 1 300 400 Cajones<br />
6.710 18.573<br />
Fuente: Encuesta a Operadores, Junta Castil<strong>la</strong> y León 2009.<br />
115
Las particu<strong>la</strong>rida<strong>de</strong>s <strong>de</strong> estas agrupaciones son:<br />
- Doble vocación <strong>de</strong> <strong>la</strong> producción fresco e industria, lo cual les facilita <strong>la</strong><br />
comercialización <strong>de</strong> <strong>la</strong> producción <strong>de</strong> sus socios gracias a esta diversificación y <strong>la</strong><br />
opción <strong>de</strong> <strong>de</strong>sviar <strong>la</strong>s producciones a uno u otro <strong>de</strong>stino.<br />
- Las principales varieda<strong>de</strong>s almacenadas son (según encuesta operadores 2009):<br />
VARIEDADES ALMACENADAS (%)<br />
AGRIA<br />
32%<br />
OTROS<br />
0%<br />
JAERLA<br />
3%<br />
MONALISA<br />
9%<br />
SPUNTA<br />
0%<br />
RED PONTIAC<br />
1%<br />
LADY CLAIRE<br />
2%<br />
ASTERIX<br />
8%<br />
HERMES<br />
45%<br />
Es importante <strong>de</strong>stacar que el 79% <strong>de</strong> <strong>la</strong> patata almacenada se <strong>de</strong>dica a <strong>la</strong><br />
industria transformadora (varieda<strong>de</strong>s Hermes, Agria y Lady C<strong>la</strong>ire).<br />
- La proce<strong>de</strong>ncia <strong>de</strong> <strong>la</strong> semil<strong>la</strong> en un porcentaje alto suele ser <strong>de</strong> importación, en<br />
torno al 85% (Hermes: Escocia, Agria: Ho<strong>la</strong>nda, Lady C<strong>la</strong>ire: Ho<strong>la</strong>nda…etc.). Sólo<br />
en algunos casos como ocurre sobre todo en <strong>la</strong>s cooperativas <strong>de</strong> Sa<strong>la</strong>manca<br />
recurren en mayor medida a patata <strong>de</strong> siembra <strong>de</strong> origen regional (caso <strong>de</strong> <strong>la</strong><br />
Jaer<strong>la</strong> por ejemplo producida por cooperativas <strong>de</strong> Burgos).<br />
- La capacidad <strong>de</strong> almacenamiento es alta, rondando un 57% <strong>de</strong> su producción, si<br />
bien se utiliza para conservar patata <strong>de</strong> industria, en <strong>la</strong> gran mayoría <strong>de</strong> los casos.<br />
- Disponen <strong>de</strong> insta<strong>la</strong>ciones para acondicionar el producto aunque también<br />
suministran <strong>la</strong>s patatas a granel y sin <strong>la</strong>var, excepto en <strong>la</strong>s ocasiones que se<br />
requiere <strong>la</strong>vada para disminuir costes logísticos. Por tanto no se emplean estos<br />
medios <strong>de</strong> manera a<strong>de</strong>cuada para obtener un rendimiento económico.<br />
- Establecen protocolos <strong>de</strong> calidad a nivel productor como Global Gap, Producción<br />
Integrada a petición normalmente <strong>de</strong> los clientes (Una tiene certificado ISO 9000,<br />
4 lo están con Global Gap y 2 con Producción Integrada).<br />
- En cuanto a Recursos Humanos y profesionales disponen <strong>de</strong> 1 Gerente, 1 ó 2<br />
técnicos y 3 ó 4 empleados por cada una.<br />
- Suelen tener un nivel muy alto <strong>de</strong> autoabastecimiento (cerca <strong>de</strong>l 100%), pues sólo<br />
alguna cooperativa en <strong>de</strong>terminadas circunstancias se abastece <strong>de</strong> terceros no<br />
socios. Esto es un factor limitante en <strong>de</strong>terminados aspectos.<br />
- Las principales varieda<strong>de</strong>s para consumo en fresco que trabajan estas<br />
cooperativas son Monalisa, Red Pontiac, Jaer<strong>la</strong>, Asterix, Spunta y Ágata. En el<br />
caso <strong>de</strong> <strong>la</strong> industria <strong>la</strong>s principales varieda<strong>de</strong>s empleadas son Agria, Hermes y<br />
Lady C<strong>la</strong>ire.<br />
116
- Las estructuras que poseen para almacenar <strong>la</strong> patata son: cámaras frigoríficas,<br />
almacenes con venti<strong>la</strong>ción forzada y almacenes ordinarios.<br />
- En cuanto a los canales <strong>de</strong> comercialización <strong>la</strong> patata es vendida en su gran<br />
mayoría a almacenistas <strong>de</strong> origen o <strong>de</strong>stino (en big bags o a granel), mayoristas en<br />
<strong>de</strong>stino (sacos raschel <strong>de</strong> 10, 15, 20 ó 25 Kg.) y un porcentaje mínimo a <strong>la</strong> gran<br />
distribución (bolsas <strong>de</strong> material plástico <strong>de</strong> 3 ó 5 Kg.).<br />
En último lugar tenemos <strong>la</strong>s agrupaciones <strong>de</strong> productores <strong>de</strong> patata <strong>de</strong> siembra <strong>la</strong>s cuales se<br />
<strong>de</strong>scriben ampliamente en el capítulo <strong>de</strong> patata <strong>de</strong> siembra.<br />
El objetivo fundamental <strong>de</strong> estas agrupaciones bajo <strong>la</strong> razón social <strong>de</strong> cooperativas es<br />
concentrar <strong>la</strong> producción <strong>de</strong> todos sus socios y así po<strong>de</strong>r establecer mejores canales <strong>de</strong><br />
comercialización que permita dar mayor rentabilidad a <strong>la</strong>s explotaciones <strong>de</strong> sus socios. No<br />
obstante se han <strong>de</strong>tectado una serie <strong>de</strong> prácticas que inci<strong>de</strong>n negativamente en <strong>la</strong> obtención<br />
<strong>de</strong>l citado objetivo:<br />
- Desviar producciones en función <strong>de</strong> los precios <strong>de</strong> <strong>la</strong> campaña.<br />
- No a<strong>de</strong>cuar <strong>la</strong>s varieda<strong>de</strong>s producidas a <strong>la</strong>s características agronómicas <strong>de</strong> los<br />
suelos <strong>de</strong> que disponen.<br />
- No cumplir rigurosamente los protocolos <strong>de</strong> producción para dar lugar a cosechas<br />
contro<strong>la</strong>das.<br />
- No a<strong>de</strong>cuar <strong>la</strong>s varieda<strong>de</strong>s que producidas a <strong>la</strong>s necesida<strong>de</strong>s reales <strong>de</strong>l mercado.<br />
- Admitir toda <strong>la</strong> producción <strong>de</strong> los socios sin criterios c<strong>la</strong>ros <strong>de</strong> calidad.<br />
- Destinar poco esfuerzo a <strong>la</strong>bores <strong>de</strong> investigación y <strong>de</strong>sarrollo <strong>de</strong> sus procesos <strong>de</strong><br />
producción en campo, manipu<strong>la</strong>ción en almacén, conservación, nuevos productos<br />
etc.<br />
- Comercializar producciones <strong>de</strong> poca calidad y sólo durante <strong>de</strong>terminados meses<br />
<strong>de</strong>l año (no se conserva a<strong>de</strong>cuadamente).<br />
- Excesiva <strong>de</strong>pen<strong>de</strong>ncia <strong>de</strong> <strong>la</strong>s ayudas y subvenciones <strong>de</strong> <strong>la</strong> administración.<br />
- Comercializar una gran parte <strong>de</strong> <strong>la</strong> producción sin dar valor añadido al producto.<br />
La imp<strong>la</strong>ntación y <strong>la</strong> inci<strong>de</strong>ncia <strong>de</strong> <strong>la</strong>s cooperativas <strong>de</strong> productores <strong>de</strong> patata es re<strong>la</strong>tivamente<br />
poca si lo comparamos con <strong>la</strong>s <strong>de</strong> otro tipo <strong>de</strong> producto principalmente <strong>de</strong>bido a:<br />
- Enorme carácter especu<strong>la</strong>tivo <strong>de</strong> todos los agentes intervinientes en <strong>la</strong> ca<strong>de</strong>na <strong>de</strong><br />
valor, que da lugar a una total <strong>de</strong>sorganización, falta <strong>de</strong> compromisos a <strong>la</strong>rgo<br />
p<strong>la</strong>zo, falta <strong>de</strong> programación, etc.<br />
- Falta <strong>de</strong> especialización <strong>de</strong> los productores <strong>de</strong> patata como ocurre en otras<br />
regiones europeas don<strong>de</strong> el productor es un profesional <strong>de</strong>l cultivo.<br />
117
A modo <strong>de</strong> resumen y para cerrar este apartado po<strong>de</strong>mos concluir que <strong>la</strong>s cooperativas<br />
comercializadoras <strong>de</strong> patata siguen <strong>la</strong>s siguientes pautas <strong>de</strong> actuación:<br />
Las cooperativas realizan un <strong>P<strong>la</strong>n</strong> <strong>de</strong> Trabajo que abarca <strong>de</strong>s<strong>de</strong> <strong>la</strong>s varieda<strong>de</strong>s<br />
que van a sembrar sus socios en base a <strong>la</strong>s <strong>de</strong>mandas que tengan y acuerdos<br />
con sus clientes finales, hasta <strong>la</strong>s prácticas culturales o métodos cualitativos<br />
<strong>de</strong> manipu<strong>la</strong>ción.<br />
Los productores compran <strong>la</strong> patata <strong>de</strong> siembra a <strong>la</strong> cooperativa.<br />
Las cooperativas suelen comercializar toda <strong>la</strong> producción <strong>de</strong> sus socios en los<br />
meses <strong>de</strong> campaña (caso excepcional es <strong>la</strong> patata <strong>de</strong> industria). Esto implica<br />
concentrar <strong>la</strong> oferta en unos pocos meses <strong>de</strong>l año, lo cual es una práctica que<br />
habría que abandonar y sustituir<strong>la</strong> por una correcta gestión comercial <strong>de</strong> <strong>la</strong><br />
producción, una correcta utilización <strong>de</strong> los medios <strong>de</strong> almacenamiento y una<br />
a<strong>de</strong>cuada selección <strong>de</strong> varieda<strong>de</strong>s<br />
La cooperativa tiene <strong>la</strong> responsabilidad <strong>de</strong> aceptar <strong>la</strong> producción <strong>de</strong> sus socios<br />
in<strong>de</strong>pendientemente <strong>de</strong> <strong>la</strong> calidad <strong>de</strong> <strong>la</strong> misma o <strong>de</strong>l cumplimiento <strong>de</strong> <strong>la</strong>s<br />
pautas agronómicas que marcan los técnicos.<br />
A los socios se les liquida según ventas <strong>de</strong> <strong>la</strong> cooperativa y restando los costes<br />
generales que puedan tener, sin tener un criterio cualitativo al respecto.<br />
La comercialización es mediante almacenistas y mayoristas pero no se llega a<br />
<strong>la</strong> gran distribución. Esto es <strong>de</strong>bido fundamentalmente a que:<br />
o No son capaces <strong>de</strong> cumplir <strong>la</strong>s exigencias <strong>de</strong> <strong>la</strong> gran distribución en<br />
cuanto a entregas regu<strong>la</strong>res, homogéneas y con cierta flexibilidad.<br />
o No hay adaptación a <strong>la</strong>s nuevas <strong>de</strong>mandas <strong>de</strong> los consumidores ni se<br />
invierte en investigar sobre nuevas ten<strong>de</strong>ncias <strong>de</strong> mercado, nuevos<br />
productos, mejores formatos y presentaciones etc.<br />
o La red comercial no compren<strong>de</strong> ni esta profesionalizada para llegar a<br />
este tipo <strong>de</strong> clientes.<br />
10.2 EMPRESAS COMERCIALIZADORAS EN ORIGEN Y DESTINO (ALMACENES DE SELECCIÓN,<br />
CLASIFICADO Y ENVASADO)<br />
Dentro <strong>de</strong> <strong>la</strong> ca<strong>de</strong>na <strong>de</strong> valor este es un agente con un gran peso ya que se aprovisionan<br />
normalmente <strong>de</strong> los agricultores in<strong>de</strong>pendientes (también en ocasiones <strong>de</strong> corredores o <strong>de</strong><br />
cooperativas) que les proveen <strong>de</strong> patata directamente <strong>de</strong>l campo (en big bag <strong>de</strong> 1.000 Kg.<br />
aproximadamente). Estos operadores lo que hacen es realizar diferentes tareas <strong>de</strong> selección,<br />
calibrado, c<strong>la</strong>sificado, <strong>la</strong>vado o cepil<strong>la</strong>do, pesado y envasado para acondicionar el producto a<br />
<strong>la</strong>s necesida<strong>de</strong>s <strong>de</strong> los diversos canales <strong>de</strong> venta ( gran distribución, mayoristas, restauración,<br />
etc.)<br />
118
La ubicación <strong>de</strong> estas empresas pue<strong>de</strong> ser en origen cercana a <strong>la</strong> fase productora, también<br />
pue<strong>de</strong>n estar en <strong>de</strong>stino cercanas a <strong>la</strong> distribución o en otras ubicaciones que obe<strong>de</strong>zcan a<br />
otros criterios <strong>de</strong> posicionamiento.<br />
Estos operadores son los principales importadores <strong>de</strong> patata ya que <strong>de</strong>ben tener disposición<br />
<strong>de</strong> un volumen regu<strong>la</strong>r durante todo el año para suministrar a sus clientes.<br />
10.2.1 ACUERDOS COMERCIALES<br />
El porcentaje <strong>de</strong> contratación <strong>de</strong>l suministro <strong>de</strong> patatas en este tipo <strong>de</strong> empresas es bajo y<br />
suelen comercializar patatas que son compradas en mercado libre. Cabe <strong>de</strong>stacar que durante<br />
los últimos años han ido estableciendo acuerdos comerciales con exportadores franceses dado<br />
<strong>la</strong> gran importancia que ha tomado esta patata <strong>de</strong>ntro <strong>de</strong>l sector. También han ido<br />
estableciendo algunas estructuras comerciales, e incluso <strong>de</strong> almacenamiento (cámaras), en<br />
Francia para estar más cerca <strong>de</strong>l origen en <strong>de</strong>terminadas épocas <strong>de</strong>l año.<br />
Dentro <strong>de</strong> <strong>la</strong> contratación po<strong>de</strong>mos hab<strong>la</strong>r <strong>de</strong> tres formu<strong>la</strong>s; precio fijo, precio mínimo y<br />
máximo (entre estos dos valores se paga según este el mercado) y precio <strong>de</strong> referencia con<br />
subidas y bajadas a dividir entre <strong>la</strong>s partes (por ejemplo precio <strong>de</strong> referencia 0,12 €/Kg y<br />
precio <strong>de</strong> mercado 0,18 €/Kg; el comprador pagaría 0,15 €/Kg.).<br />
Al contrario <strong>de</strong>l sector productor don<strong>de</strong> <strong>la</strong> oferta esta muy dispersada, referente a los<br />
almacenistas <strong>la</strong> oferta se concentra en muy pocos los cuales acaparan un porcentaje muy alto<br />
<strong>de</strong> <strong>la</strong> cuota <strong>de</strong> mercado.<br />
10.2.2 CANALES DE COMERCIALIZACIÓN<br />
Dentro <strong>de</strong> este grupo <strong>de</strong> empresas cabe <strong>de</strong>stacar algunas que asumen también tareas <strong>de</strong><br />
mayoristas en <strong>de</strong>stino principalmente, teniendo presencia con puestos <strong>de</strong> venta en <strong>la</strong> Red <strong>de</strong><br />
Mercas. Esto implica dar un salto en <strong>la</strong> ca<strong>de</strong>na <strong>de</strong> suministro y tener <strong>la</strong> posibilidad <strong>de</strong> obtener<br />
mayor valor <strong>de</strong> su producto.<br />
Otra salida lógica <strong>de</strong> los productos <strong>de</strong> este tipo <strong>de</strong> empresas son los acuerdos comerciales con<br />
<strong>la</strong> gran distribución don<strong>de</strong> se trabaja mayoritariamente patata <strong>la</strong>vada. Los requisitos <strong>de</strong><br />
calidad, envases, formatos, calibres etc. son distintos a <strong>la</strong>s necesida<strong>de</strong>s <strong>de</strong> los otros canales<br />
<strong>de</strong> venta.<br />
119
10.2.3 CRITERIOS DE COMERCIALIZACIÓN<br />
Si nos centramos, por <strong>la</strong> importancia que han tomado, en <strong>la</strong>s empresas que suministran a <strong>la</strong><br />
gran distribución, éstas tienen unos requisitos cualitativos, comerciales, etc. que vienen<br />
<strong>de</strong>terminadas por <strong>la</strong>s exigencias <strong>de</strong>l cliente final y po<strong>de</strong>mos hab<strong>la</strong>r <strong>de</strong>:<br />
• Calidad Visual: Viene <strong>de</strong>terminada por <strong>la</strong> imp<strong>la</strong>ntación <strong>de</strong>s<strong>de</strong> hace unos años <strong>de</strong> <strong>la</strong><br />
patata <strong>la</strong>vada como referencia <strong>de</strong> venta en los lineales <strong>de</strong> <strong>la</strong>s diferentes ca<strong>de</strong>nas <strong>de</strong><br />
distribución. Esto implica que <strong>la</strong>s patatas <strong>la</strong>vadas tienen que tener en muchas<br />
ocasiones una apariencia casi perfecta lo cual ha ido en <strong>de</strong>trimento <strong>de</strong> conseguir<br />
patatas con buenas cualida<strong>de</strong>s o aptitu<strong>de</strong>s culinarias centrándose solo en <strong>la</strong><br />
apariencia externa.<br />
• Segmentación <strong>de</strong>l mercado: Es un concepto que hemos importado hace<br />
re<strong>la</strong>tivamente pocos años y se basa en <strong>la</strong> adaptación <strong>de</strong> <strong>la</strong>s diferentes varieda<strong>de</strong>s <strong>de</strong><br />
patata existentes a un <strong>de</strong>terminado uso culinario (freír, cocer, guisar etc.). Esto se<br />
pue<strong>de</strong> realizar porque cada variedad tiene una serie <strong>de</strong> características físico químicas<br />
y organolépticas (también <strong>de</strong>terminadas por <strong>la</strong>s condiciones agroclimáticas <strong>de</strong>l<br />
cultivo) que <strong>la</strong>s hacen idóneas para una u otra utilidad a <strong>la</strong> hora <strong>de</strong> su preparación.<br />
• Homogeneidad <strong>de</strong>l producto: Principalmente viene <strong>de</strong>terminado por el calibre ya<br />
que comercialmente se exige que <strong>la</strong>s patatas, en función <strong>de</strong> <strong>la</strong> categoría, estén<br />
comprendidas en un <strong>de</strong>terminado calibre o tamaño <strong>de</strong> producto. También es<br />
necesario una homogeneidad <strong>de</strong>l formato, <strong>de</strong> <strong>la</strong> coloración <strong>de</strong> <strong>la</strong> piel y <strong>de</strong> <strong>la</strong> carne, <strong>de</strong><br />
<strong>de</strong>fectos etc.<br />
• Trazabilidad: La trazabilidad en <strong>la</strong> ca<strong>de</strong>na <strong>de</strong> suministro es obligatoria <strong>de</strong>s<strong>de</strong> <strong>la</strong><br />
publicación <strong>de</strong>l Reg<strong>la</strong>mento (CE) 178/2002 para <strong>la</strong> comercialización <strong>de</strong> cualquier<br />
producto alimentario.<br />
• Certificaciones: Cada vez más y sobre todo a nivel <strong>de</strong> <strong>la</strong> gran distribución, se exige a<br />
<strong>la</strong>s empresas que les suministran, diferentes tipos <strong>de</strong> certificados bien sean <strong>de</strong><br />
calidad, seguridad alimentaria, medio ambiente y últimamente lo que se <strong>de</strong>nomina<br />
responsabilidad social corporativa. Esto también se tras<strong>la</strong>da al sector productor don<strong>de</strong><br />
se están imp<strong>la</strong>ntando cada vez más protocolos <strong>de</strong> producción que acrediten un cultivo<br />
más contro<strong>la</strong>do, como lo muestran <strong>la</strong>s normas Global Gap, Producción Integrada etc.<br />
• Precios: Suelen venir <strong>de</strong>terminados por campañas <strong>de</strong> producción y no son muy<br />
osci<strong>la</strong>ntes durante <strong>la</strong>s mismas. También se pue<strong>de</strong>n cerrar precios a esca<strong>la</strong>s <strong>de</strong> tiempo<br />
mayores. Es un factor cada vez más importante <strong>de</strong>bido a <strong>la</strong> enorme competencia que<br />
hay en el mercado.<br />
• Regu<strong>la</strong>ridad <strong>de</strong> suministro: Es fundamental tener una frecuencia <strong>de</strong> suministro<br />
constante a lo <strong>la</strong>rgo <strong>de</strong>l año en función <strong>de</strong> <strong>la</strong>s necesida<strong>de</strong>s <strong>de</strong> los clientes.<br />
Lógicamente esto implica <strong>la</strong> disponibilidad <strong>de</strong> patatas durante los doce meses <strong>de</strong>l<br />
120
año, por lo tanto los suministradores <strong>de</strong>ben tener <strong>la</strong> estructura necesaria para<br />
comprar en diferentes orígenes en función <strong>de</strong> sus necesida<strong>de</strong>s.<br />
• Logística: Es un pi<strong>la</strong>r fundamental hoy en día para po<strong>de</strong>r garantizar un servicio<br />
a<strong>de</strong>cuado en tiempo y forma a los diferentes clientes, los cuales en muchas ocasiones<br />
tienen diferentes p<strong>la</strong>taformas logísticas don<strong>de</strong> realizar <strong>la</strong>s entregas. También cobra<br />
especial relevancia este aspecto <strong>de</strong>s<strong>de</strong> el punto <strong>de</strong> vista económico, <strong>de</strong>bido a <strong>la</strong><br />
re<strong>la</strong>ción volumen y peso <strong>de</strong> este producto y al escaso valor que tiene en <strong>de</strong>terminados<br />
momentos, lo cual hace necesario ser muy competitivo en este aspecto para no<br />
encarecer el producto final.<br />
• I+D: Hoy en día cada vez se valora más <strong>la</strong> capacidad <strong>de</strong> innovar que tengan <strong>la</strong>s<br />
empresas a <strong>la</strong> hora <strong>de</strong> <strong>la</strong>nzar nuevos productos, nuevos formatos, mejorar los<br />
existentes, posicionar nuevas i<strong>de</strong>as, en <strong>de</strong>finitiva el Know-How <strong>de</strong> <strong>la</strong>s mismas.<br />
• Publicidad y marketing: Hasta hace bien poco era un concepto ignorado por <strong>la</strong>s<br />
empresas <strong>de</strong>l sector pero hoy en día se requiere una imagen a<strong>de</strong>cuada y actualizada<br />
<strong>de</strong> <strong>la</strong>s empresas, <strong>de</strong> sus productos, <strong>de</strong> sus acciones, promociones etc… vincu<strong>la</strong>do a <strong>la</strong><br />
facilidad que tengan <strong>de</strong> transmitirlo al consumidor final.<br />
Referente a los criterios <strong>de</strong> calidad que aplican a sus proveedores para <strong>la</strong> compra <strong>de</strong> patata,<br />
respon<strong>de</strong>n a criterios internos en <strong>la</strong> mayoría <strong>de</strong> <strong>la</strong>s ocasiones si bien es cierto que suelen<br />
tener como referente <strong>la</strong> norma <strong>de</strong> calidad comercial para <strong>la</strong>s patatas <strong>de</strong> consumo en el<br />
mercado nacional (Real Decreto 31/2009, <strong>de</strong> 16 <strong>de</strong> enero).<br />
Este tipo <strong>de</strong> empresas normalmente trabajan no sólo patata <strong>de</strong>s<strong>de</strong> el campo sino que recurren<br />
a patata <strong>de</strong> conservación ya que tienen que suministrar a sus clientes durante todos los meses<br />
<strong>de</strong>l año. La patata <strong>de</strong> conservación; o bien proce<strong>de</strong> <strong>de</strong> <strong>la</strong> que almacenan <strong>la</strong>s propias<br />
compañías; o bien recurren a <strong>la</strong> importación, ya que el sector productor nacional difícilmente<br />
les proporciona patata <strong>de</strong> calidad conservada. Estas empresas, a<strong>de</strong>más <strong>de</strong> su actividad <strong>de</strong><br />
comercio <strong>de</strong> patata <strong>de</strong> consumo, en algunos casos también son distribuidores <strong>de</strong> casas <strong>de</strong><br />
semil<strong>la</strong> europeas, y son <strong>la</strong>s encargadas <strong>de</strong> suministrar <strong>la</strong> semil<strong>la</strong> a los productores,<br />
condicionando <strong>de</strong> esa manera <strong>la</strong> compra <strong>de</strong> <strong>la</strong> producción, aunque esto no lo hacen todos los<br />
almacenistas.<br />
La organización <strong>de</strong> <strong>la</strong> producción no esta programada en base a <strong>la</strong>s necesida<strong>de</strong>s <strong>de</strong> clientes u<br />
otro tipo <strong>de</strong> mo<strong>de</strong>lo organizativo con lo cual cuando llega <strong>la</strong> hora <strong>de</strong> comercializar <strong>la</strong>s patatas<br />
<strong>de</strong> sus co<strong>la</strong>boradores <strong>de</strong>pen<strong>de</strong>rán <strong>de</strong> <strong>la</strong> <strong>de</strong>manda que tengan.<br />
El agricultor asume normalmente toda <strong>la</strong> responsabilidad <strong>de</strong>l cultivo y cuando se comercializa<br />
asume <strong>la</strong>s <strong>de</strong>sviaciones <strong>de</strong> calidad que tenga el producto con respecto a <strong>la</strong>s exigencias<br />
requeridas por el comprador.<br />
121
10.2.4 INTERMEDIARIOS COMERCIALIZADORES<br />
Esta figura representa uno <strong>de</strong> los puntos calientes <strong>de</strong>l sector y <strong>de</strong> <strong>la</strong> agricultura en general<br />
tanto a nivel autonómico como nacional.<br />
Cabe <strong>de</strong>stacar que <strong>la</strong> imagen <strong>de</strong> este tipo <strong>de</strong> agentes ha cambiado ligeramente en algunas<br />
ocasiones ya que hoy en día están dotados <strong>de</strong> cierta estructura (almacén <strong>de</strong> manipu<strong>la</strong>ción y<br />
cámaras <strong>de</strong> conservación) pero el mayor valor lo obtienen cuando ven<strong>de</strong>n <strong>la</strong> patata<br />
directamente <strong>de</strong>s<strong>de</strong> el campo hasta el cliente (pue<strong>de</strong> ser un almacenista, un mayorista, una<br />
industria etc.). Esta figura realiza una <strong>la</strong>bor <strong>de</strong> comercialización y posicionamiento <strong>de</strong>l<br />
producto en distintos canales.<br />
Los corredores actúan <strong>de</strong> conexión entre el sector productor y los almacenistas, coordinando<br />
<strong>la</strong> recogida y el suministro. Lógicamente esta <strong>la</strong>bor lleva asociada un coste que en muchas<br />
ocasiones es un punto <strong>de</strong> inflexión para el sector.<br />
10.3 COMERCIALIZACIÓN EN DESTINO<br />
10.3.1 COMERCIALIZACIÓN DE PATATA A TRAVÉS DE LA RED DE MERCAS<br />
La distribución mayorista posee en España una infraestructura especial <strong>de</strong>bido a <strong>la</strong> existencia<br />
<strong>de</strong> una red <strong>de</strong> mercados centrales en <strong>de</strong>stino con participación pública (Empresa Nacional<br />
Mercasa). España cuenta con esta estructura <strong>de</strong> <strong>la</strong> Red <strong>de</strong> MERCAS que contiene 23 Unida<strong>de</strong>s<br />
Alimentarias.<br />
En esta Red están ubicadas unas 2.000 empresas <strong>de</strong> distribución mayorista <strong>de</strong> frutas,<br />
hortalizas y patatas. A través <strong>de</strong> esta Red se comercializa el 24% <strong>de</strong>l total <strong>de</strong> patatas que se<br />
ven<strong>de</strong>n en nuestro país.<br />
Los Mercas constituyen un verda<strong>de</strong>ro eje vertebrador <strong>de</strong>l comercio <strong>de</strong> productos frescos, si<br />
bien es variable su importancia en función <strong>de</strong>l producto. En los últimos años está sufriendo<br />
una gran presión por parte <strong>de</strong> <strong>la</strong> distribución mo<strong>de</strong>rna, que exige una mayor dimensión y<br />
capacidad <strong>de</strong> comercialización a los operadores mayoristas.<br />
El mayorista <strong>de</strong> un Mercado Central ha sido históricamente el proveedor habitual <strong>de</strong> <strong>la</strong> tienda<br />
tradicional o comercio <strong>de</strong>tallista. El minorista ha perdido en los últimos diez años gran parte<br />
<strong>de</strong> su cuota <strong>de</strong> mercado pese a que su importancia re<strong>la</strong>tiva en frescos sigue jugando un papel<br />
importante.<br />
122
Comercialización <strong>de</strong> patata a través <strong>de</strong> los Mercas<br />
La red <strong>de</strong> Mercas ha comercializado durante el año 2009 635,4 miles <strong>de</strong> t, siendo el 24% <strong>de</strong>l<br />
consumo nacional <strong>de</strong> este producto. Del total comercializado hay dos ejes principales que son<br />
MERCAMADRID con 179.043 t y MERCABARNA con 192.040 t; lo que representa un 58,4 % <strong>de</strong>l<br />
total <strong>de</strong> <strong>la</strong>s patatas comercializadas a través <strong>de</strong> este canal.<br />
TABLA 10.1: COMERCIALIZACIÓN DE PATATA A TRAVES DE LA RED DE MERCAS, EXPRESADA EN MILES DE TONELADAS.<br />
MERCAS/AÑO 2000 2001 2002 2003 2004 2005 2006 2007 2008 2009<br />
Media<br />
00/09<br />
MERCABARNA 147,5 160,8 171,0 178,8 173,5 178,1 192,9 199,6 197,7 192,0 179,2<br />
MERCAMADRID 80,9 82,1 74,8 73,0 76,4 68,1 54,0 110,7 181,7 179,0 98,1<br />
MERCASEVILLA 59,8 61,5 59,0 62,6 59,9 54,5 50,4 44,0 45,0 45,9 54,2<br />
MERCALASPALMAS 31,0 34,6 35,7 38,4 38,0 43,4 43,5 38,6 43,1 41,3 38,8<br />
MERCAPALMA 19,9 19,1 17,8 17,9 18,3 17,6 17,8 18,2 18,3 21,4 18,6<br />
MERCAGRANADA 27,0 23,5 19,3 17,1 17,6 14,4 14,5 13,3 12,1 14,1 17,3<br />
MERCAZARAGOZA 17,2 16,8 18,8 16,0 17,4 18,1 18,3 16,8 15,0 11,9 16,6<br />
OTROS 126,7 134,5 133,2 132,7 134,0 131,6 132,9 134,3 134,1 129,6 132,3<br />
TOTAL 510,0 532,8 529,4 536,6 535,0 525,7 524,3 575,6 646,9 635,4 555,2<br />
Fuente: MERCASA.<br />
GRAFICO 10.1: CANTIDAD DE PATATA COMERCIALIZADA. UNIDADES EXPRESADAS EN PORCENTAJE SOBRE EL TOTAL DE<br />
LA MEDIA EN LOS AÑOS 2000-2009.<br />
24%<br />
32%<br />
MERCABARNA<br />
MERCAMADRID<br />
MERCASEVILLA<br />
MERCALASPALMAS<br />
3%<br />
3%<br />
3%<br />
7%<br />
10%<br />
18%<br />
MERCAPALMA<br />
MERCAGRANADA<br />
MERCAZARAGOZA<br />
OTROS<br />
Fuente: MERCASA.<br />
Durante el año 2008 <strong>la</strong>s patatas supusieron el 14% <strong>de</strong>l volumen total <strong>de</strong> hortalizas<br />
comercializadas a través <strong>de</strong> <strong>la</strong> Red <strong>de</strong> Mercas, siendo asimismo el 5% <strong>de</strong>l valor. En lo que<br />
respecta a los tres mercados centrales <strong>de</strong> Castil<strong>la</strong> y León son muy poco significativos en<br />
cuanto al volumen comercializado <strong>de</strong> patata para consumo.<br />
La estacionalidad <strong>de</strong> <strong>la</strong> patata en <strong>la</strong> comercialización <strong>de</strong> este producto a través <strong>de</strong> este canal<br />
ha ido rompiéndose <strong>de</strong>bido principalmente a <strong>la</strong> importancia que ha ido tomando <strong>la</strong><br />
importación <strong>de</strong>s<strong>de</strong> distintos orígenes fuera <strong>de</strong> nuestras fronteras. Si hacemos una breve<br />
<strong>de</strong>scripción <strong>de</strong> los formatos más <strong>de</strong>mandados en estas unida<strong>de</strong>s <strong>de</strong> venta cabe <strong>de</strong>stacar:<br />
123
Formatos <strong>de</strong> gran capacidad y poco especializados (sacos <strong>de</strong> 10 a 25 Kg.).<br />
<strong>Patata</strong> sin <strong>la</strong>var o cepil<strong>la</strong>da.<br />
Varieda<strong>de</strong>s <strong>de</strong> <strong>de</strong>manda local o regional (por ejemplo Spunta en el Norte <strong>de</strong><br />
España, Red Pontiac en Cataluña, Kennebec en Galicia etc.).<br />
No se requiere ninguna especialización, ni certificaciones, ni suministro anual,<br />
etc. Principalmente precio competitivo.<br />
TABLA 10.2: COMERCIALIZACIÓN DE PATATA A TRAVES DE LA RED DE MERCAS, EXPRESADA EN MILLONES DE EUROS.<br />
MERCAS/AÑO 2000 2001 2002 2003 2004 2005 2006 2007 2008 2009 Media 00/09<br />
MERCABARNA 28,1 34,1 38,6 38,7 50,6 38,2 65,7 73,3 55,4 49,8 47,25<br />
MERCAMADRID 15,7 18,4 15,0 14,3 21,3 13,2 18,3 34,3 53,4 39,0 24,29<br />
MERCALASPALMAS 12,5 17,7 15,4 17,9 19,8 21,5 25,8 23,0 29,6 20,8 20,4<br />
MERCASEVILLA 12,7 14,5 13,1 15,0 18,0 11,5 16,5 15,0 12,7 12,2 14,12<br />
MERCAPALMA 7,5 9,0 8,0 8,2 10,2 7,2 9,6 10,2 9,8 10,9 9,06<br />
MERCAZARAGOZA 4,2 5,1 5,2 3,5 5,4 4,6 5,7 7,3 5,8 4,5 5,13<br />
MERCAGRANADA 5,9 5,5 4,1 3,8 5,5 3,6 5,4 4,6 3,4 2,7 4,45<br />
OTROS 36,4 45,1 42,7 44,0 53,9 44,5 57,9 63,4 56,8 47,7 49,24<br />
TOTAL 123,0 149,4 142,1 145,4 184,7 144,3 204,9 231,1 226,9 187,6 173,94<br />
Fuente: MERCASA.<br />
En <strong>la</strong> tab<strong>la</strong> anterior se muestra <strong>la</strong> información re<strong>la</strong>tiva al valor <strong>de</strong> <strong>la</strong> comercialización <strong>de</strong><br />
patatas en millones <strong>de</strong> euros en los años 2000-2009, don<strong>de</strong> se pue<strong>de</strong> observar como hay unas<br />
fluctuaciones importantes en función <strong>de</strong> <strong>la</strong> campaña que se consi<strong>de</strong>re.<br />
TABLA 10.3: CANTIDAD DE PATATA COMERCIALIZADA POR MERCAMADRID Y PRECIOS PAGADOS EN LOS AÑOS 2008 Y<br />
2009.<br />
2008 Entradas (Kg) Precio Medio (€/Kg) 2009 Entradas (Kg) Precio Medio (€/Kg)<br />
Enero 12.852.185 0,21 Enero 15.298.689 0,23<br />
Febrero 17.422.159 0,22 Febrero 12.416.032 0,23<br />
Marzo 11.870.375 0,21 Marzo 14.167.541 0,25<br />
Abril 12.779.412 0,23 Abril 13.856.430 0,28<br />
Mayo 13.280.336 0,34 Mayo 15.335.704 0,25<br />
Junio 18.258.485 0,40 Junio 16.700.091 0,19<br />
Julio 13.394.400 0,27 Julio 16.062.210 0,16<br />
Agosto 14.476.172 0,23 Agosto 15.076.398 0,15<br />
Septiembre 16.967.252 0,25 Septiembre 15.125.470 0,13<br />
Octubre 15.102.623 0,24 Octubre 16.679.606 0,12<br />
Noviembre 14.007.156 0,25 Noviembre 15.035.466 0,13<br />
Diciembre 21.262.638 0,24 Diciembre<br />
Fuente: MERCAMADRID.<br />
124
Por su parte, en <strong>la</strong> tab<strong>la</strong> 10.3 se muestran datos <strong>de</strong> como fluctúa el precio <strong>de</strong> <strong>la</strong> patata en<br />
Merca Madrid en los diferentes meses para los años 2008 y 2009.<br />
A continuación, se muestra en <strong>la</strong> tab<strong>la</strong> 10.4 y en el gráfico 10.2 los precios medios a los que <strong>la</strong><br />
red MERCASA (23 Uds.) han vendido <strong>la</strong> patata. Como se pue<strong>de</strong> observar en el gráfico 10.2 los<br />
precios han presentado, en general, un continuo incremento <strong>de</strong>s<strong>de</strong> el año 2000 (0,24€/Kg.)<br />
hasta el año 2008 (0,35 €/Kg.). Según esta fuente, el año que más se ha pagado por <strong>la</strong> patata<br />
fue el año 2007 (0,40 €/kg). Por su parte, el precio medio correspondiente al año 2009 sería<br />
<strong>de</strong> 0,30 €/kg.<br />
TABLA 10.4. PRECIO MEDIO AL QUE SE HA VENDIDO LA PATATA EN LA RED MERCASA, ENTRE 2000-2008, EN €/Kg.<br />
2000 2001 2002 2003 2004 2005 2006 2007 2008 2009 Media 00/09<br />
0,24 0,28 0,27 0,27 0,35 0,27 0,39 0,40 0,35 0,30 0,31<br />
Fuente: MERCASA.<br />
GRÁFICO 10.2. EVOLUCIÓN DE LOS PRECIOS DE MERCASA EN LA SERIE DE AÑOS 2000-2008.<br />
0,45<br />
0,40<br />
0,35<br />
0,30<br />
0,25<br />
0,20<br />
0,15<br />
0,10<br />
0,05<br />
0,00<br />
2000 2001 2002 2003 2004 2005 2006 2007 2008 2009<br />
Fuente: MERCASA.<br />
10.3.2 MAYORISTAS EN ORIGEN Y DESTINO<br />
Esta figura <strong>de</strong> <strong>la</strong> ca<strong>de</strong>na <strong>de</strong> suministro es importante si bien es cierto que en los últimos años<br />
esta ha perdido peso <strong>de</strong>bido a <strong>la</strong> importancia que ha tomado <strong>la</strong> gran distribución en este<br />
proceso <strong>de</strong> comercialización <strong>de</strong> patatas.<br />
Contro<strong>la</strong>n y son los encargados <strong>de</strong> <strong>la</strong> venta a los <strong>de</strong>tallistas, pero como veíamos<br />
anteriormente también pue<strong>de</strong>n poseer almacenes en origen o <strong>de</strong>stino para acondicionar el<br />
producto a <strong>la</strong>s necesida<strong>de</strong>s <strong>de</strong> los clientes. (Esto pue<strong>de</strong> implicar hasta tener sus propios<br />
125
productores a los cuales les suministran <strong>la</strong> semil<strong>la</strong> y les compran <strong>la</strong> producción para evitar<br />
intermediarios y obtener mayor rentabilidad <strong>de</strong> su negocio).<br />
Este agente <strong>de</strong> <strong>la</strong> ca<strong>de</strong>na se suele ubicar en <strong>la</strong> Red <strong>de</strong> Mercas o cercano a el<strong>la</strong>. Si no tienen<br />
almacenes propios que les suministren se suelen abastecer <strong>de</strong> cooperativas, almacenes e<br />
incluso intermediarios (que les pue<strong>de</strong>n ven<strong>de</strong>r sacos directamente <strong>de</strong>s<strong>de</strong> el campo).<br />
La venta como ya hemos visto suele ser <strong>de</strong> patata sin <strong>la</strong>var y cepil<strong>la</strong>da en formatos que van<br />
<strong>de</strong>s<strong>de</strong> 10 hasta 25 Kg. normalmente. La calidad visual no es importante si bien en ocasiones<br />
se valora mucho <strong>la</strong> calidad culinaria en función <strong>de</strong>l cliente final.<br />
En cuanto al precio <strong>de</strong> compra suele ser muy variable en función <strong>de</strong> cómo esté el mercado, al<br />
contrario <strong>de</strong>l precio <strong>de</strong> compra <strong>de</strong> <strong>la</strong> gran distribución, que es más estable y suelen por lo<br />
menos mantenerlo por campañas<br />
10.4 CANALES DE COMERCIALIZACIÓN<br />
En cuanto al lugar <strong>de</strong> compra <strong>de</strong> patatas según observamos en el gráfico siguiente los hogares<br />
recurrieron mayoritariamente para realizar sus adquisiciones <strong>de</strong> patatas a supermercados<br />
(40% <strong>de</strong> cuota <strong>de</strong> mercado) seguido <strong>de</strong> establecimientos especializados (27% <strong>de</strong> cuota <strong>de</strong><br />
mercado), mientras que el hipermercado concentra el 15 %.El autoconsumo representa un 8%,<br />
mientras que los mercadillos tienen una cuota <strong>de</strong> mercado <strong>de</strong>l 3%. Las otras formas<br />
comerciales acaparan el 7% restante.<br />
CUOTA DE MERCADO EN LA DISTRIBUCION<br />
100%<br />
90%<br />
80%<br />
70%<br />
60%<br />
50%<br />
40%<br />
30%<br />
20%<br />
10%<br />
0%<br />
1<br />
TOTAL DISTRIBUCION<br />
OTRAS FORMAS<br />
COMERCIALES<br />
AUTOCONSUMO<br />
MERCADILLOS<br />
HIPERMERCADOS<br />
SUPERMERCADOS<br />
ESTABLECIMIENTOS<br />
ESPECIALIZADOS<br />
Fuente: E<strong>la</strong>boración propia a partir <strong>de</strong> los datos <strong>de</strong>l MARM 2009.<br />
126
Las ca<strong>de</strong>nas <strong>de</strong> distribución que poseen una mayor participación en <strong>la</strong> distribución <strong>de</strong> patata<br />
fresca son, por este or<strong>de</strong>n el Grupo Carrefour, Mercadona, Grupo Eroski y Grupo Auchan. Con<br />
una cuota <strong>de</strong> mercado inferior al 1%, merece <strong>la</strong> pena mencionar a distribuidores como<br />
Ahorramás, Covirán, Consum o Gadisa entre otros.<br />
Es necesario seña<strong>la</strong>r que el Grupo Carrefour está formado por Carrefour y DIA,<br />
establecimientos con fórmu<strong>la</strong> discount que acaparan un 4% <strong>de</strong> cuota. Por su parte el Grupo<br />
Eroski está formado por los establecimientos <strong>de</strong> Eroski y Caprabo, a los Alcampo hay que<br />
sumar Sabeco y Simplymarket.<br />
La patata fresca es adquirida por casi el 90% <strong>de</strong> los hogares españoles a un precio medio<br />
(Fuente: TNS, 2008) <strong>de</strong> 0.68 Euros / Kg. y <strong>la</strong> frecuencia <strong>de</strong> compra es <strong>de</strong> 10 veces al año, es<br />
<strong>de</strong>cir cada hogar emplea en consumir <strong>la</strong> cantidad media comprada (7.17 Kg.) algo más <strong>de</strong> un<br />
mes.<br />
10.4.1 DISTRIBUCIÓN ALIMENTARIA EN CASTILLA Y LEÓN<br />
Castil<strong>la</strong> y León tiene 2.557.330 habitantes y una extensión <strong>de</strong> 93.000 km², un 5,5 % y un 18,6<br />
% sobre el total nacional, respectivamente. León, Val<strong>la</strong>dolid, Sa<strong>la</strong>manca y Burgos son <strong>la</strong>s<br />
cuatro provincias que superan los 300.000 habitantes. En función <strong>de</strong>l gasto medio por persona<br />
y comparado con los niveles nacionales, Castil<strong>la</strong> y León tiene un po<strong>de</strong>r <strong>de</strong> compra un 4 %<br />
inferior a <strong>la</strong> media nacional.<br />
En Castil<strong>la</strong> y León se cuantifican 23.240 activida<strong>de</strong>s comerciales minoristas especializadas en<br />
alimentación, que ocupan 1.136.316 m². Val<strong>la</strong>dolid tiene el 22 % <strong>de</strong> <strong>la</strong> superficie; León llega<br />
al 19 %; Sa<strong>la</strong>manca cuenta con un 12,8 %; Burgos tiene el 15,2 %; Palencia un 7,6 %; Ávi<strong>la</strong> un<br />
6,9 %; Zamora un 6,7 %; Segovia un 6,3 % y por último, Soria un 3,7 %.<br />
127
En el conjunto <strong>de</strong> <strong>la</strong> comunidad autónoma hay insta<strong>la</strong>dos 1.056 supermercados y 23<br />
hipermercados (estos 1.079 establecimientos ocupan 606.347 m² y suponen una <strong>de</strong>nsidad<br />
comercial <strong>de</strong> 241 m² por 1.000 habitantes).<br />
SUPERFICIE DE ALIMENTACION POR FORMATOS<br />
COMERCIALES EN CASTILLA Y LEON<br />
43%<br />
SUPERMERCADOS<br />
HIPERMERCADOS<br />
37%<br />
20%<br />
COMERCIO<br />
ESPECIALIZADO<br />
Fuente: Revista “Distribución y Consumo”.<br />
10.5 DIFERENCIAS EN LA COMERCIALIZACIÓN DE PATATA DE CASTILLA Y LEÓN Vs FRANCIA<br />
Vamos a realizar una especial reflexión <strong>de</strong> <strong>la</strong>s posibles diferencias existentes a <strong>la</strong> hora <strong>de</strong><br />
comprar patatas por parte <strong>de</strong> los diferentes operadores (principalmente almacenistas) en<br />
función <strong>de</strong> su proce<strong>de</strong>ncia; en este caso hab<strong>la</strong>remos <strong>de</strong> Castil<strong>la</strong> y León y Francia (<strong>la</strong>s<br />
producciones coinci<strong>de</strong>n en tiempo con lo cual son c<strong>la</strong>ramente competidoras). Las exigencias<br />
cualitativas que imponen los compradores a <strong>la</strong> hora <strong>de</strong> realizar sus acuerdos comerciales con<br />
el sector productor normalmente vienen basadas en <strong>la</strong>s condiciones que establece <strong>la</strong> gran<br />
distribución (que son <strong>la</strong>s que exigimos todos los consumidores cuando vamos a realizar <strong>la</strong><br />
compra) a sus suministradores.<br />
<br />
La elección <strong>de</strong> varieda<strong>de</strong>s por parte <strong>de</strong> los productores franceses se realiza en base a<br />
<strong>la</strong>s características <strong>de</strong>l suelo y esto da lugar a producciones <strong>de</strong> mejor calidad y<br />
mayores rendimientos. En Castil<strong>la</strong> y León, según consta en <strong>la</strong>s encuestas realizadas, <strong>la</strong><br />
elección <strong>de</strong> <strong>la</strong> semil<strong>la</strong> obe<strong>de</strong>ce a factores muy distintos: precios, calibre, servicio<br />
post-venta, compromiso con almacenista distribuidor, precocidad, accesibilidad, etc.<br />
<br />
Manipu<strong>la</strong>ción <strong>de</strong> <strong>la</strong>s patatas; en Francia se tratan como si fueran “huevos” lo cual<br />
implica que durante <strong>la</strong>s diferentes fases <strong>de</strong>s<strong>de</strong> <strong>la</strong> recolección, selección hasta <strong>la</strong><br />
128
calibración se realiza con máximo esmero para evitar golpes y cortes que disminuyen<br />
<strong>la</strong> calidad <strong>de</strong>l producto final.<br />
Conservación: Es uno <strong>de</strong> los puntos c<strong>la</strong>ves y diferenciadores entre ambas<br />
producciones. Francia tiene <strong>la</strong> capacidad y sobre todo el conocimiento para conservar<br />
sus patatas en cámaras <strong>de</strong> conservación <strong>de</strong>s<strong>de</strong> los meses <strong>de</strong> septiembre y octubre<br />
hasta abril o mayo en condiciones idóneas para su posterior comercialización. Esto<br />
supone una ventaja competitiva <strong>de</strong>bido a que son capaces <strong>de</strong> suministrar al mercado,<br />
a partir <strong>de</strong> los meses <strong>de</strong> diciembre y enero sin tener competencia alguna ya que en<br />
Castil<strong>la</strong> y León, casi no se conserva patata para consumo fresco y <strong>la</strong> que se almacena<br />
no cumple los requisitos <strong>de</strong> calidad que <strong>de</strong>manda el mercado.<br />
Mentalidad <strong>de</strong> los productores franceses que dotan a su producción <strong>de</strong> valor añadido<br />
y <strong>la</strong>s adaptan a <strong>la</strong> necesida<strong>de</strong>s <strong>de</strong> los operadores (seleccionan, calibran, conservan y<br />
suministran <strong>la</strong>s patatas en función <strong>de</strong> lo que se <strong>de</strong>manda) frente a los productores<br />
regionales que comercializan casi toda su producción <strong>de</strong>s<strong>de</strong> <strong>la</strong> tierra sin ningún tipo<br />
<strong>de</strong> c<strong>la</strong>sificación ni selección.<br />
Disponibilidad <strong>de</strong> varieda<strong>de</strong>s <strong>de</strong>bido a que hay un gran abanico <strong>de</strong> opciones<br />
adaptadas a <strong>la</strong>s necesida<strong>de</strong>s comerciales <strong>de</strong> los diferentes operadores. Este hecho<br />
posibilita el realizar una correcta segmentación <strong>de</strong>l mercado.<br />
129
ANEXO I :<br />
CADENA DE VALOR DE LA PATATA EN CASTILLA Y LEÓN<br />
ACTORES<br />
PRINCIPALES<br />
AGRICULTOR PROVEEDORES EN ORIGEN COMERCIO MINORISTA MODERNO<br />
ETAPAS DE<br />
ACTIVIDAD<br />
PRODUCCIÓN<br />
TRANSPORTE<br />
A ALMACÉN<br />
ALMACENAJE<br />
EN<br />
ORIGEN Y/O<br />
DESTINO<br />
MANIPULACIÓ<br />
N Y ENVASADO<br />
TRANSPORTE<br />
A DESTINO<br />
ALMACENAJE<br />
EN DESTINO<br />
TRANSPORTE<br />
AL PUNTO DE<br />
VENTA<br />
COMERCIALIZA<br />
CIÓN EN EL<br />
PUNTO DE<br />
VENTA<br />
• Producción :<br />
Siembra<br />
Fertilización<br />
Irrigación<br />
Tratamientos<br />
Fitosanitarios<br />
• Recolección manual<br />
y/o mecánica<br />
• Venta <strong>de</strong> <strong>la</strong><br />
producción<br />
• Transporte<br />
normalmente por<br />
cuenta <strong>de</strong>l comprador<br />
•Recepción (pesaje,<br />
control <strong>de</strong> calidad,<br />
inicio <strong>de</strong>l sistema <strong>de</strong><br />
trazabilidad)<br />
•Selección y calibración<br />
•Tratamiento postcosecha<br />
(opcional)<br />
•Almacenaje frigorífico<br />
•Lavado<br />
•Calibrado<br />
•Destríos<br />
•Envasado<br />
•Paletización <strong>de</strong> <strong>la</strong><br />
mercancía<br />
•Preparación <strong>de</strong> los<br />
pedidos para el cliente<br />
•Expedición y<br />
transporte a <strong>de</strong>stino<br />
(p<strong>la</strong>taformas <strong>de</strong><br />
distribución y/o<br />
mercas)<br />
•Actividad comercial :<br />
Recepción <strong>de</strong> los<br />
pedidos <strong>de</strong> tienda<br />
Pedidos a<br />
proveedores<br />
•Actividad logística :<br />
Recepción, entradas<br />
<strong>de</strong> mercancía en<br />
p<strong>la</strong>taforma<br />
Ubicación y picking<br />
Prep. y consolidación<br />
pedidos tienda<br />
Control stock<br />
•Transporte para<br />
entrega al punto <strong>de</strong><br />
venta o <strong>la</strong>s diferentes<br />
tiendas.<br />
• Pedidos a p<strong>la</strong>taforma<br />
•Recepción entregas <strong>de</strong><br />
p<strong>la</strong>taforma<br />
•Ubicación y gestión en<br />
los lineales<br />
•Reposición<br />
•Control <strong>de</strong> mermas<br />
•Control <strong>de</strong> caducidad<br />
•Compra asistida<br />
•Gestión <strong>de</strong> envases<br />
•Gestión <strong>de</strong> punto <strong>de</strong><br />
venta.<br />
PROCESOS DE<br />
FORMACIÓN<br />
DE PRECIOS<br />
PRECIOS DE ORIGEN:<br />
• Costes Producción<br />
• Costes Recolección<br />
COSTE DEL<br />
TRANSPORTE DE<br />
COMPRA<br />
COSTES DE TRANSFORMACIÓN:<br />
• Manipu<strong>la</strong>ción<br />
• Mermas<br />
• Almacenaje Frigorífico<br />
COSTE DEL<br />
TRANSPORTE DE<br />
VENTA<br />
COSTE DE<br />
DISTRIBUCIÓN<br />
= P.V.P.<br />
FINAL<br />
• Envasado<br />
0, 14 €<br />
0,015 0,20 0,035 0,29<br />
+ + + +<br />
20,5 % 2 % 30 % 5 % 42,5 %<br />
=<br />
0,68<br />
100 %<br />
130
COSTE DE ACTIVIDADES DE LA CADENA DE VALOR DE LA PATATA DE CALIDAD EN CASTILLA Y LEÓN<br />
PRODUCCIÓN PROVEDOR EN ORIGEN DISTRIBUCIÓN MINORISTA<br />
+ +<br />
PRECIO PROMEDIO<br />
EN ORIGEN (20,5%)<br />
TRANSPORTE A<br />
ALMACEN (2%)<br />
COSTES DE<br />
ALMACENAJE/MANIPULACIÓN<br />
ENVASADO (30%)<br />
Margen<br />
Gastos Generales<br />
Mermas y <strong>de</strong>strío<br />
Envases y Emba<strong>la</strong>jes<br />
TRANSPORTE A<br />
PLATAFORMA (5%)<br />
COSTES DE<br />
DISTRIBUCIÓN (42,5%)<br />
Margen<br />
Servicios Centrales<br />
Actividad tienda<br />
Actividad p<strong>la</strong>taforma<br />
MQD<br />
P.V.P.medio 2008(TNS)<br />
0,14 € + 0,015 + 0,20 + 0,035 + 0,29 = 0,68<br />
El precio en origen supone 1/5 <strong>de</strong>l precio final <strong>de</strong>l producto.<br />
El coste <strong>de</strong> manipu<strong>la</strong>ción en origen y el transporte a <strong>de</strong>stino, supone un tercio <strong>de</strong>l valor final <strong>de</strong>l producto.<br />
El coste <strong>de</strong> <strong>la</strong>s activida<strong>de</strong>s en <strong>de</strong>stino superan el 40% <strong>de</strong>l valor final <strong>de</strong>l producto.<br />
El total <strong>de</strong> transporte supone un 7% <strong>de</strong>l valor final <strong>de</strong>l producto, que pue<strong>de</strong> llegar hasta un 12%, si se aña<strong>de</strong> el coste <strong>de</strong> <strong>la</strong><br />
p<strong>la</strong>taforma en <strong>de</strong>stino.<br />
131
132
133
134
11 SITUACIÓN DE LA PATATA DE SIEMBRA<br />
La patata <strong>de</strong> siembra tiene unas peculiarida<strong>de</strong>s que <strong>la</strong> diferencian mucho <strong>de</strong> <strong>la</strong> patata <strong>de</strong><br />
consumo. A continuación se exponen <strong>la</strong>s particu<strong>la</strong>rida<strong>de</strong>s <strong>de</strong> este cultivo.<br />
11.1 PRODUCCIÓN DE PATATA DE SIEMBRA<br />
11.1.1 PATATA DE SIEMBRA EN EL MUNDO<br />
La evolución <strong>de</strong> <strong>la</strong> producción mundial <strong>de</strong> patata <strong>de</strong> siembra obe<strong>de</strong>ce al siguiente gráfico.<br />
GRÁFICO 11.1: PRODUCCIÓN MUNDIAL DE SEMILLA DE PATATA Y DE PATATA, EXPRESADO EN MILES DE TONELADAS.<br />
Fuente: E<strong>la</strong>boración propia. Datos Faostat 2009.<br />
Los principales países productores <strong>de</strong> patata <strong>de</strong> siembra <strong>de</strong>l mundo son Rusia (19,53%),<br />
Ucrania (15,93%), China (8,91%), India (7,91) y Polonia (4,49%). Ho<strong>la</strong>nda, a pesar <strong>de</strong> que sus<br />
compañías semilleras son lí<strong>de</strong>res mundiales en obtenciones varietales y mejora genética, sólo<br />
produce el 0,88% <strong>de</strong>l total <strong>de</strong> patata <strong>de</strong> siembra mundial.<br />
Como se pue<strong>de</strong> observar, <strong>la</strong> producción <strong>de</strong> patata <strong>de</strong> siembra está <strong>de</strong>scendiendo. Las causas<br />
<strong>de</strong> ese <strong>de</strong>scenso <strong>de</strong> producción, según se observa en <strong>la</strong> gráfica adjunta, no son una menor<br />
producción global <strong>de</strong> patata, sino que es <strong>de</strong>bido fundamentalmente al avance <strong>de</strong> rendimientos<br />
en <strong>la</strong> producción conseguidos en <strong>la</strong>s últimas cuatro décadas.<br />
135
De hecho, los datos ofrecidos por FAOSTAT confirman que en los últimos 40 años el<br />
rendimiento por hectárea ha subido un 24% sobre el existente en el año 1969. Este dato<br />
explica <strong>la</strong> bajada <strong>de</strong> producción <strong>de</strong>l 28% <strong>de</strong> <strong>la</strong> patata <strong>de</strong> siembra.<br />
Esta ten<strong>de</strong>ncia es muy previsible que se mantenga en el futuro.<br />
11.2 PATATA DE SIEMBRA EN LA UE<br />
La producción <strong>de</strong> patata <strong>de</strong> siembra en <strong>la</strong> Unión Europea está dominada básicamente por<br />
cuatro países: Ho<strong>la</strong>nda, Francia, Reino Unido y Alemania.<br />
Los datos básicos <strong>de</strong> los países más importantes <strong>de</strong>s<strong>de</strong> el punto <strong>de</strong> vista <strong>de</strong> <strong>la</strong> producción y el<br />
comercio son los siguientes:<br />
Ho<strong>la</strong>nda: (Según NIVAP HOLLAND).<br />
Superficie <strong>de</strong>stinada a patata <strong>de</strong> siembra: 36.500 ha.<br />
Cantidad Certificada: 1.200.000 t.<br />
Francia: (Según GNIS (Interprofesional francesa <strong>de</strong> semil<strong>la</strong>s).<br />
Superficie <strong>de</strong>stinada a patata <strong>de</strong> siembra: 15.000 ha.<br />
Cantidad Certificada: 420.000t.<br />
Reino Unido (Según BPC).<br />
Superficie <strong>de</strong>stinada a patata <strong>de</strong> siembra: 14.300 ha.<br />
Cantidad Certificada: 300.000t.<br />
En este marco, <strong>de</strong>ntro <strong>de</strong> <strong>la</strong> UE, el principal factor dominante es <strong>la</strong> creciente concentración <strong>de</strong><br />
un reducido grupo <strong>de</strong> casas comerciales, principalmente <strong>de</strong> capital ho<strong>la</strong>ndés.<br />
Estas empresas hacen importantes inversiones en el <strong>de</strong>sarrollo <strong>de</strong> nuevas varieda<strong>de</strong>s, y<br />
comercializan sus semil<strong>la</strong>s en cualquier lugar <strong>de</strong>l mundo con el apoyo <strong>de</strong> exportadores<br />
distribuidores europeos. Los productores <strong>de</strong> patata <strong>de</strong> siembra ho<strong>la</strong>n<strong>de</strong>ses son mejores<br />
profesionales incluso que los productores <strong>de</strong> patata <strong>de</strong> consumo, lo que nos da una i<strong>de</strong>a c<strong>la</strong>ra<br />
<strong>de</strong> <strong>la</strong> importancia manifiesta <strong>de</strong>l sector productor <strong>de</strong> patata <strong>de</strong> siembra en esta región.<br />
Los únicos países que han aumentado levemente el área <strong>de</strong> producción <strong>de</strong>dicada a patata <strong>de</strong><br />
siembra <strong>de</strong>s<strong>de</strong> comienzos <strong>de</strong> los noventa han sido Ho<strong>la</strong>nda y Francia. Más <strong>de</strong> un tercio <strong>de</strong> <strong>la</strong><br />
superficie <strong>de</strong> patata <strong>de</strong> siembra <strong>de</strong> <strong>la</strong> UE-25 está situada en Ho<strong>la</strong>nda. Cabe <strong>de</strong>stacar cómo<br />
Francia está evolucionando en este mercado gracias a <strong>la</strong>s favorables condiciones<br />
agroclimáticas, y a que Ho<strong>la</strong>nda tiene cada vez más problemas sanitarios para <strong>la</strong> producción<br />
<strong>de</strong> semil<strong>la</strong>.<br />
136
La caída <strong>de</strong> superficie <strong>de</strong> patata <strong>de</strong> siembra es aguda en los nuevos Estados Miembros (Letonia<br />
-9,3%, Eslovaquia -8,5%, Hungría -6,9% y Polonia -3,7%). En estos países el proceso <strong>de</strong><br />
certificación <strong>de</strong> semil<strong>la</strong>s no está tan <strong>de</strong>sarrol<strong>la</strong>do como en <strong>la</strong> Europa occi<strong>de</strong>ntal, y su mejora<br />
es necesaria para superar <strong>de</strong>ficiencias que aún limitan <strong>la</strong> comercialización <strong>de</strong> semil<strong>la</strong><br />
certificada en los mercados <strong>de</strong> <strong>la</strong> UE-15. Por tanto, <strong>de</strong>ben adaptarse a <strong>la</strong>s normas o criterios<br />
que <strong>de</strong>manda el mercado. Según <strong>la</strong> Comisión Europea, hay signos <strong>de</strong> cambios positivos,<br />
especialmente en <strong>la</strong> República Checa, don<strong>de</strong> buenas calida<strong>de</strong>s varietales, con perspectivas <strong>de</strong><br />
mercados dinámicos, están siendo producidas y comercializadas. Países punteros en <strong>la</strong><br />
comercialización <strong>de</strong> patata <strong>de</strong> siembra como Ho<strong>la</strong>nda y Francia ya están <strong>de</strong>sarrol<strong>la</strong>ndo<br />
varieda<strong>de</strong>s en estos países, lo que les dará c<strong>la</strong>ras opciones <strong>de</strong> futuro.<br />
Las ten<strong>de</strong>ncias que prevalecen en <strong>la</strong> obtención <strong>de</strong> varieda<strong>de</strong>s son <strong>la</strong>s dirigidas a incrementar <strong>la</strong><br />
segmentación en el uso <strong>de</strong> <strong>la</strong> patata.<br />
QUÉ SE BUSCA EN LAS NUEVAS VARIEDADES<br />
PATATA CONSUMO EN FRESCO<br />
-Segmentación <strong>de</strong> mercado (cocer, guisar,<br />
freír…etc.).<br />
-Aptitud culinaria especialmente para freír.<br />
(consumo doméstico)<br />
-Menor ciclo <strong>de</strong> cultivo (precocidad).<br />
PATATA USO INDUSTRIAL<br />
-Optima aptitud para fritura<br />
-Conservaciones prolongadas sin acumu<strong>la</strong>ción <strong>de</strong><br />
azúcares reductores.<br />
-Mejorar los rendimientos en los procesos<br />
productivos (disminución <strong>de</strong> mermas…etc.)<br />
-Producción <strong>de</strong> patatas bajas en calorías<br />
-Introducción <strong>de</strong> nuevos conceptos re<strong>la</strong>cionados con sentidos, emociones, sensaciones… (patata<br />
sabrosa, ligera, <strong>de</strong>licada, familiar…)<br />
-Evitar el par<strong>de</strong>amiento, oxidación…etc. ( en<br />
-Mejores cualida<strong>de</strong>s para el <strong>la</strong>vado.<br />
patata <strong>de</strong> cuarta gama)<br />
-Mayores rendimientos por hectárea.<br />
-Menores necesida<strong>de</strong>s hídricas<br />
-Mejor resistencia a enfermeda<strong>de</strong>s, p<strong>la</strong>gas…etc.<br />
A continuación se muestra una tab<strong>la</strong> completa (Tab<strong>la</strong> 11.1) y su gráfico correspondiente<br />
(Gráfico 11.2) don<strong>de</strong> se reflejan <strong>la</strong>s superficies cultivadas en cada Estado Miembro para <strong>la</strong><br />
producción <strong>de</strong> patata <strong>de</strong> siembra, y también se refleja <strong>la</strong> evolución <strong>de</strong> esa superficie en los<br />
últimos 8 años:<br />
137
TABLA 11.1 SUPERFICIE DE PATATA DE SIEMBRA EN LOS PAÍSES DE LA U.E.<br />
AÑOS<br />
PAÍS 1.999 2.001 2.002 2.003 2.004 2.005 2.006 2007 Rango % sobre 2007 Promedio<br />
SUPERFICIE EN HAS.<br />
MALTA 0,0% 0,00<br />
ITALIA 1.000,00 1.000,00 1.000,00 1.000,00 1.000,00 0,00 1.000,00 115,75 0,1% 764,47<br />
POLONIA 6.322,00 6.011,00 4.785,00 5.440,14 5.734,40 5,2% 5.658,5<br />
CHIPRE 153,00 94,00 88,00 90,00 89,00 0,1% 102,80<br />
ESTONIA 84,00 111,00 187,00 247,00 236,84 0,2% 173,17<br />
FINLANDIA 1.584,00 1.541,00 1.541,00 1.536,00 1.536,00 1.536,00 1.280,00 1.277,00 1,2% 1.478,88<br />
PORTUGAL 71,00 30,00 28,00 34,00 44,00 30,00 21,56 11,01 0,0% 33,70<br />
BULGARIA 327,38 315,47 0,3% 321,43<br />
REP.CHECA 4.753,00 4.932,00 4.504,00 3.743,60 3.835,10 3,5% 4.353,5<br />
ESLOVENIA 100,00 72,00 40,00 42,10 46,62 0,0% 60,14<br />
ALEMANIA 19.967,00 18.481,00 17.690,00 17.429,00 18.804,00 16.819,00 16.345,00 16.410,00 14,8% 17.743,1<br />
ESPAÑA 4.015,00 3.549,00 3.476,00 3.063,00 2.871,00 2.766,00 2.753,47 2.837,90 2,6% 3.166,42<br />
LITUANIA 275,00 292,00 148,00 203,29 278,53 0,3% 239,36<br />
HOLANDA 39.200,00 38.300,00 37.558,00 36.843,00 39.432,00 38.600,00 34.400,00 35.882,00 32,4% 37.526,9<br />
FRANCIA 14.052,00 14.008,00 13.195,00 13.928,00 14.688,00 14.297,00 14.500,00 14.000,00 12,6% 14.083,5<br />
LETONIA 392,00 502,00 235,00 251,59 281,74 0,3% 332,47<br />
BÉLGICA 2.194,00 2.010,00 1.939,00 2.037,00 2.152,00 2.114,00 2.012,00 1.847,96 1,7% 2.038,25<br />
HUNGRÍA 1.117,00 1.128,00 436,00 429,39 395,40 0,4% 701,16<br />
IRLANDA 2.153,00 1.545,00 1.544,00 1.730,00 1.343,00 1.514,00 1.739,00 1.607,14 1,5% 1.646,89<br />
ESLOVAQUIA 1.851,00 1.466,00 825,00 721,20 970,54 0,9% 1.166,75<br />
AUSTRIA 1.373,00 1.473,00 1.271,00 1.344,00 1.481,00 1.512,00 1.402,15 1.536,05 1,4% 1.424,03<br />
SUECIA 2.202,00 1.865,00 1.835,00 1.829,00 1.843,00 1.712,00 1.368,00 1.156,00 1,0% 1.726,25<br />
GRECIA 580,00 500,00 500,00 590,00 550,00 308,00 500,00 415,00 0,4% 492,88<br />
DINAMARCA 4.784,00 5.176,00 4.383,00 4.294,00 4.715,00 4.089,00 3.750,00 3.751,00 3,4% 4.367,8<br />
RUMANIA 2.385,50 2.789,30 2,5% 2.587,40<br />
LUXEMBURGO 562,00 0,00 438,00 418,00 411,00 114,00 100,00 429,32 0,4% 309,04<br />
REINO UNIDO 18.598,00 15.619,00 16.117,00 14.675,00 14.939,00 14.083,00 13.994,86 14.465,00 13,07% 15.311,4<br />
U.E. 112.335,00 105.097,00 102.515,00 115.797,00 120.417,00 110.742,00 109.047,23 110.714,07 100,00% 110.833,04<br />
CAST. Y LEÓN 2.818,00 2.616,00 2.546,00 2.195,00 2.210,00 2.003,00 1.986,41 1.987,55 1,80% 2.295,25<br />
ESPAÑA SIN C.YL. 1.197,00 933,00 930,00 868,00 661,00 763,00 767,06 850,35 0,77% 871,18<br />
Fuente: Centro <strong>de</strong> Control <strong>Patata</strong> <strong>de</strong> Siembra, D.G.Producción Agropecuaria. Junta <strong>de</strong> Castil<strong>la</strong> y León<br />
138
GRÁFICO 11.2 EVOLUCIÓN DE LA SUPERFICIE DE PATATA DE SIEMBRA, EN LOS PRINCIPALES PAÍSES DE LA .UE, EXPRESADA EN HECTÁREAS.<br />
PATATA DE SIEMBRA EN PAÍSES DE LA UE<br />
45.000,00<br />
40.000,00<br />
35.000,00<br />
30.000,00<br />
HECTÁREAS<br />
25.000,00<br />
20.000,00<br />
15.000,00<br />
FRANCIA<br />
HOLANDA<br />
ALEMANIA<br />
REINO UNIDO<br />
ESPAÑA<br />
CAST. Y LEÓN<br />
10.000,00<br />
5.000,00<br />
0,00<br />
1.999 2.001 2.002 2.003 2.004 2.005 2.006 2007<br />
AÑO<br />
Fuente: Varias. E<strong>la</strong>boración propia..<br />
139
11.3 COMERCIO DE LA PATATA DE SIEMBRA.<br />
11.3.1 SITUACIÓN EN LA U.E<br />
El comercio total <strong>de</strong> patata <strong>de</strong> siembra en <strong>la</strong> UE en los últimos 8 años está caracterizado por<br />
que <strong>la</strong>s exportaciones <strong>de</strong> los países miembros suelen ser el doble que <strong>la</strong>s importaciones.<br />
Este hecho nos ofrece una visión c<strong>la</strong>ra <strong>de</strong>l éxito europeo en patata <strong>de</strong> siembra. Dentro <strong>de</strong>l<br />
total <strong>de</strong> <strong>la</strong>s exportaciones <strong>de</strong> <strong>la</strong> UE, dos tercios pertenecen a Ho<strong>la</strong>nda.<br />
Las exportaciones europeas <strong>de</strong> semil<strong>la</strong> <strong>de</strong> patata son variables, pero en los últimos ocho años<br />
se han situado en torno al millón <strong>de</strong> tone<strong>la</strong>das <strong>de</strong> patata <strong>de</strong> siembra. De esta cantidad,<br />
Ho<strong>la</strong>nda representa en torno a un 66%, <strong>de</strong> tal manera que por sí so<strong>la</strong>, exporta más tone<strong>la</strong>das<br />
<strong>de</strong> patata <strong>de</strong> siembra que <strong>la</strong> cantidad que importan todos los países <strong>de</strong> <strong>la</strong> UE.<br />
A continuación se ofrece una gráfica (Gráfico 11.3) don<strong>de</strong> se indica <strong>la</strong> cantidad <strong>de</strong> patata <strong>de</strong><br />
siembra exportada por <strong>la</strong> UE y su valor en euros, así como <strong>la</strong> contribución <strong>de</strong> los principales<br />
países exportadores.<br />
140
GRÁFICO 11.3: EXPORTACIONES DE PATATA DE SIEMBRA, DEL TOTAL DE PAÍSES DE LA U.E, EXPRESADAS EN TONELADAS.<br />
1.200.000,<br />
600.000,<br />
EXPORTACIONES TOTALES Tm<br />
1.000.000,<br />
500.000,<br />
EXPORTACIONES INTRACOMUNITARIAS Tm<br />
EXPORTACIONES TERCEROS PAÍSES Tm<br />
EXPORTACIONES TERCEROS PAISES €<br />
800.000,<br />
400.000,<br />
EXPORTACIONES TOTALES €<br />
EXPORTACIONES INTRACOMUNITARIAS €<br />
TONELADAS<br />
600.000,<br />
400.000,<br />
300.000,<br />
200.000,<br />
200.000,<br />
100.000,<br />
0,<br />
2001 2002 2003 2004 2005 2006 2007 2008<br />
0,<br />
Fuente: Eurostacom, ICEX 2009.E<strong>la</strong>boración propia.<br />
141
Como se pue<strong>de</strong> observar en <strong>la</strong> gráfica anterior, en <strong>la</strong> zona enmarcada con un círculo<br />
azul se produce un aumento <strong>de</strong>l valor <strong>de</strong> <strong>la</strong>s exportaciones sin haber un aumento <strong>de</strong> <strong>la</strong> cantidad<br />
exportada, lo que indica que en estos años el valor <strong>de</strong> <strong>la</strong> patata <strong>de</strong> siembra se ha incrementado<br />
sensiblemente, sobre todo <strong>la</strong> <strong>de</strong>dicada al comercio intracomunitario, pues en <strong>la</strong>s gráficas <strong>de</strong><br />
exportaciones a terceros países no se observa esa ten<strong>de</strong>ncia.<br />
Las exportaciones <strong>de</strong> patata <strong>de</strong> siembra fuera <strong>de</strong> <strong>la</strong> UE suponen alre<strong>de</strong>dor <strong>de</strong> un 43% <strong>de</strong>l total<br />
<strong>de</strong> <strong>la</strong>s exportaciones, mientras que <strong>la</strong>s exportaciones que tienen como <strong>de</strong>stino los países <strong>de</strong> <strong>la</strong><br />
UE suponen <strong>de</strong> media un 57% <strong>de</strong>l total <strong>de</strong> exportaciones.<br />
Los principales países <strong>de</strong>stino <strong>de</strong> <strong>la</strong>s exportaciones europeas son <strong>de</strong> <strong>la</strong> cuenca mediterránea<br />
(Argelia, Egipto, Arabia Saudí, Líbano, Israel, Túnez...) a<strong>de</strong>más <strong>de</strong> Rusia, Suiza…etc.<br />
Tanto Francia como el Reino Unido se disputan el segundo y tercer lugar (el Reino Unido tiene<br />
un mayor peso en el sector <strong>de</strong> <strong>la</strong> patata <strong>de</strong> industria) por volumen <strong>de</strong> exportaciones, pero<br />
siempre suponiendo entre seis y siete veces menos que <strong>la</strong>s exportaciones ho<strong>la</strong>n<strong>de</strong>sas.<br />
Como se aprecia en <strong>la</strong> gráfica, el valor <strong>de</strong> <strong>la</strong>s exportaciones va aparejado al volumen <strong>de</strong> <strong>la</strong>s<br />
mismas, si bien se aprecia en los dos últimos años un incremento <strong>de</strong>l valor <strong>de</strong> <strong>la</strong>s exportaciones<br />
mayor al incremento <strong>de</strong> volumen experimentado, lo que indica que el precio unitario <strong>de</strong> <strong>la</strong>s<br />
exportaciones <strong>de</strong> patata <strong>de</strong> siembra está experimentando un fuerte avance. Si bien <strong>la</strong>s<br />
exportaciones comunitarias en su conjunto han aumentado en volumen un 10% en los últimos 8<br />
años, los precios lo han hecho un 34%. Más l<strong>la</strong>ma <strong>la</strong> atención lo que ocurre con <strong>la</strong>s<br />
exportaciones ho<strong>la</strong>n<strong>de</strong>sas, pues el volumen apenas varía pero el precio ascien<strong>de</strong> casi un 40%<br />
sobre el precio existente en 2001.<br />
Respecto a <strong>la</strong>s importaciones, a continuación se presenta <strong>la</strong> siguiente gráfica (Gráfica 11.4):<br />
142
GRÁFICA 11.4: IMPORTACIONES DE PATATA DE SIEMBRA, DEL TOTAL DE PAÍSES DE LA U.E, EXPRESADAS EN TONELADAS.<br />
Fuente: EUROSTACOM, ICEX 2009. E<strong>la</strong>boración propia.<br />
143
Las importaciones <strong>de</strong> los países <strong>de</strong> <strong>la</strong> UE están dominadas por el comercio intracomunitario<br />
(sólo se importa <strong>de</strong>s<strong>de</strong> países <strong>de</strong> <strong>la</strong> UE: Ho<strong>la</strong>nda, Francia y Reino Unido principalmente),<br />
siendo <strong>la</strong>s importaciones extracomunitarias <strong>de</strong> carácter prácticamente testimonial; a<strong>de</strong>más<br />
en este caso <strong>la</strong> ten<strong>de</strong>ncia es c<strong>la</strong>ramente <strong>de</strong>creciente, pues en los últimos 7 años han<br />
disminuido <strong>de</strong>s<strong>de</strong> 22.197 tone<strong>la</strong>das (año 2003) a <strong>la</strong>s 807 tone<strong>la</strong>das <strong>de</strong>l año 2008.<br />
Las exportaciones <strong>de</strong> los miembros <strong>de</strong> <strong>la</strong> UE 15 sufren más variaciones que el comercio<br />
intracomunitario. Los principales mercados <strong>de</strong> <strong>de</strong>stino son los situados en el norte <strong>de</strong> África,<br />
<strong>de</strong> hecho Egipto y Argelia absorben entre un 35 – 40% <strong>de</strong> <strong>la</strong>s exportaciones <strong>de</strong> <strong>la</strong> UE.<br />
Marruecos y Turquía representan también un mercado muy interesante para <strong>la</strong>s empresas<br />
productoras <strong>de</strong> patata <strong>de</strong> siembra europeas. Las ventas en ese último país (Turquía)<br />
actualmente no son muy altas, sobre 10.000 tone<strong>la</strong>das, pero se están incrementando<br />
rápidamente (+58% anual).<br />
Por otra parte, el mercado intracomunitario creció un 1,5% <strong>de</strong>s<strong>de</strong> 1.990. Este crecimiento es<br />
principalmente una consecuencia <strong>de</strong>l incremento <strong>de</strong> <strong>la</strong> concentración <strong>de</strong> <strong>la</strong>s empresas<br />
suministradoras <strong>de</strong> patata <strong>de</strong> siembra en Ho<strong>la</strong>nda. Algunas firmas ho<strong>la</strong>n<strong>de</strong>sas, como Agrico®,<br />
HZPC®, Stet Hol<strong>la</strong>nd®, Van Rijn®… etc. son lí<strong>de</strong>res mundiales. Estas empresas han<br />
consolidado su posición en <strong>la</strong> UE y buscan mercados prósperos en terceros países. Estos<br />
hechos hacen que Ho<strong>la</strong>nda sea el principal proveedor <strong>de</strong> patata <strong>de</strong> siembra con una cuota <strong>de</strong><br />
mercado osci<strong>la</strong>nte entre el 65% -70% (periodo 2000-2008) en el total <strong>de</strong>l comercio<br />
intracomunitario, más <strong>la</strong>s exportaciones que realizan fuera <strong>de</strong> <strong>la</strong> UE.<br />
Otros países con cierta importancia en el comercio <strong>de</strong> patata <strong>de</strong> siembra son Francia (8,6%),<br />
Alemania (4,4%), Reino Unido (9,1%), Bélgica/Luxemburgo (5,9%) y Dinamarca (4,1%). En<br />
estos países operan empresas <strong>de</strong> gran importancia como EUROPLANT®, MEIJER®, POTATO<br />
MASTERS®, Irish Potato Marketing Ltd…etc.<br />
Los países <strong>de</strong> <strong>la</strong> UE-6 (Alemania, Italia, Francia, Ho<strong>la</strong>nda, Bélgica y Luxemburgo) consumen el<br />
48% <strong>de</strong> <strong>la</strong>s producciones intracomunitarias. Sin embargo, Italia y España son los mayores<br />
importadores <strong>de</strong> patata <strong>de</strong> siembra <strong>de</strong> <strong>la</strong> UE, con una cuota respectivamente <strong>de</strong>l 18% y <strong>de</strong>l<br />
13,4%. En Italia, Agrico®, HZPC® y Europ<strong>la</strong>nt® comercializan el 80% <strong>de</strong>l total <strong>de</strong> patata <strong>de</strong><br />
siembra <strong>de</strong>l país. En España, <strong>la</strong> importación <strong>de</strong> patata <strong>de</strong> siembra alcanza el 70% <strong>de</strong>l mercado<br />
nacional (Agrico® y HZPC® son lí<strong>de</strong>res). Portugal y Grecia también son importantes<br />
receptores <strong>de</strong> patata <strong>de</strong> siembra comunitaria, suponiendo respectivamente el 8% y el 4,6%<br />
<strong>de</strong>l total intracomunitario.<br />
144
Como se ha comentado, <strong>la</strong> estructura industrial <strong>de</strong> <strong>la</strong> patata <strong>de</strong> siembra cada vez se<br />
caracteriza más por una fuerte concentración en el negocio <strong>de</strong> obtención varietal, mientras<br />
que <strong>la</strong> producción y distribución <strong>de</strong> <strong>la</strong> semil<strong>la</strong> certificada se lleva a cabo por varias empresas<br />
que operan en diferentes mercados y con distintos volúmenes. Los crecientes costes <strong>de</strong><br />
transporte y <strong>la</strong> protección <strong>de</strong> <strong>la</strong> Propiedad Intelectual también tienen su impacto en <strong>la</strong><br />
organización <strong>de</strong> <strong>la</strong> industria <strong>de</strong> <strong>la</strong> patata <strong>de</strong> siembra.<br />
Este encarecimiento <strong>de</strong> los costes <strong>de</strong> transporte pue<strong>de</strong> provocar que los obtentores <strong>de</strong><br />
varieda<strong>de</strong>s limiten su negocio a <strong>la</strong> genética y sus conocimientos, <strong>de</strong>jando <strong>la</strong> multiplicación a<br />
otros. Ellos proveerán <strong>de</strong> genética, know-how y licencias a operadores locales que se<br />
ocuparán <strong>de</strong> cuidar <strong>de</strong> su multiplicación y comercialización.<br />
En <strong>la</strong> UE, <strong>la</strong> mayoría <strong>de</strong> empresas están asumiendo procesos <strong>de</strong> “globalización” <strong>de</strong> su negocio<br />
mediante <strong>la</strong> absorción <strong>de</strong> firmas extranjeras. Por ejemplo, <strong>la</strong>s multinacionales ho<strong>la</strong>n<strong>de</strong>sas<br />
adquirieron algunas empresas francesas que producían patata <strong>de</strong> siembra con el resultado <strong>de</strong><br />
que el comercio <strong>de</strong> patata <strong>de</strong> siembra entre Ho<strong>la</strong>nda y Francia ha disminuido, pero los<br />
royalties pagados a <strong>la</strong>s compañías ho<strong>la</strong>n<strong>de</strong>sas están creciendo, ya que Francia está<br />
multiplicando material base ho<strong>la</strong>ndés.<br />
Las firmas europeas también pue<strong>de</strong>n colocar zonas <strong>de</strong> producción fuera <strong>de</strong> <strong>la</strong> UE. A esca<strong>la</strong><br />
mundial, por ejemplo, muchos países con importantes producciones (China) no cultivan<br />
varieda<strong>de</strong>s aceptables para frito a esca<strong>la</strong>s suficientes y esto brinda oportunida<strong>de</strong>s a lo <strong>la</strong>rgo<br />
<strong>de</strong> todo el p<strong>la</strong>neta para <strong>la</strong>s compañías productoras <strong>de</strong> patata <strong>de</strong> siembra europeas. Por ello,<br />
estas compañías han extendido sus campos <strong>de</strong> ensayo por todo el globo.<br />
Por otra parte, existe algo que ayuda a <strong>la</strong> expansión <strong>de</strong> estas compañías, y es que los ajustes<br />
generados por ciertas normas medioambientales pue<strong>de</strong>n provocar <strong>la</strong> <strong>de</strong>slocalización <strong>de</strong> <strong>la</strong>s<br />
zonas tradicionales <strong>de</strong> producción <strong>de</strong> semil<strong>la</strong>s. Pero el respeto a estas normas respon<strong>de</strong><br />
también al interés <strong>de</strong> <strong>la</strong> industria <strong>de</strong> patata <strong>de</strong> siembra en el sentido <strong>de</strong> que una mayor<br />
intensificación <strong>de</strong> <strong>la</strong> producción pue<strong>de</strong> provocar, a medio p<strong>la</strong>zo, el <strong>de</strong>terioro <strong>de</strong>l negocio, por<br />
lo que <strong>la</strong> <strong>de</strong>slocalización no es una ma<strong>la</strong> opción.<br />
145
11.4 LA PATATA DE SIEMBRA EN ESPAÑA Y EN CASTILLA Y LEÓN<br />
11.4.1 SUPERFICIES<br />
La patata <strong>de</strong> siembra en España se produce principalmente en tres comunida<strong>de</strong>s autónomas:<br />
Castil<strong>la</strong> y León, País Vasco (Á<strong>la</strong>va) y Navarra. De <strong>la</strong>s tres, <strong>la</strong> más importante en producción y<br />
en superficie es Castil<strong>la</strong> y León, que en el año 2009 suponía el 71,3% <strong>de</strong>l total <strong>de</strong> superficie.<br />
A continuación se muestra el gráfico (Gráfico 11.5) <strong>de</strong> <strong>la</strong> evolución <strong>de</strong> <strong>la</strong> superficie nacional y<br />
el tanto por ciento que representa Castil<strong>la</strong> y León en esa superficie nacional:<br />
GRÁFICO 11.5: EVOLUCIÓN EN HECTÁREAS, DE LA SUPERFICIE DE PATATA DE SIEMBRA EN CASTILLA Y LEÓN Y<br />
PORCENTAJE CON RESPECTO A ESPAÑA.<br />
73,5<br />
3000<br />
73<br />
72,5<br />
Hectareas<br />
Porcentaje<br />
2500<br />
72<br />
71,5<br />
2000<br />
71<br />
1500<br />
70,5<br />
70<br />
1000<br />
69,5<br />
69<br />
500<br />
68,5<br />
Año 2000 Año 2001 Año 2002 Año 2003 Año 2004 Año 2005 Año 2006 Año 2007 Año 2008 Año 2009<br />
0<br />
Fuente: Dirección General <strong>de</strong> Producción Agropecuaria. Junta <strong>de</strong> Castil<strong>la</strong> y León.<br />
Como se pue<strong>de</strong> observar, el porcentaje <strong>de</strong> patata <strong>de</strong> siembra en Castil<strong>la</strong> y León respecto<br />
al total <strong>de</strong> España se mantiene, pese a que <strong>la</strong> superficie sembrada en España ha<br />
disminuido. Ello quiere <strong>de</strong>cir que en referencia a España, Castil<strong>la</strong> y León ha disminuido<br />
en <strong>la</strong> misma proporción que el resto <strong>de</strong> España.<br />
11.4.2 MARCO LEGISLATIVO Y DEFINICIONES.<br />
Los condicionantes legales <strong>de</strong> <strong>la</strong> patata <strong>de</strong> siembra en España son los siguientes:<br />
• Directiva 2002/56/CE <strong>de</strong>l Consejo <strong>de</strong> 13 <strong>de</strong> junio <strong>de</strong> 2002, re<strong>la</strong>tiva a <strong>la</strong><br />
comercialización <strong>de</strong> patatas <strong>de</strong> siembra.<br />
146
• Ley 30/2006, <strong>de</strong> 26 <strong>de</strong> julio, <strong>de</strong> semil<strong>la</strong>s y p<strong>la</strong>ntas <strong>de</strong> vivero y recursos fitogenéticos.<br />
• Real Decreto 1891/2008, <strong>de</strong> 14 <strong>de</strong> noviembre, por el que se aprueba el Reg<strong>la</strong>mento<br />
para <strong>la</strong> autorización y registro <strong>de</strong> los productores <strong>de</strong> semil<strong>la</strong>s y p<strong>la</strong>ntas <strong>de</strong> vivero y su<br />
inclusión en el Registro nacional <strong>de</strong> productores.<br />
• A nivel <strong>de</strong> Castil<strong>la</strong> y León, existe el Reg<strong>la</strong>mento Técnico <strong>de</strong> Control y Certificación <strong>de</strong><br />
<strong>Patata</strong> <strong>de</strong> Siembra en Castil<strong>la</strong> y León, aprobado por Or<strong>de</strong>n <strong>de</strong> 17 <strong>de</strong> marzo <strong>de</strong> 1.998<br />
<strong>de</strong> <strong>la</strong> Consejería <strong>de</strong> Agricultura y gana<strong>de</strong>ría, y su posterior modificación <strong>de</strong>l 4 <strong>de</strong><br />
marzo <strong>de</strong> 2.000.<br />
Estas disposiciones normativas establecen <strong>la</strong>s condiciones <strong>de</strong> producción y comercialización<br />
<strong>de</strong> semil<strong>la</strong>s.<br />
La semil<strong>la</strong> <strong>de</strong> patata, como el resto <strong>de</strong> semil<strong>la</strong>s, está amparada internacionalmente por<br />
<strong>de</strong>rechos <strong>de</strong> <strong>la</strong> propiedad industrial, <strong>de</strong> tal manera que los obtentores <strong>de</strong> una <strong>de</strong>terminada<br />
variedad se reservan los <strong>de</strong>rechos <strong>de</strong> producción <strong>de</strong> <strong>la</strong> semil<strong>la</strong> durante un <strong>de</strong>terminado<br />
número <strong>de</strong> años. En el caso <strong>de</strong> <strong>la</strong> patata, <strong>la</strong> protección alcanza los 20 y los 30 años,<br />
<strong>de</strong>pendiendo <strong>de</strong>l registro en el que esté inscrita <strong>la</strong> variedad y <strong>de</strong>l número <strong>de</strong> generaciones <strong>de</strong><br />
semil<strong>la</strong> que se obtengan hasta llegar al productor <strong>de</strong> patata <strong>de</strong> consumo, que varían en los<br />
diferentes estados miembros <strong>de</strong> <strong>la</strong> Unión Europea. Por ello, en España, al igual que en<br />
Castil<strong>la</strong> y León, hay numerosas varieda<strong>de</strong>s que no se pue<strong>de</strong>n multiplicar libremente, pues sus<br />
<strong>de</strong>rechos <strong>de</strong> multiplicación pertenecen al obtentor (generalmente empresas <strong>de</strong> capital<br />
ho<strong>la</strong>ndés). Por ello en Castil<strong>la</strong> y León respecto a <strong>la</strong>s varieda<strong>de</strong>s <strong>de</strong> patata existentes<br />
so<strong>la</strong>mente se pue<strong>de</strong>n multiplicar varieda<strong>de</strong>s:<br />
a) Obtenidas por Appacale (Asociación <strong>de</strong> Productores <strong>de</strong> <strong>Patata</strong> <strong>de</strong> Siembra <strong>de</strong> Castil<strong>la</strong><br />
y León), que ha cedido <strong>la</strong> explotación a sus socios productores (Cooperativas).<br />
b) Varieda<strong>de</strong>s “libres”, una vez pasado el período <strong>de</strong> protección.<br />
c) Varieda<strong>de</strong>s protegidas, mediante el pago <strong>de</strong> los correspondientes royalties.<br />
11.4.3 DEMOGRAFÍA DE LAS ZONAS PRODUCTORAS DE PATATA DE SIEMBRA.<br />
EMPLAZAMIENTO DE LAS EXPLOTACIONES PRODUCTORAS<br />
La patata <strong>de</strong> siembra se produce en 108 localida<strong>de</strong>s (campaña 2.008/09), en el norte <strong>de</strong> <strong>la</strong>s<br />
provincias <strong>de</strong> Burgos y Palencia.<br />
Estas zonas gozan <strong>de</strong> unas condiciones tan favorables para conseguir una buena sanidad en<br />
los cultivos, que es difícil encontrar<strong>la</strong>s en otras zonas <strong>de</strong> España.<br />
147
El Boletín Oficial <strong>de</strong> Castil<strong>la</strong> y León publica anualmente <strong>la</strong>s localida<strong>de</strong>s y términos<br />
autorizados para <strong>la</strong> producción <strong>de</strong> patata <strong>de</strong> siembra en cada campaña. Las zonas a <strong>la</strong>s que<br />
pertenecen estas localida<strong>de</strong>s son <strong>la</strong>s siguientes:<br />
-LOSA<br />
-VALDELUCIO<br />
-EL TOZO<br />
-LA VALDIVIA<br />
-LOS ALTOS<br />
-UBIERNA<br />
- TREVIÑO<br />
- MEDINA-LOSA<br />
- LA OJEDA<br />
- LA LORA<br />
- TOBALINA<br />
La evolución en los últimos 16 años <strong>de</strong>l número <strong>de</strong> localida<strong>de</strong>s don<strong>de</strong> se ha cultivado patata<br />
<strong>de</strong> siembra, <strong>de</strong>l número <strong>de</strong> agricultores co<strong>la</strong>boradores y <strong>de</strong> <strong>la</strong> superficie por co<strong>la</strong>borador es <strong>la</strong><br />
siguiente (Tab<strong>la</strong> 11.2):<br />
TABLA 11.2. DATOS DE LA PRODUCCIÓN DE PATATA DE SIEMBRA EN CASTILLA Y LEÓN.<br />
CAMPAÑA Nº LOCALIDADES Nº COLABORADORES HAS./COLABORADOR<br />
1.992/93 151 865 4,19<br />
1.996/97 141 528 5,41<br />
2.000/01 139 399 6,47<br />
2.003/04 117 336 6,53<br />
2.005/06 112 296 6,77<br />
2.008/09 108 270 6,99<br />
Variación % - 28% - 69% + 67%<br />
Fuente: APPACALE, 2009.<br />
Se observa que en 16 años ha habido una reducción <strong>de</strong>l 28 % en el número <strong>de</strong> localida<strong>de</strong>s<br />
productoras, el número <strong>de</strong> agricultores co<strong>la</strong>boradores se ha reducido en un 69% y ha<br />
aumentado el tamaño <strong>de</strong> explotación en un 67% hasta <strong>la</strong>s 6,99 Has.<br />
148
11.5 ANÁLISIS DEL SECTOR PRODUCTOR<br />
11.5.1 ENTIDADES PRODUCTORAS<br />
La patata <strong>de</strong> siembra se produce y comercializa a través <strong>de</strong> Entida<strong>de</strong>s Productoras.<br />
Los tipos <strong>de</strong> productores vienen <strong>de</strong>finidos en el mencionado Real Decreto 1891/2008, que en<br />
su artículo 3º <strong>de</strong>fine los tipos siguientes:<br />
“a) Productor obtentor, son los que producen material parental o inicial <strong>de</strong> <strong>la</strong>s varieda<strong>de</strong>s o<br />
clones obtenidas por ellos o <strong>de</strong> <strong>la</strong>s que son causahabientes, previo trabajo <strong>de</strong> selección, y<br />
cuyo <strong>de</strong>stino sea su multiplicación. Pue<strong>de</strong>n producir asimismo semil<strong>la</strong>s y p<strong>la</strong>ntas <strong>de</strong> vivero <strong>de</strong><br />
base y, en su caso, <strong>de</strong> prebase. Producen semil<strong>la</strong> súper élite y élite.<br />
b) Productor seleccionador, son los que producen semil<strong>la</strong> o p<strong>la</strong>ntas <strong>de</strong> vivero <strong>de</strong> categoría<br />
inicial, base, o en su caso, <strong>de</strong> prebase. Esta producción <strong>la</strong> pue<strong>de</strong>n realizar por sí mismos o<br />
por agrupación o convenio con otros productores. Asimismo pue<strong>de</strong>n producir semil<strong>la</strong>s y<br />
p<strong>la</strong>ntas <strong>de</strong> vivero <strong>de</strong> <strong>la</strong>s restantes categorías. Pue<strong>de</strong>n certificar semil<strong>la</strong> A.<br />
c) Productor multiplicador, son los que producen:<br />
1. Semil<strong>la</strong>s o p<strong>la</strong>ntas <strong>de</strong> vivero <strong>de</strong> categoría certificada como resultado <strong>de</strong> <strong>la</strong><br />
multiplicación <strong>de</strong> semil<strong>la</strong>s o p<strong>la</strong>ntas <strong>de</strong> vivero <strong>de</strong> base o, en su caso, <strong>de</strong> semil<strong>la</strong>s<br />
certificadas.<br />
2. Para <strong>la</strong>s especies en que los reg<strong>la</strong>mentos técnicos admitan tres categorías <strong>de</strong><br />
semil<strong>la</strong>s certificadas, estos productores únicamente podrán producir semil<strong>la</strong>s <strong>de</strong> <strong>la</strong>s<br />
dos últimas categorías.<br />
3. Semil<strong>la</strong>s o p<strong>la</strong>ntas <strong>de</strong> vivero <strong>de</strong> categorías estándar, CAC (conformitas agraria<br />
comunitatis) o comercial si estas categorías existen para <strong>la</strong> especie.<br />
La mayor parte <strong>de</strong> <strong>la</strong> producción <strong>la</strong> realizan cooperativas, que tienen el título <strong>de</strong> Productorseleccionador<br />
y algunos agricultores individuales con el título <strong>de</strong> productor-multiplicador que<br />
lo han obtenido en los últimos ocho años. Des<strong>de</strong> marzo <strong>de</strong> 2.003, Appacale (Agrupación <strong>de</strong><br />
Productores <strong>de</strong> patata <strong>de</strong> siembra <strong>de</strong> Castil<strong>la</strong> y León, S.A.) dispone <strong>de</strong>l título <strong>de</strong> Productor-<br />
149
Obtentor <strong>de</strong> patata <strong>de</strong> siembra, uno <strong>de</strong> los dos que existen en España, a<strong>de</strong>más <strong>de</strong> Neiker<br />
(País Vasco), y está tramitando el Título <strong>de</strong> Productor Seleccionador.<br />
Las principales Entida<strong>de</strong>s Productoras <strong>de</strong> patata <strong>de</strong> siembra <strong>de</strong> Castil<strong>la</strong> y León y que suponen<br />
el 90% <strong>de</strong> <strong>la</strong> superficie total <strong>de</strong> cultivo total son (Tab<strong>la</strong> 11.3):<br />
TABLA 11.3. PRINCIPALES ENTIDADES PRODUCTORAS DE PATATA DE SIEMBRA EN CASTILLA Y LEÓN.<br />
ENTIDAD PRODUCTORA<br />
Has.<br />
- SELECCIÓN Y COMERCIO DE PATATA S. Coop. (SEYCO) 380,00<br />
- Coop. SANTA ISABEL. 456,00<br />
- Coop. CULTIVADORES DE PATATA DE LA VALDIVIA (CULPAVAL) 356,97<br />
- Coop. SAN ISIDRO DE LOSA (COSIDEL) 358,77<br />
- Coop. EL CARMEN. 70,36<br />
- CALIXTO SERNA MELGOSA 67,50<br />
- S.A.T. Nª Sª <strong>de</strong> AHEDO. 39,14<br />
Fuente: APPACALE noviembre 2009.<br />
La evolución <strong>de</strong> <strong>la</strong> estructura productiva <strong>de</strong> <strong>la</strong> patata <strong>de</strong> siembra es distinta a <strong>la</strong> tomada en<br />
países don<strong>de</strong> el cultivo ha tenido un gran éxito y <strong>de</strong>sarrollo. Según datos aportados por<br />
APPACALE, SA, en <strong>la</strong> campaña 1.994-95 existían siete Entida<strong>de</strong>s Productoras con una<br />
superficie total <strong>de</strong> 2.709 has. y una producción <strong>de</strong> 30.663 t. y todas el<strong>la</strong>s tenían una<br />
superficie <strong>de</strong> cultivo superior a 50 Has. En <strong>la</strong> campaña 2.009/10 hay 19 Entida<strong>de</strong>s y<br />
agricultores multiplicadores que producen y comercializan patata <strong>de</strong> siembra en una<br />
superficie total <strong>de</strong> 1.959 has y una producción <strong>de</strong> unas 27.600 t <strong>de</strong> <strong>la</strong>s cuales so<strong>la</strong>mente<br />
siguen existiendo seis con una superficie superior a 50 Has.<br />
A nivel nacional existen 25 Entida<strong>de</strong>s y agricultores individuales que producen patata <strong>de</strong><br />
siembra certificada con lo que hay mucha dispersión <strong>de</strong> <strong>la</strong> oferta.<br />
11.5.2 EVOLUCIÓN DE LAS SUPERFICIES Y PRODUCCIONES<br />
La evolución <strong>de</strong> <strong>la</strong> superficie y <strong>de</strong> <strong>la</strong> producción <strong>de</strong> patata <strong>de</strong> siembra en Castil<strong>la</strong> y León en<br />
los últimos 13 años y su importancia con el total nacional se <strong>de</strong>tal<strong>la</strong> en el siguiente gráfico<br />
(Gráfico 11.6):<br />
150
GRÁFICO 11.6: EVOLUCIÓN DE LA SUPERFICIE Y PRODUCCIÓN DE PATATA DE SIEMBRA.<br />
Fuente: APPACALE, noviembre 2009. E<strong>la</strong>boración propia.<br />
La producción total nacional es <strong>de</strong> alre<strong>de</strong>dor <strong>de</strong> 40.000 tone<strong>la</strong>das, estabilizada en los últimos<br />
4 años.<br />
La superficie <strong>de</strong> cultivo <strong>de</strong> patata <strong>de</strong> siembra en el resto <strong>de</strong> <strong>la</strong> geografía nacional es <strong>la</strong><br />
siguiente: en País Vasco (Á<strong>la</strong>va) es <strong>de</strong> 470 ha., en Navarra <strong>de</strong> 268 Has, en Galicia <strong>de</strong> 11 Has<br />
(Campaña 2.008/09).<br />
A nivel <strong>de</strong> Castil<strong>la</strong> y León, Burgos supone el 74 % <strong>de</strong> <strong>la</strong> superficie <strong>de</strong> cultivo <strong>de</strong> Castil<strong>la</strong> y León<br />
y Palencia el 26 % (campaña 2.009/10) sobre un total <strong>de</strong> 1.959 Has.<br />
11.6 VARIEDADES CULTIVADAS Y SUS SUPERFICIES<br />
Los últimos datos oficiales <strong>de</strong> superficie (has.) y varieda<strong>de</strong>s a nivel nacional son los siguientes<br />
(Tab<strong>la</strong> 11.4):<br />
151
TABLA 11.4: SUPERFICIE CULTIVADA, PARA OBTENER PATATA DE SIEMBRA, POR VARIEDADES Y PROVINCIAS.<br />
VARIEDADES<br />
ÁLAVA CASTILLA Y LEÓN NAVARRA<br />
TOTAL<br />
HAS.<br />
2.006 2.007 2.008 2.009 2.006 2.007 2.008 2.009 2.006 2.007 2.008 2.009 2.009<br />
99P41-6 0,01 0,01<br />
AGATA 2,65 2,65<br />
AGRIA 41,45 65,92 73,76 50,06 81,00 104,35 13,73 9,46 11,94 190,05<br />
ANAIS 1,81 0,00<br />
ARRAN BANNER 4,3 4,55 0,9 1,17 1,6 1,1 1,8 1,80<br />
BARAKA 26,37 37,78 30,91 36,33 471,4 525,21 490,78 502,89 62,08 68,88 66,77 78,11 617,33<br />
BLANKA 13,55 3,67 5,55 1,52 2,48 2,68 4,02 4,8 6,32<br />
CAESAR 15,63 16,41 19,36 12,79 12,79<br />
CLAUSTAR 2 0,00<br />
DESIREE 23,84 27,46 14,27 14,4 80,18 86,8 66,58 77,69 11,84 17,41 12,39 16,75 108,84<br />
DRAGA 2,12 1,2 0,00<br />
FINA DE CARBALLO 0,02 0,02 0,22 1,5 0,22<br />
FINA DE GREDOS 0,08 0,08<br />
FRISIA 5,11 1,5 4,25 1,45 10,81<br />
GORBEA 22 21,51 7,99 3,82 3,82<br />
HARANA 0,07 0,07<br />
HERMES 22,66 12,3 13,95 10,63 21,05 18,96 14,48 8,9 5,48 8,18 27,71<br />
IRATI 0,92 1,14 1,45 0,00<br />
JAERLA 92,93 75,42 91,83 85,18 397,01 395,74 364,6 332,86 39,3 56,1 44,79 40,13 458,17<br />
JIMENA 0,34 4,39 2,43 2,43<br />
KENNEBEC 166,01 156,98 132,7 142,19 607,84 536,44 511,38 602,96 59,15 66,28 60,15 69,03 814,18<br />
KONDOR 2,54 2,57 6,98 2,4 27,59 28,6 23,51 36,09 38,49<br />
LEIRE 0,02 0,75 0,75 0,52 0,52<br />
MARFONA 15,71 10,12 11,15 13,35 14,67 19,9 11,31 12,8 26,15<br />
MARIANA 0,38 13,23 6 0,00<br />
MELIBEA 0,28 0,28<br />
MELODY 1,67 1,67<br />
MIRARI 0,14 0,14<br />
MONALISA 17,98 21,71 25,64 19,33 118,73 107,82 125,81 107,93 14,61 19,36 20,02 24,06 151,32<br />
NELA 0,36 12,97 9,48 9,48<br />
ORLA 1 1 0,00<br />
RED PONTIAC 65,39 69,71 38,51 43,2 117,68 73,43 53,08 59,11 31,3 36,55 22,03 15,72 118,03<br />
ROMANO 8,16 12,39 9,59 4,78 4,78<br />
SAHEL 2,2 2,5 0,00<br />
SMITHS COMET 3,97 0,6 3,97<br />
SPUNTA 25,58 32,29 24,28 34,9 83,27 77,68 88,51 74,97 13 28,61 21,76 17,14 127,01<br />
VALNERA 0,64 0,64<br />
ZORBA 9,8 11,27 4,72 1,02 1,02<br />
T O T A L 492,13 522,48 471,07 493,19 2.000,31 1.987,53 1.872,04 1.958,48 234,93 311,20 267,97 289,11 2.821,21<br />
Nota: Datos obtenidos <strong>de</strong> APPACALE. Las varieda<strong>de</strong>s sombreadas en amarillo son <strong>la</strong>s obtenidas por APPACALE.<br />
152
Como se pue<strong>de</strong> observar, <strong>la</strong> mayoría <strong>de</strong> <strong>la</strong>s varieda<strong>de</strong>s multiplicadas son libres (sin pago <strong>de</strong><br />
royalties). El resto <strong>de</strong> varieda<strong>de</strong>s o bien son <strong>la</strong>s obtenidas por instituciones públicas<br />
(Appacale, Neiker...etc.) o bien son varieda<strong>de</strong>s catalogadas como autóctonas.<br />
11.6.1. TIPOS DE VARIEDADES<br />
El Reg<strong>la</strong>mento Técnico <strong>de</strong> Certificación y control <strong>de</strong> <strong>la</strong> patata <strong>de</strong> siembra en Castil<strong>la</strong> y León,<br />
<strong>de</strong>fine en su artículo 3º <strong>la</strong>s categorías admisibles para <strong>la</strong> patata <strong>de</strong> siembra. Estas categorías<br />
son <strong>la</strong>s siguientes:<br />
• Material parental o <strong>de</strong> partida.<br />
• Semil<strong>la</strong>s <strong>de</strong> prebase (generaciones anteriores a semil<strong>la</strong>s <strong>de</strong> base).<br />
• Semil<strong>la</strong> <strong>de</strong> base.<br />
• Semil<strong>la</strong> certificada.<br />
En <strong>la</strong> categoría <strong>de</strong> base se distinguirán dos c<strong>la</strong>ses: Súper Elite (SE) y Elite (E).<br />
La SE proce<strong>de</strong> <strong>de</strong> <strong>la</strong> multiplicación <strong>de</strong> <strong>la</strong> última generación anterior a base, y a partir <strong>de</strong><br />
aquél<strong>la</strong> se obtendrá <strong>la</strong> E.<br />
En <strong>la</strong> categoría <strong>de</strong> semil<strong>la</strong> certificada se distinguen dos c<strong>la</strong>ses: A y B.<br />
La semil<strong>la</strong> <strong>de</strong> c<strong>la</strong>se A podrá proce<strong>de</strong>r <strong>de</strong> <strong>la</strong> multiplicación <strong>de</strong> semil<strong>la</strong> <strong>de</strong> base o <strong>de</strong><br />
generaciones anteriores, o <strong>de</strong> <strong>la</strong> misma c<strong>la</strong>se A cuando cump<strong>la</strong> con los requisitos <strong>de</strong> <strong>la</strong> semil<strong>la</strong><br />
<strong>de</strong> base.<br />
La semil<strong>la</strong> <strong>de</strong> c<strong>la</strong>se B proce<strong>de</strong>rá <strong>de</strong> <strong>la</strong> multiplicación <strong>de</strong> <strong>la</strong> <strong>de</strong> c<strong>la</strong>se A o <strong>de</strong> categorías<br />
superiores.<br />
La semil<strong>la</strong> que por su genealogía <strong>de</strong>biera pertenecer a una <strong>de</strong> <strong>la</strong>s c<strong>la</strong>ses anteriormente<br />
<strong>de</strong>finidas podrá ser c<strong>la</strong>sificada en otra inferior si no cumple los requisitos correspondientes a<br />
aquél<strong>la</strong> o, a propuesta <strong>de</strong>l productor, siempre que cump<strong>la</strong>n los requisitos exigidos en <strong>la</strong> c<strong>la</strong>se<br />
propuesta.<br />
En <strong>la</strong>s zonas productoras <strong>de</strong> Castil<strong>la</strong> y León, lo frecuente es adquirir en el extranjero semil<strong>la</strong><br />
SE o E y multiplicar para ven<strong>de</strong>r semil<strong>la</strong> A o B.<br />
Appacale, S.A. nació con <strong>la</strong> finalidad <strong>de</strong> proporcionar semil<strong>la</strong> <strong>de</strong> base (SE o E) a los<br />
cultivadores, pero esa finalidad a fecha <strong>de</strong> hoy no se ha logrado, pues si bien técnicamente<br />
se ha conseguido, económicamente no ha sido competitiva (según indica <strong>la</strong> propia entidad)<br />
153
esa producción con lo que los multiplicadores siguen <strong>de</strong>pendiendo <strong>de</strong>l extranjero para<br />
obtener semil<strong>la</strong> a<strong>de</strong>cuada.<br />
A<strong>de</strong>más, <strong>la</strong> calidad <strong>de</strong> <strong>la</strong> semil<strong>la</strong> importada <strong>de</strong>l extranjero en <strong>de</strong>terminadas ocasiones es<br />
bastante discutible, pues no cumplen con <strong>la</strong> calidad sanitaria seña<strong>la</strong>da en <strong>la</strong> legis<strong>la</strong>ción<br />
vigente y tampoco se ajustan muchas veces a <strong>la</strong>s varieda<strong>de</strong>s solicitadas.<br />
Según manifiestan los productores, el nivel <strong>de</strong> <strong>la</strong>s inspecciones fitosanitarias <strong>de</strong> <strong>la</strong> semil<strong>la</strong><br />
importada en <strong>de</strong>stino es muy <strong>la</strong>xo, pues éstas no superan el 10% <strong>de</strong>l total importado.<br />
Estas afirmaciones son perfectamente verificables si observamos <strong>la</strong> estrategia <strong>de</strong>l exportador<br />
en origen: él siempre estará interesado en colocar en sus mercados buena mercancía <strong>de</strong><br />
categoría A y B, pero seguramente tenga poco interés en colocar buena patata SE o E, que<br />
competirá el siguiente año con sus exportaciones <strong>de</strong> patata <strong>de</strong> siembra A o B.<br />
11.7 PRECIOS<br />
A continuación se ofrecen los precios medios orientativos <strong>de</strong> venta <strong>de</strong> semil<strong>la</strong> (Tab<strong>la</strong> 9.6),<br />
tanto para patata importada como para patata <strong>de</strong> producción nacional.<br />
TABLA 11.5: PRECIOS MEDIOS DE PATATA DE SIEMBRA PARA PRODUCIR CONSUMO (€/Kg.) EN EL AÑO 2009.<br />
NACIONAL (A)<br />
IMPORTADA (A)<br />
VARIEDAD 28/35 35/55 28/35 35/55<br />
AGRIA 0,81 0,50 1,30-1,40 0,70-0,80<br />
DESIREE 0,57 0,40 - -<br />
JAERLA 0,69 0,43 1,20-1,30 0,70-0,80<br />
MONALISA 0,73 0,42 1,30-1,40 0,70-0,80<br />
Fuente: APPACALE (nacional) y e<strong>la</strong>boración propia (importada).<br />
Tal y como se aprecia, los precios pagados por <strong>la</strong> patata extranjera llegan a ser hasta un 80%<br />
más caros que los <strong>de</strong> <strong>la</strong> patata nacional. Esto se podría explicar por el mayor valor añadido<br />
conseguido en <strong>la</strong> patata <strong>de</strong> importación (política comercial más acertada y otros servicios,<br />
como el <strong>de</strong> post-venta, más efectivos) y por los márgenes comerciales <strong>de</strong> los distribuidores.<br />
Asimismo, se ha observado que <strong>la</strong> disminución <strong>de</strong> los precios se <strong>de</strong>be en buena medida a que<br />
los comercializadores tienen abierta una guerra <strong>de</strong> precios que les hace ven<strong>de</strong>r patata <strong>de</strong><br />
siembra más barata <strong>de</strong> lo que sería <strong>de</strong>seable, perjudicando así los ingresos <strong>de</strong> los agricultores<br />
productores.<br />
154
TABLA 11.6: PRECIOS MEDIOS EN EL AÑO 2009 (€/Kg.), DE PATATA DE SIEMBRA IMPORTADA PARA MULTIPLICACIÓN “A”<br />
Y “E”, EN CALIBRE 35/55MM.<br />
VARIEDAD “A” “E”<br />
AGRIA 0,62 -<br />
DESIREE 0,35 0,42<br />
JAERLA 0,46 0,54<br />
MONALISA 0,50 0,60<br />
Fuente: APPACALE.<br />
11.8 IMPORTACIONES<br />
La evolución <strong>de</strong> <strong>la</strong> utilización <strong>de</strong> <strong>la</strong> patata <strong>de</strong> siembra nacional e importada en España y<br />
los porcentajes correspondientes son:<br />
TABLA 11.7: UTILIZACIÓN DE PATATA DE SIEMBRA CERTIFICADA NACIONAL E IMPORTADA (t.)<br />
TASA DE UTILIZACIÓN SOBRE TOTAL DE NECESIDADES EN PORCENTAJE.<br />
CAMPAÑA<br />
TOTAL NACIONAL IMPORTACIÓN UTILIZACIÓN<br />
(T.) (T.) % (T.) % %<br />
1985-86 130.503 97.888 75,0% 32.615 25,0% 26,9%<br />
1990-91 158.923 93.497 58,8% 65.426 41,2% 38,8%<br />
1995-96 124.374 46.490 37,4% 77.884 62,6% 39,2%<br />
2000-01 119.951 45.698 38,1% 74.253 61,9% 64,4%<br />
2005-06 128.753 36.610 28,4% 92.143 71,6% 86,9%<br />
2008-09* 123.328 35.800* 29,0% 87.528 71,0% 88,5%<br />
Fuente:APPACALE * Estimación.<br />
11.9 ENSAYOS DE POST CONTROL<br />
El Centro <strong>de</strong> Control <strong>de</strong> <strong>la</strong> <strong>Patata</strong> <strong>de</strong> Siembra, perteneciente a <strong>la</strong> Dirección General <strong>de</strong><br />
Producción Agropecuaria <strong>de</strong> <strong>la</strong> Junta <strong>de</strong> Castil<strong>la</strong> y León, realiza anualmente ensayos <strong>de</strong> postcontrol<br />
para evaluar <strong>la</strong> calidad sanitaria <strong>de</strong> <strong>la</strong> patata <strong>de</strong> siembra producida en España y en<br />
Castil<strong>la</strong> y León. Estos ensayos se hacen por encargo <strong>de</strong>l MARM para el control fitosanitario <strong>de</strong><br />
155
<strong>la</strong>s producciones <strong>de</strong> semil<strong>la</strong>; pero al carecer el Ministerio <strong>de</strong> recursos, se lo encomienda a <strong>la</strong>s<br />
Comunida<strong>de</strong>s Autónomas (Castil<strong>la</strong> y León y País Vasco en este caso).<br />
En los ensayos se evalúa el comportamiento <strong>de</strong>l 100% <strong>de</strong> los lotes <strong>de</strong> semil<strong>la</strong> producida en<br />
Castil<strong>la</strong> y León más parte <strong>de</strong> los lotes producidos en Navarra (<strong>la</strong> otra parte <strong>la</strong> evalúa el País<br />
Vasco junto con su propia producción). A<strong>de</strong>más, se evalúa un 5% aproximadamente <strong>de</strong> <strong>la</strong><br />
semil<strong>la</strong> importada <strong>de</strong>stinada a producir patata <strong>de</strong> consumo.<br />
De semil<strong>la</strong> importada para producir patata <strong>de</strong> siembra se evalúan todos los lotes; por una<br />
parte se les somete a análisis <strong>de</strong> <strong>la</strong>boratorio en Al<strong>de</strong>arrubia (Sa<strong>la</strong>manca) para <strong>de</strong>tectar <strong>la</strong><br />
presencia <strong>de</strong> patógenos <strong>de</strong> cuarentena (C<strong>la</strong>vibacter y Ralstonia) y por otra parte se les<br />
somete a una inspección visual para <strong>de</strong>tectar otras enfermeda<strong>de</strong>s (Rizoctonia, virus,<br />
nematodos…etc.).<br />
Los resultados <strong>de</strong> estos ensayos se muestran a continuación (Tab<strong>la</strong> 11.8):<br />
TABLA 11.8: RESULTADOS DE ENSAYOS DE POST-CONTROL DE PATATA DE SIEMBRA.<br />
NUMERO Nº Nº % Nº % Nº Nº Nº % OT. Nº Nº PIE<br />
CAMPAÑA LOTES SEM POD POD NAC NASC RAQ ENR Y E+Y VIR RHI MEZ NEG<br />
2004/05 1.724 106,2 1,0 1,0 99,0 93,2 1,0 0,1 1,8 1,9 0,0 0,1 0,1 0,3<br />
2005/06 1.426 104 1,7 1,5 95,4 91,8 1,2 0,3 3,4 4,0 0,0 0,1 0,2 0,2<br />
2006/07 1.398 99,5 1,9 1,7 87,4 84,1 4,8 0,2 5,0 6,5 0,0 0,1 0,1 0,8<br />
2007/08 1.463 110 1,8 1,6 96,6 92,7 1,1 0,1 2,6 3,2 0,0 0,1 0,1 1,3<br />
2008/09 1.348 104 1,9 1,7 96,7 93,0 0,3 0,04 0,86 0,95 0,01 0,10 0,10 0,24<br />
Nº SEM Número <strong>de</strong> tubérculos p<strong>la</strong>ntados<br />
Nº POD Número <strong>de</strong> tubérculos podridos<br />
% POD Porcentaje <strong>de</strong> podrido<br />
Nº NAC Número <strong>de</strong> p<strong>la</strong>ntas nacidas<br />
% NASC Porcentaje <strong>de</strong> nascencia<br />
Nº RAQ Número <strong>de</strong> p<strong>la</strong>ntas raquíticas<br />
Nº ENR Número <strong>de</strong> p<strong>la</strong>ntas con virus <strong>de</strong>l enrol<strong>la</strong>do (PLRV)<br />
Nº Y Número <strong>de</strong> p<strong>la</strong>ntas con virus Y (PVY)<br />
% E+Y Porcentaje <strong>de</strong> p<strong>la</strong>ntas con virus <strong>de</strong>l enrol<strong>la</strong>do e Y<br />
OT. VIR Número <strong>de</strong> p<strong>la</strong>ntas con otros virus<br />
Nº RHI Número <strong>de</strong> p<strong>la</strong>ntas con Rhizoctonia<br />
Nº MEZ Número <strong>de</strong> p<strong>la</strong>ntas <strong>de</strong> otras varieda<strong>de</strong>s<br />
PIE NEG Número <strong>de</strong> p<strong>la</strong>ntas con pié negro (Erwinia )<br />
Fuente: Centro <strong>de</strong> Control <strong>de</strong> <strong>la</strong> <strong>Patata</strong> <strong>de</strong> Siembra<br />
De cada lote precintado se elige una muestra <strong>de</strong> unos 110 tubérculos aproximadamente, que<br />
serán los que se evaluarán en el Ensayo <strong>de</strong> Post-control. Es importante recalcar que el<br />
número <strong>de</strong> tubérculos podridos se refiere a los que existen en cada lote a <strong>la</strong> fecha <strong>de</strong><br />
siembra, no el que existe a fecha <strong>de</strong> precintado, meses antes, que obviamente es mucho<br />
menor. Los resultados son variables, <strong>de</strong>pendiendo <strong>de</strong> <strong>la</strong> campaña, pero en el peor <strong>de</strong> los<br />
casos (campaña 2006-2007) <strong>la</strong> patata <strong>de</strong> siembra producida cumple perfectamente con lo<br />
156
exigido en el Reg<strong>la</strong>mento Técnico <strong>de</strong> producción <strong>de</strong> patata <strong>de</strong> siembra. En caso <strong>de</strong> que algún<br />
lote no cumpliese los requisitos exigidos en dicho Reg<strong>la</strong>mento, se <strong>de</strong>scalificaría <strong>de</strong> manera<br />
inmediata.<br />
Estas exigencias que se p<strong>la</strong>ntean a <strong>la</strong> patata nacional también <strong>de</strong>berían <strong>de</strong> p<strong>la</strong>ntearse a <strong>la</strong><br />
patata <strong>de</strong> importación (si bien el material importado viene con su pasaporte fitosanitario<br />
emitido por <strong>la</strong> Autoridad Competente en el país <strong>de</strong> origen, en <strong>de</strong>terminadas ocasiones el<br />
material importado no cumple el mínimo <strong>de</strong> calidad fitosanitaria); así pues se han <strong>de</strong>tectado<br />
partidas <strong>de</strong> patata <strong>de</strong> siembra importadas con presencia <strong>de</strong> patógenos <strong>de</strong> cuarentena como<br />
C<strong>la</strong>vibacter y Ralstonia.<br />
11.10 ZONAS DE VENTA DE LAS PRODUCCIONES DE SEMILLA DE CASTILLA Y LEÓN<br />
En cuanto a comercialización <strong>de</strong> <strong>la</strong> patata <strong>de</strong> siembra producida en Castil<strong>la</strong> y León, con los<br />
datos <strong>de</strong> que disponemos, <strong>la</strong> distribución por Comunida<strong>de</strong>s Autónomas y <strong>la</strong>s principales<br />
varieda<strong>de</strong>s comercializadoras son <strong>la</strong>s siguientes:<br />
• Galicia: 35,66 % Baraka, Kennebec.<br />
• Castil<strong>la</strong> y León 26,41 % Jaer<strong>la</strong>, Baraka.<br />
• Asturias 21,13 % Baraka, Kennebec.<br />
• Andalucía 2,93 % Spunta, Desiree.<br />
• Extremadura 3,80 % Jaer<strong>la</strong>, Spunta.<br />
• Madrid 3,09 % Jaer<strong>la</strong>, Desiree.<br />
• País Vasco 1,90 % Kennebec, Jaer<strong>la</strong>.<br />
• Cataluña 0,92 % Kennebec, Red Pontiac<br />
• C. Valenciana 0,82 % Kennebec, Baraka.<br />
• Castil<strong>la</strong> <strong>la</strong> Mancha 0,44 % Kennebec, Red Pontiac<br />
• Aragón 0,55 % Kennebec, Jaer<strong>la</strong>.<br />
• Cantabria 0,19 % Baraka, Agria.<br />
157
GRÁFICO 11.7 DESTINO DE LAS PRODUCCIONES NACIONALES DE PATATA DE SIEMBRA.<br />
Fuente: Dirección General <strong>de</strong> Producción Agropecuaria. JCYL, 2009.<br />
158
Dentro De Castil<strong>la</strong> y León los datos totales <strong>de</strong> comercialización por varieda<strong>de</strong>s y provincias<br />
son los siguientes:<br />
• Ávi<strong>la</strong>: 15.025 0,35%<br />
• Burgos 1.001.216 23,76%<br />
• León 1.049.041 24,90%<br />
• Palencia 252.033 5,98%<br />
• Sa<strong>la</strong>manca 1.549.869 36,79%<br />
• Segovia 75.475 1,79%<br />
• Soria 4.975 0,11%<br />
• Val<strong>la</strong>dolid 195.584 4,64%<br />
• Zamora 69.150 1,64%<br />
Las conclusiones <strong>de</strong> estos datos <strong>de</strong> comercialización son <strong>la</strong>s siguientes:<br />
Más <strong>de</strong>l 72% <strong>de</strong> <strong>la</strong> patata comercializada pertenece a 3 varieda<strong>de</strong>s:<br />
• Baraka 29,38%<br />
• Kennebec 26,10%<br />
• Jaer<strong>la</strong> 16,69%<br />
Más <strong>de</strong>l 83% <strong>de</strong> <strong>la</strong> producción se ven<strong>de</strong> en 3 Comunida<strong>de</strong>s Autónomas:<br />
• Galicia.<br />
• Castil<strong>la</strong> y León<br />
• Asturias<br />
Las varieda<strong>de</strong>s obtenidas por Appacale aún no son representativas en <strong>la</strong>s siembras al<br />
encontrarse en fase <strong>de</strong> pleno crecimiento pues no se dispone <strong>de</strong> <strong>la</strong> suficiente semil<strong>la</strong> <strong>de</strong> base<br />
para una multiplicación masiva.<br />
• Producción <strong>de</strong> varieda<strong>de</strong>s obtenidas por APPACALE (Tab<strong>la</strong> 9.11)<br />
TABLA 11.9 COMERCIALIZACIÓN DE VARIEDADES OBTENIDAS POR APPACALE.<br />
VARIEDAD 2007 2009 OBSERVACIONES<br />
NELA 1 75.100 110.550 (Incremento <strong>de</strong>l 47%)<br />
JIMENA 1 70.700 57.525<br />
AGRIA 2 717.425 1.031.050<br />
Libre <strong>de</strong>s<strong>de</strong> 2008<br />
Incremento <strong>de</strong>l 43,7%<br />
HERMES 2 119.250 187.275 Incremento <strong>de</strong>l 57%<br />
Variedad obtenida por APPACALE.<br />
2 Variedad libre.<br />
.<br />
159
11.10.1 NECESIDADES DE SEMILLA EN CASTILLA Y LEÓN<br />
Según el Servicio <strong>de</strong> Comercialización Agraria y Asociacionismo <strong>de</strong> <strong>la</strong> Dirección General <strong>de</strong><br />
Industrialización y Mo<strong>de</strong>rnización Agraria, en 2007 <strong>la</strong> producción <strong>de</strong> patata <strong>de</strong> consumo era<br />
(Tab<strong>la</strong> 11.10):<br />
TABLA 11.10: ESTIMACIÓN DE DEMANDA DE PATATA DE SIEMBRA EN CASTILLA Y LEÓN.<br />
Variedad<br />
Multiplicación<br />
Hectáreas<br />
Sembradas<br />
Necesida<strong>de</strong>s<br />
semil<strong>la</strong> (t)<br />
Semil<strong>la</strong> CyL<br />
(1)<br />
Diferencia<br />
Agria Libre 6.700 13.400 297,7 13.107,3<br />
Jaer<strong>la</strong> Libre 4.000 8.000 1.765,0 6.235,0<br />
Hermes Libre 2.500 5.000 5 4.995,0<br />
Desiree Libre 1.500 3.000 1.177,0 1.823,0<br />
Asterix Protegida 1.500 3.000 - -<br />
Agata Protegida 1.000 2.000 - -<br />
Spunta Libre 800 1.600 462,6 1.137,4<br />
Fabu<strong>la</strong> Protegida 500 1.000 - -<br />
Baraka Libre 500 1.000 632,9 367,1<br />
Kennebec Libre 500 1.000 725,1 274,9<br />
Caesar Protegida 100 200 - -<br />
Otras 360 720 - -<br />
(1) Datos <strong>de</strong> comercialización en <strong>la</strong><br />
campaña 2009.<br />
TOTAL 39.920 5.055,3 34.867,7<br />
Como se observa, <strong>la</strong>s varieda<strong>de</strong>s <strong>de</strong> patata <strong>de</strong> siembra producidas en Castil<strong>la</strong> y León no<br />
cubren <strong>la</strong>s necesida<strong>de</strong>s <strong>de</strong> los agricultores <strong>de</strong> patata <strong>de</strong> consumo e industria.<br />
160
CONCLUSIONES<br />
o<br />
o<br />
o<br />
o<br />
o<br />
o<br />
o<br />
o<br />
Es evi<strong>de</strong>nte que el sector productor <strong>de</strong> patata <strong>de</strong> siembra no ha sabido o no ha<br />
podido satisfacer <strong>la</strong>s <strong>de</strong>mandas <strong>de</strong> los agricultores <strong>de</strong> patata <strong>de</strong> consumo, por lo<br />
que éstos han optado por patata <strong>de</strong> siembra <strong>de</strong> origen foráneo. Esto ha implicado una<br />
fuerte reducción <strong>de</strong> <strong>la</strong> superficie <strong>de</strong> patata <strong>de</strong> siembra en <strong>la</strong>s zonas productoras. La<br />
patata <strong>de</strong> siembra local ha pasado <strong>de</strong> una cuota <strong>de</strong> mercado <strong>de</strong>l 100% en el año 1986<br />
a una actual <strong>de</strong>l 30%.<br />
Se observa un <strong>de</strong>scenso <strong>de</strong>l 31,3 % en <strong>la</strong> superficie <strong>de</strong> cultivo (<strong>la</strong> producción ha caído<br />
un 22%) en Castil<strong>la</strong> y León, simi<strong>la</strong>r a <strong>la</strong> que se produce a nivel nacional.<br />
La importancia <strong>de</strong> <strong>la</strong> superficie en Castil<strong>la</strong> y León respecto al total nacional se<br />
mantiene en un 71%.<br />
El incremento <strong>de</strong> <strong>la</strong> superficie <strong>de</strong> regadío, (gracias a <strong>la</strong> red <strong>de</strong> balsas e<br />
infraestructuras <strong>de</strong> riego ejecutadas por <strong>la</strong> Junta <strong>de</strong> Castil<strong>la</strong> y León), junto con <strong>la</strong><br />
mejora en otras técnicas <strong>de</strong> cultivo ha posibilitado un aumento en los rendimientos<br />
por hectárea en un 20%.<br />
Parale<strong>la</strong>mente, y para bien <strong>de</strong>l sector, ha <strong>de</strong>scendido notablemente <strong>la</strong> utilización <strong>de</strong><br />
patata para siembra no contro<strong>la</strong>da oficialmente y <strong>de</strong> frau<strong>de</strong>; ya que dicha tasa <strong>de</strong><br />
semil<strong>la</strong> no certificada está actualmente próxima al 15%. Por tanto, todavía quedaría<br />
un 15 % <strong>de</strong> mercado en el que <strong>de</strong>bería potenciarse <strong>la</strong> promoción para <strong>la</strong> utilización <strong>de</strong><br />
patata <strong>de</strong> siembra precintada.<br />
Cada campaña aumenta <strong>la</strong> cantidad <strong>de</strong> patata <strong>de</strong> siembra importada y el número <strong>de</strong><br />
varieda<strong>de</strong>s. Tan sólo el 25 % <strong>de</strong>l total <strong>de</strong> el<strong>la</strong>s estaban inscritas en <strong>la</strong> Lista Españo<strong>la</strong><br />
<strong>de</strong> varieda<strong>de</strong>s comerciales, por lo que <strong>la</strong> mayor parte no podrían multiplicarse por<br />
nuestro sector productor.<br />
Según los ensayos realizados por el Centro <strong>de</strong> Control <strong>de</strong> <strong>la</strong> <strong>Patata</strong> <strong>de</strong> <strong>la</strong> Junta <strong>de</strong><br />
Castil<strong>la</strong> y León no hay diferencias apreciables en el rendimiento ni en <strong>la</strong> calidad<br />
sanitaria según sea el origen <strong>de</strong> <strong>la</strong> semil<strong>la</strong> <strong>de</strong> Castil<strong>la</strong> y León ó importada. El aumento<br />
<strong>de</strong> cuota <strong>de</strong> mercado <strong>de</strong> <strong>la</strong> patata importada sobre <strong>la</strong> nacional habría que achacárselo<br />
más a <strong>la</strong> mejor presentación <strong>de</strong> <strong>la</strong> semil<strong>la</strong> importada, <strong>la</strong> mayor disponibilidad <strong>de</strong><br />
calibres pequeños, una mejor conservación y sobre todo una más exitosa política<br />
comercial y <strong>de</strong> servicio post-venta <strong>de</strong> <strong>la</strong>s empresas extranjeras, que se acercan más<br />
al cliente y a sus necesida<strong>de</strong>s. Con todo ello, <strong>la</strong>s empresas semillistas extranjeras<br />
logran introducir su producto con una gran diferencia <strong>de</strong> precio (a veces más <strong>de</strong>l<br />
doble que <strong>la</strong> semil<strong>la</strong> nacional), e ir aumentando su cuota <strong>de</strong> mercado año tras año.<br />
Por otra parte, <strong>la</strong> semil<strong>la</strong> importada utilizada para producir patata <strong>de</strong> consumo podría<br />
introducir algunas enfermeda<strong>de</strong>s y p<strong>la</strong>gas <strong>de</strong> cuarentena (Nematodos, Ralstonia, y<br />
C<strong>la</strong>vibacter) y otras como <strong>la</strong> sarna p<strong>la</strong>teada proce<strong>de</strong>ntes <strong>de</strong> alguno <strong>de</strong> los países<br />
lí<strong>de</strong>res en <strong>la</strong> exportación, quienes no contro<strong>la</strong>n todos los lotes <strong>de</strong> patata <strong>de</strong> siembra y<br />
tienen condiciones agroclimáticas favorables al <strong>de</strong>sarrollo <strong>de</strong> estas enfermeda<strong>de</strong>s.<br />
161
o “No se pue<strong>de</strong>n multiplicar varieda<strong>de</strong>s protegidas sin previo pago <strong>de</strong> royalties”, que en<br />
algunas ocasiones son <strong>la</strong>s más <strong>de</strong>mandadas por el mercado.<br />
o La mayor parte <strong>de</strong> <strong>la</strong> semil<strong>la</strong> se comercializa a los agricultores por parte <strong>de</strong><br />
almacenistas, quienes prefieren <strong>la</strong> patata importada por diversos motivos: varieda<strong>de</strong>s<br />
más orientadas al mercado (segmentación <strong>de</strong> <strong>la</strong>s producciones <strong>de</strong> patata), mejor<br />
política comercial <strong>de</strong> <strong>la</strong>s empresas suministradoras <strong>de</strong> semil<strong>la</strong>, etc. No se <strong>de</strong>be olvidar<br />
que en muchos casos se establecen acuerdos entre almacenistas o industriales y<br />
productores, y <strong>de</strong>ntro <strong>de</strong> los acuerdos se incluye el suministro <strong>de</strong> semil<strong>la</strong>. Por tanto,<br />
para lograr una mayor difusión <strong>de</strong> <strong>la</strong> patata <strong>de</strong> siembra nacional lo necesario es<br />
“seducir” al almacenista y a los productores con los que celebre acuerdo <strong>de</strong><br />
suministro a los que posteriormente distribuirá esa semil<strong>la</strong>.<br />
o Mejorar aún más <strong>la</strong> calidad sanitaria, imponiendo rotaciones al menos trianuales e<br />
impulsando un mayor autocontrol a los productores. Existe un borrador <strong>de</strong> Or<strong>de</strong>n que<br />
modifica <strong>la</strong> legis<strong>la</strong>ción anterior en ese sentido.<br />
o Mejorar <strong>la</strong> capacidad comercial, con calibres que abarquen gamas más comerciales.<br />
Actualmente los productores <strong>de</strong> patata <strong>de</strong> siembra lo son a su vez <strong>de</strong> patata <strong>de</strong><br />
consumo, con lo que sus cosechas <strong>de</strong> patata son <strong>de</strong> un calibre <strong>de</strong>masiado gran<strong>de</strong> para<br />
siembra (35 a 65 mm.). Es necesario profesionalizar más al sector productor para que<br />
orienten sus producciones sólo a una orientación comercial, bien patata <strong>de</strong> siembra o<br />
<strong>de</strong> consumo. De esa manera, los productores <strong>de</strong> patata <strong>de</strong> siembra ofrecerán los<br />
calibres más comerciales (28 a 55 mm.)<br />
162
ANEXO I: DOCUMENTOS SOBRE LA COMPETITIVIDAD DE LA SEMILLA NACIONAL.<br />
ENSAYO COMPARATIVO DE PRODUCCIÓN ENTRE LA PATATA DE SIEMBRA DE CASTILLA Y<br />
LEÓN Y LA DE IMPORTACIÓN EN EL AÑO 2003.<br />
Fernando ALONSO ARCE<br />
Centro <strong>de</strong> Control <strong>de</strong> <strong>Patata</strong> <strong>de</strong> Castil<strong>la</strong> y León<br />
09239 Albillos (Burgos) aloarcfe@jcyl.es<br />
RESUMEN<br />
En este ensayo se ha tratado <strong>de</strong> ver si hay diferencias en <strong>la</strong> producción útil <strong>de</strong> patata<br />
<strong>de</strong> consumo usando como semil<strong>la</strong>, patata <strong>de</strong> siembra <strong>de</strong> Castil<strong>la</strong> y León o patata <strong>de</strong> siembra<br />
importada <strong>de</strong> diferentes países europeos.<br />
Según se ve en los resultados, en este ensayo, en <strong>la</strong> mayoría <strong>de</strong> <strong>la</strong>s varieda<strong>de</strong>s<br />
ensayadas no hay gran<strong>de</strong>s diferencias en <strong>la</strong> producción según sea el origen <strong>de</strong> <strong>la</strong> semil<strong>la</strong> y en<br />
<strong>la</strong> mayoría <strong>de</strong> estas varieda<strong>de</strong>s, <strong>la</strong> patata <strong>de</strong> siembra <strong>de</strong> Castil<strong>la</strong> y León produjo más kilos<br />
útiles que <strong>la</strong> importada.<br />
INTRODUCCIÓN<br />
En el momento actual, en España, <strong>la</strong> tasa <strong>de</strong> utilización <strong>de</strong> patata <strong>de</strong> siembra nacional<br />
es <strong>de</strong> un 30 %, respecto a un 70 % <strong>de</strong> <strong>la</strong> patata <strong>de</strong> siembra importada, habiendo perdido cuota<br />
<strong>de</strong> mercado <strong>de</strong>s<strong>de</strong> <strong>la</strong> entrada <strong>de</strong> España en el Mercado Común Europeo en 1986 en que se<br />
utilizaba un 70 % <strong>de</strong> patata <strong>de</strong> siembra nacional y un 30 % <strong>de</strong> patata <strong>de</strong> siembra importada.<br />
En <strong>la</strong> campaña 2003-04 se observó, sobre todo al final <strong>de</strong> <strong>la</strong> época <strong>de</strong> siembra, en los<br />
meses <strong>de</strong> marzo y abril <strong>de</strong> 2003 , que <strong>la</strong> patata <strong>de</strong> siembra <strong>de</strong> importación se vendía a unos<br />
precios mucho mayores que <strong>la</strong> semil<strong>la</strong> nacional. Mientras <strong>la</strong> importada se vendía a entre 25 y<br />
35 céntimos <strong>de</strong> € por kilo <strong>de</strong>pendiendo <strong>de</strong> calibres y varieda<strong>de</strong>s, <strong>la</strong> semil<strong>la</strong> nacional se estaba<br />
vendiendo a entre 12 y 15 céntimos <strong>de</strong> € por kilo y <strong>de</strong> hecho se vendieron muchas tone<strong>la</strong>das<br />
<strong>de</strong> patata <strong>de</strong> siembra nacional, perfectamente utilizables como tal, como patata <strong>de</strong> consumo,<br />
a unos precios <strong>de</strong> 2 ó 3 céntimos <strong>de</strong> € por kilo.<br />
Esta situación motivó el que se p<strong>la</strong>ntease este ensayo para ver si esa diferencia en <strong>la</strong>s<br />
preferencias <strong>de</strong>l usuario <strong>de</strong> esta semil<strong>la</strong>, es <strong>de</strong>cir, <strong>de</strong>l productor español <strong>de</strong> patata <strong>de</strong><br />
consumo, está justificada por <strong>la</strong> menor producción <strong>de</strong> <strong>la</strong> patata <strong>de</strong> siembra nacional o se <strong>de</strong>be<br />
a otras causas.<br />
MATERIAL Y MÉTODOS<br />
Para <strong>la</strong> realización <strong>de</strong> este ensayo se aprovechó el “Campo <strong>de</strong> postcontrol nacional y<br />
<strong>de</strong> precontrol <strong>de</strong> patata <strong>de</strong> siembra importada” que se realizó en <strong>la</strong> localidad <strong>de</strong> Hormaza<br />
(Burgos) y don<strong>de</strong> se p<strong>la</strong>ntaron 1.528 muestras <strong>de</strong> lotes <strong>de</strong> patata <strong>de</strong> siembra producida en<br />
España y 252 muestras <strong>de</strong> lotes <strong>de</strong> patata <strong>de</strong> siembra importada para producir patata <strong>de</strong><br />
consumo.<br />
Cada muestra p<strong>la</strong>ntada consta <strong>de</strong> 110 tubérculos y <strong>la</strong> semil<strong>la</strong> se pone entera, en dos<br />
surcos <strong>de</strong> 55 tubérculos cada uno, en una parce<strong>la</strong> elemental <strong>de</strong> 20,00 x 1,50 metros<br />
cuadrados.<br />
La muestra <strong>de</strong>l postcontrol nacional es <strong>la</strong> que se toma por parte <strong>de</strong> los inspectores<br />
oficiales en el momento <strong>de</strong> <strong>la</strong> certificación <strong>de</strong> cada lote <strong>de</strong> patata <strong>de</strong> siembra y <strong>la</strong> muestra<br />
<strong>de</strong>l precontrol <strong>de</strong> patata <strong>de</strong> siembra importada es <strong>la</strong> contramuestra <strong>de</strong> <strong>la</strong> enviada al Centro<br />
Regional <strong>de</strong> Diagnóstico <strong>de</strong> <strong>la</strong> Junta <strong>de</strong> Castil<strong>la</strong> y León situado en Al<strong>de</strong>arrubia (Sa<strong>la</strong>manca),<br />
163
para su análisis <strong>de</strong> <strong>la</strong>s bacterias <strong>de</strong> cuarentena C<strong>la</strong>vibacter michiganensis ssp sepedonicus y<br />
Ralstonia so<strong>la</strong>nacearum. En ambos casos son muestras oficiales, acompañadas <strong>de</strong> su Acta <strong>de</strong><br />
toma <strong>de</strong> muestra correspondiente.<br />
Este Campo <strong>de</strong> pre y postcontrol se p<strong>la</strong>ntó entre los días 21 y 25 <strong>de</strong> abril <strong>de</strong> 2003.<br />
Después <strong>de</strong> <strong>la</strong> inspección oficial <strong>de</strong> estos campos, para enfermeda<strong>de</strong>s <strong>de</strong> calidad, y<br />
aprovechando el esfuerzo y trabajo ya realizados, se p<strong>la</strong>nteó el obtener datos, para po<strong>de</strong>r<br />
comparar, acerca <strong>de</strong> <strong>la</strong> producción <strong>de</strong> un número limitado <strong>de</strong> lotes tanto <strong>de</strong> semil<strong>la</strong> <strong>de</strong><br />
Castil<strong>la</strong> y León como <strong>de</strong> semil<strong>la</strong> importada.<br />
Aunque toda <strong>la</strong> patata se cultivó en <strong>la</strong> misma parce<strong>la</strong> y ésta era bastante uniforme, <strong>la</strong><br />
elección <strong>de</strong> los lotes o parce<strong>la</strong>s elementales a muestrear se hizo en función <strong>de</strong> <strong>la</strong> proximidad<br />
física <strong>de</strong> lotes <strong>de</strong> diferentes proce<strong>de</strong>ncias, para tratar <strong>de</strong> evitar <strong>la</strong> influencia <strong>de</strong> los factores<br />
<strong>de</strong> cultivo(tipo <strong>de</strong> terreno, abonado, tratamientos, riego, etc) en <strong>la</strong> producción <strong>de</strong>l lote. Esta<br />
elección se hizo totalmente al azar en cuanto a otras circunstancias y únicamente se tuvo en<br />
cuenta el criterio expuesto <strong>de</strong> proximidad física.<br />
El arranque <strong>de</strong> <strong>la</strong>s p<strong>la</strong>ntas y los tubérculos por el<strong>la</strong>s producidos se realizó<br />
manualmente, con azada, el día 12 <strong>de</strong> septiembre <strong>de</strong> 2003.<br />
La muestra tomada consistió en todos los casos en <strong>la</strong> producción <strong>de</strong> 6 p<strong>la</strong>ntas, tres <strong>de</strong><br />
cada surco, y en todos los casos estas tres p<strong>la</strong>ntas fueron <strong>la</strong> segunda, tercera y cuarta <strong>de</strong> cada<br />
surco y en el extremo <strong>de</strong>l surco que limitaba con otro lote a muestrear. Si en el lugar<br />
correspondiente a una <strong>de</strong> estas 6 p<strong>la</strong>ntas había un hueco y no había p<strong>la</strong>nta, se consi<strong>de</strong>ró que<br />
<strong>la</strong> p<strong>la</strong>nta que <strong>de</strong>bía estar en ese lugar no había producido nada, por una circunstancia<br />
achacable a <strong>la</strong> semil<strong>la</strong>.<br />
El día 14 <strong>de</strong> febrero <strong>de</strong> 2004 se efectuó en el almacén el calibrado y pesaje <strong>de</strong> cada<br />
muestra, habiéndose conservado <strong>la</strong>s muestras en una cámara frigorífica a 4º C <strong>de</strong>s<strong>de</strong> el<br />
momento <strong>de</strong>l arranque hasta el calibrado y pesaje.<br />
El calibrado se hizo en tres grupos: < 40 mm., 40-80 mm. y > 80 mm., consi<strong>de</strong>rándose<br />
como útil para su comercialización como patata <strong>de</strong> consumo los calibres superiores a 40 mm.<br />
RESULTADOS<br />
El número <strong>de</strong> lotes muestreados fue <strong>de</strong> 57 en total, <strong>de</strong> los cuales 40 fueron <strong>de</strong> Castil<strong>la</strong><br />
y León y los 17 restantes <strong>de</strong> patata <strong>de</strong> siembra importada; entre los lotes importados había 7<br />
<strong>de</strong> Ho<strong>la</strong>nda, 5 <strong>de</strong> Dinamarca, 4 <strong>de</strong> Escocia (Reino Unido) y 1 <strong>de</strong> Bélgica.<br />
En el cuadro que sigue se ven tanto los lotes <strong>de</strong> cada variedad y proce<strong>de</strong>ncia<br />
muestreados como <strong>la</strong>s medias <strong>de</strong> producción correspondientes a cada grupo expresados en kg<br />
<strong>de</strong> patata <strong>de</strong> consumo útil por 6 p<strong>la</strong>ntas.<br />
En los resultados que se muestran a continuación se ha sustituido <strong>la</strong> producción real en<br />
kilogramos <strong>de</strong> cada variedad por un índice que nos permite comparar mejor entre <strong>la</strong>s<br />
diferentes varieda<strong>de</strong>s y proce<strong>de</strong>ncias. El índice <strong>de</strong> referencia 100 se ha atribuido a una<br />
producción <strong>de</strong> 5 kilogramos <strong>de</strong> patata <strong>de</strong> consumo útil por <strong>la</strong>s 6 p<strong>la</strong>ntas muestreadas.<br />
En el cuadro que sigue se ven tanto los lotes <strong>de</strong> cada variedad y proce<strong>de</strong>ncia<br />
muestreados como los índices <strong>de</strong> producción correspondientes a cada grupo.<br />
164
PRODUCCIÓN<br />
IMPORTADO (kg)<br />
Nº LOTES<br />
CASTILLA Y<br />
LEÓN<br />
PRODUCCIÓN<br />
CASTILLA Y LEÓN<br />
(kg)<br />
VARIEDAD Nº LOTES<br />
IMPORTADO<br />
DESIREE 4 5,345 10 5,542<br />
HERMES 1 3,160 3 6,280<br />
JAERLA 2 7,135 7 6,325<br />
KENNEBEC 2 1,990 9 3,869<br />
MONALISA 4 4,938 7 5,285<br />
RED PONTIAC 4 5,295 4 5,355<br />
TOTAL 17 40<br />
VARIEDAD<br />
Nº LOTES<br />
IMPORTADO<br />
INDICE<br />
PRODUCCIÓN<br />
IMPORTADO (*)<br />
Nº LOTES<br />
CASTILLA Y<br />
LEÓN<br />
INDICE<br />
PRODUCCIÓN<br />
CASTILLA Y LEÓN<br />
(*)<br />
DESIREE 4 106,9 10 110,8<br />
HERMES 1 63,2 3 125,6<br />
JAERLA 2 142,7 7 126,5<br />
KENNEBEC 2 39,8 9 77,4<br />
MONALISA 4 98,8 7 109,7<br />
RED PONTIAC 4 105,9 4 107,1<br />
TOTAL 17 40<br />
(*) Índice 100 = 5 kilogramos <strong>de</strong> patata <strong>de</strong> consumo útil en 6 p<strong>la</strong>ntas.<br />
En este ensayo, excepto en <strong>la</strong> variedad Jaer<strong>la</strong> en que <strong>la</strong> patata <strong>de</strong> importación ha<br />
producido más que <strong>la</strong> <strong>de</strong> Castil<strong>la</strong> y León, en el resto <strong>de</strong> varieda<strong>de</strong>s <strong>la</strong> patata <strong>de</strong> siembra <strong>de</strong><br />
Castil<strong>la</strong> y León ha superado en producción a <strong>la</strong> patata <strong>de</strong> siembra proce<strong>de</strong>nte <strong>de</strong> otros países<br />
europeos.<br />
Hay que hacer mención a que en el verano <strong>de</strong> 2003 se dieron unas temperaturas muy<br />
elevadas, tanto diurnas como nocturnas, durante un <strong>la</strong>rgo período <strong>de</strong> tiempo y cabe <strong>la</strong><br />
posibilidad <strong>de</strong> que <strong>la</strong> patata <strong>de</strong> siembra <strong>de</strong> Castil<strong>la</strong> y León, sobre todo en algunas varieda<strong>de</strong>s,<br />
hubiese respondido mejor a <strong>la</strong>s condiciones extremas sufridas, por estar más aclimatada a<br />
temperaturas altas, que <strong>la</strong> patata <strong>de</strong> siembra importada.<br />
DISCUSIÓN<br />
Según los resultados obtenidos en este ensayo, parece estar c<strong>la</strong>ro que una diferencia<br />
<strong>de</strong> precio como <strong>la</strong> que hubo en <strong>la</strong> patata <strong>de</strong> siembra utilizada en <strong>la</strong> campaña 2003-04 entre <strong>la</strong><br />
patata <strong>de</strong> siembra producida en Castil<strong>la</strong> y León y <strong>la</strong> importada, no está justificada porque <strong>la</strong><br />
patata <strong>de</strong> siembra <strong>de</strong> Castil<strong>la</strong> y León sea menos productiva, sino que habría que buscar otros<br />
factores como causantes <strong>de</strong> <strong>la</strong> pau<strong>la</strong>tina disminución en <strong>la</strong> <strong>de</strong>manda <strong>de</strong> esta semil<strong>la</strong>.<br />
Entre estos otros factores pue<strong>de</strong>n estar: <strong>la</strong> mejor presentación <strong>de</strong> <strong>la</strong> semil<strong>la</strong><br />
importada, <strong>la</strong> mayor disponibilidad <strong>de</strong> calibres pequeños en <strong>la</strong> semil<strong>la</strong> importada y <strong>la</strong>s<br />
estructuras comerciales, que en el caso <strong>de</strong> <strong>la</strong> patata <strong>de</strong> siembra nacional parecen ser poco<br />
eficaces.<br />
165
ENSAYO COMPARATIVO DE PRODUCCIÓN ENTRE LA PATATA DE SIEMBRA DE CASTILLA Y<br />
LEÓN Y LA DE IMPORTACIÓN EN EL AÑO 2004<br />
Alonso Arce F.<br />
Centro <strong>de</strong> Control <strong>de</strong> <strong>Patata</strong> <strong>de</strong> Castil<strong>la</strong> y León<br />
09239 Albillos (Burgos) - España<br />
RESUMEN<br />
En este ensayo que se ha llevado a cabo durante dos años consecutivos, se ha tratado<br />
<strong>de</strong> ver si hay diferencias en <strong>la</strong> producción útil <strong>de</strong> patata <strong>de</strong> consumo usando como semil<strong>la</strong>,<br />
patata <strong>de</strong> siembra <strong>de</strong> Castil<strong>la</strong> y León o patata <strong>de</strong> siembra importada <strong>de</strong> diferentes países<br />
europeos.<br />
Según se ve en los resultados, que confirman los obtenidos en <strong>la</strong> campaña anterior,<br />
en este ensayo, en <strong>la</strong> mayoría <strong>de</strong> <strong>la</strong>s varieda<strong>de</strong>s ensayadas no hay gran<strong>de</strong>s diferencias en <strong>la</strong><br />
producción según sea el origen <strong>de</strong> <strong>la</strong> semil<strong>la</strong> y en <strong>la</strong> mayoría <strong>de</strong> estas varieda<strong>de</strong>s, <strong>la</strong> patata<br />
<strong>de</strong> siembra <strong>de</strong> Castil<strong>la</strong> y León produjo más kilos útiles que <strong>la</strong> importada.<br />
INTRODUCCIÓN<br />
En el momento actual, en España, <strong>la</strong> tasa <strong>de</strong> utilización <strong>de</strong> patata <strong>de</strong> siembra nacional<br />
es <strong>de</strong> un 30 %, respecto a un 70 % <strong>de</strong> <strong>la</strong> patata <strong>de</strong> siembra importada, habiendo perdido cuota<br />
<strong>de</strong> mercado <strong>de</strong>s<strong>de</strong> <strong>la</strong> entrada <strong>de</strong> España en el Mercado Común Europeo en 1986 en que se<br />
utilizaba un 70 % <strong>de</strong> patata <strong>de</strong> siembra nacional y un 30 % <strong>de</strong> patata <strong>de</strong> siembra importada.<br />
En <strong>la</strong> campaña 2003-04 se observó, sobre todo al final <strong>de</strong> <strong>la</strong> época <strong>de</strong> siembra, en los<br />
meses <strong>de</strong> marzo y abril <strong>de</strong> 2003 , que <strong>la</strong> patata <strong>de</strong> siembra <strong>de</strong> importación se vendía a unos<br />
precios mucho mayores que <strong>la</strong> semil<strong>la</strong> nacional. Mientras <strong>la</strong> importada se vendía a entre 25 y<br />
35 céntimos <strong>de</strong> € por kilo <strong>de</strong>pendiendo <strong>de</strong> calibres y varieda<strong>de</strong>s, <strong>la</strong> semil<strong>la</strong> nacional se estaba<br />
vendiendo a entre 12 y 15 céntimos <strong>de</strong> € por kilo y <strong>de</strong> hecho se vendieron muchas tone<strong>la</strong>das<br />
<strong>de</strong> patata <strong>de</strong> siembra nacional, perfectamente utilizables como tal, como patata <strong>de</strong> consumo,<br />
a unos precios <strong>de</strong> 2 ó 3 céntimos <strong>de</strong> € por kilo. Esta situación no es que sea muy frecuente,<br />
pero casi siempre el precio <strong>de</strong> <strong>la</strong> semil<strong>la</strong> importada está muy por encima <strong>de</strong>l precio <strong>de</strong> <strong>la</strong><br />
semil<strong>la</strong> nacional.<br />
Durante dos años consecutivos se ha p<strong>la</strong>nteado este ensayo para ver si esa diferencia<br />
en <strong>la</strong>s preferencias <strong>de</strong>l usuario <strong>de</strong> esta semil<strong>la</strong>, es <strong>de</strong>cir, <strong>de</strong>l productor español <strong>de</strong> patata <strong>de</strong><br />
consumo, está justificada por <strong>la</strong> menor producción <strong>de</strong> <strong>la</strong> patata <strong>de</strong> siembra nacional o se <strong>de</strong>be<br />
a otras causas.<br />
MATERIAL Y MÉTODOS<br />
Para <strong>la</strong> realización <strong>de</strong> este ensayo se aprovechó el “Campo <strong>de</strong> postcontrol nacional y<br />
<strong>de</strong> precontrol <strong>de</strong> patata <strong>de</strong> siembra importada” que se realizó en <strong>la</strong> localidad <strong>de</strong> Hormaza<br />
(Burgos) y don<strong>de</strong> se p<strong>la</strong>ntaron 1.642 muestras <strong>de</strong> lotes <strong>de</strong> patata <strong>de</strong> siembra producida en<br />
España y 244 muestras <strong>de</strong> lotes <strong>de</strong> patata <strong>de</strong> siembra importada para producir patata <strong>de</strong><br />
consumo.<br />
Cada muestra p<strong>la</strong>ntada consta <strong>de</strong> 110 tubérculos y <strong>la</strong> semil<strong>la</strong> se pone entera, en dos<br />
surcos <strong>de</strong> 55 tubérculos cada uno, en una parce<strong>la</strong> elemental <strong>de</strong> 20,00 x 1,50 metros<br />
cuadrados.<br />
La muestra <strong>de</strong>l postcontrol nacional es <strong>la</strong> que se toma por parte <strong>de</strong> los inspectores<br />
oficiales en el momento <strong>de</strong> <strong>la</strong> certificación <strong>de</strong> cada lote <strong>de</strong> patata <strong>de</strong> siembra y <strong>la</strong> muestra<br />
<strong>de</strong>l precontrol <strong>de</strong> patata <strong>de</strong> siembra importada es <strong>la</strong> contramuestra <strong>de</strong> <strong>la</strong> enviada al Centro<br />
Regional <strong>de</strong> Diagnóstico <strong>de</strong> <strong>la</strong> Junta <strong>de</strong> Castil<strong>la</strong> y León situado en Al<strong>de</strong>arrubia (Sa<strong>la</strong>manca),<br />
166
para su análisis <strong>de</strong> <strong>la</strong>s bacterias <strong>de</strong> cuarentena C<strong>la</strong>vibacter michiganensis ssp sepedonicus y<br />
Ralstonia so<strong>la</strong>nacearum. En ambos casos son muestras oficiales, acompañadas <strong>de</strong> su Acta <strong>de</strong><br />
toma <strong>de</strong> muestra correspondiente.<br />
Este Campo <strong>de</strong> pre y postcontrol se p<strong>la</strong>ntó entre los días 14 y 20 <strong>de</strong> abril <strong>de</strong> 2004.<br />
Después <strong>de</strong> <strong>la</strong> inspección oficial <strong>de</strong> estos campos, para enfermeda<strong>de</strong>s <strong>de</strong> calidad, y<br />
aprovechando el esfuerzo y trabajo ya realizados, se p<strong>la</strong>nteó el obtener datos, para po<strong>de</strong>r<br />
comparar, acerca <strong>de</strong> <strong>la</strong> producción <strong>de</strong> un número limitado <strong>de</strong> lotes tanto <strong>de</strong> semil<strong>la</strong> <strong>de</strong><br />
Castil<strong>la</strong> y León como <strong>de</strong> semil<strong>la</strong> importada.<br />
Aunque toda <strong>la</strong> patata se cultivó en <strong>la</strong> misma parce<strong>la</strong> <strong>de</strong> 6 hectáreas y ésta era<br />
bastante uniforme, <strong>la</strong> elección <strong>de</strong> los lotes o parce<strong>la</strong>s elementales a muestrear se hizo en<br />
función <strong>de</strong> <strong>la</strong> proximidad física <strong>de</strong> lotes <strong>de</strong> diferentes proce<strong>de</strong>ncias, para tratar <strong>de</strong> evitar <strong>la</strong><br />
influencia <strong>de</strong> los factores <strong>de</strong> cultivo (tipo <strong>de</strong> terreno, abonado, tratamientos, riego, etc) en <strong>la</strong><br />
producción <strong>de</strong>l lote. Esta elección se hizo totalmente al azar en cuanto a otras circunstancias<br />
y únicamente se tuvo en cuenta el criterio expuesto <strong>de</strong> proximidad física.<br />
El arranque <strong>de</strong> <strong>la</strong>s p<strong>la</strong>ntas y los tubérculos por el<strong>la</strong>s producidos se realizó<br />
manualmente, con azada, los días 31 <strong>de</strong> agosto y 17 <strong>de</strong> septiembre <strong>de</strong> 2004, cuando <strong>la</strong>s<br />
p<strong>la</strong>ntas estaban ya totalmente muertas.<br />
La muestra tomada consistió en todos los casos en <strong>la</strong> producción <strong>de</strong> 6 p<strong>la</strong>ntas, tres <strong>de</strong><br />
cada surco, y en todos los casos estas tres p<strong>la</strong>ntas fueron <strong>la</strong> segunda, tercera y cuarta <strong>de</strong> cada<br />
surco y en el extremo <strong>de</strong>l surco que limitaba con otro lote a muestrear. Si en el lugar<br />
correspondiente a una <strong>de</strong> estas 6 p<strong>la</strong>ntas había un hueco y no había p<strong>la</strong>nta, se consi<strong>de</strong>ró que<br />
<strong>la</strong> p<strong>la</strong>nta que <strong>de</strong>bía estar en ese lugar no había producido nada, por una circunstancia<br />
achacable a <strong>la</strong> semil<strong>la</strong>.<br />
El día 13 <strong>de</strong> enero <strong>de</strong> 2005 se efectuó en el almacén el calibrado y pesaje <strong>de</strong> cada<br />
muestra, habiéndose conservado <strong>la</strong>s muestras en una cámara frigorífica a temperatura<br />
ambiente los dos primeros meses y a 4º C <strong>de</strong>s<strong>de</strong> ese momento hasta el calibrado y pesaje.<br />
El calibrado se hizo en tres grupos: < 40 mm., 40-80 mm. y > 80 mm., consi<strong>de</strong>rándose<br />
como útil para su comercialización como patata <strong>de</strong> consumo los calibres superiores a 40 mm.<br />
RESULTADOS<br />
El número <strong>de</strong> lotes muestreados fue <strong>de</strong> 57 en total, <strong>de</strong> los cuales 40 fueron <strong>de</strong> Castil<strong>la</strong><br />
y León y los 17 restantes <strong>de</strong> patata <strong>de</strong> siembra importada; entre los lotes importados había 7<br />
<strong>de</strong> Ho<strong>la</strong>nda, 5 <strong>de</strong> Dinamarca, 4 <strong>de</strong> Escocia (Reino Unido) y 1 <strong>de</strong> Bélgica.<br />
En el cuadro que sigue se ven tanto los lotes <strong>de</strong> cada variedad y proce<strong>de</strong>ncia<br />
muestreados como <strong>la</strong>s medias <strong>de</strong> producción correspondientes a cada grupo expresados en kg<br />
<strong>de</strong> patata <strong>de</strong> consumo útil por 6 p<strong>la</strong>ntas.<br />
En los resultados que se muestran a continuación se ha sustituido <strong>la</strong> producción real<br />
en kilogramos <strong>de</strong> cada variedad por un índice que nos permite comparar mejor entre <strong>la</strong>s<br />
diferentes varieda<strong>de</strong>s y proce<strong>de</strong>ncias. El índice <strong>de</strong> referencia 100 se ha atribuido a una<br />
producción <strong>de</strong> 5 kilogramos <strong>de</strong> patata <strong>de</strong> consumo útil por <strong>la</strong>s 6 p<strong>la</strong>ntas muestreadas.<br />
167
VARIEDAD<br />
Nº LOTES<br />
IMPORTADO<br />
PRODUCCIÓN<br />
IMPORTADO (kg)<br />
Nº LOTES<br />
CASTILLA Y<br />
LEÓN<br />
PRODUCCIÓN<br />
CASTILLA Y LEÓN<br />
(kg)<br />
DESIREE 6 4,434 9 5,886<br />
HERMES 8 3,994 9 3,796<br />
JAERLA 5 4,414 11 5,348<br />
KENNEBEC 2 8,410 5 7,428<br />
MONALISA 6 4,268 10 4,358<br />
RED PONTIAC 3 5,117 11 5,624<br />
SPUNTA 4 4,893 6 4,153<br />
TOTAL 34 61<br />
En el cuadro que sigue se ven tanto los lotes <strong>de</strong> cada variedad y proce<strong>de</strong>ncia<br />
muestreados como los índices <strong>de</strong> producción correspondientes a cada grupo.<br />
VARIEDAD<br />
Nº LOTES<br />
IMPORTADO<br />
INDICE<br />
PRODUCCIÓN<br />
IMPORTADO (*)<br />
Nº LOTES<br />
CASTILLA Y<br />
LEÓN<br />
INDICE<br />
PRODUCCIÓN<br />
CASTILLA Y LEÓN<br />
(*)<br />
DESIREE 6 88,68 9 117,71<br />
HERMES 8 79,88 9 75,91<br />
JAERLA 5 88,28 11 106,96<br />
KENNEBEC 2 168,20 5 148,56<br />
MONALISA 6 85,37 10 87,16<br />
RED PONTIAC 3 102,33 11 112,47<br />
SPUNTA 4 97,85 6 83,07<br />
TOTAL 34 61<br />
(*) Índice 100 = 5 kilogramos <strong>de</strong> patata <strong>de</strong> consumo útil en 6 p<strong>la</strong>ntas.<br />
En este ensayo, <strong>de</strong> 7 varieda<strong>de</strong>s examinadas, vemos que en Desiree, Jaer<strong>la</strong>, Monalisa<br />
y Red Pontiac, <strong>la</strong> semil<strong>la</strong> <strong>de</strong> Castil<strong>la</strong> y León ha producido más que <strong>la</strong> importada, siendo lo<br />
contrario en Hermes, Kennebec y Spunta.<br />
DISCUSIÓN<br />
Según los resultados obtenidos en este ensayo, que confirman los obtenidos en el<br />
ensayo simi<strong>la</strong>r llevado a cabo el año 2003, parece estar c<strong>la</strong>ro que una diferencia <strong>de</strong> precio<br />
como <strong>la</strong> que hubo en <strong>la</strong> patata <strong>de</strong> siembra utilizada en <strong>la</strong> campaña 2003-04 entre <strong>la</strong> patata <strong>de</strong><br />
siembra producida en Castil<strong>la</strong> y León y <strong>la</strong> importada, no está justificada porque <strong>la</strong> patata <strong>de</strong><br />
siembra <strong>de</strong> Castil<strong>la</strong> y León sea menos productiva, sino que habría que buscar otros factores<br />
como causantes <strong>de</strong> <strong>la</strong> pau<strong>la</strong>tina disminución en <strong>la</strong> <strong>de</strong>manda <strong>de</strong> esta semil<strong>la</strong>.<br />
Entre estos otros factores pue<strong>de</strong>n estar: <strong>la</strong> mejor presentación <strong>de</strong> <strong>la</strong> semil<strong>la</strong><br />
importada, <strong>la</strong> mayor disponibilidad <strong>de</strong> calibres pequeños en <strong>la</strong> semil<strong>la</strong> importada y <strong>la</strong>s<br />
estructuras comerciales, que en el caso <strong>de</strong> <strong>la</strong> patata <strong>de</strong> siembra nacional parecen ser poco<br />
eficaces.<br />
168
ANEXO II: CAPACIDAD DE ALMACENAMIENTO DE SEMILLA.<br />
ALMACENAMIENTO EN CÁMARA FRIGORÍFICA (TOTAL)<br />
ENTIDAD PRODUCTORA DESTINO Nº cámaras Dimensión (m2) Capacidad (T) Formato (Cajones, Big bag o granel)<br />
Coop. Culpaval SIEMBRA 2 1.300 2.000 Palets<br />
Coop. Cosi<strong>de</strong>l SIEMBRA 4 1.600 1.700 Sacos, Big Bags y Cajones<br />
Coop. Sta. Isabel SIEMBRA 6 2.000 3.000 Sacos, Palets y Cajones<br />
S.A.T. Ntra Sra <strong>de</strong> Ahedo SIEMBRA 1 700 800 Sacos y Palets<br />
Coop. Seyco SIEMBRA 7 2.900 3.480 Big Bags y Palets<br />
Calixto Serna NO POSEE - - - -<br />
Coop. El Carmen NO POSEE - - - -<br />
Otros Multiplicadores NO POSEEN - - - -<br />
8.500 10.980<br />
ALMACENAMIENTO EN ALMACEN VENTILADO (TOTAL)<br />
ENTIDAD PRODUCTORA DESTINO Nº cámaras Dimensión (m2) Capacidad (T) Formato (Cajones, Big bag o granel)<br />
Coop. Culpaval NO POSEE - - - -<br />
Coop. Cosi<strong>de</strong>l SIEMBRA 1 1.000 1.200 Sacos, Big Bags y Cajones<br />
Coop. Sta. Isabel NO POSEE - - - -<br />
S.A.T. Ntra Sra <strong>de</strong> Ahedo SIEMBRA 1 2.000 3.500 Granel<br />
Coop. Seyco SIEMBRA 4 4.470 2.794 Big Bags y Palets<br />
Calixto Serna SIEMBRA 1 1.400 1.400 Granel<br />
Coop. El Carmen SIEMBRA 1 - 1.000 Granel<br />
Coop. El Carmen CONSUMO 11 - 11.000 Granel<br />
Otros Multiplicadores NO POSEEN - - - -<br />
8.870 20.894<br />
169
ALMACENAMIENTO EN ALMACEN (TOTAL)<br />
ENTIDAD PRODUCTORA DESTINO Nº cámaras Dimensión (m2) Capacidad (T) Formato (Cajones, Big bag o granel)<br />
Coop. Culpaval SIEMBRA 2.000 1.500 Sacos y Palets<br />
Coop. Cosi<strong>de</strong>l NO POSEE - - - -<br />
Coop. Sta. Isabel SIEMBRA 3.000 2.000 Sacos, Palets y Cajones<br />
S.A.T. Ntra Sra <strong>de</strong> Ahedo NO POSEE - - - -<br />
Coop. Seyco NO POSEE - - - -<br />
Calixto Serna SIEMBRA 1 1.000 1.000 Granel y Cajones<br />
Coop. El Carmen CONSUMO 1 - 1.000 Granel<br />
Otros Multiplicadores SIEMBRA - - 6.000 Granel<br />
6.000 11.500<br />
RESUMEN TOTAL DE CAPACIDAD<br />
TIPO DE ALMACEN DESTINO CAPACIDAD (T.) TOTAL (T.)<br />
CÁMARA REFRIGERADA SIEMBRA 10.980 10.984<br />
ALMACÉN VENTILADO<br />
SIEMBRA 9.894<br />
CONSUMO 11.000<br />
20.894<br />
ALMACÉN<br />
SIEMBRA 10.500<br />
CONSUMO 1.000<br />
11.500<br />
43.378<br />
170
12 ANÁLISIS DE LOS PRINCIPALES PAÍSES PRODUCTORES DE LA UNIÓN<br />
EUROPEA<br />
12.1 EL SECTOR DE LA PATATA EN FRANCIA<br />
La patata francesa representa año tras año el competidor más acérrimo <strong>de</strong>l producto<br />
cultivado en Castil<strong>la</strong> y León y en otras regiones <strong>de</strong> España. Su especialización y segmentación<br />
(adaptación <strong>de</strong>l producto a su uso culinario), dos aspectos introducidos en cada es<strong>la</strong>bón <strong>de</strong> su<br />
ca<strong>de</strong>na <strong>de</strong>s<strong>de</strong> el productor hasta el distribuidor final, ha representado <strong>la</strong> l<strong>la</strong>ve maestra gracias<br />
a <strong>la</strong> cual <strong>la</strong>s patatas producidas en este país se han imp<strong>la</strong>ntado <strong>de</strong> lleno en el mercado<br />
nacional. Por lo tanto, resulta completamente necesario e<strong>la</strong>borar en este p<strong>la</strong>n un capítulo<br />
enfocado a conocer <strong>la</strong> organización <strong>de</strong>l sector <strong>de</strong> <strong>la</strong> patata en Francia.<br />
12.1.1 SITUACIÓN DEL CULTIVO<br />
En <strong>la</strong> tab<strong>la</strong> 12.1 se muestra <strong>la</strong> información re<strong>la</strong>tiva a <strong>la</strong> superficie, producción y rendimientos<br />
<strong>de</strong> patata en Francia en <strong>la</strong> serie <strong>de</strong> años 1993-2008. Estos datos se presentan <strong>de</strong> forma visual<br />
en el gráfico 12.1. Francia es <strong>la</strong> tercera productora <strong>de</strong> Europa con una media anual <strong>de</strong>,<br />
aproximadamente, 4,5 millones <strong>de</strong> tone<strong>la</strong>das brutas. Un total <strong>de</strong> 1 millón <strong>de</strong> estas tone<strong>la</strong>das<br />
se <strong>de</strong>stina a <strong>la</strong>s industrias <strong>de</strong> transformación y alre<strong>de</strong>dor <strong>de</strong> 2 millones <strong>de</strong> tone<strong>la</strong>das para el<br />
mercado fresco, el 1,5 restante se <strong>de</strong>stina a exportación.<br />
TABLA 12.1. SUPERFICIE (ha), PRODUCCIÓN (t) Y RENDIMIENTO (t/ha) DE PATATA EN FRANCIA ENTRE 1993-2008.<br />
Superficie Producción Rendimiento<br />
1993 97.600 4.118.720 42,2<br />
1994 99.000 3.742.200 37,8<br />
1995 104.000 3.972.800 38,2<br />
1996 107.000 4.280.000 40,0<br />
1997 101.600 4.450.080 43,8<br />
1998 104.400 4.249.080 40,7<br />
1999 109.900 4.560.850 41,5<br />
2000 107.800 4.473.700 41,5<br />
2001 102.000 4.233.000 41,5<br />
2002 101.800 4.682.800 46,0<br />
2003 101.600 4.277.360 42,1<br />
2004 103.000 4.645.300 45,1<br />
2005 104.700 4.449.750 42,5<br />
2006 104.100 4.393.020 42,2<br />
2007 104.500 4.733.850 45,3<br />
2008 104.300 4.599.630 44,1<br />
Fuente: CNIPT.<br />
La principal zona productora es “Nord-Pas-<strong>de</strong>-Ca<strong>la</strong>is”, que actualmente representa el 35% <strong>de</strong><br />
<strong>la</strong> producción francesa. Esta región está situada al norte <strong>de</strong>l país galo, en el límite con<br />
171
Bélgica, y es <strong>de</strong>stacable su gran producción y calidad <strong>de</strong> <strong>la</strong> variedad Monalisa para mercado<br />
fresco. Después está <strong>la</strong> región <strong>de</strong> “Picar<strong>de</strong>” (25% <strong>de</strong>l total), que también se situa al norte y su<br />
producción está más enfocada al abastecimiento <strong>de</strong> <strong>la</strong> industria. “Centre” y “Champagne” son<br />
<strong>la</strong>s otras dos regiones que siguen a <strong>la</strong>s anteriores en importancia, y su producción está más<br />
orientada hacia el mercado <strong>de</strong> productos frescos.<br />
GRÁFICO 12.1. SUPERFICIE (ha) Y PRODUCCIÓN (t) DE PATATA EN FRANCIA ENTRE 1993-2008.<br />
112000<br />
5000000<br />
110000<br />
108000<br />
106000<br />
104000<br />
102000<br />
100000<br />
98000<br />
96000<br />
94000<br />
92000<br />
90000<br />
Fuente: CNIPT.<br />
1993<br />
1994<br />
1995<br />
1996<br />
1997<br />
1998<br />
1999<br />
2000<br />
2001<br />
2002<br />
Superficie<br />
Producción<br />
2003<br />
2004<br />
2005<br />
2006<br />
2007<br />
2008<br />
4500000<br />
4000000<br />
3500000<br />
3000000<br />
2500000<br />
2000000<br />
1500000<br />
1000000<br />
500000<br />
0<br />
A continuación se pue<strong>de</strong> ver como está organizada <strong>la</strong> producción francesa por regiones.<br />
GRÁFICO 12.2. PRINCIPALES ZONAS PRODUCTORAS DE PATATA EN FRANCIA. MEDIA DE LOS AÑOS 2006-2008.<br />
Fuente: CNIPT.<br />
Los rendimientos medios <strong>de</strong> Francia no están muy lejanos <strong>de</strong> los obtenidos por algunas<br />
provincias <strong>de</strong> Castil<strong>la</strong> y León, aunque ellos cuentan con <strong>la</strong> ventaja <strong>de</strong> disponer <strong>de</strong> un coste <strong>de</strong><br />
172
iego menor. Por el contrario, en Francia existen mayores problemas sanitarios, lo que da<br />
lugar a más gastos en utilización <strong>de</strong> productos fitosanitarios, sobre todo fungicidas.<br />
El sector <strong>de</strong> <strong>la</strong> patata en Francia tiene una sólida estructura representativa p<strong>la</strong>gada <strong>de</strong> lobbys<br />
que adoptan <strong>la</strong> forma <strong>de</strong> interprofesionales, que <strong>de</strong>fien<strong>de</strong>n su producto en todas <strong>la</strong>s etapas o<br />
fases <strong>de</strong> <strong>la</strong> ca<strong>de</strong>na <strong>de</strong> valor (<strong>de</strong>s<strong>de</strong> el productor hasta el consumidor). A<strong>de</strong>más, esta te<strong>la</strong> <strong>de</strong><br />
araña <strong>de</strong> asociaciones constituidas ad hoc cumplen a <strong>la</strong> perfección con el objetivo <strong>de</strong> aunar<br />
posturas entre el sector productor, los distribuidores o almacenistas y el cliente final. Esta<br />
interconexión sirve para orientar sobre <strong>la</strong>s varieda<strong>de</strong>s que interesa cultivar, como hacerlo, y<br />
<strong>la</strong>s producciones que hay que obtener al final <strong>de</strong> <strong>la</strong> campaña. Esto permite a los implicados<br />
en el sector vivir sin <strong>la</strong> incertidumbre que originan <strong>la</strong>s osci<strong>la</strong>ciones que se dan en los precios<br />
<strong>de</strong>l producto, una situación que ocurre con frecuencia en Castil<strong>la</strong> y León.<br />
Una práctica habitual en los países europeos, no sólo en Francia, es <strong>la</strong> realización <strong>de</strong><br />
contratos por varios años, tanto para patata <strong>de</strong> industria como para <strong>la</strong> <strong>de</strong> consumo en fresco y<br />
so<strong>la</strong>mente se reserva un porcentaje exiguo para especu<strong>la</strong>r con el<strong>la</strong> en el mercado.<br />
12.1.2 LA CALIDAD: UNA PRIORIDAD EN FRANCIA<br />
La mejora <strong>de</strong> <strong>la</strong> calidad <strong>de</strong> <strong>la</strong>s frutas y <strong>la</strong>s hortalizas en general es una <strong>de</strong> <strong>la</strong>s priorida<strong>de</strong>s <strong>de</strong><br />
los profesionales franceses en todos los niveles <strong>de</strong>l sector. Esto se traduce en <strong>la</strong> aplicación <strong>de</strong><br />
distintas estrategias <strong>de</strong> calidad, así como en el <strong>de</strong>sarrollo <strong>de</strong> buenas prácticas <strong>de</strong> producción<br />
(agricultura sostenible o integrada) y <strong>de</strong> seguimiento (como por ejemplo <strong>la</strong> norma AFNOR),<br />
con el fin <strong>de</strong> obtener productos sanos y proteger el medio ambiente.<br />
Los profesionales <strong>de</strong>l sector se preocupan por mejorar <strong>la</strong> oferta <strong>de</strong>sarrol<strong>la</strong>ndo acuerdos<br />
interprofesionales a nivel <strong>de</strong> etiquetaje, <strong>de</strong> envasado, <strong>de</strong> c<strong>la</strong>sificación, etc. o mediante<br />
iniciativas propias. Asimismo, han <strong>de</strong>sarrol<strong>la</strong>do una logística complementaria para respetar <strong>la</strong><br />
ca<strong>de</strong>na <strong>de</strong>l frío y <strong>la</strong> frescura <strong>de</strong> los productos.<br />
Una oferta diversificada<br />
Con <strong>la</strong> evolución <strong>de</strong> los hábitos alimenticios, el sector <strong>de</strong> <strong>la</strong>s verduras frescas francesas<br />
respalda esta ten<strong>de</strong>ncia con una oferta cada vez más diversificada a fin <strong>de</strong> respon<strong>de</strong>r a <strong>la</strong>s<br />
exigencias <strong>de</strong> cada uno <strong>de</strong> los consumidores.<br />
• Diversidad <strong>de</strong> varieda<strong>de</strong>s: en <strong>la</strong> actualidad, el sector <strong>de</strong> <strong>la</strong> patata ofrece diversidad <strong>de</strong><br />
varieda<strong>de</strong>s <strong>de</strong> gran calidad culinaria (Charlotte, Franceline, Caesar, Bellefontaine,<br />
Cherie) y también visual (Agata).<br />
• Diversidad <strong>de</strong> regiones: Nord-Pas-De-Ca<strong>la</strong>is, Picardie, Haute-Normandie, Bretagne,<br />
Champagne-Ar<strong>de</strong>nes, Centre, Beauce, etc…..<br />
• Innovación: cocción al vapor, en microondas, IV y V gama, etc ….<br />
173
12.1.3 COMERCIALIZACIÓN EN FRANCIA, EL EXPORTADOR MÁS GRANDE DE EUROPA<br />
Las exportaciones <strong>de</strong> patata <strong>de</strong> Francia ascendieron a casi 1,7 millones <strong>de</strong> tone<strong>la</strong>das en el año<br />
2008. En <strong>la</strong> tab<strong>la</strong> 12.2 y gráfico 12.3 se presentan los principales países <strong>de</strong>stinatarios <strong>de</strong> estos<br />
volúmenes importados.<br />
TABLA 12.2. EXPORTACIONES DE PATATA DE FRANCIA A PAÍSES DE LA U.E, 2006-2008, EXPRESADO EN TONELADAS.<br />
2006 2007 2008 Media 2006 - 2008<br />
España 640.922,8 572.342,0 582.364,6 597.794,8<br />
Bélgica 290.755,3 299.916,0 235.567,9 273.872,1<br />
Italia 275.222,9 294.803,1 247.168,6 271.687,7<br />
Portugal 235.472,9 226.314,7 226.636,0 229.435,6<br />
Alemania 134.197,2 154.755,1 117.817,6 134.751,3<br />
Reino Unido 94.150,7 119.435,2 151.954,2 119.551,8<br />
Ho<strong>la</strong>nda 91.533,3 97.012,3 59.939,0 81.041,1<br />
Grecia 23.305,1 16.232,7 16.884,5 18.554,2<br />
Hungría 3.088,0 7.911,0 8.020,3 5.808,1<br />
Rumania 2.423,5 5.432,8 6.819,6 4.477,9<br />
República Checa 1.085,1 8.113,5 9.882,0 4.431,1<br />
Polonia 2.474,5 5.287,0 4.533,4 3.899,8<br />
Luxemburgo 3.042,9 2.881,5 4.416,8 3.383,3<br />
Ir<strong>la</strong>nda 4.085,4 2.162,6 3.555,7 3.155,3<br />
Dinamarca 2.818,0 2.413,7 2.923,0 2.709,1<br />
Eslovaquia 170,0 727,2 2.799,3 702,1<br />
Otros 6.577,6 10.740,7 5.596,5 7.339,6<br />
UNION EUROPEA 1.811.325,2 1.826.481,2 1.686.879,2 1.773.775,0<br />
Fuente: DATACOMEX.<br />
GRÁFICO 12.3. PRINCIPALES PAÍSES A LOS QUE FRANCIA EXPORTA PATATA ENTRE 2006-2008. EN TONELADAS.<br />
700.000<br />
600.000<br />
500.000<br />
400.000<br />
300.000<br />
200.000<br />
100.000<br />
0<br />
España<br />
Bélgica<br />
Italia<br />
Portugal<br />
Alemania<br />
Reino Unido<br />
Ho<strong>la</strong>nda<br />
Grecia<br />
Otros<br />
Fuente: E<strong>la</strong>boración propia a partir <strong>de</strong> datos <strong>de</strong> DATACOMEX.<br />
174
Es evi<strong>de</strong>nte que por países <strong>de</strong>stinatarios España es el que más patata recibe <strong>de</strong>l país galo, con<br />
un 33,7% <strong>de</strong>l total, al consi<strong>de</strong>rar <strong>la</strong> media <strong>de</strong> los años 2006-2008. Esto es <strong>de</strong>bido al gran<br />
<strong>de</strong>sarrollo comercial en cuanto a varieda<strong>de</strong>s, formatos, calibres y calida<strong>de</strong>s a<strong>de</strong>cuadas a <strong>la</strong>s<br />
necesida<strong>de</strong>s <strong>de</strong> los operadores españoles. A<strong>de</strong>más, esta es <strong>la</strong> única oferta existente durante<br />
varios meses al año. A España, le siguen en estas importaciones Bélgica (15,40% <strong>de</strong>l total),<br />
Italia (15,32%) y Portugal (12,90%).<br />
“La patata importada por España <strong>de</strong> origen francés suele ser <strong>de</strong> segunda categoría”, aunque<br />
ellos nos <strong>la</strong> vendan como <strong>de</strong> alta calidad, que son en muchas ocasiones <strong>la</strong>s <strong>de</strong>scartadas por el<br />
circuito comercial francés, quienes cuentan con una estricta normativa propia <strong>de</strong> calidad. Es<br />
importante que a nivel nacional se apliquen unos criterios a<strong>de</strong>cuados <strong>de</strong> calidad para evitar<br />
importar patata <strong>de</strong> otros países con unos niveles cualitativos inferiores a <strong>la</strong> que se produce en<br />
nuestro territorio.<br />
Al consi<strong>de</strong>rar <strong>la</strong>s exportaciones a países no pertenecientes a <strong>la</strong> UE nos encontramos con que,<br />
si hacemos <strong>la</strong> media <strong>de</strong> <strong>la</strong>s cantida<strong>de</strong>s exportadas durante los años 2006 a 2008, Israel ha sido<br />
el principal <strong>de</strong>stinatario seguido <strong>de</strong> Suiza, Noruega e Is<strong>la</strong>ndia. La situación <strong>de</strong> Israel es <strong>de</strong>bida<br />
al gran volumen que importó en 2008.<br />
TABLA 12.3. EXPORTACIONES DE PATATA DE FRANCIA A PAÍSES TERCEROS, 2006-2008, EXPRESADAS EN TONELADAS.<br />
2006 2007 2008 Media 2006 - 2008<br />
Israel 5.279,8 1.759,9<br />
Suiza 897,9 704,1 897,7 827,9<br />
Noruega 236,8 62,4 170 135,9<br />
Is<strong>la</strong>ndia 21 215,8 100,7 77,0<br />
Emiratos Árabes 101,6 33,9<br />
Otros 78,6 74,5 2 22,7<br />
Gabón 56,3 24 3,8 17,3<br />
Mayotte 9,1 27,1 14,6 15,3<br />
Congo 11,5 14,9 4,8 9,4<br />
Costa <strong>de</strong> Marfil 25 1 28 8,9<br />
Total EXTRA-EU27 1.336,2 1.123,8 6.603 2.148,3<br />
Fuente: DATACOMEX.<br />
En <strong>la</strong> tab<strong>la</strong> 12.4 y en el gráfico 12.4 se muestran los principales países que ven<strong>de</strong>n patatas a<br />
Francia, tanto <strong>de</strong> <strong>la</strong> Unión Europea como <strong>de</strong> fuera <strong>de</strong> nuestras fronteras. Se pue<strong>de</strong> observar<br />
que Bélgica es el principal suministrador <strong>de</strong> patata <strong>de</strong> Francia, seguido a mucha distancia <strong>de</strong><br />
Ho<strong>la</strong>nda y Alemania. Bélgica es un país que produce alre<strong>de</strong>dor <strong>de</strong> tres millones <strong>de</strong> tone<strong>la</strong>das y<br />
que prácticamente no almacena nada encaminando su producción fundamentalmente a<br />
patata <strong>de</strong> industria. De este modo, mueven su producción entre <strong>la</strong> gran masa <strong>de</strong> industrias<br />
transformadoras que hay en los países alre<strong>de</strong>dor suyo. Al consi<strong>de</strong>rar los países <strong>de</strong> fuera <strong>de</strong> <strong>la</strong><br />
175
UE se pue<strong>de</strong> observar que Israel y Marruecos son sus principales países suministradores, los<br />
cuales le ven<strong>de</strong>n patata temprana en época que no hay producción francesa y sus<br />
almacenamientos no son capaces <strong>de</strong> suministrar suficiente materia prima.<br />
TABLA 12.4: IMPORTACIONES DE PATATA A FRANCIA EN LOS AÑOS 2006-2008, EXPRESADAS EN TONELADAS.<br />
2006 2007 2008 Media 2006 - 2008<br />
Bélgica 279.962,7 295.754,6 254.338,8 276.151,9<br />
Ho<strong>la</strong>nda 84.699,6 60.940,3 52.472,5 64.700,2<br />
Alemania 31.825,1 25.735,1 16.938,4 24.028,3<br />
Grecia 12.102,2 12.102,2<br />
Italia 7.431,7 9.228,0 12.571,3 9.517,6<br />
España 8.768,4 10.892,2 5.458,5 8.048,3<br />
Portugal 2.173,3 2.304,2 1.988,7 2.151,5<br />
Reino Unido 7.442,4 3.677,6 1.174,4 3.179,5<br />
Otros 423,3 419,9 977,7 558,0<br />
Total Unión Europea 422.726,5 408.951,9 358.022,5 395.561,5<br />
Israel 52.205,4 50.477,7 28.977,5 42.425,3<br />
Marruecos 21.557,1 23.456,6 33.055 25.568,0<br />
Túnez 2.645,4 1.731,4 1.230,9 1.779,8<br />
Egipto 176 596,7 646,3 407,9<br />
Sudáfrica 14 338 52 62,7<br />
Argelia 140 46,7<br />
Total Extra-EU27 76.737,9 76.600,4 63.961,7 72.175,0<br />
Fuente: DATACOMEX.<br />
GRÁFICO 12.4. PRINCIPALES PAÍSES DE LOS QUE FRANCIA IMPORTA PATATA, 2006-2008, EXPRESADO EN TONELADAS.<br />
300.000<br />
250.000<br />
200.000<br />
150.000<br />
100.000<br />
50.000<br />
0<br />
Bélgica<br />
Países Bajos<br />
Israel<br />
Marruecos<br />
Alemania<br />
Grecia<br />
Italia<br />
España<br />
Reino Unido<br />
Fuente: E<strong>la</strong>boración propia a partir <strong>de</strong> datos <strong>de</strong> DATACOMEX.<br />
176
12.1.4 ORGANIZACIÓN DEL SECTOR DE LA PATATA EN FRANCIA<br />
El sector <strong>de</strong> <strong>la</strong> patata en Francia es uno <strong>de</strong> los mejor estructurados <strong>de</strong> <strong>la</strong> Unión Europea, con<br />
un grado <strong>de</strong> organización tanto horizontal (operadores <strong>de</strong>l mismo es<strong>la</strong>bón <strong>de</strong> <strong>la</strong> ca<strong>de</strong>na<br />
agroalimentaria) como vertical (operadores <strong>de</strong> distinto es<strong>la</strong>bón) muy importante, en el que <strong>la</strong><br />
concertación y el trabajo para conseguir objetivos comunes prima ante otros factores que<br />
diluyan estos esfuerzos.<br />
Las interprofesionales en Francia son los organismos que aglutinan a todas <strong>la</strong>s organizaciones<br />
<strong>de</strong> <strong>la</strong> ca<strong>de</strong>na agroalimentaria <strong>de</strong> un sector <strong>de</strong>terminado y son verda<strong>de</strong>ras estructuras <strong>de</strong><br />
trabajo conjunto para resolver los problemas <strong>de</strong> los sectores agroalimentarios.<br />
La estructura vertical en Francia se ha <strong>de</strong>sarrol<strong>la</strong>do muy ampliamente, en una dinámica <strong>de</strong><br />
estrecha co<strong>la</strong>boración con <strong>la</strong> Administración y <strong>de</strong> co-gestión <strong>de</strong> <strong>la</strong> Política Agraria.<br />
Fue durante el periodo <strong>de</strong> <strong>la</strong> posguerra cuando nacieron los primeros comités<br />
interprofesionales en el sector <strong>de</strong> los alcoholes y vino. Su financiación se aseguraba mediante<br />
una tasa parafiscal, y gozaban <strong>de</strong> po<strong>de</strong>r reg<strong>la</strong>mentario. El Estado estaba representado a<br />
través <strong>de</strong> un comisario <strong>de</strong>l Gobierno.<br />
La ley sobre Organización Interprofesional Agríco<strong>la</strong> <strong>de</strong> 1.975 (Ley 75-600), hizo caer en <strong>de</strong>suso<br />
a <strong>la</strong> Ley <strong>de</strong> 1964, al establecer un marco legal generalmente mucho más flexible y sencillo.<br />
Supuso el reconocimiento <strong>de</strong> <strong>la</strong>s organizaciones interprofesionales y para <strong>la</strong> extensión <strong>de</strong><br />
normas y cotizaciones a todo el sector. La mayor parte <strong>de</strong> <strong>la</strong>s organizaciones<br />
interprofesionales existentes con anterioridad se acogieron a esta Ley, que impulsó también<br />
<strong>la</strong> creación <strong>de</strong> otras muchas en <strong>la</strong> casi totalidad <strong>de</strong> sectores.<br />
La Ley <strong>de</strong> 10 <strong>de</strong> julio <strong>de</strong> 1975 que regu<strong>la</strong> a <strong>la</strong>s organizaciones interprofesionales establece dos<br />
herramientas que otorga a <strong>la</strong>s interprofesionales que se reconozcan. En primer lugar <strong>la</strong>s dota<br />
<strong>de</strong> un reconocimiento por <strong>la</strong> Administración, por <strong>la</strong> que les conce<strong>de</strong> cobertura jurídica para <strong>la</strong><br />
realización <strong>de</strong> sus acciones y <strong>de</strong> representatividad <strong>de</strong>l sector en cuestión. A<strong>de</strong>más conce<strong>de</strong> a<br />
<strong>la</strong> interprofesional <strong>la</strong> facultad <strong>de</strong> <strong>la</strong> extensión <strong>de</strong> normas. La extensión <strong>de</strong> norma consiste en<br />
<strong>la</strong> obligación <strong>de</strong> que los acuerdos tomados en <strong>la</strong> interprofesional sean extensivos a todos los<br />
operadores <strong>de</strong>l sector, estén o no representados en <strong>la</strong> misma.<br />
A<strong>de</strong>más esta Ley obliga a aportar una cuota <strong>de</strong> los operadores <strong>de</strong> toda <strong>la</strong> ca<strong>de</strong>na<br />
interprofesional, ya sean productores, cooperativas, comerciantes, industrias, y gran<br />
distribución.<br />
177
Sin embargo, esta normativa no establece marco legis<strong>la</strong>tivo alguno a cerca <strong>de</strong> cuestiones muy<br />
importantes para el <strong>de</strong>sarrollo <strong>de</strong> <strong>la</strong>s interprofesionales, como <strong>la</strong> no regu<strong>la</strong>ción <strong>de</strong> <strong>la</strong><br />
composición <strong>de</strong> sus colegiados, <strong>la</strong> ubicación en su seno <strong>de</strong> <strong>la</strong>s cooperativas y otras cuestiones<br />
<strong>de</strong> vital importancia en el <strong>de</strong>sarrollo <strong>de</strong> estos entes. Esas <strong>de</strong>cisiones se toman por consenso<br />
entre <strong>la</strong>s organizaciones <strong>de</strong> <strong>la</strong>s distintas fases <strong>de</strong> <strong>la</strong> ca<strong>de</strong>na agroalimentaria y se adaptan a <strong>la</strong>s<br />
características <strong>de</strong> cada sector. La norma general es que <strong>la</strong>s cooperativas entran a formar<br />
parte <strong>de</strong> <strong>la</strong> rama <strong>de</strong> <strong>la</strong> producción en <strong>la</strong>s interprofesionales cuyos productos se <strong>de</strong>stinen a<br />
consumo en fresco, o en <strong>la</strong> rama <strong>de</strong> industrias en <strong>la</strong>s interprofesionales que abarcan<br />
productos transformados.<br />
La representatividad <strong>de</strong> <strong>la</strong> interprofesional es analizada por el Ministerio <strong>de</strong> Agricultura antes<br />
<strong>de</strong> su aprobación en función <strong>de</strong> su peso en el mercado, si bien no existen criterios uniformes<br />
para su medición.<br />
El reconocimiento <strong>de</strong> <strong>la</strong>s organizaciones interprofesionales tiene lugar en el seno <strong>de</strong>l Consejo<br />
Superior Agrario, órgano máximo <strong>de</strong> consulta <strong>de</strong> <strong>la</strong> Administración, simi<strong>la</strong>r al Consejo General<br />
<strong>de</strong> Organizaciones Interprofesionales Agroalimentarias en España, en el que están presentes<br />
<strong>la</strong>s organizaciones profesionales agrarias <strong>de</strong> carácter general, <strong>la</strong>s organizaciones <strong>de</strong><br />
industriales y <strong>la</strong> distribución. Para ello es necesario que <strong>la</strong>s organizaciones miembros<br />
<strong>de</strong>muestren ser suficientemente representativas <strong>de</strong> cada una <strong>de</strong> <strong>la</strong>s fases, sin que existan<br />
criterios rígidos para medir esa representatividad.<br />
Hoy día, como se verá más a<strong>de</strong><strong>la</strong>nte, <strong>la</strong>s interprofesionales francesas centran su actividad en<br />
<strong>la</strong> I+D, <strong>la</strong> e<strong>la</strong>boración <strong>de</strong> estadísticas, <strong>la</strong> promoción y el fomento <strong>de</strong> <strong>la</strong> calidad, tanto o más<br />
que en <strong>la</strong> regu<strong>la</strong>ción <strong>de</strong> <strong>la</strong>s re<strong>la</strong>ciones entre fases.<br />
A<strong>de</strong>más existe hoy una proliferación <strong>de</strong> organismos financiados interprofesionalmente que se<br />
<strong>de</strong>dican a cada uno <strong>de</strong> esos cometidos (Centros Técnicos, <strong>de</strong> Promoción, etc.). Todos ellos<br />
están más o menos vincu<strong>la</strong>dos a <strong>la</strong>s organizaciones interprofesionales propiamente dichas,<br />
que gestionan los recursos en el seno <strong>de</strong> los sectores agrarios y actúan como portavoz y grupo<br />
<strong>de</strong> presión en <strong>de</strong>fensa <strong>de</strong> los intereses globales <strong>de</strong>l sector. En general, existe un gran<br />
consenso en los sectores acerca <strong>de</strong> <strong>la</strong> eficiencia y utilidad <strong>de</strong> <strong>la</strong>s organizaciones<br />
interprofesionales <strong>de</strong> distinto tipo.<br />
En el sector <strong>de</strong> patata existen cuatro organizaciones interprofesionales reconocidas, en<br />
función <strong>de</strong>l <strong>de</strong>stino <strong>de</strong>l producto: INTERFEL, GNIS, GIPT, CNIPT<br />
178
12.1.4.1. INTERFEL (Interprofessionel <strong>de</strong>s fruits et légumes)<br />
Es <strong>la</strong> organización interprofesional <strong>de</strong>l sector <strong>de</strong> <strong>la</strong>s frutas y hortalizas frescas. Es una<br />
organización privada que representa toda <strong>la</strong> ca<strong>de</strong>na agroalimentaria. En esta interprofesional<br />
está incluida <strong>la</strong> patata temprana o <strong>de</strong> primor, <strong>la</strong> cual tiene un tratamiento diferente con<br />
respecto a <strong>la</strong> patata <strong>de</strong> conservación con <strong>de</strong>stino a fresco (más tardía). INTERFEL se creó en<br />
1.976 acogiéndose a <strong>la</strong> Ley <strong>de</strong> 10 <strong>de</strong> julio <strong>de</strong> 1975.<br />
Según información <strong>de</strong> <strong>la</strong> propia organización agrupa a nueve organizaciones profesionales<br />
repartidas en dos secciones <strong>de</strong> producción y distribución, y representadas paritariamente en<br />
el Consejo <strong>de</strong> Administración. Esta organización integra a <strong>la</strong> Gran Distribución: <strong>la</strong>s<br />
interprofesionales que se <strong>de</strong>dican a los productos en fresco incluyen a <strong>la</strong> Distribución<br />
Alimentaria, y <strong>la</strong>s organizaciones que abarcan productos transformados integran a <strong>la</strong>s<br />
industrias <strong>de</strong> transformación, pero no a <strong>la</strong> Distribución.<br />
Para hacer posible el diálogo entre socios y que pueda <strong>de</strong>sempeñar eficazmente el papel<br />
asignado a <strong>la</strong> Interprofesional, ésta opera en 3 principios fundamentales:<br />
El principio <strong>de</strong> <strong>la</strong> representatividad <strong>de</strong> garantías a los gobiernos y <strong>la</strong> participación global<br />
<strong>de</strong> <strong>la</strong> U.E. en el sector en <strong>la</strong> toma <strong>de</strong> <strong>de</strong>cisiones.<br />
El principio <strong>de</strong> <strong>la</strong> paridad Que asigna a cada uno <strong>de</strong> los dos colegios (Producción y<br />
Distribución) 50% <strong>de</strong> los votos, garantizando el respeto mutuo para <strong>la</strong>s familias.<br />
El principio <strong>de</strong> <strong>la</strong> unanimidad mejora <strong>la</strong> calidad <strong>de</strong> <strong>la</strong>s <strong>de</strong>cisiones. Se garantiza el respeto<br />
<strong>de</strong> <strong>la</strong>s minorías y especial <strong>de</strong> <strong>la</strong> familia.<br />
En concreto, los objetivos <strong>de</strong> INTERFEL son:<br />
• Conocimiento <strong>de</strong> <strong>la</strong> oferta y <strong>la</strong> <strong>de</strong>manda<br />
• Adaptación y regu<strong>la</strong>ción <strong>de</strong> <strong>la</strong> oferta y <strong>de</strong>sarrollo <strong>de</strong> <strong>la</strong> <strong>de</strong>manda.<br />
• Mejora <strong>de</strong> <strong>la</strong>s re<strong>la</strong>ciones interprofesionales en el sector.<br />
• I+D y estudios sobre el sector.<br />
• Una gestión a<strong>de</strong>cuada al mercado.<br />
• Promover <strong>la</strong> organización Interprofesional <strong>de</strong> ámbito regional en <strong>la</strong>s zonas <strong>de</strong><br />
producción.<br />
• Desarrol<strong>la</strong>r el consumo <strong>de</strong> frutas y hortalizas.<br />
• Asegurar al consumidor un suministro saludable, seguro y <strong>de</strong> buena calidad.<br />
179
12.1.4.2. GNIS (Groupement National Interprofessionnel <strong>de</strong>s Semences et p<strong>la</strong>nts)<br />
El GNIS es el organismo que integra a todas organizaciones que tienen actividad en el sector<br />
<strong>de</strong> <strong>la</strong>s semil<strong>la</strong>s, incluyendo <strong>la</strong> patata <strong>de</strong> siembra. Es un centro <strong>de</strong> concertación que permite a<br />
los profesionales <strong>de</strong>finir juntos <strong>la</strong> política <strong>de</strong> <strong>de</strong>sarrollo <strong>de</strong> <strong>la</strong> ca<strong>de</strong>na agroalimentaria <strong>de</strong> <strong>la</strong>s<br />
semil<strong>la</strong>s. Por <strong>de</strong>legación <strong>de</strong> los Po<strong>de</strong>res Públicos, el GNIS se encarga <strong>de</strong> ve<strong>la</strong>r por <strong>la</strong> buena<br />
aplicación <strong>de</strong> <strong>la</strong> Legis<strong>la</strong>ción (que se e<strong>la</strong>bora conjuntamente con el Ministerio <strong>de</strong> Agricultura) y<br />
<strong>de</strong> contro<strong>la</strong>r a los profesionales que operan en <strong>la</strong> ca<strong>de</strong>na <strong>de</strong> <strong>la</strong>s semil<strong>la</strong>s.<br />
El GNIS fue creado por <strong>de</strong>creto <strong>de</strong>l Gobierno francés el 18 <strong>de</strong> mayo <strong>de</strong> 1962 con el objetivo <strong>de</strong><br />
representar los diferentes sectores y categorías profesionales interesadas en <strong>la</strong> selección,<br />
multiplicación, producción, comercio y utilización <strong>de</strong> <strong>la</strong>s semil<strong>la</strong>s y p<strong>la</strong>ntas, y <strong>de</strong> estudiar y<br />
promover todas <strong>la</strong>s medidas ten<strong>de</strong>ntes a organizar <strong>la</strong> producción y <strong>la</strong> comercialización <strong>de</strong> este<br />
sector.<br />
El GNIS tiene dos tipos <strong>de</strong> funciones:<br />
1. Un tipo <strong>de</strong> funciones son <strong>la</strong>s originales y específicas <strong>de</strong>l sector <strong>de</strong> <strong>la</strong>s semil<strong>la</strong>s:<br />
concertación <strong>de</strong> <strong>la</strong>s organizaciones miembros, observación, diagnóstico y análisis <strong>de</strong><br />
los mercados, y control <strong>de</strong> <strong>la</strong> calidad <strong>de</strong> <strong>la</strong>s semil<strong>la</strong>s.<br />
2. El otro tipo <strong>de</strong> función va encaminada a <strong>la</strong> información y formación, promoción,<br />
estudios económicos, difusión <strong>de</strong> los reg<strong>la</strong>mentos técnicos, etc. La GNIS realiza<br />
numerosos estudios fundamentales para conocer el mercado y <strong>la</strong>s <strong>de</strong>mandas <strong>de</strong> éste,<br />
para ayudar a los profesionales en sus actuaciones. A<strong>de</strong>más realiza campañas <strong>de</strong><br />
promoción en el extranjero contribuyendo a <strong>la</strong> expansión <strong>de</strong>l sector.<br />
El GNIS está organizado en 8 secciones especializadas por categorías <strong>de</strong> <strong>la</strong>s semil<strong>la</strong>s, lo cual<br />
permite a <strong>la</strong>s diferentes familias profesionales trabajar juntos sobre los problemas específicos<br />
<strong>de</strong> sus especies. Un Comité central coordina <strong>la</strong> acción <strong>de</strong> estas secciones para asegurar <strong>la</strong><br />
coherencia en sus actuaciones. Las secciones son:<br />
1. Cereales 5. <strong>Patata</strong>s<br />
2. Maiz y Sorgo 6. <strong>P<strong>la</strong>n</strong>tas oleaginosas<br />
3. Forrajes 7. Lino<br />
4. Remo<strong>la</strong>cha 8. Hortíco<strong>la</strong>s y florales<br />
Cada sección <strong>la</strong> forman representantes <strong>de</strong> <strong>la</strong>s organizaciones <strong>de</strong> todas <strong>la</strong>s ramas<br />
profesionales, <strong>de</strong> <strong>la</strong> ca<strong>de</strong>na agroalimentaria <strong>de</strong> ese tipo <strong>de</strong> semil<strong>la</strong>s. Cada sección está<br />
compuesta por un Consejo que agrupa entre 20 a 40 representantes <strong>de</strong> los diferentes agentes<br />
<strong>de</strong> <strong>la</strong> ca<strong>de</strong>na <strong>de</strong> valor: obtentores, productores <strong>de</strong> semil<strong>la</strong>s, importadores, exportadores,<br />
distribuidores, multiplicadores, agricultores utilizadores e industrias.<br />
180
Las misiones <strong>de</strong> cada una <strong>de</strong> <strong>la</strong>s secciones son:<br />
• Seguimiento <strong>de</strong> <strong>la</strong> oferta <strong>de</strong> semil<strong>la</strong>s.<br />
• Realizar los convenios tipos para <strong>la</strong> multiplicación <strong>de</strong> semil<strong>la</strong>s<br />
• Solicitar modificaciones <strong>de</strong> <strong>la</strong> reg<strong>la</strong>mentación.<br />
• Arbitrar en los diferentes conflictos que puedan surgir.<br />
• Preparar los programas <strong>de</strong> promoción e información a favor <strong>de</strong> <strong>la</strong>s semil<strong>la</strong>s<br />
certificadas, o <strong>de</strong> <strong>la</strong>s acciones técnicas a empren<strong>de</strong>r para mejorar el proceso <strong>de</strong><br />
multiplicación.<br />
Esta interprofesional cuenta con 6 <strong>de</strong>legaciones regionales distribuidas entre toda Francia, lo<br />
cual le permite estar presente y en continuo contacto con <strong>la</strong>s principales zonas productoras<br />
<strong>de</strong> semil<strong>la</strong>s. Las organizaciones <strong>de</strong>l sector <strong>de</strong> <strong>la</strong> patata asociadas a GNIS son:<br />
• CNIPT: Comité Interprofesional <strong>de</strong> patata <strong>de</strong> consumo para fresco.<br />
• CSF. Comité nacional <strong>de</strong> <strong>la</strong> fécu<strong>la</strong> <strong>de</strong> patata<br />
• FEDEPOM. Fe<strong>de</strong>ración francesa <strong>de</strong> sindicatos <strong>de</strong> comerciantes mayorista <strong>de</strong> patata.<br />
• FELCOOP. Fe<strong>de</strong>ración francesa <strong>de</strong> cooperativas <strong>de</strong> frutas y hortalizas y patata.<br />
• FNPPPT. Fe<strong>de</strong>ración nacional <strong>de</strong> productores <strong>de</strong> semil<strong>la</strong>s <strong>de</strong> patata.<br />
• FNPPTP. Fe<strong>de</strong>ración nacional <strong>de</strong> productores <strong>de</strong> patatas <strong>de</strong> primor.<br />
• FNPTC. Fe<strong>de</strong>ración nacional <strong>de</strong> productores <strong>de</strong> patata <strong>de</strong> consumo (patata <strong>de</strong><br />
conservación).<br />
• FNPTI. Fe<strong>de</strong>ración nacional <strong>de</strong> productores <strong>de</strong> patata con <strong>de</strong>stino a industria.<br />
• GIPT. Grupo nacional interprofesional <strong>de</strong> <strong>la</strong> patata con <strong>de</strong>stino a industria y <strong>de</strong> <strong>la</strong>s<br />
industrias <strong>de</strong> patata.<br />
• ITPT. Instituto Técnico <strong>de</strong> <strong>la</strong> patata.<br />
• SGSPDT. Sindicato General <strong>de</strong> seleccionadores <strong>de</strong> p<strong>la</strong>ntas <strong>de</strong> patata.<br />
12.1.4.3. GIPT (Groupement National Interprofessionnel <strong>de</strong> <strong>la</strong> pomme <strong>de</strong> terre industrielle et<br />
<strong>de</strong>s industries <strong>de</strong> transformation)<br />
El GIPT es <strong>la</strong> organización representativa <strong>de</strong> todos los es<strong>la</strong>bones <strong>de</strong> <strong>la</strong> ca<strong>de</strong>na agroalimentaria<br />
en el sector <strong>de</strong> <strong>la</strong> patata con <strong>de</strong>stino industria (industria alimentaria y feculeras). Reúne a <strong>la</strong>s<br />
organizaciones nacionales <strong>de</strong> los productores e industrias <strong>de</strong> <strong>la</strong>s dos ramas: rama Feculera<br />
(sector <strong>de</strong> patata con <strong>de</strong>stino a fécu<strong>la</strong>) y rama Transformación (sector <strong>de</strong> patata transformada<br />
para consumo humano: chips, patatas fritas y conge<strong>la</strong>das, purés <strong>de</strong>shidratados, y patata<br />
envasada V Gama). Esta interprofesional fue creada el 27 <strong>de</strong> abril <strong>de</strong> 1960, sus funciones y<br />
objetivos son:<br />
181
• Re<strong>la</strong>ción interprofesional entre todos los actores <strong>de</strong> <strong>la</strong> ca<strong>de</strong>na agroalimentaria.<br />
• Servicio a los profesionales <strong>de</strong> <strong>la</strong> ca<strong>de</strong>na.<br />
• Favorecer <strong>la</strong> investigación e innovación (I+D+i).<br />
• Diálogo permanente con los agentes exteriores.<br />
• Mejorar <strong>la</strong> calidad <strong>de</strong> los productos.<br />
• Diálogo permanente con <strong>la</strong>s Administraciones.<br />
• Trazabilidad y medio ambiente.<br />
El GIPT está compuesto por tres entida<strong>de</strong>s:<br />
• Fe<strong>de</strong>ración Nacional <strong>de</strong> Productores <strong>de</strong> patata con <strong>de</strong>stino a industria (FNPTI).<br />
• Fe<strong>de</strong>ración Nacional <strong>de</strong> Transformadores <strong>de</strong> patata (FNTPT).<br />
• Cámara Sindical Profesional Nacional <strong>de</strong> <strong>la</strong> Fécu<strong>la</strong> <strong>de</strong> patata (CSF).<br />
La rama feculera <strong>de</strong>l GIPT <strong>la</strong> integran <strong>la</strong>s profesiones que trabajan en <strong>la</strong> extracción <strong>de</strong> fécu<strong>la</strong><br />
<strong>de</strong> patata. Fue <strong>la</strong> primera componente <strong>de</strong>l GIPT en su creación en 1960. Existe una<br />
reg<strong>la</strong>mentación en el marco <strong>de</strong> un acuerdo interprofesional re<strong>la</strong>tivo a <strong>la</strong>s condiciones<br />
generales <strong>de</strong> compra <strong>de</strong> patata <strong>de</strong>stinada a industria feculera, en el que se regu<strong>la</strong>n <strong>la</strong>s<br />
condiciones <strong>de</strong> recepción y control <strong>de</strong> <strong>la</strong> patata entregada a fécu<strong>la</strong>, a<strong>de</strong>más <strong>de</strong>l contrato tipo<br />
<strong>de</strong> entrega.<br />
En cuanto a <strong>la</strong> rama transformación fue creada en 1971 y representa a <strong>la</strong>s organizaciones que<br />
producen y transforman patata <strong>de</strong>stinada al consumo humano. Esta industria se <strong>de</strong>sarrolló en<br />
Francia en los años 70. El sector <strong>de</strong> <strong>la</strong> transformación <strong>de</strong> patata para consumo humano no<br />
está regu<strong>la</strong>do por OCM, al contrario que <strong>la</strong> fécu<strong>la</strong> <strong>de</strong> patata, por lo que <strong>de</strong>be afrontar los<br />
efectos <strong>de</strong>l libre mercado.<br />
El GIPT cuenta con varias Comisiones <strong>de</strong> Trabajo que correspon<strong>de</strong>n a los temas específicos en<br />
los que se acuerda actuar, en los que están representados todas <strong>la</strong>s entida<strong>de</strong>s que forman <strong>la</strong><br />
interprofesional. Las Comisiones <strong>de</strong>l GNIPT constituidas son:<br />
• Comisión <strong>de</strong> Medio Ambiente<br />
• Comisión <strong>de</strong> <strong>P<strong>la</strong>n</strong>tas<br />
• Comisión <strong>de</strong> Comunicación<br />
Las re<strong>la</strong>ciones <strong>de</strong>l GIPT con los <strong>de</strong>más agentes <strong>de</strong>l sector son <strong>de</strong> tres tipos. En primer lugar<br />
esta interprofesional tiene <strong>la</strong>s re<strong>la</strong>ciones institucionales con los Po<strong>de</strong>res Públicos en los que se<br />
hace un papel <strong>de</strong> "lobby", en segundo lugar <strong>de</strong>s<strong>de</strong> el GIPT se financia a organismos<br />
investigadores para fomentar <strong>la</strong> I+D, y en tercer lugar se realiza una <strong>la</strong>bor <strong>de</strong> cooperación<br />
entre todas <strong>la</strong>s organizaciones implicadas. También se intercambian experiencias con otras<br />
interprofesionales.<br />
182
12.1.4.4. CNIPT (Comité National Interprofessionnel <strong>de</strong> <strong>la</strong> Pomme <strong>de</strong> Terre)<br />
Esta organización interprofesional abarca los trabajos que afectan a <strong>la</strong> patata en Francia con<br />
<strong>de</strong>stino a consumo en fresco. Fue creada en el marco <strong>de</strong> <strong>la</strong> Ley <strong>de</strong>l 10 <strong>de</strong> julio <strong>de</strong> 1975<br />
re<strong>la</strong>tiva a <strong>la</strong> organización interprofesional agríco<strong>la</strong> y reconocida por <strong>la</strong> Administración el 27 <strong>de</strong><br />
julio <strong>de</strong> 1997. Representa al sector <strong>de</strong> patata con <strong>de</strong>stino a consumo en fresco (excepto el<br />
sector <strong>de</strong> patata <strong>de</strong> primor que está integrado en INTERFEL).<br />
En concreto <strong>la</strong>s misiones <strong>de</strong>l CNIPT son:<br />
• Contribuir a <strong>la</strong> dinamización <strong>de</strong>l mercado para una mejor adaptación <strong>de</strong> los productos<br />
y para su promoción.<br />
• Reforzar <strong>la</strong> seguridad alimentaria, en particu<strong>la</strong>r por medio <strong>de</strong> <strong>la</strong> trazabilidad, en<br />
interés <strong>de</strong> los consumidores.<br />
• Definir y favorecer <strong>la</strong>s re<strong>la</strong>ciones contractuales entre los operadores.<br />
La mejora y el control <strong>de</strong> <strong>la</strong> calidad es <strong>la</strong> piedra angu<strong>la</strong>r <strong>de</strong> <strong>la</strong>s actuaciones <strong>de</strong>l CNIPT, ya que<br />
constituye una prioridad <strong>la</strong> satisfacción al consumidor, <strong>la</strong> mejora <strong>de</strong> <strong>la</strong> presentación <strong>de</strong>l<br />
producto y <strong>la</strong> seguridad alimentaria.<br />
El CNIPT centra sus trabajos fundamentalmente en dos aspectos: mejora <strong>de</strong> <strong>la</strong> calidad <strong>de</strong>l<br />
producto y comunicación con el objetivo <strong>de</strong> dar a conocer <strong>la</strong>s propieda<strong>de</strong>s nutritivas y<br />
naturales <strong>de</strong> <strong>la</strong> patata. En <strong>la</strong> mejora <strong>de</strong> <strong>la</strong> calidad, el CNIPT trabaja en los siguientes<br />
aspectos:<br />
• Producción "razonada", equivalente a <strong>la</strong> Producción Integrada en España.<br />
• Trazabilidad, para preservar <strong>la</strong> confianza <strong>de</strong> los consumidores es necesario respon<strong>de</strong>r<br />
a sus preocupaciones y mantener un alto grado <strong>de</strong> información.<br />
• Calidad en <strong>la</strong> recepción en los centros <strong>de</strong> acondicionamiento <strong>de</strong>l producto.<br />
• A<strong>de</strong>más se trabaja para asegurar <strong>la</strong> calidad <strong>de</strong> los productos puestos a disposición <strong>de</strong>l<br />
consumidor en los lineales <strong>de</strong> los puntos <strong>de</strong> venta.<br />
• Segmentación, <strong>la</strong> CNIPT trabaja para diferenciar <strong>la</strong>s calida<strong>de</strong>s gustativas <strong>de</strong> <strong>la</strong>s<br />
varieda<strong>de</strong>s <strong>de</strong> patata, i<strong>de</strong>ntificando 30 aspectos <strong>de</strong> aroma, sabor y textura, adaptando<br />
<strong>la</strong>s varieda<strong>de</strong>s a su mejor uso culinario.<br />
A<strong>de</strong>más <strong>de</strong> <strong>la</strong> calidad, <strong>la</strong> comunicación es una activad fundamental en <strong>la</strong>s actuaciones<br />
ordinarias que realiza el CNIPT. Dar a conocer <strong>la</strong>s cualida<strong>de</strong>s <strong>de</strong> <strong>la</strong> patata, así como su<br />
utilización gastronómica y bonda<strong>de</strong>s culinarias, son fundamentales para mejorar <strong>la</strong> imagen <strong>de</strong><br />
<strong>la</strong> patata ante el consumidor. En materia <strong>de</strong> comunicación y promoción esta interprofesional<br />
realiza <strong>la</strong>s siguientes acciones:<br />
183
• El objetivo <strong>de</strong> <strong>la</strong>s acciones <strong>de</strong> CNIPT en el campo <strong>de</strong> <strong>la</strong> comunicación es mejorar <strong>la</strong><br />
imagen pública <strong>de</strong> <strong>la</strong> patata. Para ello se realizan campañas en televisión, radio y<br />
prensa, teniendo mayor presencia mediática en plena campaña <strong>de</strong> comercialización.<br />
• A<strong>de</strong>más se realizan comunicaciones y co<strong>la</strong>boraciones con médicos, especialistas en<br />
nutrición para dar a conocer <strong>la</strong>s cualida<strong>de</strong>s nutricionales <strong>de</strong> <strong>la</strong> patata, así como<br />
sensibilizar a los niños en el consumo <strong>de</strong> <strong>la</strong> patata mediante acciones <strong>de</strong> comunicación<br />
en los colegios, etc.<br />
• CNIPT realiza, también, acciones <strong>de</strong> comunicación y promoción <strong>de</strong> <strong>la</strong> patata en el<br />
canal HORECA (restauración). La evolución <strong>de</strong> <strong>la</strong> sociedad que cada vez come más<br />
fuera <strong>de</strong> casa, hace <strong>de</strong> los restaurantes un instrumento idóneo para fomentar el<br />
consumo <strong>de</strong> patata.<br />
Por último CNIPT tiene como objetivo promocionar <strong>la</strong> patata <strong>de</strong> Francia en los mercados<br />
exteriores, sobre todo en el europeo. Para ello <strong>de</strong>sarrol<strong>la</strong> acciones <strong>de</strong> comunicación y<br />
fomento <strong>de</strong> <strong>la</strong> exportación a los profesionales <strong>de</strong>l sector y al público en general,<br />
presentándose en los principales salones internacionales (SIAL, Paris; Alimentaria, Barcelona;<br />
Fruit Logística, Berlin; etc …).<br />
Durante los primeros años <strong>de</strong> funcionamiento <strong>de</strong>l CNIPT, su función era <strong>la</strong> <strong>de</strong> gestionar el<br />
mercado; comprar patata cuando el mercado carecía <strong>de</strong> el<strong>la</strong>, y <strong>de</strong> intentar comercializar los<br />
exce<strong>de</strong>ntes cuando los hubiera. Sin embargo estas acciones no funcionaron y <strong>la</strong>s ventas <strong>de</strong><br />
patata seguían disminuyendo, por lo que <strong>la</strong> CNIPT se rep<strong>la</strong>nteó su función.<br />
En 1998 <strong>la</strong> interprofesional realizó varios estudios <strong>de</strong> mercado <strong>de</strong> los que se sacaron dos<br />
conclusiones. La primera era <strong>la</strong> necesidad <strong>de</strong> mejorar <strong>la</strong> calidad <strong>de</strong>l producto y <strong>la</strong> segunda<br />
mejorar <strong>la</strong> presentación <strong>de</strong>l mismo.<br />
A partir <strong>de</strong> ahí se han ido modificando los criterios <strong>de</strong> medición <strong>de</strong> <strong>la</strong>s calida<strong>de</strong>s iniciales e<br />
imp<strong>la</strong>ntado otros nuevos como son <strong>la</strong> <strong>la</strong>vabilidad, uso culinario <strong>de</strong> <strong>la</strong>s varieda<strong>de</strong>s, etc.<br />
Estos criterios no son oficiales pero con su uso y operatividad se han ido imp<strong>la</strong>ntando en el<br />
mercado tanto entre productores como entre los operadores.<br />
ITPT (Instituto Técnico <strong>de</strong> <strong>la</strong> <strong>Patata</strong>)<br />
El ITPT (Instituto Técnico <strong>de</strong> <strong>la</strong> <strong>Patata</strong>) está constituido, <strong>de</strong>finido y financiado por <strong>la</strong>s<br />
organizaciones <strong>de</strong> toda <strong>la</strong> ca<strong>de</strong>na agroalimentaria y <strong>la</strong>s interprofesionales <strong>de</strong> <strong>la</strong> patata (CNIPT,<br />
GNIS y GNIPT)<br />
184
Las finalida<strong>de</strong>s <strong>de</strong>l ITPT son:<br />
• Mejora <strong>de</strong> <strong>la</strong> comunicación entre todas <strong>la</strong>s partes <strong>de</strong> <strong>la</strong> ca<strong>de</strong>na agroalimentaria<br />
(reuniones profesionales, jornadas internacionales, etc).<br />
• Investigación en materia <strong>de</strong> calidad: los aspectos que más influyen en <strong>la</strong> calidad <strong>de</strong>l<br />
producto son investigados para ofrecer un servicio comercial a los operadores<br />
(trabajos sobre <strong>la</strong> calidad sanitaria y <strong>de</strong> presentación, aptitud al almacenamiento,<br />
etc).<br />
• Desarrollo agronómico. También este instituto se ocupa <strong>de</strong> realizar estudios acerca<br />
<strong>de</strong> <strong>la</strong>s condiciones agronómicas <strong>de</strong> <strong>la</strong> patata, estudio <strong>de</strong> suelos, adaptación <strong>de</strong><br />
varieda<strong>de</strong>s, etc…<br />
El ITPT cuenta con eficaces mecanismos para <strong>de</strong>tectar <strong>la</strong>s necesida<strong>de</strong>s <strong>de</strong> I+D+i y difundir sus<br />
innovaciones, gracias a <strong>la</strong> participación <strong>de</strong>l CNIPT y su estructura <strong>de</strong> gestión que implica a<br />
todas <strong>la</strong>s fases <strong>de</strong> <strong>la</strong> ca<strong>de</strong>na agroalimentaria. El presupuesto <strong>de</strong>l ITPT se financia en un 85%<br />
por <strong>la</strong>s 3 interprofesionales <strong>de</strong> patata que forman parte.<br />
12.1.5 TENDENCIAS DEL MERCADO FRANCÉS DE PATATA A CORTO Y MEDIO PLAZO<br />
Las principales evoluciones <strong>de</strong> <strong>la</strong>s estructuras en el mercado <strong>de</strong> patata en Francia se resumen<br />
a continuación:<br />
• Concentración <strong>de</strong> <strong>la</strong> distribución. Este fenómeno es simi<strong>la</strong>r al que está ocurriendo en<br />
toda <strong>la</strong> UE.<br />
• Concentración <strong>de</strong> <strong>la</strong>s empresas <strong>de</strong>l sector. Tanto en origen como en <strong>de</strong>stino <strong>la</strong>s<br />
empresas <strong>de</strong>l sector <strong>de</strong> <strong>la</strong> patata en Francia están teniendo procesos <strong>de</strong> concentración<br />
empresarial con el objetivo <strong>de</strong> aumentar su periodo <strong>de</strong> comercialización y su volumen.<br />
• Nuevas regiones <strong>de</strong> producción. Zonas que hace años no eran productoras <strong>de</strong> patata<br />
están teniendo un <strong>de</strong>sarrollo productivo muy importante.<br />
• Infraestructuras <strong>de</strong> almacenamiento. Se han fomentando <strong>la</strong> construcción <strong>de</strong><br />
infraestructuras <strong>de</strong> almacenamiento, primando <strong>la</strong> ubicación en <strong>la</strong>s zonas productoras.<br />
La consecuencia <strong>de</strong> este fenómeno es que se han acortado los ciclos <strong>de</strong><br />
comercialización, por lo que el mercado <strong>de</strong> patata nueva casi no existe en Francia,<br />
<strong>de</strong>bido a que <strong>la</strong> patata <strong>de</strong> conservación se almacena todo el año.<br />
• Mo<strong>de</strong>rnización <strong>de</strong>l instrumento <strong>de</strong> trabajo. A<strong>de</strong>más <strong>de</strong> <strong>la</strong>s estructuras <strong>de</strong><br />
almacenamiento, en Francia se es consciente <strong>de</strong> <strong>la</strong> necesidad <strong>de</strong> realizar inversiones<br />
185
acor<strong>de</strong>s con los requisitos <strong>de</strong>l mercado, mo<strong>de</strong>rnizándose constantemente <strong>la</strong>s<br />
explotaciones.<br />
• La I+D+i tiene un papel fundamental para multitud <strong>de</strong> facetas <strong>de</strong>l sector: <strong>de</strong>sarrollo<br />
<strong>de</strong> herramientas que faciliten <strong>la</strong> obtención <strong>de</strong> nuevas varieda<strong>de</strong>s, mayor efectividad<br />
en el control <strong>de</strong> p<strong>la</strong>gas y enfermeda<strong>de</strong>s, optimización <strong>de</strong> <strong>la</strong>s condiciones <strong>de</strong><br />
almacenamiento, etc.<br />
En cuanto a <strong>la</strong> evolución <strong>de</strong>l producto, Francia prevé <strong>la</strong>s siguientes ten<strong>de</strong>ncias:<br />
• Segmentación <strong>de</strong> <strong>la</strong> oferta <strong>de</strong>l producto (aptitud para el <strong>la</strong>vado, varieda<strong>de</strong>s, usos<br />
culinarios, etc), que da lugar a un amplio abanico <strong>de</strong> opciones comerciales. Hace años<br />
existía una única referencia <strong>de</strong> producto (variedad Binje en sacos 25 kg). Actualmente<br />
para posicionarse en el mercado es necesario ofrecer productos adaptados al uso <strong>de</strong>l<br />
consumidor. En <strong>la</strong> actualidad se está intentando acabar con el frau<strong>de</strong> que ha existido<br />
en cuanto a aptitu<strong>de</strong>s culinarias <strong>de</strong> <strong>la</strong>s varieda<strong>de</strong>s empleadas en <strong>la</strong> segmentación.<br />
• Promoción <strong>de</strong>l consumo <strong>de</strong> patata como un producto natural, sano y seguro, base <strong>de</strong><br />
<strong>la</strong> dieta mediterránea.<br />
• Desarrollo <strong>de</strong>l mercado <strong>de</strong> <strong>la</strong>s varieda<strong>de</strong>s <strong>de</strong> carne firme por su gran aptitud<br />
culinaria, sabor, textura, aroma, etc.<br />
• Otros <strong>de</strong>safíos que marcarán <strong>la</strong> comercialización <strong>de</strong> patata como <strong>de</strong>l resto <strong>de</strong> los<br />
alimentos como son <strong>la</strong> trazabilidad, producción integrada y seguridad alimentaria.<br />
La Gran Distribución, <strong>de</strong>s<strong>de</strong> <strong>la</strong>s crisis alimentarias pa<strong>de</strong>cidas (vacas locas, dioxinas,<br />
peste porcina, etc.), han intensificado sus exigencias. En parte, <strong>la</strong> reacción <strong>de</strong> <strong>la</strong><br />
distribución ha consistido en tras<strong>la</strong>dar a los proveedores <strong>la</strong>s responsabilida<strong>de</strong>s <strong>de</strong>l<br />
producto.<br />
• Los nuevos nichos <strong>de</strong> mercado; producto biológico, varieda<strong>de</strong>s específicas, etc….<br />
Aunque, a priori, estos nichos <strong>de</strong> mercado puedan suponer un sobrecoste a <strong>la</strong>s<br />
empresas productoras y comercializadoras, ofrecen <strong>la</strong> oportunidad <strong>de</strong> recobrar mayor<br />
valor añadido. Esta podrá ser una salida especialmente significativa para <strong>la</strong>s zonas <strong>de</strong><br />
producción marginal.<br />
186
12.2 SITUACIÓN DEL CULTIVO DE LA PATATA EN EL REINO UNIDO.<br />
12.2.1 SUPERFICIES Y PRODUCCIONES<br />
El cultivo <strong>de</strong> <strong>la</strong> patata en el Reino Unido (R.U.) es <strong>de</strong> gran importancia, tanto en el caso <strong>de</strong><br />
patata <strong>de</strong> consumo como en el caso <strong>de</strong> <strong>la</strong> patata <strong>de</strong> siembra.<br />
El interés <strong>de</strong> incluir este país productor en el presente <strong>P<strong>la</strong>n</strong> Estratégico no está basado en que<br />
sea un mercado que exporte gran<strong>de</strong>s cantida<strong>de</strong>s a España, si no más bien en conocer cómo<br />
han actuado los productores para <strong>de</strong>fen<strong>de</strong>r sus producciones en un entorno <strong>de</strong> libertad <strong>de</strong><br />
circu<strong>la</strong>ción <strong>de</strong> mercancías y capitales (libre comercio) <strong>de</strong> <strong>la</strong>s importaciones francesas y<br />
ho<strong>la</strong>n<strong>de</strong>sas. Por tanto, los problemas que configuraban el mercado <strong>de</strong> <strong>la</strong> patata en el R.U. son<br />
muy simi<strong>la</strong>res a los que se p<strong>la</strong>ntean en nuestra comunidad autónoma.<br />
La superficie cultivada ha tenido una evolución a <strong>la</strong> baja en los últimos 35 años, que gracias a<br />
un aumento en los rendimientos no ha supuesto un <strong>de</strong>scenso en <strong>la</strong> producción total. En el año<br />
2008, <strong>la</strong> superficie ascendió a 144.000 hectáreas; mientras que <strong>la</strong> producción en ese mismo<br />
año alcanzó <strong>la</strong>s 5,99 millones <strong>de</strong> tone<strong>la</strong>das. La evolución tanto <strong>de</strong> superficies como <strong>de</strong><br />
producciones en un periodo amplio (1973-2008) se pue<strong>de</strong> observar en el gráfico 12.4.<br />
GRAFICO 12.5: SUPERFICIES Y PRODUCCIONES DE PATATA EN EL REINO UNIDO<br />
SUPERFICIES Y PRODUCCIONES DE PATATA EN EL REINO UNIDO<br />
250<br />
9 000<br />
230<br />
8 000<br />
ÁREA EN MILES DE HECTÁREAS<br />
210<br />
190<br />
170<br />
150<br />
MILES DE TONELADAS<br />
1990<br />
1991<br />
1992<br />
130<br />
3 000<br />
110<br />
2 000<br />
AÑO<br />
1973<br />
1974<br />
1975<br />
1976<br />
1977<br />
1978<br />
1979<br />
1980<br />
1981<br />
1982<br />
1983<br />
1984<br />
1985<br />
1986<br />
1987<br />
1988<br />
1989<br />
Área<br />
Producción<br />
1993<br />
1994<br />
1995<br />
1996<br />
1997<br />
1998<br />
1999<br />
2000<br />
2001<br />
2002<br />
2003<br />
2004<br />
2005<br />
2006<br />
2007<br />
2008<br />
7 000<br />
6 000<br />
5 000<br />
4 000<br />
Fuente: DEFRA (Departent of Environment, Food and Rural Affairs, Enero <strong>2010</strong>).<br />
De <strong>la</strong> superficie p<strong>la</strong>ntada, en torno a un 10% <strong>de</strong>l total es <strong>de</strong> patata temprana, siendo el 90%<br />
restante patata tardía.<br />
187
En el caso <strong>de</strong> <strong>la</strong>s producciones, <strong>la</strong>s tone<strong>la</strong>das producidas <strong>de</strong> patata temprana suponen un<br />
menor porcentaje sobre el total <strong>de</strong> <strong>la</strong> producción <strong>de</strong>bido a un menor rendimiento, en este<br />
caso suponen en torno al 6%.<br />
Los rendimientos han crecido, y según aumentaban iba disminuyendo <strong>la</strong> superficie cultivada<br />
con <strong>la</strong> finalidad <strong>de</strong> no co<strong>la</strong>psar el mercado. Dicha evolución se aprecia bien en el gráfico 12.5.<br />
GRAFICO 12.6: RENDIMIENTO MEDIO DE PATATA EN EL REINO UNIDO.<br />
RENDIMIENTO MEDIO DE PATATAS POR HECTÁREA<br />
50,0<br />
45,0<br />
40,0<br />
TONELADAS/HA<br />
35,0<br />
30,0<br />
25,0<br />
Rendimientos medios totales<br />
Rendimientos patata temprana<br />
Rendimientos patata tardía<br />
20,0<br />
15,0<br />
10,0<br />
1973<br />
1974<br />
1975<br />
1976<br />
1977<br />
1978<br />
1979<br />
1980<br />
1981<br />
1982<br />
1983<br />
1984<br />
1985<br />
1986<br />
1987<br />
1988<br />
1989<br />
1990<br />
1991<br />
1992<br />
AÑO<br />
1993<br />
1994<br />
1995<br />
1996<br />
1997<br />
1998<br />
1999<br />
2000<br />
2001<br />
2002<br />
2003<br />
2004<br />
2005<br />
2006<br />
2007<br />
2008<br />
Fuente: DEFRA (Departent of Environment, Food and Rural Affairs, Enero <strong>2010</strong>).<br />
Como se observa en e gráfico, los rendimientos medios son c<strong>la</strong>ramente crecientes; si bien se<br />
observa que en patata temprana los rendimientos tienen una gran variabilidad y que han<br />
disminuido en los últimos años, lo que ha afectado también, <strong>de</strong> manera reducida, al<br />
rendimiento global.<br />
Comparando <strong>la</strong> superficie y producción <strong>de</strong>l Reino Unido con el conjunto <strong>de</strong> <strong>la</strong> UE(27), para ver<br />
cuál es <strong>la</strong> importancia re<strong>la</strong>tiva <strong>de</strong>l mercado inglés respecto <strong>de</strong>l total <strong>de</strong>l mercado europeo, se<br />
observa que es un 8% <strong>de</strong>l total <strong>de</strong> producción (5º puesto en el ranking total, tras Polonia,<br />
Alemania, Francia y Ho<strong>la</strong>nda), mientras que en superficie <strong>de</strong>scien<strong>de</strong> un puesto (6º puesto en<br />
el ranking, tras Polonia, Alemania, Rumanía, Ho<strong>la</strong>nda y Francia) y supone algo más <strong>de</strong>l 6% <strong>de</strong><br />
<strong>la</strong> superficie <strong>de</strong> patata cultivada en <strong>la</strong> Unión Europea.<br />
Para disponer <strong>de</strong> una i<strong>de</strong>a <strong>de</strong> <strong>la</strong> evolución <strong>de</strong>l sector en el Reino Unido en los últimos 40 años,<br />
a continuación se adjuntan una serie <strong>de</strong> gráficos que ilustran perfectamente el recorrido <strong>de</strong><br />
los indicadores c<strong>la</strong>ve que <strong>de</strong>finen el sector <strong>de</strong> <strong>la</strong> patata.<br />
188
Fuente: BPC, Agosto 2009.<br />
Este gráfico (Figura 1) indica <strong>la</strong> evolución <strong>de</strong> <strong>la</strong> superficie total y <strong>de</strong> <strong>la</strong>s superficie media <strong>de</strong><br />
patata por productor (Average área per grower). Debido a un aumento <strong>de</strong> los rendimientos<br />
(ver Figura 2) y a un estancamiento <strong>de</strong> <strong>la</strong> <strong>de</strong>manda, <strong>la</strong> superficie se ha reducido un 50% <strong>de</strong>s<strong>de</strong><br />
el año 1960, y los agricultores que quedan actualmente cultivando patata han multiplicado<br />
casi por diez <strong>la</strong> superficie por explotación respecto a <strong>la</strong> cultivada hace 50 años. Este hecho<br />
provoca una mayor profesionalización <strong>de</strong> los agricultores que ahora tienen mayor capacidad<br />
técnica y financiera.<br />
Fuente: BPC, Agosto 2009.<br />
189
Gracias al aumento <strong>de</strong> los rendimientos, se ha disminuido el área cultivada, que se ha podido<br />
emplear para otras finalida<strong>de</strong>s, y <strong>la</strong> producción se ha mantenido estable en torno a los 6<br />
millones <strong>de</strong> tone<strong>la</strong>das. Las fluctuaciones en <strong>la</strong>s producciones se achacan principalmente a <strong>la</strong>s<br />
condiciones meteorológicas <strong>de</strong> cada campaña.<br />
Fuente: BPC, Agosto 2009.<br />
Como se observa (Figura 3), el número <strong>de</strong> cultivadores ha <strong>de</strong>scendido muy severamente <strong>de</strong>s<strong>de</strong><br />
1960 hasta hoy, quedando sólo cuatro <strong>de</strong> cada cien agricultores productores <strong>de</strong> patata <strong>de</strong><br />
entonces. Por el contrario, los ingresos brutos por cultivador han crecido, <strong>de</strong> manera muy<br />
apreciable <strong>de</strong>s<strong>de</strong> 1996, año en que se liberalizó el sector. Por ello, hoy tienen menos<br />
explotaciones pero con mucha mayor capacidad productiva y económica. Las ten<strong>de</strong>ncias<br />
globales <strong>de</strong> especialización productiva también afectan <strong>de</strong> lleno a <strong>la</strong> agricultura, y <strong>de</strong>ntro <strong>de</strong><br />
el<strong>la</strong> al sector <strong>de</strong> <strong>la</strong> patata.<br />
Para aportar una i<strong>de</strong>a más <strong>de</strong> conjunto, a continuación se presenta una gráfica que<br />
representa <strong>la</strong> evolución <strong>de</strong>: Agricultores, Producción, Superficie, Valor <strong>de</strong> cosechas y<br />
Rendimientos por hectárea. (Figura 4)<br />
190
Fuente: BPC, Agosto 2009.<br />
Por último se aña<strong>de</strong> un gráfico (Figura 5) que muestra <strong>la</strong> re<strong>la</strong>ción existente entre <strong>la</strong>s crisis <strong>de</strong><br />
precios y los excesos <strong>de</strong> producción (sobre lo asumible por el mercado) <strong>de</strong> <strong>la</strong> campaña<br />
anterior (2008). Como se pue<strong>de</strong> observar c<strong>la</strong>ramente, los precios caen cuando <strong>la</strong> producción<br />
crece (Los precios están ajustados a <strong>la</strong> inf<strong>la</strong>ción).<br />
Fuente: BPC, Agosto 2009.<br />
191
Como se pue<strong>de</strong> observar, hay una re<strong>la</strong>ción directamente proporcional ente los precios y <strong>la</strong><br />
cantidad producida <strong>de</strong> patata. Los años <strong>de</strong> precios bajos aparecen cuando <strong>la</strong> producción<br />
supera los 6 millones <strong>de</strong> tone<strong>la</strong>das.<br />
12.2.2 MERCADOS<br />
Para caracterizar el mercado <strong>de</strong> <strong>la</strong>s patatas en el Reino Unido, primero se seña<strong>la</strong>rán cuáles<br />
son <strong>la</strong>s características más <strong>de</strong>stacables <strong>de</strong> <strong>la</strong> <strong>de</strong>manda <strong>de</strong> patatas; es <strong>de</strong>cir, el consumo. Las<br />
características más reseñables son <strong>la</strong>s siguientes:<br />
• 3.000 millones <strong>de</strong> libras <strong>de</strong> valor a nivel consumidor. 742 millones <strong>de</strong> libras en posición<br />
origen.<br />
• El consumo per cápita, basado en valores equivalentes en patata fresca, parece<br />
estabilizado en torno a los 94 kg/persona/año.<br />
• En el comercio minorista, tanto <strong>la</strong>s patatas frescas como <strong>la</strong>s procesadas han crecido año<br />
tras año.<br />
• El precio en el comercio minorista tiene una ten<strong>de</strong>ncia creciente.<br />
• El consumo se segmenta 50% fresco y 50% procesado (<strong>de</strong>s<strong>de</strong> el año 1.998 el sector <strong>de</strong><br />
industria ha venido ganando cuota <strong>de</strong> mercado al sector <strong>de</strong> fresco, aunque en 2.004 esta<br />
ten<strong>de</strong>ncia se invirtió y parece que el equilibrio ha llegado al mercado).<br />
• Los principales alimentos competidores <strong>de</strong> <strong>la</strong> patata son <strong>la</strong> pasta y el arroz, así como<br />
otras fuentes <strong>de</strong> carbohidratos (como por ejemplo <strong>la</strong>s especialida<strong>de</strong>s <strong>de</strong> pana<strong>de</strong>ría). De<br />
todas maneras, <strong>la</strong>s patatas disfrutan, <strong>de</strong> <strong>la</strong>rgo, <strong>de</strong> <strong>la</strong> más alta cuota <strong>de</strong> mercado.<br />
• Exportador c<strong>la</strong>ve en patata <strong>de</strong> siembra <strong>de</strong> alta calidad (a España principalmente exportan<br />
varieda<strong>de</strong>s <strong>de</strong> uso industrial).<br />
• Las importaciones se han incrementado regu<strong>la</strong>rmente <strong>de</strong>s<strong>de</strong> 1988, llegando a duplicarse<br />
hasta <strong>la</strong> actualidad. El incremento ha sido sobre todo en patata <strong>de</strong> industria.<br />
• El mercado se <strong>de</strong>fine con <strong>la</strong>s siguientes i<strong>de</strong>as:<br />
El consumidor es una persona <strong>de</strong> edad media-alta, mientras que en los estratos<br />
jóvenes se observa orientación hacia el arroz o <strong>la</strong> pasta.<br />
Buen perfil nutritivo, no reconocido <strong>de</strong> manera global.<br />
Posible problema <strong>de</strong> “Imagen” (patata=alimento energético=alimento que engorda)<br />
Prevalecen los minoristas, lo que disminuye los márgenes <strong>de</strong>l productor.<br />
Elevada atomización en <strong>la</strong> distribución alimentaria, aunque existen algunos gran<strong>de</strong>s<br />
compradores.<br />
Las importaciones están sometidas al cambio <strong>de</strong> divisa, al igual que <strong>la</strong>s exportaciones.<br />
Gran<strong>de</strong>s oportunida<strong>de</strong>s para los cultivadores <strong>de</strong> semil<strong>la</strong> en los mercados exteriores.<br />
192
En referencia al suministro <strong>de</strong> patatas en el Reino Unido, su naturaleza viene <strong>de</strong>terminada<br />
por <strong>la</strong>s siguientes circunstancias:<br />
• Mercado totalmente liberalizado, pues este producto se encuentra fuera <strong>de</strong>l ámbito <strong>de</strong><br />
actuación <strong>de</strong> <strong>la</strong> Política Agríco<strong>la</strong> Común (PAC).<br />
• La producción total en los últimos 5 años muestra una leve ten<strong>de</strong>ncia a <strong>la</strong> baja.<br />
• La producción se consigue en menos hectáreas y con pocos agricultores (el número <strong>de</strong><br />
agricultores ha caído un 70% en los últimos 10 años).<br />
• La producción <strong>de</strong> patata está caracterizada por ser intensiva en el uso <strong>de</strong> capital, lo que<br />
<strong>la</strong> convierte en un negocio <strong>de</strong> alto riesgo.<br />
• Los precios <strong>de</strong> <strong>la</strong> patata se han incrementado año tras año (4% el fresco, 6% el conge<strong>la</strong>do<br />
y <strong>la</strong>s chips y otras transformaciones el 12%); y los principales competidores han disfrutado<br />
incluso <strong>de</strong> mayores aumentos <strong>de</strong> precio (arroz 9%, pasta 31%...).<br />
Respecto a <strong>la</strong> estructura <strong>de</strong> los productores, los registrados por el BPC (British Potato Council)<br />
han disminuido radicalmente, <strong>de</strong>s<strong>de</strong> unos 77.000 en 1.960 a 2.981 en 2.008. Por contra, los<br />
agricultores son ahora altamente especializados y se encuentran perfectamente integrados en<br />
<strong>la</strong> ca<strong>de</strong>na <strong>de</strong> suministro. Los ingresos por explotación están en una ten<strong>de</strong>ncia c<strong>la</strong>ramente al<br />
alza, en parte <strong>de</strong>bido a <strong>la</strong> <strong>de</strong>sregu<strong>la</strong>ción efectuada en el año 1.996, que provocó un agudo<br />
incremento en <strong>la</strong> superficie <strong>de</strong> patata cultivada por agricultor.<br />
12.2.3 BRITISH POTATO COUNCIL<br />
Un agente importante (c<strong>la</strong>ve) en <strong>la</strong> producción <strong>de</strong> patata en el Reino Unido es el British<br />
Potato Council BPC (“Consejo Británico <strong>de</strong> <strong>la</strong> <strong>Patata</strong>”).<br />
El BPC es una fundación <strong>de</strong> naturaleza pública, que está encuadrada en <strong>la</strong> “Agriculture and<br />
Horticulture Development Board (AHDB)” (Junta <strong>de</strong> Desarrollo <strong>de</strong> <strong>la</strong> Agricultura y<br />
Horticultura) pero con financiación privada. Sus activida<strong>de</strong>s están basadas en los principios <strong>de</strong><br />
transparencia, imparcialidad, responsabilidad, li<strong>de</strong>razgo y cuidadoso empleo <strong>de</strong> los recursos.<br />
Por ello:<br />
• Trabaja en beneficio <strong>de</strong>l sector <strong>de</strong> <strong>la</strong> patata británico.<br />
• Emplea los recursos para obtener el máximo rendimiento <strong>de</strong> <strong>la</strong> inversión recaudada.<br />
• Mejora <strong>de</strong>l marketing en el sector <strong>de</strong> <strong>la</strong> patata.<br />
• Involucra y consulta regu<strong>la</strong>rmente con <strong>la</strong> industria sobre estrategias y activida<strong>de</strong>s.<br />
• Desarrol<strong>la</strong> servicios para que el sector provea o pueda proveer a <strong>la</strong> sociedad.<br />
• Mejorar los métodos para que el sector contribuya al <strong>de</strong>sarrollo sostenible.<br />
193
La financiación, tal y como se ha seña<strong>la</strong>do, es soportada por el sector productor y<br />
transformador, mediante unas tasas obligatorias fijas por hectárea <strong>de</strong> patata sembrada<br />
(actualmente 39 libras) o por tone<strong>la</strong>da <strong>de</strong> patata comercializada (actualmente 0,17<br />
libras/tone<strong>la</strong>da). En el año 2008 los ingresos fueron <strong>de</strong> 6,05 millones <strong>de</strong> libras, ello le<br />
proporciona <strong>la</strong> in<strong>de</strong>pen<strong>de</strong>ncia necesaria para su propio funcionamiento.<br />
Entre sus muchas activida<strong>de</strong>s, cabe <strong>de</strong>stacar <strong>la</strong> e<strong>la</strong>boración <strong>de</strong> un <strong>P<strong>la</strong>n</strong> Estratégico 2009-2012<br />
para el sector <strong>de</strong> <strong>la</strong> patata.<br />
Describiendo el <strong>P<strong>la</strong>n</strong> <strong>de</strong> manera muy sucinta, po<strong>de</strong>mos <strong>de</strong>cir que este <strong>P<strong>la</strong>n</strong> Estratégico se<br />
e<strong>la</strong>boró partiendo <strong>de</strong> un análisis DAFO en el que estuvieron implicados tanto el Consejo <strong>de</strong><br />
Administración <strong>de</strong>l BPC, como el sector productor y <strong>la</strong> industria transformadora y<br />
comercializadora.<br />
El DAFO se organizó en tres ejes: Mercado, Producto y Sector productor y sus limitaciones.<br />
Respecto al Mercado, el objetivo propuesto en el p<strong>la</strong>n es apoyar al sector <strong>de</strong> patata<br />
Británica e imp<strong>la</strong>ntarse en los mercados locales y extranjeros mediante acciones concretas:<br />
campañas sobre el beneficio saludable <strong>de</strong> <strong>la</strong> patata, campañas especiales dirigidas a jóvenes y<br />
niños, co<strong>la</strong>boración con otros tres países para fomento <strong>de</strong>l consumo <strong>de</strong> patata, etc... El<br />
objetivo es conseguir que se incrementen <strong>la</strong>s comidas don<strong>de</strong> participa <strong>la</strong> patata hasta un 30%<br />
<strong>de</strong>ntro <strong>de</strong> los grupos <strong>de</strong> pob<strong>la</strong>ción objetivo. Por otra parte también existen estrategias<br />
encaminadas al crecimiento <strong>de</strong> <strong>la</strong>s exportaciones <strong>de</strong> <strong>la</strong> patata <strong>de</strong> siembra británica y a<br />
asegurar que <strong>la</strong>s necesida<strong>de</strong>s <strong>de</strong>l sector productor <strong>de</strong> patata se satisfacen por <strong>la</strong> industria<br />
nacional <strong>de</strong> patata <strong>de</strong> siembra.<br />
Respecto al Producto, el objetivo es <strong>la</strong> mejora <strong>de</strong> su competitividad a través <strong>de</strong> mejoras en<br />
los cultivos y en <strong>la</strong> organización <strong>de</strong>l negocio . Las estrategias seguidas para conseguir el<br />
objetivo son: incremento <strong>de</strong>l rendimiento vendible, reducción <strong>de</strong> <strong>de</strong>fectos en producto<br />
(menores <strong>de</strong>scuentos), reducción <strong>de</strong> costes <strong>de</strong> materias primas, mejora <strong>de</strong> <strong>la</strong>s re<strong>la</strong>ciones<br />
entre <strong>la</strong> ca<strong>de</strong>na <strong>de</strong> suministro y precisión en <strong>la</strong> inteligencia <strong>de</strong> mercado (co<strong>la</strong>borando con<br />
TNS).<br />
Respecto al sector productor y sus limitaciones, <strong>la</strong>s estrategias seguidas se basan en <strong>la</strong><br />
comprensión y gestión <strong>de</strong> <strong>la</strong>s políticas regu<strong>la</strong>doras, en <strong>la</strong> mejora <strong>de</strong>l flujo <strong>de</strong>l conocimiento y<br />
su aprovechamiento y aumentar <strong>la</strong> pericia y habilidad <strong>de</strong> los agrónomos y <strong>de</strong> los productores.<br />
Todos estos objetivos están cuantificados, sus estrategias e indicadores <strong>de</strong>finidos y sus riesgos<br />
i<strong>de</strong>ntificados. Así mismo, cada medida lleva aparejada su dotación presupuestaria<br />
correspondiente.<br />
194
12.3 ESTUDIO DE LOS COSTES DE PRODUCCIÓN EN EL CULTIVO DE LA PATATA EN EUROPA<br />
12.3.1 FRANCIA<br />
A) Descripción <strong>de</strong> <strong>la</strong>s explotaciones y coyuntura agraria en Francia.<br />
La producción <strong>de</strong> patatas en Francia se centra en el área noreste <strong>de</strong>l país como ya hemos<br />
visto anteriormente. Tradicionalmente se han cultivado en “Picardy” y “Nord Pas <strong>de</strong> Ca<strong>la</strong>is”,<br />
extendiéndose este cultivo en los últimos años a “nuevas” regiones como Champagne y La<br />
Beuce.<br />
Los suelos <strong>de</strong> <strong>la</strong>s zonas <strong>de</strong>l norte <strong>de</strong> Francia (Nord Pas <strong>de</strong> Ca<strong>la</strong>is) son suelos mayormente<br />
calizos, y con limitaciones rotacionales por su <strong>la</strong>rgo historial productivo. Su proximidad a<br />
Bélgica, zona altamente pob<strong>la</strong>da, provoca una estructura <strong>de</strong> explotaciones pequeña, lo que<br />
hace que los precios y rentas <strong>de</strong> <strong>la</strong> tierra sean los más altos <strong>de</strong> Francia.<br />
Así, <strong>la</strong> estructura típica son explotaciones <strong>de</strong> 100-150 has. <strong>de</strong> <strong>la</strong>s cuales unas 15-30 has. son<br />
<strong>de</strong> patatas. La mano <strong>de</strong> obra suele ser familiar, tanto en el trabajo <strong>de</strong> campo como en el <strong>de</strong><br />
almacenamiento, aunque a veces hay asa<strong>la</strong>riados (1 ó 2) por ello los costes <strong>de</strong> mano <strong>de</strong> obra<br />
no suelen estar muy bien reflejados en los análisis. Las explotaciones <strong>de</strong> 200-300 has. son muy<br />
poco representativas.<br />
Existe gran disparidad <strong>de</strong>ntro <strong>de</strong> Francia en el precio y <strong>la</strong> renta <strong>de</strong> <strong>la</strong> tierra. A<strong>de</strong>más hay que<br />
consi<strong>de</strong>rar numerosos condicionantes legales como <strong>la</strong> venta <strong>de</strong> terrenos arrendados, <strong>la</strong><br />
expansión <strong>de</strong> <strong>la</strong>s explotaciones y <strong>la</strong> prioridad otorgada a <strong>la</strong>s primeras insta<strong>la</strong>ciones.<br />
El valor <strong>de</strong>l terreno en el noreste (Picardy, Nord Pas <strong>de</strong> Ca<strong>la</strong>is) es <strong>de</strong> unos 12.000 a 15.000 €<br />
por hectárea, mientras que en <strong>la</strong>s otras zonas productoras (Haute Normandie-Seine maritime,<br />
Beauce, etc…) es menor, unos 6.000 € por hectárea. Es mayor en el norte por estar más<br />
<strong>de</strong>nsamente pob<strong>la</strong>da y por tener más industria transformadora.<br />
El precio <strong>de</strong>l arrendamiento está en función <strong>de</strong>l tipo <strong>de</strong> contrato. En contratos a <strong>la</strong>rgo p<strong>la</strong>zo,<br />
conocidos por “Fermage”, se suelen pagar unos 120-170 €/ha, mientras que en los contratos<br />
anuales (a corto p<strong>la</strong>zo) <strong>la</strong> renta osci<strong>la</strong> entre 800 y 1.000 €/ha. La expansión <strong>de</strong> <strong>la</strong>s<br />
explotaciones se ve dificultada por <strong>la</strong>s leyes <strong>de</strong> herencia y por otras circunstancias. A pesar<br />
<strong>de</strong> ello, se observa un crecimiento <strong>de</strong> <strong>la</strong>s explotaciones con tierras propias, en contraste con<br />
<strong>la</strong> disminución <strong>de</strong> los ingresos por explotación.<br />
195
Los cultivos que componen <strong>la</strong>s rotaciones son patatas (20%), remo<strong>la</strong>cha (15%) y cereales. La<br />
industria <strong>de</strong>l etanol está adquiriendo protagonismo también en estas regiones, lo que<br />
proporciona mayor seguridad <strong>de</strong> cara al futuro, sobre todo ante los cierres previstos <strong>de</strong><br />
fábricas molturadoras <strong>de</strong> remo<strong>la</strong>cha.<br />
Las explotaciones son in<strong>de</strong>pendientes en aspectos como mecanización, organización y ventas,<br />
con menos cooperación en el sector <strong>de</strong> patata que en otras producciones. A modo <strong>de</strong><br />
ejemplo, <strong>la</strong> mecanización in<strong>de</strong>pendiente <strong>de</strong> <strong>la</strong>s explotaciones provoca que muchas<br />
explotaciones cuenten con más <strong>de</strong> cinco tractores y con un completo equipamiento para el<br />
cultivo <strong>de</strong> <strong>la</strong> patata (sembradoras, cosechadoras, etc…). No obstante, si que es frecuente <strong>la</strong><br />
agrupación <strong>de</strong> los agricultores para el uso en común <strong>de</strong> almacenes. El ánimo <strong>de</strong> invertir en el<br />
negocio por <strong>de</strong>sgravación fiscal es uno <strong>de</strong> los escasos “subsidios” encontrados en el estudio,<br />
que podría tener su influencia en los costes <strong>de</strong> producción.<br />
El riego no está muy generalizado, siendo los productores <strong>de</strong> fresco los que más lo emplean.<br />
B) Cálculo <strong>de</strong>l margen bruto. Contabilidad analítica.<br />
Se ha realizado una investigación sobre los costes <strong>de</strong> producción <strong>de</strong> <strong>la</strong> patata francesa. Como<br />
norma general, po<strong>de</strong>mos afirmar que en todas <strong>la</strong>s publicaciones consultadas los costes<br />
variables, re<strong>la</strong>tivos a los inputs (abonos, fitosanitarios y semil<strong>la</strong>s) son simi<strong>la</strong>res en todos los<br />
estudios, mientras que los costes fijos no lo son tanto pues son un coste más ligado a <strong>la</strong> propia<br />
estructura y naturaleza <strong>de</strong> <strong>la</strong> explotación; y pue<strong>de</strong>n variar bastante según sea <strong>la</strong> muestra <strong>de</strong><br />
explotaciones objeto <strong>de</strong> estudio.<br />
Como se observa en el escandallo <strong>de</strong> costes, los años estudiados son 2004, 2008 y 2009, no<br />
disponiendo <strong>de</strong> datos fiables para el resto <strong>de</strong> años.<br />
196
Francia<br />
PATATA DE CONSUMO<br />
2004 2008 2009<br />
RENDIMIENTO (t/ha) 45,42 43,59 44,9<br />
PRECIO (€/t) 113,8 122,4 124,7<br />
OTROS INGRESOS (€) 103 ND ND<br />
INGRESOS TOTALES (€/ha) 5.271,80 5.335,42 5.599,03<br />
COSTES (€/ha)<br />
SEMILLA 530 ND ND<br />
FITOSANITARIOS 358 ND ND<br />
FERTILIZANTES 207 ND ND<br />
OTROS COSTES DE CULTIVO 87 ND ND<br />
TOTAL COSTES VARIABLES (€/ha) 1.182,00 2.475,00 2.544,75<br />
MARGEN BRUTO (€/ha) 4.089,80 2.860,42 3.054,28<br />
COSTES FIJOS (DE ESTRUCTURA) (€/ha) 2.494,00 2.027,00 2.696,85<br />
MARGEN NETO (€/ha) 1.595,80 833,42 357,43<br />
COSTES TOTALES (VARIABLE+FIJOS) 3.676,00 4.502,00 5.241,60<br />
RESULTADO NETO (€/ha) 1.595,80 833,42 357,43<br />
COSTE (€/t) 80,93 103,28 116,74<br />
ND: Datos no disponibles.<br />
Se pue<strong>de</strong> concluir que, el coste en €/t no ha sufrido gran<strong>de</strong>s variaciones en los años<br />
estudiados. No se pue<strong>de</strong> <strong>de</strong>cir lo mismo en el coste total por hectárea, que sí que ha<br />
aumentado <strong>de</strong> manera muy significativa (+42%) en el periodo estudiado. Gran parte <strong>de</strong> ese<br />
aumento se <strong>de</strong>be a los costes variables (semil<strong>la</strong>, abonos y fitosanitarios) que han aumentado<br />
un 115%. Se observa que los altos precios <strong>de</strong> <strong>la</strong>s materias primas han tenido un fuerte reflejo<br />
en los costes <strong>de</strong> producción <strong>de</strong> patatas.<br />
Las fuentes <strong>de</strong> <strong>la</strong>s que se han tomado estos costes son:<br />
• 2004: L´agriculture, noveaux défis- Edition 2007. (INSEE).<br />
• 2004: Cost of production 2006, a European perspective. British Potato<br />
Council 2006.<br />
• 2008: Pomme <strong>de</strong> Terre hebdo. Nº 910-20 jun 2009. CNIPT.<br />
• 2009: Profil nº35 Automne 2009. UNPT.<br />
197
Como aspectos importantes a <strong>de</strong>stacar sobre estas fuentes, hay que comentar lo siguiente:<br />
• El estudio empleado para el año 2004 se ha realizado sobre 14.680<br />
explotaciones, con una superficie media <strong>de</strong> 9,4 has. <strong>de</strong> patatas.<br />
• Los costes <strong>de</strong> estructura incluyen <strong>la</strong>s siguientes partidas: amortización<br />
inmovilizado, riego –mecanizado, agua y energía-, mano <strong>de</strong> obra (sa<strong>la</strong>rios<br />
y seguros sociales, arrendamientos a <strong>la</strong>rgo p<strong>la</strong>zo (fermage), análisis <strong>de</strong><br />
suelos, comisiones, seguros y cargas diversas).<br />
• La partida <strong>de</strong> riego ascien<strong>de</strong> a 315 €/ha, lo que elimina <strong>la</strong> visión<br />
equivocada <strong>de</strong> que el riego es innecesario en estas zonas.<br />
12.3.2 HOLANDA<br />
A) Descripción <strong>de</strong> <strong>la</strong>s explotaciones y coyuntura agraria en Ho<strong>la</strong>nda.<br />
La estructura <strong>de</strong> <strong>la</strong> agricultura ho<strong>la</strong>n<strong>de</strong>sa es reflejo <strong>de</strong> <strong>la</strong> alta <strong>de</strong>nsidad <strong>de</strong>mográfica y <strong>de</strong> <strong>la</strong><br />
proximidad a mercados para un amplio catálogo <strong>de</strong> productos, junto a su renombre en el<br />
comercio y <strong>la</strong> exportación para patata <strong>de</strong> consumo y <strong>de</strong> siembra.<br />
El tamaño <strong>de</strong> <strong>la</strong>s explotaciones es limitado, sobre 22 hectáreas. El tamaño es mayor en otras<br />
zonas, como el sur <strong>de</strong> Ámsterdam o los Pól<strong>de</strong>r (aquí llegan hasta 80 hectáreas). En todo caso,<br />
los cultivadores con más <strong>de</strong> 100 has. suponen sólo el 2% <strong>de</strong> los titu<strong>la</strong>res <strong>de</strong> <strong>la</strong>s explotaciones.<br />
La alternativa <strong>la</strong> conforman <strong>la</strong>s patatas (25%), remo<strong>la</strong>cha azucarera, cereales y otros cultivos<br />
intensivos (cebol<strong>la</strong>s, bulbos, etc…). Menos <strong>de</strong>l 20% <strong>de</strong> <strong>la</strong> superficie arable <strong>de</strong>l país está<br />
cultivada <strong>de</strong> cereales.<br />
Las explotaciones tienen un nivel <strong>de</strong> asociacionismo sorpren<strong>de</strong>ntemente limitado, aunque<br />
<strong>de</strong>bido al pequeño tamaño <strong>de</strong> <strong>la</strong>s mismas, sus titu<strong>la</strong>res están juntando fuerzas con sus vecinos<br />
para crear unida<strong>de</strong>s más viables.<br />
El almacenamiento es sencillo, a granel y sin control ambiental, pues mucha patata se <strong>de</strong>stina<br />
a industria.<br />
El riego no está muy generalizado, aunque don<strong>de</strong> se emplea se hace a manta, con los riesgos<br />
sanitarios y <strong>de</strong> baja producción que conlleva este sistema.<br />
198
Respecto al valor <strong>de</strong> <strong>la</strong> tierra, está en concordancia con su escasez. No olvi<strong>de</strong>mos que<br />
Ho<strong>la</strong>nda se ha configurado como un territorio ganado al mar, lo que nos indica <strong>la</strong> avi<strong>de</strong>z que<br />
tienen sus habitantes por conseguir terreno. Los precios pue<strong>de</strong>n llegar a los 45.000 €/ha en<br />
los Pól<strong>de</strong>r (muchos <strong>de</strong> esos terrenos pertenecen al Estado), mientras que en el sur se<br />
encuentran en torno a los 30.000 €/ha. El coste <strong>de</strong> los arrendamientos también <strong>de</strong>pen<strong>de</strong> <strong>de</strong>l<br />
p<strong>la</strong>zo <strong>de</strong> los mismos, osci<strong>la</strong>ndo <strong>de</strong> unos 500 €/ha hasta unos 1.100-2.000 €/ha <strong>de</strong> renta anual<br />
para el cultivo <strong>de</strong> patatas.<br />
B) Cálculo <strong>de</strong>l margen bruto. Contabilidad analítica.<br />
A diferencia <strong>de</strong>l caso francés, para Ho<strong>la</strong>nda se han encontrado datos unificados sobre los<br />
costes <strong>de</strong> producción en los años 2.006, 2.007 y 2.008. Esto nos permite evaluar con mayor<br />
certeza los cambios acaecidos en <strong>la</strong> estructura <strong>de</strong> los costes en los años estudiados.<br />
Ho<strong>la</strong>nda<br />
PATATA DE CONSUMO<br />
2006 2007 2008<br />
RENDIMIENTO 44,63 46,12 54,2<br />
PRECIO 174,4 107 110,3<br />
OTROS INGRESOS 2 16 7<br />
INGRESOS TOTALES 7.785,47 4.950,84 5.985,26<br />
COSTES<br />
SEMILLA 679 981 942<br />
FITOSANITARIOS 628 722 675<br />
FERTILIZANTES 295 318 461<br />
OTROS COSTES DE CULTIVO 309 149 154<br />
TOTAL COSTES VARIABLES 1.911,00 2.170,00 2.232,00<br />
MARGEN BRUTO 5.874,47 2.780,84 3.753,26<br />
COSTES DE CONTRATACIÓN 147 137 136<br />
COSTES INDIRECTOS 1.900,72 2.062,30 2.200,00<br />
MARGEN NETO 3.826,75 581,54 1.417,26<br />
COSTES DE CAPITAL + EMPRESARIO 1.265,34 872,05 1.361,67<br />
COSTES TOTALES<br />
(VARIABLE+INDIRECTO+CAPITAL)<br />
5.224,06 5.241,35 5.929,67<br />
RESULTADO NETO 2.561,41 -290,51 55,59<br />
COSTE €/t 117,05 113,65 109,40<br />
199
Como aspectos importantes ac<strong>la</strong>ratorios <strong>de</strong> <strong>la</strong> anterior tab<strong>la</strong>, hay que seña<strong>la</strong>r los siguientes:<br />
• Los costes indirectos más los costes <strong>de</strong> capital son calcu<strong>la</strong>dos <strong>de</strong> una media <strong>de</strong> 170<br />
explotaciones, para una superficie arable media <strong>de</strong> 58,4 has.<br />
• Costes indirectos: Energía + intangibles + renta + amortizaciones + gasoil +<br />
mantenimientos + asa<strong>la</strong>riados + contratistas + gastos financieros + costes generales.<br />
• Los costes <strong>de</strong> capital + empresario incluyen: Beneficio <strong>de</strong>l empresario + renta <strong>de</strong> <strong>la</strong><br />
tierra + gastos financieros <strong>de</strong> otros bienes tangibles.<br />
Los datos para todos los años han sido extraídos <strong>de</strong> <strong>la</strong> Universidad <strong>de</strong> Wageningen (LEI, Farm<br />
Accountancy Data Network <strong>2010</strong>) y <strong>de</strong>l estudio “Cost of production 2006, a European<br />
perspective.” British Potato Council 2006.<br />
Como conclusión, se pue<strong>de</strong> afirmar lo siguiente:<br />
• Los costes a nivel <strong>de</strong> producción agríco<strong>la</strong> en Castil<strong>la</strong> y León están en sintonía<br />
con los <strong>de</strong> los otros países europeos <strong>de</strong> primer nivel en cuanto al cultivo <strong>de</strong><br />
patata. En Castil<strong>la</strong> y León <strong>la</strong>s partidas más importantes son <strong>la</strong> semil<strong>la</strong> y el riego.<br />
En el noreste <strong>de</strong> Francia y en Ho<strong>la</strong>nda <strong>la</strong>s partidas más gran<strong>de</strong>s son en rentas <strong>de</strong><br />
<strong>la</strong> tierra y fitosanitarios.<br />
• Los rendimientos son más elevados en estos países, lo cual les permite reducir el<br />
coste por kilogramo <strong>de</strong> patata.<br />
A mayores <strong>de</strong> lo expuesto, el estudio <strong>de</strong>l año 2006 <strong>de</strong>l BPC aporta otras consi<strong>de</strong>raciones que<br />
se <strong>de</strong>stacan a continuación:<br />
- Desarrollo <strong>de</strong> varieda<strong>de</strong>s competitivas con c<strong>la</strong>ra orientación para el sector<br />
industrial. En un mundo globalizado, <strong>la</strong> industria necesita estar al día acerca <strong>de</strong> cómo<br />
se <strong>de</strong>sarrol<strong>la</strong>n los mercados en los países vecinos.<br />
- Dada <strong>la</strong> gran competitividad existente en los países <strong>de</strong> <strong>la</strong> UE <strong>de</strong>ntro <strong>de</strong>l sector <strong>de</strong> <strong>la</strong><br />
patata, los productores <strong>de</strong>ben estar al día <strong>de</strong> <strong>la</strong>s noticias <strong>de</strong>l sector, y tratar <strong>de</strong><br />
i<strong>de</strong>ntificar sus ventajas en lo referente a los costes <strong>de</strong> producción, para po<strong>de</strong>r resistir<br />
al mercado y producir <strong>de</strong> forma competitiva productos que tengan cabida en el<br />
mercado <strong>de</strong> fresco y/o industria.<br />
- Se <strong>de</strong>mandan nuevos estándares <strong>de</strong> calidad en lo referente a <strong>la</strong> producción <strong>de</strong><br />
alimentos saludables. La innovación juega un papel crucial en este sentido, por lo<br />
que hay que estar en continua evolución para conocer lo que quiere el consumidor y<br />
como po<strong>de</strong>r satisfacerle.<br />
200
- La sociedad <strong>de</strong>manda una producción sostenible, más respetuosa con el medio<br />
ambiente. De este modo hay que impulsar <strong>la</strong> producción integrada y que ésta pueda<br />
ser diferenciada <strong>de</strong> <strong>la</strong> convencional en los lugares <strong>de</strong> compra <strong>de</strong>l consumidor.<br />
- Algunas zonas <strong>de</strong> Francia tienen potencial para incrementar su producción. Hay<br />
muchos productores con más <strong>de</strong> 55 años y no hay relevo generacional. Por lo tanto<br />
existe <strong>la</strong> oportunidad para combinar pequeñas explotaciones en una mayor, que<br />
comercialmente esté mejor orientada y con mayores facilida<strong>de</strong>s para <strong>la</strong> producción.<br />
- Todas <strong>la</strong>s regiones productoras <strong>de</strong> Ho<strong>la</strong>nda tienen una <strong>la</strong>rga historia.<br />
Sorpren<strong>de</strong>ntemente tienen pocos problemas con los nematodos formadores <strong>de</strong><br />
quistes, probablemente porque han mejorado mucho <strong>la</strong>s resistencias en <strong>la</strong>s nuevas<br />
varieda<strong>de</strong>s. Han realizado una gran inversión en <strong>la</strong> industria <strong>de</strong>l procesado, estando<br />
bien suministrados por su producción doméstica, junto a <strong>la</strong>s importaciones <strong>de</strong> Bélgica<br />
y Alemania. Sin embargo, su industria <strong>de</strong> envasado es pequeña, estando suministrados<br />
<strong>de</strong> “French Fries” por Francia.<br />
- Los costes en fitosanitarios en Ho<strong>la</strong>nda son altos <strong>de</strong>bido a su alta intensidad <strong>de</strong><br />
cultivo.<br />
- La industria europea generalmente contrata sobre el 50% <strong>de</strong> sus necesida<strong>de</strong>s. El resto<br />
lo compra en el mercado libre.<br />
- La proximidad <strong>de</strong> Francia, Ho<strong>la</strong>nda, Bélgica y Alemania, con <strong>la</strong> gran cantidad <strong>de</strong><br />
industrias existentes, crea un mercado que pue<strong>de</strong> ser fácilmente alterable.<br />
- El mercado <strong>de</strong> <strong>la</strong>s French Fries está dominado por 4 gran<strong>de</strong>s compañías que acaparan<br />
el 85% <strong>de</strong> <strong>la</strong> producción (McCain, Lamb Weston Meijer, Avico y Farm Frites).<br />
- Hay una fuerte <strong>de</strong>manda <strong>de</strong> productos <strong>de</strong> patata procesados, aunque está empezando<br />
un importante cambio y se está incorporando producto fresco pe<strong>la</strong>do al mercado<br />
europeo.<br />
- El sector <strong>de</strong> <strong>la</strong> patata <strong>de</strong> siembra en Francia se centra en su consumo interno. Sus<br />
principales áreas son Bretaña y Normandía. Muchos productores trabajan para ven<strong>de</strong>r<br />
su producto a Agrico o HZPC.<br />
- El mercado seguirá siendo extremadamente competitivo, con una gran presión <strong>de</strong> los<br />
<strong>de</strong>tallistas y servicios <strong>de</strong> alimentación.<br />
- Con <strong>la</strong> incorporación <strong>de</strong> nuevos países a <strong>la</strong> UE habrá más producción y más industrias,<br />
esto implica mayor competencia.<br />
- No hay evi<strong>de</strong>ncias reales <strong>de</strong> que <strong>la</strong>s subvenciones tengan un impacto importante en<br />
los costes <strong>de</strong> producción.<br />
A continuación se reproduce, por su interés, un comunicado <strong>de</strong> prensa <strong>de</strong> <strong>la</strong> UNPT francesa<br />
fechado en Noviembre <strong>de</strong> 2.009, en el que se rec<strong>la</strong>ma que los consumidores han <strong>de</strong> pagar un<br />
201
precio a<strong>de</strong>cuado para po<strong>de</strong>r consumir patatas <strong>de</strong> calidad, pues <strong>de</strong>spués <strong>de</strong>l arranque <strong>de</strong><br />
campaña en agosto <strong>la</strong>s ventas se han fijado en un 30% por <strong>de</strong>bajo <strong>de</strong> los costes <strong>de</strong> producción.<br />
Un promedio <strong>de</strong> 30% por <strong>de</strong>bajo <strong>de</strong> los costes <strong>de</strong> producción<br />
202
12.4 LA PATATA EN PORTUGAL<br />
El estudio <strong>de</strong>l sector <strong>de</strong> <strong>la</strong> patata en Portugal se ha incluido no por ser un gran país productor,<br />
sino por suponer una excelente oportunidad <strong>de</strong> comercio exterior, sobre todo para el sector<br />
<strong>de</strong> patata <strong>de</strong> consumo en fresco <strong>de</strong> Castil<strong>la</strong> y León y en menor medida para el sector <strong>de</strong><br />
patata <strong>de</strong> siembra.<br />
12.4.1 PRODUCCIÓN Y SUPERFICIES<br />
La patata es en Portugal uno <strong>de</strong> los productos más importantes <strong>de</strong> su agricultura. A pesar <strong>de</strong><br />
ello, viene registrando últimamente (sobre todo en <strong>la</strong>s dos últimas décadas) una disminución<br />
<strong>de</strong> <strong>la</strong> superficie y también <strong>de</strong> <strong>la</strong> producción.<br />
El cultivo se <strong>de</strong>sarrol<strong>la</strong> básicamente en regadío, pues bajo este sistema se produce el 85% <strong>de</strong><br />
<strong>la</strong> producción total.<br />
1400<br />
100<br />
1200<br />
90<br />
80<br />
1000<br />
800<br />
PRODUCCIÓN<br />
SUPERFICIE<br />
70<br />
60<br />
1000 Tm.<br />
600<br />
400<br />
50<br />
40<br />
30<br />
1000 Ha<br />
200<br />
20<br />
10<br />
0<br />
0<br />
AÑO<br />
Fuente: Eurostat <strong>2010</strong>. E<strong>la</strong>boración propia.<br />
Como se pue<strong>de</strong> comprobar, <strong>la</strong> ten<strong>de</strong>ncia <strong>de</strong> reducción <strong>de</strong> <strong>la</strong> producción viene <strong>de</strong>terminada<br />
por <strong>la</strong> ten<strong>de</strong>ncia <strong>de</strong> reducción <strong>de</strong> <strong>la</strong> superficie.<br />
Durante el período <strong>de</strong> 1999 a 2005, para <strong>la</strong> superficie, y en los trienios 1998-2.000 y 2003-<br />
2005, para <strong>la</strong> producción, hubo una reducción bastante acentuada <strong>de</strong> este cultivo, con<br />
bajadas <strong>de</strong>l 34% y <strong>de</strong>l 23% respectivamente. Esta negativa evolución se extien<strong>de</strong> a todas <strong>la</strong>s<br />
203
egiones <strong>de</strong>l país y está asociada a alteraciones <strong>de</strong> los hábitos <strong>de</strong> consumo y sobre todo al<br />
aumento <strong>de</strong> <strong>la</strong>s importaciones.<br />
Este hecho indica que los rendimientos han evolucionado muy poco, en comparación a <strong>la</strong><br />
evolución que han tenido los mismos en otros países <strong>de</strong> Europa.<br />
Las regiones <strong>de</strong> Ribatejo y Oeste, <strong>de</strong> Beira Litoral y <strong>de</strong> Tras-os-montes concentran más <strong>de</strong>l<br />
75% <strong>de</strong> <strong>la</strong> producción nacional <strong>de</strong> este producto. Estas zonas quedan reflejadas en el siguiente<br />
mapa:<br />
La patata temprana cultivada en <strong>la</strong>s zonas <strong>de</strong>l sur<br />
próximas a Lisboa sí que tienen mejores expectativas<br />
comerciales, puesto que el mercado <strong>de</strong> patata<br />
extratemprana y temprana les es más favorable.<br />
Las varieda<strong>de</strong>s más comunes en estas zonas son Desirée,<br />
Kennebec, Jaer<strong>la</strong>, Spunta, Monalisa, Marine, Asterix,<br />
Stemster, Agria, Amorosa y Picasso.<br />
Fuente: Anuario Vegetal 2006.Ministerio <strong>de</strong> Agricultura, Desarrollo<br />
Rural y Pesca. Portuga 2006.<br />
En el gráfico expuesto a continuación, se comprueba que <strong>la</strong> evolución <strong>de</strong> los rendimientos ha<br />
sido muy pobre y con muy poca regu<strong>la</strong>ridad, señal <strong>de</strong> que <strong>la</strong> variación se <strong>de</strong>be más a <strong>la</strong>s<br />
circunstancias coyunturales <strong>de</strong>l año agríco<strong>la</strong> que a una mejora en <strong>la</strong> utilización <strong>de</strong> <strong>la</strong>s técnicas<br />
<strong>de</strong> producción.<br />
Este bajo rendimiento ha sido sin duda uno <strong>de</strong> los factores <strong>de</strong>cisivos que ha provocado <strong>la</strong><br />
importante entrada <strong>de</strong> mercancía extranjera.<br />
204
Esta ten<strong>de</strong>ncia también se particu<strong>la</strong>riza por zonas, siendo <strong>la</strong>s zonas <strong>de</strong>l interior y <strong>de</strong>l norte <strong>la</strong>s<br />
más afectadas por <strong>la</strong> reducción <strong>de</strong> superficies. Ello es <strong>de</strong>bido a que en estas zonas se produce<br />
patata tardía que compite directamente con <strong>la</strong>s importaciones españo<strong>la</strong>s y francesas.<br />
RENDIMIENTOS DEL CULTIVO DE PATATAS EN<br />
PORTUGAL<br />
17000<br />
16000<br />
15000<br />
Kg/Ha.<br />
14000<br />
13000<br />
12000<br />
RENDIMIENTO<br />
11000<br />
10000<br />
TENDENCIA DE<br />
RENDIMIENTOS<br />
1998<br />
1999<br />
2000<br />
2001<br />
2002<br />
2003<br />
AÑO<br />
2004<br />
2005<br />
2006<br />
2007<br />
Fuente: EUROSTAT <strong>2010</strong>- E<strong>la</strong>boración propia.<br />
Como primera consecuencia <strong>de</strong> los datos observados se pue<strong>de</strong> extraer que <strong>la</strong> producción <strong>de</strong><br />
patata en Portugal es menos competitiva que <strong>la</strong> <strong>de</strong>l resto <strong>de</strong> Europa, motivo que empuja a<br />
reducir <strong>la</strong> superficie sembrada y a disminuir <strong>la</strong> producción obtenida.<br />
Ello explica, como veremos más a<strong>de</strong><strong>la</strong>nte, <strong>la</strong> mayor cuota <strong>de</strong> mercado que tiene cada vez <strong>la</strong><br />
patata importada frente a <strong>la</strong> doméstica en el mercado portugués.<br />
12.4.2 COMERCIO EXTERIOR DE PATATA EN PORTUGAL<br />
La patata <strong>de</strong> conservación es el producto hortíco<strong>la</strong> más importado <strong>de</strong>l exterior, representando<br />
en el año 2006 el 19% <strong>de</strong>l total <strong>de</strong> todas <strong>la</strong>s importaciones hortíco<strong>la</strong>s.<br />
A<strong>de</strong>más, más <strong>de</strong>l 90% <strong>de</strong> estas importaciones provienen <strong>de</strong> dos países: España y Francia.<br />
205
Sus importaciones han fluctuado a lo <strong>la</strong>rgo <strong>de</strong> los años, tal y como se aprecia en el siguiente<br />
gráfico:<br />
ORIGEN DE LA PATATAS IMPORTADAS EN PORCENTAJE<br />
70,00%<br />
60,00%<br />
50,00%<br />
40,00%<br />
30,00%<br />
20,00%<br />
10,00%<br />
ESPAÑA<br />
FRANCIA<br />
0,00%<br />
2003 2004 2005 2006 2007 2008<br />
Fuente: EUROESTACOM <strong>2010</strong>. E<strong>la</strong>boración propia.<br />
Como se manifiesta en <strong>la</strong> siguiente gráfica, los meses <strong>de</strong> importación <strong>de</strong> patata son aquellos<br />
en que se consume patata <strong>de</strong> conservación; mientras que en el caso <strong>de</strong>l periodo <strong>de</strong> consumo<br />
<strong>de</strong> patata nueva, <strong>la</strong>s exportaciones superan a <strong>la</strong>s importaciones.<br />
Fuente: EUROESTACOM <strong>2010</strong>. E<strong>la</strong>boración propia.<br />
206
Fuente: EUROESTACOM <strong>2010</strong>. E<strong>la</strong>boración propia.<br />
A <strong>la</strong> vista <strong>de</strong> lo expuesto, <strong>la</strong>s zonas productoras <strong>de</strong> patata temprana podrán mantener e<br />
incluso incrementar su capacidad productiva; mientras que <strong>la</strong>s zonas productoras <strong>de</strong> patata<br />
tardía, <strong>de</strong>stinadas en su mayor parte a conservación, sufren un <strong>de</strong>clive importante tanto en<br />
superficie como en producción. Son los meses <strong>de</strong> mayo, junio y julio cuando Portugal se<br />
convierte en un exportador neto <strong>de</strong> patatas; el resto <strong>de</strong> meses <strong>de</strong>l año se abastece <strong>de</strong> patata<br />
extranjera.<br />
12.4.3 COMERCIALIZACIÓN<br />
La <strong>de</strong>manda portuguesa se caracteriza por solicitar, en su mayor parte, patatas <strong>de</strong> piel roja,<br />
patata <strong>de</strong> piel b<strong>la</strong>nca, carne amaril<strong>la</strong> c<strong>la</strong>ra y calibre inferior a 60 mm.<br />
El consumo portugués <strong>de</strong> patatas es <strong>de</strong> unas 973.000 t. El consumo por habitante es bastante<br />
alto (93 kg/hab. en el año 2006); prácticamente el doble que el consumo español, estando en<br />
<strong>la</strong> línea <strong>de</strong> gran<strong>de</strong>s países consumidores como el Reino Unido.<br />
Este hecho es una gran oportunidad <strong>de</strong> mercado para <strong>la</strong>s producciones <strong>de</strong> Castil<strong>la</strong> y León, que<br />
por su ventaja logística, pue<strong>de</strong>n llegar a <strong>de</strong>sp<strong>la</strong>zar a <strong>la</strong>s producciones francesas. Todo ello se<br />
logrará si los productores <strong>de</strong> Castil<strong>la</strong> y León saben aten<strong>de</strong>r y satisfacer <strong>la</strong>s <strong>de</strong>mandas <strong>de</strong>l<br />
mercado y consumidor portugués, en cuanto a calibres, presentaciones, varieda<strong>de</strong>s, etc….<br />
207
En <strong>la</strong> siguiente tab<strong>la</strong> se observa cuál es <strong>la</strong> intensidad <strong>de</strong> <strong>la</strong> <strong>de</strong>manda por meses y zonas:<br />
Fuente: Anuario Vegetal 2006.Ministerio <strong>de</strong> Agricultura, Desarrollo rural y Pesca. Portuga 2006.<br />
El suministro <strong>de</strong> patata en Portugal está mayormente asegurado por<br />
almacenistas/mayoristas, los cuales suministran el producto a través <strong>de</strong> los mercados<br />
abastecedores. Otra porción es suministrada directamente para <strong>la</strong>s gran<strong>de</strong>s superficies a<br />
través <strong>de</strong> gran<strong>de</strong>s operadores comerciales. No obstante, persiste <strong>la</strong> comercialización<br />
tradicional en <strong>la</strong>s ferias y mercados regionales. También es importante reseñar el<br />
autoconsumo, que tiene importancia en zonas como Beira Interior.<br />
Asimismo se han constatado problemas <strong>de</strong> salida en el producto nacional portugués motivados<br />
por una baja calidad <strong>de</strong>l tubérculo y un calibre más pequeño, así como por <strong>la</strong>s importaciones<br />
<strong>de</strong> patata <strong>de</strong>s<strong>de</strong> España y Francia a precios inferiores a los nacionales.<br />
La patata temprana subsana re<strong>la</strong>tivamente <strong>la</strong> situación <strong>de</strong> <strong>la</strong> tardía, pues sí que se exporta a<br />
Francia, lo que contribuye a dar salida al producto nacional.<br />
208
13 SITUACIÓN Y ACTUACIONES DE LA I+D+i EN PATATA EN ESPAÑA<br />
13.1 BREVE RESEÑA SOBRE LA HISTORIA DE LA INVESTIGACIÓN DEL CULTIVO DE LA<br />
PATATA EN ESPAÑA<br />
A comienzos <strong>de</strong>l siglo XX el cultivo <strong>de</strong> <strong>la</strong> patata en España sufrió un <strong>de</strong>crecimiento<br />
importante, acentuándose <strong>la</strong> crisis entre 1920 y 1930, don<strong>de</strong> <strong>la</strong> fama “patatera” que tenían<br />
<strong>la</strong>s zonas a<strong>la</strong>vesas y <strong>de</strong>l norte <strong>de</strong> Castil<strong>la</strong> y León prácticamente <strong>de</strong>sapareció. Uno <strong>de</strong> los<br />
principales problemas existentes eran los bajos rendimientos <strong>de</strong>bido a infecciones por virus.<br />
Las instituciones Forales Vascas trataron <strong>de</strong> imp<strong>la</strong>ntar en sus respectivos territorios <strong>la</strong><br />
experiencia que en el campo <strong>de</strong> <strong>la</strong> experimentación, formación y divulgación agraria se<br />
estaba poniendo en marcha en países europeos como Bélgica y Francia. En este contexto<br />
surgió, entre otras, <strong>la</strong> Granja Mo<strong>de</strong>lo <strong>de</strong> Arkaute (1933) en Á<strong>la</strong>va. Este centro es el único que<br />
aún subsiste. En estos centros se realizaron <strong>de</strong>s<strong>de</strong> 1933 hasta 1950 activida<strong>de</strong>s re<strong>la</strong>cionadas<br />
con <strong>la</strong> introducción <strong>de</strong> cultivares <strong>de</strong> otros países y estudios <strong>de</strong> su adaptación. También se<br />
iniciaron los primeros programas <strong>de</strong> cruzamientos que dieron como resultado <strong>la</strong> primera<br />
variedad obtenida l<strong>la</strong>mada “Eminencia”. Des<strong>de</strong> 1950 hasta 1979 se potenciaron los estudios<br />
<strong>de</strong> virología, se continuó con los ensayos agronómicos y los estudios <strong>de</strong> adaptación, se<br />
realizaron caracterizaciones <strong>de</strong> varieda<strong>de</strong>s para conocer su potencial en el p<strong>la</strong>n <strong>de</strong> mejora, se<br />
efectuaron estudios citogenéticos <strong>de</strong> varieda<strong>de</strong>s y se empezó a producir semil<strong>la</strong> prebase y<br />
base. Fruto <strong>de</strong>l trabajo <strong>de</strong> estos años se obtuvieron varieda<strong>de</strong>s como Goya, Duquesa, O<strong>la</strong>l<strong>la</strong>,<br />
Turia, Víctor, Gauna y Lora.<br />
A partir <strong>de</strong> 1979 se regionaliza <strong>la</strong> investigación agraria y <strong>la</strong> estación <strong>de</strong> Arkaute pasa a<br />
<strong>de</strong>pen<strong>de</strong>r <strong>de</strong>l gobierno vasco. Las líneas <strong>de</strong> trabajo <strong>de</strong>s<strong>de</strong> entonces en lo referente a patata<br />
han sido <strong>la</strong> mejora genética, el cultivo <strong>de</strong> tejidos, <strong>la</strong> nematología, <strong>la</strong> patología y <strong>la</strong> serología.<br />
En los últimos años, <strong>la</strong>s técnicas biotecnológicas han cobrado una gran importancia<br />
En 1993 se insta<strong>la</strong> en Burgos <strong>la</strong> empresa pública APPACALE, que <strong>de</strong>pen<strong>de</strong> <strong>de</strong> <strong>la</strong> Junta <strong>de</strong><br />
Castil<strong>la</strong> y León y <strong>de</strong> <strong>la</strong> Asociación <strong>de</strong> Agricultores <strong>de</strong> <strong>Patata</strong> <strong>de</strong> Siembra, iniciando un<br />
programa <strong>de</strong> mejora genética y obtención <strong>de</strong> nuevas varieda<strong>de</strong>s.<br />
Con el objetivo <strong>de</strong> mejorar tanto <strong>la</strong>s activida<strong>de</strong>s en I+D+i como <strong>la</strong> gestión <strong>de</strong> <strong>la</strong>s mismas, se<br />
comenzó en <strong>la</strong> Estación <strong>de</strong> Mejora <strong>de</strong> <strong>la</strong> <strong>Patata</strong> (<strong>de</strong>rivada <strong>de</strong> <strong>la</strong> Granja Mo<strong>de</strong>lo <strong>de</strong> Arkaute) un<br />
proceso <strong>de</strong> transformación que culminó con <strong>la</strong> constitución en 1998 <strong>de</strong> <strong>la</strong> Sociedad Pública<br />
NEIKER-Instituto Vasco <strong>de</strong> <strong>la</strong> Investigación y Desarrollo Agrario, que recoge todas <strong>la</strong>s<br />
activida<strong>de</strong>s llevadas a cabo por los centros CIMA y SIMA. Actualmente, NEIKER es una sociedad<br />
pública <strong>de</strong>l Gobierno Vasco y a<strong>de</strong>más <strong>de</strong>s<strong>de</strong> finales <strong>de</strong>l 2006, miembro <strong>de</strong> TECNALIA,<br />
corporación tecnológica cuyo fin es contribuir al <strong>de</strong>sarrollo económico y social a través <strong>de</strong>l<br />
209
fomento <strong>de</strong> <strong>la</strong> Innovación Tecnológica. Dada <strong>la</strong> importancia que ha tenido el hoy <strong>de</strong>nominado<br />
Neiker en <strong>la</strong> investigación en patata en España, más a<strong>de</strong><strong>la</strong>nte se explica con <strong>de</strong>talle sus<br />
activida<strong>de</strong>s actuales en lo referente a este cultivo.<br />
En Canarias se han realizado, fundamentalmente, trabajos <strong>de</strong> experimentación en patata que<br />
hasta 1980 fueron conducidos por los especialistas <strong>de</strong>l Servicio <strong>de</strong> Extensión Agraria, ubicados<br />
en <strong>la</strong> Escue<strong>la</strong> <strong>de</strong> Capacitación Agraria <strong>de</strong> Tacoronte. Asimismo, el Instituto Canario <strong>de</strong><br />
Investigaciones Agrarias (ICIA), y más recientemente el Servicio <strong>de</strong> Agricultura y Desarrollo<br />
Rural <strong>de</strong>l Cabildo Insu<strong>la</strong>r <strong>de</strong> Tenerife, han llevado a cabo durante <strong>la</strong>s últimas décadas ensayos<br />
agronómicos <strong>de</strong> varieda<strong>de</strong>s y clones avanzados. Fruto <strong>de</strong> los mismos se han incorporado<br />
nuevos cultivares en el campo canario como son Valor, Galáctica, Fruid y Merlín, entre otras.<br />
Respecto a <strong>la</strong>s varieda<strong>de</strong>s locales <strong>de</strong> Canarias se han <strong>de</strong>sarrol<strong>la</strong>do numerosos trabajos a partir<br />
<strong>de</strong> <strong>la</strong> primera investigación sobre taxonomía y morfología, publicada en 1955. Por otra parte,<br />
<strong>la</strong> empresa Cultivos y Tecnología <strong>de</strong> Tenerife (CULTESA), mayoritariamente participada por el<br />
Cabildo Insu<strong>la</strong>r <strong>de</strong> Tenerife, ha saneado un total <strong>de</strong> cinco varieda<strong>de</strong>s antiguas que están en<br />
vía <strong>de</strong> obtener una Indicación Geográfica Protegida, <strong>de</strong>sarrol<strong>la</strong>ndo material prebase y base,<br />
que ha sido evaluado morfológica y agronómicamente en los últimos años.<br />
En el año 2007 se organizó <strong>la</strong> <strong>de</strong>nominada “Red Papata”, cuyos principales objetivos y<br />
entida<strong>de</strong>s que <strong>la</strong> componen se <strong>de</strong>tal<strong>la</strong>n en el siguiente apartado.<br />
13.2 RED NACIONAL DE INNOVACIÓN EN PATATA (RED PAPATA)<br />
El objetivo general <strong>de</strong> <strong>la</strong> Red Papata es organizar y hacer operativa una red españo<strong>la</strong> <strong>de</strong><br />
mejora y transferencia <strong>de</strong> tecnología en patata, así como servir <strong>de</strong> foro para el intercambio<br />
<strong>de</strong> información y conocimientos sobre necesida<strong>de</strong>s <strong>de</strong>l sector, i<strong>de</strong>ntificar tecnologías<br />
emergentes y crear un consorcio que represente a todos los es<strong>la</strong>bones <strong>de</strong> <strong>la</strong> ca<strong>de</strong>na con el fin<br />
<strong>de</strong> aumentar <strong>la</strong> competitividad <strong>de</strong> este cultivo. El coordinador <strong>de</strong> <strong>la</strong> red es el Dr. José Ignacio<br />
Ruiz <strong>de</strong> Ga<strong>la</strong>rreta (Neiker-Tecnalia). La página web es: http://www.neiker.net/neiker/papata/<br />
Los objetivos estratégicos <strong>de</strong> esta red son los siguientes:<br />
- I<strong>de</strong>ntificar necesida<strong>de</strong>s y conocimientos <strong>de</strong> los diferentes sectores implicados.<br />
- Definir los mecanismos <strong>de</strong> comunicación para una mejor transmisión <strong>de</strong><br />
conocimientos.<br />
- Promover cooperación entre <strong>la</strong>s diferentes partes para <strong>la</strong> participación en proyectos<br />
<strong>de</strong> I+D+i.<br />
- Definir los factores a nivel científico, económico e industrial que permitan<br />
incrementar <strong>la</strong> competitividad <strong>de</strong>l cultivo.<br />
- Divulgar diferentes iniciativas internacionales existentes acerca <strong>de</strong> este cultivo.<br />
210
Los objetivos tecnológicos <strong>de</strong> esta red son:<br />
- Mayor acceso a germop<strong>la</strong>sma avanzado <strong>de</strong> patata utilizando metodología estándar<br />
- Liberación acelerada <strong>de</strong> nuevas varieda<strong>de</strong>s<br />
- Mejorar <strong>la</strong>s tecnologías <strong>de</strong> análisis, producción <strong>de</strong> germop<strong>la</strong>sma, biotecnología,<br />
calidad etc.<br />
- Disponer <strong>de</strong> una Red <strong>de</strong> Innovación que tenga sostenibilidad e interacción con <strong>la</strong>s<br />
Re<strong>de</strong>s <strong>de</strong> I+D+i existentes<br />
La red está formada por 12 centros <strong>de</strong> investigación (uno <strong>de</strong> Castil<strong>la</strong> y León), cuyas<br />
principales activida<strong>de</strong>s en materia <strong>de</strong> I+D son:<br />
- Mejora genética: APPACALE (Burgos) y NEIKER (Vitoria).<br />
- Recursos genéticos y producción <strong>de</strong> semil<strong>la</strong>: APPACALE (Burgos), NEIKER (Vitoria),<br />
CCBAT y CULTESA (Tenerife), CAP (La P<strong>la</strong>ma).<br />
- Fisiología: Universidad <strong>de</strong> Lleida, Universidad Pública <strong>de</strong> Navarra e Instituto <strong>de</strong><br />
Agrobiotecnología (Navarra).<br />
- Biotecnología: APPACALE (Burgos), NEIKER (Vitoria), Universidad Pública <strong>de</strong> Navarra,<br />
Instituto <strong>de</strong> Agrobiotecnología (Navarra), Centro Nacional <strong>de</strong> Biotecnología-UAM, CRAG<br />
(Consorcio CSIC-IRTA-UAB).<br />
- Fitopatología y Epi<strong>de</strong>miología: NEIKER y Universidad <strong>de</strong> Santiago <strong>de</strong> Composte<strong>la</strong>.<br />
- Agronomía, Calidad y Nutrición: NEIKER, Universidad Pública <strong>de</strong> Navarra.<br />
Asimismo, en <strong>la</strong> red hay 65 empresas/agrupaciones (<strong>de</strong> <strong>la</strong>s que 30 pertenecen a Castil<strong>la</strong> y<br />
León), y 7 Centros <strong>de</strong> Certificación y Control (2 pertenecen a <strong>la</strong> Junta <strong>de</strong> Castil<strong>la</strong> y León).<br />
Todos estos integrantes <strong>de</strong> <strong>la</strong> red están <strong>de</strong>tal<strong>la</strong>dos en su página web. Dentro <strong>de</strong> esta red<br />
pue<strong>de</strong> obtenerse información acerca <strong>de</strong> ensayos <strong>de</strong> varieda<strong>de</strong>s, germop<strong>la</strong>sma disponible,<br />
protocolos <strong>de</strong> trabajo estandarizados, publicaciones (artículos científicos, libros y manuales),<br />
activida<strong>de</strong>s re<strong>la</strong>cionadas con el sector <strong>de</strong> patata (jornadas, congresos y eventos) y noticias <strong>de</strong>l<br />
sector.<br />
Los retos <strong>de</strong> futuro <strong>de</strong> <strong>la</strong> “Red Papata” son:<br />
- Programa <strong>de</strong> mejora que incorpore nuevas estrategias y tecnologías.<br />
- Mejorar el flujo <strong>de</strong> intercambio <strong>de</strong> germop<strong>la</strong>sma.<br />
- Involucrar más a <strong>la</strong>s empresas <strong>de</strong>l sector en <strong>la</strong> evaluación y diseminación <strong>de</strong> <strong>la</strong>s<br />
nuevas varieda<strong>de</strong>s y clones avanzados.<br />
- Lograr una mayor cohesión entre los diferentes grupos investigadores.<br />
211
13.3 NEIKER-TECNALIA (Instituto Vasco <strong>de</strong> Investigación y Desarrollo Agrario)<br />
Neiker-Tecnalia es una Sociedad Pública sin ánimo <strong>de</strong> lucro adscrita al Departamento <strong>de</strong><br />
Medio Ambiente, <strong>P<strong>la</strong>n</strong>ificación Territorial, Agricultura y Pesca <strong>de</strong>l Gobierno Vasco. Dentro <strong>de</strong><br />
sus objetivos se incluye <strong>la</strong> mejora <strong>de</strong> <strong>la</strong> productividad y <strong>de</strong> <strong>la</strong> competitividad <strong>de</strong> los sistemas<br />
<strong>de</strong> producción agraria, siendo <strong>la</strong> patata uno <strong>de</strong> los principales cultivos <strong>de</strong> trabajo.<br />
La investigación en patata <strong>de</strong> NEIKER se centra, fundamentalmente, en el <strong>de</strong>sarrollo <strong>de</strong> un<br />
programa <strong>de</strong> mejora genética cuyo objetivo final es <strong>la</strong> obtención <strong>de</strong> nuevas varieda<strong>de</strong>s <strong>de</strong><br />
este cultivo adaptadas a <strong>la</strong>s condiciones agroclimáticas españo<strong>la</strong>s. Los primeros trabajos <strong>de</strong><br />
este centro en patata se remontan al año 1933 cuando se crea <strong>la</strong> Estación <strong>de</strong> Mejora <strong>de</strong><br />
<strong>Patata</strong> en Á<strong>la</strong>va, habiéndose elegido esta ubicación por su tradición patatera y por poseer<br />
unas condiciones ambientales muy a<strong>de</strong>cuadas para el cultivo <strong>de</strong> este tubérculo. Des<strong>de</strong> sus<br />
orígenes hasta <strong>la</strong> actualidad se han obtenido en torno a una treintena <strong>de</strong> varieda<strong>de</strong>s. A<br />
continuación se <strong>de</strong>scriben <strong>la</strong>s principales líneas <strong>de</strong> trabajo que <strong>de</strong>sarrol<strong>la</strong>n.<br />
13.3.1 PROGRAMA DE MEJORA GENÉTICA Y OBTENCIÓN DE NUEVAS VARIEDADES<br />
Las características que <strong>de</strong>sean introducir en <strong>la</strong>s nuevas varieda<strong>de</strong>s son <strong>la</strong>s siguientes:<br />
- Morfológicas y fisiológicas. Buen aspecto <strong>de</strong> <strong>la</strong> p<strong>la</strong>nta, tubérculos homogéneos, piel<br />
fina, ojos superficiales, elevado rendimiento, estabilidad en <strong>la</strong> producción, ciclo corto y<br />
buena conservación.<br />
- Resistencia a p<strong>la</strong>gas y enfermeda<strong>de</strong>s. Incorporación <strong>de</strong> resistencias a los siguientes<br />
patógenos: virus (principalmente a PVY), nematodos (Globo<strong>de</strong>ra rostochiensis y G. pallida) y<br />
hongos (Phytophtora infestants, Rhizoctonia so<strong>la</strong>ni, Alternaria so<strong>la</strong>ni).<br />
- Calidad culinaria. Para consumo en fresco y/o aptitud para procesamiento industrial<br />
(<strong>la</strong>vado, ver<strong>de</strong>amiento, chips, french fries y conge<strong>la</strong>da)<br />
El esquema clásico <strong>de</strong> mejora se basa en <strong>la</strong> creación <strong>de</strong> variabilidad mediante cruzamientos<br />
dirigidos, y posterior selección <strong>de</strong> los genotipos <strong>de</strong>seados en <strong>la</strong> <strong>de</strong>scen<strong>de</strong>ncia F1 y en <strong>la</strong>s<br />
generaciones clonales sucesivas. Las tres fases iniciales y fundamentales <strong>de</strong>ntro <strong>de</strong>l proceso<br />
<strong>de</strong> selección son: elección <strong>de</strong> genitores, programa <strong>de</strong> cruzamientos y selección <strong>de</strong> plántu<strong>la</strong>s<br />
en <strong>la</strong> primera generación. NEIKER posee un valioso banco <strong>de</strong> germop<strong>la</strong>sma <strong>de</strong> unas 500<br />
accesiones constituidas por varieda<strong>de</strong>s comerciales, clones <strong>de</strong> mejora y especies <strong>de</strong>l género<br />
So<strong>la</strong>num. Todas estas entradas se están sometiendo continuamente a una amplia evaluación y<br />
caracterización para conocer el valor genético potencial y su interés para <strong>la</strong> aplicación al<br />
programa <strong>de</strong> mejora. Es <strong>de</strong>stacable que el banco <strong>de</strong> germop<strong>la</strong>sma incluye varieda<strong>de</strong>s nativas<br />
212
originarias <strong>de</strong> América Nativa pertenecientes a varias especies <strong>de</strong> So<strong>la</strong>num ssp. que<br />
representan nuevas fuentes <strong>de</strong> genes para numerosos caracteres <strong>de</strong> interés como, por<br />
ejemplo, resistencia a p<strong>la</strong>gas y enfermeda<strong>de</strong>s.<br />
En el p<strong>la</strong>n <strong>de</strong> mejora genética clásico integran aplicaciones biotecnológicas como cultivo “in<br />
vitro”, selección asistida por marcadores molecu<strong>la</strong>res y genotipado.<br />
Como ya se ha comentado anteriormente, NEIKER ha registrado <strong>de</strong>s<strong>de</strong> su inicio una treintena<br />
<strong>de</strong> varieda<strong>de</strong>s. Las últimas varieda<strong>de</strong>s registradas son: Nagore, Zorba, Gorbea, Mirari, Leire<br />
y Harana. Estas varieda<strong>de</strong>s no representan una superficie importante <strong>de</strong> cultivo a nivel <strong>de</strong><br />
Castil<strong>la</strong> y León.<br />
13.3.2 AGRONOMÍA<br />
NEIKER ha <strong>de</strong>sarrol<strong>la</strong>do a lo <strong>la</strong>rgo <strong>de</strong> los últimos años una importante actividad investigadora<br />
en el ámbito <strong>de</strong> <strong>la</strong> programación y optimización <strong>de</strong> riego mediante <strong>la</strong> utilización <strong>de</strong> mo<strong>de</strong>los<br />
matemáticos. Esta información <strong>la</strong> publican “on line” semanalmente para que así los<br />
productores conozcan sus necesida<strong>de</strong>s semanales. También han realizado ensayos <strong>de</strong> campo<br />
para validar y ajustar los resultados obtenidos a partir <strong>de</strong> los mo<strong>de</strong>los teóricos. Con toda esta<br />
información, NEIKER posee un vínculo en su página web para conocer <strong>la</strong>s recomendaciones <strong>de</strong><br />
riego en el cultivo <strong>de</strong> patata en <strong>la</strong> provincia <strong>de</strong> Á<strong>la</strong>va que se actualiza semanalmente.<br />
Es <strong>de</strong>stacable que NEIKER-Tecnalia ha creado <strong>la</strong> empresa NEIKERTEK. La función <strong>de</strong> esta<br />
sociedad es gestionar todos los recursos necesarios para fomentar y apoyar <strong>la</strong> creación <strong>de</strong><br />
empresas tecnológicas. Para ello, sus principales actuaciones son:<br />
- La captación y evolución <strong>de</strong> i<strong>de</strong>as empresariales a partir <strong>de</strong> <strong>la</strong> I+D.<br />
- Apoyo al <strong>de</strong>sarrollo <strong>de</strong> los p<strong>la</strong>nes <strong>de</strong> negocio.<br />
- Apoyo al impulso y constitución <strong>de</strong> nuevas empresas.<br />
NEIKERTEK ha promovido <strong>la</strong> creación <strong>de</strong> una serie <strong>de</strong> empresas innovadoras <strong>de</strong> base<br />
tecnológica <strong>de</strong> alto potencial que utilizando diferentes áreas <strong>de</strong> conocimiento, como por<br />
ejemplo <strong>la</strong> biotecnología, y su posterior transferencia tecnológica, preten<strong>de</strong>n dar soluciones a<br />
diferentes sectores, incluyendo el agríco<strong>la</strong>. Dentro <strong>de</strong> este grupo <strong>de</strong> empresas hay una<br />
<strong>de</strong>nominada NEWCO cuyo objetivo es, a gran<strong>de</strong>s rasgos, <strong>la</strong> innovación y transferencia <strong>de</strong><br />
conocimiento científico y <strong>de</strong>sarrollo <strong>de</strong> tecnologías al servicio <strong>de</strong> <strong>la</strong> producción <strong>de</strong> patata, y<br />
<strong>de</strong> <strong>la</strong> obtención <strong>de</strong> varieda<strong>de</strong>s seleccionadas para mercados diferenciados. Sus líneas <strong>de</strong><br />
negocio se basan en:<br />
A) La obtención <strong>de</strong> nuevas varieda<strong>de</strong>s e imp<strong>la</strong>ntación <strong>de</strong> sistemas <strong>de</strong> producción especializada<br />
<strong>de</strong> semil<strong>la</strong> seleccionada.<br />
213
B) Diseño <strong>de</strong> mo<strong>de</strong>los <strong>de</strong> producción innovadores y <strong>la</strong> búsqueda <strong>de</strong> nuevas oportunida<strong>de</strong>s <strong>de</strong><br />
negocio.<br />
NEWCO tiene tres tipos <strong>de</strong> participaciones. La primera es Neikertek. La segunda correspon<strong>de</strong><br />
a entida<strong>de</strong>s <strong>de</strong> producción y/o comercialización <strong>de</strong> patata <strong>de</strong> siembra. La tercera está<br />
compuesta por entida<strong>de</strong>s <strong>de</strong> producción, comercialización y/o transformación <strong>de</strong> patata <strong>de</strong><br />
consumo. La participación <strong>de</strong> Neikertek es <strong>de</strong>l 25% mientras que <strong>la</strong> <strong>de</strong> los otros dos grupos es<br />
<strong>de</strong>l 75% restante. Es evi<strong>de</strong>nte que NEWCO involucra a todos los agentes re<strong>la</strong>cionados <strong>de</strong>l<br />
sector, uniendo <strong>la</strong> parte <strong>de</strong> I+D+i, <strong>la</strong> industria, los envasadores, el consumo y <strong>la</strong><br />
comercialización.<br />
13.4 OTROS GRUPOS DE INVESTIGACIÓN EN ESPAÑA<br />
13.4.1 CENTRO DE EDAFOLOGÍA Y BIOLOGÍA APLICADA DEL SEGURA (CSIC)<br />
Departamento <strong>de</strong> Ciencia y Tecnología <strong>de</strong> los Alimentos. Grupo <strong>de</strong> Investigación en Calidad,<br />
Seguridad y Bioactividad <strong>de</strong> Alimentos Vegetales. Líneas <strong>de</strong> trabajo:<br />
- Seguridad y calidad <strong>de</strong> frutas y hortalizas.<br />
- Desarrollo científico-tecnológico <strong>de</strong> alimentos vegetales en IV y V gama.<br />
- Control <strong>de</strong> los riesgos <strong>de</strong> contaminación microbiológica durante <strong>la</strong> producción,<br />
procesado y conservación <strong>de</strong> alimentos vegetales.<br />
-<br />
Este grupo trabaja en postcosecha <strong>de</strong> frutas y hortalizas. En lo referente a patata <strong>de</strong> IV gama<br />
estudian cuales son <strong>la</strong>s mejores varieda<strong>de</strong>s para este fin, el procesado, los equipos más<br />
interesantes, como <strong>de</strong>be <strong>de</strong> hacerse el manejo <strong>de</strong> <strong>la</strong> materia prima y su conservación, y<br />
análisis <strong>de</strong> constituyentes. A pesar <strong>de</strong> que <strong>la</strong> patata no es un producto que se caracterice por<br />
poseer una gran cantidad <strong>de</strong> sustancias fitoquímicas beneficiosas para <strong>la</strong> salud humana, como<br />
ocurre en otras hortíco<strong>la</strong>s, han encontrado un f<strong>la</strong>vonoi<strong>de</strong> con interés que se produce al<br />
procesar el producto en IV gama.<br />
13.4.2 UNIVERSIDAD PÚBLICA DE NAVARRA<br />
Grupo <strong>de</strong> Mecanización Agraria: trabajan en 1) Recolección, transporte y manipu<strong>la</strong>ción <strong>de</strong><br />
patata; 2) Determinación <strong>de</strong> sus propieda<strong>de</strong>s físicas; 3) Daños mecánicos.<br />
Grupo <strong>de</strong> Fertilización Nitrogenada: trabajo centrado mayoritariamente en cereales aunque<br />
han participado en algún proyecto con patata.<br />
Grupo <strong>de</strong> Micropropagación, transformación y cultivo aeropónico en patata.<br />
214
13.4.3 CENTRO DE INVESTIGACIÓN EN AGRIGENÓMICA (CRAG) (CONSORCIO CSIC-IRTA-UAB)<br />
I<strong>de</strong>ntificación <strong>de</strong> genes que regu<strong>la</strong>n el momento en el que <strong>la</strong>s p<strong>la</strong>ntas <strong>de</strong> patata forman los<br />
tubérculos. Estudian el efecto que tienen esos genes en <strong>la</strong> formación <strong>de</strong> tubérculos en<br />
respuesta al fotoperíodo, <strong>la</strong>s interacciones entre esos genes y su posible efecto en el<br />
rendimiento <strong>de</strong> tubérculos <strong>de</strong> <strong>la</strong> p<strong>la</strong>nta. También están tratando <strong>de</strong> <strong>de</strong>terminar si estos genes<br />
participan en <strong>la</strong> generación o el movimiento <strong>de</strong> <strong>la</strong>s señales que se transmiten <strong>de</strong>s<strong>de</strong> <strong>la</strong>s hojas<br />
a <strong>la</strong> parte subterránea <strong>de</strong> <strong>la</strong> p<strong>la</strong>nta para inducir <strong>la</strong> formación <strong>de</strong> tubérculos.<br />
13.4.4 UNIVERSIDAD DE VIGO<br />
Aerobiología. Realizan investigación para realizar controles <strong>de</strong> esporas en un almacén <strong>de</strong><br />
patatas y también en campo <strong>de</strong> cultivo, aplicando mo<strong>de</strong>los predictivos para enfermeda<strong>de</strong>s<br />
como <strong>la</strong>s causadas por Alternaria y Mildiu, así como seguimientos <strong>de</strong> carácter fenológico.<br />
13.4.5 INSTITUTO DE AGROBIOTECNOLOGÍA DE NAVARRA (CSIC)<br />
Metabolismo glucídico en p<strong>la</strong>ntas. Estudian aspectos bioquímicos y molecu<strong>la</strong>res re<strong>la</strong>cionados<br />
con <strong>la</strong> regu<strong>la</strong>ción (transcripcional y post-transcripcional) <strong>de</strong> <strong>la</strong> producción <strong>de</strong> almidón en<br />
tubérculos <strong>de</strong> patata. Practican ingeniería genética y han logrado producir varieda<strong>de</strong>s <strong>de</strong><br />
patata que acumu<strong>la</strong>n gran<strong>de</strong>s cantida<strong>de</strong>s <strong>de</strong> almidón como consecuencia <strong>de</strong> <strong>la</strong> expresión<br />
ectópica <strong>de</strong> <strong>la</strong> sacarosa sintasa. En estos momentos están analizando el efecto en el<br />
metabolismo <strong>de</strong>l almidón <strong>de</strong> <strong>la</strong> re<strong>la</strong>ción <strong>de</strong> <strong>la</strong> p<strong>la</strong>nta con microorganismos. También han<br />
<strong>de</strong>sarrol<strong>la</strong>do una rama <strong>de</strong> análisis <strong>de</strong> producción <strong>de</strong> bioetanol a partir <strong>de</strong> tubérculos <strong>de</strong> patata<br />
modificados genéticamente.<br />
13.4.6 CENTRO NACIONAL DE BIOTECNOLOGÍA (CSIC) – UNIVERSIDAD AUTÓNOMA DE MADRID<br />
En este centro se realiza investigación básica en <strong>la</strong>s que <strong>la</strong> patata interviene en <strong>la</strong>s siguientes<br />
líneas <strong>de</strong> trabajo:<br />
- Regu<strong>la</strong>ción <strong>de</strong> <strong>la</strong> tuberización por luz y fotoperiodismo<br />
- Análisis genético <strong>de</strong>l <strong>de</strong>sarrollo <strong>de</strong> meristemos axi<strong>la</strong>res<br />
13.4.7 CENTRO DE CONSERVACIÓN DE LA BIODIVERSIDAD AGRÍCOLA DE TENERIFE (CCBAT)<br />
Este centro tiene como objetivos <strong>la</strong> conservación <strong>de</strong> recursos filogenéticos agríco<strong>la</strong>s <strong>de</strong> <strong>la</strong> is<strong>la</strong><br />
<strong>de</strong> Tenerife, y <strong>la</strong> recuperación y conservación <strong>de</strong> <strong>la</strong>s tradiciones asociadas a estos cultivos. En<br />
lo referente a patata realizan recolección, conservación, caracterización y documentación<br />
fundamentalmente <strong>de</strong> varieda<strong>de</strong>s tradicionales <strong>de</strong> patata <strong>de</strong> <strong>la</strong>s Is<strong>la</strong>s Canarias.<br />
215
13.4.8 UNIVERSIDAD DE SANTIAGO DE COMPOSTELA<br />
Diagnóstico, epi<strong>de</strong>miología y control <strong>de</strong> enfermeda<strong>de</strong>s <strong>de</strong> patata. Sobre todo se han centrado<br />
en virosis (especialmente PVY) y también en epi<strong>de</strong>miología y manejo <strong>de</strong> nematodos<br />
formadores <strong>de</strong> quistes (i<strong>de</strong>ntificación <strong>de</strong> especies, rotaciones, cultivos antagonistas y<br />
biofumigación, p<strong>la</strong>ntas trampa).<br />
13.5 DESARROLLO DE VARIEDADES DE PATATA TRANSGÉNICA<br />
La Comisión Europea (CE) ha aprobado el 2 <strong>de</strong> febrero <strong>de</strong> <strong>2010</strong> un permiso para cultivar una<br />
patata transgénica, cuya tramitación ha sido muy controvertida, tras 12 años en los que <strong>la</strong> UE<br />
sólo había autorizado el comercio <strong>de</strong> nuevos Organismos Genéticamente Autorizados (OGM),<br />
pero no su siembra. El Ejecutivo Comunitario ha dado el visto bueno cinco nuevos expedientes<br />
<strong>de</strong> OGM, entre ellos el cultivo <strong>de</strong> <strong>la</strong> variedad <strong>de</strong> patata Amflora, comercializada por <strong>la</strong><br />
multinacional alemana BASF, que se <strong>de</strong>stinará a obtener almidón y productos industriales<br />
pero no para alimentación humana.<br />
El <strong>de</strong>sarrollo <strong>de</strong> esta patata transgénica se ha convertido en un asunto polémico tras su<br />
aprobación. Esta nueva variedad se caracteriza por presentar un almidón formado sólo por<br />
amilopectina, sin tener amilosa, lo que contribuye a ahorrar recursos, energía y costes en<br />
usos industriales. Esta nueva variedad <strong>de</strong> patata está diseñada para fortalecer <strong>la</strong><br />
competitividad <strong>de</strong>l sector <strong>de</strong> <strong>la</strong>s industrias <strong>de</strong> fécu<strong>la</strong> europeas. Su comercialización será una<br />
<strong>la</strong>bor conjunta <strong>de</strong> <strong>la</strong> industria <strong>de</strong>l almidón con los productores <strong>de</strong> patata.<br />
Cerca <strong>de</strong>l 20% <strong>de</strong> <strong>la</strong> composición <strong>de</strong> <strong>la</strong> patata es almidón, mientras que alre<strong>de</strong>dor <strong>de</strong>l 80%<br />
restante es agua. El primero <strong>de</strong> estos elementos está formado por <strong>la</strong> mezc<strong>la</strong> <strong>de</strong> amilopectina<br />
(75%) y amilosa (25%). El almidón se encuentra en un gran número <strong>de</strong> alimentos naturales y<br />
preparados como pue<strong>de</strong> ser el arroz, <strong>la</strong> pasta o el pan. Existen distintas c<strong>la</strong>ses <strong>de</strong> almidones<br />
comerciales obtenidos <strong>de</strong> tubérculos (patata o mandioca) o <strong>de</strong> semil<strong>la</strong>s <strong>de</strong> cereales (maíz o<br />
arroz). A <strong>la</strong> industria europea <strong>de</strong>l almidón, <strong>la</strong> patata contribuye con unos dos millones <strong>de</strong><br />
tone<strong>la</strong>das <strong>de</strong> este elemento al año, que se utilizan en gran medida para aplicaciones<br />
industriales como fabricación <strong>de</strong> papel, hilo y co<strong>la</strong>.<br />
Para muchas aplicaciones industriales so<strong>la</strong>mente se emplea <strong>la</strong> amilopectina. Lo que han hecho<br />
los científicos <strong>de</strong> Basf <strong>P<strong>la</strong>n</strong>t Science es, mediante ingeniería genética, <strong>de</strong>sactivar el gen que<br />
<strong>de</strong>termina <strong>la</strong> síntesis <strong>de</strong> amilosa. Amflora, al no contener amilosa, reduce significativamente<br />
los costes <strong>de</strong> producción industrial ya que no es necesario recurrir a los procedimientos<br />
convencionales <strong>de</strong> extracción y <strong>la</strong>vado <strong>de</strong> <strong>la</strong> misma.<br />
216
Para muchas aplicaciones técnicas, como <strong>la</strong> fabricación <strong>de</strong> papel, tejidos o adhesivos, sólo se<br />
necesita amilopectina, por lo que hasta ahora ha sido necesario aplicar el costoso proceso <strong>de</strong><br />
separación <strong>de</strong> los dos componentes. A<strong>de</strong>más, el papel fabricado con este almidón puro es más<br />
bril<strong>la</strong>nte, y los adhesivos pue<strong>de</strong>n procesarse durante más tiempo.<br />
El cultivo y comercialización <strong>de</strong> esta nueva patata está previsto que se haga en sistema<br />
cerrado. Se realizará mediante contrato a agricultores a los que se les proporcionará <strong>la</strong><br />
semil<strong>la</strong> y <strong>la</strong>s p<strong>la</strong>ntaciones se realizarán separadas <strong>de</strong> <strong>la</strong>s patatas convencionales para consumo<br />
humano. También se <strong>la</strong>s mantendrá separadas <strong>de</strong> otras patatas industriales.<br />
Por todo lo anteriormente expuesto, el <strong>de</strong>sarrollo y <strong>la</strong> aprobación <strong>de</strong> <strong>la</strong> variedad transgénica<br />
Amflora marca un antes y un <strong>de</strong>spués <strong>de</strong>ntro <strong>de</strong>l sector industrial europeo <strong>de</strong> <strong>la</strong> patata, que<br />
se pue<strong>de</strong> ver fuertemente fortalecido al po<strong>de</strong>r cultivar dicha variedad. Los países que se<br />
beneficiarán inicialmente <strong>de</strong> esta tecnología son Suecia, Alemania y Republica Checa, don<strong>de</strong><br />
se dará comienzo a <strong>la</strong> siembra en el año <strong>2010</strong>. Para España, consi<strong>de</strong>rando que este segmento<br />
industrial esta muy poco <strong>de</strong>sarrol<strong>la</strong>do, BASF no tiene un p<strong>la</strong>n <strong>de</strong> negocios a corto o medio<br />
p<strong>la</strong>zo.<br />
Diversas organizaciones se han manifestado en contra <strong>de</strong> <strong>la</strong> aprobación <strong>de</strong> Amflora,<br />
argumentando que contiene un gen que le confiere resistencia a <strong>de</strong>terminados antibióticos y<br />
que por ello supone un riesgo inaceptable para <strong>la</strong> salud humana y animal, así como para el<br />
medio ambiente. Sostienen que <strong>la</strong> Organización Mundial <strong>de</strong> <strong>la</strong> Salud y <strong>la</strong> Agencia Europea <strong>de</strong>l<br />
Medicamento han advertido <strong>de</strong> <strong>la</strong> importancia <strong>de</strong> los genes <strong>de</strong> resistencia a antibióticos que<br />
contiene <strong>la</strong> patata Amflora, ya que podría aumentar <strong>la</strong> resistencia <strong>de</strong> <strong>de</strong>terminadas bacterias<br />
a antibióticos imprescindibles en tratamientos contra diversas enfermeda<strong>de</strong>s como <strong>la</strong><br />
tuberculosis. Indican que resulta especialmente l<strong>la</strong>mativo el hecho <strong>de</strong> que se hayan dado<br />
<strong>de</strong>sacuerdos sin prece<strong>de</strong>ntes en varias evaluaciones <strong>de</strong> <strong>la</strong> patata Amflora, incluso en <strong>la</strong><br />
protransgénica Agencia Europea <strong>de</strong> Seguridad Alimentaria.<br />
Por otro <strong>la</strong>do, estas organizaciones <strong>de</strong>scriben que Amflora contiene un mayor contenido en<br />
almidón y que fue <strong>de</strong>sarrol<strong>la</strong>da para su uso en procesos industriales, piensos y fertilizantes.<br />
Sin embargo, afirman que <strong>la</strong>s patatas convencionales no transgénicas disponibles en el<br />
mercado, tienen casi el mismo contenido <strong>de</strong> almidón pero sin genes <strong>de</strong> resistencia a<br />
antibióticos, lo cual, a su juicio, <strong>de</strong>muestra que <strong>la</strong> patata transgénica es absolutamente<br />
innecesaria. Todas estas últimas afirmaciones se muestran discordantes con lo <strong>de</strong>scrito<br />
inicialmente acerca <strong>de</strong> <strong>la</strong>s utilida<strong>de</strong>s <strong>de</strong> Amflora, ya que lo importante en el<strong>la</strong> no es el<br />
contenido per se <strong>de</strong> almidón, sino <strong>la</strong> re<strong>la</strong>ción entre amilosa y amilopectina <strong>de</strong>l mismo.<br />
217
En el futuro podrían salir nuevas varieda<strong>de</strong>s <strong>de</strong> patata transgénica con utilidad para <strong>la</strong><br />
producción <strong>de</strong> biocombustibles. En este caso lo que se preten<strong>de</strong> es que el almidón <strong>de</strong> este<br />
tubérculo tenga el mayor contenido posible <strong>de</strong> amilosa, ya que es más fácil <strong>de</strong> hidrolizar en<br />
azúcares simples que <strong>la</strong> amilopectina, por lo que así se incrementaría <strong>la</strong> producción y se<br />
simplificaría el proceso, reduciéndose los costes <strong>de</strong> producción.<br />
Asimismo, los científicos <strong>de</strong> BASF también han conseguido transferir genes <strong>de</strong> resistencia al<br />
tizón tardío en varieda<strong>de</strong>s comerciales <strong>de</strong> patata. El mildiu o tizón tardío es una enfermedad<br />
<strong>de</strong>vastadora causada por el hongo Phytophtora infestans, que origina pérdidas económicas<br />
muy importantes en el cultivo a nivel mundial. Esta enfermedad fue <strong>la</strong> que originó <strong>la</strong> “gran<br />
hambruna ir<strong>la</strong>n<strong>de</strong>sa” <strong>de</strong>l siglo XIX, ya que <strong>de</strong>struyó durante varios años <strong>la</strong> cosecha <strong>de</strong> patata<br />
<strong>de</strong> este país, siendo este cultivo el alimento básico <strong>de</strong> <strong>la</strong> pob<strong>la</strong>ción ir<strong>la</strong>n<strong>de</strong>sa en ese siglo.<br />
Estos genes <strong>de</strong> resistencia han sido ais<strong>la</strong>dos a partir <strong>de</strong> patatas silvestres que son resistentes a<br />
este hongo. Este hecho reduciría <strong>la</strong> cantidad <strong>de</strong> fungicidas que se aplican actualmente para<br />
contro<strong>la</strong>r los daños causados por esta enfermedad.<br />
218
14 SITUACIÓN Y ACTUACIONES DE LA I+D+i EN PATATA EN CASTILLA Y<br />
LEÓN<br />
La Junta <strong>de</strong> Castil<strong>la</strong> y León cuenta con cuatro centros que trabajan en diferentes aspectos <strong>de</strong>l<br />
cultivo <strong>de</strong> <strong>la</strong> patata. Dos <strong>de</strong> ellos, APPACALE y el Centro <strong>de</strong> Control <strong>de</strong> <strong>Patata</strong> <strong>de</strong> Albillos<br />
trabajan específicamente en este cultivo. APPACALE es una empresa pública financiada en un<br />
51% por <strong>la</strong> Junta <strong>de</strong> Castil<strong>la</strong> y León que trabaja específicamente en patata, siendo su objetivo<br />
fundamental <strong>la</strong> obtención <strong>de</strong> varieda<strong>de</strong>s. Este punto es una cuestión crítica para el sector,<br />
por lo que en este capítulo se hará un <strong>de</strong>tal<strong>la</strong>do análisis <strong>de</strong> sus activida<strong>de</strong>s y resultados. A<br />
continuación se exponen <strong>la</strong>s activida<strong>de</strong>s <strong>de</strong> cada centro <strong>de</strong> manera individualizada.<br />
14.1 CENTRO DE CONTROL DE LA PATATA DE ALBILLOS (BURGOS)<br />
La misión fundamental encomendada a este centro se refiere a <strong>la</strong>s fases técnicas <strong>de</strong> control,<br />
certificación, precintado, pre y postcontrol <strong>de</strong> <strong>la</strong> patata <strong>de</strong> siembra producida en <strong>la</strong><br />
Comunidad Autónoma <strong>de</strong> Castil<strong>la</strong> y León. Sus funciones explicadas más en <strong>de</strong>talle son:<br />
- Control e i<strong>de</strong>ntificación <strong>de</strong> <strong>la</strong> patata <strong>de</strong> siembra.<br />
- Caracterización agronómica <strong>de</strong> varieda<strong>de</strong>s <strong>de</strong> patata.<br />
- Seguimiento <strong>de</strong> los campos <strong>de</strong> precontrol y postcontrol <strong>de</strong> patata <strong>de</strong> siembra.<br />
- Certificación y control <strong>de</strong> los lotes utilizados en patata <strong>de</strong> siembra, tanto nacionales<br />
como <strong>de</strong> importación.<br />
- Control sanitario <strong>de</strong> campos a utilizar para patata <strong>de</strong> siembra, especialmente <strong>de</strong><br />
nematodos.<br />
- Control <strong>de</strong> <strong>la</strong>s cuarentenas establecidas y control <strong>de</strong> los tratamientos fitosanitarios <strong>de</strong><br />
<strong>la</strong>s parce<strong>la</strong>s en cuarentena.<br />
- Participación en <strong>la</strong> tipificación <strong>de</strong>l catálogo europeo <strong>de</strong> varieda<strong>de</strong>s.<br />
En Castil<strong>la</strong> y León se produce algo más <strong>de</strong>l 70% <strong>de</strong> <strong>la</strong> patata <strong>de</strong> siembra producida en toda<br />
España. Se actúa en 12 zonas <strong>de</strong> <strong>la</strong>s provincias <strong>de</strong> Burgos y <strong>de</strong> Palencia. La producción se<br />
realiza en más <strong>de</strong> 2.500 parce<strong>la</strong>s que hay que inspeccionar para comprobar si se cumplen toda<br />
una serie <strong>de</strong> parámetros <strong>de</strong> calidad para <strong>la</strong> c<strong>la</strong>sificación y aprobación <strong>de</strong>finitiva <strong>de</strong> <strong>la</strong> patata<br />
<strong>de</strong> siembra. Por lo tanto, el Centro <strong>de</strong> Control <strong>de</strong> <strong>la</strong> <strong>Patata</strong> <strong>de</strong> Castil<strong>la</strong> y León, es un<br />
Departamento Técnico con carácter muy específico que cuenta con <strong>la</strong> necesaria<br />
especialización para po<strong>de</strong>r cumplir con su cometido, en el que se incluye a<strong>de</strong>más el<br />
asesoramiento a organismos diversos y ciertos ensayos re<strong>la</strong>cionados con todo lo anteriormente<br />
citado.<br />
219
14.2 CENTRO REGIONAL DE DIAGNÓSTICO DE ALDEARRUBIA (SALAMANCA)<br />
A efectos estructurales el Centro Regional <strong>de</strong> Diagnóstico (CRD) ostenta el rango <strong>de</strong> Sección<br />
<strong>de</strong>l Servicio <strong>de</strong> Sanidad y Or<strong>de</strong>nación Agríco<strong>la</strong>. Se diversifica operativamente en <strong>la</strong>s siguientes<br />
unida<strong>de</strong>s: Bacteriología, Micología, Nematología, Virología y Entomología.<br />
El Centro Regional <strong>de</strong> Diagnóstico realiza <strong>la</strong>s funciones analíticas y <strong>de</strong> diagnóstico<br />
correspondientes al control oficial en materia <strong>de</strong> sanidad vegetal establecidas en <strong>la</strong><br />
legis<strong>la</strong>ción vigente, así como <strong>la</strong>s llevadas a cabo como consecuencia <strong>de</strong> <strong>la</strong> ejecución <strong>de</strong><br />
programas <strong>de</strong> actuaciones ejecutados por <strong>la</strong> Consejería <strong>de</strong> Agricultura y Gana<strong>de</strong>ría, o <strong>la</strong>s<br />
realizadas en el ámbito <strong>de</strong> <strong>la</strong> vigi<strong>la</strong>ncia y control patologías <strong>de</strong> <strong>la</strong>s producciones vegetales por<br />
los agentes <strong>de</strong> <strong>la</strong> Red <strong>de</strong> Vigi<strong>la</strong>ncia Fitosanitaria. Asimismo realiza, a instancia <strong>de</strong> parte,<br />
actuaciones <strong>de</strong> análisis y diagnóstico fitosanitario <strong>de</strong> los cultivos y producciones vegetales.<br />
Los análisis se distribuyen en <strong>la</strong>s áreas <strong>de</strong> bacterias, hongos, virus, nematodos, insectos; y<br />
para los cultivos <strong>de</strong> patata, remo<strong>la</strong>cha, forestales, ornamentales, hortíco<strong>la</strong>s, forrajeras,<br />
cereales, leguminosas, vid, frutales, fresas y girasol. El Centro participa en <strong>de</strong>terminados<br />
proyectos <strong>de</strong> investigación aplicada, en co<strong>la</strong>boración con entida<strong>de</strong>s públicas o privadas,<br />
re<strong>la</strong>tivos al <strong>de</strong>sarrollo <strong>de</strong> técnicas <strong>de</strong> diagnóstico y control <strong>de</strong> diversas patologías vegetales.<br />
Algunos <strong>de</strong> los proyectos en los que ha participado este centro en lo re<strong>la</strong>tivo a patata han sido<br />
los siguientes:<br />
Título <strong>de</strong>l proyecto: Diagnóstico, distribución y control integrado <strong>de</strong> Pseudomonas<br />
so<strong>la</strong>nacearum, causante <strong>de</strong> <strong>la</strong> podredumbre parda <strong>de</strong> <strong>la</strong> patata.<br />
Título <strong>de</strong>l proyecto: “Community method for the <strong>de</strong>tection and diagnosis of potato brown rot<br />
(Pseudomonas so<strong>la</strong>nacearum)”.<br />
Título <strong>de</strong>l proyecto: “Diagnostic protocols for organism harmful to p<strong>la</strong>nts:<br />
C<strong>la</strong>vibactermichiganensis subsp. sepedonicus”.<br />
Las muestras que llegan al Laboratorio <strong>de</strong>l CRD son <strong>la</strong>s provenientes <strong>de</strong>l p<strong>la</strong>n <strong>de</strong><br />
prospecciones que realiza <strong>la</strong> Consejería <strong>de</strong> Agricultura y Gana<strong>de</strong>ría y el MARM, <strong>de</strong> acuerdo<br />
con lo dispuesto en el Real Decreto 58/2005, <strong>de</strong> 21 <strong>de</strong> Enero <strong>de</strong> 2005, re<strong>la</strong>tiva a <strong>la</strong>s<br />
medidas <strong>de</strong> protección contra <strong>la</strong> introducción en <strong>la</strong> Comunidad <strong>de</strong> organismos nocivos<br />
para los vegetales o productos vegetales y contra su propagación en el interior <strong>de</strong> <strong>la</strong><br />
Comunidad, y <strong>de</strong> acuerdo con <strong>la</strong> Directiva 2001/32/CE <strong>de</strong> 8 <strong>de</strong> Mayo <strong>de</strong> 2001 sobre el<br />
reconocimiento <strong>de</strong> zonas protegidas <strong>de</strong> <strong>la</strong> Comunidad Europea expuestas a riesgos<br />
fitosanitarios específicos; que afectan, entre otros, a los siguientes patógenos:<br />
C<strong>la</strong>vibacter michiganensis subsp. sepedonicus (Podredumbre anu<strong>la</strong>r <strong>de</strong> <strong>la</strong> patata) y<br />
Ralstonia so<strong>la</strong>nacearum (Podredumbre parda <strong>de</strong> <strong>la</strong> patata)<br />
220
En <strong>la</strong> actualidad sus actuaciones en patata son <strong>la</strong>s siguientes:<br />
1. Análisis <strong>de</strong> control <strong>de</strong> Ralstonia so<strong>la</strong>nacearum y C<strong>la</strong>vibacter michiganensis (dos<br />
enfermeda<strong>de</strong>s <strong>de</strong> <strong>la</strong>s que <strong>de</strong>ben estar exentas <strong>la</strong>s patatas <strong>de</strong> importación o que se utilizan<br />
como patata <strong>de</strong> siembra). En Castil<strong>la</strong> y León, en <strong>la</strong> actualidad, se establecen 4 prospecciones<br />
oficiales que afectan a distintos puntos <strong>de</strong>l sistema productivo:<br />
- <strong>Patata</strong> <strong>de</strong> siembra: se analiza el 100% <strong>de</strong> los lotes <strong>de</strong> patata <strong>de</strong> siembra producida en<br />
Castil<strong>la</strong> y León.<br />
- <strong>Patata</strong> <strong>de</strong> consumo: se prospecta un porcentaje <strong>de</strong> los lotes <strong>de</strong> patata <strong>de</strong> consumo<br />
producidos en Castil<strong>la</strong> y León.<br />
- <strong>Patata</strong> <strong>de</strong> multiplicación: Se analiza <strong>la</strong> totalidad <strong>de</strong> los lotes <strong>de</strong> patata <strong>de</strong> siembra<br />
utilizados para <strong>la</strong> producción <strong>de</strong> patata <strong>de</strong> siembra certificada en Castil<strong>la</strong> y León.<br />
- <strong>Patata</strong> <strong>de</strong> importación: se examina un porcentaje <strong>de</strong> los lotes <strong>de</strong> patata <strong>de</strong> siembra<br />
certificada importados <strong>de</strong> otros países, para <strong>la</strong> producción <strong>de</strong> patata <strong>de</strong> consumo en<br />
Castil<strong>la</strong> y León<br />
2. Muestras <strong>de</strong> consultas recibidas directamente en el <strong>la</strong>boratorio, proce<strong>de</strong>ntes <strong>de</strong>:<br />
Secciones <strong>de</strong> Sanidad y Producción Vegetal, Unida<strong>de</strong>s <strong>de</strong> <strong>de</strong>sarrollo Agrario, Cooperativas,<br />
Asociaciones Profesionales, Denominaciones <strong>de</strong> Origen y Agricultores, para <strong>de</strong>terminar<br />
diversas patologías. Durante el año 2009 se han recibido en el Laboratorio un total <strong>de</strong> 4.851<br />
muestras (incluyendo muestras proce<strong>de</strong>ntes <strong>de</strong> prospecciones y consultas) <strong>de</strong> <strong>la</strong>s cuales el<br />
42% eran <strong>de</strong> patata.<br />
14.3 INSTITUTO TECNOLÓGICO AGRARIO DE CASTILLA Y LEÓN (ITACYL)<br />
El Instituto Tecnológico Agrario <strong>de</strong> Castil<strong>la</strong> y León es un Ente Público, adscrito a <strong>la</strong> Consejería<br />
<strong>de</strong> Agricultura y Gana<strong>de</strong>ría <strong>de</strong> <strong>la</strong> Junta <strong>de</strong> Castil<strong>la</strong> y León, creado por Ley 7/2002 <strong>de</strong> 3 <strong>de</strong><br />
mayo, que centra su actividad en el <strong>de</strong>sarrollo tecnológico en el sector agroalimentario, en <strong>la</strong><br />
investigación y en <strong>la</strong> transferencia <strong>de</strong> los avances científicos, favoreciendo <strong>la</strong> coordinación y<br />
co<strong>la</strong>boración con <strong>la</strong>s organizaciones públicas y privadas, rigiéndose fundamentalmente por el<br />
<strong>de</strong>recho privado. El ITACyL nace con <strong>la</strong> firme voluntad <strong>de</strong> potenciar, mediante el avance<br />
científico, <strong>la</strong> actividad <strong>de</strong>l sector agroalimentario y <strong>de</strong> sus industrias <strong>de</strong> transformación,<br />
dinamizando <strong>la</strong> innovación tecnológica y <strong>la</strong>s iniciativas que conlleven nuevas orientaciones<br />
productivas y <strong>de</strong> a<strong>de</strong>cuación al mercado.<br />
221
A continuación se pasa a <strong>de</strong>scribir los principales proyectos <strong>de</strong> I+D y <strong>de</strong> experimentación<br />
agraria en los que está involucrado el ITACyL en lo referente al cultivo <strong>de</strong> <strong>la</strong> patata:<br />
14.3.1 RED DE ENSAYOS DE NUEVAS VARIEDADES DE PATATA EN CASTILLA Y LEÓN<br />
La Consejería <strong>de</strong> Agricultura y Gana<strong>de</strong>ría encomendó a través <strong>de</strong> <strong>la</strong> Mesa <strong>de</strong> Seguimiento <strong>de</strong>l<br />
Cultivo <strong>de</strong> <strong>la</strong> <strong>Patata</strong> al ITACyL llevar a cabo una red <strong>de</strong> ensayos con unos objetivos y protocolo<br />
común para el beneficio <strong>de</strong> todos los productores <strong>de</strong> <strong>la</strong> región. Esta red comenzó en 2004, por<br />
lo que lleva cinco años <strong>de</strong> funcionamiento. Los objetivos se centran particu<strong>la</strong>rmente en el<br />
conocimiento, rendimiento y calidad culinaria <strong>de</strong> un conjunto <strong>de</strong> nuevas varieda<strong>de</strong>s para <strong>la</strong><br />
región castel<strong>la</strong>no y leonesa. El objetivo general <strong>de</strong> estos ensayos es el incremento <strong>de</strong> <strong>la</strong><br />
competitividad <strong>de</strong> <strong>la</strong>s explotaciones agríco<strong>la</strong>s <strong>de</strong> este tubérculo mediante el empleo <strong>de</strong><br />
varieda<strong>de</strong>s más productivas y con mejor calidad <strong>de</strong> sus tubérculos. Las varieda<strong>de</strong>s ensayadas<br />
son <strong>de</strong> consumo en fresco (media estación, tardías y <strong>de</strong> piel roja) y con aptitud para<br />
industria. Todos estos ensayos se han realizado en co<strong>la</strong>boración con APPACALE.<br />
Las cooperativas, como representantes <strong>de</strong> los productores y con intereses convergentes en <strong>la</strong><br />
mayoría <strong>de</strong> los casos, han establecido co<strong>la</strong>boraciones para encontrar soluciones a temas<br />
concretos <strong>de</strong>l sector. El año 2004 participaron siete cooperativas, los años 2005 y 2006 fueron<br />
ocho <strong>la</strong>s co<strong>la</strong>boradoras, cuatro en <strong>la</strong>s campañas <strong>de</strong> 2007 y 2008, y tres en <strong>la</strong> campaña 2009.<br />
Las cooperativas que han participado en el último año han sido <strong>la</strong>s siguientes:<br />
- Soc. Coop. Del Campo Glus I.<br />
- Soc. Coop. Agropecuaria Indycons.<br />
- Gexvall Soc. Coop.<br />
Las varieda<strong>de</strong>s <strong>de</strong> interés han sido ensayadas en diferentes localida<strong>de</strong>s, con <strong>la</strong>rga tradición<br />
<strong>de</strong>l cultivo <strong>de</strong> <strong>la</strong> patata, repartidas por toda <strong>la</strong> geografía <strong>de</strong> Castil<strong>la</strong> y León. A modo <strong>de</strong><br />
ejemplo, se pue<strong>de</strong> <strong>de</strong>stacar que en el año 2009 los ensayos <strong>de</strong> patata <strong>de</strong> media estación<br />
(consumo fresco) se hicieron en tres localida<strong>de</strong>s (Tor<strong>de</strong>sil<strong>la</strong>s, Campo <strong>de</strong> Cuél<strong>la</strong>r y Arabayona);<br />
los <strong>de</strong> patata tardía (consumo fresco) en otras tres (Mózar <strong>de</strong> Valver<strong>de</strong>, Toro y Campo <strong>de</strong><br />
Cuél<strong>la</strong>r); los <strong>de</strong> piel roja (consumo fresco) en una localidad (Arabayona); y por último, los <strong>de</strong><br />
patata <strong>de</strong> industria se efectuaron en tres localida<strong>de</strong>s (Tor<strong>de</strong>sil<strong>la</strong>s, Vil<strong>la</strong>muriel <strong>de</strong> Cerrato y<br />
Soto <strong>de</strong> <strong>la</strong> Vega).<br />
La producción <strong>de</strong> patata en los ensayos se ha realizado siguiendo el Reg<strong>la</strong>mento Técnico<br />
específico <strong>de</strong> Producción Integrada <strong>de</strong> <strong>Patata</strong> (Resolución <strong>de</strong> 18 <strong>de</strong> abril <strong>de</strong> 2005, <strong>de</strong> <strong>la</strong><br />
Dirección General <strong>de</strong> Producción Agropecuaria) y <strong>de</strong> su cumplimiento y control se han<br />
encargado los técnicos <strong>de</strong> <strong>la</strong>s cooperativas co<strong>la</strong>boradoras.<br />
222
Otros objetivos estudiados consisten en <strong>la</strong> obtención <strong>de</strong> nuevas varieda<strong>de</strong>s, lo que se ejecuta<br />
mediante:<br />
- Programas <strong>de</strong> mejora encaminados a obtener varieda<strong>de</strong>s <strong>de</strong> interés tanto a nivel<br />
regional como nacional, con características diferenciadas, <strong>de</strong> buena producción y<br />
resistentes a enfermeda<strong>de</strong>s, especialmente a virus y nemátodos.<br />
- La continuación con los ensayos <strong>de</strong> varieda<strong>de</strong>s y si es posible ampliarlos para tener<br />
unos datos fiables <strong>de</strong>l comportamiento <strong>de</strong> <strong>la</strong>s distintas varieda<strong>de</strong>s en distintas<br />
comarcas productoras <strong>de</strong> nuestra comunidad autónoma.<br />
Los resultados <strong>de</strong> estos ensayos han permitido conocer el vigor, el rendimiento, <strong>la</strong> adaptación<br />
y <strong>la</strong>s características culinarias <strong>de</strong> <strong>la</strong>s últimas varieda<strong>de</strong>s registradas en España y/o Europa, y<br />
po<strong>de</strong>r compararlo con el <strong>de</strong> varieda<strong>de</strong>s testigo ampliamente utilizadas en Castil<strong>la</strong> y León <strong>de</strong><br />
resultados conocidos. Esta información es muy importante porque permite conocer <strong>la</strong>s<br />
mejores varieda<strong>de</strong>s para una zona y un uso <strong>de</strong>terminado, potenciando <strong>de</strong> este modo el sector<br />
productor tras <strong>la</strong> transferencia <strong>de</strong> estos resultados.<br />
Otros proyectos en los que el ITACyL ha co<strong>la</strong>borado o co<strong>la</strong>bora con APPACALE, y re<strong>la</strong>cionados<br />
con los anteriores ensayos, que están integrados <strong>de</strong>ntro <strong>de</strong>l <strong>P<strong>la</strong>n</strong> <strong>de</strong> Experimentación Agrario<br />
son:<br />
- “Ensayo <strong>de</strong> nuevo sistema <strong>de</strong> p<strong>la</strong>ntación en patata <strong>de</strong> siembra: siembra en meseta<br />
con riego por goteo”. Cuyos objetivos principales son obtener mayores índices <strong>de</strong><br />
producción, homogeneizar <strong>la</strong> producción, minimizar el tamaño <strong>de</strong> los tubérculos y<br />
optimizar el uso <strong>de</strong>l agua.<br />
- “Producción <strong>de</strong> semil<strong>la</strong> y mantenimiento in vitro <strong>de</strong> <strong>la</strong> variedad autóctona fina <strong>de</strong><br />
Gredos”.Los objetivos son el mantenimiento <strong>de</strong> esta variedad en los bancos <strong>de</strong><br />
germop<strong>la</strong>sma y su multiplicación para distribuir<strong>la</strong> por sus especiales características <strong>de</strong><br />
diferenciación respecto a otras varieda<strong>de</strong>s.<br />
- “Evaluación <strong>de</strong> resistencia a Globo<strong>de</strong>ra rostochiensis en clones avanzados <strong>de</strong> patata”.<br />
El objetivo es evaluar <strong>la</strong> resistencia <strong>de</strong> los clones obtenido a este nematodo, causante<br />
<strong>de</strong> <strong>la</strong> mayoría <strong>de</strong> <strong>la</strong>s cuarentenas en <strong>la</strong>s zonas <strong>de</strong> producción <strong>de</strong> patata <strong>de</strong> siembra.<br />
- “Evaluación <strong>de</strong> clones <strong>de</strong> patata <strong>de</strong>l programa <strong>de</strong> mejora genética <strong>de</strong> APPACALE en<br />
condiciones <strong>de</strong> cultivo ecológico”. El objetivo es dar un paso más en el programa <strong>de</strong><br />
mejora, conociendo aparte <strong>de</strong> <strong>la</strong>s características habituales <strong>de</strong> producción,<br />
resistencia a enfermeda<strong>de</strong>s, buenas condiciones organolépticas, ver su<br />
comportamiento en condiciones <strong>de</strong> agricultura ecológica.<br />
223
14.3.2 EVALUAR LA VIABILIDAD DE LA PRODUCCIÓN DE BIOETANOL A PARTIR DE PATATA Y/O<br />
SUS RESIDUOS.<br />
La patata es un producto con alto contenido en almidón, representando este polisacárido el<br />
75% <strong>de</strong> <strong>la</strong> materia seca. Este elevado porcentaje hace que <strong>la</strong> patata sea una materia prima<br />
potencialmente utilizable para <strong>la</strong> producción <strong>de</strong> bioetanol.<br />
Las materias primas <strong>de</strong> interés para <strong>la</strong> producción <strong>de</strong> bioetanol son los productos con elevado<br />
contenido en hidratos <strong>de</strong> carbono. Aquí se incluyen productos ricos en monosacáridos o<br />
disacáridos directamente fermentables, materias primas ricas en polisacáridos como el<br />
almidón fácilmente hidrolizable (rompiendo <strong>la</strong>s estructuras complejas en estructuras simples<br />
ya fermentables), y/o materias primas con estructuras polisacáridas complejas como es <strong>la</strong><br />
celulosa, que requiere sistemas <strong>de</strong> tratamiento más severos para conseguir estructuras<br />
simples fermentables.<br />
Factores como <strong>la</strong> elevada estacionalidad <strong>de</strong> <strong>la</strong> patata, sus elevados porcentajes <strong>de</strong> humedad<br />
y, fundamentalmente, su elevado peso en el sector alimentario, han provocado que no sea<br />
una materia prima consi<strong>de</strong>rada por el momento, en <strong>la</strong> ca<strong>de</strong>na <strong>de</strong> suministro <strong>de</strong> <strong>la</strong>s gran<strong>de</strong>s<br />
insta<strong>la</strong>ciones industriales <strong>de</strong> producción <strong>de</strong> bioetanol a nivel mundial.<br />
Debe indicarse que <strong>la</strong> industria bioenergética tiene unos requerimientos <strong>de</strong> calidad para <strong>la</strong><br />
materia prima menos exigentes que <strong>la</strong> industria alimentaria. Esto podría permitir que un<br />
volumen importante <strong>de</strong> <strong>la</strong>s patatas <strong>de</strong>sechadas a lo <strong>la</strong>rgo <strong>de</strong> su ca<strong>de</strong>na <strong>de</strong> procesamiento<br />
pudiese ser utilizado para producción <strong>de</strong> bioetanol, valorizándose un residuo a <strong>la</strong> vez que se<br />
produce energía.<br />
Los proyectos <strong>de</strong> insta<strong>la</strong>ciones industriales para producción <strong>de</strong> bioetanol a partir <strong>de</strong> materias<br />
primas <strong>de</strong> <strong>de</strong>secho, como serían <strong>la</strong>s patatas <strong>de</strong> <strong>de</strong>strío no aptas para consumo humano,<br />
<strong>de</strong>berán ser pequeñas insta<strong>la</strong>ciones <strong>de</strong> carácter modu<strong>la</strong>r, dimensionadas en base a <strong>la</strong> cantidad<br />
<strong>de</strong> materia prima disponible en el área <strong>de</strong> actuación. Estos proyectos sólo serán viables si se<br />
p<strong>la</strong>ntean con un fuerte carácter local, en zonas puntuales don<strong>de</strong> <strong>la</strong> <strong>de</strong>nsidad <strong>de</strong> generación <strong>de</strong><br />
residuos para suministro a <strong>la</strong> insta<strong>la</strong>ción energética sea muy elevada y se p<strong>la</strong>nteen proyectos<br />
asociados <strong>de</strong> autoconsumo <strong>de</strong>l biocarburante generado.<br />
Bajo <strong>la</strong>s premisas p<strong>la</strong>nteadas, <strong>de</strong>s<strong>de</strong> el Instituto Tecnológico Agrario se quiere realizar un<br />
estudio <strong>de</strong> <strong>la</strong> viabilidad <strong>de</strong> un proyecto <strong>de</strong> producción <strong>de</strong> bioetanol a pequeña esca<strong>la</strong> con<br />
patata <strong>de</strong> <strong>de</strong>strío, en Castil<strong>la</strong> y León. En este momento no se dispone <strong>de</strong> inventarios <strong>de</strong>l<br />
volumen <strong>de</strong> patata residual producida en <strong>la</strong> región, por lo que inicialmente será necesario<br />
<strong>de</strong>terminar su cantidad y localización, para po<strong>de</strong>r evaluar <strong>la</strong> dimensión y producción <strong>de</strong> <strong>la</strong><br />
insta<strong>la</strong>ción industrial bioenergética.<br />
224
Por otro <strong>la</strong>do, <strong>de</strong>be indicarse que a nivel internacional se está trabajando en el <strong>de</strong>sarrollo <strong>de</strong><br />
varieda<strong>de</strong>s <strong>de</strong> patata exclusivamente para uso energético. Estas varieda<strong>de</strong>s, a<strong>de</strong>más <strong>de</strong> tener<br />
una elevada productividad, <strong>de</strong>ben presentar una mayor proporción <strong>de</strong> una <strong>de</strong> <strong>la</strong>s dos<br />
sustancias que componen el almidón, <strong>la</strong> amilosa frente a <strong>la</strong> amilopectina. Esto es <strong>de</strong>bido a<br />
que <strong>la</strong> amilosa es <strong>la</strong> estructura <strong>de</strong>l almidón fácilmente solubilizable en agua y por tanto, más<br />
fácil <strong>de</strong> hidrolizar que <strong>la</strong> amilopectina. De este modo, se conseguiría aumentar <strong>la</strong> producción<br />
y se simplificaría el proceso, reduciéndose los costes <strong>de</strong> operación.<br />
14.3.3 NUEVO PROGRAMA DE INNOVACIÓN (I+D+I) COMO APUESTA DE FUTURO EN EL SECTOR<br />
DE LA PATATA EN CASTILLA Y LEÓN<br />
Estrategias <strong>de</strong> conservación <strong>de</strong> tubérculos <strong>de</strong> patata durante su almacenamiento para <strong>la</strong><br />
mejora <strong>de</strong> sus aptitu<strong>de</strong>s tecnológicas y culinarias.<br />
Los tubérculos <strong>de</strong> patata recién cosechados entran en un periodo <strong>de</strong> <strong>la</strong>tencia o dormición que<br />
suele durar entre 3-5 meses. Transcurrido este tiempo, <strong>la</strong>s yemas <strong>la</strong>terales o “ojos” <strong>de</strong>l<br />
tubérculo reinician su <strong>de</strong>sarrollo y crecen hasta formar una nueva p<strong>la</strong>nta genéticamente<br />
idéntica a <strong>la</strong> progenitora. Una práctica habitual en <strong>la</strong> post-cosecha es el tratamiento con<br />
agentes químicos como el iso-propil-N-clorofenol carbamato y cloropropil carbamato (CIPC) ó<br />
el almacenamiento <strong>de</strong> los tubérculos a bajas temperaturas, a fin <strong>de</strong> evitar que el tubérculo<br />
germine durante el proceso <strong>de</strong> empaquetado, distribución y venta. La legis<strong>la</strong>ción vigente<br />
prohíbe el uso <strong>de</strong> estos tratamientos químicos, <strong>de</strong>bido a su re<strong>la</strong>tiva toxicidad, por lo que en <strong>la</strong><br />
actualidad el almacenamiento entre 4º y 8ºC es <strong>la</strong> única opción aceptable para prolongar el<br />
período post-cosecha <strong>de</strong>l tubérculo y asegurar un aprovisionamiento continuado <strong>de</strong> tubérculos<br />
en el mercado. Un inconveniente importante que esta práctica conlleva, es <strong>la</strong> acumu<strong>la</strong>ción <strong>de</strong><br />
azúcares solubles (sacarosa, glucosa y fructosa) en el tubérculo, fenómeno conocido como<br />
“cold sweetening” o endulzamiento por frío.<br />
Dicha acumu<strong>la</strong>ción se produce a niveles variables, <strong>de</strong>pendiendo <strong>de</strong> factores ambientales tales<br />
como el lugar <strong>de</strong> siembra o el año <strong>de</strong> <strong>la</strong> cosecha, así como <strong>de</strong> <strong>la</strong> variedad genética <strong>de</strong> patata,<br />
y está causada por un <strong>de</strong>sajuste entre <strong>la</strong> velocidad <strong>de</strong> <strong>de</strong>gradación <strong>de</strong>l almidón y <strong>la</strong> <strong>de</strong><br />
glicólisis. Esto hace que se produzca un acumulo <strong>de</strong> sacarosa, que posteriormente es<br />
<strong>de</strong>gradada a glucosa y fructosa a través <strong>de</strong> <strong>la</strong> acción <strong>de</strong> los enzimas invertasa citosólicos y<br />
vacuo<strong>la</strong>res.<br />
El acumulo <strong>de</strong> azúcares reductores en el almacenaje en frío es un problema serio y<br />
económicamente costoso tanto para los productores como para <strong>la</strong> industria procesadora. Más<br />
<strong>de</strong>l 70% <strong>de</strong>l consumo <strong>de</strong> tubérculos se hace en forma <strong>de</strong> patatas fritas, en tortil<strong>la</strong>s o como<br />
patatas chips.<br />
225
Durante este procesado, <strong>de</strong>bido a <strong>la</strong>s elevadas temperaturas alcanzadas al freír, ocurre una<br />
reacción entre los grupos reductores <strong>de</strong> los azúcares y los grupos amino <strong>de</strong> los aminoácidos y<br />
proteínas, conocida como <strong>la</strong> reacción <strong>de</strong> Mail<strong>la</strong>rd. Dicha reacción hace que <strong>la</strong>s patatas<br />
adquieran un color oscuro y gusto amargo, que <strong>la</strong>s hace inaceptables para el consumo. Se ha<br />
<strong>de</strong>scrito que un contenido en azúcares reductores en el tubérculo inferior al 0.1% es i<strong>de</strong>al<br />
para el procesado <strong>de</strong> <strong>la</strong>s patatas mientras que un contenido mayor al 0.33% es inaceptable. En<br />
base a estos estándares, casi un 20% <strong>de</strong> <strong>la</strong> producción <strong>de</strong> patatas es rechazada en <strong>la</strong> p<strong>la</strong>nta<br />
procesadora, <strong>de</strong>bido a que su contenido en azúcares es excesivamente elevado.<br />
Con el fin <strong>de</strong> evitar este problema, actualmente se almacenan los tubérculos entre 10 y 12ºC,<br />
si bien a estas temperaturas se favorece <strong>la</strong> propagación <strong>de</strong> enfermeda<strong>de</strong>s y hongos, <strong>la</strong> pérdida<br />
<strong>de</strong> agua, el envejecimiento <strong>de</strong> los tubérculos, o una germinación prematura. Por tanto, sería<br />
altamente <strong>de</strong>seable el diseño <strong>de</strong> nuevas estrategias <strong>de</strong> conservación que favoreciesen a<strong>la</strong>rgar<br />
el almacenamiento <strong>de</strong> los tubérculos una vez cosechados sin que se produjese una reducción<br />
<strong>de</strong> <strong>la</strong>s características tecnológicas y culinarias más importantes.<br />
Esta línea <strong>de</strong> investigación tiene como objetivo fundamental, por tanto, el diseño <strong>de</strong><br />
estrategias <strong>de</strong> conservación <strong>de</strong> tubérculos <strong>de</strong> patata durante su almacenamiento<br />
postcosecha, así como el <strong>de</strong>sarrollo <strong>de</strong> marcadores <strong>de</strong> calidad (p.ej. marcadores molecu<strong>la</strong>res<br />
asociados a <strong>la</strong> resistencia al endulzamiento por frío) que permitan el control <strong>de</strong> <strong>la</strong><br />
conservación así como favorecer <strong>la</strong> selección <strong>de</strong> varieda<strong>de</strong>s a<strong>de</strong>cuadas para su procesamiento<br />
tecnológico (p.ej. patatas fritas y chips). Para <strong>la</strong> consecución <strong>de</strong> este objetivo general, se han<br />
<strong>de</strong>scrito una serie <strong>de</strong> objetivos específicos:<br />
Estrategias <strong>de</strong> mejora en <strong>la</strong> conservación para reducir el endulzamiento en frío.<br />
• Mejora <strong>de</strong> <strong>la</strong>s condiciones <strong>de</strong> conservación durante el almacenamiento<br />
1. Evaluación <strong>de</strong>l efecto <strong>de</strong> <strong>la</strong> conservación <strong>de</strong> los tubérculos <strong>de</strong> patata <strong>de</strong> diferentes<br />
varieda<strong>de</strong>s <strong>de</strong> Castil<strong>la</strong> y León a diferentes temperaturas en el contenido <strong>de</strong> azúcares<br />
solubles y corre<strong>la</strong>ción <strong>de</strong> dicho contenido con el grado <strong>de</strong> par<strong>de</strong>amiento.<br />
2. Evaluación <strong>de</strong>l efecto <strong>de</strong> <strong>la</strong> conservación empleando diferentes ciclos <strong>de</strong><br />
temperaturas en el contenido <strong>de</strong> azúcares solubles <strong>de</strong> los tubérculos <strong>de</strong> patata <strong>de</strong><br />
diferentes varieda<strong>de</strong>s <strong>de</strong> Castil<strong>la</strong> y León y corre<strong>la</strong>ción <strong>de</strong> dicho contenido con el grado<br />
<strong>de</strong> par<strong>de</strong>amiento.<br />
3. Evaluación <strong>de</strong>l efecto <strong>de</strong> <strong>la</strong> conservación <strong>de</strong> los tubérculos <strong>de</strong> patata <strong>de</strong> diferentes<br />
varieda<strong>de</strong>s <strong>de</strong> Castil<strong>la</strong> y León empleando diferentes compuestos químicos autorizados<br />
en el contenido <strong>de</strong> azúcares solubles y corre<strong>la</strong>ción <strong>de</strong> dicho contenido con el grado <strong>de</strong><br />
par<strong>de</strong>amiento.<br />
4. Evaluación <strong>de</strong>l efecto combinado <strong>de</strong> <strong>la</strong> conservación empleando diferentes<br />
temperaturas diferentes compuestos químicos autorizados en el contenido <strong>de</strong><br />
226
azúcares solubles <strong>de</strong> los tubérculos <strong>de</strong> patata <strong>de</strong> diferentes varieda<strong>de</strong>s <strong>de</strong> Castil<strong>la</strong> y<br />
León y corre<strong>la</strong>ción <strong>de</strong> dicho contenido con el grado <strong>de</strong> par<strong>de</strong>amiento.<br />
5. Transferencia <strong>de</strong> los resultados al sector para su utilización en el almacenamiento<br />
postcosecha <strong>de</strong> tubérculos <strong>de</strong> patata.<br />
• C<strong>la</strong>sificación <strong>de</strong> varieda<strong>de</strong>s <strong>de</strong> patata <strong>de</strong> Castil<strong>la</strong> y León resistentes al endulzamiento<br />
en frío:<br />
1. Agrupación <strong>de</strong> diferentes varieda<strong>de</strong>s <strong>de</strong> patata <strong>de</strong> Castil<strong>la</strong> y León en alto y bajo<br />
contenido en azúcares solubles (bulk segregant analysis).<br />
2. I<strong>de</strong>ntificación <strong>de</strong> varieda<strong>de</strong>s <strong>de</strong> patata <strong>de</strong> Castil<strong>la</strong> y León con un escaso grado <strong>de</strong><br />
par<strong>de</strong>amiento tras el procesamiento tecnológico a altas temperaturas (calidad chip).<br />
3. Análisis transcriptómico <strong>de</strong> tubérculos <strong>de</strong> varieda<strong>de</strong>s con un alto y bajo contenido en<br />
azúcares solubles recién cosechados o tras 2 meses <strong>de</strong> almacenamiento a 4ºC, a fin <strong>de</strong><br />
i<strong>de</strong>ntificar aquellos genes implicados en el metabolismo <strong>de</strong> azúcares con una<br />
expresión diferencial tras el tratamiento frío, y comprobación <strong>de</strong> <strong>la</strong> expresión<br />
diferencial <strong>de</strong> los genes i<strong>de</strong>ntificados.<br />
4. Desarrollo <strong>de</strong> marcadores <strong>de</strong> calidad (marcadores molecu<strong>la</strong>res CAPS) y comprobación<br />
que el marcador generado i<strong>de</strong>ntifica <strong>la</strong>s varieda<strong>de</strong>s que presentan <strong>la</strong> resistencia al<br />
endulzamiento por frío.<br />
5. Caracterización genética (genotipado) <strong>de</strong> <strong>la</strong>s diferentes varieda<strong>de</strong>s <strong>de</strong> patata <strong>de</strong><br />
Castil<strong>la</strong> y León.<br />
6. Transferencia <strong>de</strong> los resultados al sector para su utilización en <strong>la</strong> selección <strong>de</strong><br />
varieda<strong>de</strong>s a<strong>de</strong>cuadas para su procesamiento tipo chip y/o e<strong>la</strong>boración <strong>de</strong> tortil<strong>la</strong>s.<br />
Estrategias <strong>de</strong> mejora en <strong>la</strong> conservación para reducir <strong>la</strong> presencia <strong>de</strong> acri<strong>la</strong>mida en el<br />
producto e<strong>la</strong>borado (patatas fritas y chips)<br />
• Mejora <strong>de</strong> <strong>la</strong>s condiciones <strong>de</strong> conservación durante el almacenamiento:<br />
1. Evaluación <strong>de</strong>l efecto <strong>de</strong>l envejecimiento durante el tiempo <strong>de</strong> almacenamiento <strong>de</strong><br />
los tubérculos <strong>de</strong> patata <strong>de</strong> diferentes varieda<strong>de</strong>s <strong>de</strong> Castil<strong>la</strong> y León sobre <strong>la</strong> aptitud<br />
para su procesado (patatas fritas y chip) y sobre sus características culinarias.<br />
2. Evaluación <strong>de</strong>l efecto <strong>de</strong> <strong>la</strong> conservación <strong>de</strong> tubérculos <strong>de</strong> patata <strong>de</strong> diferentes<br />
varieda<strong>de</strong>s <strong>de</strong> Castil<strong>la</strong> y León a diferentes temperaturas en el contenido <strong>de</strong> azúcares<br />
solubles y otros compuestos precursores <strong>de</strong> <strong>la</strong> acri<strong>la</strong>mida (p.ej. asparagina) y<br />
corre<strong>la</strong>ción con el contenido <strong>de</strong> acri<strong>la</strong>mida tras un procesado tecnológico a altas<br />
temperaturas (patatas fritas y chips).<br />
3. Evaluación <strong>de</strong>l efecto <strong>de</strong> <strong>la</strong> aplicación <strong>de</strong> diferentes compuestos naturales para <strong>la</strong><br />
reducción <strong>de</strong> compuestos precursores <strong>de</strong> <strong>la</strong> acri<strong>la</strong>mida (p.ej. asparagina) en los<br />
tubérculos almacenados y/o listos para su procesado y corre<strong>la</strong>ción con el contenido<br />
227
<strong>de</strong> acri<strong>la</strong>mida tras un procesado tecnológico a altas temperaturas (patatas fritas y<br />
chips).<br />
4. Transferencia <strong>de</strong> los resultados al sector para su utilización en el almacenamiento<br />
postcosecha <strong>de</strong> tubérculos <strong>de</strong> patata.<br />
• C<strong>la</strong>sificación <strong>de</strong> varieda<strong>de</strong>s <strong>de</strong> patata <strong>de</strong> Castil<strong>la</strong> y León con contenido bajo en<br />
acri<strong>la</strong>mida en el producto e<strong>la</strong>borado (patatas fritas y chips):<br />
1. Agrupación <strong>de</strong> diferentes varieda<strong>de</strong>s <strong>de</strong> patata <strong>de</strong> Castil<strong>la</strong> y León en alto y bajo<br />
contenido en acri<strong>la</strong>mida (calidad chip saludable).<br />
2. Análisis transcriptómico <strong>de</strong> tubérculos <strong>de</strong> varieda<strong>de</strong>s con un alto y bajo contenido en<br />
precursores <strong>de</strong> <strong>la</strong> acri<strong>la</strong>mida recién cosechados o tras 2 meses <strong>de</strong> almacenamiento a<br />
4ºC, a fin <strong>de</strong> i<strong>de</strong>ntificar aquellos genes implicados en el metabolismo <strong>de</strong> azúcares con<br />
una expresión diferencial, y comprobación <strong>de</strong> <strong>la</strong> expresión diferencial <strong>de</strong> los genes<br />
i<strong>de</strong>ntificados.<br />
3. Desarrollo <strong>de</strong> marcadores <strong>de</strong> calidad (marcadores molecu<strong>la</strong>res CAPS) y comprobación<br />
que el marcador generado i<strong>de</strong>ntifica <strong>la</strong>s varieda<strong>de</strong>s que presentan un menor<br />
contenido en acvri<strong>la</strong>mida tras el procesado tecnológico a altas temperaturas.<br />
4. Caracterización genética (genotipado) <strong>de</strong> <strong>la</strong>s diferentes varieda<strong>de</strong>s <strong>de</strong> patata <strong>de</strong><br />
Castil<strong>la</strong> y León.<br />
5. Transferencia <strong>de</strong> los resultados al sector para su utilización en <strong>la</strong> selección <strong>de</strong><br />
varieda<strong>de</strong>s a<strong>de</strong>cuadas para su procesamiento tipo chip y/o e<strong>la</strong>boración <strong>de</strong> tortil<strong>la</strong>s.<br />
Estrategias <strong>de</strong> mejora en <strong>la</strong> conservación para mejorar <strong>la</strong> seguridad y calidad alimentaria.<br />
1. Desarrollo <strong>de</strong> herramientas <strong>de</strong> diagnóstico rápido para el control <strong>de</strong> los principales<br />
patógenos alimentarios (bacterias, virus y parásitos) presentes en los tubérculos <strong>de</strong><br />
patata y que pue<strong>de</strong>n ser un problema para el consumidor final.<br />
2. Desarrollo <strong>de</strong> herramientas <strong>de</strong> diagnóstico rápido para el control <strong>de</strong> los principales<br />
patógenos <strong>de</strong> <strong>la</strong> patata (bacterias, virus y parásitos) que pue<strong>de</strong>n afectar a los<br />
tubérculos <strong>de</strong> patata y producir una merma en su características culinarias y/o en <strong>la</strong><br />
vida útil <strong>de</strong> <strong>la</strong>s mismas.<br />
3. Desarrollo <strong>de</strong> nuevas estrategias <strong>de</strong> almacenamiento (temperatura e iluminación<br />
para) para reducir <strong>la</strong> producción <strong>de</strong> compuesto químicos endógenos <strong>de</strong> <strong>la</strong> patata<br />
(p.ej. so<strong>la</strong>nina).<br />
4. Transferencia <strong>de</strong> los resultados al sector para su utilización en el almacenamiento<br />
postcosecha <strong>de</strong> tubérculos <strong>de</strong> patata.<br />
P<strong>la</strong>gas y Enfermeda<strong>de</strong>s<br />
228
- Co<strong>la</strong>borar en el programa <strong>de</strong> mejora para <strong>la</strong> obtención <strong>de</strong> varieda<strong>de</strong>s resistentes a<br />
virosis y nematodos.<br />
- Establecimiento <strong>de</strong> una estrategia <strong>de</strong>ntro <strong>de</strong>l <strong>P<strong>la</strong>n</strong> Director <strong>de</strong> Lucha contra P<strong>la</strong>gas <strong>de</strong><br />
Castil<strong>la</strong> y León para <strong>la</strong> prevención, vigi<strong>la</strong>ncia y control <strong>de</strong> <strong>la</strong>s principales p<strong>la</strong>gas que<br />
afecten al cultivo <strong>de</strong> <strong>la</strong> patata en Castil<strong>la</strong> y León.<br />
14.4 AGRUPACIÓN DE PRODUCTORES DE PATATA DE SIEMBRA DE CASTILLA Y LEÓN<br />
(APPACALE)<br />
14.4.1 PRESENTACIÓN<br />
Aunque el inicio <strong>de</strong> <strong>la</strong>s activida<strong>de</strong>s se remonta a marzo <strong>de</strong> 1.988 con <strong>la</strong> producción <strong>de</strong> patata<br />
<strong>de</strong> siembra Prebase, <strong>de</strong>s<strong>de</strong> 1.993 <strong>la</strong> Empresa Pública APPACALE, S.A. con una participación<br />
social <strong>de</strong>l 51 % <strong>de</strong> <strong>la</strong> Junta <strong>de</strong> Castil<strong>la</strong> y León y el 49 % restante <strong>de</strong> <strong>la</strong>s principales entida<strong>de</strong>s<br />
productoras en régimen cooperativo (COPANOR, CULPAVAL COOP., COOP. SANTA ISABEL,<br />
COSIDEL COOP. y S.A.T. Nª. Sª <strong>de</strong> AHEDO), realiza activida<strong>de</strong>s <strong>de</strong> investigación siendo el<br />
objetivo principal <strong>la</strong> obtención <strong>de</strong> nuevas varieda<strong>de</strong>s <strong>de</strong> patata a petición <strong>de</strong>l sector privado<br />
que representa el 65% <strong>de</strong> <strong>la</strong> producción regional <strong>de</strong> patata <strong>de</strong> siembra y el 55% <strong>de</strong> <strong>la</strong><br />
producción nacional.<br />
El mercado nacional está dominado totalmente por varieda<strong>de</strong>s extranjeras y el sector<br />
tiene <strong>la</strong> <strong>de</strong>pen<strong>de</strong>ncia permanente <strong>de</strong>l exterior, estando amenazado por <strong>la</strong> estrategia<br />
comercial <strong>de</strong> otros países, ya que no podría multiplicar <strong>la</strong>s nuevas varieda<strong>de</strong>s que se están<br />
introduciendo en los mercados.<br />
Por ello es preciso trabajar en <strong>la</strong> investigación para <strong>la</strong> obtención <strong>de</strong> nuevas varieda<strong>de</strong>s<br />
adaptadas a nuestras condiciones ecoclimáticas que <strong>de</strong>n cierta autonomía al sector productor<br />
regional y fortalezcan <strong>la</strong>s estructuras comerciales <strong>de</strong> nuestras cooperativas. Cubrir estas<br />
necesida<strong>de</strong>s no so<strong>la</strong>mente es vital para el sector productor regional <strong>de</strong> patata <strong>de</strong> siembra,<br />
sino que el sector <strong>de</strong> patata <strong>de</strong> consumo también lo ha <strong>de</strong>mandado reiteradamente.<br />
La p<strong>la</strong>ntil<strong>la</strong> actual <strong>de</strong> APPACALE es <strong>de</strong> 11 personas (90% <strong>de</strong> personal cualificado),<br />
estando dos empleadas con jornada reducida. Los campos <strong>de</strong> ensayo <strong>de</strong> obtención están<br />
situados a 65 km. <strong>de</strong> <strong>la</strong> Empresa, en zona productora y no se dispone <strong>de</strong> parce<strong>la</strong> propia siendo<br />
contratados el arrendamiento y <strong>la</strong> prestación <strong>de</strong> servicios. Se dispone <strong>de</strong> un almacén <strong>de</strong> apoyo<br />
<strong>de</strong> 330 m 2 en L<strong>la</strong>nillo <strong>de</strong> Val<strong>de</strong>lucio. La Empresa dispone <strong>de</strong> inverna<strong>de</strong>ro <strong>de</strong> 275m 2 , 16<br />
túneles <strong>de</strong> cultivo <strong>de</strong> 330 m 2 (uno <strong>de</strong> ellos con climatización) y equipamiento suficiente para<br />
llevar a cabo sus activida<strong>de</strong>s. La parce<strong>la</strong> <strong>de</strong> 12.949 m 2 don<strong>de</strong> se ubica <strong>la</strong> Empresa está en el<br />
Polígono Industrial Vil<strong>la</strong>lonquejar <strong>de</strong> Burgos.<br />
229
14.4.2 OBJETIVOS ESTRATÉGICOS Y JUSTIFICACIÓN<br />
El principal objetivo <strong>de</strong> APPACALE es <strong>la</strong> obtención <strong>de</strong> nuevas varieda<strong>de</strong>s con buen<br />
rendimiento, precocidad, con calidad culinaria para consumo en fresco o para procesamiento<br />
industrial y con resistencia a virus Y.<br />
Para incrementar <strong>la</strong> eficacia, crear una variabilidad genética y apoyar <strong>la</strong> mejora<br />
clásica, también se trabaja con biotecnología en mejora a nivel diploi<strong>de</strong>, así como con<br />
marcadores molecu<strong>la</strong>res para <strong>de</strong>tectar materiales con resistencia al virus Y (PVY) y a<br />
Nematodos, y po<strong>de</strong>r acortar al p<strong>la</strong>zo medio <strong>de</strong> obtención <strong>de</strong> una variedad que está en 10 años<br />
<strong>de</strong>s<strong>de</strong> <strong>la</strong> siembra <strong>de</strong> los semilleros correspondientes.<br />
La justificación <strong>de</strong>l trabajo <strong>de</strong> APPACALE se fundamenta en <strong>la</strong>s siguientes<br />
consi<strong>de</strong>raciones:<br />
1. Reducción <strong>de</strong> <strong>la</strong> completa <strong>de</strong>pen<strong>de</strong>ncia varietal <strong>de</strong>l exterior, con una disminución <strong>de</strong>l<br />
precio <strong>de</strong> semil<strong>la</strong> y <strong>de</strong> pagos <strong>de</strong> royalties, así como evitar que a medio p<strong>la</strong>zo el sector<br />
<strong>de</strong> patata <strong>de</strong> siembra so<strong>la</strong>mente multiplique varieda<strong>de</strong>s libres, algunas <strong>de</strong> el<strong>la</strong>s ya<br />
obsoletas.<br />
2. La importancia <strong>de</strong>l cultivo <strong>de</strong> patata <strong>de</strong> siembra y <strong>de</strong> consumo en Castil<strong>la</strong> y León, ya<br />
que es <strong>la</strong> primera región productora con el 72% y 33% <strong>de</strong>l total nacional,<br />
respectivamente, y con más <strong>de</strong> 5.000 explotaciones re<strong>la</strong>cionadas directamente con el<br />
cultivo que <strong>de</strong>manda esta necesidad.<br />
3. En otros países todas <strong>la</strong>s zonas productoras tienen su centro <strong>de</strong> investigación en <strong>la</strong><br />
obtención varietal, todos con más <strong>de</strong> 40 años <strong>de</strong> antigüedad. En España, con <strong>la</strong>s<br />
transferencias autonómicas al País Vasco en el año 1981, todos los recursos nacionales<br />
<strong>de</strong> investigación en patata quedaron en el Centro <strong>de</strong> Arkaute (Á<strong>la</strong>va), hoy NEIKER<br />
(Empresa Pública); por ello el sector productor y <strong>la</strong> Junta <strong>de</strong> Castil<strong>la</strong> y León apoyaron<br />
este proyecto.<br />
4. Exigencias <strong>de</strong>l mercado nacional. Es preciso trabajar en varieda<strong>de</strong>s con calidad<br />
culinaria para consumo en fresco, en sus nuevas aptitu<strong>de</strong>s y también para<br />
procesamiento industrial, ya que hay 7 fábricas importantes en Castil<strong>la</strong> y León que<br />
contribuyen, en parte, a estabilizar el cultivo.<br />
14.4.3 SITUACIÓN ACTUAL DE LA PRODUCCIÓN DE NUEVAS VARIEDADES<br />
La producción <strong>de</strong> patata <strong>de</strong> siembra nacional es una mera multiplicación <strong>de</strong> varieda<strong>de</strong>s libres,<br />
no se pagan royalties pero tienen valor estratégico cero. Son varieda<strong>de</strong>s que siguen teniendo<br />
230
<strong>de</strong>manda, principalmente en Galicia y Castil<strong>la</strong> y León: Kennebec, Baraka, Jaer<strong>la</strong>, Monalisa,<br />
Agria, Desiree, Spunta, etc., pero poco a poco van cediendo superficie ante <strong>la</strong>s protegidas.<br />
Esto obe<strong>de</strong>ce también a una estrategia comercial <strong>de</strong> los obtentores; <strong>la</strong>s varieda<strong>de</strong>s <strong>de</strong><br />
dominio común, libres, son <strong>de</strong>mandadas por su calidad y características agronómicas pero se<br />
ven <strong>de</strong>sp<strong>la</strong>zadas en el tiempo en los mercados por <strong>la</strong>s protegidas.<br />
La producción <strong>de</strong> patata <strong>de</strong> siembra no dispone prácticamente <strong>de</strong> licencias <strong>de</strong><br />
multiplicación, por lo que nuestros socios no podrían multiplicar<strong>la</strong>s. Tan sólo varieda<strong>de</strong>s como<br />
Caesar, Gorbea, Romano, Or<strong>la</strong>, Cabaret y Zorba tienen vigente <strong>la</strong> obtención. Zorba y Gorbea<br />
son <strong>de</strong> Neiker (País Vasco). Todas el<strong>la</strong>s tienen poca importancia en España. El resto son<br />
varieda<strong>de</strong>s libres <strong>de</strong> <strong>la</strong>s que Kennebec, Baraka y Jaer<strong>la</strong> ocupan el 71% <strong>de</strong> <strong>la</strong> superficie <strong>de</strong><br />
multiplicación. Actualmente se importan unas 88.000T. <strong>de</strong> patata <strong>de</strong> siembra. El 75% <strong>de</strong> <strong>la</strong>s<br />
80-90 varieda<strong>de</strong>s importadas son protegidas con el consiguiente coste <strong>de</strong>l pago <strong>de</strong> royalties,<br />
que suponen un coste añadido por el sector <strong>de</strong> patata <strong>de</strong> consumo.<br />
En APPACALE se han registrado cuatro varieda<strong>de</strong>s en los últimos tres años: Ne<strong>la</strong> y<br />
Jimena (2.006) y Valnera y Melibea (2.008) y tienen protección durante 25 años en España y<br />
30 en <strong>la</strong> Unión Europea. En el caso <strong>de</strong> <strong>la</strong>s dos últimas <strong>la</strong> protección europea está en trámite.<br />
Hay otros dos clones en trámite <strong>de</strong> registro para 2.010 (99P41-6) y para 2.011 (2000P4-6).<br />
La oferta <strong>de</strong> nuevas varieda<strong>de</strong>s por sus socios pue<strong>de</strong> reducir <strong>la</strong> <strong>de</strong>pen<strong>de</strong>ncia exterior,<br />
conseguir cierto abastecimiento varietal y mejorar <strong>la</strong> competitividad mediante <strong>la</strong> consecución<br />
<strong>de</strong> valor añadido. La producción total (Kgrs.) <strong>de</strong> <strong>la</strong>s varieda<strong>de</strong>s obtenidas y <strong>la</strong>s previsiones <strong>de</strong><br />
futuro se muestran en <strong>la</strong> tab<strong>la</strong> 14.1.<br />
TABLA 14.1: CANTIDAD PRODUCIDA DE LAS VARIEDADES OBTENIDAS POR APPACALE Y SOCIOS. EN Kg.<br />
AÑO NELA JIMENA FINA DE GREDOS VALNERA MELIBEA 99P41-6<br />
2.005 1.100 950 - - - -<br />
2.006 9.440 8.030 122 - - -<br />
2.007 75.395 70.940 190 193 43 -<br />
2.008 110.885 57.825 150 1.400 600 112<br />
2.009* 176.400 38.310 850 6.250 4.300 540<br />
2.010* 210.000 40.000 900 42.000 25.000 3.500<br />
2.011* 250.000 45.000 1.000 60.000 35.000 15.000<br />
* Previsión.<br />
14.4.4 EL PROGRAMA DE MEJORA<br />
El objetivo es <strong>la</strong> obtención <strong>de</strong> nuevas varieda<strong>de</strong>s <strong>de</strong> patata, adaptadas a <strong>la</strong>s condiciones<br />
ecoclimáticas <strong>de</strong> Castil<strong>la</strong> y León y competitivas en los mercados existentes y <strong>de</strong>ntro <strong>de</strong><br />
231
sistemas <strong>de</strong> producción sostenibles. El programa <strong>de</strong> selección se realiza consi<strong>de</strong>rando los<br />
siguientes criterios:<br />
- Aptitud para los mercados existentes: consumo fresco y transformación industrial<br />
(chip, prefrita conge<strong>la</strong>da, IV y V gama, tortil<strong>la</strong>…).<br />
- Sistemas <strong>de</strong> producción y cultivo: Resistencia a p<strong>la</strong>gas y enfermeda<strong>de</strong>s y adaptación a<br />
factores edafoclimáticos.<br />
- Calidad culinaria diferenciada<br />
- Manejo y conservación <strong>de</strong>l cultivo: posibilidad <strong>de</strong> <strong>la</strong>vado o cepil<strong>la</strong>do; resistencia a<br />
daños, golpes, etc; conservación<br />
- Nuevos nichos <strong>de</strong> mercado<br />
14.4.5 ACTIVIDADES DE BIOTECNOLOGÍA<br />
El objetivo <strong>de</strong> <strong>la</strong> implementación <strong>de</strong> <strong>la</strong> biotecnología en el programa <strong>de</strong> mejora es,<br />
fundamentalmente, dar apoyo a <strong>la</strong> mejora clásica. Más en <strong>de</strong>talle <strong>la</strong>s activida<strong>de</strong>s podrían<br />
resumirse <strong>de</strong>l siguiente modo:<br />
Programa <strong>de</strong> mejora en el nivel diploi<strong>de</strong>. El objetivo <strong>de</strong> esta parte se fundamenta en que<br />
trabajar con material diploi<strong>de</strong> es más sencillo que con el tetraploi<strong>de</strong>, por lo que pue<strong>de</strong><br />
facilitar <strong>la</strong> transmisión <strong>de</strong> caracteres <strong>de</strong> interés. Esto permite utilizar genes <strong>de</strong> interés<br />
presentes en especies silvestres e incluirlos más fácilmente en el programa <strong>de</strong> mejora.<br />
Hibridación somática (fusión <strong>de</strong> protop<strong>la</strong>stos). Hace posible <strong>la</strong> creación <strong>de</strong> genotipos<br />
tetraploi<strong>de</strong>s a partir <strong>de</strong> individuos diploi<strong>de</strong>s. Esto correspon<strong>de</strong> al último paso <strong>de</strong>l programa <strong>de</strong><br />
mejora en el nivel diploi<strong>de</strong>.<br />
I<strong>de</strong>ntificación <strong>de</strong> varieda<strong>de</strong>s mediante marcadores molecu<strong>la</strong>res. Esta tarea se hace mediante<br />
marcadores <strong>de</strong> tipo microsatélite, y se utiliza para caracterizar <strong>la</strong> varieda<strong>de</strong>s y verificar <strong>la</strong><br />
i<strong>de</strong>ntidad los cultivares en <strong>la</strong> producción <strong>de</strong> semil<strong>la</strong> prebase y base.<br />
I<strong>de</strong>ntificación <strong>de</strong> resistencias mediante marcadores molecu<strong>la</strong>res. Permite <strong>la</strong> i<strong>de</strong>ntificación<br />
precoz <strong>de</strong> <strong>de</strong>terminados genes <strong>de</strong> resistencia a enfermeda<strong>de</strong>s sin <strong>la</strong> necesidad <strong>de</strong> tener que<br />
realizar bioensayos <strong>de</strong> inocu<strong>la</strong>ción.<br />
Mantenimiento <strong>de</strong> un banco <strong>de</strong> germop<strong>la</strong>sma. El banco <strong>de</strong> germop<strong>la</strong>sma es <strong>la</strong> materia prima<br />
<strong>de</strong>l p<strong>la</strong>n <strong>de</strong> mejora por lo que es fundamental un a<strong>de</strong>cuado mantenimiento. Las ventajas que<br />
232
aporta son: <strong>la</strong> multiplicación <strong>de</strong> genotipos <strong>de</strong> forma continua, el almacenamiento en espacio<br />
reducido y el saneamiento <strong>de</strong> los genotipos mediante termoterapia y cultivo <strong>de</strong> meristemos.<br />
Análisis <strong>de</strong> virosis mediante test ELISA. Esta herramienta se emplea para <strong>la</strong> <strong>de</strong>terminación <strong>de</strong><br />
los principales virus que afectan al cultivo <strong>de</strong> <strong>la</strong> patata (PVY, PLRV, PVX, PVA, PVM, PVS),<br />
tanto a partir <strong>de</strong> tubérculo como <strong>de</strong> hoja.<br />
14.4.6. PROYECTOS COMPLEMENTARIOS DE I+D<br />
Actualmente los proyectos en curso son los siguientes:<br />
- BIOEXPLOIT<br />
Objetivo: Búsqueda <strong>de</strong> nuevas fuentes <strong>de</strong> resistencia a Phytophthora infestans (mildiu,<br />
tizón tardío) explotando <strong>la</strong> biodiversidad <strong>de</strong> <strong>la</strong>s p<strong>la</strong>ntas y <strong>de</strong>sarrollo <strong>de</strong> marcadores<br />
molecu<strong>la</strong>res que i<strong>de</strong>ntifiquen <strong>la</strong> presencia <strong>de</strong> estas resistencias<br />
- TORRES QUEVEDO: Incorporación <strong>de</strong> resistencia a mildiu y nematodos <strong>de</strong> agal<strong>la</strong>s en<br />
patata asistida por marcadores molecu<strong>la</strong>res <strong>de</strong> ADN.<br />
Asimismo hay otro proyecto concedido que comenzará en <strong>2010</strong>. Éste es el siguiente:<br />
- Proyecto KBBE-QUEST: Obtención <strong>de</strong> almidón <strong>de</strong> calidad mediante <strong>la</strong> explotación <strong>de</strong><br />
nuevas herramientas <strong>de</strong> mejora genética en So<strong>la</strong>num tuberosum.<br />
Objetivo: Obtener clones <strong>de</strong> mejora con contenidos y tipos <strong>de</strong> almidón a<strong>de</strong>cuados y<br />
mejorados para distintas transformaciones industriales. El almidón <strong>de</strong> patata es un<br />
producto ampliamente usado en procesos industriales como <strong>la</strong> producción <strong>de</strong> papel,<br />
pegamentos, materiales <strong>de</strong> construcción, plásticos y medicamentos. El almidón<br />
obtenido <strong>de</strong> patata es especialmente apreciado por <strong>la</strong> industria <strong>de</strong>bido a su bajo<br />
contenido en proteínas y grasa. El almidón es una molécu<strong>la</strong> que se compone <strong>de</strong> dos<br />
carbohidratos, amilosa y amilopectina. La modificación en <strong>la</strong> proporción <strong>de</strong> estos<br />
compuestos y sus grados <strong>de</strong> ramificación conduce a <strong>la</strong> formación <strong>de</strong> almidones con<br />
diferentes características fisicoquímicas, con diferentes aplicaciones industriales.<br />
Por otra parte hay un proyecto concedido que se encuentra en fase <strong>de</strong> revisión:<br />
- Desarrollo <strong>de</strong> marcadores <strong>de</strong> ADN para <strong>la</strong> selección precoz al endulzamiento en frío<br />
(Programa TRACE)<br />
Continuación <strong>de</strong>l proyecto PROFIT comenzado en 2007 en co<strong>la</strong>boración con el CNB-CSIC y<br />
el ITACyL. El objetivo es <strong>de</strong>sarrol<strong>la</strong>r marcadores molecu<strong>la</strong>res para <strong>de</strong>tectar <strong>la</strong><br />
233
capacidad <strong>de</strong> almacenar los clones <strong>de</strong>stinados a transformación industrial a 4ºC sin<br />
que acumulen azúcares reductores.<br />
Finalmente se indican <strong>la</strong>s co<strong>la</strong>boraciones en curso:<br />
Se está realizando una co<strong>la</strong>boración para <strong>la</strong> caracterización molecu<strong>la</strong>r y organoléptica <strong>de</strong> <strong>la</strong>s<br />
varieda<strong>de</strong>s <strong>de</strong> APPACALE y otras varieda<strong>de</strong>s ampliamente cultivadas en Castil<strong>la</strong> y León, entre<br />
el ITACyL (<strong>P<strong>la</strong>n</strong>ta Piloto <strong>de</strong> Productos Transformados) y APPACALE.<br />
234
15 COMPOSICIÓN QUÍMICA Y VALOR NUTRITIVO DE LA PATATA<br />
El año 2008 fue <strong>de</strong>c<strong>la</strong>rado por <strong>la</strong> ONU el “Año Internacional <strong>de</strong> <strong>la</strong> <strong>Patata</strong>”, con el fin <strong>de</strong><br />
alertar sobre su importante papel en cuestiones <strong>de</strong> malnutrición y pobreza. La intención <strong>de</strong><br />
esta organización fue sensibilizar al público sobre <strong>la</strong> función <strong>de</strong> este alimento básico, y <strong>de</strong> <strong>la</strong><br />
agricultura en general, a<strong>de</strong>más <strong>de</strong> afrontar cuestiones como <strong>la</strong> <strong>de</strong>snutrición, <strong>la</strong> pobreza y los<br />
peligros que corre el medio ambiente. La patata es un alimento que previene que millones <strong>de</strong><br />
personas en países <strong>de</strong>l tercer mundo se mueran <strong>de</strong> hambre cada año, con unas características<br />
excelentes para <strong>la</strong> alimentación humana y, <strong>de</strong>sgraciadamente, poco conocidas.<br />
Consi<strong>de</strong>rando que <strong>la</strong> patata es el cuarto cultivo mundial, por <strong>de</strong>trás <strong>de</strong>l maíz, el trigo y el<br />
arroz, y <strong>la</strong> gran importancia que juega en <strong>la</strong> alimentación <strong>de</strong> <strong>la</strong> humanidad, es fundamental<br />
incluir <strong>de</strong>ntro <strong>de</strong>l presente <strong>P<strong>la</strong>n</strong> un capítulo que hable <strong>de</strong> <strong>la</strong> patata <strong>de</strong>s<strong>de</strong> un punto <strong>de</strong> vista<br />
nutricional.<br />
15.1 LA PATATA: RIQUEZA IGNORADA.<br />
A gran<strong>de</strong>s rasgos se pue<strong>de</strong> <strong>de</strong>stacar que <strong>la</strong> patata es rica en carbohidratos complejos<br />
(almidón), proporciona fibra, vitaminas (B1, B2, B3, B6 y C), hierro, potasio y es baja en<br />
calorías. La patata contiene un elevado porcentaje <strong>de</strong> agua (77%). Las varieda<strong>de</strong>s <strong>de</strong> patata<br />
<strong>de</strong> carne amaril<strong>la</strong> (Monalisa, Caesar, Agria, etc) tienen mayor contenido en pro-vitamina A<br />
que <strong>la</strong> <strong>de</strong> carne b<strong>la</strong>nca (Frisia, Accord, Kennebec, etc). Su contenido en proteínas es <strong>de</strong> 2<br />
gramos por cada 100 gramos <strong>de</strong> patata, y tiene una cantidad muy baja <strong>de</strong> grasa con una<br />
media <strong>de</strong> 0,1 gramos por cada 100 gramos <strong>de</strong> patata, haciendo <strong>de</strong> el<strong>la</strong> un alimento muy<br />
recomendable para dietas <strong>de</strong> bajo contenido calórico y grasa. A modo informativo se pue<strong>de</strong><br />
<strong>de</strong>stacar que una ración <strong>de</strong> 300 g <strong>de</strong> patatas cocidas contiene:<br />
- 5 g <strong>de</strong> fibra, 1/6 <strong>de</strong> <strong>la</strong> cantidad diaria recomendada,<br />
- ¼ <strong>de</strong> <strong>la</strong> ingesta diaria recomendada <strong>de</strong> vitamina C<br />
- 30% <strong>de</strong> <strong>la</strong> cantidad diaria recomendada <strong>de</strong> Vitamina B6, y el 26% <strong>de</strong> <strong>la</strong> cantidad<br />
diaria recomendada <strong>de</strong> Vitamina B3.<br />
- 38% <strong>de</strong> <strong>la</strong> cantidad diaria recomendada <strong>de</strong> potasio y el 10% <strong>de</strong> <strong>la</strong> cantidad diaria<br />
recomendada <strong>de</strong> hierro.<br />
Una <strong>de</strong> <strong>la</strong>s diferencias más <strong>de</strong>stacables entre <strong>la</strong>s varieda<strong>de</strong>s <strong>de</strong> patata nueva y vieja es que <strong>la</strong>s<br />
primeras contienen más agua, y por lo tanto menos materia seca, por lo que su contenido <strong>de</strong><br />
almidón es menor, así como su aporte <strong>de</strong> calorías.<br />
235
En España en general, y en Castil<strong>la</strong> y León en particu<strong>la</strong>r, se siembran actualmente una gran<br />
calidad <strong>de</strong> varieda<strong>de</strong>s <strong>de</strong> patata, con diferentes especificaciones, lo que hace que se puedan<br />
realizar multitud <strong>de</strong> preparaciones culinarias. Esta diversidad es el principal atractivo <strong>de</strong> <strong>la</strong><br />
patata, ya que así se adapta muy bien a los gustos y expectativas <strong>de</strong> los consumidores y<br />
pue<strong>de</strong>n estar presentes en los menús <strong>de</strong> todos los días.<br />
15.2 COMPOSICIÓN QUÍMICA DE LA PATATA<br />
La composición química <strong>de</strong> este tubérculo varía sensiblemente en función <strong>de</strong> factores como<br />
<strong>la</strong> variedad, <strong>la</strong>s condiciones climáticas, el tipo <strong>de</strong> suelo y <strong>la</strong>s prácticas <strong>de</strong> cultivo (abonado,<br />
riegos, <strong>de</strong>nsidad <strong>de</strong> p<strong>la</strong>ntación, condiciones <strong>de</strong> conservación, etc). Por lo tanto los valores<br />
que se darán más a<strong>de</strong><strong>la</strong>nte tienen que consi<strong>de</strong>rarse como re<strong>la</strong>tivos. En <strong>la</strong> tab<strong>la</strong> 15.1 se<br />
muestra <strong>la</strong> composición química <strong>de</strong> <strong>la</strong> patata.<br />
TABLA 15.1: COMPOSICIÓN QUÍMICA Y VALOR NUTRICIONAL DE 100 GRAMOS DE PATATA COCIDA.<br />
Sin pe<strong>la</strong>r<br />
Pe<strong>la</strong>da<br />
Valor calórico (Kcal) 85 85<br />
(Kj) 20 20<br />
Agua % 78 78<br />
Glúcidos g 19 19<br />
Fibras g 2,5 1,5<br />
Lípidos g 0,1 0,1<br />
Proteínas g 2 2<br />
Vitaminas<br />
B1 mg 0,09 0,08<br />
B2 mg 0,03 0,03<br />
B3 mg 1,5 1,2<br />
B6 mg 0,2 0,18<br />
B9 mg 0,01 0,01<br />
C mg 13 9<br />
Minerales<br />
Potasio mg 564 376<br />
Magnesio mg 27 18,6<br />
Hierro mg 0,8 0,4<br />
Manganeso mg 0,25 0,14<br />
Cobre mg 0,19 0,09<br />
Cromo mg 0,02<br />
Zinc mg 0,41 0,28<br />
Fuente: CNIPT.<br />
La patata posee un valor calórico ligero, con unas 85 kcal por cada 100 g <strong>de</strong> patata cocida.<br />
Consi<strong>de</strong>rando este hecho, es evi<strong>de</strong>nte que no hay ninguna razón para excluir <strong>la</strong> patata <strong>de</strong> una<br />
236
dieta baja en calorías. En otras preparaciones, como puré o gratinadas, será un producto más<br />
calórico, pero <strong>de</strong>ntro <strong>de</strong> unos límites aceptables (94 y 100 kcal por cada 100 gr). Sin embargo,<br />
cuando <strong>la</strong>s patatas se preparan fritas, no se <strong>de</strong>be abusar <strong>de</strong> su consumo ya que su aportación<br />
calórica es mayor. Por ejemplo, <strong>la</strong>s patatas fritas en barritas o sticks tienen 274 kcal por cada<br />
100 g, y <strong>la</strong>s chips 568 kcal por cada 100 g.<br />
15.3 CALIDAD NUTRITIVA<br />
La patata, es uno <strong>de</strong> los alimentos básicos <strong>de</strong> nuestra alimentación ya que es una fuente<br />
importante <strong>de</strong> nutrientes y tiene una gran versatilidad culinaria. Es un ingrediente<br />
imprescindible para una alimentación equilibrada, y está situada en <strong>la</strong> base <strong>de</strong> <strong>la</strong> pirámi<strong>de</strong><br />
alimentaria (ver gráfico 15.1), por lo que se pue<strong>de</strong> consumir diariamente. A<strong>de</strong>más es un<br />
producto <strong>de</strong>l que se pue<strong>de</strong> <strong>de</strong>cir que “gusta a todo el mundo”.<br />
GRÁFICO 15.1. PIRÁMIDE DE LA ALIMENTACIÓN SALUDABLE.<br />
Fuente: Sociedad Españo<strong>la</strong> <strong>de</strong> Nutrición Comunitaria.<br />
Consi<strong>de</strong>rando los productos presentes en <strong>la</strong> base <strong>de</strong> <strong>la</strong> pirámi<strong>de</strong> nutricional mostrada<br />
anteriormente, nos encontramos con que aquí se encuentran <strong>la</strong> pasta, el pan, el arroz y <strong>la</strong>s<br />
237
patatas. Se recomienda ingerir diariamente entre 4 y 6 raciones <strong>de</strong> estos alimentos. En el<br />
caso <strong>de</strong> patata cada ración correspon<strong>de</strong> a una patata gran<strong>de</strong> o 2 pequeñas (unos 150-200 gr).<br />
Para pasta y arroz se recomienda una ingesta <strong>de</strong> 60-80 gr por ración, y en caso <strong>de</strong> pan entre<br />
40-60 gr por ración.<br />
Para una mejor digestibilidad <strong>de</strong> este tubérculo, se <strong>de</strong>be cocinar con su piel en agua o al<br />
vapor, unos 20 a 25 minutos. Es importante <strong>de</strong>stacar que el pe<strong>la</strong>do elimina algunas <strong>de</strong> <strong>la</strong>s<br />
vitaminas y minerales. A<strong>de</strong>más, <strong>la</strong> cocción prolongada a altas temperaturas aumenta el índice<br />
glucémico <strong>de</strong> los productos. Este incremento implica una rápida liberación <strong>de</strong> azúcares<br />
simples, y por lo tanto un mayor aumento <strong>de</strong> <strong>la</strong> glucosa en sangre <strong>de</strong>spués <strong>de</strong> <strong>la</strong> digestión. En<br />
el caso <strong>de</strong> <strong>la</strong>s patatas fritas en barritas o chips, éstas absorben una cantidad importante <strong>de</strong><br />
aceite que multiplica por 3 ó 4 su valor calórico inicial. La mejor manera <strong>de</strong> aprovechar <strong>la</strong>s<br />
ventajas <strong>de</strong> <strong>la</strong> patata es tomar<strong>la</strong> cocida o al horno con su piel.<br />
“Que consumir patatas engorda es un falso mito en el que coinci<strong>de</strong>n los especialistas en<br />
nutrición”. El error radica en que en <strong>la</strong> mayoría <strong>de</strong> <strong>la</strong>s ocasiones se asocia su consumo con<br />
frituras o guisos, a veces excesivamente e<strong>la</strong>borados y calóricos, lo que hace que <strong>la</strong>s calorías<br />
se multipliquen.<br />
Los expertos en Nutrición recomiendan su consumo a diario; junto con verduras,<br />
ensa<strong>la</strong>das, legumbres y purés como primer p<strong>la</strong>to. También se pue<strong>de</strong>n emplear como<br />
guarnición <strong>de</strong> los segundos, pero sin abusar <strong>de</strong>l consumo en frito, aumentando su ingesta<br />
cocinadas al vapor, al horno y en puré. De este modo se ingieren menos grasas, y por lo tanto<br />
menos calorías, y se mejora su digestión.<br />
La patata es una perfecta aliada en <strong>la</strong> prevención y tratamiento <strong>de</strong> <strong>de</strong>terminadas patologías,<br />
tales como <strong>la</strong> diabetes, <strong>la</strong> hipertensión arterial o, incluso, ciertos trastornos neurológicos. La<br />
patata es vista por estos expertos como algo más que un alimento, ya que existen estudios<br />
que <strong>la</strong> presentan como beneficiosa para el sistema inmunológico y el cardiovascu<strong>la</strong>r por su<br />
riqueza en hidratos <strong>de</strong> carbono complejos, su mínimo contenido en grasas y su bajo aporte<br />
calórico.<br />
Continuando con su importancia en los estados <strong>de</strong> salud hay que seña<strong>la</strong>r que <strong>la</strong> patata, por su<br />
contenido en hidratos <strong>de</strong> carbono complejos, tiene un efecto protector frente a <strong>la</strong>s<br />
enfermeda<strong>de</strong>s cardiovascu<strong>la</strong>res. El aumento <strong>de</strong>l consumo <strong>de</strong> alimentos ricos en este tipo <strong>de</strong><br />
hidratos <strong>de</strong> carbono, fibra y vitaminas, hace que el organismo los asimile más lentamente,<br />
proporcionando unos niveles <strong>de</strong> glucosa en sangre estables.<br />
Las recomendaciones nutricionales para <strong>la</strong> pob<strong>la</strong>ción españo<strong>la</strong> sugieren un aporte mínimo <strong>de</strong><br />
fibra <strong>de</strong> 30 gramos al día. Una ración <strong>de</strong> 300 gramos <strong>de</strong> patata contribuye a cubrir un 15-17<br />
238
por ciento <strong>de</strong> <strong>la</strong>s necesida<strong>de</strong>s diarias. Si <strong>la</strong> patata se consume con piel, su aporte <strong>de</strong> fibra<br />
aumenta al 25 por ciento para <strong>la</strong> misma cantidad.<br />
Un producto rico en vitaminas y minerales<br />
Estos compuestos se concentran en <strong>la</strong> piel <strong>de</strong> <strong>la</strong>s patatas y son muy sensibles a <strong>la</strong> exfoliación,<br />
especialmente si se realiza antes <strong>de</strong> cocinar, porque esto ayuda a que migren más fácilmente<br />
al medio <strong>de</strong> cocción. Los elementos cuyo contenido se reduce tras el pe<strong>la</strong>do y posterior<br />
cocinado son <strong>la</strong> vitamina C, el potasio, el magnesio y el hierro. Destaca <strong>la</strong> cantidad existente<br />
en vitamina C, que es un potente antioxidante y un agente anti-envejecimiento celu<strong>la</strong>r que<br />
actúa neutralizando los radicales libres responsables <strong>de</strong>l <strong>de</strong>terioro <strong>de</strong> los tejidos. También<br />
participa en <strong>la</strong> síntesis <strong>de</strong> colágeno y aminoácidos, y está implicada en el metabolismo <strong>de</strong> <strong>la</strong><br />
glucosa. Está presente en cantida<strong>de</strong>s aproximadas <strong>de</strong> 13 mg por 100 gr. En <strong>la</strong> dieta occi<strong>de</strong>ntal<br />
<strong>la</strong> patata es uno <strong>de</strong> los alimentos que más vitamina C aporta al organismo <strong>de</strong>bido a su alto<br />
consumo. Para conservar al máximo esta vitamina se recomienda cocer <strong>la</strong>s patatas con <strong>la</strong><br />
piel. La vitamina C es sensible al calor y en <strong>la</strong> cocción se pue<strong>de</strong> per<strong>de</strong>r hasta un 40 por ciento<br />
<strong>de</strong> esta vitamina. A<strong>de</strong>más, <strong>la</strong> presencia <strong>de</strong> vitamina C ayuda a aprovechar al máximo el hierro<br />
<strong>de</strong> <strong>la</strong> patata.<br />
En lo referente a minerales, <strong>la</strong> patata <strong>de</strong>staca por su contenido en potasio y magnesio. La<br />
patata es una fuente importante <strong>de</strong> potasio (564 mg por 100 gramos), que juega un papel<br />
esencial en <strong>la</strong> contracción muscu<strong>la</strong>r, en el buen estado <strong>de</strong> <strong>la</strong> piel y en el correcto<br />
funcionamiento cardiaco. Aporta también magnesio, que es un importante constituyente <strong>de</strong><br />
los huesos, y a<strong>de</strong>más actúa como activador enzimático. Asimismo, cuenta con otros minerales<br />
imprescindibles en <strong>la</strong> dieta como son el hierro, el zinc, el cobre, el fósforo y el azufre. Todos<br />
estos minerales actúan como catalizadores en el organismo. La presencia <strong>de</strong> todos estos<br />
minerales no es homogénea, siendo mayor su presencia bajo <strong>la</strong> piel.<br />
239
240
16 ANÁLISIS DEL SECTOR: DAFO<br />
Se ha realizado un estudio, analizando los puntos fuertes y débiles <strong>de</strong>l sector, <strong>la</strong>s<br />
oportunida<strong>de</strong>s y amenazas <strong>de</strong>l entorno; en función <strong>de</strong> <strong>la</strong>s conclusiones obtenidas a través <strong>de</strong>l<br />
análisis o diagnostico <strong>de</strong> <strong>la</strong> situación <strong>de</strong>l sector, <strong>la</strong>s encuestas llevadas a cabo, etc.… a partir<br />
<strong>de</strong>l cual se p<strong>la</strong>ntearán los objetivos estratégicos y <strong>la</strong>s posibles líneas <strong>de</strong> actuación.<br />
DIAGNÓSTICO DE LA SITUACIÓN ACTUAL<br />
OBJETIVOS<br />
LÍNEAS DE ACTUACIÓN<br />
241
DEBILIDADES<br />
AMENAZAS<br />
D1.- Escaso grado <strong>de</strong> asociacionismo prevaleciendo siempre intereses<br />
particu<strong>la</strong>res.<br />
PRODUCCIÓN<br />
D2.- Falta <strong>de</strong> adaptación <strong>de</strong> varieda<strong>de</strong>s a <strong>la</strong>s zonas <strong>de</strong> cultivo. No hay selección<br />
<strong>de</strong> parce<strong>la</strong>s aptas para el cultivo.<br />
D3.- Las explotaciones tienen costes fijos elevados.<br />
D4.- Falta <strong>de</strong> p<strong>la</strong>nificación en <strong>la</strong> siembras tanto en fechas como en varieda<strong>de</strong>s.<br />
D5.- Falta <strong>de</strong> medios mecánicos e infraestructuras para <strong>la</strong> recolección <strong>de</strong> toda<br />
<strong>la</strong> producción en el momento óptimo <strong>de</strong>l ciclo <strong>de</strong>l cultivo.<br />
D6.- Poco seguimiento <strong>de</strong> los cua<strong>de</strong>rnos <strong>de</strong> campo, por lo que no hay o es muy<br />
limitado el seguimiento técnico <strong>de</strong>l cultivo en lo referente a irrigación,<br />
fertilización, tratamientos fitosanitarios, recolección etc. A<strong>de</strong>más, ello implica<br />
un escaso o nulo control <strong>de</strong> los costes <strong>de</strong> producción.<br />
D7.- No hay una gran imp<strong>la</strong>ntación <strong>de</strong> protocolos <strong>de</strong> producción ni <strong>de</strong><br />
certificaciones <strong>de</strong> los mismos (Producción Integrada, Global GAP, etc.)<br />
D8.-Escaso cuidado en <strong>la</strong> recolección <strong>de</strong>l producto y su posterior manipu<strong>la</strong>ción.<br />
No hay concepto <strong>de</strong> <strong>la</strong> patata como un producto <strong>de</strong> calidad.<br />
D9.-Escaso interés en celebrar contratos y p<strong>la</strong>nificar <strong>la</strong>s producciones por parte<br />
<strong>de</strong>l productor y <strong>de</strong> los operadores.<br />
D10.-Débil conocimiento técnico <strong>de</strong> <strong>la</strong>s principales p<strong>la</strong>gas y enfermeda<strong>de</strong>s <strong>de</strong>l<br />
cultivo.<br />
D11.-Incremento <strong>de</strong> los costes <strong>de</strong> energía, transporte y fertilizantes.<br />
D12.-No hay una asociación interprofesional que agrupe a todos los agentes<br />
implicados.<br />
D13.-No hay estándar <strong>de</strong> calidad en <strong>la</strong> producción.<br />
D14.-Falta <strong>de</strong> garantía jurídica ante el incumplimiento <strong>de</strong> los contratos<br />
A1.- Poca o nu<strong>la</strong> estructuración <strong>de</strong>l sector en todos sus es<strong>la</strong>bones.<br />
A2.- La continuidad <strong>de</strong> subvenciones a <strong>de</strong>terminadas agrupaciones y<br />
empresas.<br />
PRODUCCIÓN<br />
A3.- Escaso relevo generacional en el sector productor.<br />
A4.- Con <strong>la</strong> reforma <strong>de</strong>l mercado <strong>de</strong>l azúcar es posible que se incremente el<br />
número <strong>de</strong> productores.<br />
A5.- Hay que adaptar y mejorar los procesos en <strong>la</strong> producción y<br />
transformación <strong>de</strong> patatas para a<strong>de</strong>cuarse a <strong>la</strong>s normativas cada vez más<br />
estrictas en materia <strong>de</strong> calidad, medio ambiente y seguridad alimentaria.<br />
A6.- Escasa mentalidad empresarial por parte <strong>de</strong> los agricultores.<br />
SEMILLA<br />
A7.- Desaparición <strong>de</strong> <strong>la</strong> patata <strong>de</strong> siembra regional.<br />
A8.- Introducción <strong>de</strong> nuevas enfermeda<strong>de</strong>s o <strong>de</strong> cepas más virulentas <strong>de</strong> <strong>la</strong>s<br />
ya existentes en patata <strong>de</strong> siembra importada si no se aumentan los controles<br />
sanitarios.<br />
COMERCIALIZACIÓN<br />
A9.- El sector pue<strong>de</strong> quedar en manos <strong>de</strong> países exportadores.<br />
A10.- Liberalización <strong>de</strong>l mercado y <strong>de</strong>sarrollo comercial <strong>de</strong> países <strong>de</strong> nueva<br />
incorporación a <strong>la</strong> U.E con costes <strong>de</strong> producción bajos y productos muy<br />
competitivos.<br />
A11.- Inestabilidad <strong>de</strong> los precios en <strong>la</strong>s sucesivas campañas.<br />
A12.- Aparición o importación <strong>de</strong> productos sustitutivos <strong>de</strong> <strong>la</strong> patata por <strong>la</strong><br />
baja calidad <strong>de</strong> <strong>la</strong> misma o por no adaptarse a <strong>la</strong>s necesida<strong>de</strong>s.<br />
242
DEBILIDADES<br />
SEMILLA<br />
D17.- No se adapta <strong>la</strong> producción <strong>de</strong> semil<strong>la</strong> <strong>de</strong> CyL a <strong>la</strong>s necesida<strong>de</strong>s reales <strong>de</strong>l<br />
mercado regional.<br />
D18.- No hay obtención <strong>de</strong> varieda<strong>de</strong>s que tengan buena imp<strong>la</strong>ntación entre los<br />
productores y operadores, con salida comercial.<br />
D19.-Depen<strong>de</strong>ncia <strong>de</strong> <strong>la</strong> semil<strong>la</strong> extranjera, tanto <strong>de</strong> nuevas varieda<strong>de</strong>s como<br />
<strong>de</strong> material libre, ya que en este último caso no se pue<strong>de</strong>n realizar el mismo<br />
número <strong>de</strong> multiplicaciones <strong>de</strong>l material base y pre-base como se hace en otros<br />
países<br />
D20.-Poca visión comercial <strong>de</strong> <strong>la</strong>s cooperativas y productores <strong>de</strong> patata <strong>de</strong><br />
siembra (calibres, varieda<strong>de</strong>s, post-venta…).<br />
D21.- Existen importantes problemas en el control sanitario en <strong>de</strong>stino y esto<br />
origina imp<strong>la</strong>ntación <strong>de</strong> nuevas enfermeda<strong>de</strong>s <strong>de</strong> <strong>la</strong> semil<strong>la</strong> importada.<br />
D22.-No se exigen los mismos criterios <strong>de</strong> calidad y sanidad para <strong>la</strong> semil<strong>la</strong><br />
producida en Castil<strong>la</strong> y León que para <strong>la</strong> importada.<br />
D23.-Poca competencia profesional en el cultivo y comercialización <strong>de</strong> <strong>la</strong><br />
patata <strong>de</strong> siembra.<br />
D24.- El marco regu<strong>la</strong>torio actual en patata <strong>de</strong> siembra no favorece <strong>la</strong><br />
profesionalización <strong>de</strong> los productores.<br />
D25.- Elevado coste <strong>de</strong> <strong>la</strong> semil<strong>la</strong> importada que implica aumento <strong>de</strong> los costes<br />
<strong>de</strong> producción.<br />
ALMACENAMIENTO E INFRAESTRUCTURAS<br />
D26.- Falta capacidad <strong>de</strong> almacenamiento.<br />
D27.- Poca utilización <strong>de</strong> <strong>la</strong>s estructuras <strong>de</strong> almacenamiento existentes.<br />
D28.- Falta <strong>de</strong> conocimiento <strong>de</strong> <strong>la</strong>s técnicas <strong>de</strong> conservación y <strong>de</strong>l<br />
comportamiento <strong>de</strong> <strong>la</strong>s varieda<strong>de</strong>s durante el periodo <strong>de</strong> almacenamiento.<br />
D29.- No hay medios en <strong>la</strong>s explotaciones para el acondicionamiento previo <strong>de</strong>l<br />
producto (eliminación <strong>de</strong> tierra, selección, calibrado…).<br />
CONSUMO<br />
D30.- Disminución <strong>de</strong>l consumo <strong>de</strong> patata fresca.<br />
D31.- Desconocimiento <strong>de</strong>l valor nutricional y beneficios <strong>de</strong> su consumo.<br />
D32.- Ma<strong>la</strong> imagen, se suele asociar a <strong>la</strong> patata como un producto muy calórico<br />
“que engorda”, ya que una parte muy importante <strong>de</strong>l consumo se hace frita.<br />
D33.-Se consi<strong>de</strong>ra como un producto básico y sin valor añadido.<br />
COMERCIALIZACIÓN<br />
D34.- La apetencia <strong>de</strong>l consumidor es por el aspecto <strong>de</strong> <strong>la</strong> patata (Calidad<br />
visual frente a Calidad culinaria) y no por el sabor <strong>de</strong> <strong>la</strong> misma.<br />
D35.- Concentración <strong>de</strong> <strong>la</strong> oferta en pocos meses.<br />
D36.-Laxos requisitos en el etiquetado.<br />
D37.- El sector productor no comercializa su producto directamente a <strong>la</strong><br />
distribución.<br />
D38.- No se aporta valor añadido al producto ya que se ven<strong>de</strong> directamente<br />
<strong>de</strong>s<strong>de</strong> <strong>la</strong> tierra por parte <strong>de</strong> los productores.<br />
D39.- El sistema cooperativista no posee una visión ni una misión comercial.<br />
D40.- Poca adaptación <strong>de</strong> los formatos y los productos a <strong>la</strong> estructura familiar y<br />
a los continuos cambios en los hábitos <strong>de</strong> consumo.<br />
D41.- Las Agrupaciones <strong>de</strong> Productores <strong>de</strong> <strong>Patata</strong> no son capaces <strong>de</strong> satisfacer<br />
<strong>la</strong>s <strong>de</strong>mandas <strong>de</strong> <strong>la</strong> gran distribución.<br />
D42.- Todavía hay agentes poco especializados y sin aportar valor al producto.<br />
D43.- Se comercializa mucho producto en formatos <strong>de</strong> poco valor añadido<br />
(sacos 25Kg. Sin <strong>la</strong>var, graneles…).<br />
D44.- Poca interre<strong>la</strong>ción entre los agentes <strong>de</strong> <strong>la</strong> ca<strong>de</strong>na <strong>de</strong> suministro<br />
I+D<br />
D45.- Se necesita una mayor obtención varietal en función <strong>de</strong> <strong>la</strong>s necesida<strong>de</strong>s<br />
<strong>de</strong>l mercado.<br />
D46.- Escasos proyectos biotecnológicos que permitan dotar <strong>de</strong> nuevos<br />
conocimientos o metodologías tanto en <strong>la</strong> mejora <strong>de</strong>l cultivo como <strong>de</strong>l<br />
almacenamiento.<br />
D47.- Escasez <strong>de</strong> personal investigador con formación específica en patata que<br />
pueda <strong>de</strong>sarrol<strong>la</strong>r proyectos específicos <strong>de</strong> I+D en este cultivo.<br />
D48.- Escasa implicación <strong>de</strong> <strong>la</strong> industria y <strong>de</strong>l sector productor con <strong>la</strong> I+D. No<br />
hay mentalidad <strong>de</strong> apoyo a <strong>la</strong> investigación ni se p<strong>la</strong>ntea los beneficios <strong>de</strong>l I+D.<br />
D49.-Existe una escasa visión <strong>de</strong> futuro e innovación por parte <strong>de</strong> los<br />
productores y operadores <strong>de</strong>l sector.<br />
D50.- Falta <strong>de</strong> material divulgativo sobre técnicas culturales y <strong>de</strong> conservación<br />
y acondicionado <strong>de</strong> <strong>la</strong> patata.<br />
D51.- Los <strong>P<strong>la</strong>n</strong>es <strong>de</strong> Experimentación Agraria no se hacen con empresas que<br />
puedan tener luego un <strong>de</strong>sarrollo comercial.<br />
MEDIO AMBIENTE Y DESARROLLO SOSTENIBLE<br />
D52.- No se contro<strong>la</strong> lo suficiente los medios <strong>de</strong> producción para hacer un uso<br />
racional <strong>de</strong> los recursos.<br />
243
FORTALEZAS<br />
OPORTUNIDADES<br />
PRODUCCIÓN<br />
F1.- No tenemos un mercado regu<strong>la</strong>do y no hay límites ni cupos en <strong>la</strong><br />
producción.<br />
F2.- Incremento <strong>de</strong> los rendimientos por hectárea en los últimos años.<br />
F3.- Campaña <strong>de</strong> producción <strong>la</strong>rga que permite tener posibilidad <strong>de</strong><br />
comercializar patatas durante un <strong>la</strong>rgo periodo <strong>de</strong> tiempo.<br />
F4.- Condiciones agro-climáticas a<strong>de</strong>cuadas para el cultivo, lo que implica un<br />
mejor estado sanitario que en otros países <strong>de</strong> Europa.<br />
F5.- Lí<strong>de</strong>res en producción <strong>de</strong> patata <strong>de</strong> consumo y <strong>de</strong> siembra a nivel nacional.<br />
Hay un gran potencial ya que <strong>la</strong> producción se mantiene re<strong>la</strong>tivamente estable<br />
en los últimos años y <strong>la</strong> Comunidad posee a<strong>de</strong>más una importante superficie<br />
para <strong>la</strong> producción <strong>de</strong> patata <strong>de</strong> siembra.<br />
F6.- La patata es una alternativa rentable <strong>de</strong>ntro <strong>de</strong> una rotación <strong>de</strong> cultivos <strong>de</strong><br />
regadío en Castil<strong>la</strong> y León.<br />
F7.- Gran tejido industrial para el producto tanto para <strong>la</strong> transformación como<br />
para el mercado en fresco.<br />
F8.- Disponibilidad <strong>de</strong> recursos hídricos, edafológicos y energéticos.<br />
F9.- Los rendimientos obtenidos en Castil<strong>la</strong> y León están cercanos a los <strong>de</strong> los<br />
mejores países <strong>de</strong> Europa.<br />
F10.- Los productores <strong>de</strong> patata son históricos, llevan varios años cultivando y<br />
conocen el cultivo.<br />
F11.- Los costes <strong>de</strong> producción no son altos, comparando otras CCAA y otros<br />
países <strong>de</strong> Europa.<br />
F12.- Existe superficie agraria disponible para aumentar <strong>la</strong> producción.<br />
SEMILLA<br />
F13.- Castil<strong>la</strong> y León produce el 70% <strong>de</strong> <strong>la</strong> patata <strong>de</strong> siembra <strong>de</strong> España.<br />
A<strong>de</strong>más esta semil<strong>la</strong> es <strong>de</strong> calidad y tiene precios competitivos.<br />
F14.- Los productores <strong>de</strong> patata <strong>de</strong> siembra conocen el cultivo perfectamente.<br />
F15.- Alta imp<strong>la</strong>ntación <strong>de</strong> <strong>la</strong> patata <strong>de</strong> siembra producida en Castil<strong>la</strong> y León en<br />
Comunida<strong>de</strong>s limítrofes como Galicia.<br />
PRODUCCIÓN<br />
O1.- Disminución <strong>de</strong> los costes <strong>de</strong> producción con <strong>la</strong> mejora <strong>de</strong> <strong>la</strong>s técnicas <strong>de</strong><br />
cultivo.<br />
O2.- Crear protocolos <strong>de</strong> producción propios bajo el amparo <strong>de</strong> <strong>la</strong> Figura <strong>de</strong><br />
Calidad “Tierra <strong>de</strong> Sabor”.<br />
O3.- Al menos el 20 % <strong>de</strong> <strong>la</strong> producción <strong>de</strong> patata se contrata.<br />
O4.- Desarrollo <strong>de</strong> nuevas técnicas o mo<strong>de</strong>los <strong>de</strong> conservación, producción etc.<br />
Aprovechando el conocimiento <strong>de</strong> profesionales que trabajen <strong>de</strong>ntro <strong>de</strong>l sector.<br />
O5.- Potenciar agricultura ecológica para varieda<strong>de</strong>s rústicas y autóctonas (Fina<br />
<strong>de</strong> Gredos,…)<br />
O6.- Potenciar <strong>la</strong> producción <strong>de</strong> patata <strong>de</strong> calidad para tener precios y<br />
rentabilidad asegurada.<br />
O7.- Desarrol<strong>la</strong>r <strong>la</strong> producción integrada como una alternativa válida para el<br />
control razonado <strong>de</strong> <strong>la</strong>s producciones<br />
SEMILLA<br />
O8.- Castil<strong>la</strong> y León podría autoabastecerse <strong>de</strong> patata <strong>de</strong> siembra a precios más<br />
competitivos que a los que se está actualmente comprando <strong>la</strong> <strong>de</strong> importación.<br />
O9.- El porcentaje <strong>de</strong> semil<strong>la</strong> empleada sin certificar (15% aprox.) es una<br />
oportunidad para los multiplicadores <strong>de</strong> aumentar su producción.<br />
COMERCIALIZACIÓN<br />
O10.- Insuficiente grado <strong>de</strong> inversión <strong>de</strong>l sector comercializador.<br />
O11.- Exportar patata <strong>de</strong> siembra (a<strong>de</strong>más <strong>de</strong> cubrir el mercado nacional) y<br />
captar nuevos nichos <strong>de</strong> mercado en otros países para aumentar el volumen <strong>de</strong><br />
exportación <strong>de</strong> patata <strong>de</strong> consumo.<br />
O12.- Utilización <strong>de</strong> nuevas tecnologías (comercio electrónico) para <strong>la</strong><br />
comercialización <strong>de</strong> los productos.<br />
O13.-Potencial crecimiento y/o captación <strong>de</strong> cuota <strong>de</strong> mercado en el segmento<br />
<strong>de</strong> patata <strong>de</strong> calidad.<br />
O14.-La entrada <strong>de</strong> nuevos operadores en el sector <strong>de</strong> patata <strong>de</strong> siembra, con<br />
nuevas técnicas comerciales, nuevos productos y nuevas metodologías <strong>de</strong><br />
gestión pue<strong>de</strong> ser un revulsivo para el resto <strong>de</strong> agentes <strong>de</strong>l sector.<br />
O15.- Ten<strong>de</strong>ncia <strong>de</strong> <strong>la</strong>s gran<strong>de</strong>s ca<strong>de</strong>nas <strong>de</strong> distribución a establecer re<strong>la</strong>ciones<br />
estables con los operadores en origen.<br />
244
FORTALEZAS<br />
OPORTUNIDADES<br />
ALMACENAMIENTO E INFRAESTRUCTURAS<br />
F16.- En los últimos tiempos están surgiendo iniciativas para crear más<br />
estructuras <strong>de</strong> almacenamiento.<br />
CONSUMO<br />
F17.- Producto <strong>de</strong> primera necesidad, <strong>de</strong> alta imp<strong>la</strong>ntación en los hogares y <strong>de</strong><br />
alta frecuencia <strong>de</strong> consumo.<br />
F18.- Des<strong>de</strong> el punto <strong>de</strong> vista <strong>de</strong> <strong>la</strong> nutrición es un producto saludable.<br />
Ingrediente fundamental <strong>de</strong> <strong>la</strong> dieta mediterránea.<br />
F19.- Producto económico, buena re<strong>la</strong>ción calidad-precio y por lo tanto<br />
asequible para todo tipo <strong>de</strong> consumidores.<br />
COMERCIALIZACIÓN<br />
F20.- Castil<strong>la</strong> y León tiene una buena posición logística cuando se consi<strong>de</strong>ran<br />
<strong>la</strong>s p<strong>la</strong>taformas <strong>de</strong> distribución y <strong>la</strong> Red <strong>de</strong> Mercas. Cercanía a países o regiones<br />
<strong>de</strong> gran consumo <strong>de</strong> patata como Portugal, Galicia, Asturias o Cantabria.<br />
I+D<br />
CONSUMO<br />
O16.- España no tiene en <strong>la</strong> actualidad capacidad <strong>de</strong> autoabastecerse <strong>de</strong><br />
patatas con lo cual hay posibilidad <strong>de</strong> crecimiento.<br />
O17.- Aumento <strong>de</strong> consumo <strong>de</strong> patatas transformadas (conge<strong>la</strong>das, chips, etc.).<br />
ALMACENAMIENTO E INFRAESTRUCTURAS<br />
O18.- Posibilidad <strong>de</strong> conservar patata y tener capacidad <strong>de</strong> suministro hasta los<br />
meses <strong>de</strong> abril o mayo.<br />
O19.- Utilización <strong>de</strong> Fondos para <strong>la</strong> mo<strong>de</strong>rnización e incorporación <strong>de</strong> jóvenes,<br />
así como p<strong>la</strong>nes <strong>de</strong> mejora en explotaciones.<br />
I +D<br />
O20.- Estudiar el cultivo <strong>de</strong> patata en nuevas líneas <strong>de</strong> negocio, como fuente<br />
productora <strong>de</strong> plásticos bio<strong>de</strong>gradables, producción <strong>de</strong> almidones etc.<br />
O21.- Ampliar y <strong>la</strong>nzar nuevas gamas <strong>de</strong> productos (IV Gama, p<strong>la</strong>tos preparados<br />
etc.).<br />
O22.- Hay medios técnicos y humanos con experiencia en investigación vegetal<br />
que podrían vincu<strong>la</strong>rse a este sector.<br />
F21.- En Castil<strong>la</strong> y León ya existe un centro que tiene experiencia en <strong>la</strong><br />
obtención <strong>de</strong> nuevas varieda<strong>de</strong>s (Appacale).<br />
245
246
17 PLAN DE ACTUACIÓN Y PROPUESTAS DE TRABAJO<br />
En base a <strong>la</strong> estructura <strong>de</strong>finida para <strong>la</strong> redacción <strong>de</strong>l presente <strong>P<strong>la</strong>n</strong> se han <strong>de</strong>terminado cinco<br />
ejes estratégicos sobre los que <strong>de</strong>finir <strong>la</strong>s próximas líneas <strong>de</strong> actuación:<br />
Agentes <strong>de</strong>l Sector.<br />
Producción<br />
Infraestructuras y Transformación<br />
Comercialización y Consumo<br />
I+D+i<br />
Dentro <strong>de</strong> los ejes estratégicos, se han establecido objetivos específicos como metas a<br />
alcanzar <strong>de</strong>ntro <strong>de</strong>l <strong>P<strong>la</strong>n</strong>; y para cada uno <strong>de</strong> los objetivos específicos se han <strong>de</strong>tal<strong>la</strong>do <strong>la</strong>s<br />
líneas <strong>de</strong> actuación o propuestas concretas para <strong>la</strong> consecución <strong>de</strong> cada uno <strong>de</strong> los objetivos<br />
marcados.<br />
Para <strong>la</strong> ejecución <strong>de</strong> <strong>la</strong>s actuaciones que se preten<strong>de</strong>n llevar a cabo, se ha consultado a todos<br />
los agentes <strong>de</strong>l sector como OPAs, cooperativas, almacenistas, industrias, distribución, etc.<br />
247
EJE ESTRATÉGICO 1:AGENTES DEL SECTOR<br />
OBJETIVO 1<br />
FOMENTAR LA COORDINACIÓN ENTRE LA PRODUCCIÓN AGRARIA, LOS ALMACENISTAS,<br />
LA INDUSTRIA DE TRANSFORMACIÓN Y LA DISTRIBUCIÓN.<br />
- Creación <strong>de</strong> <strong>la</strong> Mesa Regional <strong>de</strong> <strong>la</strong> <strong>Patata</strong> <strong>de</strong> Castil<strong>la</strong> y León.<br />
Líneas <strong>de</strong> actuación<br />
- Creación <strong>de</strong> una organización interprofesional para el sector <strong>de</strong> <strong>la</strong> patata.<br />
OBJETIVO 2<br />
COORDINACIÓN DE LAS ACTUACIONES ADMINISTRATIVAS EN EL SECTOR DE LA PATATA..<br />
Líneas <strong>de</strong> actuación<br />
- Mejora <strong>de</strong> <strong>la</strong> información estadística y documental <strong>de</strong>l sector <strong>de</strong> <strong>la</strong> patata.<br />
- Creación <strong>de</strong> un equipo <strong>de</strong> trabajo que aten<strong>de</strong>rá todas <strong>la</strong>s cuestiones que p<strong>la</strong>ntee el sector con el objetivo <strong>de</strong> su profesionalización.<br />
- Editar boletines informativos en el momento a<strong>de</strong>cuado <strong>de</strong> <strong>la</strong> siembra, cultivo, recolección, almacenaje,…<br />
- Intensificar los controles <strong>de</strong> calidad por parte <strong>de</strong> <strong>la</strong> administración para evitar frau<strong>de</strong>s en el etiquetado referentes a:<br />
1. Varieda<strong>de</strong>s.<br />
2. Proce<strong>de</strong>ncia <strong>de</strong>l tubérculo.<br />
3. La trazabilidad <strong>de</strong>l producto.<br />
4. Categoría y parámetros <strong>de</strong> calidad.<br />
5. Especificaciones culinarias.<br />
- Reestructuración <strong>de</strong> <strong>la</strong> actividad <strong>de</strong> APPACALE.<br />
248
OBJETIVO 1<br />
EJE ESTRATÉGICO 2: PRODUCCIÓN<br />
MEJORA DE LAS ESTRUCTURAS Y LA MODERNIZACIÓN DE LAS EXPLOTACIONES AGRARIAS.<br />
Líneas <strong>de</strong> actuación<br />
- Apoyo al relevo generacional a través <strong>de</strong> ayudas al cese anticipado y a <strong>la</strong> primera insta<strong>la</strong>ción.<br />
- Programa <strong>de</strong> formación para los productores <strong>de</strong> patata.<br />
- Creación <strong>de</strong> una herramienta informática <strong>de</strong> gestión para el sector productor.<br />
- Apoyo a <strong>la</strong> mejora tecnológica <strong>de</strong> <strong>la</strong>s explotaciones.<br />
- Creación <strong>de</strong> un Fondo <strong>de</strong> Compensación que permita garantizar <strong>la</strong>s rentas <strong>de</strong> los productores.<br />
OBJETIVO 2<br />
CERTIFICACIÓN DE LAS PRODUCCIONES PARA LOGRAR MAYOR VALOR AÑADIDO<br />
Líneas <strong>de</strong> actuación<br />
- Apoyo a <strong>la</strong> imp<strong>la</strong>ntación <strong>de</strong> sistemas <strong>de</strong> certificación para <strong>la</strong> producción.<br />
- Ayuda agroambiental a <strong>la</strong> producción integrada <strong>de</strong> patata en Castil<strong>la</strong> y León.<br />
- Ayuda a <strong>la</strong>s asociaciones que certifiquen patata en Producción Integrada<br />
OBJETIVO 3<br />
MEJORAR LA COMPETITIVIDAD DE LA PATATA DE SIEMBRA EN CASTILLA Y LEÓN<br />
Líneas <strong>de</strong> actuación<br />
- Intensificar los controles sanitarios sobre <strong>la</strong>s importaciones <strong>de</strong> patata <strong>de</strong> siembra penalizando el uso <strong>de</strong> aquel<strong>la</strong> que no sea certificada.<br />
- Modificar el reg<strong>la</strong>mento técnico <strong>de</strong> producción <strong>de</strong> patata <strong>de</strong> siembra orientado a una mejora <strong>de</strong> <strong>la</strong> calidad.<br />
- Estudios en campos <strong>de</strong> ensayo <strong>de</strong> post-control que permita comparar <strong>la</strong> calidad y sanidad <strong>de</strong> <strong>la</strong> semil<strong>la</strong> regional frente a <strong>la</strong> importada.<br />
249
EJE ESTRATÉGICO 3: CONTROL DE LA PRODUCCIÓN<br />
OBJETIVO 1<br />
ESTABLECER PLANES DE CONTROL Y MEJORA DE LAS PRODUCCIONES<br />
Líneas <strong>de</strong> actuación<br />
- Cumplimiento <strong>de</strong> <strong>la</strong> trazabilidad en <strong>la</strong>s explotaciones.<br />
- Buenas condiciones agrarias compatibles con el medio ambiente.<br />
- Mejora <strong>de</strong> <strong>la</strong>s condiciones <strong>de</strong>l arranque y manipu<strong>la</strong>ción.<br />
250
EJE ESTRATÉGICO 4: INFRAESTRUCTURAS Y TRANSFORMACIÓN<br />
OBJETIVO 1<br />
AUMENTAR Y MEJORAR LA CAPACIDAD DE CONSERVACIÓN DE PATATA EN CASTILLA Y LEÓN.<br />
Líneas <strong>de</strong> actuación<br />
- Ayudas a <strong>la</strong> inversión productiva en Industrias Agrarias, incrementando el porcentaje <strong>de</strong> ayuda en función <strong>de</strong>l nivel <strong>de</strong> contratos tipo homologados<br />
suscritos.<br />
- Programa <strong>de</strong> divulgación <strong>de</strong> <strong>la</strong>s técnicas más mo<strong>de</strong>rnas en almacenamiento y conservación <strong>de</strong> patata.<br />
- Fomentar <strong>la</strong> construcción <strong>de</strong> infraestructuras <strong>de</strong> almacenamiento.<br />
251
EJE ESTRATÉGICO 5: COMERCIALIZACIÓN Y CONSUMO<br />
OBJETIVO 1<br />
LOGRAR QUE EL SECTOR PRODUCTOR Y TRANSFORMADOR OBTENGAN UN PRECIO ACORDE A LOS COSTES DE PRODUCCIÓN.<br />
Líneas <strong>de</strong> actuación<br />
- Aprobar e impulsar el contrato tipo homologado para <strong>la</strong> patata en fresco en el seno <strong>de</strong> <strong>la</strong> Mesa Regional <strong>de</strong> <strong>la</strong> <strong>Patata</strong> <strong>de</strong> Castil<strong>la</strong> y León.<br />
- Promover los contratos entre los distintos operadores <strong>de</strong> <strong>la</strong> ca<strong>de</strong>na <strong>de</strong> suministro <strong>de</strong>l sector.<br />
OBJETIVO 2<br />
AUMENTAR EL VALOR AÑADIDO DE LAS PRODUCCIONES MEDIANTE LA PROMOCIÓN DE LA PATATA DE CALIDAD BAJO<br />
EL AMPARO DE LA MARCA TIERRA DE SABOR.<br />
Líneas <strong>de</strong> actuación<br />
- Conseguir que el consumidor i<strong>de</strong>ntifique <strong>la</strong> patata <strong>de</strong> Castil<strong>la</strong> y León.<br />
- Campañas <strong>de</strong> promoción específicas para <strong>la</strong> patata “Tierra <strong>de</strong> Sabor”.<br />
- Potenciar <strong>la</strong> adhesión <strong>de</strong> operadores a <strong>la</strong> marca “Tierra <strong>de</strong> Sabor”.<br />
OBJETIVO 3<br />
LOGRAR UNA EFICAZ ORIENTACIÓN AL MERCADO EN LA GESTIÓN DE LAS EMPRESAS.<br />
Líneas <strong>de</strong> actuación<br />
- Apoyo al asesoramiento externo para mejorar <strong>la</strong> comercialización y marketing <strong>de</strong> <strong>la</strong> patata.<br />
- E<strong>la</strong>borar y divulgar un estudio <strong>de</strong> mercado para evaluar el posicionamiento <strong>de</strong> <strong>la</strong> patata <strong>de</strong> Castil<strong>la</strong> y León en nuevos mercados y en otros usos.<br />
OBJETIVO 4<br />
AUMENTAR EL CONSUMO DE PATATA EN DIFERENTES ESTRATOS DE POBLACIÓN<br />
Líneas <strong>de</strong> actuación<br />
- Lanzamiento <strong>de</strong> campañas específicas a los diferentes estratos <strong>de</strong> consumidores.<br />
- Campaña <strong>de</strong> divulgación <strong>de</strong> <strong>la</strong>s cualida<strong>de</strong>s nutricionales <strong>de</strong> <strong>la</strong> patata.<br />
- Divulgar formas y cualida<strong>de</strong>s culinarias <strong>de</strong> <strong>la</strong> patata que sean saludables.<br />
- Diferenciar <strong>la</strong> aptitud culinaria y <strong>la</strong>s cualida<strong>de</strong>s <strong>de</strong> <strong>la</strong> patata <strong>de</strong> Castil<strong>la</strong> y León frente <strong>la</strong>s <strong>de</strong> otros países.<br />
252
OBJETIVO 1<br />
EJE ESTRATÉGICO 6: I + D + i<br />
COORDINAR LAS ACCIONES DE I+D+I ENTRE TODOS LOS AGENTES DEL SECTOR CON EL OBJETO DE ADECUAR<br />
LA INVESTIGACIÓN A LAS NECESIDADES.<br />
Líneas <strong>de</strong> actuación<br />
- Financiar proyectos <strong>de</strong> investigación en los que participen diferentes agentes <strong>de</strong>l sector:<br />
1. E<strong>la</strong>boración <strong>de</strong> un <strong>P<strong>la</strong>n</strong> <strong>de</strong> Experimentación Agraria (PEA) <strong>de</strong> patata representativo y en co<strong>la</strong>boración con el sector para conocer el<br />
comportamiento agronómico y cualitativo <strong>de</strong> <strong>la</strong>s varieda<strong>de</strong>s <strong>de</strong>mandadas por el mercado.<br />
2. Estudios en campos <strong>de</strong> ensayo que permitan conocer <strong>la</strong> mejor adaptación <strong>de</strong> varieda<strong>de</strong>s a tipo <strong>de</strong> suelo para conseguir los resultados más<br />
óptimos <strong>de</strong> producción<br />
3. Obtención <strong>de</strong> varieda<strong>de</strong>s adaptadas a <strong>la</strong>s características edafo-climáticas <strong>de</strong> Castil<strong>la</strong> y León y a <strong>la</strong>s <strong>de</strong>mandas <strong>de</strong>l mercado.<br />
4. Conservación y almacenamiento.<br />
5. Nuevas técnicas y procesos productivos.<br />
6. Desarrollo <strong>de</strong> nuevos productos.<br />
7. Investigación y evaluación sobre usos <strong>de</strong> <strong>la</strong> patata transgénica.<br />
- Implementación <strong>de</strong> proyectos <strong>de</strong> investigación para mejorar <strong>la</strong>s metodologías <strong>de</strong> diagnóstico y control <strong>de</strong> los patógenos <strong>de</strong> cuarentena y <strong>de</strong> calidad.<br />
- Desarrollo <strong>de</strong> marcadores genéticos para <strong>la</strong> i<strong>de</strong>ntificación <strong>de</strong> genes implicados en el metabolismo <strong>de</strong> los azúcares reductores durante <strong>la</strong><br />
conservación <strong>de</strong> tubérculos<br />
OBJETIVO 2<br />
FOMENTAR LA DIVULGACIÓN Y TRANSFERENCIA DE LOS RESULTADOS DE LA INVESTIGACIÓN.<br />
Líneas <strong>de</strong> actuación<br />
- Divulgación vía web <strong>de</strong> los resultados <strong>de</strong> los proyectos <strong>de</strong> investigación.<br />
- Fomentar canales <strong>de</strong> difusión y comunicación <strong>de</strong> <strong>la</strong> investigación a los agentes implicados (mesa <strong>de</strong> <strong>la</strong> patata, dossieres técnicos, revistas, visitas<br />
parce<strong>la</strong>s experimentales, jornadas específicas, seminarios etc.).<br />
OBJETIVO 3<br />
INCREMENTAR Y/O FORMAR PERSONAL CUALIFICADO PARA REALIZAR PROYECTOS DE INNOVACIÓN.<br />
Líneas <strong>de</strong> actuación<br />
- Apoyo a <strong>la</strong> formación <strong>de</strong> personal específico y cualificado para los proyectos a <strong>de</strong>sarrol<strong>la</strong>r.<br />
253
254
ANEXO I<br />
RESULTADOS ENCUESTA A LOS PRODUCTORES DE PATATA. NOVIEMBRE 2009<br />
1. UNIVERSO DE LA MUESTRA<br />
La encuesta se ha realizado en dos oleadas; una durante <strong>la</strong> segunda quincena <strong>de</strong> octubre a<br />
un total <strong>de</strong> 1.646 productores <strong>de</strong> patata <strong>de</strong> consumo <strong>de</strong>l total <strong>de</strong> 2.201 que cultivan más <strong>de</strong><br />
1,5 ha <strong>de</strong> superficie y otra durante <strong>la</strong> segunda quincena <strong>de</strong> noviembre a un total <strong>de</strong> 525<br />
productores <strong>de</strong> patata <strong>de</strong> consumo <strong>de</strong> los 781 que cultivan entre 0,5 y 1,5 ha.<br />
Total <strong>de</strong> encuestados: 2.171 cultivadores (72,8%) <strong>de</strong> un total <strong>de</strong> 2.982<br />
La distribución en <strong>la</strong> Comunidad Autónoma ha sido <strong>la</strong> siguiente:<br />
% SOBRE<br />
PROVINCIA NÚMERO TOTAL<br />
ENCUESTADOS<br />
ÁVILA 112 5,16%<br />
BURGOS 230 10,59%<br />
LEON 262 12,07%<br />
PALENCIA 99 4,56%<br />
SALAMANCA 528 24,32%<br />
SEGOVIA 187 8,61%<br />
SORIA 43 1,98%<br />
VALLADOLID 596 27,45%<br />
ZAMORA 114 5,25%<br />
TOTAL 2171 100,00%<br />
DISTRIBUCIÓN POR PROVINCIAS DE PRODUCTORES DE PATATA<br />
ENCUESTADOS<br />
30,00%<br />
25,00%<br />
20,00%<br />
15,00%<br />
10,00%<br />
5,00%<br />
0,00%<br />
AVILA<br />
5,16%<br />
10,59% 12,07% 4,56%<br />
BURGOS<br />
LEON<br />
PALENCIA<br />
SALAMANCA<br />
24,32%<br />
SEGOVIA<br />
8,61%<br />
SORIA<br />
1,98%<br />
VALLADOLID<br />
27,45%<br />
ZAMORA<br />
5,25%<br />
2. ANTIGÜEDAD DE LOS PRODUCTORES DE PATATA DE CASTILLA Y LEÓN<br />
2.1. CASTILLA Y LEÓN<br />
Cabe <strong>de</strong>stacar que <strong>de</strong>l total <strong>de</strong> encuestados, el 93,62% afirma sembrar<br />
habitualmente patata, mientras que <strong>de</strong>l 6,38% que no lo hace, un 77,33% reconoce que<br />
ésta es <strong>la</strong> primera campaña en <strong>la</strong> que lo hacen.<br />
%<br />
SI 93,62%<br />
NO 6,38%<br />
TOTAL 100,00%<br />
255
ANTIGÜEDAD DE LOS PRODUCTORES DE<br />
PATATA EN CASTILLA Y LEON<br />
RANGOS AGRICULTORES %<br />
ENTRE 1 Y 2<br />
AÑOS<br />
ENTRE 2 Y 5<br />
AÑOS<br />
ENTRE 5 Y 10<br />
AÑOS<br />
MÁS DE 10<br />
AÑOS<br />
63 3,83%<br />
182 11,06%<br />
418 25,39%<br />
983 59,72%<br />
En cuanto a <strong>la</strong> superficie cultivada en 2009 (Has) se han obtenido los resultados<br />
siguientes:<br />
SUPERFICIE TOTAL ENCUESTADA<br />
(Ha)<br />
MEDIA DE SUPERFICIE POR<br />
EXPLOTACIÓN (Ha)<br />
PRODUCTORES><br />
1,5 Ha.<br />
PRODUCTORES <<br />
1,5 Ha.<br />
TOTAL<br />
16.948 670 17.618 Ha<br />
10,29 1,27 8,12 Ha<br />
Kg. TOTALES OBTENIDOS 615.163.906 27.911.691<br />
643.075.597<br />
Kgs<br />
MEDIA Kg./Ha EN EXPLOTACIÓN 36.320 41.649 36.501 Kgs<br />
La superficie cultivada en Castil<strong>la</strong> y León por rangos, es <strong>la</strong> siguiente:<br />
PATATA. SUPERFICIE CULTIVADA. RANGOS<br />
(Has)<br />
RANGOS AGRICULTORES %<br />
MENOS DE 5<br />
Has<br />
1.042 47,99%<br />
ENTRE 5 y 10<br />
Has<br />
728 33,53%<br />
ENTRE 10 y 20<br />
Has<br />
293 13,50%<br />
MÁS DE 20 Has 108 4,98%<br />
256
3. PRODUCCIÓN OBTENIDA (KGS) POR PROVINCIAS<br />
CASTILLA Y LEÓN<br />
A continuación se reflejan los datos en el ámbito <strong>de</strong> <strong>la</strong> Comunidad Autónoma y por<br />
provincias, que en <strong>la</strong> campaña 2009-<strong>2010</strong>, se esperan obtener en lo que se refiere a <strong>la</strong><br />
producción (T):<br />
PATATA. PRODUCCIÓN OBTENIDA EN<br />
CASTILLA Y LEÓN. RANGOS (T)<br />
RANGOS AGRICULTORES %<br />
MENOS DE 200 T 1.129 52,00%<br />
ENTRE 200 y 400<br />
T<br />
560 25,79%<br />
ENTRE 400 y 800<br />
T<br />
327 15,06%<br />
MÁS DE 800 T 155 7,14%<br />
PROVINCIAS<br />
PROVINCIA: ÁVILA<br />
RANGOS Nº %<br />
MENOS DE 200 T. 39 34,82%<br />
ENTRE 200 Y 400 T, 43 38,39%<br />
ENTRE 400 Y 800 T. 18 16,07%<br />
MÁS DE 800 T. 12 10,71%<br />
PROVINCIA:LEON<br />
RANGOS Nº %<br />
MENOS DE 200 T. 216 82,44%<br />
ENTRE 200 Y 400 T, 27 10,31%<br />
ENTRE 400 Y 800 T. 16 6,11%<br />
MÁS DE 800 T. 3 1,15%<br />
PROVINCIA: SALAMANCA<br />
RANGOS Nº %<br />
MENOS DE 200 T. 207 39,20%<br />
ENTRE 200 Y 400 T, 185 35,04%<br />
ENTRE 400 Y 800 T. 95 17,99%<br />
MÁS DE 800 T. 41 7,77%<br />
PROVINCIA:BURGOS<br />
RANGOS Nº %<br />
MENOS DE 200 T. 160 69,57%<br />
ENTRE 200 Y 400 T, 42 18,26%<br />
ENTRE 400 Y 800 T. 15 6,52%<br />
MÁS DE 800 T. 13 5,65%<br />
PROVINCIA: PALENCIA<br />
RANGOS Nº %<br />
MENOS DE 200 T. 63 63,64%<br />
ENTRE 200 Y 400 T, 20 20,20%<br />
ENTRE 400 Y 800 T. 13 13,13%<br />
MÁS DE 800 T. 3 3,03%<br />
PROVINCIA: SEGOVIA<br />
RANGOS Nº %<br />
MENOS DE 200 T. 76 40,64%<br />
ENTRE 200 Y 400 T, 66 35,29%<br />
ENTRE 400 Y 800 T. 31 16,58%<br />
MÁS DE 800 T. 14 7,49%<br />
257
PROVINCIA: SORIA<br />
RANGOS Nº %<br />
MENOS DE 200 T. 17 39,53%<br />
ENTRE 200 Y 400 T, 15 34,88%<br />
ENTRE 400 Y 800 T. 7 16,28%<br />
MÁS DE 800 T. 4 9,30%<br />
PROVINCIA: VALLADOLID<br />
RANGOS Nº %<br />
MENOS DE 200 T. 272 45,64%<br />
ENTRE 200 Y 400 T, 145 24,33%<br />
ENTRE 400 Y 800 T. 120 20,13%<br />
MÁS DE 800 T. 59 9,90%<br />
PROVINCIA: ZAMORA<br />
RANGOS Nº %<br />
MENOS DE 200 T. 79 69,30%<br />
ENTRE 200 Y 400 T, 17 14,91%<br />
ENTRE 400 Y 800 T. 12 10,53%<br />
MÁS DE 800 T. 6 5,26%<br />
4. VARIEDADES<br />
En <strong>la</strong> encuesta se hizo alusión a <strong>la</strong>s 11 varieda<strong>de</strong>s consi<strong>de</strong>radas más frecuentes<br />
en el cultivo <strong>de</strong> Castil<strong>la</strong> y León: AGRIA, MONALISA, HERMES, JAERLA, SPUNTA, ASTERIX,<br />
AGATA, KENNEBEC, RED PONTIAC, LADY CLAIRE y CAESAR. También se incluyo un apartado<br />
<strong>de</strong> “otras varieda<strong>de</strong>s” y <strong>la</strong> superficie cultivada por si el encuestado consi<strong>de</strong>raba<br />
oportuno incluir varieda<strong>de</strong>s que no aparecían en <strong>la</strong>s 11 primeras.<br />
CASTILLA Y LEÓN<br />
Los resultados obtenidos en cuanto a varieda<strong>de</strong>s <strong>de</strong>ntro <strong>de</strong> <strong>la</strong> Comunidad Autónoma fueron:<br />
258
VARIEDADES DE PATATA CULTIVADAS EN<br />
CASTILLA Y LEÓN<br />
% Ha.<br />
AGRIA 16,24%<br />
VARIEDAD<br />
MONALISA 15,19%<br />
HERMES 10,72%<br />
JAERLA 10,05%<br />
SPUNTA 4,02%<br />
ASTERIX 3,52%<br />
ÁGATA 3,39%<br />
KENNEBEC 3,09%<br />
RED PONTIAC 1,06%<br />
LADY CLAIRE 0,73%<br />
CAESAR 0,68%<br />
OTROS 31,31%<br />
TOTAL 100,00%<br />
VARIEDADES DE PATATA CULTIVADAS EN<br />
CASTILLA Y LEÓN. OTRAS<br />
VARIEDAD<br />
%<br />
RED SCARLET 2,22%<br />
FÁBULA 2,19%<br />
CARRERA 2,03%<br />
CARLITA 1,47%<br />
VI VAL DI 1,06%<br />
PICASSO 0,84%<br />
DESIREE 0,62%<br />
BARAKA 0,55%<br />
MELODY 0,50%<br />
MARFONA 0,47%<br />
FLORICE 0,46%<br />
FONTANE 0,27%<br />
VERDI 0,19%<br />
ALMERA 0,18%<br />
FRISIA 0,16%<br />
EUROPA 0,15%<br />
SHANUM 0,14%<br />
PAMELA 0,14%<br />
BELLINI 0,13%<br />
AMBRA 0,12%<br />
INNOVATOR 0,12%<br />
ORIANA 0,10%<br />
BELLA ROSA 0,09%<br />
KONDOR 0,08%<br />
CHESTA 0,08%<br />
JELLY 0,06%<br />
COURAGE 0,06%<br />
MARGARITA 0,05%<br />
MARABEL 0,05%<br />
ELFEC 0,04%<br />
LADY OLIMPIA 0,04%<br />
ROMANO 0,03%<br />
CHOPIN 0,03%<br />
RODEO 0,02%<br />
NELA 0,01%<br />
SMITH COMET 0,01%<br />
OTROS 16,56%<br />
En <strong>la</strong>s superficies cultivadas en el apartado “OTROS”, se incluyen infinidad <strong>de</strong><br />
varieda<strong>de</strong>s con una superficie cultivada que ronda entre 1 y 2 Has (SAFRANE, AURIA,<br />
CAMERON, ELECTRA, ALASKA, AUREA, MARILYN, DANIELA, STRAELA, YOLI, BELLIQUI,<br />
CAMELOT, SALNCA, DEISY etc.)<br />
259
Por provincias <strong>la</strong> distribución <strong>de</strong> <strong>la</strong>s varieda<strong>de</strong>s más cultivadas es.<br />
PROVINCIAS<br />
VARIEDADES DE PATATA CULTIVADAS EN<br />
CASTILLA Y LEÓN<br />
PROVINCIA: AVILA<br />
VARIEDAD<br />
% DE LA<br />
PROVINCIA<br />
AGRIA 24,14%<br />
MONALISA 8,56%<br />
HERMES 33,51%<br />
JAERLA 3,45%<br />
SPUNTA 1,92%<br />
ASTERIX 1,79%<br />
AGATA 2,93%<br />
KENNEBEC 0,00%<br />
RED PONTIAC 0,27%<br />
LADY CLAIRE 0,00%<br />
CAESAR 1,53%<br />
OTROS 21,90%<br />
TOTAL 100,00%<br />
VARIEDADES DE PATATA CULTIVADAS EN<br />
CASTILLA Y LEÓN<br />
PROVINCIA: BURGOS<br />
VARIEDAD<br />
% DE LA<br />
PROVINCIA<br />
AGRIA 31,48%<br />
MONALISA 9,82%<br />
HERMES 18,00%<br />
JAERLA 2,64%<br />
SPUNTA 1,94%<br />
ASTERIX 6,73%<br />
AGATA 0,00%<br />
KENNEBEC 16,30%<br />
RED PONTIAC 1,62%<br />
LADY CLAIRE 3,66%<br />
CAESAR 0,37%<br />
OTROS 7,44%<br />
TOTAL 100,00%<br />
VARIEDADES DE PATATA CULTIVADAS EN CASTILLA Y LEÓN<br />
PROVINCIA: LEÓN<br />
VARIEDAD<br />
% DE LA<br />
PROVINCIA<br />
AGRIA 38,34%<br />
MONALISA 2,52%<br />
HERMES 20,26%<br />
JAERLA 2,62%<br />
SPUNTA 1,01%<br />
ASTERIX 5,85%<br />
AGATA 0,00%<br />
KENNEBEC 4,08%<br />
RED PONTIAC 2,61%<br />
LADY CLAIRE 3,16%<br />
CAESAR 0,00%<br />
OTROS 19,55%<br />
TOTAL 100,00%<br />
VARIEDADES DE PATATA CULTIVADAS EN CASTILLA Y LEÓN<br />
PROVINCIA: PALENCIA<br />
VARIEDAD<br />
% DE LA<br />
PROVINCIA<br />
AGRIA 29,00%<br />
MONALISA 4,52%<br />
HERMES 16,03%<br />
JAERLA 5,10%<br />
SPUNTA 7,31%<br />
ASTERIX 10,27%<br />
AGATA 0,00%<br />
KENNEBEC 8,87%<br />
RED PONTIAC 0,00%<br />
LADY CLAIRE 0,00%<br />
CAESAR 0,00%<br />
OTROS 18,90%<br />
TOTAL 100,00%<br />
260
VARIEDADES DE PATATA CULTIVADAS EN CASTILLA Y LEÓN<br />
PROVINCIA: SALAMANCA<br />
VARIEDAD<br />
% DE LA PROVINCIA<br />
AGRIA 16,90%<br />
MONALISA 1,10%<br />
HERMES 8,15%<br />
JAERLA 33,76%<br />
SPUNTA 1,39%<br />
ASTERIX 6,92%<br />
ÁGATA 0,59%<br />
KENNEBEC 1,65%<br />
RED PONTIAC 1,07%<br />
LADY CLAIRE 0,00%<br />
CAESAR 0,09%<br />
OTROS 28,38%<br />
TOTAL 100,00%<br />
VARIEDADES DE PATATA CULTIVADAS EN CASTILLA Y LEÓN<br />
PROVINCIA: SEGOVIA<br />
VARIEDAD<br />
% DE LA PROVINCIA<br />
AGRIA 5,11%<br />
MONALISA 66,12%<br />
HERMES 0,76%<br />
JAERLA 0,61%<br />
SPUNTA 3,78%<br />
ASTERIX 0,00%<br />
ÁGATA 10,25%<br />
KENNEBEC 0,00%<br />
RED PONTIAC 2,40%<br />
LADY CLAIRE 0,00%<br />
CAESAR 0,00%<br />
OTROS 10,97%<br />
TOTAL 100,00%<br />
VARIEDADES DE PATATA CULTIVADAS EN CASTILLA Y LEÓN<br />
PROVINCIA: SORIA<br />
VARIEDAD<br />
% DE LA PROVINCIA<br />
AGRIA<br />
PROVINCIA<br />
93,86%<br />
MONALISA 0,00%<br />
HERMES 0,00%<br />
JAERLA 0,00%<br />
SPUNTA 0,00%<br />
ASTERIX 0,00%<br />
ÁGATA 0,00%<br />
KENNEBEC 0,29%<br />
RED PONTIAC 1,17%<br />
LADY CLAIRE 0,00%<br />
CAESAR 0,00%<br />
OTROS 4,68%<br />
TOTAL 100,00%<br />
VARIEDADES DE PATATA CULTIVADAS EN CASTILLA Y LEÓN<br />
PROVINCIA: VALLADOLID<br />
VARIEDAD<br />
% DE LA<br />
PROVINCIA<br />
AGRIA 7,16%<br />
MONALISA 19,15%<br />
HERMES 9,61%<br />
JAERLA 2,35%<br />
SPUNTA 5,54%<br />
ASTERIX 1,34%<br />
AGATA 5,49%<br />
KENNEBEC 1,26%<br />
RED PONTIAC 0,77%<br />
LADY CLAIRE 0,66%<br />
CAESAR 1,08%<br />
OTROS 45,59%<br />
TOTAL 100,00%<br />
261
VARIEDADES DE PATATA CULTIVADAS EN CASTILLA Y LEÓN<br />
PROVINCIA: ZAMORA<br />
VARIEDAD<br />
% DE LA PROVINCIA<br />
AGRIA 18,51%<br />
MONALISA 15,23%<br />
HERMES 5,64%<br />
JAERLA 3,79%<br />
SPUNTA 14,70%<br />
ASTERIX 2,00%<br />
ÁGATA 0,84%<br />
KENNEBEC 7,49%<br />
RED PONTIAC 0,84%<br />
LADY CLAIRE 0,00%<br />
CAESAR 2,44%<br />
OTROS 28,52%<br />
TOTAL 100,00%<br />
5. COSTE MEDIO DE PRODUCCION DE UNA HECTAREA DE PATATAS (€)<br />
CASTILLA Y LEON<br />
A continuación se <strong>de</strong>tal<strong>la</strong>n los datos obtenidos en cuanto al coste medio <strong>de</strong><br />
producción por hectárea, tanto a nivel <strong>de</strong> <strong>la</strong> Comunidad Autónoma como en cada<br />
una <strong>de</strong> <strong>la</strong>s provincias que <strong>la</strong> integran. Se consi<strong>de</strong>ra importante discriminar entre<br />
los dos principales tipos <strong>de</strong> explotaciones encuestadas por <strong>la</strong> gran disparidad <strong>de</strong><br />
costes que se han <strong>de</strong>c<strong>la</strong>rado.<br />
COSTE MEDIO DE PRODUCCION POR Ha<br />
EN CASTILLA Y LEÓN EN<br />
EXPLOTACIONES> 1,5 Ha<br />
RANGOS NUMERO %<br />
MENOS DE<br />
4000€/Ha<br />
718 43,62%<br />
ENTRE 4000 Y<br />
4500€/Ha<br />
452 27,46%<br />
ENTRE 4500 Y<br />
5000€/Ha<br />
253 15,37%<br />
ENTRE 5000 Y<br />
6000€/Ha<br />
173 10,51%<br />
MÁS DE 6000€/Ha 50 3,04%<br />
COSTE MEDIO DE PRODUCCION POR Ha<br />
EN CASTILLA Y LEÓN EN<br />
EXPLOTACIONES< 1,5 Ha<br />
RANGOS NUMERO %<br />
MENOS DE<br />
4000€/Ha 400 76,19%<br />
ENTRE 4000 Y<br />
5000€/Ha 103 19,62%<br />
ENTRE 5000 Y<br />
6000€/Ha 20 3,81%<br />
MÁS DE 6000€/Ha<br />
2 0,38%<br />
COSTE MEDIO EN CASTILLA<br />
Y LEÓN<br />
4.151 €<br />
COSTE MEDIO EN CASTILLA Y<br />
LEÓN<br />
2.351 €<br />
262
PROVINCIAS<br />
COSTE PARA<br />
>1,5<br />
COSTE PARA
Observando esta tab<strong>la</strong>, se pue<strong>de</strong> <strong>de</strong>cir que el 65,91% <strong>de</strong> los agricultores,<br />
compra <strong>la</strong> totalidad <strong>de</strong> <strong>la</strong> semil<strong>la</strong> al almacenista, un 20,82% <strong>la</strong> adquiere a <strong>la</strong><br />
Cooperativa y en muy pocos casos se compra al proveedor directo.<br />
7. PROCEDENCIA DE LA SEMILLA<br />
EN CASTILLA Y LEÓN<br />
PROCEDENCIA DE LA SEMILLA ADQUIRIDA POR LOS<br />
AGRICULTORES EN CASTILLA Y LEÓN<br />
PROCEDENCIA AGRICULTORES %<br />
EXCLUSIVAMENTE NACIONAL 448 20,63 %<br />
EXCLUSIVAMENTE EXTRANJERA 1402 64,58%<br />
MEZCLA NACIONAL/EXTRANJERA 321 14,79 %<br />
Como se aprecia, <strong>la</strong> semil<strong>la</strong> extranjera es <strong>la</strong> más solicitada por los agricultores<br />
(64,58%), si bien es necesario aportar otros matices:<br />
• En el caso <strong>de</strong> agricultores pequeños (
POR PROVINCIAS<br />
En todas <strong>la</strong>s provincias, el factor más indicado acerca <strong>de</strong> <strong>la</strong>s causas que han<br />
provocado <strong>la</strong> elección <strong>de</strong> semil<strong>la</strong> es el apartado “Otros”, lo que ac<strong>la</strong>ra poco los<br />
motivos que llevan a los productores a elegir una u otra patata <strong>de</strong> siembra. No<br />
obstante, se pue<strong>de</strong> afirmar que uno <strong>de</strong> los mayores motivos para <strong>la</strong> compra <strong>de</strong> semil<strong>la</strong><br />
es el compromiso <strong>de</strong> comprar posteriormente <strong>la</strong> patata <strong>de</strong> consumo.<br />
9. GRADO DE COOPERATIVISMO<br />
CASTILLA Y LEÓN<br />
POR PROVINCIAS<br />
PERTENENCIA A COOPERATIVAS DE LOS<br />
PRODUCTORES DE PATATA EN CASTILLA<br />
Y LEÓN.<br />
PERTENENCIA AGRICULTORES %<br />
SI 349 16,08%<br />
NO 1822 83,92%<br />
ÁVILA<br />
SALAMANCA<br />
PERTENENCIA % PROV PERTENENCIA % PROV<br />
SI 3,09% SI 19,35%<br />
NO 96,91% NO 80,65%<br />
BURGOS<br />
SEGOVIA<br />
PERTENENCIA % PROV PERTENENCIA % PROV<br />
SI 22,22% SI 13,64%<br />
NO 77,78% NO 86,36%<br />
LEÓN<br />
SORIA<br />
PERTENENCIA % PROV PERTENENCIA % PROV<br />
SI 43,16% SI 8,57%<br />
NO 56,84% NO 91,43%<br />
PALENCIA<br />
VALLADOLID<br />
PERTENENCIA % PROV PERTENENCIA % PROV<br />
SI 31,48% SI 19,25%<br />
NO 68,52% NO 80,75%<br />
ZAMORA<br />
PERTENENCIA % PROV<br />
SI 11,11%<br />
NO 88,89%<br />
265
El <strong>de</strong>sglose por Cooperativas y provincias es el siguiente:<br />
ÁVILA BURGOS LEÓN PALENCIA SALAMANCA SEGOVIA SORIA VALLADOLID ZAMORA<br />
LA CARPEÑA S. COOP. 66,67% 4,21% 62,62% 12,50%<br />
COOP. SAN ISIDRO DE PALACIOS<br />
RUBIOS<br />
33,33% 36,84%<br />
S.COO. 2º GRADO GARLAN 15,38% 100,00%<br />
COSIDEL 12,82%<br />
APP TIERRAS DE CASTILLA Y<br />
LEÓN<br />
10,26% 4,17% 66,67% 6,54%<br />
ARAES (CULTIVOS ECOLÓGICOS) 2,56% 2,08%<br />
COPANOR 10,26% 28,57%<br />
LA RIOJALTEÑA 2,56%<br />
COOP. RIOJA ALTA 2,56%<br />
SAT INICIATIVAS AGRÍCOLAS 7,69%<br />
SEYCO 20,51% 4,76%<br />
VALDEVELILLA 2,56%<br />
PRODELECO 79,17%<br />
ASTORGANA DE PATATAS 4,17%<br />
GEXVALL 4,17% 12,50%<br />
PATATAS DE CALIDAD<br />
FUENTESPREADAS<br />
6,25% 37,50%<br />
ARANPINO S. COOP. 38,95% 0,93% 12,50%<br />
CRAPE S. COOP. 5,26% 0,93%<br />
COBADÚ 2,11%<br />
COOP. BARBERO DE LA TORRE 1,05%<br />
SAN MIGUEL S. COOP. 1,05%<br />
CORPI 1,05%<br />
FLOYMA 1,05%<br />
GLUS - I 72,00%<br />
CAMPO SEGOVIANO 8,00% 0,93%<br />
CULTURA DE LA HUERTA<br />
INDYCONS 8,41%<br />
COOP LAGUNA DE DUERO 9,35%<br />
TIERRA DE PINARES S. COOP. 3,74%<br />
HORCOCAF 8,00% 2,80%<br />
NO ESPECIFICAN 12,82% 8,42% 12,00% 3,74% 25,00%<br />
100,00% 100,00% 100,00% 100,00% 100,00% 100,00% 100,00% 100,00% 100,00%<br />
266
10. VENTA DE PATATAS<br />
CASTILLA Y LEÓN<br />
VENTA DE PATATA EN CASTILLA Y LEÓN<br />
VENTA DE PATATA COOPERATIVA ALMACENISTA INDUSTRIA OTROS<br />
% DE VENTA % TOTAL % TOTAL % TOTAL % TOTAL<br />
100% 18,65% 64,46% 4,31% 3,46%<br />
ENTRE EL 50 Y EL 99% 3,16% 5,22% 2,49% 0,91%<br />
ENTRE EL 0 Y EL 49% 1,03% 2,25% 0,79% 1,70%<br />
0% 77,16% 28,07% 92,35% 93,92%<br />
Como se pue<strong>de</strong> observar, el agricultor mayoritariamente no comercializa con <strong>la</strong><br />
industria (92,35%), por carecer <strong>de</strong> medios para almacenamiento, calibrado, etc. frente al 64,46%<br />
que lo hace con el almacenista y so<strong>la</strong>mente un 18, 65% directamente con <strong>la</strong> Cooperativa.<br />
POR PROVINCIAS<br />
VENTA DE PATATA EN CASTILLA Y LEÓN<br />
ÁVILA<br />
VENTA DE PATATA COOPERATIVA ALMACENISTA INDUSTRIA OTROS<br />
% DE VENTA % TOTAL % TOTAL % TOTAL % TOTAL<br />
100% 20,62% 64,95% 4,12% 4,12%<br />
ENTRE EL 50 Y EL 99% 1,03% 2,06% 4,12% 0,00%<br />
ENTRE EL 0 Y EL 49% 1,03% 3,09% 1,03% 1,03%<br />
0% 77,32% 29,90% 90,72% 94,85%<br />
VENTA DE PATATA EN CASTILLA Y LEÓN<br />
BURGOS<br />
VENTA DE PATATA COOPERATIVA ALMACENISTA INDUSTRIA OTROS<br />
% DE VENTA % TOTAL % TOTAL % TOTAL % TOTAL<br />
100% 15,28% 46,53% 10,42% 4,86%<br />
ENTRE EL 50 Y EL 99% 9,03% 9,72% 4,86% 4,17%<br />
ENTRE EL 0 Y EL 49% 1,39% 5,56% 2,08% 7,64%<br />
0% 74,31% 38,19% 81,94% 83,33%<br />
267
VENTA DE PATATA EN CASTILLA Y LEÓN<br />
LEÓN<br />
VENTA DE PATATA COOPERATIVA ALMACENISTA INDUSTRIA OTROS<br />
% DE VENTA % TOTAL % TOTAL % TOTAL % TOTAL<br />
100% 44,21% 35,79% 6,32% 4,21%<br />
ENTRE EL 50 Y EL 99% 2,11% 6,32% 1,05% 1,05%<br />
ENTRE EL 0 Y EL 49% 1,05% 0,00% 2,11% 3,16%<br />
0% 52,63% 57,89% 90,53% 90,53%<br />
VENTA DE PATATA EN CASTILLA Y LEÓN<br />
PALENCIA<br />
VENTA DE PATATA COOPERATIVA ALMACENISTA INDUSTRIA OTROS<br />
% DE VENTA % TOTAL % TOTAL % TOTAL % TOTAL<br />
100% 20,37% 44,44% 3,70% 18,52%<br />
ENTRE EL 50 Y EL 99% 5,56% 5,56% 1,85% 0,00%<br />
ENTRE EL 0 Y EL 49% 3,70% 7,41% 0,00% 3,70%<br />
0% 70,37% 42,59% 94,44% 77,78%<br />
VENTA DE PATATA EN CASTILLA Y LEÓN<br />
SALAMANCA<br />
VENTA DE PATATA COOPERATIVA ALMACENISTA INDUSTRIA OTROS<br />
% DE VENTA % TOTAL % TOTAL % TOTAL % TOTAL<br />
100% 19,35% 68,91% 2,39% 3,48%<br />
ENTRE EL 50 Y EL 99% 2,39% 3,70% 1,74% 0,22%<br />
ENTRE EL 0 Y EL 49% 0,87% 1,52% 0,22% 0,43%<br />
0% 77,39% 25,87% 95,65% 95,87%<br />
VENTA DE PATATA EN CASTILLA Y LEÓN<br />
SEGOVIA<br />
VENTA DE PATATA COOPERATIVA ALMACENISTA INDUSTRIA OTROS<br />
% DE VENTA % TOTAL % TOTAL % TOTAL % TOTAL<br />
100% 8,44% 72,08% 5,84% 1,30%<br />
ENTRE EL 50 Y EL 99% 5,19% 11,69% 3,25% 0,00%<br />
ENTRE EL 0 Y EL 49% 1,30% 0,00% 0,65% 1,95%<br />
0% 85,06% 16,23% 90,26% 96,75%<br />
268
VENTA DE PATATA EN CASTILLA Y LEÓN<br />
SORIA<br />
VENTA DE PATATA COOPERATIVA ALMACENISTA INDUSTRIA OTROS<br />
% DE VENTA % TOTAL % TOTAL % TOTAL % TOTAL<br />
100% 8,57% 51,43% 17,14% 5,71%<br />
ENTRE EL 50 Y EL 99% 5,71% 2,86% 5,71% 5,71%<br />
ENTRE EL 0 Y EL 49% 2,86% 2,86% 5,71% 2,86%<br />
0% 82,86% 42,86% 71,43% 85,71%<br />
VENTA DE PATATA EN CASTILLA Y LEÓN<br />
VALLADOLID<br />
VENTA DE PATATA COOPERATIVA ALMACENISTA INDUSTRIA OTROS<br />
% DE VENTA % TOTAL % TOTAL % TOTAL % TOTAL<br />
100% 17,94% 70,47% 2,80% 1,87%<br />
ENTRE EL 50 Y EL 99% 1,68% 4,11% 2,06% 0,75%<br />
ENTRE EL 0 Y EL 49% 0,75% 2,06% 0,56% 0,75%<br />
0% 79,63% 23,36% 94,58% 96,64%<br />
VENTA DE PATATA EN CASTILLA Y LEÓN<br />
ZAMORA<br />
VENTA DE PATATA COOPERATIVA ALMACENISTA INDUSTRIA OTROS<br />
% DE VENTA % TOTAL % TOTAL % TOTAL % TOTAL<br />
100% 15,28% 69,44% 4,17% 2,78%<br />
ENTRE EL 50 Y EL 99% 4,17% 4,17% 2,78% 1,39%<br />
ENTRE EL 0 Y EL 49% 0,00% 4,17% 0,00% 0,00%<br />
0% 80,56% 22,22% 93,06% 95,83%<br />
Como conclusiones generales se pue<strong>de</strong> establecer que <strong>la</strong> provincia con más asentamiento<br />
<strong>de</strong>l cooperativismo es León, don<strong>de</strong> llega el 40% <strong>de</strong> <strong>la</strong> mercancía a cooperativas. No<br />
obstante, <strong>la</strong> opción más frecuente en todas <strong>la</strong>s provincias es <strong>la</strong> entrega a un almacenista.<br />
La entrega a <strong>la</strong> industria nunca llega a suponer un tanto por ciento significativo, estando<br />
en <strong>la</strong> mayoría <strong>de</strong> <strong>la</strong>s provincias por <strong>de</strong>bajo <strong>de</strong>l 10%.<br />
269
11. SUSCRIPCION DE CONTRATOS<br />
<br />
CASTILLA Y LEON<br />
AGRICULTORES QUE SUSCRIBEN<br />
CONTRATOS EN LA VENTA DE<br />
PATATA<br />
CONTRATO AGRICULTORES %<br />
SI 681 31,37%<br />
NO 1490 68,63%<br />
<br />
POR PROVINCIAS<br />
AVILA<br />
SALAMANCA<br />
CONTRATO % PROV CONTRATO % PROV<br />
SI 71,13% SI 25,22%<br />
NO 28,87% NO 74,78%<br />
BURGOS<br />
SEGOVIA<br />
CONTRATO % PROV CONTRATO % PROV<br />
SI 54,17% SI 16,88%<br />
NO 45,83% NO 83,12%<br />
LEON<br />
SORIA<br />
CONTRATO % PROV CONTRATO % PROV<br />
SI 66,32% SI 60,00%<br />
NO 33,68% NO 40,00%<br />
PALENCIA<br />
VALLADOLID<br />
CONTRATO % PROV CONTRATO % PROV<br />
SI 42,59% SI 37,57%<br />
NO 57,41% NO 62,43%<br />
ZAMORA<br />
CONTRATO % PROV<br />
SI 40,28%<br />
NO 59,72%<br />
270
En este caso hay que seña<strong>la</strong>r que <strong>la</strong> suscripción <strong>de</strong> contratos está mucho más extendida en<br />
agricultores con más <strong>de</strong> 1,5 ha que en los que cultivan una superficie inferior. La firma <strong>de</strong><br />
contratos, por tanto, profesionaliza más <strong>la</strong> producción (a mayor producción por<br />
explotación; más probable es tener algo contratado).<br />
CAUSAS DE LA NO SUSCRIPCION DE CONTRATOS<br />
CAUSAS DE LA NO SUSCRIPCIÓN DE CONTRATOS EN CASTILLA Y LEÓN<br />
CAUSAS %<br />
BENEFICIOS LIMITADOS 27,8%<br />
NO ENCUENTRA CON QUIEN 19,2%<br />
ALMACENISTAS NO ACONSEJAN 1,7%<br />
COMPROMISO CON LA COOPERATIVA 1,8%<br />
DESCONOCIMIENTO 6,3%<br />
INCUMPLIMIENTO DE CONTRATOS 21,5%<br />
NO INTERESA 9,8%<br />
PRECIO INFERIOR QUE EL DE MERCADO 8,8%<br />
POCA CANTIDAD 2,4%<br />
AUTOCONSUMO 0,8%<br />
Las causas que se <strong>de</strong>c<strong>la</strong>ran con mayor frecuencia son: “Tiene beneficios limitados”,<br />
“No encuentra con quien” y “ Se incumplen los contratos”<br />
12. FORMA DE VENTA DE LAS PATATAS<br />
CASTILLA Y LEON<br />
FORMA DE VENTA DE PATATA EN CASTILLA Y LEON<br />
VENTA DE PATATA<br />
DESDE LA TIERRA<br />
CON ALMACENAJE<br />
% AGRICULTORES % TOTAL AGRICULTORES % TOTAL<br />
100% 1244 75,58% 176 10,69%<br />
ENTRE EL 50 Y 99% 181 11,00% 133 8,08%<br />
ENTRE EL 0 Y 49% 40 2,43% 88 5,35%<br />
0% 181 11,00% 1249 75,88%<br />
Es significativo el dato <strong>de</strong>l 75,58%, que ven<strong>de</strong> directamente, sin ningún valor añadido.<br />
271
13. TENENCIA DE ALMACENES<br />
Los resultados obtenidos en el ámbito <strong>de</strong> <strong>la</strong> Comunidad Autónoma<br />
cultivadores <strong>de</strong> más <strong>de</strong> 1,5 Ha. han sido:<br />
para<br />
DISPONIBILIDAD DE ALMACENES DE<br />
PATATA EN CASTILLA Y LEÓN<br />
AGRICULTORES %<br />
SI 527 32,02%<br />
NO 1119 67,98%<br />
De estos 527 productores con disponibilidad <strong>de</strong> almacén, un total <strong>de</strong> 56<br />
<strong>de</strong>sconoce <strong>la</strong> capacidad <strong>de</strong> los mismos y 471 si que <strong>la</strong> manifiestan quedando<br />
<strong>de</strong>sglosado <strong>de</strong> <strong>la</strong> siguiente manera:<br />
TIPO DE ALMACEN NUMERO % CAPACIDAD (TN) MEDIA (Tn)<br />
MANUAL 361 76,65% 4.250.056 11.773<br />
VENTILADO 86 18,26% 15.814.948 183.895<br />
REFRIGERADO 24 5,10% 225.750 9.406<br />
Desglosando los tipos <strong>de</strong> almacenes y su capacidad media por provincia<br />
obtenemos <strong>la</strong>s siguientes tab<strong>la</strong>s:<br />
AVILA<br />
TIPO DE ALMACEN NUMERO % DEL<br />
TOTAL<br />
CAPACIDAD<br />
(TN)<br />
MEDIA (Tn)<br />
MANUAL 25 25,77% 13.995 560<br />
VENTILADO 0 0,00% 0 0<br />
REFRIGERADO 0 0,00% 0 0<br />
BURGOS<br />
TIPO DE ALMACEN NUMERO % DEL<br />
TOTAL<br />
CAPACIDAD<br />
(TN)<br />
MEDIA (Tn)<br />
MANUAL 75 52,08% 327.020 4.360<br />
VENTILADO 13 9,03% 31.815 2.447<br />
REFRIGERADO 3 2,08% 950 317<br />
LEON<br />
TIPO DE ALMACEN NUMERO % DEL<br />
TOTAL<br />
CAPACIDAD<br />
(TN)<br />
MEDIA (Tn)<br />
MANUAL 29 30,53% 2.008.230 69.249<br />
VENTILADO 1 1,05% 12.000.000 12.000.000<br />
REFRIGERADO 2 2,11% 1.800 900<br />
PALENCIA<br />
TIPO DE ALMACEN NUMERO % DEL<br />
TOTAL<br />
CAPACIDAD<br />
(TN)<br />
MEDIA (Tn)<br />
MANUAL 21 38,89% 306.730 14.606<br />
VENTILADO 19 35,19% 3.441.010 181.106<br />
REFRIGERADO 1 1,85% 2.000 2.000<br />
TIPO DE ALMACEN<br />
NUMERO<br />
SALAMANCA<br />
% DEL<br />
TOTAL<br />
CAPACIDAD<br />
(TN)<br />
MEDIA<br />
(Tn)<br />
MANUAL 46 10,00% 39.931 868<br />
VENTILADO 11 2,39% 9.013 819<br />
REFRIGERADO 7 1,52% 6.900 986<br />
TIPO DE ALMACEN<br />
NUMERO<br />
SEGOVIA<br />
% DEL<br />
TOTAL<br />
CAPACIDAD<br />
(TN)<br />
MEDIA<br />
(Tn)<br />
MANUAL 60 38,96% 10.585 176<br />
VENTILADO 14 9,09% 14.590 1.042<br />
REFRIGERADO 3 1,95% 1.000 333<br />
272
TIPO DE ALMACEN<br />
NUMERO<br />
SORIA<br />
% DEL<br />
TOTAL<br />
CAPACIDAD<br />
(TN)<br />
MEDIA<br />
(Tn)<br />
MANUAL 3 8,57% 1.700 567<br />
VENTILADO 2 5,71% 900 450<br />
REFRIGERADO 1 2,86% 1.400 1.400<br />
TIPO DE ALMACEN<br />
NUMERO<br />
VALLADOLID<br />
% DEL<br />
TOTAL<br />
CAPACIDAD<br />
(TN)<br />
MEDIA<br />
(Tn)<br />
MANUAL 95 17,76% 1.539.145 16.202<br />
VENTILADO 18 3,36% 311.920 17.329<br />
REFRIGERADO 5 0,93% 211.500 42.300<br />
TIPO DE ALMACEN<br />
NUMERO<br />
ZAMORA<br />
% DEL<br />
TOTAL<br />
CAPACIDAD<br />
(TN)<br />
MEDIA<br />
(Tn)<br />
MANUAL 6 8,33% 2.720 453<br />
VENTILADO 7 9,72% 5.700 814<br />
REFRIGERADO 1 1,39% 200 200<br />
En el caso <strong>de</strong> productores <strong>de</strong> menos <strong>de</strong> 1,5 Ha. <strong>la</strong> proporción <strong>de</strong> agricultores que poseen<br />
almacén es mayor; respuesta lógica pues almacenar pequeñas partidas es más fácil que<br />
almacenar partidas gran<strong>de</strong>s. No obstante, <strong>la</strong> capacidad <strong>de</strong> los almacenes <strong>de</strong> estos<br />
agricultores supera <strong>la</strong> capacidad <strong>de</strong> productiva <strong>de</strong> <strong>la</strong> explotación, lo que hace suponer que<br />
se adquiere patata a terceros.<br />
14. SUGERENCIAS<br />
La tab<strong>la</strong> que muestra <strong>la</strong>s sugerencias que hacen los productores para tratar<br />
<strong>de</strong> mejorar el sector es <strong>la</strong> siguiente:<br />
SUGERENCIAS %<br />
ASOCIACIONISMO 19,97%<br />
FOMENTO DE CONTRATOS 17,51%<br />
AYUDAS A CONTRUCCIONES DE<br />
ALMACENES<br />
7,22%<br />
NIGUNA 4,18%<br />
OTROS 51,13%<br />
Dentro <strong>de</strong>l apartado “OTROS” el item que con más frecuencia se repite es LA NECESIDAD<br />
DE CUMPLIMIENTO DE LOS CONTRATOS.<br />
Otras sugerencias <strong>de</strong> los productores son <strong>la</strong>s siguientes:<br />
<br />
<br />
<br />
<br />
<br />
Regu<strong>la</strong>rizar <strong>la</strong> siembra a través <strong>de</strong> cupos <strong>de</strong> producción para no <strong>de</strong>sestabilizar<br />
el mercado.<br />
"ayudas a <strong>la</strong> comercialización".<br />
"especu<strong>la</strong>r menos con el producto".<br />
Introducir <strong>la</strong> patata en el Pago Único.<br />
"potenciar <strong>la</strong> venta <strong>de</strong> <strong>la</strong> producción nacional".<br />
273
Contro<strong>la</strong>r <strong>la</strong> superficie a sembrar, respetando a los productores tradicionales<br />
para evitar el exceso <strong>de</strong> oferta.<br />
Que los contratos se respeten por ambas partes".<br />
"fomentar el relevo generacional en el sector".<br />
"eliminar intermediarios y contro<strong>la</strong>r el precio al que llega al consumidor".<br />
"crear cooperativas para competir con los almacenistas".<br />
Ayuda a los que siembran patata certificada.<br />
Que <strong>la</strong>s cooperativas tengan acceso a comprar directamente <strong>la</strong> semil<strong>la</strong> y <strong>la</strong><br />
venta <strong>de</strong>l producto al consumidor o a gran<strong>de</strong>s superficies".<br />
Bajar el precio <strong>de</strong> <strong>la</strong> semil<strong>la</strong> ya que supone el 50% <strong>de</strong> los costes <strong>de</strong><br />
producción.<br />
274
ANEXO II<br />
RESULTADO DE LA ENCUESTA REALIZADA A OPERADORES DE PATATA.<br />
NOVIEMBRE 2009<br />
La Consejería <strong>de</strong> Agricultura y Gana<strong>de</strong>ría <strong>de</strong> <strong>la</strong> Junta <strong>de</strong> Castil<strong>la</strong> y León está realizando,<br />
<strong>de</strong>ntro <strong>de</strong>l ámbito <strong>de</strong> su competencia, diversos estudios y trabajos previos con <strong>la</strong> finalidad <strong>de</strong><br />
redactar un <strong>P<strong>la</strong>n</strong> Estratégico para <strong>la</strong> <strong>Patata</strong> en Castil<strong>la</strong> y León. Uno <strong>de</strong> esos trabajos consiste<br />
en realizar una encuesta que revele cuál es <strong>la</strong> realidad <strong>de</strong> los intermediarios en el comercio<br />
<strong>de</strong> patata.<br />
La encuesta se realizó durante el mes <strong>de</strong> noviembre <strong>de</strong> 2009 a un total <strong>de</strong> 74 operadores, que<br />
representan en torno al 90% <strong>de</strong>l volumen comercializado <strong>de</strong> patata en Castil<strong>la</strong>s y León, al ver<br />
<strong>la</strong> necesidad <strong>de</strong> conseguir <strong>de</strong> una manera directa datos sobre los operadores en el sector <strong>de</strong> <strong>la</strong><br />
patata <strong>de</strong> Castil<strong>la</strong> y León.<br />
A continuación se ofrecen los resultados obtenidos <strong>de</strong> una manera sucinta.<br />
1. NÚMERO DE OPERADORES ENCUESTADOS<br />
Nº OPERADORES ENCUESTADOS, CON APP APP<br />
ÁVILA 0 0<br />
BURGOS 8 1*(PATATA DE SIEMBRA)<br />
LEÓN 7 1<br />
PALENCIA 4 1<br />
SALAMANCA 11 2<br />
SEGOVIA 19 2<br />
SORIA 4 0<br />
VALLADOLID 19 3<br />
ZAMORA 2 1<br />
TOTAL 74 10<br />
* Los resultados <strong>de</strong>l productor <strong>de</strong> patata <strong>de</strong> siembra no están incluidos en el presente documento.<br />
Las encuestas se remitieron en el mes <strong>de</strong> noviembre y fueron recogidas por un técnico <strong>de</strong>l<br />
Servicio Territorial correspondiente, que hizo <strong>la</strong>s ac<strong>la</strong>raciones oportunas a <strong>la</strong>s dudas que<br />
podían surgir por parte <strong>de</strong>l encuestado.<br />
Dos operadores no han respondido a ninguna <strong>de</strong> <strong>la</strong>s preguntas realizadas.<br />
275
2. CAPACIDAD DE ALMACENAMIENTO POR TIPO DE ALMACÉN.<br />
En <strong>la</strong> encuesta se distinguen tres tipos <strong>de</strong> almacenamiento; cámara <strong>de</strong> conservación (con<br />
control <strong>de</strong> temperatura), almacén venti<strong>la</strong>do y almacén. Se pi<strong>de</strong> el dato <strong>de</strong> tone<strong>la</strong>das<br />
almacenables en cada uno <strong>de</strong> los sistemas y <strong>de</strong> los metros cúbicos disponibles también para<br />
cada uno <strong>de</strong> los sistemas.<br />
ALMACENES NO APP<br />
TABLA 1<br />
CÁMARA DE<br />
CONSERVACIÓN<br />
(t)<br />
ALMACÉN<br />
VENTILADO (t)<br />
ALMACÉN (t)<br />
TOTAL<br />
TOTAL 36.830 83.000 45.918 165.748<br />
MEDIA 1.601 3.458 1.276 2.590<br />
En el caso <strong>de</strong> cámaras, son 23 almacenistas (31%) los que <strong>de</strong>c<strong>la</strong>ran utilizar este método,<br />
habiendo gran disparidad <strong>de</strong> tamaños: 8 almacenes tiene más capacidad que <strong>la</strong> media (1.601<br />
t) y los 15 restantes menos. Del mayor (7.000 t) al más pequeño (140 t) hay una gran<br />
diferencia. Ello es <strong>de</strong>bido a que el <strong>de</strong> menor tamaño está <strong>de</strong>stinado a regu<strong>la</strong>r una industria<br />
fritera y el mayor es <strong>de</strong> un almacenista para fresco e industria.<br />
La capacidad total en estos almacenes es <strong>de</strong> 165.748 t, repartidas tal y como se expone en<br />
<strong>la</strong> tab<strong>la</strong> anterior<br />
ALMACENES APP<br />
TABLA 2<br />
CÁMARA DE<br />
ALMACÉN<br />
CONSERVACIÓN<br />
VENTILADO (t)<br />
(t)<br />
ALMACÉN (t) TOTAL<br />
TOTAL 16.190 58.790 18.573 93.553<br />
MEDIA 2.757 5.786 2.333 9.355<br />
En el caso <strong>de</strong> <strong>la</strong>s APP, <strong>de</strong> media tienen mayor capacidad <strong>de</strong> almacenamiento. A pesar <strong>de</strong> ello,<br />
en conjunto disponen <strong>de</strong> menos capacidad total para conservar que los operadores no<br />
vincu<strong>la</strong>dos con los productores.<br />
276
Complementando lo expuesto en el caso anterior, <strong>la</strong> capacidad total <strong>de</strong> almacenamiento <strong>de</strong><br />
<strong>la</strong>s APP es <strong>de</strong> 93.553 t.<br />
TABLA 3:CUADRO RESUMEN DE CAPACIDAD DE ALMACENAMIENTO<br />
TOTAL NO<br />
APP<br />
CÁMARA DE ALMACÉN<br />
TOTAL<br />
ALMACÉN (t)<br />
CONSERVACIÓN (t) VENTILADO (t)<br />
GLOBAL<br />
36.830 83.000 45.918 165.748<br />
TOTAL APP 16.190 58.790 18.573 93.553<br />
TOTAL 53.020 141.790 64.491 259.301<br />
PORCENTAJE 20% 55% 25% 100%<br />
3. ¿QUÉ FORMATO SE EMPLEA EN EL ALMACENAMIENTO?<br />
Existen básicamente tres maneras <strong>de</strong> almacenar patatas: en cajón <strong>de</strong> ma<strong>de</strong>ra, en big-bag o<br />
yumbos y a granel. La más evolucionada y <strong>la</strong> que permite mejores condiciones <strong>de</strong><br />
conservación es el cajón <strong>de</strong> ma<strong>de</strong>ra.<br />
Las otras dos soluciones también son válidas, aunque no ofrecen <strong>la</strong> misma calidad <strong>de</strong><br />
almacenaje que <strong>la</strong> primera.<br />
FORMATO<br />
% SOBRE EL TOTAL<br />
CAJON 12<br />
BIG-BAG 31<br />
GRANEL 16<br />
CAJÓN + BIGBAG 22<br />
CAJÓN + GRANEL 3<br />
BIGBAG + GRANEL 3<br />
CAJÓN + BIG-BAG + GRANEL 8<br />
NO LO MANIFIESTA 5<br />
Como se pue<strong>de</strong> observar, el formato más elegido es el big-bag, seguido <strong>de</strong> cajón y big-bag.<br />
277
En <strong>la</strong>s APP existen 4 que <strong>de</strong>c<strong>la</strong>ran usar los tres formatos <strong>de</strong> almacenamiento, 2 emplean el<br />
formato cajón y big-bag simultáneamente y una sólo emplea cajones, otra sólo graneles y otra<br />
granel y cajón. Por último, hay una que no ha contestado a esta pregunta.<br />
4. VARIEDADES MÁS ALMACENADAS.<br />
Preguntados los encuestados cuáles son <strong>la</strong>s varieda<strong>de</strong>s que almacena y en qué cantidad, <strong>la</strong><br />
respuesta obe<strong>de</strong>ce al siguiente gráfico:<br />
La patata Kennebec don<strong>de</strong> más se almacena es en Burgos, <strong>la</strong> Jaer<strong>la</strong> en Burgos y Val<strong>la</strong>dolid, <strong>la</strong><br />
Monalisa en Val<strong>la</strong>dolid y Segovia; Hermes en Val<strong>la</strong>dolid, Sa<strong>la</strong>manca y Burgos y <strong>la</strong> patata Agria<br />
se conserva mayormente en León.<br />
Las APP almacenan <strong>la</strong>s siguientes varieda<strong>de</strong>s:<br />
VARIEDADES ALMACENADAS EN CASTILLA LEÓN POR APP 2008-2009<br />
OTROS<br />
0%<br />
JAERLA<br />
3%<br />
MONALISA<br />
9%<br />
SPUNTA<br />
0%<br />
RED PONTIAC<br />
1%<br />
AGRIA<br />
32%<br />
LADY CLAIRE<br />
2%<br />
ASTERIX<br />
8%<br />
HERMES<br />
45%<br />
278
Como se pue<strong>de</strong> apreciar, en este caso <strong>la</strong> mayor parte <strong>de</strong> patata almacenada por <strong>la</strong>s APP es <strong>de</strong><br />
patata <strong>de</strong> industria (Hermes y Agria), y so<strong>la</strong>mente hay dos APP que <strong>de</strong>c<strong>la</strong>ren almacenar más<br />
cantidad <strong>de</strong> patata <strong>de</strong> consumo que <strong>de</strong> industria. Hay tres que so<strong>la</strong>mente almacenan patata<br />
<strong>de</strong> industria, el resto almacenan simultáneamente patata <strong>de</strong> consumo y <strong>de</strong> industria.<br />
5. ¿QUÉ FINALIDAD SE LE DA LA PATATA DESPUÉS DEL ALMACENAMIENTO?<br />
Con esta pregunta se preten<strong>de</strong> saber si <strong>la</strong> patata almacenada se <strong>de</strong>stina a industria o para su<br />
consumo en fresco. Evi<strong>de</strong>ntemente, <strong>la</strong> <strong>de</strong> consumo en fresco ha <strong>de</strong> tener unas mejores<br />
condiciones <strong>de</strong> almacenaje pues su calidad visual pue<strong>de</strong> <strong>de</strong>teriorarse más fácilmente que <strong>la</strong><br />
<strong>de</strong> patata <strong>de</strong> industria, don<strong>de</strong> este aspecto no es tan importante.<br />
Hay un 52% <strong>de</strong> operadores que trabajan predominantemente el fresco (más <strong>de</strong>l 90% <strong>de</strong> <strong>la</strong>s<br />
tone<strong>la</strong>das) y un 28% trabajan exclusivamente con <strong>de</strong>stino a industria (más <strong>de</strong>l 90% <strong>de</strong> sus<br />
mercancías).Un 8% combinan en distintas proporciones los dos <strong>de</strong>stinos principales (fresco e<br />
industria). Un 12% no han contestado a <strong>la</strong> pregunta.<br />
En <strong>la</strong>s APP hay 40% que trabajan únicamente para industria, un 30% exclusivamente para<br />
fresco y un 20% que trabajan ambos mercados (predominando el fresco). Una no ha<br />
contestado.<br />
6. ¿CUÁNTOS MESES SE ALMACENA LA PATATA?<br />
Las respuestas a esta pregunta han sido muy dispares, y <strong>la</strong>s c<strong>la</strong>sificaremos por nº <strong>de</strong> meses y<br />
por meses <strong>de</strong> almacenamiento:<br />
PERIODO DE ALMACENAJE<br />
SEPTIEMBRE-OCTUBRE<br />
OCTUBRE-NOVIEMBRE<br />
NOVIEMBRE-DICIEMBRE<br />
OCTUBRE-DICIEMBRE<br />
DICIEMBRE-FEBRERO<br />
DOS MESES<br />
TRES MESES<br />
% DE OPERADORES<br />
6%<br />
5%<br />
279
CUATRO MESES<br />
SEPTIEMBRE-DICIEMBRE<br />
OCTUBRE-ENERO<br />
13%<br />
NOVIEMBRE-FEBRERO<br />
CINCO MESES<br />
AGOSTO-DICIEMBRE<br />
SEPTIEMBRE-ENERO<br />
8%<br />
OCTUBRE-FEBRERO<br />
SEIS MESES<br />
JULIO-DICIEMBRE<br />
SEPTIEMBRE-FEBRERO<br />
14%<br />
OCTUBRE-MARZO<br />
SIETE MESES<br />
SEPTIEMBRE-MARZO<br />
12%<br />
OCTUBRE-ABRIL<br />
OCHO MESES<br />
SEPTIEMBRE-ABRIL<br />
12%<br />
OCTUBRE-MAYO<br />
NUEVE MESES<br />
SEPTIEMBRE-MAYO 12%<br />
DIEZ O MÁS MESES<br />
(TODO EL AÑO) 3%<br />
El 15% <strong>de</strong> los operadores no contestaron a esta pregunta.<br />
Es <strong>de</strong>stacable que el 55% <strong>de</strong>l total <strong>de</strong> operadores almacenan seis meses o más; aunque estas<br />
cifras casan poco con <strong>la</strong> realidad <strong>de</strong>l sector, pues <strong>la</strong> patata regional se consume toda antes <strong>de</strong><br />
<strong>la</strong>s fechas navi<strong>de</strong>ñas.<br />
Respecto a <strong>la</strong>s APP, lo contestado es lo siguiente:<br />
SEIS MESES<br />
OCTUBRE-MARZO 10%<br />
SIETE MESES<br />
SEPTIEMBRE-MARZO<br />
OCTUBRE-ABRIL<br />
20%<br />
280
OCHO MESES<br />
SEPTIEMBRE-ABRIL 10%<br />
NUEVE MESES<br />
SEPTIEMBRE-MAYO 30%<br />
DIEZ MESES<br />
SEPTIEMBRE-JUNIO 10%<br />
El 20% no han contestado.<br />
Como se pue<strong>de</strong> observar, el p<strong>la</strong>zo <strong>de</strong> conservación es más amplio que en el caso <strong>de</strong><br />
operadores no APP.<br />
7. ¿CUÁNTO CUESTA ALMACENAR?<br />
Dividiendo los costes <strong>de</strong> almacenamiento en fijos (amortización <strong>de</strong> insta<strong>la</strong>ciones,<br />
conservación y mantenimiento, etc.) y variables (mermas, pérdidas, gastos <strong>de</strong> energía,<br />
tratamientos antigerminantes, etc.) resulta que <strong>de</strong> lo <strong>de</strong>c<strong>la</strong>rado por los operadores, un 52%<br />
son costes fijos y un 48% son costes variables.<br />
El coste medio total <strong>de</strong>c<strong>la</strong>rado en almacenamiento es <strong>de</strong> 0,05 €/Kg.<br />
En el caso <strong>de</strong> <strong>la</strong>s APP, <strong>la</strong> estructura <strong>de</strong> costes <strong>de</strong>c<strong>la</strong>rara es distinta. Aquí los costes variables<br />
sólo suponen un 19% <strong>de</strong>l total, mientras que los fijos ascien<strong>de</strong>n a un 81%.<br />
El coste medio total <strong>de</strong>c<strong>la</strong>rado es <strong>de</strong> 0,081 €/Kg.<br />
8. ¿CON QUÉ PERSONAL CUENTA EN SU EMPRESA?<br />
Se les pi<strong>de</strong> que <strong>de</strong>c<strong>la</strong>ren el personal con el que cuentan en su empresa, partiendo <strong>de</strong> tres<br />
categorías: operarios, técnicos y directivos.<br />
Los resultados arrojan una media <strong>de</strong> 7,6 operarios, 1,5 técnicos y 1 directivo por empresa.<br />
Evi<strong>de</strong>ntemente, <strong>la</strong> dispersión es muy gran<strong>de</strong>, habiendo empresas que funcionan sólo con el<br />
directivo y otras que funcionan con hasta 70 empleados.<br />
281
Para <strong>la</strong>s APP, los medios humanos que disponen <strong>de</strong> media son: 3,8 empleados, 1,6 técnicos y<br />
un directivo por empresa.<br />
9. ¿QUÉ ORIGEN TIENE SU PRODUCTO?<br />
Las respuestas a esta pregunta se pue<strong>de</strong>n c<strong>la</strong>sificar <strong>de</strong> <strong>la</strong> siguiente manera:<br />
• Con importaciones importantes (40%): un operador.<br />
• Con importaciones puntuales (5% al 20%): veinte operadores.<br />
• Sin importaciones: el resto, 43 operadores.<br />
Respecto al mercado nacional, se abastecen fuera <strong>de</strong> Castil<strong>la</strong> y León en una cantidad:<br />
> 50%: 8 operadores<br />
< 50%: 54 operadores.<br />
Dos operadores no contestaron a esta pregunta.<br />
En el caso <strong>de</strong> <strong>la</strong>s APP, como es lógico, su abastecimiento <strong>de</strong> patata <strong>de</strong> fuera <strong>de</strong> <strong>la</strong> comunidad<br />
autónoma es muy escaso. Sólo hay una cooperativa que importe algo <strong>de</strong> patata (
11. ¿COMPRA SU PRODUCTO MEDIANTE CONTRATO?<br />
En este apartado se distingue <strong>la</strong> manera <strong>de</strong> adquirir el producto. Por un <strong>la</strong>do se contabilizarán<br />
<strong>la</strong>s empresas que contratan <strong>la</strong> compra, tanto <strong>de</strong> patata para industria como <strong>la</strong> <strong>de</strong> fresco. Por<br />
otro, se contabilizarán <strong>la</strong>s empresas que optan por el mercado libre.<br />
Las empresas que optan por el mercado libre (>50% <strong>de</strong> compras en mercado libre), ascien<strong>de</strong>n<br />
a 37.<br />
El resto, optan por celebrar contratos para garantizarse el suministro (al menos el 50% <strong>de</strong> <strong>la</strong><br />
patata comercializada). De esos 27 almacenistas, 8 contratan más <strong>de</strong>l 50% <strong>de</strong> su producción<br />
<strong>de</strong> fresco, mientras que los 19 restantes, contratan más <strong>de</strong>l 50% <strong>de</strong> su producción para patata<br />
<strong>de</strong> industria.<br />
La venta <strong>de</strong> producto, en buena lógica, es simi<strong>la</strong>r a <strong>la</strong> forma <strong>de</strong> adquisición, aunque también<br />
hay operadores que adquieren producto en el mercado libre y luego lo ven<strong>de</strong>n bajo contrato.<br />
Hay 31 empresas que ven<strong>de</strong>n como mínimo <strong>de</strong>l 80 al 100% <strong>de</strong> su producción en condiciones <strong>de</strong><br />
libre mercado. Otras 14 ven<strong>de</strong>n como mínimo el 85% <strong>de</strong> su producción bajo contrato. Las<br />
restantes (19) o bien participan <strong>de</strong> ambas formas <strong>de</strong> venta o bien son industrias que tienen<br />
contratada su producción pero que <strong>la</strong> venta <strong>la</strong> hacen en condiciones <strong>de</strong> mercado libre.<br />
En el caso <strong>de</strong> <strong>la</strong>s APP, sólo hay 3 que compren <strong>de</strong>l 80 al 100% s precio marcado en el mercado<br />
libre. Otras 6 contratan gran parte <strong>de</strong> su producción (mínimo el 95%) y una no ha respondido a<br />
<strong>la</strong> pregunta.<br />
Las ventas <strong>de</strong> <strong>la</strong>s APP se organizan <strong>de</strong> <strong>la</strong> siguiente forma: 3 ven<strong>de</strong>n el 100% al mercado libre, 5<br />
ven<strong>de</strong>n entre el 50 y el 100% <strong>de</strong> su producción bajo contrato y 2 no contestan.<br />
12. ¿A QUÉ MERCADOS SE DIRIGEN?<br />
Se preten<strong>de</strong> conocer si exportan o no producción y en el caso <strong>de</strong> exportar, que % <strong>de</strong> <strong>la</strong><br />
producción.<br />
No exportan: 22 operadores<br />
Exportan hasta un 25%: 21 operadores (preferentemente a Portugal)<br />
Exportan más <strong>de</strong> un 25%: 13 operadores, <strong>de</strong> los cuales 7 (<strong>de</strong> <strong>la</strong>s provincias <strong>de</strong> León, Zamora y<br />
Sa<strong>la</strong>manca) lo hacen con más <strong>de</strong>l 70%<strong>de</strong>l total <strong>de</strong> su producción.<br />
283
Las APP tienen menos vocación <strong>de</strong> comercio exterior. Hay dos que no exportan y el resto lo<br />
hacen con menos <strong>de</strong>l 30% <strong>de</strong> su producción.<br />
13. CANALES DE COMERCIALIZACIÓN EN LA VENTA DE PATATA.<br />
Once operadores ven<strong>de</strong>n más <strong>de</strong>l 50% <strong>de</strong> su producción a través <strong>de</strong> mercados, 15 hace lo<br />
propio con <strong>la</strong> gran distribución, mientras que sólo uno ven<strong>de</strong> más <strong>de</strong>l 50% en tiendas<br />
especializadas; 18 eligen a distribuidores para comercializar sus patatas, y sólo hay 2 que<br />
vendan más <strong>de</strong>l 50% al canal HORECA.<br />
Ocho ven<strong>de</strong>n sus productos a industrias <strong>de</strong> transformado y cinco ven<strong>de</strong>n más <strong>de</strong>l 50% <strong>de</strong> su<br />
mercancía a otros almacenistas.<br />
Las APP tienen otras preferencias a <strong>la</strong> hora <strong>de</strong> comercializar: 3 comercializan más <strong>de</strong>l 50% <strong>de</strong><br />
su mercancía a otros almacenistas, una a mercados y el resto ven<strong>de</strong> a industria para su<br />
transformación.<br />
284
BIBLIOGRAFÍA Y DOCUMENTACIÓN<br />
Cuestiones Generales.<br />
Revista Tierras <strong>de</strong> Castil<strong>la</strong> y León; Libros generales sobre <strong>la</strong> <strong>Patata</strong> (El cultivo <strong>de</strong> <strong>la</strong> patata-<br />
Fernando Alonso-, La <strong>Patata</strong> –Florencio Antolín y Oscar Carbonell-); <strong>P<strong>la</strong>n</strong>es Estratégicos <strong>de</strong>l<br />
sector hortofrutíco<strong>la</strong> en otras Comunida<strong>de</strong>s Autónomas; Información Web “Red <strong>Patata</strong>”,<br />
información sindicatos (OPAS), Documento Cooperativas (MARM en 2002): Caracterización <strong>de</strong>l<br />
Mercado y <strong>de</strong> <strong>la</strong> comercialización <strong>de</strong> <strong>la</strong> patata en <strong>la</strong>s cooperativas agrarias, Encuestas<br />
Productores y Operadores Castil<strong>la</strong> y León.<br />
Estadísticas <strong>de</strong>l cultivo.<br />
Web FAO, EUROSTAT, Ministerio <strong>de</strong> Medio Ambiente, Rural y Marino (MARM), Junta <strong>de</strong> Castil<strong>la</strong><br />
y León (D.G. Estadística), Encuestas a Productores <strong>de</strong> Castil<strong>la</strong> y León.<br />
Análisis <strong>de</strong>l comercio (Importaciones y exportaciones).<br />
DATACOMEX (Ministerio <strong>de</strong> Industria, Turismo y Comercio); EUROSTAT, Ministerio <strong>de</strong> Medio<br />
Ambiente, Rural y Marino (MARM); FEPEX; ESTACOM y EUROESTACOM (Ministerio <strong>de</strong> Industria,<br />
Turismo y Comercio); Junta <strong>de</strong> Castil<strong>la</strong> y León(ADE y D.G. Estadística), Encuestas a<br />
Productores <strong>de</strong> Castil<strong>la</strong> y León.<br />
Estimación <strong>de</strong> los costes <strong>de</strong> producción.<br />
Encuestas Productores Castil<strong>la</strong> y León, bibliografía técnica (Mundiprensa, OPAS, Revista<br />
Tierras), 2004: L´agriculture, noveaux défis- Edition 2007. (INSEE), 2004: Cost of production<br />
2006, a European perspective, British Potato Council 2006, 2008: Pomme <strong>de</strong> Terre hebdo.<br />
Nº910-20 jun 2009. CNIPT, 2009: Profil nº35 Aûtomne 2009. UNPT, Universidad <strong>de</strong> Wageningen<br />
(LEI, Farm Accountancy Data Network <strong>2010</strong>) y <strong>de</strong>l estudio “Cost of production 2006, A<br />
European Perspective”. British Potato Council 2006.<br />
Precios.<br />
Ministerio <strong>de</strong> Medio Ambiente, Rural y Marino (MARM), Encuestas productores <strong>de</strong> Castil<strong>la</strong> y<br />
León, MERCASA.<br />
285
Análisis <strong>de</strong>l consumo.<br />
TNS, MERCASA, Revista Alimarket, Revista Distribución y Consumo.<br />
Comercialización.<br />
TNS, MERCASA, Revista Alimarket, Revista Distribución y Consumo, Encuestas a operadores <strong>de</strong><br />
Castil<strong>la</strong> y León.<br />
<strong>Patata</strong> <strong>de</strong> siembra.<br />
Dirección General <strong>de</strong> Producción Agropecuaria (C. Albillos), APPACALE, Encuesta Productores<br />
<strong>de</strong> Castil<strong>la</strong> y León, EUROSTAT, FAOSTAT, Departamento <strong>de</strong> Agricultura y Desarrollo Rural <strong>de</strong> <strong>la</strong><br />
Comisión Europea.<br />
<strong>Patata</strong> en Francia.<br />
DATACOMEX, Web <strong>de</strong> <strong>la</strong> CNIPT, GIPT, INTERFEL y GNIS.<br />
<strong>Patata</strong> en Reino Unido.<br />
Departamento <strong>de</strong> Medio Ambiente, Alimentación y Asuntos Rurales <strong>de</strong>l Reino Unido, Web<br />
British Potato Council (BPC).<br />
<strong>Patata</strong> en Portugal.<br />
ICEX, Ministerio <strong>de</strong> Agricultura, Desarrollo Rural y Pesca <strong>de</strong> Portugal.<br />
Marco Normativo.<br />
B.O.E., D.U.E. y B.O.C.y L.<br />
I+D+i<br />
Web Neiker-Tecnalia, Universida<strong>de</strong>s y Centros <strong>de</strong> Investigación <strong>de</strong> carácter público, Web<br />
Junta <strong>de</strong> Castil<strong>la</strong> y León, Centro <strong>de</strong> Control <strong>de</strong> <strong>la</strong> <strong>Patata</strong> y Centro Regional <strong>de</strong> Diagnóstico,<br />
APPACALE, ITACyL. Personal involucrado en diversos proyectos <strong>de</strong> todos estos organismos.<br />
286
INDICE DE TABLAS Y GRÁFICOS<br />
GRÁFICO 2.1. PRODUCCIÓN MUNDIAL DE PATATA EN EL AÑO 2008, EXPRESADA EN MILLONES DE TONELADAS. .........13<br />
TABLA 2.1. PRODUCCIÓN MUNDIAL DE PATATA POR PAÍSES EN LOS AÑOS 1998-2008, EXPRESADA EN DECENAS DE MILES<br />
DE TONELADAS. .....................................................................................................14<br />
TABLA 2.2. SUPERFICIE MUNDIAL DE PATATA POR PAÍSES EN LOS AÑOS 1998-2008, EXPRESADA EN MILES DE<br />
HECTÁREAS. .........................................................................................................15<br />
GRÁFICO 2.2. PAÍSES CON MAYOR SUPERFICIE DEDICADA AL CULTIVO DE PATATA EN 2008, EXPRESADA EN MILES DE<br />
HECTÁREAS. .........................................................................................................16<br />
GRÁFICO 2.3. PAÍSES CON MAYORES RENDIMIENTOS DE PATATA EN 2008 EXPRESADOS EN t/ha. ..........................16<br />
TABLA 2.3. RENDIMIENTO MUNDIAL DE PATATA POR PAÍSES EN LOS AÑOS 1998-2008, EXPRESADO EN t/ha..............17<br />
GRÁFICO 2.4. PRODUCCIÓN DE PATATAS EN LA UE (27) EN LOS AÑOS 1998-2008, EXPRESADA EN MILLONES DE<br />
TONELADAS. .........................................................................................................18<br />
TABLA 2.4. PRODUCCIÓN DE PATATAS EN LA U.E. POR ESTADOS MIEMBROS EN LOS AÑOS 1998-2008, EXPRESADA EN<br />
MILES DE TONELADAS. ..............................................................................................19<br />
TABLA 2.5. SUPERFICIE DE PATATA EN LA U.E. POR ESTADOS MIEMBROS EN LOS AÑOS 1998-2007, EXPRESADA EN MILES<br />
DE HECTÁREAS.......................................................................................................20<br />
GRÁFICO 2.5. PRINCIPALES PAÍSES PRODUCTORES DE PATATA EN LA UE (27) EN 2008, EXPRESADO EN MILES DE<br />
TONELADAS. .........................................................................................................21<br />
GRÁFICO 2.6. SUPERFICIE CULTIVADA DE PATATA EN UE (27) EN 1998-2008, EXPRESADA EN MILES DE HECTÁREAS. ...21<br />
GRÁFICO 2.7. PAÍSES DE LA UE (27) CON MAYOR SUPERFICIE DE PATATA EN 2008, EXPRESADA EN MILES DE HECTÁREAS.<br />
........................................................................................................................22<br />
GRÁFICO 2.8. PAÍSES DE LA UE (27) CON MAYORES RENDIMIENTOS DE PATATA EXPRESADOS EN 2008, EN t/ha. ........22<br />
TABLA 2.6. RENDIMIENTO DE PATATA EN LA U.E. EN LOS AÑOS 1998-2008, EXPRESADO EN TONELADAS/HECTÁREA. SE<br />
INCLUYE CASTILLA Y LEÓN PARA COMPARAR CON OTROS PAÍSES.............................................23<br />
TABLA 3.1. EVOLUCIÓN DE LA PRODUCCIÓN DE PATATA EN ESPAÑA, EXPRESADA EN MILES DE TONELADAS..............25<br />
GRÁFICO 3.1. EVOLUCIÓN DE LA PRODUCCIÓN DE PATATA EN ESPAÑA EN LOS AÑOS 1990-2009, EXPRESADA EN MILES<br />
DE TONELADAS. .....................................................................................................26<br />
GRAFICO 3.2. PRODUCCIÓN DE PATATA EN ESPAÑA POR CC.AA. EN 2008, EXPRESADA EN MILES DE TONELADAS........26<br />
TABLA 3.2. PRODUCCIÓN DE PATATA EN ESPAÑA EN 2007 POR CC.AA, EXPRESADA EN MILES DE TONELADAS............27<br />
GRÁFICO 3.3. EVOLUCIÓN DE LA SUPERFICIE DE PATATA EN ESPAÑA, EXPRESADA EN MILES DE HECTÁREAS. ............28<br />
TABLA 3.3. EVOLUCIÓN DE LA SUPERFICIE DE PATATA EN ESPAÑA, EXPRESADA EN MILES DE HECTÁREAS. ...............28<br />
TABLA 3.4. SUPERFICIE, PRODUCCIÓN Y RENDIMIENTO DE PATATA EN SECANO Y REGADÍO EN ESPAÑA EN 2007. .......29<br />
GRÁFICO 3.4. EVOLUCIÓN DE LOS RENDIMIENTOS MEDIOS DE PATATA EN ESPAÑA, EXPRESADOS EN TONELADAS POR<br />
HECTÁREA............................................................................................................30<br />
TABLA 3.5. EVOLUCIÓN DE LOS RENDIMIENTOS MEDIOS DE PATATA EN ESPAÑA, EXPRESADOS EN TONELADAS POR<br />
HECTÁREA............................................................................................................30<br />
GRÁFICO 3.5. PORCENTAJE QUE REPRESENTAN LOS GRUPOS DE PATATA, EN FUNCIÓN DE LA ÉPOCA DE RECOLECCIÓN,<br />
CON RESPECTO AL TOTAL EN EL AÑO 2008. .....................................................................32<br />
GRÁFICO 3.6. EVOLUCIÓN DE CADA GRUPO DE PATATA, EXPRESADA EN PORCENTAJE DE LA PRODUCCIÓN TOTAL EN<br />
LOS AÑOS 1990-2009................................................................................................32<br />
GRÁFICO 3.7. IMPORTANCIA, EXPRESADA EN PORCENTAJE DE PRODUCCIÓN, DE LAS CC.AA. PRODUCTORAS DE PATATA<br />
EXTRATEMPRANA, EN EL AÑO 2008. ..............................................................................33<br />
GRÁFICO 3.8. IMPORTANCIA, EXPRESADA EN PORCENTAJE DE PRODUCCIÓN, DE LAS CC.AA. PRODUCTORAS DE PATATA<br />
TEMPRANA, EN EL AÑO 2008.......................................................................................34<br />
TABLA 3.6. SUPERFICIE, PRODUCCIÓN Y RENDIMIENTO DE PATATA DE MEDIA ESTACIÓN POR CC.AA. .....................35<br />
GRÁFICO 3.7. PRODUCCIÓN DE PATATA DE MEDIA ESTACIÓN POR CC.AA, EN EL AÑO 2008 EXPRESADO EN TONELADAS.<br />
........................................................................................................................36<br />
TABLA 3.7. SUPERFICIE Y PRODUCCIÓN DE PATATA DE MEDIA ESTACIÓN EN CASTILLA Y LEÓN.............................36<br />
GRÁFICO 3.8. PRODUCCIÓN DE PATATA TARDÍA POR CC.AA, EN EL AÑO 2008 EXPRESADA EN TONELADAS. ..............37<br />
TABLA 3.8. SUPERFICIE, PRODUCCIÓN Y RENDIMIENTO DE PATATA TARDÍA, POR CC.AA. ...................................38<br />
287
TABLA 3.9. SUPERFICIE Y PRODUCCIÓN DE PATATA TARDÍA EN CASTILLA Y LEÓN............................................39<br />
GRÁFICO 3.8. CALENDARIO DE COMERCIALIZACIÓN Y PRODUCCIÓN DE PATATA, DE LAS DIFERENTES ZONAS<br />
PRODUCTORAS DE ESPAÑA Y PRINCIPALES PAÍSES ABASTECEDORES DEL MERCADO ESPAÑOL. ............40<br />
TABLA 3.10. BALANCE DE UTILIZACIÓN DE PATATA EN ESPAÑA, EXPRESADO EN MILES DE TONELADAS. ..................41<br />
TABLA 4.1. PRODUCCIÓN TOTAL DEL SUBSECTOR AGRÍCOLA EN EL PERÍODO 1996-2008, EXPRESADA EN MILLONES DE €.<br />
........................................................................................................................43<br />
GRÁFICO 4.2. PRODUCCIÓN DE PATATA EN LAS PROVINCIAS DE CASTILLA Y LEÓN, EN LOS AÑOS 1998-2009, EXPRESADA<br />
EN TONALADAS. .....................................................................................................45<br />
GRÁFICO 4.3. PRODUCCIÓN Y SUPERFICIE DE PATATA EN LAS PROVINCIAS DE CASTILLA Y LEÓN, EN EL AÑO 2008,<br />
EXPRESADAS EN PORCENTAJE RESPECTO AL TOTAL DE LA COMUNIDAD. ....................................45<br />
TABLA 4.2. PRODUCCIÓN (t), SUPERFICIE (ha) Y RENDIMIENTOS (t/ha) EN CASTILLA Y LEÓN EN LOS AÑOS 1998-2009, Y<br />
COMPARACIÓN CON EL TOTAL NACIONAL. .......................................................................46<br />
GRÁFICO 4.5. SUPERFICIE DE PATATA EN LAS PROVINCIAS DE CASTILLA Y LEÓN EN LOS AÑOS 1998-2009, EXPRESADA EN<br />
HECTÁREAS. .........................................................................................................47<br />
GRÁFICO 4.6. RENDIMIENTO DE PATATA EN ESPAÑA Y EN CASTILLA Y LEÓN EN LOS AÑOS 1998-2009, EXPRESADO EN<br />
t/ha. ..................................................................................................................48<br />
GRÁFICO 4.7. RENDIMIENTO MEDIO DE PATATA EN CASTILLA Y LEÓN EN LOS AÑOS 1998-2009, EXPRESADO EN t/ha. ..48<br />
TABLA 4.4. SUPERFICIE, PRODUCCIÓN Y RENDIMIENTO DE PATATA EN CASTILLA Y LEÓN, POR ÉPOCAS DE<br />
RECOLECCIÓN........................................................................................................51<br />
GRÁFICO 4.8. PRODUCCIÓN DE PATATA DE MEDIA ESTACIÓN EN CASTILLA Y LEÓN, EXPRESADA EN TONELADAS. .......52<br />
GRÁFICO 4.8. PRODUCCIÓN DE PATATA TARDÍA EN CASTILLA Y LEÓN, EXPRESADA EN TONELADAS. ......................52<br />
TABLA 4.5. SUPERFICIE DE PATATA EN COMARCAS DE CASTILLA Y LEÓN EN 2008, EXPRESADO EN HECTÁREAS. .........54<br />
TABLA 4.6. VARIEDADES MAYORITARIAMENTE CULTIVADAS EN CASTILLA Y LEÓN Y SUS PROVINCIAS, EN EL AÑO 2009. 55<br />
GRÁFICO 4.2.1. EVOLUCIÓN DE LA SUPERFICIE DE PRODUCCIÓN INTEGRADA EN PATATAS EXPRESADA EN HECTÁREAS. 57<br />
GRÁFICO 4.2.2. NÚMERO DE PRODUCTORES ACOGIDOS A LA PRODUCCIÓN INTEGRADA DE PATATAS......................58<br />
GRÁFICO 4.2.3. PRODUCTO COMERCIALIZADO DE PATATAS EN PRODUCCIÓN INTEGRADA EN TONELADAS................58<br />
TABLA 5.1. IMPORTACIONES DE PATATA DE LA UE EN LOS AÑOS 1998-2008, EXPRESADAS EN TONELADAS. ..............61<br />
GRÁFICO 5.1. EVOLUCIÓN DE LAS IMPORTACIONES DE PATATA DE LA U.E. EN LOS AÑOS 1998-2008, EXPRESADA EN<br />
TONELADAS. .........................................................................................................62<br />
TABLA 5.2. PRINCIPALES IMPORTACIONES DE PATATA DE LA U.E. DESDE PAÍSES TERCEROS EN LOS AÑOS 2003-2008,<br />
EXPRESADAS EN TONELADAS.......................................................................................62<br />
GRÁFICO 5.2. IMPORTACIONES DE PATATA DE LA UE EN LOS AÑOS 2006-2008 POR MESES, EXPRESADAS EN TONELADAS.<br />
........................................................................................................................63<br />
TABLA 5.3. EXPORTACIONES DE PATATA DE LA U.E. DESDE PAÍSES TERCEROS ENTRE 2000-2008, EXPRESADAS EN<br />
TONELADAS. .........................................................................................................63<br />
GRÁFICO 5.3. EVOLUCIÓN DE LAS EXPORTACIONES DE PATATA DE LA U.E. EN LOS AÑOS 2000-2008, EXPRESADA EN<br />
TONELADAS. .........................................................................................................64<br />
TABLA 5.4. PRINCIPALES PAÍSES DESTINATARIOS DE LAS EXPORTACIONES DE PATATA DE LA U.E, EXPRESADAS EN<br />
TONELADAS. .........................................................................................................64<br />
GRÁFICO 5.4. EXPORTACIONES DE PATATA DE LA U.E. POR MESES EN LOS AÑOS 2006-2008, EXPRESADAS EN<br />
TONELADAS. .........................................................................................................65<br />
GRÁFICO 6.1. EVOLUCIÓN DE LAS IMPORTACIONES DE PATATA EN ESPAÑA, EN LOS AÑOS 1999-2008, EXPRESADA EN<br />
TONELADAS. .........................................................................................................67<br />
TABLA 6.1. IMPORTACIONES DE ESPAÑA DE PATATA POR PAÍSES EN LOS AÑOS 2002-2009, EXPRESADAS EN TONELADAS.<br />
........................................................................................................................68<br />
GRÁFICO 6.2. EVOLUCIÓN DE LAS IMPORTACIONES DE PATATA EN LOS AÑOS 1997 Y 2008, EXPRESADA EN TONELADAS.<br />
........................................................................................................................68<br />
GRÁFICO 6.3. EVOLUCIÓN DE LAS IMPORTACIONES DE PATATA DE PAÍSES NO PERTENECIENTES A LA U.E EN LOS AÑOS<br />
2000-2008, EXPRESADA EN TONELADAS. .........................................................................69<br />
TABLA 6.2. PORCENTAJE DE IMPORTACIÓN POR MESES, RESPECTO AL TOTAL................................................70<br />
GRÁFICO 6.4.IMPORTACIONES DE PATATA EN ESPAÑA POR MESES, ENTRE 2007-2009, EXPRESADAS EN TONELADAS. ...70<br />
288
TABLA 6.3. IMPORTACIONES DE PATATA EN ESPAÑA POR CC.AA EN LOS AÑOS 2006-2008, EXPRESADAS EN TONELADAS.<br />
........................................................................................................................71<br />
TABLA 6.4. IMPORTACIONES DE PATATA EN LAS PROVINCIAS DE CASTILLA Y LEÓN, EXPRESADAS EN TONELADAS. ......71<br />
TABLA 6.5. IMPORTACIONES DE PATATA EN ESPAÑA POR PAÍSES EN LOS AÑOS 2007-2009,EXPRESADAS EN MILLONES DE<br />
EUROS. ...............................................................................................................72<br />
TABLA 6.6. IMPORTACIONES DE PATATA EN ESPAÑA POR MESES EN LOS AÑOS 2007-2009, EXPRESADAS EN MILLONES DE<br />
EUROS. ...............................................................................................................73<br />
TABLA 6.7. VALOR DE LAS IMPORTACIONES DE PATATA REALIZADAS EN CASTILLA Y LEÓN EN LOS AÑOS 2003-2008,<br />
EXPRESADO EN MILES DE EUROS...................................................................................73<br />
GRÁFICO 6.5. EVOLUCIÓN DE LAS EXPORTACIONES DE PATATA EN LOS AÑOS 1999-2008, EXPRESADA EN TONELADAS. 74<br />
TABLA 6.8. EXPORTACIONES DE ESPAÑA DE PATATA POR PAÍSES EN LOS AÑOS 2002-2009, EXPRESADAS EN TONALADAS.<br />
........................................................................................................................74<br />
GRÁFICO 6.6. EXPORTACIONES DE PATATA DE ESPAÑA POR PAÍSES EN LOS AÑOS 1997-2008, EXPRESADAS EN<br />
TONELADAS. .........................................................................................................75<br />
TABLA 6.9. PORCENTAJE DE EXPORTACIÓN DE PATATA ESPAÑOLA, POR MESES RESPECTO AL TOTAL.....................76<br />
GRÁFICO 6.7.EXPORTACIONES DE PATATA EN ESPAÑA POR MESES, EN LOS AÑOS 2007-2009, EXPRESADAS EN<br />
TONELADAS. .........................................................................................................76<br />
TABLA 6.10. EXPORTACIONES DE PATATA DE ESPAÑA POR CC.AA ENTRE 2007-2009, EXPRESADAS EN TONELADAS. ....76<br />
TABLA 6.11. PROVINCIAS ESPAÑOLAS QUE MÁS PATATA EXPORTARON EN LOS AÑOS 2006 Y 2007, EXPRESADO EN<br />
TONELADAS. .........................................................................................................77<br />
TABLA 6.12. EXPORTACIÓN DE PATATA EN LAS PROVINCIAS DE CASTILLA Y LEÓN, EXPRESADA EN TONELADAS. ........77<br />
TABLA 6.13. EXPORTACIONES DE PATATA EN ESPAÑA POR PAÍSES EN LOS AÑOS 2007-2009, EXPRESADAS EN MILLONES<br />
DE EUROS.............................................................................................................78<br />
TABLA 6.14. EXPORTACIONES DE PATATA EN ESPAÑA POR MESES EN LOS AÑOS 2007-2009, EXPRESADAS EN MILLONES<br />
DE EUROS.............................................................................................................78<br />
TABLA 6.15. EXPORTACIONES DE PATATA EN ESPAÑA POR CC.AA EN LOS AÑOS 2007-2009, EXPRESADAS EN EUROS...79<br />
TABLA 6.16. EXPORTACIONES DE PATATA EN CASTILLA Y LEÓN, EXPRESADAS EN EUROS. ..................................80<br />
TABLA 6.17. VALOR DE LAS EXPORTACIONES DE PATATA REALIZADAS EN CASTILLA Y LEÓN EN LOS AÑOS 2003 - 2008,<br />
EXPRESADO EN MILES DE EUROS...................................................................................80<br />
GRÁFICO 6.8. EVOLUCIÓN MENSUAL DE LAS EXPORTACIONES E IMPORTACIONES ESPAÑOLAS DE PATATA EN 2008,<br />
EXPRESADA EN TONELADAS. .......................................................................................81<br />
GRÁFICO 6.9. EVOLUCIÓN MENSUAL DE LAS EXPORTACIONES E IMPORTACIONES ESPAÑOLAS DE PATATA EN 2008,<br />
EXPRESADA EN MILES DE EUROS...................................................................................82<br />
GRÁFICO 6.10. EVOLUCIÓN MENSUAL DE LAS EXPORTACIONES E IMPORTACIONES DE CASTILLA Y LEÓN DE PATATA EN<br />
2008, EXPRESADA EN TONELADAS.................................................................................82<br />
GRÁFICO 6.11. EVOLUCIÓN MENSUAL DE LAS EXPORTACIONES E IMPORTACIONES DE CASTILLA Y LEÓN DE PATATA EN<br />
2008, EXPRESADA EN MILES DE EUROS. ..........................................................................83<br />
TABLA 7.1. PRECIOS DE PATATA IMPORTADA PARA CONSUMO EN FRESCO EN LOS ÚLTIMOS AÑOS EXPRESADO EN €/t. 87<br />
TABLA 7.2. COSTES CONJUNTOS DE PRODUCCIÓN Y ALMACENAJE EN €/t, DE PATATA PRODUCIDA EN CASTILLA Y LEÓN<br />
FRENTE AL PRECIO MEDIO DE PATATA IMPORTADA DE FRANCIA (*)...........................................87<br />
GRÁFICO 8.1. PRECIOS PERCIBIDOS POR LOS AGRICULTORES ENTRE 2004-2008 EN ESPAÑA, EXPRESADOS EN €/kg. ...91<br />
GRÁFICO 8.2. PRECIOS MEDIOS PERCIBIDOS POR LOS AGRICULTORES EN CASTILLA Y LEÓN EN LOS AÑOS 1999-2009,<br />
EXPRESADOS EN €/Kg...............................................................................................92<br />
GRÁFICO 8.3. PRECIOS MEDIOS PAGADOS POR COMPRADORES EN LOS AÑOS 2006-2009, EN COMERCIO LIBRE,<br />
EXPRESADOS EN €/Kg...............................................................................................93<br />
GRÁFICO 8.4. PRECIOS MEDIOS PAGADOS POR COMPRADORES EN LOS AÑOS 2006-2009 EN COMERCIO CONTRATADO,<br />
EXPRESADOS EN €/Kg...............................................................................................93<br />
GRÁFICO 8.5. PRECIOS MEDIOS PAGADOS POR COMPRADORES EN EL PERIODO 1999-2009. EN €/Kg. (*) ..................94<br />
GRÁFICO 8.6. PRECIOS MEDIOS DE PATATA DE MEDIA ESTACIÓN, PAGADOS POR COMPRADORES EN EL PERIODO 1999 Y<br />
2009. (*)..............................................................................................................94<br />
GRÁFICO 8.7. PRECIOS MEDIOS DE PATATA TARDÍA PAGADOS POR COMPRADORES, EN EL PERIODO 1999 - 2009.(*) ....95<br />
289
GRÁFICO 8.8. PRECIOS MEDIOS DE PATATA DE INDUSTRIA, PAGADOS POR COMPRADORES EN EL PERIODO 1999-2009.(*)<br />
........................................................................................................................95<br />
GRÁFICO 8.9. PRODUCCIÓN DE PATATA EN CASTILLA Y LEÓN, Y PRECIOS PERCIBIDOS POR LOS AGRICULTORES EN LOS<br />
AÑOS 1999-2009, CANTIDADES EXPRESADAS EN TONELADAS Y PRECIOS EN EUROS.........................96<br />
TABLA 9.1. CONSUMO DE PATATA EN LA U.E EN LOS AÑOS 2000-2008, EXPRESADO EN Kg PER CAPITA.................99<br />
TABLA 9.2. NIVEL DE AUTOABASTECIMIENTO DE LOS PAÍSES DE LA UE....................................................... 100<br />
TABLA 9.3. CONSUMO EN EL HOGAR POR COMUNIDADES AUTONOMAS EN EL AÑO 2008. ................................. 102<br />
TABLA 9.4. CONSUMO Y GASTO DE PATATAS EN ESPAÑA. ..................................................................... 107<br />
TABLA 9.5 ESTRUCTURA DE GASTO EN LA ALIMENTACIÓN DE CASTILLA Y LEÓN............................................ 108<br />
TABLA 9.6 CONSUMO Y GASTO EN PATATAS DE LOS HOGARES EN 2008...................................................... 109<br />
TABLA 10.1: COMERCIALIZACION DE PATATA A TRAVES DE LA RED DE MERCAS, EXPRESADA EN MILES DE TONELADAS.<br />
...................................................................................................................... 123<br />
GRAFICO 10.1: CANTIDAD DE PATATA COMERCIALIZADA. UNIDADES EXPRESADAS EN PORCENTAJE SOBRE EL TOTAL DE<br />
LA MEDIA EN LOS AÑOS 2000-2009. ............................................................................. 123<br />
TABLA 10.2: COMERCIALIZACION DE PATATA A TRAVES DE LA RED DE MERCAS, EXPRESADA EN MILLONES DE EUROS. 124<br />
TABLA 10.3: CANTIDAD DE PATATA COMERCIALIZADA POR MERCAMADRID Y PRECIOS PAGADOS EN LOS AÑOS 2008 Y<br />
2009................................................................................................................. 124<br />
TABLA 10.4. PRECIO MEDIO AL QUE SE HA VENDIDO LA PATATA EN LA RED MERCASA, ENTRE 2000-2008, EN €/Kg. .. 125<br />
GRÁFICO 10.2. EVOLUCIÓN DE LOS PRECIOS DE MERCASA EN LA SERIE DE AÑOS 2000-2008. ............................. 125<br />
GRÁFICO 11.1: PRODUCCIÓN MUNDIAL DE SEMILLA DE PATATA Y DE PATATA, EXPRESADO EN MILES DE TONELADAS. 135<br />
TABLA 11.1 SUPERFICIE DE PATATA DE SIEMBRA EN LOS PAÍSES DE LA U.E.................................................. 138<br />
GRÁFICO 11.2 EVOLUCIÓN DE LA SUPERFICIE DE PATATA DE SIEMBRA, EN LOS PRINCIPALES PAÍSES DE LA .UE,<br />
EXPRESADA EN HECTÁREAS. ..................................................................................... 139<br />
GRÁFICO 11.3: EXPORTACIONES DE PATATA DE SIEMBRA, DEL TOTAL DE PAÍSES DE LA U.E, EXPRESADAS EN<br />
TONELADAS. ....................................................................................................... 141<br />
GRÁFICA 11.4: IMPORTACIONES DE PATATA DE SIEMBRA, DEL TOTAL DE PAÍSES DE LA U.E, EXPRESADAS EN TONELADAS.<br />
...................................................................................................................... 143<br />
GRÁFICO 11.5: EVOLUCIÓN EN HECTÁREAS, DE LA SUPERFICIE DE PATATA DE SIEMBRA EN CASTILLA Y LEÓN Y<br />
PORCENTAJE CON RESPECTO A ESPAÑA........................................................................ 146<br />
TABLA 11.2. DATOS DE LA PRODUCCIÓN DE PATATA DE SIEMBRA EN CASTILLA Y LEÓN. .................................. 148<br />
TABLA 11.3. PRINCIPALES ENTIDADES PRODUCTORAS DE PATATA DE SIEMBRA EN CASTILLA Y LEÓN. ................... 150<br />
GRÁFICO 11.6: EVOLUCIÓN DE LA SUPERFICIE Y PRODUCCIÓN DE PATATA DE SIEMBRA. .................................. 151<br />
TABLA 11.5: PRECIOS MEDIOS DE PATATA DE SIEMBRA PARA PRODUCIR CONSUMO (€/Kg.) EN EL AÑO 2009. .......... 154<br />
TABLA 11.6: PRECIOS MEDIOS EN EL AÑO 2009 (€/Kg.), DE PATATA DE SIEMBRA IMPORTADA PARA MULTIPLICACIÓN “A”<br />
Y “E”, EN CALIBRE 35/55MM..................................................................................... 155<br />
TABLA 11.7: UTILIZACIÓN DE PATATA DE SIEMBRA CERTIFICADA NACIONAL E IMPORTADA (t.)........................... 155<br />
TASA DE UTILIZACIÓN SOBRE TOTAL DE NECESIDADES EN PORCENTAJE. .................................................... 155<br />
TABLA 11.8: RESULTADOS DE ENSAYOS DE POST-CONTROL DE PATATA DE SIEMBRA....................................... 156<br />
GRÁFICO 11.7 DESTINO DE LAS PRODUCCIONES NACIONALES DE PATATA DE SIEMBRA..................................... 158<br />
TABLA 11.9 COMERCIALIZACIÓN DE VARIEDADES OBTENIDAS POR APPACALE. .............................................. 159<br />
TABLA 11.10: ESTIMACIÓN DE DEMANDA DE PATATA DE SIEMBRA EN CASTILLA Y LEÓN. .................................. 160<br />
TABLA 12.1. SUPERFICIE (ha), PRODUCCIÓN (t) Y RENDIMIENTO (t/ha) DE PATATA EN FRANCIA ENTRE 1993-2008. .. 171<br />
GRÁFICO 12.1. SUPERFICIE (ha) Y PRODUCCIÓN (t) DE PATATA EN FRANCIA ENTRE 1993-2008. ......................... 172<br />
GRÁFICO 12.2. PRINCIPALES ZONAS PRODUCTORAS DE PATATA EN FRANCIA. MEDIA DE LOS AÑOS 2006-2008. ........ 172<br />
TABLA 12.2. EXPORTACIONES DE PATATA DE FRANCIA A PAÍSES DE LA U.E, ENTRE 2006-2008, EXPRESADO EN<br />
TONELADAS. ....................................................................................................... 174<br />
GRÁFICO 12.3. PRINCIPALES PAÍSES A LOS QUE FRANCIA EXPORTA PATATA ENTRE 2006-2008. EN TONELADAS. ...... 174<br />
TABLA 12.3. EXPORTACIONES DE PATATA DE FRANCIA A PAÍSES TERCEROS, ENTRE 2006-2008, EXPRESADAS EN<br />
TONELADAS. ....................................................................................................... 175<br />
290
TABLA 12.4: IMPORTACIONES DE PATATA DE FRANCIA ENTRE 2006-2008, EXPRESADAS EN TONELADAS................ 176<br />
GRÁFICO 12.4. PRINCIPALES PAÍSES DE LOS QUE FRANCIA IMPORTA PATATA, ENTRE 2006-2008, EXPRESADO EN<br />
TONELADAS. ....................................................................................................... 176<br />
GRAFICO 12.5: SUPERFICIES Y PRODUCCIONES DE PATATA EN EL REINO UNIDO............................................ 187<br />
GRAFICO 12.6: RENDIMIENTO MEDIO DE PATATA EN EL REINO UNIDO........................................................ 188<br />
TABLA 14.1: CANTIDAD PRODUCIDA DE LAS VARIEDADES OBTENIDAS POR APPACALE Y SOCIOS. EN Kg. ................ 231<br />
TABLA 15.1: COMPOSICIÓN QUÍMICA Y VALOR NUTRICIONAL DE 100 GRAMOS DE PATATA COCIDA. ..................... 236<br />
GRÁFICO 15.1. PIRÁMIDE DE LA ALIMENTACIÓN SALUDABLE................................................................... 237<br />
291