Plan de muestreo de áreas para la región Sierra
Plan de muestreo de áreas para la región Sierra
Plan de muestreo de áreas para la región Sierra

Create successful ePaper yourself
Turn your PDF publications into a flip-book with our unique Google optimized e-Paper software.
Diseño<br />
Muestral y Construcción<br />
<strong>de</strong>l Marco <strong>de</strong> Muestreo <strong>de</strong> Area en <strong>la</strong> Región <strong>Sierra</strong><br />
HT-02: TABLA DE FRECUENCIAS DE IIUT<br />
A NIVEL DE PROVINCIA<br />
Intervalos IIUT<br />
(%)<br />
Menos <strong>de</strong> 10<br />
De 10 a 19<br />
De 20 a 29<br />
De 30 a 39<br />
De 40 a 49<br />
De 50 a 59<br />
De 60 a 69<br />
De 70 a 79<br />
De 80 a 89<br />
De 90 a 100<br />
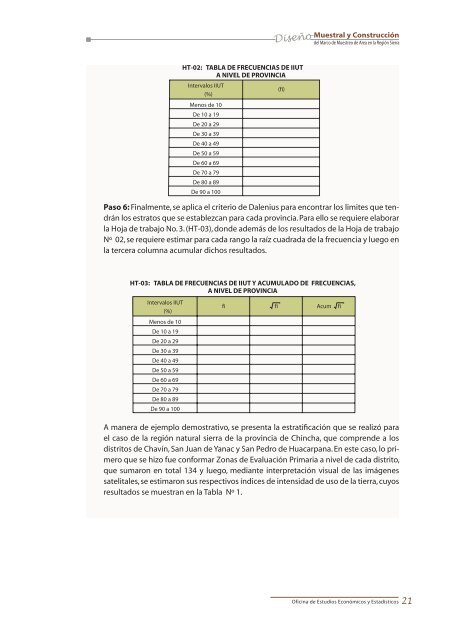
Paso 6: Finalmente, se aplica el criterio <strong>de</strong> Dalenius <strong>para</strong> encontrar los limites que tendrán<br />
los estratos que se establezcan <strong>para</strong> cada provincia. Para ello se requiere e<strong>la</strong>borar<br />
<strong>la</strong> Hoja <strong>de</strong> trabajo No. 3. (HT-03), don<strong>de</strong> a<strong>de</strong>más <strong>de</strong> los resultados <strong>de</strong> <strong>la</strong> Hoja <strong>de</strong> trabajo<br />
Nº 02, se requiere estimar <strong>para</strong> cada rango <strong>la</strong> raíz cuadrada <strong>de</strong> <strong>la</strong> frecuencia y luego en<br />
<strong>la</strong> tercera columna acumu<strong>la</strong>r dichos resultados.<br />
(fi)<br />
HT-03: TABLA DE FRECUENCIAS DE IIUT Y ACUMULADO DE FRECUENCIAS,<br />
A NIVEL DE PROVINCIA<br />
Intervalos IIUT<br />
(%)<br />
Menos <strong>de</strong> 10<br />
De 10 a 19<br />
De 20 a 29<br />
De 30 a 39<br />
De 40 a 49<br />
De 50 a 59<br />
De 60 a 69<br />
De 70 a 79<br />
De 80 a 89<br />
De 90 a 100<br />
fi<br />
fi Acum fi<br />
A manera <strong>de</strong> ejemplo <strong>de</strong>mostrativo, se presenta <strong>la</strong> estratificación que se realizó <strong>para</strong><br />
el caso <strong>de</strong> <strong>la</strong> región natural sierra <strong>de</strong> <strong>la</strong> provincia <strong>de</strong> Chincha, que compren<strong>de</strong> a los<br />
distritos <strong>de</strong> Chavín, San Juan <strong>de</strong> Yanac y San Pedro <strong>de</strong> Huacarpana. En este caso, lo primero<br />
que se hizo fue conformar Zonas <strong>de</strong> Evaluación Primaria a nivel <strong>de</strong> cada distrito,<br />
que sumaron en total 134 y luego, mediante interpretación visual <strong>de</strong> <strong>la</strong>s imágenes<br />
satelitales, se estimaron sus respectivos índices <strong>de</strong> intensidad <strong>de</strong> uso <strong>de</strong> <strong>la</strong> tierra, cuyos<br />
resultados se muestran en <strong>la</strong> Tab<strong>la</strong> Nº 1.<br />
Oficina <strong>de</strong> Estudios Económicos y Estadísticos<br />
21