Exportaciones e Importaciones Pesqueras 2012 - Ministerio de ...
Exportaciones e Importaciones Pesqueras 2012 - Ministerio de ...
Exportaciones e Importaciones Pesqueras 2012 - Ministerio de ...

You also want an ePaper? Increase the reach of your titles
YUMPU automatically turns print PDFs into web optimized ePapers that Google loves.
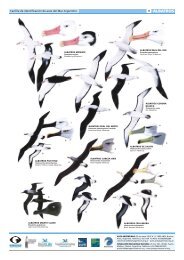
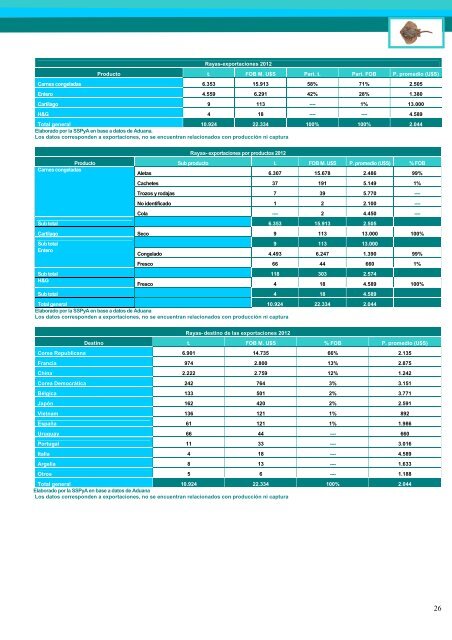
Rayas-exportaciones <strong>2012</strong><br />
Producto t. FOB M. U$S Part. t. Part. FOB P. promedio (U$S)<br />
Carnes congeladas 6.353 15.913 58% 71% 2.505<br />
Entero 4.559 6.291 42% 28% 1.380<br />
Cartílago 9 113 ---- 1% 13.000<br />
H&G 4 18 ---- ---- 4.589<br />
Total general 10.924 22.334 100% 100% 2.044<br />
Elaborado por la SSPyA en base a datos <strong>de</strong> Aduana.<br />
Los datos correspon<strong>de</strong>n a exportaciones, no se encuentran relacionados con producción ni captura<br />
Rayas- exportaciones por productos <strong>2012</strong><br />
Producto Sub producto t. FOB M. U$S P. promedio (U$S) % FOB<br />
Carnes congeladas<br />
Aletas 6.307 15.678 2.486 99%<br />
Cachetes 37 191 5.149 1%<br />
Trozos y rodajas 7 39 5.770 ----<br />
No i<strong>de</strong>ntificado 1 2 2.100 ----<br />
Cola ---- 2 4.450 ----<br />
Sub total 6.353 15.913 2.505<br />
Cartílago Seco 9 113 13.000 100%<br />
Sub total 9 113 13.000<br />
Entero<br />
Congelado 4.493 6.247 1.390 99%<br />
Fresco 66 44 660 1%<br />
Sub total 118 303 2.574<br />
H&G<br />
Fresco 4 18 4.589 100%<br />
Sub total 4 18 4.589<br />
Total general 10.924 22.334 2.044<br />
Elaborado por la SSPyA en base a datos <strong>de</strong> Aduana<br />
Los datos correspon<strong>de</strong>n a exportaciones, no se encuentran relacionados con producción ni captura<br />
Rayas- <strong>de</strong>stino <strong>de</strong> las exportaciones <strong>2012</strong><br />
Destino t. FOB M. U$S % FOB P. promedio (U$S)<br />
Corea Republicana 6.901 14.735 66% 2.135<br />
Francia 974 2.800 13% 2.875<br />
China 2.222 2.759 12% 1.242<br />
Corea Democrática 242 764 3% 3.151<br />
Bélgica 133 501 2% 3.771<br />
Japón 162 420 2% 2.591<br />
Vietnam 136 121 1% 892<br />
España 61 121 1% 1.986<br />
Uruguay 66 44 ---- 660<br />
Portugal 11 33 ---- 3.016<br />
Italia 4 18 ---- 4.589<br />
Argelia 8 13 ---- 1.633<br />
Otros 5 6 ---- 1.188<br />
Total general 10.924 22.334 100% 2.044<br />
Elaborado por la SSPyA en base a datos <strong>de</strong> Aduana<br />
Los datos correspon<strong>de</strong>n a exportaciones, no se encuentran relacionados con producción ni captura<br />
26