Exportaciones e Importaciones Pesqueras 2012 - Ministerio de ...
Exportaciones e Importaciones Pesqueras 2012 - Ministerio de ...
Exportaciones e Importaciones Pesqueras 2012 - Ministerio de ...

Create successful ePaper yourself
Turn your PDF publications into a flip-book with our unique Google optimized e-Paper software.
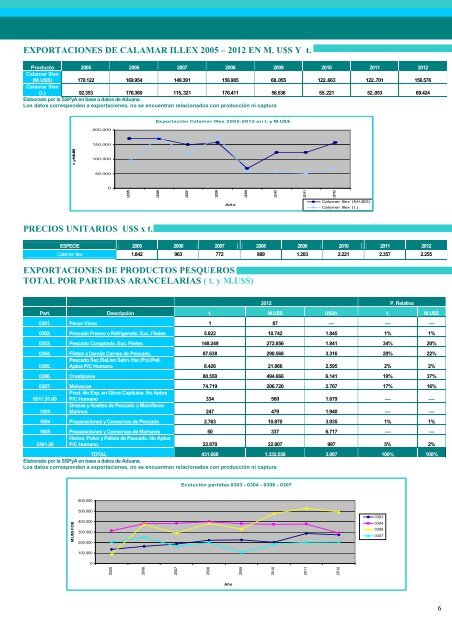
EXPORTACIONES DE CALAMAR ILLEX 2005 – <strong>2012</strong> EN M. U$S Y t.<br />
Producto 2005 2006 2007 2008 2009 2010 2011 <strong>2012</strong><br />
Calamar Illex<br />
(M.U$S) 170.122 169.954 149.391 156.985 68..055 122..663 122..701 156.576<br />
Calamar Illex<br />
(t.) 92.353 176.360 115..321 176.411 56.536 55..221 52..053 69.424<br />
Elaborado por la SSPyA en base a datos <strong>de</strong> Aduana.<br />
Los datos correspon<strong>de</strong>n a exportaciones, no se encuentran relacionados con producción ni captura<br />
200.000<br />
Exportación Calamar Illex 2005-<strong>2012</strong> en t. y M.U$$<br />
150.000<br />
100.000<br />
50.000<br />
0<br />
2005<br />
2006<br />
2007<br />
2008<br />
2009<br />
2010<br />
2011<br />
<strong>2012</strong><br />
t. y M.U$$<br />
Año<br />
Calamar Illex (M.U$S)<br />
Calamar Illex (t.)<br />
PRECIOS UNITARIOS U$S x t.<br />
ESPECIE 2005 2006 2007 2008 2009 2010 2011 <strong>2012</strong><br />
Calamar Illex 1.842 963 772 889 1.203 2.221 2.357 2.255<br />
EXPORTACIONES DE PRODUCTOS PESQUEROS<br />
TOTAL POR PARTIDAS ARANCELARIAS ( t. y M.U$S)<br />
<strong>2012</strong> P. Relativa<br />
Part. Descripción t. M.U$S U$S/t. t. M.U$S<br />
0301. Peces Vivos 1 87 ---- ---- ----<br />
0302. Pescado Fresco o Refrigerado. Exc. Filetes 5.822 10.742 1.845 1% 1%<br />
0303. Pescado Congelado. Exc. Filetes 148.249 272.856 1.841 34% 20%<br />
0304. Filetes y Demás Carnes <strong>de</strong> Pescado. 87.638 290.568 3.316 20% 22%<br />
Pescado Sec./Sal./en Salm. Har./Pol./Pell.<br />
0305. Aptos P/C Humano 8.426 21.866 2.595 2% 2%<br />
0306. Crustáceos 80.550 494.666 6.141 19% 37%<br />
0307. Moluscos 74.719 206.720 2.767 17% 16%<br />
0511.91.00<br />
Prod. No Exp. en Otros Capítulos. No Aptos<br />
P/C Humano 334 560 1.679 ---- ----<br />
1504<br />
Grasas y Aceites <strong>de</strong> Pescado y Mamíferos<br />
Marinos 247 479 1.940 ---- ----<br />
1604 Preparaciones y Conservas <strong>de</strong> Pescado 2.763 10.870 3.935 1% 1%<br />
1605 Preparaciones y Conservas <strong>de</strong> Mariscos 50 337 6.717 ---- ----<br />
Harina, Polvo y Pellets <strong>de</strong> Pescado. No Aptos<br />
2301.20 P/C Humano. 22.870 22.807 997 5% 2%<br />
TOTAL 431.668 1.332.558 3.087 100% 100%<br />
Elaborado por la SSPyA en base a datos <strong>de</strong> Aduana.<br />
Los datos correspon<strong>de</strong>n a exportaciones, no se encuentran relacionados con producción ni captura<br />
Evolución partidas 0303 - 0304 - 0306 - 0307<br />
600.000<br />
M.U$S FOB<br />
500.000<br />
400.000<br />
300.000<br />
200.000<br />
0303<br />
0304<br />
0306<br />
0307<br />
100.000<br />
0<br />
2005<br />
2006<br />
2007<br />
2008<br />
2009<br />
2010<br />
2011<br />
<strong>2012</strong><br />
Año<br />
6