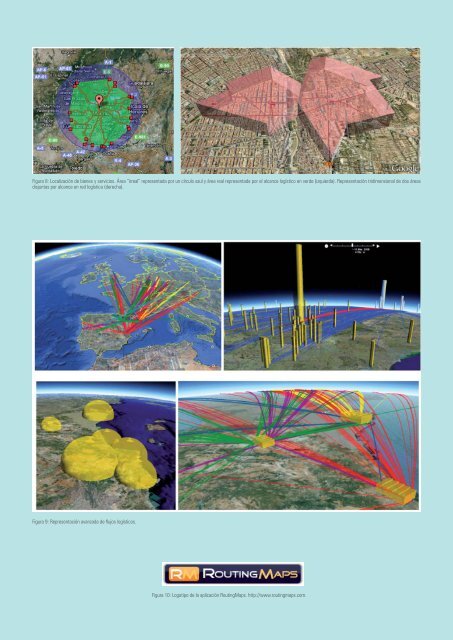
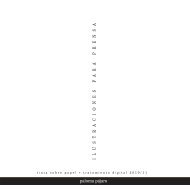
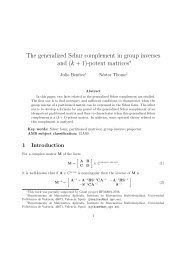
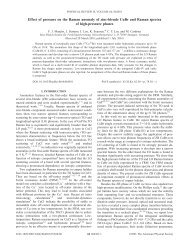
4. Módulo de cálculo de distancias. Se trata de un módulo muyavanzado. Aquí se calculan los caminos mínimos entre cadapar de clientes de la base de datos. Si se tienen 1.000 clientes,son necesarias nada más y nada menos que 1 millón dedistancias mínimas. El uso de las más modernas tecnologíasy la arquitectura avanzada de <strong>RoutingMaps</strong> permiten hacerestos cálculos en minutos, en vez de los típicos días queserían necesarios. Una captura de este módulo se muestraen la Figura 4.5. Módulo de gestión de flotas, escenarios, clientes y entregas.Aquí se desarrollan todas las necesidades y recursosdisponibles que generan el escenario de rutas a resolver. Sepuede ver una captura de ejemplo en la Figura 5.6. Asistentes para la resolución de diversos problemas de rutas.A partir de todos los datos anteriores, que se agrupan enescenarios, se aplican potentes algoritmos de rutas para suresolución. Se muestran varias capturas en las Figuras 6 y 7.Como se puede ver, <strong>RoutingMaps</strong> es una aplicación actual, que aúnalas últimas tecnologías informáticas <strong>con</strong> los últimos desarrollos en loque se refiere a algoritmos de optimización estado del arte.Figura 4: Módulo de cálculo masivo de distancias de <strong>RoutingMaps</strong> en funcionamiento.4. Esto solo es el principio. Desarrollos futurosActualmente, <strong>RoutingMaps</strong> es capaz de resolver problemas realesde rutas de vehículos <strong>con</strong> flotas heterogéneas y restricciones decapacidad, tiempo y duración máxima de las rutas, entre muchasotras cosas. Los resultados, ya obtenidos, a lo largo de <strong>con</strong>venios<strong>con</strong> distintas empresas de varios sectores (incluyendo distribución)son muy prometedores y se observan mejoras muy relevantes enahorros de costes, tiempos de cálculo y mejora general de la organizaciónlogística. En cualquier caso, esto es tan solo el comienzo yhay muchas otras posibilidades y mejoras en curso. La tecnologíaestá disponible y solo hace falta el interés para desarrollarla. Para lassiguientes versiones, <strong>RoutingMaps</strong> resolverá problemas mucho máscomplejos, que incorporen ventanas de entrega, múltiples almacenesy otras restricciones. Un reto adicional aparece en la posibilidadde resolver problemas de planificación donde se decide, dentro deun horizonte de tiempo, cuándo hay que visitar a un cliente.Otros desarrollos aparecen en la mercadotecnia. La Figura 8 muestrael efecto de calcular áreas de influencia reales, siguiendo la redlogística a la hora de localizar un bien y/o servicio. Las áreas “Euclídeas”proporcionan una información distorsionada de la realidad.La Figura 9 muestra el resultado de avanzadas técnicas de visualizaciónde datos logísticos como flujos, cantidad de materiales transportados,etc. Se puede decir que, <strong>con</strong> los modernos sistemas GIS y<strong>RoutingMaps</strong>, las posibilidades son virtualmente infinitas.Figura 5: Módulo de flotas de <strong>RoutingMaps</strong> en funcionamiento.Figura 6: Módulo de cálculo de rutas, proceso de optimización de <strong>RoutingMaps</strong> en curso.5. ConclusionesEn este trabajo se ha puesto de manifiesto la importancia capitalque tiene la logística para las empresas españolas y cómo se tratade un problema de difícil solución, principalmente debido a la enormevariedad de problemas de distribución posibles, la complejidadalgorítmica de los modelos de optimización subyacentes y las necesidadesde datos.Figura 7: Resultado de la optimización de rutas de <strong>RoutingMaps</strong>, visualizando resultados y trabajando<strong>con</strong> el escenario.Revista del Instituto Tecnológico de Informática Actualidad TIC || 9
Figura 8: Localización de bienes y servicios. Área “irreal” representada por un círculo azul y área real representada por el alcance logístico en verde (izquierda). Representación tridimensional de dos áreasdisjuntas por alcance en red logística (derecha).Figura 9: Representación avanzada de flujos logísticos.Figura 10: Logotipo de la aplicación <strong>RoutingMaps</strong>. http://www.routingmaps.com.10 || Actualidad TICRevista del Instituto Tecnológico de Informática