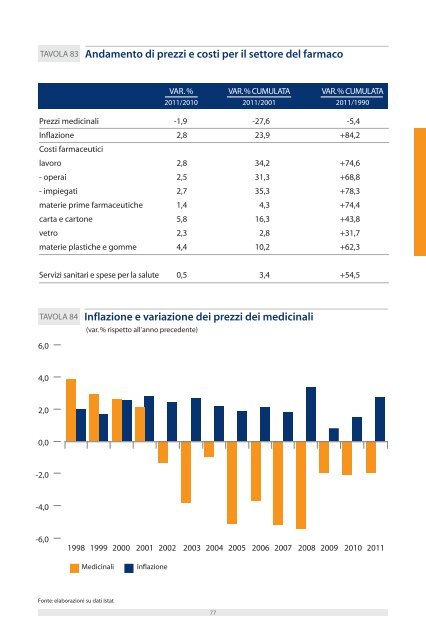
Benchmark<strong>in</strong>g <strong>in</strong>ternazionale prezzi e costi Il 2011 è stato ancora un anno di calo per i prezzi dei medic<strong>in</strong>ali, con riduzioni di prezzo per i farmaci rimborsabili e sostanziale stabilità per quelli a prezzo libero. Il risultato mostra un calo dei prezzi totali <strong>del</strong> -1,9% <strong>in</strong> media d’anno (il decimo consecutivo), <strong>in</strong> controtendenza rispetto all’<strong>in</strong>flazione (+2,8%). Il dato <strong>del</strong> 2011 prosegue un trend fortemente discendente dei prezzi dei farmaci, che dal 2001 sono scesi complessivamente <strong>del</strong> 27,6%, a fronte di un aumento <strong>del</strong>l’<strong>in</strong>flazione <strong>del</strong> 23,9% e di <strong>in</strong>crementi dei costi <strong>in</strong> praticamente tutte le loro voci. Ancora più evidente il calo per i medic<strong>in</strong>ali rimborsabili che, anche per effetto <strong><strong>del</strong>le</strong> molte manovre di taglio che si sono succedute negli anni, sono dim<strong>in</strong>uiti <strong>del</strong> 38% dal 2001 al 2011. Rispetto al 1990 i prezzi dei medic<strong>in</strong>ali sono scesi <strong>del</strong> -5,4% rispetto al +84,2% <strong>del</strong> valore complessivo dei prezzi al consumo. Anche gli altri importanti Paesi europei hanno visto un calo dei prezzi dei medic<strong>in</strong>ali nel 2011, ma <strong>in</strong> media l’<strong>Italia</strong> ha avuto un risultato <strong>in</strong>feriore (-1,9% rispetto a -1,3%). Dal 2001 i prezzi dei medic<strong>in</strong>ali sono scesi <strong>in</strong> tutti i Paesi considerati, ma l’<strong>Italia</strong> mostra una performance più negativa (-27,6% rispetto a una media di -15,3%), con tassi di <strong>in</strong>flazione superiori alla media. Tali dati confermano il trend storico <strong>del</strong> rapporto tra prezzi dei medic<strong>in</strong>ali e <strong>in</strong>flazione, globalmente <strong>in</strong> calo <strong>in</strong> tutti i Paesi europei, ma più rapidamente <strong>in</strong> <strong>Italia</strong>. Il ricavo medio <strong><strong>in</strong>dustriale</strong> <strong>in</strong> <strong>Italia</strong> nel 2011 è dim<strong>in</strong>uito <strong>del</strong> 2,8% rispetto al 2010 e complessivamente <strong>del</strong> 9,8% negli ultimi c<strong>in</strong>que anni, confermandosi ai livelli più bassi fra i pr<strong>in</strong>cipali Paesi UE (6,3 euro rispetto a una media di 9,3). Confrontando il valore a ricavo <strong>in</strong>dustria (cioè al netto <strong>del</strong>l’IVA e <strong>del</strong>la distribuzione), il Cergas Bocconi ha rilevato che per i primi 200 farmaci con obbligo di prescrizione, con stesso pr<strong>in</strong>cipio attivo e <strong>in</strong>dicazione terapeutica, l’<strong>Italia</strong> è, tra i Paesi considerati, quello con i prezzi più bassi e <strong>in</strong> generale con un livello <strong>in</strong>feriore di circa il 20% rispetto alla media. Anche nel canale ospedaliero, un’analisi <strong>del</strong>lo stesso Cergas Bocconi mostra come l’<strong>Italia</strong> abbia prezzi <strong>in</strong>feriori alla media degli altri grandi Paesi europei, <strong>del</strong> 10% circa <strong>in</strong> media prendendo come riferimento i 5 Big Ue. 76
TAVOLA 83 Andamento di prezzi e costi per il settore <strong>del</strong> <strong>farmaco</strong> Prezzi medic<strong>in</strong>ali Inflazione Costi farmaceutici lavoro - operai - impiegati materie prime farmaceutiche carta e cartone vetro materie plastiche e gomme Servizi sanitari e spese per la salute Fonte: elaborazioni su dati Istat VAR. % 2011/2010 -1,9 2,8 2,8 2,5 2,7 1,4 5,8 2,3 4,4 0,5 77 VAR. % CUMULATA 2011/2001 -27,6 23,9 34,2 31,3 35,3 4,3 16,3 2,8 10,2 TAVOLA 84 Inflazione e variazione dei prezzi dei medic<strong>in</strong>ali 6,0 4,0 2,0 0,0 -2,0 -4,0 -6,0 (var. % rispetto all’anno precedente) 1998 1999 2000 2001 2002 2003 2004 2005 2006 2007 2008 2009 2010 2011 Medic<strong>in</strong>ali Inflazione 3,4 VAR. % CUMULATA 2011/1990 -5,4 +84,2 +74,6 +68,8 +78,3 +74,4 +43,8 +31,7 +62,3 +54,5