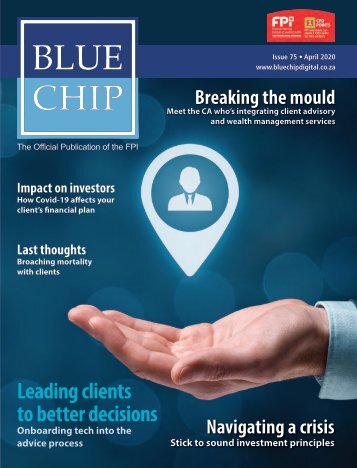
Blue Chip Journal Issue 75 - April 2020
- Text
- Technology
- Dfms
- Funds
- Retirement
- Insurance
- Management
- Funds
- Management
- Investment
- Planning
- Investors
- Planner
- Markets
- Global
- Equity
- Wealth
- Hedge
INVESTMENT Thinking
INVESTMENT Thinking beyond the crisis Perspective is crucial when it comes to long-term investing We find ourselves amid a pandemic that has had a profound short-term impact not only on our daily lives but virtually every other aspect of life including the hard-earned savings of our clients. The period from 17 February 2020 to 19 March 2020 saw a staggering meltdown in equity markets as the JSE All Share Index (ALSI) lost 30.3% in just 23 trading days and the S&P 500 lost 33.7% in US dollars over a similar period. As a financial advisor, your clients look to you for answers to their burning questions. When will life return to normal? How does South Africa come out of this? Is my financial plan still on track given the Covid-19 crash or should I take further action? It is often useful to look to history for context. This is easier said than done during a crisis when the natural response is to act first and to think only about the short term. Winston Churchill famously said, “The farther back you can look, the farther forward you are likely to see.” The chart below illustrates previous crises against the long-term performance of the ALSI over the last 90 years. It is plotted on a log scale to make the relative sizes of each highlighted drawdown more comparable visually. The chart contains a few very obvious observations. The first of which is that equities have been an extraordinary investment over the last 90 years during which the ALSI compounded by 13.6% p.a. in nominal terms – meaning that every R100 invested in 1930 would be worth R9.8-million today. Start End Drawdown Recovery time Source: Bloomberg. The second obvious point is that the market has had several periods of significant drawdowns as shown by the highlighted sections. The final observation is that while the Covid-19 crash has been rapid in its punishment of equities, the size of the drawdown is not unique. Looking at each highlighted period individually makes for interesting reading. Consider the table above that quantifies the previous drawdowns, the time it took to recover from the sell-off and the subsequent returns over the short, medium and long term. The periods highlighted in the table represent an average drawdown of -39% with an average time to recovery of less Subsequent 1 year Subsequent 2 years Subsequent 3 years Subsequent 5 years Subsequent 10 years June 1931 July 1932 -35% . 7 months 83% . 141% . 183% . 263% . 439% . February 1948 September 1953 -38% . 7 years, 9 months 17% . 20% . 18% . 45% . 194% . June 1969 October 1971 -57% . 1 year, 8 months 95% . 118% . 155% . 88% . 967% . April 1974 December 1976 -35% . 1 year, 8 months 28% . 73% . 220% . 420% . 1902% . November 1980 July 1982 -39% . 5 months 126% . 157% . 198% . 572% . 1182% . September 1987 May 1988 -39% . 11 months 69% . 105% . 113% . 181% . 592% . May 1998 August 1998 -39% . 1 year, 3 months 53% . 97% . 116% . 141% . 731% . June 2002 April 2003 -30% . 1 year, 4 months 43% . 78% . 208% . 370% . 587% . June 2008 February 2009 -40% . 1 year, 8 months 48% . 83% . 101% . 194% . 304% . Average -39% 1 year, 11 months 62% . 97% . 146% . 253% . 766% . All returns are cumulative than two years. As one can expect after a period where asset prices reduce by such a meaningful amount, the subsequent long-term performance was very strong, with investors gaining 2.5 times and almost 7.7 times their investment on average over the subsequent five and 10 years respectively. In the month following the unprecedented meltdown in equities due to the Covid-19 pandemic, the ALSI had recovered by 30.4% off its lows of 19 March, while the S&P 500 was up 28.7% in US dollars. History may not repeat itself, but it may well prove once again to rhyme. Drawdown period ALSI Sources: Coronation and IRESS Christo Lineveldt is an Investment Specialist at Coronation Fund Managers 36 www.bluechipdigital.co.za
Through the ups and downs, and for every day to come, we’ll never stop working to earn your trust and grow your money. We are in solidarity. By supporting the Solidarity Fund you’re supporting the nation, www.solidarityfund.co.za Coronation is an authorised financial services provider. Trust is Earned
- Page 1 and 2: Issue 75 • April 2020 www.bluechi
- Page 3 and 4: OF INNOVATION
- Page 5 and 6: Advice software. Built for better p
- Page 7 and 8: Company cultures will also be teste
- Page 10 and 11: ADVERTORIAL Financial planning whil
- Page 12: On the money Making waves this quar
- Page 15 and 16: 100 % SAVINGS 0% TAX WOULDN’T YOU
- Page 17 and 18: Earn free 16 verifiable CPD points.
- Page 19 and 20: advisor’s business. The advisor h
- Page 21 and 22: CASE STUDY the first quarter relati
- Page 23 and 24: The most up-to-date fund performanc
- Page 25 and 26: HEDGE FUNDS that advisors frequentl
- Page 27 and 28: www.bluechipdigital.co.za
- Page 29 and 30: DFMs Diligent evaluation How to get
- Page 31 and 32: Best investment Advisory Team South
- Page 33 and 34: Invest in a carefree retirement lif
- Page 35 and 36: Your employees’ financial life go
- Page 37: ARE THE FUNDS YOU INVEST IN INDEPEN
- Page 41 and 42: urprise, then, that Ricardo Semler,
- Page 43 and 44: PORTFOLIOS We have had portfolio ma
- Page 45 and 46: are increasingly becoming more domi
- Page 47 and 48: Time tracking Before you can decide
- Page 49 and 50: While writing this article, I did a
- Page 51 and 52: Governance FPI has been on a journe
- Page 53 and 54: TECHNOLOGY Deploying technology in
- Page 55 and 56: FINANCIAL PLANNER OF THE YEAR For a
- Page 57 and 58: *The above companies were fund mana
- Page 59 and 60: Excellent service in your time of n
Inappropriate
Loading...
Mail this publication
Loading...
Embed
Loading...


