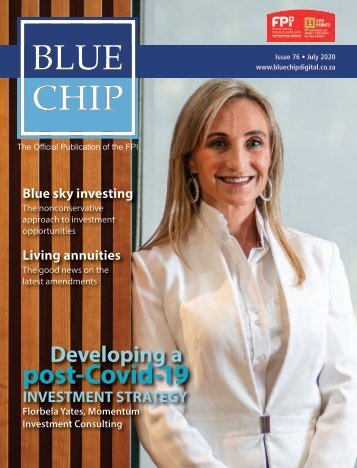
Blue Chip Journal Issue 76
- Text
- Investment
- Planners
- Funds
- Investors
- Probability
- Pandemic
- Global
- Planners
- Investing
- Equity
- Advisors
- Asset
INVESTMENT STRATEGY
INVESTMENT STRATEGY Investors have been saddled with far greater responsibility in recent decades as defined contribution schemes replaced defined benefit schemes. Along with investors living longer, this creates a challenge for retirement planning. CoreShares Asset Management took a fresh look at this challenge through a scientific lens. Evidence-based investing is an investment strategy that is not influenced by short-term market trends or predictions. Instead, it relies on accurate facts and credible analysis (published and peer-reviewed) – to make calculated, unbiased decisions. The result for an investor is a higher likelihood that they will achieve their investment goals. events like the Covid-19 crisis. Here, we have explored an approach that is focused on key controllables across asset allocation, cost management and diversification and uses Smart Beta to align client goals with the portfolio. The evidence: asset allocation CoreShares assessed the inflation goal and converted it into a target of CPI+3%. We saw that across any rolling seven-year period over the last 118 years, equity outperforms this benchmark 76% of the time, while bonds only have a 37% chance of beating it. We concluded that to provide inflation protection, a longterm asset allocation needs enough risky We also weighed up the effectiveness of using tactical asset allocation (or “tilting”) to take advantage of any short-term market trends to improve performance. We examined 15 years’ performance history in the (ASISA) Low Equity category and found that managers lowered their chances of beating a CPI+3% benchmark by using tactical asset allocation (only overthrowing the benchmark 32% of the time). Had they simply stuck to their long-term strategic asset allocation, they would have beaten this benchmark 48% of the time. The evidence: costs There has been plenty of focus on costs in recent years, especially as local equity Controlling the “controllables” in uncertain times Using evidence-based investing principles to meet investment goals Approaching the investment challenge We started with the assumption that, in retirement planning, advisors must help investors work out the amount of income they can draw, and how much they can increase this each year to maintain their lifestyle (i.e. inflation protection). They must also help investors choose investments that are unlikely to result in permanent loss of capital. These investment goals are to: • Create enough income 100% 100% • Protect against inflation 100% 80% 80% • Protect capital 80% 60% 60% An evidence-based investor approaches 100% 60% 40% 40% this problem by first starting with the 40% 80% 20% 20% “controllables”. These are decisions we 20% 0% make based on reliable data and history 60% 0% – such as asset allocation, diversification 40% and fees. We try to avoid making decisions based 20% on the “uncontrollables” or speculative 0% forecasts, for example, trying to predict short-term market performance or macro 28 www.bluechipdigital.co.za assets to deliver the required returns with a high level of probability. While equity is considered a “risky” asset, and will certainly introduce higher levels of volatility into a portfolio in the short-term, the risk of having too little exposure to this ‘risky’ asset class is of failing to beat the benchmark and satisfy the goal of inflation protection over Keeping Keeping the goal the in mind: goal in The mind: Importance 60% The Importance of Equityof Equity 60% Keeping the Keeping goal the in the mind: long goal term. The in mind: Importance The Importance of Equityof Equity 60% markets have delivered a disappointing performance, with investors scrutinising where each basis point of their performance has gone. Some investors still argue that they are Does Tactical Asset Allocation improve Does Tactical Asset happy Allocation to pay Does higher improve Tactical fees performance? Asset to a Allocation manager that improve performan Does Tactical Asset Allocation improve performance? Does Tactical delivers Asset superior Allocation performance. improve performance? But is this Impact of TAA on return predictability Impact of TAA on return predictability necessarily the case? 60% Impact of TAA on return predictability Morningstar says that Impact of TAA on return predictability Does Tactical the goal The of “the Does single Tactical Asset Impact largest Allocation Asset of TAA on determinant 50% Allocation return predictability improve improve of performance? a fund’s performance? Keeping the Keeping goal in mind: in The mind: Importance The Importance of Equityof Equity 48,18% 48,18% 50% Keeping the goal in mind: Does The Tactical 60% Importance Asset 50% of Allocation Equity improve performance? 48,18% Does Purchasing Tactical Power Purchasing Power Asset Allocation 50% improve 40% performance? 48,18% 40% 50% 40% Purchasing Power Purchasing Power Impact of TAA Impact on return of TAA predictability on return predictability 32,05% 100% KEEPING 100% THE 90% GOAL IN MIND: 90% 32,05% THE IMPORTANCE Power OF EQUITY 60% DOES 60% TACTICAL ASSET ALLOCATION 32,05% Purchasing Power Purchasing Power 40% 30% IMPROVE PERFORMANCE? 90% 90% 75,67% 75,67% 30% 40% 30% 32,05% 80% 100% 100% 90% 75,67% 80% 90% 75,67% 90% 32,05% Impact of TAA on return predictability48,18% 48,18% 62% 50% 62% 50% 30% 20% Purchasing Power 60% 75,67% 80% 60% 75,67% 75,67% 62% 20% 60% 62% 30% Impact of TAA on return 20% predictability 80% 90% 60% 62% 62% 40% 62% 36,90% 40% 20% 10% 36,90% 40% 60% 40% 10% 60% 20% 36,90% 36,90% 32,05% 10% 32,05% 48,18% 50% 75,67% 30% 30% 10% 0% 48,18% 20% 36,90% 40% 20% 36,90% 40% 50% 0% 36,90% 10% 0% Average Manager TAA Consistency Average M Average Manager TAA Consistency Average 0% 0% 20% 20% 62% Manager SAA TAA Consistency Consistnecy Average Manager SAA Consis 40% 0% 20% 20% 0% Equity Equity Bonds Bonds Average Manager Source: TAA Consistency Morningstar. Historic probability of Average relative three Manager year rolling outperformance SAA Consistnecy relative to CPI + 40% Source: Morningstar. Historic probability of relative Equity Equity Bonds Bonds Average three 32,05% Manager year rolling Source: outperformance TAA Consistency Morningstar. relative Historic ASISA CPI probability +3%. Multi-Asset of Average relative Low Equity three Manager Category year rolling for outperformance the SAA period Consistnecy July 2005 relative to end to CPI December +3%. 2019 ASISA Multi-Asset Low Equity 0% 0% 10% Category for the 10% period July 2005 to end ASISA December Multi-Asset 2019 Low Equity Past Category performance the is period not an July indication 2005 to of end future December performance. 2019 Past 30% performance is 32,05% not an indication of future performance. Source: Morningstar. Past Historic performance probability is not of an . relative indication three of year future rolling performance. outperformance relative to CPI +3%. Probability Equity of Maintaining Probability Purchasing of Equity Maintaining Equity Power Purchasing Probability Power . of Bonds Maintaining Probability Purchasing of Maintaining Bonds Bonds Power Purchasing ASISA + 3% Multi-Asset Power . Low Equity + 36,90% Source: Morningstar. Historic probability of relative three 3% Category year rolling for outperformance the period July 2005 relative to end to CPI December +3%. 2019 Probability of Maintaining Probability Purchasing of Maintaining Power Purchasing Probability Power 30% of Maintaining Probability Purchasing of Maintaining Power Purchasing + 3% ASISA 0% Multi-Asset Power + Low 0% 3% Equity Past Category performance the is period not an July indication 2005 to of end future December performance. 2019 Past performance is not an . indication of future performance. Average Manager Average TAA Manager Consistency TAA Consistency Average Manager Average SAA Manager Consistnecy SAA Consistnecy . Probability of Maintaining Probability Purchasing of Maintaining of Power Purchasing Probability Power Power of Maintaining Probability 20% Purchasing of Maintaining of Power Purchasing + 3% Power Power + 3% + 3% Source: Morningstar. The 1901-2019. Source: evidence Morningstar. Historic probability 1901-2019. of shows Historic 20% outperforming probability CPI that returns of outperforming over the a 7 year CPI rolling goal returns period. over a of 7 year inflation rolling period. protection can be met with greater certainty by using an appropriate asset allocation (enough risky assets) and sticking to it (only Equity using strategic asset allocation and no Bonds tactical asset allocation). 0% 0% Average Manager TAA Consistency Average Manager SAA Consistnecy Probability of Maintaining Purchasing Power Average Manager Probability TAA Consistency of Maintaining Purchasing Average Power Manager + 3% SAA Consistnecy Source: Morningstar. Source: Historic Morningstar. probability Historic of relative probability three year of relative rolling three outperformance year rolling outperformance relative to CPI +3%. relative to CPI +3%. Source: Morningstar. 1901-2019. Source: Morningstar. Historic Past performance probability 1901-2019. of is outperforming not Historic Past an performance indication probability CPI of returns is future of not outperforming an over performance. indication a 7 year CPI of rolling future returns period. performance. over a 7 year rolling period. ASISA Multi-Asset ASISA Low Equity Multi-Asset Category Low for Equity the Category period July for 2005 the period to end July December 2005 to 2019 end December 2019 Past performance is not Past an indication performance of future is not performance. indication of future performance. 10% Past performance Past is not performance indication is not of future an indication performance. of future performance. Source: Morningstar. 1901-2019. Source: Source: Morningstar. Historic Morningstar. probability 1901-2019. 1901-2019. of outperforming Historic Historic probability probability CPI returns of outperforming of over outperforming a 7 year CPI rolling returns CPI period. returns over a over 7 year 7 rolling year rolling period. period. . . Past performance is not Past an indication performance Past performance of future is not performance. is not indication indication of future of future performance. 10% performance. Source: Morningstar. Historic probability of relative three year rolling outperformance relative to CPI +3%. ASISA Multi-Asset Low Equity Category for the period July 2005 to end December 2019 Source: Morningstar. Historic probability of relative three year rolling outperformance relative to CPI +3%. Past performance is not an indication of future performance. ASISA Multi-Asset Low Equity Category for the period July 2005 to end December 2019 . Past performance is not an indication of future performance. Source: Morningstar. 1901-2019. Historic probability . of outperforming CPI returns over a 7 year rolling period. Past performance is not an indication of future performance.
future success is the costs it charges” and our research shows that on average, the most expensive funds underperform. In the chart on page 29 (top left), we divided the low equity managers into quartiles based on fees. The most expensive quartile only beat the benchmark 25% of the time, while the cheapest quartile beat the benchmark 46% of the time. This might effective and efficient way for investors to implement the appropriate strategic asset allocation is to use low-cost funds as the building blocks, where indexation (aka passive investing) plays an important role. This is particularly useful in the low-yield environment in which South Africans have found themselves in recent years: every basis point counts. The evidence: capital protection Harry Markowitz claimed that “Diversification is the only free lunch in investing” and this certainly applies to capital protection in the world of multi-asset investing. By making sure portfolios are sufficiently diversified across geographies, industries and companies, we can limit exposure to any possible unforeseen company failure or event particular to a region or sector. Using passive strategies as the building blocks to implement the asset allocation decision is a precise and accurate way to Helping investors “stay the course” and not panic-sell during volatile periods adds significant value to a client’s total return in the long term. &P PIVA: South S&P SPIVA: SPIVA: Africa look South S&P like S&P 50 Africa a South negative South 50 Africa correlation, Africa 50but 50it is a make sure you get the exact exposure you causal link and not a correlation. The higher have chosen and remain well diversified. fees erode the performance that investors Using index strategies as the building receive. We conclude that the most blocks also brings a second benefit: S&P South S&P African South 50 S&P African index S&P South outperformed 50 South African index African outperformed 50 index over 50 index 96% outperformed of over 96% added of over over 96% increased 96% of of certainty. By using a South Africa South Equity Africa Funds South SPIVA: Equity South S&P over Africa SOUTH Funds Africa a 5 Equity AFRICA year over Equity 50 period Funds a 5 Funds year over period over a 5 year a passive 5 year period period fund, we avoid the risk that comes 100 ping the 100 100 goal in mind: Lowering Manager with selecting Selection an active Risk manager. The goal 90 in 90 mind: 90 Lowering Manager 96,2Selection most recent Risk 96,2S&P Index V Active (SPIVA) 80 80 80 97,9 97,9 97,9 97,9 ind: 85,3Lowering Manager 85,3 85,3 Selection Risk reports that over 96% of active managers 70 70 70 in South Africa have underperformed the Top 50 index over a five-year period ended 31 December 2019. [1] The difference 60 50 40 30 20 10 0 Predictability && & Cost: Cost: Impact of of cost of cost cost on on on achieving CPI CPI CPI goals goals goals 3,0% 3,0% 3,0% 2,5% 2,5% 2,5% 2,0% 2,0% 2,0% 1,5% 1,5% 1,5% 1,0% 1,0% 1,0% 0,5% 0,5% 0,5% 0,0% 0,0% 0,0% PREDICTABILITY & COST: IMPACT OF COST ON ACHIEVING CPI GOALS 25% 25% 25% 29% 29% 29% 40% 40% 40% Avg Avg TER Avg TER TER Consistency Source: Source: Morningstar. Source: Morningstar. Morningstar. Historic Historic probability Historic probability probability of relative of relative of three relative three year three year rolling year rolling outperformance rolling outperformance outperformance relative relative to relative CPI to +3%. CPI to +3%. CPI +3%. ASISA ASISA Multi-Asset ASISA Multi-Asset Multi-Asset Low Low Equity Low Equity Category Equity Category Category for the for July the for 2005 July the 2005 July to end 2005 to December end to December end December 2019. 2019. 2019. Past Past performance Past performance performance is not is not is indication an not indication an indication of future of future of performance. future performance. performance. 60 60 50 50 40 40 The Alpha 30 30 between picking The Alpha Dream one of the top performers 20 20 The Alpha Dream versus one of the bottom performers Dream 10 Keeping 10 the goal in mind: Lowering introduces unnecessary Manager uncertainty Selection into a Risk 0 0 multi-asset portfolio. 1 Year 1 Year 1 Year 3 Years 1 3 Years 3 Years 5 Years 3 5 Years 5 Years 5 Years 350 300 300 KEEPING THE GOAL IN MIND: th Source: Africa SPIVA 30 June South 2019 Source: Africa Source: SPIVA 30 June South SPIVA 2019Africa South 30 Africa June 30 2019 June 2019 250 250 KEEPING THE GOAL IN MIND: is Past not performance indication is Past of not future Past indication performance. LOWERING is of not future an is indication not performance. MANAGER indication of future SELECTION of performance. future performance. LOWERING MANAGER SELECTION RISK RISK 200 200 150 150 46% 46% 46% The evidence shows that using lowcost passive funds that deliver better performance helps meet the goal of creating reliable income streams, as well as inflation protection. 50% 50% 50% 45% 45% 45% 40% 40% 40% 35% 35% 35% 30% 30% 30% 25% 25% 25% 20% 20% 20% 15% 15% 15% 10% 10% 10% 5% 5% 5% 0% 0% 0% The Alpha Risk 2013/11 2012/03 2010/07 2014/04 2012/08 2010/12 2014/09 2013/01 2011/05 2015/02 2013/06 2011/10 2015/07 2013/11 2012/03 2015/12 2014/04 2010/02 2012/08 2016/05 2010/07 2014/09 2013/01 2016/10 2010/12 2015/02 2013/06 2017/03 2011/05 2015/07 2013/11 2017/08 2011/10 2015/12 2014/04 2018/01 2012/03 2016/05 2014/09 2018/06 2012/08 2016/10 2015/02 2018/11 2013/01 2017/03 2015/07 2019/04 2013/06 2017/08 2015/12 2019/09 2013/11 2018/01 2016/05 2020/02 2014/04 2018/06 2014/09 2016/10 2018/11 2015/02 2017/03 2019/04 2015/07 2017/08 2019/09 2018/01 2020/02 2018/06 100 100 2015/12 2016/05 The Alpha Risk 2018/11 2016/10 2019/04 2017/03 2019/09 2020/02 The Alpha Risk 2010/02 2010/12 2011/10 2012/08 2013/06 2014/04 2015/02 2015/12 2016/10 2017/08 2018/06 2019/04 S&P SA 50 Worst Fund Best Fund S&P SA 50 Worst Fund Best Fund S&P SA 50 Source: Morningstar. Worst Fund 10 Years cumulative Best returns Fund ended 29 Feb 2020, ASISA General Equity fund category. Past performance is not an indication of future performance. Worst Fund Best Fund orningstar. 10 Years cumulative returns ended 29 Feb 2020, ASISA General Equity fund category. ormance is not an indication of future performance. mulative returns ended 29 Feb 2020, ASISA General Equity fund category. ation of future performance. GRAPHICS COMPILED BY CORESHARES. DOWNLOAD THESE STATS AND FACTS FROM OUR WEBSITE – 9 Feb 2020, ASISA General Equity fund category. ce. www.bluechipdigital.co.za/featured/controlling-the-controllables/ 2017/08 2018/01 2018/06 The evidence shows that using reliable, well-diversified strategies (such as an index) as building blocks to implement the asset allocation helps meet the goal of capital protection. 2018/11 2019/04 2019/09 2020/02 INVESTMENT STRATEGY Meeting the goal mechanically Much work has been done to quantify the multi-faceted role that financial advisors play, from tax advice to withdrawal strategies and behavioural coaching, to name but a few. For example, helping investors to “stay the course” and not panic-sell during volatile periods like the Covid-19 crisis, adds significant value to a client’s total return in the long term. Morningstar has termed this advisory role “gamma” and calculates the value to be around 1.59% per year. [2] Advisors must retain their margin and keep delivering a high-quality professional service in this way. Cutting fund fees is a simple and effective way to improve the investor’s bottom line, while the advisor retains a well-deserved margin. Advisors can bring more certainty to retirement planning by minimising the moving parts and using evidence-based investing principles to meet investment goals mechanically, with greater certainty. [1] According to SPIVA reports published from December 2014 to December 2019 (a total of 11 five-year review periods), active managers have, on average, underperformed the benchmark 87% of the time. [2] Morningstar Report: “Alpha, Beta, and Now… Gamma” by David Blanchett, CFA, CFP & Paul Kaplan, Ph.D., CFA, published 28 August 2013. The Alpha Dream The Alpha Risk Michelle Noth, CFA, Client Coverage Executive at CoreShares Asset Management. CoreShares offers a range of multi-asset funds that employ the principles discussed in this article. www.bluechipdigital.co.za 29
- Page 1 and 2: Issue 76 • July 2020 www.bluechip
- Page 3 and 4: CONTENTS JULY 2020 WHAT’S HAPPENI
- Page 5 and 6: now more relevant than ever. I can
- Page 7 and 8: Even the most skilled carpenter can
- Page 9 and 10: Postgraduate Diploma in Investment
- Page 11 and 12: On the money Making waves this quar
- Page 13 and 14: South South Africa Africa (Virtual)
- Page 15 and 16: COVER FEATURE Building momentum in
- Page 17 and 18: COVER FEATURE Please tell us about
- Page 19 and 20: BRAVE/5776/MMI/E Momentum Investmen
- Page 21 and 22: COVER FEATURE We build diversified
- Page 23 and 24: I believe that the sum of the parts
- Page 25 and 26: GROWTH MANAGERS 1 2 3 1. You don’
- Page 27 and 28: HAS YOUR PORTFOLIO EVOLVED THROUGH
- Page 29: GREEN ECONOMY Panel on Climate Chan
- Page 33 and 34: INVESTMENT TRENDS brought on by Cov
- Page 35 and 36: OFFSHORE INVESTMENTS The currency a
- Page 37 and 38: into the bear market territory in h
- Page 39 and 40: FINANCIAL PLANNING What has been yo
- Page 41 and 42: RETIREMENT Making the big decision
- Page 43 and 44: Note: White logo must please be use
- Page 45 and 46: FINANCIAL PLANNERS with their inves
- Page 47 and 48: One thing that unites all CFP® pro
- Page 49 and 50: In a Global FPSB survey into financ
- Page 51 and 52: W e have seen some important change
- Page 53 and 54: ds Reach financial planners and ass
- Page 55 and 56: MEETING WITH CLIENTS We generally o
- Page 57 and 58: ADVERTORIAL A significant challenge
- Page 60: SUCCESS IS BETTER, SHARED. * We’r
Inappropriate
Loading...
Mail this publication
Loading...
Embed
Loading...


