Políticas públicas e o financiamento da produção de café no Brasil
Políticas públicas e o financiamento da produção de café no Brasil
Políticas públicas e o financiamento da produção de café no Brasil

You also want an ePaper? Increase the reach of your titles
YUMPU automatically turns print PDFs into web optimized ePapers that Google loves.
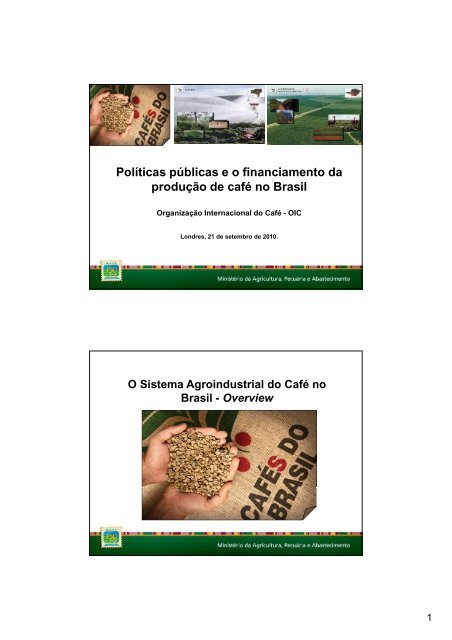
<strong>Políticas</strong> <strong>públicas</strong> e o <strong>financiamento</strong> <strong>da</strong><br />
<strong>produção</strong> <strong>de</strong> <strong>café</strong> <strong>no</strong> <strong>Brasil</strong><br />
Organização Internacional do Café - OIC<br />
Londres, 21 <strong>de</strong> setembro <strong>de</strong> 2010.<br />
O Sistema Agroindustrial do Café <strong>no</strong><br />
<strong>Brasil</strong> - Overview<br />
1
“Cafés do <strong>Brasil</strong>”<br />
• Número <strong>de</strong> estabelecimentos:<br />
287 mil, , em 1850 municípios; p ;<br />
• 42 cooperativas, sendo 30<br />
exclusivas <strong>de</strong> <strong>café</strong> (33% <strong>da</strong><br />
<strong>produção</strong>);<br />
•Torrefadores: 1.336;<br />
•Indústrias <strong>de</strong> <strong>café</strong> solúvel: 9<br />
•Marcas: 3.000<br />
•Empresas exportadoras: 220<br />
A cafeicultura brasileira e sua importância<br />
social na absorção <strong>de</strong> mão-<strong>de</strong>-obra rural<br />
2
Estratificação dos Cafés<br />
Arábica e Robusta <strong>no</strong> <strong>Brasil</strong><br />
Hectares<br />
0 a 10<br />
10 a 20<br />
20 a 50<br />
50 a 100<br />
> 100<br />
Sem <strong>de</strong>claração<br />
Total<br />
60,0<br />
50,0<br />
40,0<br />
30,0<br />
20,0<br />
10,0<br />
0,0<br />
<strong>Brasil</strong>: estabelecimentos com mais <strong>de</strong> 50 pés <strong>de</strong> <strong>café</strong> arábica e robusta - em 31.12.2006<br />
Nº <strong>de</strong> estabelecimentos Área planta<strong>da</strong> (ha) Produção<br />
Prod.<br />
Total (%) Total (%) Total (%) Média<br />
220 554 76,89 751 670 37,13 13.829.304 35,15 18,40<br />
18 306 6,38 276 099 13,64 5.109.256 12,99 18,51<br />
9 813 3,42 322 856 15,95 6.793.175 17,27 21,04<br />
2 781 0,97 206 170 10,19 4.736.613 12,04 22,97<br />
1 656 0,58 352 408 17,41 8.877.584 22,56 25,19<br />
33 733 11,76 114 969 5,68 0 0,00<br />
286.843 100,00 2 024 172 100,00 39.345.932 100,00<br />
Café: evolução do volume <strong>da</strong> safra brasileira<br />
(Conab,2010)<br />
48,5<br />
39,2<br />
42,5<br />
45,9 47,3<br />
34,0 31,1 31,3<br />
32,9<br />
36,1<br />
39,4<br />
27,2 28,8<br />
18,9<br />
1997<br />
1998<br />
1999<br />
2000<br />
2001<br />
2002<br />
2003<br />
2004<br />
2005<br />
2006<br />
2007<br />
2008<br />
2009<br />
2010<br />
3
3,1<br />
2,9<br />
2,7<br />
2,5<br />
2,3<br />
2,1<br />
1,9<br />
1,7<br />
1,5<br />
2,7<br />
2,9<br />
Fonte: Conab,2009<br />
volume<br />
35,0<br />
30,0<br />
25,0<br />
20,0<br />
15,0<br />
10,0<br />
5,0<br />
0,0<br />
Fonte: Mdic,2009<br />
2,8 ,<br />
2,5<br />
2,3<br />
<strong>Brasil</strong> - Evolução <strong>da</strong> Área planta<strong>da</strong> <strong>de</strong> Café<br />
(em milhões <strong>de</strong> hectares)<br />
2,1<br />
1989<br />
1990<br />
1991<br />
1992<br />
1993<br />
1994<br />
1995<br />
1996<br />
1,9 1,9<br />
2,4<br />
1997<br />
1998<br />
2,4<br />
1,9<br />
2,0<br />
2,2<br />
2,3<br />
1999<br />
2000<br />
2001<br />
2002<br />
2003<br />
Área - em milhões <strong>de</strong> hectares<br />
Café: evolução anual do volume e <strong>da</strong> receita <strong>da</strong>s exportações<br />
brasileiras<br />
2009<br />
2008<br />
2007<br />
2006<br />
2005<br />
2004<br />
2003<br />
2002<br />
2001<br />
2000<br />
1999<br />
1998<br />
1997<br />
1996<br />
1995<br />
1994<br />
1993<br />
1992<br />
1991<br />
1990<br />
1989<br />
Volume - em milhões <strong>de</strong> sacas <strong>de</strong> 60 kg Receita - em US$ $ bilhões<br />
2,2 2,2 2,2 2,2 2,2 2,2<br />
2004<br />
2005<br />
2006<br />
2007<br />
2008<br />
2009<br />
5,0<br />
4,5<br />
4,0<br />
3,5<br />
3,0<br />
2,5<br />
2,0<br />
1,5<br />
1,0<br />
0,5<br />
0,0<br />
receita<br />
4
50<br />
45<br />
40<br />
35<br />
30<br />
25<br />
20<br />
15<br />
10<br />
5<br />
-<br />
Carne Bovina<br />
17,35%<br />
Fonte: CNA<br />
Crédito Rural. Evolução dos <strong>financiamento</strong>s concedidos - em US$<br />
bilhões (Bacen,2010)<br />
16,09<br />
19,78<br />
22,27<br />
25,44<br />
32,07<br />
44,13<br />
2004/2005 2005/2006 2006/2007 2007/2008 2008/2009 2009/2010<br />
PRINCIPAIS PRODUTOS AGRÍCOLAS BRASILEIROS<br />
VALOR BRUTO DA PRODUÇÃO<br />
(PREÇOS DE ABRIL 2010)<br />
Feijão<br />
Outros<br />
17 17,56% 56%<br />
Carne Suína<br />
3,23%<br />
1,81% Arroz<br />
2,99%<br />
Café beneficiado<br />
5,35%<br />
Soja<br />
17,54%<br />
Cana <strong>de</strong> Açúcar<br />
11,26%<br />
Frango<br />
8,91%<br />
Milho<br />
6,13%<br />
Leite<br />
77,87% 87%<br />
5
Participação do <strong>café</strong> na <strong>produção</strong> brasileira <strong>de</strong> grãos - 2010<br />
(em mil tonela<strong>da</strong>s)<br />
Soja<br />
68.674<br />
Fonte: LSPA/IBGE, set/2010<br />
Elaboração: AGE/MAPA<br />
Trigo<br />
5.369<br />
Trigo<br />
4%<br />
outros*<br />
816<br />
outros*<br />
1%<br />
Arroz<br />
11.320<br />
Arroz<br />
8%<br />
Café<br />
2.793<br />
Café<br />
2%<br />
Feijão<br />
3.305<br />
Feijão<br />
2%<br />
Milho<br />
54.797<br />
Participação relativa do <strong>café</strong> na <strong>produção</strong> brasileira <strong>de</strong> grãos - 2010<br />
(em % )<br />
Soja<br />
46%<br />
Fonte: LSPA/IBGE, set/2010<br />
Elaboração: AGE/MAPA<br />
Milho<br />
37%<br />
6
Cafés do <strong>Brasil</strong> - fontes <strong>de</strong> <strong>financiamento</strong> <strong>da</strong> <strong>produção</strong><br />
Principais fontes do CR:<br />
Recursos Obrigatórios - RO – instituições financeiras <strong>de</strong>vem aplicar<br />
25% dos <strong>de</strong>pósitos à vista em operações do crédito rural;<br />
Poupança Rural - instituições financeiras <strong>de</strong>vem manter aplicados<br />
65% do valor dos <strong>de</strong>pósitos <strong>da</strong> poupança rural;<br />
Operações Oficiais <strong>de</strong> Crédito – OOC – recursos supervisionados<br />
pelo MF;<br />
Recursos Livres – próprios p p <strong>da</strong>s instituições ç financeiras, , aplicados p às<br />
taxas <strong>de</strong> mercado.<br />
Fundo <strong>de</strong> Defesa <strong>da</strong> Eco<strong>no</strong>mia Cafeeira<br />
Financiamento <strong>da</strong> cafeicultura <strong>no</strong> <strong>Brasil</strong> - possibili<strong>da</strong><strong>de</strong>s<br />
legais <strong>de</strong> aplicação:<br />
• formação dos estoques reguladores;<br />
• racionalização <strong>da</strong> cafeicultura e assistência à cafeicultura;<br />
• pesquisas tec<strong>no</strong>lógicas tec<strong>no</strong>lógicas, estudos e diagnósticos sobre a cafeicultura<br />
brasileira;<br />
• cooperação técnica e financeira internacional;<br />
• absorção <strong>de</strong> <strong>no</strong>vas técnicas <strong>de</strong> cultivo e beneficiamento do produto nas<br />
pequenas e médias proprie<strong>da</strong><strong>de</strong>s;<br />
• incentivo ao cooperativismo p <strong>da</strong> lavoura cafeeira; ;<br />
• apoio ao <strong>de</strong>senvolvimento do parque industrial <strong>de</strong> torrefação e moagem e<br />
<strong>de</strong> <strong>café</strong> solúvel;<br />
• promoção e propagan<strong>da</strong> <strong>no</strong>s mercados inter<strong>no</strong> e exter<strong>no</strong>.<br />
7
Financiamentos Concedidos<br />
a Produtores e Cooperativas<br />
por Fontes <strong>de</strong> Recursos - 2009<br />
Fundos Constitucionais;<br />
7,27%<br />
Recursos Livres; 4,20%<br />
Recursos do Tesouro;<br />
0,55%<br />
Outras fontes: 4,37%<br />
FUNCAFE; 2,23%<br />
BNDES/FINAME: 7,02%<br />
Pupança Rural; 26,05%<br />
Recursos Obrigatórios;<br />
48,30%<br />
Financiamentos Concedidos<br />
a Produtores e Cooperativas<br />
por Fontes <strong>de</strong> Recursos - 2010<br />
BNDES/FINAME 7,82%<br />
Fundos Constitucionais<br />
7,66%<br />
Recursos Livres; 2,22%<br />
FUNCAFE: 11,74% 74%<br />
Pupança Rural; 25,32%<br />
Outras fontes:; 3,75%<br />
RRecursos ddo Tesouro T<br />
0,19%<br />
Recursos<br />
Obrigatórios;51,29%<br />
8
CRÉDITO RURAL - Mo<strong>da</strong>li<strong>da</strong><strong>de</strong> Custeio (2009)<br />
POR CULTURA<br />
Trigo<br />
5%<br />
Soja<br />
30%<br />
Outros<br />
14%<br />
Fonte: BACEN _ Elaboração: SPA/DEAGRI/CGAE<br />
AlgodãoArroz<br />
3% 6%<br />
Milho<br />
17%<br />
Café<br />
11%<br />
Cana-<strong>de</strong>-açucar<br />
10%<br />
Feijão<br />
1%<br />
Laranja<br />
3%<br />
CRÉDITO RURAL - Mo<strong>da</strong>li<strong>da</strong><strong>de</strong> Comercialização (2009)<br />
POR CULTURA<br />
Trigo<br />
14%<br />
Soja<br />
3%<br />
Outros<br />
Algodão<br />
18% 8% Arroz<br />
15%<br />
Milho<br />
20%<br />
Fonte: BACEN _ Elaboração: SPA/DEAGRI/CGAE<br />
Café<br />
13%<br />
Cana-<strong>de</strong>-açucar<br />
9%<br />
9
Fundo <strong>de</strong> Defesa <strong>da</strong> Eco<strong>no</strong>mia Cafeeira - Fun<strong>café</strong><br />
Fun<strong>café</strong>. Linhas <strong>de</strong> crédito.Condições básicas<br />
• Orçamento 2010 – linhas <strong>de</strong> <strong>financiamento</strong>: US$ 1,5 bilhão<br />
• Risco <strong>da</strong>s operações: <strong>da</strong>s instituições financeiras<br />
• Encargos financeiros: 6,75% ao a<strong>no</strong> (não inci<strong>de</strong> em to<strong>da</strong>s as fontes do crédito rural).<br />
Remuneração <strong>da</strong>s instituições financeiras: 4,5% ao a<strong>no</strong><br />
Remuneração do fundo: 2,25%<br />
• Linhas <strong>de</strong> crédito e beneficiários:<br />
b<br />
Linhas <strong>de</strong> custeio, custeio colheita e estocagem - produtores rurais rurais, cooperativas <strong>de</strong> <strong>produção</strong><br />
Financiamento para Aquisição <strong>de</strong> <strong>café</strong> – FAC - indústrias torrefadoras <strong>de</strong> <strong>café</strong>, beneficiadores e<br />
exportadores<br />
10
Em US$<br />
1.400.000.000<br />
1.200.000.000<br />
1.000.000.000<br />
800.000.000<br />
600.000.000<br />
Fun<strong>café</strong> - volume anual <strong>de</strong> recursos financeiros repassados aos agentes financeiros<br />
2001-2009<br />
512.900.827<br />
809.580.822 863.896.867<br />
1.193.390.652<br />
825.491.031<br />
400.000.000<br />
301.824.141<br />
280.775.600<br />
200.000.000<br />
135.496.865<br />
49 49.778.761 778 761<br />
0<br />
2001<br />
Fonte: MAPA/SPAE/DCAF<br />
2002 2003 2004 2005<br />
A<strong>no</strong><br />
2006 2007 2008 2009<br />
Fun<strong>café</strong> – <strong>financiamento</strong> do<br />
custeio <strong>da</strong> safra <strong>de</strong> <strong>café</strong><br />
Objetivo <strong>da</strong> linha <strong>de</strong> crédito:<br />
“ Financiar os custos inerentes aos tratos culturais <strong>da</strong>s lavouras<br />
<strong>de</strong> <strong>café</strong>, tais como fertilizantes, corretivos, <strong>de</strong>fensivos, mão-<strong>de</strong>obra<br />
e operações com máquinas”.<br />
11
Fun<strong>café</strong> – <strong>financiamento</strong> <strong>da</strong> colheita<br />
<strong>de</strong> <strong>café</strong><br />
Objetivo:<br />
“ Destina<strong>da</strong> ao <strong>financiamento</strong> dos insumos utilizados <strong>no</strong><br />
processo <strong>de</strong> colheita do <strong>café</strong>, tais como herbici<strong>da</strong>s, arruação,<br />
transporte p ppara o terreiro, secagem g e mão-<strong>de</strong>-obra<br />
Fun<strong>café</strong> – <strong>financiamento</strong> <strong>da</strong><br />
estocagem <strong>da</strong> safra <strong>de</strong> <strong>café</strong><br />
Objetivo:<br />
Proporcionar aos produtores rurais e às cooperativas agrícolas<br />
condições financeiras que lhes permitam armazenar o produto<br />
durante períodos <strong>de</strong> baixos preços <strong>no</strong>s mercados inter<strong>no</strong> e<br />
exter<strong>no</strong>.<br />
12
Fun<strong>café</strong> – Aquisição <strong>de</strong> Café<br />
pela agroindústria interna -<br />
FAC<br />
• Objetivos <strong>de</strong>ssa linha <strong>de</strong><br />
crédito:<br />
• Financiar a aquisição <strong>de</strong> <strong>café</strong> ver<strong>de</strong> por indústrias<br />
torrefadoras, beneficiadores e torrefadores.<br />
• Nessas operações, o <strong>café</strong> <strong>de</strong>verá ser adquirido por<br />
preços iguais ou superiores aos mínimos fixados pelo<br />
Gover<strong>no</strong>.<br />
Safra 2010 - distribuição dos recursos financeiros<br />
nas linhas <strong>de</strong> crédito do Fun<strong>café</strong><br />
• Custeio: US$ 182 milhões<br />
• Colheita: US$ 303 milhões<br />
• Estocagem: US$ 546 milhões<br />
• FAC: US$ 182 milhões<br />
Total: 1,2 bilhão<br />
Resolução CMN nº 3.855/10<br />
13
Programa Nacional <strong>de</strong> Fortalecimento <strong>da</strong><br />
Agricultura Familiar - Pronaf<br />
• Recursos <strong>de</strong>stinados exclusivamente a projetos<br />
individuais ou coletivos <strong>de</strong> agricultores familiares e assentados<br />
<strong>da</strong> reforma agrária.<br />
• A ren<strong>da</strong> bruta anual dos agricultores familiares <strong>de</strong>ve ser <strong>de</strong> até US$ 63,4 mil<br />
• Apoio financeiro às ativi<strong>da</strong><strong>de</strong>s agropecuárias e não agropecuárias<br />
explora<strong>da</strong>s pelo emprego direto <strong>da</strong> força <strong>de</strong> trabalho <strong>da</strong> família produtora rural<br />
• ativi<strong>da</strong><strong>de</strong>s ti id d não-agropecuárias ã ái contempla<strong>da</strong>s t l d - tturismo i rural, l artesanato, t t<br />
agronegócio familiar e outras prestações <strong>de</strong> serviços compatíveis com a<br />
natureza <strong>da</strong> exploração rural e com o melhor emprego <strong>da</strong> mão-<strong>de</strong>-obra<br />
familiar.<br />
Em US$<br />
7.000.000.000<br />
6.000.000.000<br />
5.000.000.000<br />
4.000.000.000<br />
3.000.000.000<br />
2.000.000.000<br />
PRONAF - evolução anual do montante <strong>de</strong>stinado a <strong>financiamento</strong>s - em US$<br />
(1999 - 2008)<br />
1.185.917.644 1.184.835.662<br />
1.000.000.000<br />
931.447.874<br />
Fonte: SFA/MDA<br />
0<br />
813.523.848<br />
1.458.752.632<br />
2.095.629.014<br />
3.125.792.191<br />
3.876.150.395<br />
4.658.753.086<br />
5.882.430.670<br />
1999 2000 2001 2002 2003 2004 2005 2006 2007 2008<br />
A<strong>no</strong><br />
14
Ministério <strong>da</strong> Agricultura, Pecuária e Abastecimento<br />
Secretaria <strong>de</strong> Produção ç e Agroenergia<br />
g g<br />
Gerardo Fontelles - Secretário- Executivo<br />
15