Tabela de vida - Instituto de Biologia da UFRJ
Tabela de vida - Instituto de Biologia da UFRJ
Tabela de vida - Instituto de Biologia da UFRJ

You also want an ePaper? Increase the reach of your titles
YUMPU automatically turns print PDFs into web optimized ePapers that Google loves.
ECOLOGIA BÁSICA – TABELAS DE VIDA (Prof. Marcus Vinícius Vieira)<br />
UNIVERSIDADE FEDERAL DO RIO DE JANEIRO<br />
INSTITUTO DE BIOLOGIA – DEPARTAMENTO DE ECOLOGIA<br />
DISCIPLINA ECOLOGIA BÁSICA<br />
PRÁTICA 2: TABELA (OU TÁBUAS) DE VIDA<br />
Ferramenta básica para estimar o crescimento <strong>de</strong> uma população <strong>de</strong> uma geração para<br />
outra. São usa<strong>da</strong>s para <strong>de</strong>screver, enten<strong>de</strong>r e prever a dinâmica <strong>de</strong> uma população,<br />
utiliza<strong>da</strong>s em manejo e conservação <strong>de</strong> espécies, agricultura, e saú<strong>de</strong> humana.<br />
A tabela <strong>de</strong> <strong>vi<strong>da</strong></strong> <strong>de</strong>screve as taxas <strong>de</strong> mortali<strong>da</strong><strong>de</strong> (ou sobrevivência) e reprodução em<br />
função <strong>da</strong> i<strong>da</strong><strong>de</strong>. Na natureza, as taxas <strong>de</strong> mortali<strong>da</strong><strong>de</strong> e reprodução po<strong>de</strong>m <strong>de</strong>pen<strong>de</strong>r<br />
<strong>de</strong> vários fatores, como temperatura, <strong>de</strong>nsi<strong>da</strong><strong>de</strong> populacional, entre outros. Ao<br />
construir uma tabela <strong>de</strong> <strong>vi<strong>da</strong></strong>, o efeito <strong>de</strong>sses fatores fica implícito como parte do<br />
ambiente. Somente a variação <strong>de</strong><strong>vi<strong>da</strong></strong> à i<strong>da</strong><strong>de</strong> é consi<strong>de</strong>ra<strong>da</strong> explicitamente como um<br />
fator que <strong>de</strong>termina a mortali<strong>da</strong><strong>de</strong> e a reprodução.<br />
Em organismos com reprodução sexua<strong>da</strong> i<strong>de</strong>almente consi<strong>de</strong>ra-se somente as fêmeas<br />
numa tabela <strong>de</strong> <strong>vi<strong>da</strong></strong>. Po<strong>de</strong>m-se incluir machos e fêmeas na tabela <strong>de</strong> <strong>vi<strong>da</strong></strong>, porém, é<br />
preciso especificar consi<strong>de</strong>rar a razão sexual <strong>da</strong>s proles.<br />
Estimando as taxas <strong>de</strong> reprodução ou fecundi<strong>da</strong><strong>de</strong> (b x )<br />
A fecundi<strong>da</strong><strong>de</strong> é o número <strong>de</strong> proles fêmeas produzi<strong>da</strong>s por mãe no intervalo <strong>da</strong> i<strong>da</strong><strong>de</strong><br />
x a x+1. A fecundi<strong>da</strong><strong>de</strong> é mais facilmente <strong>de</strong>termina<strong>da</strong> em condições <strong>de</strong> laboratório.<br />
Em populações naturais <strong>de</strong> mamíferos, essa taxa po<strong>de</strong> ser estima<strong>da</strong> <strong>da</strong> proporção dos<br />
indivíduos grávidos ou lactantes. Para aves, essa taxa po<strong>de</strong> ser estima<strong>da</strong> pelo número<br />
médio <strong>de</strong> filhotes por ninho. Medi<strong>da</strong>s indiretas <strong>de</strong>ssa taxa <strong>de</strong>vem ser usa<strong>da</strong>s com<br />
cui<strong>da</strong>do <strong>de</strong>vido à imprecisão e incerteza associa<strong>da</strong>s à estimativa.<br />
Estimando a sobrevivência do organismo até a i<strong>da</strong><strong>de</strong> x, ou sua ‘SOBREVIDA’ (l x )<br />
Para os animais domésticos ou para populações cria<strong>da</strong>s no laboratório, é possível<br />
observar o que acontece com um grupo gran<strong>de</strong> <strong>de</strong> indivíduos que começaram a <strong>vi<strong>da</strong></strong><br />
simultaneamente. Os sobreviventes po<strong>de</strong>m ser contados em intervalos regulares do<br />
tempo e os valores <strong>de</strong> l x po<strong>de</strong>m ser facilmente estimados. Uma técnica similar po<strong>de</strong><br />
ser usa<strong>da</strong> para organismos sesseis com tempo <strong>de</strong> <strong>vi<strong>da</strong></strong> <strong>de</strong> meses ou poucos anos. É<br />
possível marcar um número gran<strong>de</strong> <strong>de</strong> indivíduos e observar o que acontece com eles.<br />
Esse tipo <strong>de</strong> análise geralmente não é possível para animais que se movimentam e<br />
vivem vários anos. Existem dois métodos principais para <strong>de</strong>duzir os valores <strong>de</strong> l x :<br />
<strong>de</strong>terminando a distribuição etária <strong>da</strong> população, ou <strong>de</strong>terminando as i<strong>da</strong><strong>de</strong>s <strong>da</strong><br />
morte.<br />
<br />
On<strong>de</strong> N x = número <strong>de</strong> indivíduos na i<strong>da</strong><strong>de</strong> x e N 0 = número <strong>de</strong> indivíduos inicial, t=0.<br />
O método <strong>de</strong> estimativa <strong>de</strong> l x pela i<strong>da</strong><strong>de</strong> <strong>de</strong> carcaças também requer a estabili<strong>da</strong><strong>de</strong> <strong>da</strong><br />
estrutura etária.<br />
Uma série <strong>de</strong> estatísticas <strong>de</strong>riva<strong>da</strong>s <strong>de</strong> l x são frequentemente calcula<strong>da</strong>s, como a taxa<br />
<strong>de</strong> sobrevivência (diferente <strong>da</strong> sobre<strong>vi<strong>da</strong></strong>), taxa <strong>de</strong> mortali<strong>da</strong><strong>de</strong> e expectativa <strong>de</strong> <strong>vi<strong>da</strong></strong>.<br />
Vamos ver algumas apenas a seguir.
ECOLOGIA BÁSICA – TABELAS DE VIDA (Prof. Marcus Vinícius Vieira)<br />
2/5<br />
Taxa <strong>de</strong> mortali<strong>da</strong><strong>de</strong>, q x , é a proporção <strong>de</strong> indivíduos que morrem <strong>de</strong> uma i<strong>da</strong><strong>de</strong> x até<br />
a i<strong>da</strong><strong>de</strong> x+1, em relação ao número <strong>de</strong> indivíduos vivos na i<strong>da</strong><strong>de</strong>, N x.<br />
<br />
<br />
<br />
<br />
Taxa <strong>de</strong> reprodução bruta, R 0 , é o número médio <strong>de</strong> filhotes fêmeas produzido por<br />
fêmea, consi<strong>de</strong>rando o número total <strong>de</strong> fêmeas incluí<strong>da</strong>s na tabela <strong>de</strong> <strong>vi<strong>da</strong></strong> <strong>de</strong>s<strong>de</strong> a<br />
i<strong>da</strong><strong>de</strong> 0, e não apenas as fêmeas que reproduziram. A fecundi<strong>da</strong><strong>de</strong> média por i<strong>da</strong><strong>de</strong>, b x ,<br />
é uma média por i<strong>da</strong><strong>de</strong>, mas consi<strong>de</strong>rando que to<strong>da</strong>s as fêmeas po<strong>de</strong>riam reproduzir.<br />
Esta fecundi<strong>da</strong><strong>de</strong> em potencial precisa então ser ajusta<strong>da</strong> para consi<strong>de</strong>rar a média por<br />
to<strong>da</strong>s as fêmeas <strong>da</strong> i<strong>da</strong><strong>de</strong> x, incluindo as que morreram até esta reprodução e não se<br />
reproduziram. Para se ter a fecundi<strong>da</strong><strong>de</strong> média efetiva, multiplica-se a fecundi<strong>da</strong><strong>de</strong> b x<br />
pela proporção <strong>de</strong> fêmeas vivas até a i<strong>da</strong><strong>de</strong> x, l x .<br />
Somando-se todos os valores <strong>de</strong> l x b x tem-se R 0 , o número médio <strong>de</strong> proles (fêmeas)<br />
produzidos por ao longo <strong>de</strong> to<strong>da</strong> a <strong>vi<strong>da</strong></strong>, consi<strong>de</strong>rando o número total <strong>de</strong> fêmeas e não<br />
apenas aquelas que reproduziram. É uma estimativa do crescimento <strong>da</strong> população <strong>de</strong><br />
um tempo <strong>de</strong> geração para outro (relativo ao tempo <strong>de</strong> geração):<br />
<br />
<br />
<br />
(n = última i<strong>da</strong><strong>de</strong> x)<br />
Tempo médio <strong>de</strong> geração é o tempo médio que uma nova geração começa a ser<br />
produzi<strong>da</strong>. Frequentemente a reprodução ocorre em várias i<strong>da</strong><strong>de</strong>s ao longo <strong>da</strong> <strong>vi<strong>da</strong></strong>, e<br />
não apenas em um momento ou i<strong>da</strong><strong>de</strong>. Neste caso, em ca<strong>da</strong> i<strong>da</strong><strong>de</strong> indivíduos <strong>da</strong> nova<br />
geração estão sendo produzidos. Mas em média, quanto tempo leva para se iniciar a<br />
produção <strong>de</strong> uma nova geração Depen<strong>de</strong>rá não só <strong>de</strong> quando começa e termina a<br />
reprodução, mas também <strong>da</strong> quanti<strong>da</strong><strong>de</strong> <strong>de</strong> prole produzi<strong>da</strong> em ca<strong>da</strong> i<strong>da</strong><strong>de</strong>. O tempo<br />
<strong>de</strong> geração, T, estimado usando a equação:<br />
<br />
<br />
<br />
<br />
<br />
<br />
<br />
<br />
Referências:<br />
Ricklefs, R.E., 2003. A Economia <strong>da</strong> Natureza, 3ª., 5ª. ou 6ª. eds. Editora Guanabara<br />
Koogan.<br />
Townsend, C.R., Begon, M., Harper, J.L., 2006. Fun<strong>da</strong>mentos em Ecologia, 2ª. ed.<br />
ARTMED Editora S.A.<br />
http://ecopopbio.tripod.com/id19.html<br />
Nas páginas seguintes são apresenta<strong>da</strong>s algumas tabelas <strong>de</strong> <strong>vi<strong>da</strong></strong>. Faça os cálculos e<br />
ati<strong>vi<strong>da</strong></strong><strong>de</strong>s, respon<strong>da</strong> às perguntas sobre estas tabelas, e entregue na próxima aula.
ECOLOGIA BÁSICA – TABELAS DE VIDA (Prof. Marcus Vinícius Vieira)<br />
3/5<br />
<strong>Tabela</strong> 1. <strong>Tabela</strong> <strong>de</strong> <strong>vi<strong>da</strong></strong> para o carneiro <strong>da</strong> montanha (Ovis <strong>da</strong>lli) construí<strong>da</strong> através dos <strong>da</strong>dos<br />
<strong>da</strong> morte <strong>de</strong> 608 carneiros no parque Nacional Mount Mckinley (baseado em <strong>da</strong>dos <strong>de</strong> Murie<br />
1994, citado por Deevey, 1947)<br />
Intervalo <strong>de</strong> i<strong>da</strong><strong>de</strong>s (anos) N o <strong>de</strong> mortes durante o<br />
intervalo<br />
0-1 121 608<br />
1-2 7 487<br />
2-3 8 480<br />
3-4 7 472<br />
4-5 18 465<br />
5-6 28 447<br />
6-7 29 419<br />
7-8 42 390<br />
8-9 80 348<br />
9-10 114 268<br />
10-11 95 154<br />
11-12 55 59<br />
12-13 2 4<br />
13-14 2 2<br />
14-15 0 0<br />
1. Calcule l x e q x para ca<strong>da</strong> faixa etária.<br />
N o <strong>de</strong> sobreviventes no l x q x<br />
início do intervalo, N x<br />
2. A tabela abaixo é uma tabela estática ou dinâmica (=coorte) Qual a diferença entre os<br />
dois tipos <strong>de</strong> tabela <strong>de</strong> <strong>vi<strong>da</strong></strong><br />
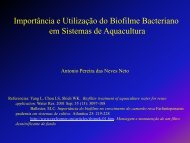
3. Plote os valores <strong>de</strong> N x na curva <strong>de</strong> sobrevivência em escala logarítimica e em escala<br />
normal.<br />
1000<br />
608<br />
487<br />
Número <strong>de</strong> indivíduos N x<br />
(escala log)<br />
100<br />
10<br />
2<br />
1<br />
0 2 4 6 8 10 12 14<br />
I<strong>da</strong><strong>de</strong>
ECOLOGIA BÁSICA – TABELAS DE VIDA (Prof. Marcus Vinícius Vieira)<br />
4/5<br />
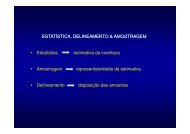
700<br />
600<br />
608<br />
Número <strong>de</strong> indivíduos N x<br />
500<br />
400<br />
300<br />
200<br />
100<br />
487<br />
0<br />
2<br />
0 2 4 6 8 10 12 14<br />
I<strong>da</strong><strong>de</strong><br />
4. Qual curva, logarítmica ou linear, <strong>de</strong>screve melhor como varia a taxa <strong>de</strong> sobre<strong>vi<strong>da</strong></strong> ao<br />
longo <strong>da</strong> <strong>vi<strong>da</strong></strong><br />
5. Discuta sua forma geral: tipo I, II ou III (três valores já foram incluídos <strong>da</strong> tabela já foram<br />
incluídos).<br />
PARA AS TABELAS DE VIDA DA PRÓXIMA PÁGINA:<br />
1. Calcule a fecundi<strong>da</strong><strong>de</strong> média efetiva em ca<strong>da</strong> faixa etária (l x b x ) e R o .<br />
2. A que temperatura há maior produção <strong>de</strong> prole<br />
3. Em qual temperatura a reprodução <strong>da</strong> espécie é mais eficiente Justifique sua resposta<br />
consi<strong>de</strong>rando a produção <strong>da</strong> prole e o tempo <strong>de</strong> geração.<br />
4. Em que temperatura a população <strong>de</strong> cladócero se extinguirá Justifique sua resposta.
ECOLOGIA BÁSICA – TABELAS DE VIDA (Prof. Marcus Vinícius Vieira)<br />
5/5<br />
Dados <strong>de</strong> tabela <strong>de</strong> <strong>vi<strong>da</strong></strong> para o cladócero Chydorous sphaericus, crescendo sob condições <strong>de</strong><br />
laboratório em temperaturas <strong>de</strong> 15 o C, 25 o C, 35 o C e 45 o C (Keen, 1967).<br />
15 o C 25 o C<br />
Intervalo<br />
<strong>de</strong> i<strong>da</strong><strong>de</strong>s<br />
(dias)<br />
Média do<br />
intervalo<br />
l x b x l x b x l x b x l x b x<br />
0-4 2 1,00 0,00 1,00 0,00<br />
5-14 10 1,00 2,88 0,948 8,27<br />
15-24 20 1,00 4,80 0,692 6,94<br />
25-34 30 1,00 4,80 0,440 8,18<br />
35-44 40 1,00 4,64 0,340 6,05<br />
45-54 50 1,00 4,56 0,184 5,00<br />
55-64 60 0,988 3,28 0,036 3,33<br />
65-74 70 0,888 1,53 0,000 0,00<br />
75-84 80 0,804 3,03<br />
85-94 90 0,656 4,39<br />
95-104 100 0,584 3,28<br />
105-114 110 0,488 2,30<br />
115-124 120 0,328 0,98<br />
125-134 130 0,136 0,00<br />
R o = R o =<br />
T(tempo <strong>de</strong> geração): 50,91 21,61<br />
Intervalo<br />
<strong>de</strong> i<strong>da</strong><strong>de</strong>s<br />
(dias)<br />
Média do<br />
intervalo<br />
35 o C* 45 o C*<br />
l x b x l x b x l x b x l x b x<br />
0-4 2 1 0 1 0<br />
5-14 10 1 0 0,010 0<br />
15-24 20 1 0 0,010 10,2<br />
25-34 30 0,90 0,1 0,008 58,3<br />
35-44 40 0,70 0,3 0,008 9,6<br />
45-54 50 0,50 0,4 0,005 3,2<br />
55-64 60 0,30 0,6 0,004 1,0<br />
65-74 70 0,20 0,7 0,002 0<br />
75-84 80 0,19 1,0<br />
85-94 90 0,10 0,2<br />
95-104 100 0,10 0,2<br />
105-114 110 0,10 0<br />
115-124 120 0,09 0<br />
125-134 130 0,09 0<br />
R o = R o =<br />
T(tempo <strong>de</strong> geração) 57,81 30,29