Statistisk årsbok för Sverige 2013 (pdf) - Statistiska centralbyrån
Statistisk årsbok för Sverige 2013 (pdf) - Statistiska centralbyrån
Statistisk årsbok för Sverige 2013 (pdf) - Statistiska centralbyrån

Create successful ePaper yourself
Turn your PDF publications into a flip-book with our unique Google optimized e-Paper software.
Arbetsmarknad <strong>Statistisk</strong> årsbok <strong>2013</strong><br />
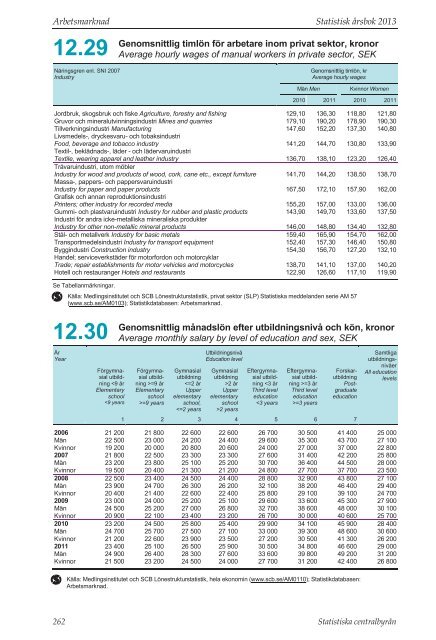
12.29<br />
Genomsnittlig timlön för arbetare inom privat sektor, kronor<br />
Average hourly wages of manual workers in private sector, SEK<br />
Näringsgren enl. SNI 2007<br />
Industry<br />
Genomsnittlig timlön, kr<br />
Average hourly wages<br />
Män Men<br />
Kvinnor Women<br />
2010 2011 2010 2011<br />
Jordbruk, skogsbruk och fiske Agriculture, forestry and fishing 129,10 136,30 118,80 121,80<br />
Gruvor och mineralutvinningsindustri Mines and quarries 179,10 190,20 178,90 190,30<br />
Tillverkningsindustri Manufacturing 147,60 152,20 137,30 140,80<br />
Livsmedels-, dryckesvaru- och tobaksindustri<br />
Food, beverage and tobacco industry 141,20 144,70 130,80 133,90<br />
Textil-, beklädnads-, läder - och lädervaruindustri<br />
Textile, wearing apparel and leather industry 136,70 138,10 123,20 126,40<br />
Trävaruindustri, utom möbler<br />
Industry for wood and products of wood, cork, cane etc., except furniture 141,70 144,20 138,50 138,70<br />
Massa-, pappers- och pappersvaruindustri<br />
Industry for paper and paper products 167,50 172,10 157,90 162,00<br />
Grafisk och annan reproduktionsindustri<br />
Printers; other industry for recorded media 155,20 157,00 133,00 136,00<br />
Gummi- och plastvaruindustri Industry for rubber and plastic products 143,90 149,70 133,60 137,50<br />
Industri för andra icke-metalliska mineraliska produkter<br />
Industry for other non-metallic mineral products 146,00 148,80 134,40 132,80<br />
Stål- och metallverk Industry for basic metals 159,40 165,90 154,70 162,00<br />
Transportmedelsindustri Industry for transport equipment 152,40 157,30 146,40 150,80<br />
Byggindustri Construction industry 154,30 156,70 127,20 132,10<br />
Handel; serviceverkstäder för motorfordon och motorcyklar<br />
Trade; repair establishments for motor vehicles and motorcycles 138,70 141,10 137,00 140,20<br />
Hotell och restauranger Hotels and restaurants 122,90 126,60 117,10 119,90<br />
Se Tabellanmärkningar.<br />
Källa: Medlingsinstitutet och SCB Lönestrukturstatistik, privat sektor (SLP) <strong>Statistisk</strong>a meddelanden serie AM 57<br />
(www.scb.se/AM0103); Statistikdatabasen: Arbetsmarknad.<br />
12.30<br />
Genomsnittlig månadslön efter utbildningsnivå och kön, kronor<br />
Average monthly salary by level of education and sex, SEK<br />
År<br />
Year<br />
Förgymnasial<br />
utbildning<br />
=9 years<br />
Gymnasial<br />
utbildning<br />
2 years<br />
Eftergymnasial<br />
utbildning<br />
=3 years<br />
Forskarutbildning<br />
Postgraduate<br />
education<br />
1 2 3 4 5 6 7<br />
Samtliga<br />
utbildningsnivåer<br />
All education<br />
levels<br />
2006 21 200 21 800 22 600 22 600 26 700 30 500 41 400 25 000<br />
Män 22 500 23 000 24 200 24 400 29 600 35 300 43 700 27 100<br />
Kvinnor 19 200 20 000 20 800 20 600 24 000 27 000 37 000 22 800<br />
2007 21 800 22 500 23 300 23 300 27 600 31 400 42 200 25 800<br />
Män 23 200 23 800 25 100 25 200 30 700 36 400 44 500 28 000<br />
Kvinnor 19 500 20 400 21 300 21 200 24 800 27 700 37 700 23 500<br />
2008 22 500 23 400 24 500 24 400 28 800 32 900 43 800 27 100<br />
Män 23 900 24 700 26 300 26 200 32 100 38 200 46 400 29 400<br />
Kvinnor 20 400 21 400 22 600 22 400 25 800 29 100 39 100 24 700<br />
2009 23 000 24 000 25 200 25 100 29 600 33 600 45 300 27 900<br />
Män 24 500 25 200 27 000 26 800 32 700 38 600 48 000 30 100<br />
Kvinnor 20 900 22 100 23 400 23 200 26 700 30 000 40 600 25 700<br />
2010 23 200 24 500 25 800 25 400 29 900 34 100 45 900 28 400<br />
Män 24 700 25 700 27 500 27 100 33 000 39 300 48 600 30 600<br />
Kvinnor 21 200 22 600 23 900 23 500 27 200 30 500 41 300 26 200<br />
2011 23 400 25 100 26 500 25 900 30 500 34 800 46 600 29 000<br />
Män 24 900 26 400 28 300 27 600 33 600 39 800 49 200 31 200<br />
Kvinnor 21 500 23 200 24 500 24 000 27 700 31 200 42 400 26 800<br />
Källa: Medlingsinstitutet och SCB Lönestrukturstatistik, hela ekonomin (www.scb.se/AM0110); Statistikdatabasen:<br />
Arbetsmarknad.<br />
262 <strong>Statistisk</strong>a centralbyrån