MSCP Market Watch - EMC
MSCP Market Watch - EMC
MSCP Market Watch - EMC
- No tags were found...
You also want an ePaper? Increase the reach of your titles
YUMPU automatically turns print PDFs into web optimized ePapers that Google loves.
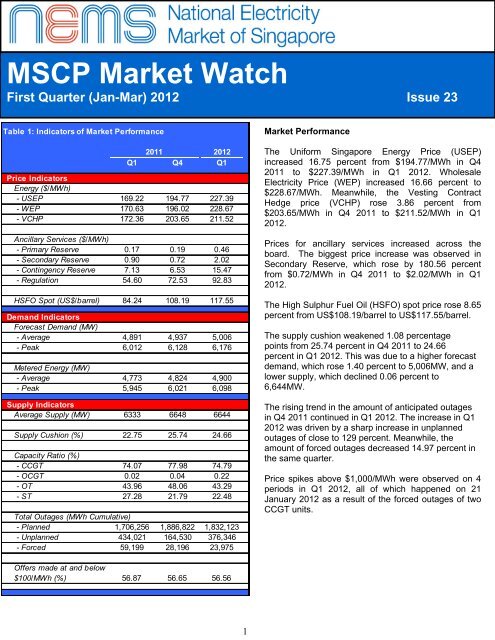
Demand IndicatorsAverage LoadForecast Variation%1.00.80.60.40.20.0-0.2-0.4Chart 5: Monthly Load Forecast VariationJan-11 Mar-11 Nov-11 Jan-12 Mar-12Monthly Variation (STS vs Real Time)Monthly Variation (PDS vs Real Time)Average Variation inLoad Forecast &Metered Energy Quantities3.203.002.802.602.402.202.00Chart 6: Variation in Real Time LoadForecast & Metered Energy QuantitiesQ1, 2011 Q4, 2011 Q1, 2012Quarterly Variation in Load Forecast and Metered Energy QuantitiesEnergy PricesWEP/VCHP$/MWh2752502252001751501251007550250Chart 7: WEP vs VestingContract Hedge Price (VCHP)Q1, 2011 Q4, 2011 Q1, 2012Metered Energy QuantitiesMW492049004880486048404820480047804760474047204700Chart 8: Comparison of Metered Energy QuantitiesQ1, 2011 Q4, 2011 Q1, 2012VCHPDaily Volume-weighted Average WEPAverage Metered Energy QuantitiesPercentageof Hours%80706050403020100-10Chart 9: Percentage of Hours when WEPFalls Into a Particular Price RangeX≤5050


