India
1594.full
1594.full

Create successful ePaper yourself
Turn your PDF publications into a flip-book with our unique Google optimized e-Paper software.
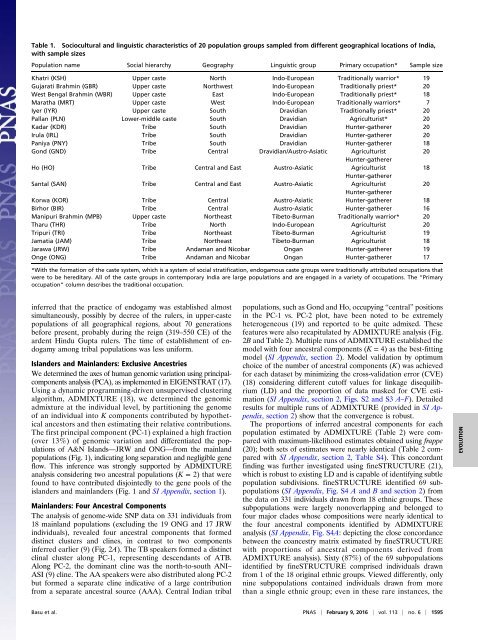
Table 1. Sociocultural and linguistic characteristics of 20 population groups sampled from different geographical locations of <strong>India</strong>,<br />
with sample sizes<br />
Population name Social hierarchy Geography Linguistic group Primary occupation* Sample size<br />
Khatri (KSH) Upper caste North Indo-European Traditionally warrior* 19<br />
Gujarati Brahmin (GBR) Upper caste Northwest Indo-European Traditionally priest* 20<br />
West Bengal Brahmin (WBR) Upper caste East Indo-European Traditionally priest* 18<br />
Maratha (MRT) Upper caste West Indo-European Traditionally warriors* 7<br />
Iyer (IYR) Upper caste South Dravidian Traditionally priest* 20<br />
Pallan (PLN) Lower-middle caste South Dravidian Agriculturist* 20<br />
Kadar (KDR) Tribe South Dravidian Hunter-gatherer 20<br />
Irula (IRL) Tribe South Dravidian Hunter-gatherer 20<br />
Paniya (PNY) Tribe South Dravidian Hunter-gatherer 18<br />
Gond (GND) Tribe Central Dravidian/Austro-Asiatic Agriculturist 20<br />
Hunter-gatherer<br />
Ho (HO) Tribe Central and East Austro-Asiatic Agriculturist 18<br />
Hunter-gatherer<br />
Santal (SAN) Tribe Central and East Austro-Asiatic Agriculturist 20<br />
Hunter-gatherer<br />
Korwa (KOR) Tribe Central Austro-Asiatic Hunter-gatherer 18<br />
Birhor (BIR) Tribe Central Austro-Asiatic Hunter-gatherer 16<br />
Manipuri Brahmin (MPB) Upper caste Northeast Tibeto-Burman Traditionally warrior* 20<br />
Tharu (THR) Tribe North Indo-European Agriculturist 20<br />
Tripuri (TRI) Tribe Northeast Tibeto-Burman Agriculturist 19<br />
Jamatia (JAM) Tribe Northeast Tibeto-Burman Agriculturist 18<br />
Jarawa (JRW) Tribe Andaman and Nicobar Ongan Hunter-gatherer 19<br />
Onge (ONG) Tribe Andaman and Nicobar Ongan Hunter-gatherer 17<br />
*With the formation of the caste system, which is a system of social stratification, endogamous caste groups were traditionally attributed occupations that<br />
were to be hereditary. All of the caste groups in contemporary <strong>India</strong> are large populations and are engaged in a variety of occupations. The “Primary<br />
occupation” column describes the traditional occupation.<br />
inferred that the practice of endogamy was established almost<br />
simultaneously, possibly by decree of the rulers, in upper-caste<br />
populations of all geographical regions, about 70 generations<br />
before present, probably during the reign (319–550 CE) of the<br />
ardent Hindu Gupta rulers. The time of establishment of endogamy<br />
among tribal populations was less uniform.<br />
Islanders and Mainlanders: Exclusive Ancestries<br />
We determined the axes of human genomic variation using principalcomponents<br />
analysis (PCA), as implemented in EIGENSTRAT (17).<br />
Using a dynamic programming-driven unsupervised clustering<br />
algorithm, ADMIXTURE (18), we determined the genomic<br />
admixture at the individual level, by partitioning the genome<br />
of an individual into K components contributed by hypothetical<br />
ancestors and then estimating their relative contributions.<br />
The first principal component (PC-1) explained a high fraction<br />
(over 13%) of genomic variation and differentiated the populations<br />
of A&N Islands—JRW and ONG—from the mainland<br />
populations (Fig. 1), indicating long separation and negligible gene<br />
flow. This inference was strongly supported by ADMIXTURE<br />
analysis considering two ancestral populations (K = 2) that were<br />
found to have contributed disjointedly to the gene pools of the<br />
islanders and mainlanders (Fig. 1 and SI Appendix, section 1).<br />
Mainlanders: Four Ancestral Components<br />
The analysis of genome-wide SNP data on 331 individuals from<br />
18 mainland populations (excluding the 19 ONG and 17 JRW<br />
individuals), revealed four ancestral components that formed<br />
distinct clusters and clines, in contrast to two components<br />
inferred earlier (9) (Fig. 2A). The TB speakers formed a distinct<br />
clinal cluster along PC-1, representing descendants of ATB.<br />
Along PC-2, the dominant cline was the north-to-south ANI–<br />
ASI (9) cline. The AA speakers were also distributed along PC-2<br />
but formed a separate cline indicative of a large contribution<br />
from a separate ancestral source (AAA). Central <strong>India</strong>n tribal<br />
populations, such as Gond and Ho, occupying “central” positions<br />
in the PC-1 vs. PC-2 plot, have been noted to be extremely<br />
heterogeneous (19) and reported to be quite admixed. These<br />
features were also recapitulated by ADMIXTURE analysis (Fig.<br />
2B and Table 2). Multiple runs of ADMIXTURE established the<br />
model with four ancestral components (K = 4) as the best-fitting<br />
model (SI Appendix, section 2). Model validation by optimum<br />
choice of the number of ancestral components (K) was achieved<br />
for each dataset by minimizing the cross-validation error (CVE)<br />
(18) considering different cutoff values for linkage disequilibrium<br />
(LD) and the proportion of data masked for CVE estimation<br />
(SI Appendix, section 2, Figs. S2 and S3 A–F). Detailed<br />
results for multiple runs of ADMIXTURE (provided in SI Appendix,<br />
section 2) show that the convergence is robust.<br />
The proportions of inferred ancestral components for each<br />
population estimated by ADMIXTURE (Table 2) were compared<br />
with maximum-likelihood estimates obtained using frappe<br />
(20); both sets of estimates were nearly identical (Table 2 compared<br />
with SI Appendix, section 2, Table S4). This concordant<br />
finding was further investigated using fineSTRUCTURE (21),<br />
which is robust to existing LD and is capable of identifying subtle<br />
population subdivisions. fineSTRUCTURE identified 69 subpopulations<br />
(SI Appendix, Fig. S4 A and B and section 2) from<br />
the data on 331 individuals drawn from 18 ethnic groups. These<br />
subpopulations were largely nonoverlapping and belonged to<br />
four major clades whose compositions were nearly identical to<br />
the four ancestral components identified by ADMIXTURE<br />
analysis (SI Appendix, Fig. S4A: depicting the close concordance<br />
between the coancestry matrix estimated by fineSTRUCTURE<br />
with proportions of ancestral components derived from<br />
ADMIXTURE analysis). Sixty (87%) of the 69 subpopulations<br />
identified by fineSTRUCTURE comprised individuals drawn<br />
from 1 of the 18 original ethnic groups. Viewed differently, only<br />
nine subpopulations contained individuals drawn from more<br />
than a single ethnic group; even in these rare instances, the<br />
EVOLUTION<br />
Basuetal. PNAS | February 9, 2016 | vol. 113 | no. 6 | 1595