6.-Red de transporte. - Red Eléctrica de España
6.-Red de transporte. - Red Eléctrica de España
6.-Red de transporte. - Red Eléctrica de España

You also want an ePaper? Increase the reach of your titles
YUMPU automatically turns print PDFs into web optimized ePapers that Google loves.
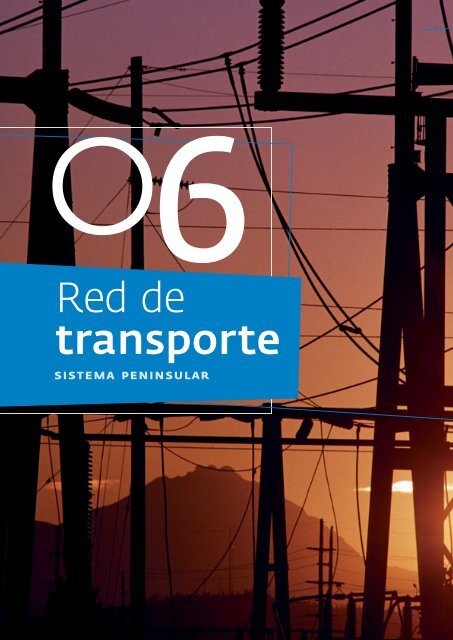
06<br />
<strong>Red</strong> <strong>de</strong><br />
<strong>transporte</strong><br />
sistema peninsular
74<br />
75<br />
76<br />
77<br />
78<br />
79<br />
Gráficos y cuadros /// Sistema eléctrico español 2011 73<br />
Evolución <strong>de</strong>l sistema <strong>de</strong> <strong>transporte</strong> y transformación<br />
Líneas <strong>de</strong> <strong>transporte</strong> a 400 kV puestas en servicio en el 2011<br />
Líneas <strong>de</strong> <strong>transporte</strong> a 220 kV puestas en servicio en el 2011<br />
Aumento <strong>de</strong> la capacidad <strong>de</strong> líneas en el 2011<br />
Parques puestos en servicio en el 2011<br />
Transformadores inventariados en el 2011<br />
Evolución <strong>de</strong> la red <strong>de</strong> <strong>transporte</strong> <strong>de</strong> 400 y ≤220 kV<br />
Gráfico <strong>de</strong> evolución <strong>de</strong> la red <strong>de</strong> <strong>transporte</strong> <strong>de</strong> 400 y ≤ 220 kV<br />
Carga máxima en día laborable en la media <strong>de</strong> las líneas <strong>de</strong> 400 kV<br />
Carga máxima en día laborable en la media <strong>de</strong> las líneas <strong>de</strong> 220 kV<br />
Líneas <strong>de</strong> la red <strong>de</strong> <strong>transporte</strong> con carga superior al 70%
74<br />
06<br />
Sistema peninsular /// - <strong>Red</strong> <strong>de</strong> <strong>transporte</strong><br />
Evolución <strong>de</strong>l sistema <strong>de</strong> <strong>transporte</strong> y transformación<br />
2007 2008 2009 2010 2011<br />
km <strong>de</strong> circuito a 400 kV <strong>Red</strong> <strong>Eléctrica</strong> 17.134 17.686 17.977 18.765 19.622<br />
Otras empresas 38 38 38 0 0<br />
Total 17.172 17.724 18.015 18.765 19.622<br />
km <strong>de</strong> circuito a ≤220 kV <strong>Red</strong> <strong>Eléctrica</strong> 1<strong>6.</strong>532 1<strong>6.</strong>633 1<strong>6.</strong>773 17.078 17.699<br />
Otras empresas 275 307 322 107 107<br />
Total 1<strong>6.</strong>807 1<strong>6.</strong>940 17.095 17.185 17.806<br />
Capacidad <strong>de</strong><br />
transformación (MVA) <strong>Red</strong> <strong>Eléctrica</strong> 58.372 62.772 65.797 68.597 71.047(1)<br />
Otras empresas 800 800 800 0 0<br />
Total 59.172 63.572 6<strong>6.</strong>597 68.597 71.047<br />
(1) Los datos <strong>de</strong>l 2011 incluyen tres trafos inventariados en este ejercicio y aumentos <strong>de</strong> capacidad <strong>de</strong> 650 MVA.<br />
Líneas <strong>de</strong> <strong>transporte</strong> a 400 kV puestas en servicio en el 2011<br />
Línea Empresa Nº circuitos km MVA*km<br />
E/S Belinchón L/ Morata-Olmedilla <strong>Red</strong> <strong>Eléctrica</strong> 2 6,9 1<strong>6.</strong>848<br />
E/S Carril L/ Asomada-Litoral <strong>Red</strong> <strong>Eléctrica</strong> 2 2,8 5.172<br />
E/S Carril L/ El Palmar-Litoral <strong>Red</strong> <strong>Eléctrica</strong> 2 2,9 5.248<br />
E/S Palo L/ Pesoz-Grado <strong>Red</strong> <strong>Eléctrica</strong> 2 0,3 727<br />
E/S Silleda L/ Cartelle-Puentes Gª. Rodríguez <strong>Red</strong> <strong>Eléctrica</strong> 2 0,9 1.547<br />
E/S Tabernas L/ Huéneja-Litoral <strong>Red</strong> <strong>Eléctrica</strong> 1 1,3 2.395<br />
E/S Udalla L/ Abanto-Aguayo <strong>Red</strong> <strong>Eléctrica</strong> 1 1,9 3.517<br />
L/ Aparecida-Tor<strong>de</strong>sillas <strong>Red</strong> <strong>Eléctrica</strong> 2 353,3 862.396<br />
L/ Fuen<strong>de</strong>todos-Mezquita <strong>Red</strong> <strong>Eléctrica</strong> 2 159,7 389.789<br />
L/ Pesoz-Salas <strong>Red</strong> <strong>Eléctrica</strong> 2 102,1 249.334<br />
L/ Pesoz-Sanzo <strong>Red</strong> <strong>Eléctrica</strong> 2 2,3 4.164<br />
L/ Soto-Penagos <strong>Red</strong> <strong>Eléctrica</strong> 1 182,8 308.085<br />
L/ Vic-Bescanó (3 fase) <strong>Red</strong> <strong>Eléctrica</strong> 1 39,9 97.474<br />
Total 857,2 1.94<strong>6.</strong>696
Gráficos y cuadros /// Sistema eléctrico español 2011<br />
Líneas <strong>de</strong> <strong>transporte</strong> a 220 kV puestas en servicio en el 2011<br />
Línea Empresa Nº circuitos km MVA*km<br />
E/S Amoeiro L/ Chantada-Castrelo <strong>Red</strong> <strong>Eléctrica</strong> 2 0,2 35<br />
E/S Arenas San Juan L/ La Paloma-Madri<strong>de</strong>jos <strong>Red</strong> <strong>Eléctrica</strong> 2 1,4 993<br />
E/S Beniferri L/ Feria <strong>de</strong> Muestras-Torrente (S) <strong>Red</strong> <strong>Eléctrica</strong> 2 3,1 1.561<br />
E/S Bescanó L/ Vic-Juiá <strong>Red</strong> <strong>Eléctrica</strong> 2 2,2 977<br />
E/S Buenavista L/ Moraleja-Retamar (S) <strong>Red</strong> <strong>Eléctrica</strong> 2 0,1 61<br />
E/S Cartama L/ Alhaurín-Tajo <strong>Red</strong> <strong>Eléctrica</strong> 1 1,6 735<br />
E/S Cartama L/ Ramos-Casares <strong>Red</strong> <strong>Eléctrica</strong> 2 2,6 1.155<br />
E/S Cartama L/ Alhaurín-Montes <strong>Red</strong> <strong>Eléctrica</strong> 2 19,4 19.336<br />
E/S Haro L/ Miranda-La Guardia <strong>Red</strong> <strong>Eléctrica</strong> 2 18,1 9.779<br />
E/S Illora L/ Atarfe-Tajo <strong>Red</strong> <strong>Eléctrica</strong> 2 2,8 1.239<br />
E/S Illora L/Caparacena-Tajo <strong>Red</strong> <strong>Eléctrica</strong> 2 2,3 1.031<br />
E/S La Solana L/ Picón-Puertollano 1 <strong>Red</strong> <strong>Eléctrica</strong> 1 0,1 111<br />
E/S La Solana L/ Picón-Puertollano 1(S) <strong>Red</strong> <strong>Eléctrica</strong> 1 0,1 40<br />
E/S La Solana L/ Picón-Puertollano 2 <strong>Red</strong> <strong>Eléctrica</strong> 2 0,1 98<br />
E/S La Solana L/ Picón-Puertollano 2(S) <strong>Red</strong> <strong>Eléctrica</strong> 1 0,1 28<br />
E/S Montebello L/ El Cantalar-Jijona <strong>Red</strong> <strong>Eléctrica</strong> 2 65,7 52.542<br />
E/S Montebello L/ El Cantalar-Jijona (S) <strong>Red</strong> <strong>Eléctrica</strong> 2 4,2 2.223<br />
E/S Nueva Casares L/ Algeciras-Los Ramos <strong>Red</strong> <strong>Eléctrica</strong> 2 12,4 9.904<br />
E/S Palencia L/ Corcos-Villalbilla <strong>Red</strong> <strong>Eléctrica</strong> 2 7,8 <strong>6.</strong>950<br />
E/S Palencia L/ Mudarra-Vallejera <strong>Red</strong> <strong>Eléctrica</strong> 2 12,9 <strong>6.</strong>303<br />
E/S Santiz L/ Villalcampo-Villamayor <strong>Red</strong> <strong>Eléctrica</strong> 2 1,3 429<br />
L/ Alvarado-Vaguadas <strong>Red</strong> <strong>Eléctrica</strong> 1 18,1 4.719<br />
L/ Alvarado-Vaguadas (S) <strong>Red</strong> <strong>Eléctrica</strong> 1 0,1 45<br />
L/ Arkale-Irún <strong>Red</strong> <strong>Eléctrica</strong> 1 1,0 557<br />
L/ Baró <strong>de</strong> Viver-Trinitat (S) <strong>Red</strong> <strong>Eléctrica</strong> 1 0,9 423<br />
L/ Benicull-Bernat (Alcira) <strong>Red</strong> <strong>Eléctrica</strong> 2 14,3 11.433<br />
L/ Benicull-Bernat (Alcira) (S) <strong>Red</strong> <strong>Eléctrica</strong> 2 0,4 206<br />
L/ Beniferri-Fuente <strong>de</strong> San Luis (S) <strong>Red</strong> <strong>Eléctrica</strong> 1 13,0 <strong>6.</strong>752<br />
L/ Fuencarral-El Pilar (S) <strong>Red</strong> <strong>Eléctrica</strong> 2 17,7 <strong>6.</strong>630<br />
L/ Jalón-Los Vientos <strong>Red</strong> <strong>Eléctrica</strong> 2 60,8 3<strong>6.</strong>464<br />
L/ La Solana-Costanilla (S) <strong>Red</strong> <strong>Eléctrica</strong> 1 0,1 12<br />
L/ Mérida-Vaguadas <strong>Red</strong> <strong>Eléctrica</strong> 1 57,3 14.886<br />
L/ Mérida-Vaguadas (S) <strong>Red</strong> <strong>Eléctrica</strong> 1 0,1 45<br />
L/ Morvedre-Santa Ponsa (Morvedre a km 122)(SM)<br />
± 250 kV <strong>Red</strong> <strong>Eléctrica</strong> 2 236,0 (1) 94.400<br />
L/ Morvedre-Santa Ponsa (Morvedre a km 122)(S)<br />
± 250 kV <strong>Red</strong> <strong>Eléctrica</strong> 2 8,0 (1) 3.200<br />
L/ San Cayetano-Porto<strong>de</strong>mouros <strong>Red</strong> <strong>Eléctrica</strong> 1 26,8 9.839<br />
L/ San Cayetano-Porto<strong>de</strong>mouros (S) <strong>Red</strong> <strong>Eléctrica</strong> 1 7,5 2.715<br />
Fausita: conexión entre parques (S) <strong>Red</strong> <strong>Eléctrica</strong> 1 0,3 182<br />
Fuencarral: conexión AT3 a GIS 220 <strong>Red</strong> <strong>Eléctrica</strong> 1 0,3 176<br />
Torrente: conexión entre parques (S) <strong>Red</strong> <strong>Eléctrica</strong> 1 0,3 172<br />
Total 621,2 308.385<br />
(S) subterráneo; (SM) submarino<br />
(1) De los 488 km <strong>de</strong> circuito que tiene este enlace, la mitad se contabilizan en la Península y la otra mitad en Baleares.<br />
75
76<br />
Sistema peninsular /// 06 - <strong>Red</strong> <strong>de</strong> <strong>transporte</strong><br />
Aumento <strong>de</strong> la capacidad <strong>de</strong> líneas en el 2011<br />
Aumento <strong>de</strong><br />
Línea Tensión (kV) km capacidad (MVA) MWA*km<br />
L/ Pierola-Vic 400 35,6 438 15.580<br />
L/ Bellicens-Begues (Subirat) 220 82,3 95 7.818<br />
L/ Centenario-Santiponce 220 5,0 105 525<br />
L/ Cordovilla-Sanguesa 220 38,6 105 4.053<br />
L/ Costasol-Alhaurín 220 36,5 105 3.833<br />
L/ Jordana-Alhaurín 220 65,5 105 13.755<br />
L/ Laguardia-Miranda 220 36,4 70 2.551<br />
L/ Vila<strong>de</strong>cans-St. Just 220 13,4 105 1.407<br />
Total 220 kV 313,3 1.128 49.521<br />
Parques puestos en servicio en el 2011<br />
Subestación Empresa Tensión kV<br />
Carril <strong>Red</strong> <strong>Eléctrica</strong> 400<br />
Mezquita <strong>Red</strong> <strong>Eléctrica</strong> 400<br />
Palo <strong>Red</strong> <strong>Eléctrica</strong> 400<br />
Silleda <strong>Red</strong> <strong>Eléctrica</strong> 400<br />
Tabernas <strong>Red</strong> <strong>Eléctrica</strong> 400<br />
Amoeiro <strong>Red</strong> <strong>Eléctrica</strong> 220<br />
Arenas <strong>de</strong> San Pedro <strong>Red</strong> <strong>Eléctrica</strong> 220<br />
Baró <strong>de</strong> Viver <strong>Red</strong> <strong>Eléctrica</strong> 220<br />
Bescanó <strong>Red</strong> <strong>Eléctrica</strong> 220<br />
Buenavista <strong>Red</strong> <strong>Eléctrica</strong> 220<br />
Calamocha <strong>Red</strong> <strong>Eléctrica</strong> 220<br />
Ébora <strong>Red</strong> <strong>Eléctrica</strong> 220<br />
Illora <strong>Red</strong> <strong>Eléctrica</strong> 220<br />
La Solana <strong>Red</strong> <strong>Eléctrica</strong> 220<br />
Los Leones <strong>Red</strong> <strong>Eléctrica</strong> 220<br />
Mezquita <strong>Red</strong> <strong>Eléctrica</strong> 220<br />
Novelda <strong>Red</strong> <strong>Eléctrica</strong> 220<br />
Nudo Viario <strong>Red</strong> <strong>Eléctrica</strong> 220<br />
Parque Central <strong>Red</strong> <strong>Eléctrica</strong> 220<br />
Santiz <strong>Red</strong> <strong>Eléctrica</strong> 220<br />
Tabernas <strong>Red</strong> <strong>Eléctrica</strong> 220
Transformadores inventariados en 2011<br />
Gráficos y cuadros /// Sistema eléctrico español 2011 77<br />
Transformación<br />
Subestación Empresa Tensión kV kV MVA<br />
Brazatortas <strong>Red</strong> <strong>Eléctrica</strong> 400 400/220 600<br />
Fausita <strong>Red</strong> <strong>Eléctrica</strong> 400 400/220 600<br />
El Palmar <strong>Red</strong> <strong>Eléctrica</strong> 400 400/220 600<br />
Total 1.800<br />
Evolución <strong>de</strong> la red <strong>de</strong> <strong>transporte</strong> <strong>de</strong> 400 y ≤220 kV (km)<br />
Año 400 kV ≤ 220 kV<br />
1972 3.817 11.839<br />
1973 4.175 11.923<br />
1974 4.437 12.830<br />
1975 4.715 12.925<br />
1976 4.715 13.501<br />
1977 5.595 13.138<br />
1978 5.732 13.258<br />
1979 8.207 13.767<br />
1980 8.518 14.139<br />
1981 8.906 13.973<br />
1982 8.975 14.466<br />
1983 9.563 14.491<br />
1984 9.998 14.598<br />
1985 10.781 14.652<br />
1986 10.978 14.746<br />
1987 11.147 14.849<br />
1988 12.194 14.938<br />
1989 12.533 14.964<br />
1990 12.686 15.035<br />
1991 12.883 15.109<br />
Año 400 kV ≤ 220 kV<br />
1992 13.222 15.356<br />
1993 13.611 15.442<br />
1994 13.737 15.586<br />
1995 13.970 15.629<br />
1996 14.084 15.734<br />
1997 14.244 15.776<br />
1998 14.538 15.876<br />
1999 14.538 15.975<br />
2000 14.918 1<strong>6.</strong>078<br />
2001 15.364 1<strong>6.</strong>121<br />
2002 1<strong>6.</strong>067 1<strong>6.</strong>296<br />
2003 1<strong>6.</strong>592 1<strong>6.</strong>344<br />
2004 1<strong>6.</strong>841 1<strong>6.</strong>464<br />
2005 1<strong>6.</strong>846 1<strong>6.</strong>530<br />
2006 17.042 1<strong>6.</strong>765<br />
2007 17.172 1<strong>6.</strong>807<br />
2008 17.724 1<strong>6.</strong>940<br />
2009 18.015 17.095<br />
2010 18.765 17.185<br />
2011 19.622 17.806
78<br />
Sistema peninsular /// 06 - <strong>Red</strong> <strong>de</strong> <strong>transporte</strong><br />
Gráfico <strong>de</strong> evolución <strong>de</strong> la red <strong>de</strong> <strong>transporte</strong> <strong>de</strong> 400 y ≤220 kV (km)<br />
22.000<br />
20.000<br />
18.000<br />
1<strong>6.</strong>000<br />
14.000<br />
12.000<br />
10.000<br />
8.000<br />
<strong>6.</strong>000<br />
4.000<br />
2.000<br />
0<br />
1972 1975 1978 1981 1984 1987 1990 1993 1996 1999 2002 2005 2008 2011<br />
Carga máxima en día laborable en la media <strong>de</strong><br />
las líneas <strong>de</strong> 400 kV (MW)<br />
1.400<br />
1.200<br />
1.000<br />
800<br />
600<br />
400<br />
200<br />
0<br />
≤ 220 kV 400 kV<br />
E F M A M J J A S O N D<br />
Carga máxima Capacidad térmica
Carga máxima en día laborable en la media <strong>de</strong><br />
las líneas <strong>de</strong> 220 kV (MW)<br />
450<br />
400<br />
350<br />
300<br />
250<br />
200<br />
150<br />
100<br />
50<br />
0<br />
Gráficos y cuadros /// Sistema eléctrico español 2011 79<br />
E F M A M J J A S O N D<br />
Carga máxima Capacidad térmica<br />
Líneas <strong>de</strong> la red <strong>de</strong> <strong>transporte</strong> con carga superior al 70%<br />
45<br />
40<br />
35<br />
30<br />
25<br />
20<br />
15<br />
10<br />
5<br />
0<br />
E F M A M J J A S O N D<br />
400 kV 220 kV<br />
Nº <strong>de</strong> líneas que superan en algún momento el 70% <strong>de</strong> la capacidad térmica <strong>de</strong> <strong>transporte</strong> <strong>de</strong> invierno.